the Creative Commons Attribution 4.0 License.
the Creative Commons Attribution 4.0 License.
 | 01 Jul 2022
Suspended sediment and discharge dynamics in a glaciated alpine environment: identifying crucial areas and time periods on several spatial and temporal scales in the Ötztal, Austria
Lena Katharina Schmidt
Till Francke
Erwin Rottler
Theresa Blume
Johannes Schöber
Axel Bronstert
Glaciated high-alpine areas are fundamentally altered by climate change, with well-known implications for hydrology, e.g., due to glacier retreat, longer snow-free periods, and more frequent and intense summer rainstorms. While knowledge on how these hydrological changes will propagate to suspended sediment dynamics is still scarce, it is needed to inform mitigation and adaptation strategies. To understand the processes and source areas most relevant to sediment dynamics, we analyzed discharge and sediment dynamics in high temporal resolution as well as their patterns on several spatial scales, which to date few studies have done.
We used a nested catchment setup in the Upper Ötztal in Tyrol, Austria, where high-resolution (15 min) time series of discharge and suspended sediment concentrations are available for up to 15 years (2006–2020). The catchments of the gauges in Vent, Sölden and Tumpen range from 100 to almost 800 km2 with 10 % to 30 % glacier cover and span an elevation range of 930 to 3772 m a.s.l. We analyzed discharge and suspended sediment yields (SSY), their distribution in space, their seasonality and spatial differences therein, and the relative importance of short-term events. We complemented our analysis by linking the observations to satellite-based snow cover maps, glacier inventories, mass balances and precipitation data.
Our results indicate that the areas above 2500 m a.s.l., characterized by glacier tongues and the most recently deglaciated areas, are crucial for sediment generation in all sub-catchments. This notion is supported by the synchronous spring onset of sediment export at the three gauges, which coincides with snowmelt above 2500 m but lags behind spring discharge onsets. This points at a limitation of suspended sediment supply as long as the areas above 2500 m are snow-covered. The positive correlation of annual SSY with glacier cover (among catchments) and glacier mass balances (within a catchment) further supports the importance of the glacier-dominated areas. The analysis of short-term events showed that summer precipitation events were associated with peak sediment concentrations and yields but on average accounted for only 21 % of the annual SSY in the headwaters. These results indicate that under current conditions, thermally induced sediment export (through snow and glacier melt) is dominant in the study area.
Our results extend the scientific knowledge on current hydro-sedimentological conditions in glaciated high-alpine areas and provide a baseline for studies on projected future changes in hydro-sedimentological system dynamics.
- Article
(4243 KB) - Full-text XML
- BibTeX
- EndNote


Glaciated high-alpine areas are central for discharge and sediment dynamics even beyond their catchment boundaries because the discharge and sediment fluxes from these areas are typically much higher (per unit area) than from lower-lying areas (Beniston et al., 2018; Hallet et al., 1996; Hinderer et al., 2013; Milliman and Syvitski, 1992). As a consequence, glaciated high-alpine areas have a disproportionate influence on downstream water quality and quantity, flood hazard, hydropower generation, and ecological habitats (Huss et al., 2017; Vercruysse et al., 2017).
However, glaciated high-alpine areas are also particularly sensitive to climatic change, and climate warming is especially pronounced here (Gobiet et al., 2014). As a result of the rising temperatures, widespread and accelerating glacier retreat has been observed for several decades (e.g., Abermann et al., 2009; Sommer et al., 2020). Hydrological consequences include changes in water quantities (such as a transient increase in runoff) (Vormoor et al., 2015; Wijngaard et al., 2016), streamflow variability (van Tiel et al., 2019) and hydrograph timing, e.g., due to earlier snowmelt onset and a prolonged glacier melt period (Hanus et al., 2021; Kormann et al., 2016; Rottler et al., 2021, 2020).
Possible climate change impacts on sediment dynamics are manifold, as all of the hydrological changes can affect sediment dynamics by changing the magnitude and timing of transport capacities. At the same time, sediment supply may change as glacier retreat uncovers vast amounts of sediment previously inaccessible to pluvial and fluvial erosion (Carrivick and Heckmann, 2017; Leggat et al., 2015) and as subglacial sediment discharge transiently increases (Delaney and Adhikari, 2020). Intense precipitation events, which are projected to increase in intensity and occur more frequently (Bürger et al., 2019; Giorgi et al., 2016; Scherrer et al., 2016), have a higher chance of affecting unfrozen material during prolonged snow-free periods (Kormann et al., 2016; Rottler et al., 2021; Wijngaard et al., 2016) and may thereby lead to a shift in the relative importance of sediment sources. Adding to this, permafrost thaw can destabilize hillslopes and facilitate mass movements (Chiarle et al., 2021; Huggel et al., 2010; Savi et al., 2020). On the other hand, changes in catchment-scale connectivity can provide new pathways or close off old pathways for loose material to the receiving waters (Cavalli et al., 2013; Lane et al., 2017) depending on local preconditions, for example due to the formation of a proglacial lake.
Balanced sediment management to address future changes is not only required in the context of hydropower production and reservoir sedimentation (Schöber and Hofer, 2018). It is also needed to prevent disturbances of the natural sediment regimes that may lead to decreasing species diversity and loss of habitat in aquatic environments (Gabbud and Lane, 2016), changing flood hazard (Nones, 2019), or changes in water quality (Bilotta and Brazier, 2008). In order to inform these management strategies, it is crucial to understand how changes in influencing factors and their complex interactions propagate to sediment dynamics, yet to date our understanding is still very limited (Huss et al., 2017).
A first step towards facilitating the assessment of future changes is to understand discharge and sediment dynamics in the recent past and present. Studies that have embarked on this journey to date have either compared (mean) annual sediment yields across a number of sites (e.g., Delaney et al., 2018b; Hinderer et al., 2013; Lalk et al., 2014; Micheletti and Lane, 2016; Schöber and Hofer, 2018; Tschada and Hofer, 1990) or investigated dynamics in daily or even finer temporal resolution but only at one or two locations (Beylich et al., 2017; Collins, 1996, 1990; Costa et al., 2018; Guillon et al., 2018; Leggat et al., 2015; Orwin and Smart, 2004; Swift et al., 2005; Tsyplenkov et al., 2020). However, it is crucial to consider discharge and sediment dynamics in high temporal resolution as well as their spatial patterns in order to understand the dominant processes and thereby help inform modeling approaches that can put into perspective the effects of future changes.
In the present study, we aim to pinpoint the areas and processes most relevant to sediment dynamics in combination with discharge dynamics on several spatial and temporal scales. Our approach builds on three combined discharge and sediment gauges in a nested catchment setup in the Ötztal Alpine region, where discharge data and relatively long suspended sediment time series of up to 15 years are available in high temporal resolution for catchments of 100 to almost 800 km2 in size. To improve the existing sediment concentration data set, we improved the relationship between turbidity and suspended sediment concentrations at the gauge in Sölden by operating an automatic water sampler. To complement our analysis, we investigate glacier inventories and mass balances, precipitation data, satellite-based snow cover maps, and land cover characteristics.
More specifically, we (1) explore changes in discharge and suspended sediment yield magnitudes across spatial scales, (2) analyze the seasonal distribution of both fluxes as well as the relative importance of (precipitation) events compared to snow and glacier melt, and (3) examine the importance of different elevation bands for sediment export in spring using a synoptic view of snow cover evolution and sediment seasonality.
2.1 Study area
The study area is a nested catchment setup within the Ötztal valley in Tyrol, Austria (Fig. 1). The Ötztal Alps are part of the Ötztal–Stubai massif within the crystalline central Eastern Alps and biotite–plagioclase, biotite and muscovite gneisses, variable mica schists, and gneissic schists dominate (Strasser et al., 2018). The entire catchment of 783 km2 stretches from 931 m a.s.l. at the gauge in Tumpen (T) to 3772 m a.s.l. at the Wildspitze, the highest summit of Tyrol. Nested within are the 441 km2 catchment of the gauge in Sölden (S) at 1343 m a.s.l. and the 98 km2 catchment of the gauge in Vent (V) at 1891 m a.s.l. (Table 1). The areas between the gauges in Vent and Sölden (i.e., the area downstream of Vent and upstream of Sölden) and between Sölden and Tumpen have been termed S-V and T-S, respectively.
Table 1Characteristics of the sub-catchments.
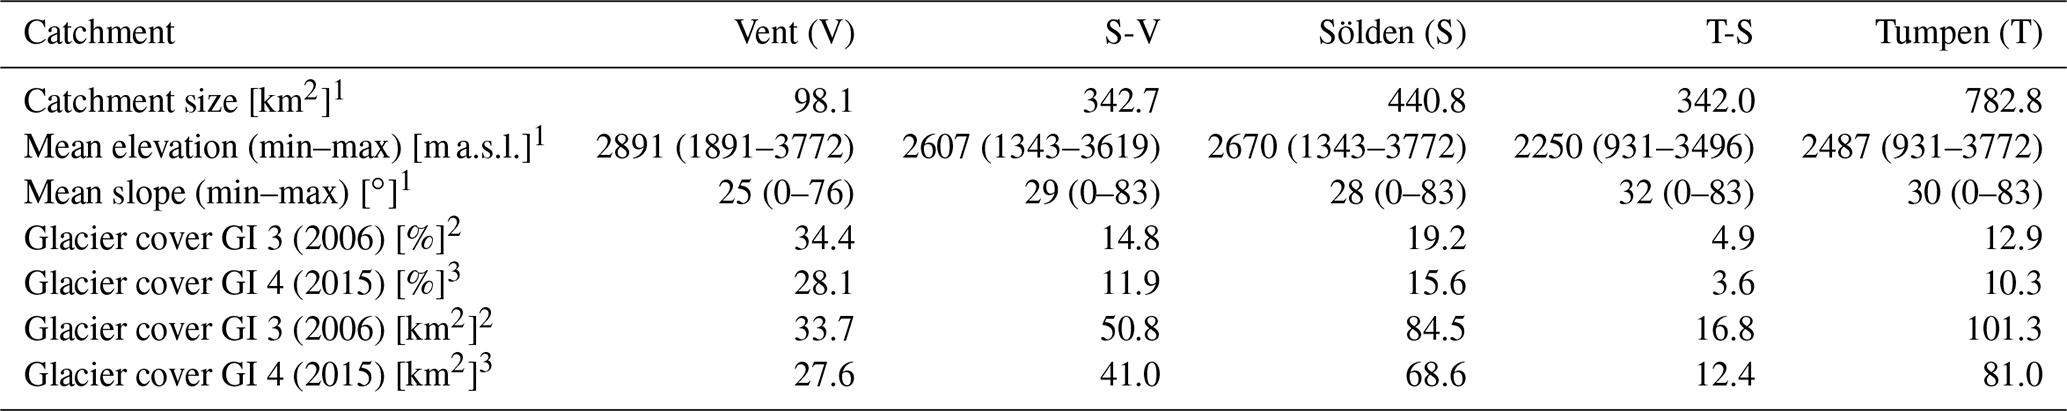
Calculations based on 1 DTM of Tyrol, 10 m resolution
(Umweltbundesamt, 2018), 2 glacier inventory 3
(Fischer et al., 2015) and 3
glacier inventory 4 (Buckel and Otto, 2018)
using
ArcGIS version 10.6.1.
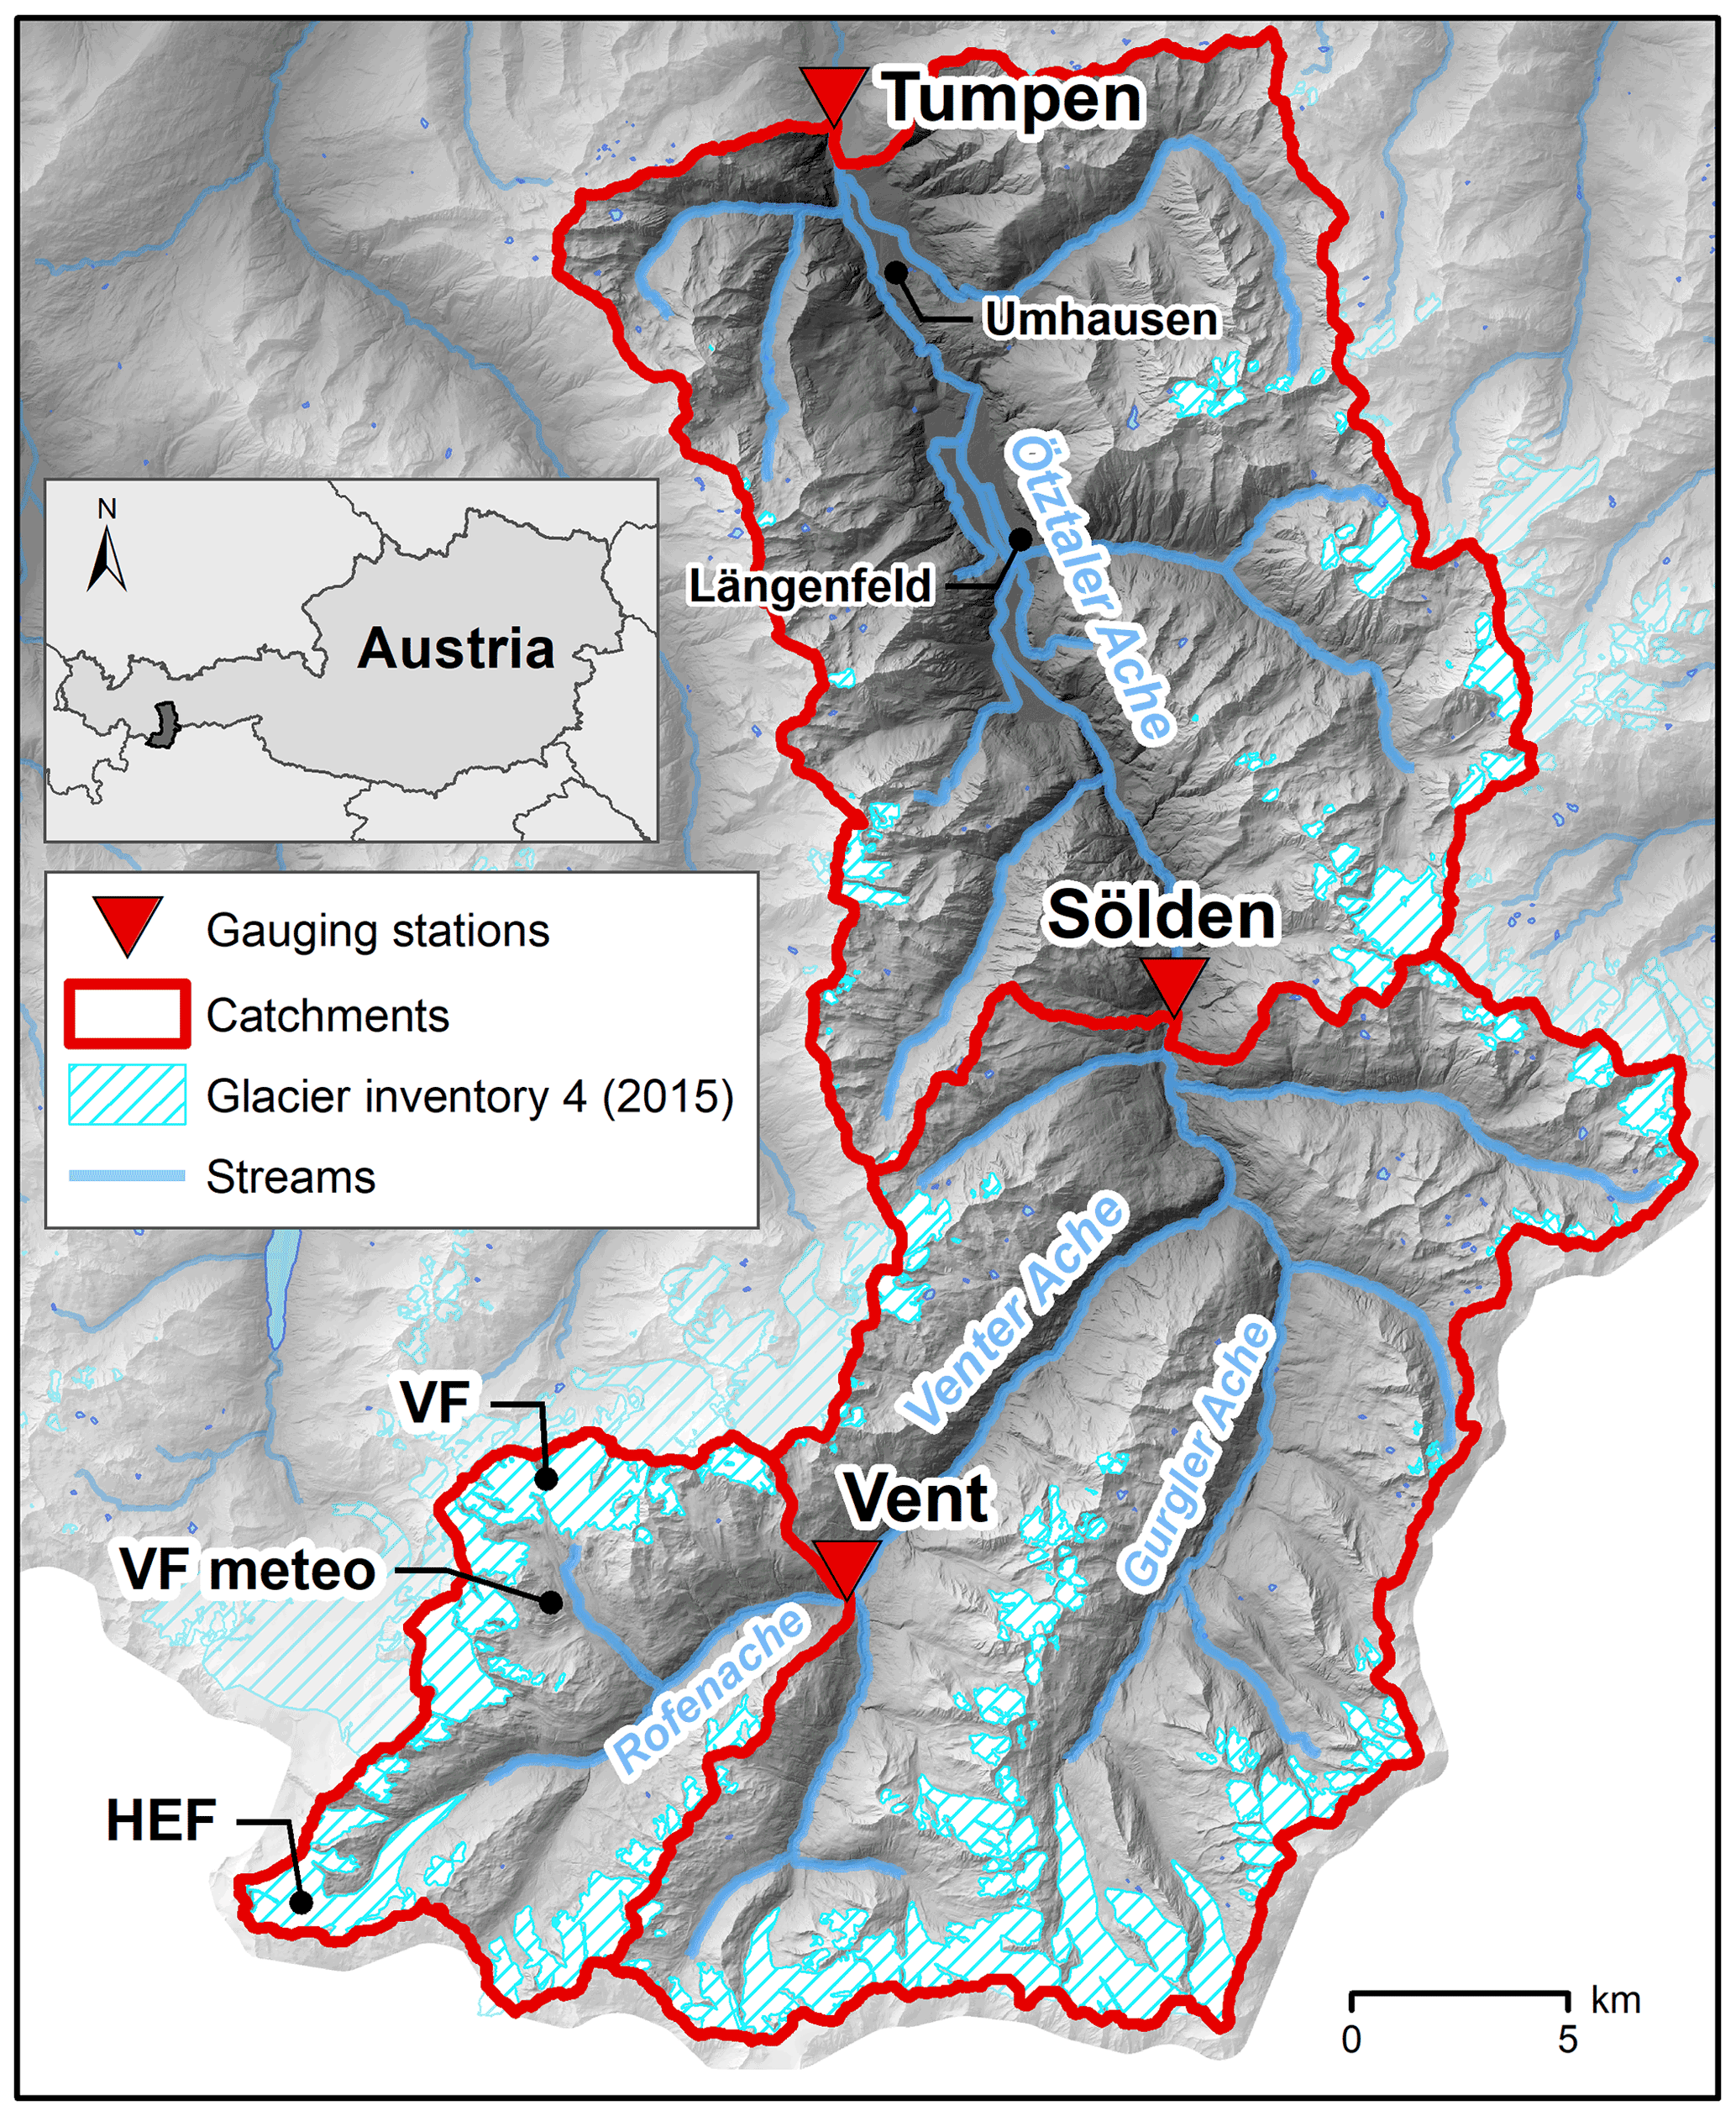
Figure 1Nested catchment areas of the three gauging stations Vent, Sölden and Tumpen within the Upper Ötztal, Tyrol, Austria. The locations of the Hintereisferner and Vernagtferner glaciers are marked by HEF and VF, respectively. “VF meteo” shows the location of the Vernagtferner meteorological station (Bavarian Academy of Sciences and Humanities), providing precipitation and air temperature data for the event analysis. Sources: 10 m DTM of Tyrol (Land Tirol, 2016), glacier inventory 4, 2015 (Buckel and Otto, 2018), rivers and water bodies from tiris open government data (Land Tirol, 2021).
The climate in the catchment is comparatively dry since it is located in the inner Alpine region and is shielded from precipitation arriving from both the north and the south (Kuhn et al., 1982). Annual precipitation recorded at valley stations such as Vent (687 mm) and Längenfeld (see Fig. 1, 730 mm) (Hydrographic Yearbook of Austria, 2016) is much lower than recordings by accumulating rain gauges in altitudes >3000 m, where annual precipitation can exceed 1500 mm (Kuhn et al., 2016; Strasser et al., 2018). The precipitation gradient with elevation has been estimated at about 5 % per 100 m (Schöber et al., 2014). Mean annual temperature at the gauge in Vent is 2.5 ∘C (Strasser et al., 2018) and increases to 6.3 ∘C at Umhausen (see Fig. 1), 5 km upstream of the Tumpen gauge (ZAMG, 2013).
The Ötztaler Ache is one of the largest tributaries of the Inn River and is fed by the Venter Ache and Gurgler Ache (Gattermayr, 2013). Upstream of Tumpen, the Ötztaler Ache is largely uninfluenced by hydropower, with a few small hydroelectric plants upstream of the gauges in Sölden and Tumpen that do not retain water and temporarily store coarse sediment fractions in sand traps. The Ötztaler Ache shows a strong seasonality with a snow- and ice-melt-dominated peak in summer (e.g., Strasser et al., 2018) and low-flow conditions in winter.
All sub-catchments are partially glaciated, ranging from almost 28 % glacier cover in the Vent catchment to 10 % glacier cover in the Tumpen catchment (Table 1). Glaciers in the area are subject to accelerating glacier retreat, as can be seen in the difference between the two glacier inventories (3 and 4) from 2006 and 2015 (Buckel and Otto, 2018; Fischer et al., 2015). The magnitude of this glacier retreat is illustrated in the reduction in glacier cover from almost 35 % in 2006 to 28 % in 2015 in the Vent catchment. With respect to land cover, high elevations are dominated by glaciers and bare rock or sparsely vegetated terrain, while lower altitudes are characterized by mountain pastures and coniferous forests as well as agriculture in the valley floors.
2.2 Data and analyses
2.2.1 Discharge and sediment concentration data
For our analyses, we used discharge and turbidity-based suspended sediment concentration data from the three gauging stations in Vent (Rofenache), Sölden and Tumpen as depicted in Fig. 1 (Table 2).
Table 2Characteristics and sources of investigated data (HD: Hydrographic Service of Tyrol, Austria; TiWAG: Tiroler Wasserkraft AG/hydropower company of Tyrol). * Turbidity measurements in Vent and Sölden are interrupted during the winter months to prevent damage to the equipment by ice.
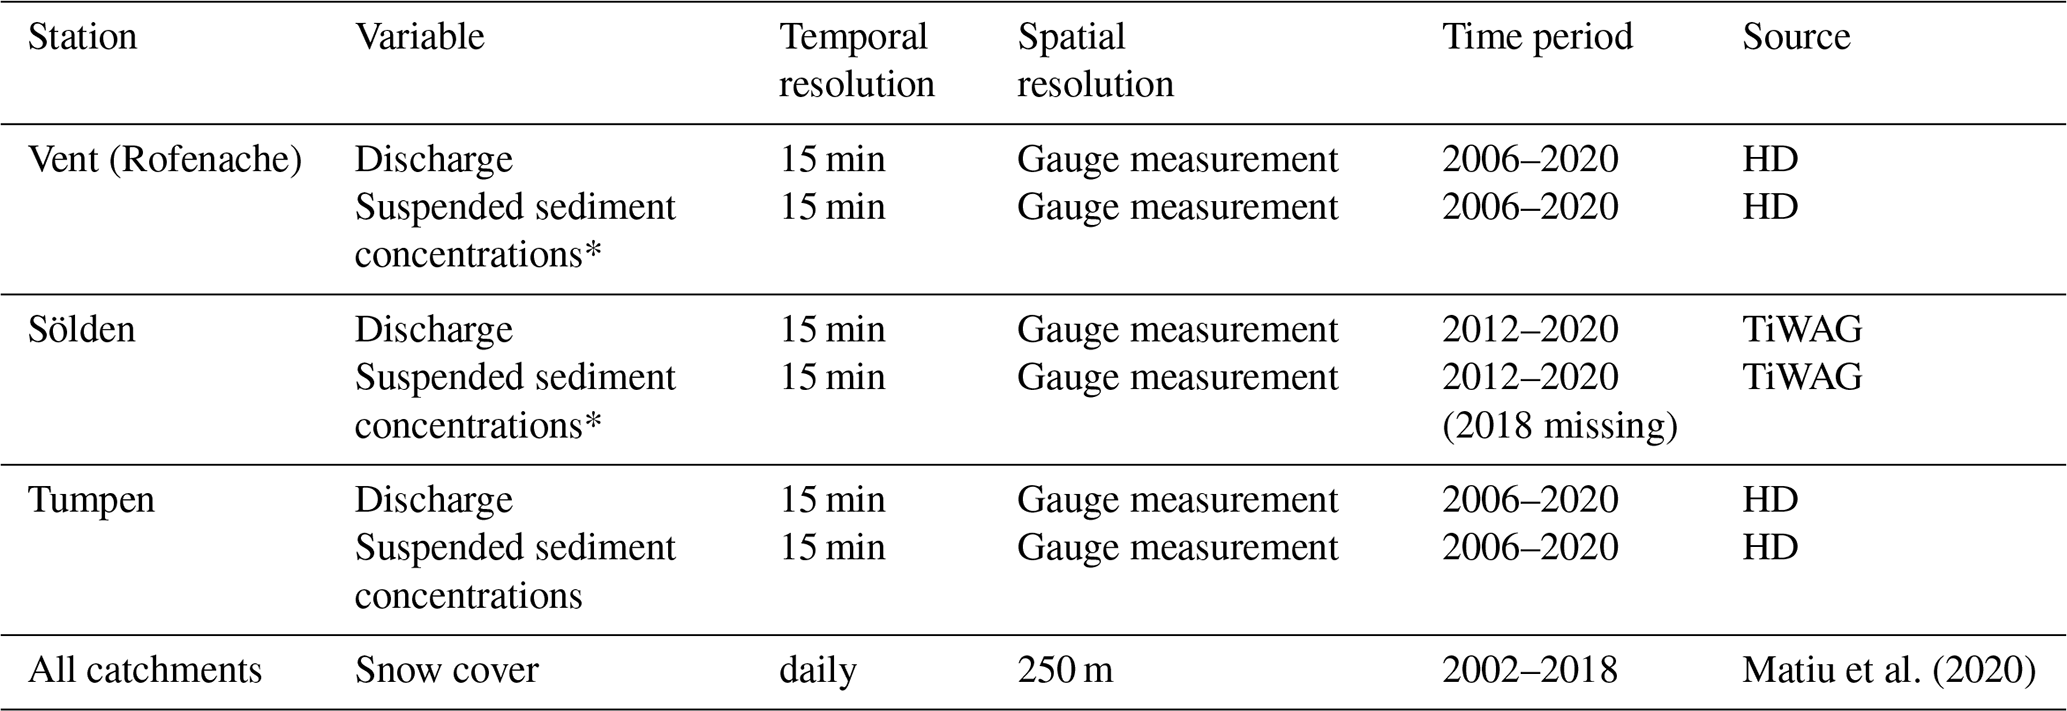
Although discharge data have been recorded by the Hydrographic Service of Tyrol since 1967 and 1976 in Vent and Tumpen, respectively, we only considered the period of time when concomitant turbidity measurements are available, i.e., since 2006. This was to focus on analyzing the present and recent past and to exclude long-term trends, e.g., due to increased glacier ablation since the 1980s (Hock, 2020), as much as possible.
Sediment concentration data at all stations are acquired by continuous turbidity measurements using optical infrared turbidity sensors (Solitax sensors by Hach, yielding tentative concentrations in mg L−1). At the gauges in Vent and Tumpen, we used the data as received by the Hydrographic Service of Tyrol. These data result from a calibration of turbidity data to sediment concentrations based on water samples that were taken by hand close to the turbidity probes in the stream and at several points spanning the width of the gauge (for details see Lalk et al., 2014). These data have been quality-checked by the Hydrographic Service except for the years 2019 and 2020.
Similarly, at the gauge in Sölden, the TiWAG used water samples taken close to the turbidity sensor to translate turbidity measurements into a continuous sedigraph from 2012 to 2017 (see Schöber and Hofer, 2018, for details). We took additional water samples in 2019 and 2020 using automatic samplers (MAXX P6 L Vacuum) in order to improve the data situation, especially at rarely sampled high concentrations, and to continue observations as measurements by the TiWAG had been discontinued after 2017. For this purpose, the turbidity values recorded by the turbidity probe were recorded by a logger programmed to initiate sampling if one of three criteria was met: (i) regular sampling to ensure one sample at least every 4 d, (ii) threshold-based sampling to obtain samples across the whole range of possible turbidity values and (iii) event-based sampling. For the latter, a sample was initiated if the turbidity increase was steeper than a predetermined empirical threshold and if the absolute turbidity level exceeded the moving average of the past 10 d. The suction tube of the automatic sampler in Sölden was attached to the turbidity sensor's case, which was immersed at the side of the channel. The collection of one sample takes ca. 1.5 min, and we specified that two samples had to be at least 30 min apart. Gravimetric sediment concentrations SSCg [g L−1] were then determined in the laboratory by filtering the water samples onto glass fiber filters with a pore size of 0.45 µm and drying the filters at 60 ∘C until the weight was constant (see, e.g., Delaney et al., 2018b).
In total, we took 99 samples in Sölden between April 2019 and October 2020. To verify whether these can be combined with the 268 samples taken by the TiWAG between 2012 and 2017, we tested for significant differences between linear models estimated for the two groups by means of an ANCOVA (analysis of covariance). This showed no significant differences between the two linear models. However, strictly speaking, the assumptions for an ANCOVA are violated because the residuals of the TiWAG data are not normally distributed (Shapiro–Wilk test, p<0.001). By contrast, the residuals of our data are normally distributed (Shapiro–Wilk test, p=0.03), which allows for the computation of confidence and prediction intervals around the linear model (Fig. 2). Since all data points of the TiWAG samples are located within the prediction interval and the linear model based on TiWAG data lies within the confidence interval of the linear model based on our data, we conclude that there is good enough agreement to estimate one linear model using all 367 available samples. The resulting model (SSC, R2=0.84) is applied to the complete turbidity time series.
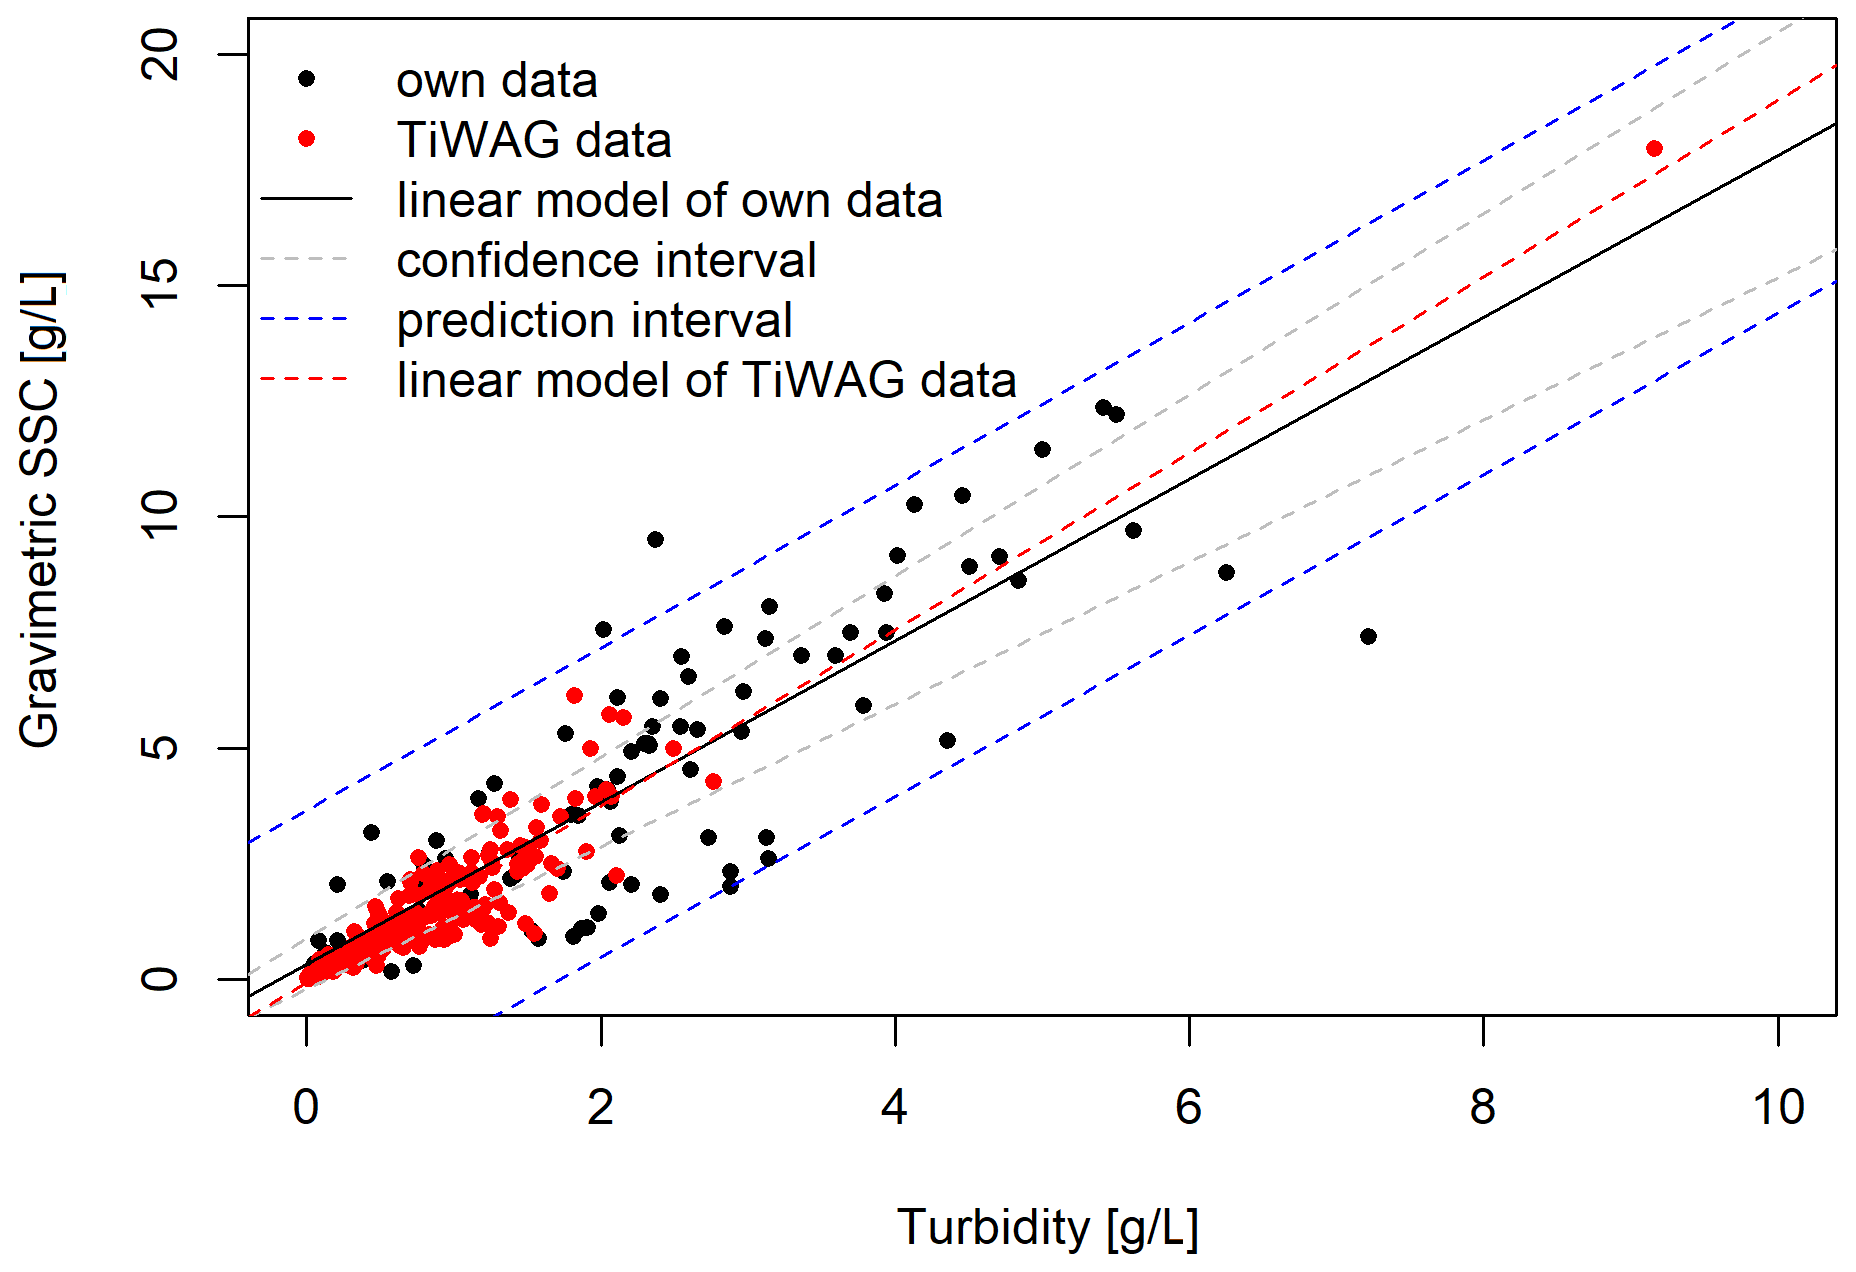
Figure 2Gravimetric suspended sediment concentrations SSCg in samples vs. turbidity measured at the gauge in Sölden: TiWAG samples taken between 2012 and 2017 are all located within the prediction interval of the linear regression based on our samples, and the linear model based on TiWAG data is located within the confidence interval.
The variance observed in the SSC–turbidity relationship does not appear to be unusually high compared to other studies reporting similar coefficients of determination (Delaney et al., 2018b; Felix et al., 2018) and can be attributed to changes in particle size, shape or color (Merten et al., 2014).
From the discharge and SSC data, we calculated sediment discharge Qsed [t/s] (for the analysis of events), water yield WY [m3/time], suspended sediment yield SSY [t/time] (to assess the magnitude of water and sediment export), annual specific discharge sQ [mm a−1] and annual specific suspended sediment yield sSSY [t km−2 a−1] (for comparison among gauges) as follows:
where Q is discharge [m3 s−1]
and
where Δt is the corresponding temporal resolution [s], and
and
where A [km2] is the catchment area.
In order to assess discharge and sediment flux seasonality, we calculated the percentage of annual water yield pw(WOY) and annual suspended sediment yield psed(WOY) exported in a given week of year (WOY) as
and
2.2.2 Sediment event analysis
To assess the relative importance of sediment events in time and space, we analyzed the largest Qsed events of each year in Vent and Tumpen. We excluded Sölden from the analysis, as comparability would be limited since data are missing before 2012 and in 2018.
For the Vent catchment, we analyzed the events with respect to the antecedent air temperature and precipitation conditions. Since availability of high-quality (i.e., gap-free) data in high temporal resolution is limited, we confined this analysis to the years 2011 to 2020. We based our analysis on Qsed calculated from discharge and sediment concentrations at the gauge in Vent and precipitation and air temperature data from the Vernagtferner station (2640 m a.s.l., located 6.25 km west of the gauge in Vent within the catchment) provided by the Bavarian Academy of Sciences. We visually identified Qsed peaks that were clearly higher than the characteristic daily amplitude of the respective season. Since automatic event detection is not straightforward and thresholds are unsuitable due to the intense interannual and seasonal variability in Qsed, we used expert knowledge to visually identify the events based on the beginning of the rising limb and the return to the before-event Qsed or the point of inflection before the next event or daily fluctuation.
In order to be classified as a precipitation event, precipitation had to be >3 mm in the 24 h before of the end of the Qsed event. We chose this low threshold, since the point-like measurements often represent an underestimate of catchment precipitation due to the high spatial variability of precipitation within the almost 100 km2 catchment and topographic effects. Additionally, we considered the hydrograph shape at the gauge in Vent to be a complementary indication, which typically shows a sharp increase in the case of a precipitation event. For classification as a melt-induced event, liquid precipitation had to be smaller than 3 mm within 24 h and the mean absolute temperature had to be above 1.5 ∘C. Additionally, we used the temporal development in daily snow cover data (Sect. 2.2.3) for the verification of snowmelt events.
For the Tumpen catchment, we visually identified Qsed peaks as described above for the years 2011 to 2020 to ensure comparability. However, given the almost 800 km2 area of the Tumpen catchment with considerable topography, there are only a few stations measuring precipitation for the whole time and in sufficient temporal (i.e., sub-daily and preferably sub-hourly) resolution. Therefore, we did not classify the events with respect to precipitation events.
2.2.3 GIS analysis, snow cover data and statistical analyses
To derive the catchment areas for the three gauges, we used ArcGIS (version 10.6.1; Environmental Systems Research Institute, 2018) and the 10 m Digital Terrain Model of Tyrol (Land Tirol, 2016) to calculate the flow direction (D8) and flow accumulation, and finally we used the watershed tool. We then clipped the glacier areas of the glacier inventories 3 (Fischer et al., 2015) and 4 (Buckel and Otto, 2018) with the resulting catchment areas to obtain the respective glacier areas within the catchment (Table 1) and erased the areas of glacier inventory 4 of 2015 from the inventory 3 of 2006 to assess recently deglaciated areas.
In order to analyze land cover classes within the different elevation bands, we first calculated 250 m elevation bands for the whole catchment area upstream of the gauge in Tumpen using the contour tool. Subsequently, we clipped glacier inventories and CORINE land cover data (Umweltbundesamt, 2018) to the elevation band areas.
We calculated average weekly snow-free areas based on data provided by Matiu et al. (2020), who used MODIS remote sensing products and derived daily nearly cloud-free snow cover data for the European Alps using temporal and spatial filters. We used these gridded data and intersected them with the areas of the 250 m elevation bands to gain the daily percentages of snow-free area for each elevation band and averaged these for each week of the year. In this, our basic idea is similar to the active contributing drainage area (ACDA) as proposed by Li et al. (2021), which uses the freezing line altitude to quantify the percentage of the catchment where the ground is unfrozen and thus susceptible to erosion. However, as an advantage over the ACDA, which yields the percentage of unfrozen area for the whole catchment, we are able to differentiate between different areas within the catchment. We consider the resulting snow-free fraction of the respective elevation bands to be potentially erodible under the assumption that the ground no longer covered by snow is largely unfrozen and thus susceptible to erosion.
All statistical analyses were conducted in R version 3.5.1 (R Core Team, 2018).
3.1 Spatial differences in mean annual discharge and suspended sediment yields
Mean annual specific discharge (sQ) is highest in the Vent catchment with 1543 mm a−1 and gradually decreases to 885 mm a−1 in the T-S catchment, i.e., the area between the lowest gauge in Tumpen and the gauge in Sölden. Specific suspended sediment yield (sSSY) is markedly higher in the Vent catchment (1532 t km−2 a−1 on average) compared to Sölden and Tumpen (1071 and 954 t km−2 a−1 on average) and the intermediate catchments. Adding to this, sSSY shows much higher interannual variability than sQ, and the variability is highest at the gauge in Vent.
Absolute mean annual discharge and sediment yield increase with increasing catchment size (Table 3). The distributions of both fluxes are severely right-skewed (as the location of mean to maximum values show) since low values are much more frequent than high values. Maximum sediment concentrations decrease slightly with increasing catchment size, which points to a dampening along the flow path.
Table 3Mean (min–max) observed values of discharge (Q), suspended sediment concentration (SSC) and suspended sediment yield (SSY) at the three gauges. For better comparability between the stations, SSCs recorded during the winter months from November to April were set to zero if there were NA values.

To investigate whether the spatial differences of mean sQ and sSSY are equally distributed across the seasons, we subdivided the year into seasons that match governing hydrological processes so that “spring” from April to June corresponds to the time dominated by snowmelt and “summer” from July to September corresponds to the bulk of glacier melt (Fig. 3).
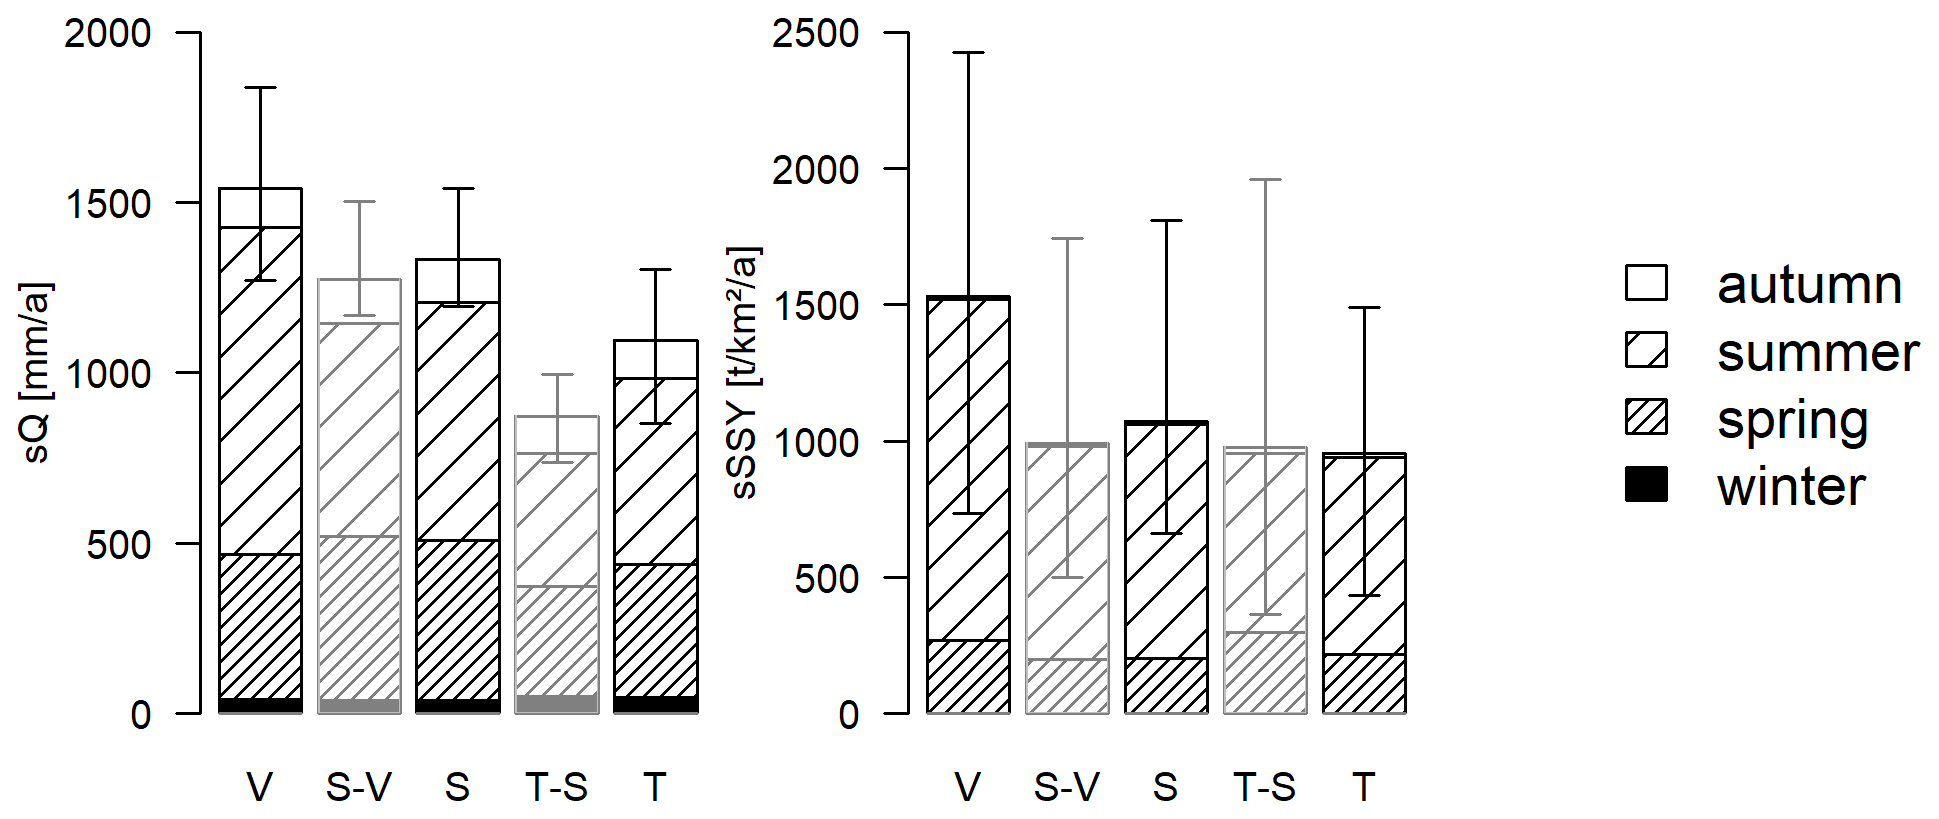
Figure 3Mean annual specific discharge (sQ) and suspended sediment yields (sSSY) at the gauges in Vent, Sölden and Tumpen as well as the intermediate catchments between gauges in Vent and Sölden (S-V) and between gauges in Sölden and Tumpen (T-S). Bars are divided into seasons: winter (January–March), spring (April–June), summer (July–September), autumn (October–December). Whiskers depict minimum and maximum annual values.
Both discharge and suspended sediment export are not equally distributed throughout the year. The discharge regimes at all gauges are clearly dominated by spring and summer streamflow (April–September), whereas autumn and winter discharge contributions (October–March) are small and almost equal across all sub-catchments. The most striking differences between the sub-catchments occur during the glacier melt period in summer, when sQ in the Vent catchment is markedly higher than in the downstream catchments.
Sediment yield is even more seasonal than discharge, with almost no export during autumn and winter (October–March). Mean summer sSSY values are markedly higher in Vent (1250 t km−2 per year) than in the other catchments (660–860 t km−2 a−1), and differences between the sub-catchments are less pronounced in spring (ranging from 200 t km−2 a−1 in the S-V to 300 t km−2 a−1 in the T-S sub-catchment).
3.2 Discharge and suspended sediment yields in relation to glacier cover and glacier mass balances
Annual specific discharge (sQ) and suspended sediment yields (sSSY) show significant positive correlations (significance level α=0.01) with increasing glacier cover among the respective catchments, although the high interannual variation in sSSY leads to a much weaker relationship and lower R2 than for sQ (Fig. 4).
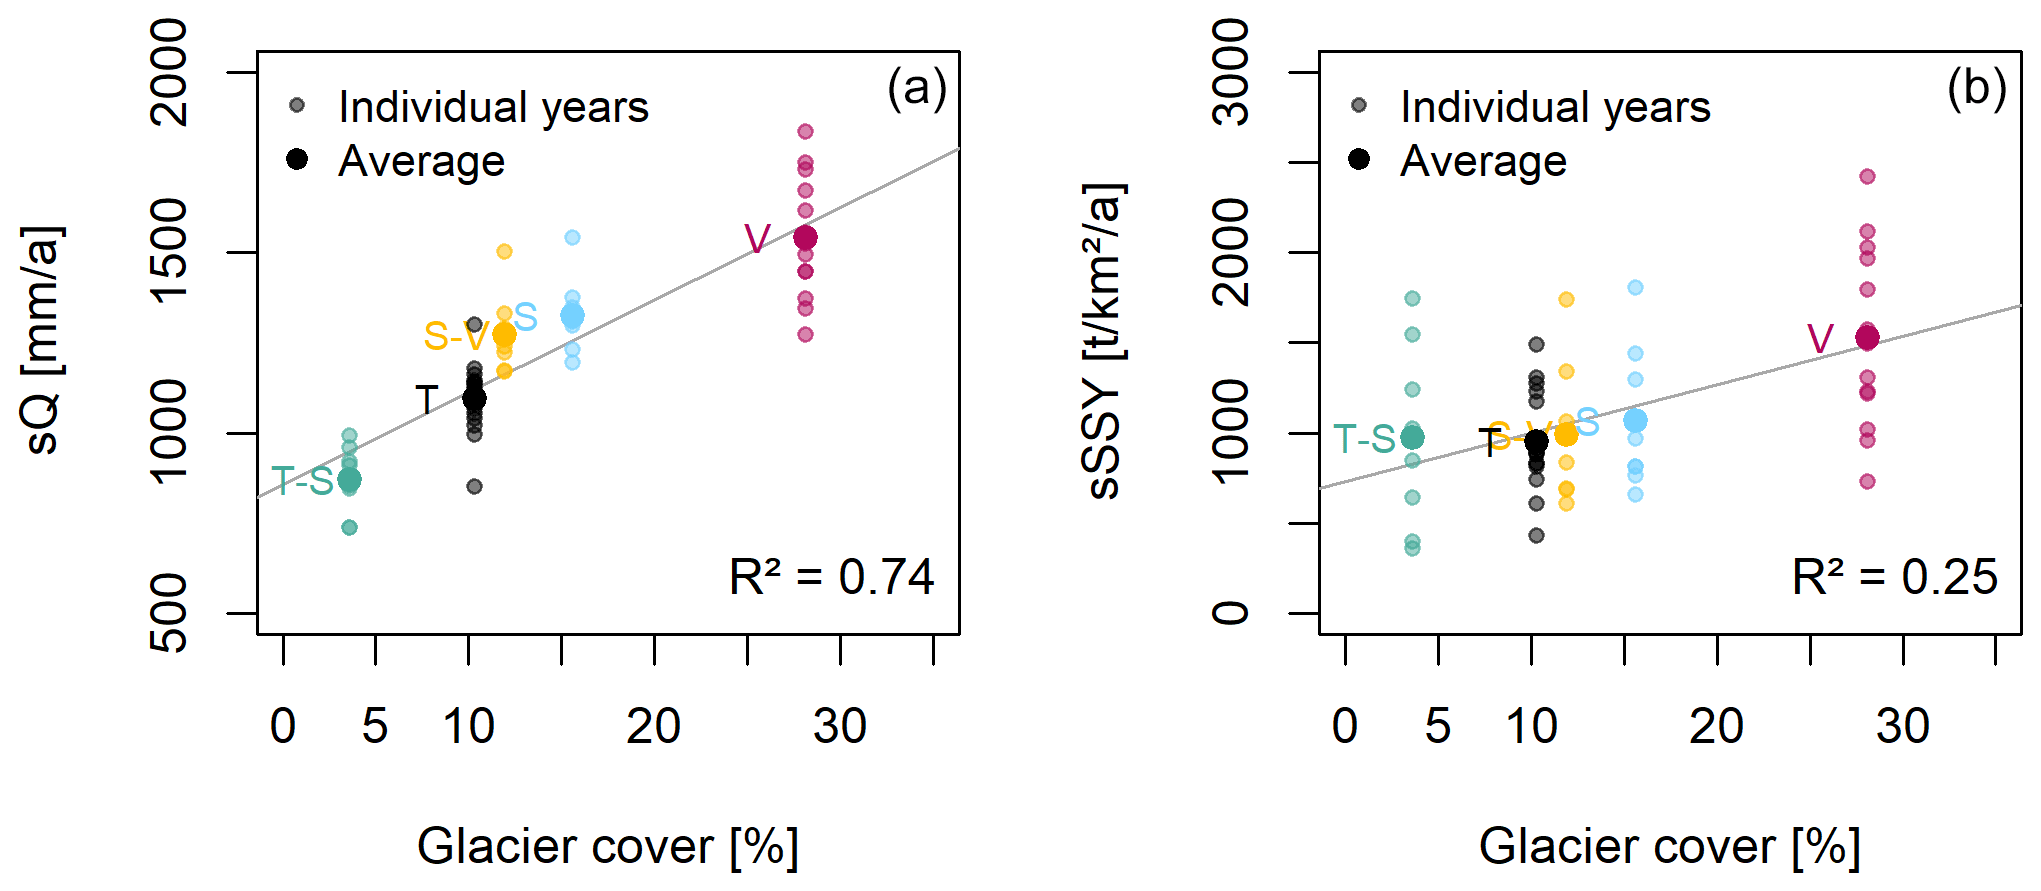
Figure 4Annual specific discharge (a) and annual specific suspended sediment yields (b) vs. glacier cover (glacier inventory 4, 2015; Buckel and Otto, 2018) in the sub-catchments.
Minimum and maximum annual water yields at the three gauges differed by a factor of 1.3 to 1.5 in the years 2006 to 2020, while annual sediment yields varied by a factor of 3.3 to 5.4 (see also whiskers in Fig. 3 or the range of values at each gauge in Figs. 4 and 5). For both variables, the interannual variability was most pronounced at the highest gauge in Vent.
In order to examine this, we considered the relationship between annual water yield and annual suspended sediment yield as well as the relationship of both to annual glacier balances. Unfortunately, we had to limit the latter analysis to the Vent catchment as mass balance data for glaciers within the other sub-catchments are lacking.
We did not find a clear relationship of annual water yield and annual sediment yield at any of the gauges (Fig. 5). However, the interannual variability can be at least partly attributed to differences in glacier mass balances: both sQ and sSSY in Vent correlate positively with the cumulative annual mass balances of Vernagt- and Hintereisferner (Fig. 6), the two largest glaciers within the Vent catchment. Although the correlation for the entire available sQ and mass balance time series since 1976 (grey line in left panel of Fig. 6) is significant (α=0.01), the correlation for the years since 2006 (i.e., the period of time investigated in this paper) is not significant and has a very low R2. The correlation between sSSY and annual balances is significant at a level of α=0.05.
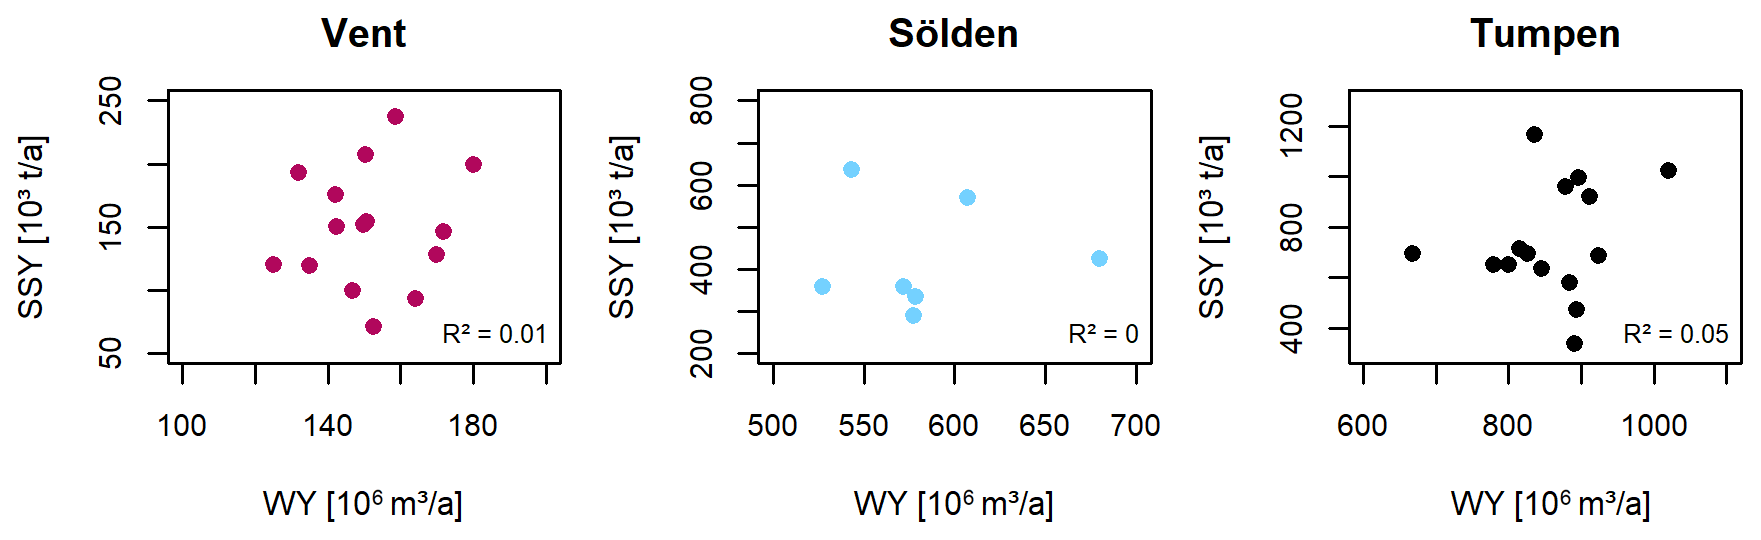
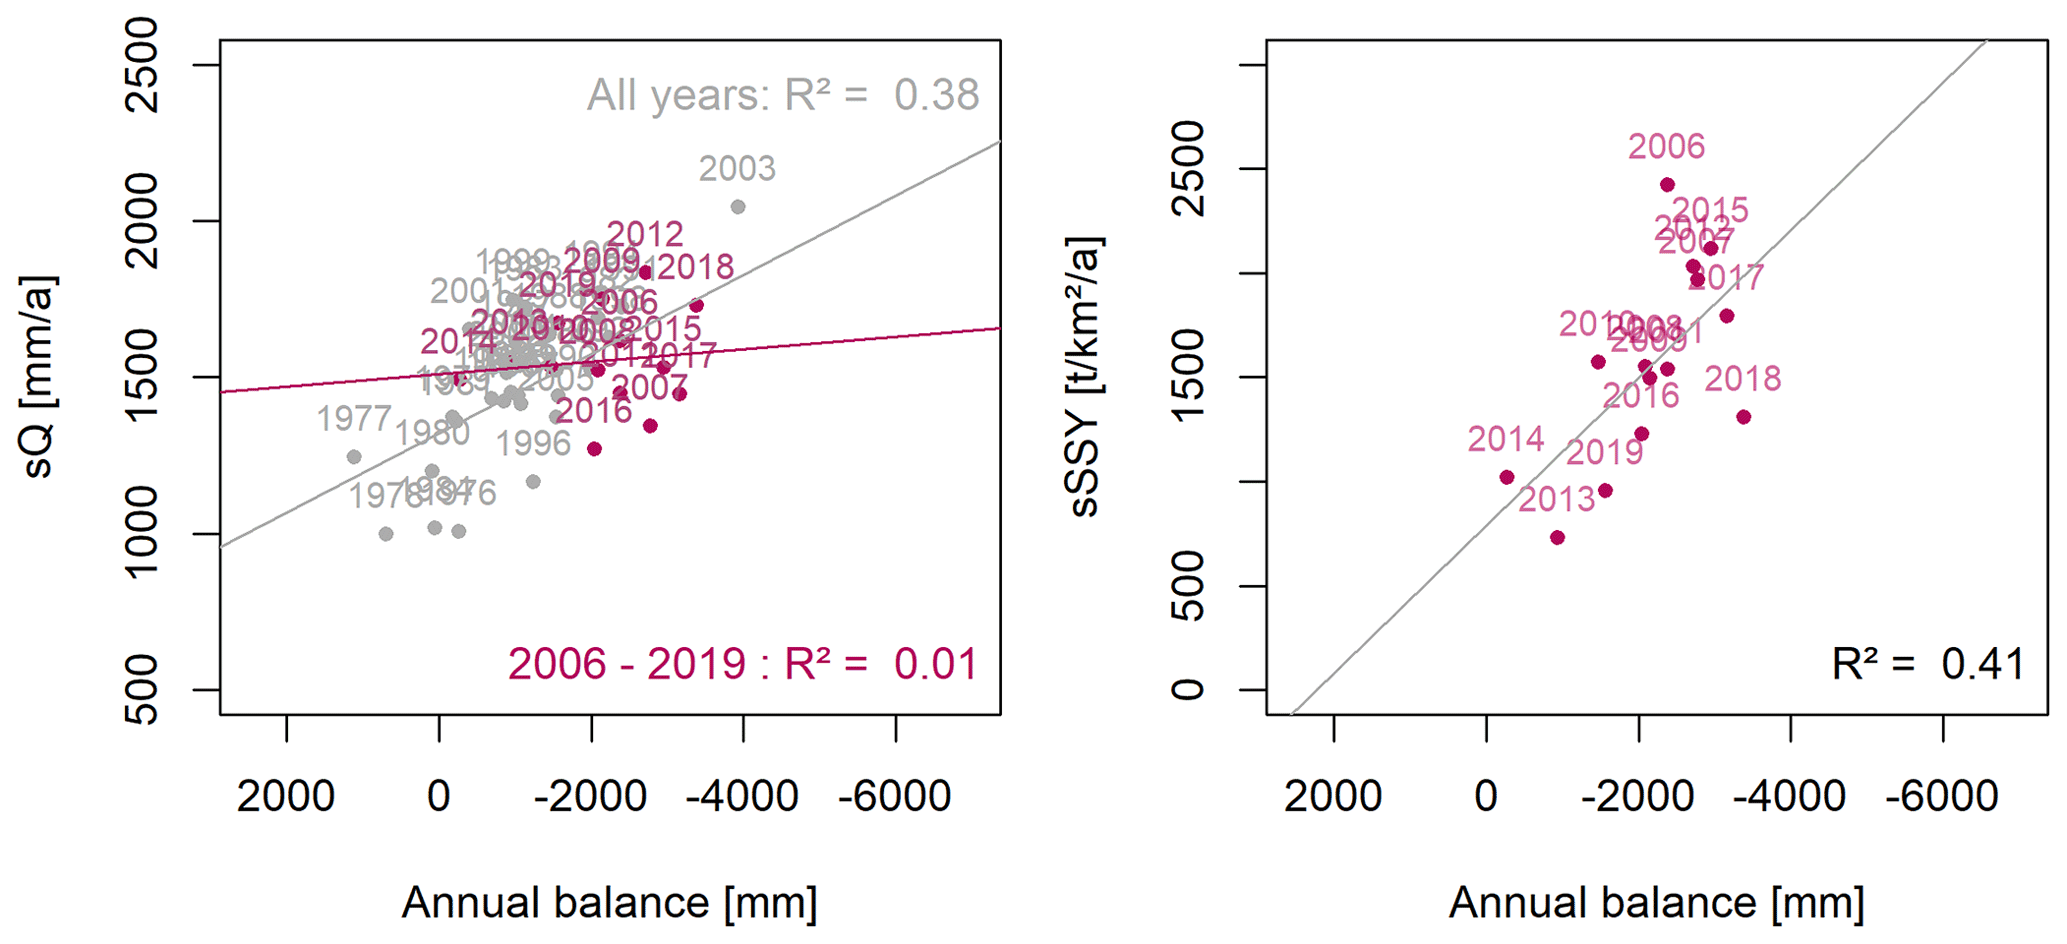
Figure 6Correlation of annual specific discharge and annual specific suspended sediment yields at the gauge in Vent with the sum of annual mass balances of the two largest glaciers within the Vent catchment (in millimeters), Vernagtferner and Hintereisferner (World Glacier Monitoring Service, 2021), corresponding to the respective glacier areas. The grey points, line and R2 in the left panel refer to the entire available sQ and mass balance time series starting in 1976.
3.3 Seasonality of discharge and suspended sediment yields and spatial differences therein
In order to assess discharge and suspended sediment seasonality for different spatial scales, we calculated the percentages of annual water yield pw(WOY) and annual suspended sediment yield psed(WOY) that are transported in a given week of year WOY (Fig. 7).
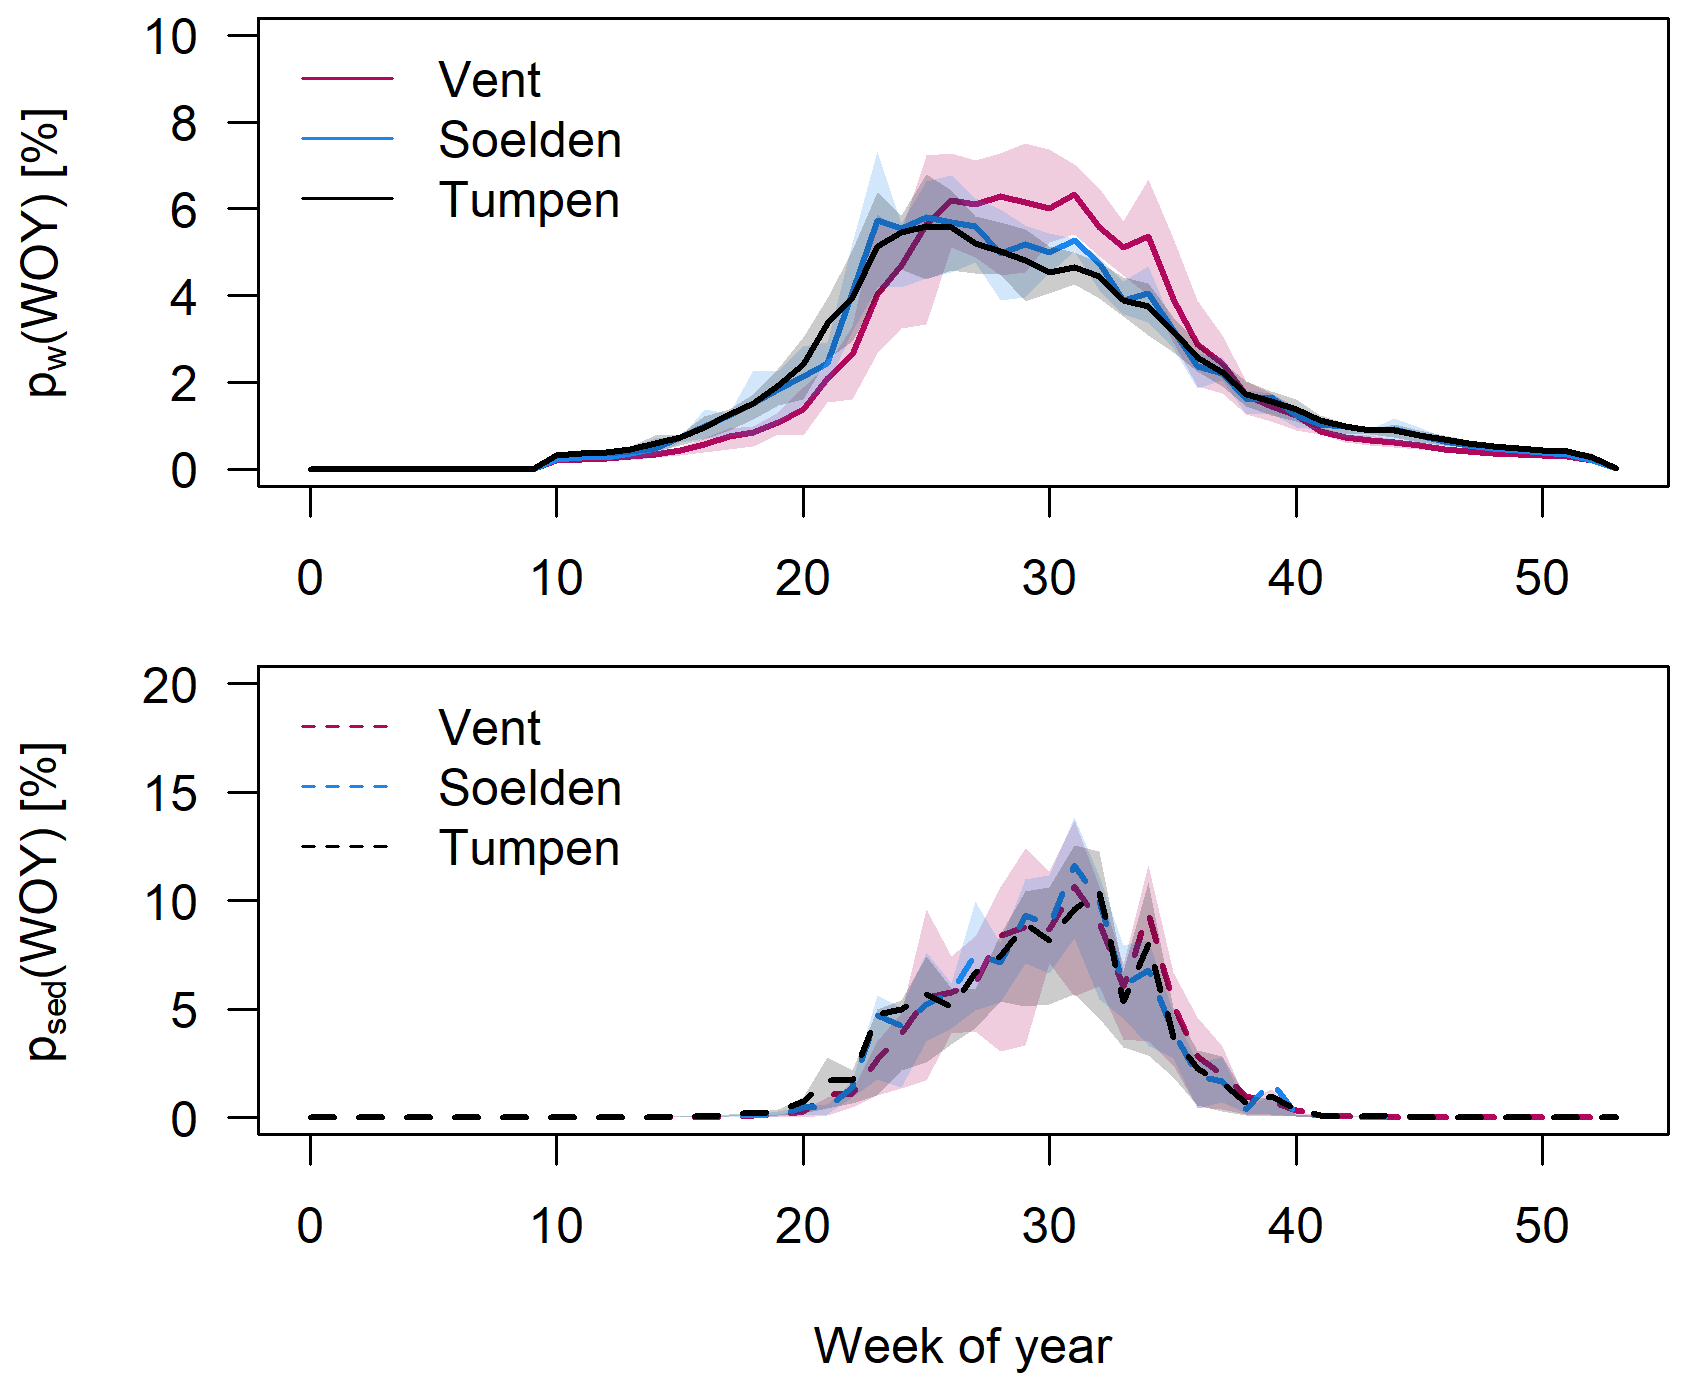
Figure 7Seasonality illustrated by mean percentages of annual water yield (pw(WOY)) and suspended sediment yield (psed(WOY)) per week of year at the three gauges. Lightly colored areas show interquartile ranges (i.e., 25 % and 75 % quantiles).
Water yield is very low between October and March at all gauges due to temperatures below the freezing point. As temperatures start to rise in spring, snowmelt usually starts around March in low elevations and mid-May in high elevations (see also Fig. 8), causing the initial increases in water yield. In Sölden and Tumpen, peak pw(WOY) values are recorded in early June, whereas the highest pw(WOY) values in Vent are not achieved until the end of June or early July. Water yield at all gauges recedes as temperatures start to drop in September.
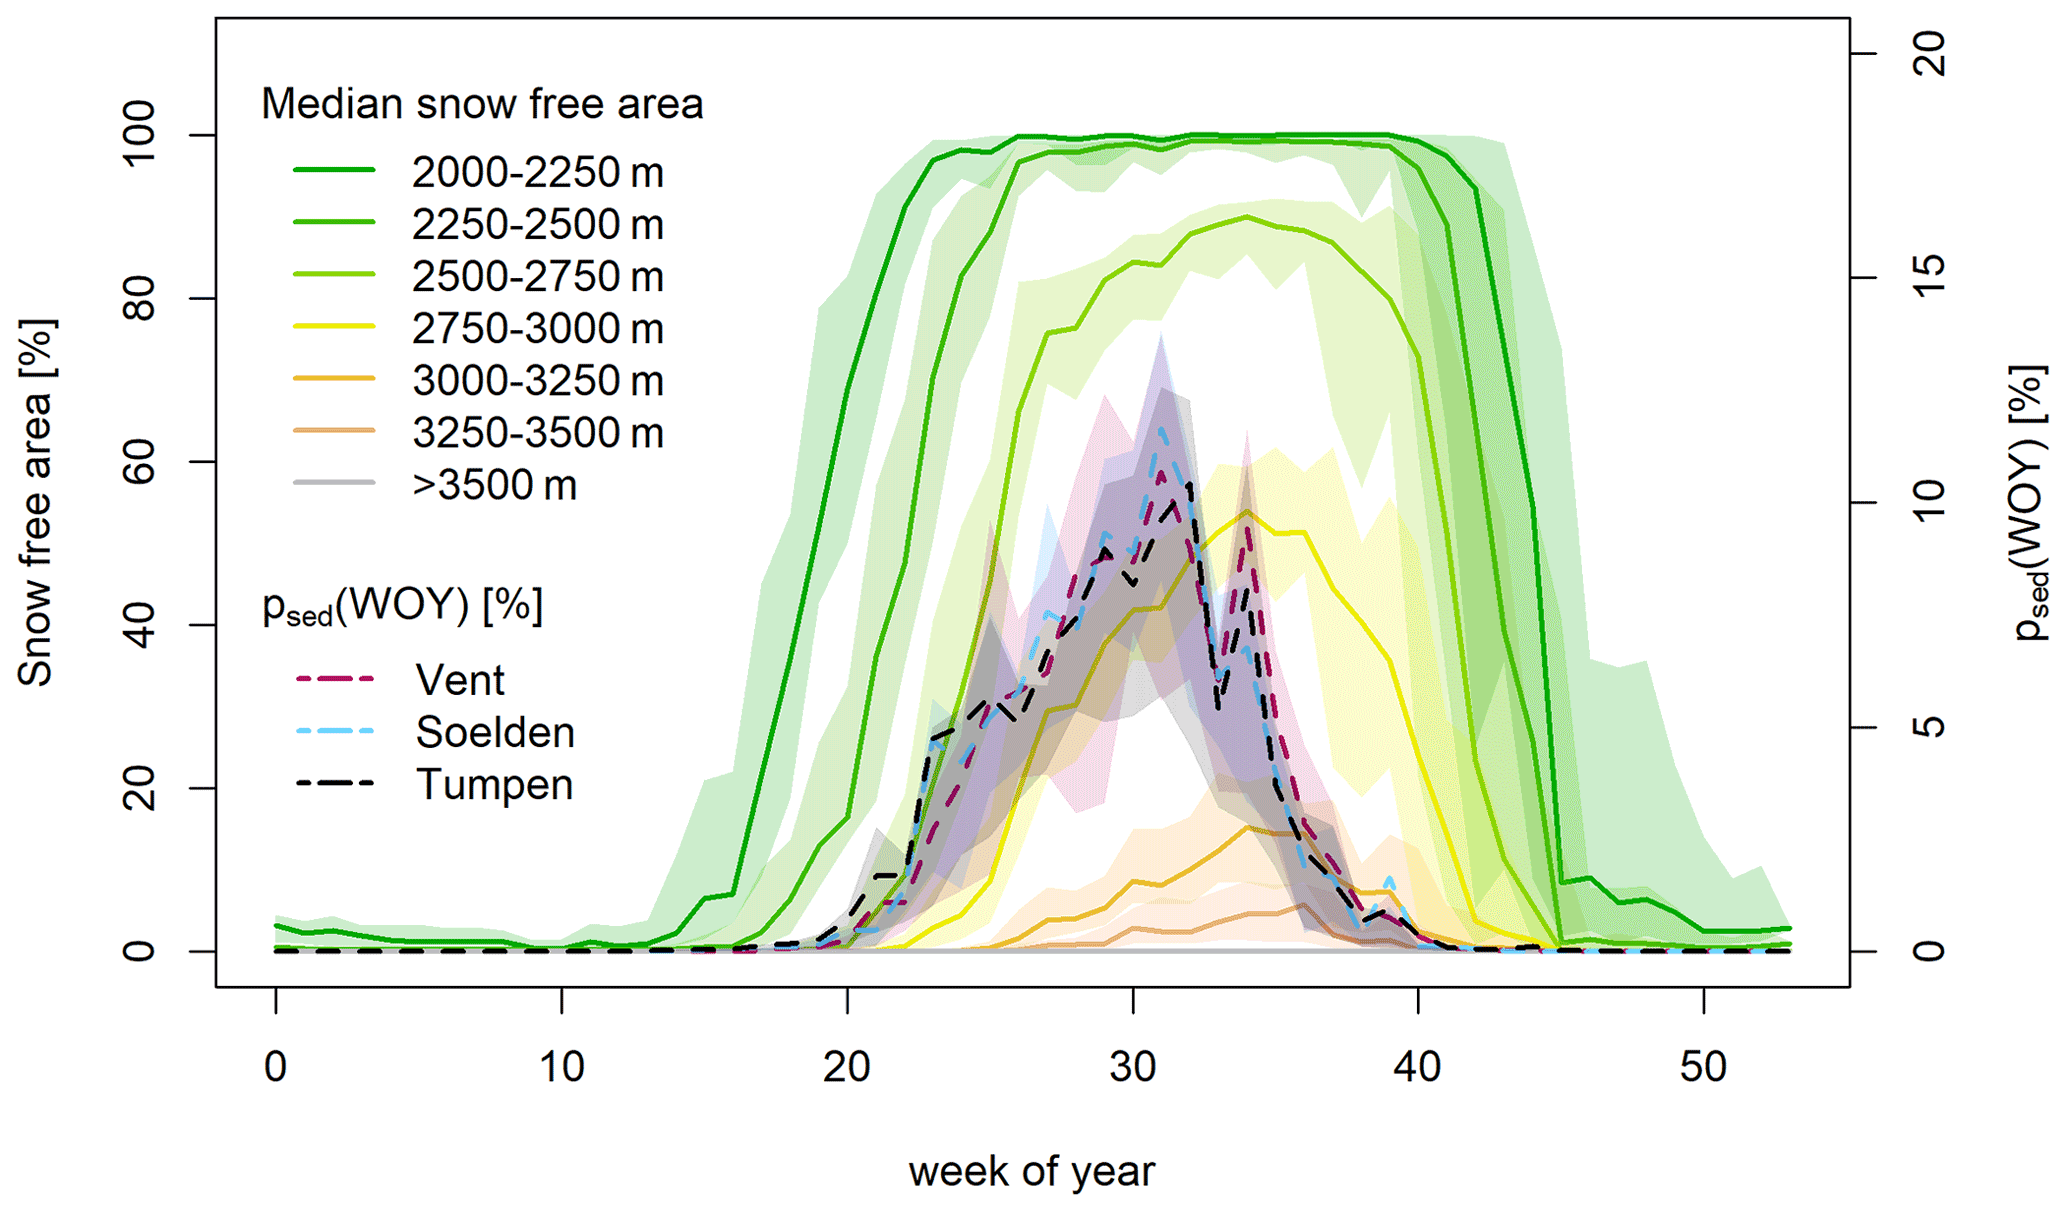
Figure 8Mean weekly percentage of annual SSY psed(WOY) and median snow-free fraction resolved to selected elevation bands (above 2000 m a.s.l.) within the Tumpen catchment. Lightly colored areas depict interquartile ranges (i.e., 25 % and 75 %).
Suspended sediment seasonality is even more pronounced than discharge seasonality, as sediment yields start to increase later in the year and decrease earlier, and they are thus constrained to a smaller time window at all gauges (Fig. 7). The highest psed(WOY) values occur during the ice-melt-dominated period after mid-July, coinciding with the highest weekly pw(WOY) at the gauge in Vent but delayed with respect to peak pw(WOY) at the lower-lying gauges (Fig. 7).
Discharge seasonality becomes more pronounced with elevation (Fig. 7): of the annual water yield, 62 %, 52 % and 50 % are generated in summer in Vent, Sölden and Tumpen, and 11 %, 13 % and 14 % in winter and autumn, respectively. An analysis of the individual years showed that the timing of the water yield increase in early spring is very similar at the three gauges. However, initially specific discharge is lower in Vent compared to Sölden and Tumpen, as snowmelt starts roughly at the same time in spring in all sub-catchments, but at a much lower rate upstream compared to downstream as temperatures above the freezing point occur earlier in lower areas. Later in summer, specific discharge is higher in Vent compared to Sölden and Tumpen.
Interestingly, the timing and seasonal distribution of specific sediment yield are very similar at the three gauges (Fig. 7), although absolute sediment yield is higher at the downstream gauges. This was also confirmed by an analysis of individual years: only in 4 of the 15 years of data (2007, 2009, 2018 and 2019) were very small portions of the annual SSY in Tumpen transported starting 2 weeks before the initial rise in Vent, but the first sharp increase in SSY was always simultaneous at the three gauges. Thus, suspended sediment seasonality changes only slightly with elevation: 81 %, 80 % and 76 % of the annual SSY are transported in summer in Vent, Sölden and Tumpen and 18 %, 19 % and 23 % in spring, respectively. The striking decrease in psed(WOY) at all stations in week 33 (i.e., around mid-August) is due to the coincidental absence of large events in the observed period in this week compared to the weeks before and after.
3.4 Spatiotemporal dynamics of snow cover and suspended sediment seasonality
To explore the simultaneous onset of sediment export at all sites and the delay compared to the initial rises in water yield, we used a synoptic view of the mean spatiotemporal snow cover evolution with sediment seasonality.
The spatial snow cover evolution shows that in March (ca. week 10), the entire area above 2000 m is usually covered by snow (Fig. 8). Until the end of April (ca. week 18), the area above 2500 m is still entirely snow-covered, while about 20 % and 60 % of the two elevation bands below 2500 m are already snow-free. Starting in May, snow melts in areas above 2750 m.
The initial rise in psed(WOY) at all gauges coincides with the onset of snowmelt above 2500 m. Further differentiation between the elevation bands above 2500 m is difficult: firstly, an analysis of the individual years showed that snowmelt often started simultaneously in all elevation bands above 2500 m (although with different intensities). Furthermore, Matiu et al. (2020) warn against analyses of short periods of time that are too detailed due to uncertainties in the snow cover data and advise to average over weeks to months. Yet what was clear from the analysis of individual years as well as from Fig. 7 is that the onset of snowpack removal in the areas below 2500 m always preceded the initial rise in suspended sediment psed(WOY) at the three gauges.
In autumn, sediment export declines as soon as the first snow cover starts to build up, which happens simultaneously at all elevations above 2000 m but to variable extents.
3.5 Characteristics of areas above 2500 m a.s.l.
To investigate whether the co-occurrence of snowmelt above 2500 m with spring increases in sediment export is linked to changes in land cover, we analyzed CORINE land cover data for the individual elevation bands (Fig. 9). The most striking differences between the areas below and above 2500 m a.s.l. are the decrease in natural grasslands and the increase in bare rock surfaces. Moreover, the first glacier areas can be found above 2500 m, and for most glaciers in the area, the (tip of the) glacier tongue is located here. In the elevation band below, between 2250 and 2500 m a.s.l., 93 % of the 0.5 km2 glacier area that had remained in this elevation band during the glacier inventory of 2006 had melted by 2015. Thus, the most recently deglaciated proglacial zones – with a much larger area of 3.2 km2 glacier retreat between 2006 and 2015 – are located between 2500 and 2750 m.
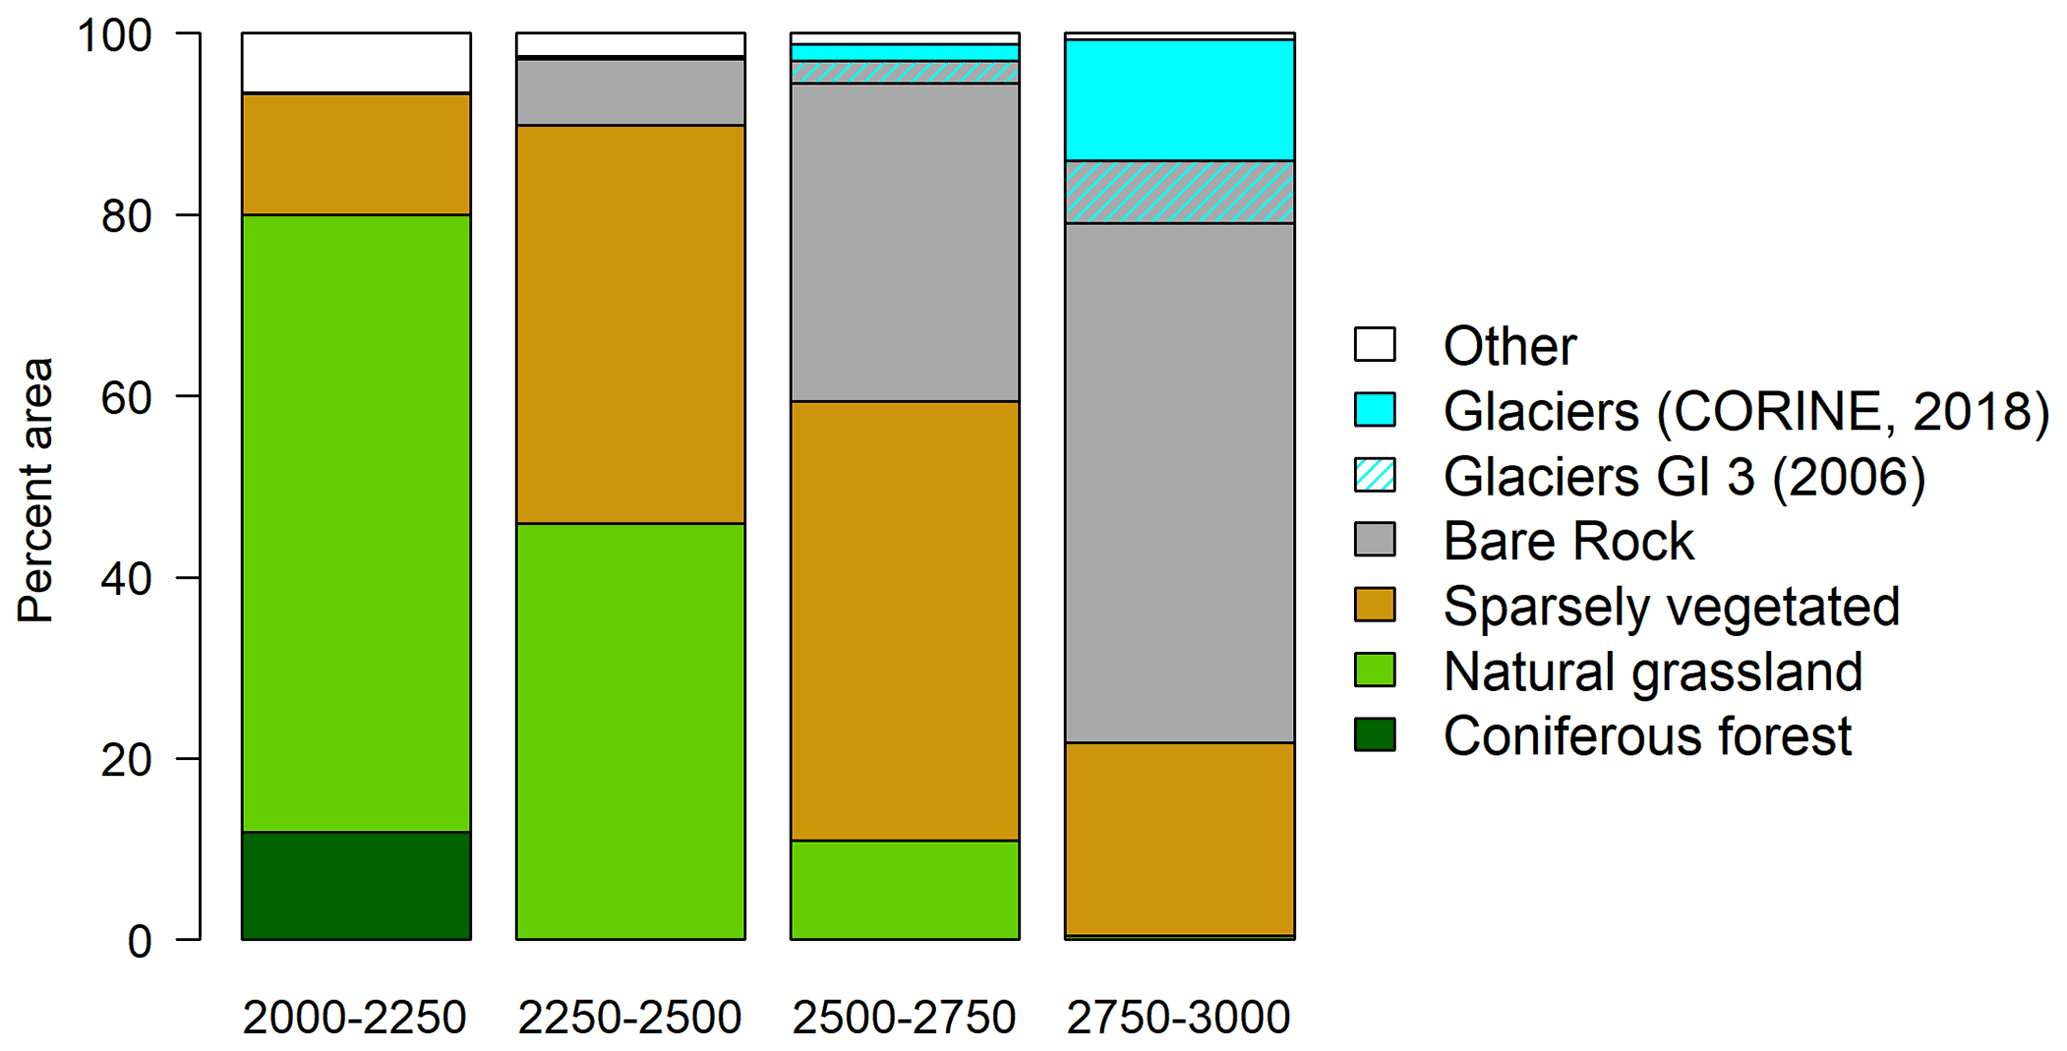
Figure 9Land cover in the elevation bands between 2000 and 3000 m a.s.l. based on CORINE land cover data (Umweltbundesamt, 2018).
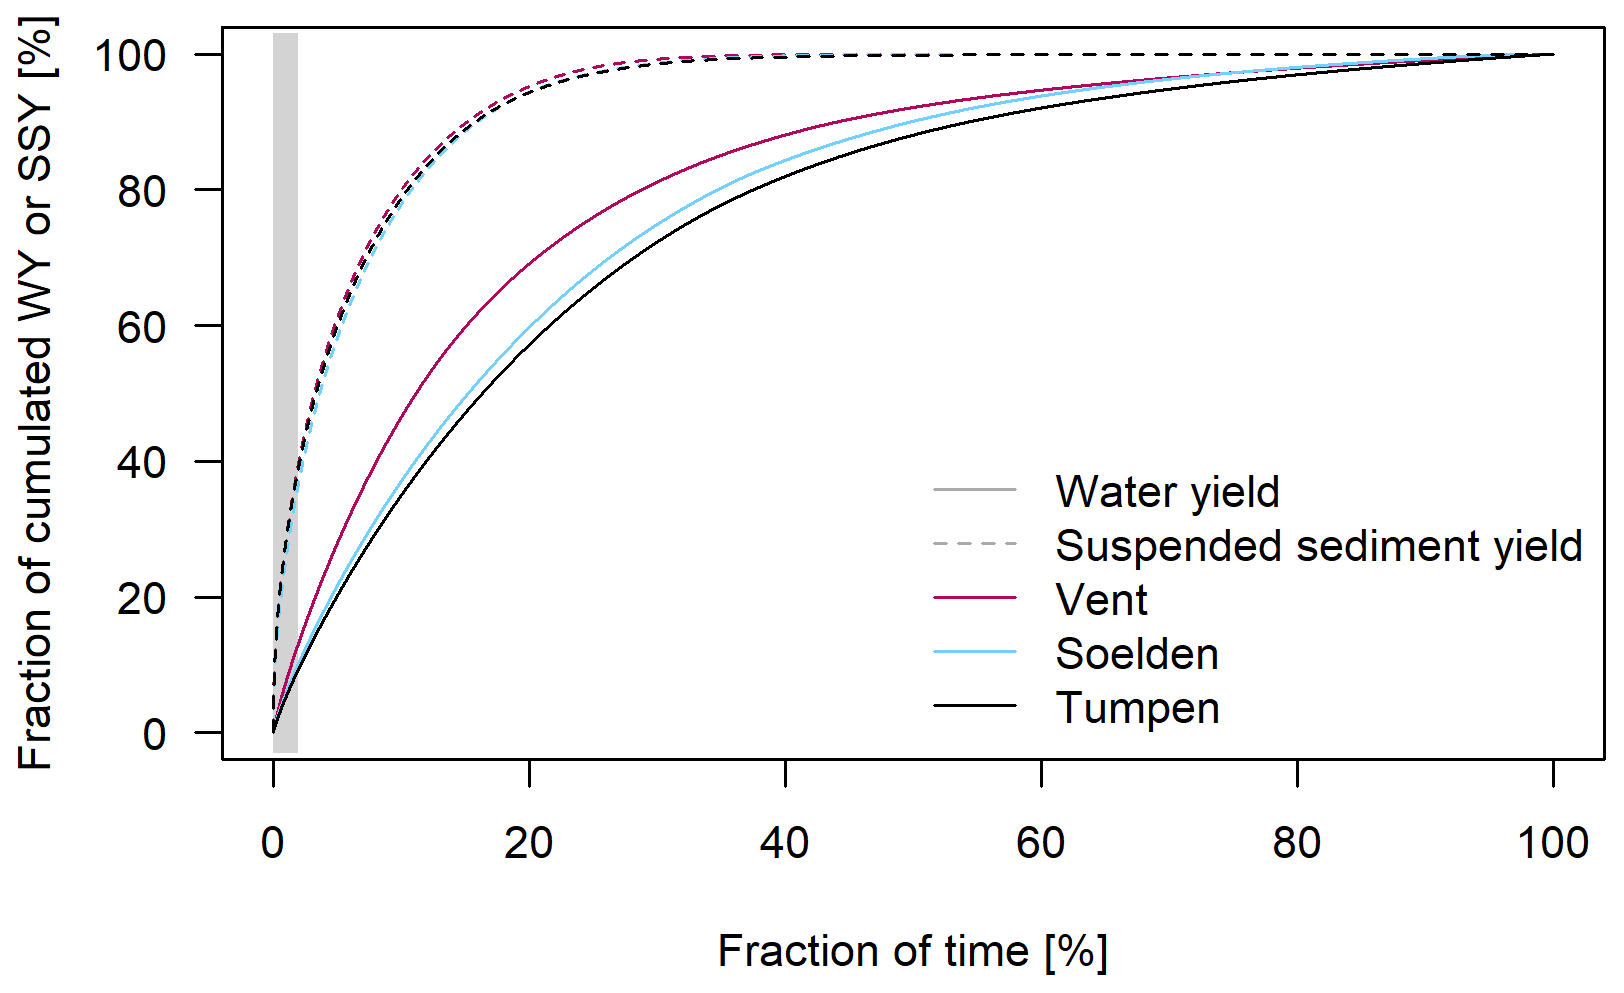
Figure 10Duration curves of water and suspended sediment yield based on 15 min data. The grey area represents the percentage of time classified as events. Note that the three lines for suspended sediment are very similar and might appear as only one line.
3.6 Event-based assessment of suspended sediment dynamics
For Vent, we identified between 6 and 16 Qsed events per year and a total of 100 events. Of the counted events, 95 % were shorter than 24 h and the periods classified as events correspond to 0.5 % to 1.5 % of the year. All events combined transported on average 7 % of the annual water yield (min. 4 %–max. 9 %, i.e., 6×10⁶ to 13×106 m3) and 25 % of the annual sediment yield in Vent (min. 12 %–max. 40 %, i.e., 8.5×10³ to 57×103 t).
In Tumpen, we identified between 7 and 13 events per year and a total of 84 events. Compared to the 100 events identified in Vent, this means that some of the events detected in Vent did not stand out against the diurnal amplitude in Tumpen. The events in Tumpen were slightly longer than the events in Vent, as only 83 % were shorter than 24 h. All events combined on average accounted for 6 % of the annual water yield (min. 4 % and max. 9 %, i.e., 35×106 and 80×106 m3) and 26 % of the annual SSY in Tumpen (min. 16 % to max. 38 %, i.e., 102×103 to 372×103 t). Similar to Vent, the periods classified as events correspond to 1 % to 2 % of the year.
Although we only examined the events of the last 10 years, these proportions seem to be representative for the whole time series since 2006, as indicated by the grey area in Fig. 10, which shows that up to almost 40 % of the cumulated yield is transported within 2 % of the time.
Of the identified events, 84 % were associated with precipitation, while the remaining events were associated with the melting of snow or ice. The events associated with precipitation transported on average 21 % (min. 7 %–max. 40 %) of the annual SSY and 5 % (min. 2 %–max. 9 %) of the annual water yield. The most extreme event was observed in August 2014, when 26 % of the annual SSY (ca. 26 000 t) and 2.2 % of the annual water yield were transported in only 25 h. We hypothesize that this was associated with mass movements, as the event was preceded by a prolonged precipitation period (67 mm within 7 d and 30 mm within 24 h before the event), but do not have field observations from this time.
However, we did observe an event on 28 August 2020, when an extreme precipitation event of about 100 mm within 3 d led to a mass-wasting event onto the Hintereisferner, one of the largest glaciers within the Vent catchment. A total of 13 % of the annual SSY at the gauge in Vent (about 15 000 t) was exported within the first 30 h and 20 % within 4 d. The starting zone of the observed mass movement is located in an area with a high probability of permafrost occurrence (Boeckli et al., 2012).
4.1 Magnitudes of water and suspended sediment yield
We determined the order of magnitude of mean specific discharge (sQ) and specific suspended sediment yields (sSSY) on several spatial scales of 900 to 1500 mm a−1 for discharge and 1000 to 1500 t km−2 a−1 for sSSY, which generally correspond well to values reported for other catchments in the Ötztal and Stubai Alps (Schöber and Hofer, 2018). Our estimates of sSSY fall at the high end compared to the extensive collection of studies compiled by Hinderer et al. (2013) for the European Alps: only three catchments (the Haut Glacier D'Arolla and, the Tsidjiore Nouve and the Vispa with higher or similar glacier cover compared to Vent) showed higher annual sSSY than at the gauge Vent. Remarkably, the specific discharge of the order of 1500 mm at the gauge in Vent appears high compared to areal precipitation estimates for the Vent catchment between 1200 and 1500 (Hanzer et al., 2018; Kuhn et al., 2016; Stoll et al., 2020), leaving almost no room for evapotranspiration. This phenomenon can be explained by the contribution of non-equilibrium glacier melt and thus release of water from long-term glacier storage (Hock et al., 2005).
4.2 Spatial differences in discharge and SSY as well as relations to glacier cover and mass balances
We found that mean annual values for both sQ and sSSY were highest at the gauge in Vent and thus correlate positively with glacier cover among the analyzed catchments. Similar correlations have been reported across the European Alps for spatially distinct catchments (Hinderer et al., 2013; Lalk et al., 2014; Schöber and Hofer, 2018) as opposed to the situation of nested catchments in our study.
The increase in specific discharge with glacier cover among catchments is reasonable given its correlation with high-altitude, non-equilibrium glacier storage and higher contribution of glacier meltwater in Vent compared to lower elevations, where snowmelt gains in relative importance (Kormann et al., 2016; Kuhn et al., 2016; Weber and Prasch, 2016). However, precipitation also increases with elevation: mean annual precipitation at the gauge in Vent of 666 mm is much lower than the 1200 to 1500 mm estimated for the Vent catchment, and even 1525 to 1900 mm is reported for the 11.4 km2 Vernagtferner sub-catchment (2600–3600 m elevation) (Braun et al., 2007; Hanzer et al., 2018; Kuhn et al., 2016; Stoll et al., 2020). Further contributing factors are lower temperatures and vegetation cover, leading to lower evapotranspiration in higher elevations.
Looking at interannual differences within the Vent catchment, annual sQ of the period 2006 to 2020 did not show a significant correlation with glacier mass balances and a very low R2, as opposed to the entire available time series since 1976 (Fig. 6). We attribute this to the leverage of individual years such as 2014, when a ca. 10-year flood occurred in the Ötztaler Ache on 13 August and the percentage of the annual water yield during precipitation events was 9 % (the highest percentage of the 10 years examined), while, unusually, the annual glacier mass balance was close to zero.
The increase in mean sSSY with glacier cover is in line with the current understanding that glaciers act as important sediment sources, especially during the transitional, paraglacial state of deglaciation (Ballantyne, 2002), through glacial erosion, the provision of proglacial sediments following their retreat and the transport of subglacial sediments by meltwaters (Beylich et al., 2017; Delaney et al., 2018a; Schöber and Hofer, 2018). This is further supported by the negative correlation between annual glacier mass balance and annual sSSY (i.e., positive correlation between glacier ablation and sediment export) as well as our finding that differences in mean annual sQ and sSSY were mainly due to differences during the glacier melt period. Interestingly, specific discharge volumes show much lower interannual variability than sSSY, which we attribute to the compensating effect of glaciers for interannual streamflow variability (Hock et al., 2005). We did not find a clear relationship between annual water yield and annual sediment yield at any of the gauges and conclude that annual water yield does not seem to explain much of the interannual variability in SSY.
4.3 Seasonality of discharge and suspended sediment yields as well as spatial differences therein
We further assessed the spatiotemporal distribution by analyzing the seasonality of discharge and SSY at the three gauges. This showed that discharge seasonality is scale-dependent, as water yield increases earlier at the lower gauges due to earlier onsets of snowmelt, as well as lower relative contributions of glacier melt and higher relative contributions of precipitation in lower elevations (see also Kormann et al., 2016; Weber and Prasch, 2016). Accordingly, the highest weekly percentages of annual water yield pw(WOY) are observed during the snowmelt phase at the gauges in Sölden and Tumpen but during the glacier melt phase in Vent. This can be attributed to the higher percentage of glacier cover further upstream and associated higher daily discharge maxima during summer (Gattermayr, 2013). In contrast, SSY seasonality is synchronous at the three gauges. The mean annual cycle suggests that sediment discharge is negligible in winter. It has to be noted that there are no direct SSC measurements at the Vent and Sölden gauges during late autumn and winter, as the respective monitoring is routinely paused to avoid damages to the equipment by ice and reinstalled before the initial rise in concentrations in spring. However, turbidity recordings at the gauge in Tumpen show that the total sSSY of roughly 0.5 t km−2 in January to March accounts for less than 1 % of the annual sSSY. Sediment supply seems to be limited in spring as the initial rise in water yield precedes the beginning of sediment export, and similar discharge volumes transport higher amounts of sediment in late summer compared to spring.
4.4 Spatiotemporal dynamics of snow cover and suspended sediment seasonality
To explore the reasons behind the simultaneous onset of suspended sediment export at the three gauges, we investigated the temporal evolution of snow-free area in different elevation bands. The snowmelt timing as derived from the MODIS product (Matiu et al., 2020) is well in accordance with the timing as reported by Kuhn et al. (2016).
As the spring increase in sediment export at all gauges coincides with snowmelt above 2500 m a.s.l., we conclude that the areas above 2500 m are crucial source areas, where the determining processes are activated as the snow melts. These processes include the initiation of ice melt and export of sediment from subglacial and proglacial areas as well as increased susceptibility of snow-free and possibly unfrozen hillslopes to pluvial erosion. The suitability of snow-free area as a proxy for these processes is also supported by the coinciding decline in sediment transport and build-up of first snow cover in autumn.
The areas above 2500 m contain landscape elements such as glacier tongues and proglacial areas, which have been identified as very significant for sediment dynamics in other catchments (Delaney et al., 2018a; Orwin and Smart, 2004; Schöber and Hofer, 2018). For example, Delaney et al. (2018a) found that although far more sediment originated subglacially, erosion rates in proglacial areas were over 50 times greater than in the rest of the Griesgletscher catchment in the Swiss Alps. As another characteristic of the areas above 2500 m, permafrost is likely to occur in favorable or cold conditions according to the permafrost distribution map provided by Boeckli et al. (2012) and as demonstrated by Klug et al. (2017). Thus, erosion processes associated with permafrost thawing could also play a role, for example as the active layer becomes susceptible to pluvial erosion once it has thawed (Li et al., 2021).
We conclude that sediment export in all three catchments is limited as long as the areas above 2500 m are frozen or snow-covered and subglacial sediment sources are still inactive. This has implications for the future, since these areas will likely be snow-free for longer periods in summer (Hanus et al., 2021; Hanzer et al., 2018) during which sediments from these areas can be mobilized. At the same time, the crucial areas might increase in size as glaciers retreat and recently deglaciated areas increase. Additionally, assuming that permafrost degradation is an ongoing and largely irreversible process, the increase in erodible surfaces due to permafrost melt seems very likely.
4.5 Event-based assessment of suspended sediment dynamics
All Qsed events combined (up to 2 % of the total time span) on average accounted for 25 % and 26 % of the annual sediment yield but only 7 % and 6 % of annual water yield in Vent and Tumpen, respectively. In combination with the more pronounced seasonality of SSY, this explains the much “flashier” behavior compared to discharge (Fig. 10). Similar proportions have been reported for other glaciated catchments (Leggat et al., 2015; Wulf et al., 2012), which suggests greater availability and/or easier mobilization of sediments compared to fluvial systems wherein up to 90 % of sediment is transported during short, high-discharge events (Delaney et al., 2018b).
In Vent, 84 % of the events were associated with precipitation. While this implies that, so far, thermally induced sediment export through snow and glacier melt yields the biggest share of SSY in Vent, we also showed that individual summer rainstorm events can account for up to 26 % of the annual yield (ca. 26 000 t) within just over 24 h if mass movements are involved. Since we had to limit this analysis to the Vent catchment, we cannot assess spatial variation in the importance of precipitation events.
We suggest that hydro-sedimentological events such as the one observed in August 2020 – involving mass movements that were triggered by heavy precipitation and are probably associated with increased hydro-sedimentological connectivity and/or permafrost thaw – are likely to occur more frequently in the future: in view of expected future developments, such as more frequent high-intensity summer rainstorms (Giorgi et al., 2016), prolonged snow-free periods in summer during which these rainstorms can become erosive (Hanus et al., 2021; Hanzer et al., 2018), the exposure of vast amounts of sediment due to glacier retreat (Carrivick and Heckmann, 2017; Lane et al., 2017) and accelerating permafrost thaw, which facilitates more frequent slope-failure events (Savi et al., 2020), heavy precipitation events have the potential to drastically gain in importance with regard to sediment export.
4.6 Outlook
To our knowledge, this study represents the first extensive analysis of discharge and suspended sediment dynamics on multiple spatial and temporal scales in a glaciated, high-alpine setting. The employed approach can bridge the gap between detailed, small-scale investigations of individual (pro)glacial areas and wide-area comparisons of numerous gauges in low temporal resolution. Our results extend the knowledge on hydro-sedimentological dynamics in glaciated high-alpine areas and can therefore serve as a basis for future studies and management strategies. For example, studies attempting to model sediment dynamics in high-alpine areas might consider focusing more attention on the areas above 2500 m compared to other parts of the study area. Likewise, studies on future changes in high-alpine sediment dynamics need to consider the potentially changing role of precipitation and mass movements relative to the currently dominating thermal processes.
Discharge dynamics in glaciated high-alpine areas are expected to change fundamentally due to climate change, yet little is known about how exactly these changes propagate to sediment dynamics. To provide the basis for future studies investigating these future changes, we analyzed discharge and suspended sediment concentration data from the recent past in a nested catchment setup in the Ötztal in Tyrol, Austria, and aimed to identify the areas, time periods and processes that are crucial for suspended sediment and discharge dynamics.
We showed that mean annual discharge and suspended sediment export were highest in the smallest, highest, most glaciated sub-catchment above the gauge in Vent and that annual water and sediment yields correlated significantly with annual glacier mass balances. This demonstrates that glaciated areas are important sediment sources and glacier meltwater contribution is high.
Discharge seasonality is more pronounced at higher elevations due to a later onset of snowmelt, higher glacier melt contributions and a considerable positive precipitation gradient with elevation.
However, the onset of suspended sediment export in spring occurs almost synchronously at the three gauges, and the time lag compared to the spring increase in discharge points towards a limitation of sediment supply during this time. We analyzed sediment seasonality in synopsis with snowmelt timing in different elevation bands, which suggests that the areas above 2500 m a.s.l., including glacier tongues, bare rock surfaces and recently deglaciated areas, are crucial for suspended sediment dynamics.
Our analysis showed that sediment dynamics are largely dominated by melt-driven processes, as precipitation events play a subordinate role compared to thermally induced discharge and suspended sediment export. However, single large rainfall events can significantly contribute to the annual sediment budget, which we attribute to the activation of additional sediment supply by mass-wasting processes and increased hydro-sedimentological connectivity during phases of excessive overland flow. We discuss the fact that these events are likely to occur more frequently in the future, which may result in a shift in the relative importance of precipitation events for sediment dynamics.
Our study extends the scientific knowledge on current hydro-sedimentological dynamics in glaciated high-alpine areas and provides a baseline for investigations on projected future changes in hydro-sedimentological system dynamics. Such future investigations should focus on the areas above 2500 m and the role of precipitation events when addressing future changes in suspended sediment and discharge dynamics, e.g., in modeling studies.
Discharge and suspended sediment concentration data from the gauges at Vent and Tumpen recorded by the Hydrographic Service of Tyrol, Austria, as well as sediment concentrations from our samples taken in Sölden are published under https://doi.org/10.23728/b2share.be13f43ce9bb46d8a7eedb7b56df3140 (Schmidt and Hydrographic Service of Tyrol, 2021).
Discharge and turbidity time series recorded by the TiWAG at the gauge in Sölden along with suspended sediment concentration data in TiWAG samples can be requested via info-ausbau.kw.kaunertal@tiwag.at.
Precipitation and air temperature data recorded at the Vernagtferner hydro-meteorological station by the Bavarian Academy of Sciences and Humanities are successively made available on PANGEA, and data until 2012 are already available at https://doi.org/10.1594/PANGAEA.829530 (Escher-Vetter et al., 2014).
The DTM of Tyrol is available at https://www.data.gv.at/katalog/dataset/land-tirol_tirolgelnde (Land Tirol, 2016).
Land cover data are available at https://www.data.gv.at/katalog/dataset/clc2018 (Umweltbundesamt, 2018).
Glacier inventories are available at https://doi.org/10.1594/PANGAEA.844985 (Fischer et al., 2015) and https://doi.org/10.1594/PANGAEA.887415 (Buckel and Otto, 2018). Glacier mass balances are available at https://doi.org/10.5904/wgms-fog-2021-05, 2021 (World Glacier Monitoring Service, 2021). Snow cover data are available via https://doi.org/10.3390/data5010001 (Matiu et al., 2020).
LKS planned the sampling and conceptualized the study together with the supervisors TF and AB. TB and JS mentored and reviewed. LKS conducted the statistical analyses with support and supervision by TF and AB. LKS conducted the GIS analysis. ER developed the code and performed the calculations for the snow cover analysis. LKS prepared the original draft, including all figures, and all authors contributed to the writing of this paper.
The contact author has declared that none of the authors has any competing interests.
Publisher's note: Copernicus Publications remains neutral with regard to jurisdictional claims in published maps and institutional affiliations.
We thank the Hydrographic Service of Tyrol, Austria, the TiWAG Tirolean hydropower corporation, and the Bavarian Academy of Sciences and Humanities for the provision of data as well as logistical support and fruitful discussions.
We thank Peter Grosse and Marvin Teschner for their support in the field, laboratory work and data analyses, Nina Lena Neumann and Joseph Pscherer for their laboratory work, and Daniel Bazant for his support during the GIS analysis.
We thank Stefan Achleitner, Carolina Kinzel and the environmental engineering laboratory at the University of Innsbruck for their kind support during fieldwork and laboratory work.
We thank Anatoly Tsyplenkov and Ronald Pöppl for their detailed and constructive reviews of this paper.
This research has been supported by the Deutsche Forschungsgemeinschaft Research Training Group “Natural Hazards and Risks in a Changing World” (NatRisk Change GRK 2043/1 and NatRisk Change GRK 2043/2 grants) as well as a fieldwork fellowship from the German Hydrological Society (DHG).
This paper was edited by Tom Coulthard and reviewed by Anatoly Tsyplenkov and Ronald Pöppl.
Abermann, J., Lambrecht, A., Fischer, A., and Kuhn, M.: Quantifying changes and trends in glacier area and volume in the Austrian Ötztal Alps (1969-1997-2006), The Cryosphere, 3, 205–215, https://doi.org/10.5194/tc-3-205-2009, 2009.
Ballantyne, C. K.: Paraglacial geomorphology, Quat. Sci. Rev., 21, 1935–2017, https://doi.org/10.1016/S0277-3791(02)00005-7, 2002.
Beniston, M., Farinotti, D., Stoffel, M., Andreassen, L. M., Coppola, E., Eckert, N., Fantini, A., Giacona, F., Hauck, C., Huss, M., Huwald, H., Lehning, M., López-Moreno, J.-I., Magnusson, J., Marty, C., Morán-Tejéda, E., Morin, S., Naaim, M., Provenzale, A., Rabatel, A., Six, D., Stötter, J., Strasser, U., Terzago, S., and Vincent, C.: The European mountain cryosphere: a review of its current state, trends, and future challenges, The Cryosphere, 12, 759–794, https://doi.org/10.5194/tc-12-759-2018, 2018.
Beylich, A. A., Laute, K., and Storms, J. E. A.: Contemporary suspended sediment dynamics within two partly glacierized mountain drainage basins in western Norway (Erdalen and Bødalen, inner Nordfjord), Geomorphology, 287, 126–143, https://doi.org/10.1016/j.geomorph.2015.12.013, 2017.
Bilotta, G. S. and Brazier, R. E.: Understanding the influence of suspended solids on water quality and aquatic biota, Water Res., 42, 2849–2861, https://doi.org/10.1016/j.watres.2008.03.018, 2008.
Boeckli, L., Brenning, A., Gruber, S., and Noetzli, J.: Permafrost distribution in the European Alps: calculation and evaluation of an index map and summary statistics, The Cryosphere, 6, 807–820, https://doi.org/10.5194/tc-6-807-2012, 2012.
Braun, L. N., Escher-Vetter, H., Siebers, M., and Weber, M.: Water Balance of the highly Glaciated Vernagt Basin, Ötztal Alps, in: The water balance of the alps: what do we need to protect the water resources of the Alps?; proceedings of the conference held at Innsbruck university, 28–29 September 2006, Univ. Press, Innsbruck, 2007.
Buckel, J. and Otto, J.-C.: The Austrian Glacier Inventory GI 4 (2015) in ArcGis (shapefile) format, PANGAEA [data set], https://doi.org/10.1594/PANGAEA.887415, 2018.
Bürger, G., Pfister, A., and Bronstert, A.: Temperature-Driven Rise in Extreme Sub-Hourly Rainfall, J. Clim., 32, 7597–7609, https://doi.org/10.1175/JCLI-D-19-0136.1, 2019.
Carrivick, J. L. and Heckmann, T.: Short-term geomorphological evolution of proglacial systems, Geomorphology, 287, 3–28, https://doi.org/10.1016/j.geomorph.2017.01.037, 2017.
Cavalli, M., Trevisani, S., Comiti, F., and Marchi, L.: Geomorphometric assessment of spatial sediment connectivity in small Alpine catchments, Geomorphology, 188, 31–41, https://doi.org/10.1016/j.geomorph.2012.05.007, 2013.
Chiarle, M., Geertsema, M., Mortara, G., and Clague, J. J.: Relations between climate change and mass movement: Perspectives from the Canadian Cordillera and the European Alps, Glob. Planet. Change, 202, 103499, https://doi.org/10.1016/j.gloplacha.2021.103499, 2021.
Collins, D. N.: Seasonal and annual variations of suspended sediment transport in meltwaters draining from an Alpine glacier, in: Hydrological Measurements; the Water Cycle (Proceedings of two Lausanne Symposia), Hydrology in Mountainous Regions I: Hydrological Measurements; the Water Cycle 193, Lousanne, 9, 1990.
Collins, D. N.: A conceptually based model of the interaction between flowing meltwater and subglacial sediment, Ann. Glaciol., 22, 224–232, https://doi.org/10.3189/1996AoG22-1-224-232, 1996.
Costa, A., Anghileri, D., and Molnar, P.: Hydroclimatic control on suspended sediment dynamics of a regulated Alpine catchment: a conceptual approach, Hydrol. Earth Syst. Sci., 22, 3421–3434, https://doi.org/10.5194/hess-22-3421-2018, 2018.
Delaney, I. and Adhikari, S.: Increased Subglacial Sediment Discharge in a Warming Climate: Consideration of Ice Dynamics, Glacial Erosion, and Fluvial Sediment Transport, Geophys. Res. Lett., 47, e2019GL085672, https://doi.org/10.1029/2019GL085672, 2020.
Delaney, I., Bauder, A., Huss, M., and Weidmann, Y.: Proglacial erosion rates and processes in a glacierized catchment in the Swiss Alps, Earth Surf. Process. Landf., 43, 765–778, https://doi.org/10.1002/esp.4239, 2018a.
Delaney, I., Bauder, A., Werder, M., and Farinotti, D.: Regional and annual variability in subglacial sediment transport by water for two glaciers in the Swiss Alps, Front. Earth Sci., 6, 175, https://doi.org/10.3929/ethz-b-000305762, 2018b.
Environmental Systems Research Institute (Redlands, CA): ArcGIS Desktop, Release 10.6.1 [code], 2018.
Escher-Vetter, H., Braun, L. N., and Siebers, M.: Hydrological and meteorological records from the Vernagtferner Basin – Vernagtbach station, for the years 2002 to 2012, PANGAEA [data set], https://doi.org/10.1594/PANGAEA.829530, 2014.
Felix, D., Albayrak, I., and Boes, R. M.: In-situ investigation on real-time suspended sediment measurement techniques: Turbidimetry, acoustic attenuation, laser diffraction (LISST) and vibrating tube densimetry, Int. J. Sediment Res., 33, 3–17, https://doi.org/10.1016/j.ijsrc.2017.11.003, 2018.
Fischer, A., Seiser, B., Stocker-Waldhuber, M., and Abermann, J.: The Austrian Glacier Inventory GI 3, 2006, in ArcGIS (shapefile) format, PANGAEA [data set], https://doi.org/10.1594/PANGAEA.844985, 2015.
Gabbud, C. and Lane, S. N.: Ecosystem impacts of Alpine water intakes for hydropower: the challenge of sediment management, WIREs Water, 3, 41–61, https://doi.org/10.1002/wat2.1124, 2016.
Gattermayr, W.: Das hydrographische Regime der Ötztaler Ache, in: Wetter und Klima im Wandel, edited by: Koch, E.-M. and Erschbamer, B., vol. 3 Klima, Wetter, Gletscher im Wandel, Innsbruck University Press, Innsbruck, 35, 2013.
Giorgi, F., Torma, C., Coppola, E., Ban, N., Schär, C., and Somot, S.: Enhanced summer convective rainfall at Alpine high elevations in response to climate warming, Nat. Geosci., 9, 584–589, https://doi.org/10.1038/ngeo2761, 2016.
Gobiet, A., Kotlarski, S., Beniston, M., Heinrich, G., Rajczak, J., and Stoffel, M.: 21st century climate change in the European Alps – A review, Sci. Total Environ., 493, 1138–1151, https://doi.org/10.1016/j.scitotenv.2013.07.050, 2014.
Guillon, H., Mugnier, J.-L., and Buoncristiani, J.-F.: Proglacial sediment dynamics from daily to seasonal scales in a glaciated Alpine catchment (Bossons glacier, Mont Blanc massif, France), Earth Surf. Process. Landf., 43, 1478–1495, https://doi.org/10.1002/esp.4333, 2018.
Hallet, B., Hunter, L., and Bogen, J.: Rates of erosion and sediment evacuation by glaciers: A review of field data and their implications, Glob. Planet. Change, 12, 213–235, https://doi.org/10.1016/0921-8181(95)00021-6, 1996.
Hanus, S., Hrachowitz, M., Zekollari, H., Schoups, G., Vizcaino, M., and Kaitna, R.: Future changes in annual, seasonal and monthly runoff signatures in contrasting Alpine catchments in Austria, Hydrol. Earth Syst. Sci., 25, 3429–3453, https://doi.org/10.5194/hess-25-3429-2021, 2021.
Hanzer, F., Förster, K., Nemec, J., and Strasser, U.: Projected cryospheric and hydrological impacts of 21st century climate change in the Ötztal Alps (Austria) simulated using a physically based approach, Hydrol. Earth Syst. Sci., 22, 1593–1614, https://doi.org/10.5194/hess-22-1593-2018, 2018.
Hinderer, M., Kastowski, M., Kamelger, A., Bartolini, C., and Schlunegger, F.: River loads and modern denudation of the Alps – A review, Earth-Sci. Rev., 118, 11–44, https://doi.org/10.1016/j.earscirev.2013.01.001, 2013.
Hock, R.: 4.5 Hydrologische Veränderungen in vergletscherten Einzugsgebieten, in: Warnsignal Klima: Hochgebirge im Wandel, edited by: Lozán, J. L., Breckle, S.-W., and Graßl, H., Österreichischer Wasser- und Abfallwirtschaftsverband ÖWAV, Wien, 5, https://doi.org/10.25592/uhhfdm.9252, 2020.
Hock, R., Jansson, P., and Braun, L. N.: Modelling the Response of Mountain Glacier Discharge to Climate Warming, in: Global Change and Mountain Regions: An Overview of Current Knowledge, edited by: Huber, U. M., Bugmann, H. K. M., and Reasoner, M. A., Springer Netherlands, Dordrecht, 243–252, https://doi.org/10.1007/1-4020-3508-X_25, 2005.
Huggel, C., Salzmann, N., Allen, S., Caplan-Auerbach, J., Fischer, L., Haeberli, W., Larsen, C., Schneider, D., and Wessels, R.: Recent and future warm extreme events and high-mountain slope stability, Philos. Trans. R. Soc. Math. Phys. Eng. Sci., 368, 2435–2459, https://doi.org/10.1098/rsta.2010.0078, 2010.
Huss, M., Bookhagen, B., Huggel, C., Jacobsen, D., Bradley, R. S., Clague, J. J., Vuille, M., Buytaert, W., Cayan, D. R., Greenwood, G., Mark, B. G., Milner, A. M., Weingartner, R., and Winder, M.: Toward mountains without permanent snow and ice, Earths Future, 5, 418–435, https://doi.org/10.1002/2016EF000514, 2017.
Hydrographic yearbook of Austria, Hydrographisches Jahrbuch von Österreich, Hydrographischer Dienst in Österreich, Bundesministerium für Land- und Forstwirtschaft, Umwelt und Wasserwirtschaft Abteilung VII/3, 2016.
Klug, C., Rieg, L., Ott, P., Mössinger, M., Sailer, R., and Stötter, J.: A Multi-Methodological Approach to Determine Permafrost Occurrence and Ground Surface Subsidence in Mountain Terrain, Tyrol, Austria, Permafr. Periglac. Process., 28, 249–265, https://doi.org/10.1002/ppp.1896, 2017.
Kormann, C., Bronstert, A., Francke, T., Recknagel, T., and Graeff, T.: Model-Based Attribution of High-Resolution Streamflow Trends in Two Alpine Basins of Western Austria, Hydrology, 3, 7, https://doi.org/10.3390/hydrology3010007, 2016.
Kuhn, M., Nickus, U., and Pellet, F.: Precipitation Patterns in the Inner Ötztal, 17, Internationale Tagung für Alpine Meteorologie, Offenbach am Main, 1982.
Kuhn, M., Helfricht, K., Ortner, M., Landmann, J., and Gurgiser, W.: Liquid water storage in snow and ice in 86 Eastern Alpine basins and its changes from 1970–97 to 1998–2006, Ann. Glaciol., 57, 11–18, https://doi.org/10.1017/aog.2016.24, 2016.
Lalk, P., Haimann, M., and Habersack, H.: Monitoring, Analyse und Interpretation des Schwebstofftransportes an österreichischen Flüssen, Österr. Wasser- Abfallwirtsch., 66, 306–315, https://doi.org/10.1007/s00506-014-0175-x, 2014.
Land Tirol: Digital terrain model of Tyrol, 10m resolution, EPSG 31254 [data set], https://www.data.gv.at/katalog/dataset/land-tirol_tirolgelnde (last access: 5 July 2021), 2016.
Land Tirol: tiris OGD map service “Wasser”, Amt der Tiroler Landesregierung, Abt. Raumordnung und Statistik, FB tiris, Innsbruck, Austria, State of Tyrol [data set], https://www.data.gv.at/katalog/dataset/0b5d6529-d88c-46c0-84f7-b37282e96ce8, last access: 5 July 2021.
Lane, S. N., Bakker, M., Gabbud, C., Micheletti, N., and Saugy, J.-N.: Sediment export, transient landscape response and catchment-scale connectivity following rapid climate warming and Alpine glacier recession, Geomorphology, 277, 210–227, https://doi.org/10.1016/j.geomorph.2016.02.015, 2017.
Leggat, M. S., Owens, P. N., Stott, T. A., Forrester, B. J., Déry, S. J., and Menounos, B.: Hydro-meteorological drivers and sources of suspended sediment flux in the pro-glacial zone of the retreating Castle Creek Glacier, Cariboo Mountains, British Columbia, Canada, Earth Surf. Process. Landf., 40, 1542–1559, https://doi.org/10.1002/esp.3755, 2015.
Li, D., Overeem, I., Kettner, A., Zhou, Y., and Xixi, L.: Air Temperature Regulates Erodible Landscape, Water, and Sediment Fluxes in the Permafrost-Dominated Catchment on the Tibetan Plateau, Water Resour. Res., 57, e2020WR028193, https://doi.org/10.1029/2020WR028193, 2021.
Matiu, M., Jacob, A., and Notarnicola, C.: Daily MODIS Snow Cover Maps for the European Alps from 2002 onwards at 250 m Horizontal Resolution Along with a Nearly Cloud-Free Version, Data [data set], 5, 1, https://doi.org/10.3390/data5010001, 2020.
Merten, G., Capel, P., and Minella, J. P. G.: Effects of suspended sediment concentration and grain size on three optical turbidity sensors, J. Soils Sediments, 14, 1235–1241, https://doi.org/10.1007/s11368-013-0813-0, 2014.
Micheletti, N. and Lane, S. N.: Water yield and sediment export in small, partially glaciated Alpine watersheds in a warming climate, Water Resour. Res., 52, 4924–4943, https://doi.org/10.1002/2016WR018774, 2016.
Milliman, J. D. and Syvitski, J. P. M.: Geomorphic/Tectonic Control of Sediment Discharge to the Ocean: The Importance of Small Mountainous Rivers, J. Geol., 100, 525–544, https://doi.org/10.1086/629606, 1992.
Nones, M.: Dealing with sediment transport in flood risk management, Acta Geophys., 67, 677–685, https://doi.org/10.1007/s11600-019-00273-7, 2019.
Orwin, J. F. and Smart, C. C.: Short-term spatial and temporal patterns of suspended sediment transfer in proglacial channels, small River Glacier, Canada, Hydrol. Process., 18, 1521–1542, https://doi.org/10.1002/hyp.1402, 2004.
R Core Team: R: A language and environment for statistical computing, R Foundation for Statistical Computing, Vienna, Austria, R Core Team [code], https://www.R-project.org/ (last access: 28 June 2022), 2018.
Rottler, E., Francke, T., Bürger, G., and Bronstert, A.: Long-term changes in central European river discharge for 1869–2016: impact of changing snow covers, reservoir constructions and an intensified hydrological cycle, Hydrol. Earth Syst. Sci., 24, 1721–1740, https://doi.org/10.5194/hess-24-1721-2020, 2020.
Rottler, E., Vormoor, K., Francke, T., Warscher, M., Strasser, U., and Bronstert, A.: Elevation-dependent compensation effects in snowmelt in the Rhine River Basin upstream gauge Basel, Hydrol. Res., 52, 536–557, https://doi.org/10.2166/nh.2021.092, 2021.
Savi, S., Comiti, F., and Strecker, M. R.: Pronounced increase in slope instability linked to global warming: A case study from the eastern European Alps, Earth Surf. Process. Landf., 46, 1328–1347, https://doi.org/10.1002/esp.5100, 2020.
Scherrer, S. C., Fischer, E. M., Posselt, R., Liniger, M. A., Croci-Maspoli, M., and Knutti, R.: Emerging trends in heavy precipitation and hot temperature extremes in Switzerland, J. Geophys. Res.-Atmos., 121, 2626–2637, https://doi.org/10.1002/2015JD024634, 2016.
Schmidt, L. K. and Hydrographic Service of Tyrol, Austria: Discharge and suspended sediment time series of 2006–2020 of gauges Vent Rofenache and Tumpen in the glacierized high-alpine Ötztal, Tyrol, Austria, B2Share [data set], https://doi.org/10.23728/b2share.be13f43ce9bb46d8a7eedb7b56df3140, 2021.
Schöber, J. and Hofer, B.: The sediment budget of the glacial streams in the catchment area of the Gepatsch reservoir in the Ötztal Alps in the period 1965–2015, ICOLD 2018 Wien Int. Com. Large Dam Syst. Proc., 2018.
Schöber, J., Schneider, K., Helfricht, K., Schattan, P., Achleitner, S., Schöberl, F., and Kirnbauer, R.: Snow cover characteristics in a glacierized catchment in the Tyrolean Alps – Improved spatially distributed modelling by usage of Lidar data, J. Hydrol., 519, 3492–3510, https://doi.org/10.1016/j.jhydrol.2013.12.054, 2014.
Sommer, C., Malz, P., Seehaus, T. C., Lippl, S., Zemp, M., and Braun, M. H.: Rapid glacier retreat and downwasting throughout the European Alps in the early 21 st century, Nat. Commun., 11, 3209, https://doi.org/10.1038/s41467-020-16818-0, 2020.
Stoll, E., Hanzer, F., Oesterle, F., Nemec, J., Schöber, J., Huttenlau, M., and Förster, K.: What Can We Learn from Comparing Glacio-Hydrological Models?, Atmosphere, 11, 981, https://doi.org/10.3390/atmos11090981, 2020.
Strasser, U., Marke, T., Braun, L., Escher-Vetter, H., Juen, I., Kuhn, M., Maussion, F., Mayer, C., Nicholson, L., Niedertscheider, K., Sailer, R., Stötter, J., Weber, M., and Kaser, G.: The Rofental: a high Alpine research basin (1890–3770 m a.s.l.) in the Ötztal Alps (Austria) with over 150 years of hydrometeorological and glaciological observations, Earth Syst. Sci. Data, 10, 151–171, https://doi.org/10.5194/essd-10-151-2018, 2018.
Swift, D. A., Nienow, P. W., and Hoey, T. B.: Basal sediment evacuation by subglacial meltwater: suspended sediment transport from Haut Glacier d'Arolla, Switzerland, Earth Surf. Process. Landf., 30, 867–883, https://doi.org/10.1002/esp.1197, 2005.
Tschada, H. and Hofer, B.: Total solids load from the catchment area of the Kaunertal hydroelectric power station: the results of 25 years of operation, in: Hydrology in Mountain Regions. II – Artificial Reservoirs; Waters and Slopes (Proceedings of two Lausanne Symposia), Lausanne, 8, 1990.
Tsyplenkov, A., Vanmaercke, M., Golosov, V., and Chalov, S.: Suspended sediment budget and intra-event sediment dynamics of a small glaciated mountainous catchment in the Northern Caucasus, J. Soils Sediments, 20, 3266–3281, https://doi.org/10.1007/s11368-020-02633-z, 2020.
Umweltbundesamt: CORINE Landcover 2018, Umweltbundesamt [data set], https://www.data.gv.at/katalog/dataset/clc2018 (last access: 13 September 2018), 2018.
van Tiel, M., Kohn, I., Loon, A. F. V., and Stahl, K.: The compensating effect of glaciers: Characterizing the relation between interannual streamflow variability and glacier cover, Hydrol. Process., 34, 553–568, https://doi.org/10.1002/hyp.13603, 2019.
Vercruysse, K., Grabowski, R. C., and Rickson, R. J.: Suspended sediment transport dynamics in rivers: Multi-scale drivers of temporal variation, Earth-Sci. Rev., 166, 38–52, https://doi.org/10.1016/j.earscirev.2016.12.016, 2017.
Vormoor, K., Lawrence, D., Heistermann, M., and Bronstert, A.: Climate change impacts on the seasonality and generation processes of floods – projections and uncertainties for catchments with mixed snowmelt/rainfall regimes, Hydrol. Earth Syst. Sci., 19, 913–931, https://doi.org/10.5194/hess-19-913-2015, 2015.
Weber, M. and Prasch, M.: Influence of the Glaciers on Runoff Regime and Its Change, in: Regional Assessment of Global Change Impacts, edited by: Mauser, W. and Prasch, M., Springer International Publishing, Cham, 493–509, https://doi.org/10.1007/978-3-319-16751-0_56, 2016.
Wijngaard, R. R., Helfricht, K., Schneeberger, K., Huttenlau, M., Schneider, K., and Bierkens, M. F. P.: Hydrological response of the Ötztal glacierized catchments to climate change, Hydrol. Res., 47, 979–995, https://doi.org/10.2166/nh.2015.093, 2016.
World Glacier Monitoring Service: Fluctuations of Glaciers Database, WGMS [data set], https://doi.org/10.5904/wgms-fog-2021-05, 2021.
Wulf, H., Bookhagen, B., and Scherler, D.: Climatic and geologic controls on suspended sediment flux in the Sutlej River Valley, western Himalaya, Hydrol. Earth Syst. Sci., 16, 2193–2217, https://doi.org/10.5194/hess-16-2193-2012, 2012.
Zentralanstalt für Meteorologie und Geodynamik (ZAMG), Climate Data of Austria 1971–2000, http://www.zamg.ac.at/fix/klima/oe71-00/klima2000/klimadaten_oesterreich_1971_frame1.htm (last access: 15 October 2021), 2013.