the Creative Commons Attribution 4.0 License.
the Creative Commons Attribution 4.0 License.
 | 11 Jul 2023
The influence of dune lee side shape on time-averaged velocities and turbulence
Julia Cisneros
Underwater dunes are found in various environments with strong hydrodynamics and movable sediment such as rivers, estuaries and continental shelves. They have a diversity of morphology, ranging from low- to high-angle lee sides and sharp or rounded crests. Here, we investigate the influence of lee side morphology on flow properties (time-averaged velocities and turbulence). To do so, we carried out a large number of numerical simulations of flow over dunes with a variety of morphologies using Delft3D. Our results show that the value of the mean lee side angle in addition to the value and position of the maximum lee side angle have an influence on the flow properties investigated. We propose a classification with the following three types of dunes: (1) low-angle dunes (mean lee side < 10∘), over which there is generally no flow separation and over which only little turbulence is created; (2) intermediate-angle dunes (mean lee side 10–17∘), over which an intermittent flow separation is likely over the trough; and (3) high-angle dunes (mean lee side > 17∘), over which the flow separates at the brink point and reattaches shortly after the trough and over which turbulence is high. The influence of maximum lee side slope value and position on flow characteristics depends on the dune type. We discuss the implications of the proposed dune classification on the interaction between dune morphology and flow.
- Article
(9229 KB) - Full-text XML
- BibTeX
- EndNote


Underwater dunes are observed in many shallow- and deep-water environments, such as rivers, estuaries, tidal inlets, continental shelves and slopes. They form in systems with beds composed of sediment ranging from coarse silt to fine gravel, where the hydrodynamics are strong enough to produce sufficient bedload transport. Until recently, most studies focussed on so-called “high-angle dunes”, which possess a steep lee side, with slopes of around 30∘ (angle of repose) over which sediment is avalanching (Kleinhans, 2004). These dunes commonly form in small rivers and in flumes (Naqshband et al., 2014a; van der Mark et al., 2008). Over such dunes, flow separation and recirculation over the lee side produce a turbulent wake and induce bedform roughness. However, many dunes have recently been observed to be “low-angle dunes”, with lee side angles much lower than the angle of repose. Over low-angle dunes, flow separation is absent or intermittent, and turbulence and roughness are lower than over high-angle dunes (Kwoll et al., 2016; Lefebvre and Winter, 2016). In large rivers, mean lee side angles are commonly between 5 and 20∘ (Cisneros et al., 2020). This is illustrated in Fig. 1 with data from the Mississippi and Waal rivers, which had the steepest and gentlest mean lee side slopes of the six rivers investigated by Cisneros et al. (2020). Bedform lee sides in tidal environments are also often low, with typical values of 2 to 20∘ (e.g. Lefebvre et al., 2021; Dalrymple and Rhodes, 1995; Franzetti et al., 2013; Damen et al., 2018; Fig. 1c). In addition, contrary to previous simplifications of lee side shape, the lee side is rarely a straight line but is rather made of several steeply and gently sloping portions (Lefebvre et al., 2016). Typically, a comparatively steep slope is observed somewhere along the lee side, with gentler slopes towards the crest and/or the trough. The steep slope is often referred to as the “slip face”, as sediment is thought to avalanche or slip over this part of the lee side. Although this is true for slope close to the angle of repose (Kleinhans, 2004), the transport mechanisms over gentler slopes are still under discussion (Kostaschuk and Venditti, 2019). Therefore, we refer to this slope as the “steep portion” in an effort to not make any assumptions about the type of sediment transport along the dune lee side (see also Lefebvre et al., 2021). The maximum lee side angle value and position can be used to characterise the steep portion characteristics. In large rivers, the maximum lee side angle is generally less than the angle of repose (e.g. Fig. 1a and b), with an average maximum lee side angle of 20.5∘, as calculated by Cisneros et al. (2020). In constrained tidal environments (e.g. estuaries and tidal inlets), maximum lee side angles are usually less than 20∘ (Lefebvre et al., 2021; Prokocki et al., 2022; Dalrymple and Rhodes, 1995) (Fig. 1c). In marine environments, there has not yet been a systematic report of mean or maximum angles, in part due to the lack of consistent high-resolution data, which may be used to precisely calculate the maximum slope. The mean and maximum lee side angles will vary, depending on dune asymmetry, the absolute and relative strength of ebb and flood currents, the influence of other currents (e.g. river flows and wave-related currents), sediment size and tidal phase. In any case, it should be noted that in tidal environments, flow reverses from one tidal phase to the next. However, large dunes usually stay oriented in one direction during the whole tidal cycle. Therefore, in the case of asymmetric bedforms, the lee side may be steep during one tidal phase and gentle during the following tidal phase. As a result, a wide range of mean and maximum lee side angles are likely to be found in marine environments.
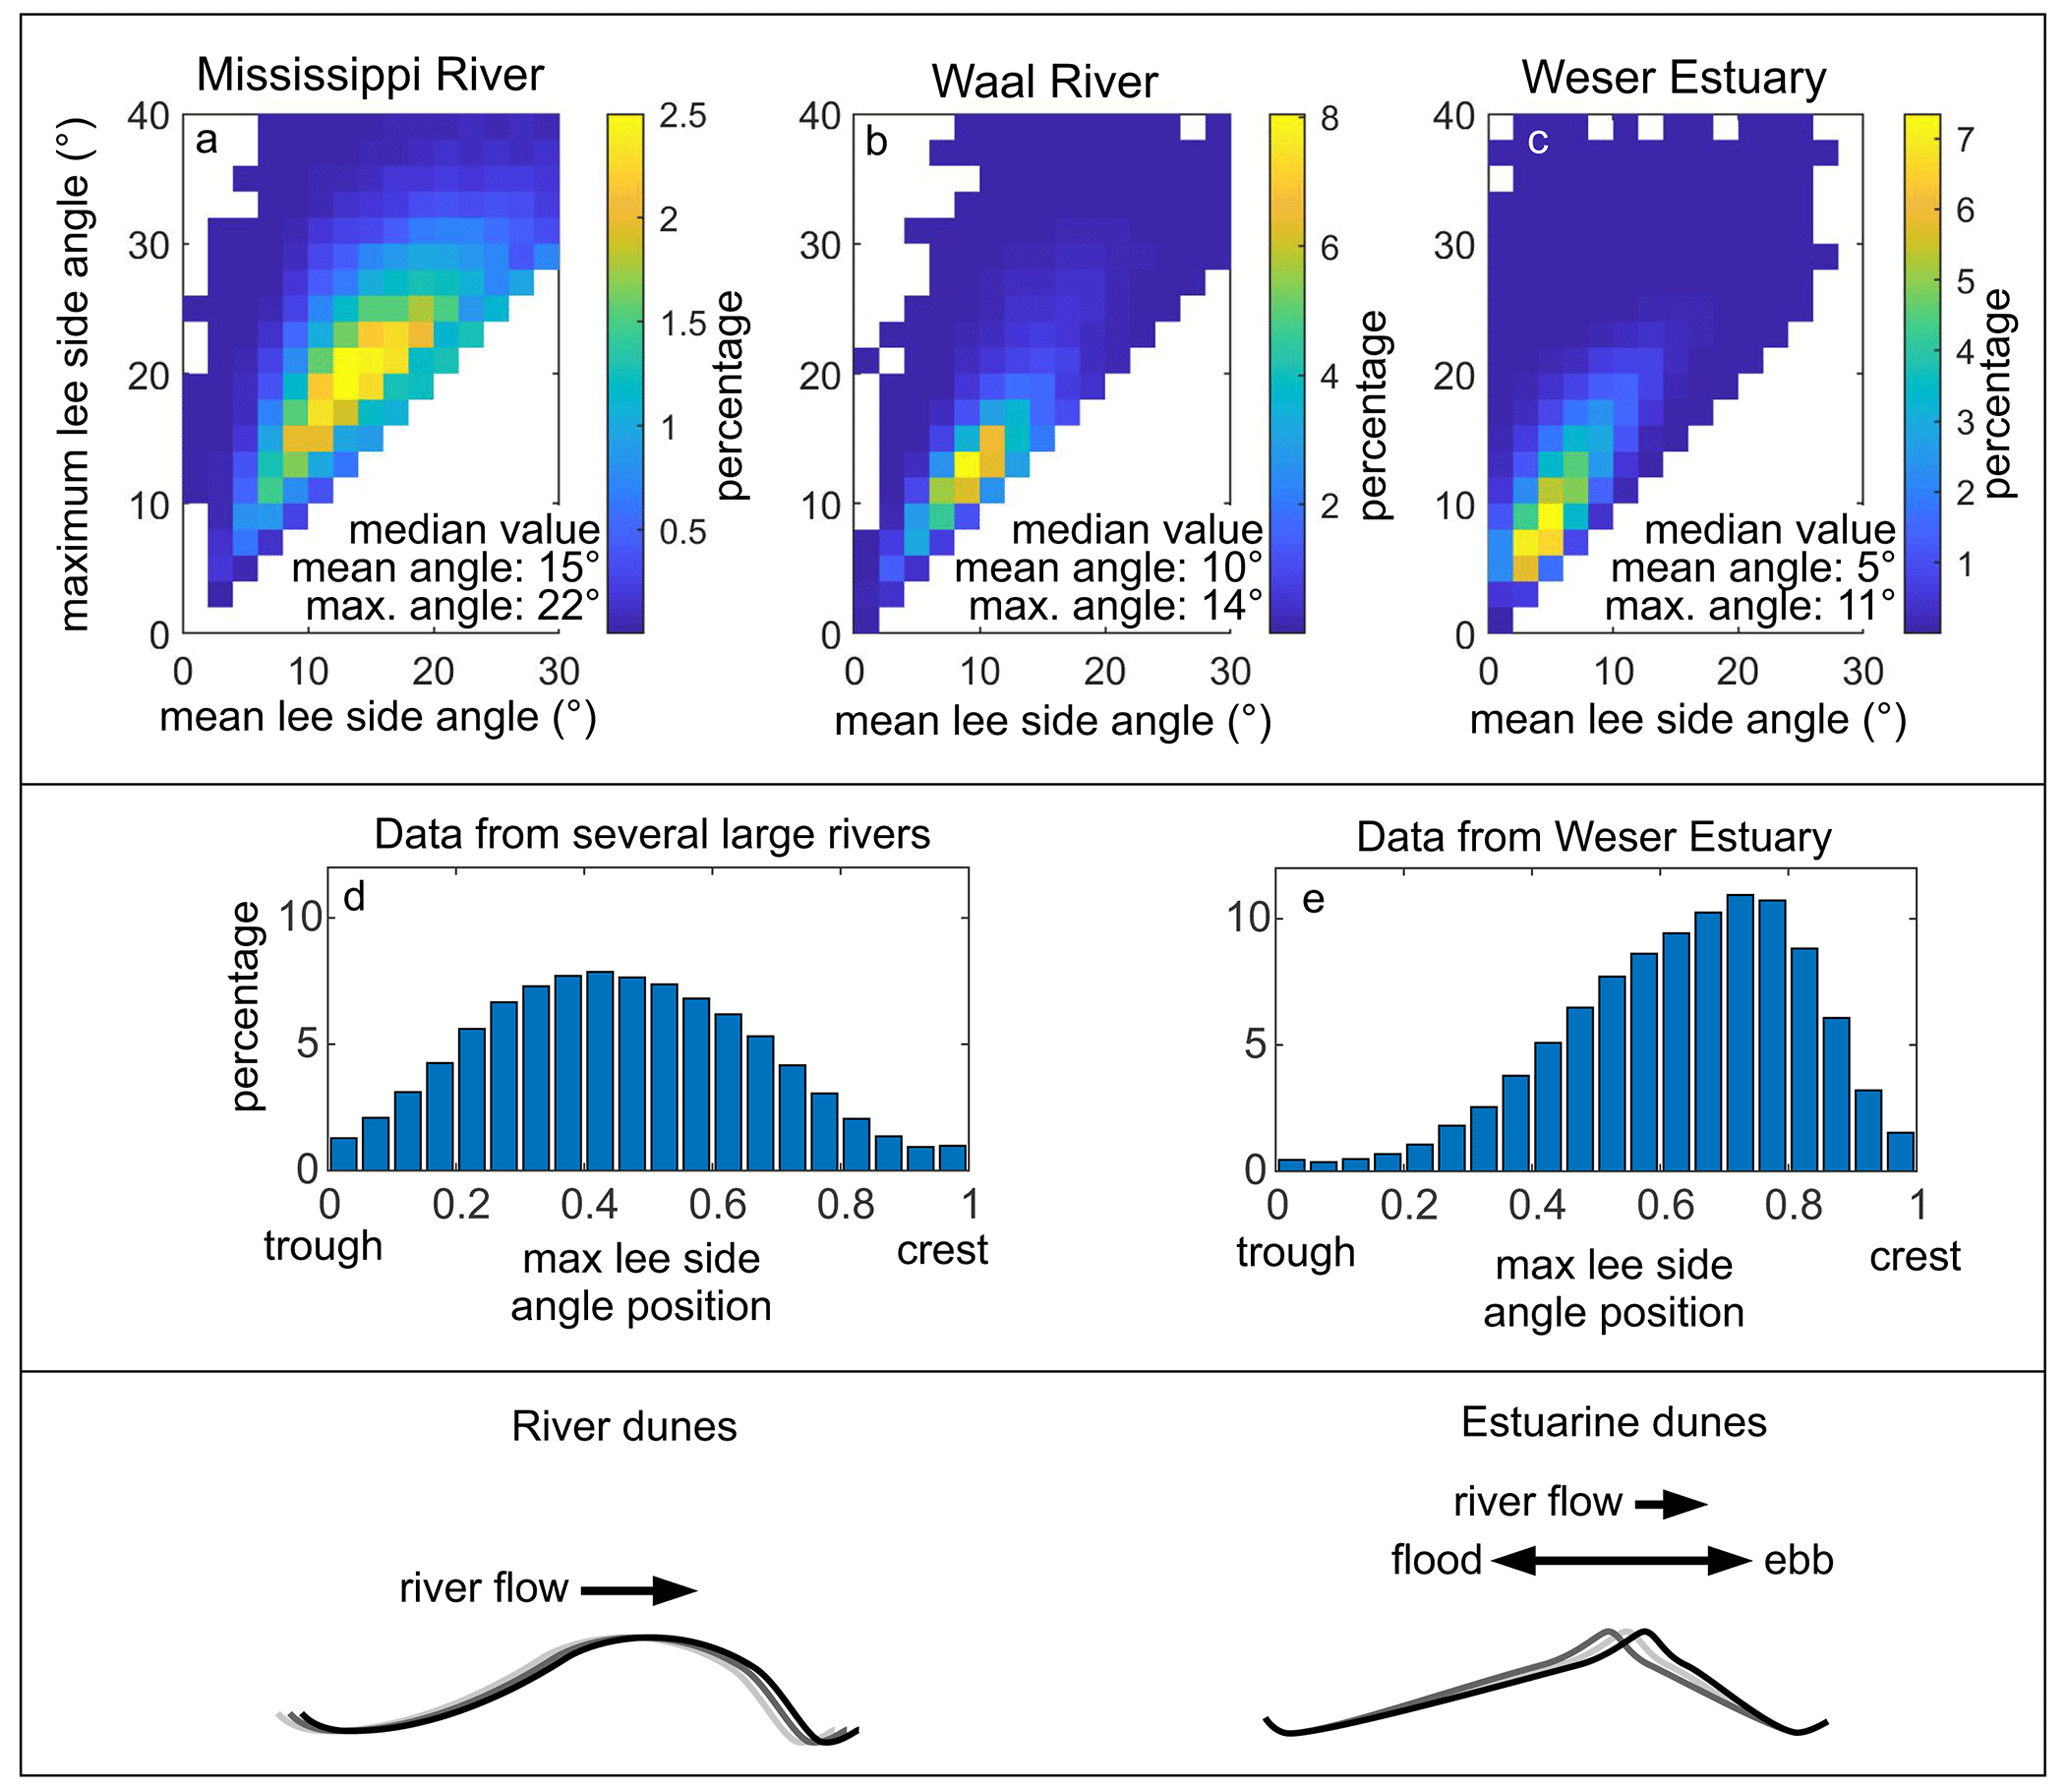
Figure 1The upper panel shows the mean and maximum lee side angles from dunes found in the Mississippi and Waal rivers (data from Cisneros et al., 2020) and the Weser estuary (data from Lefebvre et al., 2021). The middle panel shows a histogram of the position of the maximum lee side angle in six large rivers (data from Cisneros et al., 2020) and in the Weser estuary (data from Lefebvre et al., 2021). The lower panel shows a schematic representation of the shape of dunes in large rivers and estuaries (after Lefebvre et al., 2021).
Interestingly, the shapes of the river (Fig. 1d) and estuarine dunes (Fig. 1e) differ. River dunes have their steepest slope close to the trough and a rounded crest (Cisneros et al., 2020), whereas estuarine dunes have their steepest slope close to the crest and a sharp crest (Dalrymple and Rhodes, 1995; Lefebvre et al., 2021; Prokocki et al., 2022). Lefebvre et al. (2021) suggested that this is created by the difference in sediment transport direction (Fig. 1). In rivers, sediment is systematically eroded from the crest and deposited over the lee side by the unidirectional currents, creating a rounded crest; in estuaries and other tidal environments, sediment at the crest is being mobilised at each tidal phase but only for a short time in each direction, resulting in the sharp crest morphology. In open-marine environments, various morphologies are found, from sharp to round crests (Van Landeghem et al., 2009; Zhang et al., 2019). Therefore, the difference in dune shape is not strictly reflecting the difference between river and tidal environments but rather the complex interaction between dune morphology, sediment properties and hydrodynamics. It is therefore likely that a range of shapes are found, depending on these specific morphodynamic conditions.
The influence of lee side morphology and how it fits within the coupling of feedbacks in the morphodynamic triad has not yet been systematically studied. The aim of this work is therefore to characterise flow properties (velocities and turbulence) in unidirectional flow over low- and high-angle dunes, with their steepest slope close to the crest or close to the trough, using numerical experiments. We hypothesise that the presence, size and length of the flow separation and turbulent wake vary depending on the value and position of the maximum angle along the lee side.
2.1 Model description
Delft3D (Deltares, 2014) is a process-based, open-source integrated flow and transport modelling system. In Delft3D-FLOW, the 3D non-linear shallow water equations, derived from the three-dimensional Navier–Stokes equations for incompressible free-surface flow, are solved. In order to capture non-hydrostatic flow phenomena such as flow separation and recirculation on the lee of dunes, the non-hydrostatic pressure can be computed by using a pressure correction technique. For every time step, a hydrostatic step is first performed to obtain an estimate of the velocities and water levels; a second step, taking into account the effect of the non-hydrostatic pressure, is carried out to correct the velocities and water levels such that continuity is fulfilled (Deltares, 2014).
The Delft3D modelling system has been used to set up a two-dimensional vertical (2DV) numerical model, using the non-hydrostatic pressure correction technique to simulate horizontal and vertical velocities, turbulent kinetic energy (TKE) and bed shear stresses above fixed bedforms. The model has been calibrated and validated against laboratory flume experiments over idealised high-angle dunes (Lefebvre et al., 2014a) and verified against field data over natural tidal dunes (Lefebvre et al., 2014b). The same numerical model was used here to simulate flow over dunes with varying morphologies. The simulations were performed on a 2DV plane Cartesian model grid over a fixed bed (i.e. no sediment transport) composed of 10 similar bedforms. The following conditions were prescribed to be constant in time at the lateral open boundaries of the model domain: a logarithmic velocity profile at the upstream boundary and a water surface elevation of 0 m at the downstream boundary. The bed roughness was set as a uniform roughness length z0=0.0001 m. The dune height and length, the water depth and the vertical and horizontal grid size were kept similar for all simulations. The horizontal grid size was set as dx=0.09 m (271 grid points per dune). A non-uniform vertical grid size, stretched in the vertical direction with fine spacing near the bed (dz1) and coarser spacing in the water column (dz2), was used; dz1=0.044 m between the trough position and the height of the crest + 5 dz1, which gradually increased to dz2=0.48 m within the remaining water column, resulting in 42 layers being used in each simulation. The time step dt was set to s (0.0005 min), following a Courant–Friedrichs–Lewy criterion , where dt is the time step (s), g is the acceleration due to gravity (m s−2) and h is the water depth (m). Since the z model was used, the following condition also applies: , where is a characteristic value of horizontal velocities (m s−1; Deltares, 2014). A uniform background horizontal viscosity of 10−3 m2 s−1 and background vertical eddy viscosity of 0 m2 s−1 were set. A k–ε turbulence closure model (Uittenbogaard et al., 1992) was used.
2.2 Model experiments
A total of 88 simulations (Table 1) were carried out to test the influence of lee side morphology on unidirectional flow velocities, separation zone, turbulent kinetic energy and bed shear stress. Specifically, the influence of the maximum lee side slope position (closer to the dune crest or trough) was tested but not the shape of the stoss side or the overall shape of the crest. For all simulations, bedform height (Hb=0.89 m) and length (Lb=24.4 m), water depth (h=8 m) and mean flow velocity (0.8 m s−1) were kept similar. The values were chosen based on typical dune dimensions in large rivers (Cisneros et al., 2020). The stoss side followed a cosine shape, and the lee side was made of either a line (straight lee side) or three lines (complex lee side; Fig. 2). The straight lee side experiments were made with lee side angles varying from 5 to 30∘, in increments of 5∘. For each mean lee side angle (αmean), simulations were done with the lee side composed of three segments, namely a steep portion, where the maximum angle (αmax) was fixed (Table 1), and upper and lower lee sides, which had angles adjusted so that the mean angle would be between 5 and 30∘, in increments of 5∘. The steep portion height was one-third of the bedform height ( m). For each maximum lee side angle, four configurations were tested, with the position of the steep portion varying from close to the crest to close to the trough (Fig. 2).
Table 1Summary of bedform dimensions used for the numerical experiments. For all simulations, the water depth h=8 m, mean velocity u=0.8 m s−1, bedform height Hb=0.89 m and bedform length Lb=24.4 m. Note that the mean lee side angle values were fixed at 5, 10, 15, 20, 25 or 30∘. However, due to the horizontal resolution for the sharp profile (see also Appendix A1) and the smoothing for the smooth profiles, the mean lee side angles are lower than initially set. The maximum angle stayed as fixed (Fig. 2). See Fig. 2 for a representation of the configurations.
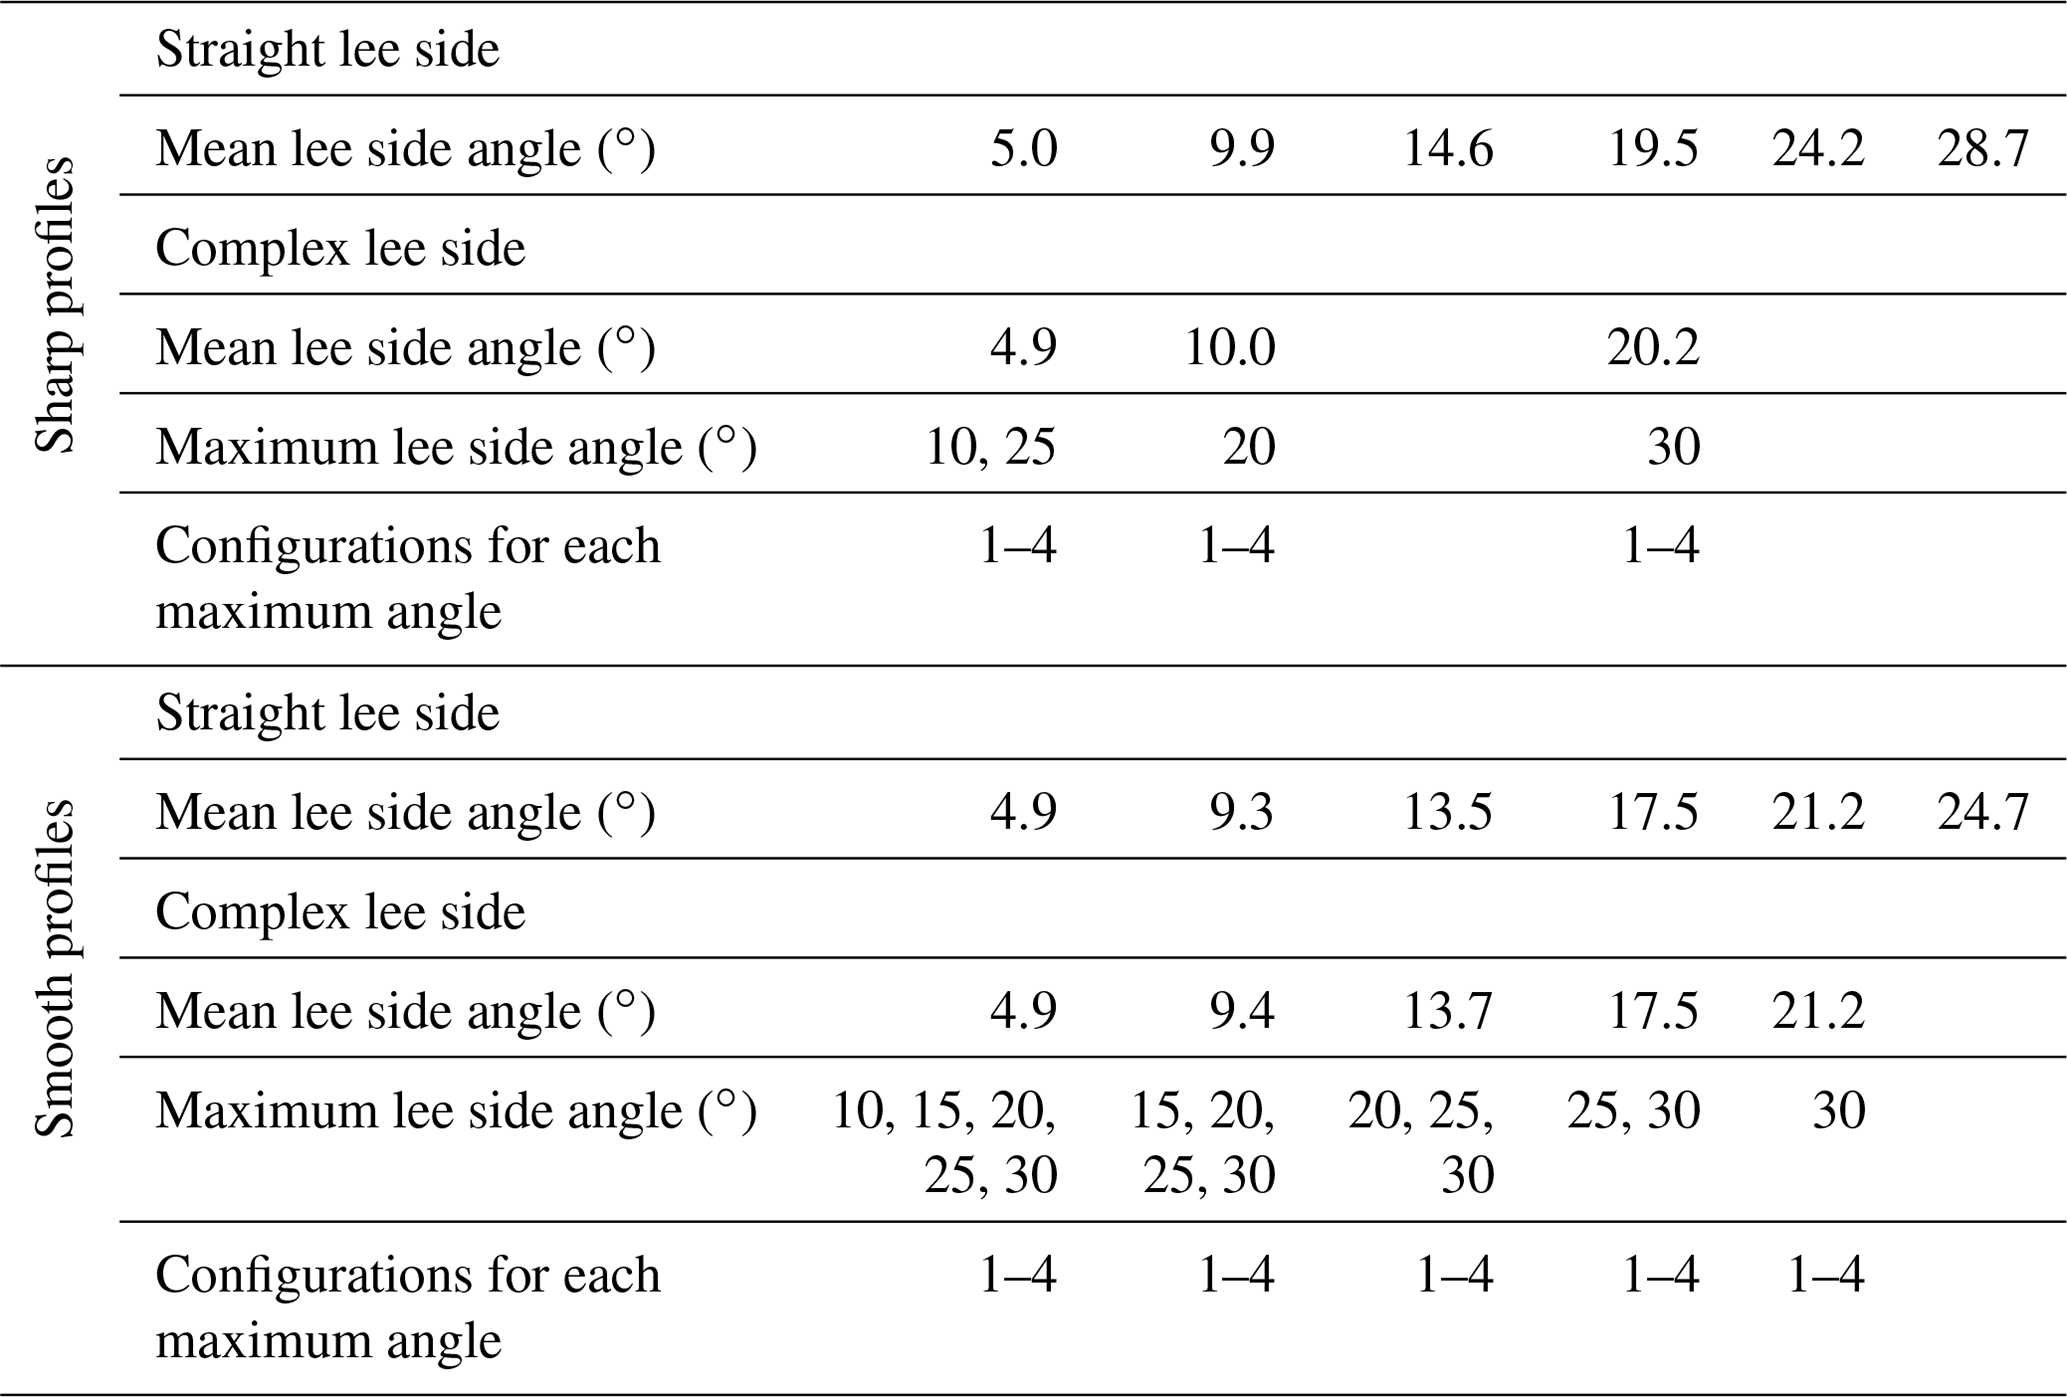
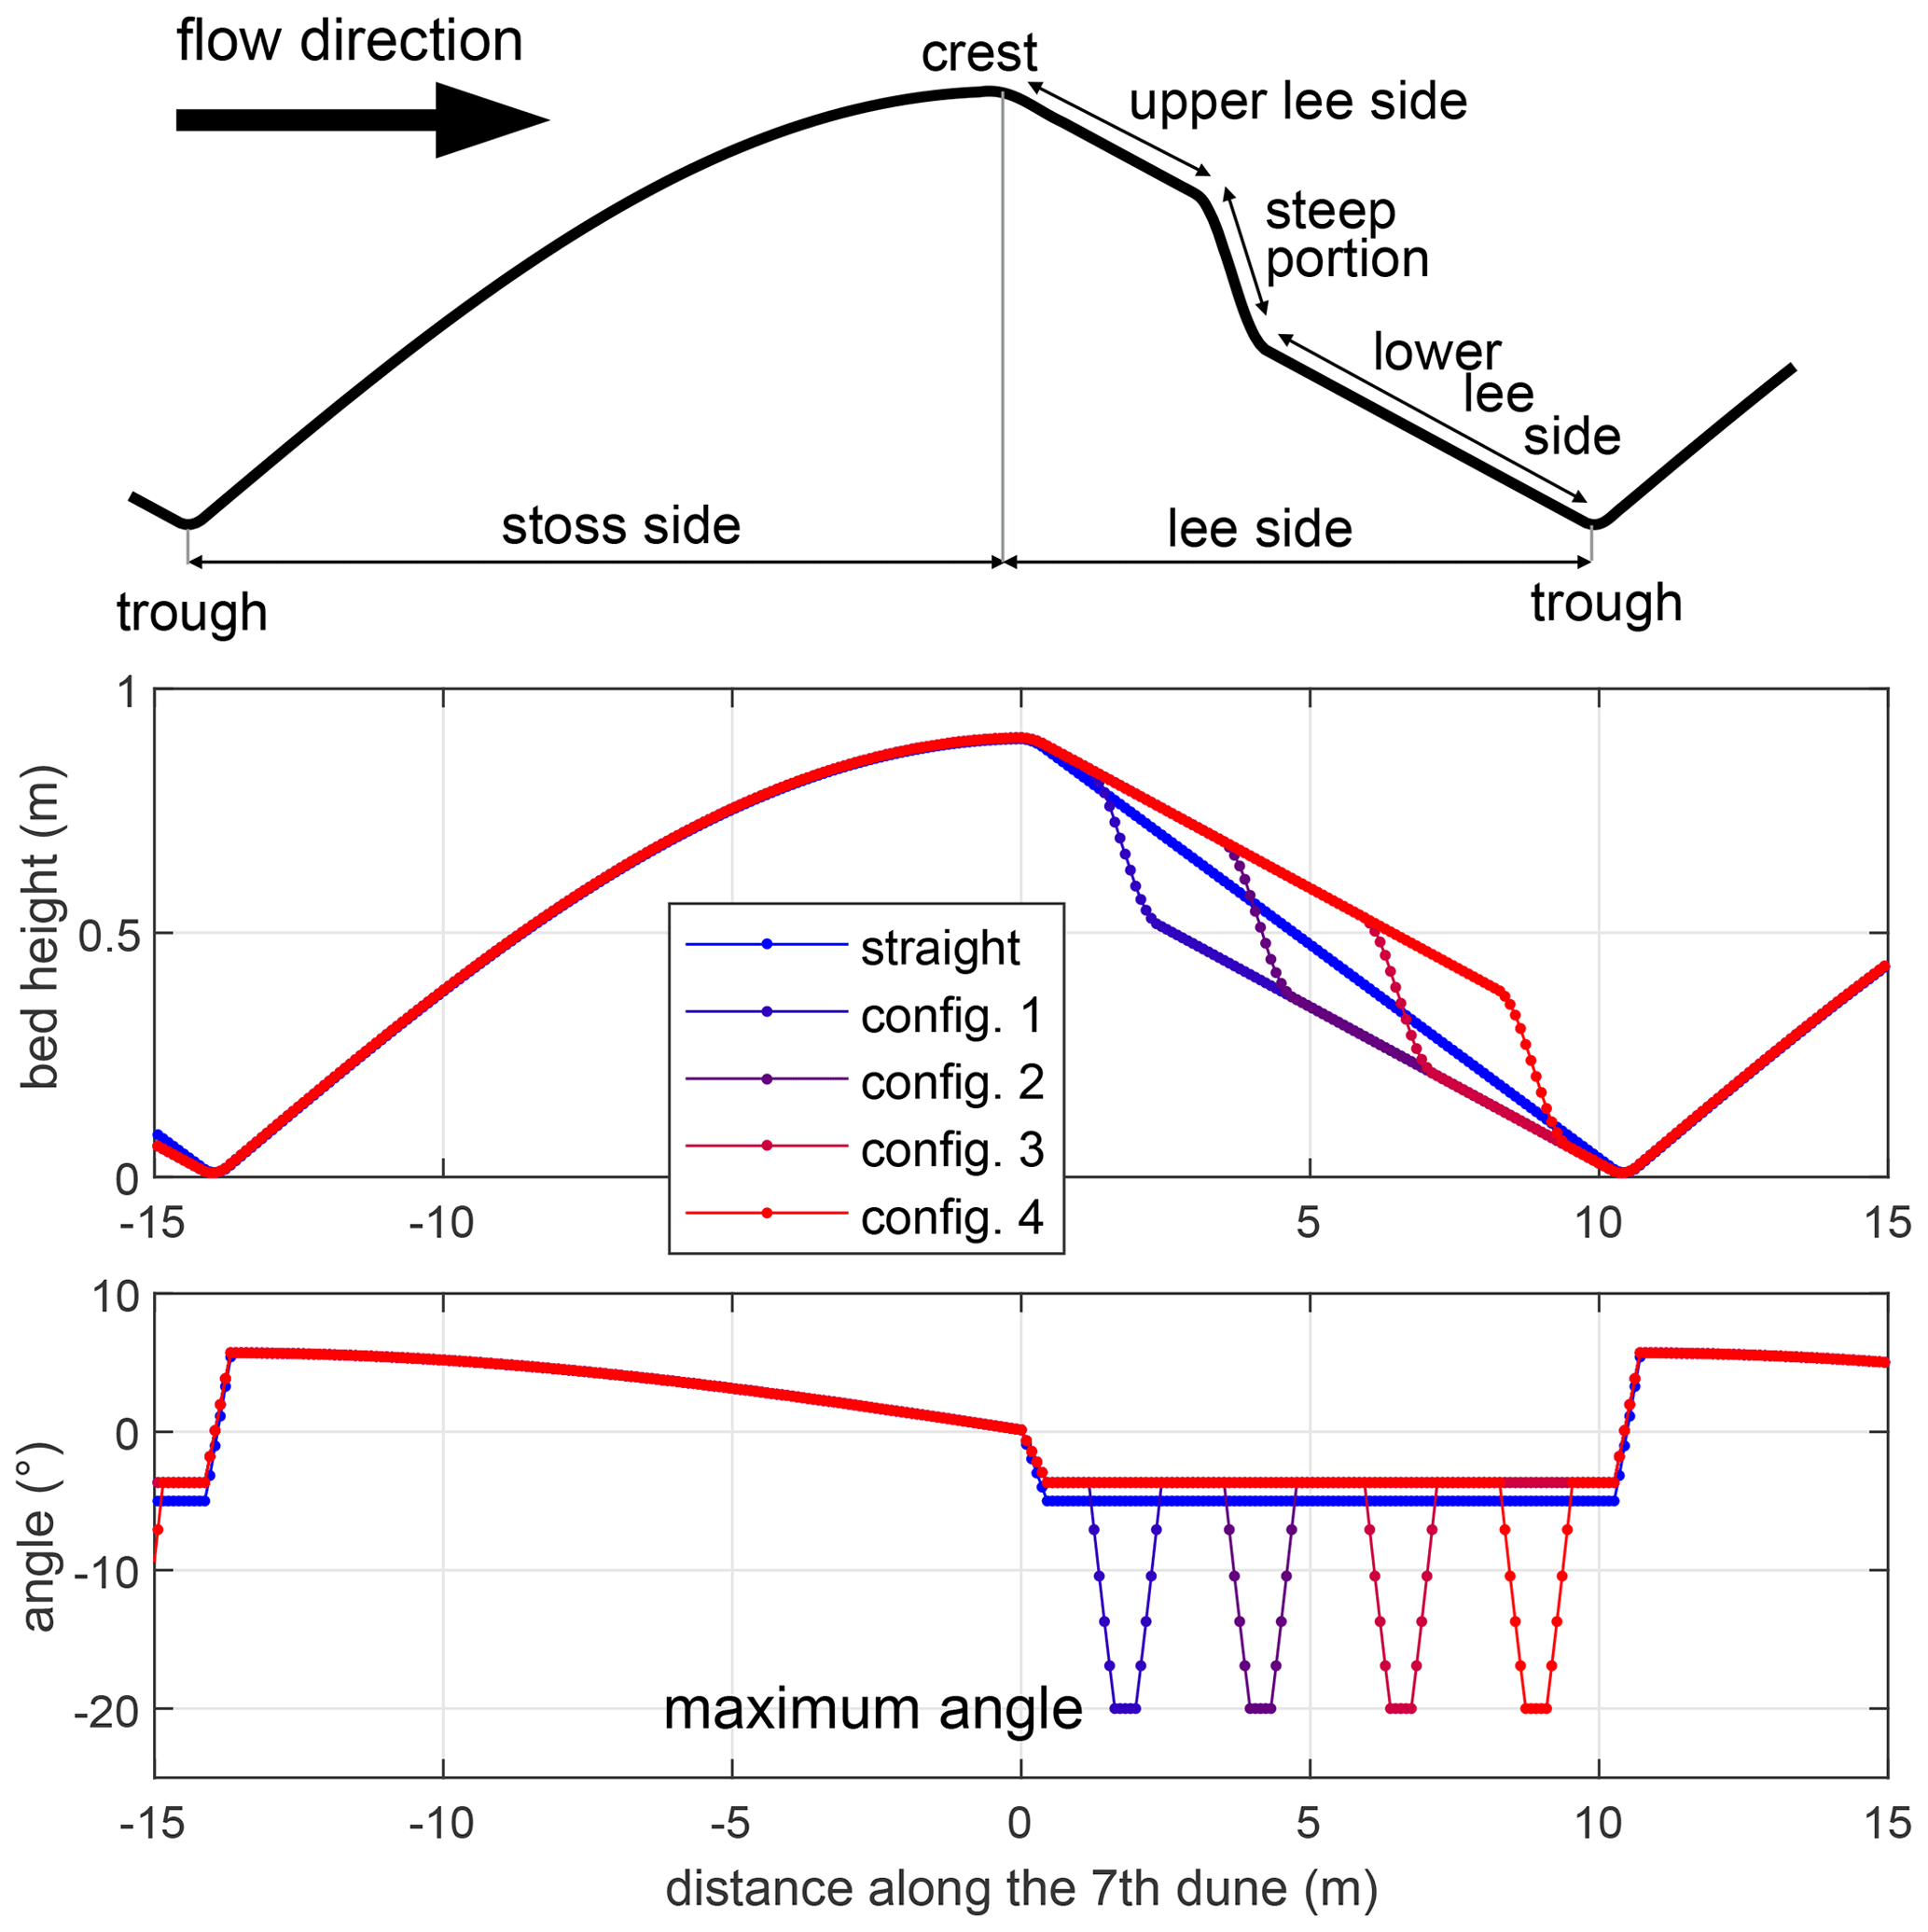
Figure 2Example of the different configurations tested, here shown for a mean lee side angle of 4.9∘, a maximum angle of 20∘ and a smooth profile.
A distinction was made between sharp profiles and smooth profiles. For some experiments (sharp profiles), the bed profiles were left as created, with a cosine stoss side and straight or complex lee sides, with sharp variations between each section. However, most experiments were made with smooth profiles in order to mimic natural slopes. The profiles were first created from straight lines and then smoothed using a five-point smoothing averaged window. The smoothing produced mean angles that were lower than what was set up (Table 1). However, the maximum angle was not smoothed and stayed at the given value (Fig. 2).
2.3 Model output analysis
From the simulation results, the horizontal and vertical velocities and the TKE are investigated above the seventh bedform (from a total of 10 bedforms) in order to characterise equilibrium conditions that are not perturbed by entrance and exit conditions. The position and size of the flow separation zone, when present, is calculated following the method detailed in Lefebvre et al. (2014a): the flow separation line delimitates the region in which the flow going upstream (i.e. negative horizontal velocity) is compensated by flow going downstream. The length of the flow separation zone (LFSZ) is the horizontal distance between the separation point and the reattachment point. The relative flow separation length (rLFSZ) is the flow separation length divided by the dune height (Hb). Because Delft3D uses the Reynolds-averaged Navier–Stokes equations, it is not possible to model the intermittent flow separation zone; only permanent flow separation can be simulated and is considered here. The shear layer is visualised as a high vertical gradient of streamwise velocity (), reflecting a rapid change in velocity between two flow regions (Kwoll et al., 2016; Venditti, 2007).
The mean and maximum TKE (TKEmean and TKEmax) over the seventh bedform are computed as indicators of the overall turbulence produced and dissipated over each dune shape. In the literature, the wake over bedforms has been defined in different ways. Following the definitions of the wake behind cylinders, wakes have been defined as a momentum deficit (i.e. reduced velocity) downstream of the bedform crest (Wiberg and Nelson, 1992; Nelson et al., 1993; Maddux et al., 2003). They have also been calculated based on their position (i.e. a specific height or water depth; e.g. 0.1 to 0.5 depth), which often occurs in cases when velocity profiles are not available at high resolution above the bedforms (McLean et al., 1994, 1999; Bennett and Best, 1995). More recently, the wake has been defined as a region of high turbulence, using turbulence intensity and TKE above a constant threshold value (Venditti, 2007), TKE more than 70 % of the maximum TKE (Lefebvre et al., 2014a, b), high Reynolds shear stress (Kwoll et al., 2016) or the percentage of events in quadrants 2 and 4 (Unsworth et al., 2018). In the present work, we define the wake based on turbulence and therefore will refer to it as the “turbulent wake”. The turbulent wake is the region in which TKE is more than twice the average TKE above a flat bed with similar hydrodynamic conditions. For this, a simulation was carried out with a flat bed (depth 8 m), but all other parameters (domain length, boundary conditions, roughness length, etc.) were kept similar to the simulations with dunes. The average TKE for this flat bed simulation is 0.0019 m2 s−2, and therefore, a threshold value of 0.0038 m2 s−2 is used to outline the contour of the wake in the dune simulations. As in previous work, this definition lacks a physical basis, as the threshold value is defined quite arbitrarily. However, the turbulent wake contour above straight angle-of-repose dunes corresponds well to what is expected from the literature, and it allows us to highlight changes in TKE intensity and spatial distribution between the different configurations. The length of the wake is calculated as the horizontal length between the beginning and the end of the wake.
The bed shear stress is calculated by Delft3D, using the law of the wall (Deltares, 2014). In the z layer, strong variations in the vertical cell size affect the calculation of the bed shear stress. In order to improve accuracy and smoothness of the computed bed shear stress, a local remapping of the near-bed layer is used (Platzek et al., 2014). However, due to the high resolution of the grid used here, some distortions are still seen. Therefore, we use a 10-point smoothing average to produce a smooth bed shear stress profile.
The results from all the simulations (Fig. 3) show that the relative flow separation length (rLFSZ) and the mean TKE (TKEmean) generally increase with increasing mean lee side angle (αmean). Both are linearly related to mean lee side angle (Fig. 3a and d), with rL (R2=0.70), and TKE (R2=0.87). They also generally increase as a function of the maximum lee side angle but with a wide range in the data (Fig. 3b and e). There does not seem to be any clear pattern which relates the flow separation length or the mean TKE to the relative position of the maximum lee side angle (Fig. 3c and f). The relative length of the turbulent wake shows strong variations and does not seem to be linearly related to mean or maximum lee side angle or its position. A distinct overall trend of relative flow separation length, TKE and relative turbulent wake length as a function of a combination of mean lee side angle and maximum lee side angle value and position could not be identified. There is therefore no influence of the combined mean angle and maximum angle value and location on flow properties. The maximum TKE above the seventh dune is linearly related to the mean TKE above the seventh dune (R2=0.95; Appendix A2). Therefore, the trends described for TKEmean are also seen for TKEmax. Although some differences are seen between the smooth and sharp profiles, there is no systematic difference (Appendix A3).
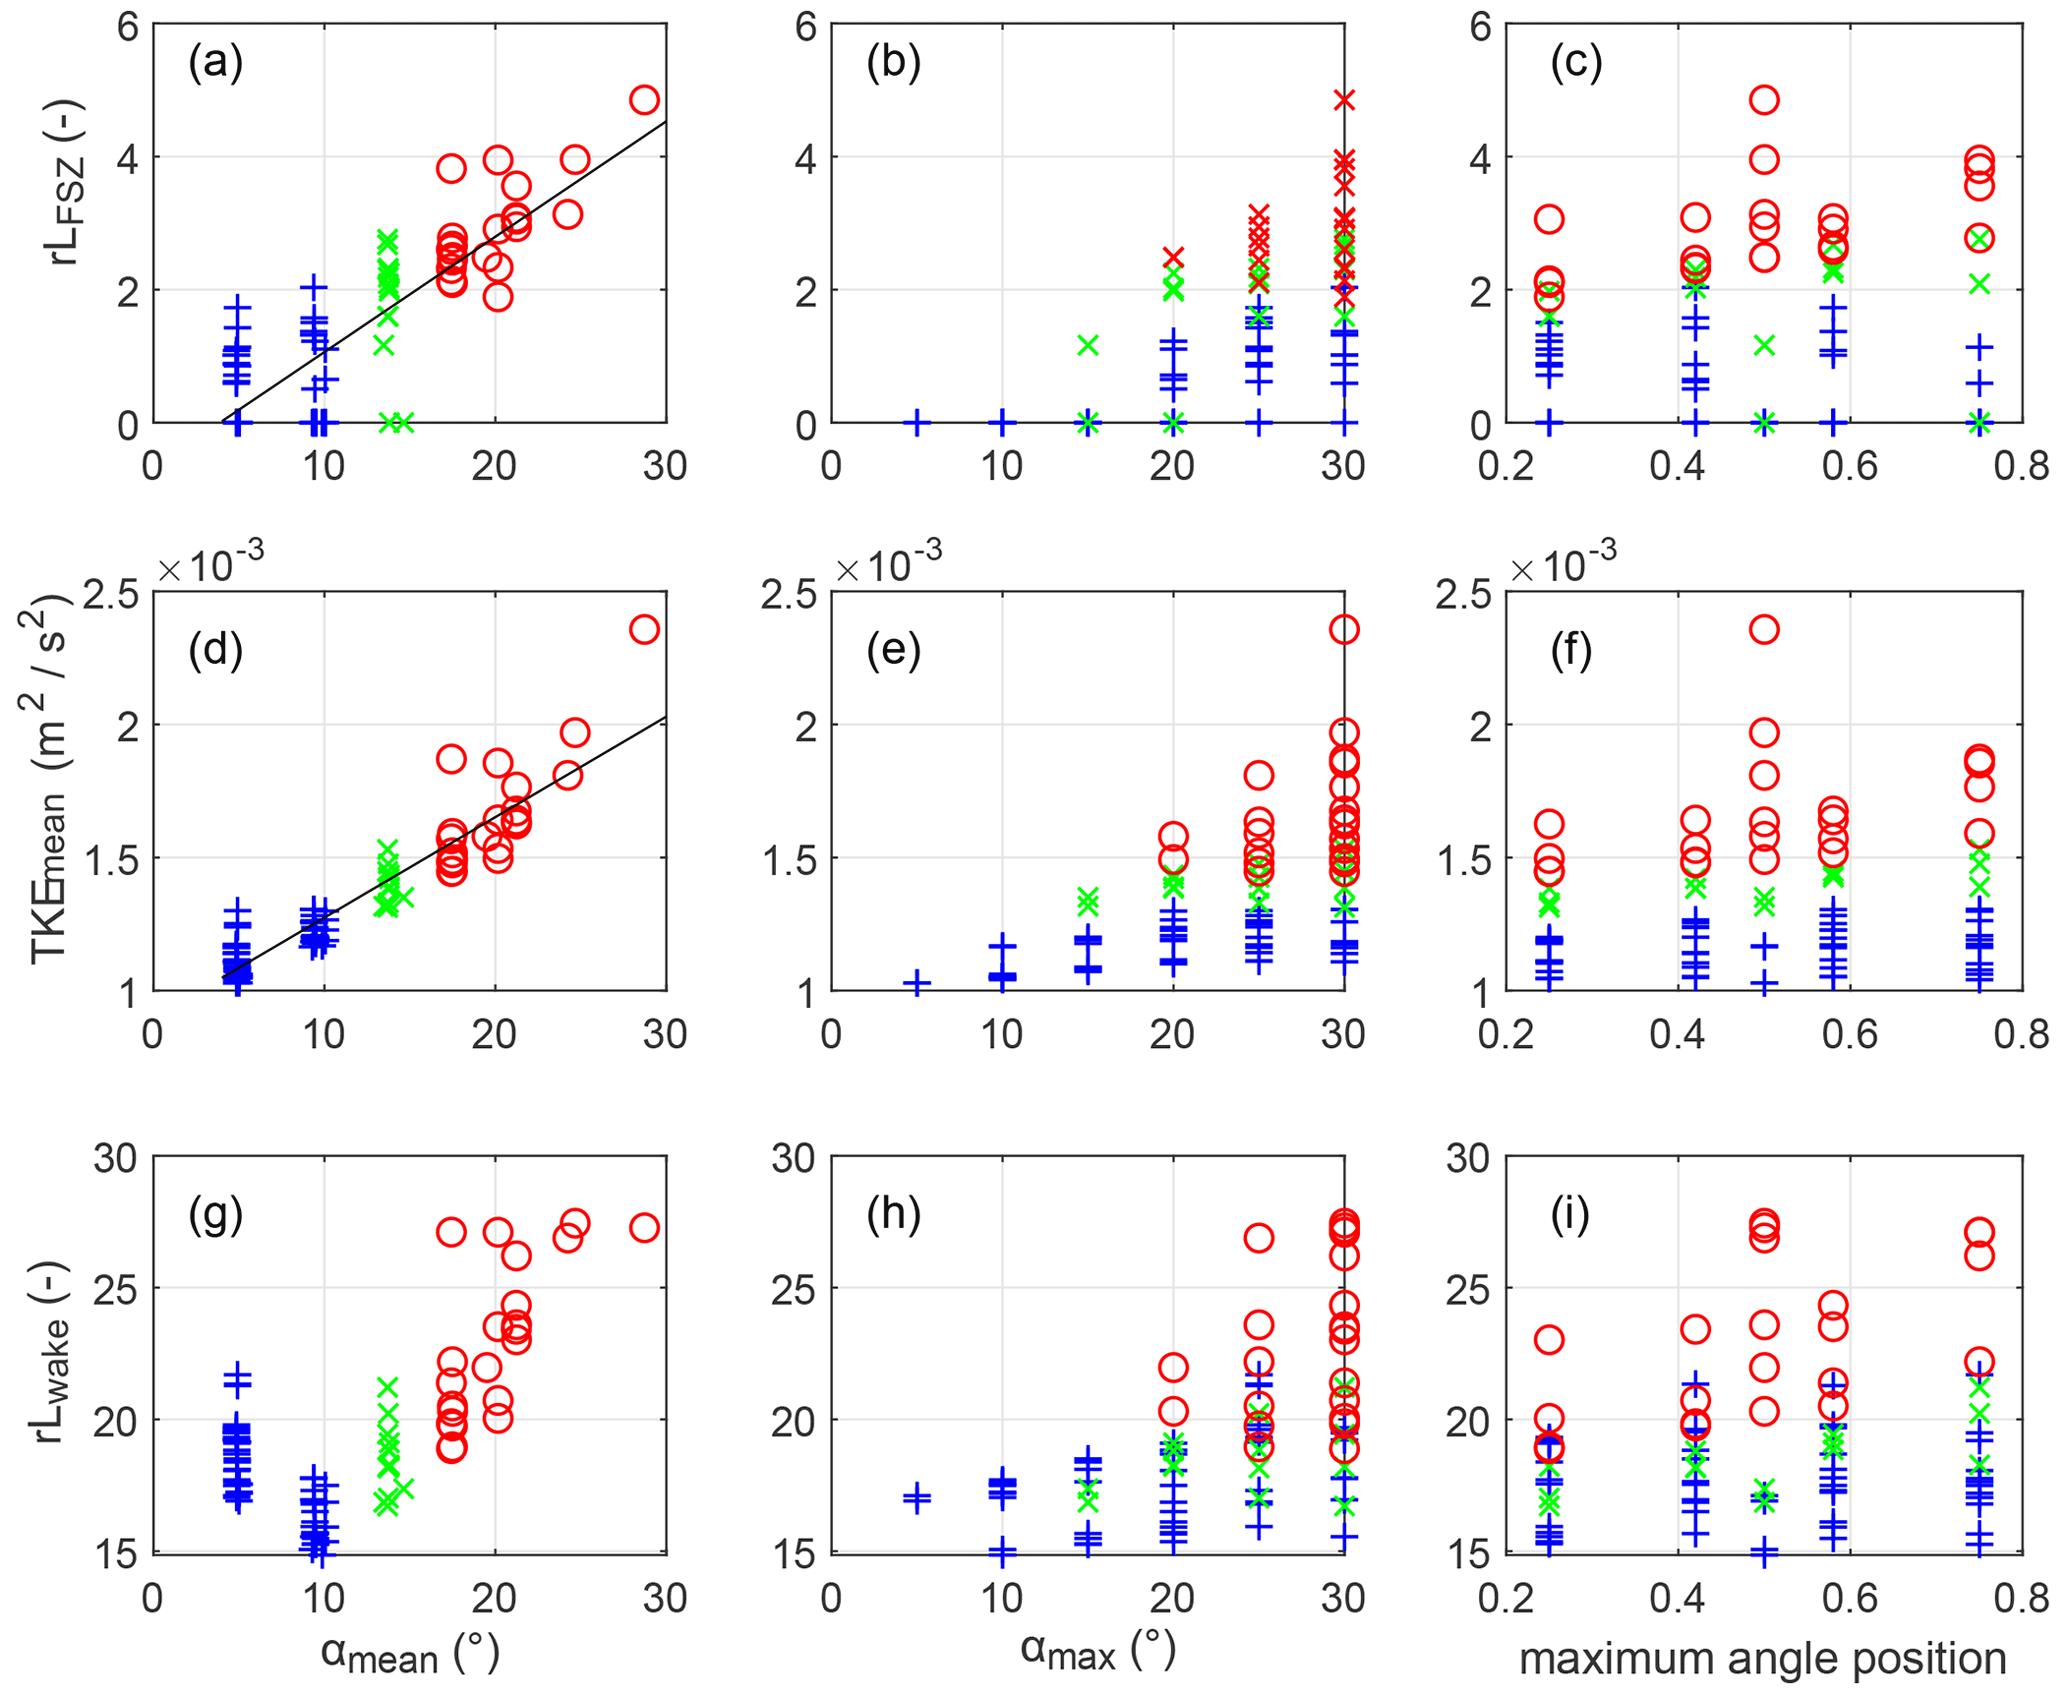
Figure 3Relative flow separation length (rLFSZ), mean turbulent kinetic energy (TKEmean) and relative length of the turbulent wake (rLwake) as a function of mean lee side angle (αmean) (a, d, g), maximum lee side angle (αmax) (b, e, h) and the position of the maximum lee side angle (a position of 0.5 indicates a straight lee side) (c, f, i). The blue plus signs show results from dunes with mean lee side < 10∘, green crosses for mean lee sides between 10 and 17∘ and red circles for mean lee side > 17∘.
Based on the presence and size of a flow separation zone, the shear layer and the relative length of the wake and how they vary depending on mean and maximum angles, it is useful to make a distinction between mean lee side of less than 10∘ (low-angle dunes), between ca. 10 to 17∘ (intermediate-angle dunes) and more than ca. 17∘ (high-angle dunes). Therefore, we describe flow properties and how they are affected by the value and position of the maximum angle, based on these three categories in the next sections.
3.1 Low-angle dunes
Low-angle dunes (mean lee side angle < 10∘) represent 89 % of the dunes measured in the Weser by Lefebvre et al. (2021) and 41 % of dunes measured in six large rivers by Cisneros et al. (2020). Flow and turbulence patterns over low-angle dunes are illustrated by Fig. 4, which shows dunes with a mean lee side of around 5∘ and a maximum angle of 10∘, which is the most common configuration in the Weser estuary. As typically observed over dunes, the horizontal velocity is highest above the crest and lowest above the trough. Vertical velocity shows downward flow above the lee side, with the strongest downward flow observed above the steep portion, and upward flow above the stoss side. There is generally no flow separation over dunes with a mean lee side angle of 10∘ or less. However, if the maximum angle is at least 20∘ and situated close to the trough, then a small flow separation may develop over the steep portion (Fig. 5). For example, dunes with a mean lee side of ca. 10∘ and a maximum lee side of 20∘ will not have a flow separation for config1 and config2 (where the maximum angle is positioned in the upper part of the lee side) but will have a small flow separation for config3 and config4 (where the maximum angle is positioned in the lower part of the lee side). It should be noted that dunes with a lee side angle of less than 10∘ but a maximum lee side angle of 20∘ or more represent only 2.75 % of all dunes measured by Cisneros et al. (2020) in large rivers and 1.70 % of dunes measured in the Weser estuary by Lefebvre et al. (2021). Therefore, they are not commonly observed.
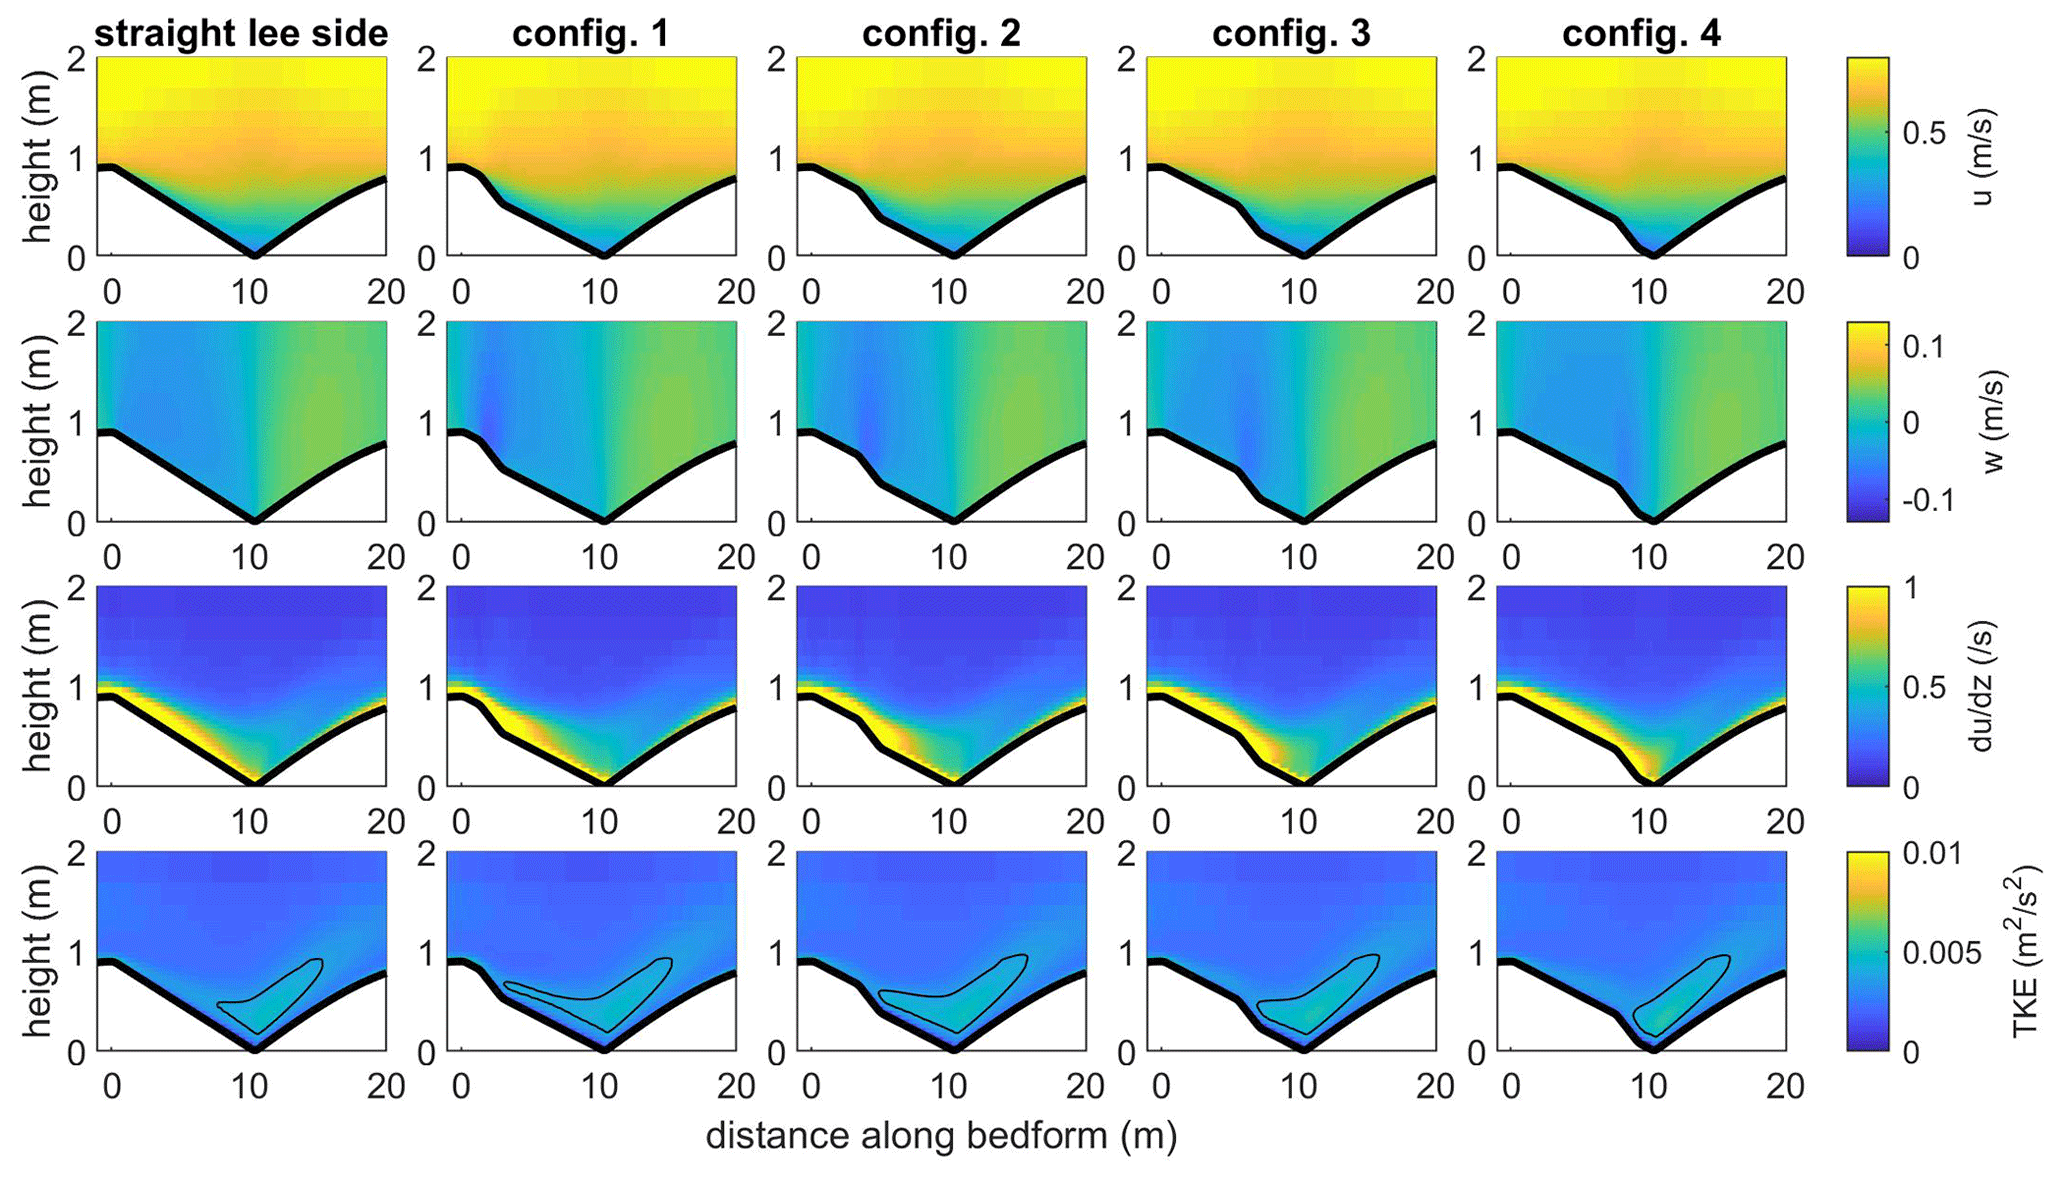
Figure 4Horizontal and vertical velocities (u and w), vertical gradient of streamwise velocity () from which the shear layer can be seen and TKE above bedforms with a mean lee side of 4.9∘ and maximum angle of 10∘ for the straight lee slope and the four lee shape configurations tested. The black lines in the bottom figures show the contour of TKE > 0.0038 m2 s−2 to highlight the position of the turbulent wake.
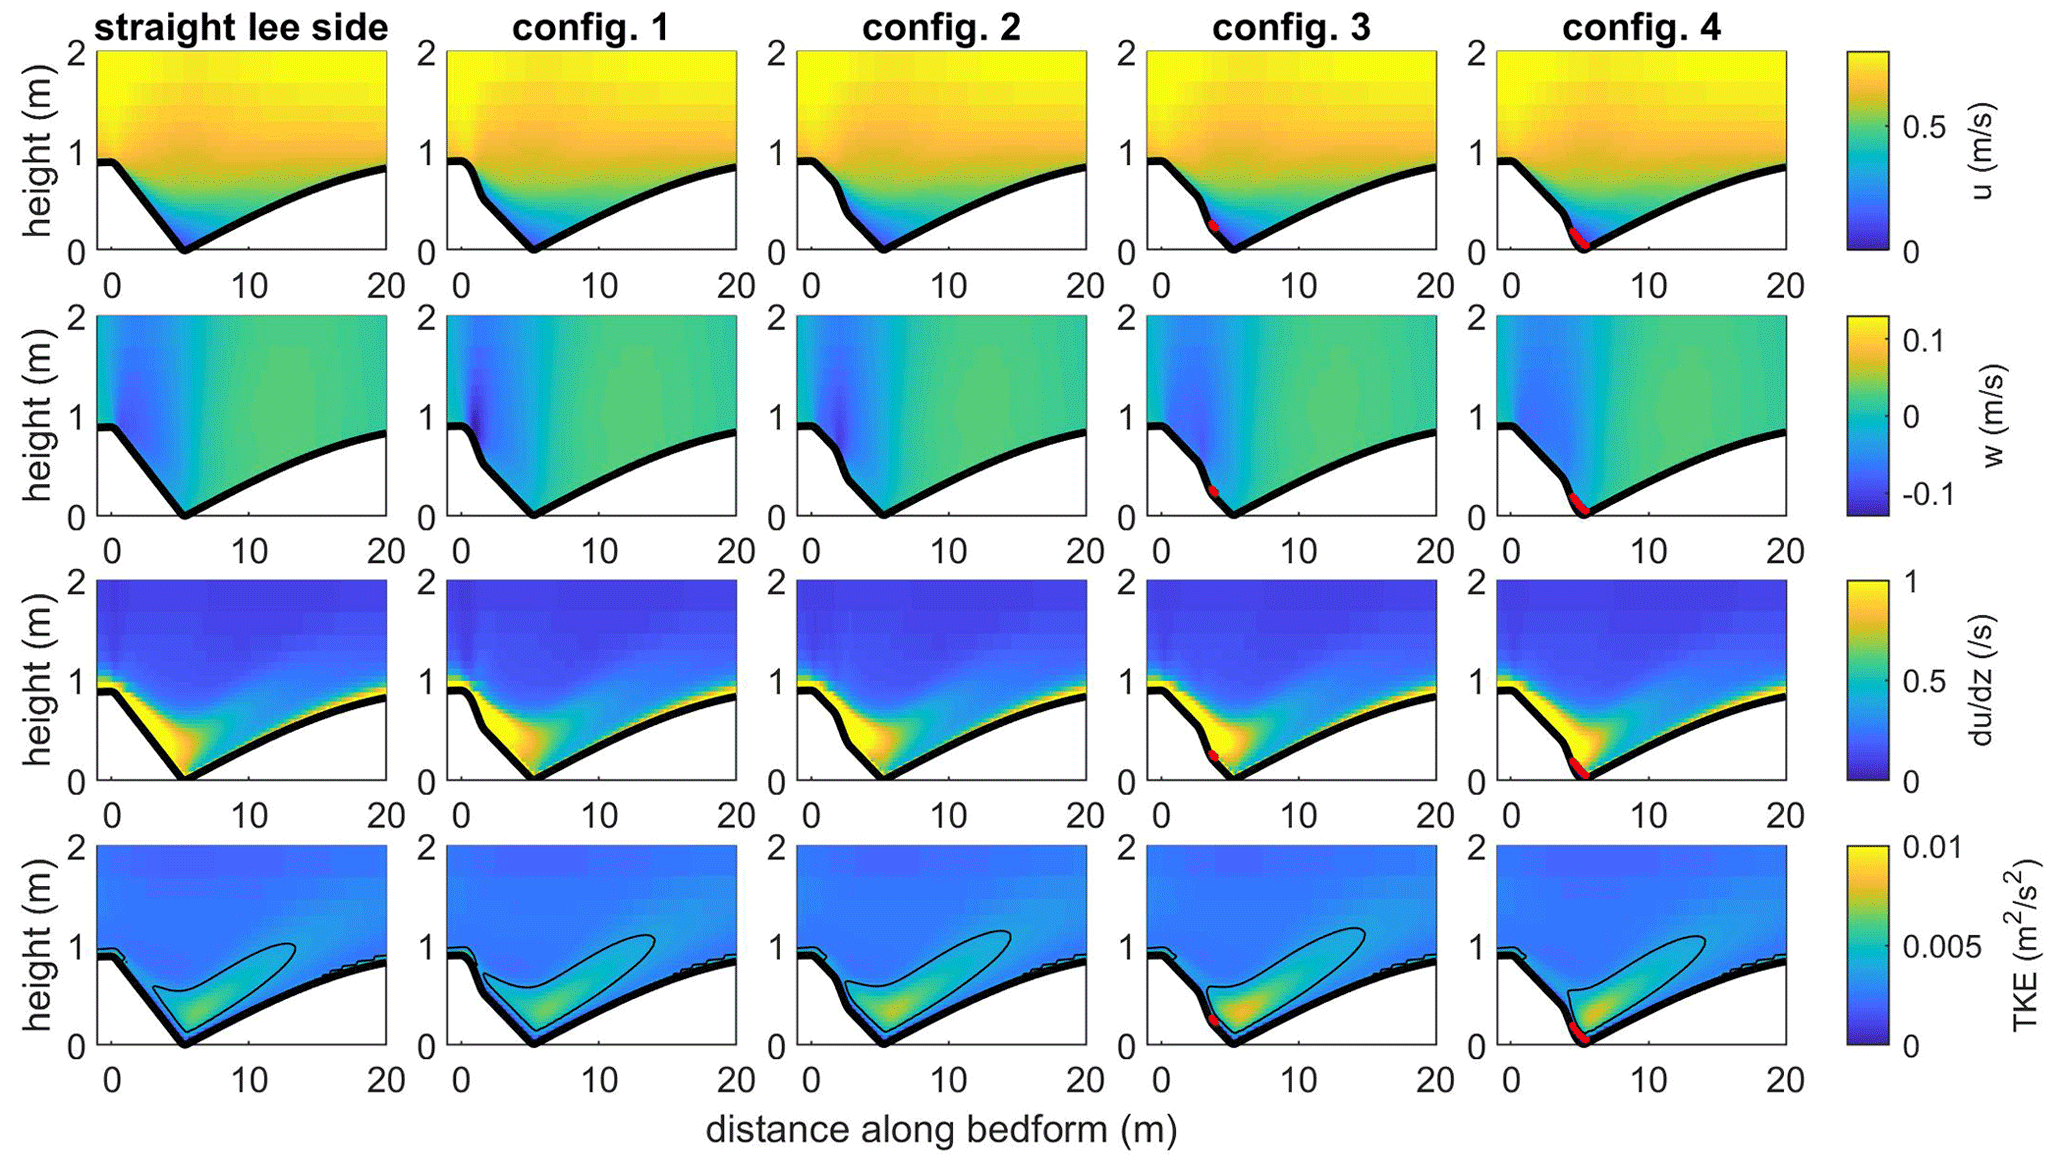
Figure 5Horizontal and vertical velocities (u and w), vertical gradient of streamwise velocity () from which the shear layer can be seen and TKE above bedforms with a mean lee side of 9.4∘ and maximum angle of 20∘ for the straight lee slope and the four lee shape configurations tested. The thick red lines show the upper limit of the flow separation zone. The black lines in the bottom figures show the contour of TKE > 0.0038 m2 s−2 to highlight the position of the turbulent wake.
Over low-angle dunes, the shear layer stays close to the bed and is the thickest above the upper lee side and the steep portion. The maximum TKE is situated close to the trough, independently of the steep portion position. The turbulent wake generally starts over the steep portion and extends downstream, down to a distance of ca. 5 Hb after the trough. Therefore, although the mean and maximum TKE are strongest for steep faces closest to the trough, the turbulent wake is longest for steep portions close to the crest (Fig. 4).
3.2 Intermediate-angle dunes
Intermediate-angle dunes (defined here as dunes with mean lee side angles between 10 and 17∘) represent 11 % of the dunes measured in the Weser by Lefebvre et al. (2021) and 43 % of dunes measured in six large rivers by Cisneros et al. (2020). From the results of the simulations over intermediate-angle dunes, it is difficult to find distinctive trends in terms of the presence and size of flow separation and TKE patterns with respect to the maximum angle value and its position. This is likely due to the fact that the model can only simulate permanent flow separation, whereas intermittent flow separation is most likely to occur over intermediate-angle dunes. In general, a small permanent flow separation is simulated, although not systematically. For example, a flow separation is often absent over dunes for which the maximum angle is close to the crest (e.g. config1 in Fig. 6 but also config2 in some other cases) and/or for sharp profiles. Interestingly, flow separation does not always start at the brink point but is centred over the trough. As a result, the size of the flow separation, when present, varies only little with the position of the maximum slope. Moreover, over intermediate-angle dunes, the shear layer extends from the dune crest and down the lee side, extending just above the dune trough, regardless of maximum angle location. It becomes thicker when moving down the lee side until detaching near the location of flow separation. The maximum TKE is found close to the trough. The turbulent wake is situated over the trough, independently of the maximum angle position. It is longer than over low-angle dunes and extends into the water column above the dune height, but its size does not vary significantly depending on the position of the maximum angle for a given mean angle.
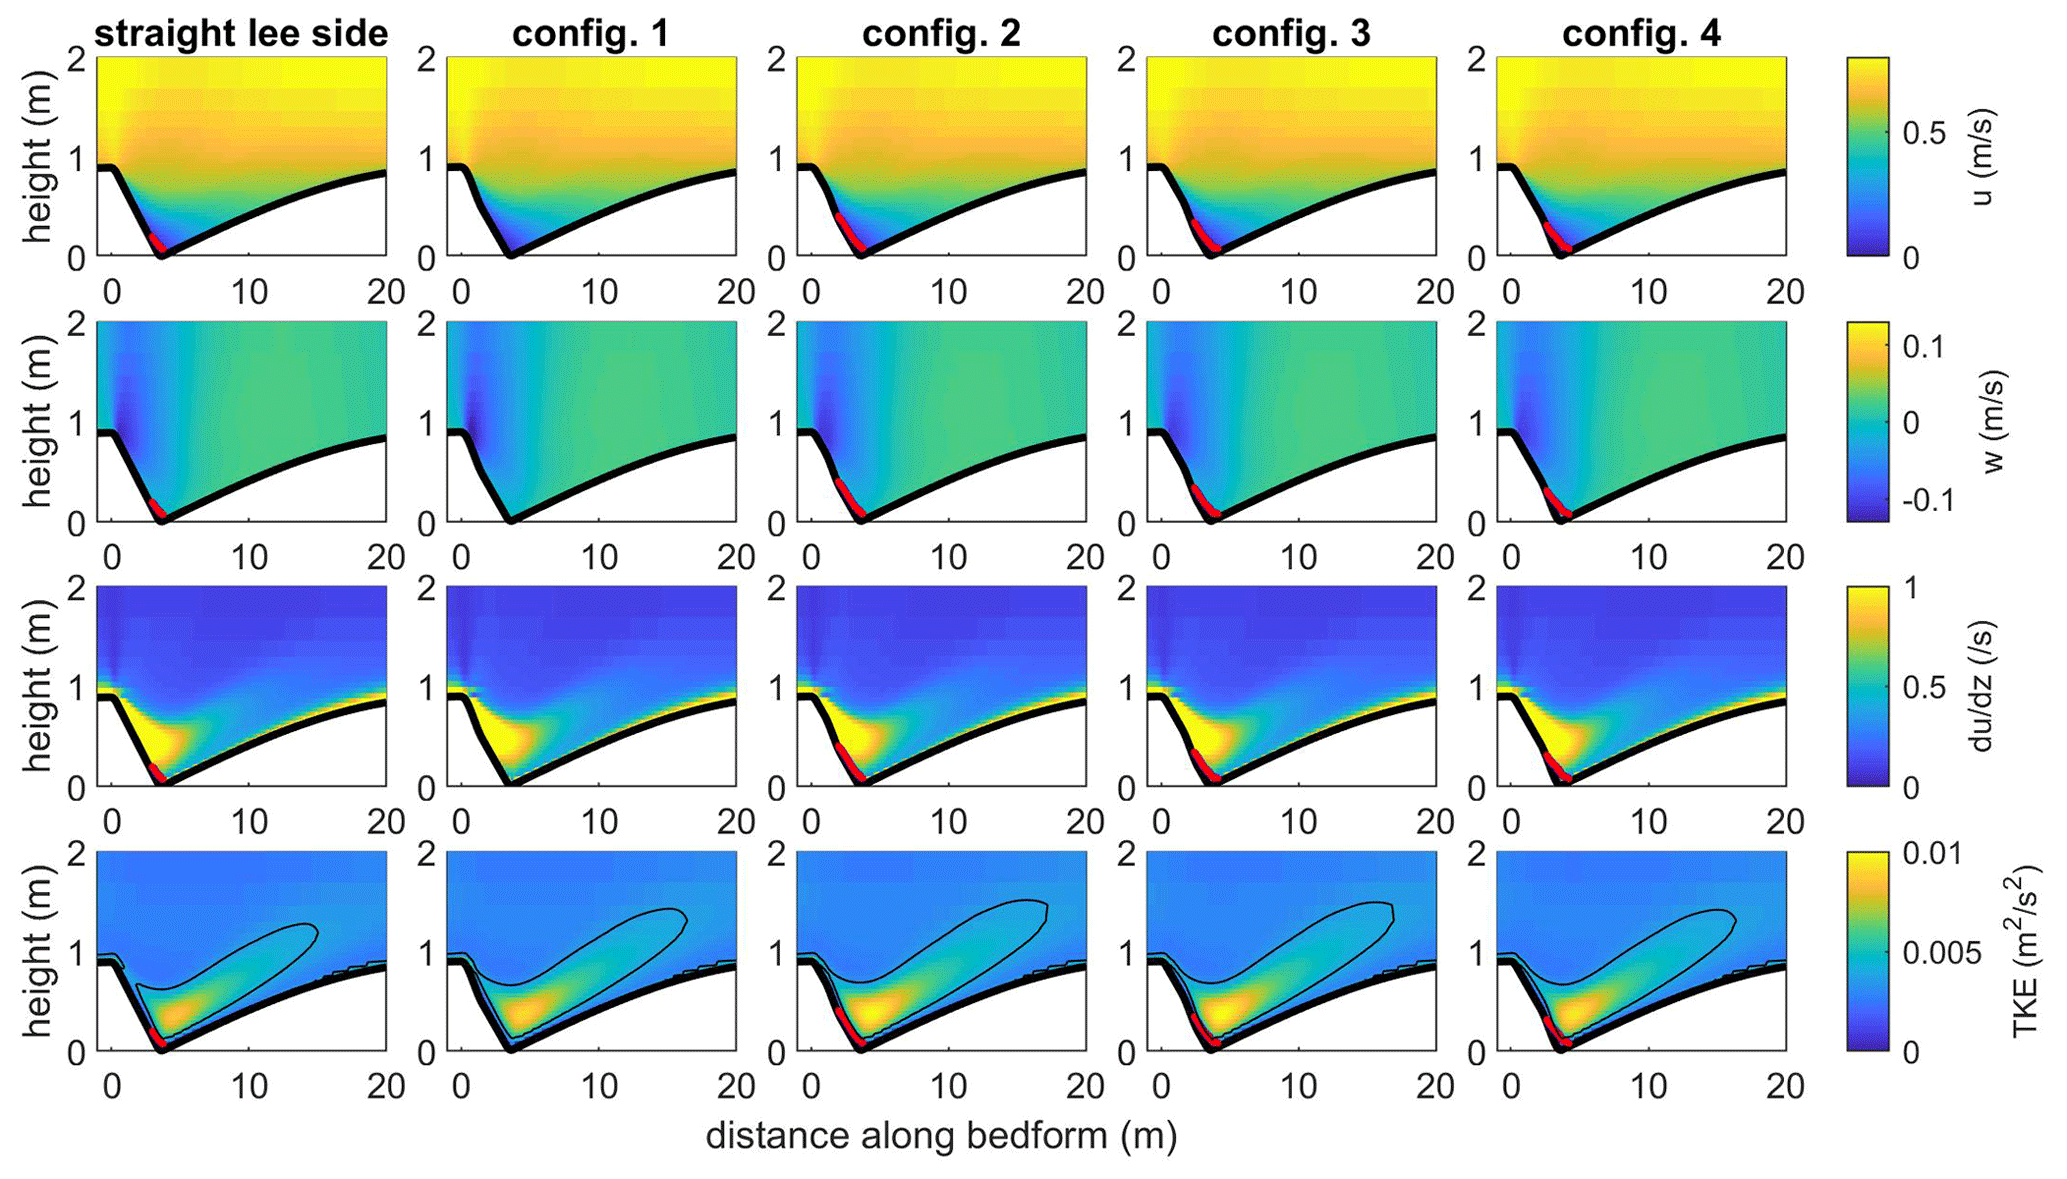
Figure 6Horizontal and vertical velocities (u and w), vertical gradient of streamwise velocity () from which the shear layer can be seen and TKE above bedforms with a mean lee side of 13.7∘ and maximum angle of 20∘ for the straight lee slope and the four lee shape configurations tested. The thick red lines show the upper limit of the flow separation zone. The black lines in the bottom figures show the contour of TKE > 0.0038 m2 s−2 to highlight the position of the turbulent wake.
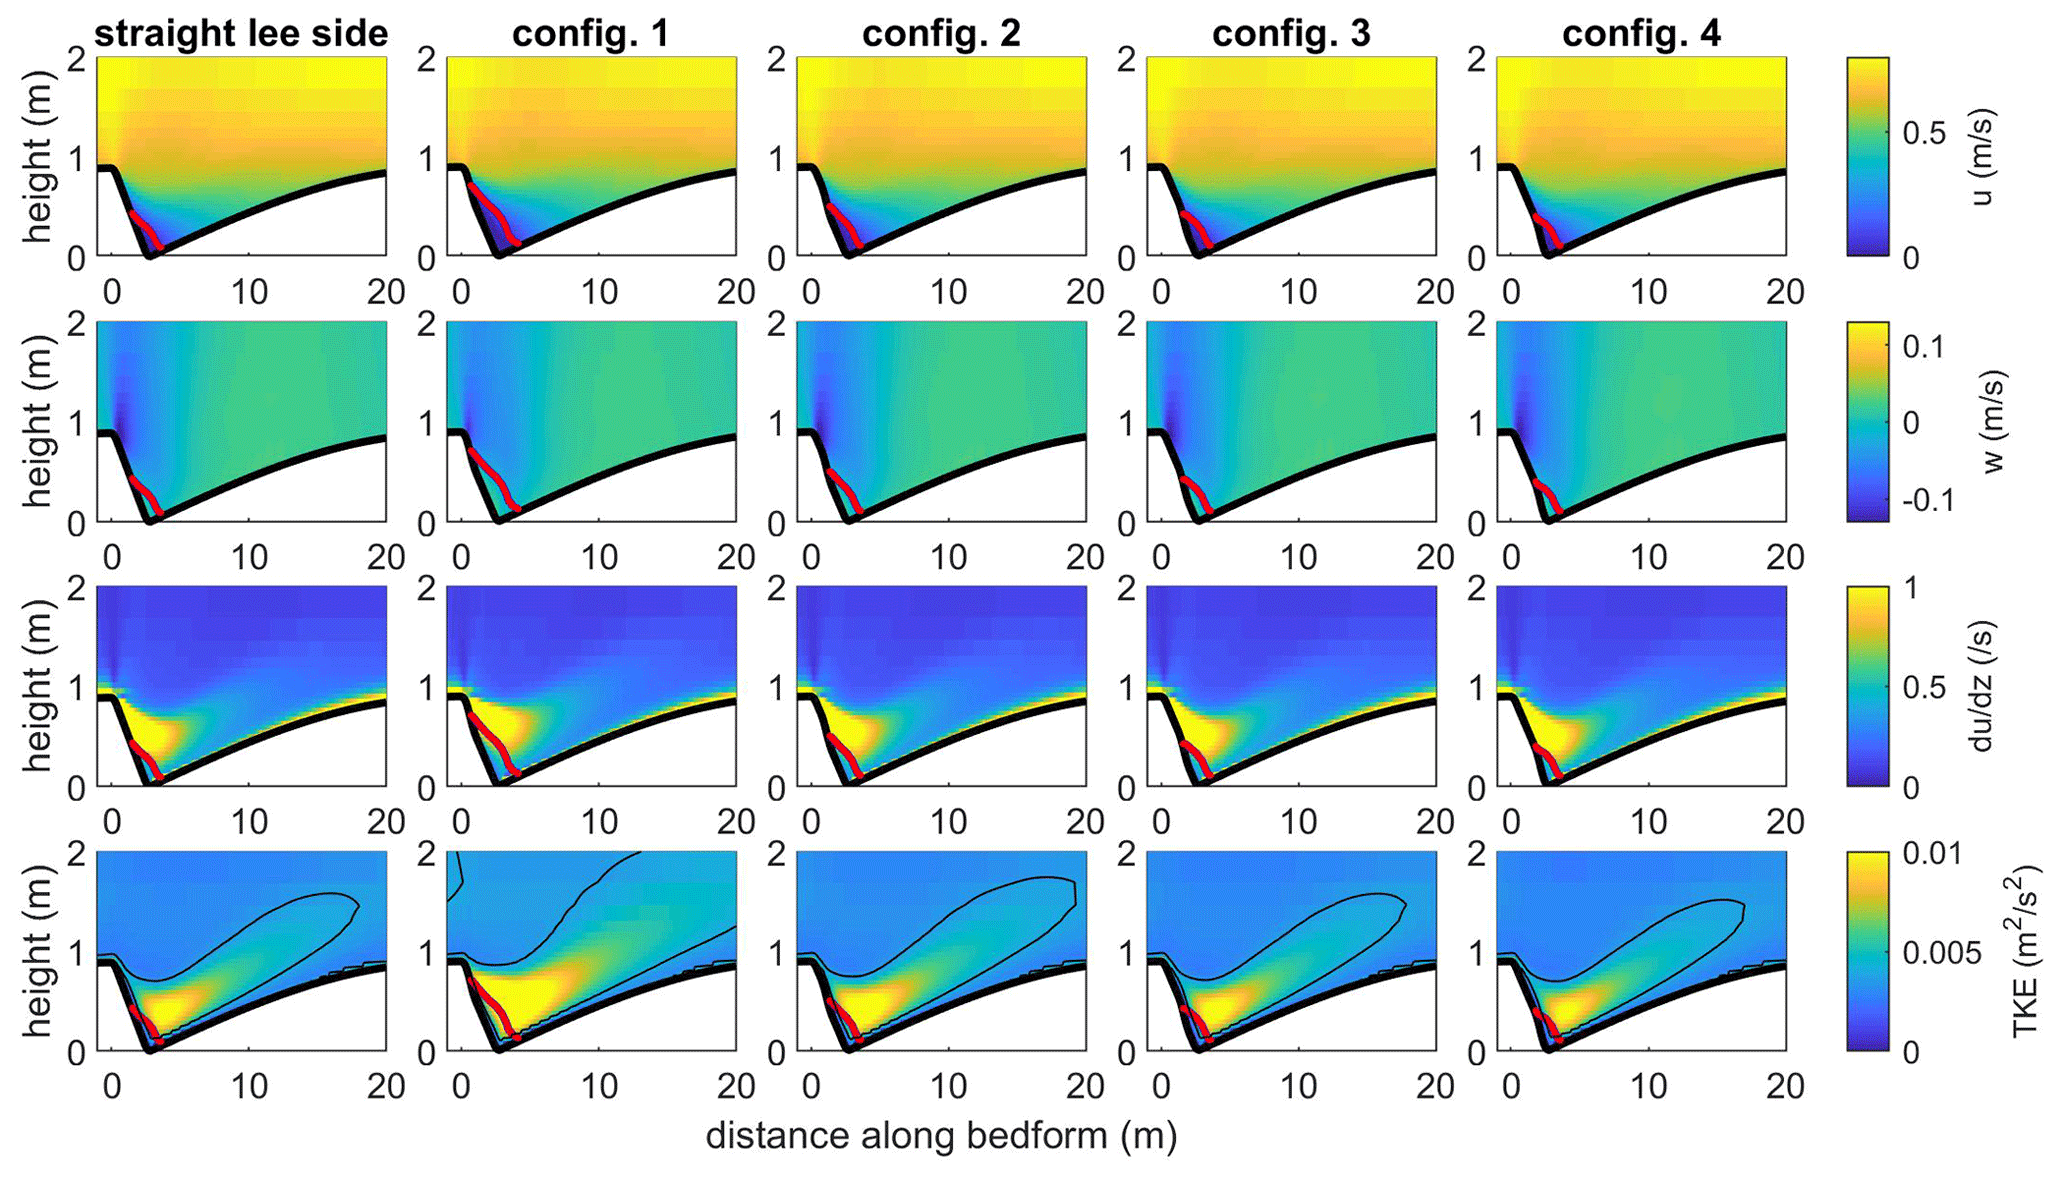
Figure 7Horizontal and vertical velocities (u and w), vertical gradient of streamwise velocity () from which the shear layer can be seen and TKE above bedforms with a mean lee side of 17.5∘ and maximum angle of 30∘ for the straight lee slope and the four lee shape configurations tested. The thick red lines show the upper limit of the flow separation zone. The black lines in the bottom figures show the contour of TKE > 0.0038 m2 s−2 to highlight the position of the turbulent wake.
3.3 High-angle dunes
High-angle dunes (defined here as dunes with mean lee side angles over 17∘) represent only 0.03 % of the dunes measured in the Weser by Lefebvre et al. (2021) and 16 % of dunes measured in six large rivers by Cisneros et al. (2020). According to our simulations, a permanent flow separation is always observed above high-angle dunes. The flow generally separates over the steep portion and reattaches shortly after the trough (Fig. 7). Therefore, flow separation is longer for maximum angles situated close to the crest than for those situated close to the trough. The highest downward velocity is always situated just after the crest, independently of the maximum angle position. The shear layer detaches from the lee side along the upper flow separation line. Significant differences are observed for the turbulent wake depending on the maximum angle position; it is especially strong (i.e. high TKE intensity) and spatially developed for steep portions close to the crest, so much so that a stacked wake (i.e. a turbulent wake which extends over the crest onto the next dune, as commonly observed over angle-of-repose dunes; Unsworth et al., 2018) is seen (Fig. 7). As the position of the steep portion comes closer to the trough, the turbulent wake decreases in size and intensity.
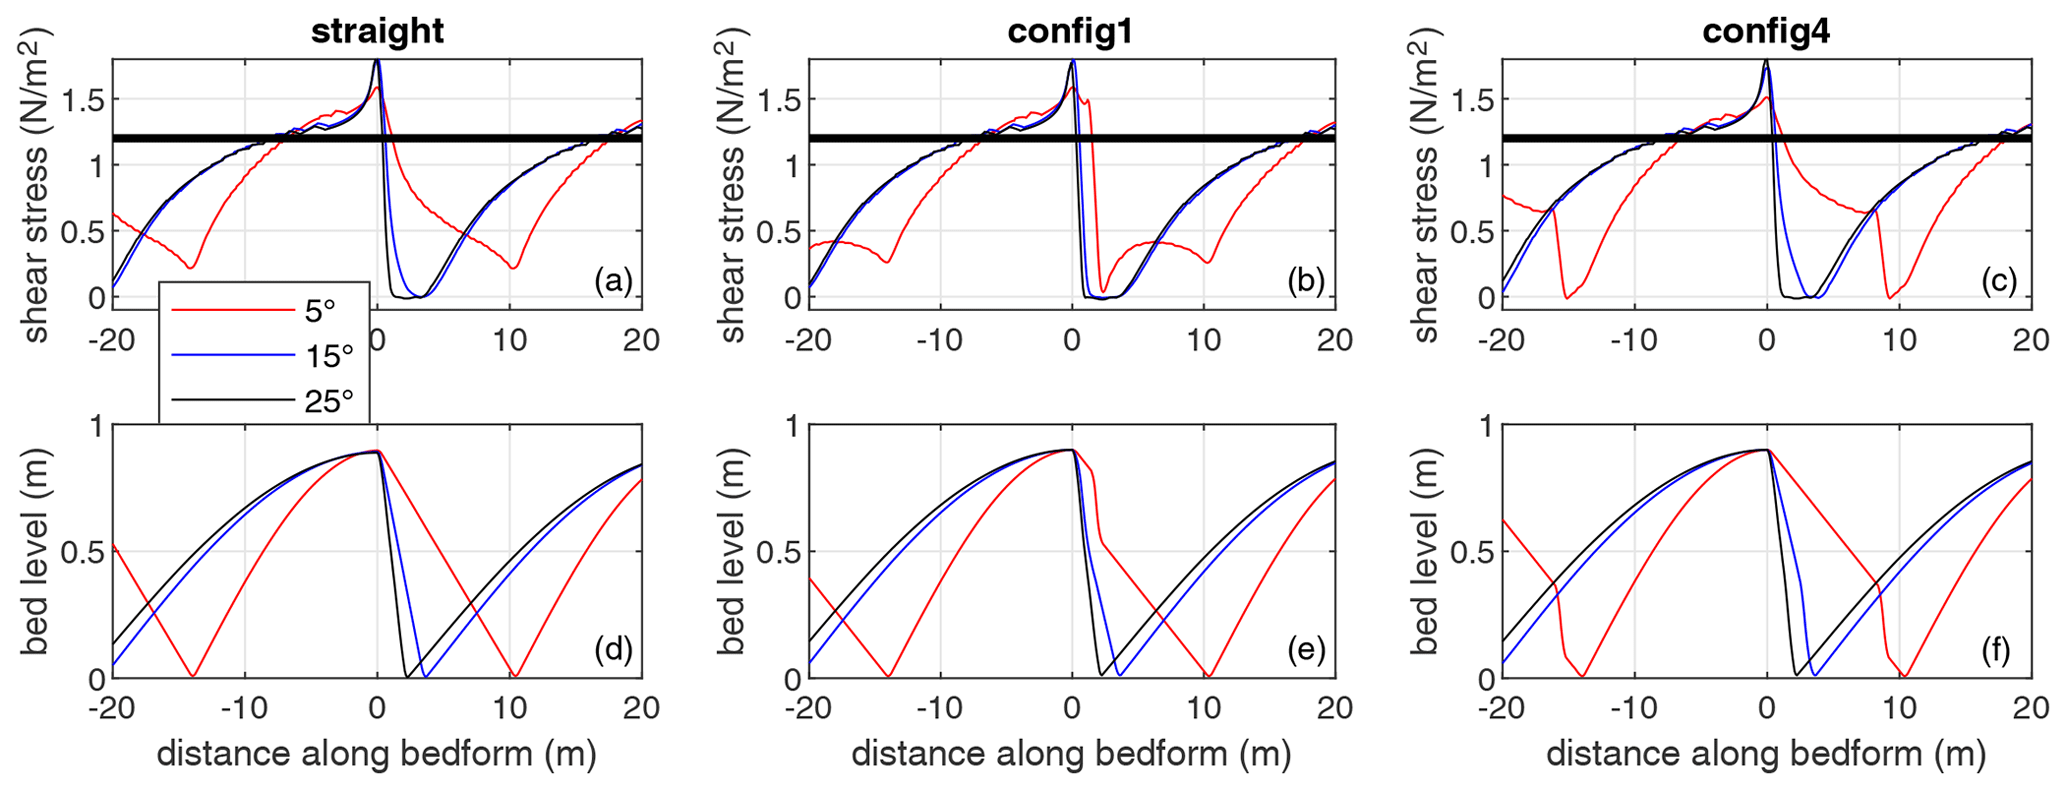
Figure 8Bed shear stress and bed level for bedforms with a mean lee side of 5, 15 and 25∘ and with a straight lee side (a, d) or a maximum angle of 30∘ close to the crest (config1; b, e) or close to the trough (config4; c, f). The thick black line in the upper plots shows the critical shear stress for the bed load transport not adjusted for slope effects.
3.4 Bed shear stress
The bed shear stress variations above the dunes are influenced by the dune shape (Fig. 8). Bed shear stress generally increases along the stoss side and reaches a maximum at the crest. It then decreases along the lee side and reaches a minimum above the trough. However, this decrease is not linear, even when the lee side is straight. Instead, there is a strong decrease over the first half of the lee side and a slower decrease or stabilisation in the lower half. It should be noted that the bed shear stress over a 30∘ lee side angle reaches slightly negative values (minimum value of −0.01 N m−2 over a straight lee side) due to flow separation but stays relatively high for a 10∘ lee side angle (minimum value of 0.21 N m−2 over a straight lee side). The maximum lee side angle position has an effect which is observed mainly over low-angle lee sides. If the maximum angle is close to the crest, the bed shear stress decreases strongly over the steep portion, increases gently over the lower lee side, with a little dip over the trough, and has a strong increase over the stoss side. If the maximum angle is situated towards the trough, then the bed shear stress decreases slowly over the upper lee side before a sudden decrease over the steep portion reaching a minimum over the trough. The value of the minimum bed shear stress also varies, depending on the maximum angle position. For a mean angle of around 5∘ and a maximum angle of 30∘, the minimum bed shear stress is 0.03 N m−2 if the maximum angle is close to the crest and −0.01 N m−2 if the maximum angle is close to the trough (presence of a small flow separation). Therefore, the position and value of the minimum bed shear stress is impacted by the position of the maximum angle.
4.1 Low-, intermediate- and high-angle dunes
Our results show that the mean lee side angle has the strongest control over flow separation and turbulence over dunes, with a secondary influence of the position and value of the maximum lee side angle, depending on mean lee side angle values. Following these results, we propose a distinction among three types of dunes, namely low-angle dunes, intermediate-angle dunes and high-angle dunes. The results of the 88 simulations carried out indicate that the boundaries between these dune types are at 10 and 17∘. Additional simulations were done in order to verify these angles (Appendix A4). The simulation results confirmed that dunes with a mean lee side of 12, 15 and 16∘ belong to intermediate-angle dunes, with an “irregular” pattern of flow separation and turbulence. They also showed that an increase in the relative dune height (varied within the limits given by Bradley and Venditti, 2017) did not have a strong influence on flow properties. Finally, flow over a mean lee side of 18∘ showed properties similar to high-angle dunes. Therefore, these additional simulations confirmed that, with the settings used in the present study (fixed bedform height and length, only a small variation in bedform relative height, fixed bed roughness and flow velocity), the boundary between low- and intermediate-angle dunes is at 10∘ and between intermediate- and high-angle dunes at 17∘. The proposed classification scheme adds precision to previous research in which only high- and low-angle dunes were described, sometimes without a clear definition, and did not (explicitly) recognise intermediate-angle dunes. For example, Best (2005) refers to high-angle and low-angle dunes but did not specify the slopes at which they are differentiated. Roden (1998) defined dunes with a lee side angle > 20∘ as being steep and a lee side angle < 10 as being a low-angle dune. Kostaschuk and Villard (1996) differentiate between symmetric dunes with mean lee side slopes < 8∘ and asymmetric dunes with slopes > 19∘, and Kostaschuk and Venditti (2019) classify high-angle dunes with maximum lee side angles > 24∘ and low-angle dunes with maximum lee side angles < 24∘. These publications therefore recognised the existence of intermediate-angle dunes but only implicitly. Best and Kostaschuk (2002) define low-angle lee sides with slopes < 10∘ but mention the “transition region for the onset of flow separation (e.g. 10–15∘)”. The boundaries between dune types in the literature vary compared to those from the present study. That is likely due to the variety of dune and flow characteristics found in a natural environment compared to our simplified numerical experiments. Other numerical experiments have already showed that some characteristics (for example, bed roughness, relative bedform height or aspect ratio) can influence flow separation properties (Lefebvre et al., 2014a). Therefore, it is likely that the limits between low-, intermediate- and high-angle dunes are not at specific and fixed values but vary around these values depending on hydrodynamic and morphodynamic conditions.
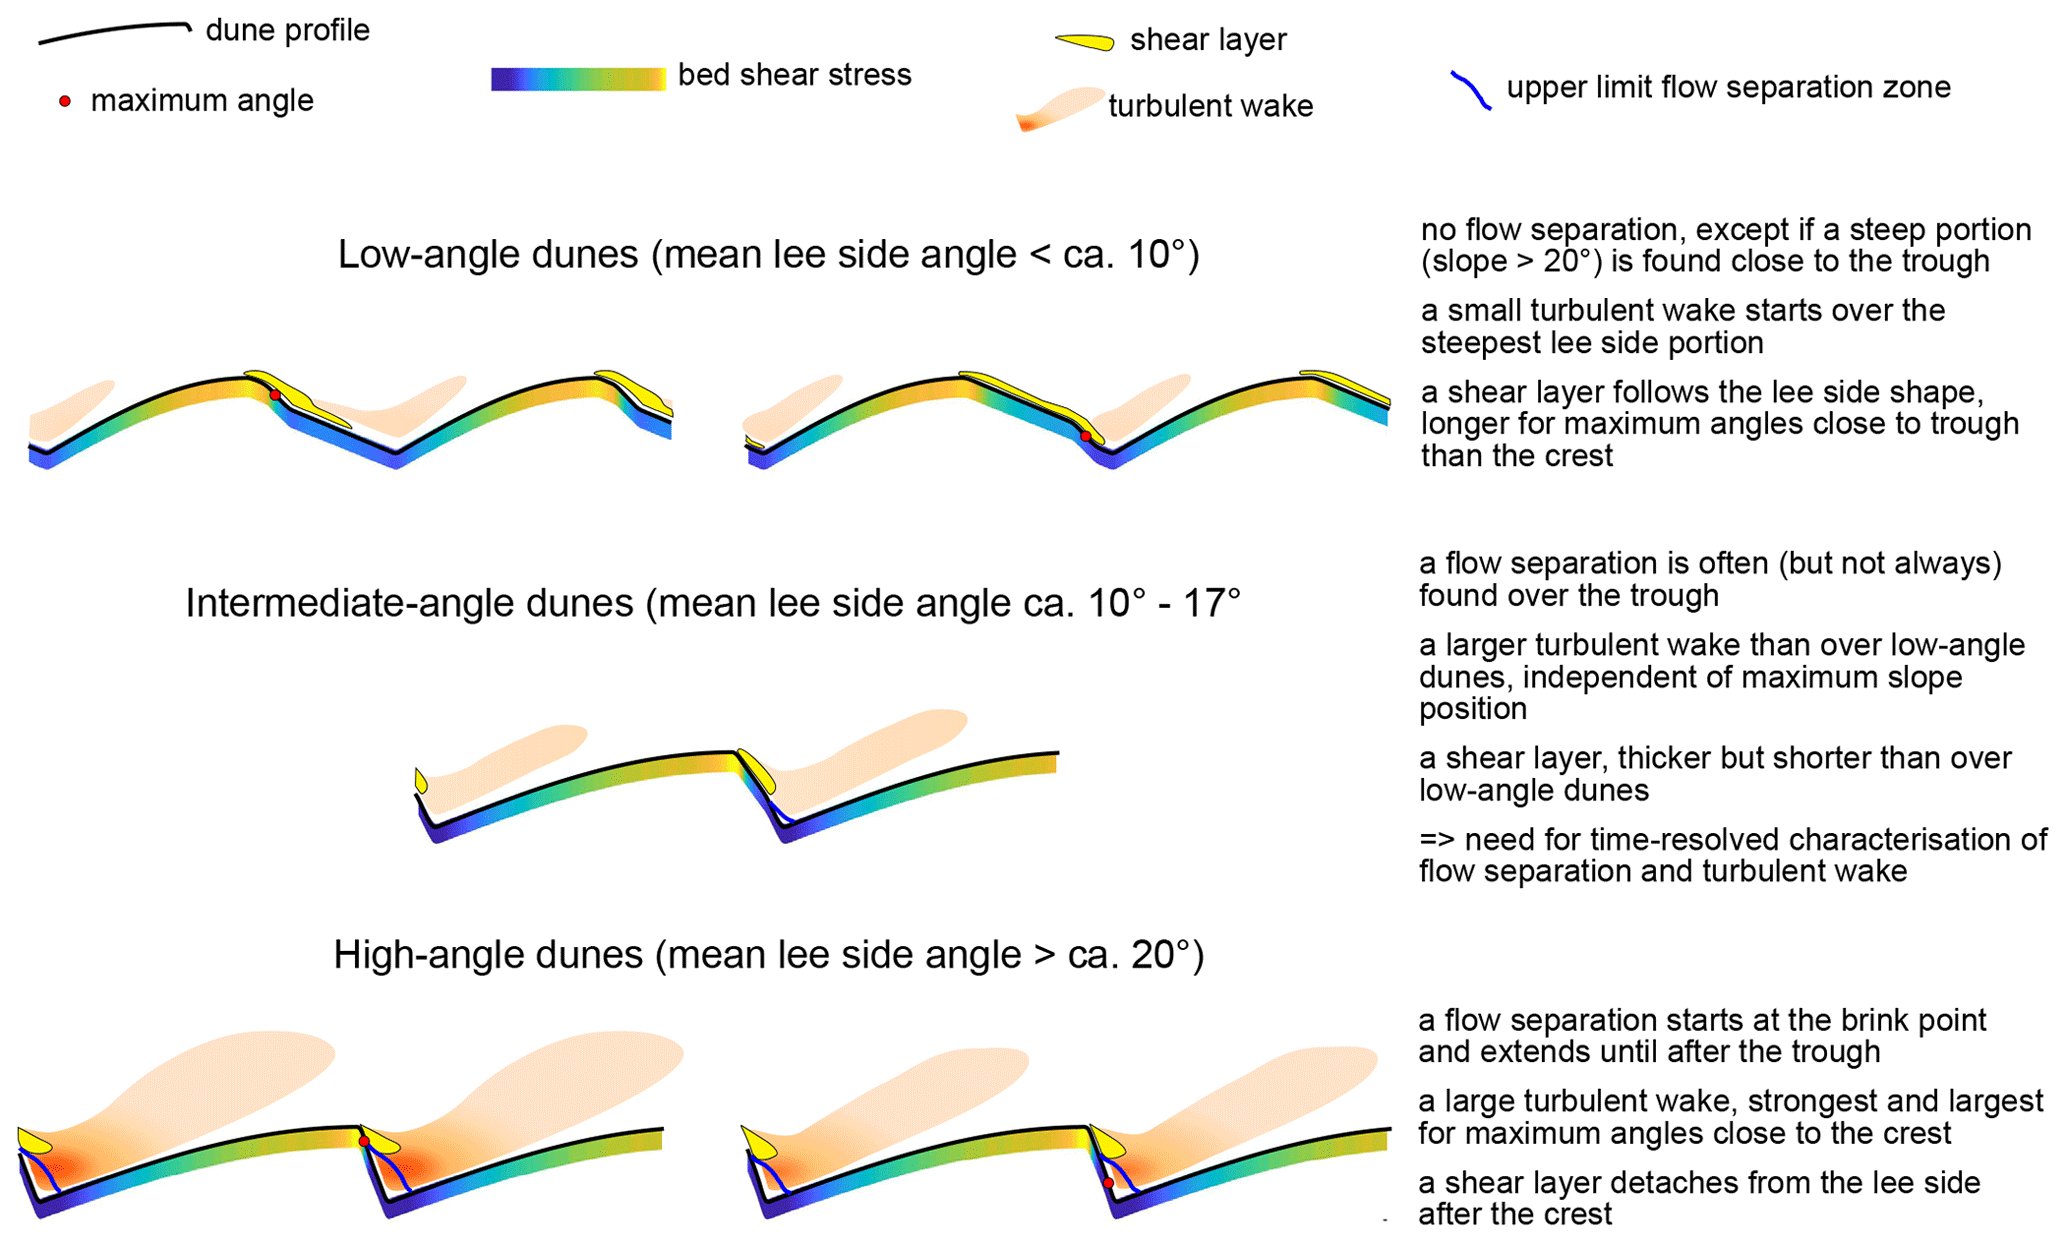
Figure 9Summary of the results showing the main characteristics of flow over low-angle, intermediate-angle and high-angle dunes.
Based on our results and previous research (e.g. Best and Kostaschuk, 2002; Bradley et al., 2013; Kwoll et al., 2016; Naqshband et al., 2018; Kostaschuk and Villard, 1996), properties of each dune category can be identified (Fig. 9). Over low-angle dunes, there is no flow separation, except if a very steep portion (slope > 20∘) is found. Low-angle dunes generate little turbulence and are likely to induce little bedform roughness. The shear layer follows the bed and is more extended when the steepest slope is close to the trough than close to the crest. Over intermediate dunes, flow separation is intermittent. Turbulence and roughness are intermediate between low- and high-angle dunes. No patterns were found between the position of the maximum angle and flow properties. Over high-angle dunes, a developing to fully developed flow separation is present, a strong turbulent flow is observed and a high bedform roughness is created. If the maximum angle is close to the crest, then the flow separation is longer and the turbulent wake is stronger than if the maximum angle is close to the trough. The distinction between low-, intermediate- and high-angle dunes is important for a range of processes, such as the evaluation of bed roughness, understanding the relation between hydrodynamics, sediment transport and dune morphology, how dunes are identified in the depositional record and unravelling the controlling processes leading to different lee side angle slopes and shapes.
A limitation of this study is that Delft3D uses the Reynolds-averaged Navier–Stokes equations and therefore can only model permanent flow separation. This is especially important in the case of the intermediate-angle dunes, which are characterised by intermittent flow separation (Best and Kostaschuk, 2002). It is likely that, over intermediate-angle dunes, the turbulent wake and the shear layer size and extent will be largely dynamic, switching between the behaviour observed for the low-angle and high-angle dunes. A particular question arises from the observation with respect to the idea that a flow separation is often (but not systematically) absent when the maximum slope is close to the crest (config1 and config2) but generally present when the maximum slope is close to the trough (config3 and config4). Our results show the limitations of studying intermediate dunes with Reynolds-averaged models such as Delft3D. We suggest that these dunes should be investigated with laboratory experiments, field measurements and Reynolds-resolving models in order to precisely characterise the case of intermittent flow separation, where little information is available.
4.2 Lee side morphology
We investigated the influence of “complex” dune morphologies, which are still simplified as three portions but with a maximum angle placed towards the crest (creating a sharp crest) or placed towards the trough (creating a rounded crest). Dunes in rivers are predominantly low- to intermediate-angle dunes with a rounded crest (Cisneros et al., 2020) and are similar to the config3 and config4 morphologies, which means that flow over river dunes will likely follow the results observed over those configurations. Following this assumption, most river dunes are likely to have intermittent flow separation and a wake contained over the trough. The bed shear stress will slowly decrease over the upper lee side and strongly decrease over the steep face.
Dunes in estuaries are predominantly low-angle dunes with a sharp crest (Lefebvre et al., 2021; Dalrymple and Rhodes, 1995), so they will mainly follow the results from config1 and config2. Following the modelled results over these lee side morphologies, it is likely that there is no permanent flow separation over low-angle sharp crested dunes. The turbulence will be low and diffused along a large, long turbulent wake with low TKE. The bed shear stress will have a strong decrease over the upper part of the lee side and then be stable or increase slightly over the lower lee side.
Our results show that the dune shape will affect how they interact with the flow. However, so far, the precise mean and maximum angles and the detailed shape (e.g. position of maximum angle) has been systematically quantified only for six large rivers and the Weser estuary. Dunes on the continental shelf have been described as sharp or round crested (Van Landeghem et al., 2009; Zhang et al., 2019) but without further precision. Therefore, it is essential that the lee side shape is characterised with a precise determination of mean and maximum angles, the position of the maximum angle, if possible, the size and location of the steep face (i.e. not only the position of the maximum angle but also the size of the steepest slope) and a quantification of the crest shape (between rounded and sharp) in order to precisely understand and predict the complex interaction between hydrodynamics, sediment transport and bed morphology. Since high-resolution multibeam data are now routinely collected during surveys, the description of the dune shape can and should be routinely done. This would greatly help us to better understand the complex interaction between bedform morphology and hydrodynamics.
In this study, we have assumed that there was only one scale of dunes. However, compound bedforms are often observed, with smaller bedforms superimposed on larger ones, usually over the stoss side. When the lee side of large dunes is low, then secondary bedforms may also be found over the lee side (Zomer et al., 2021; Galeazzi et al., 2018). These secondary bedforms can have a strong influence on flow above dunes, as even if the primary dune mean lee side angle is low, the lee side of the secondary bedforms may be steep, and therefore, flow separation and roughness will be created over such compound dunes. The simulations with mean lee side 5∘ and maximum lee side > 20∘ certainly show the possibility for permanent flow separation over such low-angle primary dunes if there are some steep secondary bedforms over the lee side. This has the potential to create high roughness, as the wakes are mixing with one another when they are advecting downstream, in the case where several steep secondary bedforms are found on the lee side of low-angle primary dunes. Further studies could therefore investigate the interaction between the turbulence and flow separation of the secondary bedforms found over low-angle dunes. However, this does require high spatial resolution for the secondary bedforms to be properly resolved, and if the experiments are carried out with moving sediment, then the temporal scales required to observe this interaction would be related to the rate of superimposed bedform migration.
4.3 Potential impact on bedform roughness
Bedform roughness varies depending on lee side angle (Kwoll et al., 2016; Lefebvre and Winter, 2016). In the present study, we could not directly quantify the variations in roughness. However, bedform roughness is related to turbulence intensity over dunes (Lefebvre et al., 2016). Here, we observe that mean and maximum turbulence generally increases with increasing mean lee side angle. However, for the same mean lee side angle, there are still variations in turbulence created by the value and position of the maximum slope (Fig. 3). This means that bedform roughness is likely to be affected not only by the mean lee side angle but also by the value and position of the maximum angle. However, no practical way has been found to characterise the roughness of low-angle dunes, and a definite relation between lee side angle of natural dune field and roughness has not yet been established. For example, no relation was found between dune lee properties and roughness variations in the river Waal in the Netherlands (de Lange et al., 2021). Therefore, it currently seems unlikely that the effect of the value and position of the maximum lee side angle can easily be considered when estimating bedform roughness of a natural bedform field. Instead, research should focus on relating bedform statistical properties, such as the integrated slope area, to roughness measurements in the field and developing practical ways to incorporate these in model simulations. Indeed, bedform roughness variations due to bedform asymmetry have a strong impact on velocities and bedload transport calculation in tidal environments (Herrling et al., 2021).
4.4 Potential impact on sediment transport
The variation in bed shear stress across different dune morphologies will impact the potential for sediment transport. Here, it should be noted that the critical shear was calculated using a single sediment size and without bed slope effect (following the procedure described by Soulsby, 1997), and of course, it does not take into account the complex feedback between sediment transport and morphology variation (i.e. no sediment is being moved). Furthermore, the dune shapes investigated are still simple compared to the natural dunes, especially for the stoss side, which is represented by a sinusoidal. The critical shear stress is therefore a simple indication for the potential to put sediment in motion along the dune but cannot be used for a full analysis of sediment transport along the dunes. This point is especially salient, considering the differences in near-bed sediment transport processes between migrating and fixed dunes and specifically the presence of a dense sediment layer near the bed in migrating dunes (Naqshband et al., 2014b). For low-angle dunes (mean lee side < 10∘), the extended area of critical bed shear stresses near the crest in case the maximum angle is near the crest (config1) implies that there is a higher ability of sediment to be transported from the dune crest compared to the configuration where the maximum angle is near the trough (config4). Kostaschuk and Villard (1996) attribute crestal rounding (possibly through crestal erosion) to high near-bed velocities when the bedload transport is dominating, and this process would likely also occur in the config1 case. On the other hand, there is very little difference in the bed shear stress curves for the high-angle dunes, which implies that the sediment transport potential for the different dune morphologies will be less impacted by the location of a steep slope in these high-angle cases. The difference between the shear stress curves from the low to the high-angle dunes requires that we account for the spatial variations in bed shear stress across the dune to better understand the sediment transport potential in these systems and bedform evolution which can occur from these different bed shear stress patterns.
The differences in bed shear stress curves for the low-angle dunes are related to variations in velocity magnitude above the lee side, which can also be recognised in the shapes of the shear layer and turbulent wake. The magnitude of Kelvin–Helmholtz instabilities and macroturbulence above dunes have been linked to the velocity differential across the shear layer (Bennett and Best, 1995; Shugar et al., 2010), where accelerations and decelerations are attributed to locations and modes of sediment entrainment. The present simulations show differences in velocity deceleration across the crestal and lee side region, depending on the maximum angle position, particularly a rapid decrease versus a gradual decrease when the steep portion is close to the crest or trough, respectively. These differences are likely to result in varying magnitudes and types of sediment transport (i.e. bedload vs. suspended load), where more rapid flow deceleration may be related to higher suspended sediment flux (Shugar et al., 2010). This shows the ways in which the differing flow dynamics and wake regions over complex lee side shapes may influence the along-stream bed shear stress and resultant sediment transport across low-angle dunes.
The present analysis was carried out in a two-dimensional (2D) setting, whereas dunes usually have some degree of three-dimensionality. The complex interaction between bedform three-dimensional (3D) shape, flow and sediment transport has been recognised since the early work of Allen (1968) and described based mostly on idealised bedforms in physical and numerical experiments (Unsworth et al., 2020; Maddux et al., 2003; Venditti, 2007; Lefebvre, 2019; Hardy et al., 2021). For example, three-dimensionality will deflect flow over the lee side (Hardy et al., 2021) and thereby affect flow separation and turbulence properties (Lefebvre, 2019; Venditti, 2007). Furthermore, if a dune is recognised from 3D bathymetry as a 3D entity between two trough lines (Cassol et al., 2022; Lebrec et al., 2022), then lee side angles may vary laterally along a dune. In this case, the classification may be complicated by the fact that parts of a dune may be considered to be, for example, low angle, but other parts may be considered to be intermediate-angle dunes.
Numerical simulations were carried out in order to estimate the influence of the value and position of the maximum lee side angle on flow above dunes with varied mean lee side slopes in a unidirectional flow. Based on our results and the previous literature, we propose a distinction between three types of dunes.
-
Low-angle dunes, with mean lee side slopes lower than ca. 10∘. Over such dunes, there is no permanent flow separation, except if the maximum angle is more than 20∘ and close to the trough. The turbulent wake is generally weak but strongest and most compact (limited spatial extent) for steep maximum angles situated close to the trough. The variations in velocity magnitude and turbulence intensity along the dune influence the bed shear stress and potential for sediment transport across different lee side shapes.
-
Intermediate-angle dunes, with mean lee sides of ca. 10 to 17∘. Over such dunes, there is rarely a permanent flow separation, but it is likely that an intermittent flow separation forms. When present, flow separation is observed over the trough, independently of the maximum lee side angle position. These dunes should be studied systemically and in detail with laboratory experiments and eddy-resolving numerical modelling.
-
High-angle dunes, with mean lee sides of more than ca. 17∘. Over such dunes, the flow separates at, or just downstream of, the brink point, and therefore, flow separation is longest if the maximum angle is close to the crest. The turbulent wake is strong and strongest and most extensive for steep maximum slopes situated close to the crest.
The scheme introduced herein is more specific than previous schemes, which only considered low- and high-angle dunes, and describes the detailed flow properties that are controlled by lee side morphology. Importantly, this new classification scheme for dune lee sides allows for a precise consideration of the interaction between dune morphology and flow. To correctly take this interaction and its consequences into account, detailed reports of dune morphology from varied environments are needed.
A1 Comparison of flow and turbulence over flat bed and straight angle-of-repose dunes
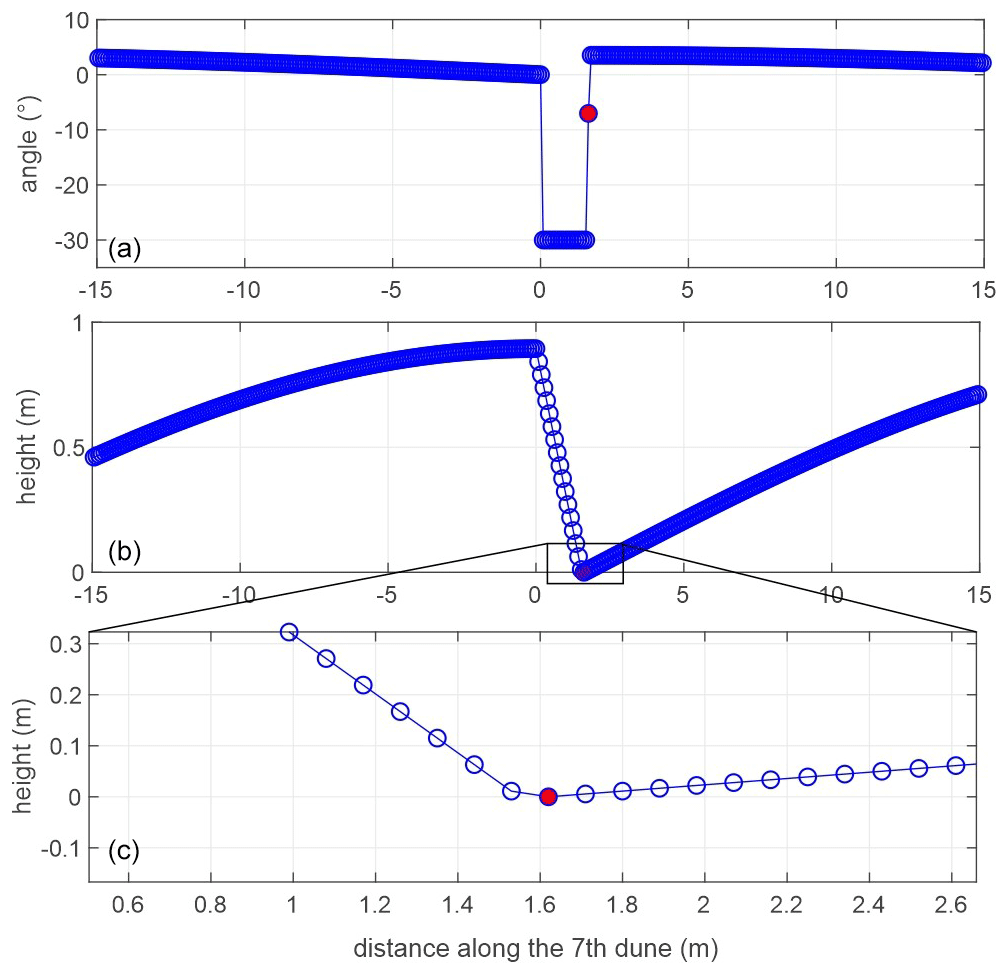
Figure A1Example of the angles (a) and the bed (b). A close-up of the trough area is shown in panel (c) on a straight lee side configuration, with a set mean lee side angle of 30∘. Because of the need to define the bedform profile on the grid, the last lee side point before the trough (marked with a red dot) is not at an angle of 30∘, compared to the previous point, but ca. 8∘. As a result, the mean lee side angle of this dune is 28.7∘ instead of the prescribed 30∘.
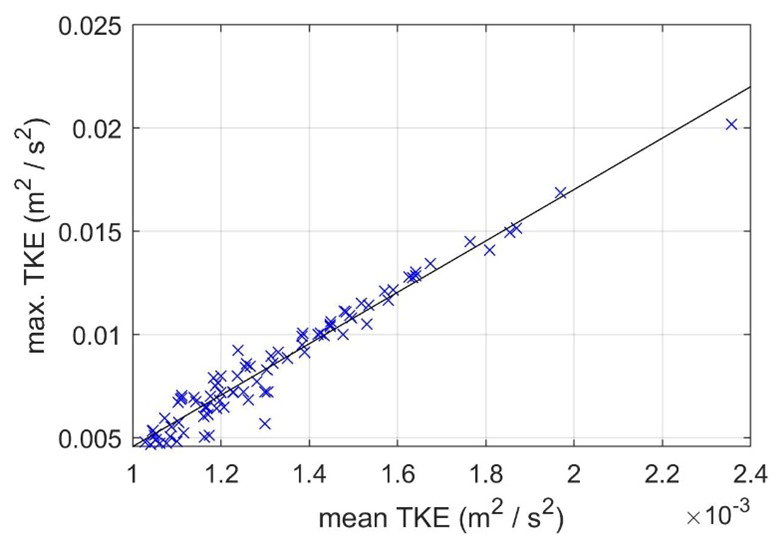
A2 Comparison of mean and maximum TKE over the seventh bedform for all the experiments
The maximum and mean TKE above the seventh bedform are linearly related, with TKEmax=12.4581TKEmean−0.0079 R2=0.95, and the number of points = 88.
A3 Comparison of properties over smooth and sharp lee sides
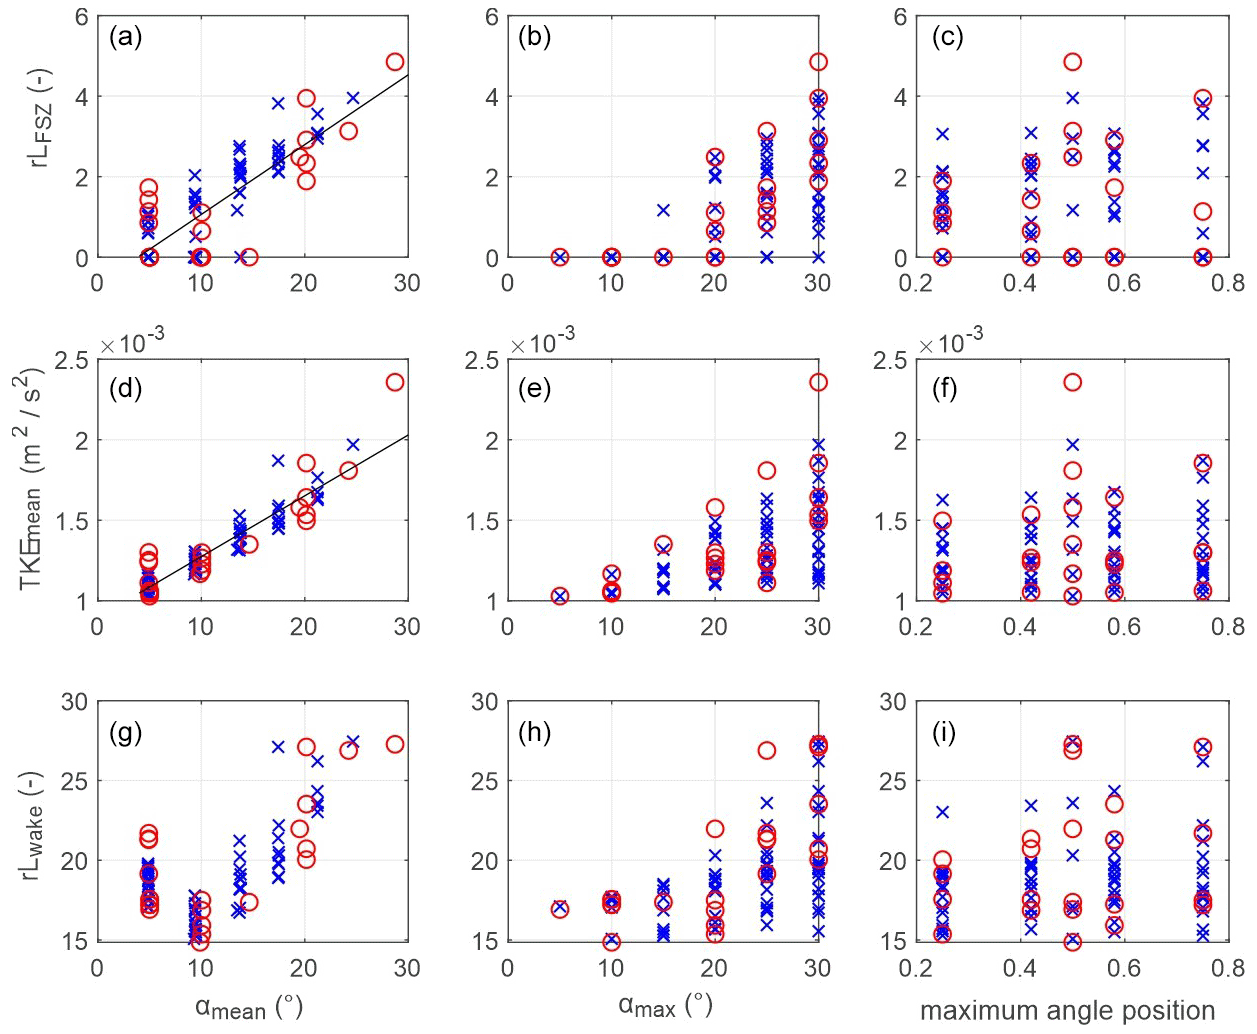
Figure A3Relative flow separation length (rLFSZ), mean turbulent kinetic energy (TKEmean) and relative length of the turbulent wake (rLwake) as a function of mean lee side angle (αmean) (a, d, g), maximum lee side angle (αmax) (b, e, h) and the position of the maximum lee side angle (a position of 0.5 indicates a straight lee side; c, f, i). This figure is similar to Fig. 3 in the main text, but the properties calculated from the sharp dunes are plotted in red circles and those from the smooth dunes in blue crosses in order to highlight the lack of systematic differences.
A4 Additional simulations
Five new sets of simulations (20 simulations in total) were carried out in order to verify the limits of low-, intermediate- and high-angle dunes (Table 2). The results are briefly described here.
-
The first set of simulations contains dunes with a mean lee side of 13∘, smoothed to 11.2∘, and a maximum lee side of 20∘. A very small flow separation is observed over config1 and none over config2, with a larger one over config3 than config4. The fact that there is no direct relation between the maximum angle position and flow separation size or presence and that there is not systematically a flow separation confirms that these are intermediate-angle dunes.
-
The second set of simulations contains dunes with a mean lee side of 17∘, smoothed to 15.2∘, and a maximum lee side of 25∘. A flow separation is found over all four configurations. However, the flow separation is, in all cases, concentrated over the trough, and the shear layer does not detach over the crest. Furthermore, the simulation with a straight lee side of 15∘ does not have a flow separation. These dunes can therefore be classified as intermediate-angle dunes.
-
The third set of simulations contains dunes with a mean lee side of 20∘, smoothed to 17.5∘, and maximum lee side of 25∘ but in 10 m water depth (instead of 8 m). The results are very similar to a similar simulation in 8 m water depth. This shows that there is not a large influence of water depth between these two values. In particular, it shows that the limit between intermediate and high-angle dunes is not shifted to higher values for smaller relative water depth.
-
The fourth set of simulations contains a mean lee side of 18∘ (not smoothed) and maximum lee side of 25∘. There is a flow separation is all cases; the flow separates at the brink point and reattaches shortly after the trough. The turbulent wake is strongest and largest for steep slopes close to the crest. These dunes can be classified as high-angle dunes.
-
The fifth set of simulations contains a mean lee side of 16∘ (not smoothed) and maximum lee side of 23∘. A flow separation is present for all four configurations. However, the size of the flow separation and the wake does not vary depending on steep slope position. Therefore, these dunes can be classified as intermediate-angle dunes.
Table A1Summary of bedform dimensions used for the numerical experiments. For all simulations, the mean velocity u=0.8 m s−1, bedform height Hb=0.89 m and bedform length Lb=24.4 m. For all simulations, water depth h=8 m, except for the one in italics for which the water depth was h=10 m.
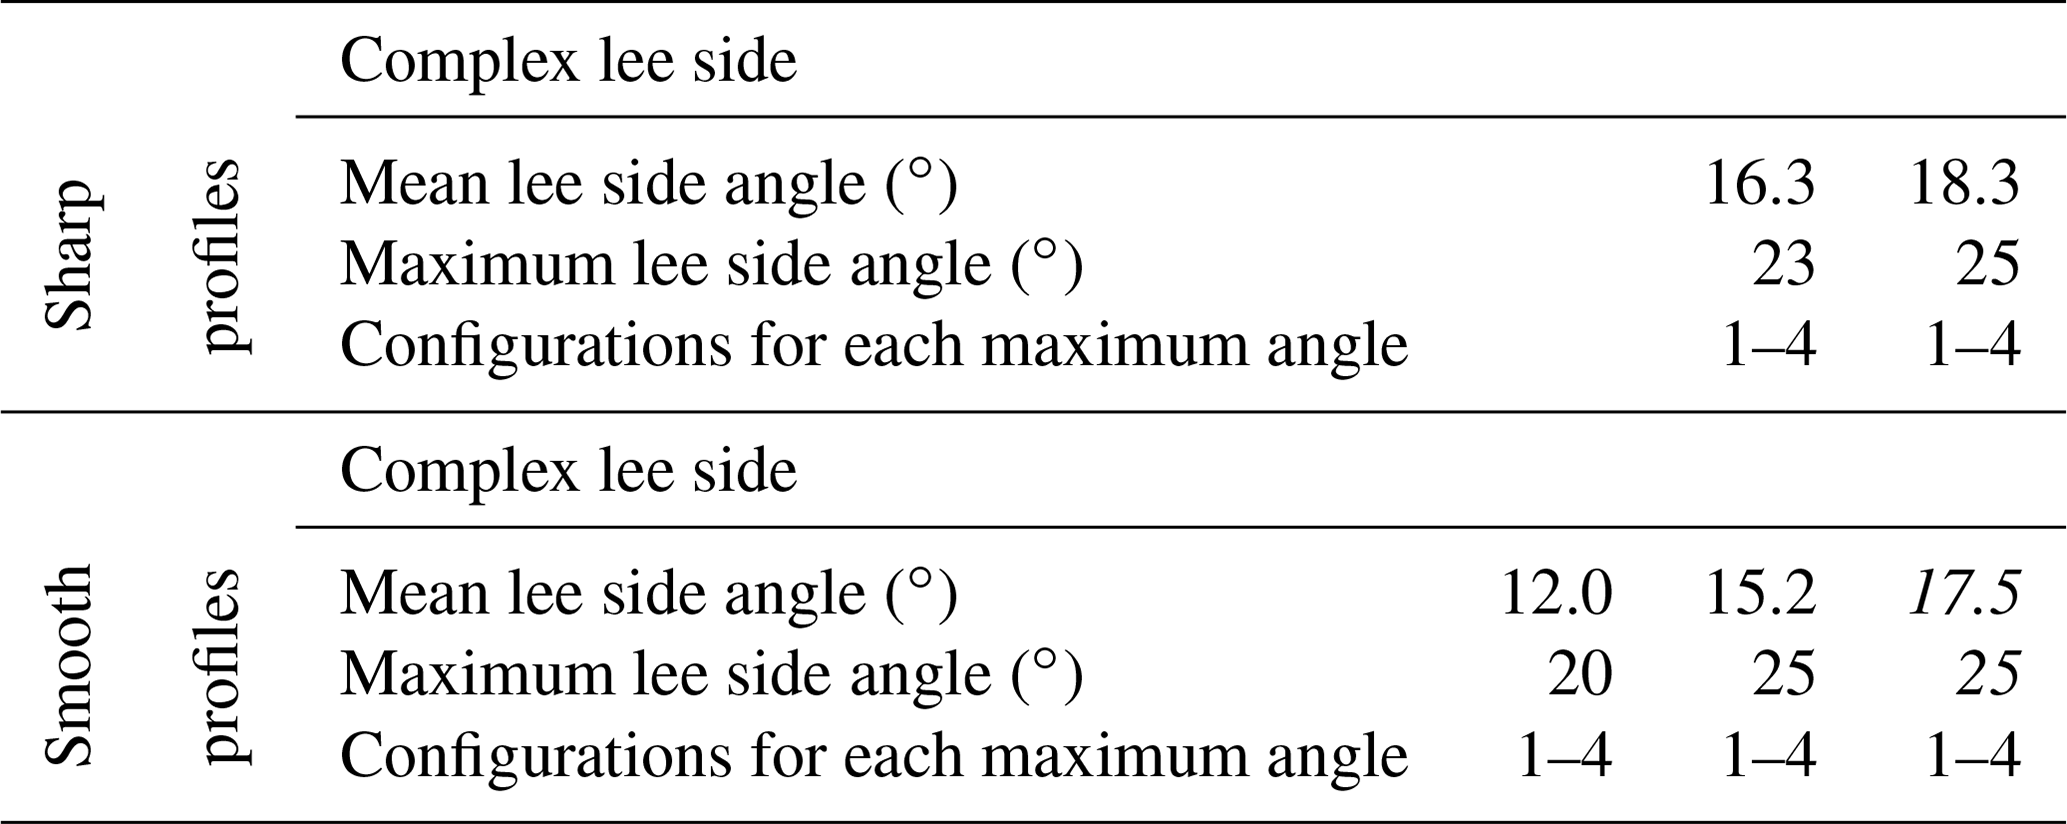
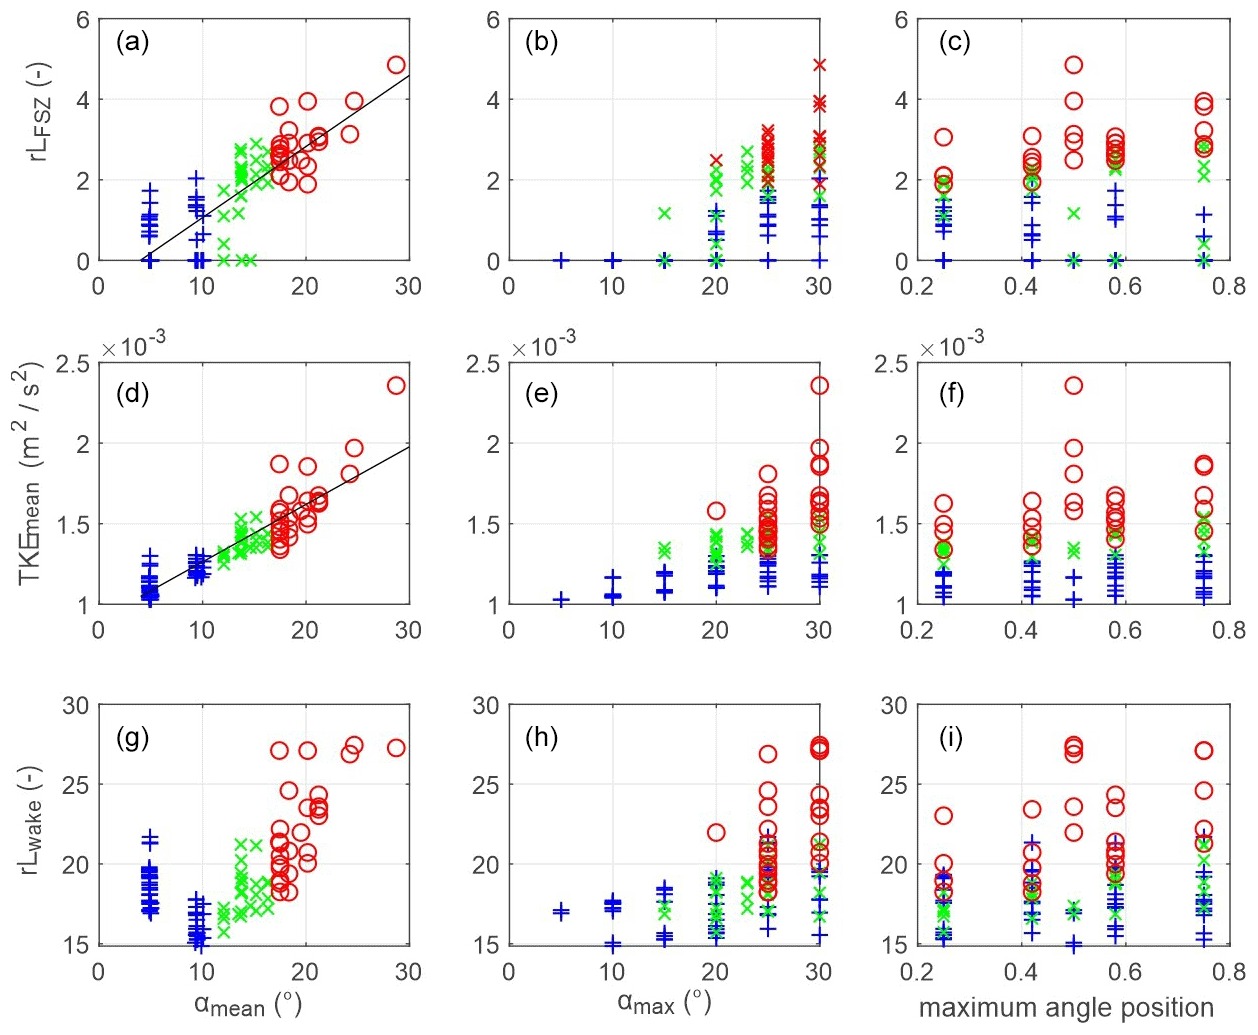
Figure A4Relative flow separation length (rLFSZ), mean turbulent kinetic energy (TKEmean) and relative length of the turbulent wake (rLwake) as a function of mean lee side angle (αmean) (a, d, g), maximum lee side angle (αmax) (b, e, h) and the position of the maximum lee side angle (a position of 0.5 indicates a straight lee side; c, f, i). The blue plus signs show results from dunes with mean lee side lower than 10∘, green crosses for mean lee sides between 10 and 17∘ and red circles for mean lee side > 17∘. This figure is similar to Fig. 3 in the main text, but the properties calculated from the sharp dunes are plotted in red circles and those from the smooth dunes in blue crosses in order to highlight the lack of systematic differences.
The main results will be made available at https://www.pangaea.de/ (PANGAEA, 2023).
AL and JC conceptualised the study and planned the experiments. AL performed and analysed the numerical simulations. Experimental results were discussed by AL and JC. The original draft was prepared by AL and commented on by JC. Further writing, review and editing were done by AL and JC.
The contact author has declared that neither of the authors has any competing interests.
Any opinions, findings and conclusions or recommendations expressed in this material are those of the author(s) and do not necessarily reflect the views of the National Science Foundation.
Publisher's note: Copernicus Publications remains neutral with regard to jurisdictional claims in published maps and institutional affiliations.
The authors are very grateful for the comments from two reviewers and the editor Andreas Baas. Furthermore, the authors appreciate the open review style of Earth Surface Dynamics.
Alice Lefebvre has been funded through the Cluster of Excellence “The Ocean Floor – Earth's Uncharted Interface”. Julia Cisneros has been supported by the National Science Foundation (grant no. 1952844).
The article processing charges for this open-access publication were covered by the University of Bremen.
This paper was edited by Andreas Baas and reviewed by two anonymous referees.
Allen, J. R. L.: Current Ripples. Their Relation to Patterns of Water and Sediment Motion, Amsterdam, North-Holland Publishing Company, 433 pp., https://doi.org/10.1017/S001675680005946X, 1968.
Bennett, S. J. and Best, J. L.: Mean flow and turbulence structure over fixed, two-dimensional dunes: implications for sediment transport and bedform stability, Sedimentology, 42, 491–513, https://doi.org/10.1111/j.1365-3091.1995.tb00386.x, 1995.
Best, J.: The fluid dynamics of river dunes: A review and some future research directions, J. Geophys. Res., 110, F04S02, https://doi.org/10.1029/2004JF000218, 2005.
Best, J. and Kostaschuk, R.: An experimental study of turbulent flow over a low-angle dune, J. Geophys. Res., 107, 3135, https://doi.org/10.1029/2000JC000294, 2002.
Bradley, R. W. and Venditti, J. G.: Reevaluating dune scaling relations, Earth-Sci. Rev., 165, 356–376, https://doi.org/10.1016/j.earscirev.2016.11.004, 2017.
Bradley, R. W., Venditti, J. G., Kostaschuk, R., Church, M. A., Hendershot, M., and Allison, M. A.: Flow and sediment suspension events over low-angle dunes: Fraser Estuary, Canada, J. Geophys. Res., 118, 1693–1709, https://doi.org/10.1002/jgrf.20118, 2013.
Cassol, W. N., Daniel, S., and Guilbert, É.: An Approach for the Automatic Characterization of Underwater Dunes in Fluviomarine Context, Geosciences, 12, 89, https://doi.org/10.3390/geosciences12020089, 2022.
Cisneros, J., Best, J., van Dijk, T., de Almeida, R. P., Amsler, M., Boldt, J., Freitas, B., Galeazzi, C., Huizinga, R., Ianniruberto, M., Ma, H. B., Nittrouer, J. A., Oberg, K., Orfeo, O., Parsons, D., Szupiany, R., Wang, P., and Zhang, Y. F.: Dunes in the world's big rivers are characterized by low-angle lee-side slopes and a complex shape, Nat. Geosci., 13, 156–162, https://doi.org/10.1038/s41561-019-0511-7, 2020.
Dalrymple, R. W. and Rhodes, R. N.: Chapter 13 Estuarine Dunes and Bars, in: Dev. Sedimentol., edited by: Perillo, G. M. E., Elsevier, 359–422, ISBN 0070-4571, 1995.
Damen, J. M., van Dijk, A. G. P., and Hulscher, S. J. M. H.: Replication Data for: Spatially varying environmental properties controlling observed sand wave morphology, Part 1, Version 1, 4TU.ResearchData [data set], https://doi.org/10.4121/uuid:0d7e016d-2182-46ea-bc19-cdfda5c20308, 2018.
de Lange, S. I., Naqshband, S., and Hoitink, A. J. F.: Quantifying Hydraulic Roughness From Field Data: Can Dune Morphology Tell the Whole Story?, Water Resour. Res., 57, e2021WR030329, https://doi.org/10.1029/2021WR030329, 2021.
Deltares: User Manual Delft3D-FLOW, Deltares, Delft, the Netherlands, https://oss.deltares.nl/web/delft3d/manuals (last access: 23 June 2023), 2014.
Franzetti, M., Le Roy, P., Delacourt, C., Garlan, T., Cancouët, R., Sukhovich, A., and Deschamps, A.: Giant dune morphologies and dynamics in a deep continental shelf environment: Example of the banc du four (Western Brittany, France), Mar. Geol., 346, 17–30, https://doi.org/10.1016/j.margeo.2013.07.014, 2013.
Galeazzi, C. P., Almeida, R. P., Mazoca, C. E. M., Best, J. L., Freitas, B. T., Ianniruberto, M., Cisneros, J., and Tamura, L. N.: The significance of superimposed dunes in the Amazon River: Implications for how large rivers are identified in the rock record, Sedimentology, 65, 2388–2403, https://doi.org/10.1111/sed.12471, 2018.
Hardy, R. J., Best, J. L., Marjoribanks, T. I., Parsons, D. R., and Ashworth, P. J.: The influence of three-dimensional topography on turbulent flow structures over dunes in unidirectional flows, J. Geophys. Res.-Earth, 126, e2021JF006121, https://doi.org/10.1029/2021jf006121, 2021.
Herrling, G., Becker, M., Lefebvre, A., Zorndt, A., Kramer, K., and Winter, C.: The effect of asymmetric dune roughness on tidal asymmetry in the Weser estuary, Earth Surf. Proc. Land., 46, 2211– 2228., https://doi.org/10.1002/esp.5170, 2021.
Kleinhans, M. G.: Sorting in grain flows at the lee side of dunes, Earth-Sci. Rev., 65, 75–102, https://doi.org/10.1016/S0012-8252(03)00081-3, 2004.
Kostaschuk, R. and Villard, P.: Flow and sediment transport over large subaqueous dunes: Fraser River, Canada, Sedimentology, 43, 849–863, https://doi.org/10.1111/j.1365-3091.1996.tb01506.x, 1996.
Kostaschuk, R. A. and Venditti, J. G.: Why do large, deep rivers have low-angle dune beds?, Geology, 47, 919–922, https://doi.org/10.1130/g46460.1, 2019.
Kwoll, E., Venditti, J. G., Bradley, R. W., and Winter, C.: Flow structure and resistance over subaquaeous high- and low-angle dunes, J. Geophys. Res.-Earth, 121, 545–564, https://doi.org/10.1002/2015JF003637, 2016.
Lebrec, U., Riera, R., Paumard, V., O'Leary, M. J., and Lang, S. C.: Automatic Mapping and Characterisation of Linear Depositional Bedforms: Theory and Application Using Bathymetry from the North West Shelf of Australia, Remote Sens., 14, 280, https://doi.org/10.3390/rs14020280, 2022.
Lefebvre, A.: Three-Dimensional Flow Above River Bedforms: Insights From Numerical Modeling of a Natural Dune Field (Río Paraná, Argentina), J. Geophys. Res.-Earth, 124, 2241–2264, https://doi.org/10.1029/2018jf004928, 2019.
Lefebvre, A. and Winter, C.: Predicting bed form roughness: the influence of lee side angle, Geo-Mar. Lett., 36, 121–133, https://doi.org/10.1007/s00367-016-0436-8, 2016.
Lefebvre, A., Paarlberg, A. J., and Winter, C.: Flow separation and shear stress over angle of repose bedforms: a numerical investigation, Water Resour. Res., 50, 986–1005, https://doi.org/10.1002/2013WR014587, 2014a.
Lefebvre, A., Paarlberg, A. J., Ernstsen, V. B., and Winter, C.: Flow separation and roughness lengths over large bedforms in a tidal environment: a numerical investigation, Cont. Shelf Res., 91, 57–69, https://doi.org/10.1016/j.csr.2014.09.001, 2014b.
Lefebvre, A., Paarlberg, A. J., and Winter, C.: Characterising natural bedform morphology and its influence on flow, Geo-Mar. Lett., 36, 379–393, https://doi.org/10.1007/s00367-016-0455-5, 2016.
Lefebvre, A., Herrling, G., Becker, M., Zorndt, A., Krämer, K., and Winter, C.: Morphology of estuarine bedforms, Weser Estuary, Germany, Earth Surf. Proc. Land., 47, 242–256, https://doi.org/10.1002/esp.5243, 2021.
Maddux, T. B., Nelson, J. M., and McLean, S. R.: Turbulent flow over three-dimensional dunes: 1. Free surface and flow response, J. Geophys. Res.-Earth, 108, 6009, https://doi.org/10.1029/2003JF000017, 2003.
McLean, S. R., Nelson, J. M., and Wolfe, S. R.: Turbulence structure over two-dimensional bed forms: Implications for sediment transport, J. Geophys. Res., 99, 12729–12747, https://doi.org/10.1029/94JC00571, 1994.
McLean, S. R., Wolfe, S. R., and Nelson, J. M.: Spatially averaged flow over a wavy boundary revisited, J. Geophys. Res., 104, 15743–15753, https://doi.org/10.1029/1999JC900116, 1999.
Naqshband, S., Ribberink, J., and Hulscher, S.: Using both free surface effect and sediment transport mode parameters in defining the morphology of river dunes and their evolution to upper stage plane beds, J. Hydraul. Eng., 140, 06014010, https://doi.org/10.1061/(ASCE)HY.1943-7900.0000873, 2014a.
Naqshband, S., Ribberink, J. S., Hurther, D., and Hulscher, S. J. M. H.: Bed load and suspended load contributions to migrating sand dunes in equilibrium, J. Geophys. Res., 119, 1043–1063, https://doi.org/10.1002/2013JF003043, 2014b.
Naqshband, S., Wullems, B., de Ruijsscher, T., and Hoitink, T.: Experimental investigation of low-angle dune morphodynamics, E3S Web Conf., 40, 02056, https://doi.org/10.1051/e3sconf/20184002056 2018.
Nelson, J. M., McLean, S. R., and Wolfe, S. R.: Mean flow and turbulence fields over two-dimensional bed forms, Water Resour. Res., 29, 3935–3953, https://doi.org/10.1029/93WR01932, 1993. PANGAEA: https://www.pangaea.de/, last access: 30 June 2023.
Platzek, F. W., Stelling, G. S., Jankowski, J. A., and Pietrzak, J. D.: Accurate vertical profiles of turbulent flow in z-layer models, Water Resour. Res., 50, 2191–2211, https://doi.org/10.1002/2013WR014411, 2014.
Prokocki, E. W., Best, J. L., Perillo, M. M., Ashworth, P. J., Parsons, D. R., Sambrook Smith, G. H., Nicholas, A. P., and Simpson, C. J.: The morphology of fluvial-tidal dunes: Lower Columbia River, Oregon/Washington, USA, Earth Surf. Proc. Land., 47, 2079–2106, https://doi.org/10.1002/esp.5364, 2022.
Roden, J. E.: The sedimentology and dynamics of mega-dunes, Jamuna River, Bangladesh, PhD thesis, Department of Earth Sciences, University of Leeds, Leeds, UK, 310 pp., https://etheses.whiterose.ac.uk/1537/ (last access: 23 June 2023), 1998.
Shugar, D. H., Kostaschuk, R., Best, J. L., Parsons, D. R., Lane, S. N., Orfeo, O., and Hardy, R. J.: On the relationship between flow and suspended sediment transport over the crest of a sand dune, Río Paraná, Argentina, Sedimentol. Rev., 57, 252–272, https://doi.org/10.1111/j.1365-3091.2009.01110.x, 2010.
Soulsby, R. L.: Dynamics of marine sands: a manual for practical applications, Thomas Telford, London, 249 pp., ISBN 9780727739551, 0727739557, 1997.
Uittenbogaard, R., van Kester, J., and Stelling, G.: Implementation of three turbulence models in 3D-TRISULA for rectangular grids, Tech. Rep. Z81, WL|Delft Hydraulics, Delft, the Netherlands, 1992.
Unsworth, C. A., Parsons, D. R., Hardy, R. J., Reesink, A. J. H., Best, J. L., Ashworth, P. J., and Keevil, G. M.: The Impact of Nonequilibrium Flow on the Structure of Turbulence Over River Dunes, Water Resour. Res., 54, 6566–6584, https://doi.org/10.1029/2017WR021377, 2018.
Unsworth, C. A., Nicholas, A. P., Ashworth, P. J., Best, J. L., Lane, S. N., Parsons, D. R., Sambrook Smith, G. H., Simpson, C. J., and Strick, R. J. P.: Influence of Dunes on Channel-Scale Flow and Sediment Transport in a Sand Bed Braided River, J. Geophys. Res.-Earth, 125, e2020JF005571, https://doi.org/10.1029/2020JF005571, 2020.
Van der Mark, C. F., Blom, A., and Hulsher, S. J. M. H.: Quantification of variability in bedform geometry, J. Geophys. Res., 113, F03020, https://doi.org/10.1029/2007JF000940, 2008.
Van Landeghem, K. J. J., Wheeler, A. J., Mitchell, N. C., and Sutton, G.: Variations in sediment wave dimensions across the tidally dominated Irish Sea, NW Europe, Mar. Geol., 263, 108–119, https://doi.org/10.1016/j.margeo.2009.04.003, 2009.
Venditti, J. G.: Turbulent flow and drag over fixed two- and three-dimensional dunes, J. Geophys. Res., 112, F04008, https://doi.org/10.1029/2006JF000650, 2007.
Wiberg, P. L. and Nelson, J. M.: Unidirectional flow over asymmetric and symmetric ripples, J. Geophys. Res.-Oceans, 97, 12745–12761, https://doi.org/10.1029/92JC01228, 1992.
Zhang, H., Ma, X., Zhuang, L., and Yan, J.: Sand waves near the shelf break of the northern South China Sea: morphology and recent mobility, Geo-Mar. Lett., 39, 19–36, https://doi.org/10.1007/s00367-018-0557-3, 2019.
Zomer, J. Y., Naqshband, S., Vermeulen, B., and Hoitink, A. J. F.: Rapidly Migrating Secondary Bedforms Can Persist on the Lee of Slowly Migrating Primary River Dunes, J. Geophys. Res.-Earth, 126, e2020JF005918, https://doi.org/10.1029/2020JF005918, 2021.