the Creative Commons Attribution 4.0 License.
the Creative Commons Attribution 4.0 License.
 | 19 Sep 2023
Estimating surface water availability in high mountain rock slopes using a numerical energy balance model
Matan Ben-Asher
Florence Magnin
Sebastian Westermann
Josué Bock
Emmanuel Malet
Johan Berthet
Ludovic Ravanel
Philip Deline
Water takes part in most physical processes that shape mountainous periglacial landscapes and initiation of mass-wasting processes. An observed increase in rockfall activity in high mountain regions was previously linked to permafrost degradation, and water that infiltrates into rock fractures is one of the likely drivers of processes related to thawing and destabilization. However, there is very little knowledge of the quantity and timing of water availability for infiltration into steep rock slopes. This knowledge gap originates from the complex meteorological, hydrological, and thermal processes that control snowmelt, as well as challenging access and data acquisition in extreme alpine environments. Here we use field measurements and numerical modeling to simulate the energy balance and hydrological fluxes on a steep high-elevation permafrost-affected rock slope at Aiguille du Midi (3842 m a.s.l, France), in the Mont Blanc massif. Our results provide new information about water balance at the surface of steep rock slopes. Model results suggest that only ∼ 25 % of the snowfall accumulates in our study site; the remaining ∼ 75 % is likely transported downslope by wind and gravity. The snowpack thickness was found to decrease with surface slopes between 40 and 70∘. We found that among all water fluxes, sublimation is the main process of snowpack mass loss at our study site. Snowmelt occurs between spring and late summer, but most of it may not reach the rock surface due to refreezing and the formation of an impermeable ice layer at the base of the snowpack, which was observed at the field site. The annual snowmelt that is available for infiltration (i.e., effective snowmelt) is highly variable in the simulated years 1959–2021, and its onset occurs mostly between May and August and ends before October. By applying the model to a range of altitudes, we show that effective snowmelt is the main source of water for infiltration above 3600 m a.s.l.; below, direct rainfall on the snow-free surface is the dominant source. This change from snowmelt- to rainfall-dominated water input leads to an abrupt, nonlinear increase in water availability at altitudes below 3600 m a.s.l and may point to higher sensitivity of permafrost-affected rock slopes to climate change at these altitudes.
- Article
(10005 KB) - Full-text XML
-
Supplement
(1586 KB) - BibTeX
- EndNote


Water plays a key role in the thermal and mechanical processes in mountainous periglacial landscapes and influences the stability of steep rock slopes in several ways (French, 2017). In deep fractures, the accumulation of water can lead to a hydrostatic head high enough to exert critical pressure and initiation of failure (Fischer et al., 2010). Water that refreezes in saturated fractures can also build up critical cryostatic pressure (Matsuoka, 2008; Draebing and Krautblatter, 2019). Infiltrating surface water can efficiently transport heat by advection into rock fractures and lead to thicker and earlier development of the active layer (i.e., the depth of seasonal thawing) in permafrost-affected ground compared to pure heat conduction (Hasler et al., 2011; Magnin and Josnin, 2021; Gruber and Haeberli, 2007). The warming of permafrost-affected rocks can then decrease the rock's uniaxial and tensile strength (Krautblatter et al., 2013; Dwivedi et al., 1998; Li et al., 2003; Mellor, 1973) and reduce friction along joints and ice-bonded discontinuities (Haeberli et al., 2010; Mamot et al., 2018, 2020). Over geological timescales water is a catalyst of mechanical rock weathering processes related to subcritical cracking (Eppes and Keanini, 2017). However, despite the existing knowledge and ongoing research on water-related mechanical processes in mountainous periglacial landscapes, little knowledge exists on the quantity and timing of water availability in these environments. This knowledge is becoming even more imperative with the fast warming of high permafrost-affected mountain regions (Haeberli and Gruber, 2009) and the growing evidence for a related increase in rockfall occurrence (Gruber et al., 2004; Allen et al., 2009; Ravanel and Deline, 2011; Huggel et al., 2012; Ravanel and Deline, 2013; Ravanel et al., 2017).
This study aims to decipher the availability of surface water for surface and hydrological processes in permafrost-affected rock slopes. To do so, we use a numerical energy balance model coupled with a state-of-the-art snowpack scheme, forced by field measurements and reanalysis of meteorological datasets, to simulate hydrological and thermal processes at the surface and quantify the flux of excess water that is available for infiltration.
Much of the precipitation in high mountain water occurs as snow, and snowmelt is a major source of water. However, we lack a robust understanding of its rates and timing. A significant portion of the snow that falls on steep slopes does not accumulate due to redistribution by wind and transport by gravity (Sokratov and Sato, 2001; Mott et al., 2010), and snowfall measurement techniques commonly introduce large errors, especially in windy conditions (Rasmussen et al., 2012). We thus differentiate between rates of snow accumulation and snowfall. Previous studies suggested that snow accumulation on steep rock slopes is inversely proportional to the slope angle and that above a certain slope angle, snow does not accumulate (Blöschl et al., 1991; Winstral et al., 2002; Gruber Schmid and Sardemann, 2003; Haberkorn et al., 2015; Sommer et al., 2015). Existing estimations of the threshold angle for snow accumulation range between 45 and 80∘. This wide range is likely due to differences in local climatic and topographic conditions in different study areas (Phillips et al., 2017) and perhaps also the resolution of the topographic data used in the analysis (Blöschl et al., 1991; Haberkorn et al., 2017). In this study, we use a site-specific analysis of snow depth distribution from a repeated high-resolution survey of our study site using drone-based photogrammetry. This information is essential to accurately estimate the snow water equivalent amount at the rock slope surface. Moreover, quantifying water equivalent snowmelt is not enough to evaluate infiltration potential since the actual flux that is available for infiltration is also controlled by the hydrological properties of the snowpack and the rock itself. Snowmelt that percolates to the base of the snowpack can refreeze to form an impermeable basal ice layer at the interface between the snow cover and the rock surface when the rock surface is cold enough to dissipate the latent heat of freezing (Woo and Heron, 1981; Woo et al., 1982; Marsh, 2005; Fierz et al., 2009) (Supplement Fig. S1). This ice crust phenomenon was described by Phillips et al. (2016) on an alpine permafrost-affected rock ridge, where they used borehole temperature data to demonstrate how a basal ice layer, which they observed in monitored snow pits, limits the infiltration of spring snowmelt. To differentiate from the net snowmelt, we use the term “effective snowmelt” to refer to excess water that exceeds the field capacity of the snow and occurs when the base of the snowpack is permeable and enables infiltration to the rock surface (i.e., when no ice crust exists).
The Mont Blanc massif covers approximately 550 km2 across France, Italy, and Switzerland (Fig. 1). It is predominantly composed of crystalline rocks with a Hercynian granitic batholith dated at 304±3 Ma intruded in a metamorphic (mostly gneisses and mafic schists) basement dated at 453±3 Ma (Bussy and Von Raumer, 1994; Leloup et al., 2005). Shear zones and faults networks, mainly striking 0∘ N to 25∘ E and 45∘ N to 60∘ E (Rossi et al., 2005), outline the main peaks, spurs, and couloirs with their subvertical dipping characterized by a fan-like arrangement across the range, being slightly inclined towards the southeast (SE) in the northwestern (NW) part of the massif and towards NW in its SE part (Bertini et al., 1985).
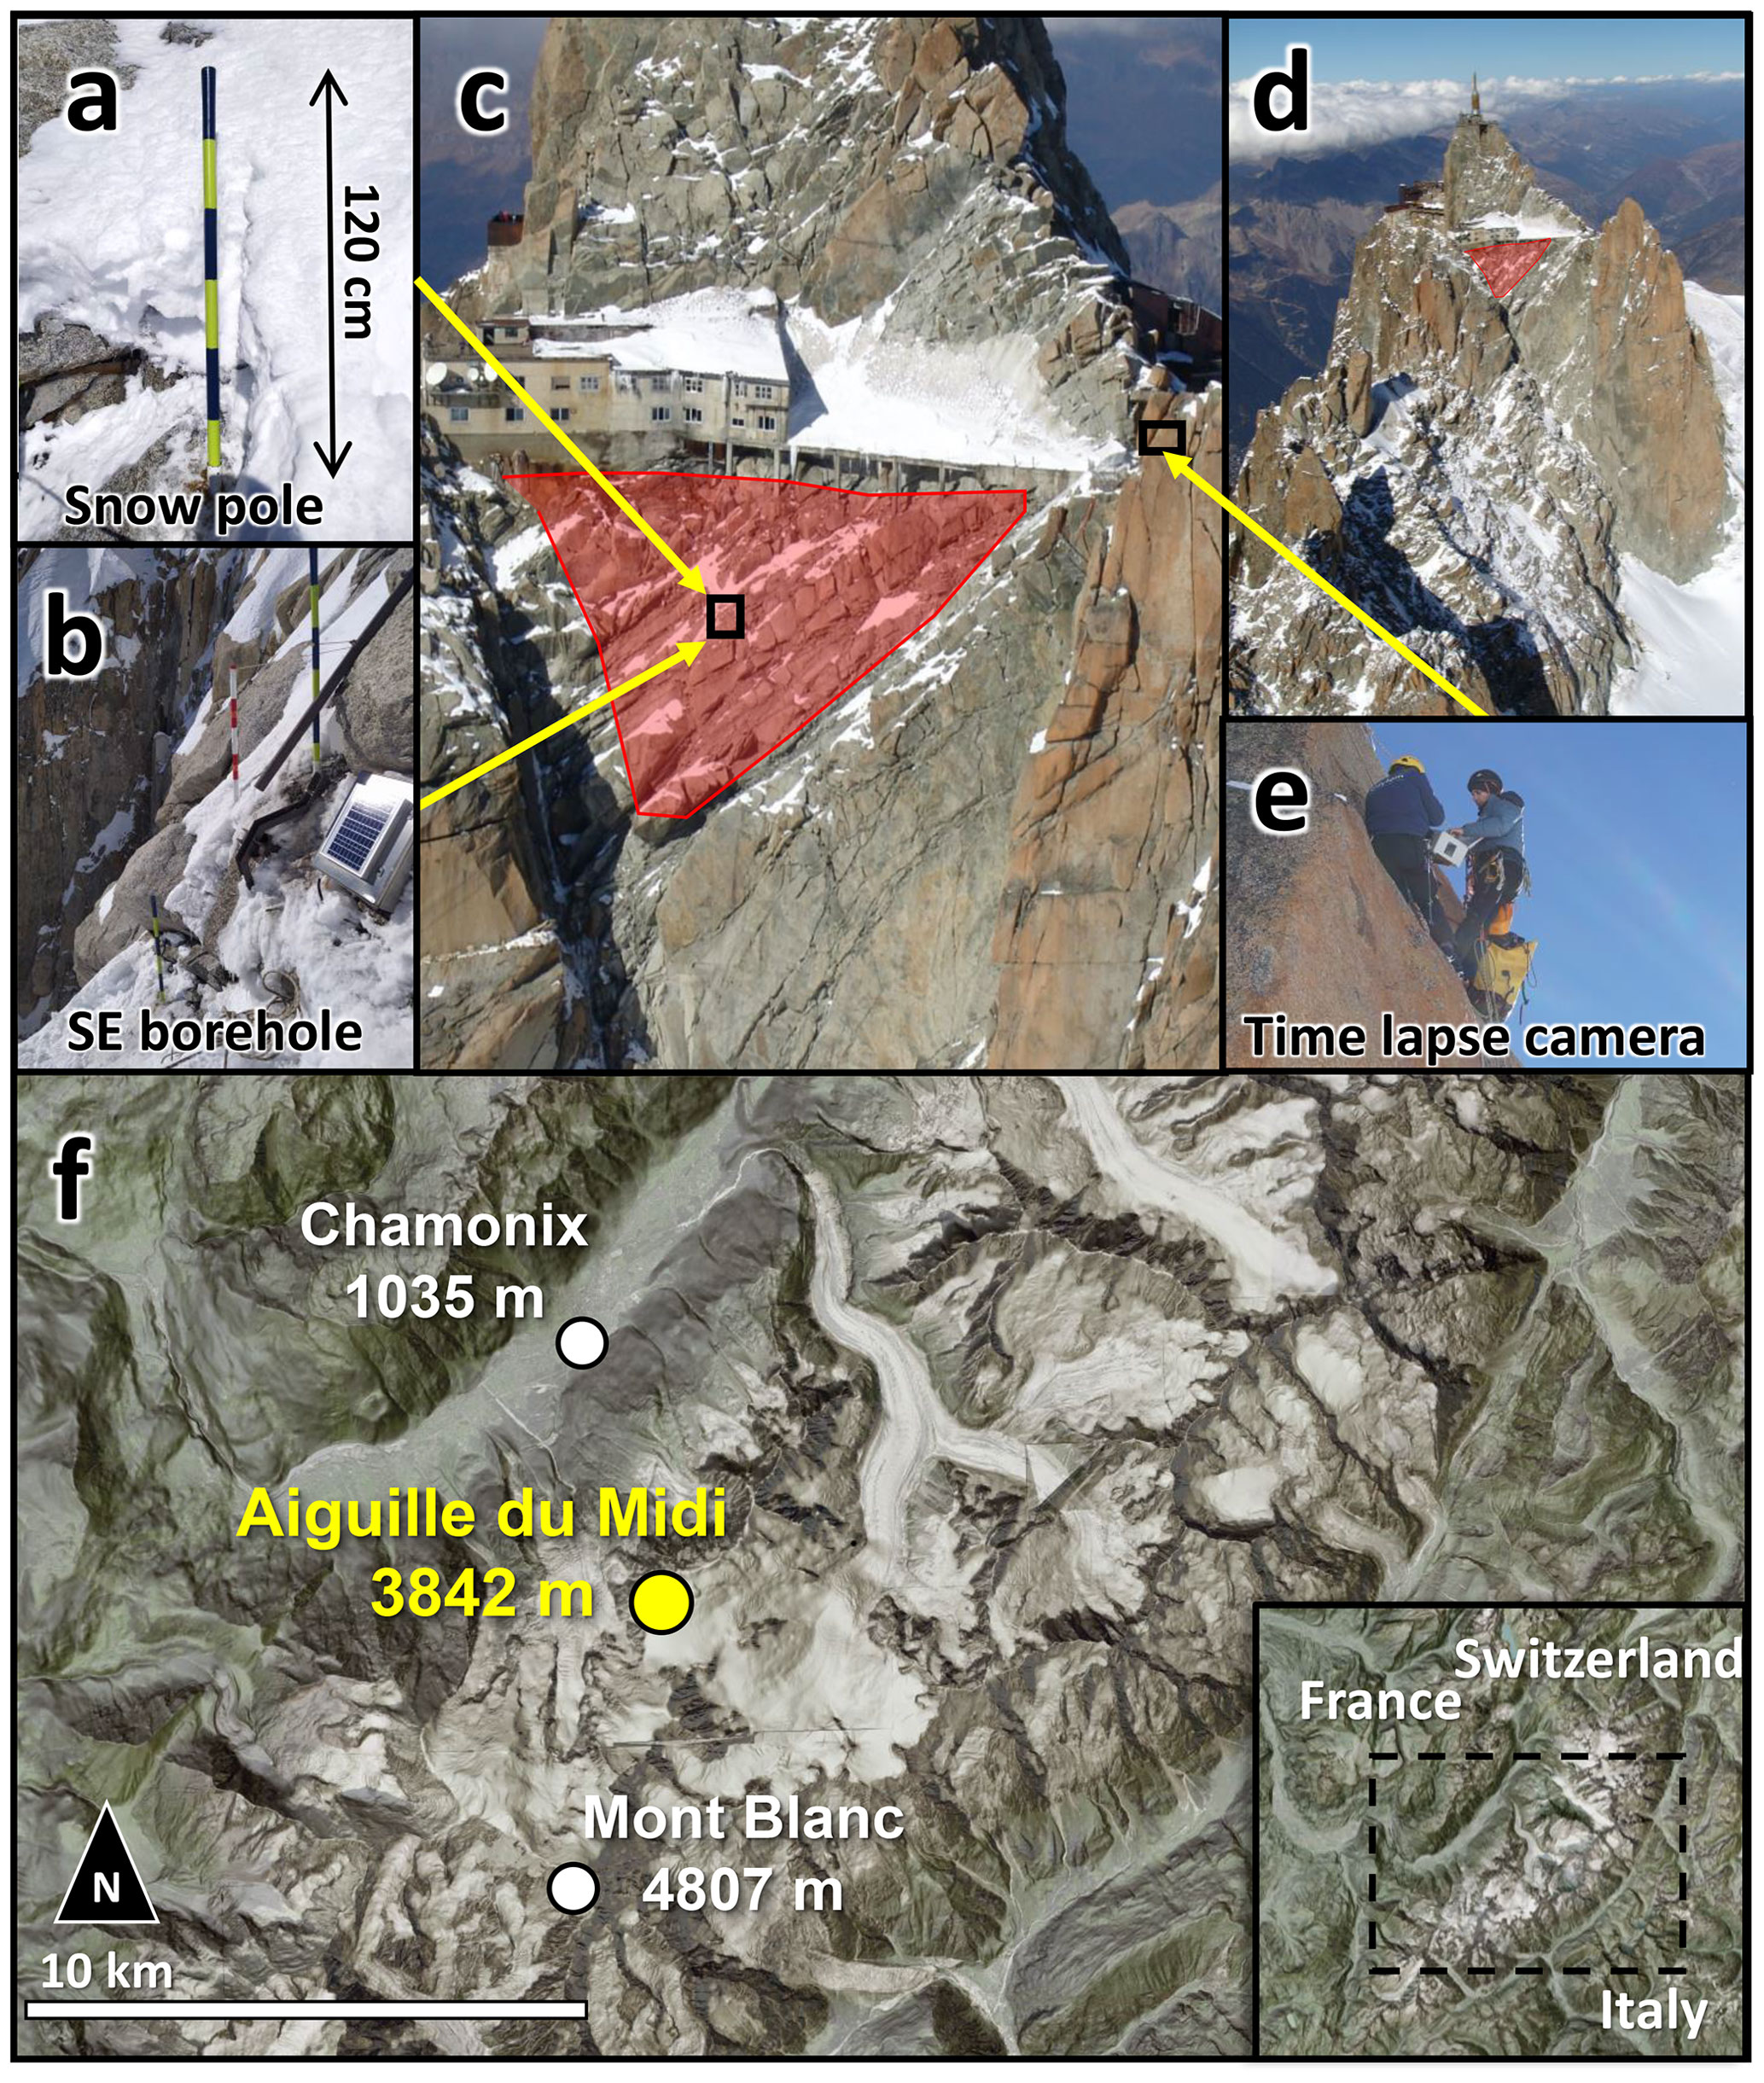
Figure 1Location map of the study site. (a) Snow accumulation measurement pole. (b) Southeastern location of the borehole with logger box and solar panel. (c–d) Study site on the SE face of Aiguille du Midi. The red polygon shows the slope area surveyed for high-resolution topography using a drone. (e) The time-lapse camera installed on the SE pillar. (f) General location in the Mont Blanc massif. Maps provided by the Federal Office of Topography, swisstopo.
The massif is one of the most glaciated in the western European Alps with about 102 km2 of glaciers in 2007–2008 (Gardent et al., 2014) extending from the Mont Blanc summit at 4808 m a.s.l. down to the toe of the Bossons glaciers at ca. 1450 m a.s.l. Numerous steep rock walls reach altitudes above 4000 m a.s.l and are strongly affected by permafrost whose lower elevation limit is found at around 2600 m a.s.l in north faces and 3200 m a.s.l in south faces (Magnin et al., 2015a). These lower limits may vary by several hundred meters, depending on the surface conditions such as fracture density and snow cover (Boeckli et al., 2012). Since the 1990s, these rock walls have been affected by an increasing number of rockfalls (Ravanel and Deline, 2011), with particularly high frequencies during hot summers, such as 2003 and 2015, occurring across a wide range of elevations from 2700 to 4000 m a.s.l. (Ravanel et al., 2017).
The Aiguille du Midi site (3842 m a.s.l.; 45.88∘ N, 6.89∘ E) is located on the northwestern side of the Mont Blanc massif (Fig. 1) in the porphyritic granite zone. Its summit consists of three steep peaks (north, central, and south). The peaks tower more than 1000 m above the Glacier des Pélerins and Glacier des Bossons, on the north and east faces, and the south face is 250 m high above the Glacier du Géant. The combination of various slope angles and surface characteristics at Aiguille du Midi makes it particularly representative of the Mont Blanc massif rock walls. A tourist cable car runs from Chamonix to the Aiguille du Midi north peak, where galleries and an elevator are carved in the rock mass, providing year-round access to an extreme and otherwise inaccessible environment. Furthermore, alongside the steep vertical rock walls, slopes with intermediate angles (50–60∘) and rugged surfaces allow the accumulation of a thick snow cover (> 0.6–0.8 m) throughout the winter, resulting in variable permafrost conditions from warm discontinuous permafrost on the SE face to vertical rock slabs affected by cold and continuous permafrost on the NW (Magnin et al., 2015b). This makes Aiguille du Midi an ideal location to study processes of high permafrost-affected mountain landscapes. The study site used for the main analysis is in a ∼ 500 m2 rock slope on the central pillar's SE face (azimuth angle 150∘) with an average slope angle of 55∘ (Fig. 1). It is located below a confined section of the touristic structure and is not frequented by skiers and alpinists. There is thus minimal influence of human activity on the natural processes of snow accumulation. The SE study site was surveyed and equipped with several monitoring systems that support the research presented in this contribution and are detailed in the Methods section, including a time-lapse camera and snow depth measurement poles to monitor temporal changes in snow accumulation (see Figs. 1, 4 and Sect. 3.2), 10 m deep boreholes with temperatures sensors (Fig. 1b), and repeated high-resolution 3D topographic surveys of the surface with minimal snow cover as well as after substantial snowfall (see Fig. 2 and Sect. 3.1). A second site on the E side of the central pillar was used to validate the results and includes a 10 m deep borehole, time-lapse camera records, and snow depth measurement poles.
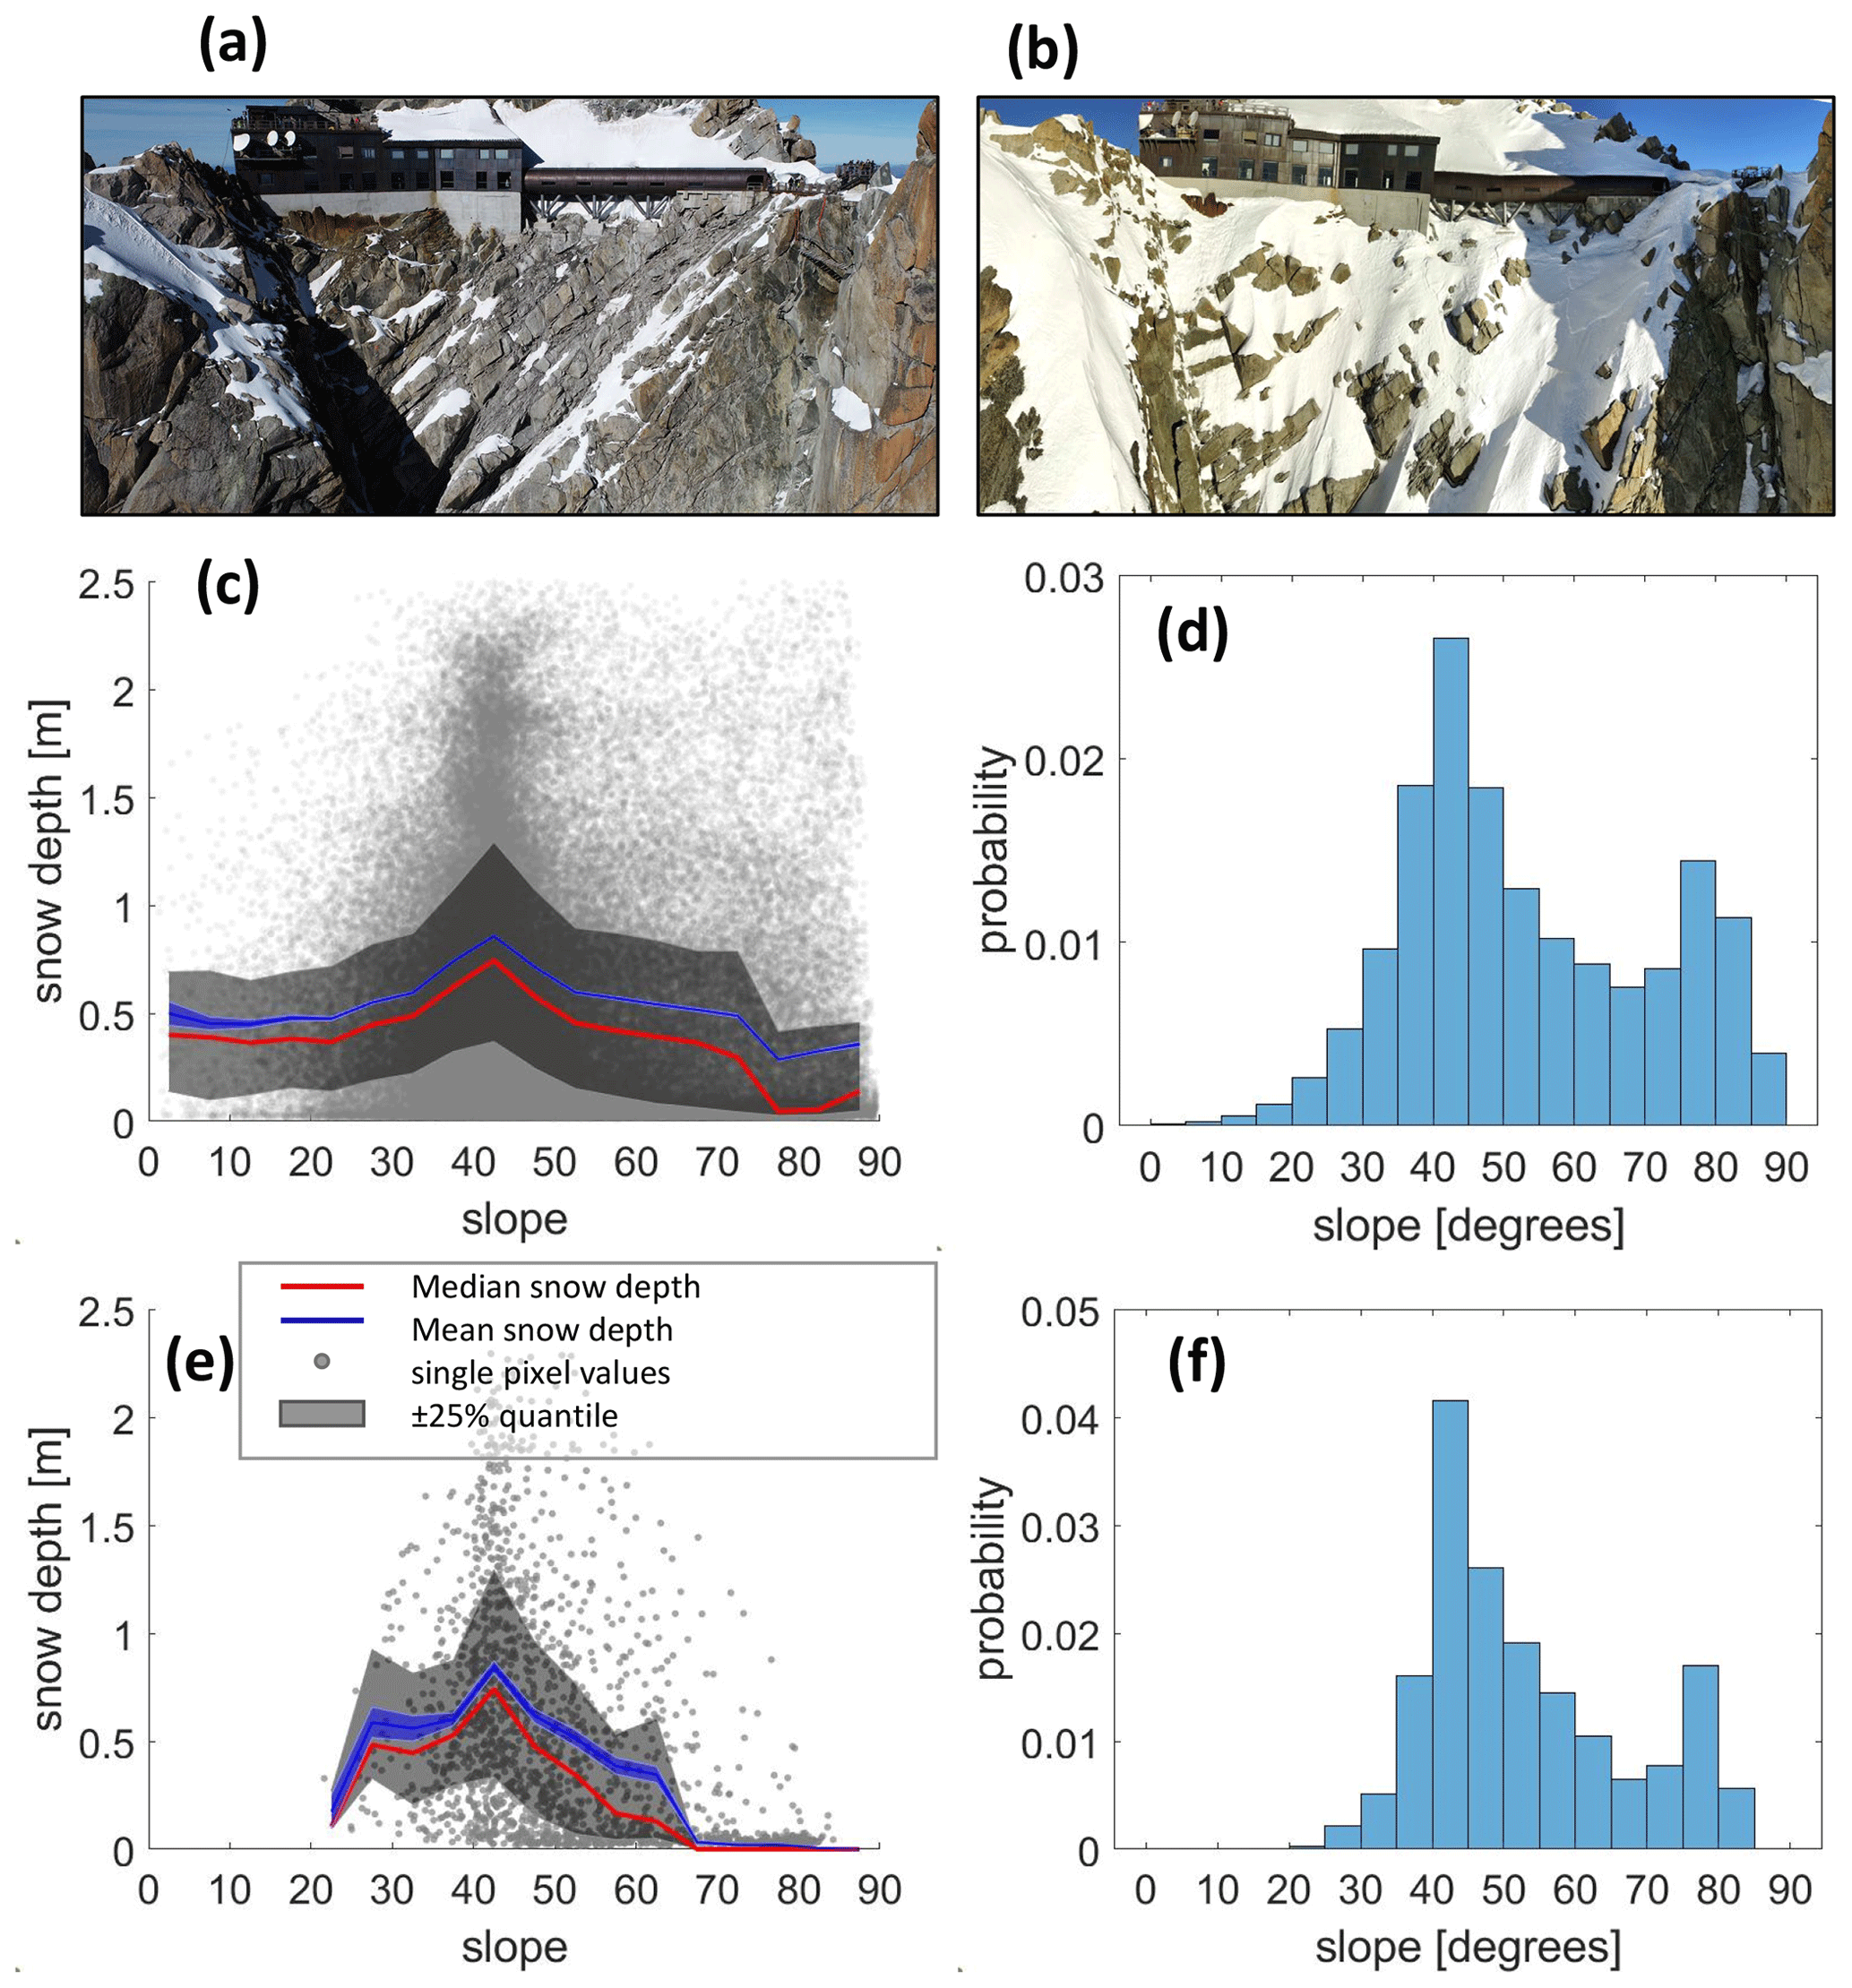
Figure 2Snow accumulation on rock walls – snow depth vs. local slope from the comparison of two 3D photogrammetric point cloud models of an area of 500 m2 on the SE slope rock surface. (a) SE face of Aiguille du Midi with minimal snow cover in October 2021. (b) SE face of Aiguille du Midi with substantial snow cover in January 2022. (c) Snow depth as a function of the local slope of the 0.1 m pixels in a high-resolution DEM. Red line is the median value of snow depth for bins of specific local slope (bin size 5∘) with ±25 % quantile range in gray. The blue line is the mean value with a range of ± standard error. (d) Distribution of local slope values. (e–f) Same as (c)–(d) after resampling the point cloud data to 1 m cell size. Note that snow depth systematically decreases from a median depth of 0.7 m (average depth 0.8 m) for a slope of 40∘ to < 0.1 m at 70∘ slope.
3.1 Snow depth – spatial distribution
Snow accumulation is simulated in our model setup and field measurements are used in the validation process. To analyze the spatial distribution of snow depth at our study site, we produced two 3D photogrammetric point cloud models of an area of ∼ 500 m2 on the SE slope rock surface: one with minimal snow cover, on 27 October 2021 and another with substantial snow cover on 17 January 2022 (Figs. 2a–b, S5). Based on our knowledge of the site (first fieldwork in 2005), we assume that the January 2022 snow cover represents conditions close to maximal accumulation. Data from an on-site time-lapse camera (see Sect. 3.2) and from a meteorological station in Chamonix show that substantial snowfall events occurred on 25 to 27 December and 5 to 7 January. We assume that the 10 d without snowfall before the survey was sufficient for preliminary redistribution and compaction processes to take effect and that further processes of mass loss from the snowpack are either by sublimation or snowmelt.
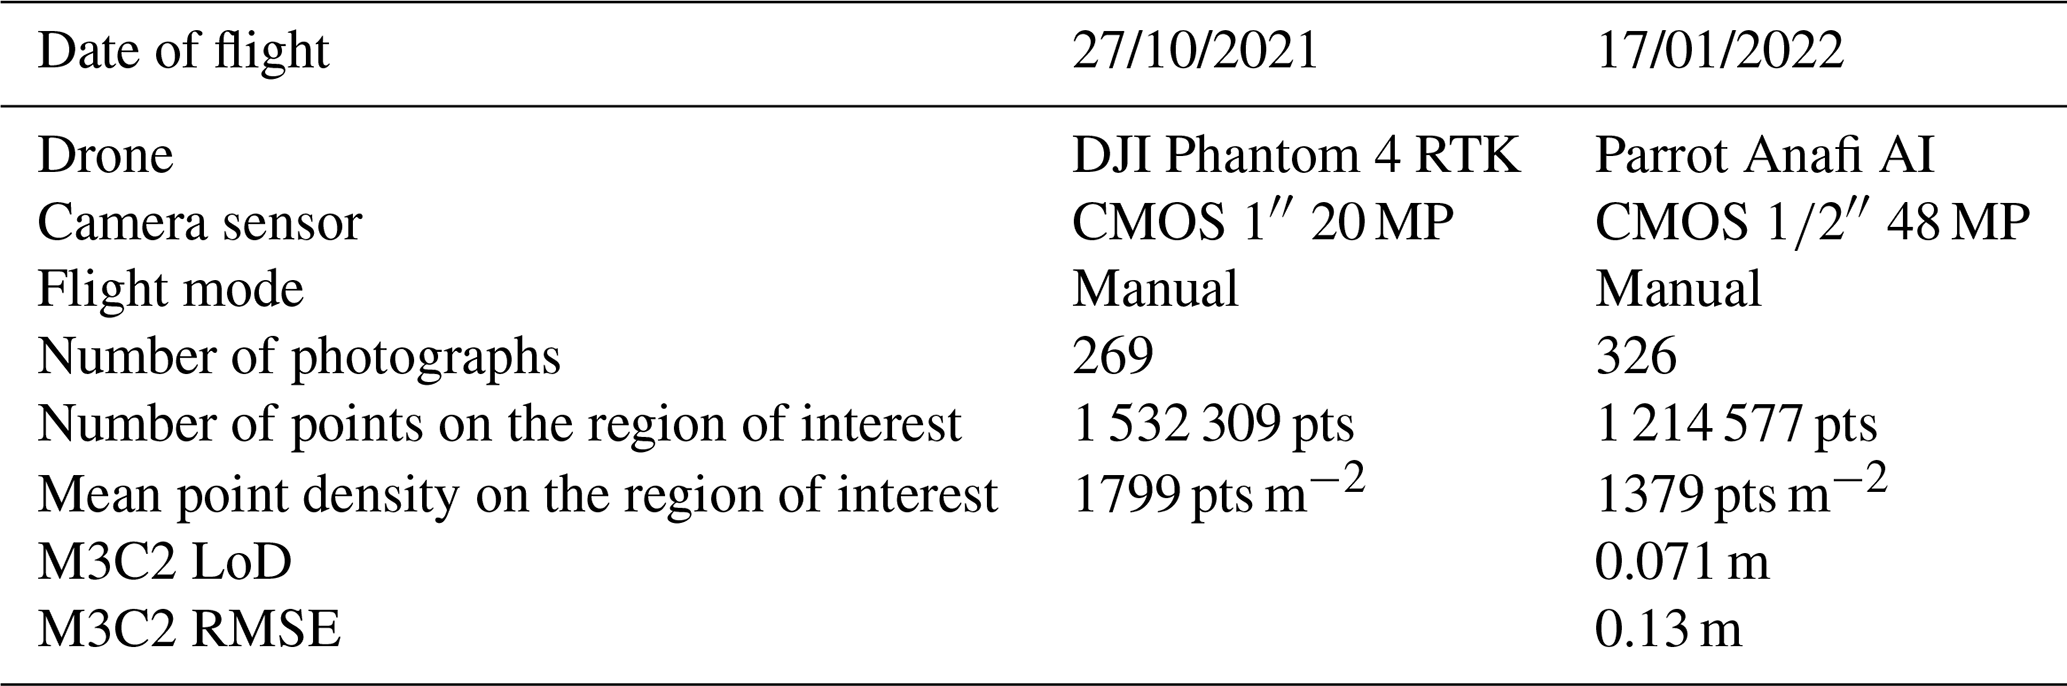
The use of high-resolution photogrammetric 3D models from drones has become a prevalent method in geomorphology, particularly in high mountain regions (e.g., Tonkin et al., 2016; Vivero and Lambiel, 2019). However, obtaining data on high mountain walls using drones can be a demanding and complex task. The challenging topography necessitates increased flight precautions. In the current study, flight was performed in manual mode at approximately 30 m from the wall to achieve a satisfactory overlap (80 % and 85 % overlap in the 2021 and 2022 campaigns, respectively) and a view angle perpendicular to the slope. Table 1 presents a summary of the characteristics of the two flights and the point clouds in the region of interest.
Field conditions on the south face of Aiguille du Midi did not allow the use of ground control points (GCPs). The use of GPS in these environments does not provide satisfactory precision due to the satellite masking effect created by the walls. It was also not possible to perform topographic measurements, and the real-time kinematic (RTK) positioning system of the drone was not functional during manual flight. Furthermore, there was no access to high-resolution 3D models (terrestrial or airborne lidar), which would have allowed for georeferencing through coregistration from pre-georeferenced point clouds. Since absolute georeferencing was not necessary, we chose to work solely using the georeferencing and exterior orientation parameters of the images measured by the GPS and IMU (inertial measurement unit) systems onboard the drones (Essel et al., 2022). Subsequently, we performed the coregistration of the second drone survey on the first using 19 GCPs identified as common distinctive points between the two models in the region of interest.
Table 1Characteristics of UAV flights, point clouds, and surface displacement uncertainties.
The uncertainty of the comparison (Table 1) was obtained through the statistical analysis of point-to-point distances between the two-point clouds, calculated using the M3C2 module of CloudCompare, on surfaces identified as stable between the two models, where the expectation of measurement is zero. The distances measured on these surfaces are therefore measurement errors. The root mean square error (RMSE) is calculated as the component of systematic errors (mean) and standard deviation (σ) by using the following formula:
The level of detection (LoD) is defined as the 95 % confidence interval of the vertical error, the standard deviation of the RMSE (Zhang et al., 2019):
The point clouds were compared by interpolating the elevation data into a 0.1 m cell-size digital elevation model (DEM). We calculated the local slope and vertical snow depth for each grid pixel (Fig. 2c–d). The angle of the rock slope surface was calculated by fitting a second-order polynomial surface to a window size of 3×3 pixels and deriving the local gradient (Zevenbergen and Thorne, 1987; Evans, 1980) from the DEM of the snowless conditions (Zevenbergen and Thorne, 1987; Evans, 1980). The main purpose of this analysis was to examine the relation between snow depth and local slope and also to compare with data from our time-lapse camera (see Sect. 3.2) to determine the maximum snow depth. We compared the 0.1 m slope–depth relation (Fig. 2c–d) with an upscaled 1 m resolution grid (Fig. 2e–f), which is the length scale of our model realizations, and found the results to be in good agreement, as shown by the comparison between slope angle distributions of the two resolutions (Fig. 2d and f).
3.2 Snow depth – temporal distribution
Time-lapse cameras with a temporal resolution of four images per day were used to monitor the height of accumulated snow using permanent measurement poles installed at our study site at Aiguille du Midi (Figs. 1a, 4). The snow depth data cover periods between 2012–2015 and 2021–2022. A total of 10 poles were installed in two areas of 20 m × 20 m each, near the boreholes on the SE face (Fig. 1) and on the east (E) face. The pole heights are 1–1.35 m and painted with colored bands of 0.1 to 0.2 m. Snow accumulation time series, with a sub-daily resolution, were then produced by visually examining the images with an estimated accuracy of ∼ 0.1 m based on the ability to read the snow depth from the images (Fig. S6). A snow depth time series of the SE face field site, based on images taken between January 2012 and July 2012 from the same camera position, was used to calibrate the model constraints on snow accumulation and loss rates and also compare with the maximum snow depth values obtained from the 3D photogrammetric point cloud models. A snow depth time series of the E face, from images taken between February 2012 and January 2015 (with gaps in data between June 2012 and March 2013), was used to validate the model.
3.3 Simulating snow evolution with a surface energy balance model
3.3.1 The CryoGrid community model
The CryoGrid community model is a toolbox for numerical simulations of the ground thermal regime and water balance (Westermann et al., 2023). Its modular structure makes it suitable for a wide range of terrestrial cryosphere settings and is mainly applied in permafrost environments (Westermann et al., 2023) using the finite-difference method to transiently simulate ground temperatures and water balance. Previous studies successfully used former CryoGrid models to simulate processes on steep rock walls and mountainous regions (Magnin et al., 2017; Myhra et al., 2017; Schmidt et al., 2021; Legay et al., 2021). We used the CryoGrid community model (version 1.0) toolbox (Westermann et al., 2023) to simulate the one-dimensional (1D) ground thermal regime and ice–water balance and to estimate the availability of surface water and its potential for infiltration in rock fractures. The ground domain, representing the rock wall, is simulated as a 1D gridded column with a depth of 100 m. Ground temperatures are calculated using diffusion and advection by vertical water flow. The lower boundary condition is provided by a constant geothermal heat flux. The upper boundary is calculated by surface energy balance using atmospheric forcing (see Sect. 3.3.2). Water balance and hydrological processes are also simulated. We used a water scheme based on the Richards equation (Richards, 1931) of unsaturated flow to simulate flow in the rock. We applied a low porosity value (1 %) to limit infiltration and conserve the full potential of excess water at the surface in each time step (i.e., the amount of water that could potentially infiltrate if a fracture exists). In addition to surface energy balance, the CryoGrid model is implemented with the state-of-the-art CROCUS snow scheme (Vionnet et al., 2012), which provides representations of snow cover dynamics and water drainage. The CROCUS scheme allows for transient representation of internal snow properties as well as processes of interaction between the atmosphere, snow, and rock (Fig. S2). Snow surface mass fluxes are also computed with the consideration of energy balance and include latent heat fluxes from evaporation and sublimation following an approach by Boone and Etchevers (2001). Water flow in the snowpack is simulated with a scheme that includes a threshold value of field capacity. At values below the threshold no flow occurs, and above it, flow is governed by gravity and the hydraulic conductivity of the snow. We consider two potential sources of water for infiltration into rock fractures: rainfall and snowmelt. Excess water was set to be produced during snowmelt and rainfall in scenarios when snow water content exceeds its saturated field capacity if snow cover exists.
3.3.2 Forcing data
Obtaining reliable and continuous long-term meteorological data from high mountain regions is challenging due to the extreme conditions that limit accessibility and damage equipment. Thanks to the accessibility of the Aiguille du Midi site, meteorological data are available from in situ meteorological stations, including a permanent station of Météo France running since 2007. However, the available meteorological datasets contain large gaps and are of limited duration. We thus compared the available measurements of air temperature at Aiguille du Midi and precipitation at the nearby station of Chamonix with data obtained from the S2M-SAFRAN meteorological reanalysis tool. We found it well fitted for our needs, with R2 values of 0.97 and 0.69 for air temperatures and precipitation, respectively (Fig. S3). The S2M-SAFRAN dataset combines output from a numerical weather prediction model and in situ observations and was originally developed for operational needs to estimate avalanche hazards in mountainous areas (Durand et al., 1993). It is available for 74 mountain areas in France, including the Mont Blanc massif, with an area of 585 km2 and 26 meteorological stations used in the reanalysis of this area. The data in each area are divided at elevation steps of 300 m, with an hourly resolution between the years 1958 and 2021 (Vernay et al., 2022). The S2M-SAFRAN dataset includes most parameters that are required for modeling with CryoGrid: relative humidity, air temperature, incoming longwave and shortwave radiation, and wind speed. To complete the forcing data, we used top-of-the-atmosphere incident solar radiation from the ERA5 global reanalysis dataset (Hersbach et al., 2020).
3.3.3 Constraining snow accumulation and model calibration
Our model setup contains uncertainties regarding unknown model parameters, which we estimated using the literature (Table 2) (Legay et al., 2021; Magnin et al., 2017) and calibration. Two of the model outputs can be compared with field measurements and were used for calibration – snow depth, which has a direct influence on water availability, and near-surface temperature, which can indirectly influence the water mass balance by controlling sublimation, evaporation, melting, and refreezing of the snow. We used a parameter called “snowfall multiplication factor”, which has a constant value between 0 and 1 that sets the fraction of snowfall, provided by the meteorological dataset, that accumulates on the surface. For example, a snowfall multiplication factor value of 0.25 means that only 25 % of the net snowfall is accumulated. Another constraint on snow accumulation used in the model is the value of maximum snow depth. It is the maximum depth above which no snow can accumulate once it is reached. The value of maximum snow depth was obtained by comparing two 3D high-resolution models of the study site in snow-free conditions and after heavy snowfall and was found to be slope-dependent (see Sects. 3.1 and 4.2). In the calibration process, we aimed to optimize two model outputs, snow depth and near-surface temperature, by comparing them with field measurements (Fig. 3b). The model was validated by simulating the E face of Aiguille du Midi using the calibrated model parameters (calibrated with data from the SE face). The location of the validation site on the E face shares many characteristics with the SE face borehole (i.e., elevation, rock type, climate) and includes the required datasets that were used in the calibration – snow depth poles, a time-lapse camera, and near-surface temperature measurement in a 10 m deep borehole. However, for technical reasons, the borehole on the E face was originally installed in a subvertical wall that does not accumulate snow. We thus compared the near-surface temperature measured at the E face with the modeled temperature with a low snowfall multiplication factor value of 0.1 (10 %) (Fig. 3d, e, f).
Table 2Physical parameters used in the model simulation.
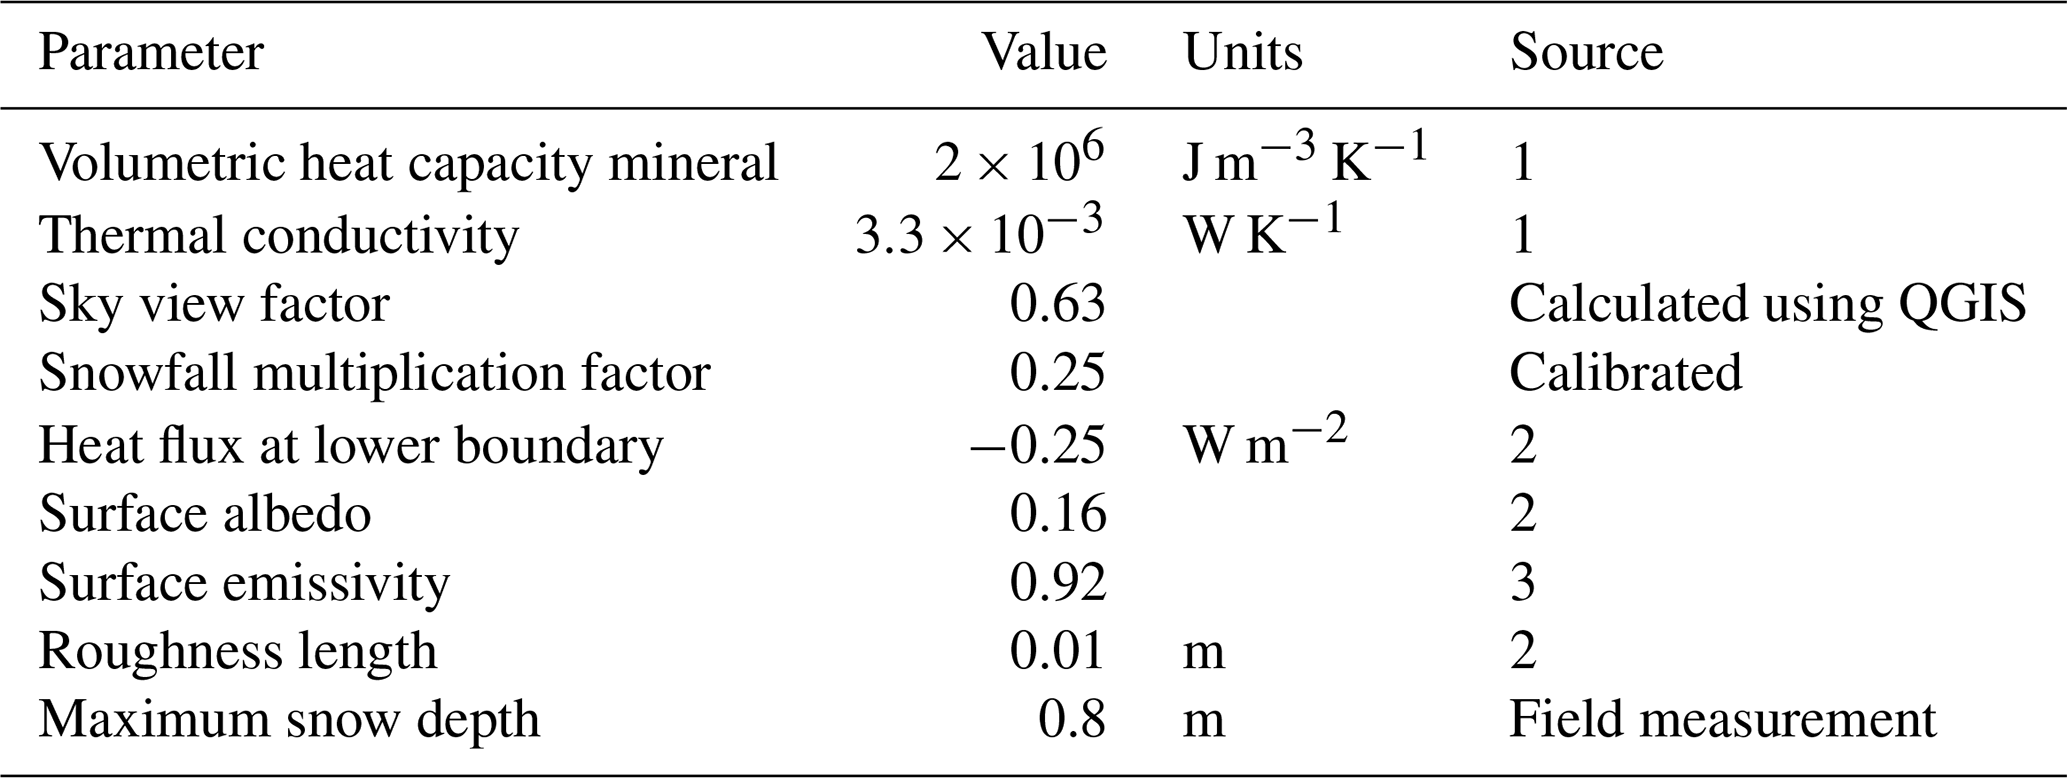
(1) Legay et al. (2021). (2) Magnin et al. (2017). (3) Mineo and Pappalardo (2021).
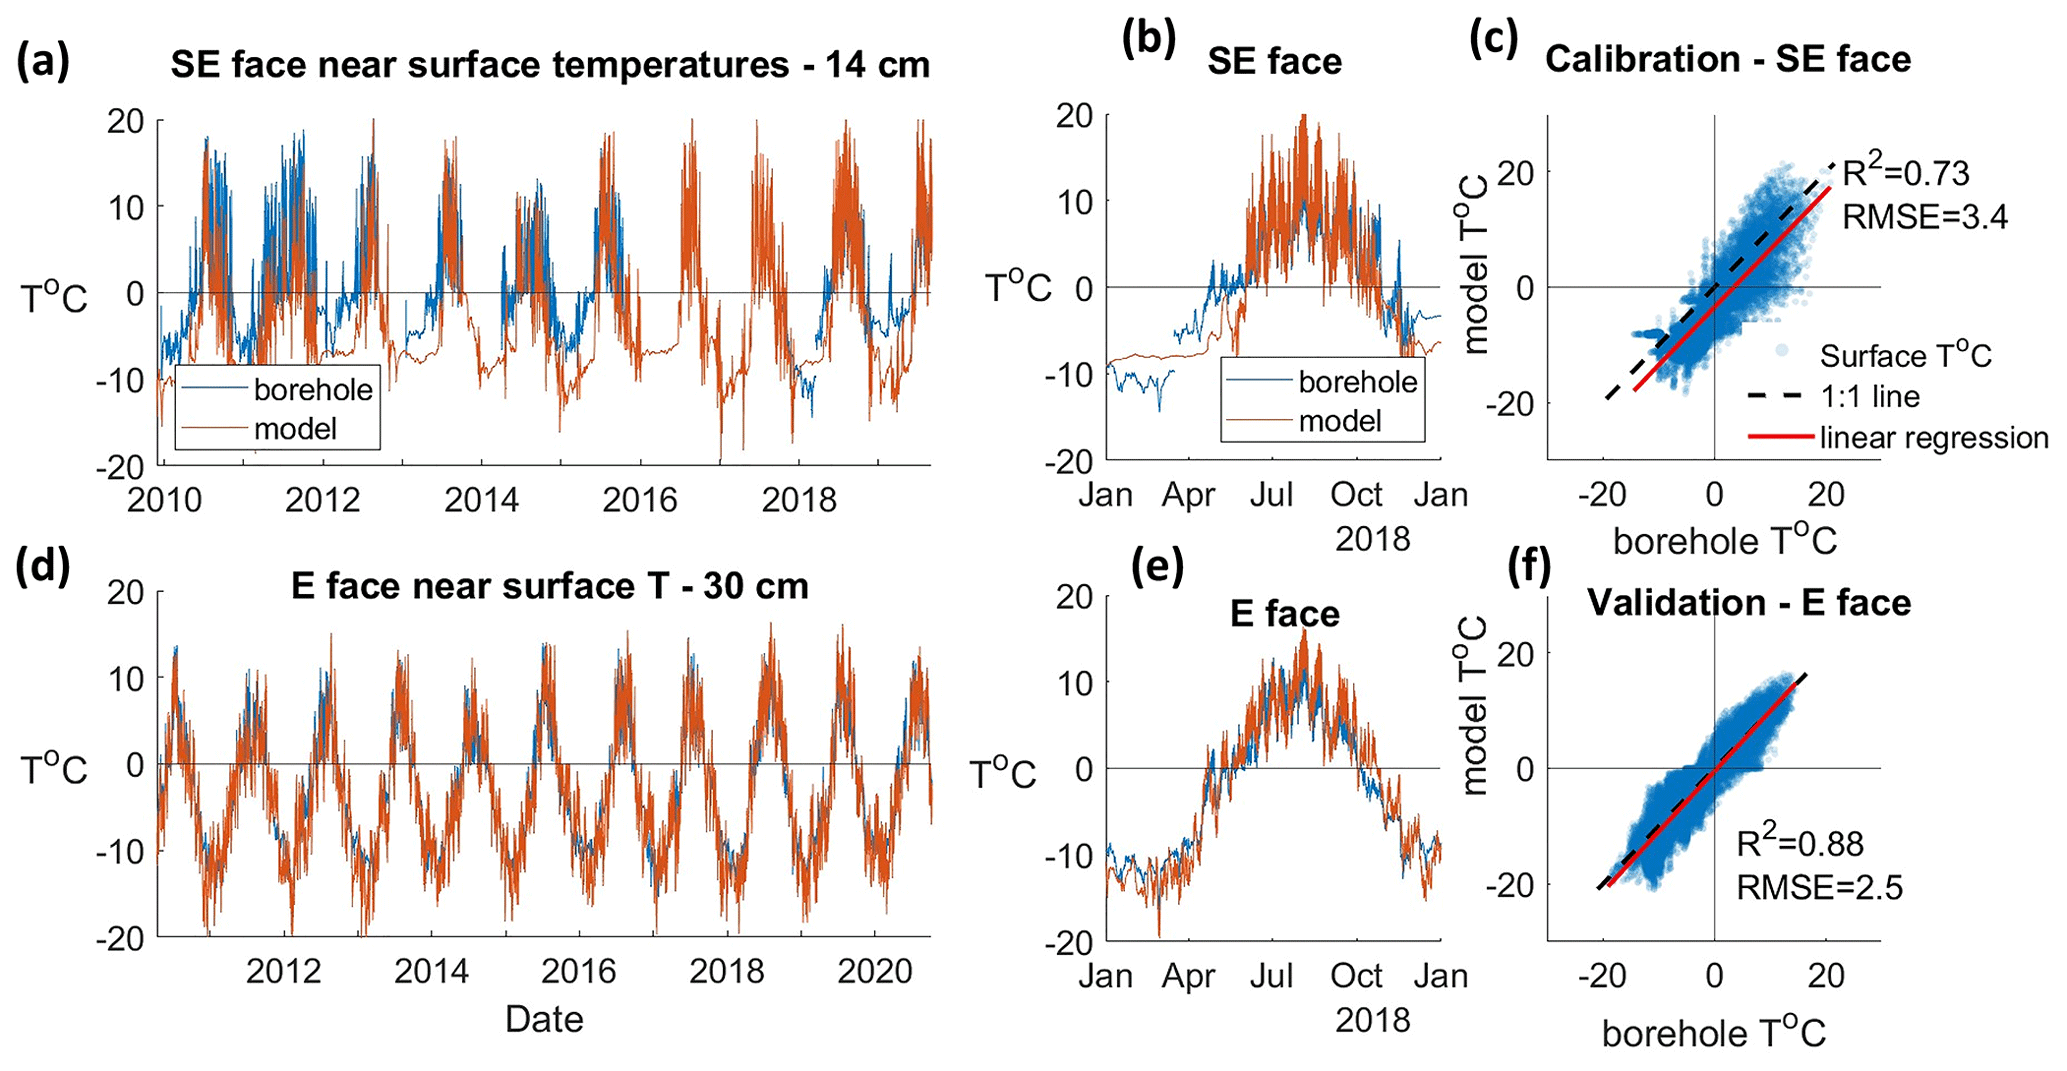
Figure 3Comparison of near-surface temperature (T) data from model output and borehole measurements. (a) Comparison of modeled near-surface temperature (orange) at a depth of 0.14 m with borehole measurement from the SE face study site (blue). (b) Same as (a), showing modeled and observed rock temperatures during the year 2018. (c) Correlation of modeled near-surface temperature (depth 0.14 m) and borehole temperature on the SE face after calibration of snowfall multiplication factor (0.25) and maximum snow depth (0.8 m). (d) Comparison of modeled near-surface temperature (orange) at a depth of 0.30 m with borehole measurement from the E face study site (blue). (e) Same as (d), showing modeled and observed rock temperatures during the year 2018 (f) Validating the modeled near-surface temperature at a depth of 0.3 m with near-surface temperature data from a second borehole on the E face of Aiguille du Midi.
3.4 Effective snowmelt
Snow density is commonly used as a proxy for snow permeability (Marsh, 2005). We defined a threshold density value at the base of the snowpack for which no infiltration occurs and an ice crust develops (i.e., hydraulic conductivity 0). Based on an empirical relation suggested by Sommerfeld and Rocchio (1993), we define a threshold density value of 0.4 g cm−3, which corresponds to a permeability value in the range of 10−10 m2. For comparison, the average dry snow density in our simulation is 0.24 g cm−3 with a standard deviation of 0.08 g cm−3. We thus define effective snowmelt as the volume of water that exceeds the snow porosity field capacity during model time steps provided that dry snow density at the base of the snowpack does not exceed 0.4 g cm−3. In the CryoGrid model, snow density is controlled by compaction, metamorphism, refreezing, and water retention processes (Vionnet et al., 2012). The model also accounts for the inputs of rainfall to the snowpack water balance.
4.1 Calibrated model of the SE face of Aiguille du Midi
The calibration process for maximal snow depth in the SE study site resulted in a value of 0.8 m. It corresponds to what we observed in our snow depth time series from the time-lapse camera (Fig. 4) and high-resolution snow depth survey (Fig. 2). Modeled rock surface temperature shows a good correlation with borehole data from the SE face of Aiguille du Midi (R2= 0.73) (Fig. 3b). The validation of the model by simulating snow accumulation and near-surface temperatures in an E-facing slope and comparing them with field measurements confirmed that the model is flexible for use within the Aiguille du Midi region (R2= 0.88) (Figs. 3c, 4, S4). The predictions of the near-surface rock temperatures on the E face were made with snow-free conditions and provided good correlation with field measurement (Fig. 3b). The reason for that is the location of the E borehole in a subvertical wall that does not accumulate snow and reduces much of the complexity of the surface energy balance calculations and the subsequent uncertainty.
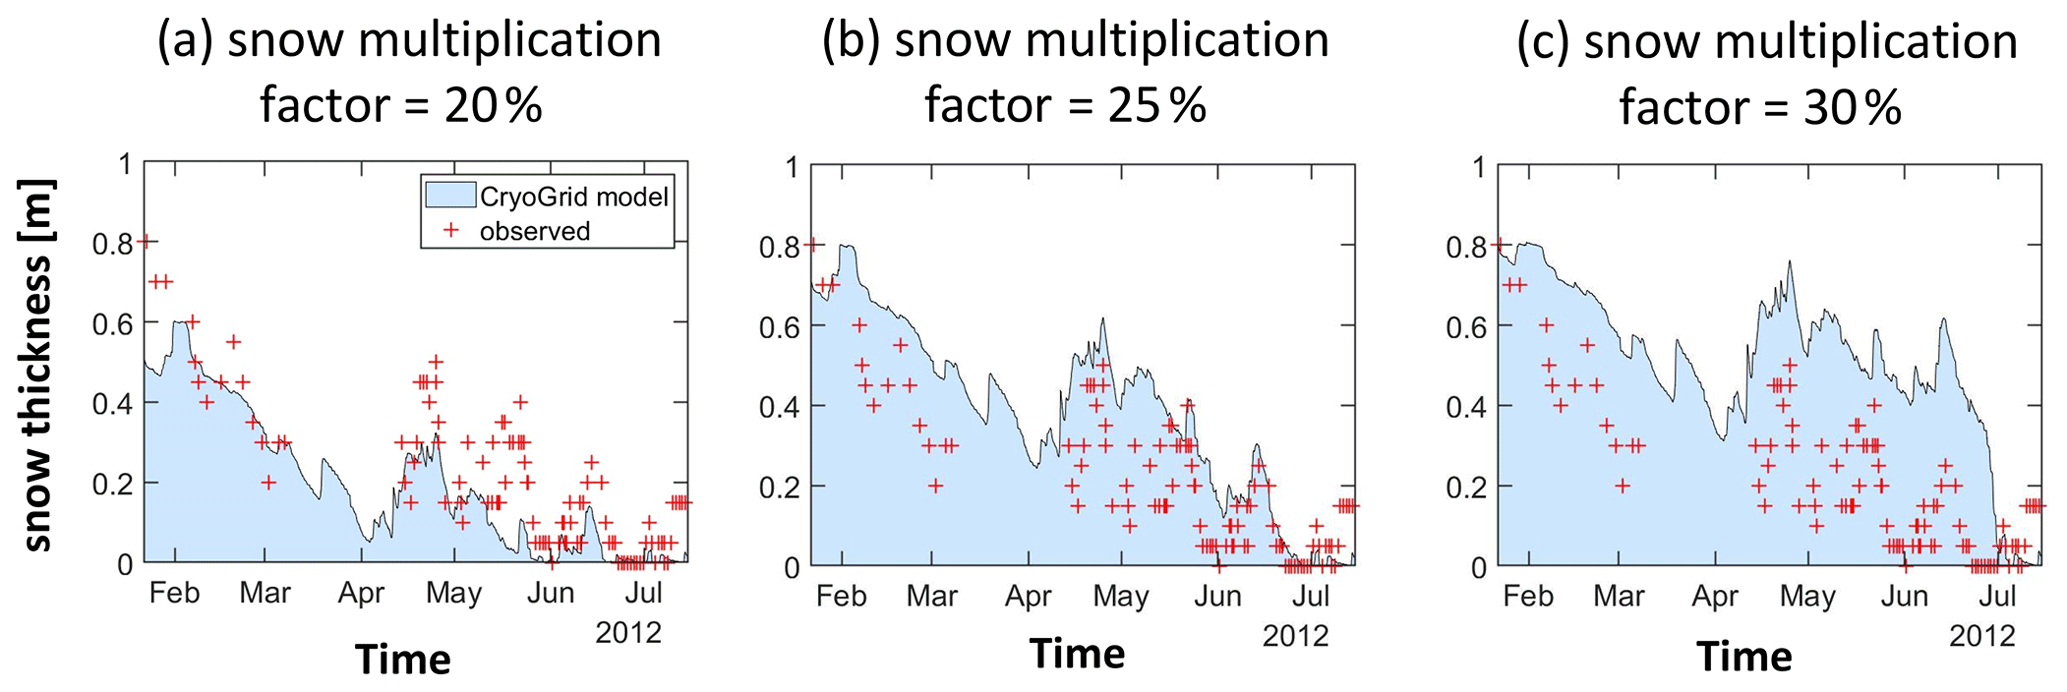
Figure 4Comparing modeled snow depth, under different snowfall multiplication factor values used in calibration, with measurements made in situ using snow poles and a time-lapse camera. Note that using a multiplication factor of 0.2 (a) (20 %) provides snow thickness values that are lower than the observed thickness (red cross), while a value of 0.3 (c) (30 %) leads to values higher than observed. A multiplication factor value of 0.25 (25 %) (b) provides the optimum results.
4.2 Snow accumulation on steep rock walls
In the calibration process, we found that only about 25 % of the snowfall accumulates on the steep rock slopes of our study site on the SE face of Aiguille du Midi (See Sect. 3.3.3 for more details).
Topographic analysis of the 10 cm resolution survey of our field site shows a heterogeneous surface with local slope ranging between 20 and 90∘ and a bimodal distribution with two well-defined modes at 43 and 80∘ (Fig. 2d), which illustrates the typical steep step-like rugged morphology of the SE rock slope. We found that snow depth systematically decreases from a median depth of 0.7 m at a slope of 40∘ (an average depth of 0.8 m) to < 0.1 m at 70∘ slope. We thus use the value of 0.8 m as the maximum value of snow depth in our simulations. At lower slopes, between 25 and 40∘, snow depth measurements show a counterintuitive positive correlation. Wirz et al. (2011) reported a similar trend in low slope angles and suggested that it is related to the relatively small area represented. In our case, cells with slope angles below 40∘ cover ∼ 22 % of the surface, and cells with slope < 30∘ cover ∼ only 6 %. Many of the cells with slope < 40∘ are located at a step edge where the snowpack is not supported downslope and accumulation is thus relatively thin.
4.3 Snowmelt and water availability for infiltration
Figure 5 shows the SE face model results for annual amounts of net snowmelt, effective snowmelt (when the rock surface is penetrable and no ice crust exists at the base of the snowpack), direct rainfall (that falls on snow-free area), and sublimation in the SE face of Aiguille du Midi. All water fluxes are reported in length units of meters (i.e., water equivalent of volume per area – m3 m−2). We found that most of the annual water mass loss from the snowpack is the result of sublimation (Fig. 5a), which is the only process of snowpack mass loss during winter and spring months, from November to April, in our study site (Fig. 6). The average annual amount of net snowmelt is 0.13 m with variability that ranges over a factor of 6 between 0.05 and 0.28 m and is directly related to the annual amount of snow accumulation – years with relatively heavy snowfall will get more net snowmelt (Fig. 5b). The annual effective snowmelt ranges between values below 0.01 m (during the years 1977, 1984, 2000, 2007, 2011) and 0.075–0.1 m (during the years 1964, 1973, 1980, 1992). The fraction of effective snowmelt from the total annual excess water (net snowmelt + direct rainfall) varies widely from 7 % to 90 % (during the years 1968 and 1975, respectively).
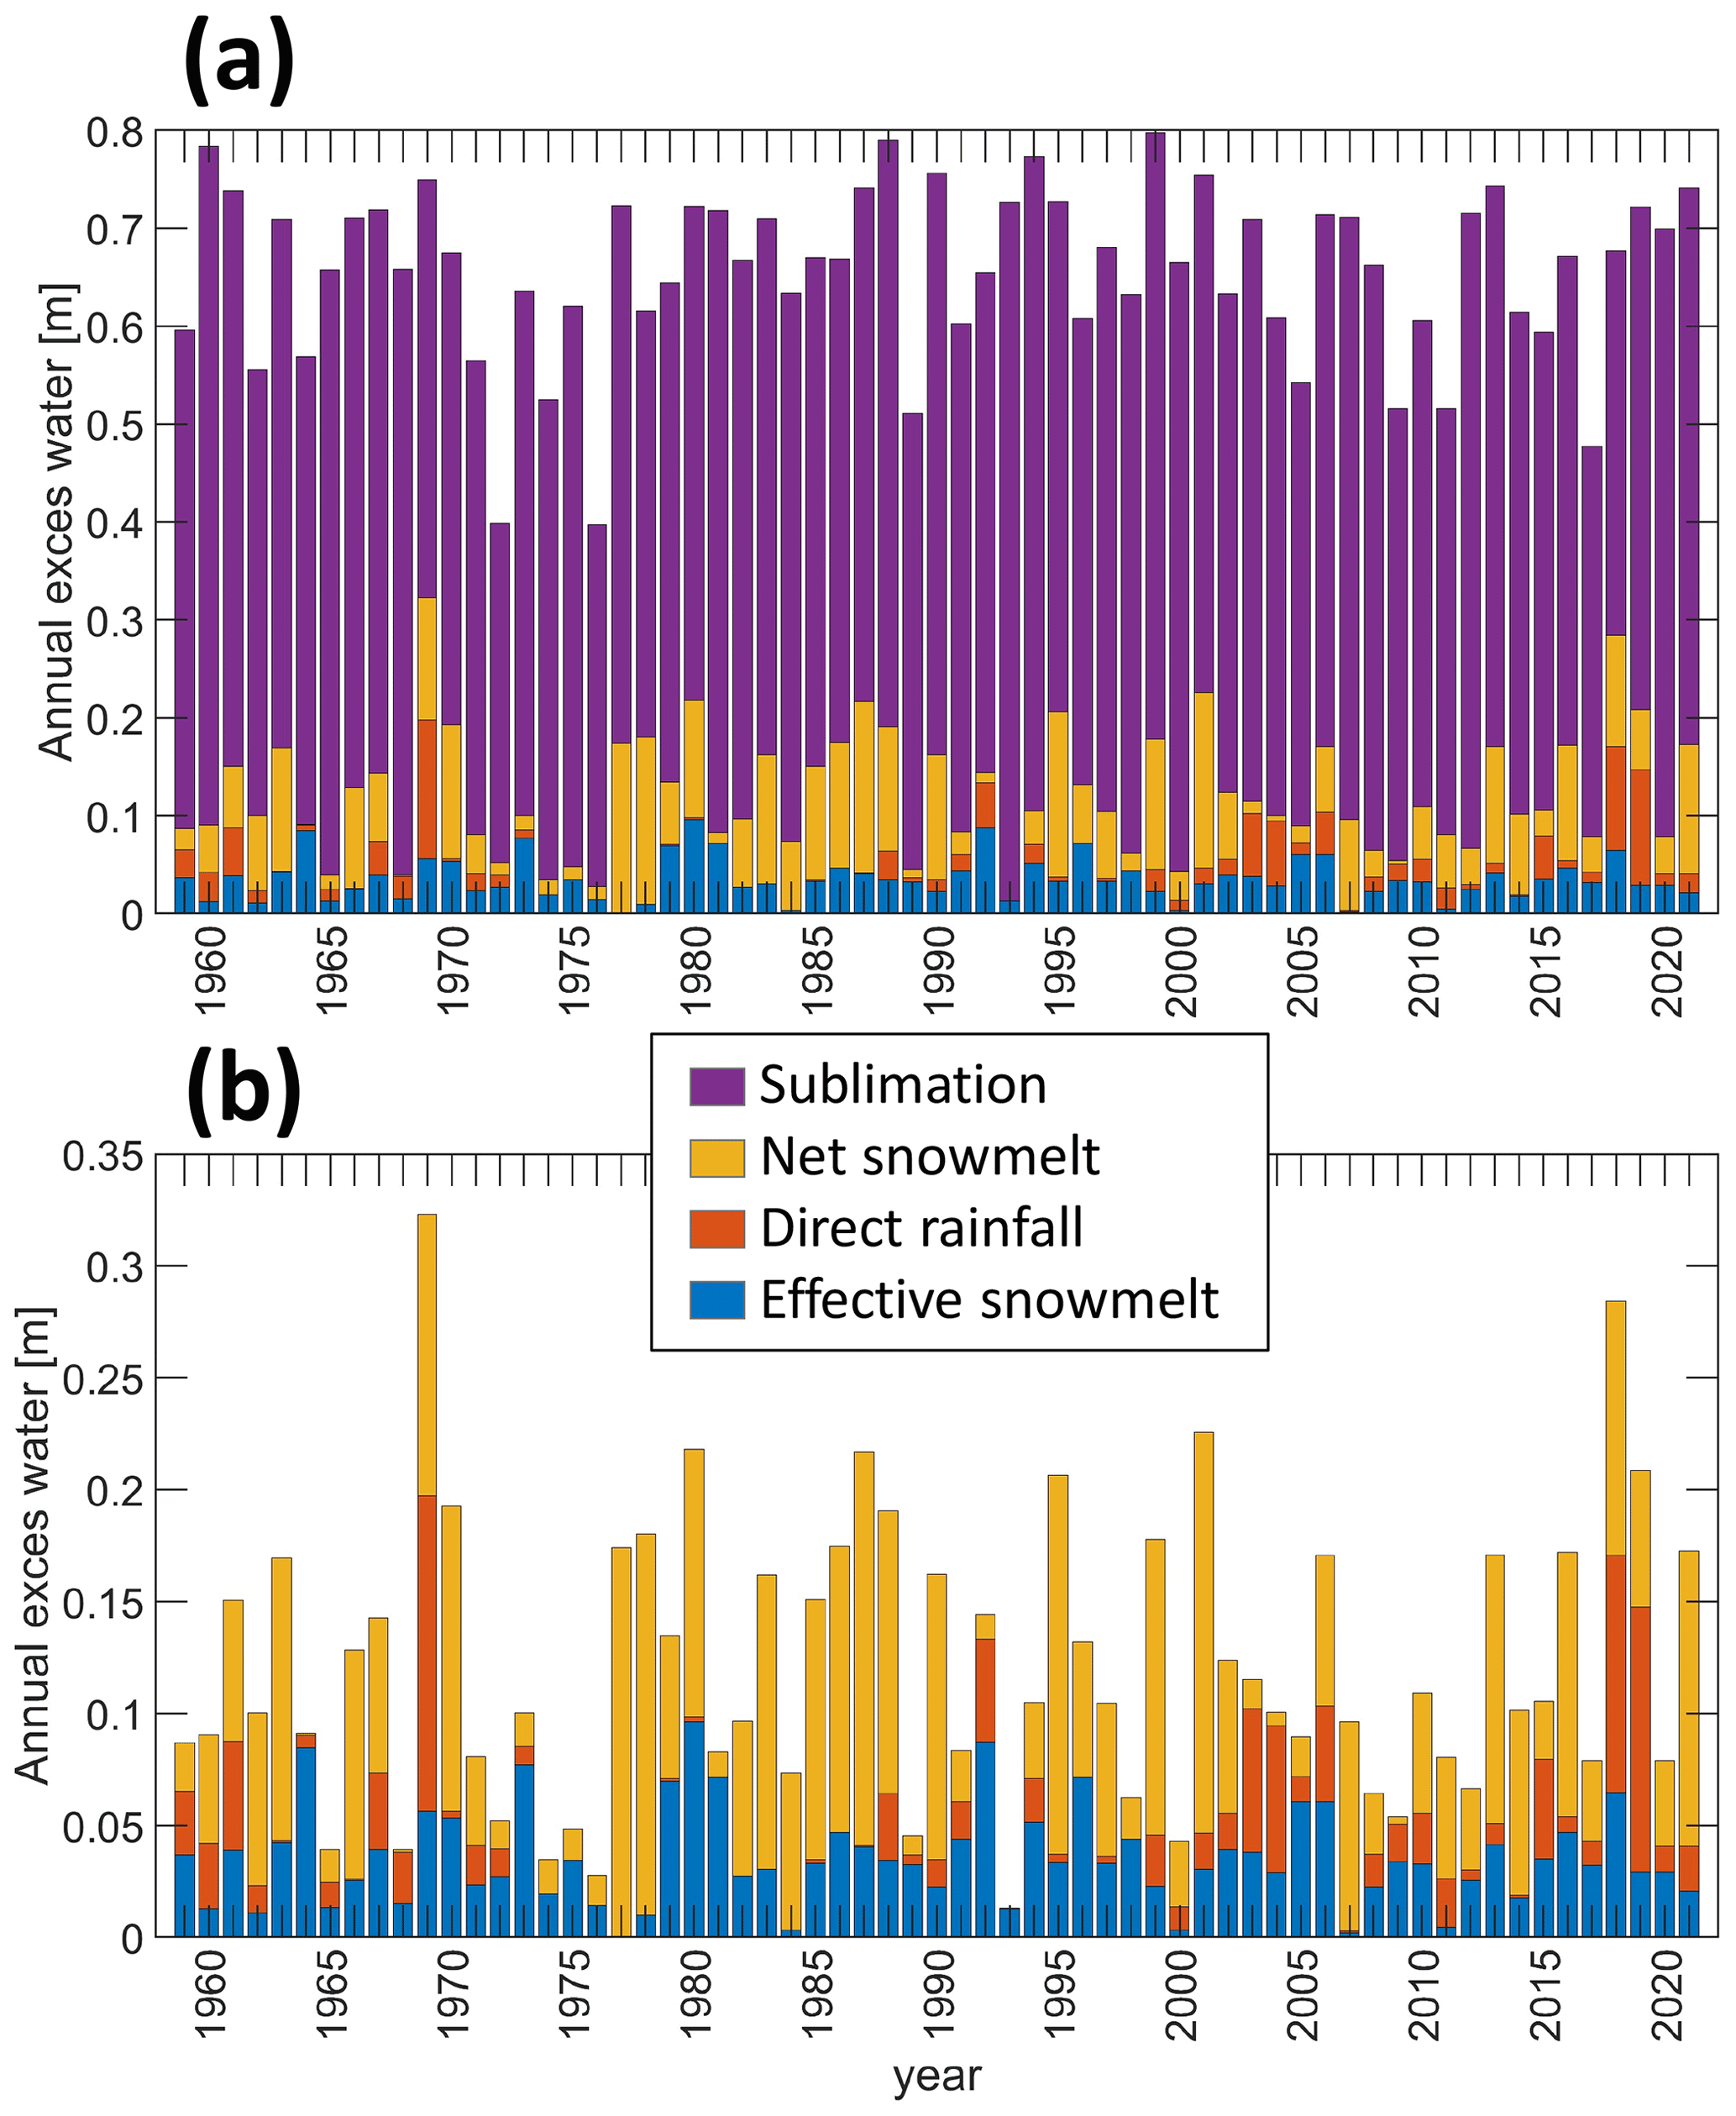
Figure 5Annual water fluxes in the SE face study site between 1959 and 2020 – model results of annual effective snowmelt (blue), direct rain (red), net snowmelt (yellow), and sublimation (purple) at the SE face study site at 3800 m a.s.l. (a) Water balance including sublimation. (b) Total and effective snowmelt and direct rainfall. Note the high variability in annual water availability for infiltration (effective snowmelt + direct rain) and the high rate of sublimation.
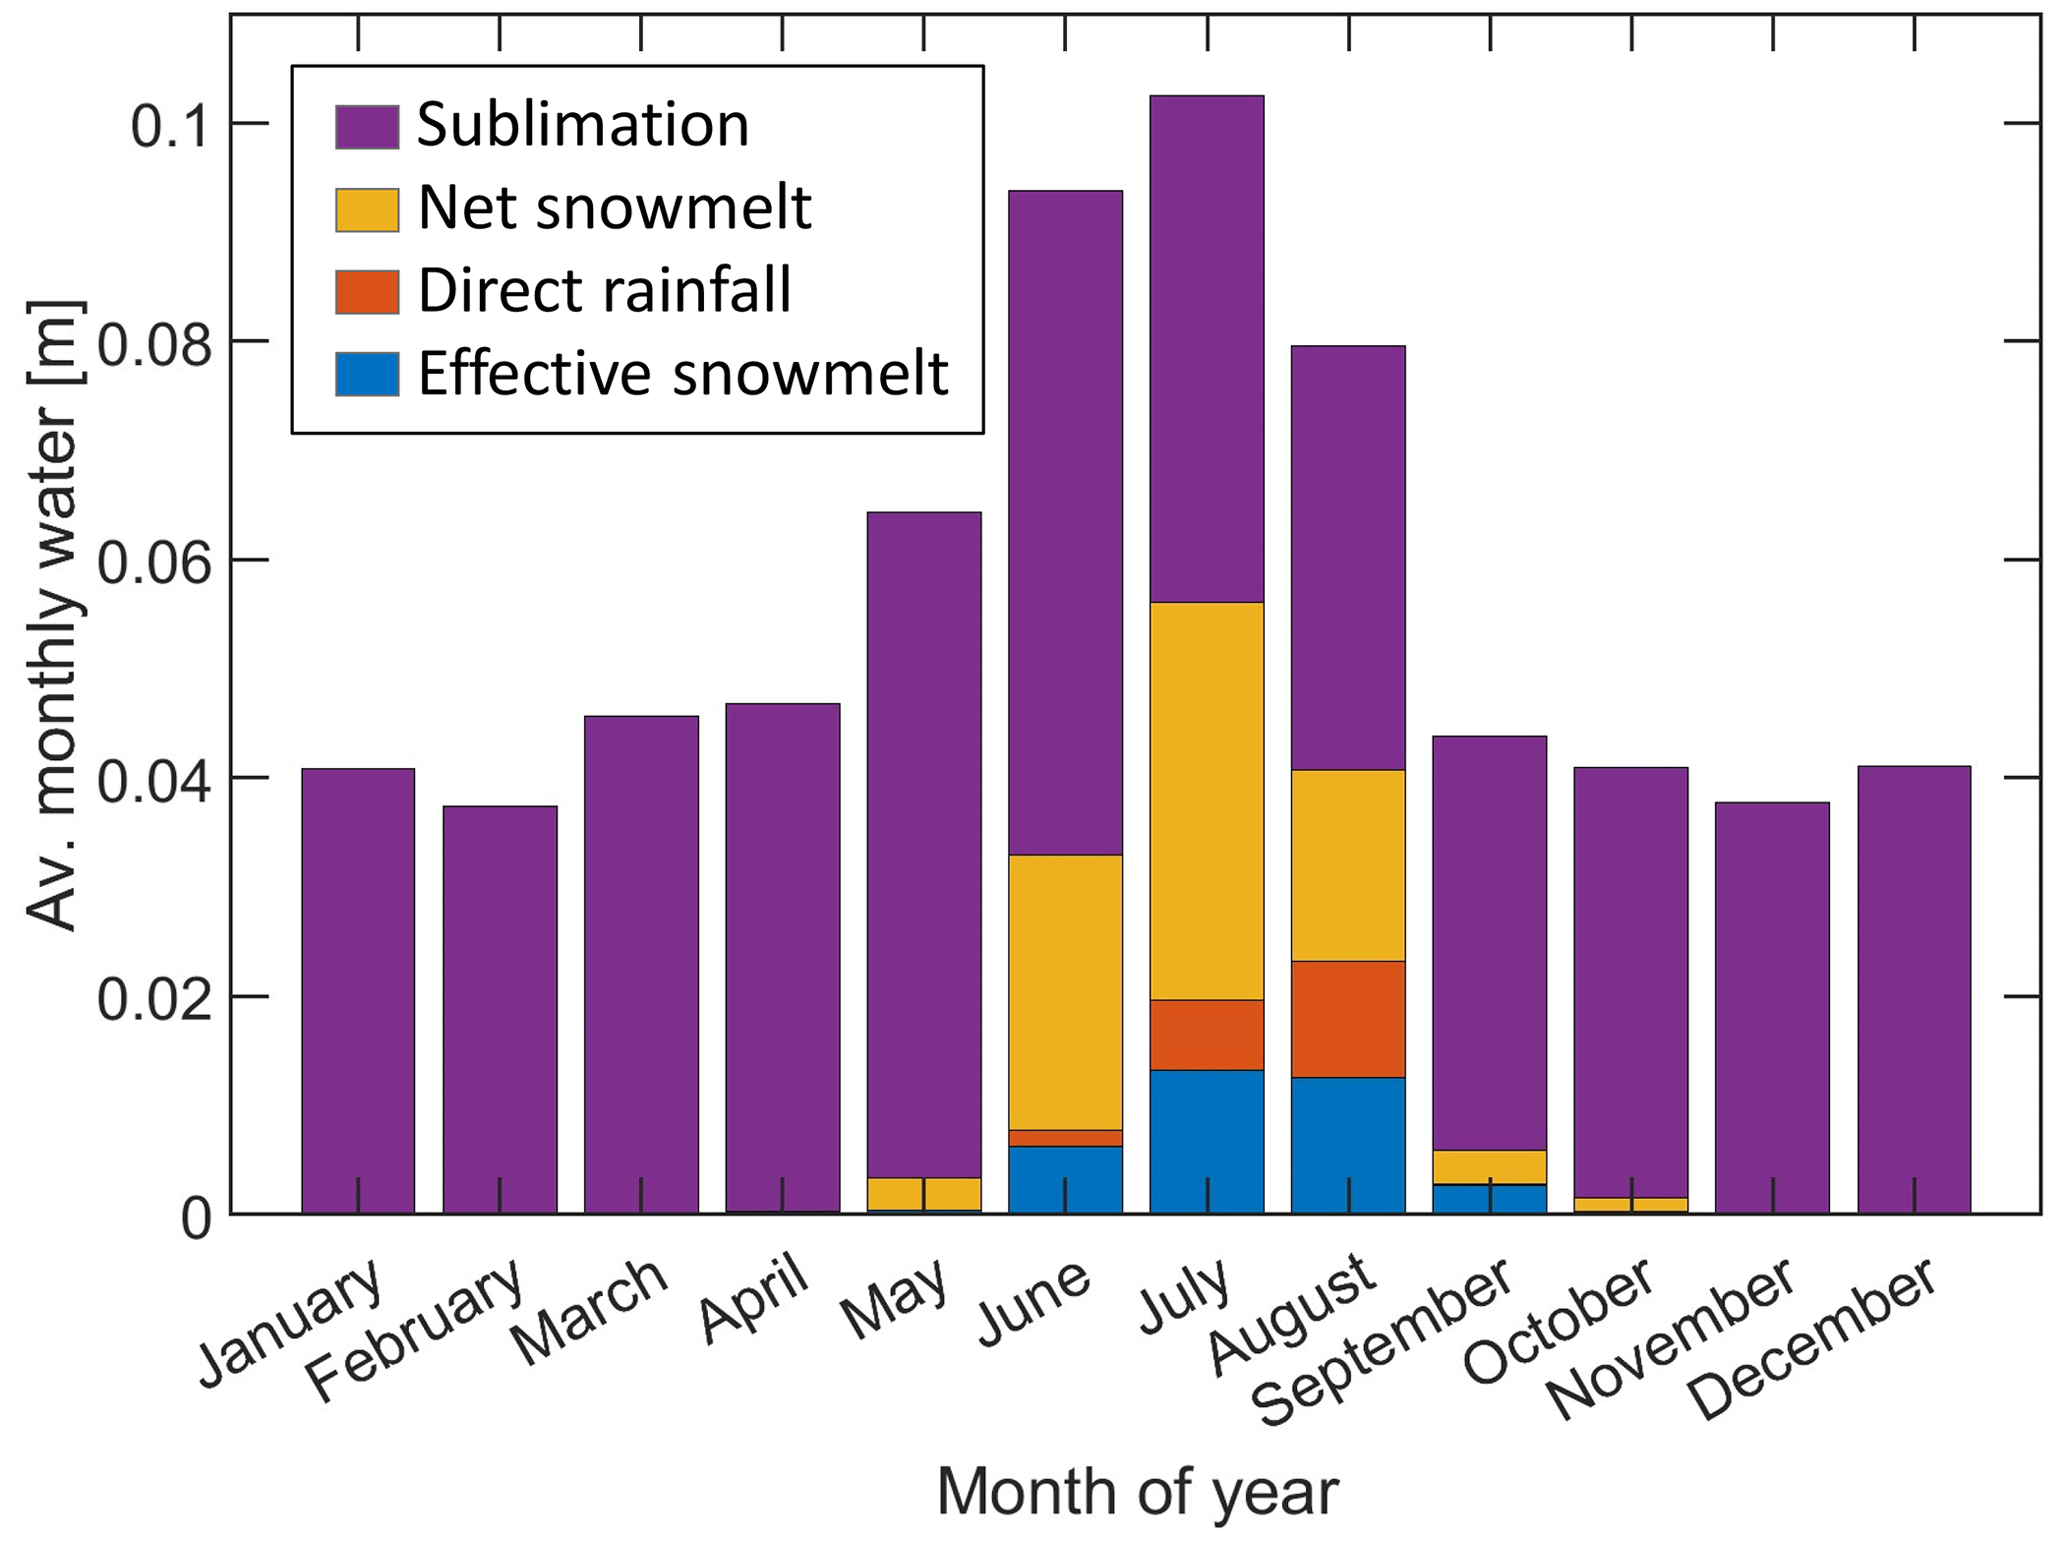
On average, at our study site on the SE face, 95 % of the snowmelt occurs from May to September; however, the effective snowmelt is delayed to the summer months (June to September) when 95 % of the effective snowmelt occurs on average (Fig. 6). In most years, effective snowmelt begins in June or July. A few exceptional years show considerable effective snowmelt values in May (1992, 2017, 2018), and some show the first effective snowmelt only in August (1978, 1997, 2007, 2011). In all years, more than 90 % of the effective snowmelt is produced by the end of September.
The flexibility of the model setup enables the simulation of opposite north- and south-facing rock slopes to test the effect of the topographic aspect on runoff regime. In these simulations, we kept all model parameters identical and changed only the aspect. The results show that both north- and south-facing rock slopes experience complete melting of snow cover by late summer, which agrees with field observations (Fig. 7). Similar volumes of total runoff are produced, with negligible differences due to different sublimation rates. Interestingly, the annual effective snowmelt on south-facing rock slopes is 48 % greater on average than on north-facing slopes (Fig. 7). The reason for this is that effective snowmelt occurs from May to October on south-facing rock slopes, while it takes place only from June to September on north-facing slopes (Fig. 7), with longer persistence of ice crust at the base of the snowpack.
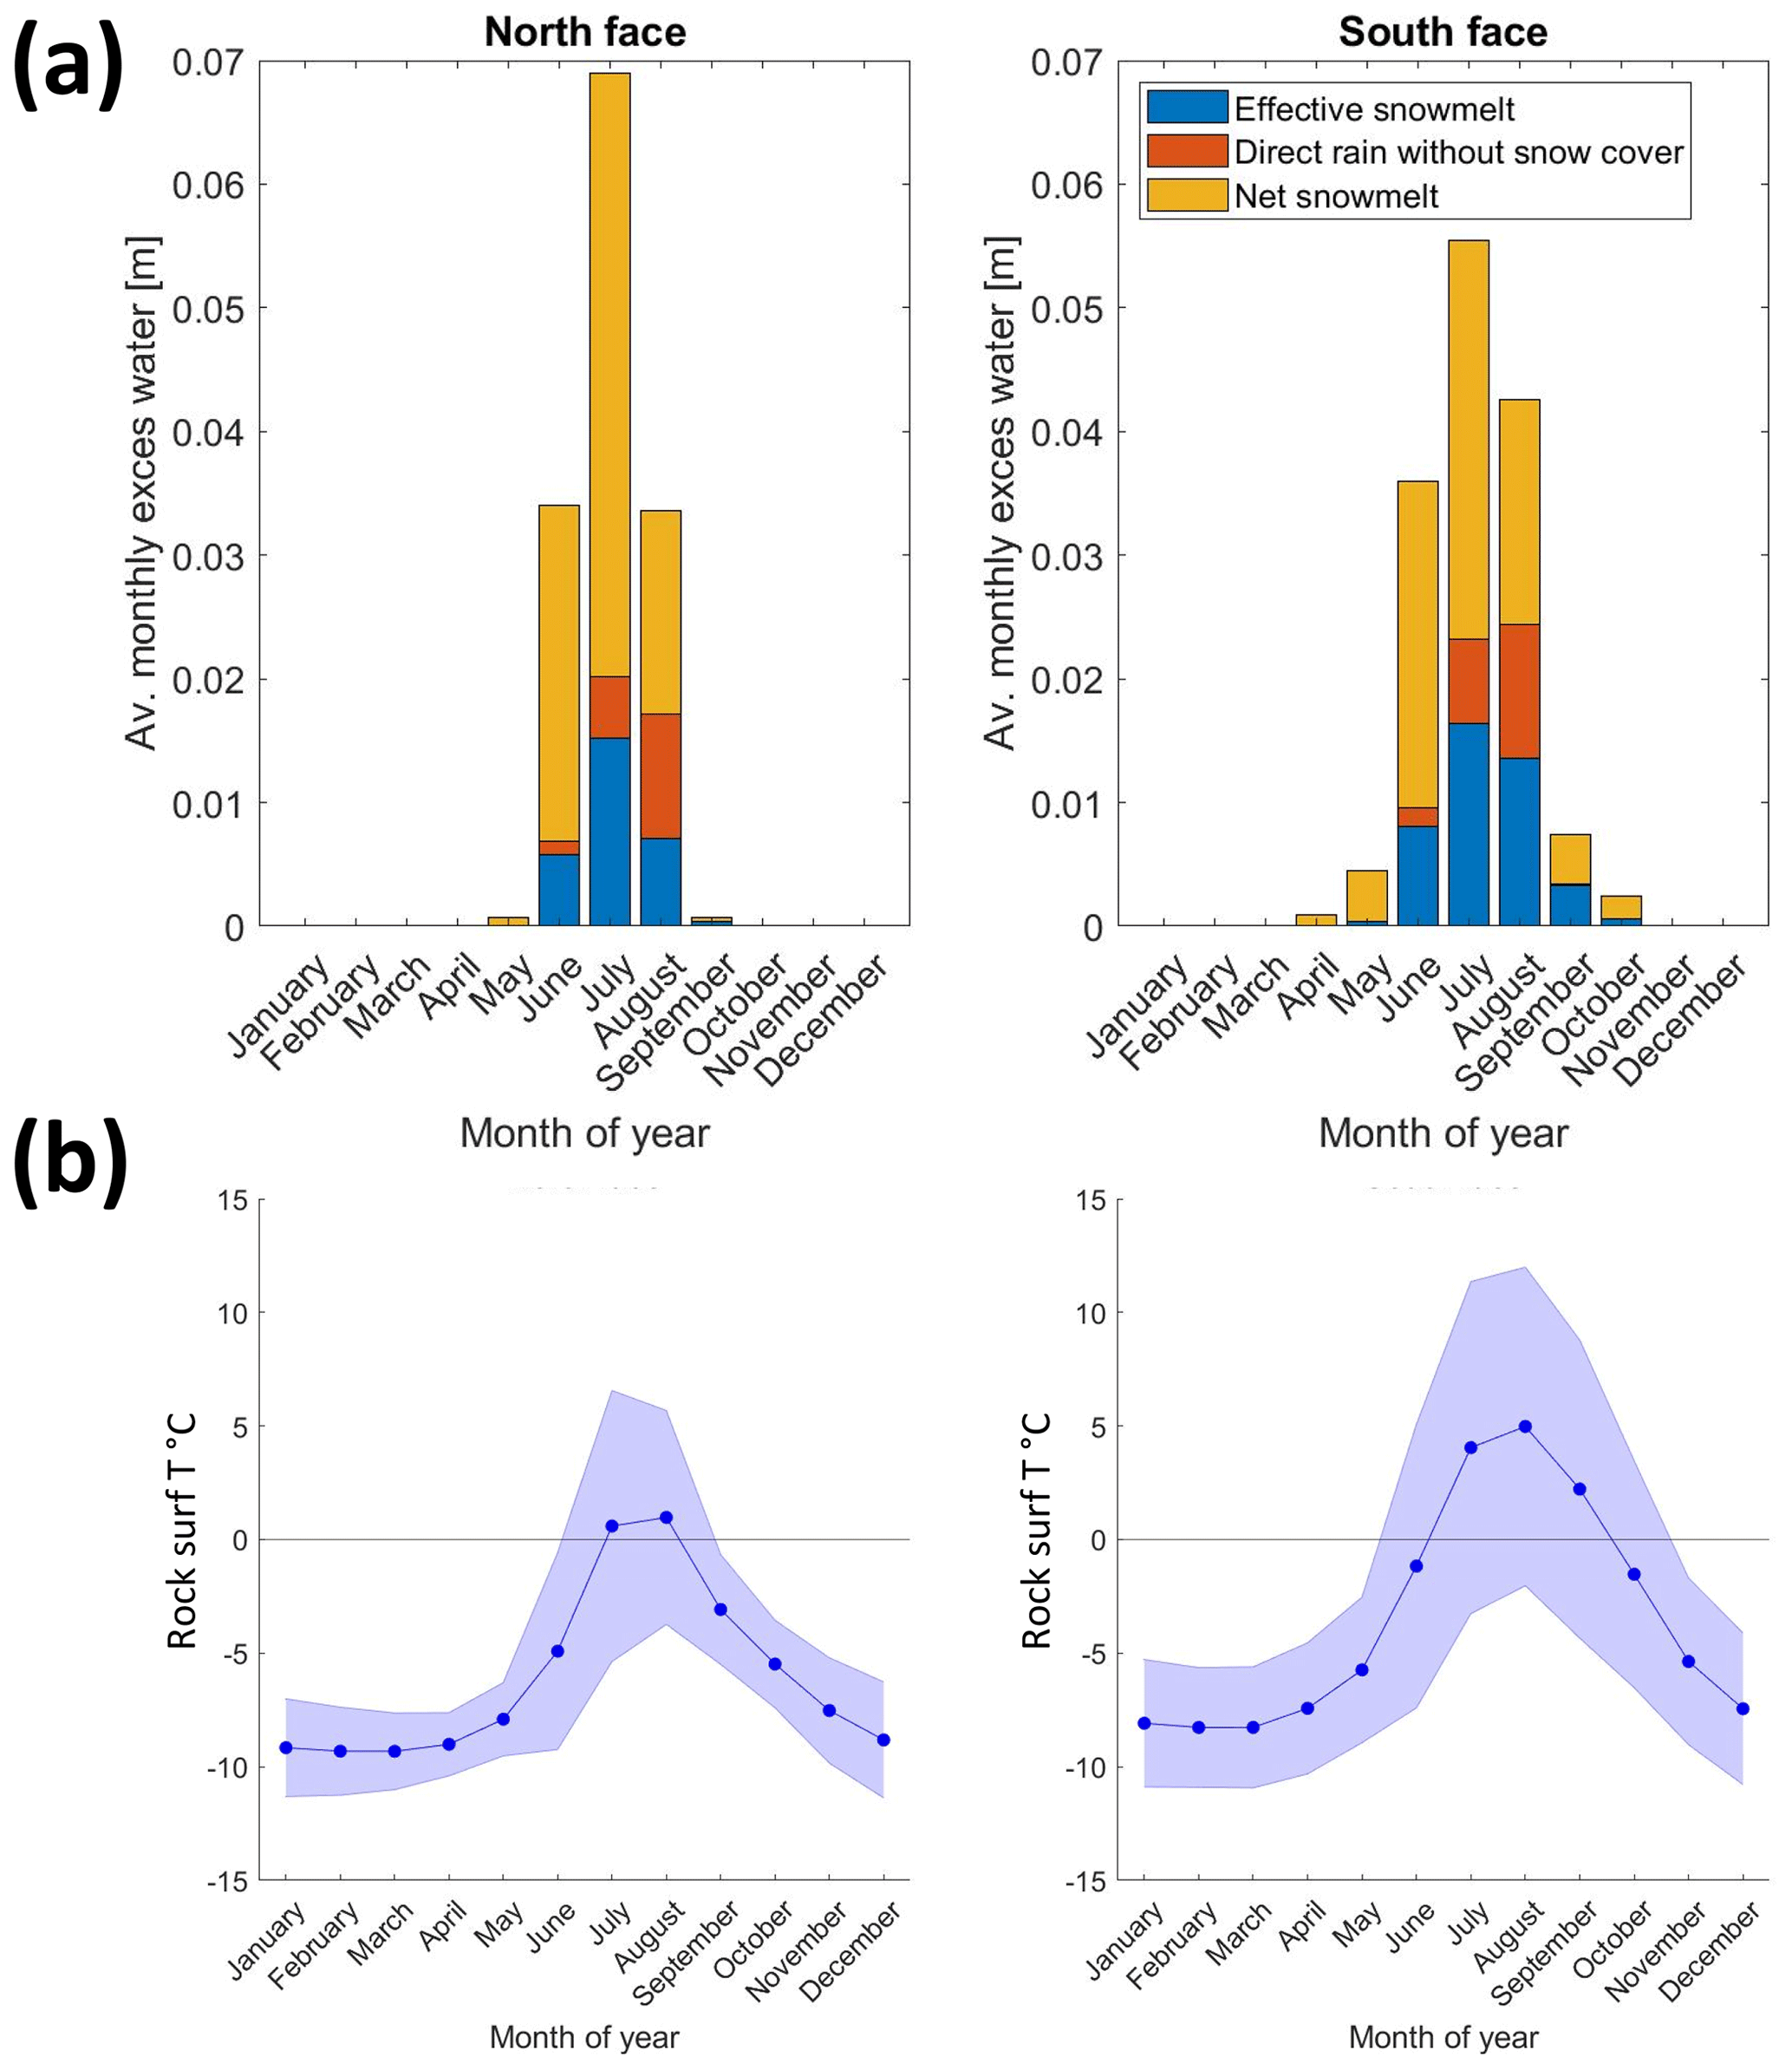
Figure 7North vs. south comparison. (a) Comparison of the average monthly distribution of water fluxes in north- and south-facing rock slopes at an elevation of 3900 m a.s.l. Note that the annual effective snowmelt on south-facing rock slopes is 48 % greater on average than on north-facing slopes. (b) Average surface temperature (T) in north- and south-facing rock slopes at an elevation of 3900 m a.s.l. Blue shading shows the standard deviation of monthly surface temperatures.
4.4 Modeling energy and water balance at various altitudes
The S2M-SAFRAN dataset for the Mont Blanc massif is available at elevation steps of 300 m. We compared our model simulation results for the Aiguille du Midi SE face with the same settings at different altitudes, starting from 2700 m a.s.l, which is the elevation where discontinuous rock wall permafrost is expected to exist, and up to 4800 m a.s.l, which is the highest point in the Mont Blanc massif. These simulations give a better understanding of the thermal dynamics along the entire permafrost-affected mountain flank and the changes in effective snowmelt and water availability for infiltration. To broaden the analysis, we also modeled the effect of elevation change on a north-facing slope. Our results show that for south-facing rock slopes, snowmelt is the main source of water for infiltration at elevations above 3600 m a.s.l. From 3600 to 2700 m, direct inputs of rainfall and net snowmelt volumes increase rapidly, while the effective snowmelt increases at a more gradual rate (Fig. 8). At these lower elevations, where direct rainfall is dominant, effective snowmelt input precedes rainfall by ∼ 1 month on average (Fig. 8a). Above 3300 m, sublimation is the dominant process of snow mass loss. The availability of water for infiltration, either by snowmelt or direct rainfall, occurs sooner at lower elevations: water is available for infiltration as early as April at elevations of 2700–3000 m, while the onset of snowmelt occurs in June at 3600 m. A comparison with the same elevations on a north face (Fig. 9) shows that at elevations < 3000 m, fluxes are similar. At higher elevations, the ratio of water availability between north and south increases, while the water flux magnitudes decrease.
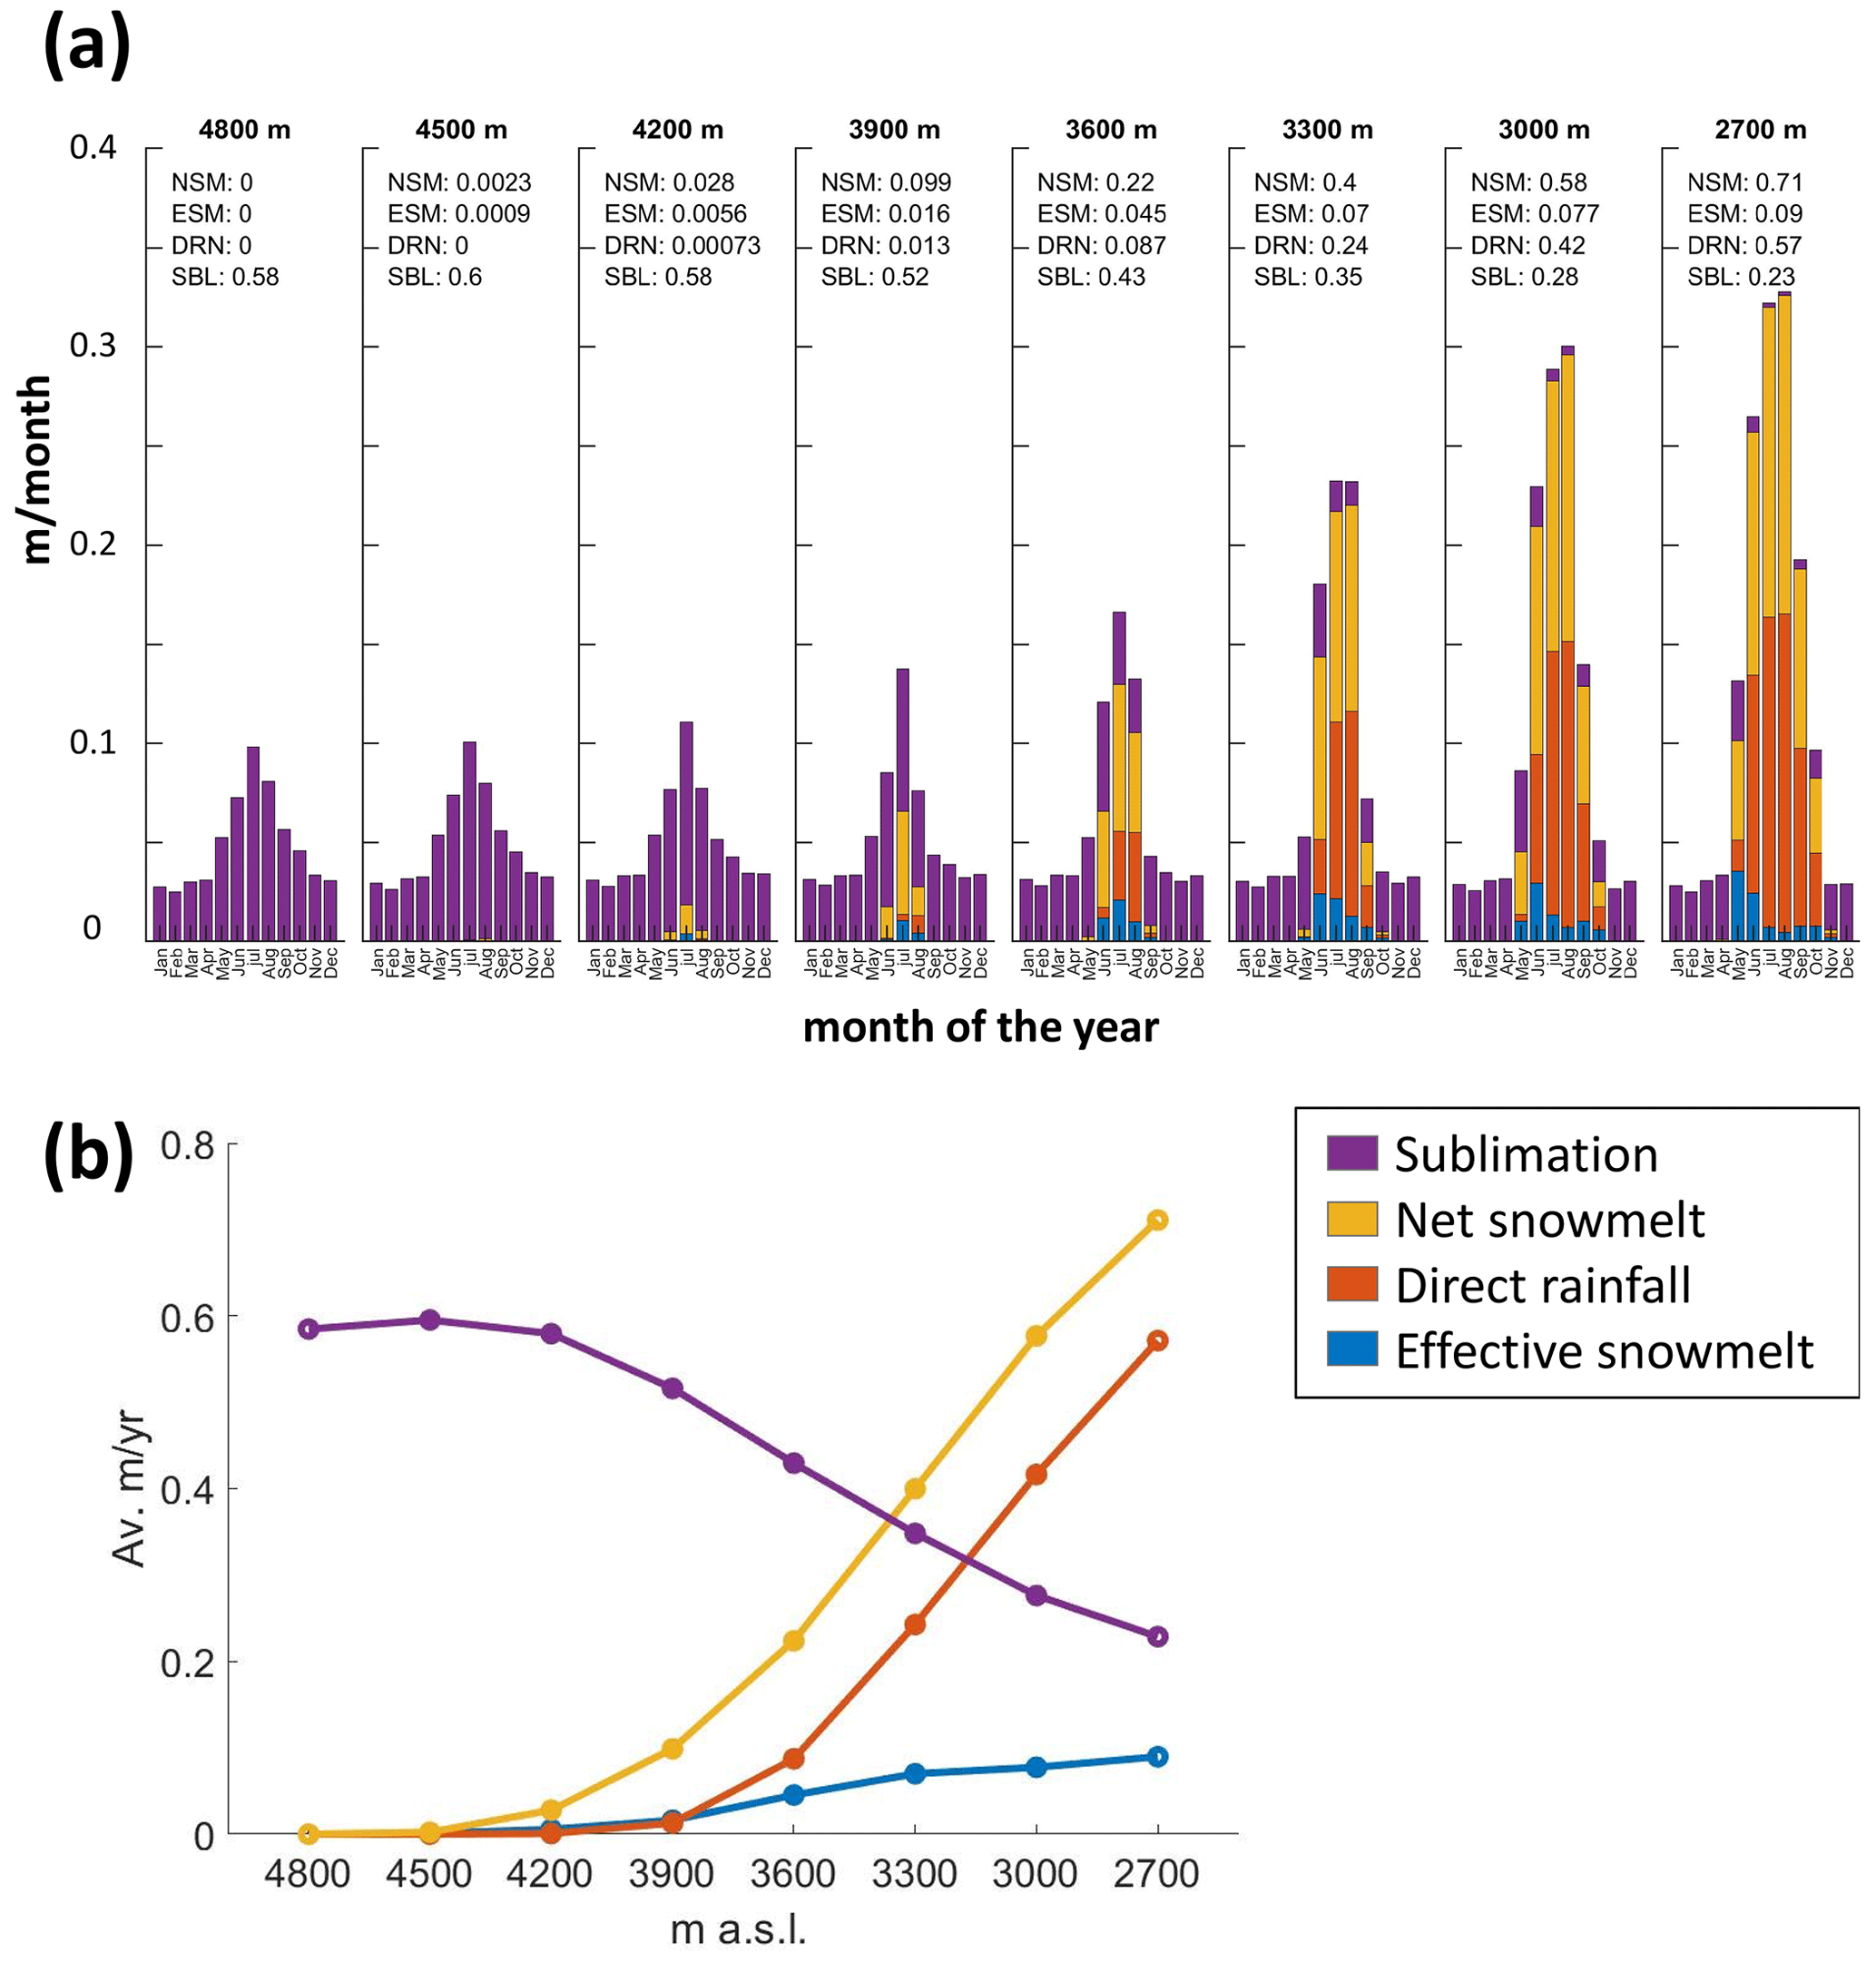
Figure 8Comparison of the average monthly distribution of water fluxes at elevations ranging from 4800 to 2700 m a.s.l. (a) Comparison of the average monthly distribution of water fluxes in conditions at elevations of 2700, 3000, 3300, 3600, 3900, 4200, 4500, and 4800 m a.s.l. based on the SE-facing rock-slope-calibrated model. NSM: net snowmelt; ESM: effective snowmelt; DRN: direct rainfall; SBL: sublimation. (b) Average annual fluxes at each of the modeled elevations between 2700 and 4800 m a.s.l. on SE-facing rock slopes. Note the rapid increase in water availability from rainfall input below 3900 m.
5.1 Snow accumulation depth
The spatial variability of snow depth at our study site shows a robust inverse relation between slope angle and snow accumulation depth, as mean snow depth decreased from 0.8 to 0 m when slope angle increased from 40 to 70∘. This observation is in agreement with the results of previous studies (Sommer et al., 2015; Blöschl et al., 1991; Winstral et al., 2002; Gruber Schmid and Sardemann, 2003; Haberkorn et al., 2015). The results also suggest that only 25 % of the snowfall at the study site accumulates. The remaining 75 % is likely redistributed by wind and gravity through avalanches and spindrifts (e.g., Hood and Hayashi, 2010). We acknowledge the observed variance in snow accumulation depth for a given slope (Fig. 2). This variance is interesting by itself since it might point to additional environmental factors that control snow accumulation, such as local micro-topographic and micro-climatic factors (Wirz et al., 2011; Lehning et al., 2011). For example, the micro-topography of the rock surface can influence local wind dynamics and snow redistribution (Winstral et al., 2002). The rock slope roughness can affect friction with the snowpack surface and support its stability. Local shading can affect the thermal regime and mechanical characteristics of the snowpack (Vionnet et al., 2012). Further research using higher temporal (i.e., several per year) and spatial resolution of snow accumulation (i.e., at a scale of surface roughness that is relevant for rock–snow friction) is needed to decipher the influence of slope characteristics other than slope angle on snow accumulation on steep slopes.
5.2 Model applications and flexibility of the S2M-SAFRAN dataset
We show that the use of the S2M-SAFRAN meteorological dataset can overcome some of the limitations of meteorological field measurements. The S2M-SAFRAN data are available for other mountain ranges in the Alps, Pyrenees (e.g., López-Moreno et al., 2020), and Corsica, and our approach could be applied anywhere if enough field data are available for forcing (meteorological data) and validation (i.e., surface temperature and/or snow depth).
We show that the CryoGrid community model is a useful tool for studying near-surface thermal and hydrological processes in steep mountainous landscapes. However, although the model allows considerations of lateral drainage, it is spatially limited to 1D configuration and oversimplifies 3D subsurface thermal and hydrological processes. 3D hydrogeological models that can account for lateral flow, heat advection, and various saturation levels do exist. However, these models, in addition to often being closed-source and costly, rarely include modules for simulating the complex processes in the snowpack and the interactions with meteorological and topographical conditions. We thus suggest that a complete model of the thermal and hydrological processes in mountainous periglacial and/or permafrost-affected landscapes can benefit from a coupling of the output of an energy balance plus snow hydrology model, such as CryoGrid, with a 3D hydrogeological model of mass and heat transfer.
5.3 Potential snowmelt and water balance
The results presented here are from a first attempt to fill a major knowledge gap in the field of mountain permafrost hydrology and provide a constraint on one of the most important parameters – the availability of water for infiltration. We demonstrate previously suggested control of snow hydrology on water availability in high-elevation steep rock slopes via the formation of an ice crust layer that can profoundly lower the local rock surface infiltration capacity (Woo and Heron, 1981; Woo et al., 1982; Marsh, 2005; Phillips et al., 2016). Our approach to simulating the formation of the ice crust and its influence on snow hydrology is likely oversimplified and ignores possible lateral fluxes and the formation of impermeable layers in the upper parts of the snowpack. Sublimation was found to be the dominant process of snowpack mass loss at the field site at elevations higher than 3600 m a.s.l (excluding mass removal by wind and gravity). Accurate modeling of sublimation in steep to high alpine terrain is highly complex, and field measurements are rare; however, previous studies have pointed out the importance of sublimation in the alpine snowpack mass balance and are thus in agreement with our model results (Strasser et al., 2008; MacDonald et al., 2010). We found sublimation rate to be sensitive to surface roughness length – a parameter that describes the efficiency of energy transfer (i.e., latent heat of sublimation) at the air–snowpack interface. We tested the sensitivity of sublimation rates to a wide range of roughness length values ( m, Table 2) and found that although the sublimation rate changed significantly, it remained the most dominant process of snow mass loss (Fig. S7). We show that effective snowmelt is the main source of water availability to the rock surface on steep high-elevation rock slopes and that at some elevations, i.e., 3600–3900 m a.s.l in our case study, a transition occurs from snowmelt-dominated to rainfall-dominated water availability (Fig. 8). A high rockfall frequency in such a permafrost-affected elevation range was recently demonstrated by Mourey et al. (2022) in the Mont Blanc massif at the Grand Couloir du Goûter site, at elevations of 3300–3800 m a.s.l. We compared the influence of elevation on water balance in N- and S-facing hillslopes (Fig. 9a) and found that differences are more prominent at higher elevations – as S-facing rock slopes receive more water input in comparison with N-facing (Fig. 9b). This results from the interplay of snow cover dynamics, which in turn influence snowmelt and rock surface exposure to direct rain, in addition to differences in ice crust formation. Considering the connectivity in the slope length scale, some of the surface runoff that is generated from snowmelt at high elevation in spring and early summer, due to sealing of the rock surface with an ice crust, may reach a lower elevation where the rock is not sealed and amplify the observed increase in water contribution at the transition elevation.
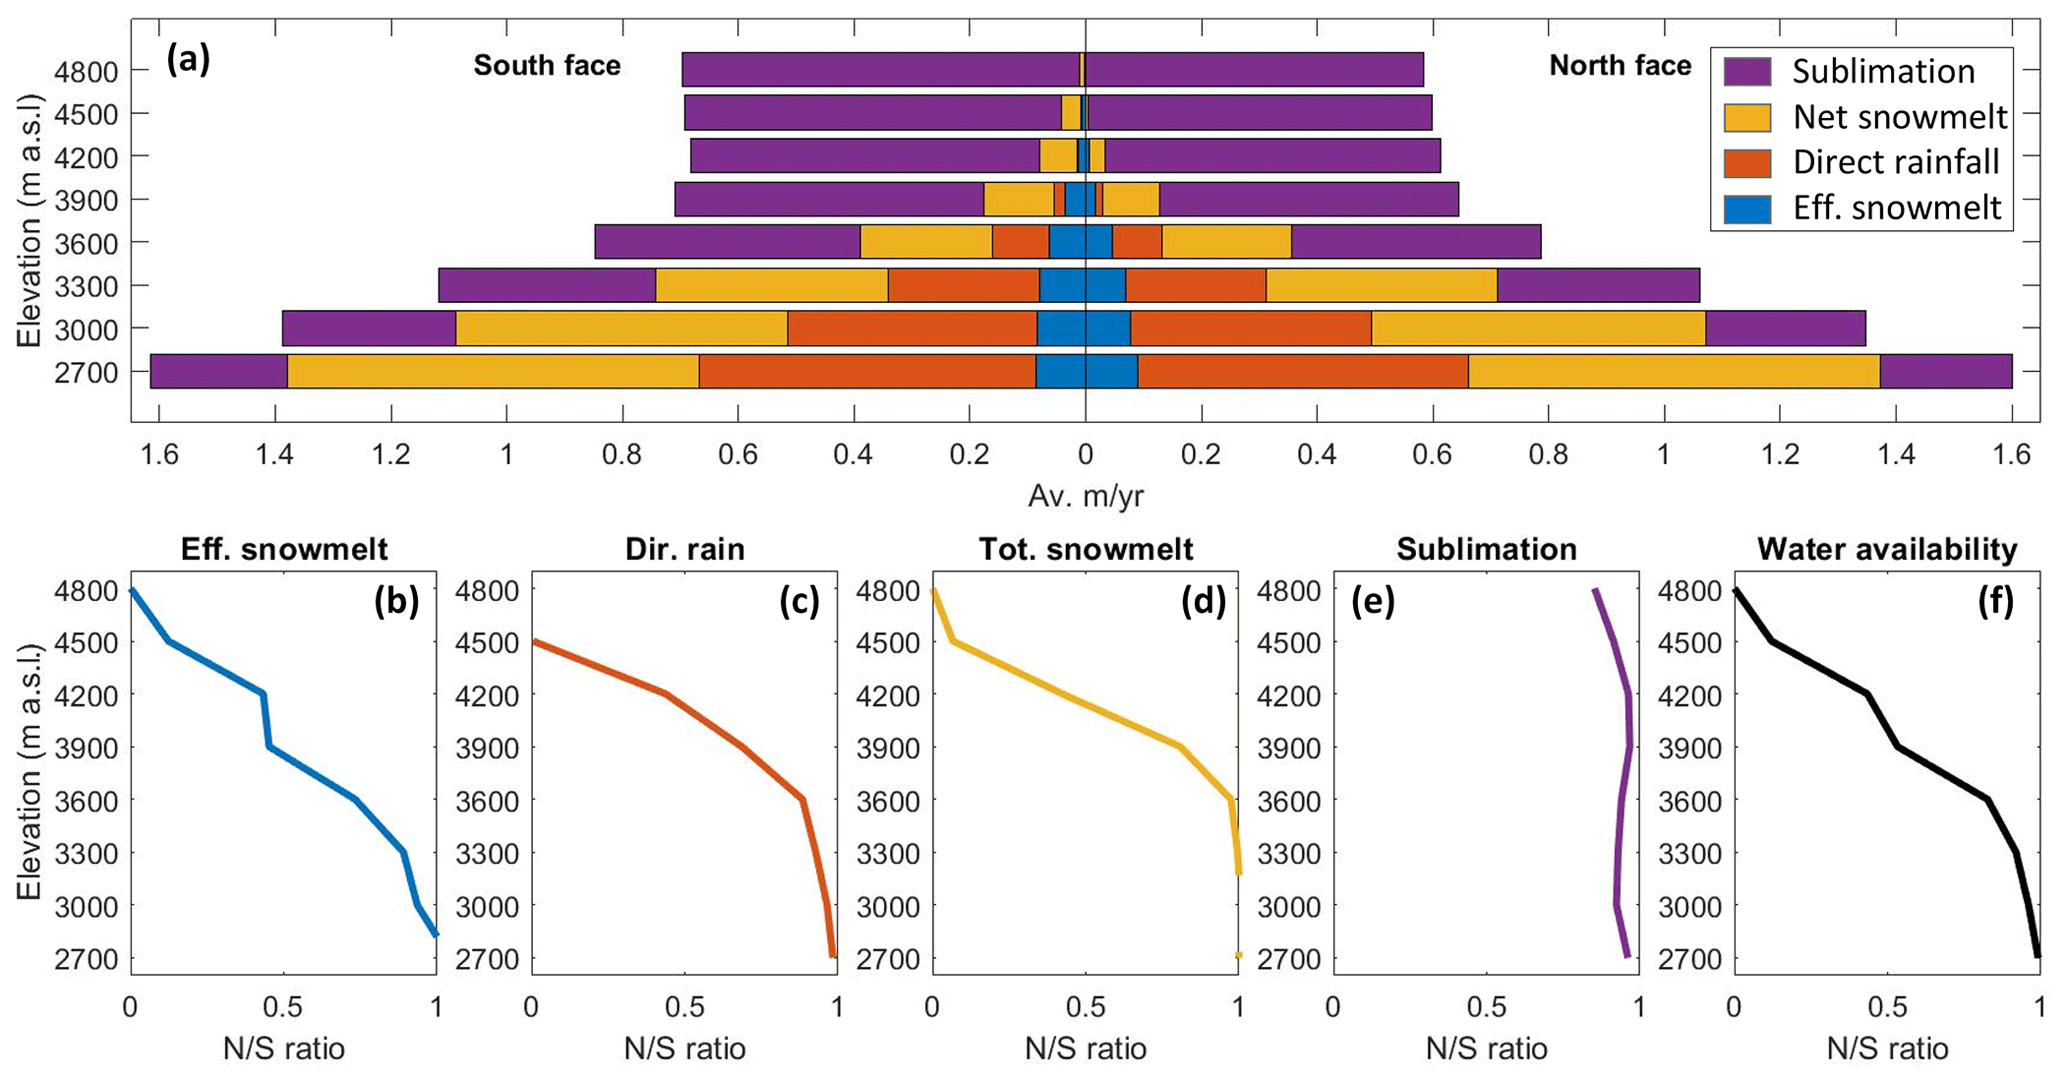
Figure 9North vs. south comparison of the average monthly distribution of water fluxes at elevations of 2700–4800 m a.s.l. Top: comparison of average annual water fluxes at elevations of 4800, 4500, 4200, 3900, 3600, 3300, 3000, and 2700 m a.s.l. on north-facing (right) and south-facing (left) rock slopes. Bottom: the ratio between north and south of each component of the water fluxes described above at each of the modeled elevations. A value of 1 represents equal flux on both aspects, and values decreasing toward 0 represent a larger ratio between the S and N face (for example, a value of 0.5 corresponds to ×2 higher flux on the S face). The bottom right image shows the flux of net water availability at the rock surface that is available for infiltration (effective snowmelt + direct rain). Note that at elevations < 3000 m a.s.l fluxes are similar on both aspects, and the ratio decreases at higher elevations, but the water flux magnitudes decrease.
In this contribution, we focus on the availability of water for infiltration at the rock surface; however, the actual infiltration rate depends on the infiltration capacity of the bulk rock, including pores and fractures. Any water fluxes that exceed the infiltration capacity will not infiltrate and flow as runoff. Maréchal et al. (1999) estimated the hydraulic conductivity of the bulk crystalline rock that composes the Aiguille du Midi to be 10−8 m s−1. Since the hydraulic conductivity of the granitic rock is much lower (Bear, 1988), the actual value is controlled by the fractures in the rock – their density, aperture, and connectivity. Utilizing an empirical equation (Eq. 3) suggested by Kiraly (1969, 1994),
where k is the hydraulic conductivity (m s−1), g is gravity acceleration (9.81 m s−2), v is the kinematic viscosity of water ( m2 s−1), d is average aperture of planar fissures (m), and f is average fracture frequency (m−1), along with conservative values of fracture density of 2 m−1 and fracture aperture of 0.5 mm, we get a value that is 2 orders of magnitude higher ( m s−1) than that of Maréchal et al. (1999). If we convert our model results of effective snowmelt to the common units for hydraulic conductivity of meters per second (m s−1), we find that 95 % of the effective snowmelt occurs at rates that fall between these estimations ( m s−1), thus making infiltration capacity (or hydraulic conductivity) an important parameter for estimation of infiltration on steep fractured rock walls.
5.4 Implications of results
The new information presented here on the timing and quantity of water input at the rock surface (Figs. 5, 6) improves the understanding of thermal, hydrogeological, and mechanical processes on steep mountain rock slopes, such as the buildup of water pressure (Matsuoka, 2019; D'Amato et al., 2016) and decrease in the mechanical stability of rock walls due to permafrost degradation (Gruber et al., 2004; Gruber and Haeberli, 2007; Ravanel and Deline, 2015). The combined information on the thermal state of the ground and water input into the rock provides a potential proxy for ice content, which is highly relevant for geotechnical purposes and hazard assessments (Hoelzle et al., 2001). The results of the CryoGrid community model can also assist in assessing the snow control on the rock–atmosphere energy transfer, a factor that was recently shown to have a strong impact on active layer dynamics (Magnin et al., 2017; Haberkorn et al., 2015).
Based on the results from simulations of various elevations we suggest that rock slopes at elevations of 3600–3900 m a.s.l., where we observe a sharp transition in water availability (Fig. 8), are especially sensitive to climate change. Our simulations show that water availability increases rapidly below these elevations due to high rates of direct rainfall (rainfall on exposed rocks). In a scenario of increasing air temperature and summer rain intensity due to climate change (Pepin et al., 2022; Pepin et al., 2015), the observed nonlinear trend of water input may shift upwards to higher elevations. We thus expect that higher-elevation permafrost-affected slopes will experience an abrupt increase in water input from rainfall, which could prompt permafrost degradation and mechanical destabilization. This effect will be more prominent at transition elevations that will change from snowmelt- to rainfall-dominated input, and it will be less prominent at higher elevations that will remain snowmelt-dominated. Field observations support this hypothesis: topographic analysis of data from 209 rockfalls in the Mont Blanc massif between 2007 and 2015 (Legay et al., 2021) show that rockfalls on S-, E-, and W-facing rock walls occurred mostly at elevations of 3300-3600 m and at elevations of 3000–3300 m a.s.l on N-facing rock walls (Fig. 10), suggesting that elevation-dependent climate change is responsible for the observed peak in rockfall occurrence at the water availability transition elevation (Pepin et al., 2022, 2015). Ravanel et al. (2017) showed that during the 2003 and 2015 summer heatwaves in the Mont Blanc massif, numerous rockfalls were initiated at average elevations of 3300 and 3600 m a.s.l on the north and south faces, respectively, and that thawing and water percolation along discontinuities are the likely rockfall-triggering factors. The lower elevation of the maximum rockfall occurrence on the north face could also be related to the lower boundary of permafrost occurrence in the Mont Blanc massif (Magnin et al., 2015a). In addition, our results could be used in parameterization and forcing data in further modeling of subsurface hydrogeological processes and larger-spatial-scale analysis, as well as to study watershed hydrology in high mountain environments and the role of heat advection by water infiltration through rock fractures (Hasler et al., 2011; Magnin and Josnin, 2021).
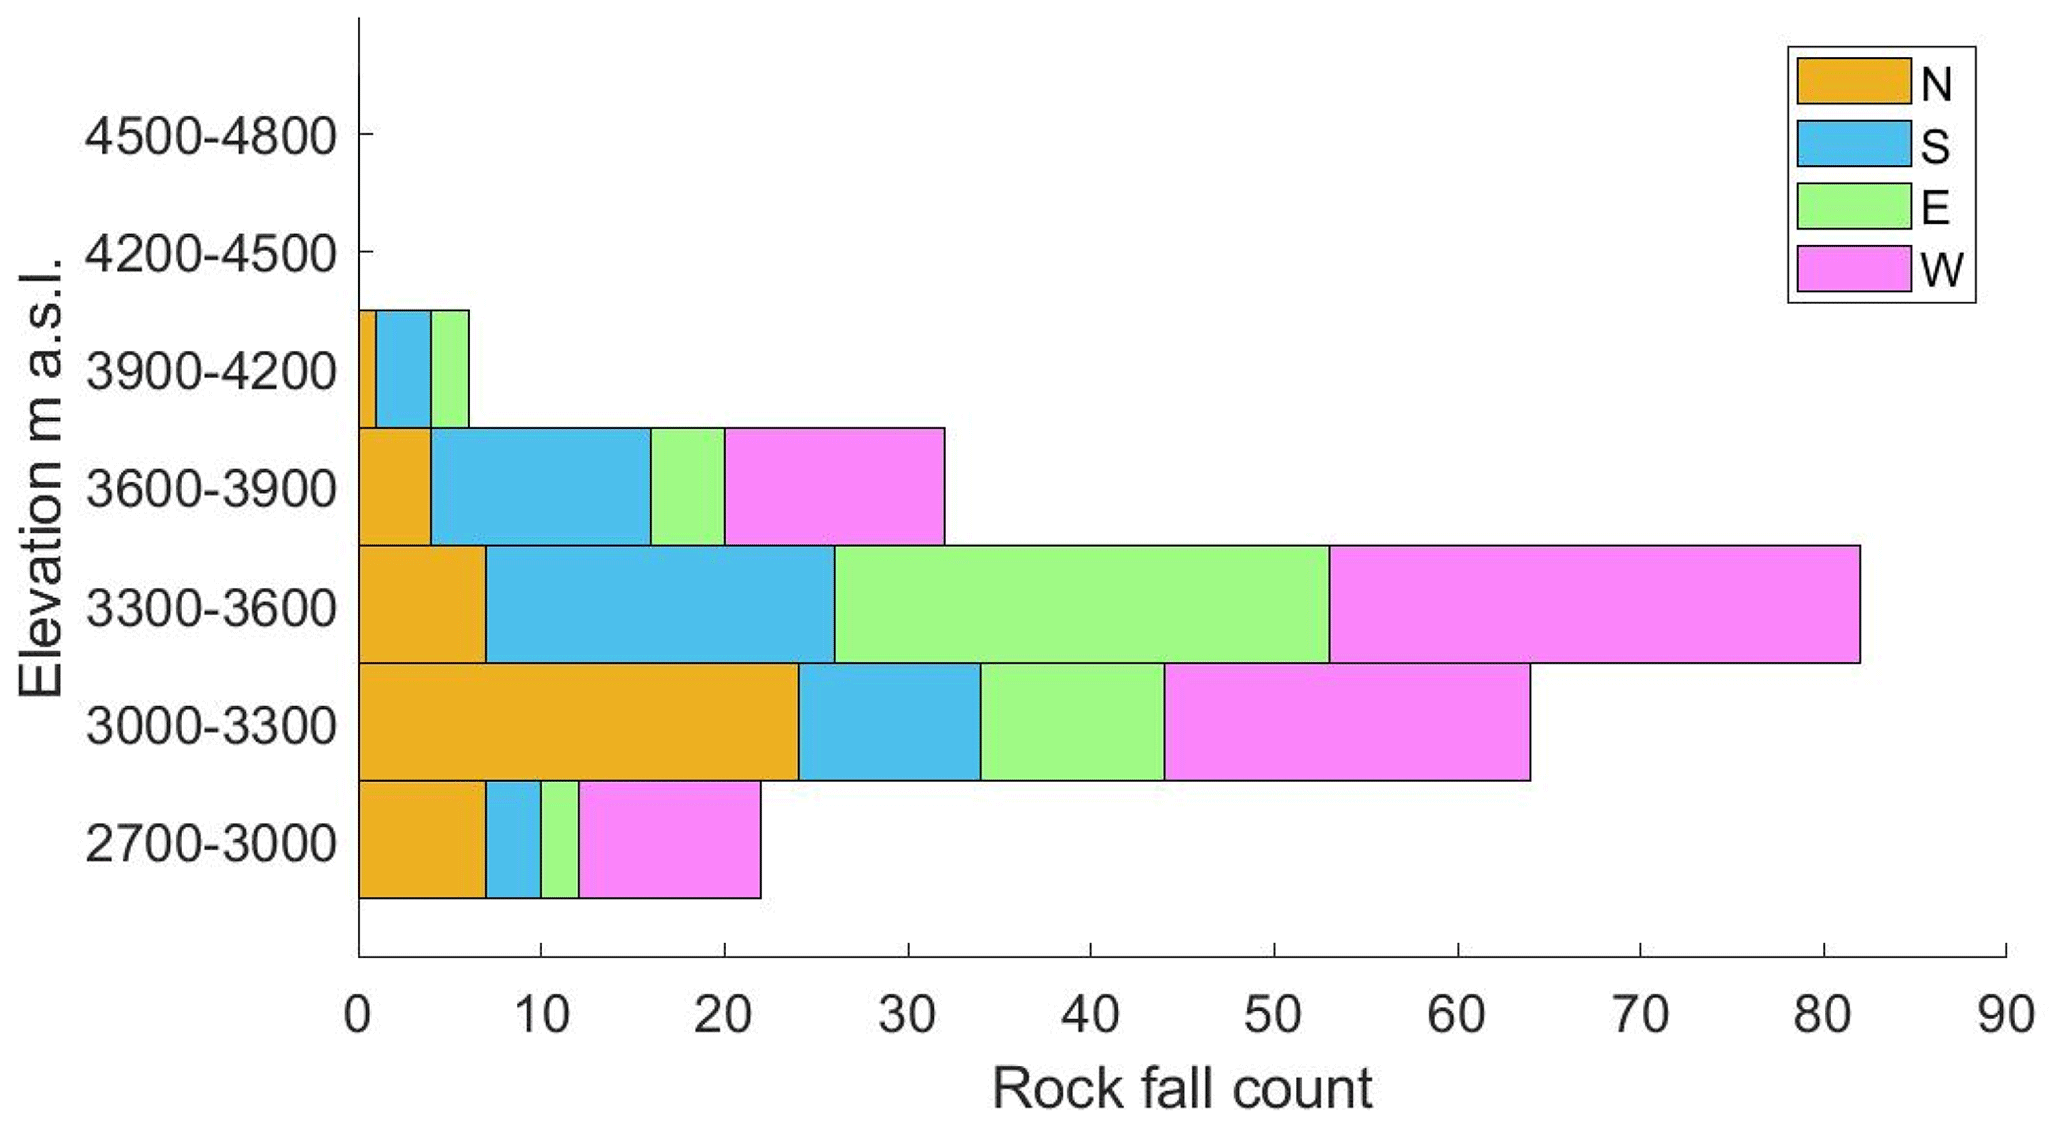
Figure 10Topographic analysis of rockfalls documented by Legay et al. (2021) in the Mont Blanc massif between 2007 and 2015. Rockfalls are most common at elevations of 3300–3600 m a.s.l. This trend is consistent for S-, E-, and W-facing slopes. On N-facing slopes, the highest occurrence is in the elevation range of 3000–3300 m.
The importance of water in driving surface processes in steep periglacial landscapes is recognized by numerous studies. However, the complexity of the physical processes related to snow hydrology and challenges of data acquisition in these extreme environments result in a major knowledge gap in the availability of water at the slope surface. Using field measurements and numerical modeling, we simulated the energy balance and hydrological fluxes on a steep high-elevation permafrost-affected rock slope at a site in Aiguille du Midi (3842 m a.s.l), in the Mont Blanc massif. We also applied the model to both north- and south-facing aspects and a range of elevations, between 2700 and 4800 m a.s.l, to study the effects of topography and micro-topography on water availability. Our results provide new insights into water balance at the surface of steep rock slopes. This includes the quantity and temporal distribution of the effective snowmelt that is available for infiltration in addition to input from rainfall and mass losses by sublimation and runoff. Our results provide essential information to improve understanding of rockfalls and rock avalanches that are sometimes thought to be triggered by water flow in fractures. We highlight the following conclusions.
-
The combined application of the S2M-SAFRAN dataset with the CryoGrid community model is a powerful tool to study cryogenic and hydrologic processes in high alpine landscapes. Such capabilities are presented in this study in a comparison of various aspects, slope angles, and elevations.
-
We estimate that at our study site, on a steep rock slope on the SE face of Aiguille du Midi, only ∼ 25 % of the snowfall accumulates. The remaining ∼ 75 % is redistributed by wind and gravity. We also found that snow accumulation thickness decreases as surface slope increases between 40 and 70∘.
-
Snowmelt occurs between late spring and early fall, and most of it does not reach the rock surface due to the formation of an impermeable ice layer at the base of the snowpack. The annual effective snowmelt that is available for infiltration is highly variable and ranges over a factor of 6, between 0.05 and 0.28 m during the period 1959–2021. The onset of effective snowmelt occurs between May and August and ends before October; it precedes the first rainfall input by 1 month on average.
-
Sublimation is the main process of snowpack mass loss in our study site.
-
Results of model simulations at various elevations show that effective snowmelt is the main source of potential water for infiltration at elevations > 3600 m a.s.l. Below 3600 m, direct rainfall becomes more dominant. The change from snowmelt-dominated to rainfall-dominated water availability is nonlinear and characterized by a rapid increase in water availability for infiltration. We suggest that this transition elevation is highly sensitive to climate change, as permafrost-affected slopes experience an abrupt increase in water input that can initiate rock failure.
Data used in this paper are available at https://doi.org/10.5281/zenodo.7224692 (Ben-Asher, 2022). The S2M-SAFRAN reanalysis atmospheric data are available at https://www.aeris-data.fr/landing-page/?uuid=865730e8-edeb-4c6b-ae58-80f95166509b (Vernay et al., 2022).
The supplement related to this article is available online at: https://doi.org/10.5194/esurf-11-899-2023-supplement.
MB and FM conceptualized and designed the research. MB analyzed the data. MB, FM, JB, EM, and JB performed fieldwork. SW developed the model and wrote the code. MB, FM, SW, JB, JB, LR, and PD wrote the paper.
The contact author has declared that none of the authors has any competing interests.
Publisher’s note: Copernicus Publications remains neutral with regard to jurisdictional claims in published maps and institutional affiliations.
We thank the Compagnie du Mont Blanc and the Aiguille du Midi station staff for their support and access to the site. We are grateful to the two anonymous reviewers, whose comments allowed us to significantly improve the paper.
This research has been supported by the Agence Nationale de la Recherche (grant no. ANR-19-CE01-0018).
This paper was edited by Frances E. G. Butcher and reviewed by two anonymous referees.
Allen, S. K., Gruber, S., and Owens, I. F.: Exploring steep bedrock permafrost and its relationship with recent slope failures in the Southern Alps of New Zealand, Permafrost Periglac., 20, 345–356, https://doi.org/10.1002/ppp.658, 2009.
Bear, J.: Dynamics of Fluids in Porous Media, Courier Corporation, 806 pp., ISBN 10 044400114X, ISBN 13 978-0444001146, 1988.
Ben-Asher, M.: Estimating surface water availability in high mountain rock slopes using a numerical energy balance model, Zenodo [data set], https://doi.org/10.5281/zenodo.7224692, 2022.
Bertini, G., Marcucci, M., Nevini, R., Passerini, P., and Sguazzoni, G.: Patterns of faulting in the Mont Blanc granite, Tectonophysics, 111, 65–106, https://doi.org/10.1016/0040-1951(85)90066-6, 1985.
Blöschl, G., Kirnbauer, R., and Gutknecht, D.: Distributed Snowmelt Simulations in an Alpine Catchment: 1. Model Evaluation on the Basis of Snow Cover Patterns, Water Resour. Res., 27, 3171–3179, https://doi.org/10.1029/91WR02250, 1991.
Boeckli, L., Brenning, A., Gruber, S., and Noetzli, J.: Permafrost distribution in the European Alps: calculation and evaluation of an index map and summary statistics, The Cryosphere, 6, 807–820, https://doi.org/10.5194/tc-6-807-2012, 2012.
Boone, A. and Etchevers, P.: An Intercomparison of Three Snow Schemes of Varying Complexity Coupled to the Same Land Surface Model: Local-Scale Evaluation at an Alpine Site, J. Hydrometeorol., 2, 374–394, https://doi.org/10.1175/1525-7541(2001)002<0374:AIOTSS>2.0.CO;2, 2001.
Bussy, F. and Von Raumer, J.: U–Pb geochronology of Palaeozoic magmatic events in the Mont-Blanc Crystalline Massif, Western Alps, Schweiz. Mineral. Petrog., 74, 514–515, 1994.
D'Amato, J., Hantz, D., Guerin, A., Jaboyedoff, M., Baillet, L., and Mariscal, A.: Influence of meteorological factors on rockfall occurrence in a middle mountain limestone cliff, Nat. Hazards Earth Syst. Sci., 16, 719–735, https://doi.org/10.5194/nhess-16-719-2016, 2016.
Draebing, D. and Krautblatter, M.: The Efficacy of Frost Weathering Processes in Alpine Rockwalls, Geophys. Res. Lett., 46, 6516–6524, https://doi.org/10.1029/2019GL081981, 2019.
Durand, Y., Brun, E., Merindol, L., Guyomarc'h, G., Lesaffre, B., and Martin, E.: A meteorological estimation of relevant parameters for snow models, Ann. Glaciol., 18, 65–71, https://doi.org/10.3189/S0260305500011277, 1993.
Dwivedi, R. D., Singh, P. K., Singh, T. N., and Singh, D. P.: Compressive strength and tensile strength of rocks at sub-zero temperature, Indian J. Eng. Mater. Sci., 5, 43–48, 1998.
Eppes, M. C. and Keanini, R.: Mechanical weathering and rock erosion by climate-dependent subcritical cracking, Rev. Geophys., 55, 470–508, https://doi.org/10.1002/2017RG000557, 2017.
Essel, B., McDonald, J., Bolger, M., and Cahalane, C.: INITIAL STUDY ASSESSING THE SUITABILITY OF DRONES WITH LOW-COST GNSS AND IMU FOR MAPPING OVER FEATURELESS TERRAIN USING DIRECT GEOREFERENCING, Int. Arch. Photogramm. Remote Sens. Spatial Inf. Sci., XLIII-B2-2022, 37–44, https://doi.org/10.5194/isprs-archives-XLIII-B2-2022-37-2022, 2022.
Evans, I. S.: An integrated system of terrain analysis and slope mapping, Z. Geomorphol., 36, 274–295, 1980.
Fierz, C., Armstrong, R. L., Durand, Y., Etchevers, P., Greene, E., McClung, D. M., Nishimura, K., Satyawali, P. K., and Sokratov, S. A.: The International Classification for Seasonal Snow on the Ground. IHP-VII Technical Documents in Hydrology No. 83, IACS Contribution No. 1, UNESCO-IHP, Paris, https://unesdoc.unesco.org/ark:/48223/pf0000186462 (last access: 24 August 2023), 2009.
Fischer, L., Amann, F., Moore, J. R., and Huggel, C.: Assessment of periglacial slope stability for the 1988 Tschierva rock avalanche (Piz Morteratsch, Switzerland), Eng. Geol., 116, 32–43, https://doi.org/10.1016/j.enggeo.2010.07.005, 2010.
French, H. M.: The Periglacial Environment, Fourth edition, ISBN 9781119132790, https://doi.org/10.1002/9781119132820, 2017.
Gardent, M., Rabatel, A., Dedieu, J.-P., and Deline, P.: Multitemporal glacier inventory of the French Alps from the late 1960s to the late 2000s, Global Planet. Change, 120, 24–37, https://doi.org/10.1016/j.gloplacha.2014.05.004, 2014.
Gruber, S. and Haeberli, W.: Permafrost in steep bedrock slopes and its temperatures-related destabilization following climate change, J. Geophys. Res.-Earth, 112, F02S18, https://doi.org/10.1029/2006JF000547, 2007.
Gruber, S., Hoelzle, M., and Haeberli, W.: Rock-wall temperatures in the Alps: Modelling their topographic distribution and regional differences, Permafrost Periglac., 15, 299–307, https://doi.org/10.1002/ppp.501, 2004.
Gruber Schmid, U. and Sardemann, S.: High-frequency avalanches: release area characteristics and run-out distances, Cold Reg. Sci. Technol., 37, 439–451, https://doi.org/10.1016/S0165-232X(03)00083-1, 2003.
Haberkorn, A., Phillips, M., Kenner, R., Rhyner, H., Bavay, M., Galos, S. P., and Hoelzle, M.: Thermal Regime of Rock and its Relation to Snow Cover in Steep Alpine Rock Walls: Gemsstock, Central Swiss Alps, Geogr. Ann. Ser. Phys. Geogr., 97, 579–597, https://doi.org/10.1111/geoa.12101, 2015.
Haberkorn, A., Wever, N., Hoelzle, M., Phillips, M., Kenner, R., Bavay, M., and Lehning, M.: Distributed snow and rock temperature modelling in steep rock walls using Alpine3D, The Cryosphere, 11, 585–607, https://doi.org/10.5194/tc-11-585-2017, 2017.
Haeberli, W. and Gruber, S.: Global Warming and Mountain Permafrost, in: Permafrost Soils, vol. 16, edited by: Margesin, R., Springer Berlin Heidelberg, Berlin, Heidelberg, 205–218, https://doi.org/10.1007/978-3-540-69371-0_14, 2009.
Haeberli, W., Noetzli, J., Arenson, L., Delaloye, R., Gärtner-Roer, I., Gruber, S., Isaksen, K., Kneisel, C., Krautblatter, M., and Phillips, M.: Mountain permafrost: development and challenges of a young research field, J. Glaciol., 56, 1043–1058, https://doi.org/10.3189/002214311796406121, 2010.
Hasler, A., Gruber, S., Font, M., and Dubois, A.: Advective heat transport in frozen rock clefts: Conceptual model, laboratory experiments and numerical simulation, Permafrost Periglac., 22, 378–389, https://doi.org/10.1002/ppp.737, 2011.
Hersbach, H., Bell, B., Berrisford, P., Hirahara, S., Horányi, A., Muñoz-Sabater, J., Nicolas, J., Peubey, C., Radu, R., Schepers, D., Simmons, A., Soci, C., Abdalla, S., Abellan, X., Balsamo, G., Bechtold, P., Biavati, G., Bidlot, J., Bonavita, M., Chiara, G., Dahlgren, P., Dee, D., Diamantakis, M., Dragani, R., Flemming, J., Forbes, R., Fuentes, M., Geer, A., Haimberger, L., Healy, S., Hogan, R. J., Hólm, E., Janisková, M., Keeley, S., Laloyaux, P., Lopez, P., Lupu, C., Radnoti, G., Rosnay, P., Rozum, I., Vamborg, F., Villaume, S., and Thépaut, J.: The ERA5 global reanalysis, Q. J. Roy. Meteor. Soc., 146, 1999–2049, https://doi.org/10.1002/qj.3803, 2020.
Hoelzle, M., Mittaz, C., Etzelmüller, B., and Haeberli, W.: Surface energy fluxes and distribution models of permafrost in European mountain areas: an overview of current developments: Surface Energy Fluxes, Permafrost Periglac., 12, 53–68, https://doi.org/10.1002/ppp.385, 2001.
Hood, J. L. and Hayashi, M.: Assessing the application of a laser rangefinder for determining snow depth in inaccessible alpine terrain, Hydrol. Earth Syst. Sci., 14, 901–910, https://doi.org/10.5194/hess-14-901-2010, 2010.
Huggel, C., Allen, S., Deline, P., Fischer, L., Noetzli, J., and Ravanel, L.: Ice thawing, mountains falling-are alpine rock slope failures increasing, Geol. Today, 28, 98–104, https://doi.org/10.1111/j.1365-2451.2012.00836.x, 2012.
Kiraly, L.: Anisotropie et hétérogénéité de la perméabilité dans les calcaires fissurés (Anisotropy and heterogeneity of permeability in fractured limestones), Eclogae Geol. Helv., 62, 613–619, 1969.
Kiraly, L.: Groundwater flow in fractured rocks: models and reality: with 15 figures (with author annotations), in: 14. Mintrop-Seminar über Interpretationsstrategien in Exploration und Produktion, 1–21, https://libra.unine.ch/entities/publication/a108a48e-b366-478d-a901-d45485c95fa7/details (last access: 15 November 2021), 1994.
Krautblatter, M., Funk, D., and Günzel, F. K.: Why permafrost rocks become unstable: A rock-ice-mechanical model in time and space, Earth Surf. Proc. Land., 38, 876–887, https://doi.org/10.1002/esp.3374, 2013.
Legay, A., Magnin, F., and Ravanel, L.: Rock temperature prior to failure: Analysis of 209 rockfall events in the Mont Blanc massif (Western European Alps), Permafrost Periglac., 32, 520–536, https://doi.org/10.1002/ppp.2110, 2021.
Lehning, M., Grünewald, T., and Schirmer, M.: Mountain snow distribution governed by an altitudinal gradient and terrain roughness, Geophys. Res. Lett., 38, L19504, https://doi.org/10.1029/2011GL048927, 2011.
Leloup, P. H., Arnaud, N., Sobel, E. R., and Lacassin, R.: Alpine thermal and structural evolution of the highest external crystalline massif: The Mont Blanc, Tectonics, 24, TC4002, https://doi.org/10.1029/2004TC001676, 2005.
Li, N., Zhang, P., Chen, Y., and Swoboda, G.: Fatigue properties of cracked, saturated and frozen sandstone samples under cyclic loading, Int. J. Rock Mech. Min., 40, 145–150, https://doi.org/10.1016/S1365-1609(02)00111-9, 2003.
López-Moreno, J. I., Soubeyroux, J. M., Gascoin, S., Alonso-Gonzalez, E., Durán-Gómez, N., Lafaysse, M., Vernay, M., Carmagnola, C., and Morin, S.: Long-term trends (1958–2017) in snow cover duration and depth in the Pyrenees, Int. J. Climatol., 40, 6122–6136, https://doi.org/10.1002/joc.6571, 2020.
MacDonald, M. K., Pomeroy, J. W., and Pietroniro, A.: On the importance of sublimation to an alpine snow mass balance in the Canadian Rocky Mountains, Hydrol. Earth Syst. Sci., 14, 1401–1415, https://doi.org/10.5194/hess-14-1401-2010, 2010.
Magnin, F. and Josnin, J.-Y.: Water flows in rock wall permafrost: A numerical approach coupling hydrological and thermal processes, J. Geophys. Res.-Earth, 126, e2021JF006394, https://doi.org/10.1029/2021JF006394, 2021.
Magnin, F., Brenning, A., Bodin, X., Deline, P., and Ravanel, L.: Modélisation statistique de la distribution du permafrost de paroi: application au massif du Mont Blanc, Géomorphologie Relief Process. Environ., 21, 145–162, https://doi.org/10.4000/geomorphologie.10965, 2015a.
Magnin, F., Deline, P., Ravanel, L., Noetzli, J., and Pogliotti, P.: Thermal characteristics of permafrost in the steep alpine rock walls of the Aiguille du Midi (Mont Blanc Massif, 3842 m a.s.l), Cryosphere, 9, 109–121, https://doi.org/10.5194/tc-9-109-2015, 2015b.
Magnin, F., Westermann, S., Pogliotti, P., Ravanel, L., Deline, P., and Malet, E.: Snow control on active layer thickness in steep alpine rock walls (Aiguille du Midi, 3842 m a.s.l., Mont Blanc massif), Catena, 149, 648–662, https://doi.org/10.1016/j.catena.2016.06.006, 2017.
Mamot, P., Weber, S., Schröder, T., and Krautblatter, M.: A temperature- and stress-controlled failure criterion for ice-filled permafrost rock joints, The Cryosphere, 12, 3333–3353, https://doi.org/10.5194/tc-12-3333-2018, 2018.
Mamot, P., Weber, S., Lanz, M., and Krautblatter, M.: Brief communication: The influence of mica-rich rocks on the shear strength of ice-filled discontinuities, The Cryosphere, 14, 1849–1855, https://doi.org/10.5194/tc-14-1849-2020, 2020.
Maréchal, J. C., Perrochet, P., and Tacher, L.: Long-term simulations of thermal and hydraulic characteristics in a mountain massif: The Mont Blanc case study, French and Italian Alps, Hydrogeol. J., 7, 341–354, https://doi.org/10.1007/s100400050207, 1999.
Marsh, P.: Water Flow through Snow and Firn, in: Encyclopedia of Hydrological Sciences, edited by: Anderson, M. G. and McDonnell, J. J., John Wiley & Sons, Ltd, Chichester, UK, hsa167, https://doi.org/10.1002/0470848944.hsa167, 2005.
Matsuoka, N.: Frost weathering and rockwall erosion in the southeastern Swiss Alps: Long-term (1994–2006) observations, Geomorphology, 99, 353–368, https://doi.org/10.1016/j.geomorph.2007.11.013, 2008.
Matsuoka, N.: A multi-method monitoring of timing, magnitude and origin of rockfall activity in the Japanese Alps, Geomorphology, 336, 65–76, https://doi.org/10.1016/j.geomorph.2019.03.023, 2019.
Mellor, M.: Mechanical properties of rocks at low temperatures, in: 2nd International Conference on Permafrost, Yakutsk, International Permafrost Association, 334–344, https://books.google.fr/books?hl=iw&lr=&id=M4SvF9Qax7EC&oi=fnd&pg=PA334&dq=mellor+Mechanical+properties+of+rocks+at+low+temperatures&ots=gtCsjQAGMO&sig=_ZPYqA9IlR2y14vOg9gm0BL6X2E&redir_esc=y#v=onepage&q=mellor Mechanical properties of rocks at low temperatures&f=false (last access: 7 March 2023), 1973.
Mineo, S. and Pappalardo, G.: Rock Emissivity Measurement for Infrared Thermography Engineering Geological Applications, Appl. Sci., 11, 3773, https://doi.org/10.3390/app11093773, 2021.
Mott, R., Schirmer, M., Bavay, M., Grünewald, T., and Lehning, M.: Understanding snow-transport processes shaping the mountain snow-cover, The Cryosphere, 4, 545–559, https://doi.org/10.5194/tc-4-545-2010, 2010.
Mourey, J., Lacroix, P., Duvillard, P.-A., Marsy, G., Marcer, M., Malet, E., and Ravanel, L.: Multi-method monitoring of rockfall activity along the classic route up Mont Blanc (4809 m a.s.l.) to encourage adaptation by mountaineers, Nat. Hazards Earth Syst. Sci., 22, 445–460, https://doi.org/10.5194/nhess-22-445-2022, 2022.
Myhra, K. S., Westermann, S., and Etzelmüller, B.: Modelled Distribution and Temporal Evolution of Permafrost in Steep Rock Walls Along a Latitudinal Transect in Norway by CryoGrid 2D, Permafrost Periglac., 28, 172–182, https://doi.org/10.1002/ppp.1884, 2017.
Pepin, N. C., Bradley, R. S., Diaz, H. F., Baraer, M., Caceres, E. B., Forsythe, N., Fowler, H., Greenwood, G., Hashmi, M. Z., Liu, X. D., Miller, J. R., Ning, L., Ohmura, A., Palazzi, E., Rangwala, I., Schöner, W., Severskiy, I., Shahgedanova, M., Wang, M. B., Williamson, S. N., and Yang, D. Q.: Elevation-dependent warming in mountain regions of the world, Nat. Clim. Change, 5, 424–430, https://doi.org/10.1038/nclimate2563, 2015.
Pepin, N. C., Arnone, E., Gobiet, A., Haslinger, K., Kotlarski, S., Notarnicola, C., Palazzi, E., Seibert, P., Serafin, S., Schöner, W., Terzago, S., Thornton, J. M., Vuille, M., and Adler, C.: Climate Changes and Their Elevational Patterns in the Mountains of the World, Rev. Geophys., 60, e2020RG000730, https://doi.org/10.1029/2020RG000730, 2022.
Phillips, M., Haberkorn, A., Draebing, D., Krautblatter, M., Rhyner, H., and Kenner, R.: Seasonally intermittent water flow through deep fractures in an Alpine Rock Ridge: Gemsstock, Central Swiss Alps, Cold Reg. Sci. Technol., 125, 117–127, https://doi.org/10.1016/j.coldregions.2016.02.010, 2016.
Phillips, M., Haberkorn, A., and Rhyner, H.: Snowpack characteristics on steep frozen rock slopes, Cold Reg. Sci. Technol., 141, 54–65, https://doi.org/10.1016/j.coldregions.2017.05.010, 2017.
Rasmussen, R., Baker, B., Kochendorfer, J., Meyers, T., Landolt, S., Fischer, A. P., Black, J., Thériault, J. M., Kucera, P., Gochis, D., Smith, C., Nitu, R., Hall, M., Ikeda, K., and Gutmann, E.: How Well Are We Measuring Snow: The NOAA/FAA/NCAR Winter Precipitation Test Bed, B. Am. Meteorol. Soc., 93, 811–829, https://doi.org/10.1175/BAMS-D-11-00052.1, 2012.
Ravanel, L. and Deline, P.: Climate influence on rockfalls in high-alpine steep rockwalls: The north side of the aiguilles de chamonix (mont blanc massif) since the end of the “Little Ice Age”, Holocene, 21, 357–365, https://doi.org/10.1177/0959683610374887, 2011.
Ravanel, L. and Deline, P.: A network of observers in the Mont-Blanc massif to study rockfall from high Alpine rockwalls, Geogr. Fis. E Din. Quat., 151–158, https://doi.org/10.4461/GFDQ.2013.36.12, 2013.
Ravanel, L. and Deline, P.: Rockfall Hazard in the Mont Blanc Massif Increased by the Current Atmospheric Warming, in: Engineering Geology for Society and Territory – Volume 1, edited by: Lollino, G., Manconi, A., Clague, J., Shan, W., and Chiarle, M., Springer International Publishing, Cham, 425–428, https://doi.org/10.1007/978-3-319-09300-0_81, 2015.
Ravanel, L., Magnin, F., and Deline, P.: Impacts of the 2003 and 2015 summer heatwaves on permafrost-affected rock-walls in the Mont Blanc massif, Sci. Total Environ., 609, 132–143, https://doi.org/10.1016/j.scitotenv.2017.07.055, 2017.
Richards, L. A.: Capillary conduction of liquids through porous mediums, Physics, 1, 318–333, https://doi.org/10.1063/1.1745010, 1931.
Rossi, M., Rolland, Y., Vidal, O., and Cox, S. F.: Geochemical variations and element transfer during shear-zone development and related episyenites at middle crust depths: insights from the Mont Blanc granite (French – Italian Alps), Geol. Soc. Lond. Spec. Publ., 245, 373–396, https://doi.org/10.1144/GSL.SP.2005.245.01.18, 2005.
Schmidt, J. U., Etzelmüller, B., Schuler, T. V., Magnin, F., Boike, J., Langer, M., and Westermann, S.: Surface temperatures and their influence on the permafrost thermal regime in high-Arctic rock walls on Svalbard, The Cryosphere, 15, 2491–2509, https://doi.org/10.5194/tc-15-2491-2021, 2021.
Sokratov, S. A. and Sato, A.: The effect of wind on the snow cover, Ann. Glaciol., 32, 116–120, https://doi.org/10.3189/172756401781819436, 2001.
Sommer, C. G., Lehning, M., and Mott, R.: Snow in a Very Steep Rock Face: Accumulation and Redistribution During and After a Snowfall Event, Front. Earth Sci., 3, 1–13, https://doi.org/10.3389/feart.2015.00073, 2015.
Sommerfeld, R. A. and Rocchio, J. E.: Permeability measurements on new and equitemperature snow, Water Resour. Res., 29, 2485–2490, https://doi.org/10.1029/93WR01071, 1993.
Strasser, U., Bernhardt, M., Weber, M., Liston, G. E., and Mauser, W.: Is snow sublimation important in the alpine water balance?, The Cryosphere, 2, 53–66, https://doi.org/10.5194/tc-2-53-2008, 2008.
Tonkin, T. N., Midgley, N. G., Cook, S. J., and Graham, D. J.: Ice-cored moraine degradation mapped and quantified using an unmanned aerial vehicle: A case study from a polythermal glacier in Svalbard, Geomorphology, 258, 1–10, https://doi.org/10.1016/j.geomorph.2015.12.019, 2016.
Vernay, M., Lafaysse, M., Monteiro, D., Hagenmuller, P., Nheili, R., Samacoïts, R., Verfaillie, D., and Morin, S.: The S2M meteorological and snow cover reanalysis over the French mountainous areas: description and evaluation (1958–2021), Earth Syst. Sci. Data, 14, 1707–1733, https://doi.org/10.5194/essd-14-1707-2022, 2022 (data available at: https://www.aeris-data.fr/landing-page/?uuid=865730e8-edeb-4c6b-ae58-80f95166509b, last access: 19 May 2022).
Vionnet, V., Brun, E., Morin, S., Boone, A., Faroux, S., Le Moigne, P., Martin, E., and Willemet, J.-M.: The detailed snowpack scheme Crocus and its implementation in SURFEX v7.2, Geosci. Model Dev., 5, 773–791, https://doi.org/10.5194/gmd-5-773-2012, 2012.
Vivero, S. and Lambiel, C.: Monitoring the crisis of a rock glacier with repeated UAV surveys, Geogr. Helv., 74, 59–69, https://doi.org/10.5194/gh-74-59-2019, 2019.
Westermann, S., Ingeman-Nielsen, T., Scheer, J., Aalstad, K., Aga, J., Chaudhary, N., Etzelmüller, B., Filhol, S., Kääb, A., Renette, C., Schmidt, L. S., Schuler, T. V., Zweigel, R. B., Martin, L., Morard, S., Ben-Asher, M., Angelopoulos, M., Boike, J., Groenke, B., Miesner, F., Nitzbon, J., Overduin, P., Stuenzi, S. M., and Langer, M.: The CryoGrid community model (version 1.0) – a multi-physics toolbox for climate-driven simulations in the terrestrial cryosphere, Geosci. Model Dev., 16, 2607–2647, https://doi.org/10.5194/gmd-16-2607-2023, 2023.
Winstral, A., Elder, K., and Davis, R. E.: Spatial Snow Modeling of Wind-Redistributed Snow Using Terrain-Based Parameters, J. Hydrometeorol., 3, 524–538, https://doi.org/10.1175/1525-7541(2002)003<0524:SSMOWR>2.0.CO;2, 2002.
Wirz, V., Schirmer, M., Gruber, S., and Lehning, M.: Spatio-temporal measurements and analysis of snow depth in a rock face, The Cryosphere, 5, 893–905, https://doi.org/10.5194/tc-5-893-2011, 2011.
Woo, M. and Heron, R.: Occurrence of Ice Layers at the Base of High Arctic Snowpacks, Arct. Alp. Res., 13, 225, https://doi.org/10.2307/1551198, 1981.
Woo, M., Heron, R., and Marsh, P.: Basal Ice in High Arctic Snowpacks, Arct. Alp. Res., 14, 251, https://doi.org/10.2307/1551157, 1982.
Zevenbergen, L. W. and Thorne, C. R.: Quantitative analysis of land surface topography, Earth Surf. Proc. Land., 12, 47–56, https://doi.org/10.1002/esp.3290120107, 1987.
Zhang, H., Aldana-Jague, E., Clapuyt, F., Wilken, F., Vanacker, V., and Van Oost, K.: Evaluating the potential of post-processing kinematic (PPK) georeferencing for UAV-based structure- from-motion (SfM) photogrammetry and surface change detection, Earth Surf. Dynam., 7, 807–827, https://doi.org/10.5194/esurf-7-807-2019, 2019.