the Creative Commons Attribution 4.0 License.
the Creative Commons Attribution 4.0 License.
 | 05 Oct 2023
Subaerial and subglacial seismic characteristics of the largest measured jökulhlaup from the eastern Skaftá cauldron, Iceland
Kristin S. Vogfjörd
Benedikt G. Ófeigsson
Matthew J. Roberts
Christopher J. Bean
Morgan T. Jones
Bergur H. Bergsson
Sebastian Heimann
Thoralf Dietrich
Subglacial floods cause seismic tremors that can be located and tracked in space and time using a seismic array. Here, we shed light on the generating mechanisms of the seismic signals observed during the largest measured flood from the eastern Skaftá cauldron in the Vatnajökull ice cap, Iceland. We track the propagation of the flood in 2015 using two seismic arrays and a local seismic network in combination with GPS, hydrological, and geochemical data. We find that as the water drained from the subglacial lake beneath the cauldron, families of icequakes were generated in the area around the cauldron, while the glacier surface gradually subsided by more than 100 m. We detected a several-hours-long, non-harmonic tremor and high-frequency transient events migrating downglacier, following the subglacial flood front. We suggest that this tremor is composed of repeating, closely spaced icequakes that were generated as the glacier was being lifted, cracked, and deformed, thus enabling the subglacial water flow. When the lake had largely drained, the pressure within the underlying hydrothermal system dropped. At this time, we recorded minute-long tremor bursts emanating from the cauldron area, followed by an hour-long harmonic tremor each. We interpret these as being caused by hydrothermal explosions in the geothermal system within the cauldron and as being vigorous boiling in the crustal rocks, respectively, which is an interpretation corroborated by floodwater geochemical signals. Finally, the flood also led to detectable tremor due to more energetic flow in the rapids near Sveinstindur in the Skaftá river. We conclude that the flood generated five different seismic signal types that can be associated with five different geophysical processes, including the wide spectrum from brittle failure and explosions to boiling and turbulent flow.
- Article
(14681 KB) - Full-text XML
- BibTeX
- EndNote


Subglacial volcanic and geothermal systems beneath glaciers cause a substantial flood hazard in areas surrounding glaciers (Waythomas et al., 2013; Björnsson, 2003; Magnússon et al., 2012; Roberts, 2005; Cook et al., 2018; Eibl et al., 2020). Glacial outburst floods, termed jökulhlaups in Icelandic, can occur through steady melting above ice-covered geothermal areas (Björnsson, 2003, 2010), through melting by magma–ice interaction during a volcanic eruption (Björnsson, 2003; Gudmundsson et al., 1997; Sturkell et al., 2008), and through the release of water stored in subglacial or marginal lakes dammed by glaciers (Björnsson, 1976; Roberts et al., 2005; Bartholomaus et al., 2015; Grinsted et al., 2017; Lindner et al., 2020; Livingstone et al., 2019; Behm et al., 2020) or moraines (Cook et al., 2018). Improving the understanding of the source processes and generation mechanisms of subglacial floods is challenging, as (i) the flood has to be detected beneath several hundred metres of ice; (ii) instruments are either difficult to maintain on the ice and on nunataks within the ice or they are located outside the glacier, far from the signal-generating source; and (iii) seismic signals accompanying a flood are often weak, non-impulsive, long-lasting, and lacking in discernible seismic phases and are therefore intrinsically difficult to analyse to extract the source location and mechanism.
In close proximity to rivers, it has been found that long-lasting seismic signals referred to as tremors are generated both by turbulent flow and bedload transport in the rivers (Burtin et al., 2011; Gimbert et al., 2014, 2016; Schmandt et al., 2013). The tremor amplitude correlates with the discharge (Hsu et al., 2011; Burtin et al., 2008), as was recently confirmed in a glacial environment by Bartholomaus et al. (2015) and Gimbert et al. (2016), where Bartholomaus et al. (2015) correlated the tremor amplitude at 1.5 to 10 Hz measured at 1 to 5 km distance with the discharge, while Gimbert et al. (2016) explained the tremor amplitude between 2 to 12 Hz as being due to turbulent flow interacting with the bed roughness. However, both aforementioned studies suggest that at more than 1 km distance, the seismic signal caused by turbulent water flow dominates over the signal caused by bedload transport.
At larger distances, the seismic signal linked to turbulent water flow still needs to be distinguished from other possible tremor sources. In a glacial environment, there are a variety of possible tremor sources (Podolskiy and Walter, 2016), including resonating water-filled cracks or channels (Röösli et al., 2014; Chapp et al., 2005; Winberry et al., 2009; Heeszel et al., 2014; Lindner et al., 2020), englacial water flow in a moulin (Röösli et al., 2014, 2016; Lindner et al., 2020), regularly repeating icequakes (MacAyeal et al., 2008; Winberry et al., 2013; Müller et al., 2005; Lindner et al., 2020; Behm et al., 2020; Lipovsky and Dunham, 2016), and hydrothermal boiling (Leet, 1988; Montanaro et al., 2016). The tremor signals from these different sources need to be characterized and distinguished from flood-related tremor, observed during subglacial floods, as some might indicate hazardous migrating processes, while others might be stationary, non-hazardous, and “normal background” processes. Furthermore, despite various reports on seismic signals such as quakes and tremor before and during subglacial floods (Winberry et al., 2009; Bartholomaus et al., 2015; Lindner et al., 2020; Behm et al., 2020), a thorough and continuous tracking of flood migration beneath the ice from the draining lake to the glacier terminus was only recently achieved by Eibl et al. (2020) for four subglacial floods in Iceland. At 10 to 52 km distance, they detect a migrating tremor source with peak frequency at 1.3 Hz.
Iceland is an ideal place to study subglacial flood-related seismic signals, as there are multiple subglacial floods per year which produce detectable signals such as tremor (Eibl et al., 2020). In several glaciological, geomorphological, or hydrological studies (Böðvarsson et al., 1999; Einarsson, 2009; Einarsson et al., 2016; Old et al., 2005; Roberts et al., 2003), researchers used 1 min averages of filtered seismic signals to exhibit the evolution and characteristics of different jökulhlaups. These filtered signals suggest that the seismic character of subglacial floods changes with time, where, in particular, floods draining subglacial high-temperature geothermal areas exhibit the following characteristics: a period of quakes intermixed with or followed by a weak tremor that is followed by strong tremor bursts. If no network stations are located near the flood path, then the weak tremor is usually not detected above the background noise. Due to a lack of continuous data, sparse seismic networks and uncertainties in the timing of the subglacial propagation of these floods, there has so far been little in-depth, seismological analysis of this type of activity and the processes that might generate it. A comprehensive overview of the different sources generating seismic signals in glacier environments and various commonly applied seismic analysis methods can be found in Podolskiy and Walter (2016).
In 2013, we installed a multidisciplinary network at Vatnajökull glacier, consisting of seismic arrays outside the glacier margin, and seismic and GPS stations within the glacier. The network was specifically designed to (i) monitor subglacial floods from west Vatnajökull and (ii) was used to demonstrate a real-time early-warning capability. Eibl et al. (2020) tracked four subglacial floods with peak discharges in the range of 210 to 3000 m3 s−1 using one seismic array, which is a cluster of closely spaced sensors capable of resolving the direction to the tremor source and the apparent speed of the waves across the array. They concluded that large floods travel faster than smaller floods and that seismic arrays can be used to detect the floods several hours in advance of the hydrological network located in the area outside the glacier margin, thereby allowing an improved early warning of oncoming floods. The study, however, did not delve into a detailed examination of the different types of seismic events associated with the floods, which would be crucial for a better understanding and robust interpretation of the signals.
Here, we focus on an in-depth analysis of the largest of the four subglacial floods, a flood emanating from the eastern Skaftá cauldron in Vatnajökull from 28 September to 2 October 2015, with the goal of characterizing the different seismic signals associated with the flood to understand the generating mechanism, while being aided by an analysis of other multidisciplinary data, such as geodetic observations of the glacier movements and its response to the subglacial flood and hydrological and geochemical data recording the volume, flow, and dissolved chemicals in the floodwater (Sect. 3). We track the flood beneath the glacier and in the affected glacial river. We analyse icequakes, four tremor sources, and one noise source detected in the seismic data from the local seismic network, SIL, and the two arrays in the context of the geochemical data (Sect. 4.1). We describe the located icequakes (Sect. 4.2), weak persistent tremor (Sect. 4.3), transient high-frequency events (Sect. 4.4), strong tremor bursts and harmonic tremor tails (Sect. 4.5), and the tremor and noise of the river (Sect. 4.6) in detail. We discuss the flood initiation (Sect. 5.1), the tremor generation during the flood propagation in the context of the known flood path (Sect. 5.2), the tremor generation in the cauldron area in the context of the pressure drop (Sect. 5.3), and the tremor from the river (Sect. 5.4). Finally, we put the propagation speed of the flood into a global context (Sect. 5.5). Our paper will be a reference for the further detection and classification of seismic signals associated with flood-related geophysical processes.
Localized geothermal melting of ice at the base of a glacier causes the formation of a depression in the glacier surface, which is often surrounded by cylindrically symmetric crevasse patterns. The depression leads to a decrease in the ice overburden pressure and consequently forces geothermal meltwater, geothermal fluids, percolating rainwater, and surface meltwater to accumulate beneath the cauldron. Water accumulates as a subglacial lake until the water pressure is close to the ice-overburdened pressure at the location of the weakest seal near the edge of the lake. The lake drains rapidly through the seal after outflow begins (Björnsson, 1977, 1988, 2003).
Two subglacial lakes in the western part of Vatnajökull ice cap, southeastern Iceland, 10 and 15 km WNW of Grímsvötn volcano, are the source of regular jökulhlaups in the Skaftá river (Fig. 1; Björnsson, 2003; Jóhannesson et al., 2007). The eastern and western cauldron each have a width of 1–3 km, depth of 50–150 m, and host ca. 100 m deep subglacial lakes at their highest stage shortly before jökulhlaups are released (Jóhannesson et al., 2007). Combined, they drain approximately 65 km2 of the ice cap (Pálsson et al., 2014). Finite-element ice flow calculations show that ice surface depressions caused by the emptying of the subglacial lakes are considerably larger than the footprint of the corresponding waterbody at the glacier bed (Einarsson et al., 2017).
Jökulhlaups from the Skaftá cauldrons into the Skaftá river catchment have been observed since 1955 (Zóphóníasson, 2002; Björnsson, 1977; Þórarinsson and Rist, 1955). Floods earlier than 1955 may have taken alternate drainage pathways outside the ice margin into Langisjór lake without leading to noticeable floods in the river course further downstream (Björnsson, 1977; Tómasson and Vilmundardóttir, 1967). The jökulhlaups occur every 1 to 5 years from each cauldron, with volumes of 0.05 to 0.4 km3 and maximum discharge rates of 50 to 3000 m3 s−1 (Björnsson, 1977, 1992; Zóphóníasson, 2002). The locations of the flood paths were estimated based on the gradient of the hydraulic potential derived from radio echo sounding studies of the ice thickness and bedrock topography beneath the ice (Björnsson, 1986, 1988). The geometry of the hydraulic potential based on the radio echo sounding measurements and the observed outlet locations of jökulhlaups at the ice margin of Skaftárjökull outlet glacier indicates that the location of the subglacial flood path shown in Fig. 1 has remained the same since jökulhlaups in Skaftá were first reported in the 1950s.
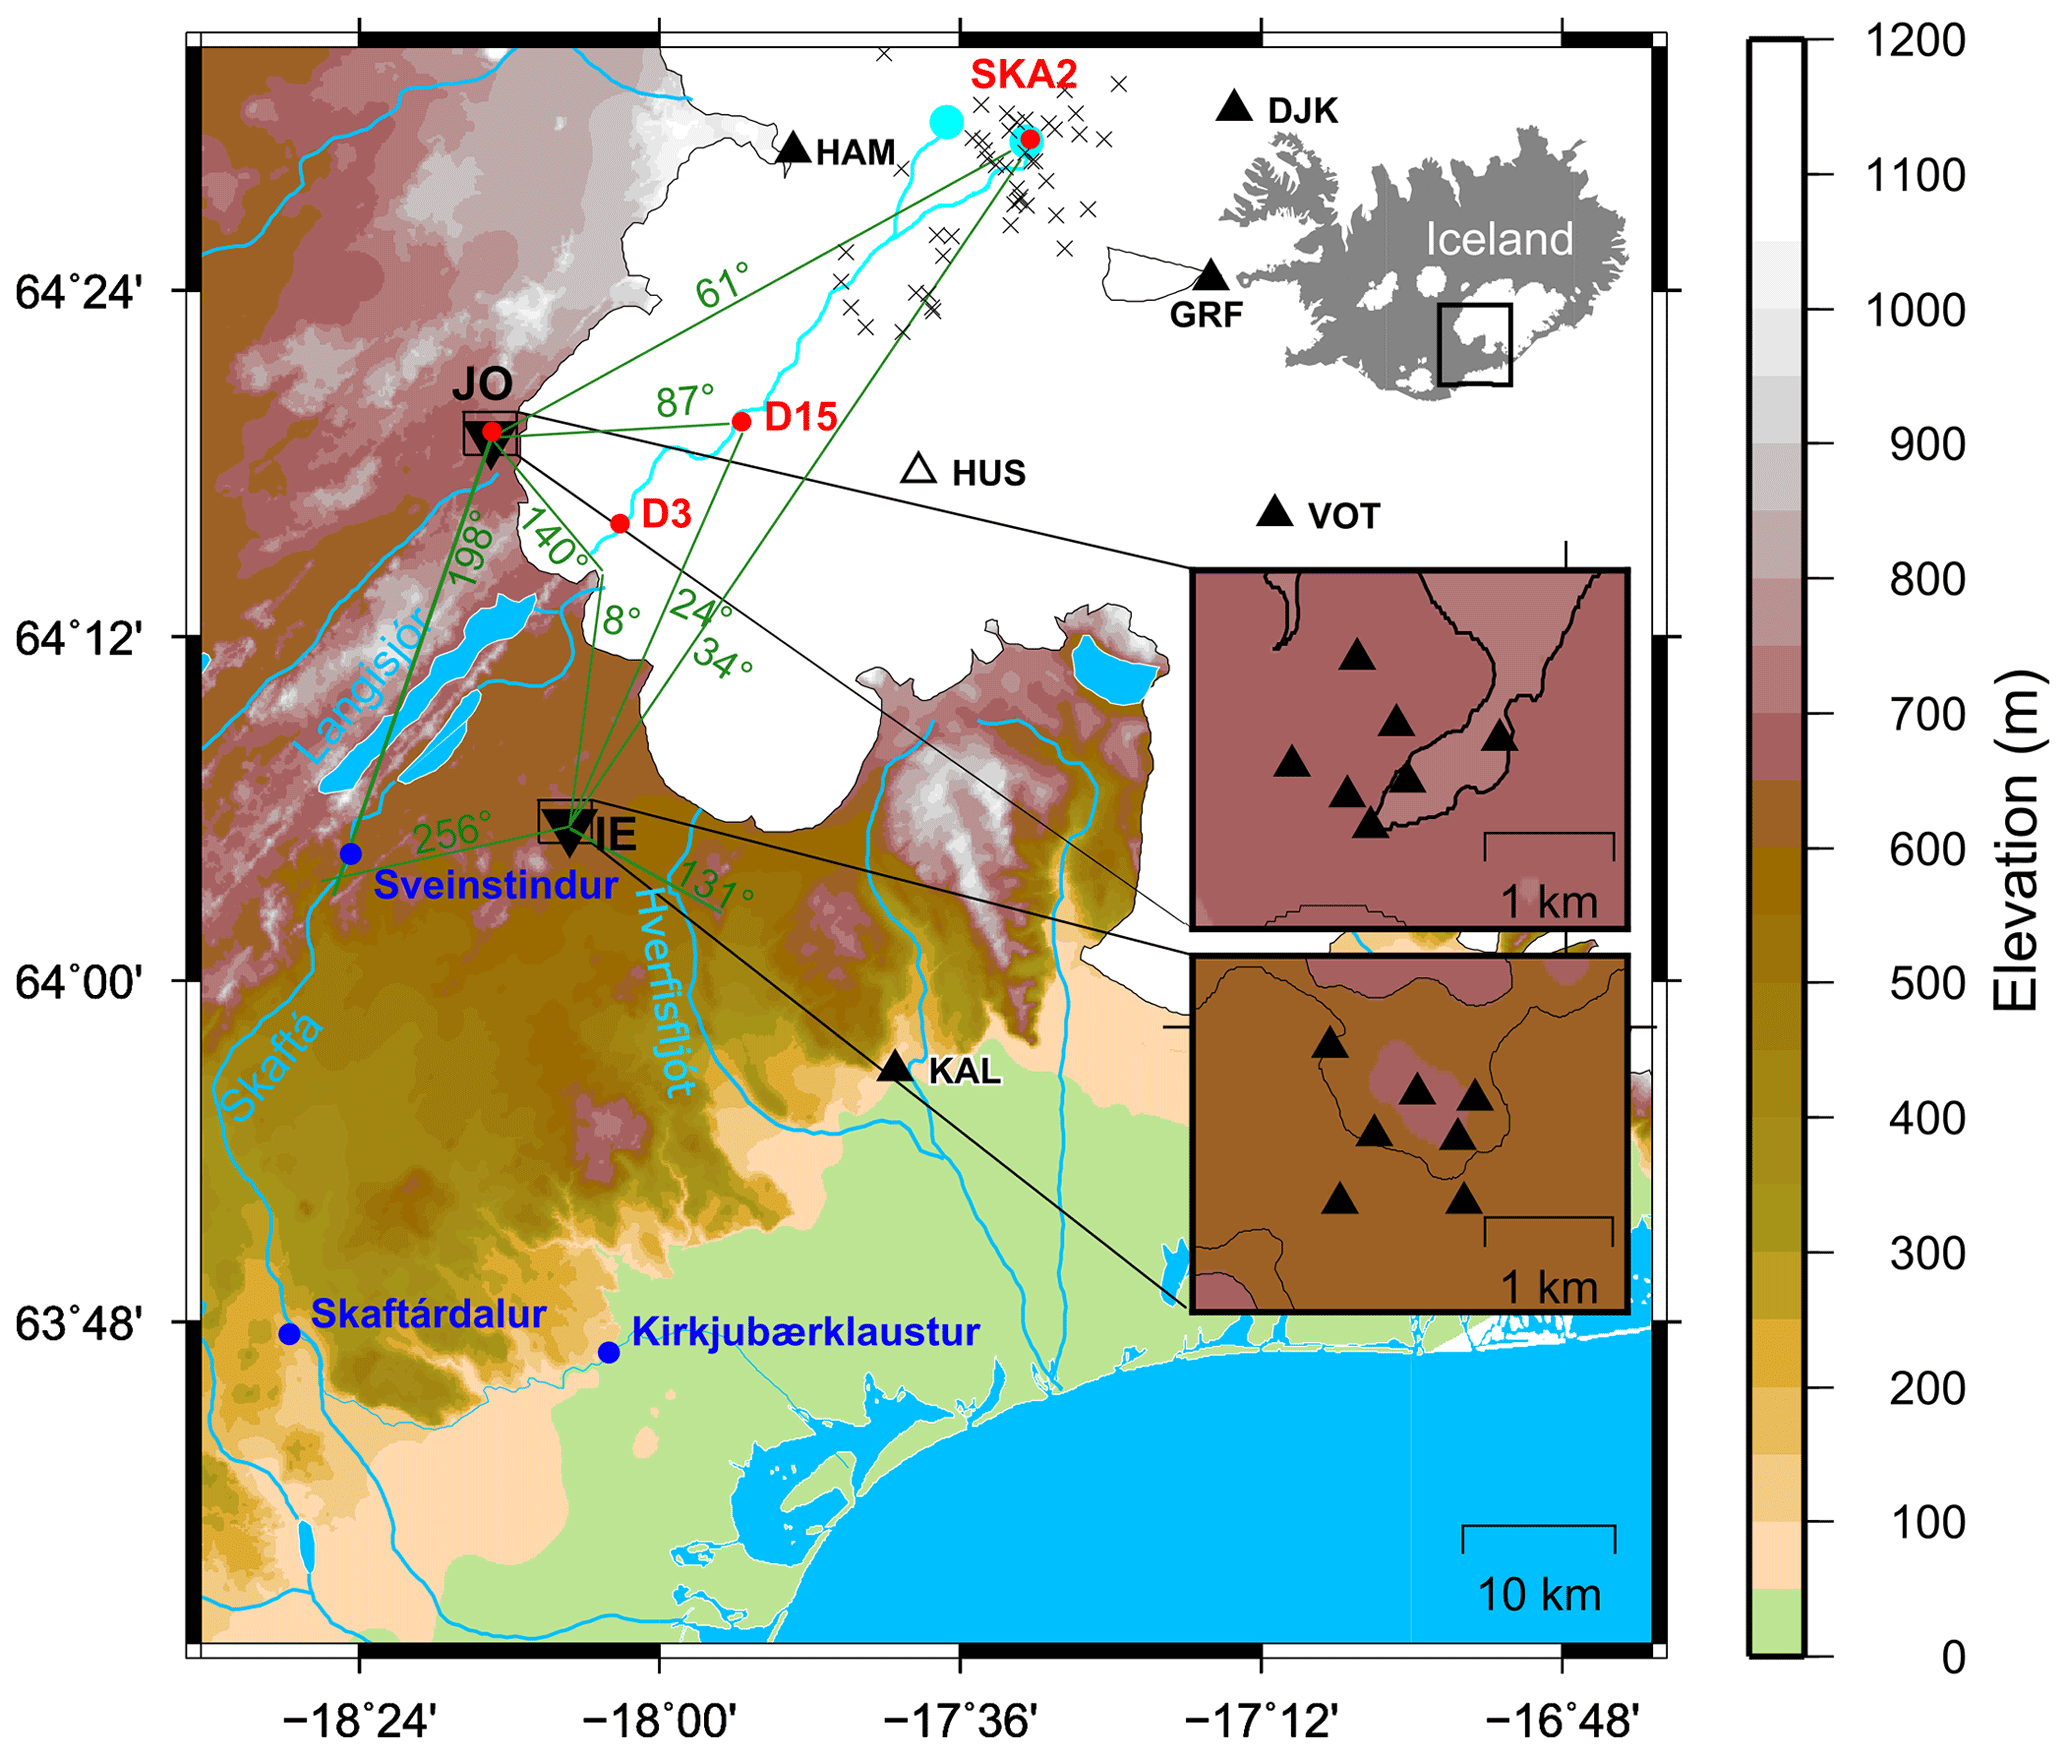
Figure 1Instrument network on and west of the Vatnajökull ice cap monitoring the 2015 jökulhlaup in the Skaftá river. The eastern and western cauldrons (cyan dots) and subglacial and subaerial flood path (cyan lines; Björnsson, 1986, 1988) are marked. The locations of Jökulheimar (JO) and Innri-Eyrar (IE) seismic arrays (both black inverted triangles), single seismic stations (black triangles, which are shown as outlines only if not working during the jökulhlaup), the GPS instruments (red dots), and hydrological stations (blue dots) are indicated. Locations of quakes are marked with black × signs, and the back azimuths from JO and IE are shown as green lines with numbers. Note the two back azimuths from the IE array that point to the Svartifoss waterfall in the river Hverfisfljót to the east and rapids in Skaftá river near Sveinstindur to the west. The insets show an overview of Iceland, with glaciers marked in white (top), the geometry of the JO array (middle), and geometry of the IE array (bottom).
3.1 Seismic network and seismic array
The seismic signals generated by the flood were recorded using two seismic arrays (clusters of seismometers) operated by the Dublin Institute for Advanced Studies (DIAS) with an aperture of 1.6 km (black inverted triangles in Fig. 1) and the Icelandic Meteorological Office's (IMO) national seismic network, SIL (Böðvarsson et al., 1996; Böðvarsson and Lund, 2003; black triangles in Fig. 1).
In the Vatnajökull region, the SIL network consists of broadband (Güralp Systems Ltd., 3ESPC model, 60 s and 120 s; Güralp Systems Ltd., 6T Flute model, 10 s; Trillium Compact, 20s model; Geotech Instruments, LLC, KS-2000 model, 100 s) and short period (Lennartz electronic GmbH i.L., 5s model) stations, where some are installed on nunataks and others within the ice. This network monitored the seismic activity associated with the flood. The closest stations DJK, HAM, and GRF at 13–15 km distance from the draining cauldron recorded both quakes and tremor, but event locations, which mostly relied on P and S wave arrivals at the three to seven closest stations, were hampered by emergent onsets, small magnitudes, and low signal-to-noise ratios, as well as station failures (HUS and horizontal components of DJK) and frequent earthquakes from the Bárðarbunga volcano following its eruption in 2014/2015 (Sigmundsson et al., 2014). As a result, only a few events were located by the automatic SIL system. A review of the seismic network records, as part of this study, has enabled the location and magnitude determination of 45 events near the cauldron and the flood path (Fig. 1) between 28 September and 2 October, using the SIL analysis software and velocity model (Rögnvaldsson and Slunga, 1993; Stefansson et al., 1993). Hypocentral location uncertainties are, however, rather large and up to 2–4 km in some cases.
The telemetered arrays, specifically installed to record subglacial floods, consist of seven stations (six three-component Güralp 6TDs (30 s to 100 Hz) and one three-component Güralp 3ESPCD (60 s to 50 Hz)) at Jökulheimar (JO; centred at the SIL station JOK) and Innri-Eyrar (IE; centred at the SIL station IEY), which is southwest of Vatnajökull at 38–52 km distance from the cauldron (5L seismic network; Bean and Vogfjörd, 2020). During a flood, these arrays can be used to locate and track the emergent, long-lasting, and low-amplitude tremor. As preprocessing steps, we detrend, instrument-correct, and down-sample the recordings to 20 Hz and divide them into 1 h long time windows. At the JO array, local noise sources dominate at 1 Hz, while the flood-related signal was strongest around 1.3 Hz and clearly detectable above the noise. Our analysis and interpretation here is mainly based on the results from one array (JO) and the a priori knowledge of the subglacial flood path.
3.1.1 Array data analysis in the time and frequency domain
FK analysis in the frequency domain
We performed frequency–wavenumber (FK) analysis on the array data, using the vertical component of the signal filtered between 1.2 and 2.6 Hz with a moving 18 s long time window. as described in Capon (2009) and implemented in Beyreuther et al. (2010) and Megies et al. (2011). We repeated the analysis using only the northern and eastern components to assess the dominance of the river noise. We did not rotate the horizontal components to radial and transverse before the analysis, since we face a migrating source. As a consequence, we here only discuss and show the derived back azimuths for the horizontal components but not the slownesses. A grid search for maximum power was carried out in a horizontal slowness grid with a step size of 0.02 s km−1 and limits of ±1.0 s km−1. The resulting time series contain back azimuth and slowness, which reflect the direction and steepness of the dominant incoming wave, respectively. Time windows with a semblance of less than 0.3 were discarded. The semblance is defined as the ratio of the coherent energy to the total energy in the waveform stack within the time windows of analysis (e.g. Kennett, 2000).
The uncertainty in the back azimuth and slowness estimates based on the array geometry is estimated using the width of the peak in the array response function in the horizontal slowness grid. We determine the back azimuth and slownesses of all points that have a power of at least 95 % of the maximum (Eibl et al., 2017a). We discard points with an uncertainty in the back azimuth greater than 12∘ and uncertainty in slowness greater than 0.2 s km−1. The resulting mean uncertainty for each back azimuth or slowness estimate was 4.2 and 3.0∘ in back azimuth and 0.04 and 0.03 s km−1 in slowness at JO and IE array, respectively. When binning back azimuth estimates over a longer time period, it becomes apparent whether the tremor is emitted at a spatially confined location, as indicated by little variation in the back azimuth with time, or whether the tremor source comprises a larger region, as indicated by scattering in the back azimuth with time.
Beam stacking in the time domain
In addition, we performed beam stacking in the time domain as an alternative to FK analysis in a frequency band from 5 to 20 Hz, using a moving time window of 0.5 s. Though similar to FK analysis, it is more efficient for very short time windows. The same settings were used for the slowness grid and the required minimum semblance. We also discard time steps where the corresponding absolute slowness was above 0.3 s km−1. Though not strictly necessary for stable results, the latter limit was introduced to exclude parameter ranges where the array aperture may be too large for the analysed frequency range. This second type of processing was introduced after a visual inspection of the waveforms had shown that certain transient signals were too short and of a frequency that was too high to be detected with the lower-frequency FK analysis targeting the flood-related tremor sources. Most of these events are not visible at the SIL stations. These events are further discussed in the context of the tremor generation.
3.1.2 Root median square amplitude
To additionally assess the tremor amplitude, we calculated the root median square (RMeS) of the seismic recordings. The data were instrument-corrected, detrended, tapered, and filtered between 1.0 and 2.0 Hz. The vertical component of the velocity seismogram of one seismometer in each array was divided into 60 min long time windows, and the RMeS was calculated. The time window was then shifted, allowing 75 % overlap. Calculating the RMeS instead of the root mean square (rms) strengthens the tremor signal, while giving less weight to shorter events such as earthquakes (Eibl et al., 2017a). To assess the spectral characteristics of the seismograms and enhance the continuous signals in the tremor, spectrograms were created using window lengths of 64 to 256 s and an overlap of 50 %–70 %. We calculate spectra of up to 45 min long time windows. For this, we split the data into 1 min long non-overlapping time windows, calculate the spectrum for each time window, and stack the resulting spectra to enhance dominant frequencies.
3.1.3 Template matching
To find additional signals of distinct and possibly repeating earthquakes or icequakes, we first used a short time average (STA)- and long time average (LTA)-based event detector implemented in Snuffler software (Heimann et al., 2017) to find template events. This STA LTA-based detector calculates the ratio of a STA window and a LTA window (Allen, 1982). It was set up with a short window of 30 s and a long window of 90 s, which was centred over the short window. We applied it to the three-component waveforms of the JO and IE arrays that were filtered in the frequency range of 1 to 15 Hz. We normalized the STA and LTA traces for each component separately, averaged them, and then used peak detection with a threshold of 0.3 to define the detections. With this procedure, we found 615 events between 28 September and 5 October 2015 and used these as templates in the following cross-correlation search.
For each template, we cut out time windows of 60 s and calculated cross-correlations (with a moving window normalization) for all components at all stations of the IE and JO arrays to find similar, weaker events. Both the template and continuous waveforms were filtered between 1 and 15 Hz. The continuous cross-correlation signals (between template and continuous waveform) of the individual stations and components were stacked and normalized by the number of contributing stations and components in each processing time window separately. Detections were defined where the stacked and normalized cross-correlation value exceeded a value of 0.2. Higher cross-correlation values are not reached because both the template and the matched event are noisy, the noise levels at some stations are higher, and the length of the template is longer than the event's signal. The average background level of the cross-correlation of the event templates with continuous waveforms is of the order of 0.015. Against this, a value of 0.2 is highly significant and only reached when the signals of both events arrive at all contributing stations and components without any differential time delays and also only when the coda of both events is qualitatively very similar (Fig. A1 in the Appendix). The resulting catalogue consisted of 669 events. While the template matching produced only about 9 % more detections than the STA LTA-based detector, we noticed a significant number of cross-detections between the templates. These were further analysed by event-wise cross-correlation and cluster analysis.
3.1.4 Event clustering
To find potential clusters of seismicity, we analysed the waveform similarity of the 669 events from the template-matching catalogue. In our first attempt, we used the waveforms at the JO array for the clustering. However, the waveforms were too similar and hence only sorted into one cluster. We tried several stations and finally present the results from station HAM, as this station is close to most of the sources, contains little noise and shows the highest waveform variability for the events in the catalogue (Sect. 3.1.3). This was the seismic instrument closest to the flood path where all three components were operational over the time interval of our analysis. We cut time windows of 60 s around each event, filtered the waveforms to the frequency range of 1 to 6 Hz, and calculated pairwise cross-correlations, keeping their maximum values and time lags for all event combinations. The cross-correlation maximum values were used to form a precomputed distance matrix for the OPTICS clustering algorithm (Ankerst et al., 1999), as implemented in the scikit-learn package (Pedregosa et al., 2011). We used (1−C)p with p=8 as the measure of distance, where C is the normalized cross-correlation maximum of an event pair. A total of 203 events was clustered into 20 different clusters, and the remaining 466 events were left unclustered by the algorithm. The exact number of clusters formed and the fraction of events which were put into the clusters depended on the value of p and on the tuning parameters of the OPTICS algorithm, but the overall picture obtained was robust, which we verified by a visual inspection of the waveforms in each cluster. For further inspection, we extracted back azimuth and slowness at the JO array from the already-computed list of back azimuths used for the tremor study (Sect. 3.1.1).
3.2 GPS and hydrological measurements
A streaming Trimble NetRS GPS instrument was installed by the IMO near the centre of the eastern cauldron (SKA2) from July 2014 to October 2015 for early-warning purposes. Two additional identical GPS instruments were installed above the subglacial flood path on the glacier at 15 and 3 km distance from the ice terminus (D15 and D3, respectively; Fig. 1 and Einarsson et al., 2016). Mainly instrument D15 was used to constrain the travel time of the subglacial jökulhlaup. Instrument D3 was washed away when a small part of the floodwater hydrofractured through the ice. However, it was found during the following summer on the surface of the glacier. Data were recovered from the internal memory card and used to constrain the speed of the subglacial flood wave, although the data do not contain information about the movement of the ice during the flood at this location. The GPS data were processed using the GAMIT track utility software (Herring et al., 2015) with the continuous GPS station at JOKU in Jökulheimar as the base.
Hydrological data of the Skaftá river were obtained from IMO's pressure sensor stage meters at Sveinstindur, 28 km downstream of the glacier margin, and Skaftárdalur, 40 km downstream of Sveinstindur (Fig. 1) and include the river level, electric conductivity, and water temperature. The river level was used to calculate the flood discharge using a rating curve.
4.1 Propagation of the subglacial flood according to GPS and hydrological measurements
Based on the GPS and hydrological instruments, the flood started to propagate in the early hours of 30 September and reached instrument D15 at 17:30 UTC on the same day and the hydrological station 25 km downstream at 04:00 UTC on 1 October. However, the GPS instrument SKA2 already recorded a slow subsidence from noon on 27 September. A slowly increasing outflow of water from the subglacial lake of the order of a few cubic metres per second started at this time, but the water was stored subglacially near the cauldron for about 3 d (Fig. 2a).
The subglacial lake emptied rapidly, and the 300 m thick ice shelf dropped by approximately 60 m in 24 h. The subsidence of SKA2 on top of the ice shelf slowed down rather abruptly at a lowering of about 66 m, accelerated again and subsided by another 17 m by 3 October (Fig. 6a). It should be noted that at the end of the subsidence, the GPS instrument was not located at the deepest part of the cauldron. Mapping of the ice surface geometry of the cauldron after the jökulhlaup showed two deep pits that had lowered by close to 40 m more than that at the centre; this was probably caused by local maxima in the geothermal heat flux from geothermal vents at the glacier bottom, which melt large domes into the bottom of the ice shelf. The continued slower subsidence recorded by the GPS instrument may have been caused by the local collapse of such thinner areas of the ice shelf.
The flood started to lift the overlying ice at D15 for 1 d, reaching a maximum of approximately 1 m at 16:00 UTC on 1 October (Fig. 2a). The flood was accompanied by an order of magnitude increase in the horizontal velocity of the glacier to 1–2 m d−1. The glacier surface then subsided over a 2 d period back to the level before the jökulhlaup. While the subsidence in the cauldron hovered at around 66 m, the flood lifted instrument D15 to its maximum height.
While the deformation at instrument D15 was high, we detected 40–100 high-frequency transient signals per hour (Fig. 3), featuring semblance values of more than 0.35 on the JO array from the lowermost 15 km of the glacier (Fig. A3 in the Appendix). The background rate before the flood arrived at instrument D15 is 0–10 transients per hour (Table 1). Some events featured clear body wave arrivals. Our detector, however, did not find more of these clear events but instead found coherent body wave energy that closely followed the flood front. Interestingly, the initial water front was followed by seismicity from 90 to 120∘ between 00:00 and 03:30 UTC on 1 October. At the same time, the detected type 1 tremor was strongest at the terminus. During the largest lifting of the ice sheet, the transient seismicity on the lowermost 15 km died down (Fig. 3).
The D3 instrument detected no changes in the glacier motion before midnight on 30 September. The flood must, therefore, have arrived later at this location, which is 3 km from the ice terminus. As the river stage and conductivity rapidly increased from 04:00 UTC on 1 October (Fig. 2b), the flood front most likely reached the ice terminus between 01:00 and 02:00 UTC and fractured the ice at several locations 1–3 km from the terminus. These outbreaks were marked by up to 3–5 m high and 10 m wide ice fragments on the surface of the glacier, alongside debris deposited from the floodwater. Towards the ice terminus, the fragments decreased in size, down to a few centimetres or tens of centimetres in diameter near the ice margin. After the first pulse, water continued to flow beneath the ice to outlets at the margin. The transient, high-frequency events support an arrival at the ice terminus shortly after midnight on 1 October (Fig. 3).
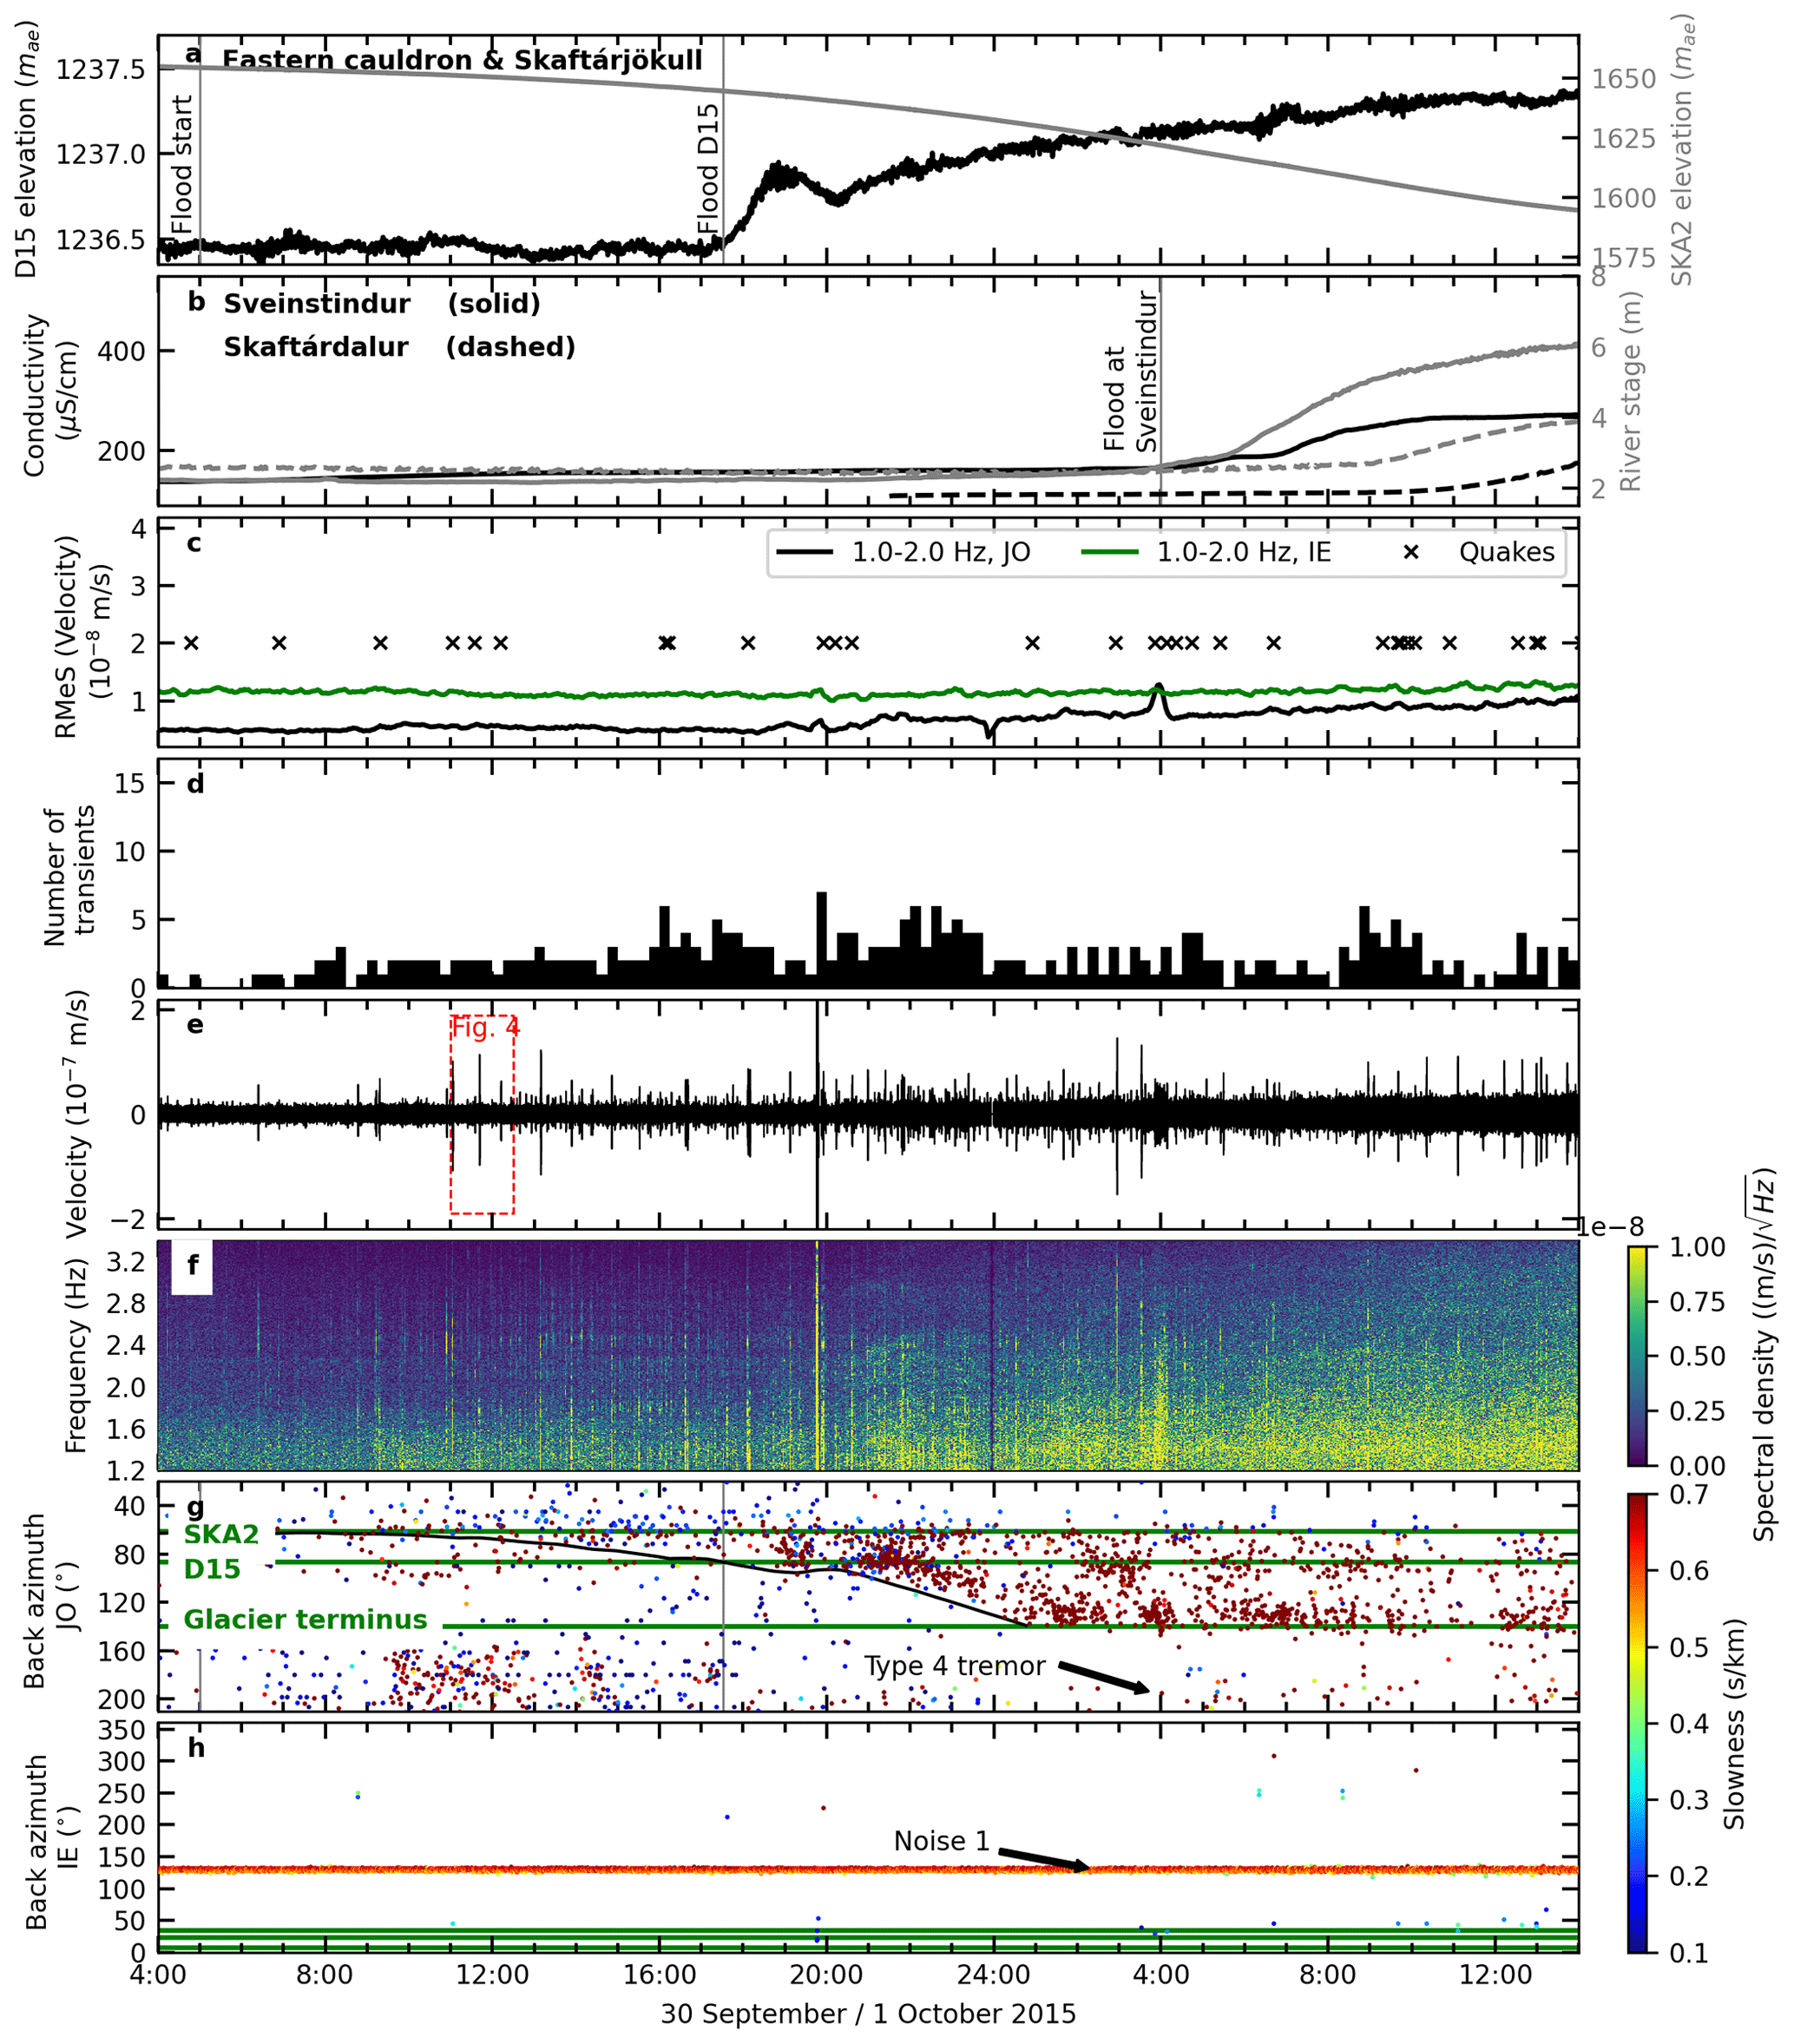
Figure 2Subglacial type 1 tremor followed the migrating flood front in September–October 2015 (for station locations, see Fig. 1). Grey lines mark important events during the flood, as detected by various instruments for comparison with the tremor. Panels (a), (b), (e), and (f) are redrawn from Eibl et al. (2020). (a) The elevation of GPS instruments in the eastern cauldron (SKA2) and on Skaftárjökull (D15) above the GRS80 or WGS84 ellipsoid (67.23 m at D15 and 67.72 m at SKA2). (b) River stage (grey; right y axis) and electrical conductivity (black; left y axis) of Skaftá river measured at Sveinstindur (solid lines) and in Skaftárdalur (dashed lines). (c) Root median square (RMeS) of the seismic amplitude filtered from 1 to 2 Hz at the JO and IE arrays. The occurrence times of the located quakes (Fig. 1) are marked with black × signs. (d) Number of events detected with STA LTA and template matching. (e) Vertical velocity seismogram from 04:00 UTC on 30 September to 12:00 UTC on 1 October 2015 filtered between 1.2 and 3.4 Hz. Some of the “spikes” in the figure are not part of the tremor but rather short quakes from the cauldron area or earthquakes in other nearby locations like Bárðarbunga volcano (see Fig. 4). (f) Amplitude spectrogram made with a fast Fourier transform window length of 256 s and 50 % overlap. (g) Dots indicate the dominating back azimuth at the JO array in each 18 s long time window (FK analysis in Sect. 3.1.1) coloured according to slowness. Horizontal green lines, respectively, mark the back azimuth of signals from the eastern Skaftá cauldron, at instrument D15, and the point where the Skaftá river emerges from under the glacier (see Fig. 1). The black curve shows changes in back azimuth at JO corresponding to a point migrating along the flood path (Fig. 1) with a constant velocity of 2 km h−1 and passing D15 at 17:30 UTC on 30 September. Panel (h) is the same as panel (g) but for the IE array.
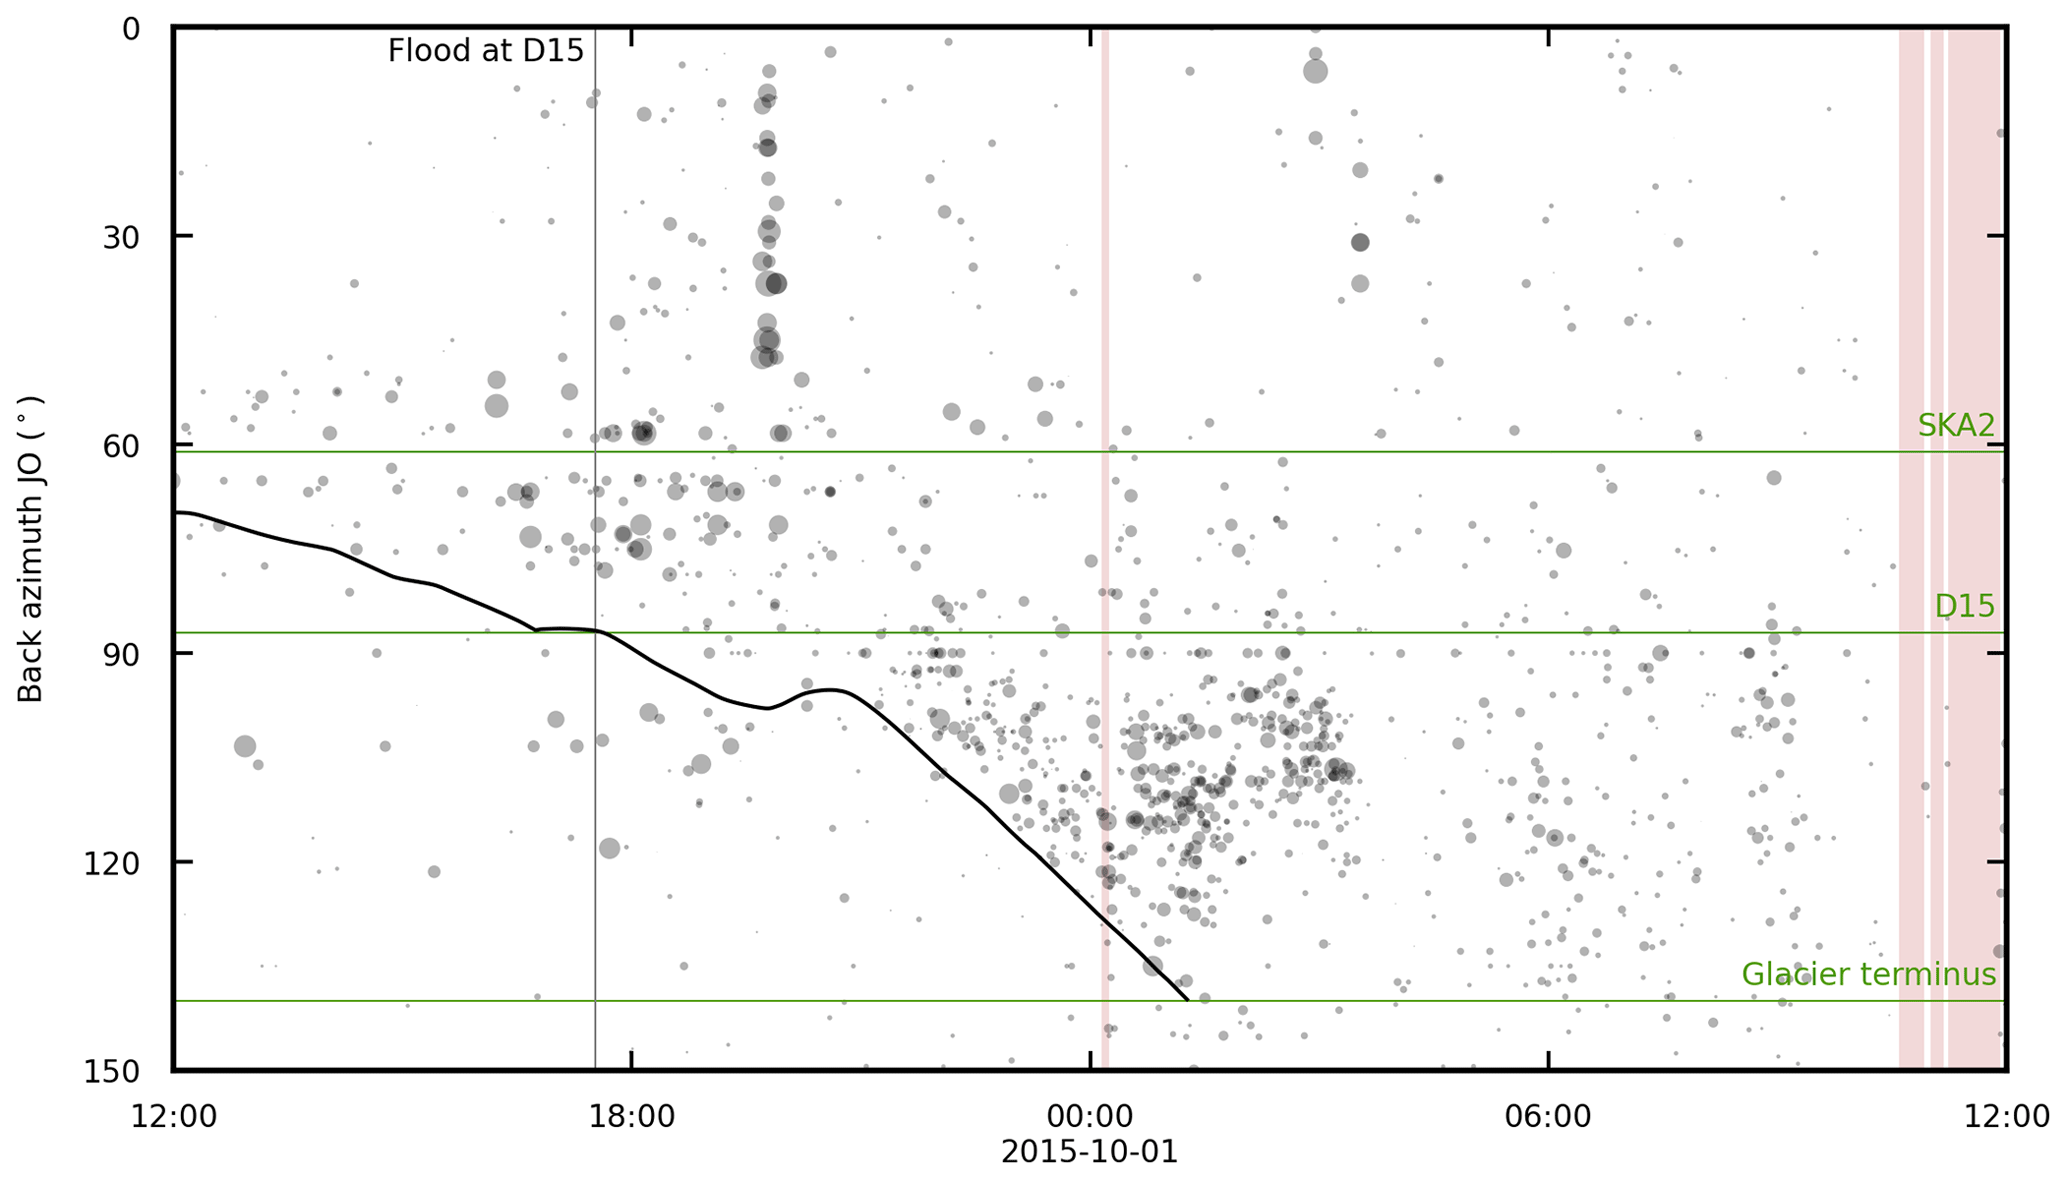
Figure 3Transients detected by beam stacking on data filtered from 5 to 20 Hz (Sect. 3.1.1). The size of the points indicates the semblance at which all values are above 0.35 and slownesses are between 0.1 and 0.3 s km−1 (P waves only). Data gaps are highlighted with light red background. The vertical grey line indicates the flood arrival at D15 (17:31 UTC on 30 September). Black and green lines are as shown in Fig. 2g.
4.2 Flood initiation and quakes recorded on closest seismic stations (SIL)
Seismic records from HAM and DJK, the stations closest to the draining cauldron, show that the onset of cauldron subsidence and the slow outflow of water on 27 September did not immediately trigger seismic activity in the cauldron area. The first located quake occurs 16 h later in the early hours of 28 September, which is within a 4 km distance west of the cauldron centre (Table 1; Figs. 1 and 2c). Only two events of M 0.7 were located on that day in the cauldron area and another two smaller events in the afternoon and evening of the following day. On 30 September when the cauldron subsidence started accelerating, the seismic activity also escalated to well over 100 events per hour in the afternoon (Fig. 2c to e).
However, because of the small magnitudes and overlapping signals, only 12 events could be located. Five of them were southwest of the cauldron area, either along or in the vicinity of the subglacial flood path. The location of the first such event, 13 km from the cauldron at 11:03 UTC on 30 September, supports the inference from the GPS and hydrological data that the flood front had started propagating from the cauldron area at around 04:00 UTC in the morning. The high seismic activity continued into 1 October, when the cauldron subsidence was the fastest, until around 14:00 UTC, when both the seismicity and rate of subsidence swiftly decreased. In this period, another 19 events could be located, of which 7 were along or near the flood path. As the seismicity decreased, signs of tremor bursts appeared; the first one was at 12:15 UTC on 1 October and continued through 2 October when they were the dominant activity on the seismic records. During this final phase, 10 additional events were located in the cauldron area and 2 were along or near the flood path.
A total of 45 seismic events were located in the cauldron area, mostly within 4 km distance from the centre, and along or near the upper part of the subglacial flood path (Fig. 1). Their source depths were located predominantly near the surface, with 33 events within 1 km of the surface. Event magnitudes range from ML 0 to ML 1.6. No events were located along the lower half of the subglacial flood path. Due to the emergent event onsets and small signal-to-noise ratios, the event locations have considerable uncertainty. However, they mostly cluster within the expected source areas, and the recorded signals show the expected characteristics of the shallow source depth and propagation in the near-surface, which result in long P and S wave trains and the dominance of low frequencies (Vogfjörd and Langston, 1996; Fig. A2 in the Appendix). The frequency content above background is from 1–8 Hz for the smallest events and 1–15 Hz for the largest (Fig. 4a and b). The duration of the signals on the array stations is around 30–35 s (Fig. 4c). Dominant frequencies are at 1–3 Hz.
In total, 39 of those 45 events are also detected through our STA LTA and template matching (see Sect. 3.1.3), and 22 of them are sorted into a cluster. We hence interpret the 22 quakes that are sorted into a cluster as icequakes, and the remaining ones are classified as earthquakes in the shallow crust.
We used these 45 quakes to test our arrays for a systematic bias in the back azimuth for signals coming from that direction and depth. The source locations were used to calculate the expected back azimuths at the JO and IE arrays. After performing FK analysis on these events, we could compare the expected back azimuths and array-derived back azimuths. Due to a low signal-to-noise ratio, only 17 events could be used at the JO array and 12 events at the IE array. For these quakes, the array-determined back azimuths were on average 9.3∘ too low at the JO array and 10.1∘ too high at the IE array. It is likely that the back azimuths are systematically shifted due to heterogeneities in the seismic velocity structure under western Vatnajökull, which is related to volcanic ridges beneath the ice cap striking NNE–SSW. We keep this in mind when discussing the potential tremor source locations, as this systematic shift may be expected to affect the tremor sources as well if they originate in the same region. Squinting arrays with systematic offsets between the actual source and array back azimuths were reported in (Eibl et al., 2017b; Krueger and Weber, 1992; Schweitzer, 2001). Due to the short signal duration compared to the length of the moving time window in the array analysis, the events do not affect the calculated back azimuth of the tremor.
4.3 Seismic tremor related to the advancing subglacial flood front (type 1)
We subdivide the seismic tremor into four types based on the back azimuth direction and possible migration with time, the spectral content, amplitude strength, and evolution with time (Table 1). When the subglacial flood started to propagate from the cauldron, it was accompanied by a migrating tremor source (type 1) and transient high-frequency events that we only detected at the JO array (Fig. 2f). While the flood front arrived at instrument D15 at ca. 17:30 UTC on 30 September (Fig. 2a), stronger type 1 tremor started at 18:40 UTC in an area about 1 km farther downstream. D15 reached its maximum elevation about 20 h later, while the strongest tremor came from a location farther south and became weak at the last 8 km of the subglacial flood path. Along the whole flood path, the type 1 tremor was strongest in regions of adverse bedrock slope (upslope flow about 35 km down the flood path) and close to the ice terminus (Fig. 2a and g). The back azimuth of the type 1 tremor and the high-frequency transients first reached 140∘ at 01:30 UTC on 1 October. This strong tremor close to the ice terminus might be linked to the hydrofracturing of the ice that happened about 3 km upstream of the ice terminus. However, the tremor near the terminus was also exceptionally strong from 01:30 to 02:45 UTC and 03:35 to 04:09 UTC on 1 October (Fig. 2g). In general, we can conclude that the type 1 tremor was generated in an area spanning up to 20∘, as measured from the JO array, which migrated downglacier with time.
The black line in Fig. 2g shows the back azimuth corresponding to a point migrating along the flood path at 2 km h−1 that crosses instrument D15 at 17:30 UTC on 30 September. It aids the visual interpretation of the tremor back azimuths, as this curve shows how the location and shape of the flood path map into changes in the back azimuth with time. It indicates that most of the tremor back azimuth is consistent with source locations upstream of a migrating flood front with a rather constant propagation speed near 2 km h−1. Tremor is further generated in an elongated area, as the tremor is visible for up to 12 h at some locations.
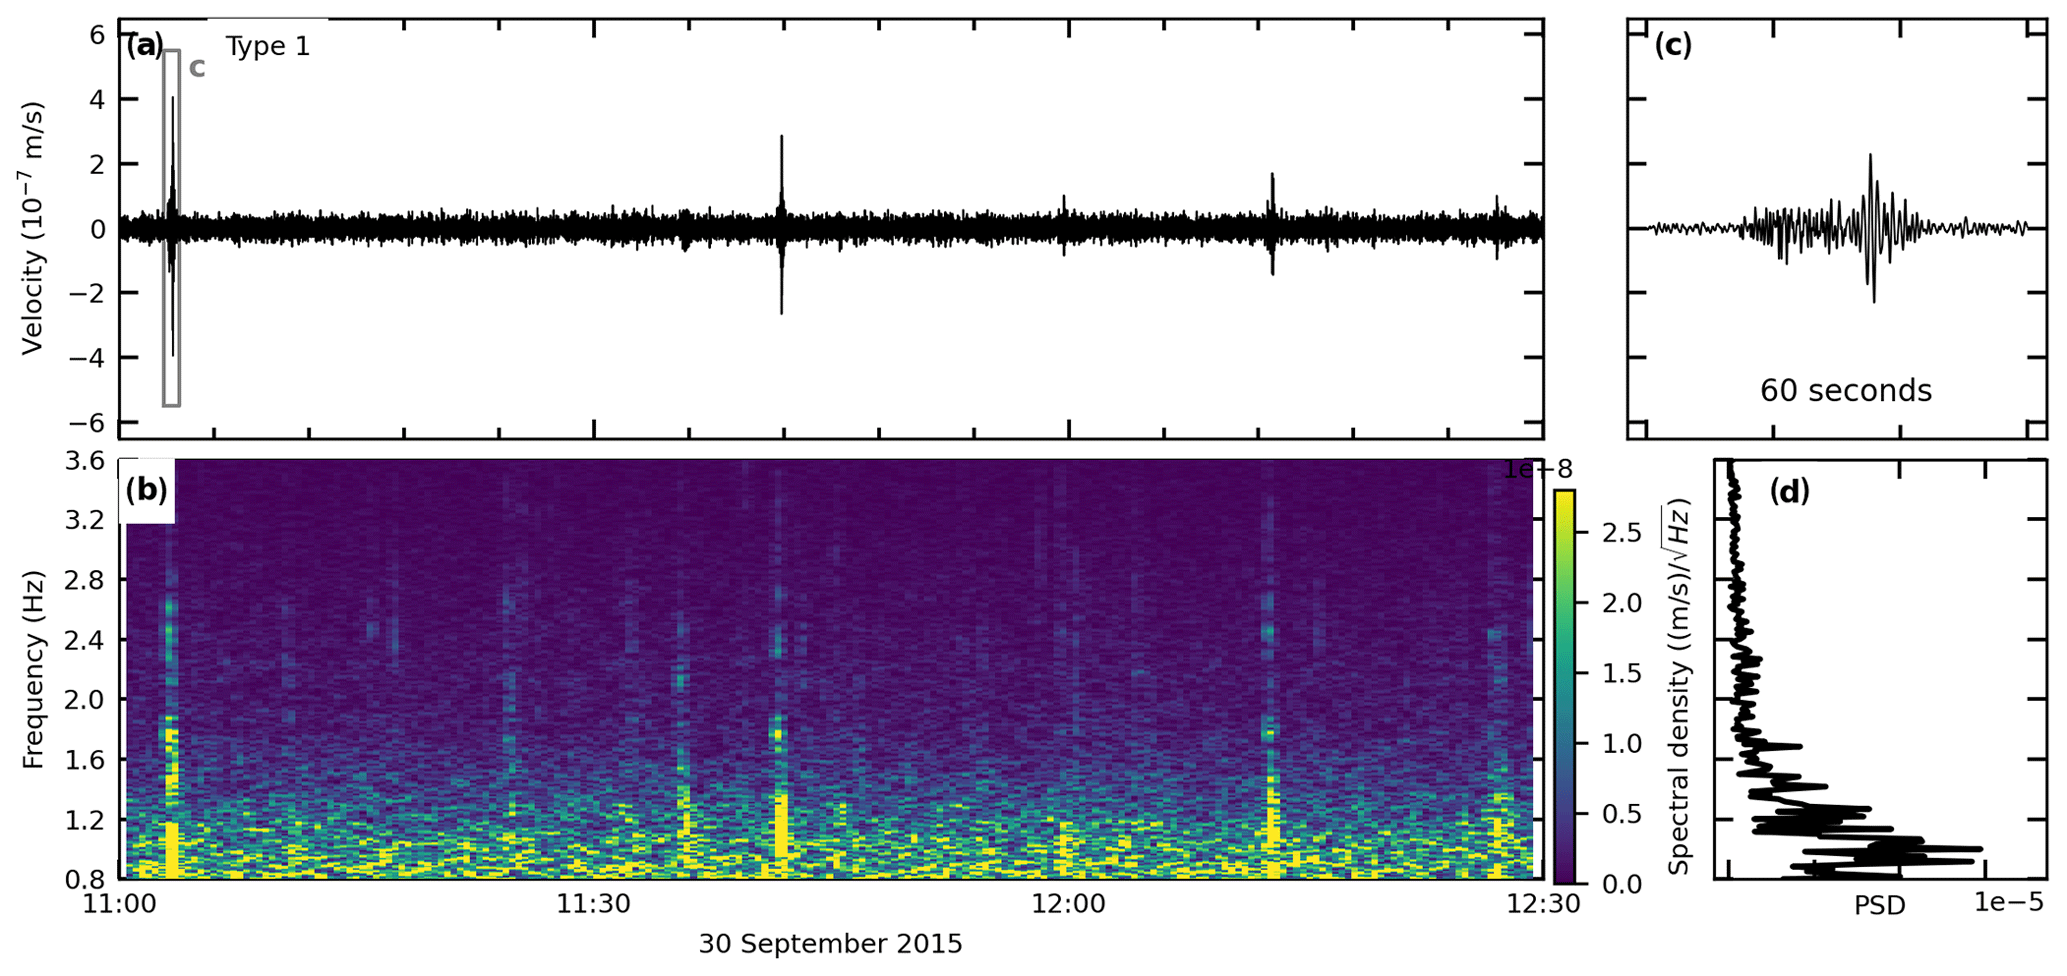
Figure 4Icequakes followed the start of the flood. (a) Seismogram between 11:00 and 12:30 UTC on 30 September 2015, which was filtered between 0.8 and 3.6 Hz. (b) Amplitude spectrogram made with a fast Fourier transform window length of 64 s and 70 % overlap. (c) The 1 min long time window showing a discrete event filtered between 1 and 8 Hz. (d) The spectrum of panel (b).
4.4 Icequakes originating from the cauldron area
A total of 669 seismic events were visible both on the JO array and the stations from the SIL network near the cauldron (Fig. 5a and b). Back azimuths derived from the JO array indicate that most of these events originated in the cauldron area. Waveform-similarity-based clustering at station HAM (Sect. 3.1.4) revealed that about 30 % of these could be grouped into up to about 20 families of highly similar events (Fig. 5c). A visual inspection of the waveforms also shows high similarity between the families. This type of seismicity started at 23:24 UTC on 29 September and ended at 12:38 UTC on 3 October, with high activity occurring between 08:29 UTC on 30 September and 04:45 UTC on 1 October. The clusters were active for different time spans but with significant overlap. For example, the cluster shown in blue in Fig. 5 was active over the entire time span of high activity.
The remaining unclustered events mainly fall into three categories. A major part showed qualitatively similar waveforms in the frequency content, duration, and waveform pattern as being the clustered events when inspected visually but were possibly too weak or too noisy to be picked up by the clustering algorithm. A second part could be attributed to bursts of high energy within the type 2 and type 3 tremor. The remainder were mostly unrelated regional events not originating from the cauldron or glacier.
In the frequency range analysed with this method, no distinct events originating from the flood propagation path could be identified with certainty. The back azimuths associated with the clustered events is 50 to 70∘ from the JO array, while the slowness is in the range of 0.7 to 0.9 s km−1. The events of all clusters lie in this range without any clear pattern. This is in accordance with the similar waveforms that we noticed across clusters. Note that the back azimuth shown in Fig. 5 may be incorrect for some events due to simultaneous arrival of the type 1 tremor in the processing time window of the array analysis.
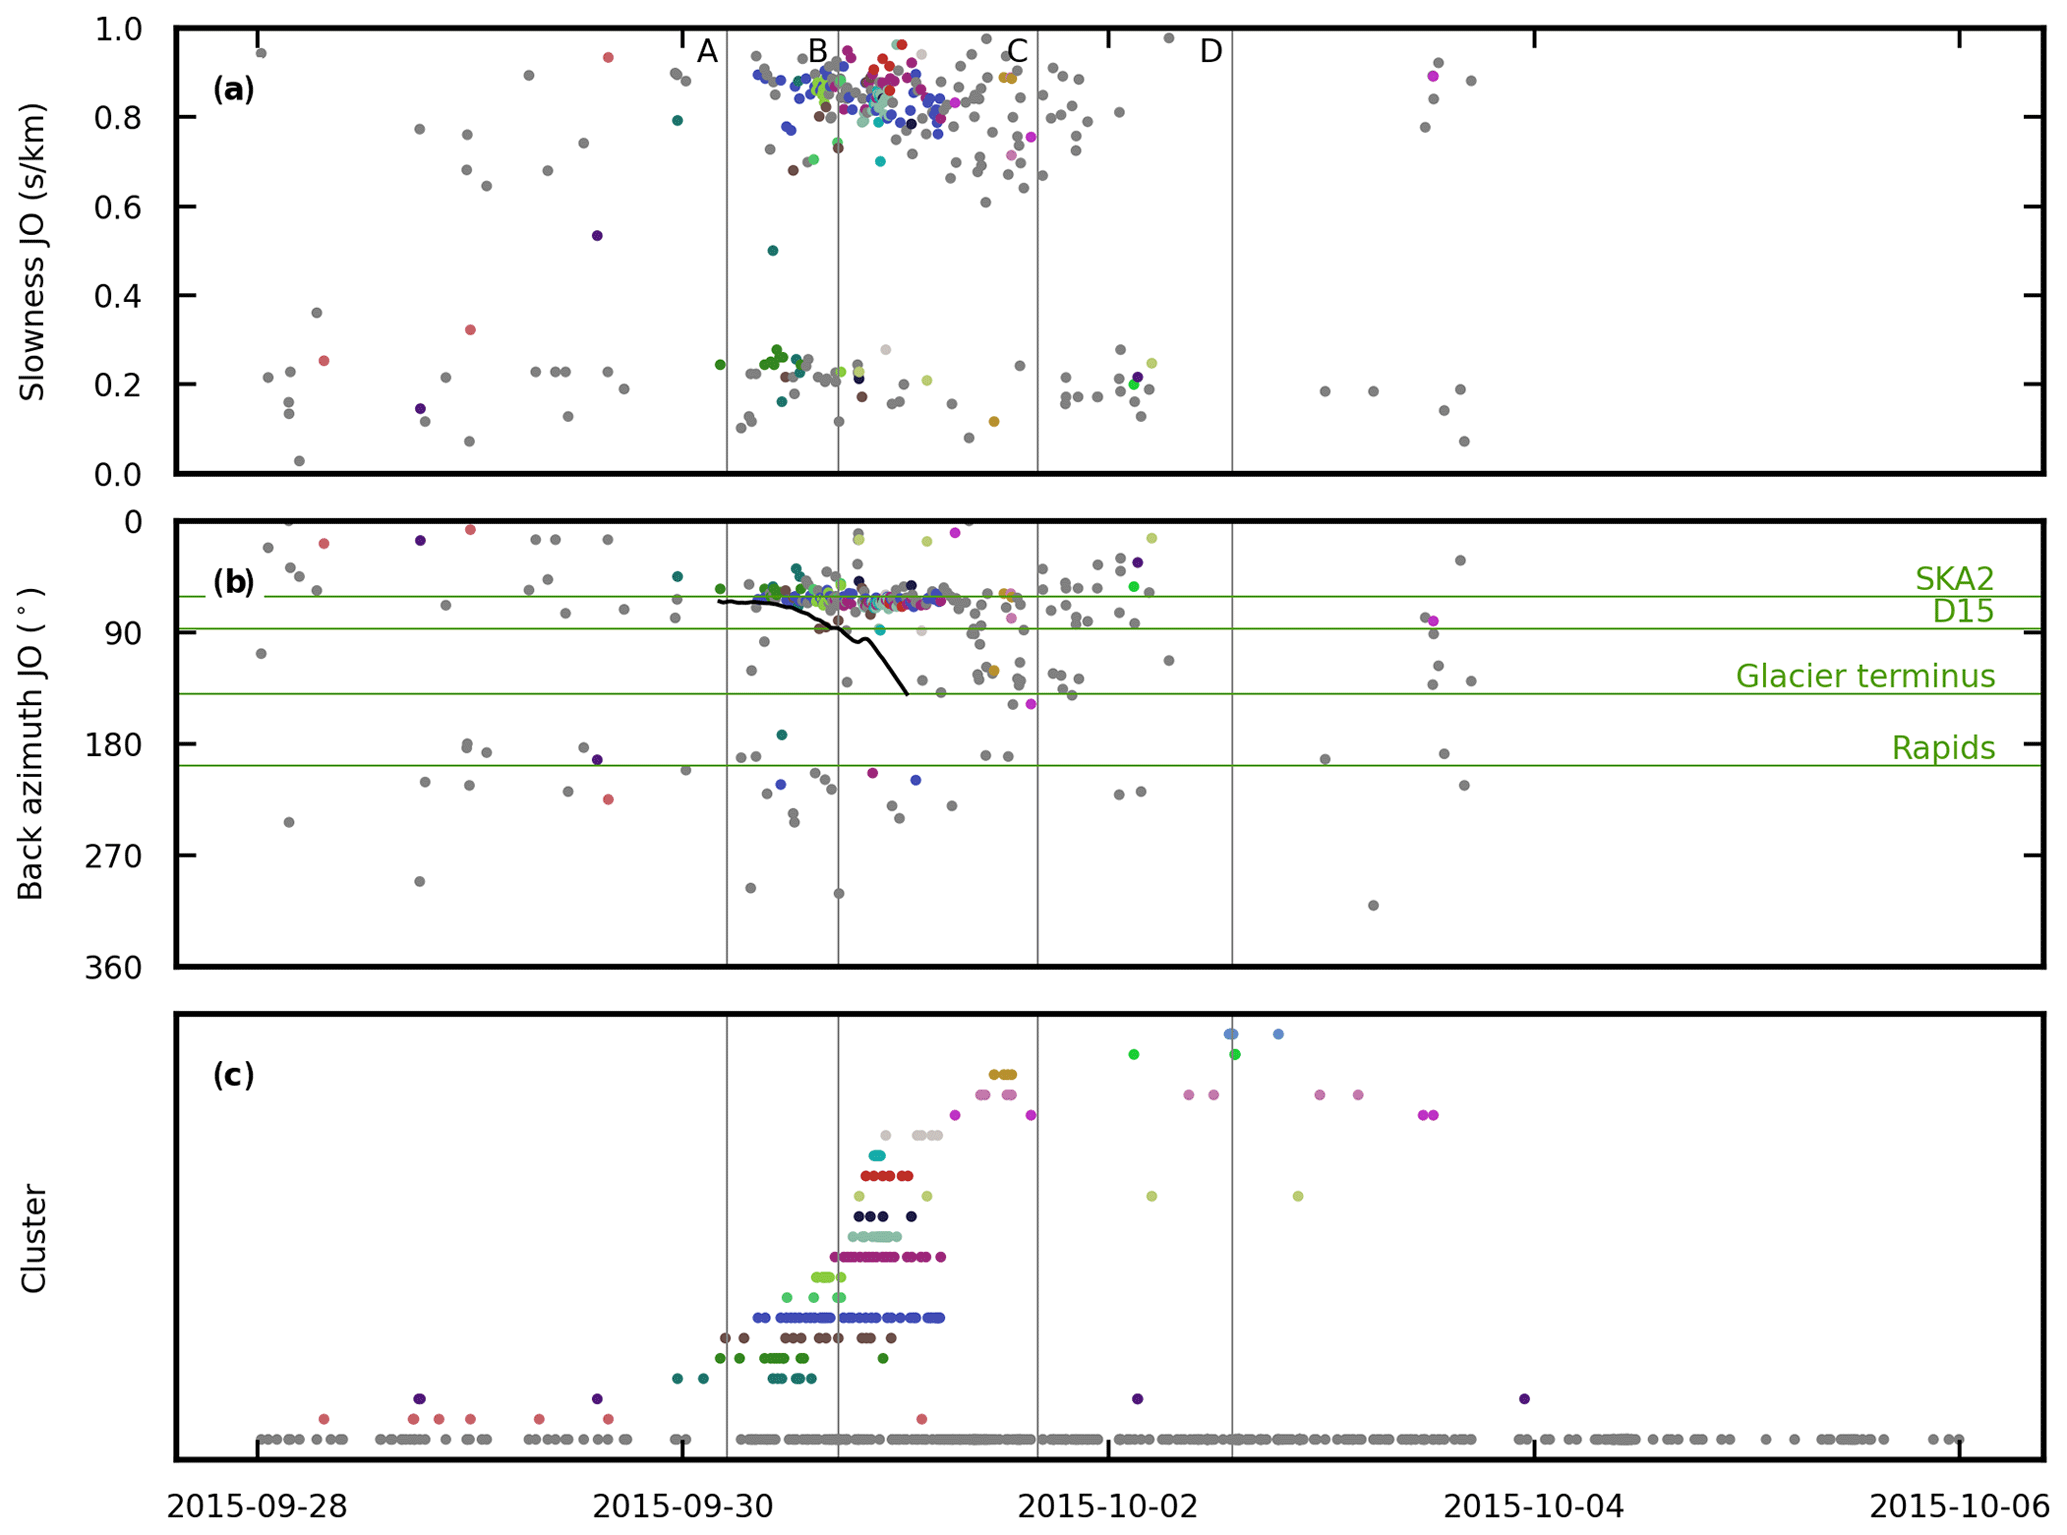
Figure 5Icequakes detected with STA LTA and template matching (Sect. 3.1.3) and coloured according to the cluster membership (Sect. 3.1.4). Unclustered events are shown in grey. Vertical grey lines (labelled A–D) indicate (A) the start of the flood (05:00 UTC on 30 September); (B) the flood arrival at D15 (17:31 UTC on 30 September); (C) the first levelling of the ice shelf at SKA2 (16:00 UTC on 1 October); and (D) the start of the final ice shelf subsidence (14:00 UTC on 2 October). (a) Slowness and (b) back azimuth at JO. The horizontal green lines in panel (b) mark, from top to bottom, the direction towards the cauldron, D15, the ice terminus, and the rapids. The black line in panel (b) is as shown in Fig. 2g. (c) Clusters sorted according to the time of the first occurrence.
4.5 Subglacial episodic tremor from the cauldron (type 2 and type 3)
At a later stage of the flood, the tremor character changed and became stronger and episodic. We hence detected it on the JO and IE arrays (Fig. 6g and h). At the closest stations of the SIL network (e.g. GRF), a tremor band around 2 Hz was detected from 09:30 UTC on 1 October. A first weak tremor episode was detected at noon, with about 11 episodes in total (Fig. 6). For comparison, the subglacial flood from the western Skaftá cauldron in January 2014 was followed by seven episodes (Eibl et al., 2020). Each episodic tremor event consisted of two distinct tremor types that we refer to as type 2 and type 3 in the following (Fig. 7a to c). Note that Eibl et al. (2020) do not separate these types but call them a “type 2 tremor”. The episodic tremor stopped at 22:00 UTC on 2 October when the ice shelf had almost fully subsided. The first and last episodic tremors were weaker, while the strongest and longest started at 01:11, 11:03, and 13:47 UTC on 2 October, before the last phase in the settling of the ice shelf started at 14:00 UTC (Fig. 6a, f, and h). This last settling is characterized by an exponential decrease in the ice shelf height.
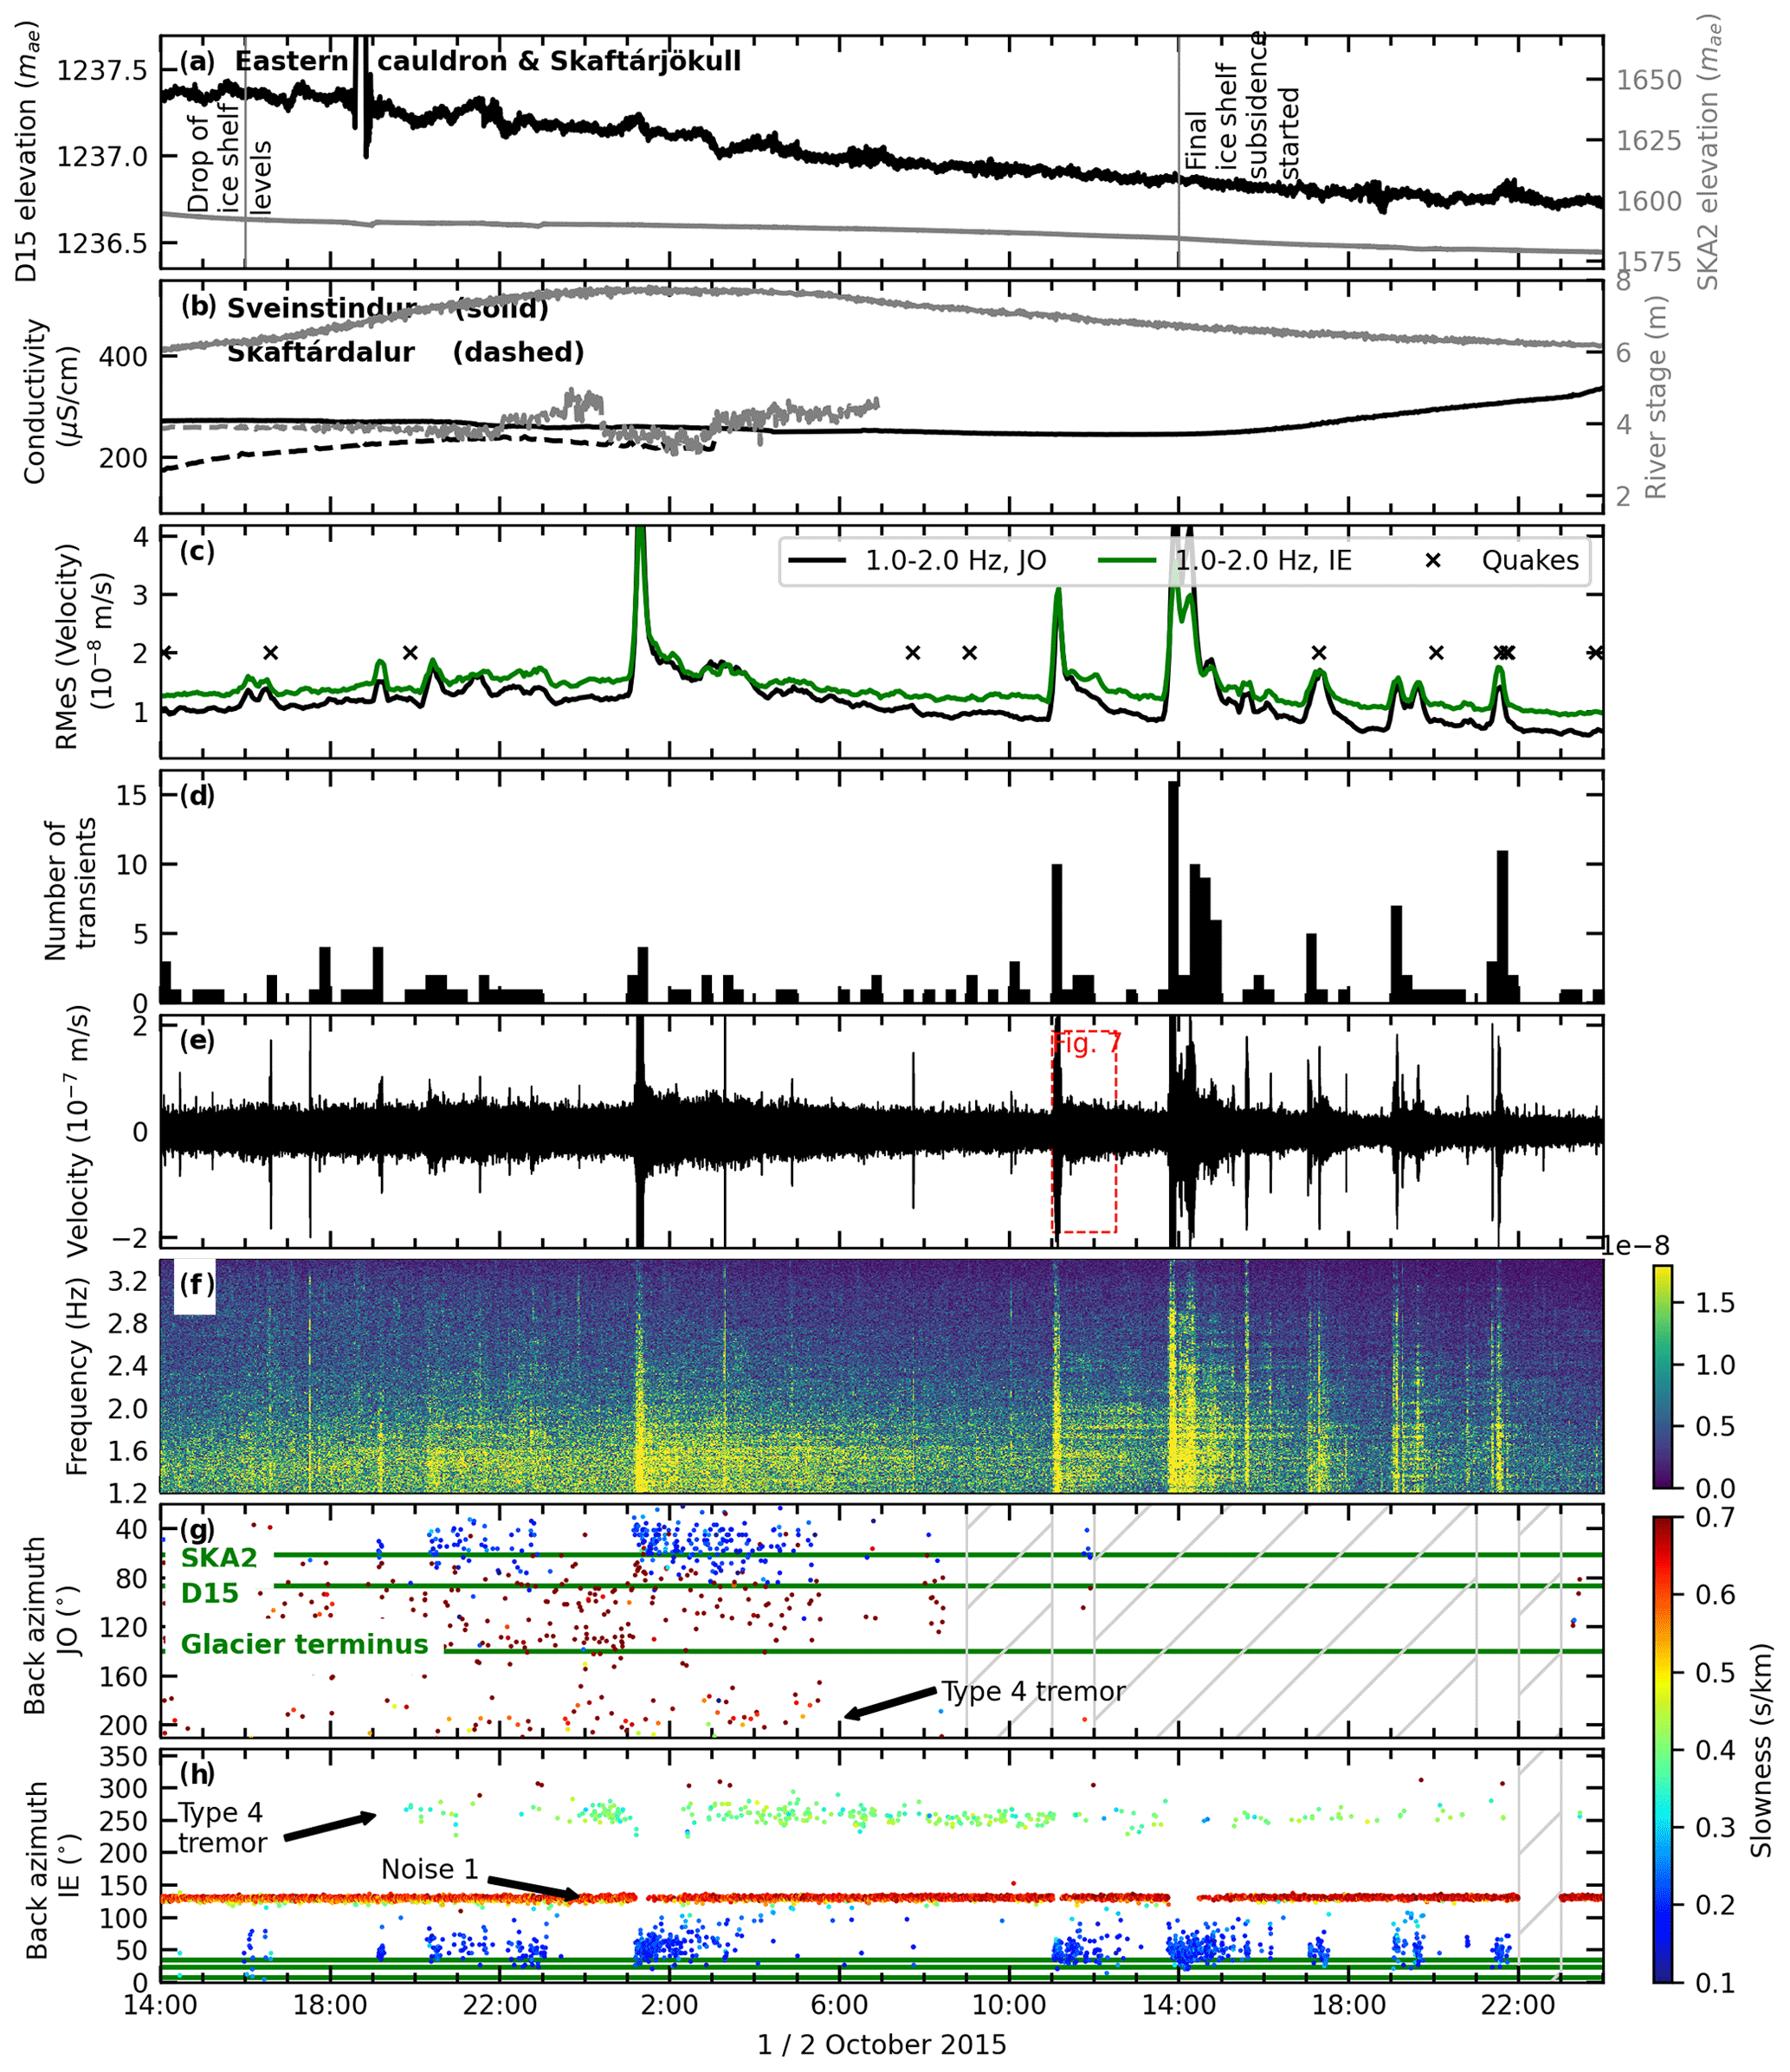
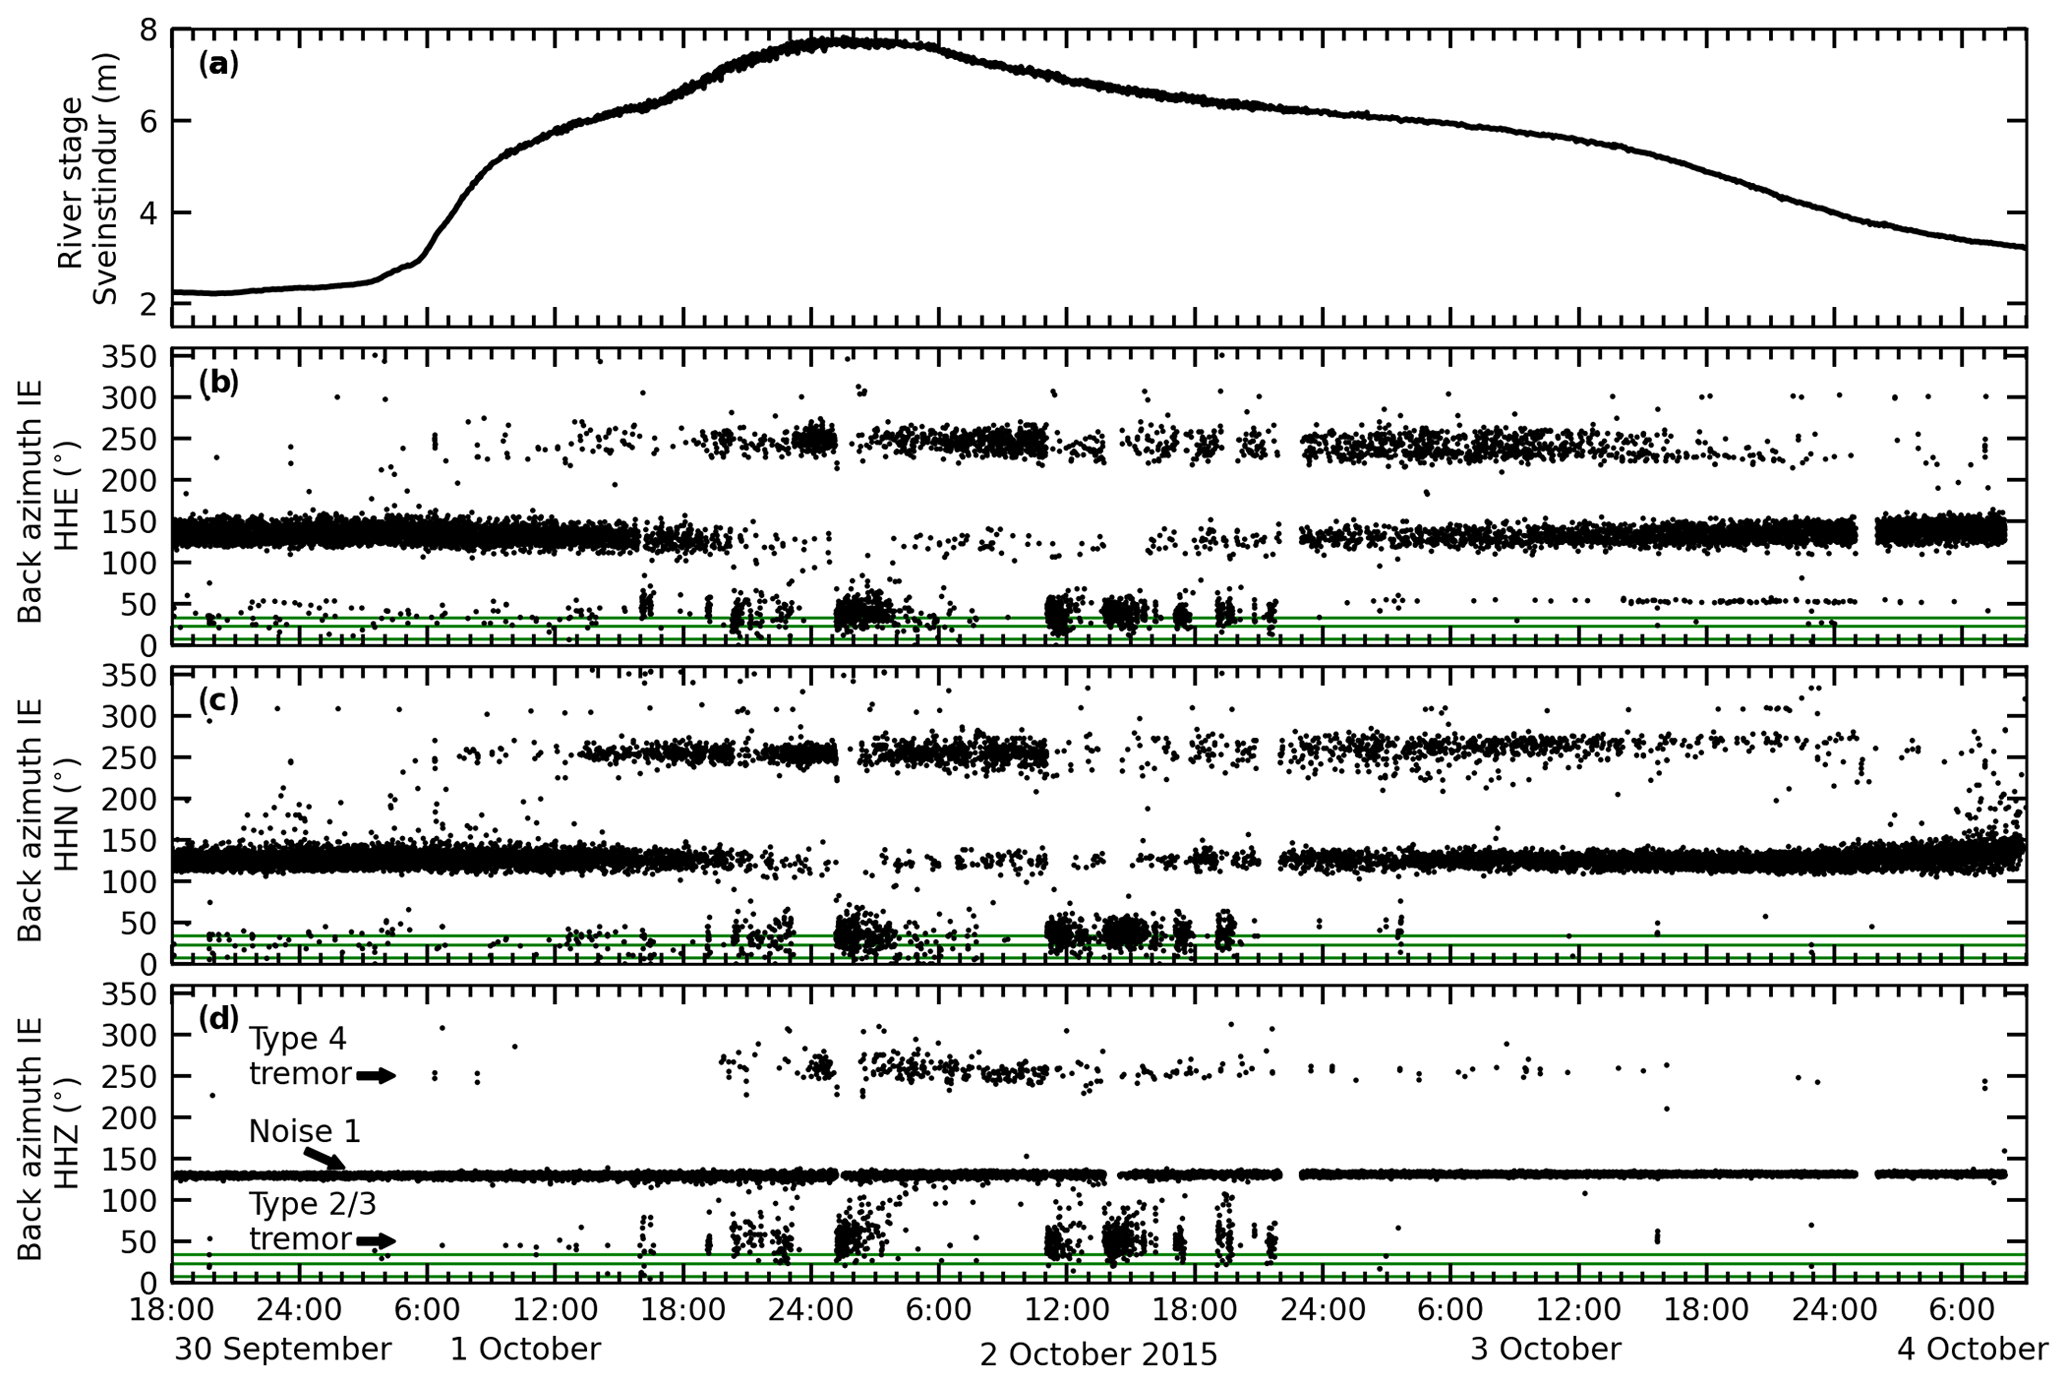
Figure 6Type 2 tremor bursts and type 3 harmonic tremor tails occurred after most of the water had drained from the subglacial lake. The tremor from the cauldron area was from 14:00 UTC on 1 October to 22:00 UTC on 2 October 2015. Panels are as shown in Fig. 2.
Each episodic tremor started with an emergent burst of 2.8 to 36.6 min duration (Fig. 8a to h), with a frequency content up to 7 Hz. We refer to it here as type 2 tremor. It features distinct but not equally spaced frequency bands from 0.8 to 1.8 Hz (Fig. 7d and e). The dominant frequency changes with time and is within the range of 0.85 and 1.2 Hz (Fig. 8i to p). One has to keep in mind, though, that other subglacial (type 1) or subaerial (type 4) tremor sources might influence the spectra specifically when the type 2 tremor bursts are weaker.
Type 2 tremor bursts were followed by a 10 min and up to 6 h long harmonic tail (Fig. 8i to p), with several distinct frequency bands in the range of 0.8 to 1.6 Hz. We refer to this tail as a type 3 tremor, which has an overtone spacing of about 0.3 Hz (Fig. 7f and g). Similar to the type 2 tremor, the peak frequency of the type 3 tremor changes slightly with time but is mostly around 1 Hz (Fig. 8y to af). The fundamental frequency is in both cases not visible due to the low-frequency noise.
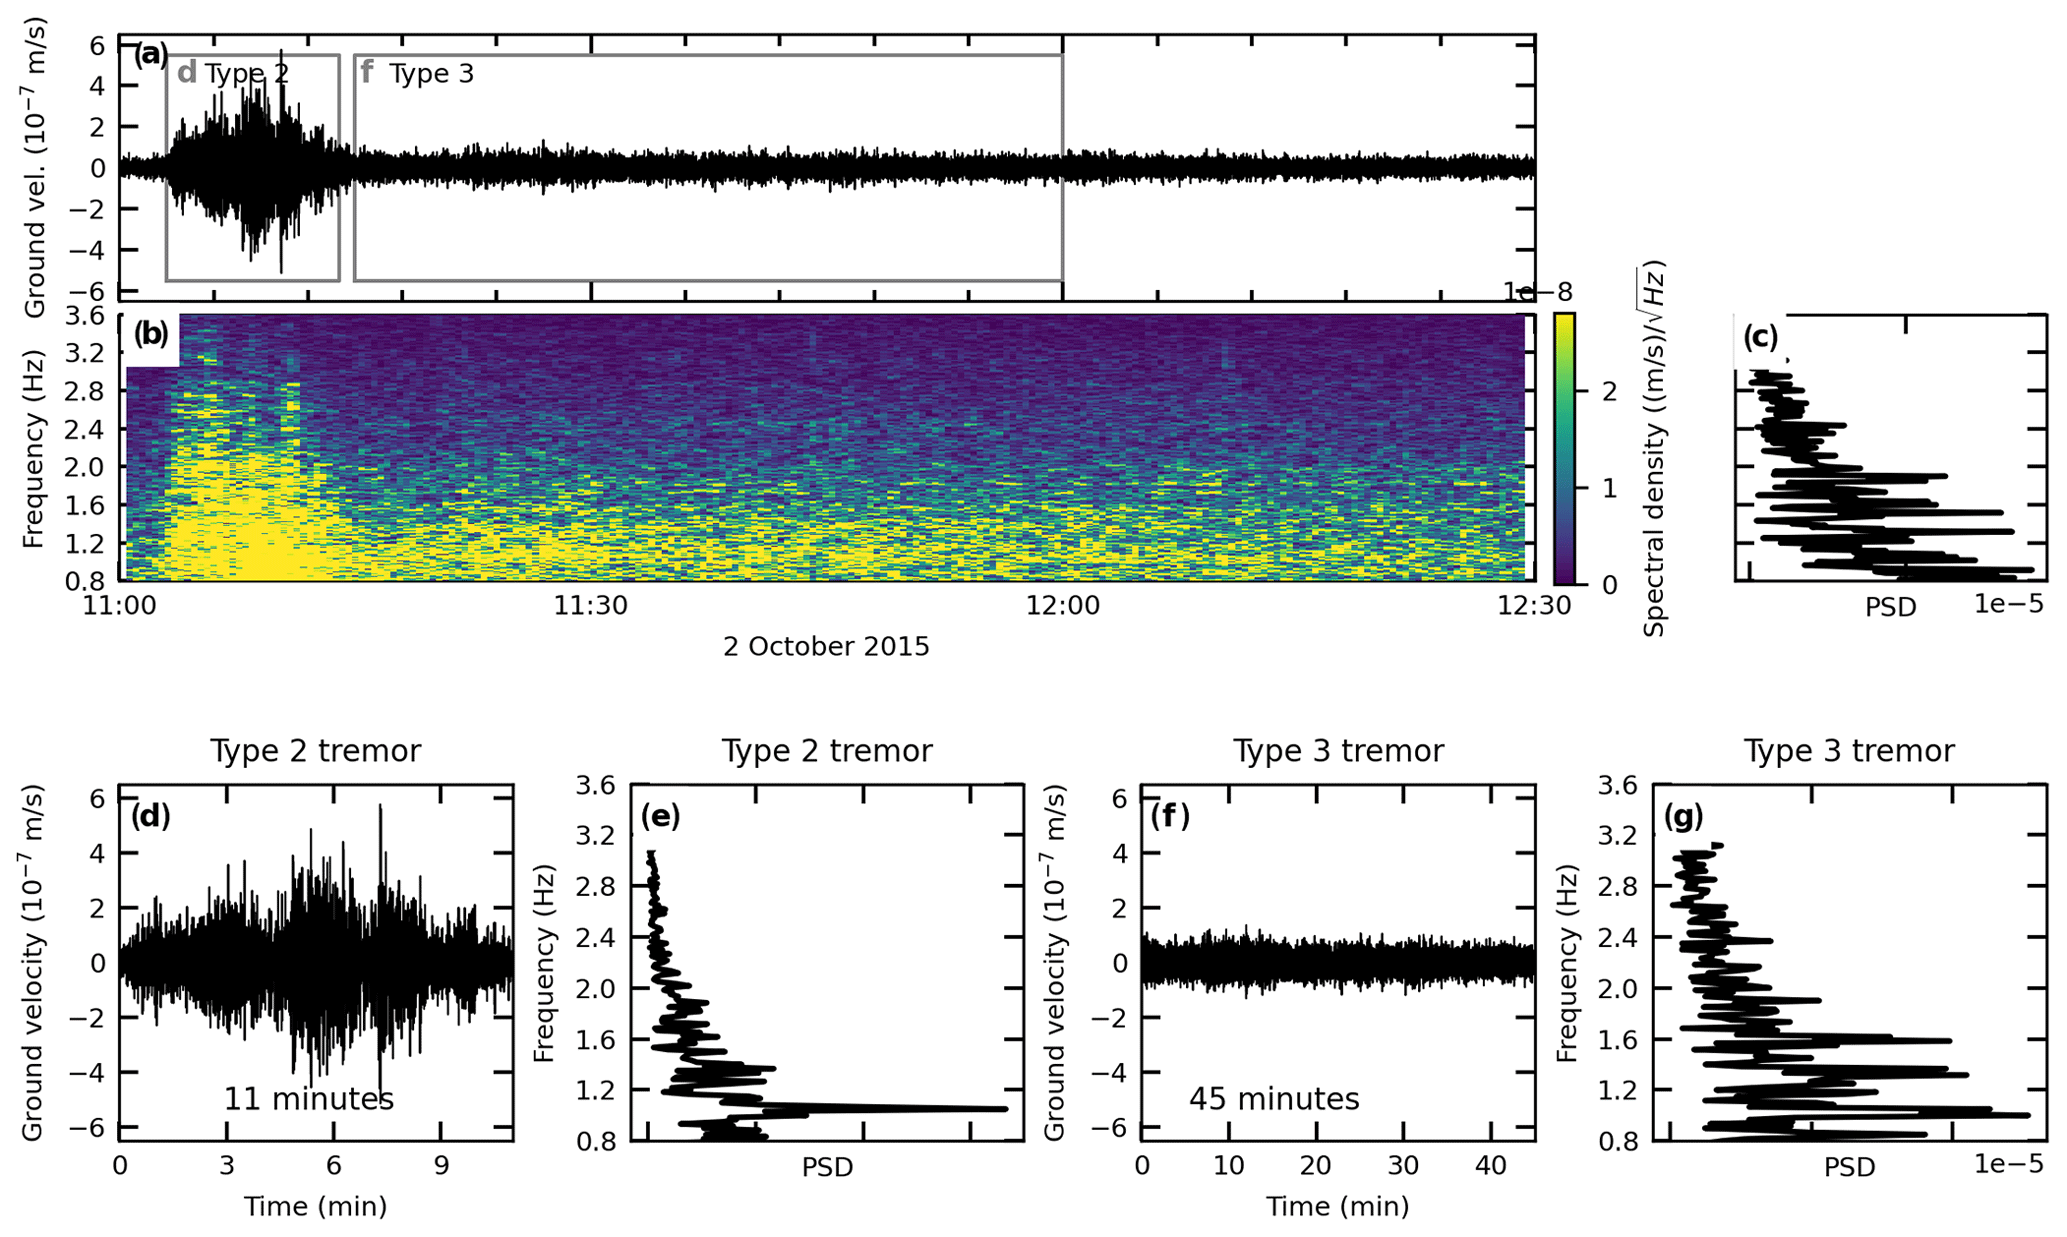
Figure 7Magnification of one type 2 tremor burst and its type 3 harmonic tremor tail from 11:00 to 12:30 UTC on 2 October 2015. Panels (a) and (b) are as shown in Fig. 4, but panel (b) has a fast Fourier transform window length of 84 s. (c) The spectrum of panel (b). (d) The 11 min long time window showing a magnification of the tremor burst and (e) its spectrum. (f) The 45 min long time window, showing the harmonic tremor tail and (g) its spectrum.
We isolated the back azimuths of the type 2 and type 3 tremor (Fig. 8ag and ah) and created histograms with 2∘ wide bins (Fig. 8ai and aj). The grey bars in Fig. 8ag and ah indicate the uncertainty associated with each back azimuth estimate, based on the array geometry (see Sect. 3). We do not see a clear difference in the back azimuth or slowness when comparing the type 2 and type 3 tremor. The median back azimuth ± standard deviations during all tremor bursts were 53.1 ± 15.6∘ at JO and 50.1 ± 16.6∘ at IE. The large standard deviation or scatter of these values indicates that the type 2 and type 3 tremor was generated over a wide region.
Given that slownesses indicate a type 2 and type 3 tremor source in the bedrock and that back azimuths roughly point towards the eastern cauldron, they might be generated in roughly the same region as the icequakes. For these icequakes, we determined back azimuths that are 10.1∘ too large at IE and 9.3∘ too low at the JO array. If the tremor back azimuths are affected similarly, then the type 2 and type 3 tremor should in reality be generated at an average back azimuth of 62.4∘ from JO and 40.0∘ from IE. This corresponds approximately to the area of the cauldron (see Fig. 1).
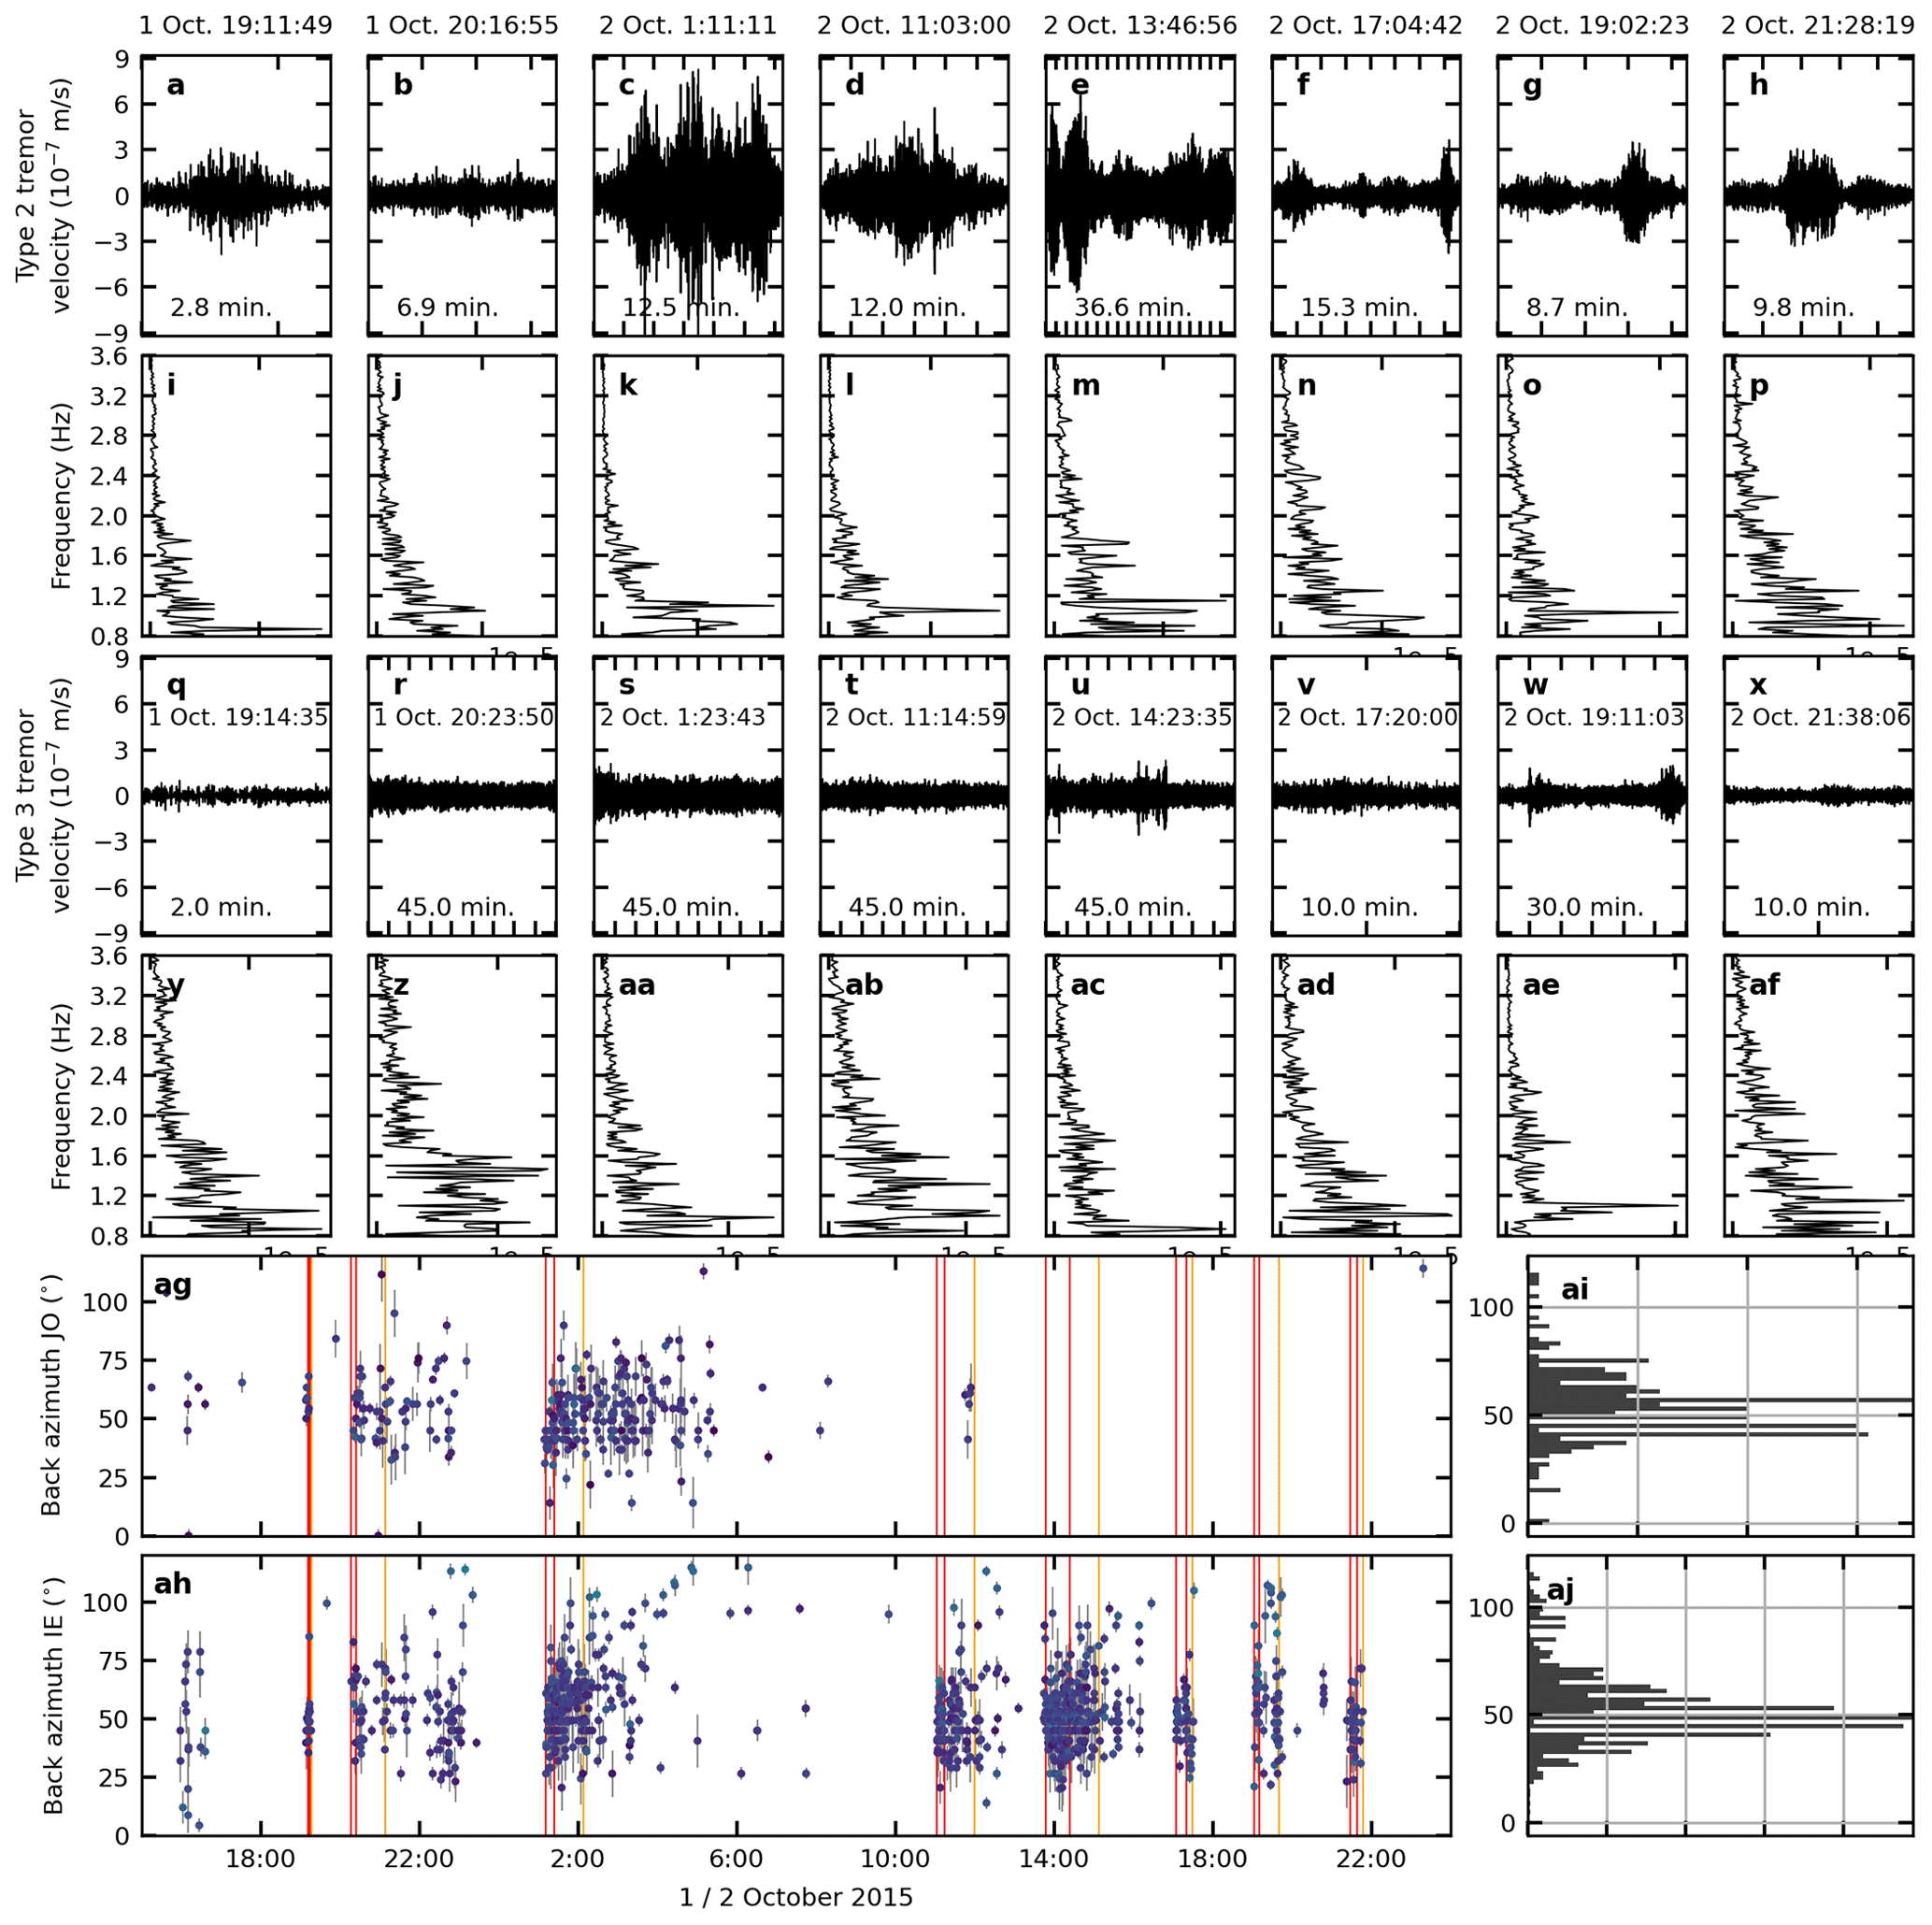
Figure 8Temporal evolution of the type 2 and type 3 tremor. (a–h) Vertical component seismograms of JOK filtered between 0.8 and 3.6 Hz for eight type 2 tremors. The start time and duration of the time windows are given above and below the seismograms, respectively. (i–p) Spectra of the seismograms in panels (a) to (h). (q–x) Same as panels (a) to (h) but for eight type 3 tremors. (y–af) Spectra of seismograms in panels (q) to (x). (ag–ah) Back azimuths associated with the type 2 and type 3 tremor bursts at the (ag) JO and (ah) IE array. Vertical red lines and vertical orange lines indicate the time windows of type 2 and type 3 tremor shown in panels (a) to (af). (ai–aj) Histograms illustrating the dominant back azimuths at the (ai) JO and (aj) IE array that indicate a source in the cauldron area.
4.6 Subaerial seismic tremor and noise from the river
At the JO array, we sometimes detected seismic signals associated with the subaerial flow in the nearby glacial river. Note that we only detected this signal at times when the tremor from the glacier was weak (e.g. in the early hours of 30 September when the flood just started). At the final stage of the flood, the subglacial water entered the glacial river Skaftá and drained towards the sea. The increased volume of water in the river generated the type 4 tremor. The back azimuths from around 198∘, as seen from the JO array, can be associated with rapids near Sveinstindur that are at 29.5 km distance from the JO array (Fig. 1). These were visible in the derived back azimuths on 1 and 2 October when processing the vertical component at the JO array (type 4 tremor in Figs. 2g and 6g). In the horizontal components, this noise is not detected above the noise floor.
The back azimuths derived using the IE array show a continuous dominant noise source at 131∘ (noise 1 in Fig. 6g). This noise is strong, detected on all three components, and masks most tremor sources. Nevertheless, the type 4 tremor source at 256∘ from the IE array was detected in the vertical components from 19:45 UTC on 1 October when the river stage at Sveinstindur reached 7 m (type 4 tremor in Fig. 6g). The type 4 tremor reached its largest amplitude at 0:30 UTC on 2 October when the river stage reached its maximum of 7.75 m. Finally, the type 4 tremor was not detected in the vertical components after 16:00 UTC on 3 October when the river stage at Sveinstindur had dropped back down to 6.2 m height and continued to decrease thereafter. In the horizontal components, the type 4 tremor is visible from 07:45 UTC on 1 October when the river stage had increased – 1.8 m above the normal flow rate – to 4.3 m height (Fig. 9). This tremor source faded once the river stage dropped to 3 m height and hence dominated the seismic wave field in the horizontal components longer than in the vertical components.
5.1 Triggering of the flood
The cauldron subsidence, as recorded by the GPS instrument on top of the subglacial lake, started on 27 September 2015. The first quake appeared about 16 h later, and seismic activity peaked when the cauldron subsidence sped up and the flood propagation started. Therefore, no seismic activity in the form of earthquakes or icequakes was detected when the cauldron seal failed. This failure led to an initial slow water loss from the subglacial lake, which only developed into a flood wave migrating downhill a few days later.
In contrast, a flood from a glacier-dammed, marginal lake on Plaine Morte Glacier, Switzerland, in 2016 was presumably triggered by icequakes (Lindner et al., 2020). When the melt season started and progressed, Lindner et al. (2020) were able to track how an efficient draining system progressed upglacier. Since they recorded icequake signals near the lake basin in the 24 h period before the lake drained, they suggest that hydrofracturing linked the ice-dammed marginal lake to this drainage system and led to a flood. Here, at the Skaftá cauldrons, such hydrofracturing might not be a relevant flood trigger, since the lake is located at the bedrock–ice interface and therefore does not cause vertical hydrostatic pressure aiding a hydrofracturing event.
The quakes recorded here are interpreted as being a sign of brittle failure. They are located near the bedrock–ice interface. They appear once the water started to slowly migrate from the subglacial lake and might therefore be caused by the pressure change induced in the bedrock. Alternatively, these quakes could be signs of further failure of the cauldron seal or linked to the subsidence of the ice layer, opening crevasses that are visible on the surface (Fig. 10). These quakes, potentially caused by crevasses, are clearly distinguishable from the various tremor sources due to a higher-frequency content.
Based on the results of our waveform similarity analysis (Sect. 3.1.3), the cauldron area produced a lot of seismic events, which we interpret as icequakes, from 08:29 UTC on 30 September to 04:45 UTC on 1 October. In this time period, the largest volume of water drained from the subglacial lake, and the ice shelf subsided by more than 30 m, reaching its fastest subsidence rate. Our clustering revealed that the waveforms of these events can be clustered into 20 families. Considering that the slip during the gradual collapse of the ice shelf happens at different times and at different locations near the up-to-3 km wide cauldron might cause slightly different waveforms that are sorted into different families. The character of these events could be explained by repeated stick–slip on the same fault segments or on close-by fault segments in the ice. The events might be repeated or occur in close proximity to each other. The shortest contributing wavelengths are of the order of about 130 m. Due to several event families and the similarity of events within a family, it is more likely that these events are icequakes generated when parts of the ice shelf collapse rather than being due to earthquakes. The progressive activation of different clusters (Fig. 5) might reflect the gradual slip along different fault planes in the ice. Similarly, during the Bárðarbunga caldera collapse in 2014/2015, earthquakes on the northern and southern ring fault segments were different and could be separated into two major families (Gudmundsson et al., 2016).
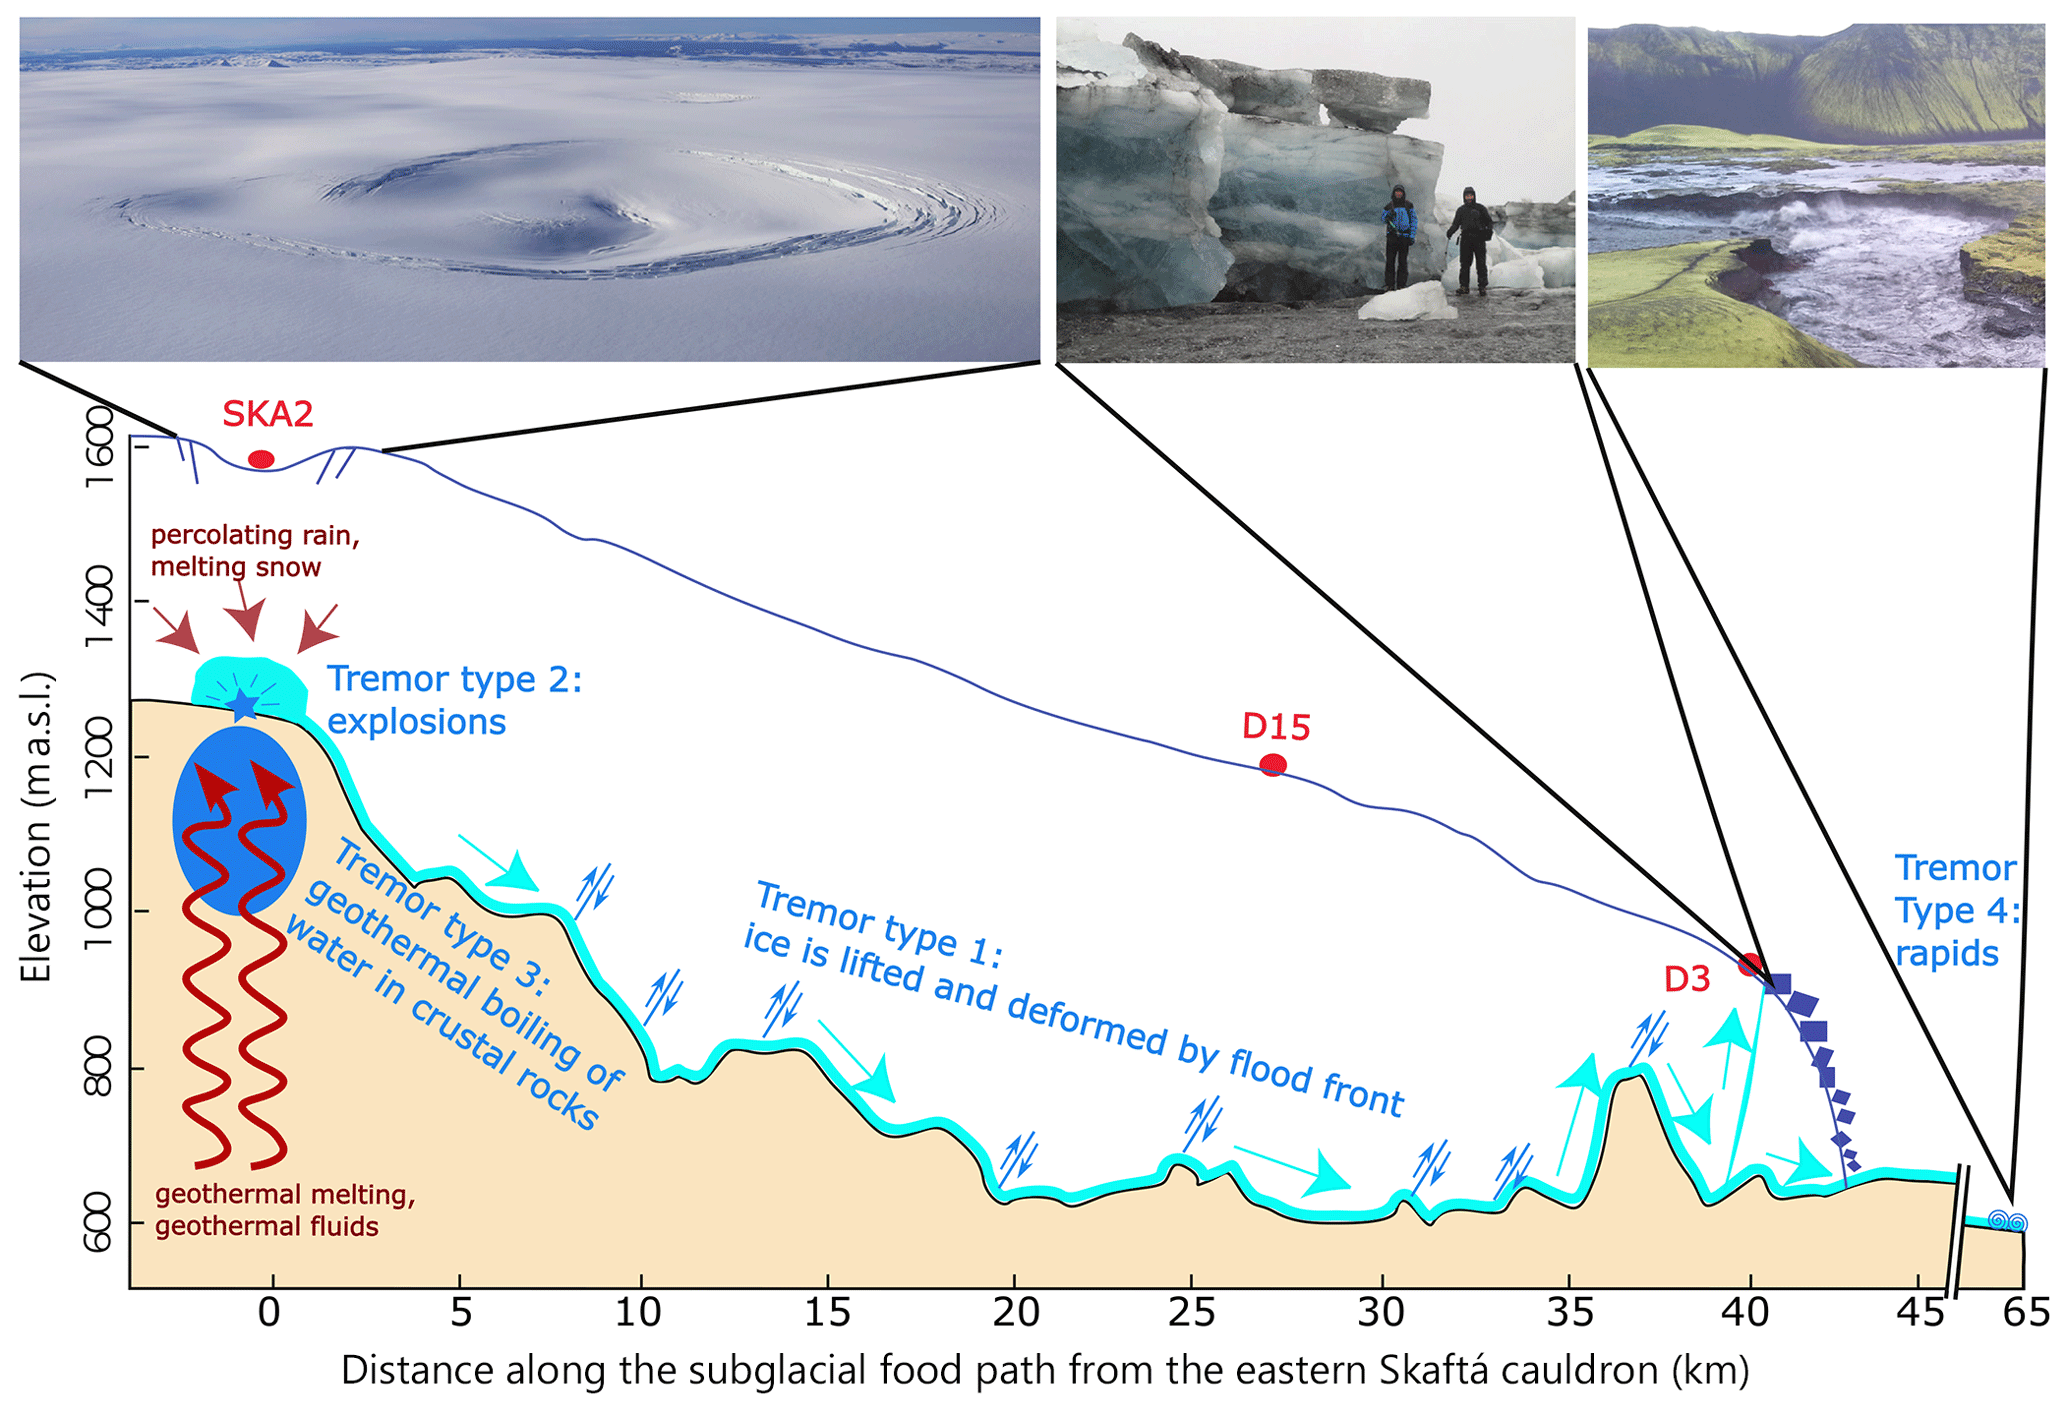
Figure 10Schematic diagram along the subglacial flood path from the eastern Skaftá cauldron, based on Fig. 3.6 in Einarsson (2009), Fig. 9 in Magnússon et al. (2021), and Fig. 2 in Jóhannesson et al. (2007). Conceptual model of the tremor generation supported by the high-frequency transients and clustered icequakes. The photo on the left shows an aerial view from the east of the eastern Skaftá cauldron after the September/October 2015 jökulhlaup. The western cauldron can be seen in the distance to the right of the centre of the image. Semi-circular crevasses mark the boundary of the area that subsided. Thrust ridges due to inward ice flow have formed near the centre of the depression during the 10 d that elapsed from the time of the flood to the time when the photo was taken. (Photo credit: Oddur Sigurðsson, 10 October 2015.) The photo in the middle shows large ice blocks broken from the glacier surface by the initial outburst flood through the glacier at 3 km distance from the ice margin. (Photo credit: Tómas Jóhannesson, 1 October 2015.) The photo on the right shows rapids near Sveinstindur. (Photo credit: Bergur Einarsson, 2 October 2015.)
5.2 Flood-related tremor generation (type 1)
For the Skaftá 2015 jökulhlaup, the subglacial type 1 tremor source moved gradually southwards and accompanied the subglacial propagation of the flood. Based on the geometry of the flood path, we calculated the back azimuths we would expect from a flood front propagating at a constant speed along the path (see Sect. 4.3 and Fig. 2). The back azimuths of the type 1 tremor closely followed these expected back azimuths of the flood front during the flood. The tremor was furthermore generated in a wide migrating region and was strongest in the regions with an adverse bedrock slope (Fig. 10). As plausible tremor models, we consider turbulent flow, impact during bedload transport, resonance, and repeating icequakes.
Resonance might be triggered by water flow in a subglacial channel or between the bedrock and ice layer. However, if resonance is triggered in this manner, then we would expect tremor generation along the whole flood path and not mainly following the propagating flood front. In addition, the strong tremor in regions with an adverse slope cannot be explained by this model.
If the tremor were induced by turbulent flow, then we would expect a high tremor amplitude along the entire flood path upstream of the flood front. Instead, we find that the tremor source moved and started, for example, at the GPS instrument D15 shortly after the first sign of the flood was detected there. The tremor amplitude is highest while the glacier is being lifted, especially in regions of adverse bedrock slope, and the tremor source moves southwards following the flood front. Additionally, we detected differences in tremor generation along the flood path, with little tremor generation in the upper half of the flood path. As we expect similar water flow speeds and turbulence along the whole flood path upstream of the flood front, our observations are not consistent with tremor generation by turbulent flow.
Our surface wave observation, however, is consistent with the Rayleigh-wave-dominated glaciohydraulic tremor reported by Vore et al. (2019) at more than 1 km distance from the source. Lindner et al. (2020) recorded tremor before and during a flood at the Plaine Morte Glacier, Switzerland, and interpreted it as being the signs of ice fracturing, moulins, and moulin resonance that hide the potential tremor linked to turbulent flow. Lindner et al. (2020) did not manage to track the propagating flood front but located a persistent tremor source near an outlet and interpreted it as being linked to subglacial water flow. This might be consistent with our observation that the tremor is strongest near the outlet and in the lowermost part of the flood path. However, for Skaftá floods, we were far from the source (>50 km), and it remains to be shown whether tremor signals along the flood path have varying amplitude or whether the signal amplitude was merely modulated by the distance between the flood and array location.
Tremor caused by bedload sediment transport is thought to be characterized by a frequency content of more than 9 Hz, while pressure fluctuations in turbulent flow are thought to be characterized by a frequency content of less than 9 Hz (Bartholomaus et al., 2015; Gimbert et al., 2016). These observations are made a few kilometres from the source, and at larger distances, the high frequencies will be attenuated. At 10 to 52 km distance, we observe a tremor that is strongest around 1.3 Hz. The bedload transport studies indicate that the bedload sediment transport is an unlikely generating source at this distance in the present case. Additionally, the Skaftá floods might not transport much sediment in comparison to other sites globally, as mentioned by Bartholomaus et al. (2015), Gimbert et al. (2016), and Cook et al. (2018).
We suggest that the type 1 tremor was generated by the high strain rates caused by the advancing water front. The glacier is lifted quickly up to 1 m off the bedrock and hence behaves in a brittle way in contrast to its usual plastic behaviour. The water front can flow into these newly formed cracks and propagate them further. This lifting is inferred to be typical of the front of fast-rising jökulhlaups (Jóhannesson, 2002; Björnsson, 2010; Einarsson et al., 2016, 2017; Magnússon et al., 2007). The area of increased velocity was studied with interferometric synthetic aperture radar (InSAR) during a flood in 1995 and found to be at least 9 km wide (Fig. 6 in Magnússon et al., 2007). This mechanism implies that the ice underwent brittle fracturing that resulted in small, repeated, and closely spaced icequakes that could merge into a tremor, as suggested by MacAyeal et al. (2008), for colliding icebergs.
Further evidence for repeated icequakes in the type 1 tremor stems from the detected high-frequency events that closely follow the flood propagation. Interestingly, some areas apparently generate more of the type 1 tremor, i.e. around D15 or near the terminus, while other areas generate more high-frequency events, i.e. the area between D15 and the ice terminus. This might be caused by normal or adverse bedrock slopes, the distance that possibly affected our event detection, or the bedrock roughness. Independently, high-frequency events are generated along the same path on which we detect the type 1 tremor, which in our opinion suggests a close link. These events are too weak to be clustered, and the clustered events mainly focus on the cauldron area. This might be in line with tremor composed of icequakes, where the templates vary in space and time as the flood front propagates and both the source and the path change.
This process may be assumed to have been particularly intense at the tip of the flood front at each point in time but continued until the discharge reached the maximum at each location. According to this interpretation, the first strong tremor period at around 02:00 UTC on 1 October from the direction of the glacier terminus might be due to the hydrofracturing of the ice that is likely to have been especially intense as the flood lifted the thinner ice near the terminus. While most of the water continued to flow near the bedrock, the tremor might have decreased after the hydrofracture reached the surface. The second stronger tremor period (around 04:00 UTC on 1 October) most likely marks further ice fracturing as the flood discharge near the terminus increased. In addition, the seismic sources generated in a lifted ice sheet might not couple well to the ground once the ice sheet is separated by the water layer.
Similarly, Behm et al. (2020) recorded a rapidly rising jökulhlaup in the Zackenberg River in Greenland that was accompanied by intense surface crevassing, as inferred from seismic icequake detection by seismometers on the ice. They suggest that increased basal sliding leads to increasing seismicity and crevassing on the surface. We are most likely too far from the source to detect these icequakes caused by the ice movement. However, we speculate that during the flood when parts of the ice cap speed up, the crevassing and seismicity intensify. This might merge into what we record as a non-harmonic tremor at more than 10 km distance due to scattering effects of the shallow bedrock layers (Ying et al., 2015). A ground-penetrating radar (GPR) study in Greenland also detected basal crevassing (Behm et al., 2020) that might be similar to the hydrofracture we observed here, which ruptured all the way to the ice surface near the terminus.
The migrating tremor source is spread over up to 20∘ along the flood path, as seen from the JO array. This indicates that tremor does not start immediately when the flood front arrives but that the ice surface needs to be lifted further before tremor becomes visible from each location. In the context of tremor that is composed of icequakes, this suggests that a threshold number of icequakes is required before the tremor is detected at our observational range. The width of the flood front, ∼9 km as derived from InSAR studies (Magnússon et al., 2007), may also be expected to contribute to the spread of the calculated back azimuth.
The activated region is therefore large, and icequakes are likely neither similar enough nor spaced regularly enough to generate harmonic tremor such as that observed during strike–slip collisions of edges of icebergs MacAyeal et al. (2008). Large-scale sliding events of a glacier in Antarctica, not associated with a subglacial flood, were accompanied by tremor episodes at the ice–bedrock interface. They were interpreted as being repeating earthquakes due to the clear presence of single events and harmonic character of the observed gliding tremor (Lipovsky and Dunham, 2016). The tremor in our case neither shows a harmonic character nor clearly repeating events that might compose it. The visible peaks in the seismogram of Fig. 2e are linked to the quakes around the eastern cauldron or other volcanically active regions. Additionally, our GPS recordings indicate that the glacier is lifted up to 1 m off the bedrock, which led us to conclude that the tremor might be generated by irregularly repeating icequakes, while ice is hydrofractured rather than experiencing earthquakes on fault planes at the bedrock–ice interface.
We observe a substantial but short-lived increase in horizontal velocity of the glacier at each GPS location when the pressure wave passes (Einarsson et al., 2016). The maximum of the velocity increase coincides with the maximum of lifting and decreases as the wave has passed by. The velocity increase is partly due to shear thinning but mostly due to the increased basal sliding of the glacier. Both increased scraping at the bottom of the ice or the stick–slip motion could lead to tremor generation. This would then follow the location of the flood front and would not be detected once the flood reaches the glacial river. This is consistent with the type 1 tremor locations that stopped at the glacier terminus.
While other glacier seismology studies (Bartholomaus et al., 2015; Lindner et al., 2020) report a tight correlation between discharge and tremor amplitude in the 1 to 10 Hz band, Eibl et al. (2020) do not report a correlating diurnal variation but rather a temporal offset in the tremor amplitude and discharge. However, floods with larger peak discharge are still accompanied by a larger tremor. The time offset might be caused by large distances between instruments or due to the flow of water between the ice and bedrock in a wide area instead of a channelized flow (Eibl et al., 2020).
Nevertheless, we note that the type 1 tremor still continues to increase in amplitude after the flood front has reached the terminus of the glacier and has the highest amplitude early on 2 October for the 2015 flood. This tremor might be formed by the subglacial water flow. This interpretation is able to explain the following points: (i) its magnitude follows the discharge on 1 October; (ii) it seems to be generated along the whole flood path, as seen by seismic signals that are not coming from only one specific direction; and (iii) it should be more distinct for the large flood from the eastern cauldron than for the small floods from the western cauldron, as observed by Eibl et al. (2020).
If a GPS instrument measures a pronounced lifting of the ice, then this indicates that the capacity of the subglacial drainage system was overwhelmed by the abrupt water escape (Lindner et al., 2020). For example, Lindner et al. (2020) report a peak discharge and GPS or ice lifting in the first hours when the moulin reached the lake bottom. Consequently, the GPS elevation lowered to the levels before the drainage, and the discharge measured in the river dropped, while the lake drained slower and incised into the ice to drain through the moulin. In this study, the GPS is lifted even more in a second pulse, and the peak discharge is only measured 4 d after the slow outflow from the lake was detected. The draining water overwhelmed the capacities of the subglacial drainage system, leading to a pronounced ice lifting and widespread flow of water beneath it.
5.3 Cauldron tremor generation (type 2 and type 3)
Taking bias in the back azimuth from the JO and IE arrays into account, back azimuths during the type 2 tremor and type 3 tremor point towards an area near the eastern cauldron (compare Fig. 1 and Fig. 8ag to aj).
Each of these tremor episodes starts with an emergent burst and is followed by an hour-long harmonic tail. Similarly, Montanaro et al. (2016) reported 40 to 50 s long explosions with a frequency content of up to 4 Hz followed by a several-minute-long tail of an elevated tremor during a flood from a semi-subaerial lake at Kverkfjöll, northern Vatnajökull, in 2013. Montanaro et al. (2016) suggest explosions due to the expansion of boiling fluid in the geothermal reservoir followed by vigorous boiling. Remnants of such explosions were observed from the air on the following day. This observation was the first time that such a subglacial tremor burst could be confirmed visually. While Montanaro et al. (2016) reported a drop of 30 m at Kverkfjöll, we observed more than 100 m at the Skaftá cauldron and hence a larger pressure decrease that might cause the long tremor duration reported here.
The temperature in the subglacial geothermal area may be assumed to be close to the pressure boiling point of water, except at shallow depths near the glacier bed (e.g. Gudmundsson and Björnsson, 1991; Ármannsson, 2016. This implies that a lowering of the overlying pressure by ∼ 0.6–1 MPa, corresponding to a drop in water level of ∼60 m, and the lowering of the effective pressure in the lake due to bridging stresses in the subsiding ice shelf (Einarsson et al., 2017) will lead to a lowering of the pressure boiling point within the geothermal system in the range 5–15 K (Wagner et al., 2000). A lowering of the pressure boiling point of this magnitude will lead to the vigorous hydrothermal boiling of water in shallow crustal rocks, which explains the creation of body waves by this tremor source.
Given that the episodic tremor is very strong, we would like to discuss it in the context of it being a possible sign of a subglacial eruption. Based solely on the volcanic tremor recordings, subglacial volcanic eruptions and explosions are difficult to distinguish. Within this context, our geochemical water samples play a crucial role. Small volcanic eruptions are not likely to be the cause of the type 2 and type 3 tremor, as water samples showed elevated concentrations of dissolved inorganic carbon (DIC) and major elements including Ca, Mg, and B (see the Appendix for details on the geochemical data). High DIC concentrations are indicative of sustained water–rock interactions prior to subaerial exposure, and peak concentrations during this flood are comparable to previous floods from the Skaftá cauldrons (Jones et al., 2015; Galeczka et al., 2015). Boron is a strong indicator of geothermal activity, given its high mobility (Arnórsson and Andrésdóttir, 1995). The boron concentration peaked at 18.3 µmol L−1 in the pro-glacial river at Kirkjubæjarklaustur. This is over 4 times higher than measurements from the 2014 flood from the western Skaftá cauldron at the same locality (Jones et al., 2015), indicating that the non-glacial-melt part of the floodwater is of geothermal origin that has taken years to accumulate.
The geothermal chemical signature of the water suggests that the reservoir built up gradually beneath the ice cap, with continued and long-lasting reactions with the bedrock. With no indication of eruptive activity beneath the ice, we suggest that the type 2 tremor reflects explosions, while the type 3 tremor reflects boiling in the shallow crustal rocks (Fig. 10). The subtle changes in the frequency content with time might reflect a changing environment that is confined by first an enlarging and then a shrinking resonating void in the ice that is intermittently present when the water drained and the ice has not settled yet on the ground. In subglacial environments, linking the observations of the tremor presented here and the associated geochemical fingerprint is crucial. If in future only one of the two is available, then our study will support a correct interpretation of the associated signals.
5.4 Tremor and noise generation by rapids and waterfalls, respectively
All three seismometer components in the IE array are significantly affected by a continuous noise source (noise 1). It is likely that this noise source is caused by the flow of water in a nearby river (Fig. 10). The Svartifoss waterfall, located in a narrow gorge on the Hverfisfljót river 7 km southeast of the IE array, is a likely noise source at 131∘.
Near Sveinstindur there are strong rapids, which are to the southwest of the IE array at a distance of 15 km. This might generate the type 4 tremor from 256∘. On our arrays, at more than 10 km distance from the Skaftá glacial river, we do not detect the flow of water in the subaerial river, apart from the locations with rapids. This is consistent with the suggestion by Gimbert et al. (2016) that at more than 1 km distance, the seismic signal caused by turbulent water flow dominates over the signal caused by bedload transport. The horizontal components of the seismometers in the arrays and consequently their back azimuth determinations are strongly sensitive to the type 4 tremor. This can help with tracking the amount of water in the rivers, especially when processing the horizontal components. However, on the downside, a type 4 tremor will also hide the type 1, 2, and 3 tremors linked to the subglacial flood processes. In remote areas, it is promising that subglacial floods also generate seismic signals in the subaerial glacial rivers that can be detected by remote seismic networks.
We note that the differences in slownesses between the signals generated by the rapids and those generated by the waterfall might reflect the different source receiver distances. While the Svartifoss waterfall at a distance of 7 km might generate more noise that is composed of surface waves, the rapids at 15 km might generate a mixed wave field. Similarly, Eibl et al. (2017b) reported changes in slownesses that coincided with changes in the distance between the actively growing lava flow field and the array.
5.5 Speed of floods globally
Eibl et al. (2020) combined GPS, hydrological, and seismic data to estimate the speed of the 2015 Skaftá cauldron flood. They derive an average speed of 2 km h−1 (0.6 m s−1) for the lowermost 15 km of the flood path from GPS and hydrological measurements and an average speed of 1.4–2.4 km h−1 (0.4–0.7 m s−1) along the flood path from seismic observations. Assuming a constant speed upstream of instrument D15, the timing derived for the start of the flood from near the cauldron at 04:00 UTC+0 on 30 September is in broad accordance with the time at which the rate of cauldron subsidence started to accelerate.
We calculated the expected back azimuths along the known flood path and converted the distance along the flood path to time, assuming a constant velocity of 2 km h−1 as discussed above (Fig. 2). The resulting change in back azimuth with time closely fits the initiation of the type 1 tremor observed at each location along the path, indicating (i) the approximately constant flood propagation along the path and (ii) less bias in the back azimuth for the type 1 tremor generated at or above the ice–rock interface along the flood path than for the type 2 tremor generated at depth in the crust. We might expect less bias in the back azimuth for the type 1 tremor composed of surface waves travelling in the glacier ice, as ice is more homogeneous than the volcanic bedrock. Whether these waves might be affected by the heterogeneous bedrock finally depends on the dominating wavelengths. The type 2 tremor interpreted to be generated at depth in the crust is sensitive to possible heterogeneities in the seismic velocity structure of the crust. A strong type 1 tremor source that we interpret as being an area of substantial lifting somewhat upstream of the flood front clearly moved downglacier from an area near the cauldron to the glacier margin (Fig. 6). Exact estimates of the initial arrival of the type 1 tremor or the time of maximum tremor intensity at specific locations of the flood path are hard to derive because of the wide scatter in the data.
On the lowermost part of the flood path (D15 to the glacier margin), the average change in the back azimuth at the JO array may roughly correspond to the flood front propagation of ∼15 km in 6–7 h, which is in crude agreement with the propagation estimated from GPS and hydrological data. The variation in the back azimuth from higher up the path to the glacier margin is harder to estimate because the type 1 tremor signal from the upper part of the path is weak. It does not allow us to make a statement on how the propagation speed varies as the flood moves through the glacier.
The flood in September–October 2015 propagated faster than other known jökulhlaups in Iceland. In October 1995, Magnússon et al. (2007) found that in the last 7 km of the subglacial flood path, the speed of the flood front during a small jökulhlaup from the eastern cauldron was less than 0.06 m s−1 (0.2 km h−1). This is an order of magnitude lower than the average speed we derive during the jökulhlaup in 2015, but Magnússon et al. (2007) described the flood in 1995 as being an unusually small one that occurred unexpectedly only 3 months after a large jökulhlaup from the same cauldron. Einarsson et al. (2016) and Einarsson et al. (2017) report subglacial flood propagation speeds of 0.2–0.4, 0.1–0.3, and 0.4–0.6 m s−1 for jökulhlaups from the western cauldron in September 2006 and August 2008 and from the eastern cauldron in October 2008, respectively. Similarly, Eibl et al. (2020) report propagating speeds in the range of 0.2 and 0.4 m s−1 (0.9–1.6, 0.7–1.1, and 0.8–1.3 km h−1) for three subglacial floods from the western Skaftá cauldron. These differences might be caused by the flood size, as Eibl et al. (2020) conclude that floods with a smaller peak discharge propagate more slowly.
Larger velocities were derived on other glaciers in Iceland and worldwide. A large jökulhlaup from Grímsvötn, Iceland, in 1996 propagated at 5 km h−1 (Björnsson, 2003; Jóhannesson, 2002). Benediktsdóttir et al. (2021) calculated subglacial flood speeds during the 2010 Eyjafjallajökull eruption of 2.0, 2.5, 3.75, and 15 km h−1 for floods of a similar size to the ones we reported here. The propagation speed of subglacial floods in other glaciers worldwide have been reported as being 6.1 m s−1 (22 km h−1) for glaciers in the Pacific Northwest (Richardson, 1968) and >2 m s−1 (>7.2 km h−1) (Driedger and Fountain, 1989) at Mount Rainier, Washington, in the USA and >1.05 m s−1 (3.8 km h−1) in Switzerland (Werder and Funk, 2009). Larger speeds might be due to larger flood sizes (Eibl et al., 2020), a larger gradient of the topography, path width, or other factors that are not constrained in detail yet.
The September–October 2015 jökulhlaup in the Skaftá river was one of the largest measured floods in Iceland since the start of hydrological measurements at Sveinstindur in 1971. The flood was released after an unusually long interval of more than 5 years since the previous jökulhlaup from the eastern Skaftá cauldron. This subglacial flood was accompanied by a characteristic seismic sequence consisting of (i) a few-second-long icequakes generated by brittle failure during the gradual ice shelf collapse above the subglacial lake. Then (ii) an hour-long non-harmonic type 1 tremor and high-frequency transient events follow the flood front from the cauldron to the ice terminus. We suggest that the source of the type 1 tremor observed during the subglacial propagation of the Skaftá jökulhlaup is repeating icequakes generated while the ice is quickly forced upwards to allow water flow below. Consequently, (iii) approximately 10 to 15 min long type 2 tremor bursts occurred, followed by (iv) an up to 6 h long harmonic type 3 tremor tail. Type 2 tremor bursts were interpreted as being hydrothermal explosions in the cauldron area and the type 3 tremor as being vigorous boiling. These episodic type 2 and 3 tremors indicate the drainage of floodwater from the cauldron and the associated lowering of water pressure in the subglacial geothermal system, respectively. There is no indication of subglacial volcanic eruptions based on our geochemical water samples from Skaftá river. Finally, (v) we detected a type 4 tremor caused by rapids in the glacial river that strongly correlated with the discharge in that river. We hence also managed to detect and follow the flood as it travelled outside the ice and into the glacial river.
Globally, most subglacial flood studies report on quakes (Behm et al., 2020) or tremor (Winberry et al., 2009; Bartholomaus et al., 2015; Lindner et al., 2020; Vore et al., 2019) during the floods. Iceland, however, seems to be a unique place where fast-rising jökulhlaups may be followed by an episodic tremor that is potentially caused by explosions and boiling in the active geothermal systems driven by the active subglacial volcanic systems. Despite geothermal activity in Greenland or Antarctica (Fahnestock et al., 2001; Loose et al., 2018; Schroeder et al., 2014), a similar sequence of seismic signals remains to be reported in other regions with volcano–ice interaction. The methods described and knowledge gained here can aid in the identification of flood signals and their differentiation from eruption–related signals in other glacier-covered, volcanically active regions worldwide that can lead to hazardous flooding.
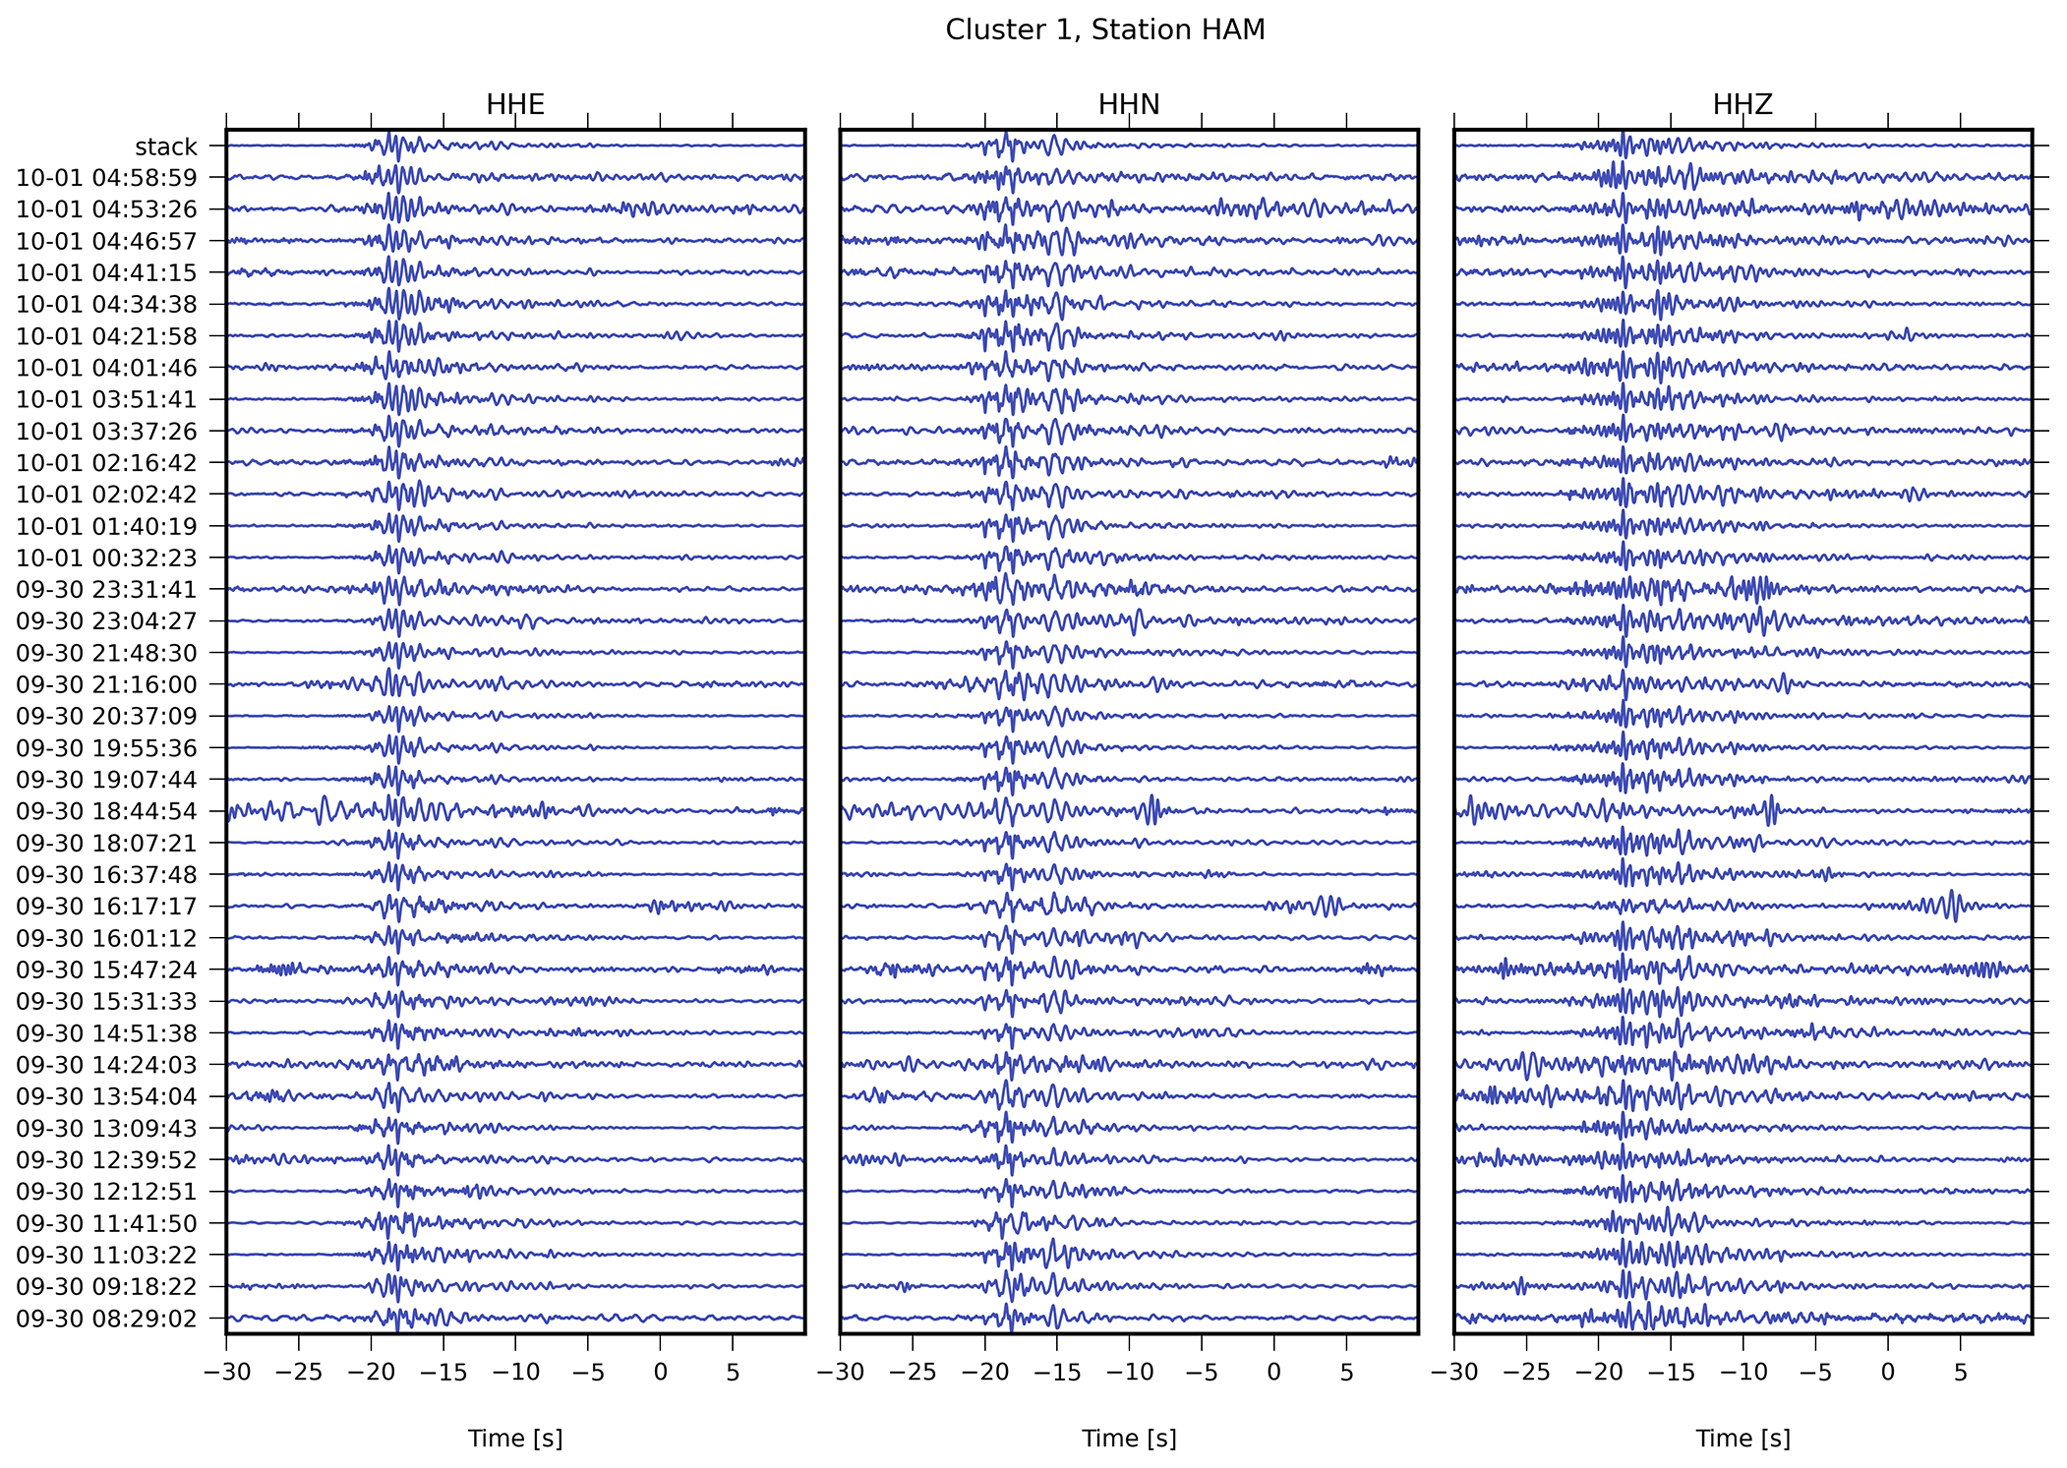
Figure A1Example comparison of waveforms of the events in cluster 1, as observed at station HAM.
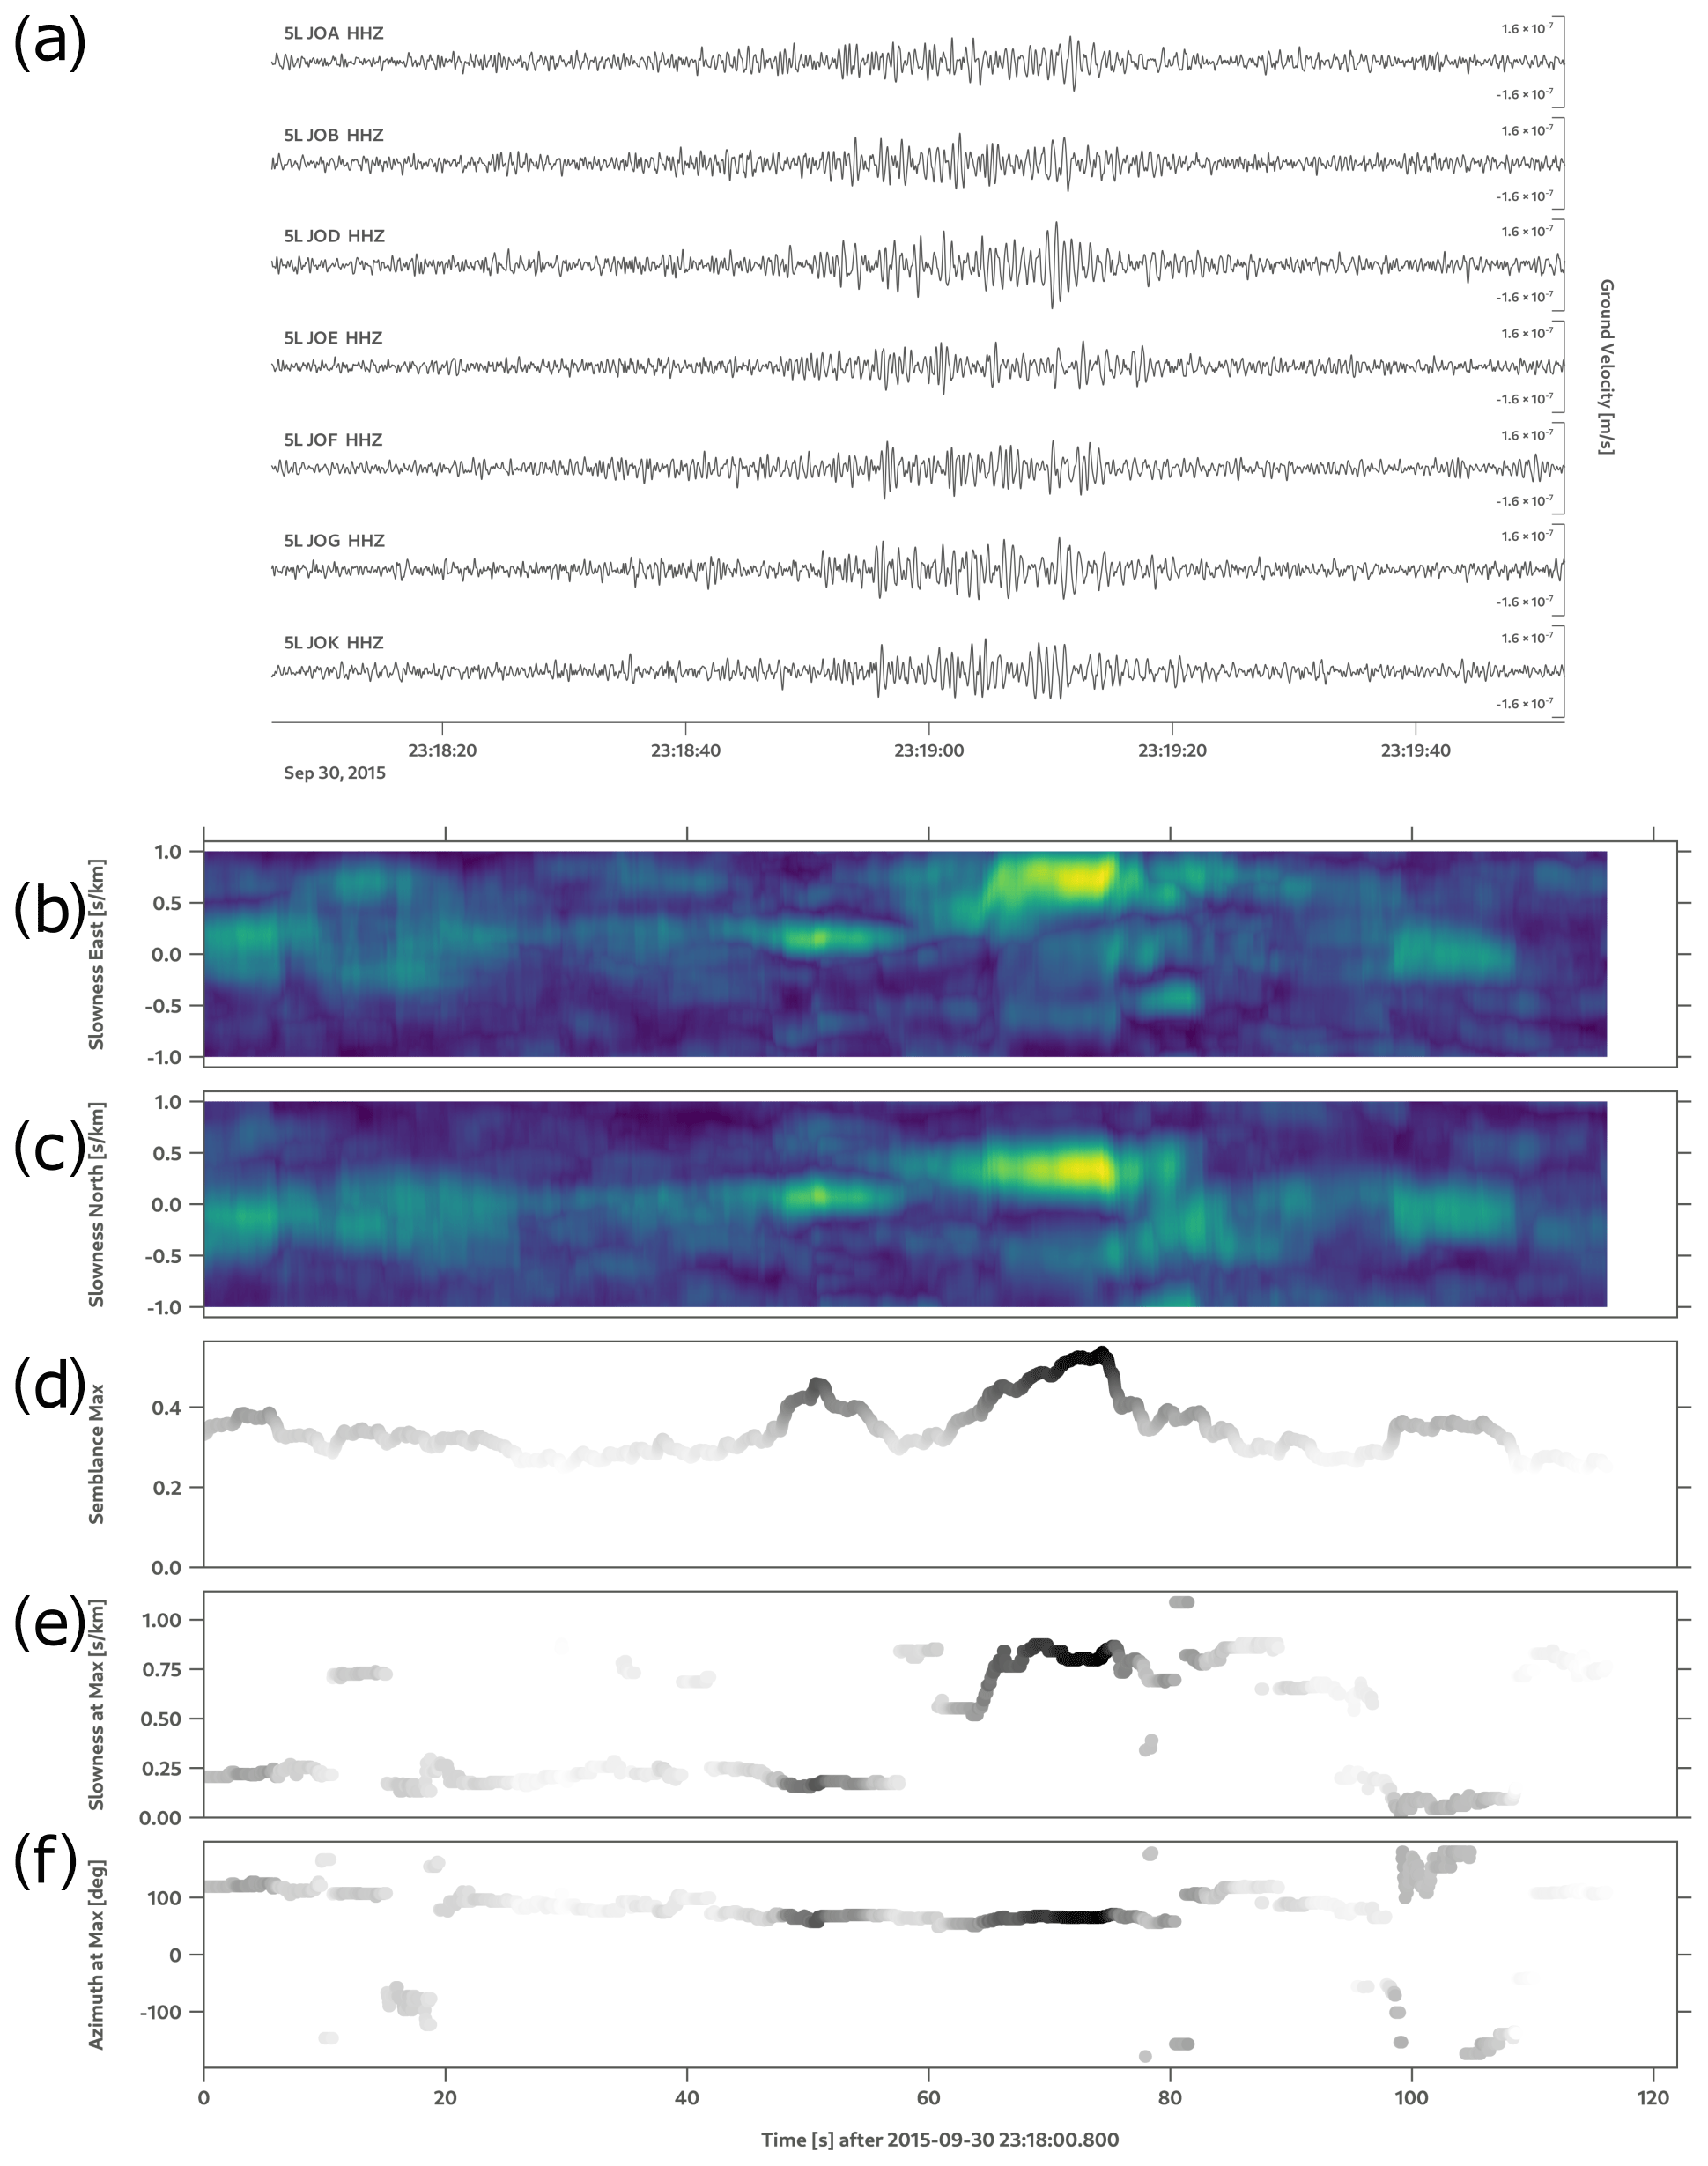
Figure A2Example of a clustered (cauldron) event filtered from 1.5 to 5 Hz. (a) Seismic waveforms of all stations in the JO array. (b–f) Beam-stacking grid search results as a function of time, including (top to bottom) the (b–c) component-wise projection of semblance maximum, where lighter colours indicate higher semblance. (d) Maximum semblance over all slowness values. (e) Slowness and (f) back azimuth values at the semblance maximum value at each time step, where dark colours indicate higher corresponding semblance values.
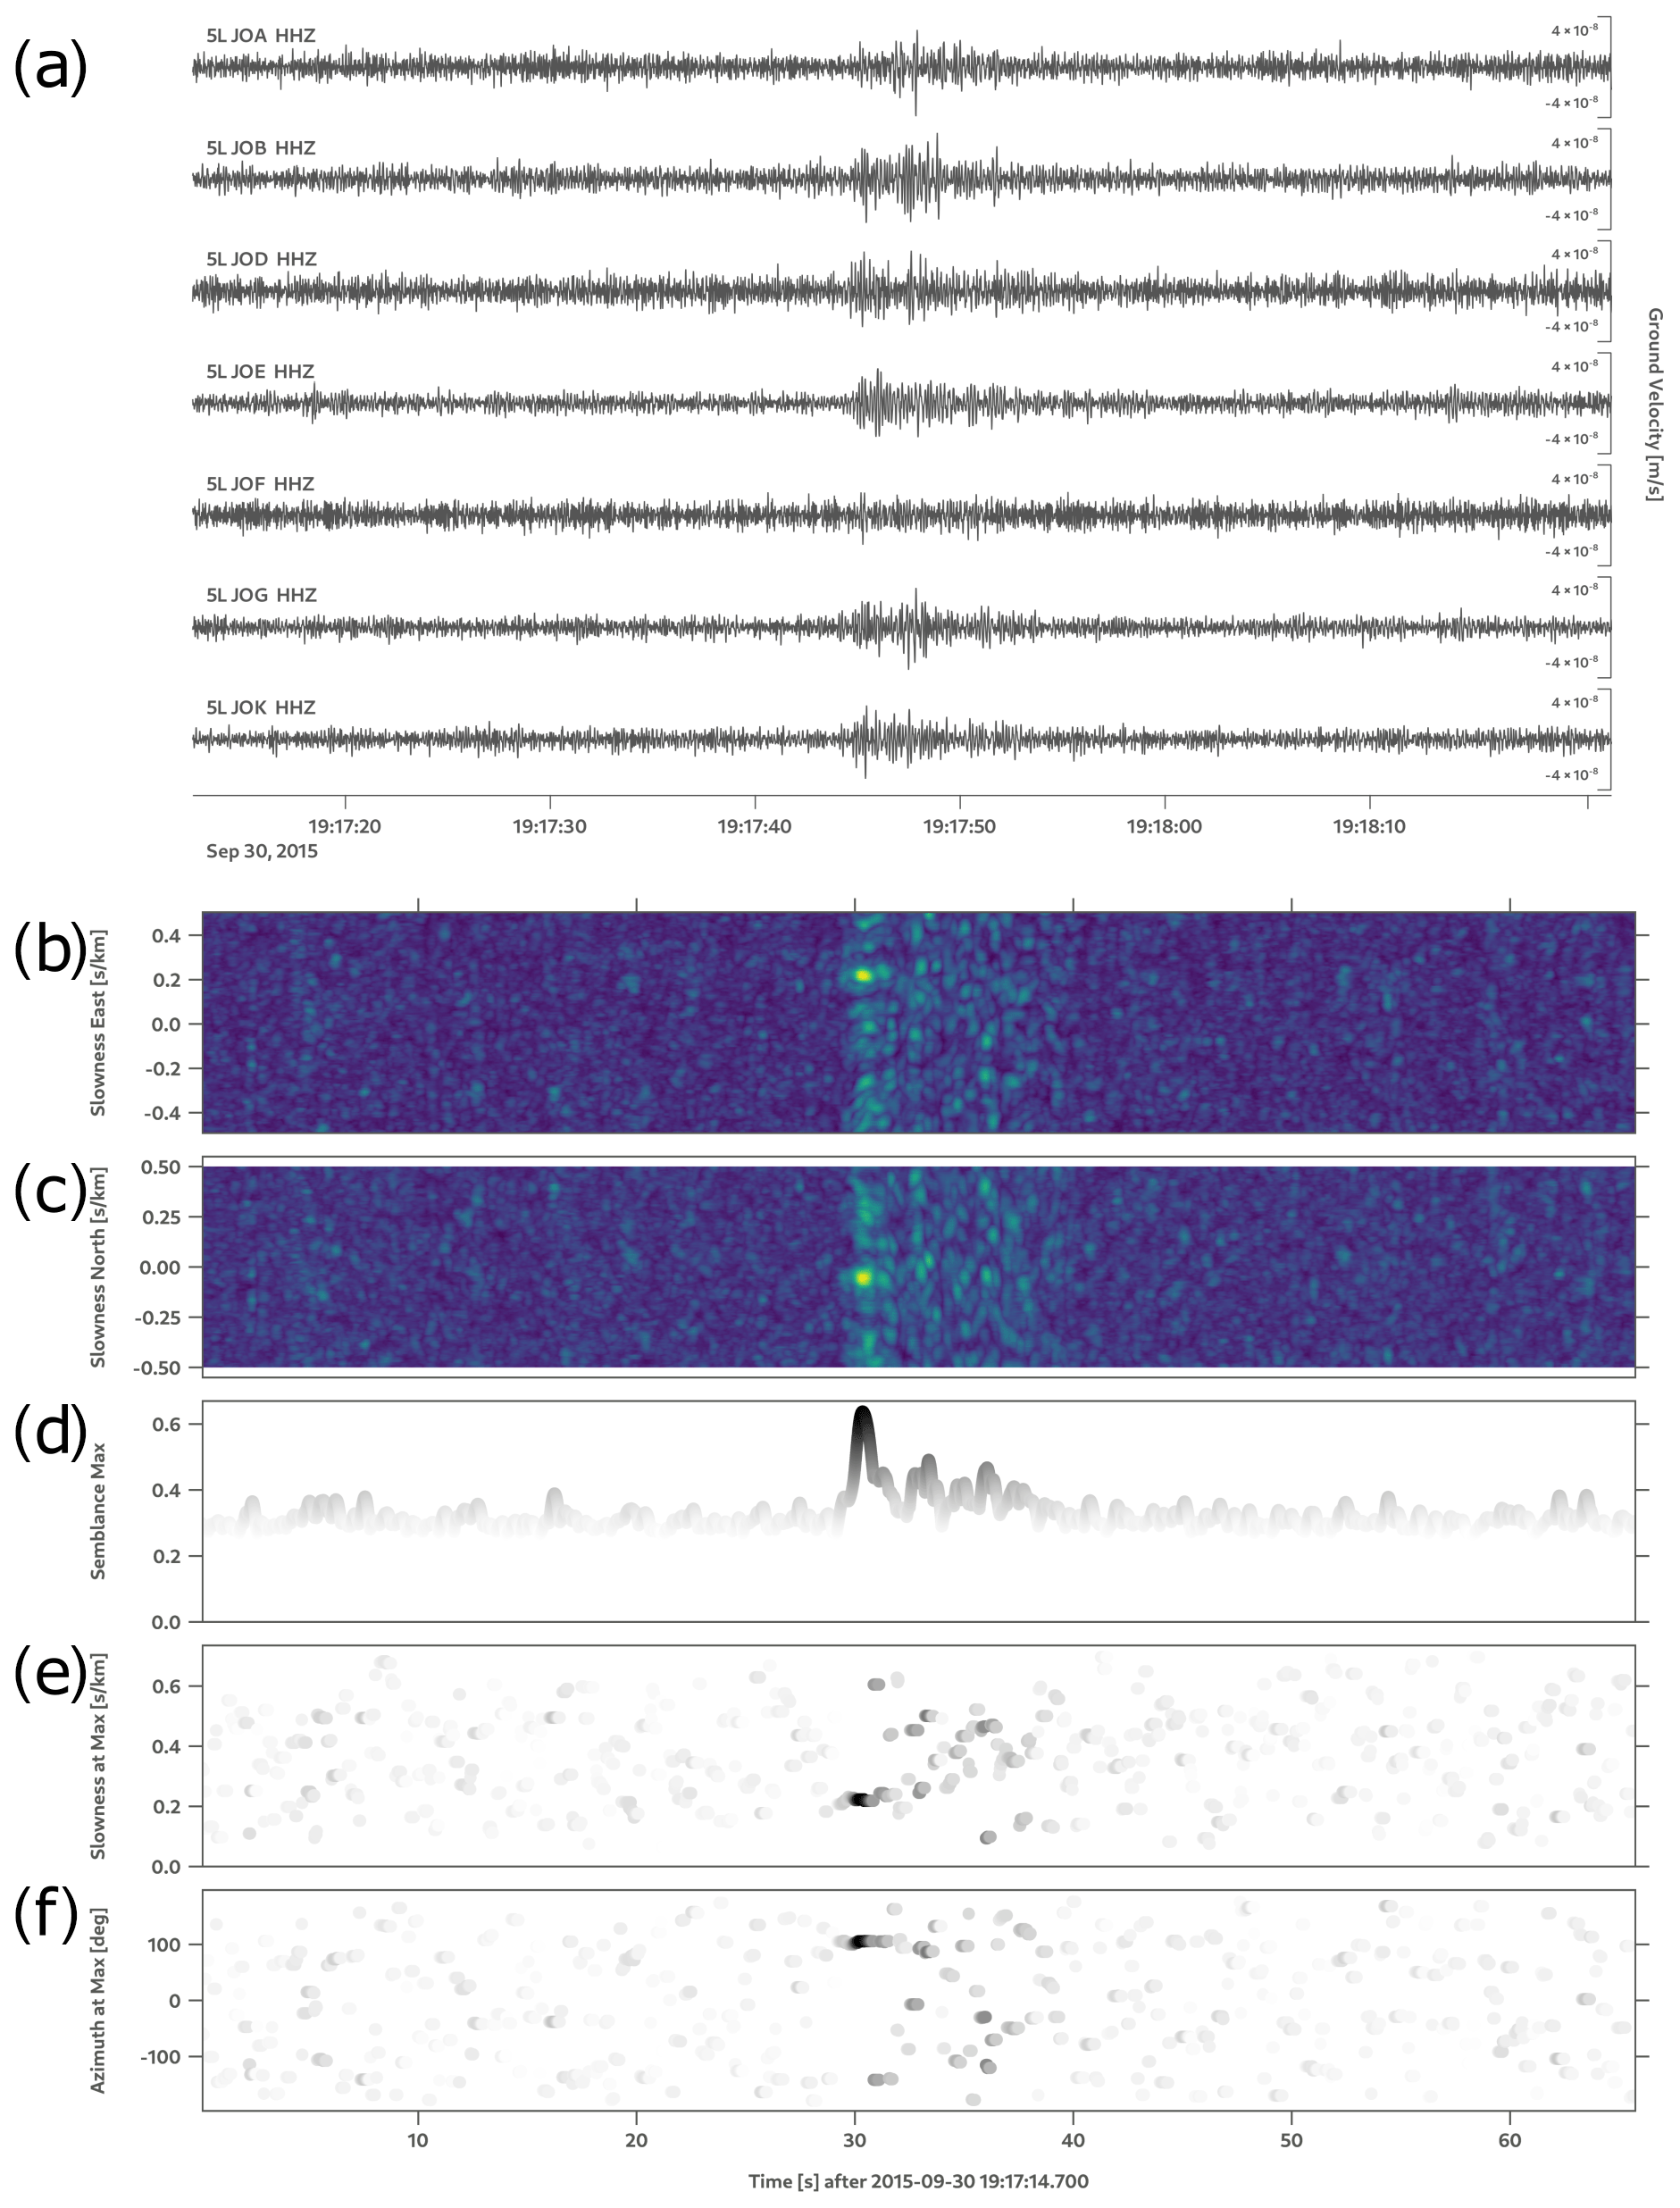
Seismic data are available via GEOFON (5L seismic network; https://doi.org/10.14470/0Y7568667884, Bean and Vogfjörd, 2020). The FK analysis was performed using the freely available Python toolbox, ObsPy. Event catalogues are available from GFZ (German Research Centre for Geosciences) Data Services (https://doi.org/10.5880/fidgeo.2023.023, Eibl et al., 2023).
EE, CB, and KV initiated the study conception and design. Data collection was performed and supported by BB, EE, BO, MR, and MJ. Data analysis was performed by EE, KV, BO, MJ, SH, and TD. The first draft was written by EE, and all authors commented on previous versions of the paper. All authors read and approved the final paper.
The contact author has declared that none of the authors has any competing interests.
Publisher’s note: Copernicus Publications remains neutral with regard to jurisdictional claims in published maps and institutional affiliations.
We thank Bergur Einarsson for fruitful discussions, Martin Möllhoff, Heiko Buxel, Baldur Bergsson, Vilhjálmur S. Kjartansson, and Þorsteinn Jónsson for technical support, and Aoife Braiden for support in the field. Water samples were collected at Skaftárdalur and Kirkjubæjarklaustur by IMO staff. We acknowledge the assistance of Tómas Jóhannesson, who provided data and contributed to the interpretation presented in the paper. We extend our thanks to Iwona Galeczka for the processing of these samples at the University of Iceland.
Fieldwork, data collection, and analysis was performed within the framework of FUTUREVOLC, funded by the European Union's Seventh Programme for research, technological development, and demonstration (grant no. 308377). Morgan T. Jones is supported by the Research Council of Norway (project nos. 223272 and 263000). The Landsvirkjun (National Power Company of Iceland) Research Fund, the Icelandic Road Administration, the Kvískerja fund, and the Iceland Glaciological Society have supported the glaciological fieldwork and research on jökulhlaups from the Skaftá cauldrons.
This paper was edited by Daniella Rempe and reviewed by Małgorzata Chmiel and three anonymous referees.
Allen, R.: Automatic phase pickers: Their present use and future prospects, B. Seismol. Soc. Am., 72, S225–S242, https://doi.org/10.1785/BSSA07206B0225, 1982. a
Ankerst, M., Breunig, M. M., Kriegel, H.-P., and Sander, J.: OPTICS: Ordering points to identify the clustering structure, Sigmod. Rec., 28, 49–60, https://doi.org/10.1145/304181.304187, 1999. a
Ármannsson, H.: The fluid geochemistry of Icelandic high temperature geothermal areas, Appl. Geochem., 66, 14–64, https://doi.org/10.1016/j.apgeochem.2015.10.008, 2016. a
Arnórsson, S. and Andrésdóttir, A.: Processes controlling the distribution of boron and chlorine in natural waters in Iceland, Geochim. Cosmochim. Ac., 59, 4125–4146, https://doi.org/10.1016/0016-7037(95)00278-8, 1995. a
Bartholomaus, T. C., Amundson, J. M., Walter, J. I., O'Neel, S., West, M. E., and Larsen, C. F.: Subglacial discharge at tidewater glaciers revealed by seismic tremor, Geophys. Res. Lett., 42, 6391–6398, https://doi.org/10.1002/2015GL064590, 2015. a, b, c, d, e, f, g, h
Bean, C. J. and Vogfjörd, K. S.: Seismic array data for monitoring and tracking tremor sources during subglacial floods and volcanic eruptions at Vatnajökull (Vatna Glacier), Iceland, GFZ Data Services, https://doi.org/10.14470/0Y7568667884, 2020. a, b
Behm, M., Walter, J. I., Binder, D., Cheng, F., Citterio, M., Kulessa, B., Langley, K., Limpach, P., Mertl, S., Schöner, W., Tamstorf, M., and Weyss, G.: Seismic characterization of a rapidly-rising jökulhlaup cycle at the A.P. Olsen Ice Cap, NE-Greenland, J. Glaciol., 66, 329–347, https://doi.org/10.1017/jog.2020.9, 2020. a, b, c, d, e, f
Benediktsdóttir, Á., Gudmundsson, Ó., Li, K. L., and Brandsdóttir, B.: Volcanic tremor of the 2010 Eyjafjallajökull eruption, Geophys. J. Int., 228, 1015–1037, https://doi.org/10.1093/gji/ggab378, 2021. a
Beyreuther, M., Barsch, R., Krischer, L., Megies, T., Behr, Y., and Wassermann, J.: ObsPy: A Python Toolbox for Seismology, Seismol. Res. Lett., 81, 530–533, https://doi.org/10.1785/gssrl.81.3.530, 2010. a
Björnsson, H.: Marginal and supraglacial lakes in Iceland, Jökull, 26, 40–51, 1976. a
Björnsson, H.: The cause of jökulhlaups in the Skaftá River, Vatnajökull, Jökull, 27, 71–78, 1977. a, b, c, d
Björnsson, H.: Surface and bedrock topography of ice caps in Iceland, mapped by radio echo-sounding, Ann. Glaciol., 8, 11–18, 1986. a, b
Björnsson, H.: Hydrology of Ice Caps in Volcanic Regions, Vísindafélag Íslendinga, 45, 139 pp., 21 maps, https://cir.nii.ac.jp/crid/1130000796093865216 (last access: 18 September 2023), 1988. a, b, c
Björnsson, H.: Jökulhlaups in Iceland: prediction, characteristics and simulation, Ann. Glaciol., 16, 95–106, https://doi.org/10.3189/1992AoG16-1-95-10, 1992. a
Björnsson, H.: Subglacial lakes and jökulhlaups in Iceland, Global Planet. Change, 35, 255–271, https://doi.org/10.1016/S0921-8181(02)00130-3, 2003. a, b, c, d, e, f
Björnsson, H.: Understanding jökulhlaups: from tale to theory, J. Glaciol., 56, 1002–1010, https://doi.org/10.3189/002214311796406086, 2010. a, b
Böðvarsson, R. and Lund, B.: The SIL seismological data acquisition system – As operated in Iceland and in Sweden –, in: Methods and Applications of Signal Processing in Seismic Network Operations, 660, 131–148, Springer Berlin Heidelberg, Berlin, Heidelberg, https://doi.org/10.1007/BFb0117700, 2003. a
Böðvarsson, R., Rögnvaldsson, S. T., Jakobsdóttir, S. S., Slunga, R., and Stefánsson, R.: The SIL Data Acquisition and Monitoring System, Seismol. Res. Lett., 67, 35–46, https://doi.org/10.1785/gssrl.67.5.35, 1996. a
Böðvarsson, R., Rögnvaldsson, S. T., Slunga, R., and Kjartansson, E.: The SIL data acquisition system-at present and beyond year 2000, Phys. Earth Planet. In., 113, 89–101, https://doi.org/10.1016/S0031-9201(99)00032-1, 1999. a
Burtin, A., Bollinger, L., Vergne, J., Cattin, R., and Nábělek, J. L.: Spectral analysis of seismic noise induced by rivers: A new tool to monitor spatiotemporal changes in stream hydrodynamics, J. Geophys. Res.-Sol. Ea., 113, 1–14, https://doi.org/10.1029/2007JB005034, 2008. a
Burtin, A., Cattin, R., Bollinger, L., Vergne, J., Steer, P., Robert, A., Findling, N., and Tiberi, C.: Towards the hydrologic and bed load monitoring from high-frequency seismic noise in a braided river: The “torrent de St Pierre”, French Alps, J. Hydrol., 408, 43–53, https://doi.org/10.1016/j.jhydrol.2011.07.014, 2011. a
Capon, J.: High-resolution frequency-wavenumber spectrum analysis, Adaptive Antennas for Wireless Communications, 57, 146–156, https://doi.org/10.1109/9780470544075.ch2, 2009. a
Chapp, E., Bohnenstiehl, D. R., and Tolstoy, M.: Sound-channel observations of ice-generated tremor in the Indian Ocean, Geochem. Geophy. Geosy., 6, Q06003, https://doi.org/10.1029/2004GC000889, 2005. a
Cook, K. L., Andermann, C., Gimbert, F., Adhikari, B. R., and Hovius, N.: Glacial lake outburst floods as drivers of fluvial erosion in the Himalaya, Science, 362, 53–57, 2018. a, b, c
Driedger, C. L. and Fountain, A. G.: Glacier outburst floods at Mount Rainier, Washington State, USA, Ann. Glaciol., 13, 51–55, 1989. a
Eibl, E. P., Bean, C. J., Vogfjörd, K. S., Ying, Y., Lokmer, I., Möllhoff, M., O'Brien, G. S., and Pálsson, F.: Tremor-rich shallow dyke formation followed by silent magma flow at Bárdarbunga in Iceland, Nat. Geosci., 10, 299–304, https://doi.org/10.1038/ngeo2906, 2017a. a, b
Eibl, E. P., Bean, C. J., Einarsson, B., Pàlsson, F., and Vogfjörd, K. S.: Seismic ground vibrations give advanced early-warning of subglacial floods, Nat. Commun., 11, 2504, https://doi.org/10.1038/s41467-020-15744-5, 2020. a, b, c, d, e, f, g, h, i, j, k, l, m, n
Eibl, E. P. S., Bean, C. J., Jónsdóttir, I., Höskuldsson, A., Thordarson, T., Coppola, D., Witt, T., and Walter, T. R.: Multiple coincident eruptive seismic tremor sources during the 2014-2015 eruption at Holuhraun, Iceland, J. Geophys. Res.-Sol. Ea., 122, 2972–2987, https://doi.org/10.1002/2016JB013892, 2017b. a, b
Eibl, E. P. S., Vogfjörd, K., Dietrich, T., Heimann, S., and Bean, C. J.: Event catalogs of seismic events accompanying the 30 September to 5 October 2015 Skaftá flood, https://doi.org/10.5880/fidgeo.2023.023, 2023. a
Einarsson, B.: Jökulhlaups in Skaftá: A study of a jökulhlaup from the Western Skaftá cauldron in the Vatnajökull ice cap, Iceland, PhD thesis, https://en.vedur.is/media/vedurstofan/utgafa/skyrslur/2009/VI_2009_006_tt.pdf (last access: 18 September 2023), 2009. a, b
Einarsson, B., Magnússon, E., Roberts, M. J., Pálsson, F., Thorsteinsson, T., and Jóhannesson, T.: A spectrum of jökulhlaup dynamics revealed by GPS measurements of glacier surface motion, Ann. Glaciol., 57, 47–61, https://doi.org/10.1017/aog.2016.8, 2016. a, b, c, d, e
Einarsson, B., Jóhannesson, T., Thorsteinsson, T., Gaidos, E., and Zwinger, T.: Subglacial flood path development during a rapidly rising jökulhlaup from the western Skaftá cauldron, Vatnajökull, Iceland, J. Glaciol., 63, 670–682, https://doi.org/10.1017/jog.2017.33, 2017. a, b, c, d
Fahnestock, M., Abdalati, W., Joughin, I., Brozena, J., and Gogineni, P.: High Geothermal Heat Flow, Basal Melt, and the Origin of Rapid Ice Flow in Central Greenland, Science, 294, 2338–2342, https://doi.org/10.1126/science.1065370, 2001. a
Galeczka, I., Eiriksdottir, E. S., Hardardottir, J., Oelkers, E. H., Torssander, P., and Gislason, S. R.: The effect of the 2002 glacial flood on dissolved and suspended chemical fluxes in the Skaftá river, Iceland, J. Volcanol. Geoth. Res., 301, 253–276, https://doi.org/10.1016/j.jvolgeores.2015.05.008, 2015. a
Gimbert, F., Tsai, V. C., and Lamb, M. P.: A physical model for seismic noise generation by turbulent flow in rivers, J. Geophys. Res.-Earth, 119, 2209–2238, https://doi.org/10.1002/2014JF003201, 2014. a
Gimbert, F., Tsai, V. C., Amundson, J. M., Bartholomaus, T. C., and Walter, J. I.: Subseasonal changes observed in subglacial channel pressure, size, and sediment transport, Geophys. Res. Lett., 43, 3786–3794, https://doi.org/10.1002/2016GL068337, 2016. a, b, c, d, e, f
Grinsted, A., Hvidberg, C. S., Campos, N., and Dahl-Jensen, D.: Periodic outburst floods from an ice-dammed lake in East Greenland, Sci. Rep., 7, 9966, https://doi.org/10.1038/s41598-017-07960-9, 2017. a
Gudmundsson, M. T. and Björnsson, H.: Eruptions in Grímsvötn, Vatnajökull, Iceland, 1934–1991, Jökull, 41, 21–45, 1991. a
Gudmundsson, M. T., Sigmundsson, F., and Björnsson, H.: Ice–volcano interaction of the 1996 Gjalp subglacial eruption, Vatnajökull, Iceland, Nature, 389, 954–957, https://doi.org/10.1038/40122, 1997. a
Gudmundsson, M. T., Jónsdóttir, K., Hooper, A., Holohan, E. P., Halldórsson, S. A., Ófeigsson, B. G., Cesca, S., Vogfjörd, K. S., Sigmundsson, F., Högnadóttir, T., Einarsson, P., Sigmarsson, O., Jarosch, A. H., Jónasson, K., Magnússon, E., Hreinsdóttir, S., Bagnardi, M., Parks, M. M., Hjörleifsdóttir, V., Pálsson, F., Walter, T. R., Schöpfer, M. P. J., Heimann, S., Reynolds, H. I., Dumont, S., Bali, E., Gudfinnsson, G. H., Dahm, T., Roberts, M. J., Hensch, M., Belart, J. M. C., Spaans, K., Jakobsson, S., Gudmundsson, G. B., Fridriksdóttir, H. M., Drouin, V., Dürig, T., Adalgeirsdóttir, G., Riishuus, M. S., Pedersen, G. B. M., Van Boeckel, T., Oddsson, B., Pfeffer, M. A., Barsotti, S., Bergsson, B., Donovan, A., Burton, M. R., and Aiuppa, A.: Gradual caldera collapse at Bárdarbunga volcano, Iceland, regulated by lateral magma outflow, Science, 353, 262, https://doi.org/10.1126/science.aaf8988, 2016. a
Heeszel, D. S., Walter, F., and Kilb, D. L.: Humming glaciers, Geology, 42, 1099–1102, https://doi.org/10.1130/G35994.1, 2014. a
Heimann, S., Kriegerowski, M., Isken, M., Cesca, S., Daout, S., Grigoli, F., Juretzek, C., Megies, T., Nooshiri, N., Steinberg, A., Sudhaus, H., Vasyura-Bathke, H., Willey, T., and Dahm, T.: Pyrocko – An open-source seismology toolbox and library. V. 0.3, Tech. rep., GFZ, https://doi.org/10.5880/GFZ.2.1.2017.001, 2017. a
Herring, T. A., King, R. W., Mcclusky, S. C., and Sciences, P.: Introduction to GAMIT/GLOBK, Tech. Rep. June 2015, Mass. Instit. Tech., http://www-gpsg.mit.edu/~simon/gtgk (last access: December 2017), 2015. a
Hsu, L., Finnegan, N. J., and Brodsky, E. E.: A seismic signature of river bedload transport during storm events, Geophys. Res. Lett., 38, 1–6, https://doi.org/10.1029/2011GL047759, 2011. a
Jóhannesson, T.: Propagation of a subglacial flood wave during the initiation of a jökulhlaup, Hydrolog. Sci. J., 47, 417–434, https://doi.org/10.1080/02626660209492944, 2002. a, b
Jóhannesson, T., Thorsteinsson, T., Stefánsson, A., Gaidos, E. J., and Einarsson, B.: Circulation and thermodynamics in a subglacial geothermal lake under the Western Skaftá cauldron of the Vatnajökull ice cap, Iceland, Geophys. Res. Lett., 34, 1–6, https://doi.org/10.1029/2007GL030686, 2007. a, b, c
Jones, M. T., Galeczka, I. M., Gkritzalis-Papadopoulos, A., Palmer, M. R., Mowlem, M. C., Vogfjörð, K., Jónsson, T., and Gislason, S. R.: Monitoring of jökulhlaups and element fluxes in proglacial Icelandic rivers using osmotic samplers, J. Volcanol. Geoth. Res., 291, 112–124, https://doi.org/10.1016/j.jvolgeores.2014.12.018, 2015. a, b
Kennett, B. L. N.: Stacking three-component seismograms, Geophys. J. Int., 141, 263–269, 2000. a
Krueger, F. and Weber, M.: The effect of low-velocity sediments on the mislocation vectors of the GRF array, Geophys. J. Int., 108, 387–393, https://doi.org/10.1111/j.1365-246X.1992.tb00866.x, 1992. a
Leet, R. C.: Saturated and subcooled hydrothermal boiling in groundwater flow channels as a source of harmonic tremor, J. Geophys. Res., 93, 4835, https://doi.org/10.1029/JB093iB05p04835, 1988. a
Lindner, F., Walter, F., Laske, G., and Gimbert, F.: Glaciohydraulic seismic tremors on an Alpine glacier, The Cryosphere, 14, 287–308, https://doi.org/10.5194/tc-14-287-2020, 2020. a, b, c, d, e, f, g, h, i, j, k, l, m
Lipovsky, B. P. and Dunham, E. M.: Tremor during ice-stream stick slip, The Cryosphere, 10, 385–399, https://doi.org/10.5194/tc-10-385-2016, 2016. a, b
Livingstone, S. J., Sole, A. J., Storrar, R. D., Harrison, D., Ross, N., and Bowling, J.: Brief communication: Subglacial lake drainage beneath Isunguata Sermia, West Greenland: geomorphic and ice dynamic effects, The Cryosphere, 13, 2789–2796, https://doi.org/10.5194/tc-13-2789-2019, 2019. a
Loose, B., Naveira Garabato, A. C., Schlosser, P., Jenkins, W. J., Vaughan, D., and Heywood, K. J.: Evidence of an active volcanic heat source beneath the Pine Island Glacier, Nat. Commun., 9, 1–9, https://doi.org/10.1038/s41467-018-04421-3, 2018. a
MacAyeal, D. R., Okal, E. A., Aster, R. C., and Bassis, J. N.: Seismic and hydroacoustic tremor generated by colliding Icebergs, J. Geophys. Res.-Earth, 113, 1–10, https://doi.org/10.1029/2008JF001005, 2008. a, b, c
Magnússon, E., Rott, H., Björnsson, H., and Pálsson, F.: The impact of jökulhlaups on basal sliding observed by SAR interferometry on Vatnajökull, Iceland, J. Glaciol., 53, 232–240, https://doi.org/10.3189/172756507782202810, 2007. a, b, c, d, e
Magnússon, E., Gudmundsson, M. T., Roberts, M. J., Sigurdsson, G., Höskuldsson, F., and Oddsson, B.: Ice-volcano interactions during the 2010 Eyjafjallajkull eruption, as revealed by airborne imaging radar, J. Geophys. Res.-Sol. Ea., 117, 1–17, https://doi.org/10.1029/2012JB009250, 2012. a
Magnússon, E., Pálsson, F., Gudmundsson, M. T., Högnadóttir, T., Rossi, C., Thorsteinsson, T., Ófeigsson, B. G., Sturkell, E., and Jóhannesson, T.: Development of a subglacial lake monitored with radio-echo sounding: case study from the eastern Skaftá cauldron in the Vatnajökull ice cap, Iceland, The Cryosphere, 15, 3731–3749, https://doi.org/10.5194/tc-15-3731-2021, 2021. a
Megies, T., Beyreuther, M., Barsch, R., Krischer, L., and Wassermann, J.: ObsPy – what can it do for data centers and observatories?, Ann. Geophys., 54, 47–58, https://doi.org/10.4401/ag-4838, 2011. a
Montanaro, C., Scheu, B., Gudmundsson, M. T., Vogfjörd, K., Reynolds, H. I., Dürig, T., Strehlow, K., Rott, S., Reuschlé, T., and Dingwell, D. B.: Multidisciplinary constraints of hydrothermal explosions based on the 2013 Gengissig lake events, Kverkfjöll volcano, Iceland, Earth Planet. Sci. Lett., 434, 308–319, https://doi.org/10.1016/j.epsl.2015.11.043, 2016. a, b, c, d
Müller, C., Schlindwein, V., Eckstaller, A., and Miller, H.: Geophysics: Singing icebergs, Science, 310, 1299, https://doi.org/10.1126/science.1117145, 2005. a
Old, G. H., Lawler, D. M., and Snorrason, Á.: Discharge and suspended sediment dynamics during two jökulhlaups in the Skaftá river, Iceland, Earth Surf. Proc. Land., 30, 1441–1460, https://doi.org/10.1002/esp.1216, 2005. a
Pálsson, F., Gunnarsson, A., Jónsson, Steinþórsson, S., and Pálsson, H. S.: Vatnajökull: Mass balance, meltwater drainage and surface velocity of the glacial year 2012–2013, Tech. rep., http://gogn.lv.is/files/2014/2014-138.pdf (last access: 18 September 2023), 2014. a
Pedregosa, F., Varoquaux, G., Gramfort, A., Michel, V., Thirion, B., Grisel, O., Blondel, M., Prettenhofer, P., Weiss, R., Dubourg, V., Vanderplas, J., Passos, A., Cournapeau, D., Brucher, M., Perrot, M., and Duchesnay, E.: Scikit-learn: Machine Learning in Python, J. Mach. Learn. Res., 12, 2825–2830, 2011. a
Podolskiy, E. A. and Walter, F.: Cryoseismology, Rev. Geophys., 54, 708–758, https://doi.org/10.1002/2016RG000526, 2016. a, b
Richardson, D.: Glacier outburst floods in the Pacific Northwest, Geological Survey Research, 1968. a
Roberts, M. J.: Jökulhlaups: A reassessment of floodwater flow through glaciers, Rev. Geophys., 43, 1–21, https://doi.org/10.1029/2003RG000147, 2005. a
Roberts, M. J., Stefánsson, R., Björnsson, H., Russell, A. J., Tweed, F. S., Harris, T. D., Fay, H., Knudsen, Ó., and Guðmundsson, G. B.: Recent jökulhlaups from Western Vatnajökull, Iceland: Hydrologic insights from seismic tremor measurements and aerial observations, in: EGS-AGU-EUG Joint Assembly, https://ui.adsabs.harvard.edu/abs/2003EAEJA....12174R/abstract (last access: 18 September 2023), 2003. a
Roberts, M. J., Pálsson, F., Gudmundsson, M. T., Björnsson, H., and Tweed, F. S.: Ice–water interactions during floods from Grænalón glacier-dammed lake, Iceland, Ann. Glaciol., 40, 133–138, https://doi.org/10.3189/172756405781813771, 2005. a
Rögnvaldsson, S. and Slunga, R.: Routine Fault Plane Solutions for Local Networks: a Test With Synthetic Data, B. Seismol. Soc. Am., 83, 1232–1247, 1993. a
Röösli, C., Walter, F., Husen, S., Andrews, L. C., Lüthi, M. P., Catania, G. A., and Kissling, E.: Sustained seismic tremors and icequakes detected in the ablation zone of the Greenland ice sheet, J. Glaciol., 60, 563–575, https://doi.org/10.3189/2014JoG13J210, 2014. a, b
Röösli, C., Walter, F., Ampuero, J. P., and Kissling, E.: Seismic moulin tremor, J. Geophys. Res.-Sol. Ea., 121, 5838–5858, https://doi.org/10.1002/2015JB012786, 2016. a
Schmandt, B., Aster, R. C., Scherler, D., Tsai, V. C., and Karlstrom, K.: Multiple fluvial processes detected by riverside seismic and infrasound monitoring of a controlled flood in the Grand Canyon, Geophys. Res. Lett., 40, 4858–4863, https://doi.org/10.1002/grl.50953, 2013. a
Schroeder, D. M., Blankenship, D. D., Young, D. A., and Quartini, E.: Evidence for elevated and spatially variable geothermal flux beneath the West Antarctic Ice Sheet, P. Natl. Acad. Sci. USA, 111, 9070–9072, https://doi.org/10.1073/pnas.1405184111, 2014. a
Schweitzer, J.: Slowness corrections – One way to improve IDC products, Pure Appl. Geophys., 158, 375–396, https://doi.org/10.1007/PL00001165, 2001. a
Sigmundsson, F., Hooper, A., Hreinsdóttir, S., Vogfjörd, K. S., Ófeigsson, B. G., Heimisson, E. R., Dumont, S., Parks, M., Spaans, K., Gudmundsson, G. B., Drouin, V., Árnadóttir, T., Jónsdóttir, K., Gudmundsson, M. T., Högnadóttir, T., Fridriksdóttir, H. M., Hensch, M., Einarsson, P., Magnússon, E., Samsonov, S., Brandsdóttir, B., White, R. S., Ágústsdóttir, T., Greenfield, T., Green, R. G., Hjartardóttir, Á. R., Pedersen, R., Bennett, R. A., Geirsson, H., la Femina, P. C., Björnsson, H., Pálsson, F., Sturkell, E., Bean, C. J., Möllhoff, M., Braiden, A. K., and Eibl, E. P. S.: Segmented lateral dyke growth in a rifting event at Bárðarbunga volcanic system, Iceland, Nature, 517, 191–195, https://doi.org/10.1038/nature14111, 2014. a
Stefansson, R., Bodvarsson, R., Slunga, R., Einarsson, P., Jakobsdottir, S., Bungum, H., Gregersen, S., Havskov, J., Hjelme, J., and Korhonen, H.: Earthquake prediction research in the South Iceland Seismic Zone and the SIL Project, B. Seismol. Soc. Am., 83, 696–716, 1993. a
Sturkell, E., Einarsson, P., Roberts, M. J., Geirsson, H., Gudmundsson, M. T., Sigmundsson, F., Pinel, V., Gudmundsson, G. B., Ólafsson, H., and Stefánsson, R.: Seismic and geodetic insights into magma accumulation at Katla subglacial volcano, Iceland: 1999 to 2005, J. Geophys. Res.-Sol. Ea., 113, 1–17, https://doi.org/10.1029/2006JB004851, 2008. a
Tómasson, H. and Vilmundardóttir, E. G.: Nokkrar athuganir við Langasjó [Several observations at lake Langasjór], National Energy Authority, report 10385, National Energy Authority, 1967. a
Vogfjörd, K. and Langston, C.: Characteristics of short-period wave propagation in regions of Fennoscandia, with emphasis on Lg, B. Seismol. Soc. Am., 86, 1873–1895, 1996. a
Vore, M. E., Bartholomaus, T. C., Winberry, J. P., Walter, J. I., and Amundson, J. M.: Seismic Tremor Reveals Spatial Organization and Temporal Changes of Subglacial Water System, J. Geophys. Res.-Earth, 124, 1–20, https://doi.org/10.1029/2018jf004819, 2019. a, b
Wagner, W., Cooper, J. R., Dittmann, A., Kijima, J., Kretzschmar, H.-J., Kruse, A., Mares, R., Oguchi, K., Sato, H., Stöcker, I., Sifner, O., Takaishi, Y., Tanishita, I., Trübenbach, J., and Willkommen, T.: The IAPWS Industrial Formulation 1997 for the Thermodynamic Properties of Water and Steam, Tech. Rep. 1, Erlangen, Germany, https://doi.org/10.1115/1.483186, 2000. a
Waythomas, C. F., Pierson, T. C., Major, J. J., and Scott, W. E.: Voluminous ice-rich and water-rich lahars generated during the 2009 eruption of Redoubt Volcano, Alaska, J. Volcanol. Geoth. Res., 259, 389–413, https://doi.org/10.1016/j.jvolgeores.2012.05.012, 2013. a
Werder, M. A. and Funk, M.: Dye tracing a jökulhlaup: II. Testing a jökulhlaup model against flow speeds inferred from measurements, J. Glaciol., 55, 899–908, https://doi.org/10.3189/002214309790152375, 2009. a
Winberry, J. P., Anandakrishnan, S., and Alley, R. B.: Seismic observations of transient subglacial water-flow beneath MacAyeal Ice Stream, West Antarctica, Geophys. Res. Lett., 36, L11502, https://doi.org/10.1029/2009GL037730, 2009. a, b, c
Winberry, J. P., Anandakrishnan, S., Wiens, D. A., and Alley, R. B.: Nucleation and seismic tremor associated with the glacial earthquakes of Whillans Ice Stream, Antarctica, Geophys. Res. Lett., 40, 312–315, https://doi.org/10.1002/grl.50130, 2013. a
Ying, Y., Eibl, E. P. S., Bean, C. J., Vogfjörd, K., and Pálsson, F.: Full Wavefield Numerical Simulations of Sub-glacial Seismic Tremor at Vatnajökull Glacier, Iceland, in: EGU General Assembly Conference Abstracts, vol. 17, https://ui.adsabs.harvard.edu/abs/2015EGUGA..1714488Y/abstract (last access: 18 September 2023), 2015. a
Zóphóníasson, S.: Rennsli í Skaftárhlaupum 1955–2002, Tech. rep., Report SZ-2002/01, National Energy Authority, Reykjavík, 2002. a, b
Þórarinsson, S. and Rist, S.: Skaftárhlaup í september 1955 [Jökulhlaup in Skaftá in September 1955], Jökull, 5, 37–40, 1955. a