the Creative Commons Attribution 4.0 License.
the Creative Commons Attribution 4.0 License.
 | 20 Sep 2024
Acceleration of coastal-retreat rates for high-Arctic rock cliffs on Brøggerhalvøya, Svalbard, over the past decade
Livia Piermattei
Luc Girod
Kristoffer Aalstad
Trond Eiken
Andreas Kääb
Sebastian Westermann
In many Arctic regions, marine coastlines change rapidly in our currently warming climate. In contrast, coastal rock cliffs on Svalbard are considered to be relatively stable. Long-term trends of coastal-retreat rates for rock cliffs on Svalbard remain unknown, but quantifying them could improve our understanding of coastal dynamics in the Canadian Arctic Archipelago. This study presents coastal-retreat rates for rock cliffs along several kilometres of Brøggerhalvøya, Svalbard. The analysis relies on high-resolution orthoimages from 1970, 1990, 2010, and 2021. The data are corroborated by high-precision dGNSS (differential Global Navigation Satellite System) measurements obtained along selected segments of the coastline. Our analysis reveals statistically significant acceleration in coastal-retreat rates across Brøggerhalvøya between 2010 and 2021. The northeast-facing coastline features fairly stable conditions, with retreat rates of 0.04 ± 0.06 m a−1 (1970–1990; calculated retreat rate ± the corresponding measurement uncertainty), 0.04 ± 0.04 m a−1 (1990–2010), and 0.06 ± 0.08 m a−1 (2010–2021). Along the southwest-facing coastline, higher retreat rates of 0.26 ± 0.06 m a−1 (1970–1990), 0.24 ± 0.04 m a−1 (1990–2010), and 0.30 ± 0.08 m a−1 (2010–2021) were calculated. For the most recent decade, this corresponds to an increase of 50 % for the northeast-facing coastline and an increase of 25 % for the southwest-facing coastline. Furthermore, for the northeast-facing coastline, the proportion of the coastline affected by erosion increased from 47 % (1970–1990) to 65 % (2010–2021), while it stayed consistently above 90 % for the southwest-facing coastline. The recent acceleration in retreat rates coincides with increasing storminess and retreating sea ice, factors that can enhance coastal erosion.
- Article
(11592 KB) - Full-text XML
- BibTeX
- EndNote


Arctic permafrost environments can respond rapidly to changing climatic conditions (Biskaborn et al., 2019). This is especially true for Arctic coastlines, where sea-level rise, sea ice retreat, increasing seawater temperatures, and the loss of permafrost and glaciers have pronounced effects on coastal dynamics (Irrgang et al., 2022). Therefore, Arctic coasts often erode more rapidly than coasts in temperate regions, and the average retreat rate is estimated to be 0.5 m a−1 (Lantuit et al., 2012). However, variability in coastal-retreat rates across the Arctic is pronounced, both on regional and local scales. Lantuit et al. (2012) present a circum-Arctic database, which shows that the highest erosion rates of 0.7 to 1.2 m a−1 are detected in the Laptev Sea, the East Siberian Sea, and the Beaufort Sea. The highest erosion rates are often observed in ice-rich permafrost bluffs and barrier islands. Jones et al. (2018) report a maximum of 48.8 m a−1 for a similar setting along the US region of the Beaufort Sea from 2007 to 2008.
In response to changing climatic conditions, erosion rates along the Arctic coastline have increased since the early 2000s (Jones et al., 2020). This trend is expected to continue, with a sensitivity to warming ranging from 0.4 to 0.8 (Nielsen et al., 2022). Increasing coastal-erosion rates can enhance organic-carbon and sediment fluxes into the nearshore zone (Fritz et al., 2017; Tanski et al., 2017) and threaten infrastructure, settlements, and archaeological sites (Radosavljevic et al., 2016).
In contrast, lithified coastlines in the Arctic are assumed to be relatively stable and show lower erosion rates compared to unlithified Arctic coastlines. This can be explained by the higher resistance to erosion due to the lithology (Irrgang et al., 2022). Lithified coastlines are often found in Arctic archipelagos, such as the Canadian Arctic Archipelago, Greenland, and Svalbard. The topography of these areas is often characterized by fjords and narrow straits, preventing a long fetch and protecting the coastlines against wave activity (Overduin et al., 2014). The database from Lantuit et al. (2012) presents retreat rates of 0.01 m a−1 for the Canadian Arctic Archipelago and even lower rates for Svalbard, but there are considerable gaps in the understanding of Arctic coastal dynamics, especially with respect to lithified coastlines.
The coastal environment of Svalbard is influenced by paraglacial processes caused by glacial retreat since the Little Ice Age (Bourriquen et al., 2016). Consequences include the exposure of new coastal landscapes (Kavan and Strzelecki, 2023); intensified glaciofluvial sediment transport towards the coast, resulting in coastal progradation (Mercier and Laffly, 2005; Bourriquen et al., 2018); and increased exposure to storms and wave action, enhancing coastline retreat (Zagórski et al., 2015). In addition, terrestrial processes, such as precipitation events, can contribute to erosion, especially the erosion of unlithified material (Sessford et al., 2015). Regional studies on Svalbard show that the retreat of coastal rock cliffs occurs at a rate of mm a−1 to cm a−1: a yearly retreat of coastal cliffs of 2.7 to 3.1 mm (2002 to 2004) was observed in Kongsfjorden, (Wangensteen et al., 2007), and a yearly retreat of up to 1.9 cm was observed between 2014 to 2015 in Hornsund (Lim et al., 2020). In contrast, mixed-type coasts on Svalbard, i.e. bedrock cliffs covered by unconsolidated sediment, show higher erosion rates of up to 80 cm a−1 (Guégan and Christiansen, 2017).
Warming is especially intense on Svalbard because the archipelago is influenced by the northern part of the warm North Atlantic Current, making it more susceptible to atmospheric and oceanic changes (Walczowski and Piechura, 2011). Air temperatures have increased in the past decades (Nordli et al., 2020), with the highest rates observed during the winter season (Hanssen-Bauer et al., 2019; Isaksen et al., 2016). Following this atmospheric trend, borehole data from the last few decades show increasing permafrost temperatures on Svalbard (Boike et al., 2018; Christiansen et al., 2010; Etzelmüller et al., 2020; Isaksen et al., 2007).
In addition to increasing air and ground temperatures, sea ice coverage has markedly reduced around Svalbard. A prime example is seen in Kongsfjorden, which, in the past, was typically covered by sea ice during the winter season (Gerland and Hall, 2006). However, since 2002, the sea ice duration has shortened, and since 2006, the maximum extent of sea ice has drastically reduced (Johansson et al., 2020). Longer ice-free seasons enhance the influence of wave action and storms (Overeem et al., 2011). Furthermore, radiative warming caused by the relatively warm seawater can lead to higher ground surface temperatures along the coast (Schmidt et al., 2021). Both exposure to waves and storms and the warming trend in permafrost could contribute to an increased vulnerability of the coasts on Svalbard.
Previous studies on coastal-cliff erosion across Svalbard have only covered a few years (Guégan and Christiansen, 2017; Lim et al., 2020; Prick, 2004; Wangensteen et al., 2007), and long-term analyses are lacking. These can be especially valuable because short-term studies may be biased by the presence or absence of high-magnitude, low-frequency cliff failure events, which can lead to an underestimation or overestimation of long-term retreat rates. The present study focuses on the retreat rate of the sediment-covered coastal cliffs along Brøggerhalvøya, Svalbard, using high-resolution historical and digital aerial images (1970 to 2021). The study aims to detect long-term trends in coastal retreat across Brøggerhalvøya, which are separately analysed with respect to the northeast- and southwest-facing coastlines, and link changes in retreat rates to available climate data.
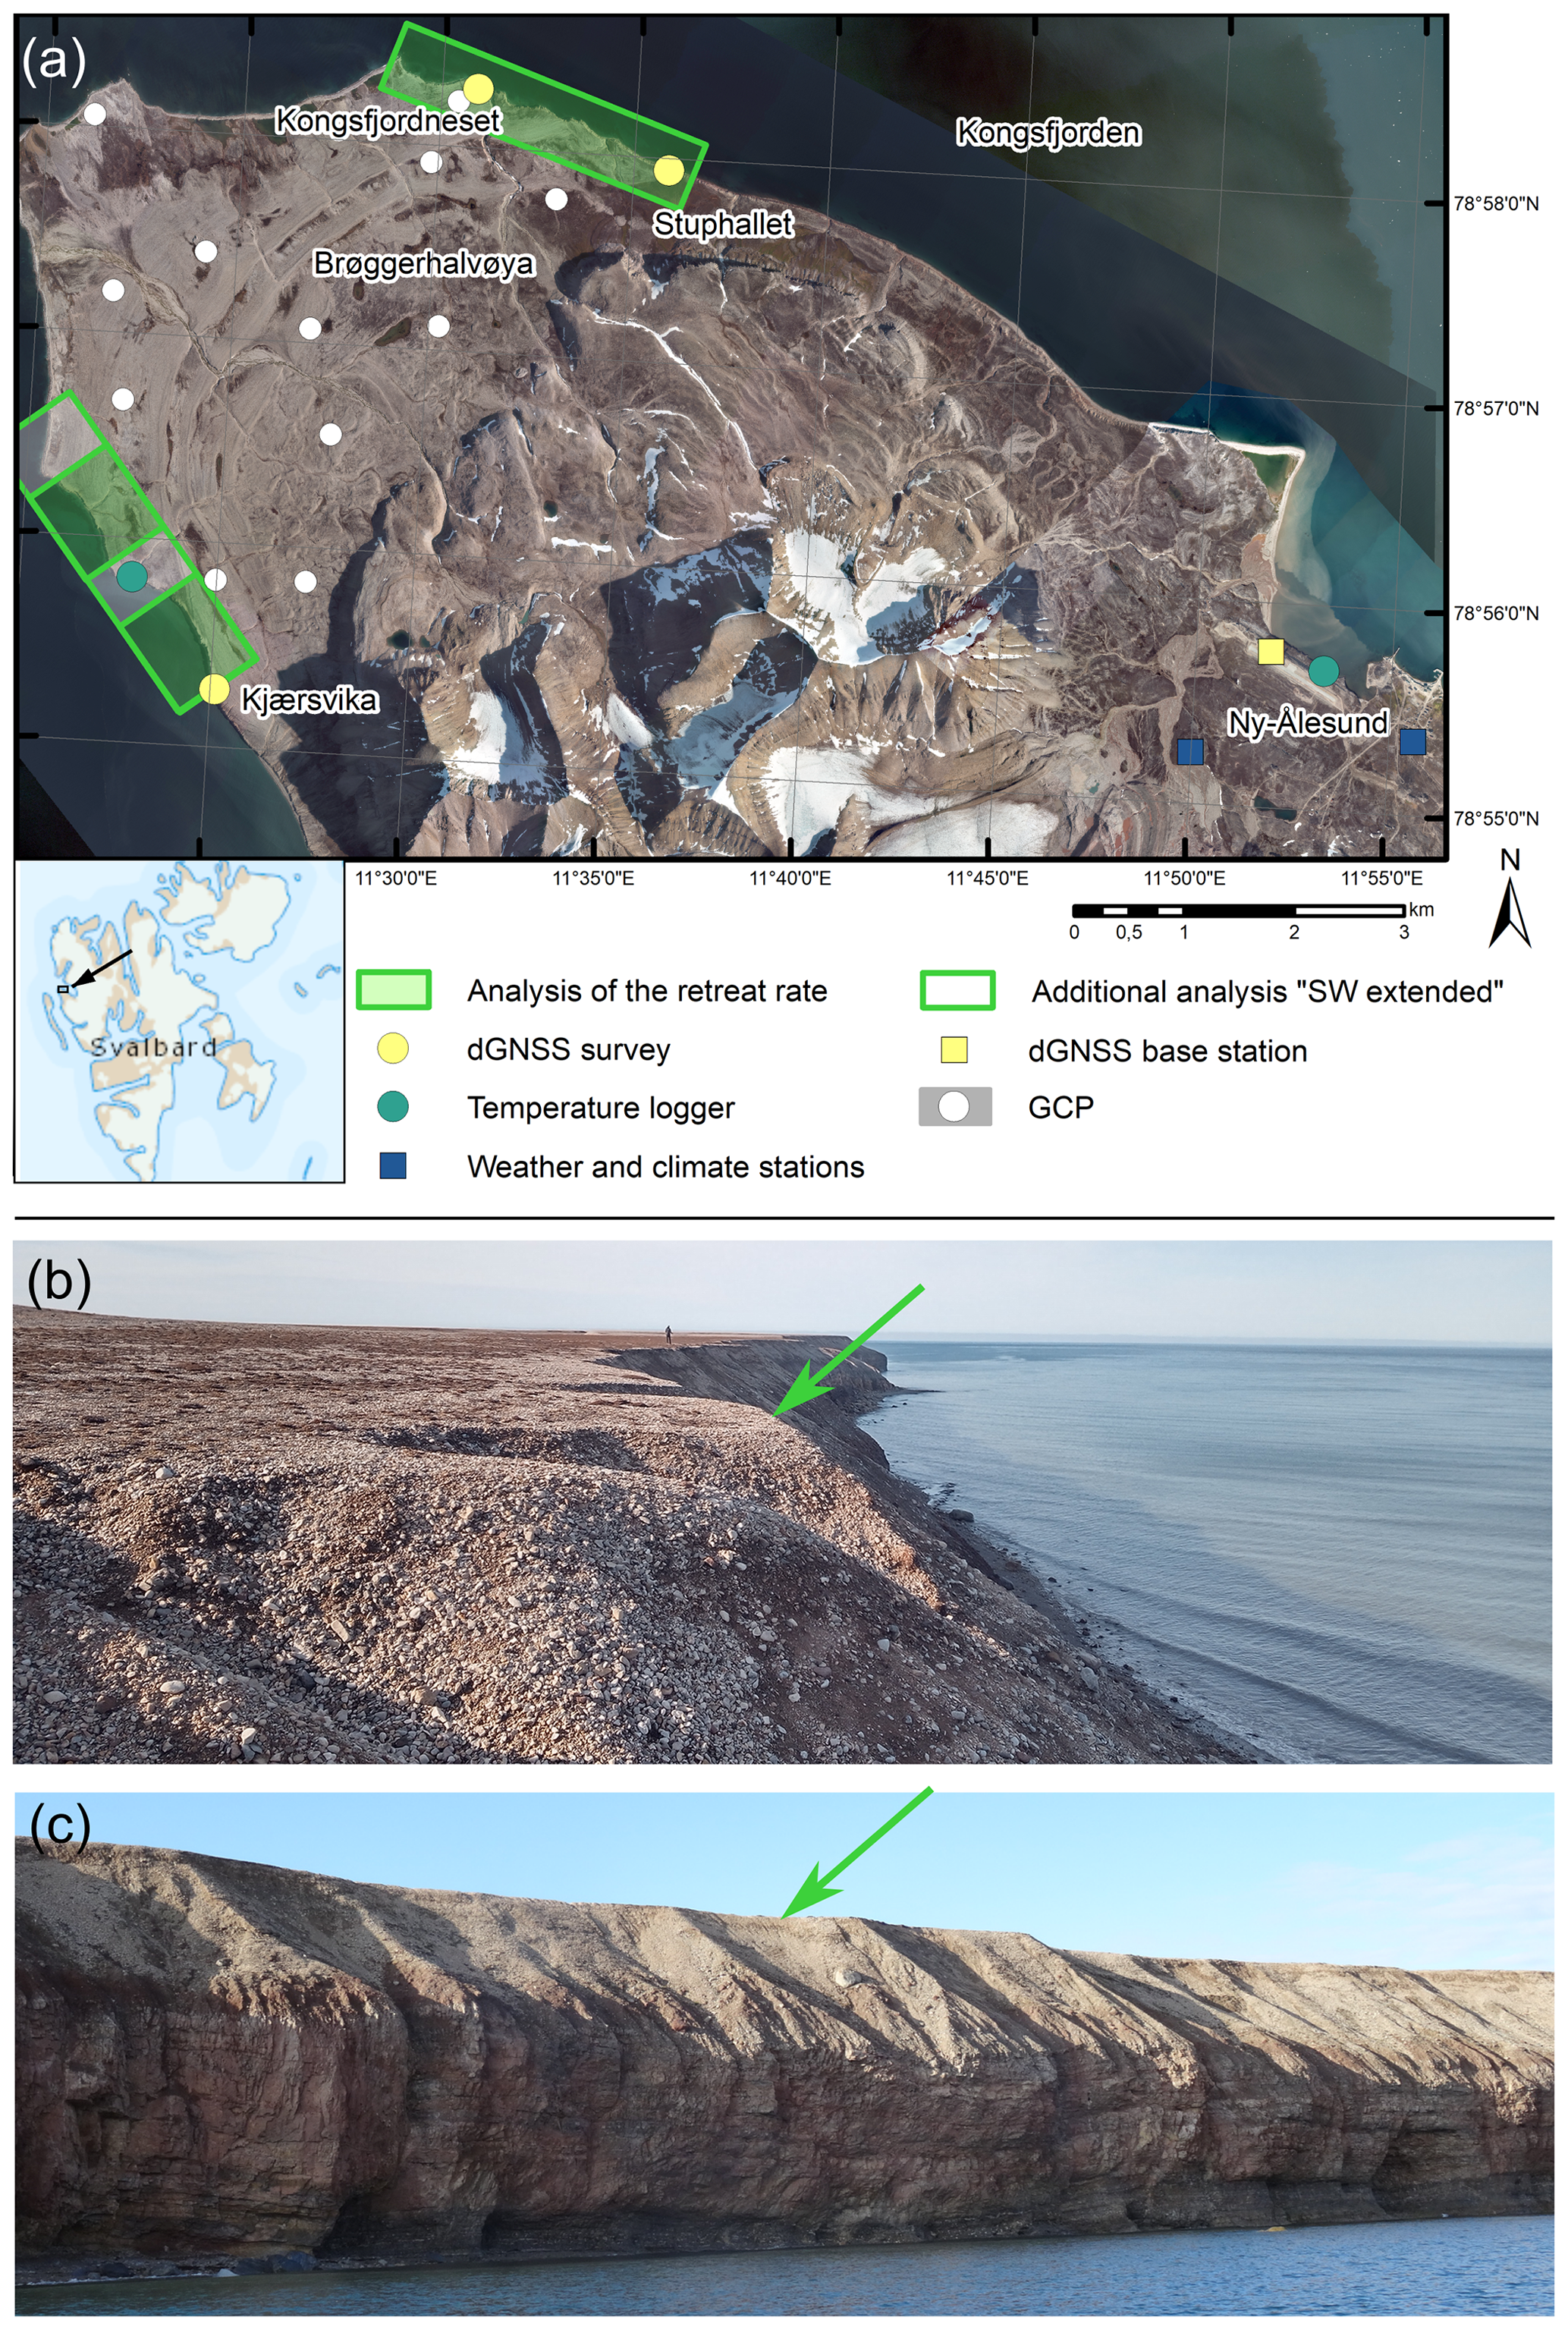
Figure 1(a) Orthoimage of the study area, including the measurement sites. The coastal-retreat rate is analysed along the northeast- and southwest-facing coastlines, with an extended section found in the southwest. The locations of the differential Global Navigation Satellite System (dGNSS) surveys, the dGNSS base station, the temperature loggers, the weather and climate stations, and the ground control points (GCPs) are indicated by dots. The source of the orthoimage and basemap is the ©Norwegian Polar Institute (https://geodata.npolar.no/, last access: 11 October 2022). The top (b) and face (c) of the bluff along the coastline of Brøggerhalvøya show that the rock cliffs are covered with unconsolidated sediments. The green arrows indicate the top part of the cliff that is digitized. Both photos were taken at the location of the dGNSS survey area in Stuphallet.
The study area is the northwestern part of Brøggerhalvøya, located on the west coast of Spitsbergen. It stretches from approximately 78°55′ N, 11°15′ E, in the southwest to 78°59′ N, 11°40′ E, in the northeast. The area has a total coastline of about 14 km, of which we analysed approximately 5.5 km, featuring rock cliffs behind beach sediments that show active coastal erosion of the bedrock (Etzelmüller et al., 2003). The bedrock is typically highly fractured (Ødegård and Sollid, 1993) and is dominated by conglomerates, sandstones, shales, and carbonates from the Carboniferous to the Permian, which often form overhanging cliffs (Fig. 1). These cliffs are typically covered with several metres of unconsolidated sediments, consisting of raised beach ridges (Etzelmüller and Sollid, 1991), which are dated to the Late Weichselian glaciation (about 13.5 ka; Forman et al., 1987), and were uplifted following the isostatic rebound of land caused by the retreat of glaciers (Rotem et al., 2023), with current elevation levels reaching up to 45 (above sea level) (Forman et al., 1987). The present-day uplift rate in Ny-Ålesund is 8.0 ± 0.3 mm a−1 (Hanssen-Bauer et al., 2019). As unconsolidated deposits are more prone to erosion than bedrock, they often show a second, more landward break in the slope compared to the bedrock cliff (Fig. 1). The coastal cliffs have a mean height of 15.5 m, with a maximum height of 28.0 m, with the bedrock accounting for approximately 10.5 m on average. The average slope angle of the unconsolidated sediments is approximately 35° (Norwegian Polar Institute, 2014).
The field site is characterized by continuous permafrost, though the presence of taliks cannot be excluded. The Bayelva soil and climate station, which is located about 8 km away from the investigated field site, recorded mean annual ground temperatures of −3.0 to −2.6 °C at a depth of 9 m between 2009 and 2016 (GTN-P, 2018). Measurements of rock surface temperatures obtained along the coastal cliffs of Brøggerhalvøya, also about 8 km from the field site, reveal relatively warm permafrost, with annual values ranging from −0.6 to −3.6 °C for the years 2016 to 2020 (Schmidt et al., 2021).
Table 1Orthoimages used in this study along with their respective metadata, including the number and accuracy of the ground control points (GCPs). SIOS: Svalbard Integrated Arctic Earth Observing System. NPI: Norwegian Polar Institute.
Note that n/a stands for not applicable.
Meteorological data, such as air temperature and solar-radiation data, are measured by weather stations located in Ny-Ålesund (Fig. 1), which is located approximately 8 km southeast of the study area along the northeast-facing coastline of Brøggerhalvøya. Station data show that air temperatures increased from an average of −5.9 °C in the 1970s to −3.1 °C in the 2010s (Norwegian Meteorological Institute, 2022b). This corresponds to a linear increase in mean annual air temperature of 0.71 °C decade−1 for the period from 1971 to 2017 (Hanssen-Bauer et al., 2019). Maturilli et al. (2015), who looked at a shorter period (from 1994 to 2013), detected an even stronger trend of 1.3 ± 0.7 °C decade−1. Following this warming trend, incoming longwave radiation increased at a rate of 15.6 ± 11.6 . As the duration of snow cover shortens and, consequently, the reflection of shortwave radiation reduces, net shortwave radiation slightly increases during the spring and summer seasons (Maturilli et al., 2015). In addition, water-level records in Ny-Ålesund show a mean tidal range of 0.91m (Kartverket, 2024).
Mean annual precipitation in Ny-Ålesund in the 1980s corresponded to 384 mm, increasing to 526 mm between 2010 and 2021 (Norwegian Meteorological Institute, 2022a). Both snowfall and rainfall can occur at any time during the year, but the snow season typically lasts from October to June (Hop and Wiencke, 2019). With warming air temperatures, a shift in the onset of snowmelt to earlier dates has been observed at a rate of −5.8 ± 8.3 d decade−1 (Maturilli et al., 2015). At the Bayelva soil and climate station, typical snow depths range from 0.65 to 1.4 m (Boike et al., 2018). The steep coastal cliffs of Brøggerhalvøya are typically snow-free. Here, snow accumulations are limited to the edges of bedrock and the foot of rock walls (Schmidt et al., 2021).
The wind regime of Brøggerhalvøya is notably influenced by the mountainous terrain, the topography of Kongsfjorden, and katabatic winds originating from glaciers, resulting in a complex wind field (Svendsen et al., 2002; Maturilli and Kayser, 2017). In Ny-Ålesund, the number of days with high mean hourly wind speeds, indicating a strong breeze or more (wind speeds ≥ 10.8 m s−1), has increased from an average of around 65 d in the 1970s to 90 d in recent years (as described in Sect. 4.4; Norwegian Centre for Climate Services, 2023). It is important to note that the wind characteristics of Ny-Ålesund are not directly applicable to the study site because the influence of the mountains and fjord diminishes and likely plays a lesser role. Wind speed measurements for the tip of Brøggerhalvøya, which is part of the study site, have been available since the summer of 2021 (Norwegian Centre for Climate Services, 2023). These data reveal stronger wind speeds, with 112 d of strong breezes recorded in 2022 (compared to 84 d in Ny-Ålesund), although long-term trends in wind speed for the investigated field site are not available.
We used orthoimages derived from aerial nadir images acquired in 1970, 1990, 2010, and 2021 (Sect. 3.1) to analyse the retreat rate of coastal cliffs along the coastline (Sect. 3.3). To do so, clifftop retreat was used as a proxy for the retreat of the coastline (Sect. 3.3). In August 2021, almost at the same time as the airborne-image acquisition, we conducted a differential Global Navigation Satellite System (dGNSS) survey along selected parts of the coastline (Sect. 3.2) to collect validation data. Rock surface temperatures obtained on rock cliffs were measured from September 2020 to August 2021 for both the southwest- and northeast-facing coastlines (Appendix A). Furthermore, we used wind speed records from Ny-Ålesund (Sect. 3.4), sea ice charts (Sect. 3.4), and topographically downscaled ERA5 reanalysis data (Appendix B and C) to contextualize our results in light of ongoing climate change.
3.1 Orthoimages
The historical aerial images acquired in 1970 and 1990 were provided by the Norwegian Polar Institute (NPI). The 1970 dataset consists of nine images (Table 1), which were taken with a RemoteCam8 (RC8) camera (152 mm focal length) at an altitude of approximately 2700 m along two flight lines. As no calibration file was available, we used the nominal calibration for this camera model. The grey-scale images from 1970 were scanned from prints using an Epson Expression 10000XL scanner (i.e. an A3 flatbed scanner) at a resolution of 10.6 µm and a 16-bit grey scale. The 31 images from 1990 (Table 1) were acquired with an RC20 camera (152 mm focal length) at an altitude of approximately 2700 m along seven flight lines. The calibration report was made available by the NPI. The false-colour infrared images from 1990 were scanned by the Norwegian Polar Institute using a photogrammetric scanner at a resolution of 14.1 µm and an 8-bit colour scale. The 1970 and 1990 aerial images were processed separately using MicMac, an open-source software for photogrammetry (Rupnik et al., 2017), with scripts available in Girod and Filhol (2022). The workflow involved identifying tie points to match the images, solving the relative orientation; using ground control points (GCPs) for bundle adjustment and refinement of the camera calibration; and, finally, generating a digital elevation model (DEM) and an orthoimage. We used the same GCPs for both the 1970 and 1990 images, which were identified and extracted from the 2010 DEM and orthoimage (Fig. 1). DEMs were produced for both the 1970 and 1990 images. We estimated the a priori accuracy of the GCPs to be around 0.5 m, which was consistent with both the residuals of the bundle adjustments on the GCPs and the fit to the checkpoints. Both the 1970 and 1990 aerial photos were taken with a high-precision photogrammetric-class camera along multiple overlapping flight lines. The resulting DEMs showed no significant artefacts (e.g. doming or other non-linear effects) compared to the 2010 DEM. Nevertheless, the 1970 DEM exhibited more noise than the 1990 DEM.
The 2010 orthoimage and DEM were downloaded at a resolution of 0.20 m from the Norwegian Polar Institute database for Svalbard (https://geodata.npolar.no/, last access: 11 October 2022; Norwegian Polar Institute, 2014). The 2021 aerial images were collected by the Svalbard Integrated Arctic Earth Observing System (SIOS) using a ground sampling distance of 0.08 m. High-precision onboard dGNSS and navigation data were available for these more recent images, enabling the use of geolocation tags from the metadata files to georeference the images. The accuracy of the georeferencing was confirmed by comparing the georeferenced images with the 1970, 1990, and 2010 images and manually controlled by measuring the distances between stable objects near the cliff. The 1970 and 1990 orthoimages were also the result of the processing performed in MicMac (Girod and Filhol, 2022). The resolution of the final product was set to 0.20 m to ensure consistency with the resolution of the other datasets and to reduce the file size. The attributes of the orthoimages are reported in Table 1.
3.2 dGNSS survey
The dGNSS measurements were used to validate whether the manual digitization of the coastline from 2021 (Sect. 3.3) showed a systematic seaward or landward bias. These measurements were well suited for this purpose because the dGNSS survey was conducted on 31 August 2021, while the aerial images were acquired on 28 August 2021. The receiver was positioned exactly at the cliff edge. Moreover, dGNSS observations were made with an Altus APS3G GPS + GLONASS receiver using post-processing kinematic (PPK) surveying. The receiver was kept static at each point for 60 s, with a 1 s log interval for raw data. Post-processing was carried out with version 3.4 of the software RTKLIB (Takasu and Yasuda, 2009), using the permanent station NYA1 in Ny-Ålesund as a reference, located 6 to 10 km away.
The dGNSS surveys were conducted along three transects of the coastline of Brøggerhalvøya: Kjærsvika, Kongsfjordneset, and Stuphallet (Fig. 1). The length of each transect is approximately 40 m (10 points) at Kjærsvika, 275 m at Kongsfjordneset (45 points), and 182 m at Stuphallet (37 points). The number of points and the distance between the points were adapted to the irregularity of the coastline, but, on average, measurements were taken at intervals of 5 to 6 m. Standard deviations of dGNSS-measured positions corresponded to a few centimetres and were considered error-free when compared to the digitized coastline as the pixel size of the orthoimages was larger than the calculated errors.
3.3 Calculation of the coastal-retreat rates
In the aerial images, the coastline was digitized along the top of the cliff (Fig. 1), which is slightly farther inland than the actual shoreline, i.e. the boundary between water and land, due to unconsolidated sediments on top of the bedrock (Sect. 2). The top of the cliff has been used as a proxy for the shoreline in previous studies (e.g. Irrgang et al., 2018). However, it is important to note that the clifftop and cliff foot can erode at different rates, and the presence of frontal beaches can affect erosion processes (Swirad and Young, 2022). To address this, we conducted an analysis to confirm the suitability of clifftop retreat as a proxy for coastal retreat at our field site. To do so, we compared the planar distance between the clifftop and shoreline, as well as the width of the frontal beaches, for 53 cross-sections along the coast at intervals of 100 m. Here, we used the orthoimages from 2010 and 2021 since the shoreline could not be reliably detected in the orthoimages from 1990 and 1970. When detecting the shoreline position, wave run-up and tides may constitute a source of uncertainty.
The clifftop was digitized manually in a GIS environment using the World Geodetic System 1984 (WGS 84)/UTM zone 33N projection at a scale of 1:400 by the same operator. The digitization process relied on visually interpreting the clifftop in the orthophoto, with additional visual support (e.g. the hillshaded DEM and slope) provided by the topographic maps. Our analysis focused on the northeast- and southwest-facing coastlines of Brøggerhalvøya (Fig. 1) as the remaining coastlines between Kongsfjordneset and Kvadehuksletta primarily consist of beaches, which are beyond the scope of this study. Digitization along the bedrock coast was interrupted sporadically due to rivers feeding into the fjord, which incised into the bedrock; closely spaced thermo-erosional gullies, which prevented the clear detection of the coastline; and the quality of the orthoimages. The last point affected only the digitization of the southwest-facing coastline in the 1970 data, which was challenging due to unfavourable illumination conditions and excessive blurring of the orthoimage. In areas where the 1970 orthoimage met acceptable quality standards (i.e. less blur and a higher contrast), we mapped the clifftop and notches by tracing the boundary between the dark-grey and light-grey areas (as shown in Fig. 3). In this case, we assumed that the lighter area in the orthoimage corresponded to the steeper terrain of the cliffs. The hillshade and slope maps were very noisy and thus not considered in the digitization process.
The retreat rate was calculated by comparing the clifftop position between the years 1970–1990, 1990–2010, and 2010–2021. Each clifftop position is subject to uncertainty (U), calculated following Irrgang et al. (2018) and Radosavljevic et al. (2016):
where EGR represents the ground resolution of the orthoimage, RMSE represents the root-mean-square error created by the georeferencing of the aerial image, and LOA represents the loss of accuracy due to digitizing errors. The RMSE was estimated from manually measured offsets between different orthoimages obtained over stable terrain across Kvadehuksletta (Fig. 1). The LOA was determined by repeating the digitization four times along the coastline segments where the dGNSS survey was conducted. For every metre along the three additional digitized lines, the distance to the original digitized coastline was calculated, and the associated root-mean-square error served as the LOA for further uncertainty calculations.
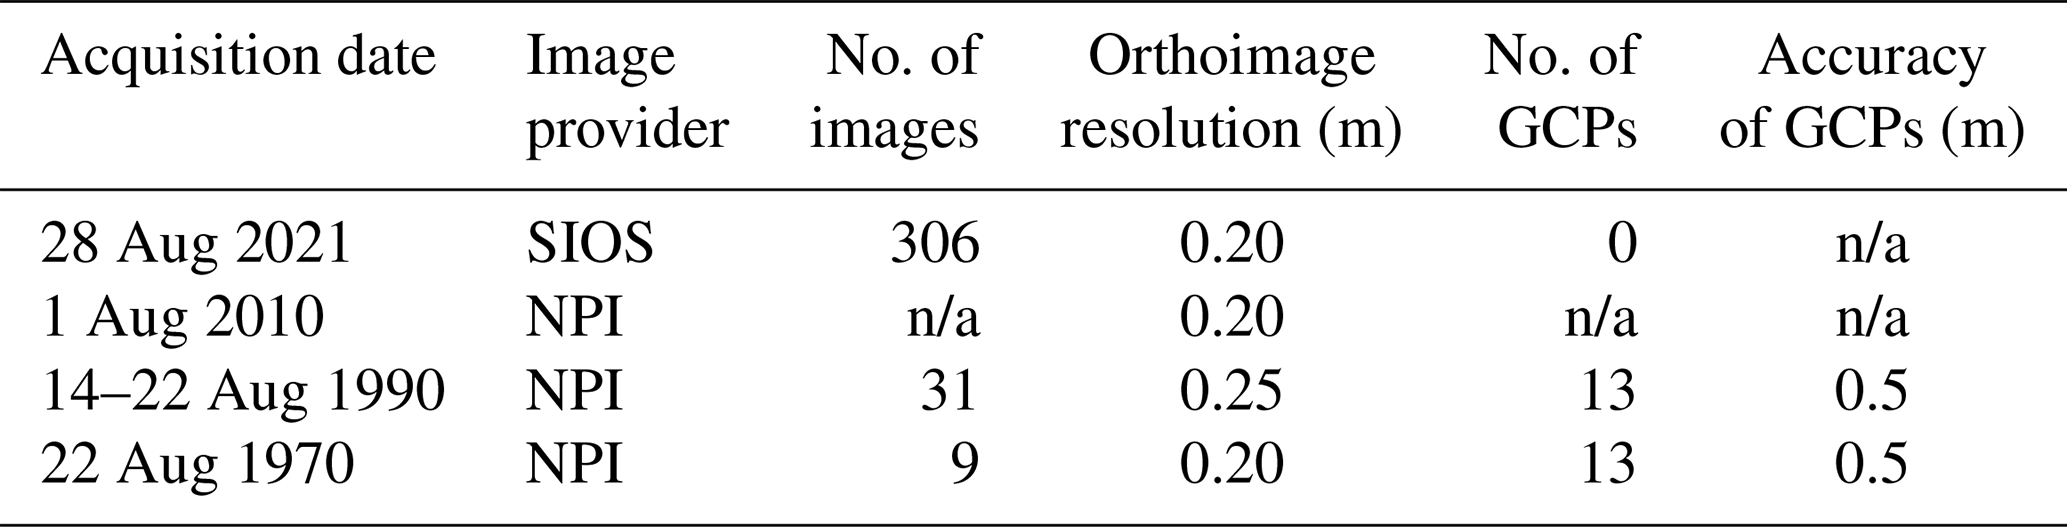
The retreat rates were computed using version 5.1 of the Digital Shoreline Analysis System (DSAS), an extension of Esri's ArcGIS (Himmelstoss et al., 2021), which has been successfully applied in previous studies to detect changes in Arctic coastlines (e.g. Günther et al., 2013; Irrgang et al., 2018; Jones et al., 2018; Radosavljevic et al., 2016). Using this tool, transects crossing all digitized coastlines were automatically generated with user-defined spacing, and the distance between these intersections was calculated. Due to the large number of transects along the coastline, statistical analyses of the clifftop retreat rates could be performed. We analysed the periods 1970–1990, 1990–2010, and 2010–2021, constrained by the availability of orthoimages. As a first step, the distance between the digitized clifftops was calculated separately for transects spaced 5 m apart along the coastline (following the same spacing as in Radosavljevic et al., 2016). Locally, irregularities in the coastlines, e.g. protruding edges, may be distinct and may cause the transect to cross the digitized coastline twice. Here, we always selected the smallest distance between two coastlines to avoid overestimating the retreat rates (Fig. 2). We calculated the retreat rate (RR) for each transect by dividing the distance of the intersection (Δx; Fig. 2) by the analysed time period (Δt):
We then determined the mean retreat rates as well as the percentage of transects that displayed retreat.
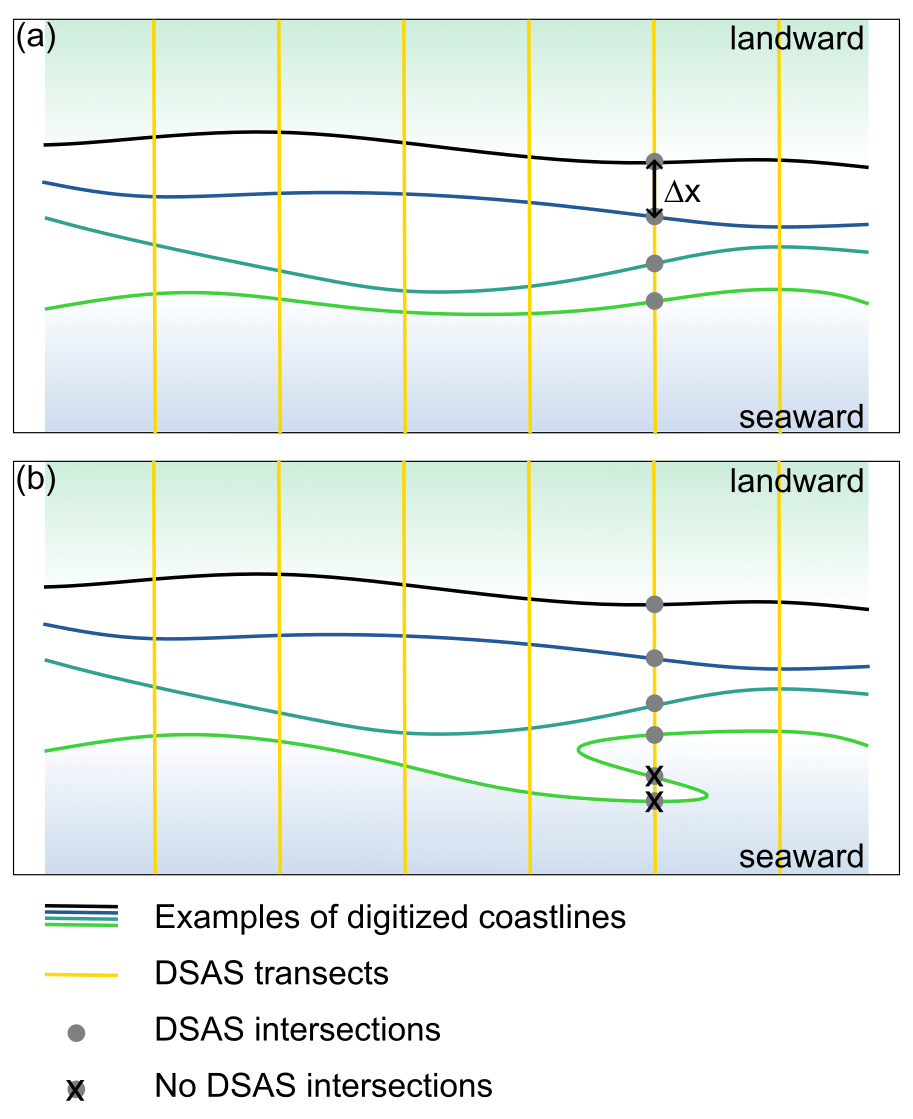
Figure 2(a) Illustration of the analysis using the Digital Shoreline Analysis System (DSAS), showing the digitized coastlines and the transects with intersections. The distance between two intersections corresponds to the retreat along one transect. (b) In the case where one coastline had several intersections, the shortest distance was used for analysis.
In total, 2.67 km of the northeast-facing coastline and 1.73 km of the southwest-facing coastline were analysed for all orthoimages. Additionally, 1.15 km of the southwest-facing coastline was analysed for the periods 1990–2010 and 2010–2021 in instances where the coastline in the 1970 orthoimage could not be detected reliably. The uncertainty in the retreat rate – here, the dilution of accuracy (DOA) – was calculated from the uncertainty in the clifftop position (U) and the analysed time span (Δt) (Irrgang et al., 2018; Radosavljevic et al., 2016):
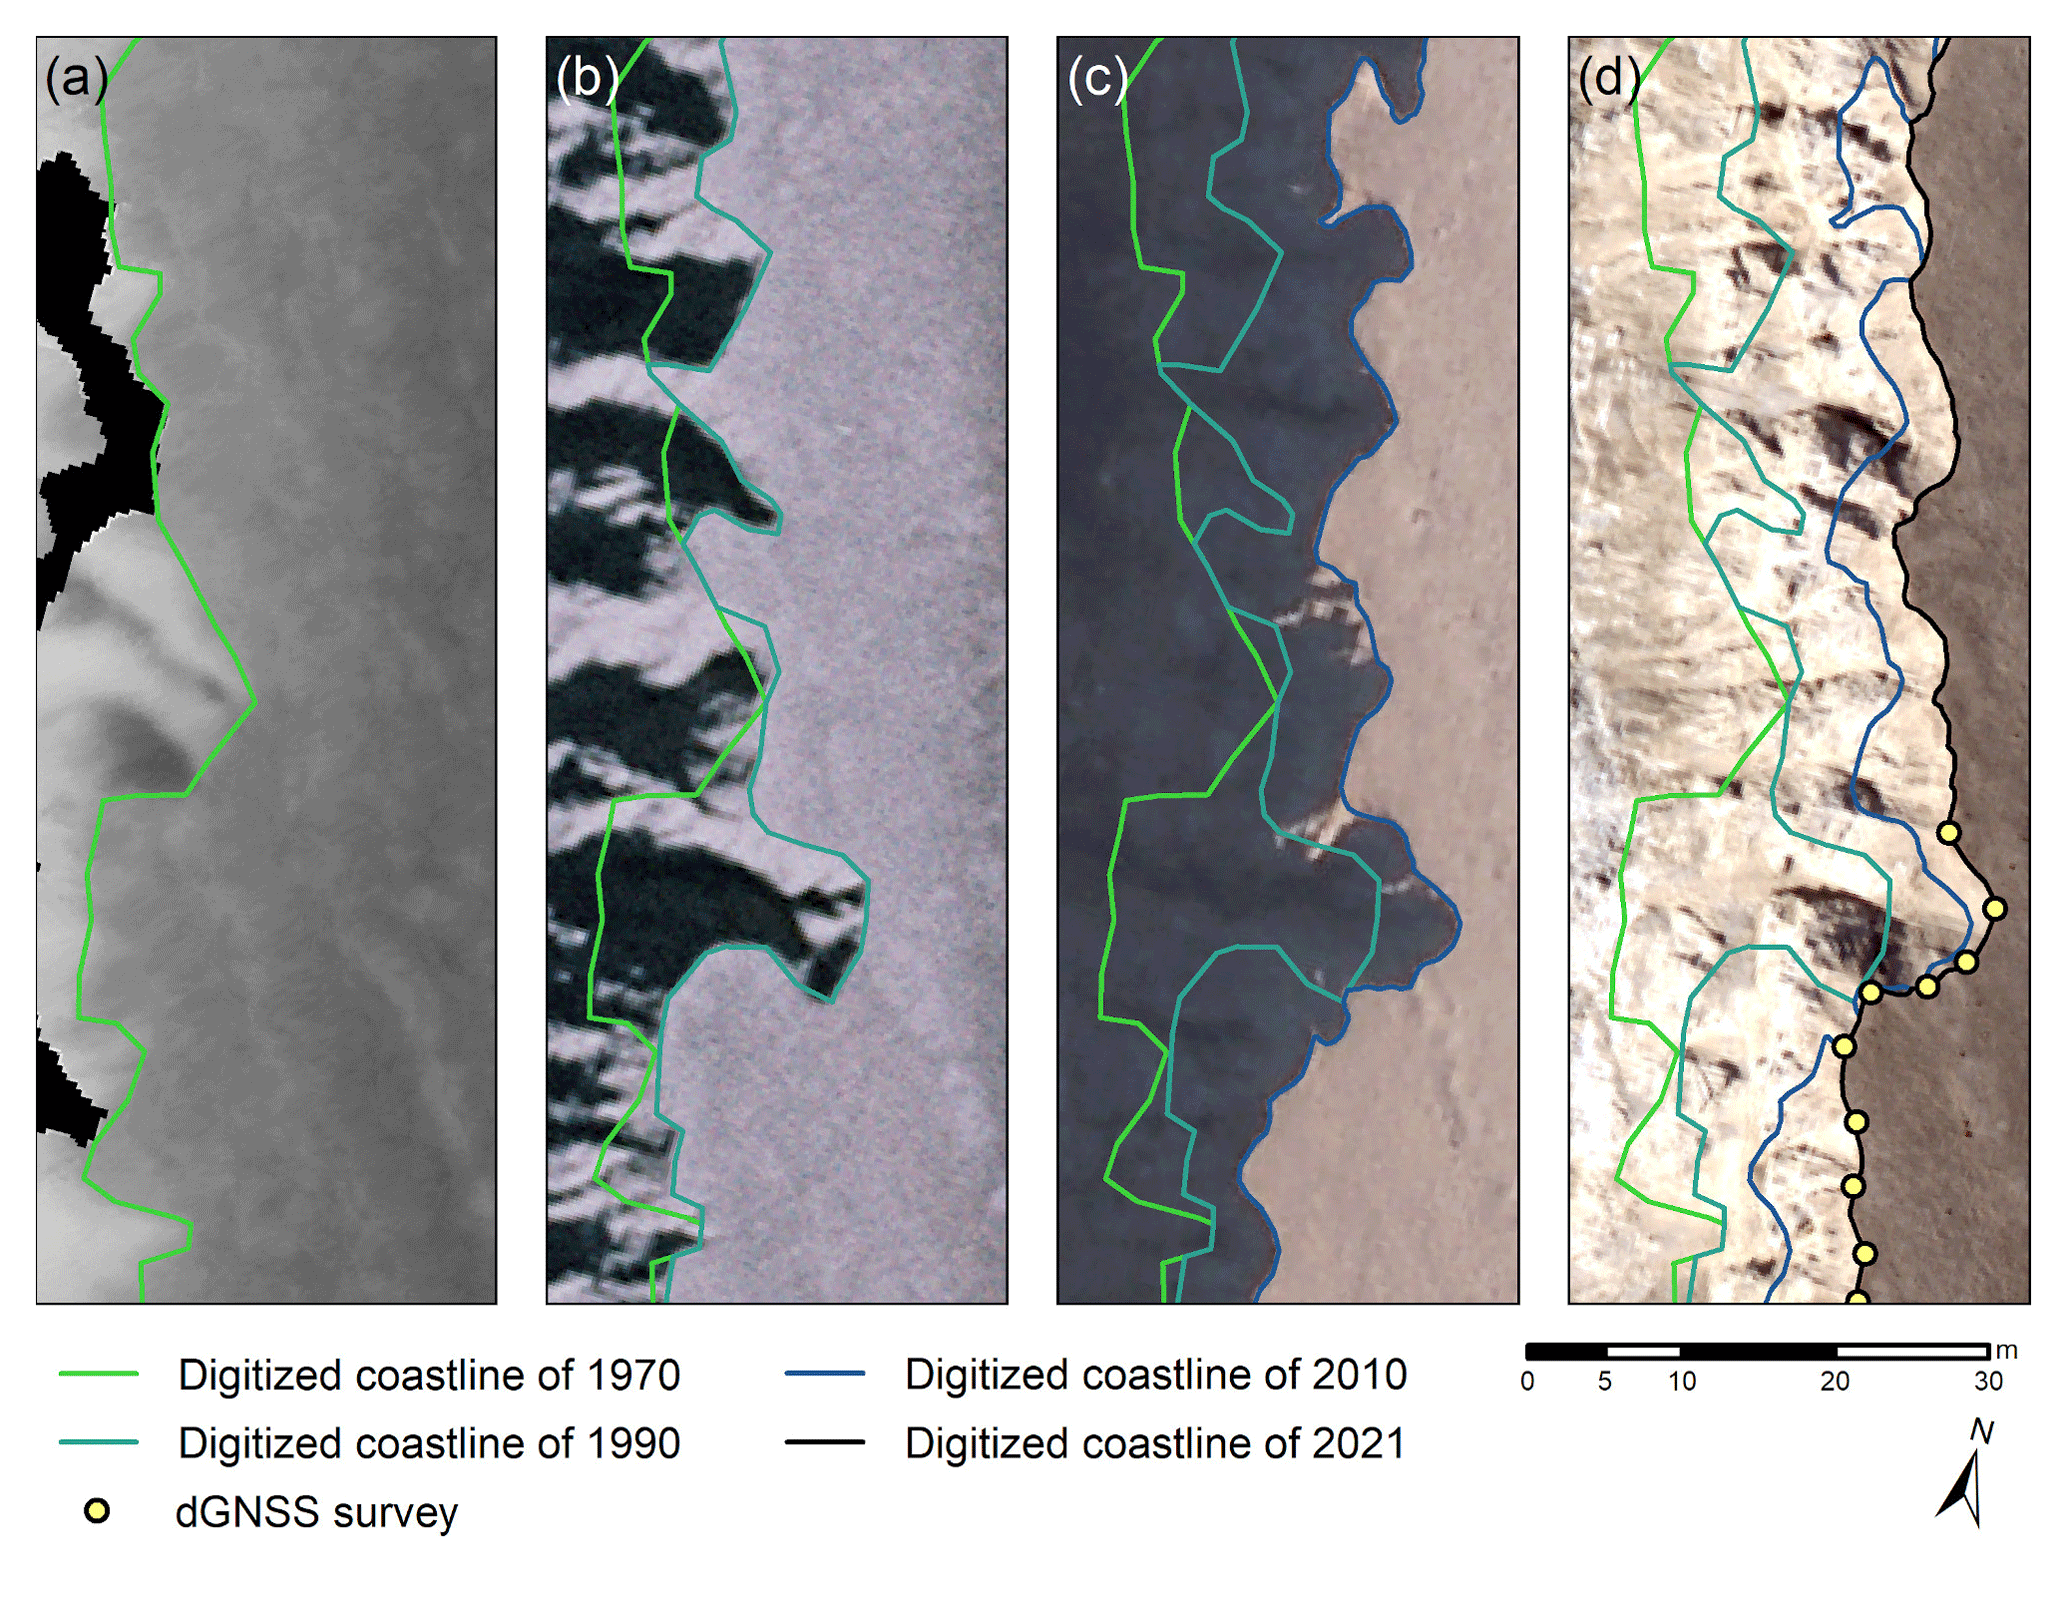
Figure 3Orthoimages and digitized coastlines from (a) 1970, (b) 1990, (c) 2010, and (d) 2021 along a selected transect of the southwest-facing coastline. The sea is located to the left (west) of the image sections shown. The results of the dGNSS survey agree well with the digitized coastline from 2021. Sources of the orthoimages are (a, b) the ©Norwegian Polar Institute (not publicly available), (c) the ©Norwegian Polar Institute (https://geodata.npolar.no/), and (d) the Svalbard Integrated Arctic Earth Observing System (SIOS; not publicly available).
To determine whether the increase (decrease) in the retreat rate signifies a statistically significant acceleration (deceleration) of the erosion, we performed a right-tailed (left-tailed) paired Student's t test (Student, 1908) by comparing two consecutive retreat rates (e.g. the 1970–1990 rate vs. the 1990–2010 rate) and evaluating the p value using a significance threshold of α = 0.005 (Benjamin et al., 2018). Moreover, p values lower than this threshold can be considered statistically significant, which means that the chance of observing a change in retreat as extreme as the one observed is extremely unlikely given the null hypothesis of no change (Ambaum, 2010; Benjamin et al., 2018).
3.4 Analysis of climate conditions
We analysed trends in wind speed and changes in the distance to the sea ice edge (potential wave fetch) as these factors control the interaction between wind and water and therefore influence the wave field (Barnhart et al., 2014), playing an important role along the coastline of Brøggerhalvøya, where erosion is driven by waves. The wind speed records were taken from the Ny-Ålesund weather station (SN99910; 78°55′23′′ N, 11°55′55′ E; Fig. B1), covering the time period from 1975 to 2020 (Norwegian Centre for Climate Services, 2023). We extracted data for days when mean hourly wind speeds of at least 10.8 m s−1 (strong breeze or more) were recorded, corresponding to large waves measuring approximately 3 to 4 m (NTNU, 2023).
We also analysed the distance to the sea ice edge in the northwesterly direction (corresponding to the open Fram Strait), which is the potential distance over which waves can build up. The analysis of this potential fetch was based on data provided by the Norwegian Meteorological Institute (2023) for the time period 1997 to 2023. Hereby, we defined the sea ice edge as the category of 10 % to 40 % sea ice concentration, following Meier and Stroeve (2008) and Overeem et al. (2011), who applied a threshold of 15 %. We determined the mean distance to the sea ice edge for September, with an average of 22 ice charts available per year. For trend detection, we applied a Bayesian regression analysis (Särkkä, 2013), which is explained in Appendix B. In all other cardinal directions, land was found within about 10 to 15 km of distance, meaning the potential fetch was limited.
In addition, we used hourly ERA5 reanalysis data (Hersbach et al., 2020) in conjunction with the topography-based downscaling routing model TopoSCALE (Fiddes and Gruber, 2014) to analyse trends in mean annual air temperature, annual rainfall and snowfall, and mean annual incoming longwave and shortwave radiation. The methods and detailed results for these climatic parameters are presented in Appendix B and C.
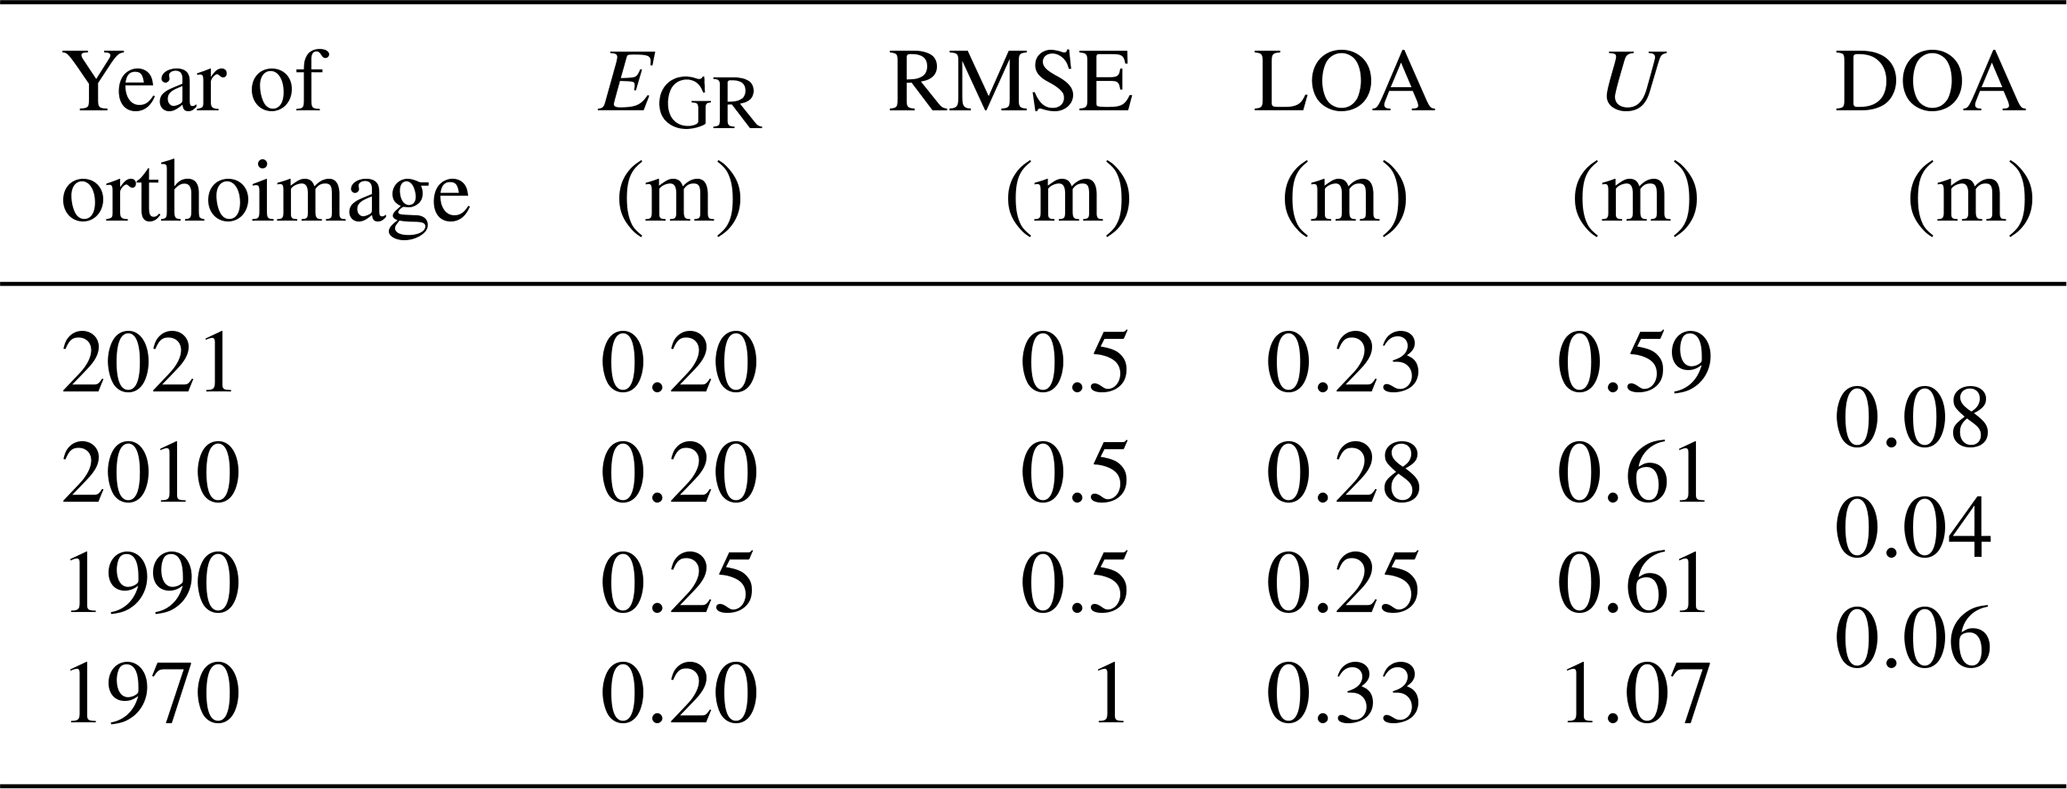
Table 2Uncertainty associated with the digitization of the coastline. EGR stands for the resolution of the orthoimage, RMSE represents the root-mean-square error associated with the georeferencing of the images and the noise from the processing, LOA stands for the loss of accuracy due to digitization, U represents the uncertainty in the coastline position, and DOA stands for the dilution of accuracy.
4.1 Digitization of coastlines
Coastal-retreat rates were analysed for three different time periods (1970–1990, 1990–2010, and 2010–2021), using digitized coastlines from the respective orthoimages. Figure 3 shows a selected segment of the southwest-facing coastline for all time periods, together with the digitized coastlines and the results of the dGNSS survey. The uncertainty in the digitized coastline is approximately 0.6 m for 1990, 2010, and 2021, while it is 1.07 m for the year 1970, based on multiple digitizations of the coastline for selected transects (Sect. 3.3). However, as the analysed time periods cover 1 decade or more, the uncertainty in the retreat rate per year is reduced to 0.08 m or less (Table 2).
In addition, the digitized clifftop from 2021 was validated with the dGNSS measurements. The mean distance between the dGNSS points and the digitized clifftop was 0.33 m, which corresponds to approximately 1–2 pixels in the orthoimage (Table 1). The calculated bias is 0.12 m, indicating a slight landward shift in the digitized coastline. However, this is mainly attributable to four dGNSS points with distances of more than 2 m to the digitized coastline, where protruding edges were not detected in the orthoimage due to unfavourable illumination. Removing these edges led to a mean distance between the dGNSS points and the digitized coastline of 0.23 m and a bias of 0.00 m. Consequently, no systematic seaward or landward bias could typically be detected; however, some protruding edges might not have been captured in the digitized coastline.
4.2 Clifftop retreat as a proxy for coastal retreat
The analysis of 53 cross-sections along the coastline of Brøggerhalvøya shows that the distance between the clifftop and the shoreline only changed slightly between 2010 and 2021, i.e. by less than 0.10 m. An example of a representative cross-section is given in Fig. 4. Here, the distance from the clifftop to the shoreline was 32.35 m in 2010 and reduced marginally to 32.19 m in 2021. Meanwhile, the width of the beach increased slightly from 2.82 m in 2010 to 3.05 m in 2021. This example showcases that the clifftop retreats at a similar rate to the shoreline.
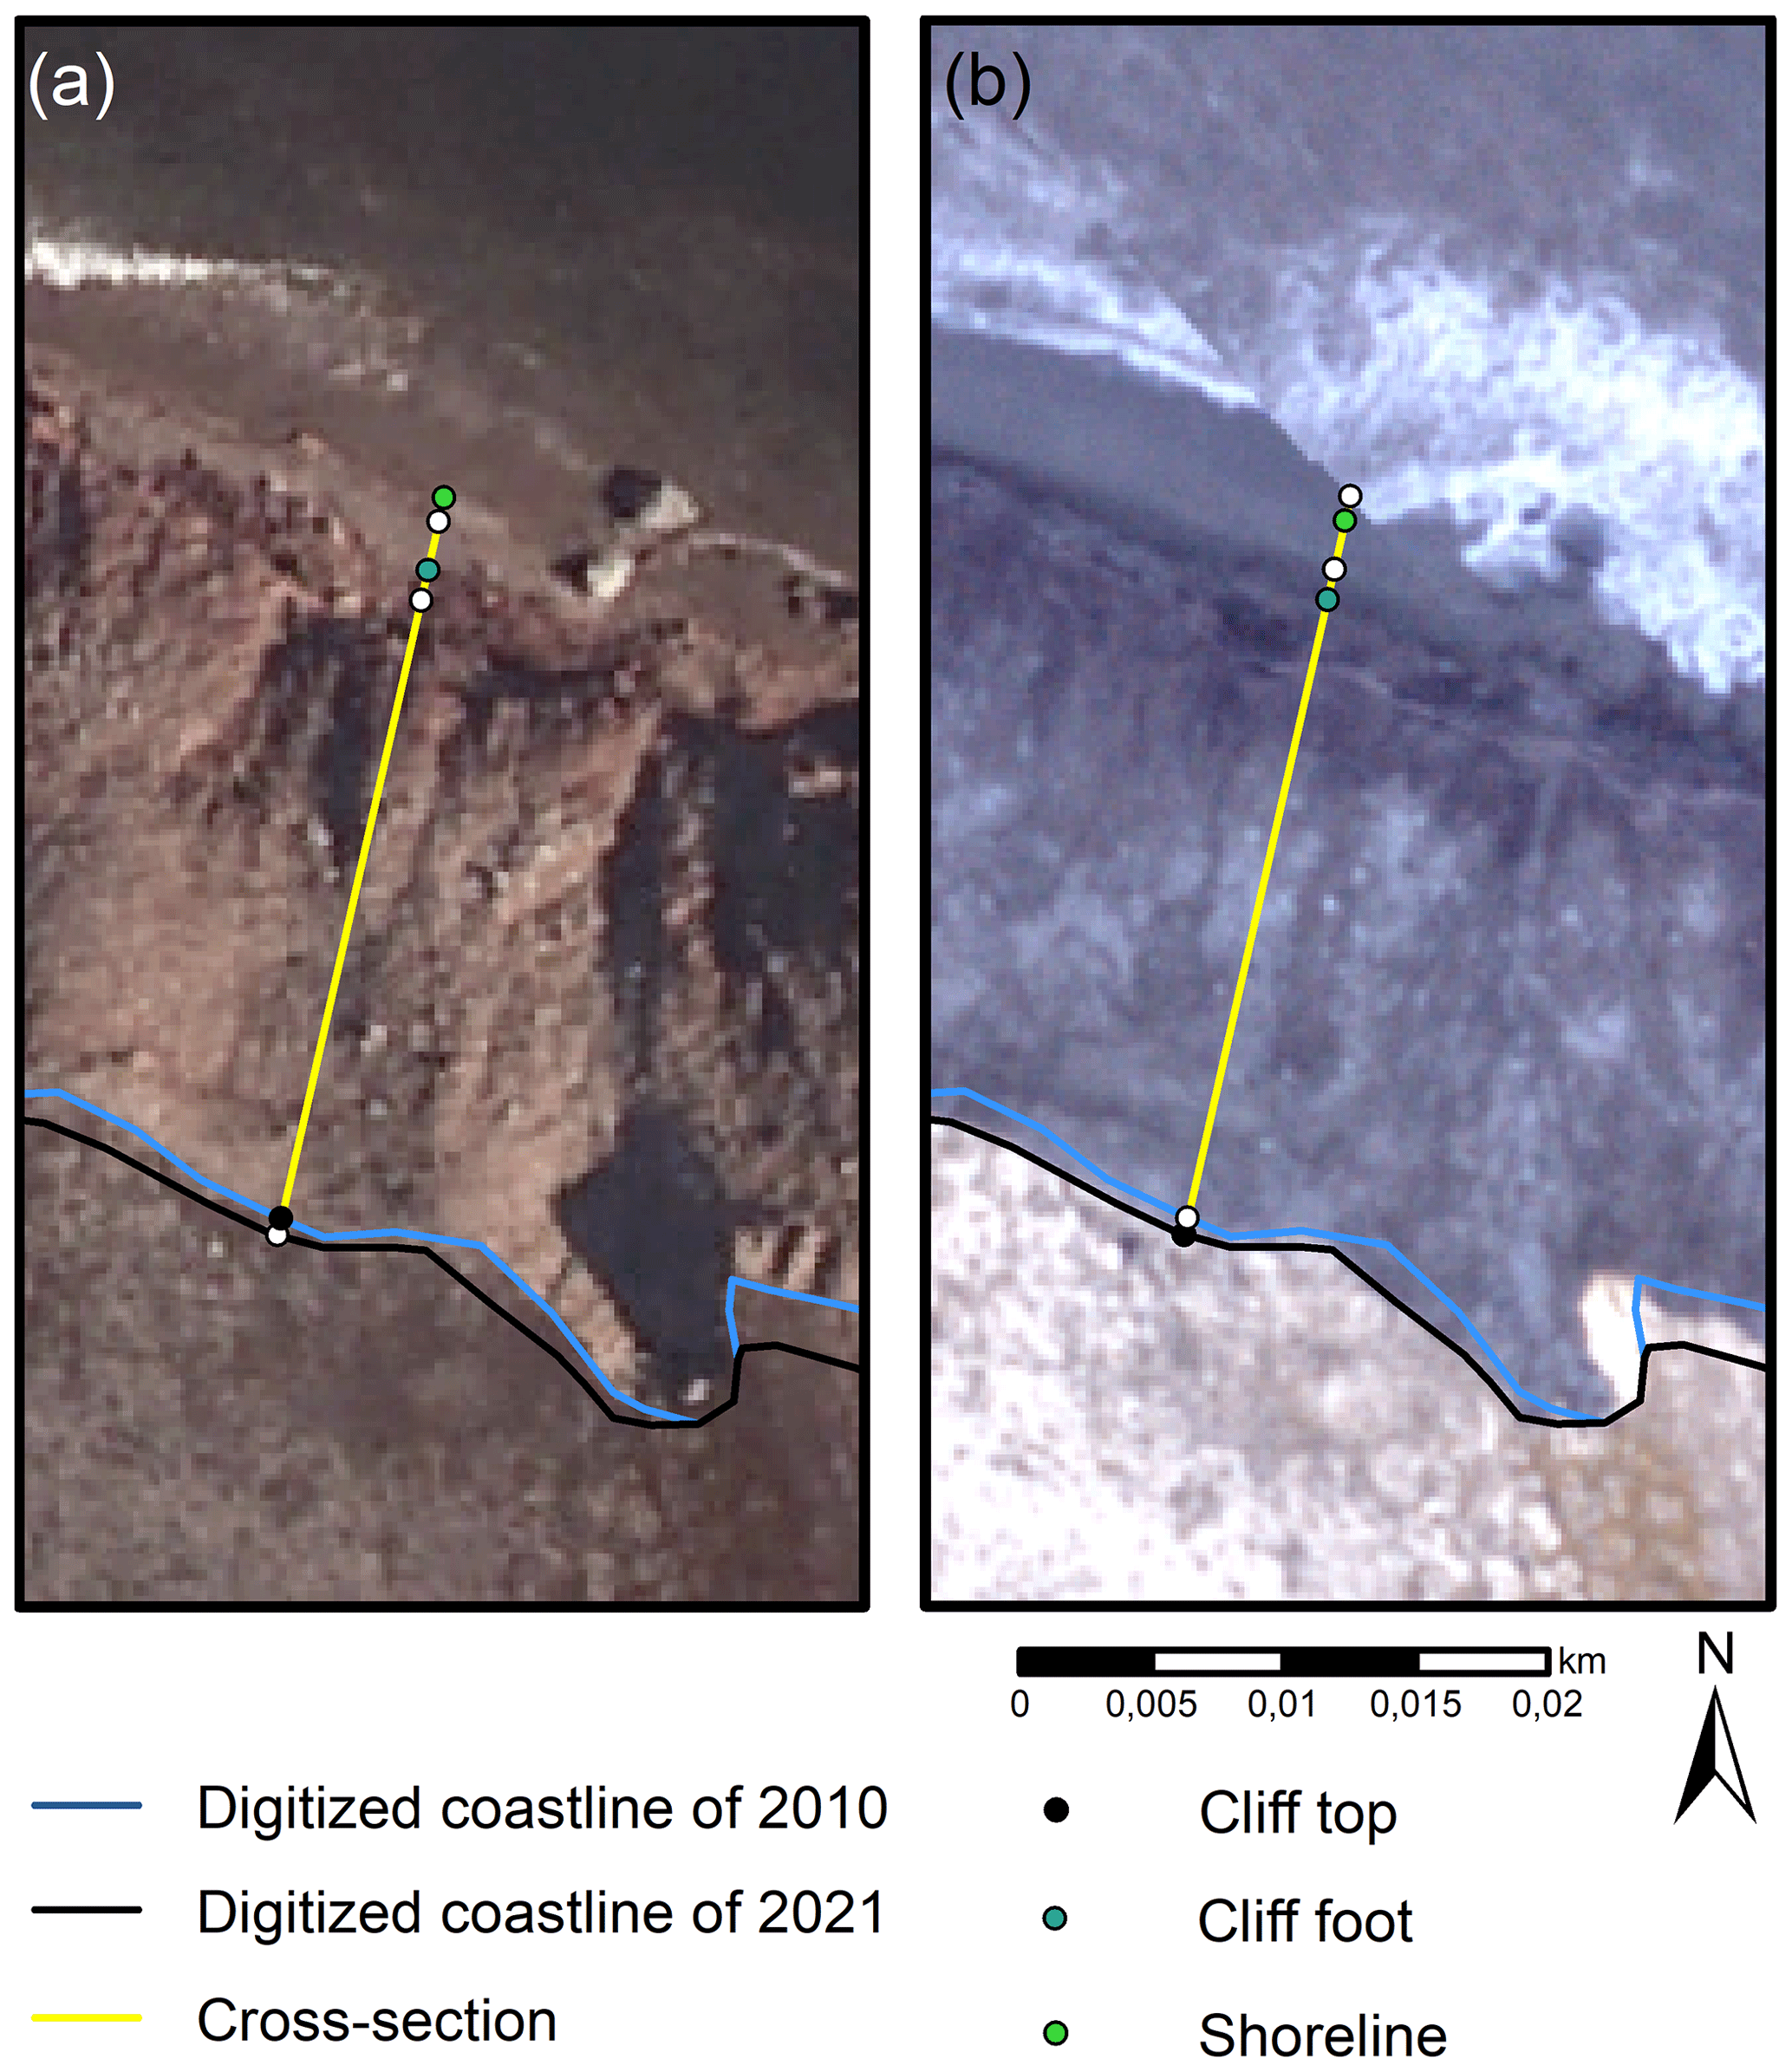
Figure 4Cross-sections of the clifftop, cliff foot, and shoreline for (a) 2010 and (b) 2021. The background of each panel shows the respective orthoimage. Source of the orthoimages are (a) the ©Norwegian Polar Institute (https://geodata.npolar.no/, last access: 11 October 2022) and (b) the Svalbard Integrated Arctic Earth Observing System (SIOS; not publicly available).
The mean distance for all cross-sections was 17.44 m in 2010, which reduced marginally to 17.35 m in 2021. The change in distance of 0.09 m is considerably smaller than the uncertainty associated with the digitization of the coastline (Table 2), i.e. the position of the clifftop. Also, the distribution of the distances is comparable between the 2 years, with clusters of clifftop–shoreline distances occurring around 4, 12, and 24 m (Fig. 5).
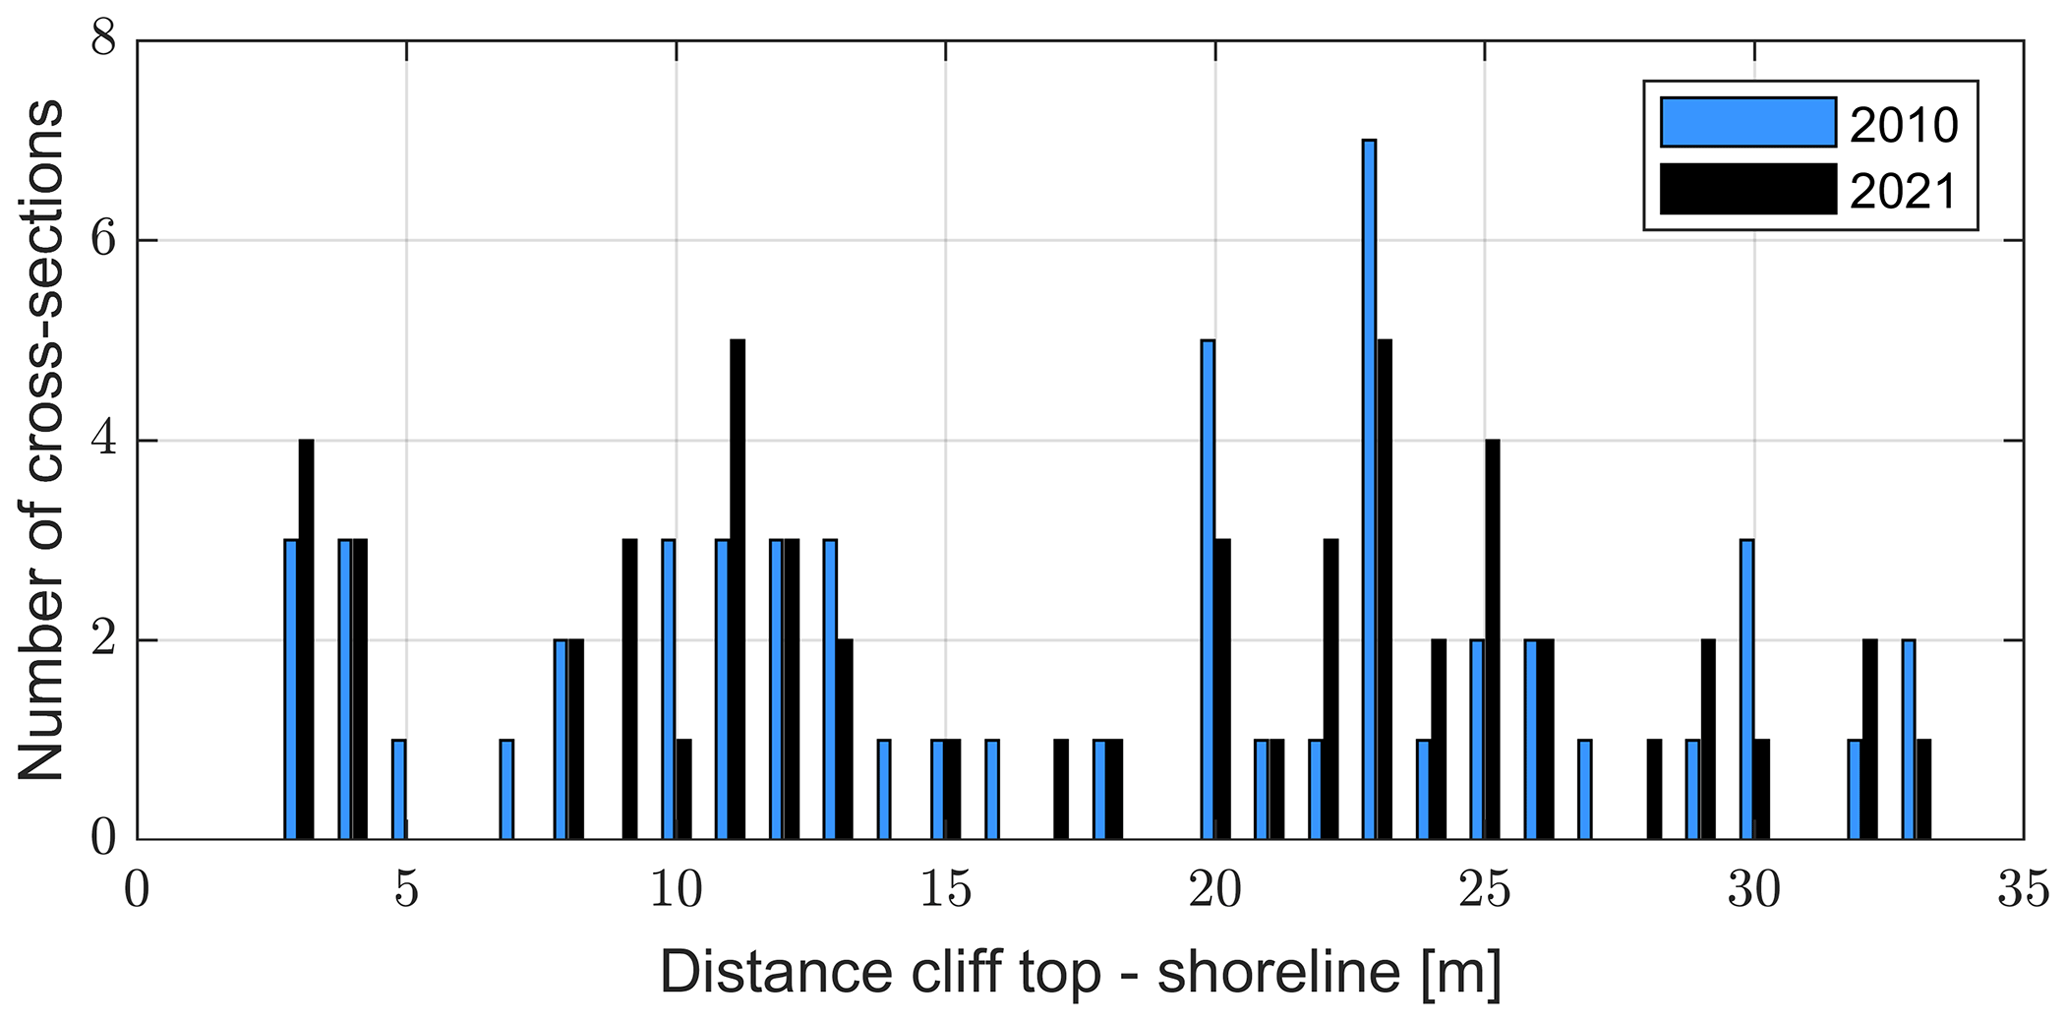
Figure 5Number of cross-sections that show a non-zero distance between the clifftop and shoreline for 2010 and 2021. In total, we analysed 53 cross-sections. The distribution only changes slightly, with clusters occurring around 4, 12, and 24 m.
In addition, we analysed the width of the frontal beaches along the 53 cross-sections. The results show that the width was only slightly reduced, from 2.23 m in 2010 to 2.09 m in 2021. Furthermore, the characteristics of the cliff morphology did not change significantly: seawater reaching the cliff foot directly was detected in 40 % (2010) and 42 % (2021) of the cross-sections, while 47 % (2010) and 45 % (2021) of the cross-sections exhibited frontal beaches with a high potential for inundation during stormy conditions (as seen in the example in Fig. 4). Only 7 % (2010 and 2021) had extended frontal beaches, limiting the effect of wave activity on the cliff foot. These small changes in beach width and cliff morphology indicate that eroded material is effectively transported away from the foot of the cliff and that no significant accumulation of eroded material occurs. Furthermore, we can conclude that the potential for wave activity has not been affected by changes in cliff morphology over the years.
As our results suggest that the average distance between the clifftop and the shoreline (or the width of the beach) has not changed significantly over time, we are confident that the retreat of the clifftop is an acceptable proxy for coastal retreat at our field site.
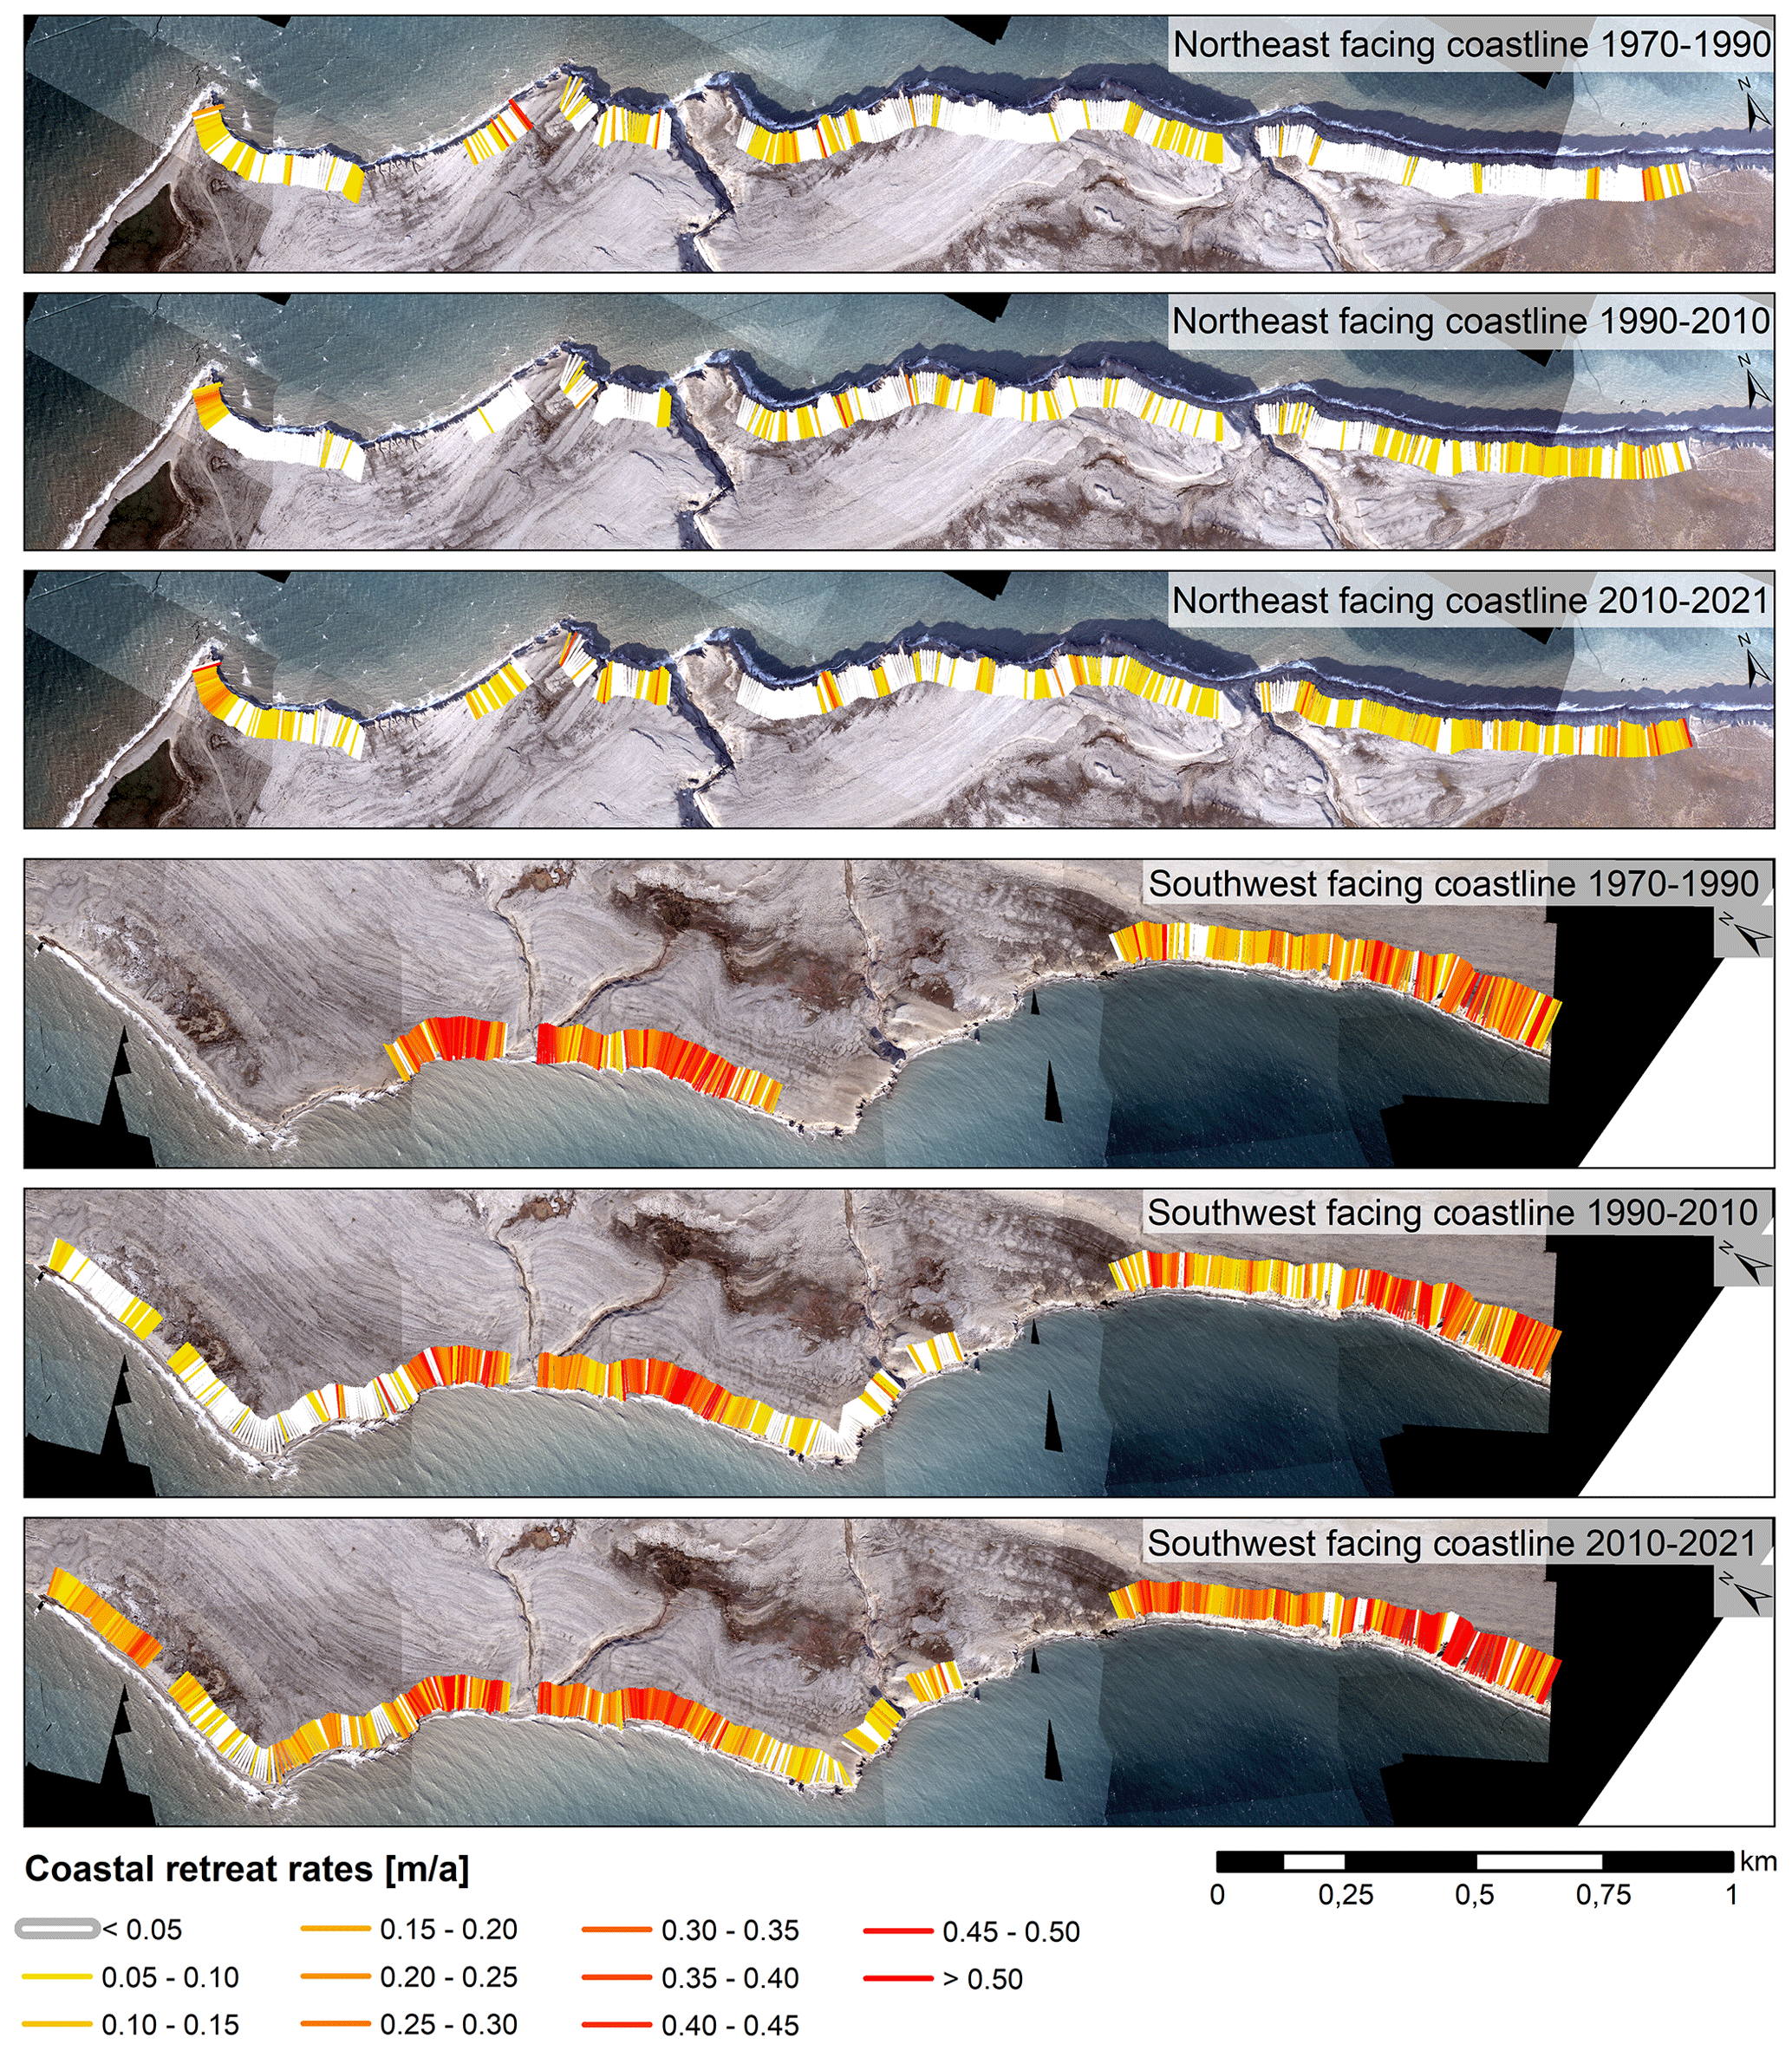
Figure 6Coastal-retreat rates at the northeast- and southwest-facing coastlines of Brøggerhalvøya for the time periods 1970–1990, 1990–2010, and 2010–2021. The background shows the orthoimage from 2021. The source of the orthoimage is the Svalbard Integrated Arctic Earth Observing System (SIOS; not publicly available).
4.3 Coastal-retreat rates on Brøggerhalvøya
The analysis for the different time periods was performed separately for the northeast- and southwest-facing coastlines due to markedly different retreat rates. The resulting retreat rates are visualized in Fig. 6, and all results (retreat rates and their uncertainties, the percentage of transects showing erosion, and p values for the significant acceleration in retreat rates) are summarized in Table 3.
Table 3Mean retreat rates and associated statistics for the analysed time periods. The analysis is performed separately for the northeast-facing coastline, the southwest-facing coastline, and an extended part of the southwest-facing coastline where the coastline could not be detected in the image from 1970 (SW ext.). RR stands for the retreat rate, DOA stands for the dilution of accuracy, TE stands for transects showing erosion, and p is the result of Student's t test. We tested for the significance of acceleration (right-tailed Student's t test); only the p value marked with * was calculated for deceleration (left-tailed Student's t test).
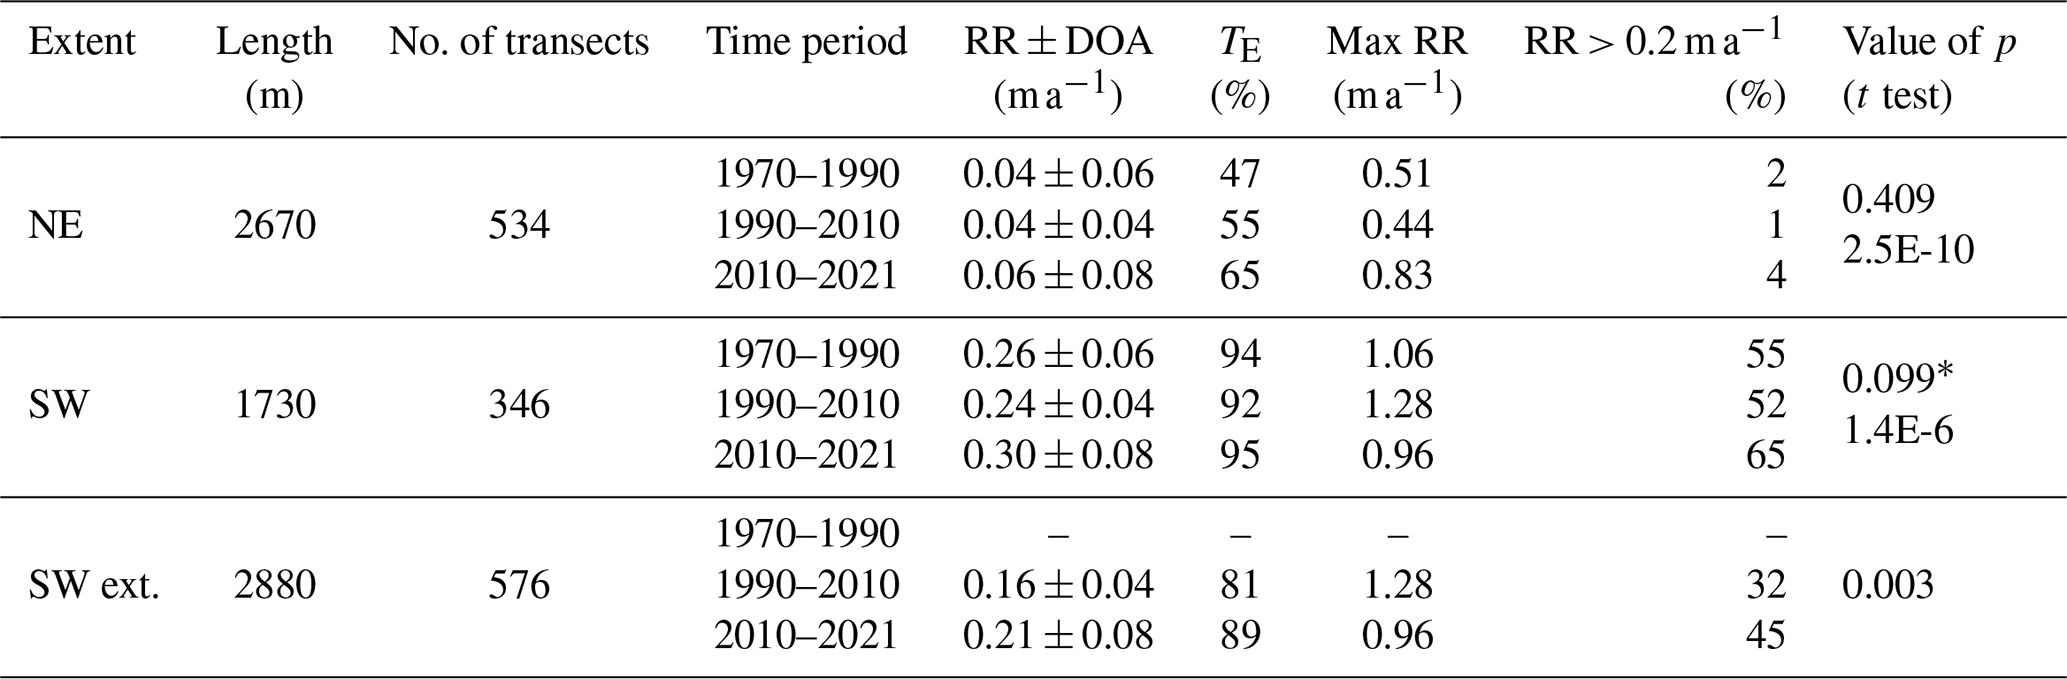
The northeast-facing coastline can be considered fairly stable, although erosion has accelerated over the last decade. The time periods 1970–1990 and 1990–2010 show retreat rates with the same order of magnitude, with mean values of 0.04 ± 0.06 m a−1 and 0.04 ± 0.04 m a−1, respectively. However, the percentage of transects where erosion exceeds the threshold of detection increases slightly, from 47 % to 55 %, indicating that only about half of the coastline is subject to erosion. Despite the low average erosion levels on average, single transects can experience retreat rates of up to 0.51 m a−1 (1970–1990) and 0.44 m a−1 (1990–2010), even though only 2 % (1970–1990) and 1 % (1990–2010) of the transects exhibit retreat rates of 0.20 m a−1 or more. The coastal-retreat rate increases in the following decade (2010–2021), indicating higher erosion, with a mean retreat rate of 0.06 ± 0.08 m a−1. The acceleration in retreat rate between 1990–2010 and 2010–2021 is statistically significant (p = 2.5 × 10⁻¹⁰). Non-negligible retreat is observed for 65 % of the transects, showing that a longer portion of the coastline experiences erosion during this period. This is visualized in Fig. 6: while low retreat rates (< 0.05 m a−1, i.e. little to no erosion) dominated in 1970–1990, the number of transects with higher retreat rates (0.05–0.20 m a−1) increased along the entire coastline in 2010–2021. In addition, more transects show retreat rates greater than 0.20 m a−1, with a maximum of 0.83 m a−1.
In contrast to the retreat rates well below 0.10 m a−1 in the northeast-facing sector, the southwest-facing coastline is subject to more pronounced erosion. The highest retreat rates over the last decade are recorded here. While erosion decelerates slightly from 0.26 ± 0.06 m a−1 in 1970–1990 to 0.24 ± 0.04 m a−1 in 1990–2010, it accelerates statistically significantly (p = 1.4 × 10⁻⁶) to 0.30 ± 0.08 m a−1 in the past decade (2010–2021). Almost the entire southwest-facing coastline is subject to erosion during the analysed time period (1970–2021), with over 90 % of the transects showing non-negligible retreat. In addition to more intense erosion compared to the northeast-facing coastline, the maximum retreat rate is also higher in all analysed time periods, with 1.06 m a−1 in 1970–1990, 1.28 m a−1 in 1990–2010, and 0.96 m a−1 in 2010–2021. Retreat rates of more than 0.20 m a−1 are obtained for 55 % (1970–1990), 52 % (1990–2010), and 65 % (2010–2021) of the transects. These rates are often concentrated in certain parts of the coastline, which shift between the analysed time periods.
For the time periods 1990–2010 and 2010–2021, the retreat rate is estimated for a longer section (“SW ext.” in Table 3). Here, the results show that erosion accelerates significantly from 0.16 ± 0.04 m a−1 (1990–2010) to 0.21 ± 0.08 m a−1 (2010–2021). Furthermore, the percentage of transects that show non-negligible retreat increases from 81 % to 89 %. These results indicate that while lower retreat rates occur in this section, they show the same trend of intensified erosion over the last decade (2010–2021).
4.4 Rock surface temperatures and climatic conditions
Installed temperature loggers recorded rock surface temperatures from September 2020 to August 2021. Permafrost conditions were close to the thaw threshold at the southwest-facing coastline, with a mean annual rock surface temperature of −0.49 °C, while the mean annual rock surface temperature along the northeast-facing coastline in Ny-Ålesund was lower, exhibiting a value of −1.64 °C. A detailed analysis is given in Appendix A.
Given the lithology along the coastline of Brøggerhalvøya, wave action is likely a dominant factor in erosion. Therefore, we focus on wind conditions and changes in sea ice cover as important driving factors. Other climatic drivers, such as precipitation patterns, air temperature, and radiation, are presented in Appendix C.
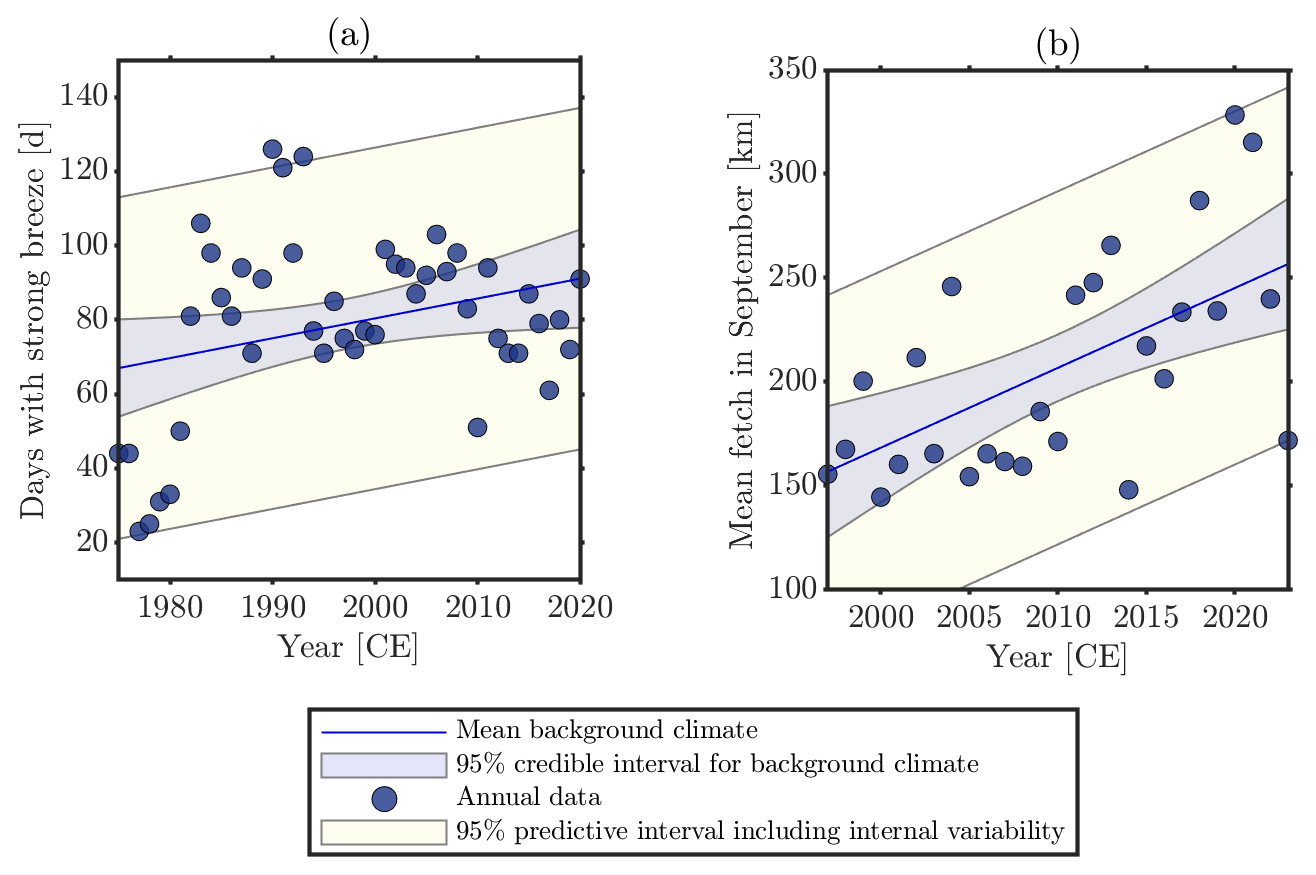
Figure 7(a) Days with a strong breeze (wind speeds ≥ 10.8 m s−1) measured by the Ny-Ålesund weather station (SN99910). The number of days increased by 5.4 d decade−1 between 1975 and 2020. (b) The mean distance to the sea ice edge (potential wave fetch) in September in the northwesterly direction. The distance to the sea ice edge increased by approximately 39 km decade−1 between 1997 and 2023.
The trend analysis of wind speeds in Ny-Ålesund corresponding to a strong breeze or more (i.e. wind speeds ≥ 10.8 m s−1, which produce large waves of approximately 3 to 4 m; NTNU, 2023) shows an increase of 5.4 d decade−1, from approximately 65 d on average in the 1970s to 90 d in the last decade (Fig. 7a). However, due to strong variability, the evidence in favour of a trend remains weak (Bayes factor < 0.5; Appendix B). Years with an exceptionally high number of days with high wind speeds were observed in the early 1990s, but the number of these years has decreased slightly in recent years. We emphasize that the weather station providing the data is located approximately 8 km away from the field area, inside Kongsfjorden, where wind speeds are lower compared to those at the investigated field site. Wind speed measurements obtained at the tip of Brøggerhalvøya (only available since 2021) recorded 112 d with strong breezes in 2022, compared to 84 d with strong breezes in Ny-Ålesund (Norwegian Centre for Climate Services, 2023), highlighting the potential differences in wind regimes.
In most cardinal directions, land is found within about 10 to 15 km, meaning the potential wave fetch over open water is limited. However, in the northwestern direction, the coastline of Brøggerhalvøya is exposed to the open sea towards the Fram Strait, and the potential wave fetch is limited by the distance to the edge of the sea ice, which is displayed in Fig. 7b for the month of September. We detected an increasing trend from about 150 to 250 km between 1997 and 2023, accounting for approximately 39 km decade−1 (Bayes factors 1–2, i.e. strong evidence in favour of the trend; Appendix B). The largest values, with a mean distance to the sea ice edge exceeding 300 km, were observed in 2020 and 2021.
5.1 Coastal retreat along Brøggerhalvøya
In this study, we analysed coastal retreat along the lithified coast of Brøggerhalvøya, Svalbard. The retreat rates indicate that the northeast-facing coastline is fairly stable, with mean annual values ranging from 0.04 ± 0.06 to 0.06 ± 0.08 m a−1 during the analysed time period, while the southwest-facing coastline is subject to more intense erosion, with mean annual values ranging from 0.24 ± 0.04 to 0.30 ± 0.08 m a−1. Both cases show a statistically significant acceleration of erosion over the last decade (2010–2021).
The bedrock cliffs on Svalbard are exposed to several denudational processes. At the shore platform and the lower part of the coastal cliff, abrasion is likely the main controlling factor as wave action acts upon the bedrock (Are, 1988a, b), redistributing beach sediments and consequently polishing the bedrock, similar to the processes observed at other rock cliffs on Svalbard (Strzelecki et al., 2017). We assume that these factors play an important role in coastal erosion across Brøggerhalvøya as overhanging rock walls with a retreated cliff foot can be observed (Fig. 1c). In addition, wetting–drying cycles caused by tidal-water-level changes and freeze–thaw processes can weaken the bedrock, especially where open cracks are present. In winter, an ice foot or snowdrift may develop, protecting the shore platform and the lower parts of the coastal rock wall from denudational processes. Above, where waves cannot reach the coastal cliff, periglacial weathering controls the erosion. Here, rock fracturing through ice segregation may contribute to an increased susceptibility of the bedrock (Ødegård and Sollid, 1993).
The results show more pronounced erosion along the southwest-facing coastline compared to the northeast-facing coastline. The different retreat rates could be explained by the impact of wind-induced wave action, which is expected to vary along the coastline of Brøggerhalvøya. The northeast-facing coastline is characterized by a relatively sheltered position within the Kongsfjorden system, with land found in most cardinal directions within a range of 10 to 15 km. This likely restricts the fetch and, consequently, hinders wave activity, which may explain the lower coastal-retreat rates in this sector. In contrast, the southwest-facing to west-facing coastline is more exposed to the open sea, especially in westerly and northwesterly directions, where the potential wave fetch is controlled by the distance to the sea ice edge in the Fram Strait. However, this study does not provide direct wave measurements, and the influence of factors such as local wind conditions, sea ice characteristics, bathymetry, and oceanic swell on coastal wave action cannot be completely ruled out.
The unconsolidated sediments at the top of the cliffs rest at their natural friction angle, stabilized by the underlying bedrock. Analysis of the orthoimages shows that the top of the cliff typically retreats in conjunction with the bedrock; consequently, the erosion of the sediments is highly dependent on the retreat of the bedrock below. While the erosion of the bedrock is likely the most important controlling factor, rainfall can result in increased overland flow, forming channels on the surface and erosional gullies (Jorgenson and Osterkamp, 2005). Observations obtained along the coastline in the field area show the local occurrence of such features, and the analysis of the orthoimages reveals that the gullies develop over several decades.
With no infrastructure situated along the investigated coastline of Brøggerhalvøya, the consequences for the population are expected to be minor. However, settlements and infrastructure are concentrated along Svalbard's coastlines. An example is the major administrative centre Longyearbyen, where coastal retreat endangers infrastructure, as well as river erosion, permafrost thaw, and solifluction (Jaskólski et al., 2018). In addition, the cultural heritage of Svalbard is severely affected by coastal erosion (Nicu et al., 2020, 2021). Increased pan-Arctic coastal erosion threatens Arctic communities, e.g. those in Alaska (Bronen and Chapin III, 2013; Brady and Leichenko, 2020) and Canada (Andrachuk and Pearce, 2010; Radosavljevic et al., 2016; Irrgang et al., 2019), and has even led to the relocation of some settlements (Bronen and Chapin III, 2013). As the results from our study show, this may concern not only unlithified, ice-rich coasts, which are known to be highly affected by coastal erosion (Irrgang et al., 2022), but also lithified coasts in the Arctic.
5.2 Uncertainties and limitations
While most of the literature uses shorelines to analyse coastal retreat, we detect changes in clifftop positions. A similar approach has been applied previously for other Arctic coastlines (e.g. Irrgang et al., 2018). To account for associated uncertainties, we showed, using a separate analysis, that the clifftop retreat rate can be used as a proxy for coastal retreat (Sect. 4.2).
The uncertainty in the calculated retreat rates is a consequence of the resolution of the orthoimages, the georeferencing and noise of the processing, and the loss of accuracy due to manual digitization of the coastlines (Sect. 4.1). As the northeast-facing coastline is fairly stable, the uncertainty exceeds the measured retreat rate. Consequently, conditions without coastal retreat are conceivable, while aggradation at the clifftop can be excluded due to local geomorphological conditions (Sect. 2). However, field observations of eroding clifftops and the deposition of eroded blocks along the shoreline suggest that coastal retreat is also active along the northeast-facing coastline.
By analysing changes in coastline position over periods exceeding 11 years, we cannot resolve seasonal coastal retreat or the influence of high-magnitude, low-frequency cliff failure events. However, we evaluate the time evolution of long-term, average coastal-retreat rates over several kilometres of coastline, which allows for an estimation of the net impact of changing climate and environmental conditions in the study area.
5.3 Comparison to previous studies
The calculated retreat rates are lower than the average change of 0.5 m a−1 in Arctic coastlines (Lantuit et al., 2012). This is expected because high retreat rates are typically found along unlithified coasts, which account for 65 % of the Arctic coastline (Irrgang et al., 2022). In contrast, the coastline along Brøggerhalvøya is formed by bedrock, which is more resistant to erosion caused by waves, and the unconsolidated sediments on top are not exposed to wave action. However, we detected higher retreat rates compared to those observed along other lithified coasts in the Arctic, e.g. the Canadian Arctic Archipelago, which exhibits a rate of 0.01 m a−1 (Lantuit et al., 2012). However, as our study covers only a few kilometres of coastline, a comparison with the mean value of the Canadian Arctic Archipelago does not consider the spatial heterogeneity of the latter.
In addition, the findings of this study suggest values that are higher than those reported in most previous studies on coastal-cliff erosion across Svalbard (Prick, 2004; Wangensteen et al., 2007; Lim et al., 2020), with only the study by Guégan and Christiansen (2017) showing higher retreat rates. These differences can be explained by various factors, such as the applied method, the considered time period, lithology, and wave activity, as well as local climate conditions. However, determining the relative importance of each factor is difficult.
5.4 Coastal-retreat rates under a warming climate
One of the most effective denudational processes along the coastline of Brøggerhalvøya is erosion caused by wave action (Sect. 5.1). Erosion caused by wind-generated waves is especially effective during stormy weather, which has likely intensified in the area around Brøggerhalvøya over the past decades, as indicated by a positive trend in the number of days with a strong breeze over the last decades (Fig. 7a). Furthermore, extreme cyclone events regularly occur in the Arctic region of the North Atlantic, with 20 to 40 events occurring during winter. In Ny-Ålesund, an increasing trend of six cyclones per decade was detected from 1979–2015, which can be related to a decreasing sea ice extent in the region and large-scale atmospheric-circulation changes (Rinke et al., 2017). Single weather events like this can support landslides and thus have a localized yet pronounced influence on coastal-retreat rates.
Previous studies have shown that an increasing fetch results in wave growth (Casas-Prat and Wang, 2020b), increasing the capacity for wave-driven erosion (Casas-Prat and Wang, 2020a). The results of this study show an increasing distance from the sea ice edge towards the open Fram Strait over the last decades (Sect. 4.4), which has likely increased wave activity along the southwestern sector of Brøggerhalvøya, possibly explaining the higher erosion rates found there.
In addition to large-scale sea ice conditions in the Fram Strait, local sea ice coverage around Brøggerhalvøya influences wave action along the coastline (Barnhart et al., 2014). Dahlke et al. (2020) provide an overview of sea ice extent around Svalbard from 1980 to 2016. The results show a considerable decrease in sea ice coverage during winter and spring in Forlandsundet (where the southwest-facing coastline is located), from 50 %–70 % in the early 2000s to below 10 % in recent years. Kongsfjorden (where the northeast-facing coastline is located) experienced an increase in sea ice extent from around 40 % to 60 % in the 1990s, followed by a decrease to around 10 %. However, as our field area is located in the outer parts of Kongsfjorden (NE sector) and near the open Arctic ocean (SW sector), where less sea ice tends to develops, even lower percentages of sea ice coverage are likely, with mostly ice-free conditions observed in the last decade.
The increasing influence of wave activity due to intensified storminess and sea ice retreat may, to some extent, be counteracted by the lowering of relative sea level by −4.5 ± 0.4 mm a−1 in Ny-Ålesund (Hanssen-Bauer et al., 2019). On Svalbard, the global mean sea-level rise, caused mainly by changes in seawater density and land ice mass (Slangen et al., 2017), is outpaced by the isostatic uplift of the land and changes in the gravitational field following deglaciation (Slangen et al., 2017; Kavan and Strzelecki, 2023). This phenomenon is dynamic in space and time (Hanssen-Bauer et al., 2019), and due to its heterogeneity, the effect on coastal-cliff erosion is difficult to quantify (Luetzenburg et al., 2023). However, we assume that the influence of increasing wave activity on coastal-cliff erosion will be stronger than the relative sea-level lowering in the coming decades.
As a result of ongoing atmospheric warming over the last decades, increasing ground temperatures have been measured on Svalbard (Boike et al., 2018; Christiansen et al., 2010; Etzelmüller et al., 2020; Isaksen et al., 2007). Furthermore, retreating sea ice coverage and the resultant ice-free waterbody can warm coastal rock walls through additional longwave energy input (Schmidt et al., 2021). Higher ground temperatures can affect the stability of permafrost rock walls (Krautblatter et al., 2013). Rock surface measurements obtained from September 2020 to August 2021 along the coastline of Brøggerhalvøya show that the permafrost is close to the thaw threshold (Appendix A), falling within a temperature range associated with decreased stability (Davies et al., 2001). Due to limited snow accumulation on the steep coastal cliffs, the rock surface temperature is mainly linked to air temperature, as well as longwave and shortwave radiation. Topographically downscaled ERA5 climate data (Fiddes and Gruber, 2014; Hersbach et al., 2020; Renette et al., 2023) for Brøggerhalvøya show that air temperature and longwave radiation have increased over the past decades, while shortwave radiation has decreased slightly (Appendix C). If this trend continues, we can expect further increases in rock temperatures along the coastal cliffs of Brøggerhalvøya, potentially making the rock more susceptible to erosion.
Rainfall can lead to the formation of channels and erosional gullies in the unlithified sediments on top of the bedrock (Sect. 5.1). Annual rainfall has increased over the past decades (Appendix C) and is expected to intensify in the future as a dominance of rainfall over snowfall during Arctic summer and autumn is projected to occur in the 21st century (McCrystall et al., 2021). This trend might also affect gully formation at the clifftop.
Although the data in this study do not allow us to directly relate retreat rates to records from weather stations or downscaled climate data, we can observe that the acceleration of the retreat rate coincides with increasing storminess and retreating sea ice, which may enhance coastal erosion. This is supported by increasing ground temperatures, which may lead to increased susceptibility of the coastline.
In this study, we calculate the retreat rates of coastal cliffs along Brøggerhalvøya, Svalbard, using aerial orthoimages from the years 1970, 1990, 2010, and 2021. As previous studies on coastal erosion across Svalbard have been spatially and temporally limited, we present long-term trends (51 years) in retreat rates, covering approximately 5.5 km along the Brøggerhalvøya coastline. The main conclusions are as follows:
-
At the northeast-facing coastline, we detect fairly stable conditions, albeit with an increasing trend in the retreat rate from 0.04 ± 0.06 m a−1 (1970–1990) and 0.04 ± 0.04 m a−1 (1990–2010) to 0.06 ± 0.08 m a−1 (2010–2021). About half of the transects show erosion, increasing from 47 % (1970–1990) and 55 % (1990–2010) to 65 % (2010–2021).
-
In contrast, the southwest-facing coastline shows higher retreat rates, with 0.26 ± 0.06 m a−1 from 1970 to 1990, a decrease to 0.24 ± 0.04 m a−1 from 1990–2010, and a statistically significant acceleration in retreat rates to 0.30 ± 0.08 m a−1 in the past decade (2010 to 2021). More than 90 % of the southwest-facing coastline was affected by erosion throughout the entire time period.
-
The coastal cliffs of Brøggerhalvøya are exposed to changing climatic conditions, particularly increasing storminess, retreating sea ice, warming permafrost, and increasing rainfall. These factors likely contribute to the accelerating coastal erosion measured over the past decade.
To analyse the thermal regime of the rock walls, an iButton (©Maxim) temperature logger was installed in a rock wall close to Kjærsvika to measure rock surface temperatures along the southwest-facing coastline (logger ID: RW-SW). No data could be collected from the field area at the northeast-facing coastline. Therefore, previously published rock surface temperature data (logger ID: RW04), which were obtained 8 km from the study area, were used in this study and followed the same installation technique as described below (Schmidt et al., 2021). The name of the temperature logger was adopted from the aforementioned study to simplify comparison. Including temperature data from these two settings allowed for the analysis of the thermal regime with respect to both expositions of Brøggerhalvøya (Fig. 1).
The measurements covered the time period from September 2020 to August 2021, with a sampling interval of 4 h. The iButtons were placed in cracks in the coastal cliffs, ensuring direct thermal contact between the sensor and the rock surface while protecting the sensor from direct sunlight. The manufacturer states that the measurement accuracy is within 0.5 °C. The numerical precision of the sensor readout was set to 0.0625 °C. We used no additional calibration. The uncertainty in the sensor and/or logger system could be analysed for the iButtons close to Ny-Ålesund as several iButtons were placed within the same rock wall. Schmidt et al. (2021) found uncertainties of less than 0.1 °C for annual averages and uncertainties of less than 0.2 °C for seasonal values. However, this analysis was not possible for the iButton close to Kjærsvika as only a single sensor was operational during the study period. The annual average for RW04 was calculated, excluding a 7-day period in August 2021 during which no data were available.
The measurement period of the RW-SW logger, located close to Kjærsvika, lasted from 1 September 2020 to 31 August 2021. During this period, the logger measured a mean annual rock surface temperature of −0.49 °C. This indicates below-freezing temperatures, although average ground temperatures in the permafrost behind the rock wall are likely close to the freezing point. The mean seasonal values were −6.2 °C for winter (December to February), −3.1 °C for spring (March to May), 6.6 °C for summer (June to August), and 0.6 °C for autumn (September to November). The lowest rock surface temperature recorded by the RW-SW logger (−14.7 °C) was obtained on both 31 January and 16 March, while the highest rock surface temperature (18.7 °C) was found on 3 August (Fig. A1). Daily variability in rock surface temperature was more pronounced in the spring and summer seasons, showing high-frequency variability and large amplitudes. In the autumn and winter seasons, although daily variability also exhibited high amplitudes, the frequency of the temperature fluctuations decreased.
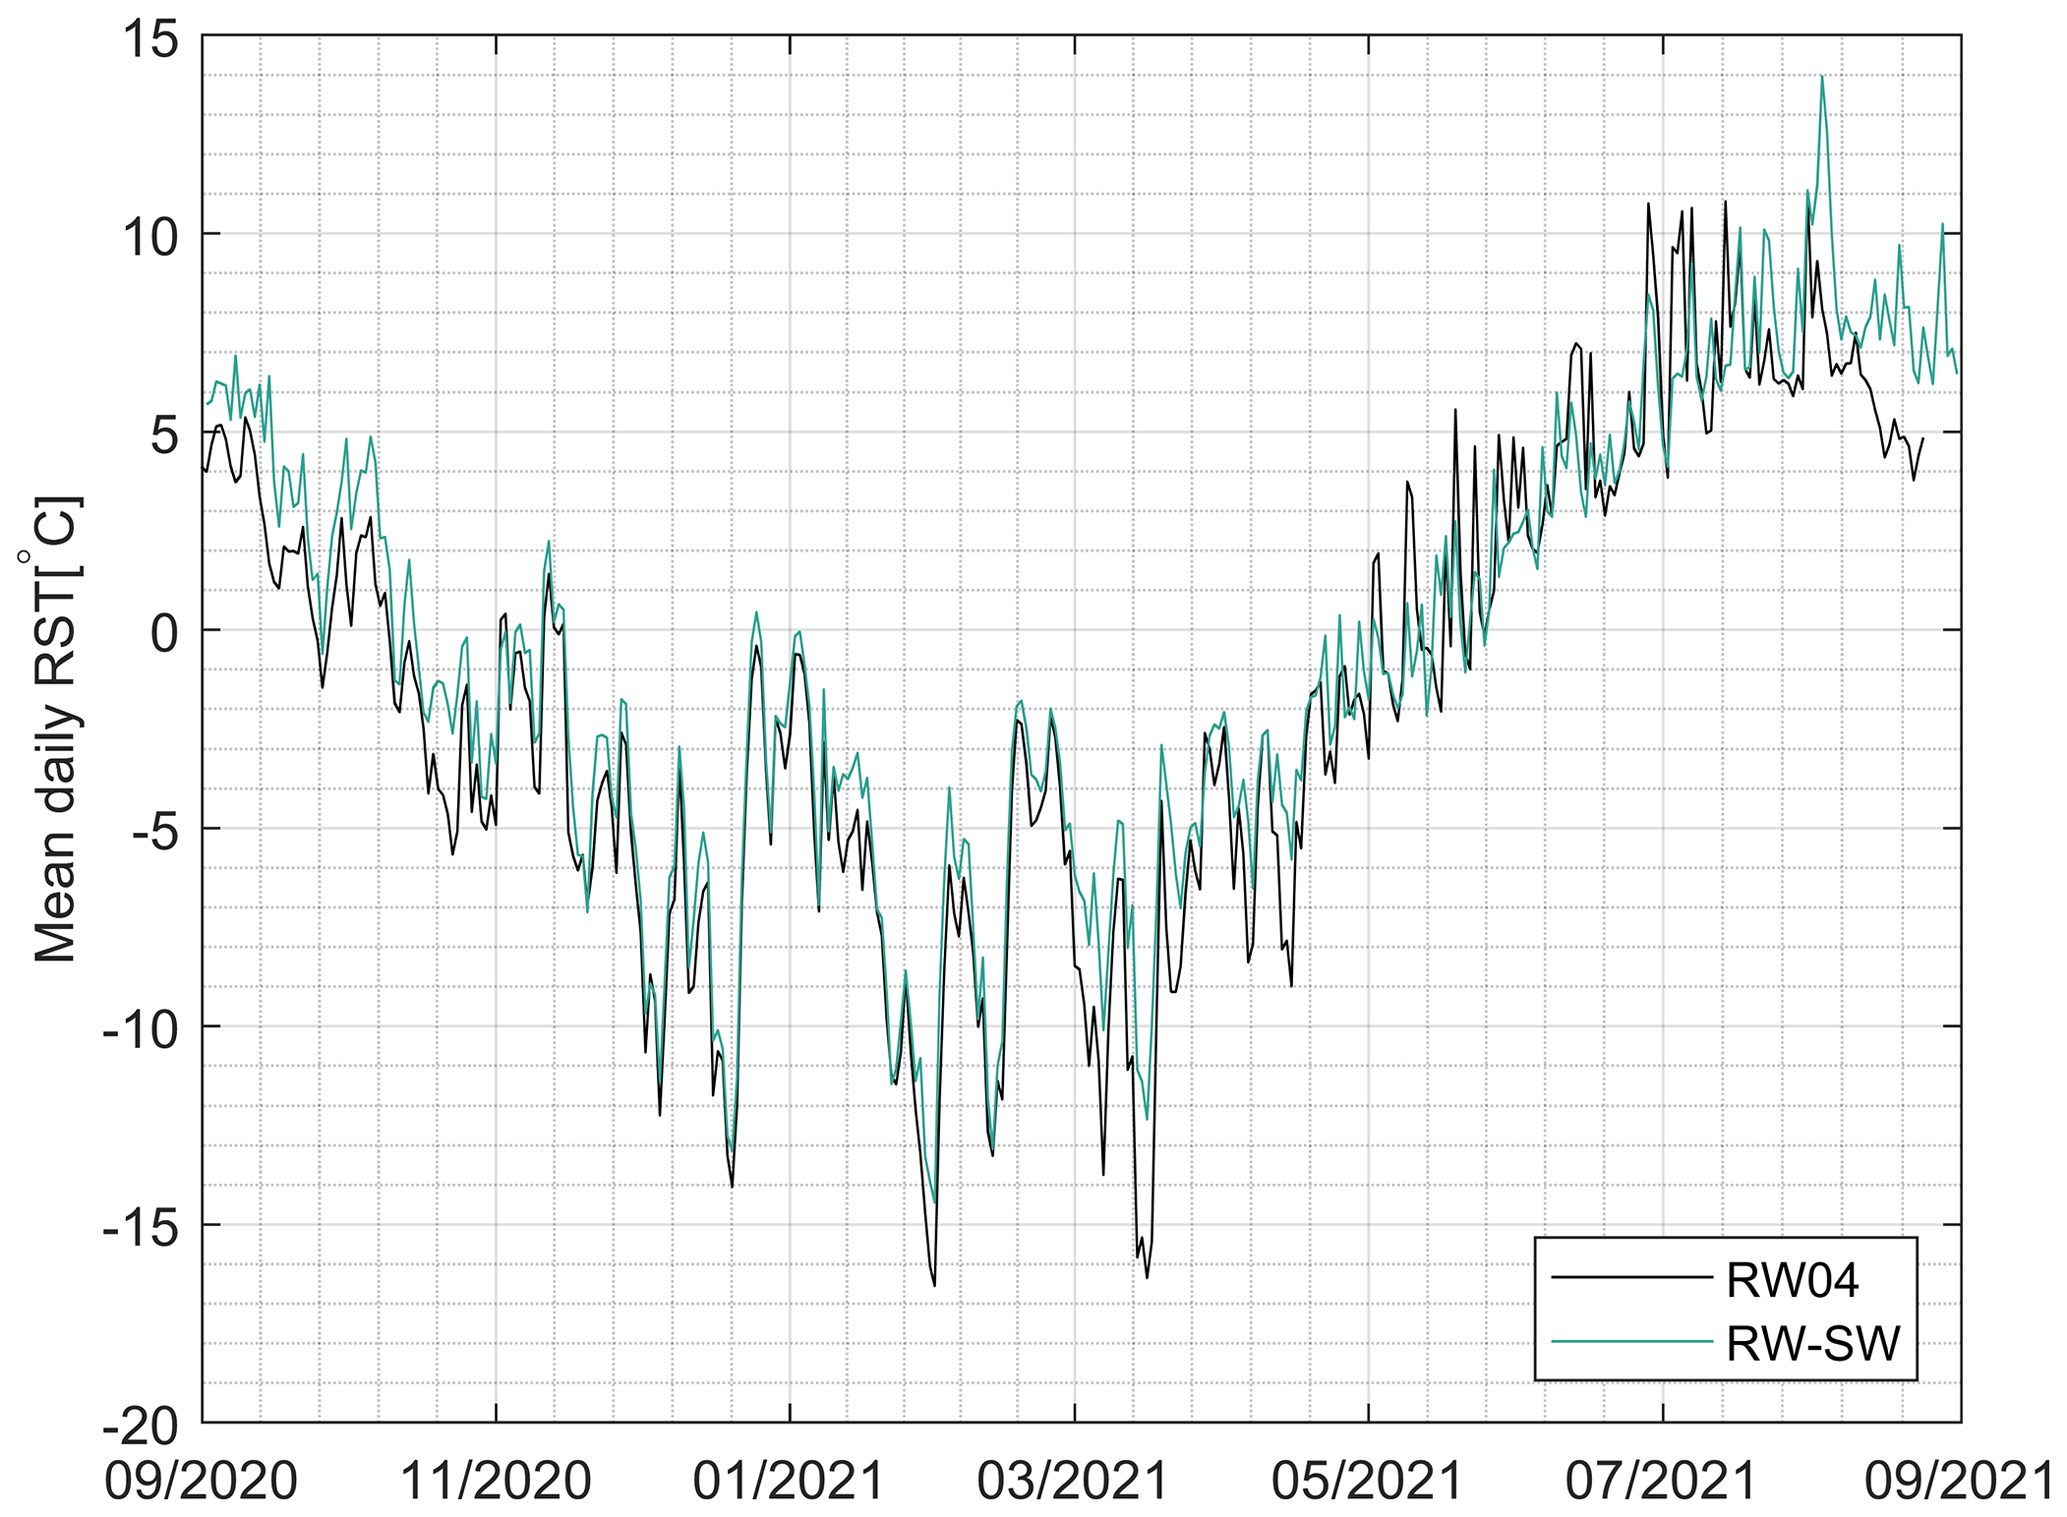
Figure A1Measured rock surface temperature (RST) from 1 September 2020 to 31 August 2021 recorded by the rock wall loggers at the northeast-facing coastline (RW04) and the southwest-facing coastline (RW-SW).
The RW-SW logger is located at the southwest-facing coastline of Brøggerhalvøya, exposed to the open sea. Comparing RW-SW records to records from the RW04 logger (Schmidt et al., 2021) at the northeast-facing coastline, which is protected from the open sea by Kongsfjorden, reveals differences in mean annual rock surface temperatures. RW04 measured a value of −1.64 °C, which is 1.15 °C lower than the value recorded by RW-SW. The temperature differences are particularly pronounced in late winter and early spring. The entire measurement period is shown in Fig. A1.
To investigate links between coastal-erosion dynamics in Brøggerhalvøya and possible changes in the local climate, we used hourly ERA5 reanalysis data (Hersbach et al., 2020) in conjunction with a downscaling routine. The ERA5 reanalysis data can represent the mesoscale (10–100 km) behaviour of the atmosphere and the underlying surface relatively accurately. To account for hillslope-scale effects, we used the topography-based downscaling routine TopoSCALE (Fiddes and Gruber, 2014). This scheme has been widely used for downscaling reanalysis data from complex terrain (e.g. Renette et al., 2023). TopoSCALE uses several terrain parameters (elevation, slope, aspect, sky view factor, and horizon angles) to adjust coarse-scale meteorological forcing to a finer grid that can represent local topography. We analysed trends in mean annual air temperature, annual rainfall and snowfall, and mean annual incoming longwave and shortwave radiation.
The terrain parameters were computed using a 30 m resolution DEM of Svalbard (Norwegian Polar Institute, 2014), focusing on six sites: the Ny-Ålesund weather station (SN99910; 78°55′23′′ N, 11°55′55′′ E), the Ny-Ålesund Baseline Surface Radiation Network (BSRN) station (78°55′22′′ N, 11°55′38′′ E), the Bayelva soil and climate (known as BCS; 78°55′15′′ N, 11°50′0′′ E; Fig. B1), Stuphallet (78°57′57′′ N, 11°35′57′′ E), Kongsfjordneset (78°58′21′′ N, 11°30′45′′ E), and Kjærsvika (78°55′17′′ N, 11°25′11′′ E) (Fig. 1). While the latter three sites represent coastal cliffs, the first three were used for validation, as shown in Fig. B2. The downscaling performed well on a monthly timescale for air temperature (validated against SN99910); specific humidity, which showed a slight tendency to underestimate periods of higher humidity (validated against BCS); and incoming shortwave and longwave radiation (validated against BCS), and it provided a very accurate estimate of surface pressure (validated against the BSRN station). Although we did not perform a direct validation of the downscaled precipitation due to challenges in measuring this variable, the performance for surface pressure suggests that ERA5 can capture larger-scale, synoptic precipitation events. The evaluation of wind speed showed greater scatter; therefore, station data provided by the Norwegian Centre for Climate Services (2023) were used when examining trends in storminess (Sect. 3.4).
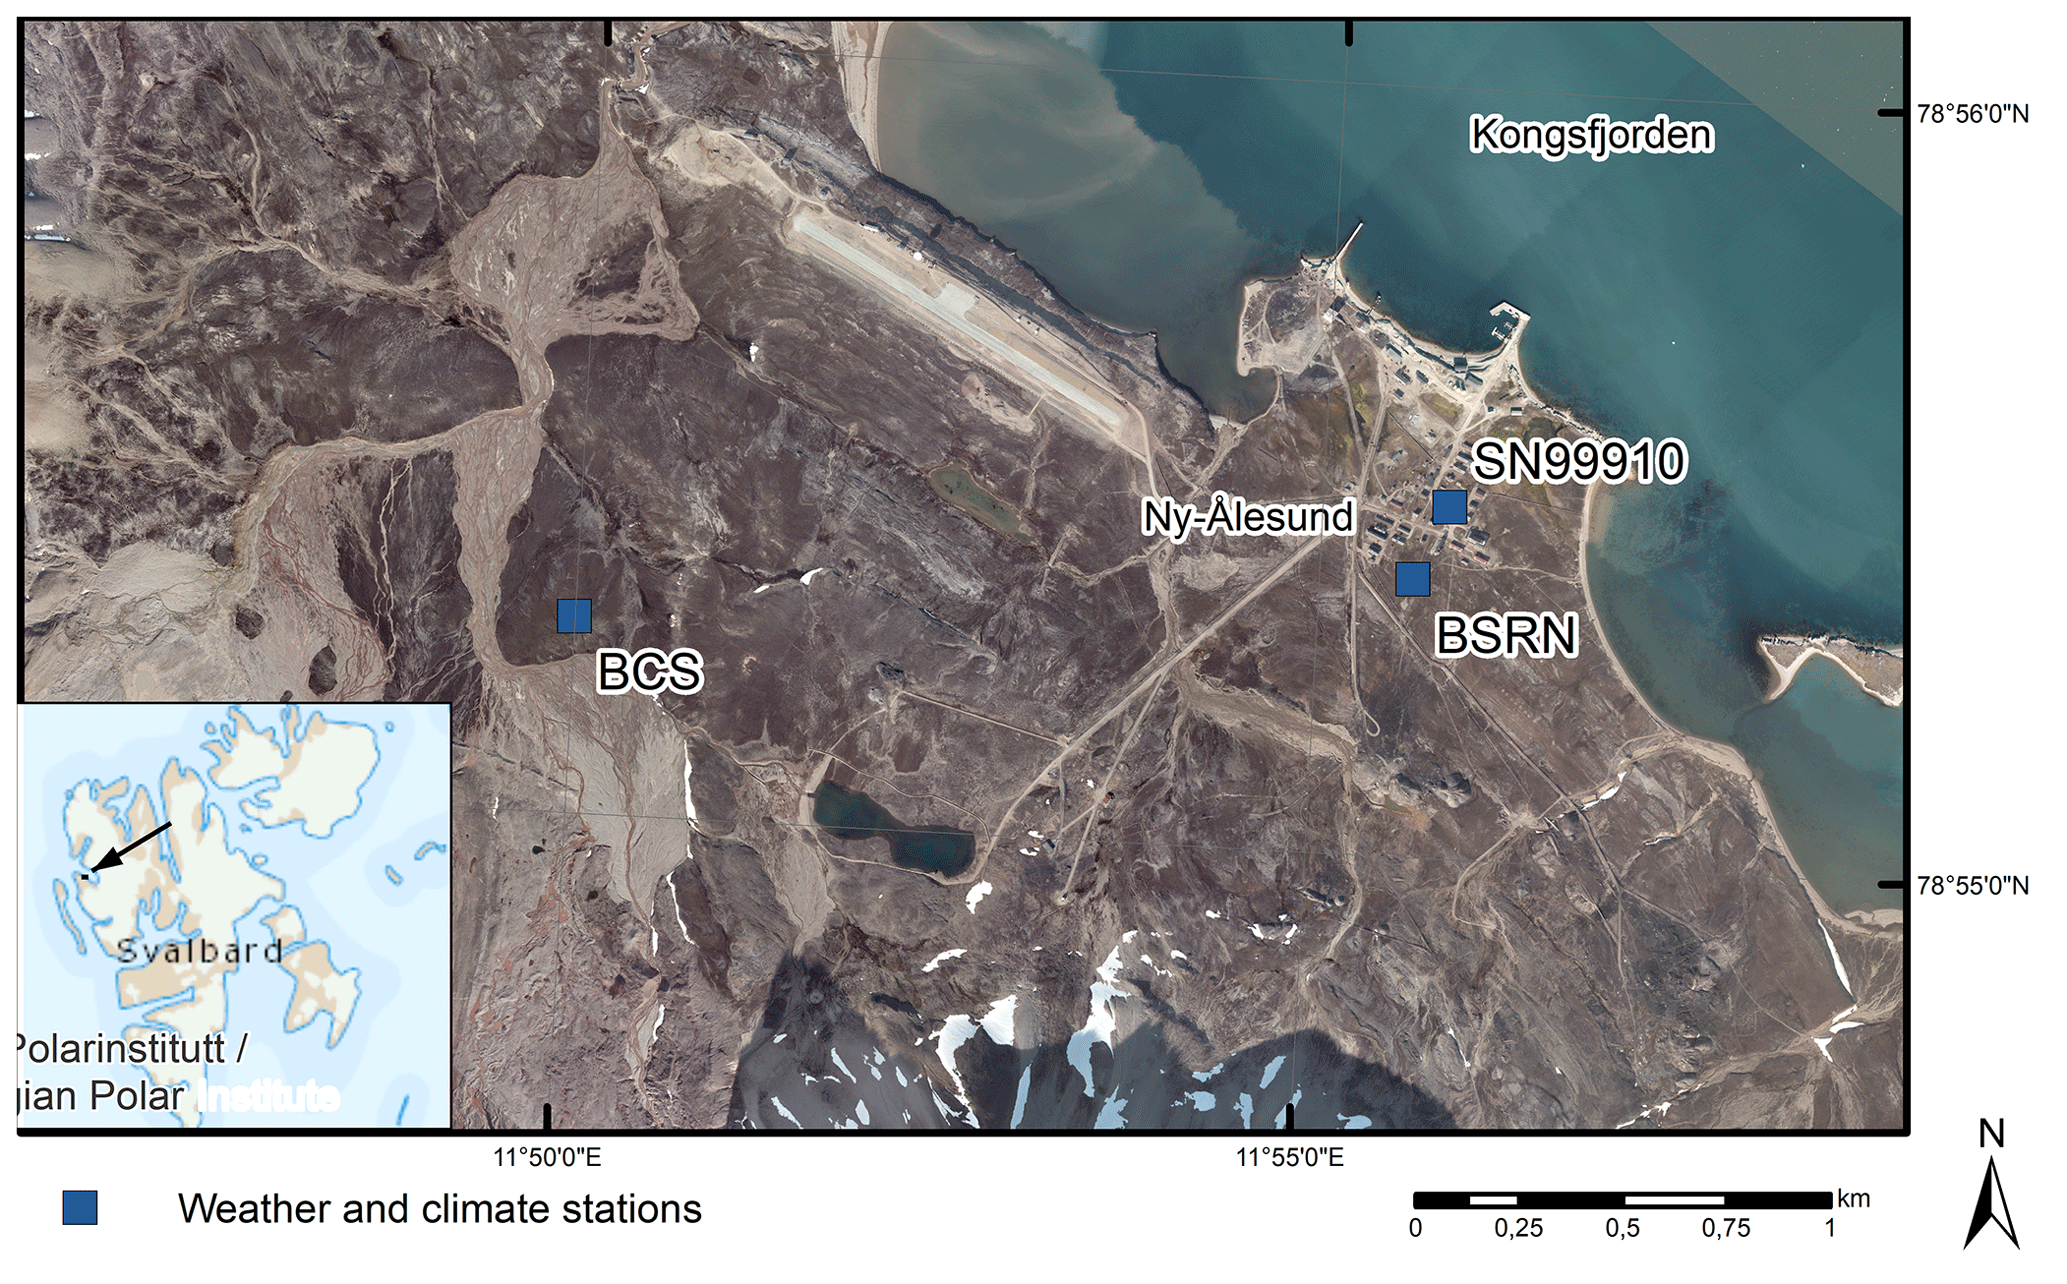
Figure B1Orthoimage of Ny-Ålesund, where the weather and climate stations are located. These stations were used for the validation of the downscaled atmospheric data. The source of the orthoimage is the ©Norwegian Polar Institute (https://geodata.npolar.no/, last access: 11 October 2022).
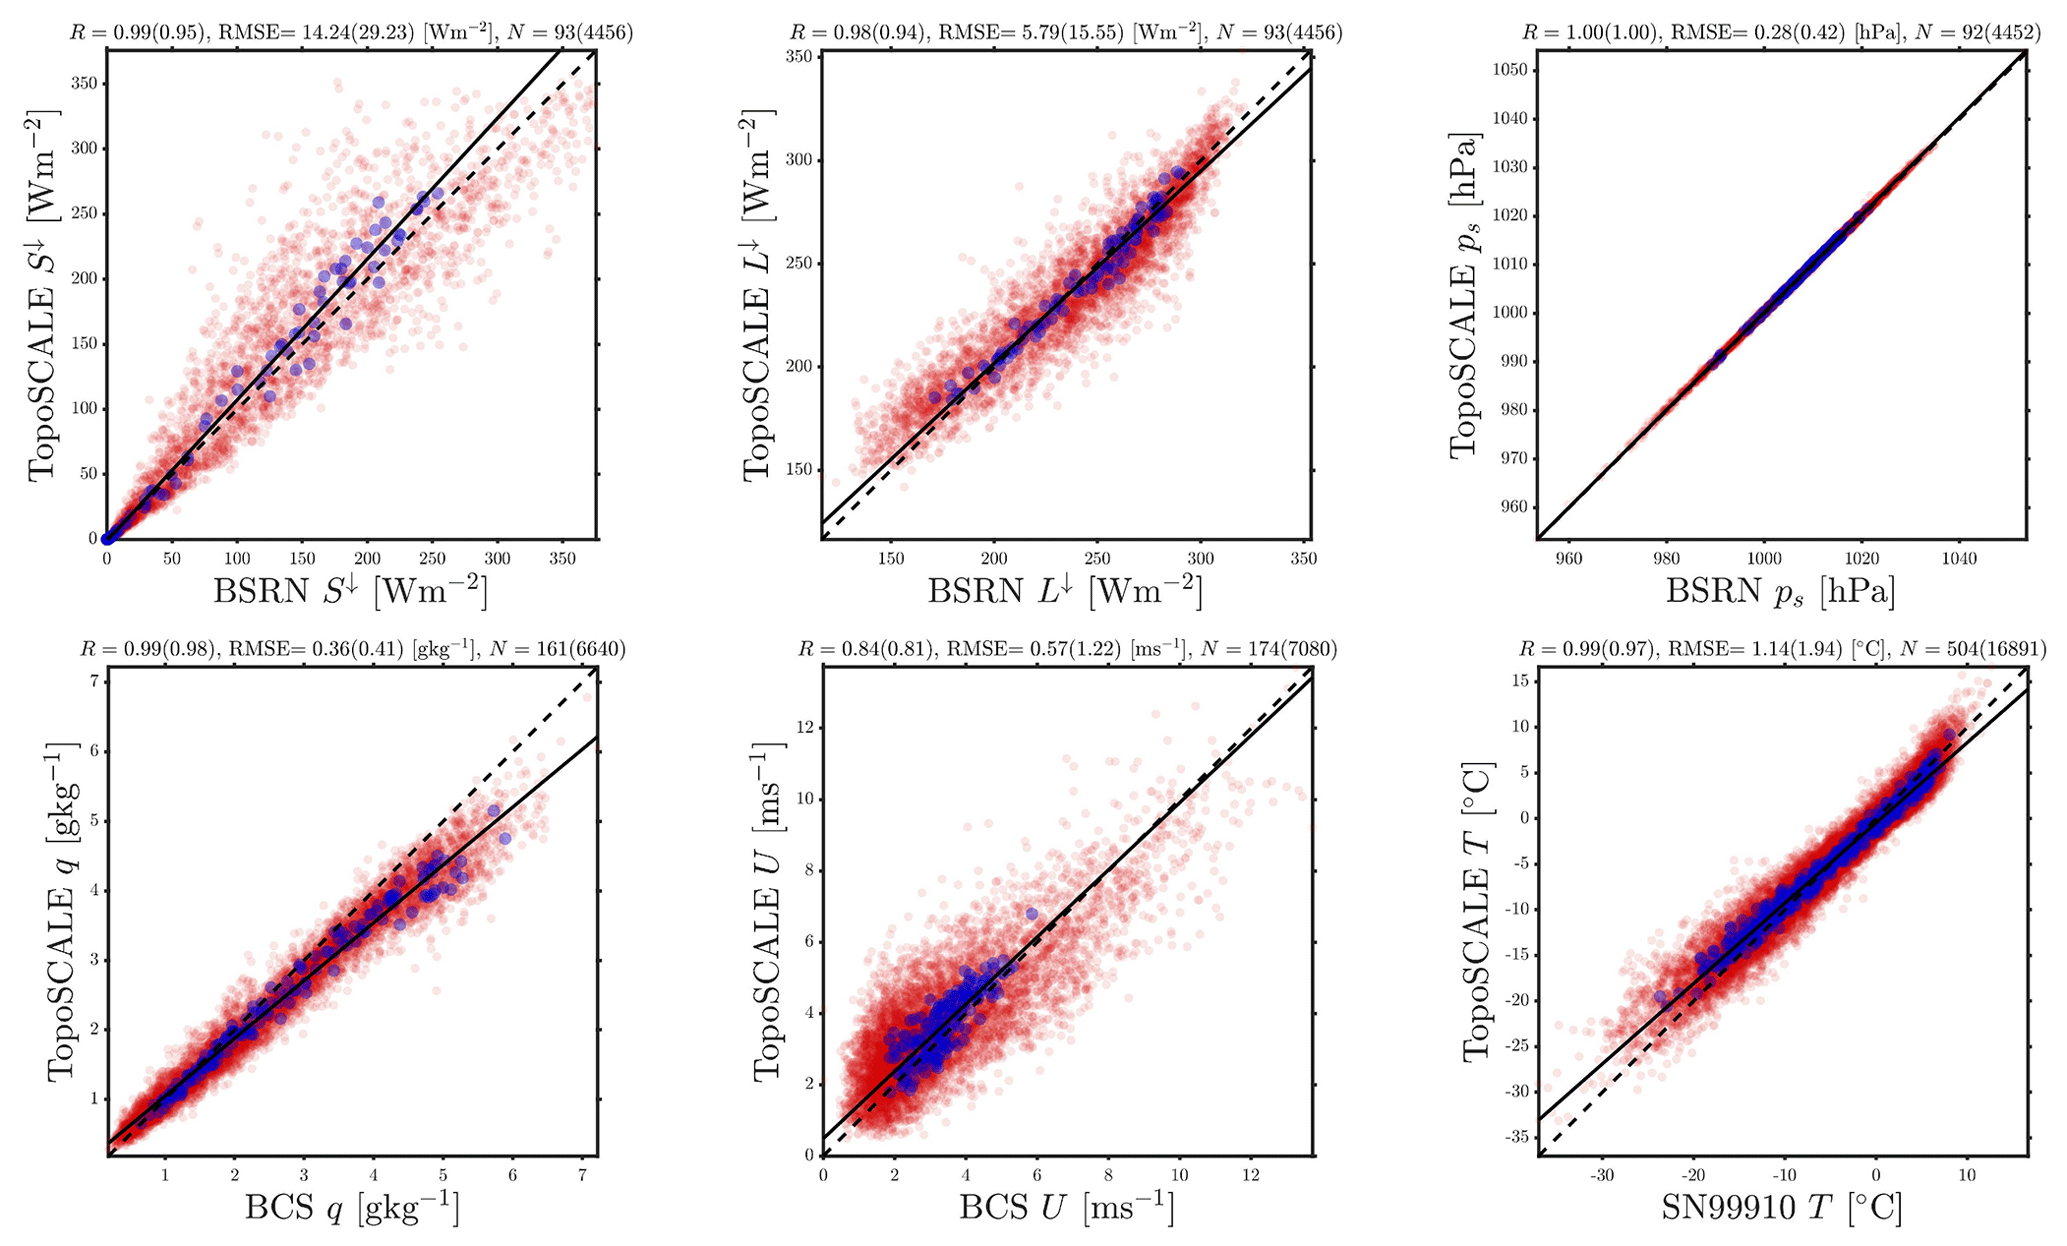
Figure B2Validation of downscaled data from stations near Ny-Ålesund (the BSRN station, BCS, and SN99910). The following data are analysed: incoming shortwave radiation (↓S; top left), incoming longwave radiation (↓L; top middle), surface pressure (ps; top right), specific humidity (q; bottom left), wind speed (U; bottom middle), and air temperature (T; bottom right). The red dots represent daily averages, the blue dots indicate monthly averages, the dashed line represents identity, and the solid line indicates the linear best fit. Stations with the longest records were selected in each case. The correlation coefficient (R), RMSE, and number of points at the monthly (daily) scale are given in the panel titles.
We aggregated the hourly downscaled data to represent annual means (temperature, incoming longwave, and incoming shortwave) and accumulations (snowfall and rainfall). Annual snowfall and rainfall were estimated using an air-temperature-based phase delineation of hourly precipitation data. This annual aggregation leads to a further reduction in the RMSE compared to the monthly estimates given in Fig. B2. The annual error is thus likely low enough to detect multi-decadal climate change signals. For all variables except incoming shortwave radiation and the number of days exhibiting storminess, we took the average of the downscaled ERA5 data across the three study sites (Stuphallet, Kjærsvika, and Kongsfjordneset) from 1950 to 2021. For incoming shortwave radiation, we used the same data and period but separately considered two sites with different expositions: Stuphallet, which is northeast-facing, and Kjærsvika, which is southwest-facing. For days exhibiting storminess, we used data from the Ny-Ålesund weather station (SN99910; Norwegian Centre for Climate Services, 2023).
To detect trends in the annual time series, we performed a Bayesian regression analysis (Särkkä, 2013), which is an established method for climate change detection (Annan, 2010). In particular, we fitted two competing models: a “trend” model with a linearly varying background climate and a “steady” model with a fixed background climate.
The regression analysis of the trend model delivers the trend coefficients (β) and the scales of internal climate variability (σ). As a verification, we expect around 5 % of the data to fall outside the 95 % predictive interval (marked in yellow), which is what we observe in all panels in Fig. C1. For each variable, we also report the Bayes factor (Kass and Raftery, 1995), denoted as B, which quantifies how much support the data lend to the trend model versus the steady model. This output is presented on a logarithmic scale that measures the weight of evidence in favour of a trend: signifies weak evidence, signifies substantial evidence, signifies strong evidence, and log 10(B)>2 signifies decisive evidence. For negative log 10(B), the scale is the same but indicates evidence in favour of no trend (the steady model). For our analysis, log 10(B) can thus help quantify the strength of evidence in favour of (or against, if log 10(B)<0) a climate change signal over the last 70 years.
The outputs from the regression analysis of the trend model are shown in Fig. C1. Air temperature shows a decisive positive trend of +0.6 °C decade−1, increasing from approximately −7 to −3 °C. A strong increase in annual rainfall is detected at a rate of 13 mm decade−1. The values increased from about 180 mm in the 1950s to 270 mm in the last decade. As this analysis only considers annual values, no conclusion can be drawn regarding the occurrence of heavy-rainfall events. In contrast, there is substantial evidence showing that the amount of snowfall has remained steady, with only a very slight decrease of −2.7 mm decade−1 and a nearly constant climatology around 280 mm a−1. The strongly increasing trend in rainfall and negligible decreasing trend in snowfall indicate an overall warmer and wetter climate.
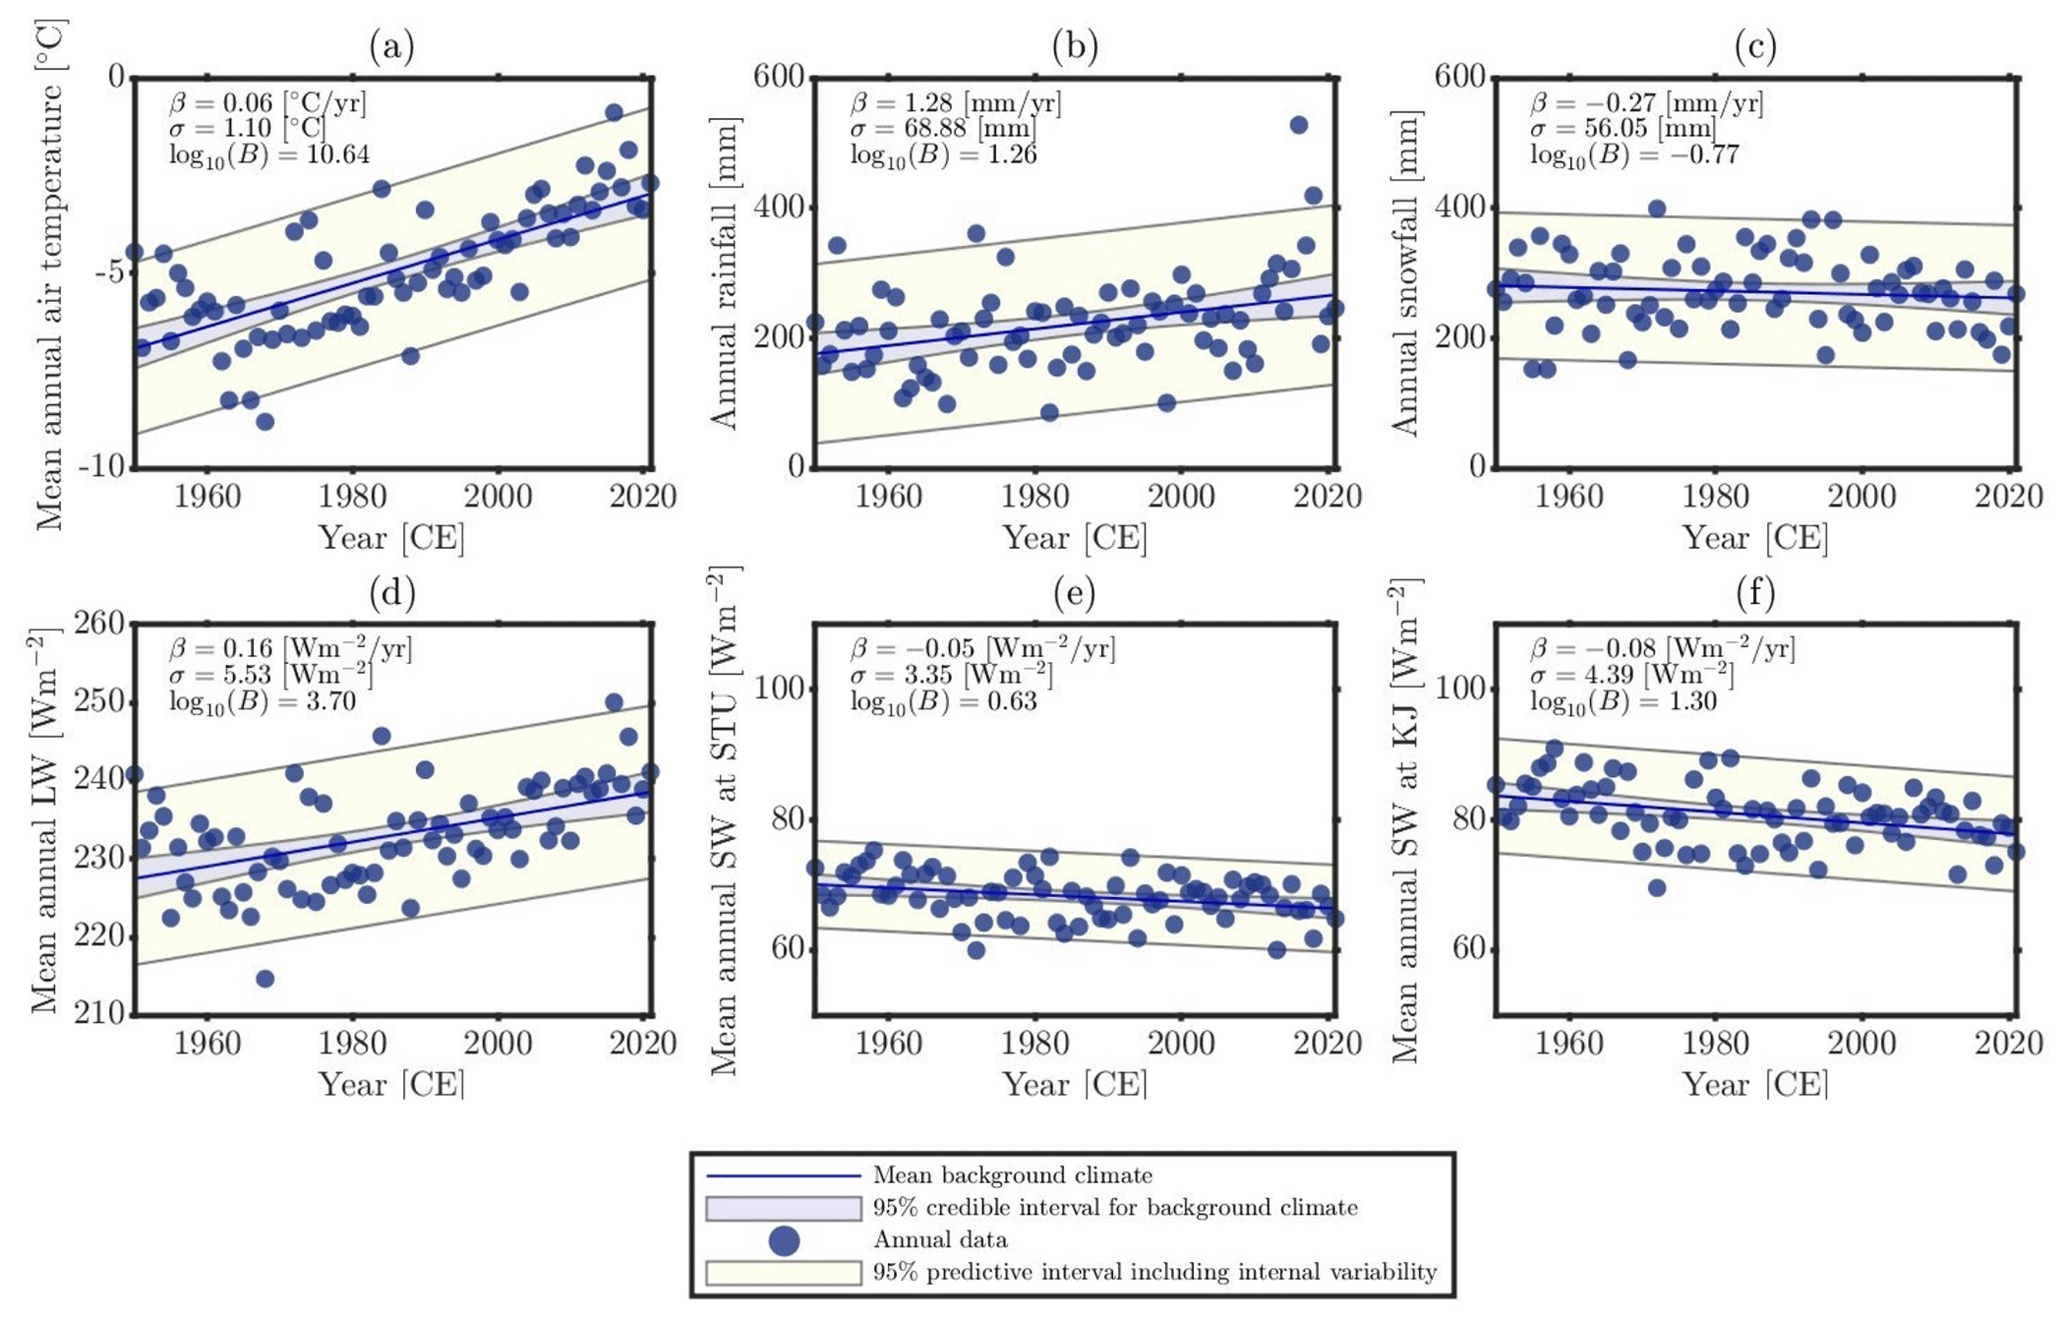
Figure C1Climate data for Brøggerhalvøya over the last decades, downscaled from (a–f) ERA5 data and (g) Ny-Ålesund station data for the following variables: (a) air temperature, (b) rainfall, (c) snowfall, (d) incoming longwave (LW) radiation, (e) incoming shortwave (SW) radiation at Stuphallet (STU), and (f) incoming shortwave radiation at Kjærsvika (KJ).
Incoming longwave radiation shows a decisive increasing trend over the last 70 years at a rate of 1.6 . Mean annual values increased, on average, from 227 W m−2 in the 1950s to 237 W m−2 in recent years. This increase in longwave radiation has a pronounced effect on the surface energy balance, with more energy being transferred to the ground surface. The steep slope angles of the coastal cliffs influence the incoming shortwave radiation. Mean annual values at Kjærsvika (the representative field site for the southwest-facing coastline) decreased strongly from 83 to 78 W m−2 at a rate of −0.8 . Exhibiting a substantial trend of −0.6 , Stuphallet shows a trend of a similar order of magnitude; however, the incoming shortwave radiation is considerably lower, decreasing from 70 to 67 W m−2. The reduced incoming shortwave radiation at Stuphallet is the result of the northeastern exposition of the coastline, which leads to longer periods of shading.
The dGNSS survey and the analysis of the multiple coastline digitizations are archived on Zenodo (https://doi.org/10.5281/zenodo.7756973; Aga, 2023). The orthoimage from 2010 can be accessed at https://geodata.npolar.no/ (Norwegian Polar Institute, 2022), whereas the orthoimages of 1970, 1990, and 2021 are not publicly available.
JA designed the concept of the study, conducted fieldwork, performed the DSAS analysis, and prepared the paper (including tables and figures). LP contributed to the concept throughout all phases of the study and digitized the coastlines. SW provided ideas regarding the concept of the study and offered organizational and technical support. LP and AK acquired the aerial images. LG processed the aerial images. TE performed the post-processing of the dGNSS data. JA and KA performed the statistical tests. KA downscaled the climate data and prepared most of the Appendix. All authors contributed to the final paper with input and suggestions.
The contact author has declared that none of the authors has any competing interests.
Publisher's note: Copernicus Publications remains neutral with regard to jurisdictional claims made in the text, published maps, institutional affiliations, or any other geographical representation in this paper. While Copernicus Publications makes every effort to include appropriate place names, the final responsibility lies with the authors.
We acknowledge the support provided by Robin B. Zweigel during the fieldwork.
This research has been supported by the Horizon 2020 programme via the Nunataryuk project (“Permafrost thaw and the changing arctic coast: science for socio-economic adaptation”; grant no. 773421). We acknowledge funding from the Research Council of Norway via the Arctic Field Grant “Coastal erosion on the Brøgger peninsula, Svalbard” (grant no. 321957) and PCCH-Arctic (grant no. 320769).
This paper was edited by Susan Conway and reviewed by Gregor Luetzenburg and two anonymous referees.
Aga, J.: Supplementary data for “Coastal retreat rates of high-Arctic rock cliffs on Brøgger peninsula, Svalbard, accelerate during the past decade”, Zenodo [data set], https://doi.org/10.5281/zenodo.7756973, 2023. a
Ambaum, M. H.: Significance tests in climate science, J. Climate, 23, 5927–5932, https://doi.org/10.1175/2010JCLI3746.1, 2010. a
Andrachuk, M. and Pearce, T.: Vulnerability and adaptation in two communities in the Inuvialuit Settlement Region, in: Community adaptation and vulnerability in Arctic Regions, Springer, Dordrecht Heidelberg London New York, https://doi.org/10.1007/978-90-481-9174-1_3, pp. 63–81, 2010. a
Annan, J.: Bayesian approaches to detection and attribution, WIREs Clim. Change, 1, 486–489, https://doi.org/10.1002/wcc.47, 2010. a
Are, F.: Thermal abrasion of sea coasts (Part II), Polar Geography and Geology, 12, https://doi.org/10.1080/10889378809377352, 1988a. a
Are, F. E.: Thermal abrasion of sea coasts (part I), Polar Geography and Geology, 12, https://doi.org/10.1080/10889378809377343, 1988b. a
Barnhart, K. R., Overeem, I., and Anderson, R. S.: The effect of changing sea ice on the physical vulnerability of Arctic coasts, The Cryosphere, 8, 1777–1799, https://doi.org/10.5194/tc-8-1777-2014, 2014. a, b
Benjamin, D. J., Berger, J. O., Johannesson, M., Nosek, B. A., Wagenmakers, E.-J., Berk, R., Bollen, K. A., Brembs, B., Brown, L., Camerer, C., Cesarini, D., Chambers, C. D., Clyde, M., Cook, T. D., De Boeck, P., Dienes, Z., Dreber, A., Easwaran, K., Efferson, C., Fehr, E., Fidler, F., Field, A. P., Forster, M., George, E. I., Gonzalez, R., Goodman, S., Green, E., Green, D. P., Greenwald, A. G., Hadfield, J. D., Hedges, L. V., Held, L., Ho, T. H., Hoijtink, H., Hruschka, D. J., Imai, K., Imbens, G., Ioannidis, J. P. A., Jeon, M., Jones, J. H., Kirchler, M., Laibson, D., List, J., Little, R., Lupia, A., Machery, E., Maxwell, S. E., McCarthy, M., Moore, D. A., Morgan, S. L., Munafó, M., Nakagawa, S., Nyhan, B., Parker, T. H., Pericchi, L., Perugini, M., Rouder, J., Rousseau, J., Savalei, V., Schönbrodt, F. D., Sellke, T., Sinclair, B., Tingley, D., Van Zandt, T., Vazire, S., Watts, D. J., Winship, C., Wolpert, R. L., Xie, Y., Young, C., Zinman, J., and Johnson, V. E.: Redefine statistical significance, Nat. Human Behav., 2, 6–10, https://doi.org/10.1038/s41562-017-0189-z, 2018. a, b
Biskaborn, B. K., Smith, S. L., Noetzli, J., Matthes, H., Vieira, G., Streletskiy, D. A., Schoeneich, P., Romanovsky, V. E., Lewkowicz, A. G., Abramov, A., Allard, M., Boike, J., Cable, W. L., Christiansen, H. H., Delaloye, R., Diekmann, B., Drozdov, D., Etzelmüller, B., Grosse, G., Guglielmin, M., Ingeman-Nielsen, T., Isaksen, K., Ishikawa, M., Johansson, M., Johannsson, H., Joo, A., Kaverin, D., Kholodov, A., Konstantinov, P., Kröger, T., Lambiel, C., Lanckman, J.-P., Luo, D., Malkova, G., Meiklejohn, I., Moskalenko, N., Oliva, M., Phillips, M., Ramos, M., Sannel, A. B. K., Sergeev, D., Seybold, C., Skryabin, P., Vasiliev, A., Wu, Q., Yoshikawa, K., Zheleznyak, M., and Lantuit, H.: Permafrost is warming at a global scale, Nat. Commun., 10, 1–11, https://doi.org/10.1038/s41467-018-08240-4, 2019. a
Boike, J., Juszak, I., Lange, S., Chadburn, S., Burke, E., Overduin, P. P., Roth, K., Ippisch, O., Bornemann, N., Stern, L., Gouttevin, I., Hauber, E., and Westermann, S.: A 20-year record (1998–2017) of permafrost, active layer and meteorological conditions at a high Arctic permafrost research site (Bayelva, Spitsbergen), Earth Syst. Sci. Data, 10, 355–390, https://doi.org/10.5194/essd-10-355-2018, 2018. a, b, c
Bourriquen, M., Baltzer, A., Mercier, D., Fournier, J., Pérez, L., Haquin, S., Bernard, E., and Jensen, M.: Coastal evolution and sedimentary mobility of Brøgger Peninsula, northwest Spitsbergen, Polar Biol., 39, 1689–1698, https://doi.org/10.1007/s00300-016-1930-1, 2016. a
Bourriquen, M., Mercier, D., Baltzer, A., Fournier, J., Costa, S., and Roussel, E.: Paraglacial coasts responses to glacier retreat and associated shifts in river floodplains over decadal timescales (1966–2016), Kongsfjorden, Svalbard, Land Degrad. Dev., 29, 4173–4185, https://doi.org/10.1002/ldr.3149, 2018. a
Brady, M. B. and Leichenko, R.: The impacts of coastal erosion on Alaska's North Slope communities: a co-production assessment of land use damages and risks, Polar Geography, 43, 259–279, https://doi.org/10.1080/1088937X.2020.1755907, 2020. a
Bronen, R. and Chapin III, F. S.: Adaptive governance and institutional strategies for climate-induced community relocations in Alaska, P. Natl. Acad. Sci. USA, 110, 9320–9325, https://doi.org/10.1073/pnas.1210508110, 2013. a, b
Casas-Prat, M. and Wang, X. L.: Projections of extreme ocean waves in the Arctic and potential implications for coastal inundation and erosion, J. Geophys. Res.-Oceans, 125, e2019JC015745, https://doi.org/10.1029/2019JC015745, 2020a. a
Casas-Prat, M. and Wang, X. L.: Sea ice retreat contributes to projected increases in extreme Arctic ocean surface waves, Geophys. Res. Lett., 47, e2020GL088100, https://doi.org/10.1029/2020GL088100, 2020b. a
Christiansen, H. H., Etzelmüller, B., Isaksen, K., Juliussen, H., Farbrot, H., Humlum, O., Johansson, M., Ingeman-Nielsen, T., Kristensen, L., Hjort, J., Holmlund, P., Sannel, A. B. K., Sigsgaard, C., Åkerman, H. J., Foged, N., Blikra, L. H., Pernosky, M. A., and Ødegård, R. S.: The thermal state of permafrost in the nordic area during the international polar year 2007–2009, Permafrost Periglac., 21, 156–181, https://doi.org/10.1002/ppp.687, 2010. a, b
Dahlke, S., Hughes, N. E., Wagner, P. M., Gerland, S., Wawrzyniak, T., Ivanov, B., and Maturilli, M.: The observed recent surface air temperature development across Svalbard and concurring footprints in local sea ice cover, Int. J. Climatol., 40, 5246–5265, https://doi.org/10.1002/joc.6517, 2020. a
Davies, M. C., Hamza, O., and Harris, C.: The effect of rise in mean annual temperature on the stability of rock slopes containing ice-filled discontinuities, Permafrost Periglac. 12, 137–144, https://doi.org/10.1002/ppp.378, 2001. a
Etzelmüller, B. and Sollid, J. L.: The role of weathering and pedological processes for the development of sorted circles on Kvadehuksletta, Svalbard-a short report, Polar Res., 9, 181–191, https://doi.org/10.3402/polar.v9i2.6790, 1991. a
Etzelmüller, B., Ødegård, R., and Sollid, J.: The spatial distribution of coast types on Svalbard, in: Arctic Coastal Dynamics–Report of the 3rd International Workshop. Extended Abstracts, Alfred Wegener Institute for Polar and Marine Research, Bremerhaven, 2–5 December 2002, University of Oslo, Norway, Citeseer, pp. 33–40, 2003. a
Etzelmüller, B., Guglielmin, M., Hauck, C., Hilbich, C., Hoelzle, M., Isaksen, K., Noetzli, J., Oliva, M., and Ramos, M.: Twenty years of European mountain permafrost dynamics—the PACE legacy, Environ. Res. Lett., 15, 104070, https://doi.org/10.1088/1748-9326/abae9d, 2020. a, b
Fiddes, J. and Gruber, S.: TopoSCALE v.1.0: downscaling gridded climate data in complex terrain, Geosci. Model Dev., 7, 387–405, https://doi.org/10.5194/gmd-7-387-2014, 2014. a, b, c
Forman, S. L., Mann, D. H., and Miller, G. H.: Late Weichselian and Holocene relative sea-level history of Bröggerhalvöya, Spitsbergen, Quaternary Res., 27, 41–50, https://doi.org/10.1016/0033-5894(87)90048-2, 1987. a, b
Fritz, M., Vonk, J. E., and Lantuit, H.: Collapsing arctic coastlines, Nat. Clim. Change, 7, 6–7, https://doi.org/10.1038/nclimate3188, 2017. a
Gerland, S. and Hall, R.: Variability of fast-ice thickness in Spitsbergen fjords, Ann. Glaciol., 44, 231–239, https://doi.org/10.3189/172756406781811367, 2006. a
Girod, L. and Filhol, S.: luc-girod/MicMacWorkflowsByLucGirod: As of processing of Sedongpu glacier in (Kääb and Girod, 2022 or 2023), Zenodo, https://doi.org/10.5281/zenodo.7380304, 2022. a, b
GTN-P: GTN-P global mean annual ground temperature data for permafrost near the depth of zero annual amplitude (2007–2016), PANGAEA, https://doi.org/10.1594/PANGAEA.884711, 2018. a
Guégan, E. B. and Christiansen, H. H.: Seasonal Arctic coastal bluff dynamics in Adventfjorden, Svalbard, Permafrost Periglac., 28, 18–31, https://doi.org/10.1002/ppp.1891, 2017. a, b, c
Günther, F., Overduin, P. P., Sandakov, A. V., Grosse, G., and Grigoriev, M. N.: Short- and long-term thermo-erosion of ice-rich permafrost coasts in the Laptev Sea region, Biogeosciences, 10, 4297–4318, https://doi.org/10.5194/bg-10-4297-2013, 2013. a
Hanssen-Bauer, I., Førland, E., Hisdal, H., Mayer, S., Sandø, A., Sorteberg, A., Adakudlu, M., Andresen, J., Bakke, J., Beldring, S., Benestad, R., van der Bilt, W., Bogen, J., Borstad, C., Breili, K., Breivik, O., Børsheim, K., Christiansen, H., Dobler, A., and Wong, W.: Climate in Svalbard 2100 – A knowledge base for climate adaptation, Norwegian Centre for Climate Services NCCS report, https://doi.org/10.13140/RG.2.2.10183.75687, 2019. a, b, c, d, e
Hersbach, H., Bell, B., Berrisford, P., Hirahara, S., Horányi, A., Muñoz-Sabater, J., Nicolas, J., Peubey, C., Radu, R., Schepers, D., Simmons, A., Soci, C., Abdalla, S., Abellan, X., Balsamo, G., Bechtold, P., Biavati, G., Bidlot, J., Bonavita, M., De Chiara, G., Dahlgren, P., Lee, D., Diamantakis, M., Dragani, R., Flemming, J., Forbes, R., Fuentes, M., Geer, A., Haimberger, L., Healy, S., Hogan, R. J., Hólm, E., Janisková, M., Keeley, S., Laloyaux, P., Lopez, P., Lupu, C., Radnoti, G., de Rosnay, P., Rozum, I., Vamborg, F., Villaume, S., and Thépaut, J.-N.: The ERA5 global reanalysis, Q. J. Roy. Meteor. Soc., 146, 1999–2049, https://doi.org/10.1002/qj.3803, 2020. a, b, c
Himmelstoss, E. A., Henderson, R. E., Kratzmann, M. G., and Farris, A. S.: Digital shoreline analysis system (DSAS) version 5.1 user guide, Tech. rep., US Geological Survey, https://doi.org/10.3133/ofr20211091, 2021. a
Hop, H. and Wiencke, C.: The Ecosystem of Kongsfjorden, Svalbard, in: The Ecosystem of Kongsfjorden, Svalbard, Springer, Cham, https://doi.org/10.1007/978-3-319-46425-1_1, pp. 1–20, 2019. a
Irrgang, A. M., Lantuit, H., Manson, G. K., Günther, F., Grosse, G., and Overduin, P. P.: Variability in rates of coastal change along the Yukon coast, 1951 to 2015, J. Geophys. Res.-Earth, 123, 779–800, https://doi.org/10.1002/2017JF004326, 2018. a, b, c, d, e
Irrgang, A. M., Lantuit, H., Gordon, R. R., Piskor, A., and Manson, G. K.: Impacts of past and future coastal changes on the Yukon coast—threats for cultural sites, infrastructure, and travel routes, Arctic Science, 5, 107–126, https://doi.org/10.1139/as-2017-0041, 2019. a
Irrgang, A. M., Bendixen, M., Farquharson, L. M., Baranskaya, A. V., Erikson, L. H., Gibbs, A. E., Ogorodov, S. A., Overduin, P. P., Lantuit, H., Grigoriev, M. N., and Jones, B. M.: Drivers, dynamics and impacts of changing Arctic coasts, Nat. Rev. Earth Environ., 3, 39–54, https://doi.org/10.1038/s43017-021-00232-1, 2022. a, b, c, d
Isaksen, K., Sollid, J. L., Holmlund, P., and Harris, C.: Recent warming of mountain permafrost in Svalbard and Scandinavia, J. Geophys. Res.-Earth, 112, F02S04, https://doi.org/10.1029/2006JF000522, 2007. a, b
Isaksen, K., Nordli, Ø., Førland, E. J., Łupikasza, E., Eastwood, S., and Niedźwiedź, T.: Recent warming on Spitsbergen—Influence of atmospheric circulation and sea ice cover, J. Geophys. Res.-Atmos., 121, 11–913, https://doi.org/10.1002/2016JD025606, 2016. a
Jaskólski, M. W., Pawłowski, Ł., and Strzelecki, M. C.: High Arctic coasts at risk—the case study of coastal zone development and degradation associated with climate changes and multidirectional human impacts in Longyearbyen (Adventfjorden, Svalbard), Land Degrad. Dev., 29, 2514–2524, https://doi.org/10.1002/ldr.2974, 2018. a
Johansson, A. M., Malnes, E., Gerland, S., Cristea, A., Doulgeris, A. P., Divine, D. V., Pavlova, O., and Lauknes, T. R.: Consistent ice and open water classification combining historical synthetic aperture radar satellite images from ERS-1/2, Envisat ASAR, RADARSAT-2 and Sentinel-1A/B, Ann. Glaciol., 61, 40–50, https://doi.org/10.1017/aog.2019.52, 2020. a
Jones, B., Irrgang, A., Farquharson, L., Lantuit, H., Whalen, D., Ogorodov, S., Grigoriev, M., Tweedie, C., Gibbs, A., Strzelecki, M., Baranskaya, A., Belova, N., Sinitsyn, A., Kroon, A., Maslakov, A., Vieira, G., Grosse, G., Overduin, P., Nitze, I., Maio, C., Overbeck, J., Bendixen, M., Zagorski, P., and Romanovsky, V.: Coastal Permafrost Erosion, Arctic Report Card, NOAA (National Oceanic and Atmospheric Administration), https://doi.org/10.25923/e47w-dw52, 2020. a
Jones, B. M., Farquharson, L. M., Baughman, C. A., Buzard, R. M., Arp, C. D., Grosse, G., Bull, D. L., Günther, F., Nitze, I., Urban, F., Kasper, J. L., Frederick, J. M., Thomas, M., Jones, C., Mota, A., Dallimore, S., Tweedie, C., Maio, C., Mann, D. H., Richmond, B., Gibbs, A., Xiao, M., Sachs, T., Iwahana, G., Kanevskiy, M., and Romanovsky, V. E.: A decade of remotely sensed observations highlight complex processes linked to coastal permafrost bluff erosion in the Arctic, Environ. Res. Lett., 13, 115001, https://doi.org/10.1088/1748-9326/aae471, 2018. a, b
Jorgenson, M. and Osterkamp, T.: Response of boreal ecosystems to varying modes of permafrost degradation, Can. J. Forest Res., 35, 2100–2111, https://doi.org/10.1139/x05-153, 2005. a
Kartverket: Tides and observed water level from Ny-Ålesund, Kartverket, https://kartverket.no/en/at-sea/se-havniva/result?id=587933&location=Ny-Alesund, (last access: 15 April 2024), 2024. a
Kass, R. and Raftery, A.: Bayes Factors, J. Am. Stat. Assoc., 90, 773–795, https://doi.org/10.2307/2291091, 1995. a
Kavan, J. and Strzelecki, M. C.: Glacier decay boosts the formation of new Arctic coastal environments—Perspectives from Svalbard, Land Degrad. Dev., 34, 3467–3474, https://doi.org/10.1002/ldr.4695, 2023. a, b
Krautblatter, M., Funk, D., and Günzel, F. K.: Why permafrost rocks become unstable: a rock–ice-mechanical model in time and space, Earth Surf. Proc. Land., 38, 876–887, https://doi.org/10.1002/esp.3374, 2013. a
Lantuit, H., Overduin, P. P., Couture, N., Wetterich, S., Aré, F., Atkinson, D., Brown, J., Cherkashov, G., Drozdov, D., Forbes, D. L., Graves-Gaylord, A., Grigoriev, M., Hubberten, H.-W., Jordan, J., Jorgenson, T., Ødegård, R. S., Ogorodov, S., Pollard, W. H., Rachold, V., Sedenko, S., Solomon, S., Steenhuisen, F., Streletskaya, I., and Vasiliev, A.: The Arctic coastal dynamics database: A new classification scheme and statistics on Arctic permafrost coastlines, Estuar. Coast., 35, 383–400, https://doi.org/10.1007/s12237-010-9362-6, 2012. a, b, c, d, e
Lim, M., Strzelecki, M. C., Kasprzak, M., Swirad, Z. M., Webster, C., Woodward, J., and Gjelten, H.: Arctic rock coast responses under a changing climate, Remote Sens. Environ., 236, 111500, https://doi.org/10.1016/j.rse.2019.111500, 2020. a, b, c
Luetzenburg, G., Townsend, D., Svennevig, K., Bendixen, M., Bjørk, A., Eidam, E., and Kroon, A.: Sedimentary coastal cliff erosion in Greenland, J. Geophys. Res.-Earth, 128, e2022JF007026, https://doi.org/10.1029/2022JF007026, 2023. a
Maturilli, M. and Kayser, M.: Arctic warming, moisture increase and circulation changes observed in the Ny-Ålesund homogenized radiosonde record, Theor. Appl. Climatol., 130, 1–17, https://doi.org/10.1007/s00704-016-1864-0, 2017. a
Maturilli, M., Herber, A., and König-Langlo, G.: Surface radiation climatology for Ny-Ålesund, Svalbard (78.9 N), basic observations for trend detection, Theor. Appl. Climatol., 120, 331–339, https://doi.org/10.1007/s00704-014-1173-4, 2015. a, b, c
McCrystall, M. R., Stroeve, J., Serreze, M., Forbes, B. C., and Screen, J. A.: New climate models reveal faster and larger increases in Arctic precipitation than previously projected, Nat. Commun., 12, 6765, https://doi.org/10.1038/s41467-021-27031-y, 2021. a
Meier, W. N. and Stroeve, J.: Comparison of sea-ice extent and ice-edge location estimates from passive microwave and enhanced-resolution scatterometer data, Ann. Glaciol., 48, 65–70, https://doi.org/10.3189/172756408784700743, 2008. a
Mercier, D. and Laffly, D.: Actual paraglacial progradation of the coastal zone in the Kongsfjorden area, western Spitsbergen (Svalbard), Geol. Soc., London, Spec. Publ., 242, 111–117, https://doi.org/10.1144/GSL.SP.2005.242.01.10, 2005. a
Nicu, I. C., Stalsberg, K., Rubensdotter, L., Martens, V. V., and Flyen, A.-C.: Coastal erosion affecting cultural heritage in Svalbard. A case study in Hiorthhamn (Adventfjorden)—An abandoned mining settlement, Sustainability, 12, 2306, https://doi.org/10.3390/su12062306, 2020. a
Nicu, I. C., Rubensdotter, L., Stalsberg, K., and Nau, E.: Coastal erosion of arctic cultural heritage in danger: A case study from svalbard, Norway, Water, 13, 784, https://doi.org/10.3390/w13060784, 2021. a
Nielsen, D. M., Pieper, P., Barkhordarian, A., Overduin, P., Ilyina, T., Brovkin, V., Baehr, J., and Dobrynin, M.: Increase in Arctic coastal erosion and its sensitivity to warming in the twenty-first century, Nat. Clim. Change, 12, 263–270, https://doi.org/10.1038/s41558-022-01281-0, 2022. a
Nordli, Ø., Wyszyński, P., Gjelten, H., Isaksen, K., Łupikasza, E., Niedźwiedź, T., and Przybylak, R.: Revisiting the extended Svalbard Airport monthly temperature series, and the compiled corresponding daily series 1898–2018, Polar Res., 39, 3614, https://doi.org/10.33265/polar.v39.3614, 2020. a
Norwegian Centre for Climate Services: Seklima – Observations and weather statistics, Norwegian Centre for Climate Services, https://seklima.met.no/ (last access: 22 October 2023), 2023. a, b, c, d, e, f
Norwegian Meteorological Institute: Annual precipitation in Svalbard, Hopen and Jan Mayen, filtered. Environmental monitoring of Svalbard and Jan Mayen (MOSJ), https://mosj.no/en/indikator/climate/atmosphere/air-temperature-and-precipitation/ (last access: 4 July 2022), 2022a. a
Norwegian Meteorological Institute: Annual mean temperature in Svalbard, filtered and unfiltered. Environmental monitoring of Svalbard and Jan Mayen (MOSJ), https://mosj.no/en/indikator/climate/atmosphere/air-temperature-and-precipitation/ (last access: 24 August 2023), 2022b. a
Norwegian Meteorological Institute: Ice Service charts, https://cryo.met.no/en/latest-ice-charts (last access: 4 October 2023), 2023. a
Norwegian Polar Institute: Terrengmodell Svalbard (S0 Terrengmodell), https://doi.org/10.21334/npolar.2014.dce53a47, 2014. a, b, c
Norwegian Polar Institute: Norwegian Polar Institute Map Data and Services, Basemap Services [data set], NP_Ortofoto_Svalbard_WMTS_25833, https://geodata.npolar.no/, last access: 11 October 2022. a
NTNU: The Beaufort Wind Scale, https://folk.ntnu.no/oivarn/fld37083/beaufat303.pdf (last access: 24 October 2023), 2023. a, b
Ødegård, R. S. and Sollid, J. L.: Coastal cliff temperatures related to the potential for cryogenic weathering processes, western Spitsbergen, Svalbard, Polar Res., 12, 95–106, https://doi.org/10.3402/polar.v12i1.6705, 1993. a, b
Overduin, P. P., Strzelecki, M. C., Grigoriev, M. N., Couture, N., Lantuit, H., St-Hilaire-Gravel, D., Günther, F., and Wetterich, S.: Coastal changes in the Arctic, Geol. Soc., London, Spec. Publ., 388, 103–129, https://doi.org/10.1144/SP388.13, 2014. a
Overeem, I., Anderson, R. S., Wobus, C. W., Clow, G. D., Urban, F. E., and Matell, N.: Sea ice loss enhances wave action at the Arctic coast, Geophys. Res. Lett., 38, L17503, https://doi.org/10.1029/2011GL048681, 2011. a, b
Prick, A.: Observations of rock temperatures and rock moisture variability in Longyearbyen: implications for cryogenic weathering and rock wall retreat rate, Abstracts of Pace 21: Permafrost and Climate in the 21st Century, Field Workshop Longyearbyen, Svalbard, 8–13 September 2004, P. 16, University Courses on Svalbard, Longyearbyen, 2004. a, b
Radosavljevic, B., Lantuit, H., Pollard, W., Overduin, P., Couture, N., Sachs, T., Helm, V., and Fritz, M.: Erosion and flooding—Threats to coastal infrastructure in the Arctic: a case study from Herschel Island, Yukon Territory, Canada, Estuar. Coast., 39, 900–915, https://doi.org/10.1007/s12237-015-0046-0, 2016. a, b, c, d, e, f
Renette, C., Aalstad, K., Aga, J., Zweigel, R. B., Etzelmüller, B., Lilleøren, K. S., Isaksen, K., and Westermann, S.: Simulating the effect of subsurface drainage on the thermal regime and ground ice in blocky terrain in Norway, Earth Surf. Dynam., 11, 33–50, https://doi.org/10.5194/esurf-11-33-2023, 2023. a, b
Rinke, A., Maturilli, M., Graham, R. M., Matthes, H., Handorf, D., Cohen, L., Hudson, S. R., and Moore, J. C.: Extreme cyclone events in the Arctic: Wintertime variability and trends, Environ. Res. Lett., 12, 094006, https://doi.org/10.1088/1748-9326/aa7def, 2017. a
Rotem, D., Lyakhovsky, V., Christiansen, H. H., Harlavan, Y., and Weinstein, Y.: Permafrost saline water and Early to mid-Holocene permafrost aggradation in Svalbard, The Cryosphere, 17, 3363–3381, https://doi.org/10.5194/tc-17-3363-2023, 2023. a
Rupnik, E., Daakir, M., and Pierrot Deseilligny, M.: MicMac – a free, open-source solution for photogrammetry, Open Geospatial Data, Software and Standards, 2, 1–9, 2017. a
Särkkä, S.: Bayesian Filtering and Smoothing, Cambridge University Press, New York, https://doi.org/10.1017/CBO9781139344203, 2013. a, b
Schmidt, J. U., Etzelmüller, B., Schuler, T. V., Magnin, F., Boike, J., Langer, M., and Westermann, S.: Surface temperatures and their influence on the permafrost thermal regime in high-Arctic rock walls on Svalbard, The Cryosphere, 15, 2491–2509, https://doi.org/10.5194/tc-15-2491-2021, 2021. a, b, c, d, e, f, g
Sessford, E. G., Bæverford, M. G., and Hormes, A.: Terrestrial processes affecting unlithified coastal erosion disparities in central fjords of Svalbard, Polar Res., 34, 24122, https://doi.org/10.3402/polar.v34.24122, 2015. a
Slangen, A. B., Meyssignac, B., Agosta, C., Champollion, N., Church, J. A., Fettweis, X., Ligtenberg, S. R., Marzeion, B., Melet, A., Palmer, M. D., Richter, K., Roberts, C. D., and Spada, G.: Evaluating model simulations of twentieth-century sea level rise. Part I: Global mean sea level change, J. Climate, 30, 8539–8563, https://doi.org/10.1175/JCLI-D-17-0110.1, 2017. a, b
Strzelecki, M. C., Kasprzak, M., Lim, M., Swirad, Z. M., Jaskólski, M., Pawłowskiwski, Ł., and Modzel, P.: Cryo-conditioned rocky coast systems: A case study from Wilczekodden, Svalbard, Sci. Total Environ., 607, 443–453, https://doi.org/10.1016/j.scitotenv.2017.07.009, 2017. a
Student: The probable error of a mean, Biometrika, 6, 1–25, https://doi.org/10.2307/2331554, 1908. a
Svendsen, H., Beszczynska-Møller, A., Hagen, J. O., Lefauconnier, B., Tverberg, V., Gerland, S., Børre Ørbæk, J., Bischof, K., Papucci, C., Zajaczkowski, M., Azzolini, R., Bruland, O., and Wiencke, C.: The physical environment of Kongsfjorden–Krossfjorden, an Arctic fjord system in Svalbard, Polar Res., 21, 133–166, https://doi.org/10.3402/polar.v21i1.6479, 2002. a
Swirad, Z. M. and Young, A. P.: Spatial and temporal trends in California coastal cliff retreat, Geomorphology, 412, 108318, https://doi.org/10.1016/j.geomorph.2022.108318, 2022. a
Takasu, T. and Yasuda, A.: Development of the low-cost RTK-GPS receiver with an open source program package RTKLIB, in: International Symposium on GPS/GNSS, vol. 1, International Convention Center Jeju Korea, 22–25 September 2009. a
Tanski, G., Lantuit, H., Ruttor, S., Knoblauch, C., Radosavljevic, B., Strauss, J., Wolter, J., Irrgang, A. M., Ramage, J., and Fritz, M.: Transformation of terrestrial organic matter along thermokarst-affected permafrost coasts in the Arctic, Sci. Total Environ., 581, 434–447, https://doi.org/10.1016/j.scitotenv.2016.12.152, 2017. a
Walczowski, W. and Piechura, J.: Influence of the West Spitsbergen Current on the local climate, Int. J. Climatol., 31, 1088–1093, https://doi.org/10.1002/joc.2338, 2011. a
Wangensteen, B., Eiken, T., Ødegård, R. S., and Ludvig Sollid, J.: Measuring coastal cliff retreat in the Kongsfjorden area, Svalbard, using terrestrial photogrammetry, Polar Res., 26, 14–21, https://doi.org/10.1111/j.1751-8369.2007.00002.x, 2007. a, b, c
Zagórski, P., Rodzik, J., Moskalik, M., Strzelecki, M., Lim, M., Błaszczyk, M., Promińska, A., Kruszewksi, G., Styszyńska, A., and Malczewski, A.: Multidecadal (1960–2011) shoreline changes in Isbjørnhamna (Hornsund, Svalbard), Polish Polar Res., 36, 369–390, https://doi.org/10.1515/popore-2015-0019, 2015. a
- Abstract
- Introduction
- Study area
- Data and methods
- Results
- Discussion
- Conclusions
- Appendix A: Rock surface temperature monitoring
- Appendix B: Topography-based downscaling of atmospheric reanalysis data and climate change detection
- Appendix C: Trends in climatic parameters for Brøggerhalvøya
- Data availability
- Author contributions
- Competing interests
- Disclaimer
- Acknowledgements
- Financial support
- Review statement
- References