the Creative Commons Attribution 4.0 License.
the Creative Commons Attribution 4.0 License.
 | 22 Oct 2024
Modeling the formation of toma hills based on fluid dynamics with a modified Voellmy rheology
Stefan Hergarten
Toma hills are perhaps the most enigmatic morphological feature found in rock avalanche deposits. While it has been proposed that toma hills might emerge from the fluid-like behavior of rock avalanches, there still seems to be no consistent explanation for their occurrence. This paper presents numerical results based on a modified version of the Voellmy rheology, which was recently developed to explain the long runout of rock avalanches. In contrast to the widely used original version, the modified Voellmy rheology defines distinct regimes of Coulomb friction at low velocities and velocity-dependent friction at high velocities. When movement slows down, returning to Coulomb friction may cause a sudden increase in friction. Material accumulates in the region upstream of the point where this happens. In turn, high velocities may persist for some time in the downstream and lateral ranges, ultimately resulting in a thin deposit layer. In combination, both processes generate more or less isolated hills with shapes and sizes similar to those of toma hills found in real rock avalanche deposits. Thus, the modified Voellmy rheology suggests a simple mechanism for the formation of toma hills.
- Article
(9945 KB) - Full-text XML
- BibTeX
- EndNote


Toma hills are cone-, pyramid-, or roof-shaped hills consisting mainly of landslide material (Abele, 1974). While toma hills seem to be more or less isolated, they are typically clustered. In the European Alps, such structures have been documented in the Rhine Valley close to Domat/Ems (Abele, 1974), at Fern Pass (Prager et al., 2006), in Almtal (van Husen et al., 2007), in Obernberg (Ostermann et al., 2012), at Eibsee (Ostermann and Prager, 2016), and at Pragser Wildsee (Ostermann et al., 2020).
The formation of toma hills is still enigmatic. Results from dating (e.g., Ivy-Ochs et al., 2009; Ostermann et al., 2012) refute any effects of glaciation. Since the deposits of rock avalanches are typically hummocky, it makes sense to assume that toma hills are already formed during emplacement and are not the result of later modification. Ostermann et al. (2012) have discussed the occurrence of transverse ridges and toma hills in the valley of Obernberg in the context of the fluid-like behavior of rock avalanches. Besides the potential occurrence of waves and surges, the collapse of this fluid-like behavior below a minimum required kinetic energy level also played a part in this discussion.
However, there is still no direct evidence that toma hills emerge from the fluid-like behavior of rock avalanches. Several laboratory experiments on granular flow have been conducted, with a focus on rock avalanches (e.g., Pouliquen et al., 1997; Shea and van Wyk de Vries, 2008; Paguican et al., 2014; Valderrama et al., 2018), and have been partly able to predict the occurrence of hummocky topographies and ridges. Cone- or pyramid-shaped hills, however, have not been found. The same holds for particle-based numerical simulations (e.g., Campbell et al., 1995; Thompson et al., 2010; Mead and Cleary, 2015; Johnson et al., 2016) and for continuum simulations based on the fundamental theory proposed by Savage and Hutter (1989).
The lack of direct evidence from granular dynamics has motivated alternative approaches. More and Wolkersdorfer (2019) revisited the idea of a long-term modification of the topography via internal erosion. Knapp et al. (2022) proposed a concept involving an already-existing lake, which may have been formed by a previous rock avalanche. This idea is, however, still on a qualitative level and appears to be site-specific.
This study takes up the idea that toma hills emerge from the complex, fluid-like behavior of rock avalanches. It starts with the modification of the Voellmy rheology (Voellmy, 1955; Salm, 1993) proposed by Hergarten (2024c). The Voellmy rheology was originally developed for snow avalanches, but nowadays, it is also applied widely to rock avalanches. In its original form, however, it is not able to reproduce the long runout of large rock avalanches without assuming an artificially low coefficient of friction. The modified rheology reproduces the long runout reasonably well without assuming specific processes that reduce friction, such as frictional heating (Erismann, 1979; de Blasio and Elverhøi, 2008; Lucas et al., 2014) or acoustic fluidization (Johnson et al., 2016).
The existence of two distinct regimes of granular flow is the main idea behind the modified Voellmy rheology. The ideas of Voellmy (1955) are adopted for high velocities, resulting in an effective friction that is proportional to the square of the velocity. In turn, Coulomb friction is assumed at low velocities. The velocity at which the transition occurs was derived from reinterpreting the concept of random kinetic energy (Buser and Bartelt, 2009; Bartelt and Buser, 2010). As a key point, friction may be much lower in the fast regime than in the slow regime. In this case, friction may increase suddenly when movement slows down and returns to Coulomb friction. In this sense, the modified Voellmy rheology is a perfect starting point for further elaborating on ideas about a fluid dynamical origin of toma hills, as discussed by Ostermann et al. (2012).
There was no specific strategy for selecting a suitable study site except for keeping it simple. As a first step, the model for rockslide disposition proposed by Hergarten (2012) was applied to a given topography – specifically, a digital terrain model of Tyrol with a mesh width of 5 m (Land Tirol, 2023). The model was only used for detecting locations where a large volume could be detached along a sufficiently steep failure surface. This model is a statistical model of progressive failure and involves only two parameters, smin and smax. These two values define the range of slopes over which the probability of failure increases from 0 to 1, whereby the values used by Argentin et al. (2021) (smin=1; smax=5) were implemented in the present study. The most recent version of the model was used, which also takes into account the local orientation of the failure surface during progressive failure. This modification prevents the failure of entire mountains in multiple directions and thus reduces the number of obviously unrealistic detached volumes.
The valley of Obernberg was selected as a study site by screening the spatial distribution of 106 potential events visually. Figure 1 shows the topography, including the predicted area of detachment (red), where the largest predicted volume (about 8×10⁷ m3) was chosen. It should be kept in mind that this is only the initial state of the simulation of the runout performed in this study and not a result. Since the model does not take into account the existence and orientation of faults or any other properties of the rocks, we cannot tell whether such a rockslide is geologically possible at this location or even assign a probability to it.
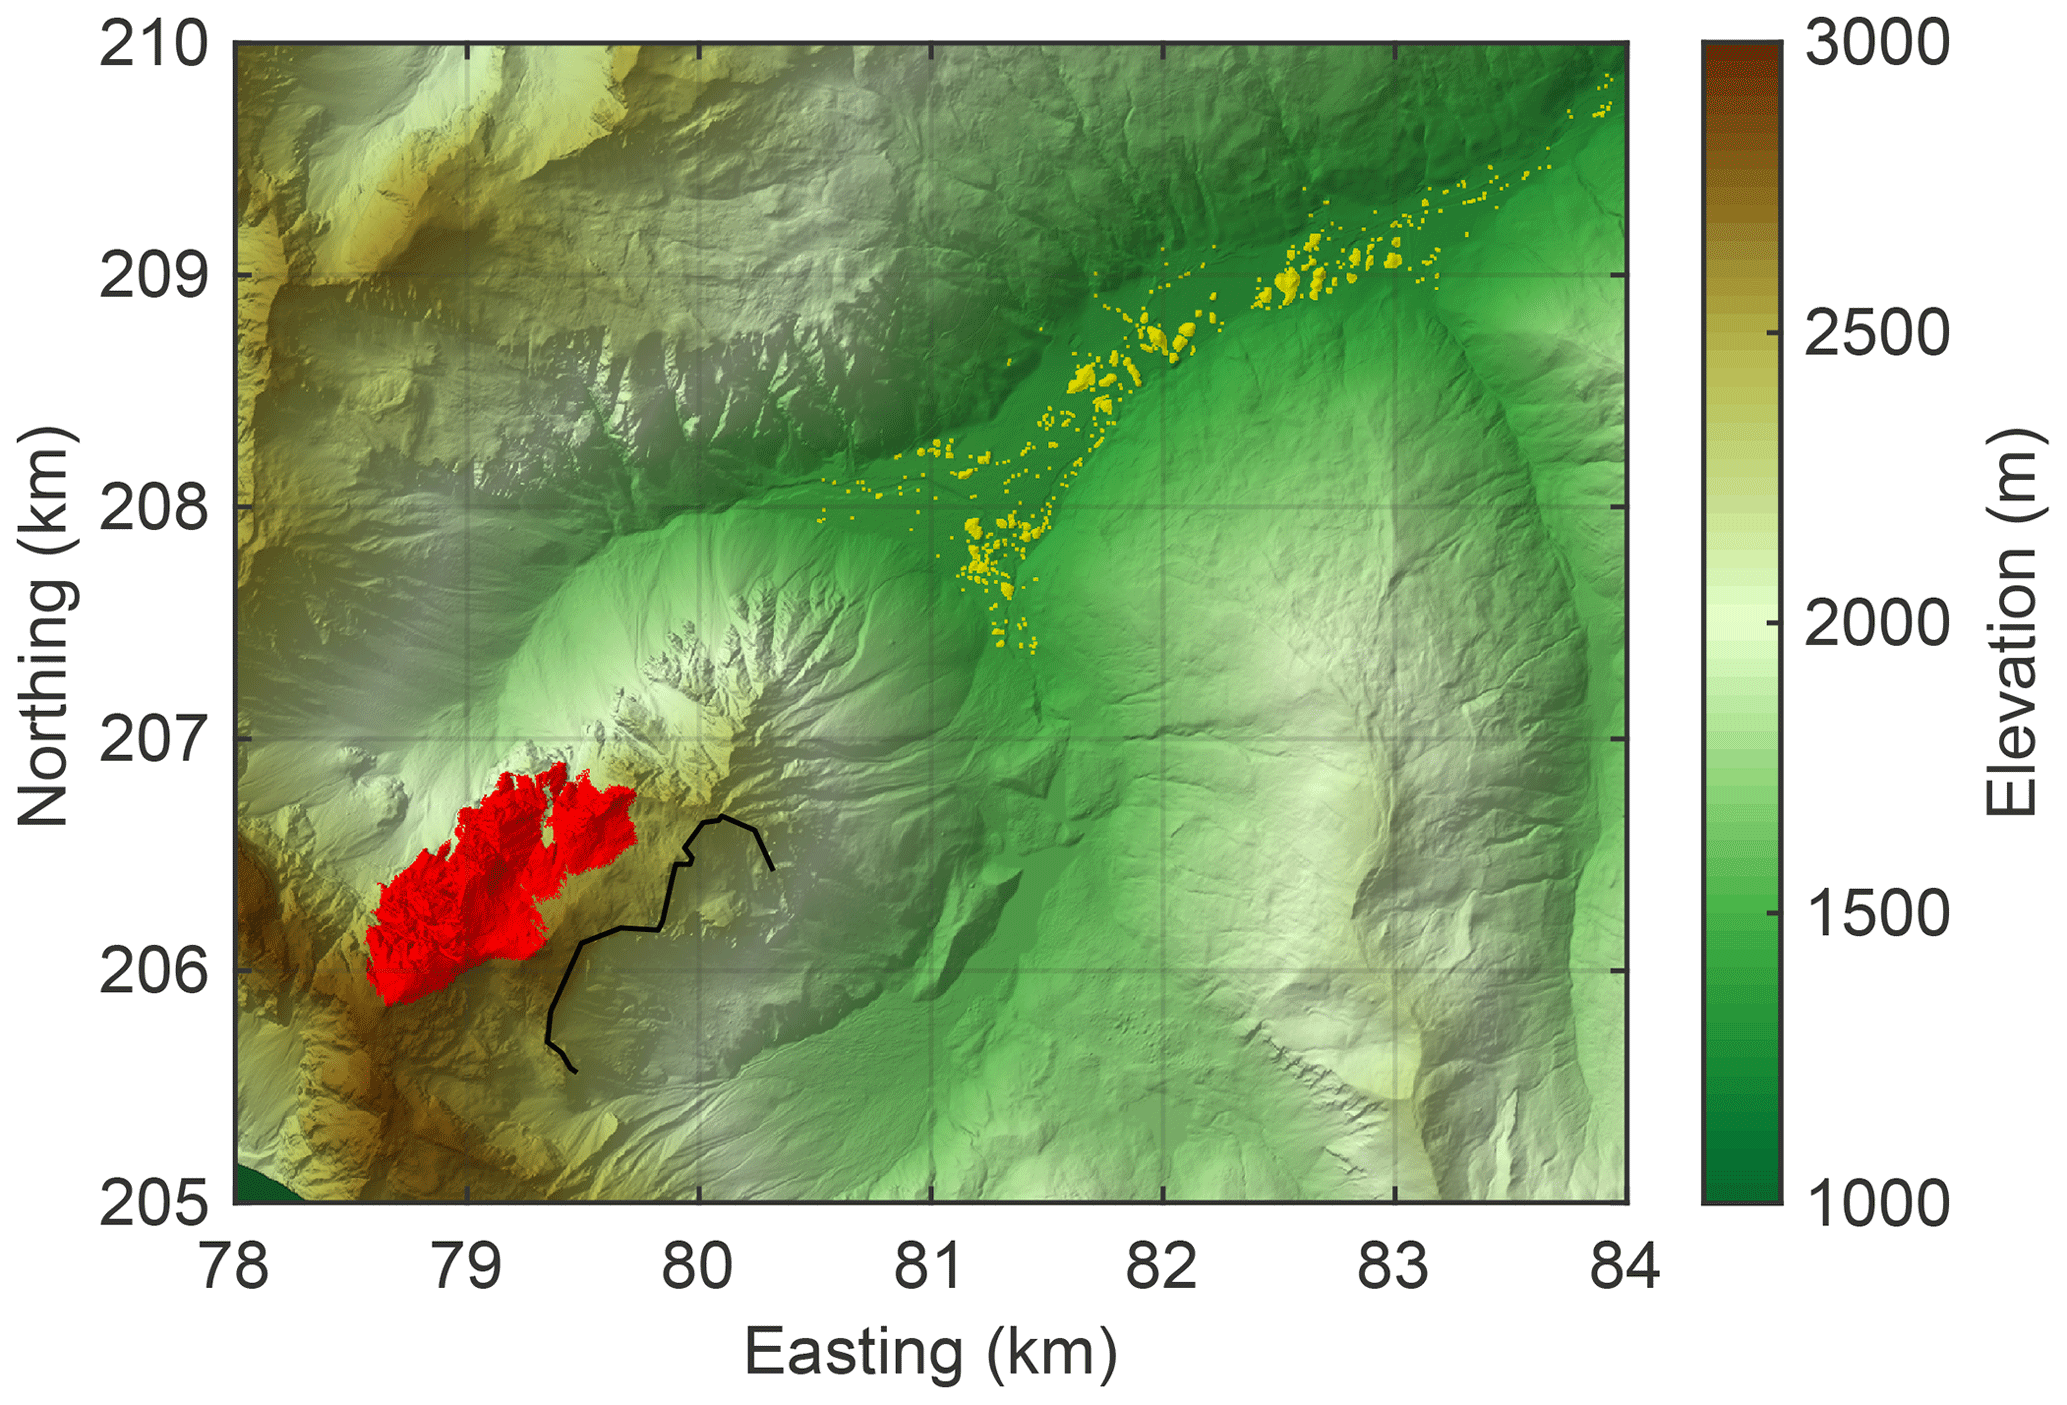
Figure 1The study site, located in the valley of Obernberg. The red region depicts the assumed detachment area. The black line illustrates the scarp of the real rock avalanche (redrawn from Ostermann et al., 2012). Yellow patches indicate removed local maxima. Coordinates refer to EPSG:31254 (MGI/Austria GK West).
While the chosen initial state is somewhat arbitrary, the valley of Obernberg is particularly interesting because it was subject to a rock avalanche in the past, which was investigated in detail by Ostermann et al. (2012). Since the valley already contains toma hills, its morphology should, in principle, be suitable for generating toma hills. The assumed detachment area is in a different branch of the valley than the original event. An advantage of considering a rockslide in the different branch is that the existing deposits can interfere with the simulated rock avalanche only in the lower part of the valley, whereas the original branch was reshaped considerably by the deposits of the real rockslide. While the lower part of the valley contains only a small fraction of the deposited volume, it hosts the toma hills. Therefore, the existing hills were removed before simulating the rock avalanche. For this purpose, closed contour lines in the valley were computed at 0.25 m intervals. All points within these contour lines with an elevation higher than the contour line were replaced by minimal surfaces (yellow areas in Fig. 1). In combination with the closed contour lines, this procedure is almost the same as clipping the areas inside the contour lines to the elevations of the respective contour lines, but it yields a slightly smoother transition at the edges.
Version 2 of the model MinVoellmy (Hergarten, 2024e) was used for simulating the rock avalanche. As a modification of version 1, described by Hergarten (2024d), it uses thickness-weighted central difference quotients for the gradient of the surface. One-sided difference quotients toward the steepest descent are only used at local maxima. This version was also included in the model intercomparison by Wirbel et al. (2024).
The model MinVoellmy implements the modification of the Voellmy rheology proposed by Hergarten (2024c). Friction is represented by shear stress, expressed as
at the bed. The upper row describes Coulomb friction with the coefficient μ, where σ represents the normal stress. The lower row describes velocity-dependent friction, as originally proposed by Voellmy (1955) for snow, where ρ, g, and v represent density, gravity, and vertically averaged velocity, respectively. The parameter ξ refers to the roughness of the bed.
In its original form, the Voellmy rheology assumes that the shear stress is the sum of the two terms in Eq. (1). Defining two distinct regimes of friction separated by a crossover velocity (vc), which depends on the thickness (h) of the mobile layer, was the central idea behind the modified Voellmy rheology. Hergarten (2024c) derived a particular relation,
by reinterpreting the random-kinetic-energy model (Buser and Bartelt, 2009; Bartelt and Buser, 2010), which describes the supply of kinetic energy from random particle motion and its consumption. Equation (2) requires a factor of proportionality, which is defined by vc at h=1 m (for a given value of ξ) in MinVoellmy. All occurrences of ρ finally cancel out since driving gravitational forces and normal stress (σ) are proportional to ρ. Thus, MinVoellmy requires three physical parameters (μ, ξ, and vc at h=1 m).
Several simulations were performed with different values of ξ and vc, while μ=0.75 was kept constant as a typical value for the Coulomb friction of rocks. Constant time increments of δt=0.01 s were used, ensuring that the transport distance at each step was much smaller than the grid spacing and thus maintaining numerical stability according to the Courant–Friedrichs–Lewy criterion. As a further technical setting, it was assumed that layers thinner than 1 mm cannot move.
3.1 Morphology of the deposits
The parameter combination of ξ=500 m s−2 and vc=4 m s−1 was selected for an in-depth analysis. The influence of these two parameters will be investigated in Sect. 3.4. Figure 2 shows the final deposits, which extend about 1 km further downstream than the deposits of the real rock avalanche described by Ostermann et al. (2012). Figure 3 shows a close-up of the deposits in the valley, with contour lines of peaks with more than 3 m of prominence. The respective outermost closed contour line defines the base for the height, and the inner contour lines are plotted at intervals of 2 m.
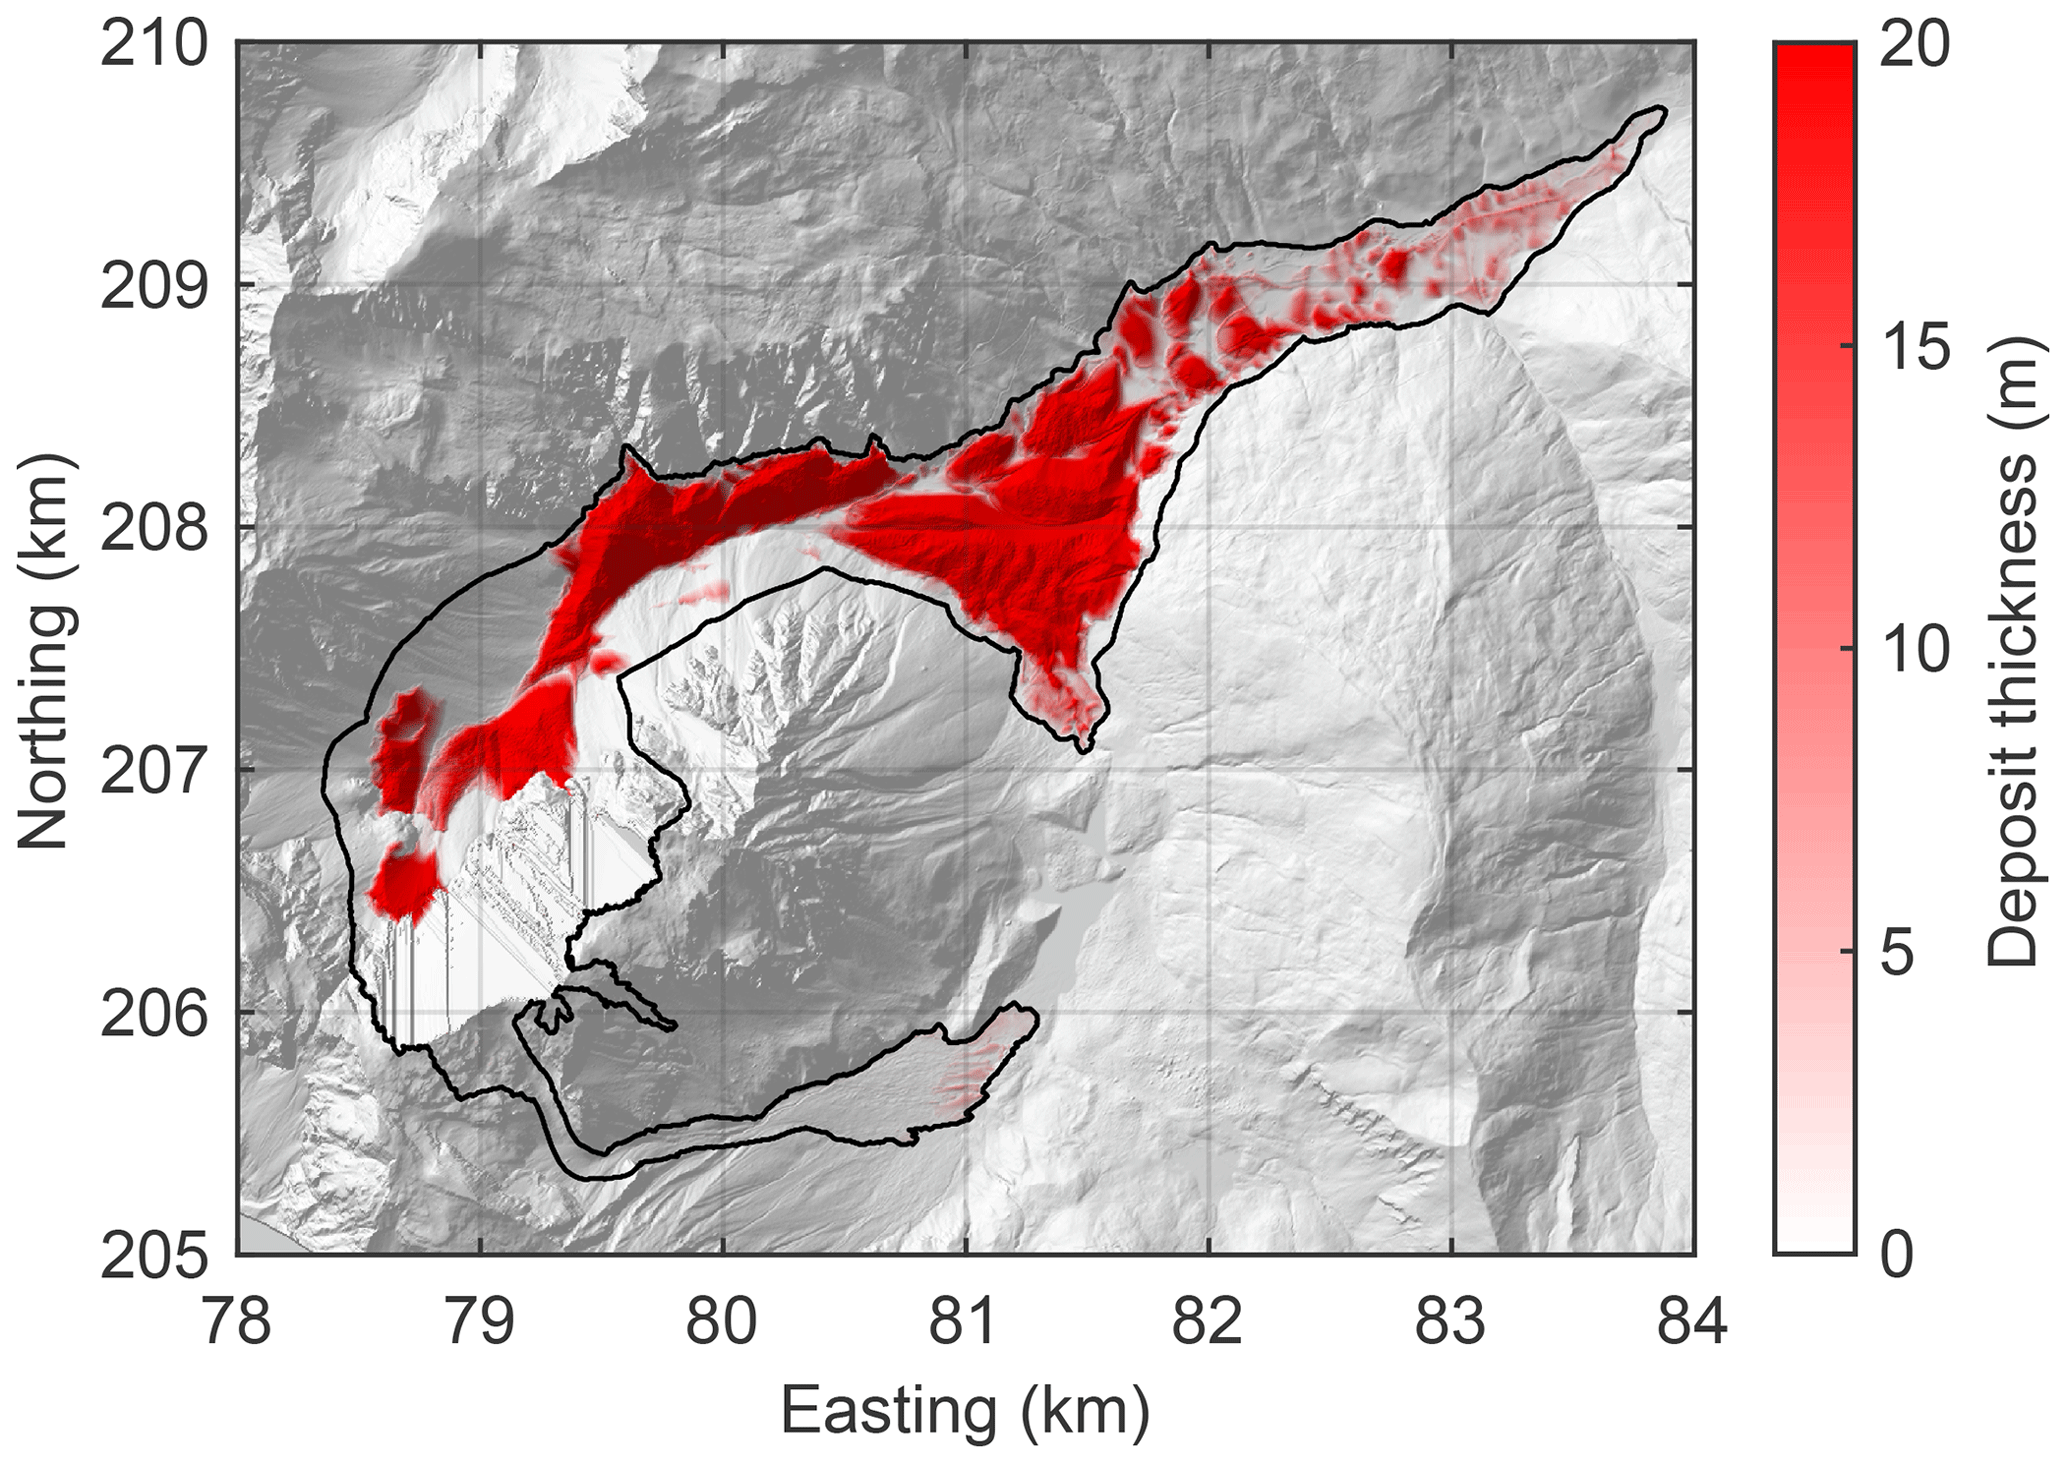
Figure 2Final deposit thickness. The black outline encloses the region affected by the rock avalanche.
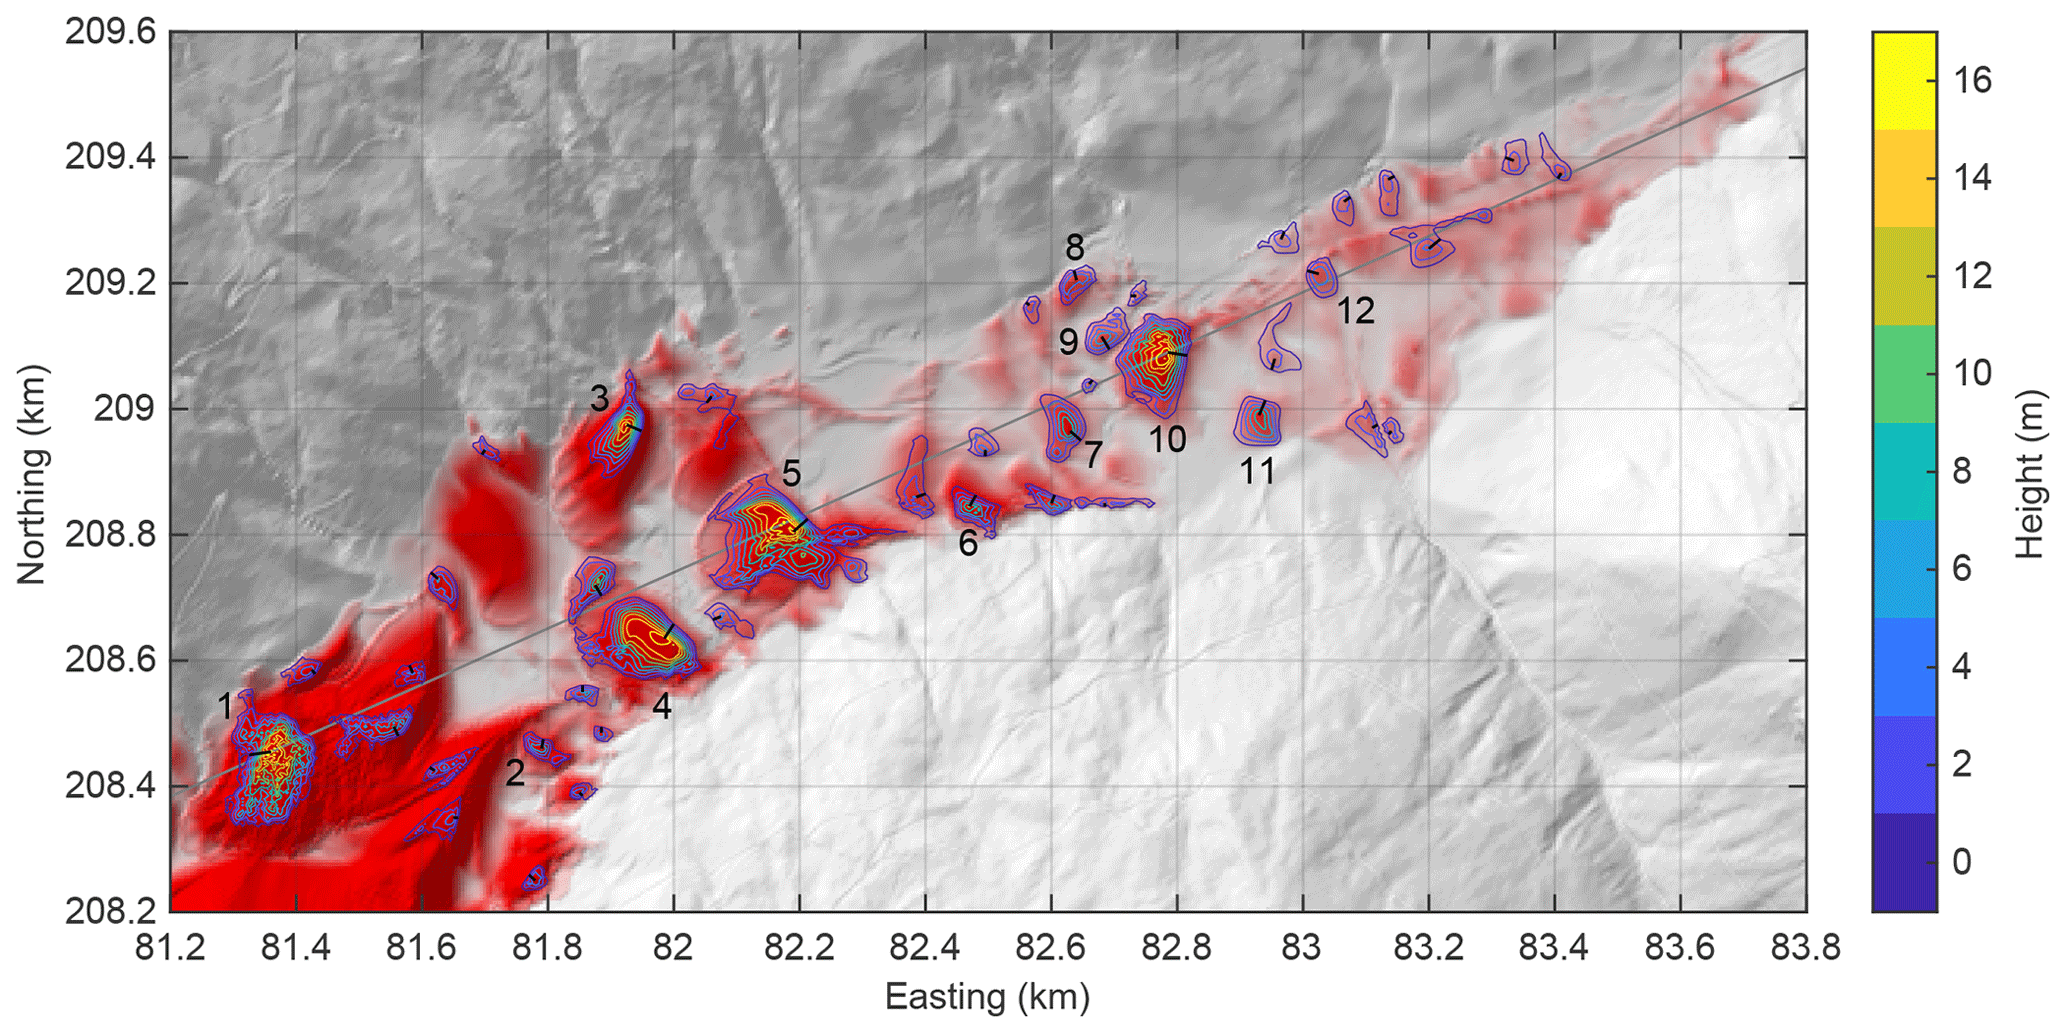
Figure 3Morphology of the deposits in the valley. The colored lines represent closed elevation contour lines drawn at 2 m intervals around hills with at least 3 m of prominence, with the outermost contour line defining the base level. The red regions indicate the thickness of the deposits, as shown in Fig. 2. The black and gray lines, along with the labels, correspond to Figs. 5–7.
Figure 4 shows the results of the same analysis for the real topography. The biggest hills are obviously smaller than those obtained in the simulation. While the maximum prominence is about 19 m in the simulated deposits, it is only about 12 m in the real topography. However, a two-sample Kolmogorov–Smirnov test does not reveal any differences between the statistical distributions of the prominence values, with a p value of 56 %. Thus, it cannot be concluded whether the simulation simply yields more hills compared to the real topography (42 vs. 17) or whether the hills are also systematically larger.
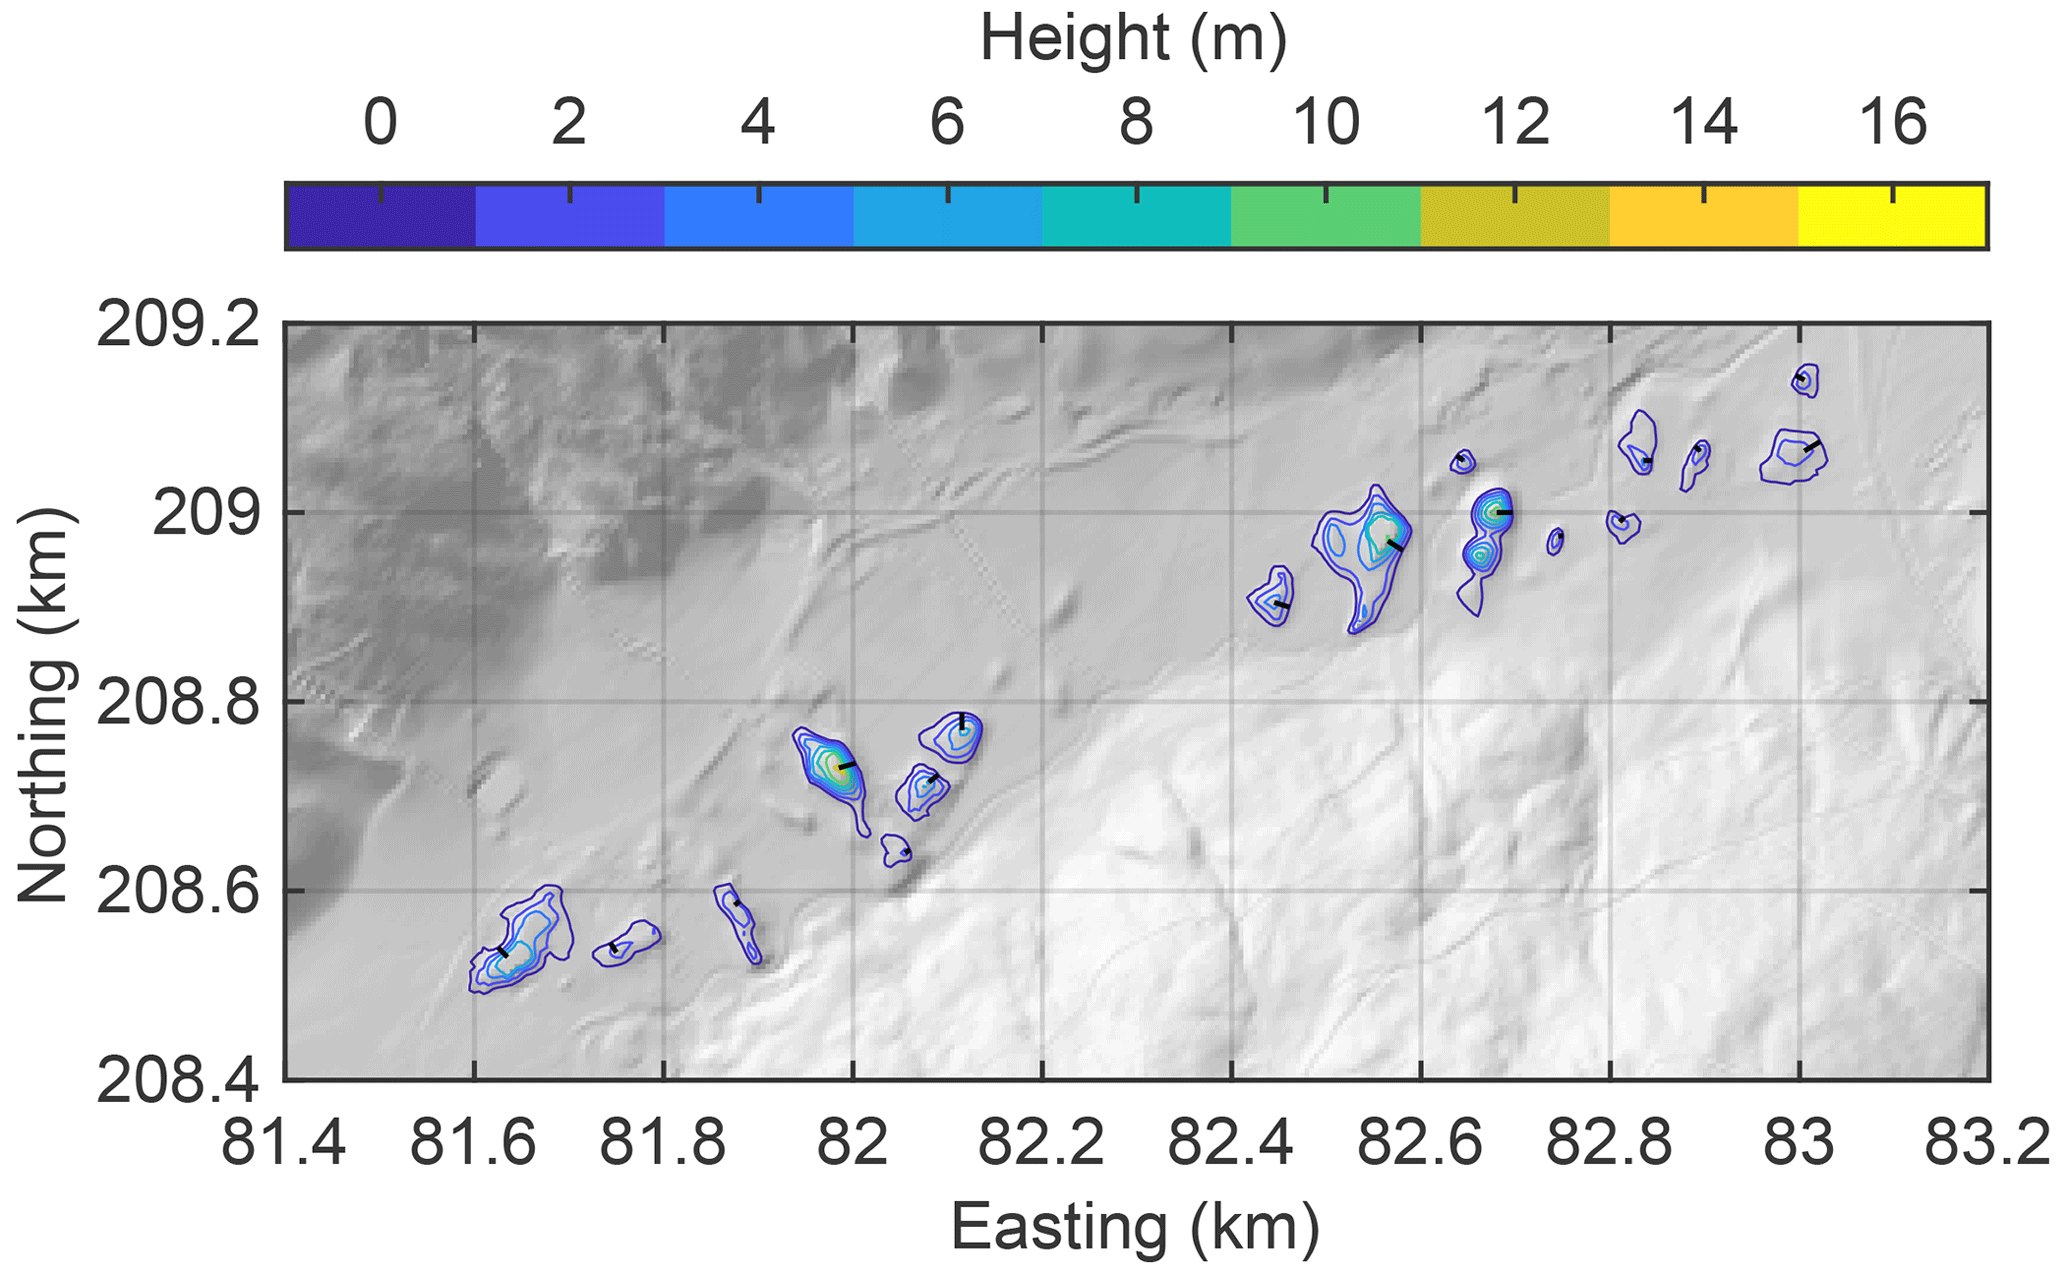
Figure 4Hill structures in the real topography. The colored lines represent closed contour lines drawn at 2 m intervals, with the outermost contour line defining the base level. The black lines correspond to Fig. 5.
Comparing the shapes in plan view is, however, difficult beyond the visual impression of some similarity. To investigate the cross-sectional geometry, the prominence of each hill is considered in relation to two different radii. One of them is the minimum radius, defined by the shortest distance from the peak to the outermost contour line, illustrated by black lines in Figs. 3 and 4. The second radius is the mean radius, which is obtained by converting the outermost contour line into a circle of equal area. Two-sample Kolmogorov–Smirnov tests do not reveal any differences between the statistical distributions of the simulated and real radii, with p values of 33 % (minimum radius) and 75 % (mean radius).
Figure 5 shows the prominence of all hills vs. the two radii. The straight lines were obtained by fitting linear functions through the origin. While individual hills scatter strongly around these lines, the lines themselves agree strikingly well between simulated and real hills. This means that the simulated hills have practically the same steepness as the real hills on average. The respective mean slopes are 0.46 in the steepest direction (minimum radius) and 0.23 on average (mean radius).
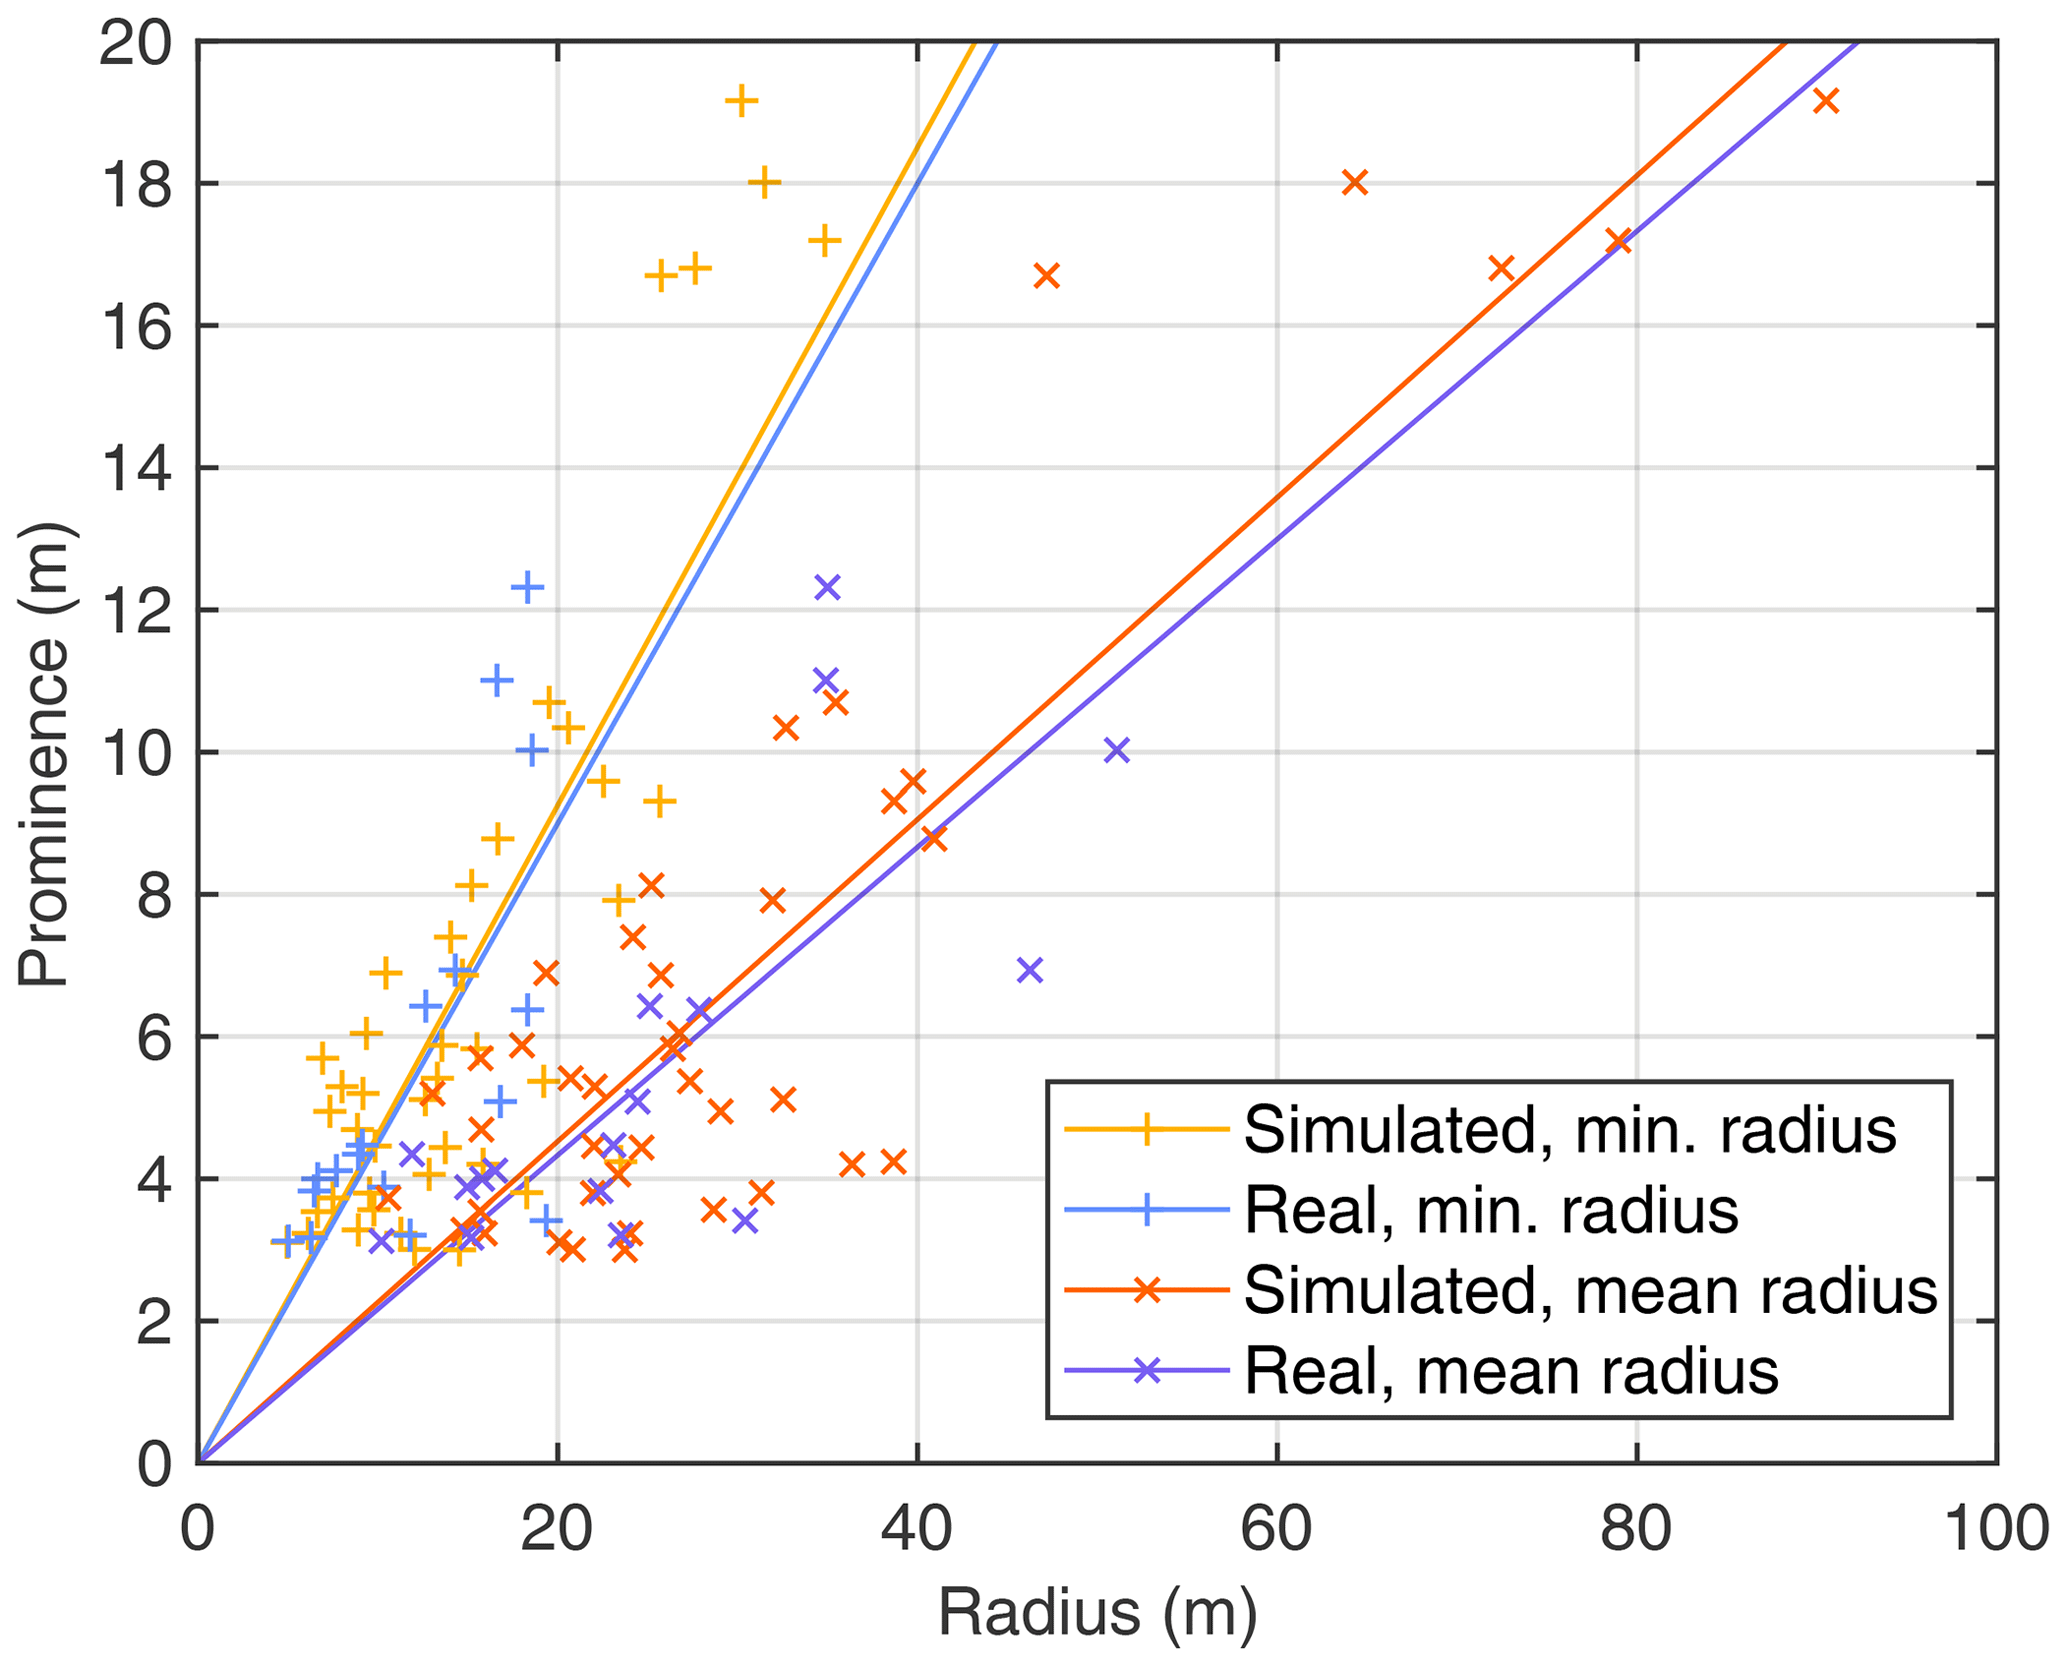
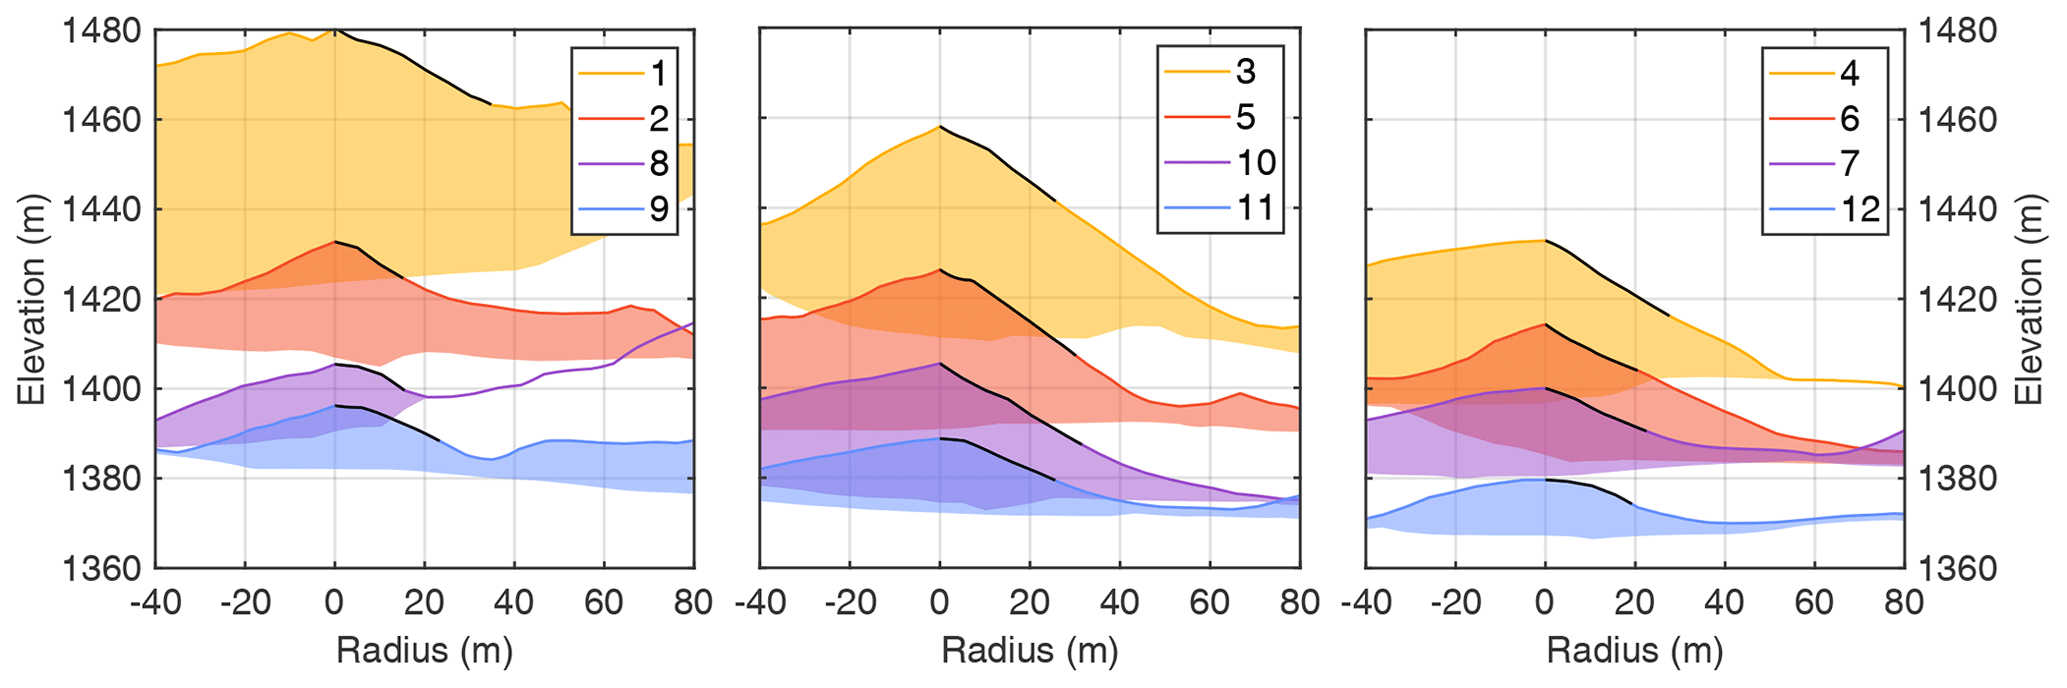
Figure 6 shows profiles of the numbered hills from Fig. 3 in the steepest direction. As a first observation, some profiles (hills 3, 4, and 6) contain a more or less straight segment that is considerably longer than the minimum radius, illustrated by the black lines. This property is due to the irregular shape of the hills and emphasizes the role of prominence as a lower bound for the height of the respective hill. For the two steepest hills (hills 3 and 5), the slope of the straight segment is close to the coefficient of Coulomb friction, μ=0.75. This value defines the maximum stable slope. Thus, some flanks of the hills are at the limit of stability. The majority, however, are less steep, although some are also partly straight.
3.2 Are the hills isolated?
As a second characteristic property beyond surface morphology, Abele (1974) described toma hills as isolated objects. However, the question of what this means exactly is not trivial. While toma hills typically look like islands standing out from an alluvial plain, some clustering is often found. Ostermann et al. (2012) even found connected hills forming ridges in the valley of Obernberg, which can partly be recognized in Fig. 4. These observations raise the question of whether toma hills are typically isolated patches of rockslide material or outcrops of a continuous layer in the subsurface. Resistivity measurements obtained in the Rhine Valley by Knapp et al. (2022) could not answer this question uniquely but suggest that there may be some rockslide material beneath the alluvial deposits.
As already visible in Fig. 3, the hills generated by the model are not just hummocks at the surface of a thick layer of rockslide material. There are even areas between the hills with very little thickness. However, several hills are not clearly separated. Some of the connections are like narrow bridges. Revisiting Fig. 6 confirms that the thickness between the hills is irregular. Hills 4 and 8 approach a very small deposit thickness in their steepest direction. For the majority of the hills, however, a thickness of several meters persists at the foot.
Figure 7 shows a longitudinal valley profile drawn through hills 1 and 10. Hill 4, which is crossed at a saddle between two local maxima, looks quite isolated in this direction. Hills 5 and 10 are not isolated in the profile direction but are much higher than the minimum deposit thicknesses between the respective hills and their neighbors. In turn, the lower part of the profile is characterized by a more continuous deposit layer, which is partly related to the road.
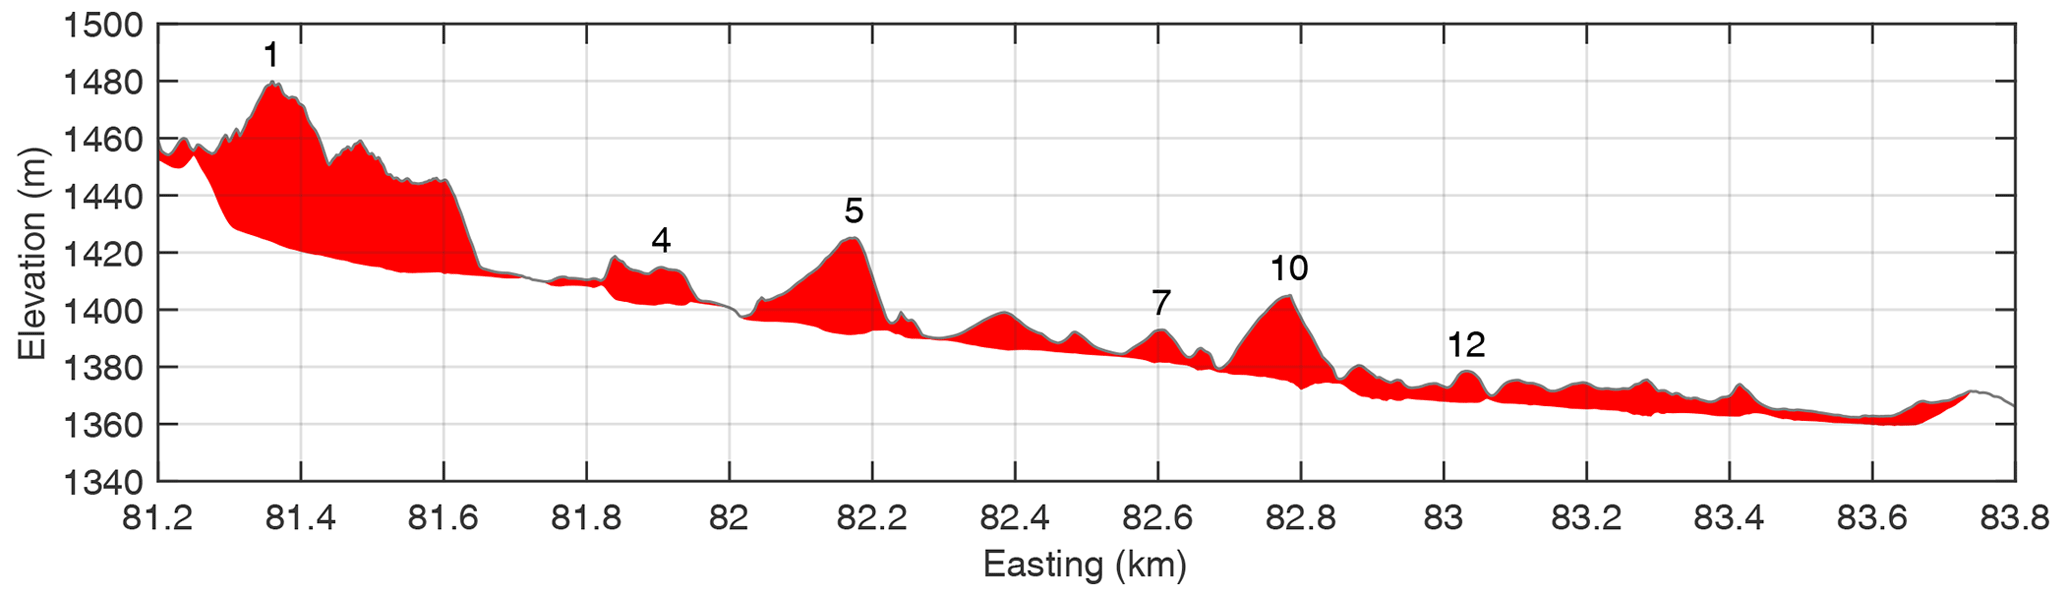
Figure 7A longitudinal valley profile drawn through hills 1 and 10. For better identification with Fig. 3, easting is plotted instead of length along the profile. Elevation is exaggerated by a factor of 4.
Formally, however, the hills are not separated clearly in terms of deposit thickness. Figure 8 shows the minimum thickness around each hill, defined by the lowest thickness contour line around each hill that does not include another hill. This means that the respective hill would be isolated completely if we removed this thickness. The lowest thickness is 2.9 m, and only 3 out of the 42 hills are separated by a thickness less than 5 m. This separation is weaker than what can be expected from the previous considerations. It is, however, related to the complex pattern of the deposits already recognized in Fig. 3. Some hills are quite close to each other and are thus not separated clearly, but narrow, ridge-like connections also contribute to the weak separation.
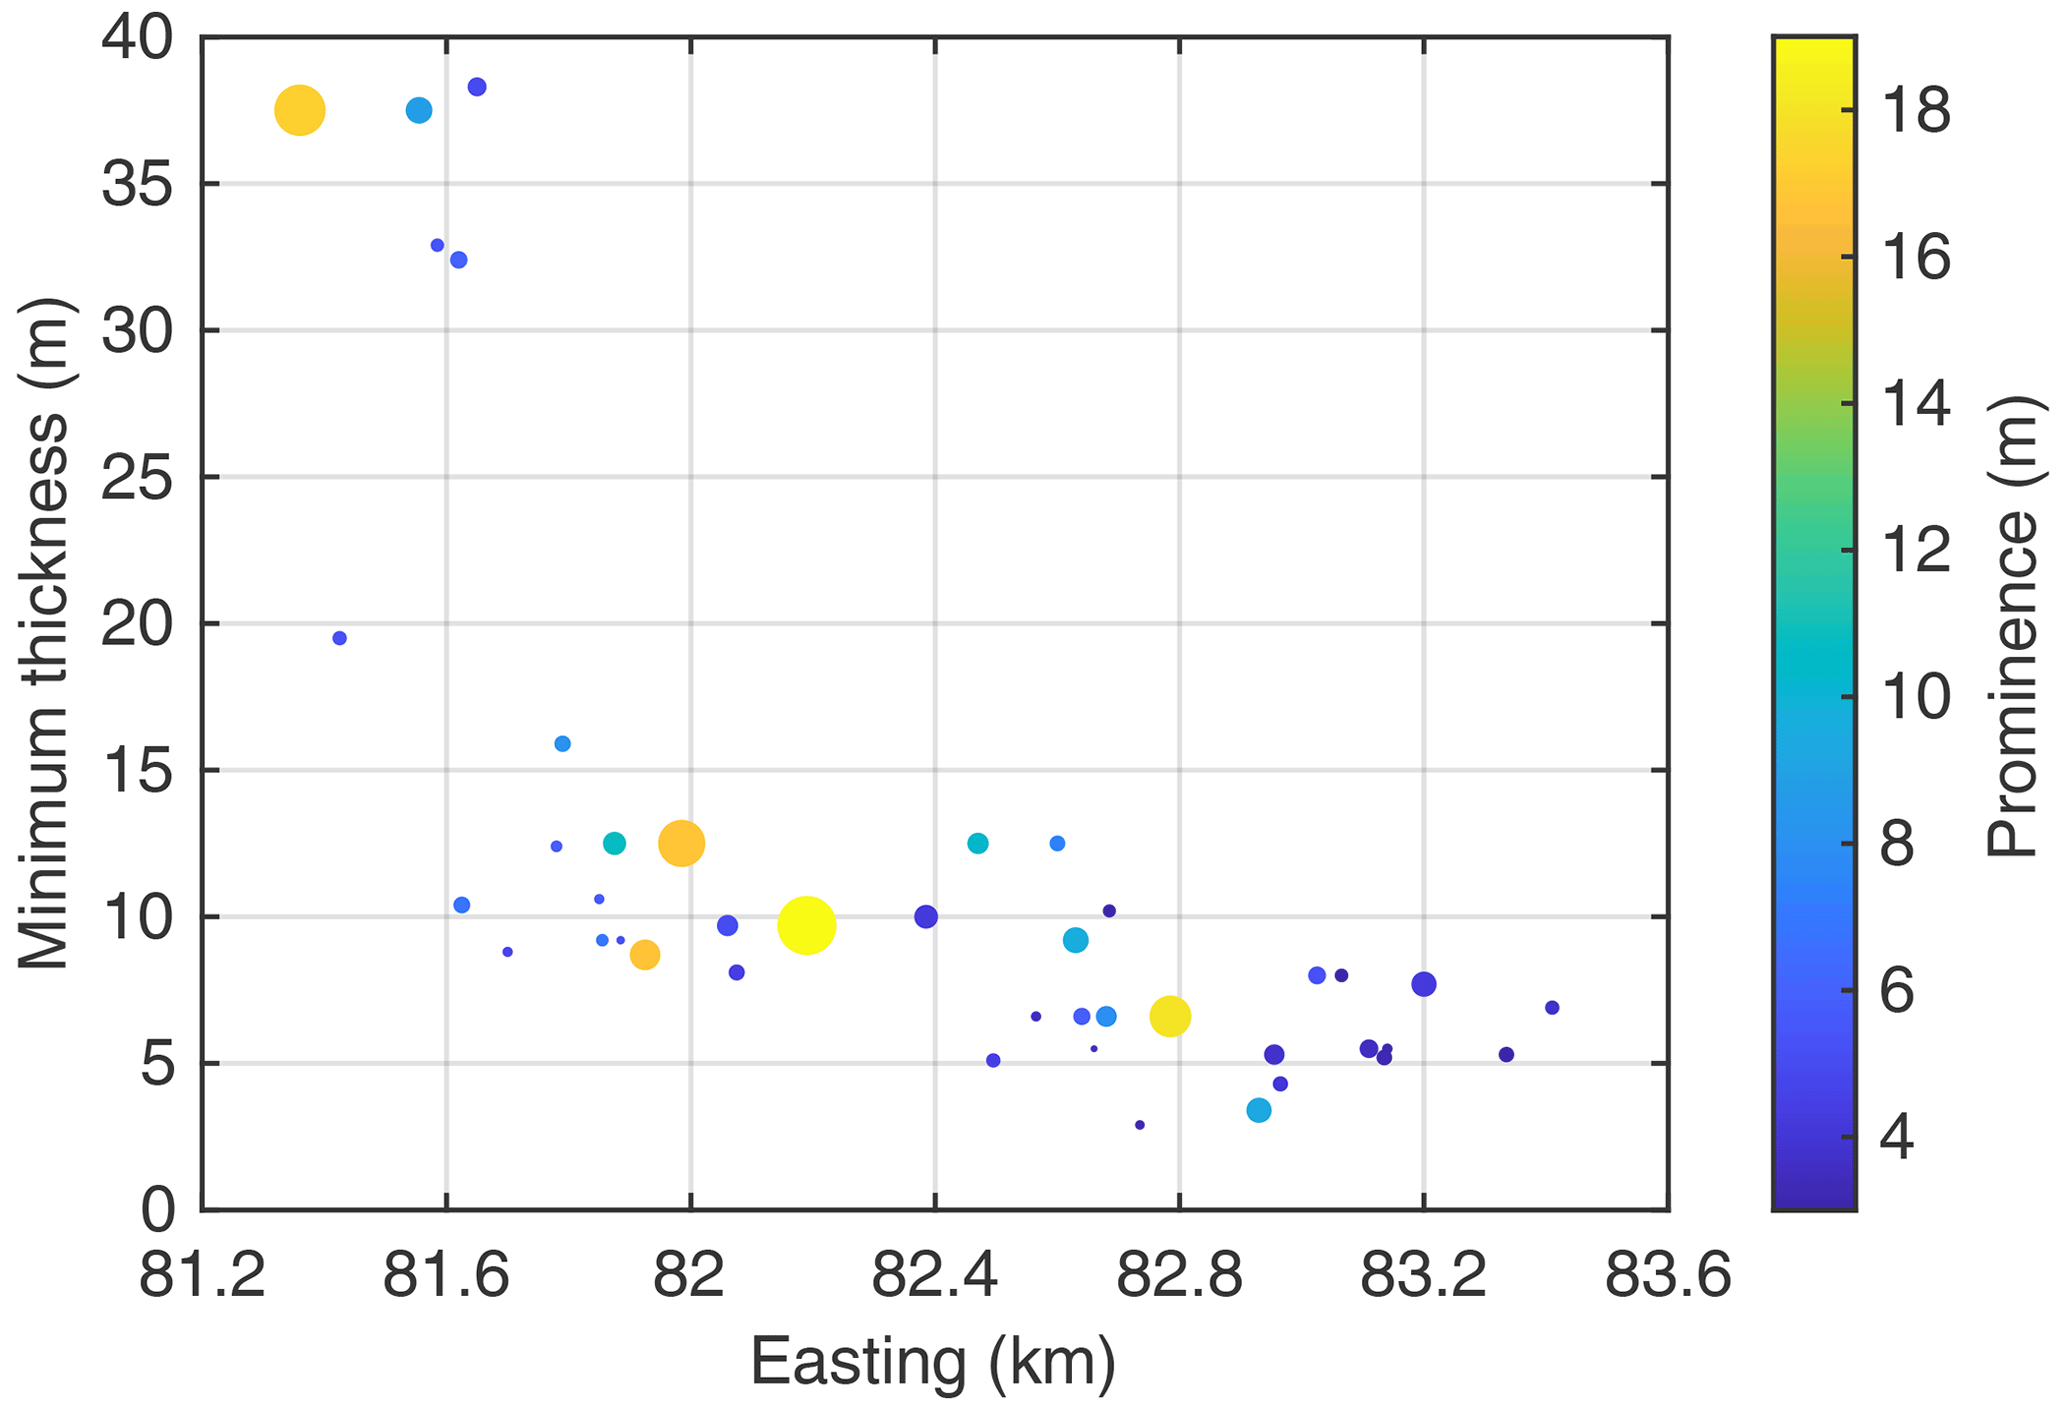
Figure 8Minimum deposit thickness around each hill. Colors indicate prominence, and marker sizes represent the area of prominence, defined by the area within the respective outermost contour line shown in Fig. 3.
Overall, the model predicts more or less isolated hills. This finding is not inconsistent with previous knowledge about toma hills. Taking into account the fact that the uppermost rockslide deposits may be reworked by fluvial processes or even anthropogenically, validating the results of the model quantitatively may be challenging.
3.3 The mechanism of formation
The formation of hills is closely related to the discontinuity in friction at the velocity (vc) assumed in the model. If the fluid-like behavior collapses at any point, friction increases suddenly, which causes a rapid decrease in velocity and, ultimately, some kind of traffic jam upstream of the respective point.
Figure 9 illustrates at which time the fluid-like behavior collapses in a section of the valley. Overall, this collapse proceeds downstream due to the low friction when v≥vc. If friction were high, particles would decelerate strongly when moving downstream, which could cause the collapse to start at the front and propagate upstream. Then, the entire mass could accumulate in a small area.
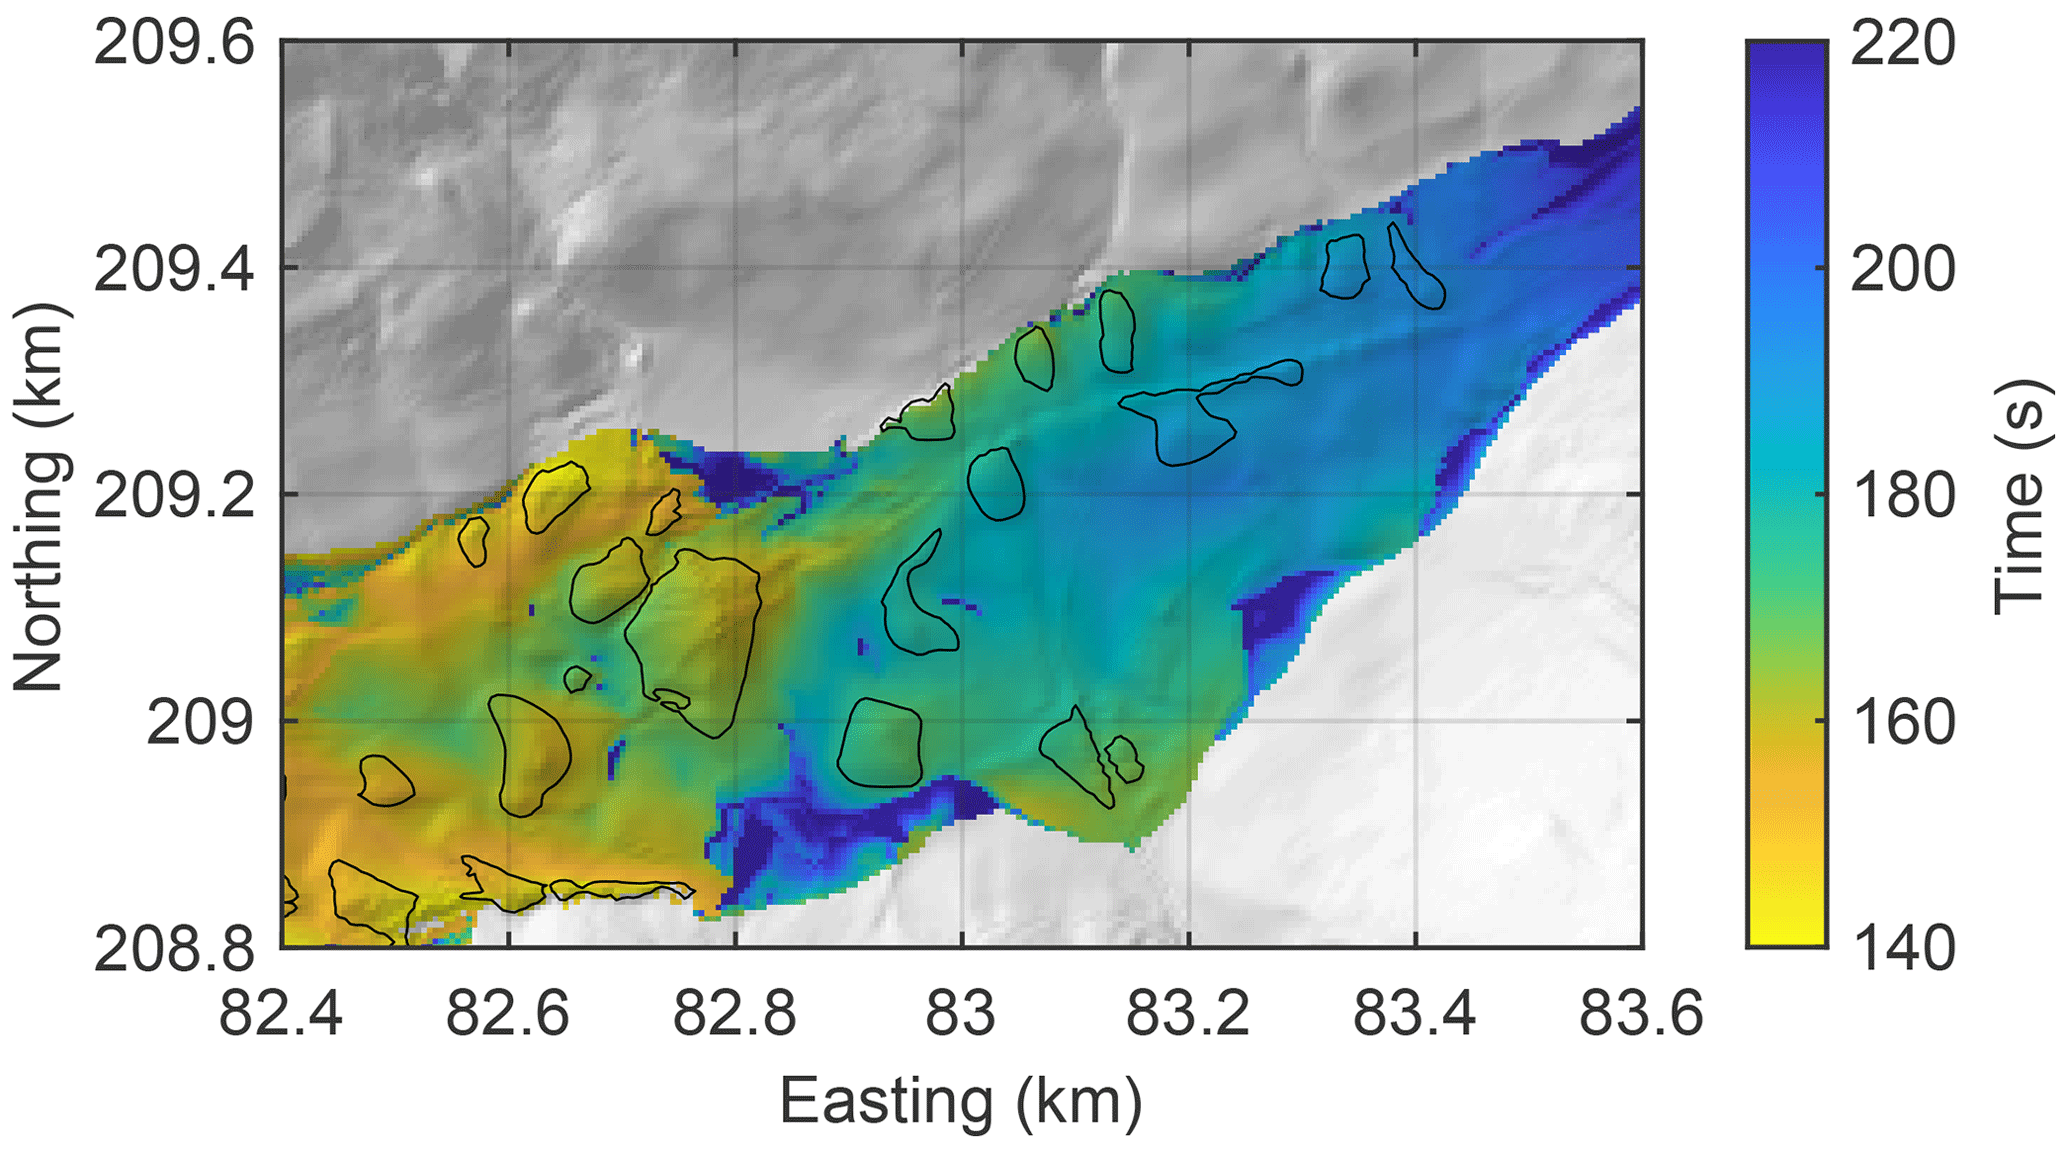
Figure 9Time of collapse of the fluid-like behavior. The black lines represent the outlines of the hills shown in Fig. 3.
Since this is not the case here, the formation of hills hinges on local variations in the time of collapse. As expected, the hills in Fig. 9 are primarily formed in zones of early collapse or slightly upstream. Local minima of the time of collapse are particularly relevant here. The yellow points in Fig. 10 represent such local minima, with a (negative) prominence of at least 1 s. Thus, the collapse spreads from these points in all directions for at least 1 s.
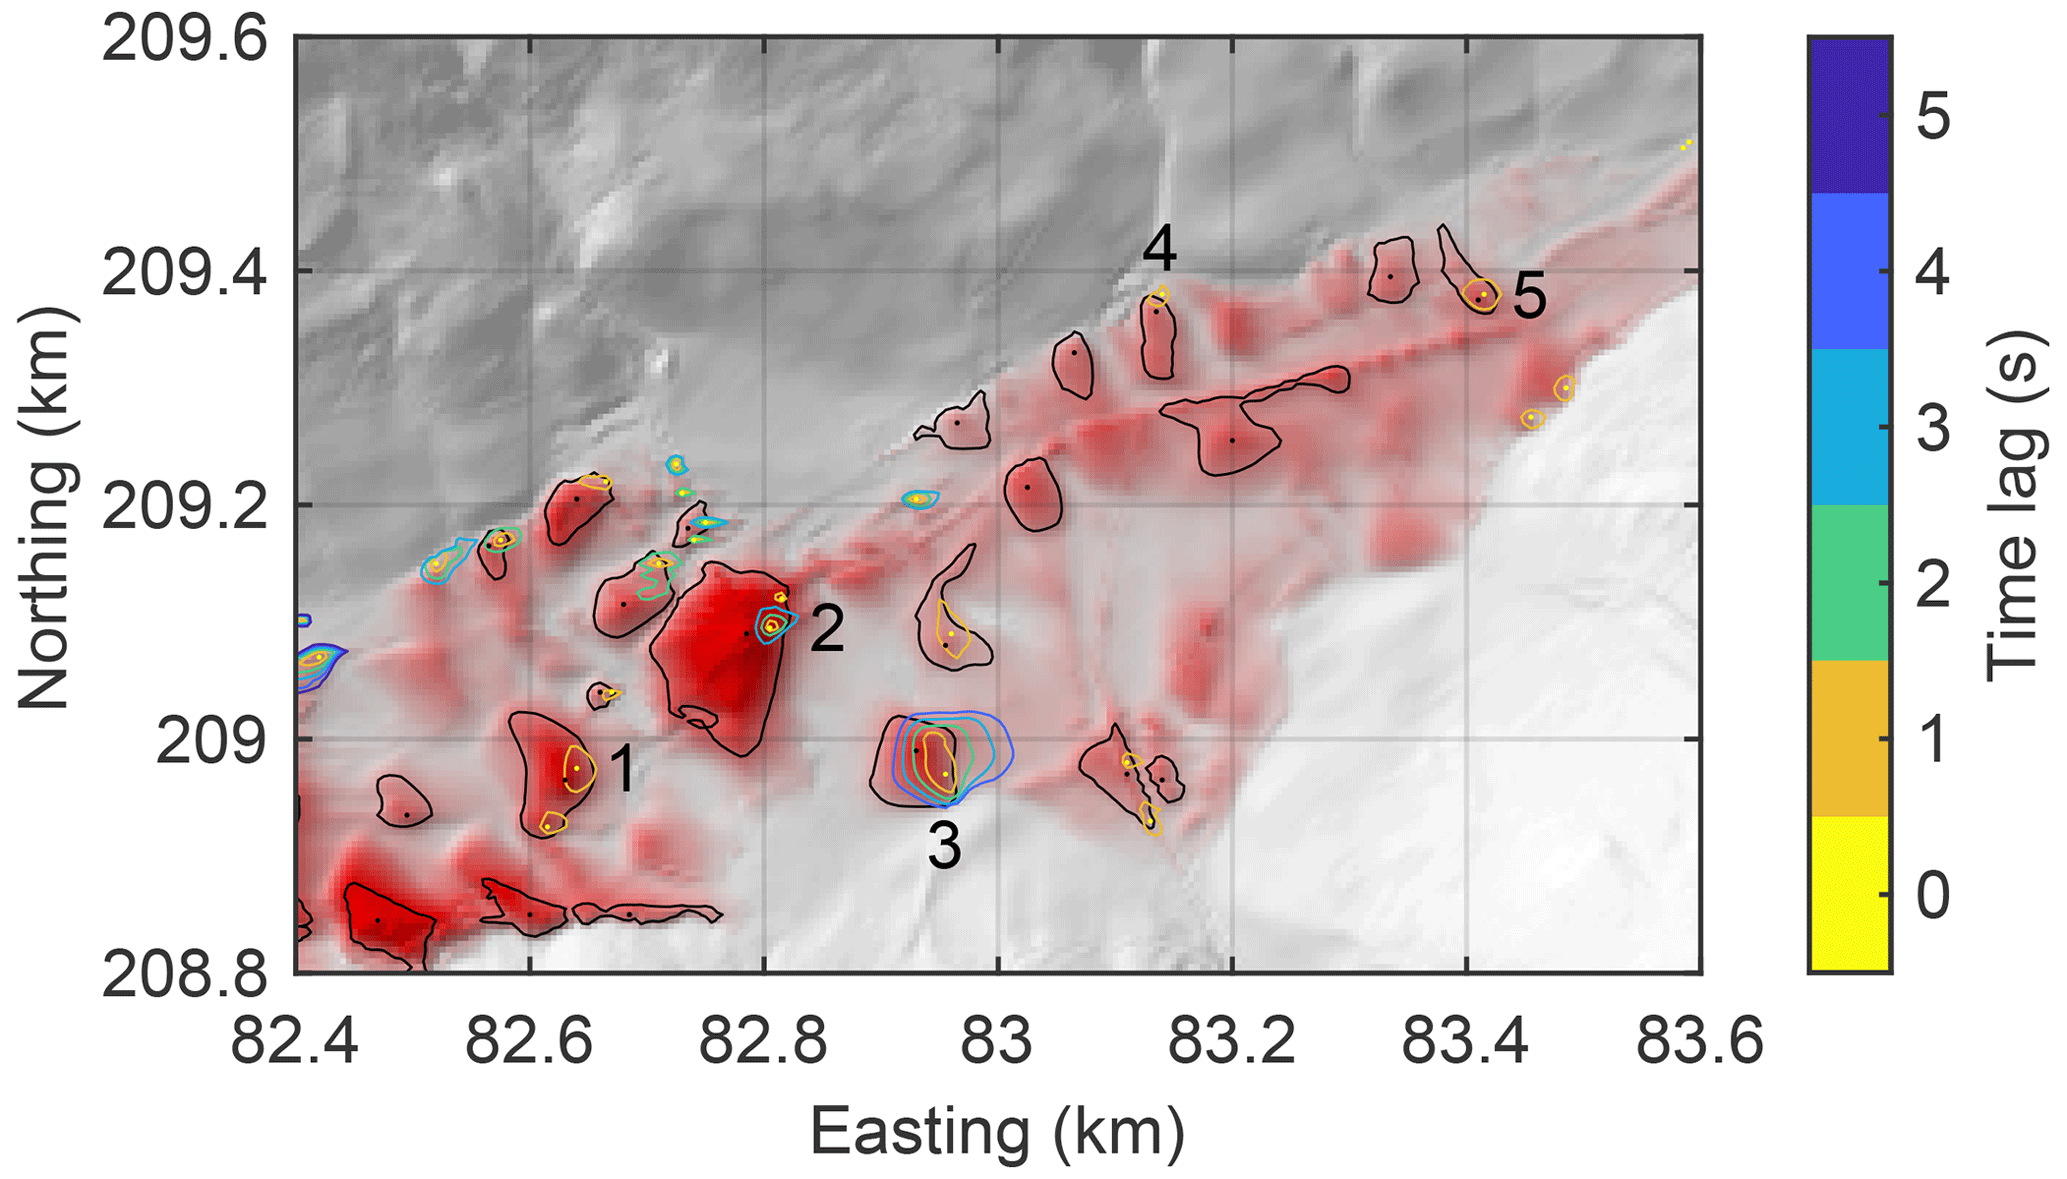
Figure 10Local minima of the time of collapse of the fluid-like behavior, with a (negative) prominence of at least 1 s. Contour lines are drawn around the minima at intervals of 1 s. The black lines represent the outlines of the hills shown in Fig. 3, and the black dots indicate the respective nearest peaks in the topography. The labels correspond to those in Fig. 11.
The solid lines in Fig. 11 show the velocities and thicknesses of the five seed points labeled in Fig. 10. The collapse of the fluid-like behavior takes place during a phase of decreasing velocity. However, this does not imply that the particles are already significantly decelerated since the plot does not follow moving particles but instead refers to the particles at a given position (i.e., a Eulerian description). Friction remains low as long as v≥vc, and the decrease in velocity arises from the ceasing supply of material from the upstream region.
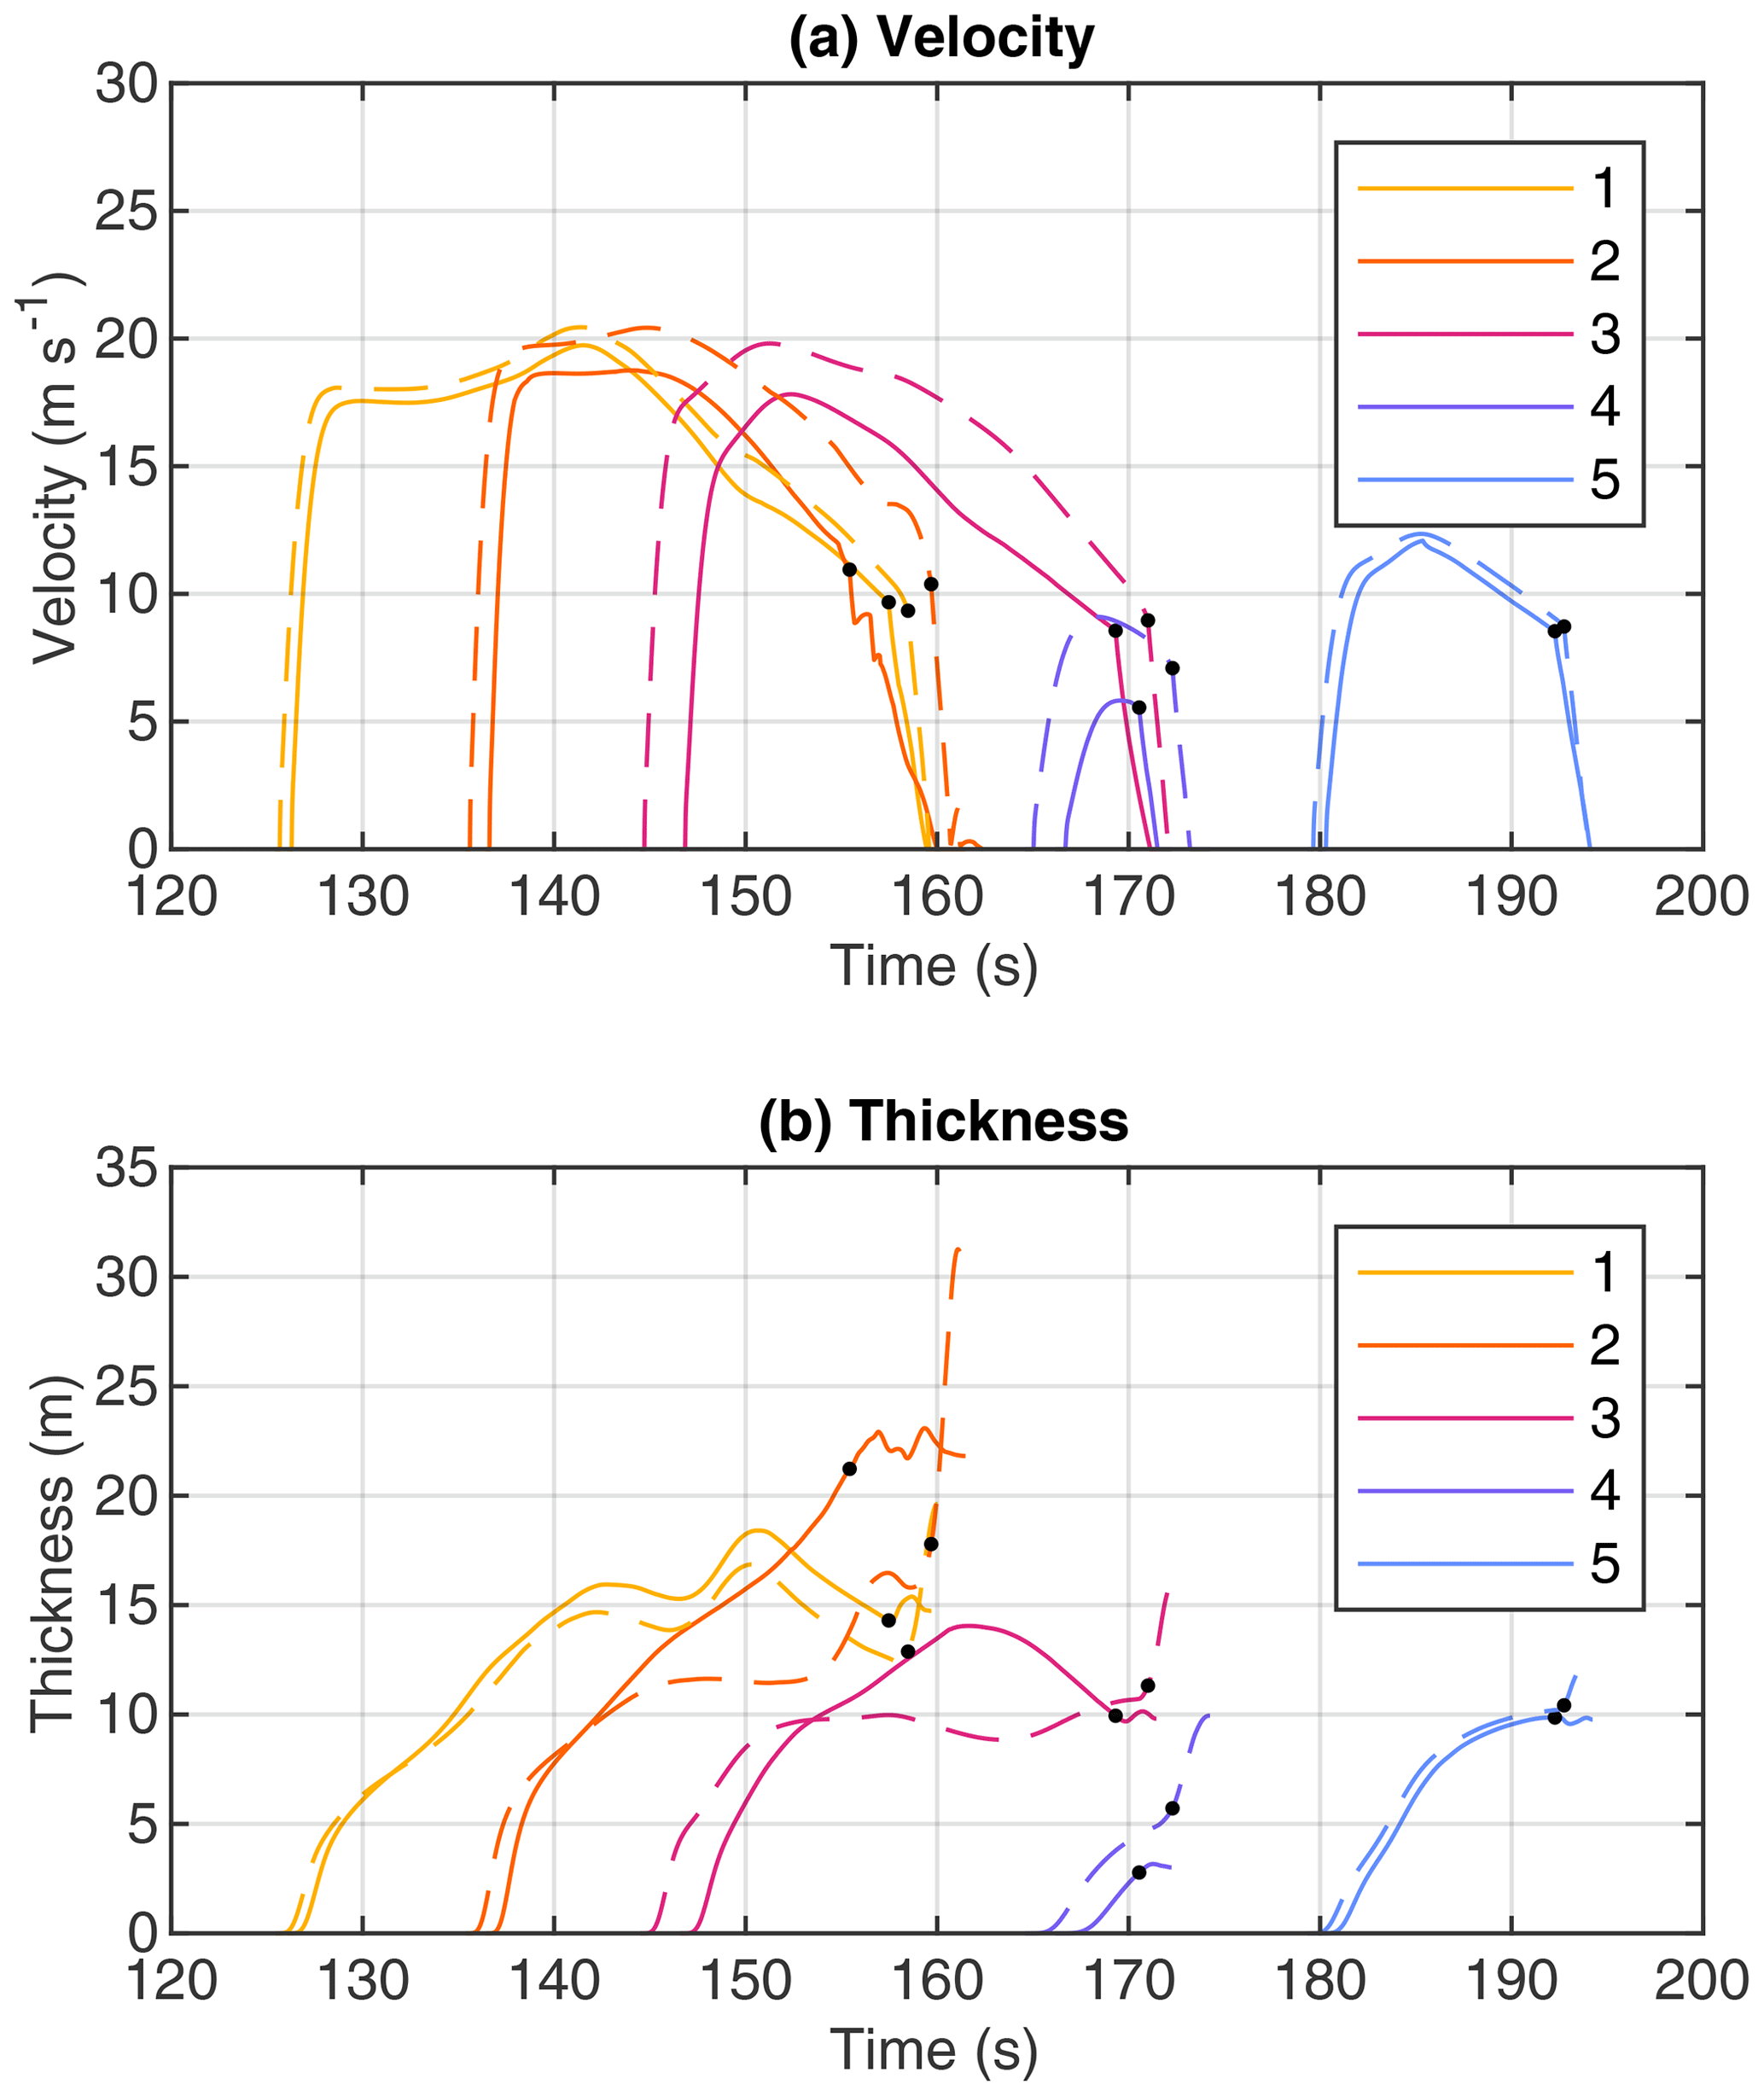
After returning to Coulomb friction, however, the particles strongly decelerate. Assuming a horizontal bed and a horizontal surface, this deceleration corresponds to μg≈7.3 m s−2, causing the particles to come to a complete stop in less than 1.4 s from v=10 m s−1 (the typical order of magnitude shown in Fig. 11a), with a traveling distance of less than 7 m. In turn, the change in thickness at the seed points is not unique. It may increase or decrease, but there is typically little change.
The dashed lines in Fig. 11 show the points that will become the respective peaks in elevation (black points in Fig. 10). By definition, these points return to Coulomb friction later than the respective seed points. Due to their location upstream of the seed points, material accumulates here, causing an increase in thickness until the material comes to rest. While the thickness increases by almost a factor of 2 at peaks 2 and 4, there is almost no increase at hill 5. The majority of the peaks not shown here are also in the range between almost no increase and a factor of 2. Thus, the accumulation of material alone cannot explain the occurrence of more or less isolated hills. There must also be a decrease in thickness in the surrounding area.
Figure 12 illustrates the velocity field around seed point 1. Time is measured relative to the time at which the seed point returns to Coulomb friction (t0=157.48 s). Flow continues with little change in velocity for several seconds in the region upstream of the seed point, resulting in the accumulation described above. Some slight changes in the direction of velocity indicate that particles try to bypass the obstacle, but this effect is weak. Most of the incoming flux still moves toward the obstacle and causes it to grow rapidly. Downstream, the opposite effect is observed. Particles that returned to Coulomb friction rapidly decelerate, while particles that are already ahead keep moving at a high velocity. This difference leads to a depletion of material downstream of the obstacle and thus to a region with a low deposit thickness.
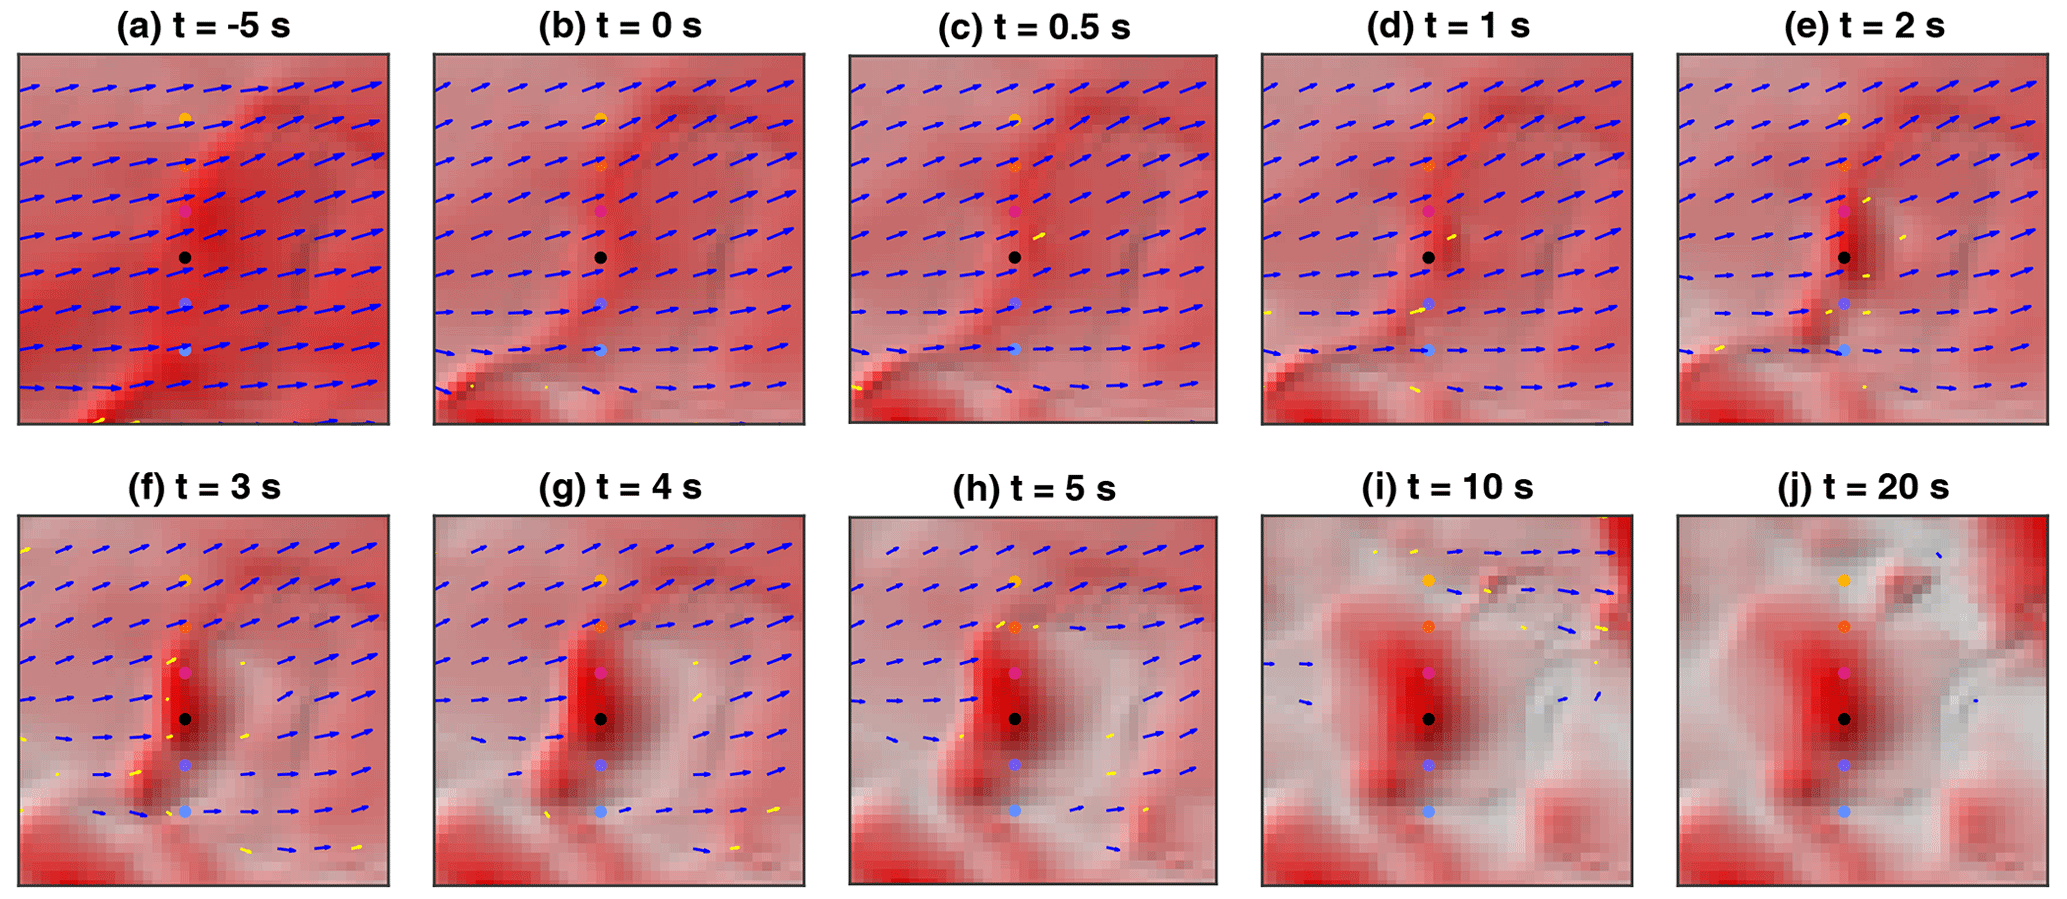
Figure 12Velocity field around seed point 1 (shown in Figs. 10 and 11). Time is measured relative to when the seed point returns to Coulomb friction (t0=157.48 s). The domain is centered on the seed point and is 200×200 m in size. The blue arrows indicate velocity-dependent friction (v≥vc), and the yellow arrows indicate Coulomb friction (v<vc). The dots show the points considered in Fig. 13.
The behavior concerning the lateral direction is less systematic. Figure 13 illustrates the change in thickness for six points. The point that will become the peak (black line) is the first to return to Coulomb friction and experiences the strongest increase in thickness. The points shifted by m follow closely behind but behave differently. One of them (δy=25 m) behaves similarly to the peak, but the southward point ( m) even decreases in thickness. It is recognized in Fig. 12 that material accumulates somewhat upstream of this point. The point at δy=75 m stays at v≥vc for almost 10 s longer. During this time span, thickness decreases from more than 8 m to less than 2 m and then further to about 1 m until movement stops completely. This depletion of material is not necessarily related to the dynamics at the hill. Here, it is the result of the ceasing supply from the upstream region, making the layer thinner until it finally comes to rest. In turn, laterally elongated hills or even transverse ridges may occur if the collapse of the flow propagates laterally before the supply ceases.
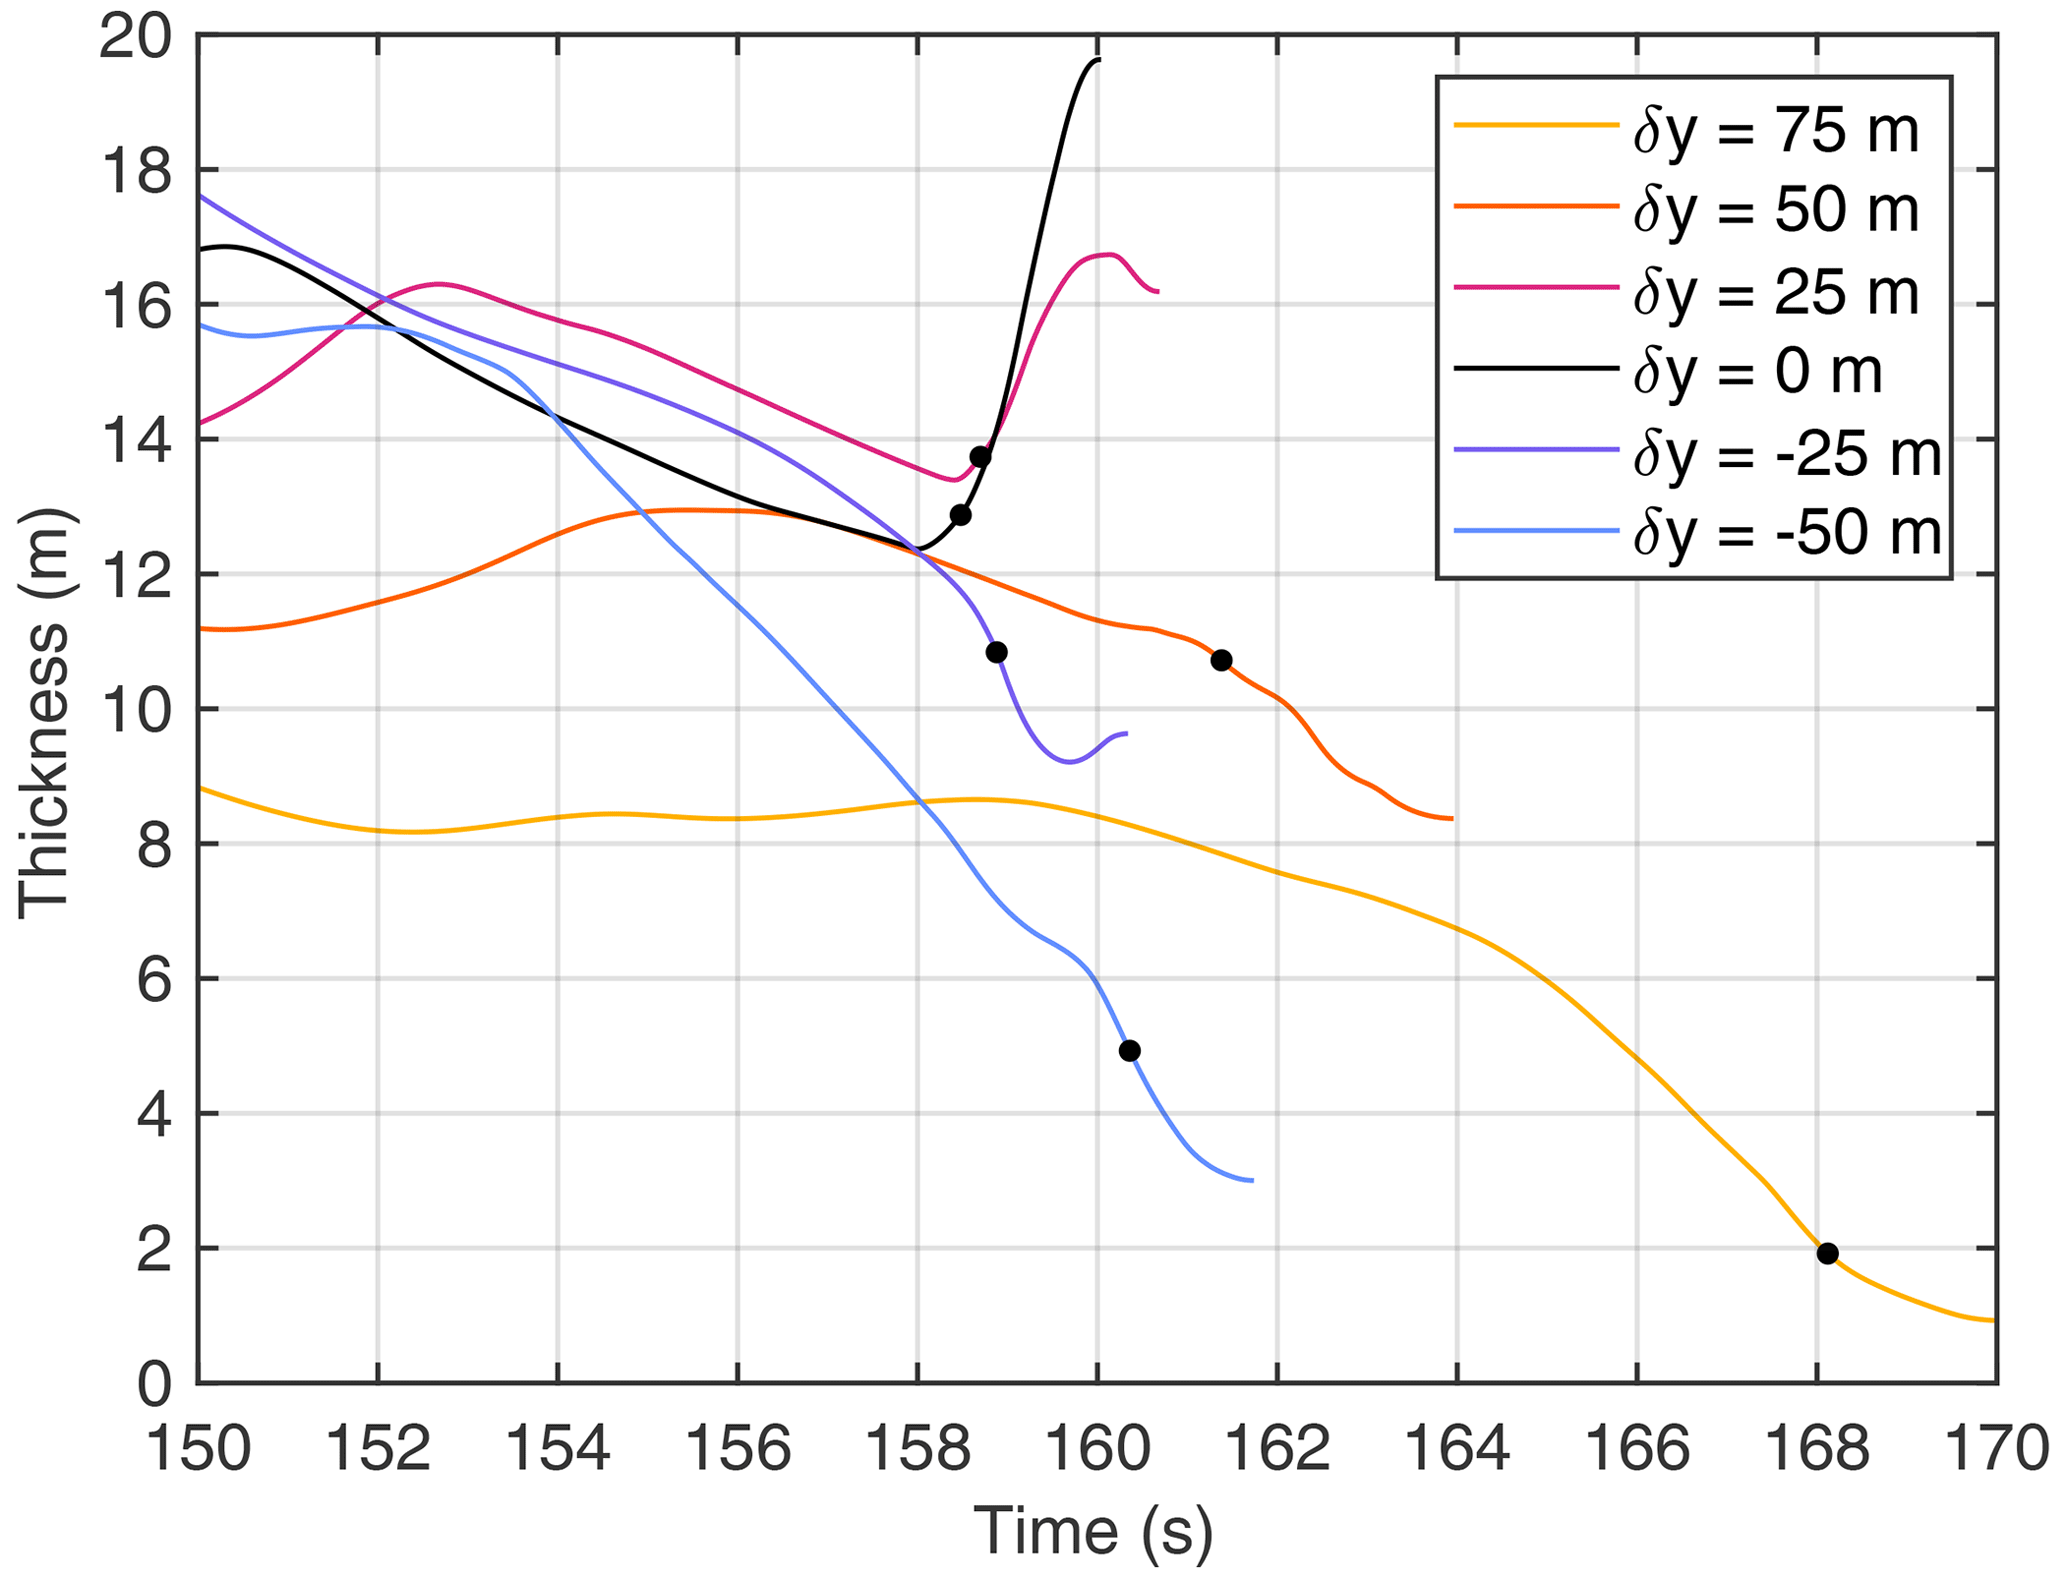
Figure 13Thickness at the points marked in Fig. 12. The black line corresponds to the point that becomes the peak. The colored lines refer to points shifted in the north–south direction in steps of 25 m. The black dots indicate the time at which the fluid-like behavior collapses.
Thus, the formation of more or less isolated hills involves two components. The top of the hill is typically formed by the accumulation of material, which starts from a point that returns to Coulomb friction and propagates upstream. As a second contribution, material is depleted in the domain around the hill. This depletion is only partly related to the formation of the hill. The hill immediately suppresses the supply of material to its downstream range, leading to rapid depletion here. In turn, fast flow may continue for a longer time in the upstream and lateral ranges, leading to a depletion of material simply due to the cessation of the incoming flux. Since this contribution depends on what happens in the upstream range rather than on what happens at the hill, it seems to be responsible for the large variation observed in the shape of the hills.
3.4 Influence of the parameters
The results obtained so far were obtained from a combination of parameter values that allows for a relatively long runout in the valley. Figure 14 shows two scenarios that yield a shorter runout. Friction in the fluid-like regime was increased by a factor of 2 (ξ=250 m s−2 instead of 500 m s−2), as shown in Fig. 14a. The other version (Fig. 14b) assumes the original friction but an earlier collapse of the fluid-like behavior (vc=5 m s−1 instead of 4 m s−1 when h=1 m). The two parameter sets are related to each other through the minimum amount of random kinetic energy required to maintain the fluid-like behavior. According to the considerations of Hergarten (2024c), this amount is proportional to . It is thus almost identical for the two parameter sets and twice as high as that for the original scenario.
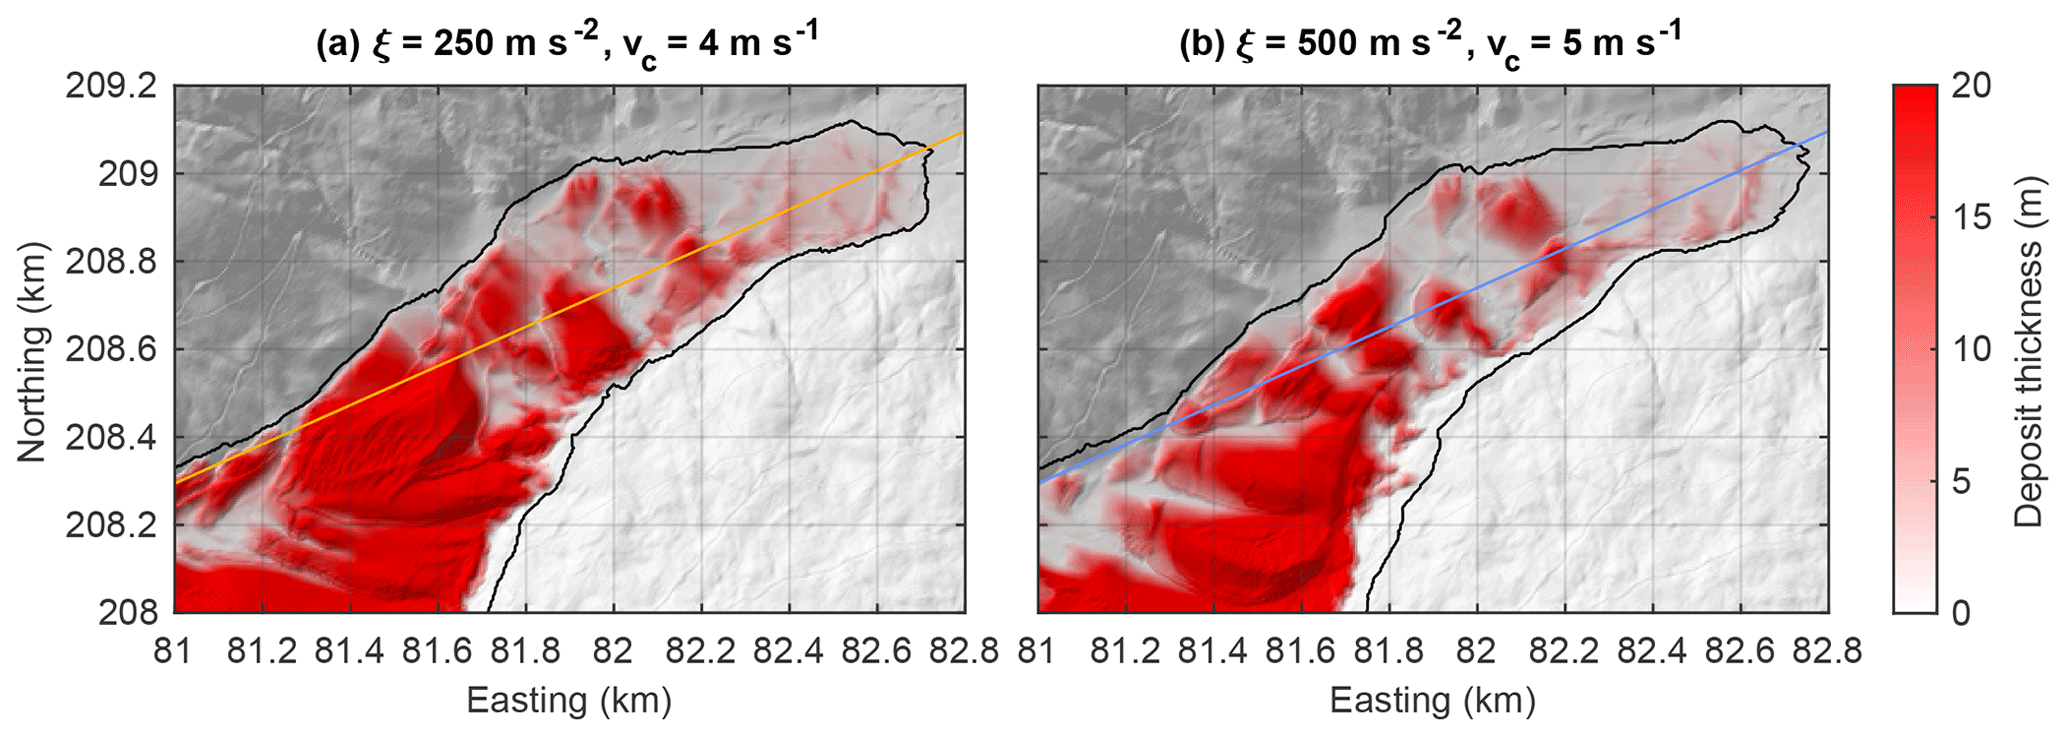
Figure 14Deposit thickness in a section of the valley obtained for two different parameter combinations. The value of vc refers to a thickness of h=1 m. The black outline encloses the region affected by the rock avalanche. The straight lines correspond to the profile considered in Fig. 7.
Runout is more than 1 km shorter in both scenarios than in the original simulation (Fig. 2) and is also shorter than that of the real rock avalanche in the valley. The two scenarios are similar with regard to not only the runout but also the morphology of the deposits. Both versions produce hills, albeit over a shorter section of the valley due to the shorter runout. Some hills even seem to be located at similar positions in both scenarios.
The profiles shown in Fig. 15 confirm the similarity of the morphologies, although the version with the increased friction (Fig. 14a) produces thicker deposits along large parts of the profile compared to the version with an earlier collapse of the fluid-like behavior (Fig. 14b). In some sections of the profile, the morphology even looks similar to that of the original scenario (Fig. 3).
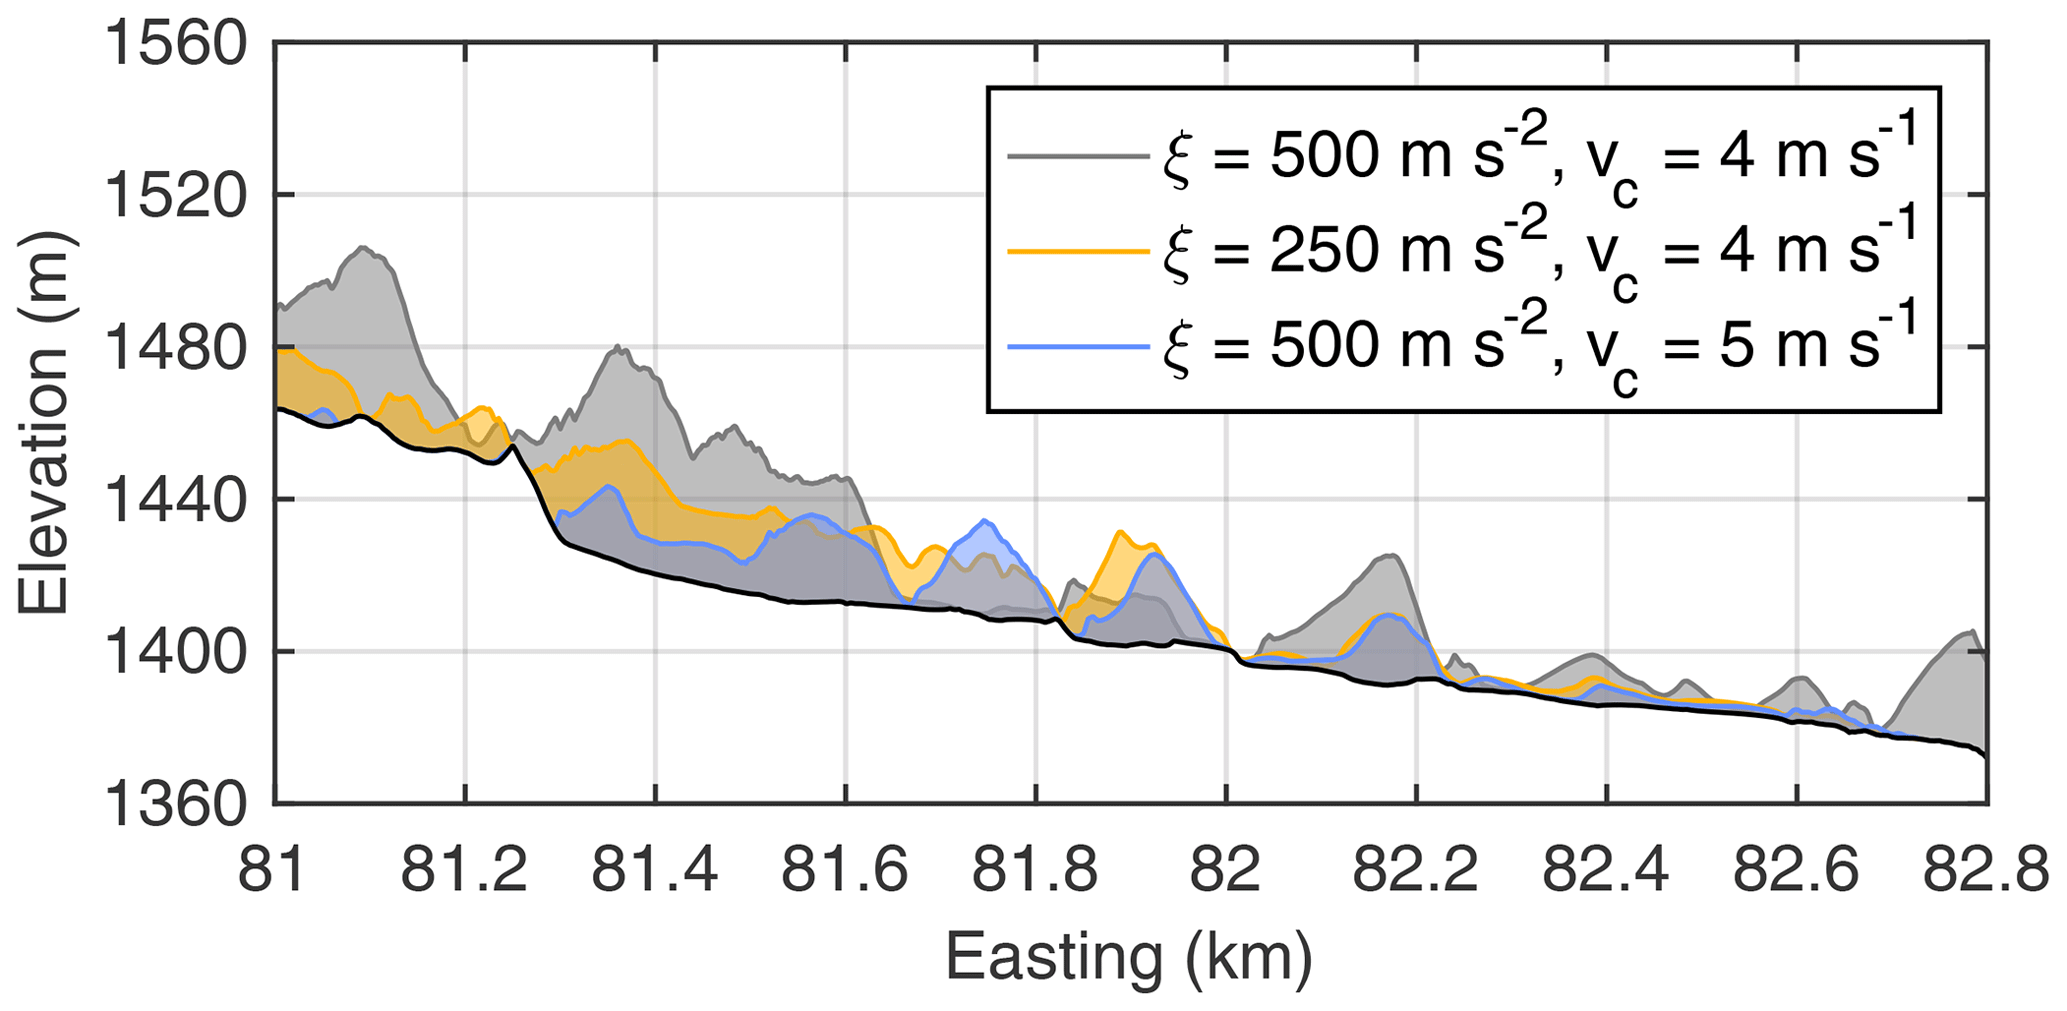
These results suggest that the minimum amount of random kinetic energy required to maintain the fluid-like behavior controls how far the rock avalanche travels along the valley. It therefore defines the potential to form toma hills. However, it seems that the formation of hills in the part of the valley covered by rock avalanche deposits is not very sensitive to the parameter values. The crucial condition seems to be that the friction in the fluid-like regime must be much lower than the Coulomb friction.
The spatial resolution also affects the results. Figure 16 was obtained with the original parameter values (ξ=500 m s−2; vc=4 m s−1) but with a grid spacing of 10 m instead of 5 m. The initial conditions were obtained by averaging over tiles of 2×2 points.
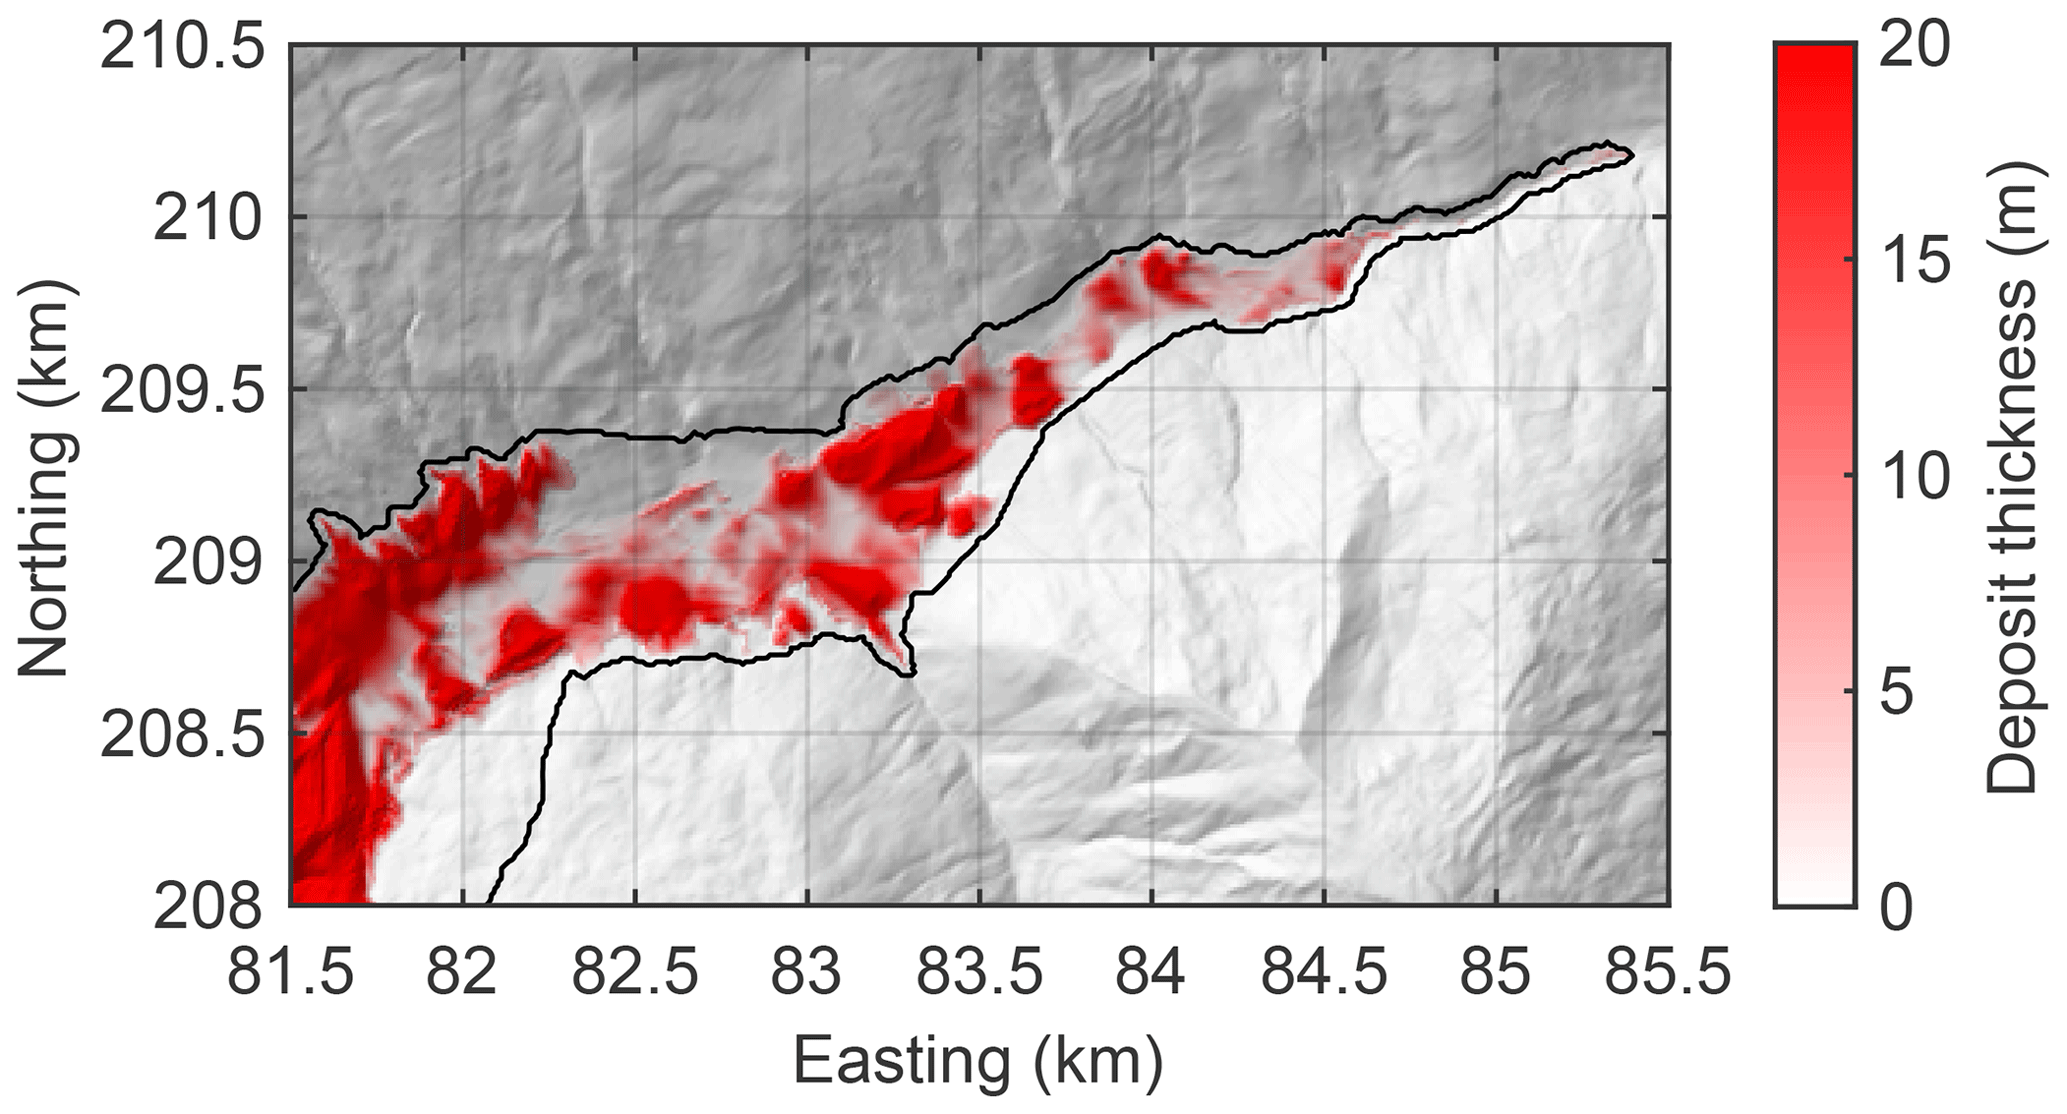
Figure 16Deposit thickness in a section of the valley obtained with 10 m grid spacing instead of 5 m grid spacing. The black outline encloses the region affected by the rock avalanche.
Although the hills are clearly recognizable, their pattern is visually even less similar to the original pattern (Figs. 2 and 3) compared to the patterns shown in Fig. 14. Furthermore, the runout length has increased considerably, although this increase is partly due to a small amount of material traveling along a narrow section of the valley. Overall, the scenario of material flowing along a relatively flat valley seems to be sensitive not only to the model parameters but also to the spatial resolution. While this issue affects estimates of the runout length more than the formation of toma hills, it should be investigated more thoroughly in subsequent studies.
Based on the numerical simulation of a hypothetic rock avalanche, it was found that the modification of the widely used Voellmy rheology proposed by Hergarten (2024c) is able to reproduce the occurrence of distinct hills in the deposits. The key feature of the modified rheology is a sudden drop in friction when transitioning from Coulomb friction to a fluid-like behavior. While this property was originally introduced in order to explain the long runout of rock avalanches without specific assumptions, it turned out to be responsible for the formation of hills as well.
The mechanism of forming hills involves two components, starting with returning to Coulomb friction at one point. The sudden increase in friction decelerates the particles strongly, causing material to accumulate in the domain upstream of the seed point. In turn, particles downstream of the seed point continue to move at high velocities, causing a rapid depletion of material. However, the formation of distinct hills also requires depletion in the lateral region. This happens if flow at low friction levels continues until the supply ceases. In turn, hills become laterally elongated or even form transverse ridges if the fluid-like behavior collapses in the lateral region before the supply ceases.
Since the shape of the simulated hills is quite irregular, a quantitative comparison with real toma hills is difficult. For the valley considered, however, the steepness of the simulated hills is strikingly similar to the steepness of existing toma hills generated by a real rock avalanche. This similarity holds for the average steepness as well as for the slope in the steepest direction. For some of the simulated hills, the slope in the steepest direction is close to the maximum stable slope, which is defined by the coefficient of Coulomb friction. The majority of the hills, however, are less steep.
The simulated hills are more or less isolated in the sense that there are areas with minimal deposit thickness between them. In turn, there are also connections between hills with several meters of deposits. Thus, the hills are not clearly separated in terms of deposit thickness. Although real toma hills often look like islands on an alluvial plain, the partial connections formed by rock avalanche deposits are not inconsistent with observations. Knowledge about the subsurface structure around toma hills is still incomplete. Validating or refuting the model will require more simulations, a more detailed analysis, and more research on real toma hills.
The occurrence of hills that look much like toma hills does not seem to rely on specific parameter values. In terms of the parameters, it seems that the only important factor is that friction in the fluid-like regime is much weaker than Coulomb friction. Given that there is even some similarity in the spatial patterns of the hills for different parameter values, the shape of the valley and the morphology of the valley floor also seem to be important. Finding out which valley morphologies facilitate the formation of toma hills could be the subject of a subsequent study.
So far, the modified Voellmy rheology has been supported mainly by its ability to explain the long runout of rock avalanches and it dependence on volume (Hergarten, 2024c). The finding that it also predicts the formation of hills that look much like toma hills provides further support for this rheology.
All codes are available in a Zenodo repository available at https://doi.org/10.5281/zenodo.13143283 (Hergarten, 2024a). This repository also contains the data obtained from the numerical simulations. Interested users are advised to download the most recent version of the MinVoellmy software from http://hergarten.at/minvoellmy (Hergarten, 2024e).
Two videos showing the simulation are available at http://hergarten.at/minvoellmy/tomahills (Hergarten, 2024b).
The author has declared that there are no competing interests.
Publisher's note: Copernicus Publications remains neutral with regard to jurisdictional claims made in the text, published maps, institutional affiliations, or any other geographical representation in this paper. While Copernicus Publications makes every effort to include appropriate place names, the final responsibility lies with the authors.
The author would like to thank Martin Mergili and an anonymous reviewer for their constructive comments and Fiona Clubb for the editorial handling.
This open-access publication was funded by the University of Freiburg.
This paper was edited by Fiona Clubb and reviewed by Martin Mergili and one anonymous referee.
Abele, G.: Bergstürze in den Alpen: ihre Verbreitung, Morphologie und Folgeerscheinungen, no. 25 in Wiss. Alpenvereinshefte, Dt. Alpenverein, München, https://bibliothek.alpenverein.de/webOPAC/01_Alpenvereins-Publikationen/06_wiss._Alpenvereinshefte/AV-HeftNr.025.pdf (last access: 16 October 2024), 1974. a, b, c
Argentin, A.-L., Robl, J., Prasicek, G., Hergarten, S., Hölbling, D., Abad, L., and Dabiri, Z.: Controls on the formation and size of potential landslide dams and dammed lakes in the Austrian Alps, Nat. Hazards Earth Syst. Sci., 21, 1615–1637, https://doi.org/10.5194/nhess-21-1615-2021, 2021. a
Bartelt, P. and Buser, O.: Frictional relaxation in avalanches, Ann. Glaciol., 51, 98–104, https://doi.org/10.3189/172756410791386607, 2010. a, b
Buser, O. and Bartelt, P.: Production and decay of random kinetic energy in granular snow avalanches, J. Glaciol., 55, 3–12, https://doi.org/10.3189/002214309788608859, 2009. a, b
Campbell, C. S., Cleary, P. W., and Hopkins, M.: Large‐scale landslide simulations: Global deformation, velocities and basal friction, J. Geophys. Res.-Solid, 100, 8267–8283, https://doi.org/10.1029/94JB00937, 1995. a
de Blasio, F. V. and Elverhøi, A.: A model for frictional melt production beneath large rock avalanches, J. Geophys. Res.-Earth, 113, F02014, https://doi.org/10.1029/2007JF000867, 2008. a
Erismann, T. H.: Mechanisms of large landslides, Rock Mech., 12, 15–46, https://doi.org/10.1007/BF01241087, 1979. a
Hergarten, S.: Topography-based modeling of large rockfalls and application to hazard assessment, Geophys. Res. Lett., 39, L13402, https://doi.org/10.1029/2012GL052090, 2012. a
Hergarten, S.: Formation of toma hills, Zenodo [code and data set], https://doi.org/10.5281/zenodo.13143283, 2024a. a
Hergarten, S.: Formation of toma hills, [video supplement], http://hergarten.at/minvoellmy/tomahills (last access: 9 April 2024), 2024b. a
Hergarten, S.: Scaling between volume and runout of rock avalanches explained by a modified Voellmy rheology, Earth Surf. Dynam., 12, 219–229, https://doi.org/10.5194/esurf-12-219-2024, 2024c. a, b, c, d, e, f
Hergarten, S.: MinVoellmy v1: a lightweight model for simulating rapid mass movements based on a modified Voellmy rheology, Geosci. Model Dev., 17, 781–794, https://doi.org/10.5194/gmd-17-781-2024, 2024d. a
Hergarten, S.: MinVoellmy, [code], http://hergarten.at/minvoellmy (last access: 16 October 2024), 2024e. a, b
Ivy-Ochs, S., von Poschinger, A., Synal, H.-A., and Maisch, M.: Surface exposure dating of the Flims landslide, Graubünden, Switzerland, Geomorphology, 103, 104–112, https://doi.org/10.1016/j.geomorph.2007.10.024, 2009. a
Johnson, B. C., Campbell, C. S., and Melosh, H. J.: The reduction of friction in long runout landslides as an emergent phenomenon, J. Geophys. Res.-Earth, 121, 881–889, https://doi.org/10.1002/2015JF003751, 2016. a, b
Knapp, S., Schwenk, M., and Krautblatter, M.: Geophysical evidence of massive hyperconcentrated push waves with embedded toma hills caused by the Flims rockslide, Switzerland, Earth Surf. Dynam., 10, 1185–1193, https://doi.org/10.5194/esurf-10-1185-2022, 2022. a, b
Land Tirol: Digitales Geländemodell Tirol, https://www.data.gv.at/katalog/dataset/land-tirol_tirolgelnde (last access: 20 July 2023), 2023. a
Lucas, A., Mangeney, A., and Ampuero, J. P.: Frictional velocity-weakening in landslides on Earth and on other planetary bodies, Nat. Commun., 5, 3417, https://doi.org/10.1038/ncomms4417, 2014. a
Mead, S. R. and Cleary, P. W.: Validation of DEM prediction for granular avalanches on irregular terrain, J. Geophys. Res.-Earth, 120, 1724–1741, https://doi.org/10.1002/2014JF003331, 2015. a
More, K. S. and Wolkersdorfer, C.: An analogue Toma Hill formation model for the Tyrolian Fernpass rockslide, Landslides, 16, 1855–1870, https://doi.org/10.1007/s10346-019-01211-w, 2019. a
Ostermann, M. and Prager, C.: Field trip 12: Rock slope failures shaping the landscape in the Loisach-, Inn- and Ötz Valley region (Tyrol, Austria), Geo. Alp, 13, 257–276, 2016. a
Ostermann, M., Sanders, D., Ivy-Ochs, S., Alfimov, V., Rockenschaub, M., and Römer, A.: Early Holocene (8.6 ka) rock avalanche deposits, Obernberg valley (Eastern Alps): Landform interpretation and kinematics of rapid mass movement, Geomorphology, 171–172, 83–93, https://doi.org/10.1016/j.geomorph.2012.05.006, 2012. a, b, c, d, e, f, g, h
Ostermann, M., Ivy-Ochs, S., Ruegenberg, F., and Vockenhuber, C.: Characteristics and dating of the rock avalanche at Pragser Wildsee/Lago di Braies (Dolomites, Italy), Alp. Mediterr. Quat., 33, 183–189, https://doi.org/10.26382/AMQ.2020.07, 2020. a
Paguican, E. M. R., van Wyk de Vries, B., and Lagmay, A.: Hummocks: how they form and how they evolve in rockslide-debris avalanches, Landslides, 11, 67–80, https://doi.org/10.1007/s10346-012-0368-y, 2014. a
Pouliquen, O., Delour, J., and Savage, S. B.: Fingering in granular flows, Nature, 386, 816–817, https://doi.org/10.1038/386816a0, 1997. a
Prager, C., Krainer, K., Seidl, V., and Chwatal, W.: Spatial features of Holocene sturzstrom-deposits inferred from subsurface investigations (Fernpass rockslide, Tyrol, Austria), Geo. Alp, 3, 147–166, 2006. a
Salm, B.: Flow, flow transition and runout distances of flowing avalanches, Ann. Glaciol., 18, 221–226, https://doi.org/10.3189/S0260305500011551, 1993. a
Savage, S. B. and Hutter, K.: The motion of a finite mass of granular material down a rough incline, J. Fluid Mech., 199, 177–215, https://doi.org/10.1017/S0022112089000340, 1989. a
Shea, T. and van Wyk de Vries, B.: Structural analysis and analogue modeling of the kinematics and dynamics of rockslide avalanches, Geosphere, 4, 657–686, https://doi.org/10.1130/GES00131.1, 2008. a
Thompson, N., Bennett, M. R., and Petford, N.: Development of characteristic volcanic debris avalanche deposit structures: New insight from distinct element simulations, J. Volcanol. Geoth. Res., 192, 191–200, https://doi.org/10.1016/j.jvolgeores.2010.02.021, 2010. a
Valderrama, P., Roche, O., Samaniegoa, P., van Wyk de Vries, B., and Araujo, G.: Granular fingering as a mechanism for ridge formation in debris avalanche deposits: laboratory experiments and implications for Tutupaca volcano, Peru, J. Volcanol. Geoth. Res., 349, 409–418, https://doi.org/10.1016/j.jvolgeores.2017.12.004, 2018. a
van Husen, D., Ivy-Ochs, S., and Alfimov, V.: Mechanism and age of late glacial landslides in the Calcareous Alps; the Almtal, Upper Austria, Aust. J. Earth Sci., 100, 114–127, 2007. a
Voellmy, A.: Über die Zerstörungskraft von Lawinen, Schweiz. Bauzeitung, 73, 212–217, https://doi.org/10.5169/seals-61891, 1955. a, b, c
Wirbel, A., Oesterle, F., Fischer, J.-T., Chambon, G., Faug, T., Gaume, J., Glaus, J., Hergarten, S., Issler, D., Jarosch, A., Jóhannesson, T., Martini, M., Mergili, M., Rauter, M., Robl, J., Rosatti, G., Spannring, P., Tollinger, C., Vicari, H., and Zugliani, D.: ISeeSnow – initiating an avalanche simulation tool intercomparison, EGU General Assembly 2024, Vienna, Austria, 14–19 April 2024, EGU24-17750, https://doi.org/10.5194/egusphere-egu24-17750, 2024. a