the Creative Commons Attribution 4.0 License.
the Creative Commons Attribution 4.0 License.
Channel concavity controls planform complexity of branching drainage networks
Eitan Shelef
The planform geometry of branching drainage networks controls the topography of landscapes and their geomorphic, hydrologic, and ecologic functionality. The complexity of networks' geometry shows significant variability, from simple, straight channels that flow along the regional topographic gradient to intricate, tortuous flow patterns. This variability in complexity presents an enigma, as models show that it emerges independently of any heterogeneity in the environmental conditions. We propose to quantify networks' complexity based on the distribution of lengthwise asymmetry between paired flow pathways that diverge from a divide and rejoin at a junction. Using the lengthwise asymmetry definition, we show that the channel concavity index, describing downstream changes in channel slope, has a primary control on the planform complexity of natural drainage networks. An analytic model and optimal channel network simulations employing an energy minimization principle reveal that landscapes with low concavity channels attain planform stability only with simple network geometry. In contrast, landscapes with high concavity channels can achieve planform stability with various configurations, displaying different degrees of network complexity, including extremely complex geometries. Consequently, landscapes with high concavity index channels can preserve the legacy of former environmental conditions, whereas landscapes with low concavity index channels reorganize in response to environmental changes, erasing the former conditions. Consistent with previous findings showing that channel concavity correlates with climate aridity, we find a significant empirical correlation between aridity and network complexity, suggesting a climatic signature embedded in the large-scale planform geometry of landscapes.
- Article
(10287 KB) - Full-text XML
- BibTeX
- EndNote
The planform structure of branching fluvial drainage networks has far-reaching implications for the geomorphic, hydrologic, and ecologic functionality of landscapes (Horton, 1945; Sharp and Malin, 1975; Perron et al., 2008; Willett et al., 2018; Pelletier et al., 2018; Stokes and Perron, 2020; Freund et al., 2023; Liu et al., 2024). This structure, which can be expressed based on its geometric and topological attributes, exhibits significant variation across different regions. In some cases, networks exhibit simple flow paths (Fig. 1a) that generally follow the regional topographic gradient. These flow paths define main drainage basins, draining the main water divide to the mountain front, that are overall similar in shape and size and have a symmetric basin shape with respect to their main trunk (sensu Ramsey et al., 2007). Other networks appear more intricate. These complex networks display tortuous flow paths, asymmetric basin shapes, and varying sizes and shapes of the main basins (Fig. 1b).
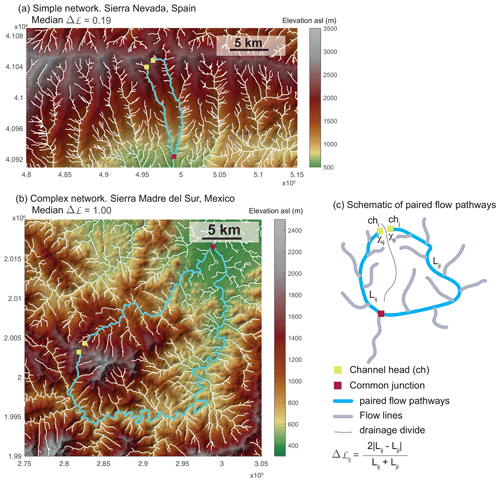
Figure 1Variability of complexity. Examples and schematic representations of paired flow pathways (light blue) originating from two channel heads (yellow squares), diverging from a common divide, and merging at a downstream junction (red square). Hillshade topographies with drainage networks colored in white are displayed in panels (a) and (b). Panel (a) shows an example from Sierra Nevada, Spain, where a simple network with sub-parallel trunk streams flows down the main topographic gradient. The median lengthwise asymmetry, Δℒ, over all paired flow pathways in this mountain range is 0.19. The map projection is UTM zone 30S. Panel (b) displays an example from Sierra Madre del Sur, Mexico, showcasing a complex drainage network with tortuous flow paths. The median Δℒ over all paired flow paths in this mountain range is 1.00. The map projection is UTM zone 14Q. (c) A schematic basin with the same components as in panels (a) and (b). Lij and Lji, used for calculating the Δℒ of paired flow paths, are measured along the two paired flow paths (light blue) from channel heads chi and chj (yellow squares), respectively, to their common junction (red square). Δχ is determined by measuring the χ values of the channel heads starting at the junction where they merge.
Differences in network planform complexity directly control the landscape's 3D topography. For the same total relief, longer and more tortuous flow paths have diverse slope aspects and shallower channel slopes, resulting in lower local reliefs (DiBiase et al., 2010) and longer channel segments per elevation range and associated ecoclimatic zone within individual main basins. Conversely, shorter and simpler flow paths that conform to the regional gradient feature a narrower distribution of slope aspects and greater local fluvial relief, such that each main basin is expected to have shorter channel segments within any given elevation range. These characteristics affect water runoff, sediment transport capacity, rate and pattern of erosion, and the distribution of ecological niches (Rodríguez-Iturbe and Valdés, 1979; Whipple and Tucker, 2002; Badgley et al., 2017; Pelletier et al., 2018; Khosh Bin Ghomash et al., 2019; Beeson et al., 2021; Stokes and Perron, 2020).
Some of the variability in network complexity could be attributed to the level of heterogeneity in the environmental and boundary conditions affecting the landscape. Spatial gradients in tectonics (Castelltort et al., 2012; Goren et al., 2015, 2014; Habousha et al., 2023; Cowie et al., 2006; Braun et al., 2013; Mudd et al., 2022), climate (Caylor et al., 2005; Thomas et al., 2011; Abed-Elmdoust et al., 2016), and lithology (including fabric and fracture density) (Strong et al., 2019; Ward, 2019; Mudd et al., 2022) and discrete geologic structures (Hamawi et al., 2022; Scott and Wohl, 2019) are likely linked to more complex network geometry (e.g., Abed-Elmdoust et al., 2016). However, numerical studies of landscape evolution (Shelef and Hilley, 2014; Tucker and Whipple, 2002; Howard, 1994; Rinaldo et al., 1992; Sun et al., 1994b; Howard, 1990) show that variabilities in complexity emerge even when environmental and boundary conditions are spatially uniform. This means that drainage complexity could emerge from autogenic network dynamics and be independent of any heterogeneity in the applied forcings.
The same modeling studies (Shelef and Hilley, 2014; Tucker and Whipple, 2002; Howard, 1994; Sun et al., 1994b; Howard, 1990) found that changing the channel concavity index leads to variations in numerical network complexity, where drainages that are characterized by a higher concavity index are more complex. However, a similar relation was not reported in natural drainage networks, and the reasoning behind it remained elusive. The concavity index, θ, emerges as the exponent of the globally documented empirical power law relation between the drainage area, A, and slope, S, known as Flint's law (Flint, 1974; Howard, 1971; Whipple and Tucker, 1999; Willgoose et al., 1991):
where Ks is referred to as the steepness index. The concavity index describes changes in the slope of the river channel along its longitudinal profile as it accumulates drainage area downstream. Empirical studies have found that the concavity index ranges between 0.1–1, with values between 0.3–0.7 being more common (Tucker and Whipple, 2002). A sub-linear profile is characterized by concavity values close to zero, where the channel slope is nearly independent of the drainage area. In contrast, high θ values, closer to 1, indicate that most of the elevation gain occurs at higher elevations and small drainage areas (Whipple and Tucker, 1999). Channel concavity has been shown to vary with formative processes, which are primarily influenced by hydrologic conditions, i.e., the relationship between precipitation, discharge, and channel width (Whipple and Tucker, 1999; Stock and Dietrich, 2006), and by spatial gradients in tectonic uplift (Seybold et al., 2021) and climatic conditions (Roe et al., 2002). Notably, several recent studies identified links between channel concavity and prevailing climatic conditions, particularly aridity. These studies have consistently indicated that arid regions tend to exhibit lower concavity indices (Zaprowski et al., 2005; Chen et al., 2019; Getraer and Maloof, 2021; Michaelides et al., 2022).
The relationship between channel concavity and network complexity is intriguing because it suggests that the concavity index, θ, which characterizes the channel longitudinal profiles, controls the planform properties of entire branching drainage networks. One potential way in which θ may affect the planform geometry of drainage basins is through its hypothesized influence on junction branching angles (Howard, 1971, 1990; Sólyom and Tucker, 2007; Hooshyar et al., 2017; Strong and Mudd, 2022). Larger θ values are associated with larger branching angles, potentially leading to wider basins, while lower θ values are associated with smaller junction angles and narrower basins. However, consistent changes in the local metric of junction branching angle, despite their potential effect on basin scaling (Yi et al., 2018), do not necessarily correspond to variations in drainage complexity.
To proceed, it is essential to establish a formal definition of drainage network complexity. The term complexity has been used in association with drainage networks referring to various metrics and geometric properties, including, for example, channel branching angle (Devauchelle et al., 2012) and Horton–Strahler order (De Bartolo et al., 2016). A formal mathematical definition was proposed by Ranjbar et al. (2020), who used an entropy measure applied to series that describe the width and incremental area functions within a basin (Ranjbar et al., 2020, and references therein). These functions capture the variability in drainage density (channel pixels) and incremental contributing area along the catchment, from the furthest drainage divide to the outlet. However, by reducing the two-dimensional geometry of the drainage network to one-dimensional functions (Gangodagamage et al., 2014), these measures cannot account for internal basin asymmetry and the overall degree of channel tortuosity.
Ranjbar et al. (2020) further identified a significant correlation between their complexity measure and the drainage network topology, defined by the c-parameter of the self-similar Tokunaga tree constructed based on the drainage network (Pelletier and Turcotte, 2000; Zanardo et al., 2013) and describing the properties of side branching. This suggests that a topological description based on the Tokunaga tree might also be informative for network complexity. Nevertheless, the Tokunaga tree properties rely on average side branching by order, which overlooks internal basin asymmetry. Additionally, the Tokunaga-derived c-parameter assumes topologically self-similar basins, a potentially restrictive assumption.
Here, we adopt an alternative approach for defining and quantifying network complexity based on the lengthwise asymmetry between paired flow pathways that diverge from a single divide and rejoin at a junction or a common base level following Shelef and Hilley (2014) (Fig. 1c). The link between lengthwise asymmetry, capturing the multi-scale network geometry, and drainage complexity can be understood by considering two end-members. Extremely tortuous and complex networks are linked to large lengthwise asymmetry (Fig. 1b), as one tortuous flow pathway can be meaningfully longer than its across-divide pair. Conversely, simple geometry is linked to small asymmetry (Fig. 1a). Following this definition, we explore the associations between the concavity index and the network complexity as reflected by lengthwise asymmetry. We target observations from natural drainage networks and process-based rationale to quantify and better understand a climate-dependent, first-order control on the 3D geometry of landscapes and the river networks that drain them.
Drainage divides delineate drainage basins, and, consequently, the planform geometry of a drainage network is closely tied to the associated drainage divide network (Shelef, 2018; Scherler and Schwanghart, 2020b; Habousha et al., 2023). The stability of the drainage network planform geometry is, therefore, tied to the stability of the divide network. When the divides shift or jump, the drainage basin's geometry changes and the network geometry is not steady. In contrast, as long as the divides remain stationary, the planform geometry of the drainage system is stable and the network topology is fixed. The stability of drainage divides can be assessed using the gradient of the parameter χ in between channel heads across divides (Willett et al., 2014), where χ is proportional to the expected steady-state elevation and is defined as (Perron and Royden, 2013)
In Eq. (2), x is the spatial coordinates measured upstream the channel, xb represents the base level, x′ is the integration parameter, and A0 is a reference drainage area introduced to ensure that the dimension of χ [L] is independent of the value of θ.
Considering the χ values of channel heads (Fig. 1c), when the environmental conditions are spatially uniform, a zero or sufficiently small (Shelef and Goren, 2021) Δχ across a divide indicates that the divide is stable (Willett et al., 2014; Shelef and Hilley, 2014), while a large Δχ across a divide could indicate a migrating divide (Willett et al., 2014; Beeson et al., 2017; Habousha et al., 2023). To compare the stability of divides and drainages of different scales, a normalized χ difference (referred to as χ difference) across a divide is defined for paired flow pathways, which originate from two channel heads, i and j, across a single divide that join at a downstream junction or base level (Fig. 1c):
where χij (χji) is the χ value at channel head i (j), where χ is computed between the channel head and the common junction of flow pathways i and j.
A formal quantification of network complexity is defined in a similar manner as a measure of normalized lengthwise difference (referred to also as asymmetry) between paired flow pathways (Fig. 1c):
where Lij and Lji are the along-flow distances from the two channel heads to their common junction or base level.
These definitions offer valuable insights into how θ might influence network complexity, Δℒ. In the extreme case of θ=0, χij=Lij, and χ differences across the divide reduces to lengthwise asymmetry (Shelef and Hilley, 2014). In this case, stable planform configurations with Δχij=0 for all i and j reduce to Δℒij=0 for all i and j. Consequently, for θ=0, the only stable branching network is one with perfect lengthwise symmetry, the simplest possible network. As θ increases, the drainage area distribution along the flow pathways, Eq. (2), plays a growing role, such that equal χ across divides could also be achieved when Δℒij≠0, as long as the drainage area distribution compensates for the lengthwise asymmetry.
We explore correlations between landscapes' channel concavity indices and their fluvial branching network complexity while accounting for the networks' stability. The analysis targets natural drainage networks, numerical networks generated using the surface process model DAC (Goren et al., 2014), and numerical optimal channel network simulations (Rinaldo et al., 1992).
3.1 Elongated natural mountain ranges
To explore the correlation between channel concavity and drainage network complexity in natural fluvial drainage networks, we independently quantify θ, Δℒ, and Δχ along 18 elongated mountain ranges across the globe. We choose to focus on elongated ranges (rather than study general networks) because (i) such ranges represent topographic units, whose base-level boundaries are relatively well defined; (ii) each of the ranges is relatively simple in terms of its tectonic setting, where the main faults bound the range rather than transect it; and (iii) for each range, θ and Δℒ are quantified over a relatively large domain with an along-range length between 10s–100s km. We further note that the ranges we choose are situated in both extensional and compressional settings, and, accordingly, some are bounded by normal faults and others are bounded by reverse faults. Detailed information about the elongated ranges is listed in Appendix A.
The selection of elongated mountain ranges for the current analysis adhered to specific criteria: (i) the elongated range has a single main divide from which basins drain to two opposite base levels. (ii) There should be a minimum of four basins on each flank, with the basins' outlets determined by a common elevation contour surrounding the range. (iii) The range should be free from prevalent volcanic characteristics or systematic structural control on the internal drainage pattern.
The analysis of the natural elongated mountain ranges is based on the SRTM 3 arcsec digital elevation model (DEM) (NASA Shuttle Radar Topography Mission, 2013) using the TopoToolbox topography analysis package (Schwanghart and Scherler, 2014; Scherler and Schwanghart, 2020a). The boundaries of each range were defined based on a minimum elevation threshold, chosen visually to eliminate alluvial fans and focus on bedrock rivers. Then, interstitial basins were excluded from the analyzed area, such that the analysis was based only on the main basins, draining the main divide to the boundary contour. The drainage network was extracted based on a predefined drainage area threshold, and we explore the sensitivity of the results to the drainage area threshold in Appendix B.
A single, best-suited concavity index, θ, was determined for each elongated mountain range based on the extracted drainage network and using the disorder scheme (Gailleton et al., 2021; Hergarten et al., 2016; Mudd et al., 2018). The disorder scheme assesses the extent to which the elevation-based order of channel pixels aligns with their χ-value order. The scheme involves calculating a normalized measure of pixel disorder, D∗(θ), for predefined values of θ (Gailleton et al., 2021). The most probable θ value (referred to as the best-suited θ) is the one that minimizes the D∗(θ) metric. For each value of θ, the calculation involves calculating when χ is sorted by elevation. Then, because the absolute value of χ depends on θ, R(θ) is normalized by χmax(θ) to define (Hergarten et al., 2016; Gailleton et al., 2021). Finally, D∗(θ) is defined as (Gailleton et al., 2021).
The uncertainty in θ is derived based on the uncertainty in D∗ following Gailleton et al. (2021). To evaluate it, a set of D∗(θ) values was generated through bootstrapping iterations, with the number of iterations being 1.5 times the number of main basins in each range. In each iteration, D∗(θ) was computed based on the drainage network of a random selection of 90 % of the main basins. The specific parameters used in the bootstrapping iterations were chosen heuristically for their relatively consistent results. The identification of the best-suited θ using the disorder scheme does not assume any specific functional dependency between the elevations and χ values but does assume that the parameters affecting the elevation along the drainage network, such as tectonic, climate, and lithology, might vary as a function of χ.
Δℒ and Δχ were computed for all divide points with distance from divide endpoints exceeding 1000 m (Scherler and Schwanghart, 2020a). For each of these divide points, Δℒ and Δχ were calculated based on the L and χ values of the two opposing (across the divide point) nearest drainage network pixels along the D8 flow routing raster and the L and χ values of the junction (or base level) of the two opposing pathways. To eliminate the influence of overall range asymmetry (which could stem from orographic effects on climate, tectonic advection, or tectonic tilting), the main divide points from which flow diverges to the two opposite base levels of the elongated range were excluded from the analysis. The calculation of χ values employed the best-suited θ value of the range. In cases where the two nearest network pixels were not at the same elevation, a correction was applied to Δℒ and Δχ. This correction adds the values of and to the χ and L of the lower pixel, respectively, thus estimating the χ and L values for channel heads that are at exactly the same elevation. Here, Δzij represents the elevation difference between the two nearest network pixels, Ks is the best-fit steepness index (derived from the slope of the χ–z data of the range), and Ai denotes the drainage area at the lower nearest network pixel (assuming it is labeled as i).
3.2 DAC simulations
The DAC landscape evolution model is a process-based model presented in Goren et al. (2014). DAC implements an implicit solver of the stream power incision model (Howard, 1994; Whipple and Tucker, 1999), E=K(PA)mSn, where E [L/T] is the erosion rate, K [L(1−3m)/T(1−m)] is the erodibility coefficient, P [L/T] is the precipitation rate, A [L2] is the drainage area, S [L/L] is the channel gradient, and m and n are positive exponents. Upon identifying and , the stream power model can be shown to reduce to Eq. (1). The solver is built upon a triangular, sparse, dynamically adjusting grid. Unlike previous implementations (Goren et al., 2014, 2015; Habousha et al., 2023) that solved for the divide location and identified captures following divide breaching, the DAC implementation used here assumes a strict steepest descent algorithm for flow routing. This choice allows better preservation of the initial conditions (starting with a random subdued topography between 0–1 m) and facilitates the comparison of drainage network complexity across values of the concavity index.
For the current analysis, we ran simulations over a domain size of 200 km × 60 km, producing elongated numerical mountain ranges with a single main water divide. The simulations apply a precipitation rate of P = 1 m yr−1; an uplift rate of U = 0.5 mm yr−1; and a slope exponent, n, of 1. The area exponent, m, was varied between the simulations and was maintained spatially uniformly in each simulation. The applied concavity index was calculated as . The drainage density, a function of grid spacing, is independent of the model parameters and similar across the simulations. To maintain a consistent global relief despite the changes in θ, the erodibility coefficient K is adjusted across the simulations. Table C1 lists the values of K.
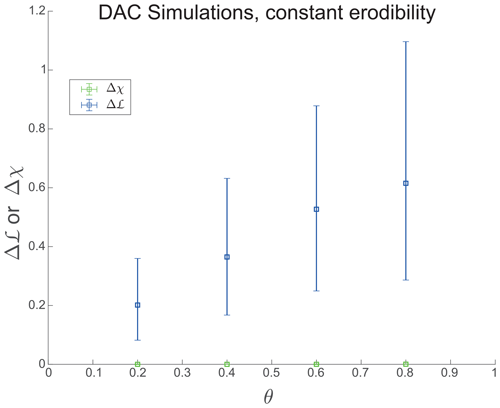
The simulations were run for 100 million years, ensuring topological stability by verifying that no alterations in flow routing occurred during the final 10 million years of each simulation. To ensure that the observed effects are indeed related to θ and not influenced by K, Fig. C1 replicates a subset of the analysis while keeping K constant.
In the DAC simulations, the calculation Δℒ and Δχ across divides accounts for all grid-based channel head pairs that share a divide. When a pair of channel heads does not have the same elevation, a similar correction to the one described for the natural elongated mountain ranges was used with the applied steepness index, Ks.
3.3 Optimal channel network simulations
Optimal channel network (OCN) theory (Rodriguez-Iturbe and Rinaldo, 2001; Rinaldo et al., 1992; Molnár and Ramírez, 1998; Banavar et al., 2001) suggests that natural drainage networks self-organize in a way that minimizes global energy expenditure during water flow down the network. In this general view of landscape organization, the energy is evaluated based on the network's geometry and topology, represented as sets of nodes and edges, where edges represent the channel connections between nodes. Each internal node has a unique path leading to an outlet node, and the flow paths are loopless. The total energy expenditure, denoted as P, for any network defined over the node set is determined by the sum of the local energy expenditures, Pi, along each edge, i (Sun et al., 1994b):
Si is the slope across edge i, Ai is the upstream drainage area (proxy for discharge Q) of node i from which edge i originates, and li is the length of edge i. The term on the right-hand side of Eq. (5) is referred to as the energy equivalent, Peq. The area exponent, γ, is expected to correlate inversely with θ, the concavity index (Eq. 1) (Strong and Mudd, 2022). However, the interdependence of these two exponents as a function of environmental conditions and network hydrology, and their consequent functional relation, remains debated (Strong and Mudd, 2022). Here, we follow the formulation of Sun et al. (1994b) and define .
Natural drainage networks were found to resemble numerically generated networks in a state of a local energy minimum (Rodriguez-Iturbe and Rinaldo, 2001; Colaiori et al., 1997). A commonly used criterion to identify and construct such networks is to ensure that the total energy (i.e., Eq. 5) is not reduced by a single-edge flip. An edge flip is an operation that redirects an edge that emerges from node i and used to end at node j, an immediate neighbor of i, to one of its other immediate neighbors, k≠j, without creating loops. A network configuration where any edge flip will only increase its total energy content defines a local energy minimum and corresponds to a topologically stable configuration.
We perform simulations using an iterative greedy algorithm following Rodríguez-Iturbe et al. (1992) to explore the effect of θ on networks' evolution toward the local energy minimum and the complexity of the emerging stable networks. The algorithm starts from a random network configuration, attempts a random edge flip in each iteration, and accepts the new configuration only if the edge flip reduces the total energy. Note that this approach differs from the simulated annealing algorithm (e.g., Sun et al., 1994a, b) that defines a temperature-dependent probability to accept edge flips that increase the total energy as a means to exit local minima and identify a global minimum configuration. Here, we use the greedy approach to eliminate probability-dependent changes that obscure the topological relation between stable networks generated with different θ values from the same initial random state (Rodríguez-Iturbe et al., 1992).
Optimizations with different θ are initiated from the same random network with a domain size of 200 over 60 nodes. Each node in the domain can drain to one of its eight neighbors, leading edges to be longer in the diagonal than in the rook directions. The nodes along the domain boundary are defined as outlets. Each simulation performed an optimization with a predefined θ value. The OCN approach lacks a hillslope domain, resulting in a high drainage density. Therefore, to avoid signal overwhelming by channel head pairs that merge at a single node downstream, Δℒ and Δχ are calculated only for neighboring channel head pairs that drain to different outlets (boundary nodes). Each simulation was run for 3.6 × 10⁶ iterations.
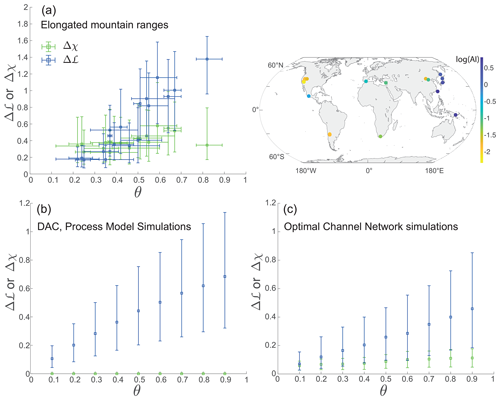
Figure 2Complexity and concavity index. (a) Relations between lengthwise asymmetry, Δℒ (blue) and Δχ (green), and the concavity index θ. The data represent 18 elongated mountain ranges, visualized as circles on the right-hand side of the map. The circles are color-coded by the logarithm of the aridity index (AI) (Zomer et al., 2022), with yellower circles corresponding to more arid conditions. (b) Relations between Δℒ, Δχ, and the concavity index θ for numerical ranges from the DAC process model (Goren et al., 2014). (c) Relations between Δℒ, Δχ, and the concavity index θ for numerical ranges derived from simulations using an optimal channel network model. In all panels, the squares display median values and the vertical error bars indicate the 25th and 75th percentiles. The horizontal error bars in panel (a) represent the uncertainty in θ, where the square is located at the best-suited θ value. A relatively high regression slope and significant correlation is observed between θ and Δℒ and between θ and the spread of Δℒ in the natural and numerical ranges. A weaker (a, c) or nonexistent (b) correlation is observed between Δχ and θ.
Among the 18 natural elongated mountain ranges studied, a larger θ correlates with a higher median Δℒ (Fig. 2a; blue squares) and a wider spread of Δℒ values (Fig. 2a; blue bars, denoting the 25th and 75th percentiles of the Δℒ distribution in each range). Though the correlation is not necessarily linear, we quantify it through Pearson's linear correlation. The correlation coefficient between the best-suited θ and the median Δℒ is 0.92 (with a slope of 2.16 and a P-value of 4.22 × 10⁻⁸), and the correlation coefficient between the best-suited θ and the difference between the 75th and 25th percentiles of the Δℒ distribution is 0.81 (with a slope of 1.30 and a P-value of 5.54 × 10⁻⁵). These trends indicate that those natural networks that are characterized by a higher value of θ are more complex (with a larger median Δℒ) and show greater variability in their level of complexity. In contrast, low-θ natural networks have lower complexity and complexity variation.
To explore the relation between planform stability and θ, Fig. 2a also shows the correlation between Δχ and θ (green symbols and bars). The Pearson's linear correlation coefficient between the best-suited θ and the median Δχ is 0.58 (with a slope of 0.33 and a P-value of 0.01). The correlation coefficient relating θ to the difference between the 75th and 25th percentiles of the Δχ distribution is 0.61 (with a slope of 0.43 and a P-value of 0.007). Therefore, the association and sensitivity (i.e., correlation and slope) between Δχ and its spread to θ are weaker than those between Δℒ and its spread and θ. Consequently, the degree of network instability, as quantified by Δχ, cannot be invoked as a main driver of the variability in complexity for the analyzed ranges.
We cannot fully exclude the possibility that heterogeneity in the environmental conditions across the analyzed mountain ranges affect both θ and Δℒ. To address this possibility, we apply a similar analysis over two types of synthetic, steady-state landscapes of uniform environmental conditions generated using (i) the DAC process-based landscape evolution model (Goren et al., 2014) and (ii) the process-independent greedy OCN model. In both models, we ran simulations with pre-defined θ values and measured Δχ and Δℒ over the emerging drainage networks after they achieved topological stability. For Δℒ, models' results, Fig. 2b and c (blue), show similar trends to those documented for the natural elongated mountain ranges. The median and the spread of Δℒ increase with increasing θ. For Δχ (blue), model results show constant and infinitesimal values, independent of θ in the DAC simulations and with a weak dependency on θ in the OCN simulations. Notably, while the range of Δℒ has the same order of magnitude in the natural elongated ranges (Fig. 2a) and the numerical drainages (Fig. 2b and c), the Δℒ values in the simulations are mostly smaller than the natural Δℒ for the higher θ values, potentially revealing the effect of environmental heterogeneity on the natural terrains' complexity, consistent with the higher values of Δχ for these ranges.
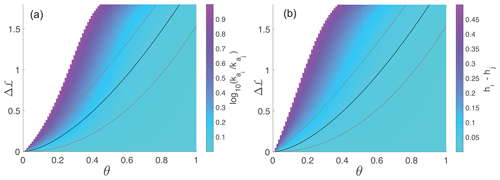
Figure 3Changes in lengthwise asymmetry, Δℒ as a function of concavity index, θ with differing Hack's law parameters; Eq. (6). Δℒ is calculated for idealized sub-basins along paired flow pathways, i and j, sharing a stable divide (Fig. 1c). (a) The color map represents the logarithm of Hack's coefficient ratio, assuming that Hack's exponents are identical, . (b) The color map represents the difference between Hack's exponents, assuming Hack's coefficients are identical and hi=2. In both panels, Li = 50 km, Lj≤Li, and xc = 0.25 km. The black and gray curves represent fitted power laws to the Δℒ–θ trends based on the natural elongated mountain ranges shown in Fig. 2a. For the median Δℒ, the fit is Δℒ=2.12θ1.60 (black curves); for the 75th percentile, the fit is Δℒ=2.49θ1.23 (upper gray curves); for the 25th percentile, the fit is Δℒ=1.54θ2.14 (lower gray curves).
5.1 Hack's law explains the relation between θ and Δℒ
To explain the observed correlation between θ and landscape complexity as quantified by Δℒ, we turn to an analysis of idealized channels. We set two coordinate systems, x, that follow paired flow paths from their common junction or base level to their common divide, such that x=0 is at the junction and x=Li (x=Lj) is the common divide when measured along channel i (j) (Fig. 1c). We assume that the channels obey Hack's law (Rigon et al., 1996), such that the drainage area distribution along the sub-basins whose outlet is the common junction are expressed as follows:
where and are Hack's coefficients and hi and hj are Hack's exponents. The hillslope length, xc, measured between the divide and the channel heads, is assumed to be uniform. We further assume that the channels obey a power law relation between the slope and the drainage area with a concavity index θ, Eq. (1), and, consequently, that the χ values at the channel heads could be defined by combining Eqs. (6) and (2):
Requiring the channels to be in a topological steady state (stable divide and stable planform configuration), the channel head χ values across the divide must be equal. For generality and simplicity, we consider the case where hiθ≠1 and hjθ≠1 and write the divide stability criterion, equating χi(Li−xc) to χj(Lj−xc):
If Hack's coefficients and exponents are identical for the two sub-basins, i.e., and hi=hj, then the only solution to Eq. (9) is lengthwise symmetry, Li=Lj and Δℒ=0 for all values of θ.
To explore the possibility of stable topological configurations that respect equal χ across a divide while permitting Δℒ≠0, we relax the restricting assumption of an identical Hack's coefficient or exponent. Firstly, we consider the case where is not necessarily 1, whereas . Figure 3a shows the value of needed to ensure equal χ across a divide, Eq. (9), as a function of θ and Δℒ. Without the loss of generality, we assume that Lj<Li and consider values of , approximately a factor of 3 larger than the range of reported natural values (Montgomery and Dietrich, 1992; Mueller, 1972; Willemin, 2000; Dodds and Rothman, 2000; Shen et al., 2017; Sassolas-Serrayet et al., 2018). Considering a fixed Δℒ, the figure shows that, for low values of θ, there are no values within the range for which Li≠Lj. As θ increases, Δℒ≠0 could be achieved with high values. As θ further increases, the values ensuring stable configurations with any particular Δℒ become smaller. This analysis reveals that, for small θ values, stable topologies can be achieved only with small Δℒ, but, as θ increases, small differences in Hack's coefficients permit stable topological configuration with large lengthwise asymmetry.
Next, we consider the case where hi≠hj, whereas . Here, Eq. (9) becomes independent of ka, and, for a fixed value of hi, the value of hj for different Δℒ can be solved only implicitly. Figure 3b shows the value of the difference hi−hj as a function of θ and Δℒ for hi=2. The difference is used rather than the ratio, as with ka (Fig. 3a), because the h exponents vary by a factor, whereas the ka coefficients can vary by orders of magnitude. We only consider solutions where , again representing a difference larger by a factor of approximately 3 with respect to the range of h exponents reported for natural terrains. Here, as well, for low values of θ, a solution exists only for very small Δℒ, and, as θ increases, smaller differences in the Hack's exponents allow a stable configuration with a large lengthwise asymmetry.
This analysis reveals that the widely documented geomorphic relationships of Hack's law, Eq. (6), and Flint's law, Eq. (1), are consistent with and can explain natural and numerical observations (Fig. 2) of the relations between θ and Δℒ. More specifically, the analysis shows that, when θ is large, stable configurations with zero Δχ across divides can be achieved even when Δℒ≫0, facilitated by small variations in Hack's exponent and coefficient. When θ is small, topological stability necessitates high lengthwise symmetry (small Δℒ).
The curves that overlie Fig. 3 show the best-fit power law relation between the best-suited θ and the median (black curve) and the 25th and 75th (gray curves) percentiles of Δℒ based on the elongated mountain ranges shown in Fig. 2a. The relation between the curves and the color map that underlies them reveals that high-θ natural networks achieve large Δℒ by exploiting small variations in Hack's exponent or coefficient. In contrast, low-θ networks require greater variability in Hack's parameters to achieve a much smaller Δℒ.
5.2 Optimal channel network (OCN) perspective
While the analysis based on Hack's law, Sect. 5.1, explains the observed correlation between concavity and complexity from a geomorphic scaling relations standpoint, the OCN framework helps conceptualize this correlation based on energy considerations. Figure 4a shows the evolution of the normalized energy equivalent, , as a function of iteration number during the energy optimization process under different values of θ and starting from the same initial random network, with equivalent energy . The figure shows that, as θ decreases, the normalized energy equivalent reduction is greater. Figure 4b shows the evolution of the median Δℒ during the optimization procedure, displaying a similar trend to that of the normalized energy equivalent, with a greater reduction in Δℒ with decreasing θ. Notably, while the greedy algorithm ensures a monotonous energy reduction with an increasing number of iterations (Fig. 4a), the Δℒ trends are non-monotonous (Fig. 4b). The Δℒ values of the final energy-minimum networks are depicted in Fig. 2c. Appendix D discusses the trend of Δχ through the optimization iterations.
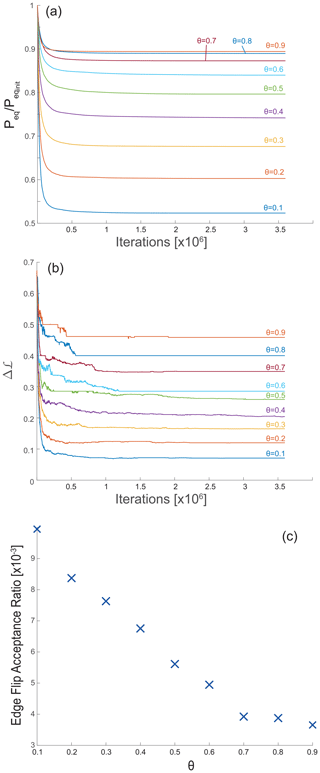
Figure 4Optimal channel network (OCN) dynamics as a function of concavity index. Transient response and steady-state values from OCN simulations (see Sect. 3.3 for details) showing the effect of the concavity index, θ, on the reduction trends of (a) the normalized energy equivalent, , Eq. (5); (b) the median Δℒ; and (c) the acceptance ratio of edge flip operations that reduce the total energy, i.e., the quotient of edge flips and the total number of iterations.
Examples of network topology optimized using the greedy algorithm with different values of θ are shown in Fig. 5. High θ values result in complex, tortuous networks that do not significantly differ from the random initial conditions, consistent with the low number of accepted edge flip operations (Fig. 4c). As θ decreases, the networks become less complex and the legacy of the initial conditions is gradually erased (Fig. 5c and d). A similar behavior was recorded in surface process model simulations (Shelef and Hilley, 2014; Kwang and Parker, 2019; Howard, 1994).
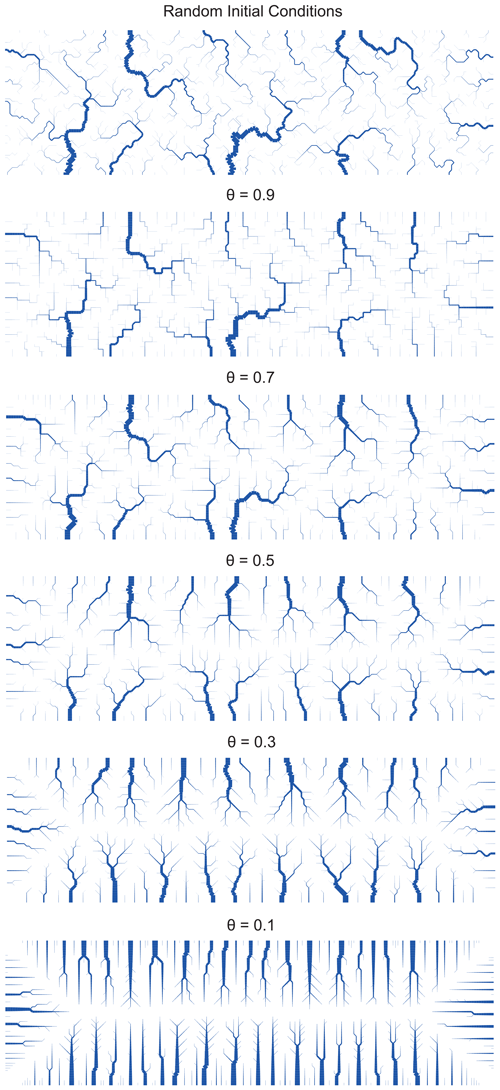
Figure 5Topologies emerging from OCN simulations with different concavity indexes. Random initial conditions (top) and final, steady optimal channel networks following the application of the greedy algorithm with different θ values. Note the great complexity and the similarity to the initial conditions of the high-θ networks relative to the simple geometry of the low-θ networks that significantly differ from the initial conditions. Edges are plotted only for drainage areas greater than five nodes, and edge width scales with the number of draining nodes.
The reduction in the minimum normalized energy equivalent and network complexity observed in Fig. 4a and b and the gradual deviation from the random initial network with decreasing θ (seen in Fig. 5) could be rationalized analytically. In the limit of θ=0 and when the edge length is uniform, the energy equivalent, Eq. (5), , becomes proportional to (here, li is the length of a single edge and Li represents the distance to the outlet node) (Colaiori et al., 1997). In this case, the global minimum is attained when each node drains to an outlet along the shortest path, contributing its local area to the minimal number of nodes. This ensures that, in the limit of θ→0, the emerging topology is such that each Li is minimal and therefore equal across all divides and Δℒ→0. Such an optimal network exhibits an exceptionally simple geometry that differs significantly from any random network, explaining the low-complexity configurations that characterize low-θ OCNs (Fig. 5), the many edge flips needed to achieve such configurations, and the associated large normalized energy equivalent reduction (Figs. 4a and 2c).
In the θ→1 limit, the energy equivalent becomes independent of the drainage area. Assuming uniform li, the energy equivalent is a function of the number of nodes in the domain and is independent of the specific drainage configuration. Consequently, all networks, including any random initial complex network, have the same minimal energy. This, in turn, explains the low number of edge flips when θ→1, the small reduction in normalized energy equivalent, and the similarity of the final optimal OCN to the initial random network.
For , our analysis reveals a monotonous relation between θ to the normalized energy equivalent reduction (Fig. 4a), the final Δℒ (Fig. 2c), and the acceptance ratio of edge flips (Fig. 4c). Overall, the OCN analysis indicates that θ determines the multiplicity of stable topologies. Networks with a high θ value can achieve stability across a wide range of Δℒ values, allowing many possible stable topologies. This includes the formation of complex networks with large Δℒ values, similar to random networks. In contrast, to attain stability, networks with a low θ value are restricted to simple topologies with smaller Δℒ values.
5.3 Climate aridity controls network complexity
Large data compilations of river profiles revealed that channel concavity correlates with climatic and hydrologic factors. More specifically, mean annual rainfall and rainfall intensities correlate positively with the concavity index (Zaprowski et al., 2005). Likewise, the degree of aridity as quantified by the aridity index (AI), the quotient of precipitation and evapotranspiration potential (Zomer et al., 2022), correlates with channel concavity, such that in arid regions (with a low aridity index) rivers are less concave (Chen et al., 2019; Getraer and Maloof, 2021). Combining these established relations between climate and concavity index and the correlation identified here between the concavity index and drainage complexity implies that the climatic conditions at which drainage networks develop could be encoded in their complexity and thus in the large-scale planform geometry of landscapes. Consequently, arid climates, characterized by low channel profile concavity, likely favor the development of low-complexity networks, whereas a more humid climate, characterized by high-concavity channels, is expected to result in variable complexity, including high-complexity drainage networks.
We examine the relationship between the complexity, Δℒ, and the aridity index across the elongated natural mountain ranges. The aridity index for each elongated range is calculated based on pixel statistics of the global aridity index raster (Zomer et al., 2022). A mask based on the analyzed area in each elongated range is used to extract the relevant pixels from the AI raster. The median and 25th and 75th percentiles of the pixel values within each such mask are used in the analysis.
Figure 6 shows a positive correlation between climate aridity index (AI) and network complexity for the elongated mountain ranges. The Spearman's rank correlation coefficient for this correlation is 0.59 with a P-value of 0.01, indicating, that consistent with the expectations, higher complexity tends to be associated with a higher AI, representing more humid climates. It is worth noting the significance of this correlation, considering that the correlation between the concavity index and the aridity index is found to be insignificant (see Appendix E for details) and that our dataset comprises only 18 mountain ranges. This could be seen as another support for the strong link between the network planform complexity and the formative concavity index (Eq. 1), which is expected to strongly depend on the hydrologic conditions (i.e., rainfall–discharge, and discharge–channel width relations) (Whipple and Tucker, 1999; Freund et al., 2023) and could differ from the measured concavity (Seybold et al., 2021).
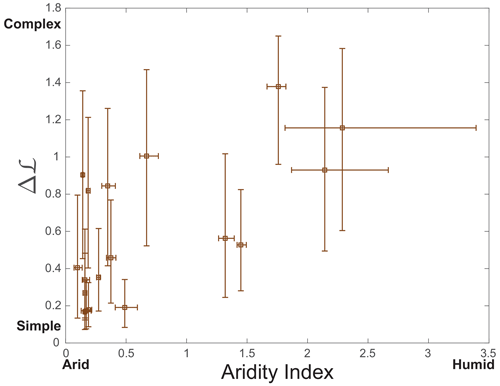
Figure 6Complexity and aridity. The relation between drainage complexity, Δℒ, and aridity index, the quotient of precipitation and evapotranspiration potential (Zomer et al., 2022), for the 18 elongated mountain ranges analyzed in Fig. 2a. The box symbols represent the median values, and the bars show the 25th and 75th percentiles. A significant correlation (P=0.01) with a Spearman's rank correlation coefficient of 0.59 indicates that more complex networks (high Δℒ) are associated with more humid climatic conditions and their corresponding hydrology.
5.4 Concavity controls planform landscape evolution
The results so far reveal that high-concavity landscapes can achieve topological stability with variable complexity, whereas the stability of low-concavity landscapes is conditioned by low complexity. These findings are consequential for landscape evolution, which we further investigate and quantify using landscape evolution simulations in DAC.
5.4.1 Changing climate
A first simulation set is designed to examine how the drainage network adjusts to changes in the concavity index, reflecting changing climatic, hydrologic, and geomorphic conditions. Previous studies have linked the concavity index to channel-forming processes, where debris flow channels typically exhibit lower concavity compared to fluvial channels (Stock and Dietrich, 2006). Therefore, a decrease in the concavity index can represent aridification or a transition to a debris-dominated landscape, while an increase in concavity may indicate a transition to a more humid climate or a fluvial-dominated regime.
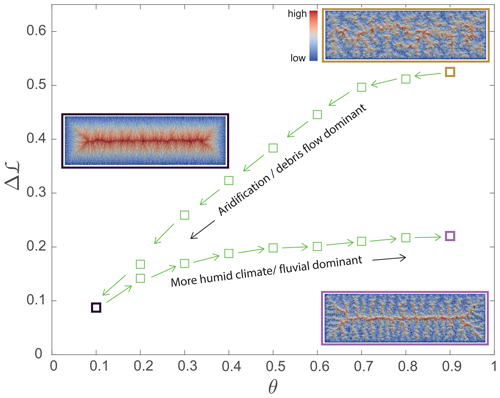
Figure 7The effect of changing concavity on network complexity. Simulation results from the DAC process model (Goren et al., 2014) showing the relation between the complexity, Δℒ, and the concavity index, θ, during a two-stage scenario. Firstly, the concavity is gradually decreased by steps of 0.1 (left-pointing arrow), and, secondly, the concavity increases in steps of 0.1 (right-pointing arrows). The network and topography of the initial θ=0.9 conditions are depicted in the brown-framed topography; the θ=0.1 landscape, corresponding to the end of the first stage and the beginning of the second stage, is shown with a black-framed topography; and the final θ=0.9 landscape is shown with a purple-framed topography. Note (i) the hysteresis response of Δℒ, showing different trends depending on the directional change in the concavity index, and (ii) the difference in topographic complexity between the two θ=0.9 maps. For the current analysis, Δℒ is calculated only for channel heads that drain to different outlets, such that the shared junction is the base level. Measuring Δℒ over this longer length scale emphasizes the hysteresis signal.
The simulation set starts with a topologically stable landscape of high concavity (θ = 0.9) and high complexity (brown frame in Fig. 7). We then gradually decrease the concavity index by steps of 0.1. Following each step, we let the landscape re-equilibrate until no further topological changes are observed. We measure the median value of Δℒ for this equilibrated landscape and then use this landscape as the initial condition for the next step. The procedure continues until reaching a low concavity value of θ = 0.1. Subsequently, we gradually increase the concavity index by 0.1, following the same re-equilibration procedure, until returning to the initial concavity value of θ = 0.9.
Figure 7 shows that, during the decreasing concavity stage, the median Δℒ gradually decreases, consistent with the results shown in Fig. 2b. However, in the increasing concavity stage, a hysteresis response is observed. The median Δℒ in the increasing concavity stage is lower than that of the same concavity value in the decreasing concavity stage and overall shows only a slight increase compared to the median Δℒ of the landscape with θ=0.1 (black frame in Fig. 7). Consequently, when the concavity index returns to its initial value of θ = 0.9 (purple frame in Fig. 7), the median Δℒ of the landscape is smaller by a factor of 2.4 with respect to the median Δℒ of the initial conditions with the same concavity index.
The dynamics depicted in Fig. 7 suggest that, when aridification or a transition to a debris-flow-dominated regime takes place, there is a significant autogenic reorganization of the drainage network towards a lower-complexity configuration. In contrast, when transitioning to a more humid climate or a fluvially dominated regime, minimal reorganization is expected, and the resulting landscape may retain the complexity of the antecedent more arid or debris-flow-dominated state. This implies that the complexity of a given landscape, as reflected by Δℒ, is influenced by the lowermost concavity experienced by this landscape. For example, a low-complexity landscape, currently located in a humid climate (and exhibiting high concavity), might suggest a formation or modification history under drier (i.e., low-concavity) conditions. Differences in past aridity can therefore be invoked to explain the variability in Δℒ with aridity (Fig. 6) and the increased variability in Δℒ with concavity in the elongated mountain ranges (Fig. 2a).
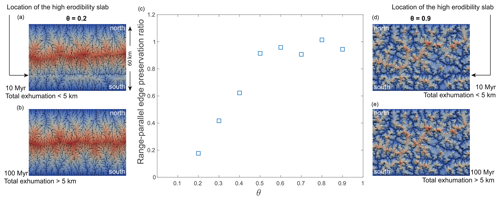
Figure 8Preservation of antecedent conditions as a function of concavity index in a DAC (Goren et al., 2014) process model simulation series. In these simulations, drainage networks evolve primarily through the incision of spatially uniform rocks, except for a narrow, elongated slab with a higher erodibility (100 times greater), a width of 1 km, and a depth that extends from the surface to 5 km into the crust. The slab is located 15 km from the southern base level. The south-draining basins originally incise into the slab-containing rocks, and the drainage network locally aligns with the high-erodibility slab, forming longitudinal channels regardless of the concavity index (topographies at the top of the figure). Following a 5 km exhumation, the slab is fully eroded away and rivers incise into uniformly erodible strata. Drainage network response to the removal of the slab depends on the concavity index. In simulations of low concavity (topographic maps on the left; a and b), significant drainage reorganization removes the longitudinal segments (topography at the bottom left; b). In contrast, high-concavity landscapes (topographic maps to the right; d and e) preserve the antecedent longitudinal segments after the slab is eroded (topography at the bottom right; e). The central graph (c) presents the preservation ratio by counting the number of longitudinal segments at 100 Myr (after slab removal by erosion) and dividing it by the number of longitudinal segments at 10 Myr (while the high-erodibility slab is still present) for all south-draining basins.
5.4.2 Fingerprints of antecedent lithologic conditions
To explore another scenario in which the complexity records the legacy of past conditions, we focus on the effect of lithology in a second set of simulations. Here, drainage networks evolve from a subdued, random topography, similar to the simulations depicted in Fig. 2b. However, in this case, a narrow, 1 km wide slab protrudes into the surrounding rocks. The slab extends down to a depth of 5 km into the crust and is positioned midway between the center of the domain and the southern base level of the evolving range, as shown in Fig. 8. The slab's erodibility is higher by a factor of 100 compared to that of the surrounding rocks. This high-erodibility slab can be conceptualized as a fault zone containing crushed, more erodible rocks.
During the initial period of approximately 10 Myr (with an imposed uplift rate of 5 × 10⁻⁴ m yr−1), the developing channel networks incise into the layers of rock protruded by the higher-erodibility slab. Once the slab is fully removed by erosional exhumation of 5 km, the networks continue to incise into rocks with a uniform erodibility.
The simulation results reveal distinct behaviors of the drainage networks over time, depending on the concavity index and the presence of a high-erodibility slab. In the first 10 Myr, south-draining channel segments favor the high-erodibility slab, resulting in channel segments that develop on top of the slab (Duvall et al., 2020), parallel to the mountain range, with an east–west orientation. However, beyond this period, after the high-erodibility slab has been eroded, the response of the drainage networks diverges based on the concavity index.
To quantitatively assess this response, we analyze the number of slab-parallel channel longitudinal segments whose orientations are within 10° of the slab's orientation, where a segment connects two neighboring numerical nodes. Figure 8 illustrates the ratio of longitudinal segments after 100 Myr (post-slab removal by erosion) to the number of longitudinal segments at 10 Myr, prior to the complete exhumation of the slab, for south-draining basins. As the concavity index increases, a greater preservation of longitudinal segments is observed, although the slab is completely eroded. In the case of a landscape with θ=0.9 (right-hand side of Fig. 8), the drainage pattern predominantly retains the legacy of the high-erodibility slab, resulting in a preservation ratio of longitudinal segments close to 1. Conversely, a landscape with θ=0.2 (left-hand side of Fig. 8) is characterized by lower preservation of longitudinal segments after the removal of the high-erodibility slab, leading to a low preservation ratio.
The slab simulation set reveals that environmental conditions that sustained a high concavity index over long timescales resulted in drainage networks that recorded the cumulative effect of spatially varying heterogeneities (e.g., lithology) even long after these heterogeneities were removed. In contrast, environmental conditions associated with a low concavity index might eliminate traces of past spatial heterogeneities.
The two simulation sets indicate that landscapes with high concavity indexes are less sensitive to variations in exogenic forcing. As a result, high-concavity-index landscapes can preserve the original drainage patterns (Kwang and Parker, 2019), their specific complexity, and the legacy of the environmental conditions in which these landscapes initially formed. Conversely, networks with low concavity indexes undergo reorganization to attain a configuration of lower complexity in response to any environmental, climatic, and tectonic changes. Consequently, they possess a limited capacity to retain the legacy of the previous environmental conditions.
The current analysis reveals that the channel concavity index, θ, reflecting the channel longitudinal profile, sets a first-order control on the planform complexity of drainage networks as quantified by the statistics of asymmetry in the length of paired flow pathways, Δℒ. The variability in concavity indices thus explains the observed variability in complexity across the globe. Specifically, θ controls the multiplicity of stable planform configurations available to a drainage network. When θ is small, the number of stable configurations is small, and they are all characterized by high lengthwise symmetry, producing simple-looking drainage networks. When θ is large, the number of stable planform configurations increases, and they include configurations with a large degree of lengthwise asymmetry, producing complex geometry. Consequently, high-θ drainages can be found in topological stable configurations that are characterized by high lengthwise asymmetry (i.e., high complexity), whereas the stability of low-θ drainages is conditioned by a smaller lengthwise asymmetry (i.e., low complexity). These findings can be theoretically explained based on an energy minimization principle or by combining two empirical power laws that are readily documented across the globe: Hack's law, Eq. (6), and Flint's law, Eq. (1), describing the relation between drainage area and, respectively, channel length and channel slope. The multiplicity of steady configurations of high-θ landscapes further means that the planform geometry of these networks more readily preserves the legacy of former conditions (Kwang and Parker, 2019).
Drainage network complexity of elongated mountain ranges correlates with the aridity index, a measure of climate dryness. The correlation emerges despite the relatively small number of natural ranges we analyzed and is intuit through the effect of climate on channel formative concavity (Whipple and Tucker, 1999). Therefore, the geometric complexity of drainage networks over entire mountain ranges records information about prevailing climatic conditions.
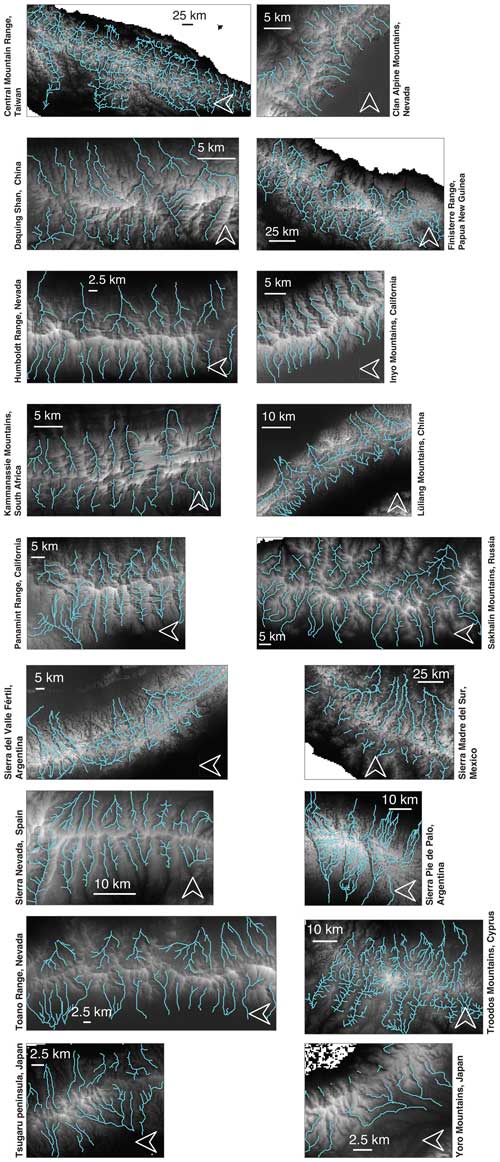
Comprehensive details of the 18 elongated mountain ranges and the data utilized for generating Figs. 2a and 6 are listed in Table A1. The ranges' relief and drainage networks are depicted in Fig. A1.
Table A1Elongated Mountain Ranges1.

1 Data based on threshold drainage area of 145 pixels corresponding to ≈ 1 km2. Values to the left of the parentheses are the median. Values in parentheses correspond to the 25th and 75th percentiles of the population.
2 Latitude, longitude, and elevation of the highest peak in the range.
3 Elevation of the minimal closed contour defining the bounds of the range.
4 The total drainage area of the main basins in the range, draining the main divide to the mountain front, at elevation zth used for the analysis. The calculation of θ, Δℒ, and Δχ is based on the drainage network defined by these basins, and the calculation of the aridity index statistics is based on a mask defined by the boundaries of these basins.
5 Apparent steepness index based on the linear regression slope of the χ–z domain.
6 The aridity index is calculated based on a mask defined by the main basins, based on Zomer et al. (2022).
7 Number of paired flow pathways analyzed for Δℒ and Δχ.
8 Due to the extensive area of these ranges, the concavity index calculation and the extraction of the channel heads used for the analysis of Δℒ and Δχ were based on a trimmed drainage network after eliminating channels of Strahler order 1.
Channels of small drainage areas are sometimes associated with a low concavity index, reflecting the dominance of debris flows (Stock and Dietrich, 2006). Therefore, we explore the sensitivity of the results to the threshold drainage area used for network extraction. Figure 1a shows the relation between θ and Δℒ for 18 elongated mountain ranges across the globe. The figure is based on drainage network extraction using a drainage area threshold of 145 pixels, corresponding to ≈ 1 km2. Figure B1 shows that, when the drainage network is defined based on different thresholds, the distributions of θ, Δℒ, and Δχ vary, but the emerging trends between these parameters are generally independent of the threshold drainage area.

Figure B1The effect of threshold drainage area, A0, used for the extraction of the drainage network on the relations between Δℒ or Δχ and the concavity index, θ. The choice of A0 affects the calculated values, but the positive relation between Δℒ and θ and the less significant correlation between Δχ and θ are reproduced in all cases. The three panels (a–c) show data for the same elongated ranges, except the Taiwanese Central Mountain Range, which is omitted from the left panel because the concavity estimation with A0≈ 0.34 km2 produced a bimodal distribution of values.
The erodibility coefficients used in the DAC simulations, as shown in Fig. 2b, were varied along with the value of θ to maintain an approximately equal range relief (Willett, 2010). These values are listed in Table C1.
Table C1Concavity index and erodibility in the DAC simulations∗.
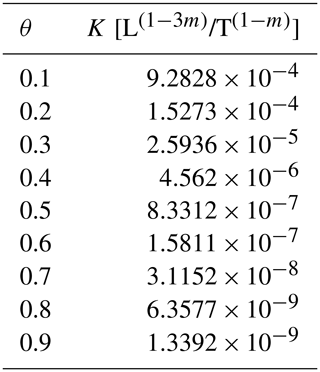
∗ Parameters used in the simulations depicted in Fig. 2b.
To ensure that the erodibility itself does not control Δℒ, we repeat a subset of the simulations, where the concavity index varies, and the erodibility is kept constant, resulting in numerical ranges of drastically different relief. Figure C1 shows the same trend as in Fig. 2b in the main text, indicating that this trend is independent of changing the erodibility index.
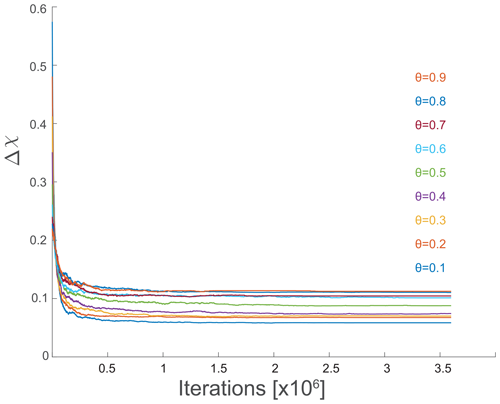
The main text shows the evolution of the normalized energy equivalent and Δℒ as functions of iteration number during the greedy OCN optimization application. Here, the behavior of Δχ is shown throughout the iteration process to highlight the parallelism between the two definitions of stable networks: achieving minimal Δχ across divides and minimizing the normalized energy equivalent. Figure D1 shows that the energy minimization process also decreases the median Δχ. However, compared to the normalized energy equivalent and the Δℒ trends (Fig. 4a and b in the main text), the Δχ decrease is more uniform across values of θ, as also seen in Fig. 2c in the main text. Furthermore, the decrease in Δχ is non-monotonous.
OCNs can be linked to drainage network evolution over topography (Banavar et al., 2001). Banavar et al. (2001) found that any edge flip resulting in a reduction in the network's total energy indicates that the flip occurred towards a steeper immediate neighbor. While such a flip aligns with a decrease in Δχ between the pre- and post-flip channel heads, the non-monotonic trends of Δχ depicted in Fig. D1 indicate that the median Δχ of the network, encompassing the entire model domain, does not necessarily decrease following an edge flip. This is likely because a single flip changes the drainage area distribution along the two affected basins, which can also change the Δχ across other channel head pairs.
Figure E1 depicts the relationship between the concavity index, θ, and the aridity index, AI, for the 18 elongated mountain ranges we studied. Although a positive trend is apparent, the Spearman's rank correlation coefficient for this correlation is 0.37, and the correlation is statistically insignificant with a P-value of 0.13. In contrast, the data shown in Fig. 6 for the relationship between complexity, quantified with Δℒ and the aridity index, are statistically significant.
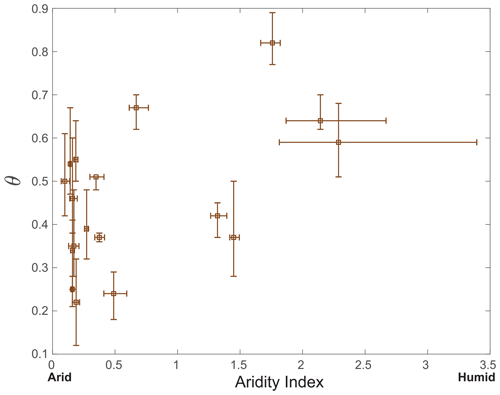
Figure E1The relation between the concavity index, θ, and the aridity index, the quotient of precipitation and evapotranspiration potential (Zomer et al., 2022), for the 18 elongated mountain ranges analyzed in Fig. 2a. The box symbols represent the median values, and the bars show the 25th and 75th percentiles. Despite the positive trend, the Spearman's rank correlation is statistically insignificant (P=0.13).
This raises the question of why the aridity index better correlates with complexity than with the concavity index, particularly since previous studies, which used larger datasets, identified a correlation between θ and climate (Zaprowski et al., 2005; Chen et al., 2019; Getraer and Maloof, 2021). A possible interpretation is that the measurement of channel concavity in natural settings and a particular point in time might encompass several environmental factors, including variations in tectonics (i.e., Seybold et al., 2021) and rock types, introducing noise into the relationship between concavity index and aridity index. In contrast, our analyses, based on Hack's law and OCN theory, demonstrate that network complexity, Δℒ, is contingent on the channel formative concavity index. This index is expected to depend on hydrologic conditions (Whipple and Tucker, 1999) and therefore to exhibit a more robust correlation with climate (assuming the relative aridity of the analyzed sites did not meaningfully change since network formation).
The codes used in this contribution can be found in Goren (2024) (https://doi.org/10.5281/zenodo.13934906). Updates on newer versions will be available at https://github.com/gorenl/ConcavityControlsComplexity (last access: 3 December 2024).
LG and ES conceptualized the project and designed the analysis. LG developed the code and executed the analysis. ES contributed to the interpretation of the results. LG wrote the first draft and prepared the figures. LG and ES edited the text.
The contact author has declared that none of the authors has any competing interests.
Publisher's note: Copernicus Publications remains neutral with regard to jurisdictional claims made in the text, published maps, institutional affiliations, or any other geographical representation in this paper. While Copernicus Publications makes every effort to include appropriate place names, the final responsibility lies with the authors.
The authors thank Ravid Hagbi for compiling the aridity index data used for producing Fig. 6. The authors thank Fergus McNab and an anonymous reviewer for their constructive and helpful comments and associate editor Fiona Club for handling the manuscript.
This research has been supported by the United States – Israel Binational Science Foundation (grant no. 2019656), the National Science Foundation (grant no. 1946253), and the Israel Science Foundation (grant no. 562/19).
This paper was edited by Fiona Clubb and reviewed by Fergus McNab and one anonymous referee.
Abed-Elmdoust, A., Miri, M.-A., and Singh, A.: Reorganization of river networks under changing spatiotemporal precipitation patterns: An optimal channel network approach, Water Resour. Res., 52, 8845–8860, https://doi.org/10.1002/2015WR018391, 2016. a, b
Badgley, C., Smiley, T. M., Terry, R., Davis, E. B., DeSantis, L. R., Fox, D. L., Hopkins, S. S., Jezkova, T., Matocq, M. D., Matzke, N., McGuire, J. L., Mulch, A., Riddle, B. R., Roth, V. L., Samuels, J. X., Strömberg, C. A., and Yanites, B. J.: Biodiversity and Topographic Complexity: Modern and Geohistorical Perspectives, Trends Ecol. Evol., 32, 211–226, https://doi.org/10.1016/j.tree.2016.12.010, 2017. a
Banavar, J. R., Colaiori, F., Flammini, A., Maritan, A., and Rinaldo, A.: Scaling, Optimality, and Landscape Evolution, J. Stat. Phys., 104, 1–48, https://doi.org/10.1023/A:1010397325029, 2001. a, b, c
Beeson, H. W., McCoy, S. W., and Keen-Zebert, A.: Geometric disequilibrium of river basins produces long-lived transient landscapes, Earth Planet. Sc. Lett., 475, 34–43, https://doi.org/10.1016/j.epsl.2017.07.010, 2017. a
Beeson, H. W., Willett, S., Pellissier, L., and Wang, Y.: Identifying causal links between tectonic processes and biodiversity in an orogenic wedge setting with a coupled landscape-biodiversity evolution model, in: AGU Fall Meeting 2021, New Orleans, LA, 13–17 December 2021, id. B53C-06, 2021. a
Braun, J., Robert, X., and Simon-Labric, T.: Eroding dynamic topography, Geophys. Res. Lett., 40, 1494–1499, https://doi.org/10.1002/grl.50310, 2013. a
Castelltort, S., Goren, L., Willett, S. D., Champagnac, J.-D., Herman, F., and Braun, J.: River drainage patterns in the New Zealand Alps primarily controlled by plate tectonic strain, Nat. Geosci., 5, 744–748, https://doi.org/10.1038/NGEO1582, 2012. a
Caylor, K. K., Manfreda, S., and Rodriguez-Iturbe, I.: On the coupled geomorphological and ecohydrological organization of river basins, Adv. Water Resour., 28, 69–86, https://doi.org/10.1016/j.advwatres.2004.08.013, 2005. a
Chen, S.-A., Michaelides, K., Grieve, S. W. D., and Singer, M. B.: Aridity is expressed in river topography globally, Nature, 573, 573–577, https://doi.org/10.1038/s41586-019-1558-8, 2019. a, b, c
Colaiori, F., Flammini, A., Maritan, A., and Banavar, J. R.: Analytical and numerical study of optimal channel networks, Phys. Rev. E, 55, 1298–1310, https://doi.org/10.1103/PhysRevE.55.1298, 1997. a, b
Cowie, P., Attal, M., Tucker, G. E., Whittaker, A. C., Naylor, M., Ganas, A., and Roberts, G. P.: Investigating the surface process response to fault interaction and linkage using a numerical modelling approach, Basin Res., 18, 231–266, https://doi.org/10.1111/j.1365-2117.2006.00298.x, 2006. a
De Bartolo, S., Dell'Accio, F., Frandina, G., Moretti, G., Orlandini, S., and Veltri, M.: Relation between grid, channel, and Peano networks in high-resolution digital elevation models, Water Resour. Res., 52, 3527–3546, https://doi.org/10.1002/2015WR018076, 2016. a
Devauchelle, O., Petroff, A. P., Seybold, H. F., and Rothman, D. H.: Ramification of stream networks, P. Natl. Acad. Sci. USA, 109, 20832–20836, https://doi.org/10.1073/pnas.1215218109, 2012. a
DiBiase, R. A., Whipple, K. X., Heimsath, A. M., and Ouimet, W. B.: Landscape form and millennial erosion rates in the San Gabriel Mountains, CA, Earth Planet. Sc. Lett., 289, 134–144, https://doi.org/10.1016/j.epsl.2009.10.036, 2010. a
Dodds, P. S. and Rothman, D. H.: Scaling, universality, and geomorphology, Annu. Rev. Earth Pl. Sc., 28, 571–610, https://doi.org/10.1146/annurev.earth.28.1.571, 2000. a
Duvall, A. R., Harbert, S. A., Upton, P., Tucker, G. E., Flowers, R. M., and Collett, C.: River patterns reveal two stages of landscape evolution at an oblique convergent margin, Marlborough Fault System, New Zealand, Earth Surf. Dynam., 8, 177–194, https://doi.org/10.5194/esurf-8-177-2020, 2020. a
Flint, J. J.: Stream gradient as a function of order, magnitude, and discharge, Water Resour. Res., 10, 969–973, https://doi.org/10.1029/WR010i005p00969, 1974. a
Freund, E. R., Seybold, H., Jasechko, S., and Kirchner, J. W.: Groundwater's Fingerprint in Stream Network Branching Angles, Geophys. Res. Lett., 50, e2023GL103599, https://doi.org/10.1029/2023GL103599, e2023GL103599 2023GL103599, 2023. a, b
Gailleton, B., Mudd, S. M., Clubb, F. J., Grieve, S. W. D., and Hurst, M. D.: Impact of Changing Concavity Indices on Channel Steepness and Divide Migration Metrics, J. Geophys. Res.-Earth, 126, e2020JF006060, https://doi.org/10.1029/2020JF006060, 2021. a, b, c, d, e
Gangodagamage, C., Foufoula-Georgiou, E., and Belmont, P.: River basin organization around the main stem: Scale invariance in tributary branching and the incremental area function, J. Geophys. Res.-Earth, 119, 2174–2193, https://doi.org/10.1002/2014JF003304, 2014. a
Getraer, A. and Maloof, A. C.: Climate-Driven Variability in Runoff Erosion Encoded in Stream Network Geometry, Geophys. Res. Lett., 48, e2020GL091777, https://doi.org/10.1029/2020GL091777, 2021. a, b, c
Goren, L.: Codes and data used in: Channel concavity controls planform complexity of branching drainage networks, Zenodo [code], https://doi.org/10.5281/zenodo.13934906, 2024. a
Goren, L., Willett, S. D., Herman, F., and Braun, J.: Coupled numerical–analytical approach to landscape evolution modeling, Earth Surf. Proc. Land., 39, 522–545, https://doi.org/10.1002/esp.3514, 2014. a, b, c, d, e, f, g, h
Goren, L., Castelltort, S., and Klinger, Y.: Modes and rates of horizontal deformation from rotated river basins: Application to the Dead Sea fault system in Lebanon, Geology, 43, 843–846, https://doi.org/10.1130/G36841.1, 2015. a, b
Habousha, K., Goren, L., Nativ, R., and Gruber, C.: Plan-Form Evolution of Drainage Basins in Response to Tectonic Changes: Insights From Experimental and Numerical Landscapes, J. Geophys. Res.-Earth, 128, e2022JF006876, https://doi.org/10.1029/2022JF006876, 2023. a, b, c, d
Hamawi, M., Goren, L., Mushkin, A., and Levi, T.: Rectangular drainage pattern evolution controlled by pipe cave collapse along clastic dikes, the Dead Sea Basin, Israel, Earth Surf. Proc. Land., 47, 936–954, https://doi.org/10.1002/esp.5295, 2022. a
Hergarten, S., Robl, J., and Stüwe, K.: Tectonic geomorphology at small catchment sizes – extensions of the stream-power approach and the χ method, Earth Surf. Dynam., 4, 1–9, https://doi.org/10.5194/esurf-4-1-2016, 2016. a, b
Hooshyar, M., Singh, A., and Wang, D.: Hydrologic controls on junction angle of river networks, Water Resour. Res., 53, 4073–4083, https://doi.org/10.1002/2016WR020267, 2017. a
Horton, R. E.: Erosional development of streams and their drainage basins; hydrophysical approach to quantitative morphology, GSA Bulletin, 56, 275–370, https://doi.org/10.1130/0016-7606(1945)56[275:EDOSAT]2.0.CO;2, 1945. a
Howard, A. D.: Optimal Angles of Stream Junction: Geometric, Stability to Capture, and Minimum Power Criteria, Water Resour. Res., 7, 863–873, https://doi.org/10.1029/WR007i004p00863, 1971. a, b
Howard, A. D.: Theoretical model of optimal drainage networks, Water Resour. Res., 26, 2107–2117, https://doi.org/10.1029/WR026i009p02107, 1990. a, b, c
Howard, A. D.: A detachment-limited model of drainage basin evolution, Water Resour. Res., 30, 2261–2285, https://doi.org/10.1029/94WR00757, 1994. a, b, c, d
Khosh Bin Ghomash, S., Caviedes-Voullieme, D., and Hinz, C.: Effects of erosion-induced changes to topography on runoff dynamics, J. Hydrol., 573, 811–828, https://doi.org/10.1016/j.jhydrol.2019.04.018, 2019. a
Kwang, J. S. and Parker, G.: Extreme Memory of Initial Conditions in Numerical Landscape Evolution Models, Geophys. Res. Lett., 46, 6563–6573, https://doi.org/10.1029/2019GL083305, 2019. a, b, c
Liu, Y., Wang, Y., Willett, S. D., Zimmermann, N. E., and Pellissier, L.: Escarpment evolution drives the diversification of the Madagascar flora, Science, 383, 653–658, https://doi.org/10.1126/science.adi0833, 2024. a
Michaelides, K., Chen, S.-A., Grieve, S., and Singer, M. B.: Reply to: Climate versus tectonics as controls on river profiles, Nature, 612, E15–E17, https://doi.org/10.1038/s41586-022-05419-0, 2022. a
Molnár, P. and Ramírez, J. A.: Energy dissipation theories and optimal channel characteristics of river networks, Water Resour. Res., 34, 1809–1818, https://doi.org/10.1029/98WR00983, 1998. a
Montgomery, D. R. and Dietrich, W. E.: Channel Initiation and the Problem of Landscape Scale, Science, 255, 826–830, https://doi.org/10.1126/science.255.5046.826, 1992. a
Mudd, S. M., Clubb, F. J., Gailleton, B., and Hurst, M. D.: How concave are river channels?, Earth Surf. Dynam., 6, 505–523, https://doi.org/10.5194/esurf-6-505-2018, 2018. a
Mudd, S. M., Roda-Boluda, D. C., Goren, L., and Clubb, F. J.: Beyond the Long Profile, in: Treatise on Geomorphology, second edn., edited by: Shroder, J. J. F., Academic Press, Oxford, https://doi.org/10.1016/B978-0-12-818234-5.00026-2, pp. 22–52, 2022. a, b
Mueller, J. E.: Re-Evaluation of Relationship of Master Streams and Drainage Basins, Geol. Soc. Am. Bull., 83, 3471–3474, https://doi.org/10.1130/0016-7606(1972)83{[}3471:ROTROM]2.0.CO;2, 1972. a
NASA Shuttle Radar Topography Mission (SRTM): Shuttle Radar Topography Mission (SRTM) Global, Distributed by OpenTopography, https://doi.org/10.5069/G9445JDF, 2013. a
Pelletier, J. D. and Turcotte, D. L.: Shapes of river networks and leaves: are they statistically similar?, Philos. T. Roy. Soc. B, 355, 307–311, https://doi.org/10.1098/rstb.2000.0566, 2000. a
Pelletier, J. D., Barron-Gafford, G. A., Gutiérrez-Jurado, H., Hinckley, E.-L. S., Istanbulluoglu, E., McGuire, L. A., Niu, G.-Y., Poulos, M. J., Rasmussen, C., Richardson, P., Swetnam, T. L., and Tucker, G. E.: Which way do you lean? Using slope aspect variations to understand Critical Zone processes and feedbacks, Earth Surf. Proc. Land., 43, 1133–1154, https://doi.org/10.1002/esp.4306, 2018. a, b
Perron, J. T. and Royden, L.: An integral approach to bedrock river profile analysis, Earth Surf. Proc. Land., 38, 570–576, https://doi.org/10.1002/esp.3302, 2013. a
Perron, J. T., Dietrich, W. E., and Kirchner, J. W: Controls on the spacing of first-order valleys, J. Geophys. Res.-Earth, 113, https://doi.org/10.1029/2007JF000977, 2008. a
Ramsey, L. A., Walker, R. T., and Jackson, J.: Geomorphic constraints on the active tectonics of southern Taiwan, Geophys. J. Int., 170, 1357–1372, https://doi.org/10.1111/j.1365-246X.2007.03444.x, 2007. a
Ranjbar, S., Singh, A., and Wang, D.: Controls of the Topological Connectivity on the Structural and Functional Complexity of River Networks, Geophys. Res. Lett., 47, e2020GL087737, https://doi.org/10.1029/2020GL087737, 2020. a, b, c
Rigon, R., Rodriguez-Iturbe, I., Maritan, A., Giacometti, A., Tarboton, D. G., and Rinaldo, A.: On Hack's Law, Water Resour. Res., 32, 3367–3374, https://doi.org/10.1029/96WR02397, 1996. a
Rinaldo, A., Rodriguez-Iturbe, I., Rigon, R., Bras, R. L., Ijjasz-Vasquez, E., and Marani, A.: Minimum energy and fractal structures of drainage networks, Water Resour. Res., 28, 2183–2195, https://doi.org/10.1029/92WR00801, 1992. a, b, c
Rodriguez-Iturbe, I. and Rinaldo, A.: Fractal river basins: chance and self-organization, Cambridge University Press, ISBN 9780521004053, 2001. a, b
Rodríguez-Iturbe, I. and Valdés, J. B.: The geomorphologic structure of hydrologic response, Water Resour. Res., 15, 1409–1420, https://doi.org/10.1029/WR015i006p01409, 1979. a
Rodríguez-Iturbe, I., Rinaldo, A., Rigon, R., Bras, R. L., Marani, A., and Ijjász-Vásquez, E.: Energy dissipation, runoff production, and the three-dimensional structure of river basins, Water Resour. Res., 28, 1095–1103, https://doi.org/10.1029/91WR03034, 1992. a, b
Roe, G. H., Montgomery, D. R., and Hallet, B.: Effects of orographic precipitation variations on the concavity of steady-state river profiles, Geology, 30, 143–146, https://doi.org/10.1130/0091-7613(2002)030<0143:EOOPVO>2.0.CO;2, 2002. a
Sassolas-Serrayet, T., Cattin, R., and Ferry, M.: The shape of watersheds, Nat. Commun., 9, 3791, https://doi.org/10.1038/s41467-018-06210-4, 2018. a
Scherler, D. and Schwanghart, W.: Drainage divide networks – Part 1: Identification and ordering in digital elevation models, Earth Surf. Dynam., 8, 245–259, https://doi.org/10.5194/esurf-8-245-2020, 2020a. a, b
Scherler, D. and Schwanghart, W.: Drainage divide networks – Part 2: Response to perturbations, Earth Surf. Dynam., 8, 261–274, https://doi.org/10.5194/esurf-8-261-2020, 2020b. a
Schwanghart, W. and Scherler, D.: Short Communication: TopoToolbox 2 – MATLAB-based software for topographic analysis and modeling in Earth surface sciences, Earth Surf. Dynam., 2, 1–7, https://doi.org/10.5194/esurf-2-1-2014, 2014. a
Scott, D. N. and Wohl, E. E.: Bedrock fracture influences on geomorphic process and form across process domains and scales, Earth Surf. Proc. Land., 44, 27–45, https://doi.org/10.1002/esp.4473, 2019. a
Seybold, H., Berghuijs, W. R., Prancevic, J. P., and Kirchner, J. W.: Global dominance of tectonics over climate in shaping river longitudinal profiles, Nat. Geosci., 14, 503–507, https://doi.org/10.1038/s41561-021-00720-5, 2021. a, b, c
Sharp, R. P. and Malin, M. C.: Channels on Mars, GSA Bulletin, 86, 593–609, https://doi.org/10.1130/0016-7606(1975)86<593:COM>2.0.CO;2, 1975. a
Shelef, E.: Channel Profile and Plan-View Controls on the Aspect Ratio of River Basins, Geophys. Res. Lett., 45, 11712–11721, https://doi.org/10.1029/2018GL080172, 2018. a
Shelef, E. and Goren, L.: The rate and extent of wind-gap migration regulated by tributary confluences and avulsions, Earth Surf. Dynam., 9, 687–700, https://doi.org/10.5194/esurf-9-687-2021, 2021. a
Shelef, E. and Hilley, G. E.: Symmetry, randomness, and process in the structure of branched channel networks, Geophys. Res. Lett., 41, 3485–3493, https://doi.org/10.1002/2014GL059816, 2014. a, b, c, d, e, f
Shen, X., Anagnostou, E. N., Mei, Y., and Hong, Y.: A global distributed basin morphometric dataset, Scientific Data, 4, 160124, https://doi.org/10.1038/sdata.2016.124, 2017. a
Sólyom, P. B. and Tucker, G. E.: The importance of the catchment area–length relationship in governing non-steady state hydrology, optimal junction angles and drainage network pattern, Geomorphology, 88, 84–108, https://doi.org/10.1016/j.geomorph.2006.10.014, 2007. a
Stock, J. D. and Dietrich, W. E.: Erosion of steepland valleys by debris flows, GSA Bulletin, 118, 1125–1148, https://doi.org/10.1130/B25902.1, 2006. a, b, c
Stokes, M. F. and Perron, J. T.: Modeling the Evolution of Aquatic Organisms in Dynamic River Basins, J. Geophys. Res.-Earth, 125, e2020JF005652, https://doi.org/10.1029/2020JF005652, 2020. a, b
Strong, C. M. and Mudd, S. M.: Explaining the climate sensitivity of junction geometry in global river networks, P. Natl. Acad. Sci. USA, 119, e2211942119, https://doi.org/10.1073/pnas.2211942119, 2022. a, b, c
Strong, C. M., Attal, M., Mudd, S. M., and Sinclair, H. D.: Lithological control on the geomorphic evolution of the Shillong Plateau in Northeast India, Geomorphology, 330, 133–150, https://doi.org/10.1016/j.geomorph.2019.01.016, 2019. a
Sun, T., Meakin, P., and Jøssang, T.: Minimum energy dissipation model for river basin geometry, Phys. Rev. E, 49, 4865–4872, https://doi.org/10.1103/PhysRevE.49.4865, 1994a. a
Sun, T., Meakin, P., and Jøssang, T.: The topography of optimal drainage basins, Water Resour. Res., 30, 2599–2610, https://doi.org/10.1029/94WR01050, 1994b. a, b, c, d, e
Thomas, J., Joseph, S., Thrivikramji, K. P., and Abe, G.: Morphometric analysis of the drainage system and its hydrological implications in the rain shadow regions, Kerala, India, J. Geogr. Sci., 21, 1077–1088, https://doi.org/10.1007/s11442-011-0901-2, 2011. a
Tucker, G. E. and Whipple, K. X.: Topographic outcomes predicted by stream erosion models: Sensitivity analysis and intermodel comparison, J. Geophys. Res.-Sol. Ea., 107, ETG 1-1–ETG 1-16, https://doi.org/10.1029/2001JB000162, 2002. a, b, c
Ward, D. J.: Dip, layer spacing, and incision rate controls on the formation of strike valleys, cuestas, and cliffbands in heterogeneous stratigraphy, Lithosphere, 11, 697–707, https://doi.org/10.1130/L1056.1, 2019. a
Whipple, K. X. and Tucker, G. E.: Dynamics of the stream-power river incision model: Implications for height limits of mountain ranges, landscape response timescales, and research needs, J. Geophys. Res.-Sol. Ea., 104, 17661–17674, https://doi.org/10.1029/1999JB900120, 1999. a, b, c, d, e, f, g
Whipple, K. X. and Tucker, G. E.: Implications of sediment-flux-dependent river incision models for landscape evolution, J. Geophys. Res.-Sol. Ea., 107, https://doi.org/10.1029/2000JB000044, 2002. a
Willemin, J. H.: Hack's law: Sinuosity, convexity, elongation, Water Resour. Research., 36, 3365–3374, https://doi.org/10.1029/2000WR900229<y, 2000. a
Willett, S. D.: Erosion on a line, Tectonophysics, 484, 168–180, https://doi.org/10.1016/j.tecto.2009.09.011, 2010. a
Willett, S. D., McCoy, S. W., Perron, J. T., Goren, L., and Chen, C.-Y.: Dynamic Reorganization of River Basins, Science, 343, 1248765, https://doi.org/10.1126/science.1248765, 2014. a, b, c
Willett, S. D., McCoy, S. W., and Beeson, H. W.: Transience of the North American High Plains landscape and its impact on surface water, Nature, 561, 528–532, https://doi.org/10.1038/s41586-018-0532-1, 2018. a
Willgoose, G., Bras, R. L., and Rodriguez-Iturbe, I.: A physical explanation of an observed link area-slope relationship, Water Resour. Res., 27, 1697–1702, https://doi.org/10.1029/91WR00937, 1991. a
Yi, R. S., Arredondo, Á., Stansifer, E., Seybold, H., and Rothman, D. H.: Shapes of river networks, P. Roy. Soc. A-Math. Phy., 474, 20180081, https://doi.org/10.1098/rspa.2018.0081, 2018. a
Zanardo, S., Zaliapin, I., and Foufoula-Georgiou, E.: Are American rivers Tokunaga self-similar? New results on fluvial network topology and its climatic dependence, J. Geophys. Res.-Earth, 118, 166–183, https://doi.org/10.1029/2012JF002392, 2013. a
Zaprowski, B. J., Pazzaglia, F. J., and Evenson, E. B.: Climatic influences on profile concavity and river incision, J. Geophys. Res.-Earth, 110, F3, https://doi.org/10.1029/2004JF000138, 2005. a, b, c
Zomer, R. J., Xu, J., and Trabucco, A.: Version 3 of the Global Aridity Index and Potential Evapotranspiration Database, Scientific Data, 9, 409, https://doi.org/10.1038/s41597-022-01493-1, 2022. a, b, c, d, e, f
- Abstract
- Introduction
- Quantifying the complexity and stability of branching drainage networks
- Methods
- Results – concavity correlates with lengthwise asymmetry in natural and numerical mountain ranges
- Discussion
- Conclusions
- Appendix A: Elongated mountain ranges
- Appendix B: θ – Δℒ insensitivity to threshold drainage area in natural mountain ranges
- Appendix C: θ – Δℒ and the erodibility in the numerical DAC simulations
- Appendix D: The evolution of Δχ during OCN simulations
- Appendix E: Aridity index (AI), concavity index, and complexity
- Code availability
- Data availability
- Author contributions
- Competing interests
- Disclaimer
- Acknowledgements
- Financial support
- Review statement
- References


