the Creative Commons Attribution 4.0 License.
the Creative Commons Attribution 4.0 License.
Post-fire evolution of ravel transport regimes in the Diablo Range, CA
Danica L. Roth
Gabriel Walton
Margaret Zimmer
Kerri Johnson
Post-fire changes to the transport regime of dry ravel, which describes the gravity-driven transport of individual particles downslope, are poorly constrained but critical to understand as ravel may contribute to elevated sediment fluxes and associated debris flow activity observed post-fire in the western United States. In this study, we evaluated post-fire variability in dry ravel travel distance exceedance probabilities and disentrainment rates in the Diablo Range of central coastal California following the Santa Clara Unit Lightning Complex fire of August 2020. Between March 2021 and March 2022, we conducted repeat field experiments simulating ravel with in situ particles (3–35 mm diameter) on a range of experimental surface gradients (0.38–0.81) on both grassy south-facing slopes and oak woodland north-facing slopes. We characterized post-fire evolution in particle transport by fitting a probabilistic Lomax distribution model to the empirical travel distance exceedance probabilities for each experimental particle size, surface gradient, and time period. The resulting Lomax shape and scale parameters were used to identify the transport regime for each subset of simulated ravel, ranging from “bounded” (light-tailed or local) to “runaway” (heavy-tailed or nonlocal) motion. Our experimental results indicated that as vegetation recovered over the first 2 years post-fire, the behavior of small particles (median intermediate axis of 6 mm) became less similar across the experimental sites due to different vegetation structures, whereas medium and large particles (median intermediate axes of 13 and 28 mm, respectively) exhibited a general transition from more runaway to more bounded transport, and large particles became less sensitive to surface gradient. All particle sizes exhibited a decrease in the length scale of transport with time. Of all particle subsets, larger particles on steeper slopes were more likely to experience nonlocal transport, consistent with previous observations and theory. These findings are further corroborated by hillslope and channel deposits, which suggest that large particles were preferentially evacuated from the hillslope to the channel during or immediately after the fire. Our results indicate that nonlocal transport of in situ particles likely occurs in the experimental study catchment, and the presence of wildfire increases the likelihood of nonlocal transport, particularly on steeper slopes.
- Article
(16181 KB) - Full-text XML
- BibTeX
- EndNote
The average yearly areal extent of burned land in the western United States is increasing (e.g., Parks and Abatzoglou, 2020). Fire is an effective agent of weathering and results in the mobilization of sediment, with a temporary increase in sediment transport rates frequently observed post-wildfire (e.g., Roering and Gerber, 2005; Shakesby and Doerr, 2006; Swanson, 1981; Wondzell and King, 2003). It is critical to characterize the post-fire evolution of transport mechanisms that contribute to changes in sediment transport rates, as it can inform our understanding of post-fire variability in catchment-scale sediment loading and associated hazards, such as debris flows (e.g., DiBiase and Lamb, 2019; Florsheim et al., 1991; Jackson and Roering, 2009). Additionally, the form of hillslopes in steep lands is governed by the length scale of sediment transport, and understanding post-fire sediment transport regimes informs the appropriate construction of long-term landscape evolution models (e.g., Gabet and Mendoza, 2012; Tucker and Bradley, 2010).
A contributor to the observed post-fire increase in sediment transport in the western US is dry ravel, the rarified, gravity-driven transport of individual gravels or soil aggregates, collectively referred to here as “particles”. Ravel is entrained by surface disturbances such as bioturbation or wildfire (Gabet, 2003; Jackson and Roering, 2009; Roering and Gerber, 2005). The incineration of vegetation dams during wildfires releases retained sediment on slopes greater than the angle of repose of the stored sediment, which then travels downslope as ravel (Bennett, 1982; DiBiase and Lamb, 2013). The loss of vegetation and associated surface roughness also results in reduced frictional resistance to the gravity-driven transport of ravel entrained in the months following a fire. This change may drive a transition between a distance-bounded particle motion regime defined by net kinetic energy loss via friction to a runaway motion regime defined by the conversion of gravitational potential energy to kinetic energy, resulting in net energy gain (Furbish et al., 2021a; Roth et al., 2020). On hillslopes, this transition has been observed to occur at slopes of 30–40° and has often been described as a shift from local to nonlocal transport (DiBiase et al., 2017; Furbish et al., 2021b; Gabet, 2003; Gabet and Mendoza, 2012; Roering and Gerber, 2005). Nonlocal transport describes a condition in which the upslope topography influences the flux at a downslope position, as this “nonlocal” topography controls the motions of particles that are transported long distances (Foufoula-Georgiou et al., 2010; Furbish and Haff, 2010; Furbish and Roering, 2013). A theoretical transition between local and nonlocal transport can be described in terms of the form of the particle travel distance exceedance probability distribution (i.e., the complementary cumulative distribution of travel distances). As particle motion transitions from bounded (local) to runaway (nonlocal), the form of the travel distance exceedance probability distribution transitions from light-tailed to heavy-tailed distributions (Foufoula-Georgiou et al., 2010; Gabet and Mendoza, 2012; Roth et al., 2020; Tucker and Bradley, 2010). Since the sediment flux depends on the rate of particle entrainment and the distance particles travel before disentraining, the longer particle travel distances associated with nonlocal transport are expected to result in higher sediment fluxes (e.g., DiBiase et al., 2017; Furbish and Roering, 2013).
Recent experimental work suggests that nonlocal transport may be more likely to occur post-fire due to the decreased probability of particle disentrainment, potentially leading to increased fluxes post-fire (DiBiase et al., 2017; Furbish et al., 2021b; Roth et al., 2020). Major increases in catchment-scale sediment yield due to ravel fluxes in the first year after fire are well documented in the Pacific Northwest (e.g., Jackson and Roering, 2009; Roering and Gerber, 2005; Swanson, 1981) and California (e.g., Collins and Ketcham, 2001; DiBiase and Lamb, 2013; East et al., 2021; Florsheim et al., 1991; Lavé and Burbank, 2004; Lamb et al., 2011, 2013; Perkins et al., 2022), where they have also been linked to post-fire hazards (e.g., DiBiase and Lamb, 2019; Guilinger et al., 2020; Kean et al., 2011; Wells, 1987). Even in the absence of fire, however, it has been shown that bioturbation-driven dry ravel has the potential to contribute significantly to long-term hillslope evolution and hazards in California (e.g., Black and Montgomery, 1991; Reed and Amundson, 2007), highlighting the need for clarity on the mechanics and physical controls on ravel processes.
The recognition of nonlocal transport characteristics of ravel and the failure of traditional continuum-based diffusive transport models to describe the heavy-tailed travel distance distributions associated with nonlocal transport has led to the development of alternative models to more effectively describe nonlocal transport (e.g., Furbish and Roering, 2013). Recent field experiments demonstrate that ravel particle travel distances are consistent with the Lomax distribution model theorized by Furbish and Roering (2013) and refined by Furbish et al. (2021a). Using experimental clasts dropped at a range of burned and unburned field sites, Roth et al. (2020) showed that the parameters of a Lomax distribution capture a continuum of particle motion from local to nonlocal (i.e., light- to heavy-tailed distributions) as particle size increases or slopes get steeper or smoother. Furbish et al. (2021b) found that this model accurately described particle travel distances published in previous field experiments and new laboratory experiments. However, no study to date has conducted field experiments representative of natural particle motion in a manner allowing model validation against observed post-fire deposits or tracked the evolution of particle travel distances throughout post-fire recovery to explore the conditions under which dry ravel experiences nonlocal transport.
Here, we present a series of repeat particle drop experiments conducted in March 2021, July 2021, and March 2022 at a total of seven positions on north- and south-facing hillslopes burned by the Santa Clara Unit (SCU) Lightning Complex fire in the Bay Area, CA, in summer 2020 (Fig. 1a–b). Our selection of this site and particle drop experimental design were motivated by observations of post-fire ravel entrainment by burrowing California ground squirrels and Botta's pocket gophers, which we attempted to simulate. We fit experimental particle travel distances to a Lomax distribution model to assess spatial and temporal variation in particle motion as vegetation recovered over the year and a half following the fire. Our experiments are differentiated from prior studies by the use of experimental particles collected in situ at the field site (Fig. 1c) and corroboration of results with particle size distributions measured along the study hillslope. We use our experimental results along with field-measurement-based evidence of downslope coarsening of surface deposits to constrain the influence of particle size, hillslope gradient, and aspect-dependent vegetation loss and recovery on post-fire sediment transport by dry ravel.
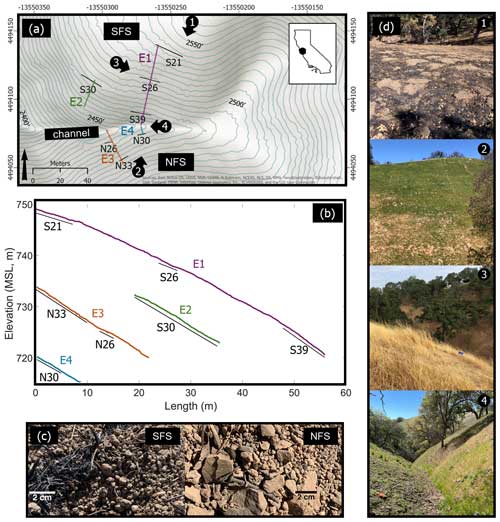
Figure 1(a) The inset map indicates the location of BORR within California. The primary map presents the layout of the particle drop starting lines (black lines) for the seven experimental sites in the Arbor Creek Catchment at BORR. Site labels reference aspect and average site slope angle (e.g., S21 corresponds to a south-facing site with slope of 21°). Lines labeled E1–E4 indicate cross sections corresponding to the elevation profiles shown in (b). The numbers 1–4 indicate the location at which site photos (d) were collected, with arrows representing photograph orientation. Coordinates are displayed as UTM northing and easting (m) NAD 1983. Elevation contours represent ∼ 1.5 m (5 ft) intervals. (b) Elevation profiles interpolated from last returns of terrestrial laser scanner data at experimental sites. Black lines indicate the maximum distance any experimental particle traveled at each site. (c) Post-fire condition of surficial material at the south-facing slope (soil, subrounded) and north-facing slope (rock, subangular). (d) Images (1–4) presenting various vantage points of the experimental catchment at different times, including 1 month post-fire (1), in spring 2021 (2), in summer 2021 (3), and in spring 2022 (4). These photos exemplify the incineration (1) and initial recovery (2) of vegetation post-fire, followed by seasonal death (3) and regrowth (4).
2.1 Field methods
Field visits occurred from September 2020 to March 2022 (Fig. 1d), and experiments were conducted in March 2021, July 2021, and March 2022 (Fig. 1d, Images 2–4). In the following sections these three experimental epochs are described as spring 2021, summer 2021, and spring 2022.
2.1.1 Study site
Our field experiments were conducted in Santa Clara County, CA, USA at the Arbor Creek Catchment in the Blue Oak Ranch Reserve (BORR), an experimental ecological reserve managed by the University of California Natural Reserve System since 1990 (Fig. 1a). The experimental catchment is located in the Diablo Range of the California Coast Ranges and is underlain by the Yolla Bolly terrain of the Franciscan assemblage (Dibblee and Minch, 2006). Sandstone, metagraywacke, and shale outcrops were observed at the field area (Donaldson et al., 2023). The Arbor Creek Catchment has a drainage area of ∼ 0.04 km2 and elevation range of ∼ 715–805 m a.s.l. The climate is Mediterranean, with warm, dry summers (August average 25 °C) and cool, dry winters (January average 8 °C). The majority of precipitation falls from October to May as rain (mean annual precipitation 600 mm), and streams are non-perennial (Donaldson et al., 2023).
The Arbor Creek Catchment consists of a generally south-facing slope (SFS) and a north-facing slope (NFS) draining to the west (Fig. 1a). The portion of the SFS used in our experiments is convex to planar with an average slope of 27° and slopes up to 43° adjacent to the channel. The portion of the NFS used in our experiments is planar to concave with an average slope of 31° and slopes up to 35°. Mobile material on the SFS generally consists of coarse, subangular to subrounded soil aggregates that move as coherent particles (Fig. 1b). On the NFS, the dominant species of mobile material is angular rocky colluvium, and a more limited fraction of soil aggregates is present relative to the SFS (Fig. 1b). Although soil compressive strength was not measured directly during our field visits, we observed that the soil at the SFS easily supported our weight with limited deformation. Where soil was present at the NFS, it would compact underfoot such that we left deep footprints, suggesting lower soil strength at the NFS relative to the SFS. Shallow soil moisture is generally greater at the NFS relative to the SFS (Donaldson et al., 2024), while soil depth is similar (30–80 cm), as is the mean depth to the saprolite–bedrock transition (5.7 m at the SFS, and 6.6 m at the NFS) (Donaldson et al., 2023).
The depth of soil at this site is assumed to bound the activity of burrowing rodents on the slope. These include both California ground squirrels (Otospermophilus beecheyi) and Botta's pocket gopher (Thomomys bottae). Observations of freshly excavated granular material overlaying the burned surface in summer 2020 (Fig. 1d, Image 1) suggest burrowing by rodents produces many of the loose particles observed on the hillslopes at the experimental site.
2.1.2 Pebble counts and particle collection
We conducted pebble line counts to obtain grain size distributions of in situ particles at different slope positions on the SFS. During each count, we measured the intermediate axis of particles (rocks or soil aggregates) at every 10 cm mark on a measuring tape laid along a 10 m contour-parallel transect. This approach is a common method of systematically sampling bed surface material in rivers (e.g., Bunte and Abt, 2001; Hey and Thorne, 1983; Wohl et al., 1996). The 10 m transect length was set by the maximum along-contour distance over which the study hillslope remained relatively planar. The 10 cm sampling interval was chosen to be larger than the intermediate diameter of the largest particles observed at the study site, while still allowing ∼ 100 measurements along each transect.
The spring 2021 pebble counts were conducted at three transects initially identified as capturing the variable slope of the SFS (S21, S26, S39), which were also used for rock drop experiments described below. Particle measurements in spring 2021 were conducted with a ruler, with 1 mm precision at S21 and S26 and 5 mm precision at S39.
The extent of subsequent pebble counts in summer 2021 and spring 2022 was expanded to include four additional cross-slope transects, for a total of seven transects spaced every 10 m downslope between the upper portion of the slope and the channel on the SFS. Particle measurements in summer 2021 and spring 2022 were conducted with a digital caliper, increasing measurement precision to 0.01 mm.
All in-channel particle measurements from summer 2021 were collected above a leaf layer that accumulated in the months after fire, providing a lower bound to the timing of ravel deposition. The channel was then excavated down to the ash layer, such that all particle measurements from spring 2022 represent material deposited between summer 2021 and spring 2022.
2.1.3 Particle drops
Particle drop experiments were conducted at a total of seven sites (Fig. 1a) to simulate ravel movement initiated by burrowing of California ground squirrels and Botta's pocket gophers. The experiments in spring 2021 were conducted in conjunction with the pebble counts along only the three original SFS transects (S21, S26, S39). Initial experiments at these sites used only the particles from the pebble counts, which were dropped immediately after measurement. To ensure adequate characterization of particle travel statistics across the full grain size distribution, additional ad hoc experiments were conducted at sites S26 and S39 with particles collected on site and sorted into bins with 0.5 cm resolution.
The preliminary results of the spring 2021 pebble counts were used to identify three particle size classes for future experiments to span the measured range of particle sizes. In summer 2021 we collected and spray-painted several hundred particles from the experimental hillslope (rocks or soil aggregates, i.e., granules) falling within three intermediate axis dimension ranges of 0.25–1 cm (small), 1–2 cm (medium), and 2–3.5 cm (large) for use in particle drop experiments (Fig. 2). These particles were used in all experiments conducted in summer 2021 and spring 2022. The grain size distribution of each particle group was later characterized by hand measurement in the lab with a digital caliper. Measured intermediate axis dimensions for each size class fell within the ranges of 0.33–0.95 cm (small), 0.97–1.72 cm (medium), and 2.27–3.25 cm (large), with median (D50) values of 0.6, 1.3, and 2.8 cm, respectively, for small, medium, and large particles (Appendix A, Table A2). We note that these values represent lower limits due to the possibility that some particles may have degraded in size without exceeding the particle size class limits. Based on the measured statistics of the particles used in summer 2021–spring 2022, we retroactively binned our data from spring 2021 into small (0.25–0.75 cm), medium (0.75–2.25 cm), and large (2.25–3.25 cm) groups to make them as comparable as possible to later epochs given the 0.5 cm precision of spring 2021 measurements.
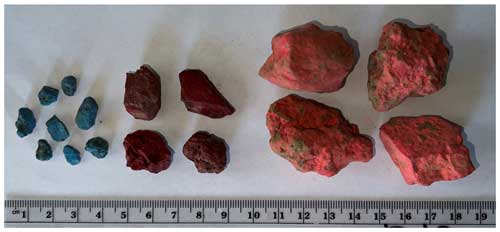
Figure 2Examples of small (left, blue), medium (middle, red), and large (right, pink) experimental particles used in particle drop experiments in summer 2021 and spring 2022. Ruler units are in centimeters.
Under these binning criteria, a range of 41 to 230 particle travel distances were included for each experimental particle size class at S21, S26, and S39 in spring 2021. At site S21, randomly selected particles of intermediate diameter larger than ∼ 2.25 cm were not present in sufficient quantities to include a large particle class in our analysis. Table A2 in Appendix A contains additional information on experimental particles for all epochs.
In addition to the three sites selected in spring 2021, four additional drop locations were selected in summer 2021 to capture a broader range of surface conditions. This includes a site at the western nose of the SFS (S30) and three sites on the NFS (N26, N30, and N33), as shown in Fig. 1a. The seven selected sites captured variation in aspect and slope over the study area. Particle drop experiments were conducted at all seven sites using the painted particles in summer 2021 and spring 2022 with a range of 100 to 200 particles dropped for each particle size class per site.
During the summer 2021 experiments, grasses at the SFS experimental transects were observed to have heights of up to 1.3 m. At our experimental sites S21 and S26 these grasses were trimmed to ensure that particle distances could be feasibly measured and particles recovered after each experiment. Grasses were trimmed to ∼ 15 cm, well above the estimated maximum particle bounce height at these sites, to avoid modifying the vegetative roughness encountered by the particles during transport.
During particle drop experiments (Fig. 3), particles were released from the middle of the palm with fingertips placed along the downhill edge of the starting line (Fig. 3a). This approach aimed to produce relatively consistent initial energies and rotational motion (Fig. 3b–c) (as noted by Furbish et al., 2021b) reasonable for particles mobilized by the scratch digging typical of rodents at this site (Fitch, 1948; Kley and Kearney, 2006). To define a starting line, a tape measure was placed along contour (i.e., at a constant elevation) with a clinometer, and particles were released at regular 10 cm intervals (Fig. 3d). Particle travel distances were measured in the slope-parallel direction using rulers, meter sticks, or tape measures (Fig. 3d). Less than 5 % of soil aggregate particles degraded during transport (as evidenced by loss of paint) such that they fell outside of the selected particle size ranges and were removed from the experiment.
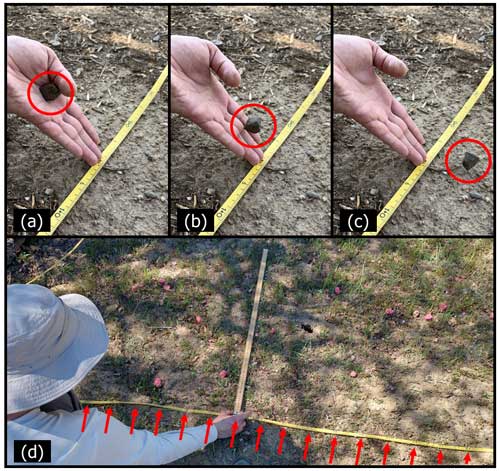
Figure 3Experimental particle drop procedure, with panels (a)–(c) showing the particle drop approach and panel (d) showing the slope-parallel measurement of particle transport distance for large particle class (pink particles) at site N26 in spring 2022. In (a)–(c), red circles highlight position of particle during and after release. In (d), red arrows represent particle drop positions at 10 cm intervals. Note that the photos in (a)–(c) were not collected at BORR.
2.1.4 Topographic data
Topographic data used in our analyses was collected by UNAVCO with a Riegl VZ-2000 terrestrial laser scanner (TLS) between 18 and 20 July 2021. Registration and georeferencing of point clouds was performed by UNAVCO. Point cloud resolution was generally between 0.1–2 cm.
We used TLS-derived point cloud data to define the surface slope at each particle experiment site. The software CloudCompare was used to fit a plane to the unmodified point cloud of each particle drop experimental region with the built in “Fit Plane” tool. Due to the low density of points corresponding to vegetation relative to points collected at the mineral surface in the experimental regions, the vegetation did not qualitatively appear to impact our slope estimation approach. All slope measurements were also corroborated with field measurements collected with a clinometer. The experimental regions were visually identified with survey flags placed in the field prior to TLS collection. The size of these selected regions was dependent on the width of the experimental drop zone and the maximum particle travel distance observed during the particle drop experiments described above.
2.2 Model description
We used a Lomax model to represent particle travel distance exceedance probability R(x), also known as the survival function of particle travel distances or a complementary cumulative distribution. The exceedance probability can be related to an associated spatial disentrainment rate P(x), or hazard function representing the conditional probability of a particle in motion being disentrained at a distance x downslope from its point of entrainment (Fig. 4). A Lomax distribution is capable of capturing both local and nonlocal transport regimes (Furbish et al., 2021a; Roth et al., 2020) and generally acts as a constant function at low values of the travel distance, with a transition to a power law at greater values. This transition generally occurs at a value of (Fig. 4a, c) (Milojević, 2010).
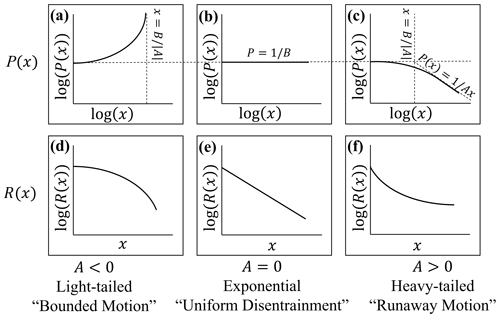
Figure 4General form of the disentrainment rate P(x) (a, b, c) and travel distance exceedance probability R(x) (d, e, f) corresponding to different values of the Lomax shape parameter (A), where x represents downslope travel distance, modified after Roth et al. (2020).
The modeled forms of R(x) and P(x) are defined in terms of the Lomax shape (A, dimensionless) and scale (B, dimensions of length) parameters (Roth et al., 2020):
The Lomax distribution can represent a range of forms of R(x) and P(x) as the transport regime transitions from local (A≤0) to nonlocal (A>0) (Fig. 4). The form of the R(x) and P(x) described by the shape parameter A informs our physical understanding of the sediment transport regime. Although the Lomax distribution is fit to the survival function R(x) due to more limited potential for propagation of error from the cumulative probability distribution, the disentrainment function P(x) represents the physical process controlling travel distances and therefore informs our understanding of the mechanics of particle motion. Although our results are presented exclusively in terms of R(x) because these distributions were used to identify Lomax parameters A and B, we provide some background description of P(x) because of the physical relevance of the form of the distribution. R(x) explicitly results from P(x) and can be represented as such (Furbish and Roering, 2013).
The condition A<0 describing a light-tailed R(x) indicates that the likelihood of disentrainment P(x) will increase with distance asymptotically as particles approach position (Fig. 4a). Particles are probabilistically unlikely to travel beyond this theoretical bounding distance, which we expect to increase with greater gravitational energy (for example, as particle size increases), an increased rate of conversion of gravitational energy to kinetic energy controlled by the surface gradient, and/or lower frictional losses from surface roughness. In this case, the model describes a transport regime of bounded motion, which is associated with “local” transport (Furbish et al., 2021b).
For A=0, R(x) is an exponential distribution, while P(x) is equal to the constant , indicating the probability of disentrainment is equal at all travel distances and that the transport regime can be described as uniform disentrainment (Fig. 4b). Regardless of the value of A, at short travel distances such as x→0, .
For A>0, the exceedance probability R(x) is heavy tailed and the disentrainment rate P(x) decreases with distance along a slant asymptote after (Fig. 4c). In this case, the spatially decreasing disentrainment probability represents the onset of runaway motion. The distance to this onset is expected to decrease with greater gravitational energy (larger particle sizes) or conversion of gravitational to kinetic energy (steeper slopes) and lower frictional losses, each of which will lead particles to experience runaway motion at shorter distances. This condition represents the “nonlocal” transport regime (Furbish et al., 2021b).
2.3 Initial processing of empirical data
Preliminary processing of empirical travel distance data was conducted to prepare data for Lomax distribution fitting. Particle motion was non-stochastic immediately after release from the palm due to our use of a consistent approach to initiating particle motion (Fig. 3a–b). Stochastic motion occurred after contact with the mineral surface, which induced random components of motion as particles bounced and tumbled. In our experimental approach, the disentrainment rate may be anomalously low relative to naturally occurring transport prior to the onset of stochastic motion, especially for the smallest particles (Furbish et al., 2021b). To ensure that only stochastic particle motion associated with particle–surface interactions (as opposed to motion dominated by initial conditions associated with experimental procedures) was captured and to avoid the potential influence of unrealistically uniform initial particle velocities, we performed left truncation on all empirical travel distance exceedance distributions at a distance of 1 cm (i.e., removing travel distances ≤ 1 cm). We note that the onset of stochastic motion may vary for particles of different geometry, as more rounded or angular particles may initially experience tumbling or a random oblique motion, respectively. We selected a single left-truncation distance for combined distributions of different particle geometries rather than separating particles by geometry or composition (soil or rock) in order to achieve our goal of identifying a general trend for a given range of particle sizes. We selected the truncation value of 1 cm through a combination of visual analysis of the raw empirical R(x) data and consideration of the median intermediate diameter of the smallest particles involved in our study (∼ 0.64 cm), which is approximately half the truncation distance (e.g., Furbish et al., 2021b).
After truncating travel distance measurements ≤ 1 cm, we calculated an empirical cumulative distribution, F(x), for each experimental travel distance dataset. We normalized F(x) by a factor of N+1 (where N is the number of samples) under the assumption that the cumulative probability of empirical data remains below 1 due to the finite number of samples (e.g., Furbish et al., 2021b). Three of the seven sites were then assigned a type I (right) censor distance (Appendix A, Table A3) based on the distance to physical barriers that terminated particle travel, such as the channel at the base of the slope (S39, all epochs), dense piles of vegetative debris (S30, summer 2021), or trails caused by human activity on the slope (N33, spring 2022). In cases where censorship was necessary, particle travel distances exceeding the censor distance were excluded from the empirical distribution. If a physical barrier was not present at the time of our experiments, then no type I censorship was applied. We then calculated the empirical exceedance distribution R(x) as the complementary cumulative distribution or .
2.4 Optimization of Lomax parameters
Lomax parameters describing the transport regime of our experimental ravel simulations were optimized by fitting a Pareto type II (Lomax) distribution (Eq. 1) to the empirical travel distance exceedance probability R(x). We optimized Lomax parameters A and B through an ordinary least-squares regression. Our optimization approach is identical to that of Roth et al. (2020) with the Nelder–Mead simplex selected for minimization, implemented as described in Lagarias et al. (1998). This algorithm is highly efficient, simple to implement, and capable of optimizing a wide range of objective functions. Because this method was not guaranteed to converge at a local minimum without an initial parameter estimation of reasonable quality, a trust region regression capable of handling poor initial guesses was first implemented to obtain initial estimates of A and B (Sorensen and Moré, 1983).
Error estimations presented in our results were calculated using a bootstrap procedure in which each R(x) was resampled with replacement 10 000 times with one of the parameters A or B individually fixed while the other was calculated (per Roth et al., 2020). The standard deviations of the estimated parameters, σA and σB, respectively, were used to denote their uncertainty related to the standard error, and the uncertainty in , denoted as , was calculated through the method of moments using these standard deviations and the covariance of the bootstrapped parameters, σAB, as described in Eq. (4).
For cases in which nonlocal transport was identified with A>0, the tail is the sparsest region of the empirical data and may be underrepresented. This issue is exacerbated by a low sample number N. As noted by Furbish et al. (2021b), parametric values estimated with N<1000 should be accepted with skepticism, especially for heavy-tailed distributions, for which variability in R(x) increases. Any censored distributions may only have a small portion of the exceedance probability represented in the experimental data, exacerbating underrepresentation of the tail. Unfortunately, N>1000 was deemed to be impractical in our field experiments due to the extensive time required to drop, measure, and collect the in situ particles at a large number of sites as described in Sect. 2.1. This is a perspective shared by other similar field studies such as DiBiase et al. (2017), who dropped between 43 and 93 particles for their various size classes, and Roth et al. (2020), who dropped ∼ 100 particles of each size class per site. Given the logistical limitations of our experiments, we therefore acknowledge uncertainty in A, particularly in our ability to distinguish heavy-tailed and light-tailed distributions for values of A close to 0.
2.5 Estimating mean travel distance and frictional coefficient
Besides allowing evaluation of the transport regime (A) and length scale of transport (B), the Lomax parameters A and B allow calculation of mean travel distance (μx) and a frictional coefficient describing energy lost due to particle collisions with the mineral surface and vegetation (μ) as described in Furbish et al. (2021b). Note that μ is not a Coulomb-like friction coefficient, but it instead describes the efficacy of frictional losses due to particle–surface collisions that extract translational energy. For additional discussion, see Furbish et al. (2021a, b).
The mean value μx of a Lomax distribution is defined as
Note that μx only exists when A<1 (Furbish et al., 2021b). For heavy-tailed distributions with A≥1, the mean is undefined.
To estimate μ, we follow the approach of Furbish et al. (2021b),
where S is hillslope gradient, θ is slope angle in radians, m is particle mass, and g is acceleration due to gravity (9.81 m s−2). E0 is the initial kinetic energy, γ, the ratio of the arithmetic and harmonic means of particle energy, was set to 1.5 following Furbish et al. (2021b).
In our use of Eq. (6), we estimated particle potential energy as a replacement of initial particle kinetic energy with an assumption that all potential energy available to each particle due to the elevated position of release (Fig. 3a) was converted to kinetic energy by the time the particle contacted the ground surface. Potential energy was calculated as mgh, with a constant release height above the ground, h, of 10 cm for all particle sizes. We estimated particle mass by assuming a spherical particle form and calculating particle volume from the median intermediate particle axis. We then assumed a particle density of 1200 kg m−3 to obtain the particle mass.
Presented results describe observations and experimental results following our field visits at the Arbor Creek Catchment. These include a qualitative assessment of vegetation condition through time, grain size distributions from our pebble counts, and Lomax parameter values (A and B) derived from our particle drop experiments.
3.1 Qualitative vegetation assessments
To provide context for the results of our particle drop experiments, we present qualitative descriptions of vegetation at the SFS and NFS and how vegetation structures evolved as the site recovered post-fire. The SFS is dominated by annual grass species (e.g., Avena sp., Bromus diandrus). The NFS is dominated by blue (Quercus douglasii), black (Q. kelloggii), and valley (Q. lobata) oaks, with sparse annual grasses and prevalent lichens and mosses. The grassy vegetation on these slopes undergoes seasonal cycles, with growth through the spring and senescence in late summer as rainfall ceases and temperatures increase. This is particularly noticeable at the SFS, which receives more insolation and has a larger population of grasses relative to the NFS. Donaldson et al. (2024) focused on aspect-dependent evapotranspiration rates at our field site and found that the SFS, in contrast to most south-facing aspects in the Southern Hemisphere that receive more insolation than their north-facing counterparts, had lower rates of evapotranspiration than the NFS due to oak tree water uptake from weathered bedrock at the NFS. While the NFS had greater rates of evapotranspiration than the SFS, our observations of soil texture and the findings of Donaldson et al. (2024) indicate the NFS generally had higher levels of shallow soil moisture. Donaldson et al. (2024) proposed that the different hillslope-scale vegetation structures at the SFS and NFS are driven by factors including higher air temperature and reduced shallow soil moisture at the SFS, as the SFS is grass-dominated and the NFS is oak tree-dominated, though mosses and short grasses are present at the NFS.
In addition to observations of different vegetation structures and soil moisture, different fire behavior at the SFS and NFS resulted in observations of variable burn severity between aspects during our field visits. Following the August 2020 SCU Lightning Complex fire, grasses were singed down to a roughly uniform ∼ 0–3 cm height but were generally still present at the soil surface on the SFS. We did not observe alteration of granular aggregate structure or damage to fine root structure. Based on these characteristics and the observed recovery of vegetation within 1 year, the SFS was generally burned at low severity (Parsons et al., 2010). The NFS experienced a wider range of soil burn severities ranging from unburned to high, although the majority of the slope demonstrated low burn severity. Lichens and mosses were observed to be unaltered in some areas post-fire. Limited patches of high burn severity were present where downed trees or branches were incinerated. Within these patches, the organic woody and soil components were completely consumed, several centimeters of white ash was present, and soils demonstrated disaggregation and oxidation typical of the extreme temperatures associated with burning of downed logs (e.g., Mataix-Solera et al., 2011). On both NFS and SFS, the intensity of burrowing activity after the burn was clearly visible due to the difference in color of the charred surface and lighter excavated soil (Fig. 1d, Image 1).
Along with the aspect dependence of burn severity, different post-fire vegetation structures were observed at the SFS and NFS. These structures are relevant when considering the evolution of particle transport over time. Here, we provide our qualitative observations of vegetation and images of typical vegetation structures at each aspect. Within 7 months of the fire, vegetation (grass) had begun to regrow on the SFS. During the spring 2021 experimental period, the vegetation was several centimeters high and covered the majority of the SFS, although it was fairly sparse (Figs. 1d, Image 2 and 5a). Where vegetation was denser, it was observed as resisting the downslope motion of particles mobilized by burrowing California ground squirrels (Fig. 5b). By July 2021, the SFS vegetation had experienced seasonal die-off, but residual dry matter ranged from roughly 30 cm to 1.3 m in height (Figs. 1d, Image 3; and 5c). In spring 2022, live vegetation had regrown to a height of several centimeters to 1 m and leaf litter and dead grasses were present on the mineral surface (Fig. 5d). The leaf litter and dead grasses increased surface roughness relative to our first experimental period, as these materials had been recently incinerated prior to our experiments in spring 2021. The mineral and vegetative surface roughness in summer 2021 and spring 2022 qualitatively appeared similar, although the height of the dead vegetation was greater in summer 2021, and the live vegetation was observed to be less brittle and more resistant to displacement when impacted by traveling particles in spring 2022.
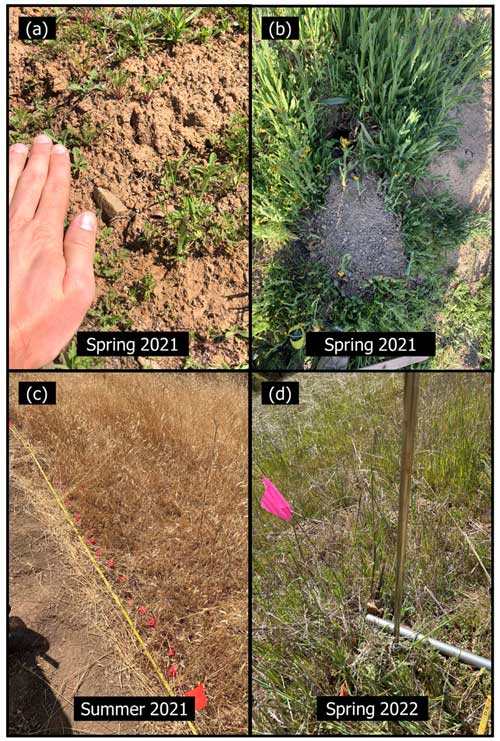
Figure 5Vegetation conditions at the south-facing slope (SFS) through experimental epochs. (a) In spring 2021 vegetation was generally short and sparse, though in some regions dense vegetation was observed as shown in (b) vegetation supporting a deposit of granular material generated from a California ground squirrel burrow. (c) By summer 2021 vegetation had regrown and died. Panel (c) shows how this dead vegetation at site S21 acted as a barrier to our large particles. (d) In spring 2022, there was a mixture of live and dead vegetation.
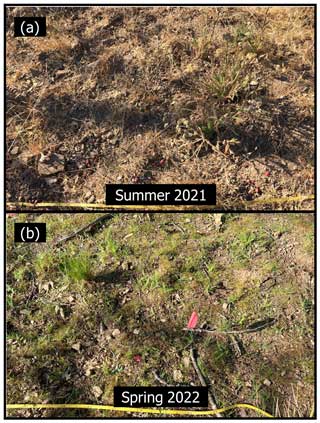
Figure 6Typical vegetation conditions on the north-facing slope (NFS) during experimental epochs. (a) Site N26 in summer 2021. Although grasses are present, their density is lower than at the SFS in the same experimental epoch, and more of the mineral surface is visible. (b) Site N33 in spring 2022. Mosses and grasses are present, and vegetation is less dense than at the SFS. Note the presence of more angular and rocky particles at the surface in contrast to the soils on the SFS.
The NFS experienced more limited post-fire evolution of vegetation compared to the SFS. Throughout all experimental periods, the surface characteristics of the NFS appeared relatively unchanged based on vegetation density and moss cover, though most grasses were dead in summer 2021 (Fig. 6a), while a mix of live and dead vegetation was present in spring 2022 (Fig. 6b).
3.2 Pebble counts
The particle size distributions measured by pebble counts during each study epoch are presented in Fig. 7. The median diameters (D50) of our three selected particle size classes for summer 2021 and spring 2022 are indicated on all plots.
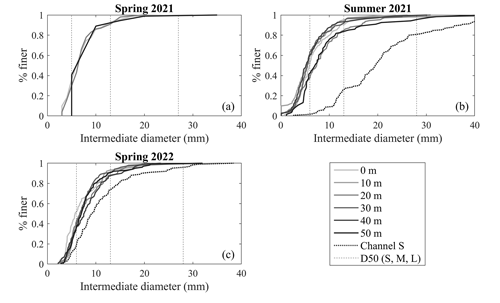
Figure 7Particle size distributions from pebble counts conducted on cross-slope transects along the study hillslope during (a) spring 2021, (b) summer 2021, and (c) spring 2022. Distances 0–50 m represent each transect's downslope distance from experimental particle drop site S21. The extent of counts in spring 2021 was limited to only 0, 20, and 50 m transects, and particle sizes at 50 m were collected at a reduced measurement precision (0.5 cm). Dashed lines represent the median diameters (D50) of the three particle size groups used in summer 2021 and spring 2022 experiments (S = 0.6 cm; M = 1.3 cm; L = 2.8 cm). Note the 95th percentile of channel S particles and above are excluded from the plot in panel (b) to aid comparison between epochs. The largest of these particles had an intermediate diameter of 88 mm, and the remainder 51 mm or less.
In spring 2021, particle size distributions appear similar along all three transects at which measurements were collected (0, 20, and 50 m transects roughly corresponding to the positions of sites S21, S26, and S39, respectively). We note that because measurements taken along the 50 m transect near the hillslope toe were recorded at 0.5 cm precision, this distribution is only coarsely comparable with other distributions. In summer 2021, we observed notable downslope coarsening in surface particles in the lower transects near the hillslope toe where the slope increases. The material collected at “channel S”, or the channel along the base of the SFS, approximately 10 m below the 50 m transect, was coarser than the material on the hillslope, with a median value over twice that of the lowest hillslope transect at 50 m (Appendix A, Table A1). By spring 2022, downslope coarsening in the channel was still evident but had declined substantially.
3.3 Evolution of Lomax parameters with site recovery
Figures 8 and 9 show variation in model R(x) and associated empirical travel distance data through time for each experimental site and particle size combination. Note that the number of dropped particles in each experimental group (N) and estimates of A, B, σA, and σB may also be found in Appendix B in Table B1. See Appendix B (Figs. B1–B7) for individual empirical datasets, model fits, and visualizations of variability in the form of R(x) with estimated σA. Figure 8 illustrates the evolution of R(x) at all SFS sites, while Fig. 9 shows the evolution of R(x) at all NFS sites. Note that versions of Figs. 8 and 9 with equal scaling of the horizontal axes for each experimental site are available in Appendix B (Figs. B8 and B9). Experiments at sites on the NFS and the S30 site were only conducted in summer 2021 and spring 2022.
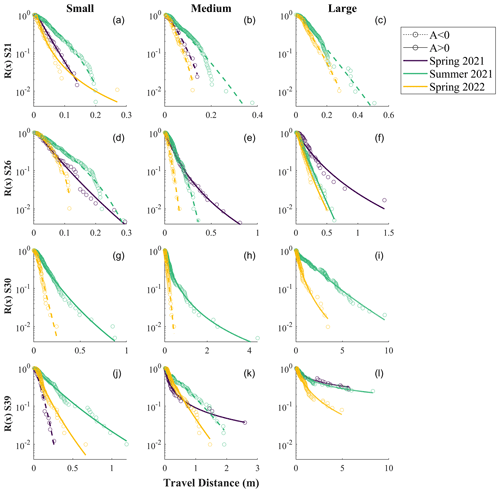
Figure 8Empirical and modeled travel distance exceedance distributions R(x) for all SFS sites. Dashed lines indicate models with A<0 (bounded motion), and solid lines indicate models with A>0 (runaway motion). Open circles represent empirical data. Columns correspond to particle sizes (small, medium, large), while rows indicate experimental site.
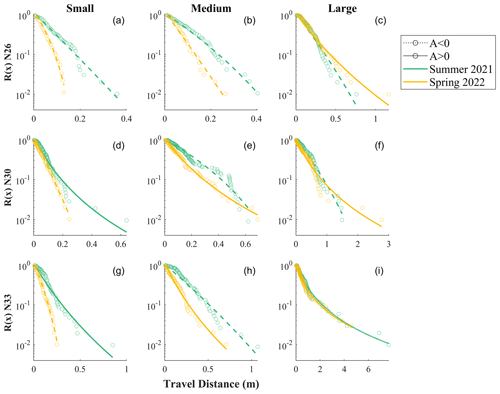
Figure 9Empirical and modeled ravel distance exceedance distribution R(x) for all NFS sites. Dashed lines indicate models with A<0 (bounded motion), and solid lines indicate models with A>0 (runaway motion). Open circles represent empirical data. Columns correspond to particle sizes (small, medium, large), while rows indicate experimental site.
Figures 8 and 9 indicate that nonlocal transport of the in situ particles in our experimental catchment occurs across a range of particle sizes, hillslope gradients, and aspects, as evidenced by the presence of heavy-tailed travel distance exceedance distributions (solid lines). In Figs. 8 and 9, heavy-tailed distributions are shown to be most prevalent for the largest particles, and their occurrence decreases for smaller particle sizes. More heavy-tailed distributions are also observed across the range of hillslope gradients and particle sizes in the first experimental periods during earlier stages of post-fire site recovery, with a general transition to light-tailed distributions as the site continued to recover. Alternative results using a 1.75 cm medium vs. large binning threshold rather than 2.25 cm for spring 2021 are presented in Table A4 and broadly show similar results.
No single trend in A vs. time elapsed since the fire can be consistently identified across all sites and particle sizes. It is therefore more useful to consider the evolution of A across different combinations of particle size, hillslope gradient, aspect, and experimental epoch. Note that in our presentation of trends in Lomax parameters in Figs. 10 and 11 (A and B), we include the standard error (±σA, ±σB).
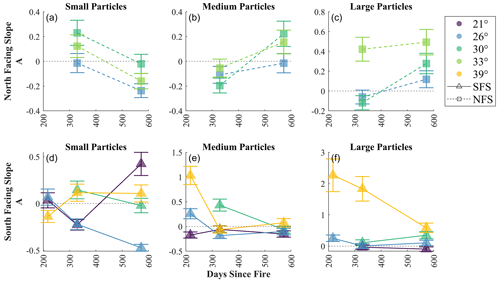
Figure 10Values of Lomax shape parameter A for all combinations of particle size class, slope angle (°), and experimental epoch on the (a–c) north-facing (NFS) and (d–f) south facing (SFS) study slopes. Error bars represent standard error (±σA) of A obtained from bootstrapping. Field visits occurred 217, 329, and 572 d post-fire. There is a dashed line at A= 0, which is the boundary between heavy-tailed (A>0) and light-tailed (A<0) Lomax distributions.
The evolution of A across all experimental parameter combinations is presented in Fig. 10. Mirroring results from Figs. 8 and 9, Fig. 10 shows positive A values (i.e., nonlocal transport) in our dry ravel simulations for all particle sizes and indicates that as particle size increased at both the NFS and SFS, the largest A value observed also increased. At the SFS, A values diverged with time for small particles (Fig. 10d), while A values converged for medium and large particles (Fig. 10e–f). The range of A between the NFS and SFS for medium (Fig. 10b and e) and large particles (Fig. 10c and f) also became more similar with time post-fire. Note that σA values in Fig. 10 are sufficiently large to induce uncertainty in the sign (and therefore transport regime) of A for 13 of our 51 combinations of particle size, hillslope gradient, aspect, and experimental epoch (see Appendix B, Table B1).
Figure 11 shows changes in A, B, and the reciprocal of mean travel distance () with hillslope gradient. This figure shows that A, B, and μx generally increased as slopes steepen for all observed particle sizes and experimental epochs, although exceptions occur among small and medium particles on lower slopes.
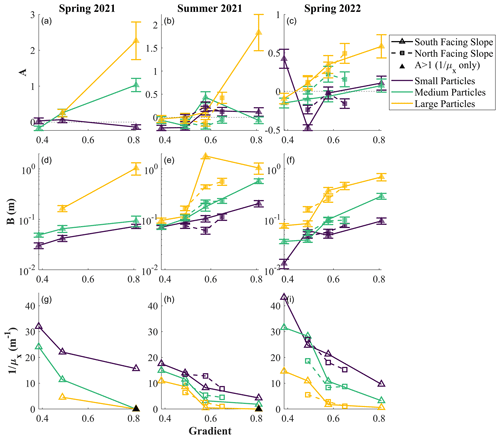
Figure 11(a–c) Trends in A with hillslope gradient during (a) spring 2021, (b) summer 2021, and (c) spring 2022. Note the differences in the vertical axes between sub-plots. There is a dashed line at A= 0, the boundary between heavy-tailed (A>0) and light-tailed (A<0) Lomax distributions. (d–f) Trends in B with hillslope gradient for each experimental particle size during (d) spring 2021, (e) summer 2021, and (f) spring 2022. (g–i) Trends in the reciprocal of mean travel distance () with hillslope gradient for each experimental particle size during (g) spring 2021, (h) summer 2021, and (i) spring 2022. Undefined values of (μx=∞ for A≥1) are represented by filled black markers and plotted at a value of 0 (medium and large particles at S39 in spring 2021 and large particles at S39 in summer 2021).
A values for the transport regime of the largest particles demonstrate larger increases with increasing hillslope gradient than those of small or medium particles in spring 2021 and summer 2021 (Fig. 11a–b). Figure 11 also suggests a transition from a more nonlinear relationship between A and the gradient (Fig. 11b) to a more linear relationship (Fig. 11c) with the time since the fire for large particles.
Besides showing an increase in the length scale of transport with gradient, Fig. 11d–i also illustrate the consistent decrease in the length scale of transport between summer 2021 and spring 2022 (see Appendix C, Figs. C1–C2, for additional visualizations).
Figure 12 illustrates trends in A, B, and μx with particle size for each experimental site. Each of A, B, and μx generally increased with particle size. Figure 12g–i suggests an exponential-like relationship between μx and particle size.
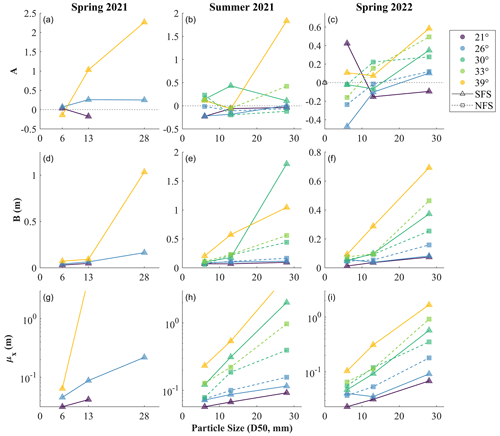
Figure 12(a–c) Trends in A with particle size. Note the differences in the vertical axes between sub-plots. There is a dashed line at A= 0, the boundary between heavy-tailed (A>0) and light-tailed (A<0) Lomax distributions. (d–f) Trends in B with particle size. Note the differences in vertical axes between sub-plots. (g–i) Trends in mean travel distance (μx) with particle size. Values of μx=∞ (for A≥1) are plotted at μx=5 (above vertical axis extent) to allow visualization of trends in μx. These values include medium and large particles at S39 in spring 2021 and large particles at S39 in summer 2021. SFS is the south-facing slope, and NFS is the north-facing slope.
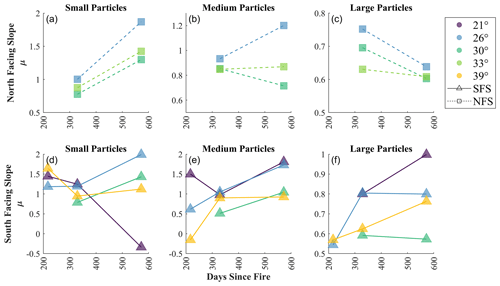
Figure 13Values of coefficient of friction (μ) for all combinations of particle size class, slope angle (°), and experimental epoch on (a–c) the north-facing slope (NFS) and (d–f) the south-facing slope (SFS). Field visits occurred 217, 329, and 572 d post-fire.
To evaluate differences in the frictional energy losses experienced by differently sized particles at our experimental sites, we calculated a friction coefficient μ as described in Sect. 2.5. Figure 13 shows that frictional losses generally increased through time for medium and large particles, although μ decreased in some cases between summer 2021 and spring 2022. There is no clear pattern in frictional losses of small particles through time where data are available for all epochs. Additional figures presenting the relationship between μ and gradient organized by epoch and site are available in Appendix C (Figs. C3–C4).
Here, we consider the results of our pebble counts and dry ravel simulations to evaluate the influences of particle size, aspect, and slope on dry ravel as the time since the Arbor Creek Catchment burn-area increased. We also consider evidence of downslope coarsening of particle size at the SFS. Our experimental results are compared against previous field and lab experiments exploring dry ravel transport regimes, and we provide suggestions for additional data collection efforts relevant to those that apply the Lomax model to similar in situ particle transport experiments.
4.1 Transport dependence on site conditions and particle size
The heavy-tailed travel distance exceedance distributions we observe provide clear evidence of nonlocal transport at a variety of particle size and slope combinations (Figs. 8–10 and 11a–c). Since these results represent the behavior of in situ particles under experimental conditions intended to simulate a primary particle entrainment process at this site (burrowing), these results suggest that nonlocal transport does occur within the natural range of particle sizes, slopes, and post-fire surface conditions at this site.
Overall, larger particles on steeper slopes were more likely to exhibit nonlocal transport over long distances. The heaviness of distribution tails (A), the length scale of transport (B), and mean travel distances (μx) in any experimental epoch generally increased with particle size and gradient on both study slopes (Figs. 11 and 12). Our estimated μ values suggest that frictional energy losses (evaluated with μ) were also greater for small and medium particles, and vegetation and mineral roughness were less effective in reducing particle energy as hillslope gradient increased (Fig. 13). These findings are consistent with expected controls on particle disentrainment, as larger particles have a larger component of effective gravitational energy due to their higher mass and are therefore less affected by surface roughness (e.g., Furbish et al., 2021b; Gabet and Mendoza, 2012; Roth et al., 2020). We find less consistent behavior at low gradients, especially for smaller particle sizes, which often demonstrate higher A values than medium or even large particles (discussed below).
Figure 11g–i emphasizes that both particle size and vegetation structure control the slope at which a transition to runaway motion may occur. Theoretically, particles rolling down a rough surface would exhibit a linear decline in the reciprocal of the mean travel distance or with increasing gradient before approaching 0 (at μx=∞), corresponding to a critical gradient at which particles are unlikely to be trapped by topography (Furbish et al., 2021b; Samson et al., 1999). For all particle groups, our data suggest that the critical gradient likely increased with time since the fire due to vegetation regrowth as evidenced by increases in at most sites with time (with the exceptions of medium particles on the lowest slope and all small particles between spring and summer 2021). However, our data also suggest that the critical gradient is dependent on particle size. The value of was ∼ 0 or near 0 for large particles at the steepest experimental sites in all epochs, suggesting that our steepest site (S39) is near or at this critical gradient for large particles. In spring 2021, was ∼ 0 for medium particles, but in subsequent epochs the trend in suggests that S39 was just below this critical gradient for medium particles.
Where data are present on the south-facing slope, A, B, and μx values generally decrease between spring 2021 and spring 2022 (Fig. 11). This trend is clearly evident for larger particle sizes on steeper slopes, although it does not appear to hold for smaller particles on lower slopes. Many of these trends are also partially obscured by larger values in summer 2021 than in the surrounding spring epochs, particularly for B and μx. Given the differences observed between summer and spring vegetation in the field, we assume this deviation reflects the effects of seasonal variation. We therefore exclude summer 2021 data from our consideration of post-fire recovery impacts and instead focus on differences between spring 2021 and spring 2022 on the south-facing study slope. We interpret the general decrease in tail heaviness (Fig. 11b–c), transport length scale (Fig. 11e–f), and mean travel distances (Fig. 11h–i) as being consistent with the progressive recovery of vegetation after the fire. This interpretation is supported by our estimated friction coefficients, which increased between spring 2021 and spring 2022 at all study sites on the SFS for all medium and large particles, reflecting the regrowth of vegetation (Fig. 13).
These findings align with differences in particle transport on burned and unburned slopes observed by previous studies, demonstrating that travel distances become increasingly long and heavy-tailed with decreasing surface roughness or increasing particle size or slope (Roth et al., 2020; Furbish et al., 2021b). However, a more nuanced assessment of the controls on particle transport may be derived from closer consideration of the cases that deviate from these expected trends. These cases appear to primarily reflect the influence of (1) seasonal or spatial variation in vegetation characteristics and (2) stochastic particle motion. Below, we discuss the effects of these factors on producing aspect-dependent particle behavior and the anomalous behavior of small particles on low slopes.
4.1.1 Small particles and stochastic motion
Figure 10d–f shows that A values for small particles diverged and A values for medium and large particles converged near A= 0 through time. We suggest that these changes were driven by size-dependent particle responses to the regrowth of vegetation. Small particles, which had a lower component of initial momentum than medium and large particles, were most sensitive to surface roughness (e.g., Gabet and Mendoza, 2012) and were more likely to experience a random component of motion upon impact with vegetation (Figs. 10d and 13d). We presume that this random motion and greater sensitivity to differences in vegetation structure between experimental sites caused values of A to diverge with time for small particles (Fig. 10d). We infer that the greater momentum of medium and large particles resulted in less random motion upon contact with vegetation, though particle momentum was still decreased (based on the observation that A began to converge around values closer to 0 over time; see Fig. 10e and f).
Our estimation of friction coefficient μ supports this interpretation, as μ was also sensitive to particle size, and the smallest particles had the largest values of μ in all epochs. Stochasticity in μ also increased for smaller particles on lower slopes through time. For example, the decrease in μ for medium particles at S21 opposed the increase observed for most other medium particle groups, and μ diverged for all small particle groups at the SFS with time. (Fig. 13). These findings contrast interpretations made by Furbish et al. (2021b), who suggested that μ is insensitive to particle size for identical slope and roughness conditions. We suggest that μ may be insensitive to particle size when considering only roughness of the mineral surface (e.g., Gabet and Mendoza, 2012) or using larger rounded particles (e.g., Roth et al., 2020), but the presence of vegetation with spacing comparable to the range of experimental particle sizes results in size-selective values of μ.
4.1.2 Aspect-dependent differences in particle motion
The shift in travel distance distributions from summer 2021 to spring 2022 among large and medium particles is far less pronounced or even absent on the NFS (Fig. 9), especially among large particles where we see the largest shift on the SFS (Fig. 8). Without spring 2021 data for the NFS, it is uncertain to what extent this difference is due to aspect-dependent variation in post-fire recovery or aspect-dependent seasonal variation in vegetation and soil moisture. However, our data and field observations are consistent with the hypothesis that aspect-dependent differences between conditions on the NFS and SFS contributed to measurable differences in particle motion.
Dependence on the aspect was more noticeable in summer 2021 than spring 2022, with greater differences in A, B, and mean travel distance for a given gradient and particle size between the NFS and SFS in summer 2021 (Fig. 11b–c, e–f, and h–i). In summer 2021, south-facing slopes above 26° also experienced uniformly higher mean travel distances than their north-facing counterparts (Fig. 11g–i). Between summer 2021 and spring 2022, friction coefficients on the SFS increased by an average 47 % for all but two experimental particle size and slope groups. Over this same period, friction increased for only five of the nine experimental groups on the NFS (average 50 % increase), while four decreased by an average 12 % (all three large particle groups and one medium particle group; see Fig. 13). These results indicate that the SFS (1) experienced conditions in summer 2021 that were more conducive to long-distance particle motion overall and (2) experienced conditions in spring 2022 that disproportionately reduced particle motion relative to the NFS.
Though both the SFS and NFS exhibited some seasonal changes in vegetation (Figs. 5 and 6), the SFS experienced more extreme seasonal variation in both vegetation than the NFS due to the death and regrowth of dense seasonal grasses. In addition to simply adding new growth to the older, dried vegetation already present on the hillslope, healthy vegetation may have acted as a more effective barrier to the passage of particles in spring 2022 than the dead vegetation in summer 2021.
Other factors such as the coefficient of restitution of the mineral surface may also have evolved with seasonal changes in antecedent moisture. Based on field observations, soils on the SFS were more dry and less easily deformed than on the NFS during the summer. These observations are corroborated by measurements by Donaldson et al. (2024), who found that shallow soil moisture was generally lower on south-facing slopes in our study catchment. We suggest that the drier soils on the SFS may have increased the coefficient of restitution relative to the NFS. This would be expected to produce longer and more heavy-tailed particle travel distances on the SFS, consistent with our observations in summer 2021.
4.1.3 Downslope coarsening and size selective transport
On the SFS, we observed nonlocal transport of medium and large particles at all sites with slopes of 26° or greater in spring 2021 (Figs. 8 and 10). At S26 and S39, a transition from nonlocal to local transport was observed between spring 2021 and summer 2021 for medium particles, while large particles still experienced nonlocal transport. After summer 2021, systematic changes in particle motion were not observable across all SFS experiments, but the maximum particle travel distance decreased for all SFS sites and all particle sizes. The post-fire observation of downslope coarsening along the SFS hillslope and the coarser particles found in the channel relative to the SFS hillslope (Fig. 7; Appendix A, Table A1) provide evidence of particle-size-selective transport consistent with our experimental results. Previous field experiments and observations of post-fire dry ravel (DiBiase et al., 2017; DiBiase and Lamb, 2013; Florsheim et al., 1991; Gabet, 2003; Lamb et al., 2013; Roering and Gerber, 2005; Roth et al., 2020) report the sequestration of fine sediments by mineral or vegetative roughness, whereas large particles bypass hillslope storage zones and are delivered to the channel network. This mechanism is interpreted to produce the variation between hillslope and channel particle size distributions shown in Fig. 7.
4.2 Implications for post-fire variability in particle fluxes
Although large particles were the most sensitive to slope, their sensitivity varied throughout the experimental epochs. A more nonlinear trend in A with slope in summer 2021 (Fig. 11b) transitioned to a more linear trend in spring 2022 (Fig. 11c). Our results suggest that immediately post-fire or in summer when vegetation strength is apparently reduced (e.g., summer 2021 at our site), the aggregate travel distance distribution for all particle sizes naturally present would demonstrate a greater spread due to nonlinearity in large-particle A values. Since the flux of dry ravel involves the convolution of the entrainment rate and R(x) (as described by Furbish et al., 2021a), this size-dependent nonlinearity in A values could contribute to the increased variance and nonlinearity in sediment fluxes commonly observed at high slopes (e.g., Roering et al., 1999). Evidence of nonlinear dependence of post-fire dry ravel flux has been previously presented by Gabet and Dunne (2003) and ascribed to nonlocal transport (Gabet and Mendoza, 2012). In fact, we expect that entrainment rates may also vary with particle size and contribute to this nonlinearity, although further research is needed to constrain the relationship between particle sizes and biotically driven entrainment rates.
4.3 Limitations and outstanding questions
Limitations of our work include a lack of control sites and no quantitative characterization of vegetation structures, which should be considered in future data collection campaigns. We also suggest that future attempts at similar experiments would benefit from the collection of entrainment rate data.
In this study, we assume that our observations, particularly the transition from A>0 toward lower A values closer to 0 for medium and large particles on the SFS, are caused by post-fire vegetation recovery. This interpretation is consistent with previous studies demonstrating higher A values at smooth or burned sites relative to those on vegetated slopes (e.g., Furbish et al., 2021b; Roth et al., 2020). Future work would benefit from the inclusion of paired experiments at unburned control sites to better isolate the post-fire response relative to background transport characteristics. We emphasize the need for care in control site selection, however, as our data highlight the sensitivity of these experiments to not only macro-scale conditions (slope, aspect, vegetation) but also microtopographic, biotic, and hydrologic conditions that may be subject to heterogeneity over both experimental plot and catchment scales.
Another opportunity for future work complementary to the findings presented here would be the estimation of entrainment rates of ravel at the NFS and SFS. As the convolution of the entrainment rate and R(x) provides an estimate of flux (Furbish et al., 2021a), deriving entrainment rates for the different particle sizes we used in our experiments would allow calculations of sediment flux due to dry ravel. Observations by others suggest that differences in soil cohesion associated with soil moisture and selective burrowing by California ground squirrels and Botta's pocket gophers may cause aspect dependency in the production and entrainment of ravel (e.g., Gabet, 2003; Ordeñana et al., 2012). Burrowing rodents apparently generate much of the mobile material at the mineral surface in the Arbor Creek Catchment (Fig. 1d, Image 1), and their presence likely influences hillslope morphology at the NFS and SFS. While the transport regime of medium and large particles was apparently similar at the NFS and SFS in spring 2022, it would be useful to evaluate if the actual flux of ravel varied with aspect due to variable entrainment rates.
Previous studies have used descriptions of vegetation, such as roughness obtained from point cloud data, to explore relationships between vegetation, slope, and particle transport (e.g., Roth et al., 2020). To characterize the mineral and vegetative components of surface roughness, we attempted to conduct structure-from-motion 3D modeling from images collected with drones in each experimental epoch, but the motion of dense grasses between image collections limited the quality of resulting point clouds. While point cloud data generally enable the calculation of useful topographic metrics such as roughness, the presence of dense vegetation inhibits the estimation of density at the mineral surface (e.g., Ashcroft et al., 2014; Grau et al., 2017). Physical vegetation sampling procedures are well established, including the point-centered quarter method (Dix, 1961), the frequency grid approach (Vogel and Masters, 2001), or alternative quadrat-based approaches (e.g., Knapp et al., 1986). We suggest that future studies of this nature utilize physical sampling procedures.
Finally, we emphasize uncertainty in the values of A presented for different experimental particle groups in this study. When considering these results, it is important to be aware that regressed A values generally represent an upper-bound estimate of A due to potential overfitting of tails, which are generally the sparsest region in our empirical data. This issue is exemplified by the potential removal of the farthest travel distance recorded at S21 in spring 2022 for small particles (Appendix B, Fig. B1), which would modify the R(x) distribution from one describing runaway motion (unrealistic at this site for small particles given our other results) to near-uniform disentrainment. At some sites for which error was large relative to the calculated A value, it was difficult to distinguish clear signals in the transport regime from noise, which we assume was dominated by seasonal vegetation or resulted from undersampling issues. Further experiments would be required to constrain the background level of travel distances at an unburned site or over longer time periods to validate whether this catchment had fully recovered by spring 2022.
This study examines post-fire variability in rarified particle motion representative of dry ravel at Arbor Creek Catchment at Blue Oak Ranch Reserve in the Diablo Range of the California Bay Area. We conducted a series of particle drop experiments using in situ particles in size classes representative of the range of particle sizes present at our field site, as measured by pebble counts along cross-slope transects. We fit our experimental particle travel distances to a Lomax distribution model for the travel distance exceedance probability of simulated ravel, in order to track the post-fire evolution of the form of these distributions with time, particle size, slope, and aspect. The Lomax parameter A, which describes the form of the travel distance exceedance distribution as a light-tailed (bounded motion, local transport, A<0), exponential (isothermal, A= 0), or heavy-tailed (runaway motion, nonlocal transport, A>0) distribution was the primary metric used in our interpretations.
In considering different combinations of particle size, slope, and aspect through time, we identified that larger particles on steeper slopes in earlier experimental epochs were more likely to exhibit evidence of nonlocal transport. Our observations of size-selective transport corresponded with evidence of downslope coarsening immediately after the fire, as determined from pebble counts along the slope and in the channel at the base of the hillslope. We also observed the transport regime of small particles (D50= 0.6 cm) on a south-facing slope to diverge with time as vegetation recovered, while the behavior of medium (D50= 1.3 cm) and large (D50= 2.8 cm) particles became more similar across aspect and slope with time. Our results suggest that as vegetation recovered, the behavior of small particles became more dependent on site-specific vegetation structures, while medium and large particles were less likely to exhibit evidence of runaway motion. Our estimated friction coefficients support our identification of vegetation-dependent particle behavior, as the friction coefficient generally increased for medium and large particles as vegetation recovered on the south-facing slope while trends for smaller particles on less steep slopes were inconsistent. For all particle sizes, the length scale of transport continued to decrease as vegetation recovered through the first 2 years post-fire, though seasonal changes to surface characteristics (vegetation, soil moisture) likely caused greater variability in transport behavior observed on south-facing aspects relative to north-facing aspects through time.
Table A1Hillslope particle size statistics. Median, minimum, maximum, standard deviation, and number of measurements from pebble counts on cross-slope transects along the study hillslope during each epoch. Numbered transect positions describe the downslope distance from Site S21, and channel (S) denotes the channel at the base of the south-facing slope. In spring 2021, measurements at 0 and 20 m were recorded with 1 mm precision, while measurements at 50 m were recorded with 5 mm precision. In summer 2021 and spring 2022, measurements were recorded with 0.01 mm precision.
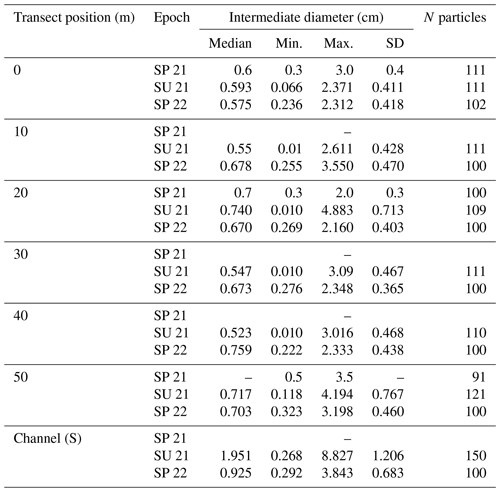
Table A2Median, minimum, maximum, and standard deviation of particle sizes for all experimental particle classes. Particle minimum and maximum values are reported as bin edges for spring 2021 due to measurement imprecision and as measured sample minimum and maximum for summer 2021 and spring 2022, which was when pre-collected and painted particles were used.

* No particles in large size class dropped at site S21 in spring 2021.
Table A3Censor distances for all sites. Site S30 was censored in summer 2021 only, site N33 was censored in spring 2022 only, and site S39 was censored in all three epochs. The variable censor point at S39 caused by the variable distance to the sloping channel at the base of the site required manual censorship based on drop position.

Table A4Comparison of Lomax parameter A resulting from alternative division of medium (M) and large (L) particle classes for relevant experiments conducted in spring 2021. The classification of several particles recorded as 1.75 cm (i.e., falling between 1.5 and 2 cm) and 2 cm (1.75–2.25 cm) in diameter was particularly sensitive to our selection of the binning threshold between medium and large size classes. We tested thresholds of 1.75 and 2.25 cm for comparison and found that a boundary of 2.25 cm resulted in less severe undersampling of the medium class at S39 without meaningfully altering results for the large particle class. We also note the that the lower edge of the spring 2021 medium bin (0.75 cm) falls below the medium size range in the later epochs (0.97 cm). Given these considerations, we selected the 2.25 cm threshold for all analyses presented in the main text.

Table B1Summary of number of experimental particles (N), A values, standard error of A (σA), B values (m), and standard error of B [σB (m)]. Bold text indicates sites at which σA is greater than , indicating substantial uncertainty in the sign of A. “Sp” stands for spring, while “Su” stands for summer.
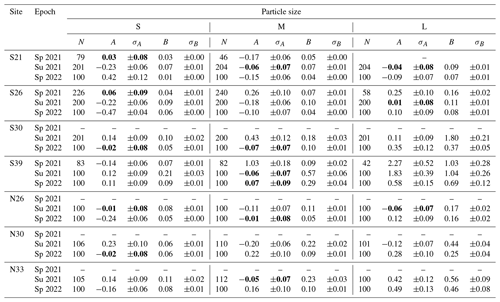
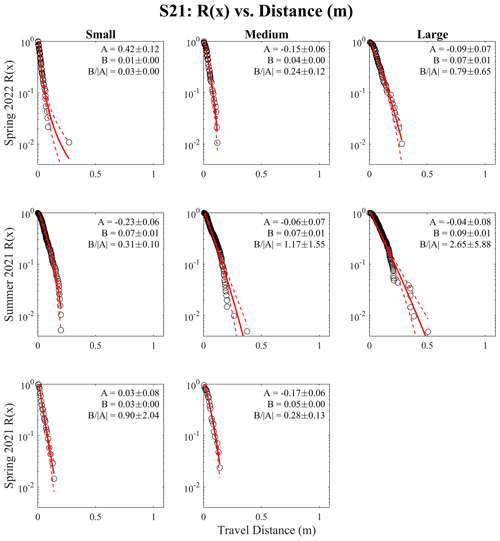
Figure B1Empirical R(x) and modeled R(xi) for site S21 annotated with Lomax parameters A and B and characteristic distance . Error estimations are denoted with parameter values. Black circles are empirical data. Dashed red lines represent variability in R(x) with the standard error in A.
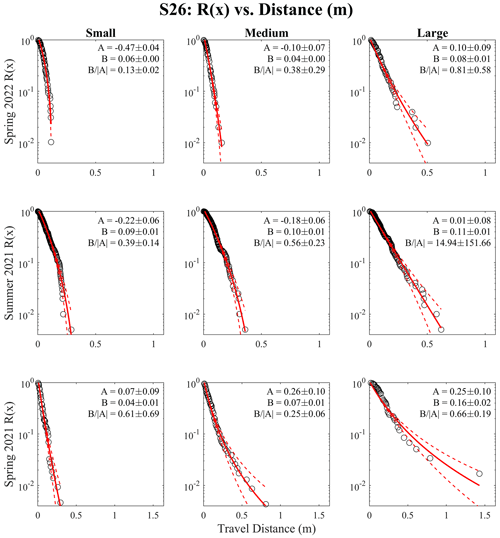
Figure B2Empirical R(x) and modeled R(xi) for site S26 annotated with Lomax parameters A and B and characteristic distance . Error estimations are denoted with parameter values. Black circles are empirical data. Dashed red lines represent variability in R(x) with the standard error in A.
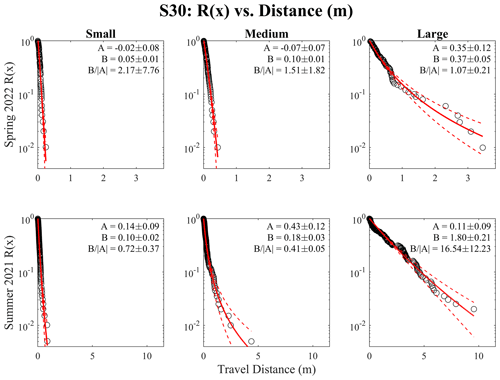
Figure B3Empirical R(x) and modeled R(xi) for site S30 annotated with Lomax parameters A and B and characteristic distance . Error estimations are denoted with parameter values. Black circles are empirical data. Dashed red lines represent variability in R(x) with the standard error in A.
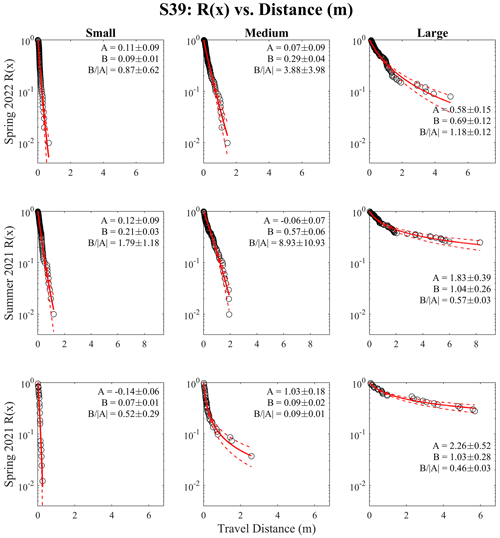
Figure B4Empirical R(x) and modeled R(xi) for site S39 annotated with Lomax parameters A and B and characteristic distance . Error estimations are denoted with parameter values. Black circles are empirical data. Dashed red lines represent variability in R(x) with the standard error in A.
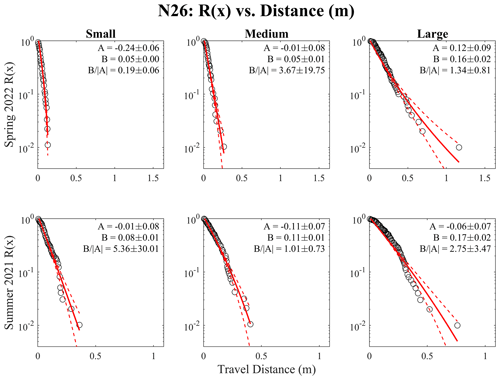
Figure B5Empirical R(x) and modeled R(xi) for site N26 annotated with Lomax parameters A and B and characteristic distance . Error estimations are denoted with parameter values. Black circles are empirical data. Dashed red lines represent variability in R(x) with the standard error in A.
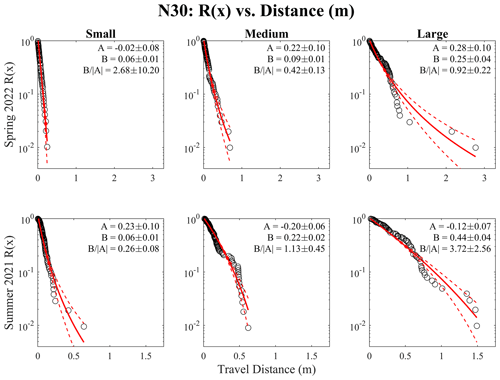
Figure B6Empirical R(x) and modeled R(xi) for site N30 annotated with Lomax parameters A and B and characteristic distance . Error estimations are denoted with parameter values. Black circles are empirical data. Dashed red lines represent variability in R(x) with the standard error in A.
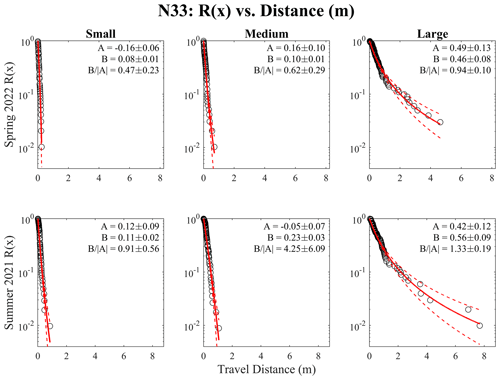
Figure B7Empirical R(x) and modeled R(xi) for site N33 annotated with Lomax parameters A and B and characteristic distance . Error estimations are denoted with parameter values. Black circles are empirical data. Dashed red lines represent variability in R(x) with the standard error in A.
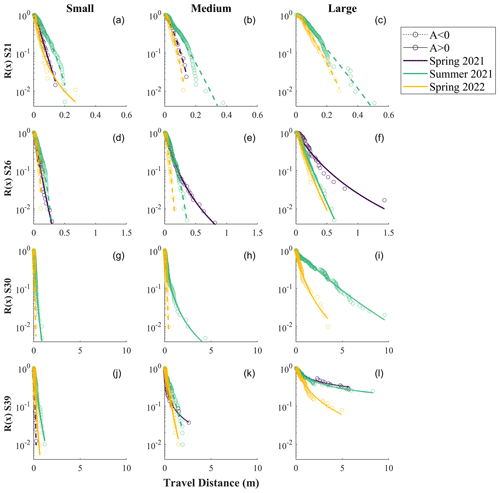
Figure B8Empirical and modeled travel distance exceedance distributions R(x) for all south-facing slope sites with equal scaling of the horizontal axes for each site. Dashed lines indicate models with A<0 (bounded motion), and solid lines indicate models with A>0 (runaway motion). Open circles represent empirical data. Columns correspond to particle sizes (small, medium, large), while rows indicate the experimental site.
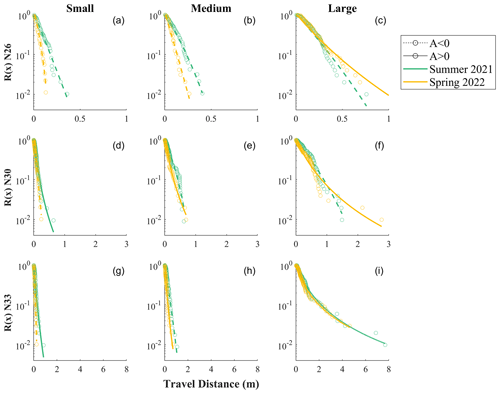
Figure B9Empirical and modeled travel distance exceedance distributions R(x) for all south-facing slope sites with equal scaling of the horizontal axes for each site. Dashed lines indicate models with A<0 (bounded motion), and solid lines indicate models with A>0 (runaway motion). Open circles represent empirical data. Columns correspond to particle sizes (small, medium, large) while rows indicate experimental site.
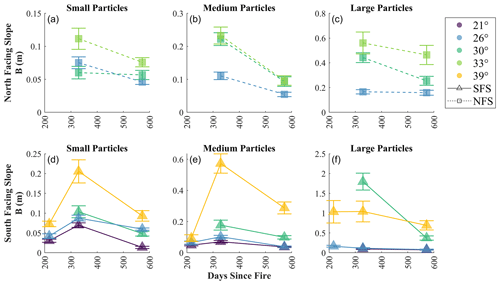
Figure C1Values of Lomax scale parameter B (m) for all combinations of particle size class, slope angle (°), experimental epoch, and aspect. Error bars represent standard error (±σB) of B obtained from bootstrapping. Field visits occurred 217, 329, and 572 d post-fire.
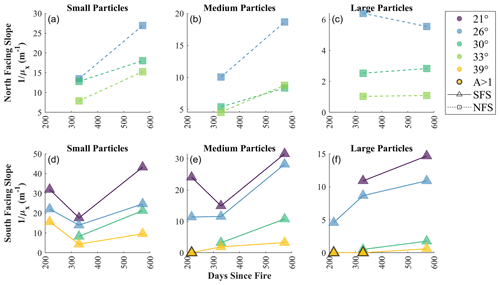
Figure C2Values of the reciprocal of mean travel distance () (m−1) for all combinations of particle size class, slope angle (°), experimental epoch, and aspect. Undefined values of where A>1 are represented by filled black markers and plotted at a value of 0 (medium and large particles at S39 in spring 2021 and large particles at S39 in summer 2021). Field visits occurred 217, 329, and 572 d post-fire.
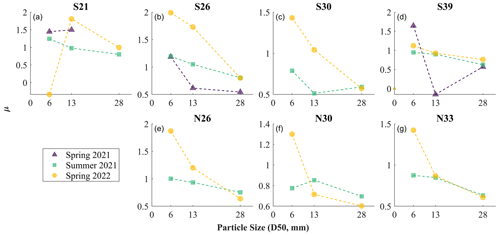
Figure C3Trends in the coefficient of friction (μ) with particle size for each experimental site and epoch. Subplot titles designate aspect (S indicates the south-facing slope, while N indicates the north-facing slope) and slope in degrees (e.g., S21 has a slope of 21°).
The V1.0.0 version of the code (Lomax2) and data (particle travel distances, pebble counts) required to recreate the analyses presented in this paper can be found on GitHub and are archived with Zenodo (https://doi.org/10.5281/zenodo.10048974, Jacobson, 2023). Topographic data are available in the UNAVCO online data archive at https://doi.org/10.7283/cp79-v370 (UNAVCO, 2021).
Conceptualization: DLR, MZ, and KJ. Methodology: HLJ, DLR, and GW. Software: HLJ and DLR. Formal analysis: HLJ, DLR, and GW. Investigation: HLJ, DLR, and MZ. Data curation: HLJ. Writing – original draft: HLJ. Writing – review and editing: HLJ, DLR, GW, MZ, and KJ. Visualization: HLJ. Supervision: DLR and GW. Funding acquisition: DLR, and MZ.
The contact author has declared that none of the authors has any competing interests.
Publisher’s note: Copernicus Publications remains neutral with regard to jurisdictional claims made in the text, published maps, institutional affiliations, or any other geographical representation in this paper. While Copernicus Publications makes every effort to include appropriate place names, the final responsibility lies with the authors.
The authors thank Zac Harlow and Zac Tuthill for assisting with site access and providing equipment at Blue Oak Ranch Reserve (https://doi.org/10.21973/N3ZT08), which is part of the University of California Natural Reserve System. We greatly appreciate Amanda Donaldson, Lauren Giggy, Michael Wilshire, Nerissa Barling, and Dylan Elliott, members of the UC Santa Cruz Watershed Hydrology Laboratory, and Mel Zhang, Natalie Lasater, Stephen Gialamas, and Samantha Burton, members of the Surface Processes and Geomorphology Group at CSM, for assisting with fieldwork and data management. Lidar acquisition services were provided by the GAGE Facility, operated by UNAVCO, Inc., with support from the National Science Foundation, the National Aeronautics and Space Administration, and the U.S. Geological Survey under NSF cooperative agreement no. EAR-1724794. We appreciate the comments on an earlier version of this paper by Jonathan Perkins, and we thank Emmanuel Gabet and an anonymous reviewer for their peer reviews.
This work was supported by the National Science Foundation (NSF) Division of Earth Sciences through award no. 2123220.
This paper was edited by Tom Coulthard and reviewed by Emmanuel Gabet and one anonymous referee.
Ashcroft, M. B., Gollan, J. R., and Ramp, D.: Creating vegetation density profiles for a diverse range of ecological habitats using terrestrial laser scanning, Meth. Ecol. Evol., 5, 263–272, https://doi.org/10.1111/2041-210X.12157, 2014.
Bennett, K. A.: Effects of slash burning on surface soil erosion rates in the Oregon Coast Range, MS Thesis, Oregon State University, https://ir.library.oregonstate.edu/concern/graduate_thesis_or_dissertations/zg64tq07h (last access: 1 October 2023), 1982.
Black, T. A. and Montgomery, D. R.: Sediment transport by burrowing mammals, Marin County, California, Earth Surf. Proc. Land. 16, 163–172, https://doi.org/10.1002/esp.3290160207, 1991.
Bunte, K. and Abt, S. R.: Sampling surface and subsurface particle-size distributions in wadable gravel-and cobble-bed streams for analyses in sediment transport, hydraulics, and streambed monitoring, US Department of Agriculture, Forest Service, Rocky Mountain Research Station, https://doi.org/10.2737/RMRS-GTR-74, 2001.
Collins, L. and Ketcham, B.: Fluvial Geomorphic Response Of a Northern California Coastal Stream To Wildfire, Lessons Learned From the October 1995 Fire, US Department of the Interior, National Park Service, Point Reyes National Seashore, 59–79, https://www.nps.gov/pore/learn/nature/upload/firemanagement_visionfire_lessonslearned.pdf (last access: 1 October 2023), 2001.
Dibblee, T. W. and Minch, J. A. Geologic map of the Mount Day quadrangle, Santa Clara & Alameda Counties, California, Dibblee Geological Foundation, Dibblee Foundation Map DF-236, https://purl.stanford.edu/sm222ps4601 (last access: 1 October 2023), 2006.
DiBiase, R. A. and Lamb, M. P.: Vegetation and wildfire controls on sediment yield in bedrock landscapes, Geophys. Res. Lett., 40, 1093–1097, https://doi.org/10.1002/grl.50277, 2013.
DiBiase, R. A. and Lamb, M. P.: Dry sediment loading of headwater channels fuels post-wildfire debris flows in bedrock landscapes, Geology, 48, 189–193, https://doi.org/10.1130/G46847.1, 2019.
DiBiase, R. A., Lamb, M. P., Ganti, V., and Booth, A. M.: Slope, grain size, and roughness controls on dry sediment transport and storage on steep hillslopes, J. Geophys. Res.-Earth, 122, 941–960, https://doi.org/10.1002/2016JF003970, 2017.
Dix, R. L.: An Application of the Point-Centered Quarter Method to the Sampling of Grassland Vegetation, J. Land Manage., 14, 63–69, https://doi.org/10.2307/3894717, 1961.
Donaldson, A., Dralle, D., Barling, N., Callahan, R. P., Loik, M. E., and Zimmer, M.: Aspect Differences in Vegetation Type Drive Higher Evapotranspiration on a Pole-Facing Slope in a California Oak Savanna, J. Geophys. Res-Biogeo., 129, e2024JG008054, https://doi.org/10.1029/2024JG008054, 2024.
Donaldson, A. M., Zimmer, M., Huang, M.-H., Johnson, K. N., Hudson-Rasmussen, B., Finnegan, N., Barling, N., and Callahan, R. P.: Symmetry in Hillslope Steepness and Saprolite Thickness Between Hillslopes With Opposing Aspects, J. Geophys. Res.-Earth, 128, e2023JF007076, https://doi.org/10.1029/2023JF007076, 2023.
East, A. E., Logan, J. B., Dartnell, P., Lieber-Kotz, O., Cavagnaro, D. B., McCoy, S. W., and Lindsay, D. N.: Watershed Sediment Yield Following the 2018 Carr Fire, Whiskeytown National Recreation Area, Northern California, Earth and Space Science, 8, e2021EA001828, https://doi.org/10.1029/2021EA001828, 2021.
Fitch, H. S.: Ecology of the California ground squirrel on grazing lands, Am. Midl. Nat., 39, 513–596, https://www.jstor.org/stable/2421524 (last access: 1 August 2024), 1948.
Florsheim, J. L., Keller, E. A., and Best, D. W.: Fluvial sediment transport in response to moderate storm flows following chaparral wildfire, Ventura County, southern California, GSA Bulletin, 103, 504–511, https://doi.org/10.1130/0016-7606(1991)103<0504:FSTIRT>2.3.CO;2, 1991.
Foufoula-Georgiou, E., Ganti, V., and Dietrich, W. E.: A nonlocal theory of sediment transport on hillslopes, J. Geophys. Res.-Earth, 115, F00A16, https://doi.org/10.1029/2009JF001280, 2010.
Furbish, D. J. and Haff, P. K.: From divots to swales: Hillslope sediment transport across divers length scales, J. Geophys. Res.-Earth, 115, F03001, https://doi.org/10.1029/2009JF001576, 2010.
Furbish, D. J. and Roering, J. J.: Sediment disentrainment and the concept of local versus nonlocal transport on hillslopes, J. Geophys. Res.-Earth, 118, 937–952, https://doi.org/10.1002/jgrf.20071, 2013.
Furbish, D. J., Roering, J. J., Doane, T. H., Roth, D. L., Williams, S. G. W., and Abbott, A. M.: Rarefied particle motions on hillslopes – Part 1: Theory, Earth Surf. Dynam., 9, 539–576, https://doi.org/10.5194/esurf-9-539-2021, 2021a.
Furbish, D. J., Williams, S. G. W., Roth, D. L., Doane, T. H., and Roering, J. J.: Rarefied particle motions on hillslopes – Part 2: Analysis, Earth Surf. Dynam., 9, 577–613, https://doi.org/10.5194/esurf-9-577-2021, 2021b.
Gabet, E. J.: Sediment transport by dry ravel, J. Geophys. Res.-Sol. Ea., 108, 2049, https://doi.org/10.1029/2001JB001686, 2003.
Gabet, E. J. and Dunne, T.: A stochastic sediment delivery model for a steep Mediterranean landscape, Water Resour. Res., 39, 1237, https://doi.org/10.1029/2003WR002341, 2003.
Gabet, E. J. and Mendoza, M. K.: Particle transport over rough hillslope surfaces by dry ravel: Experiments and simulations with implications for nonlocal sediment flux, J. Geophys. Res.-Earth, 117, F01019, https://doi.org/10.1029/2011JF002229, 2012.
Grau, E., Durrieu, S., Fournier, R., Gastellu-Etchegorry, J.-P., and Yin, T.: Estimation of 3D vegetation density with Terrestrial Laser Scanning data using voxels. A sensitivity analysis of influencing parameters, Proc. SPIE, 191, 373–388, https://doi.org/10.1016/j.rse.2017.01.032, 2017.
Guilinger, J. J., Gray, A. B., Barth, N. C., and Fong, B. T.: The Evolution of Sediment Sources Over a Sequence of Postfire Sediment-Laden Flows Revealed Through Repeat High-Resolution Change Detection, J. Geophys. Res.-Earth, 125, e2020JF005527, https://doi.org/10.1029/2020JF005527, 2020.
Hey, R. D. and Thorne, C. R.: Accuracy of Surface Samples from Gravel Bed Material, J. Hydraul. Eng., 109, 842–851, https://doi.org/10.1061/(ASCE)0733-9429(1983)109:6(842), 1983.
Jackson, M. and Roering, J. J.: Post-fire geomorphic response in steep, forested landscapes: Oregon Coast Range, USA, Quaternary Sci. Rev., 28, 1131–1146, https://doi.org/10.1016/j.quascirev.2008.05.003, 2009.
Jacobson, H.: Lomax2, Zenodo [code and data set], https://doi.org/10.5281/zenodo.10048974, 2023.
Kean, J. W., Staley, D. M., and Cannon, S. H.: In situ measurements of post-fire debris flows in southern California: Comparisons of the timing and magnitude of 24 debris-flow events with rainfall and soil moisture conditions, J. Geophys. Res.-Earth, 116, F04019, https://doi.org/10.1029/2011JF002005, 2011.
Kley, N. J. and Kearney, M.: Chapter 17. Adaptations for Digging and Burrowing, in: Fins into Limbs: Evolution, Development, and Transformation, edited by: Hall, B. K., University of Chicago Press, Chicago, 284–309, ISBN 9780226313405, 2006.
Knapp, A. K. and Hulbert, L. C.: Production, Density and Height of Flower Stalks of Three Grasses in Annually Burned and Unburned Eastern Kansas Tallgrass Prairie: A Four Year Record, Southwest. Nat., 31, 235–241, https://doi.org/10.2307/3670564, 1986.
Lagarias, J. C., Reeds, J. A., Wright, M. H., and Wright, P. E.: Convergence Properties of the Nelder-Mead Simplex Method in Low Dimensions, SIAM J. Optimiz., 9, 112–147, https://doi.org/10.1137/S1052623496303470, 1998.
Lamb, M. P., Scheingross, J. S., Amidon, W. H., Swanson, E., and Limaye, A.: A model for fire-induced sediment yield by dry ravel in steep landscapes, J. Geophys. Res.-Earth, 116, F03006, https://doi.org/10.1029/2010JF001878, 2011.
Lamb, M. P., Levina, M., DiBiase, R. A., and Fuller, B. M.: Sediment storage by vegetation in steep bedrock landscapes: Theory, experiments, and implications for postfire sediment yield, J. Geophys. Res.-Earth, 118, 1147–1160, https://doi.org/10.1002/jgrf.20058, 2013.
Lavé, J. and Burbank, D.: Denudation processes and rates in the Transverse Ranges, southern California: Erosional response of a transitional landscape to external and anthropogenic forcing, J. Geophys. Res.-Earth, 109, F01006, https://doi.org/10.1029/2003JF000023, 2004.
Mataix-Solera, J., Cerdà, A., Arcenegui, V., Jordán, A., and Zavala, L.M.: Fire effects on soil aggregation: a review, Earth-Sci. Rev., 109, 44–60, https://doi.org/10.1016/j.earscirev.2011.08.002, 2011.
Milojević, S.: Power law distributions in information science: Making the case for logarithmic binning, J. Am. Soc. Inf. Sci. Tec., 61, 2417–2425, https://doi.org/10.1002/asi.21426, 2010.
Ordeñana, M. A., Van Vuren, D. H., and Draper, J. P.: Habitat associations of California ground squirrels and Botta's pocket gophers on levees in California, J. Wildlife Manage., 76, 1712–1717, https://doi.org/10.1002/jwmg.402, 2012.
Parks, S. A. and Abatzoglou, J. T.: Warmer and Drier Fire Seasons Contribute to Increases in Area Burned at High Severity in Western US Forests From 1985 to 2017, Geophys. Res. Lett., 47, e2020GL089858, https://doi.org/10.1029/2020GL089858, 2020.
Parsons, A., Robichaud, P. R., Lewis, S. A., Napper, C., and Clark, J. T.: Field guide for mapping post-fire soil burn severity (Vol. 243), US Department of Agriculture, Forest Service, Rocky Mountain Research Station, https://doi.org/10.2737/RMRS-GTR-243, 2010.
Perkins, J. P., Diaz, C., Corbett, S. C., Cerovski-Darriau, C., Stock, J. D., Prancevic, J. P., Micheli, E., and Jasperse, J.: Multi-Stage Soil-Hydraulic Recovery and Limited Ravel Accumulations Following the 2017 Nuns and Tubbs Wildfires in Northern California, J. Geophys. Res.-Earth, 127, e2022JF006591, https://doi.org/10.1029/2022JF006591, 2022.
Reed, S. and Amundson, R.: Sediment, gophers, and time: a model for the origin and persistence of Mima mound–vernal pool topography in the Great Central Valley, in: Vernal Pool Landscapes, edited by: Schlising, A. and Alexander, D. G., California State University, Chico, California, 15–27, ISBN 978-0-9761774-1-8, 2007.
Roering, J. J. and Gerber, M.: Fire and the evolution of steep, soil-mantled landscapes, Geology, 33, 349–352, https://doi.org/10.1130/G21260.1, 2005.
Roering, J. J., Kirchner, J. W., and Dietrich, W. E.: Evidence for nonlinear, diffusive sediment transport on hillslopes and implications for landscape morphology, Water Resour. Res., 35, 853–870, https://doi.org/10.1029/1998WR900090, 1999.
Roth, D. L., Doane, T. H., Roering, J. J., Furbish, D. J., and Zettler-Mann, A.: Particle motion on burned and vegetated hillslopes, P. Natl. Acad. Sci. USA, 117, 25335–25343, https://doi.org/10.1073/pnas.1922495117, 2020.
Samson, L., Ippolito, I., Bideau, D., and Batrouni, G. G.: Motions of grains down a bumpy surface, Chaos, 9, 639–648, https://doi.org/10.1063/1.166437, 1999.
Shakesby, R. A. and Doerr, S. H.: Wildfire as a hydrological and geomorphological agent, Earth-Sci. Rev., 74, 269–307, https://doi.org/10.1016/j.earscirev.2005.10.006, 2006.
Sorensen, D. C. and Moré, J. C.: Computing a Trust Region Step, SIAM J. Sci. Stat. Comp., 4, 553–572, https://doi.org/10.1137/0904038, 1983.
Swanson, F. J.: Fire and geomorphic process, Fire Regime and Ecosystem Properties, 26, 401–421, 1981.
Tucker, G. E. and Bradley, D. N.: Trouble with diffusion: Reassessing hillslope erosion laws with a particle-based model, J. Geophys. Res.-Earth, 115, F00A10, https://doi.org/10.1029/2009JF001264, 2010.
UNAVCO: SV01: Postfire Steepland Ravel (U-078) – Arbor Creek (PS01), tls.unavco.org, UNAVCO [data set], https://doi.org/10.7283/cp79-v370, 2021.
Vogel, K. P. and Masters, R. A.: Frequency grid – a simple tool for measuring grassland establishment, J. Range Manage., 54, 635–655, https://doi.org/10.2307/4003666, 2001.
Wells, W. G.: The effects of fire on the generation of debris flows in southern California, Rev. Eng. Geol., 7, 105–114, https://doi.org/10.1130/REG7-p105, 1987.
Wohl, E. E., Anthony, D. J., Madsen, S. W., and Thompson, D. M.: A comparison of surface sampling methods for coarse fluvial sediments, Water Resour. Res., 32, 3219–3226, https://doi.org/10.1029/96WR01527, 1996.
Wondzell, S. M. and King, J. G.: Postfire erosional processes in the Pacific Northwest and Rocky Mountain regions, Forest Ecol. Manag., 178, 75–87, https://doi.org/10.1016/S0378-1127(03)00054-9, 2003.
- Abstract
- Introduction
- Methods
- Results
- Discussion
- Conclusion
- Appendix A: Experimental particle and site parameters
- Appendix B: Detailed regression with empirical data and error for all sites
- Appendix C: Additional visualizations of trends in A, B, , and μ
- Code and data availability
- Author contributions
- Competing interests
- Disclaimer
- Acknowledgements
- Financial support
- Review statement
- References


