the Creative Commons Attribution 4.0 License.
the Creative Commons Attribution 4.0 License.
 | 30 Jan 2024
Massive sediment pulses triggered by a multi-stage 130 000 m3 alpine cliff fall (Hochvogel, DE–AT)
Natalie Barbosa
Johannes Leinauer
Juilson Jubanski
Michael Dietze
Ulrich Münzer
Florian Siegert
Michael Krautblatter
Massive sediment pulses in catchments are a key alpine multi-risk component. Substantial sediment redistribution in alpine catchments frequently causes flooding, river erosion, and landsliding and affects infrastructure such as dam reservoirs as well as aquatic ecosystems and water quality. While systematic rock slope failure inventories have been collected in several countries, the subsequent cascading sediment redistribution is virtually unaccessed. For the first time, this contribution reports the massive sediment redistribution triggered by the multi-stage failure of more than 130 000 m3 from the Hochvogel dolomite peak during the summer of 2016. We applied change detection techniques to seven 3D-coregistered high-resolution true orthophotos and digital surface models (DSMs) obtained through digital aerial photogrammetry later optimized for precise volume calculation in steep terrain. The analysis of seismic information from surrounding stations revealed the temporal evolution of the cliff fall. We identified the proportional contribution of > 600 rockfall events (> 1 m3) from four rock slope catchments with different slope aspects and their volume estimates. In a sediment cascade approach, we evaluated erosion, transport, and deposition from the rock face to the upper channelized erosive debris flow channel, then to the widened dispersive debris flow channel, and finally to the outlet into the braided sediment-supercharged Jochbach river. We observe the decadal flux of more than 400 000 m3 of sediment, characterized by massive sediment waves that (i) exhibit reaction times of 0–4 years in response to a cliff fall sediment input and relaxation times beyond 10 years. The sediment waves (ii) manifest with faster response times of 0–2 years in the upper catchment and over 2 years in the lower catchments. The entire catchment (iii) undergoes a rapid shift from sedimentary (102–103 mm a−1) to massive erosive regimes (102 mm a−1) within single years, and the massive sediment redistribution (iv) shows limited dependency on rainfall frequency and intensity. This study provides generic information on spatial and temporal patterns of massive sediment pulses in highly sediment-charged alpine catchments.
- Article
(13308 KB) - Full-text XML
-
Supplement
(2049 KB) - BibTeX
- EndNote


Recent high-magnitude rockfalls in the European Alps have brought attention to the potential of catastrophic cascading sediment transport and its societal impact, e.g., Piz Cengalo Bergsturz (Baer et al., 2017). Sediment cascades define the dynamic process of sediment mobilization and deposition within a landscape that encompasses the continuous travel of sediment particles from their source through the river network to eventual deposition in sediment sinks (Burt and Allison, 2010). Key driving processes to sediment cascades are landslides and rockfalls acting as sources of sediment and debris flows and sediment transport as mechanisms of sediment remobilization. Several studies have focused on sediment cascades in active mountain environments controlled by landsliding (e.g., Benda and Dunne, 1997; Wichmann et al., 2009; Bennett et al., 2013; Heckmann et al., 2016; Clapuyt et al., 2019) as landslides provide and condition the input of sediment volumes into the sediment cascade (Benda and Dunne, 1997; Tucker, 2004). Attempts to better understand decadal to centennial erosion rates and sediment yield at a basin scale include geomorphological observations and spatial pattern analysis (Schrott et al., 2003; Theler et al., 2010), monitoring of sediment fluxes and construction of sediment budgets (Dietrich et al., 1982; Becht et al., 2009; Brown et al., 2009; Heckmann et al., 2016; Joyce et al., 2018), numerical modeling (Wichmann et al., 2009; Heckmann and Schwanghart, 2013; Bennett et al., 2014; Battista et al., 2022), and application of the connectivity framework (Borselli et al., 2008; Fryirs, 2013; Heckmann and Schwanghart, 2013; Bracken et al., 2015). These approaches incorporate both spatial and temporal variability in the operation of the sediment cascades at a diversity of scales; however, they lack key observations on rare and high-magnitude events and the subsequent sediment transfer at high spatial resolutions.
High-magnitude, low-frequency events disrupt landscape dynamics, yielding a measurable time response. This response is the combination of the time required for a system to initiate a reaction, known as the reaction time, and the time taken for the system to complete the response and adjust to the change, referred to as the relaxation time. Debris flows are of particular societal concern (Owens et al., 2010) due to their short reaction times and long relaxation times expanding the temporal activity of the processes. Debris flows serve as a link to hillslope–channel coupling by connecting large parts of rockwalls to the channel network (Heckmann and Schwanghart, 2013; Bennett et al., 2014). Debris flows rapidly mobilize < 102 to > 109 m3 of sediment (Jakob, 2005) along great distances, reaching infrastructure and populated areas. While debris flows are typically considered transport-limited processes (Gregory and Lewin, 2014), numerical simulations suggest that continuous delivery of sediment from upslope areas to the location where debris flows are initiated maintains the supply of material available for transport, thus impacting the persistence and magnitude of sediment pulses in the system (Heckmann and Schwanghart, 2013). Several studies have collected data from massive rock slope failures (e.g., Dussauge-Peisser et al., 2002; Heckmann et al., 2012; Fischer et al., 2012; Krautblatter et al., 2012; Guerin et al., 2020), which are a major landscape evolution process and significantly contribute to sediment yields by sporadic production of a considerable (< 103 m3 km2 y−1) amount of debris (McSaveney, 2002; Korup et al., 2010; Krautblatter et al., 2012). In the coming decades with enhanced rainstorm activity, massive sediment redistribution primarily by debris flows in alpine catchments will be a key hazard and challenge in alpine communities; thus, constraining rates and sediment cascades response times to suddenly increased sediment input by landsliding is paramount for prediction and early warning.
Developments in digital photogrammetry allow the 3D reconstruction of landscapes from images taken by a diversity of platforms (Eltner and Sofia, 2020). Large-format nadir-view digital photogrammetry with (multi-)year temporal resolution and high spatial resolution (20 cm) covering vast areas presents a valuable, yet unexplored, data source for quantification of geomorphic changes in the last decade despite their challenges (Fawcett et al., 2019). Photogrammetric models of steep terrain and pseudo-vertical walls include random errors still difficult to minimize and quantify accurately, yet they allow the unlocking of a historical perspective and provide insights on sediment cascade spatial patterns in climate-sensitive landscapes (e.g., Fabris and Pesci, 2009; Berger et al., 2011; Bennett et al., 2012; Savi et al., 2023). Despite the temporal resolution that results in the coalescence of events, a combination of techniques such as high-resolution seismic investigation provides a potential complement to the photogrammetric record. Environmental seismology uses the seismic signals emitted by Earth's surface processes to track back their origin (Dietze et al., 2017a).
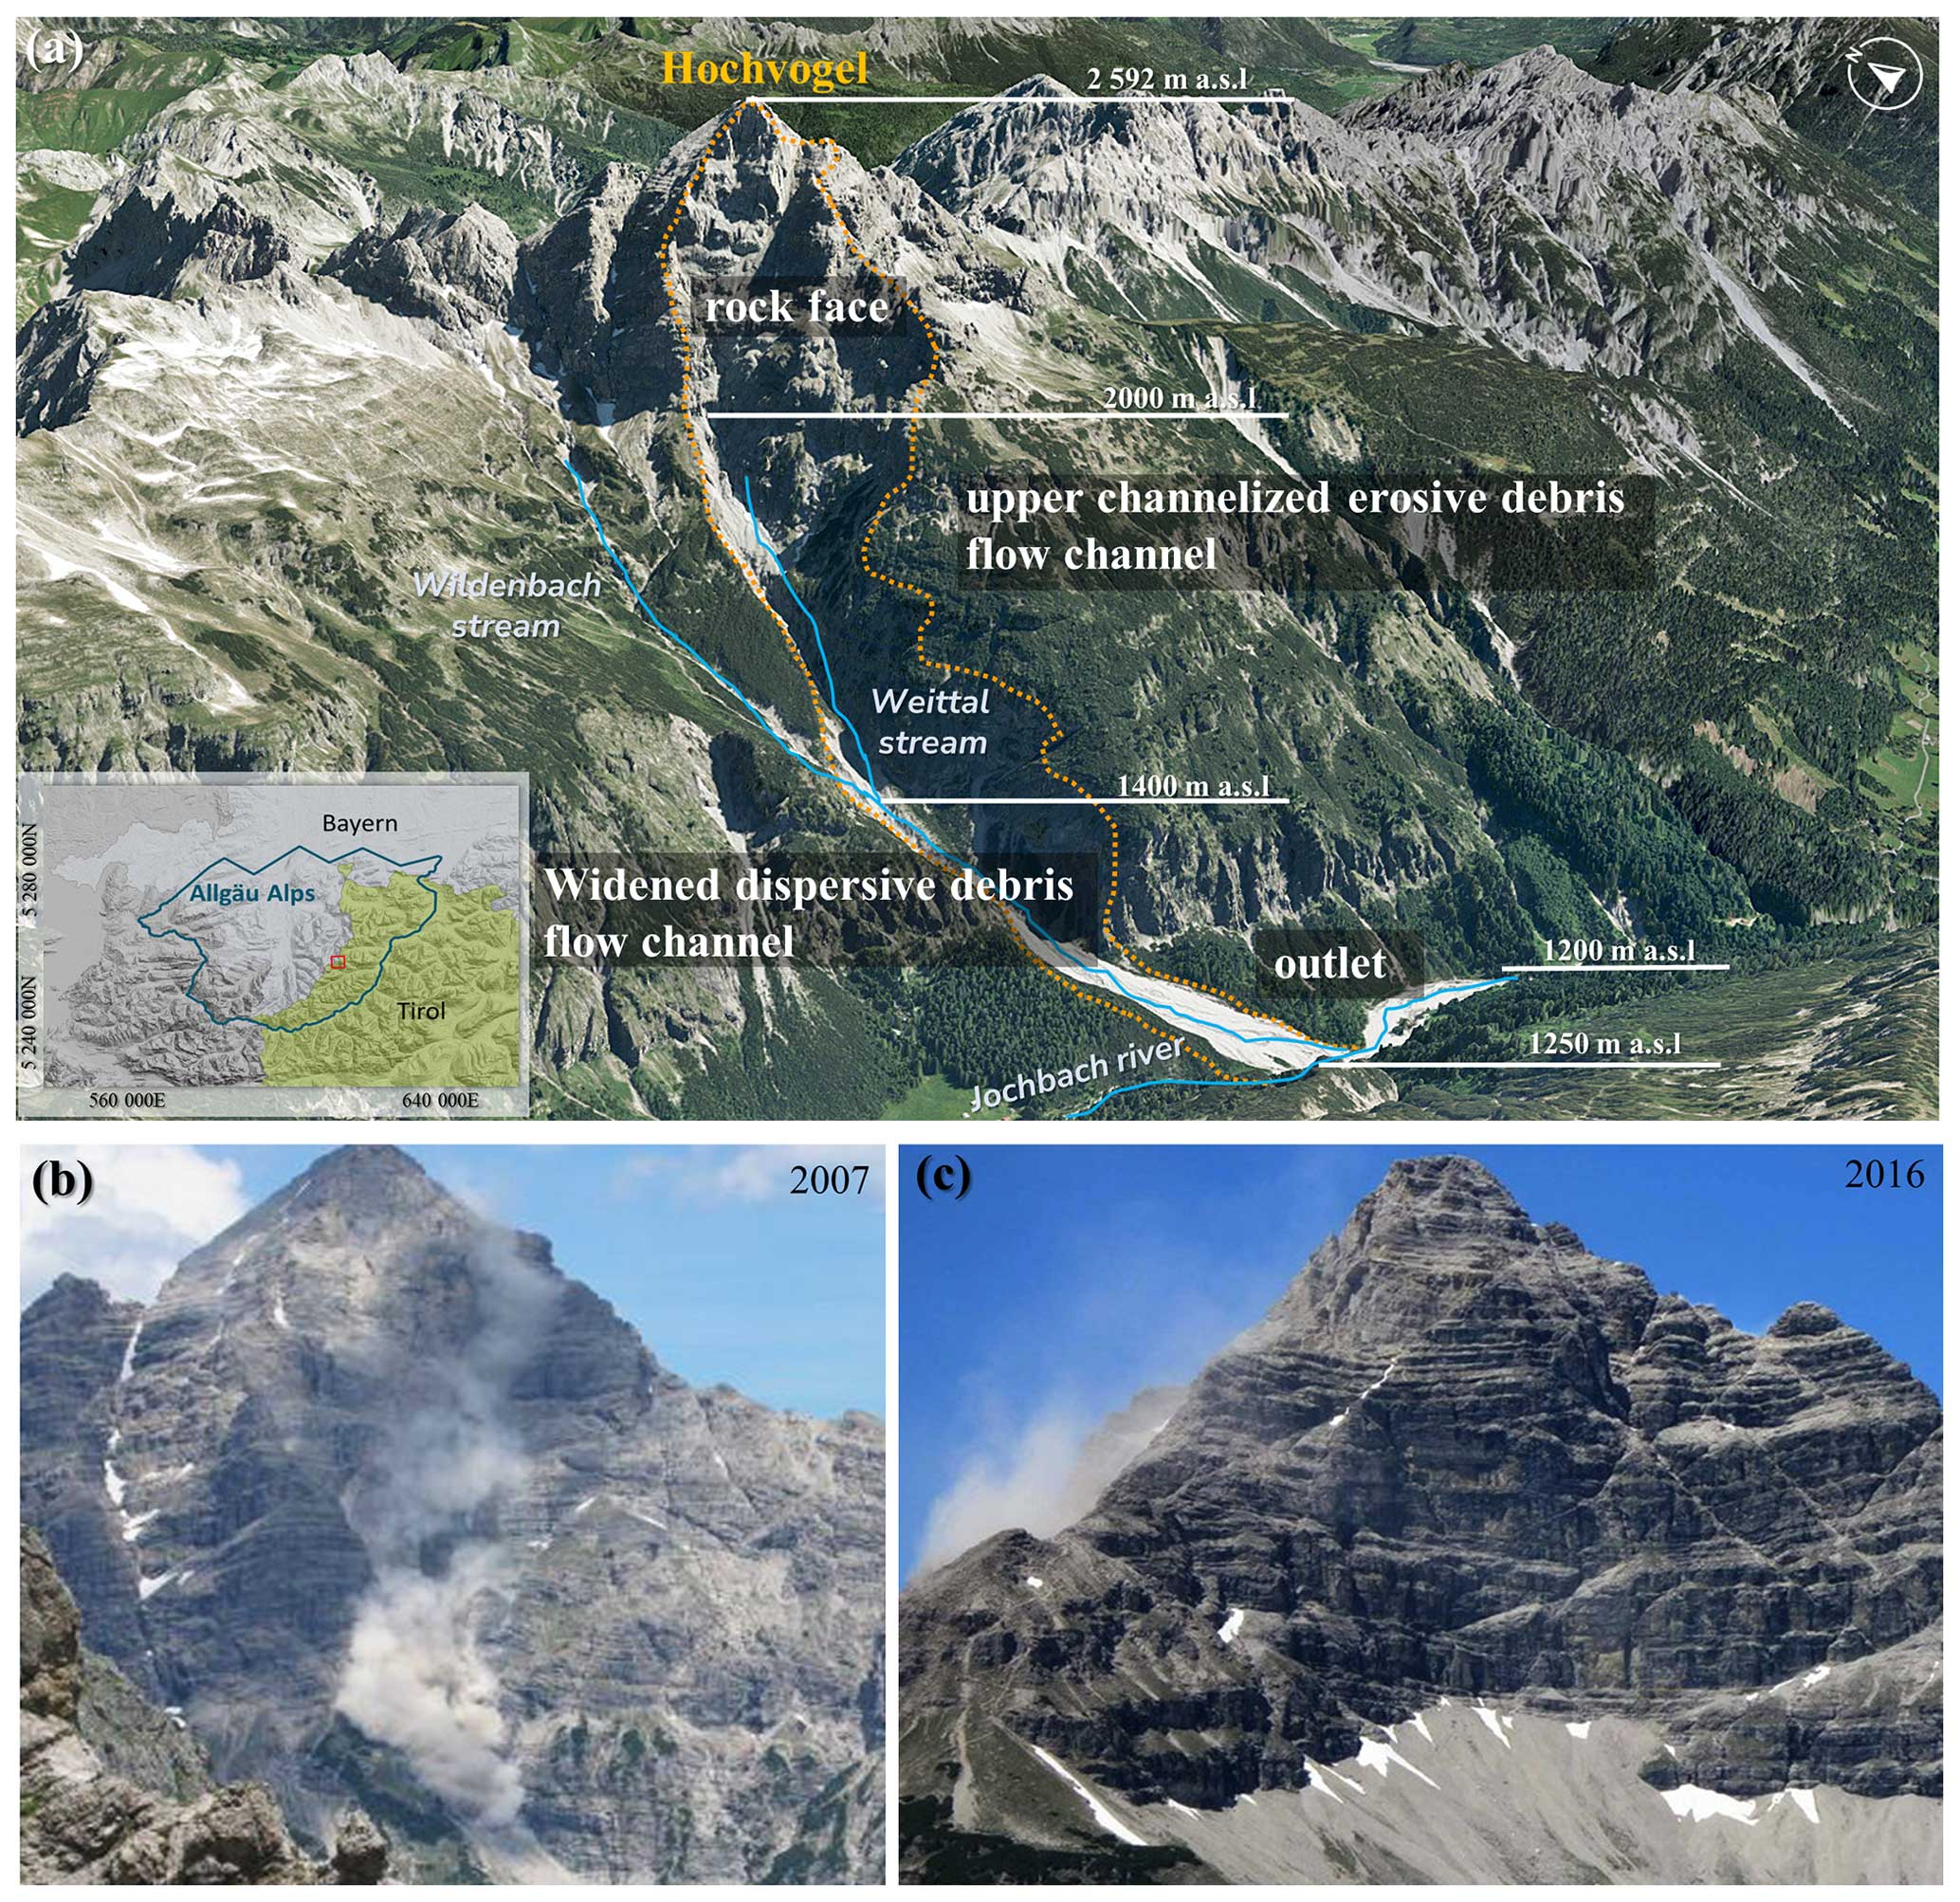
Figure 1(a) Location of the Hochvogel summit in the Allgäu Alps between Bavaria (Germany) and Tirol (Austria) and 3D reconstruction of the southwestern slope, indicating the approximate elevation of the boundaries of the morphodynamic zones: rock face, upper channelized erosive debris flow channel, widened dispersive debris flow channel, and outlet. The orange dotted line delimits the 378 642 m2 impacted by the cliff fall studied in this contribution. (b) Dust cloud over the southwestern slope produced by the 2007 rockfall event (Deutscher Alpenverein, Sektion Donauwörth, 2017); (b) southeastern slope with remnant dust cloud from the 2016 rockfall event at the southwestern slope (Deutscher Alpenverein, Sektion Donauwörth, 2016).
This paper reports the massive sediment redistribution triggered by the multi-stage failure from the Hochvogel dolomite peak during the summer of 2016. We evaluate the spatiotemporal morphodynamics at a catchment scale before and after the cliff fall by means of multi-temporal high-resolution aerial photogrammetry between 2010 and 2020. The (multi-)annual photogrammetric surveys provide information on detachment areas and failed volumes. Still, the temporal resolution is limited to the recurrence interval between two consecutive surveys, i.e., 1 to 2 years. Thereby, we intend to decipher rockfall patterns and catchment sediment dynamics after an unusual sediment input to the catchment. Additionally, we complement the understanding of a multi-stage single rockfall event by the use of high-resolution seismic records (e.g., Hibert et al., 2011; Lacroix and Helmstetter, 2011; Manconi et al., 2016; Fuchs et al., 2018; Dietze et al., 2017a). The combination of seismic information with high-resolution wide-extent photogrammetric reconstructions resulted in (i) identification of the spatial and temporal contribution of rockfall material from the four rock slope catchments that constitute the Hochvogel summit, (ii) quantification of (multi-)annual series of sediment budget erosion rates before and after the cliff fall evidencing the dramatic inversion of deposition and erosion processes, (iii) time series of sediment cascading, and (iv) estimation of the system reaction time and redistribution controls with respect to rainstorm intensity and frequencies. To our knowledge, this paper is one of few publications showing the cascading sediment response of an alpine catchment to a massive rock slope failure. This enables a better understanding of short-, mid-, and long-term catchment morphodynamic responses to high-magnitude rockfall, propagation, and persistence of sediment waves through alpine catchment system and future hazard scenarios in which increased sediment availability and seasonal extreme heavy rainfall are expected.
The Hochvogel peak (47∘21′ N, 10∘26 E; 2592 ), is a prominent summit in the northern calcareous Alps and a popular destination for hikers. The Hochvogel massif consists of Hauptdolomit, a brittle, variably bituminous carbonate rock with pronounced bedding (decimeter–meter) and incidental marly interlayers. The rock mass is tectonically stressed and highly weathered. A meter-sized fracture at the summit poses a catastrophic rock failure scenario (Leinauer et al., 2020, 2021) directly impacting the Weittal (Fig. 1).
Four slopes constitute the pyramidal-shaped summit with orientations towards northeast, west, southeast, and southwest and mean inclinations between 43 and 47∘. The southwestern slope is distinguished by its currently almost vertical wall and upper negative slope reaching the peak of the summit. Slope processes occurring at the southwestern slope are transferred to the Weittal catchment, which extends over 1.9 km2 with an elevation difference of more than 1300 m. The area directly affected by slope instabilities occurring at the southwestern slope covered 378 642 m2 between 2010 and 2021 and is divided into four morphodynamic zones (Fig. 1a) as follows. The rock face, with strong slope changes, serves as the source of sediment production (primary and secondary rockfalls). The upper channelized erosive debris flow channel, characterized by a mean slope of 42∘, promotes temporal accumulation of sediment in an incipient slope talus. A confined asymmetric valley follows the slope talus limited to the east by vertical walls almost 60 m in height. At the same time, to the west, sporadic minor pulses of sediment are produced by erosion of the base of an older slope deposit gently oriented southwest. The widened dispersive debris flow channel, geographically limited by the intersection of the Weittal and Wildenbach streams, starts by a rockwall-confined valley which transforms into a highly active unconfined slope under continuous incision of older deposits and the outlet into the Jochbach river, which imposes a high-sediment-transfer regime evidenced in the braided development of the river along an alluvial plain with a mean inclination of 14∘ and the presence of terraces with a height between 1 and 3 m from the current main channel.
Rockfalls on the southeastern and southwestern slopes of the Hochvogel summit were documented in 1934, 1935, 2005, and 2007 (Deutscher Alpenverein, Sektion Donauwörth, 2017). Between Saturday 9 and Monday 11 July 2016 (Heißel and Figl, 2017), noise and a dust cloud alerted the local authorities to a new rockfall event that affected the Weittal (Fig. 1b and c).
3.1 Multi-temporal quantification of surface change
We used large-format aerial imagery surveyed by the Austrian and German cartographic survey offices (BEV and LDBV) and by 3D RealityMaps GmbH to investigate the spatial and temporal sediment production, transport, and accumulation patterns of the southwestern slope of the Hochvogel in six intervals over 10 years. All seven surveys (September 2010, August 2012, September 2014, June 2015, August 2017, September 2018, and August 2020) have a nominal 20 cm spatial resolution (Table S1 in the Supplement) for the production of the digital surface models (DSMs) and true orthophotos from the photogrammetric point clouds. The produced DSMs were aligned with the reference dataset acquired on 21 September 2018 by means of 3D coregistration for the further application of change detection and volume calculation.
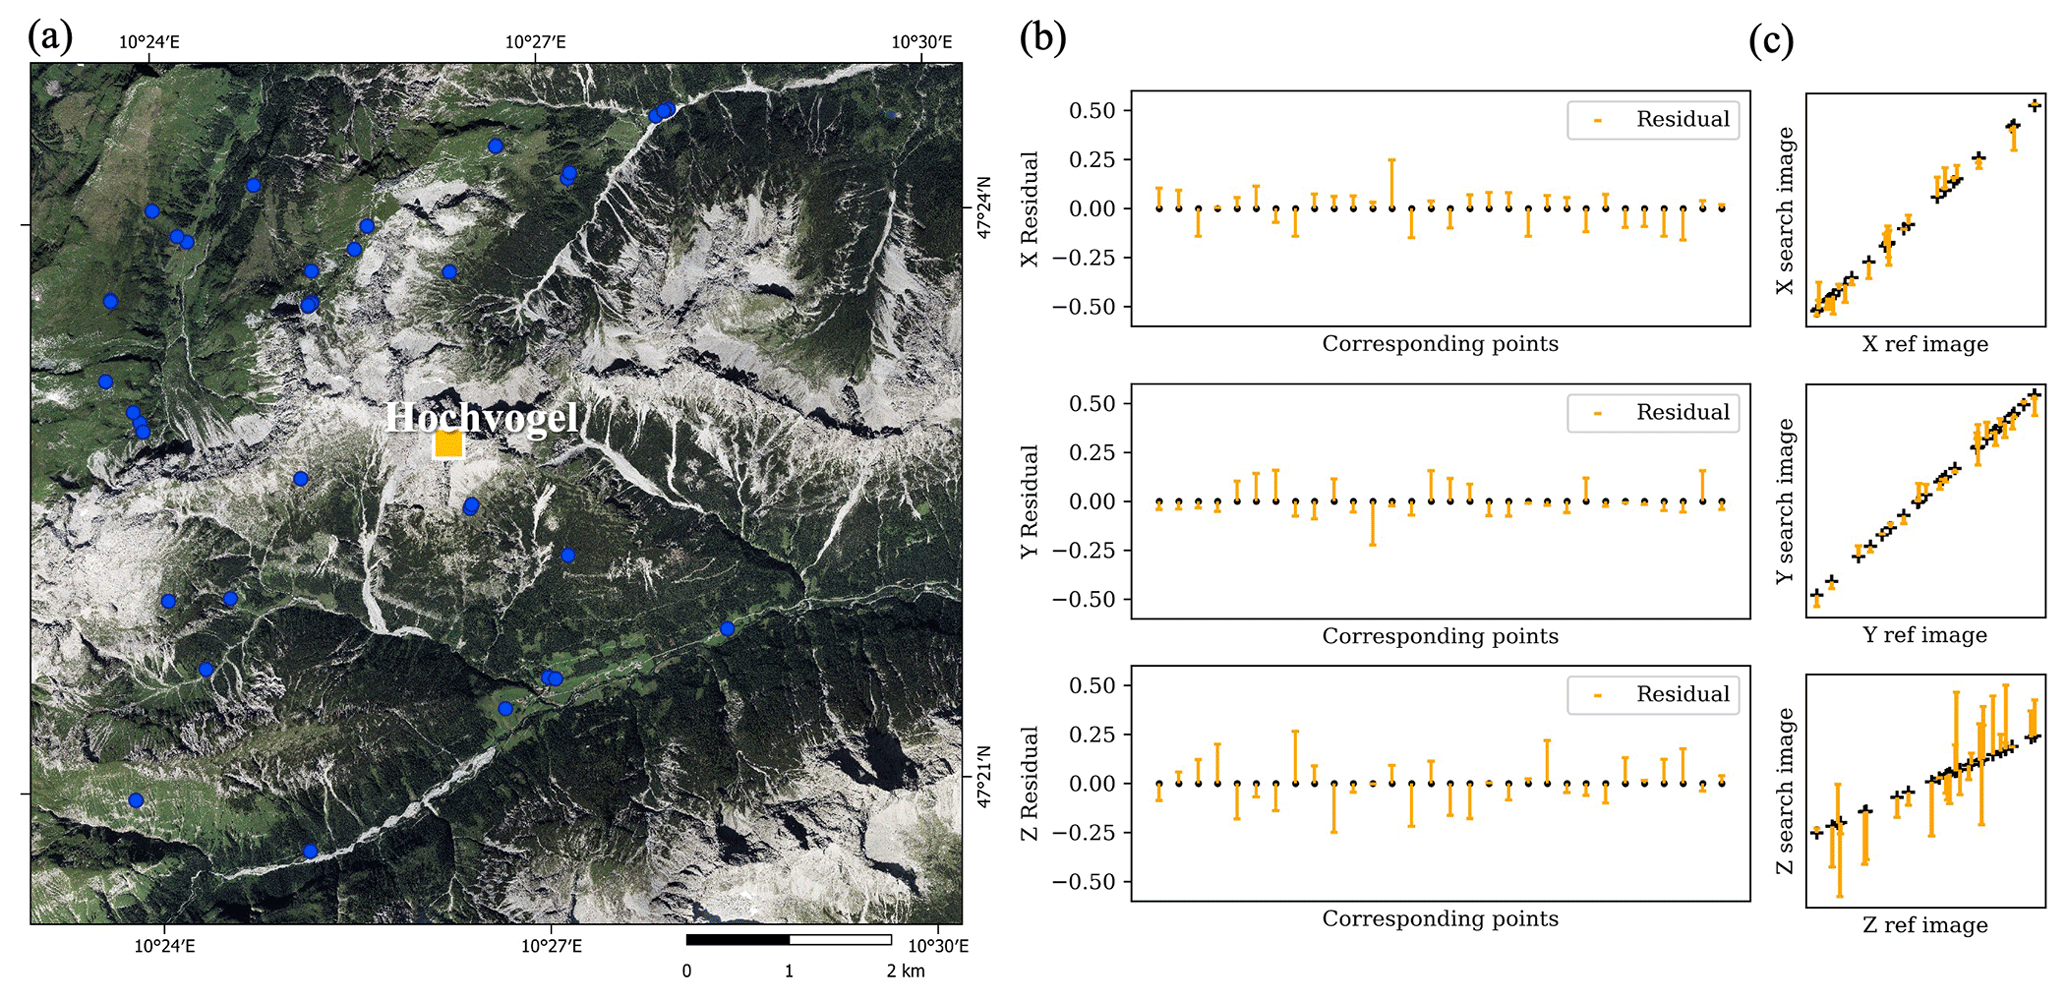
Figure 2(a) True orthophoto of the reference surface acquired on 21 September 2018. Blue dots indicate the corresponding points with the search surface acquired on 7 August 2017. Similar spatial distribution is followed for the remaining datasets according to the extent of the acquisition. (b) Residuals calculated as the difference between r(xyz) and strans(xyz), with strans being the new coordinate of the corresponding points at the search surface after the application of the transformation parameters for each spatial axis x, y, and z. (c) Spatial distribution of the corresponding points at each spatial axis x, y, and z.
3.1.1 2.5D topographic time series
The photogrammetric workflow to generate DSMs and true orthophotos from nadir-view aircraft photographs consists of the initial standardization of the aerotriangulation provided by the survey agencies into the same spatial reference system using the software Inpho and Match-AT by Trimble, followed by the generation of oriented point clouds, DSMs, and orthophotos using the semi-global matching algorithm first developed by Hirschmüller (2008) and implemented in the software SURE from nFrames (ESRI) (Haala and Rothermel, 2012; Rothermel et al., 2012). The DSM follows the same grid from the orthophoto, but only high-quality elevation points identified by a multi-triangulation of at least three photographs are written in the non-interpolated DSM. We optimized the orthophotos and non-interpolated DSMs for a more precise volumetric calculation in steep terrain by the application of a seven-parameter 3D similarity transformation described by Eq. (1). To minimize the 3D distance between a reference dataset (DSM and orthophoto) (21 September 2018) and the interest datasets, we manually selected 30 multi-temporal well-distributed 3D corresponding points (xyz) located in stable, non-changeable areas using the true orthophotos and the corresponding DSMs, and we solved Eq. (1) using the least-squares adjustment solution in Python.
Here, and are the vectors of coordinates of the corresponding points in the interest dataset s(xyz) and reference dataset r(xyz) with size , respectively; λ is the uniform scale factor; is the vector of approximate values of the parameters; and ω, φ, and κ represent the rotation Euler angles used to calculate the orthogonal rotation matrix M, with m11 = cos (φ) cos (κ) , m12 = sin (ω) sin (φ) cos (κ) −cos (ω) sin (κ) , m13 = cos (ω) sin (φ) cos (κ) +sin (ω) sin (κ) , m21 = cos (φ) sin (κ) , m22 = sin (ω) sin (φ) sin (κ) +cos (ω) cos (κ) , m23 = cos (ω) sin (φ) sin (κ) +sin (ω) cos (κ) , m31 = −sin (φ) , m32 = sin (ω) cons (φ) , and m33 = cos (ω) cos (φ) . Parameters λ and are initially approximated to 0 and to . The evaluation of the estimated parameters , λ and after the convergence of the model (five iterations) results in the elimination of outliers and the warranty of randomness in the residual values defined as the difference between the r(xyz) and strans(xyz), with strans being the new coordinate of the corresponding points at the search surface after the application of the transformation parameters (Fig. 2).
Repetitive topographic surveys, in our case DSMs, allow the identification and quantification of geomorphic changes such as erosion and deposition. We followed the guidelines given by James et al. (2012) and Wheaton et al. (2010) for the estimation of area and volume of change based on 2.5D data., i.e., rasterized topography, following Eq. (2):
where DoD is the difference in elevation between consecutive DSMs (Znew and Zold). Despite the limited depiction of vertical walls and possible artifacts for overhanging walls, gridded datasets, i.e., DSMs, support the fast and straightforward calculation of 2.5D volumes by Eq. (3):
and n is the number of pixels with a meaningful change, i.e., pixels over or under a critical threshold; apixel corresponds to 0.4 m2, and DoDi is the elevation difference between time periods.
Elevation uncertainty of photogrammetric surveys is roughly assessed as 3 times the spatial resolution; however, lighting conditions, surface roughness, and camera configuration, among others, imprint an inhomogeneous spatially distributed uncertainty that remains challenging to estimate. Thus, we evaluated the uncertainty of the elevation change (δDoD) after the 3D coregistration using 30 independent well-distributed points on stable areas with complex topography for each DoD independently (Table S2). The uncertainty of the elevation change (δDoD) is measured as the root mean square error (RMSE) of the elevation difference in stable areas with complex topography and ranges between 30 and 40 cm (Table S3). We segmented the study area into four regions based on morphometric characteristics (Fig. 1) to acknowledge the role of topography in elevation uncertainty. Hereby slope angle and slope aspect influence the minimum detectable change through time but also imprint morphodynamic characteristics (Sect. 2). Conservative critical thresholds above the measured coregistration error and elevation uncertainty for each region were determined by best practice between 0.2 and 1 m (Tables S4 and S5). Selecting these critical threshold values influences the calculation of rockfall magnitude and sediment transport volumes. However, they will not affect the rockfall patterns and the response of sediment dynamics in terms of reaction and relaxation times.
Table 1Attributes, argumentation, and threshold value used to filter the change polygons from noise. Threshold values are selected by visual inspection of the filtering results: (A) rock face, (B) upper channelized erosive debris flow channel, (C) widened dispersive debris flow channel, and (D) outlet.
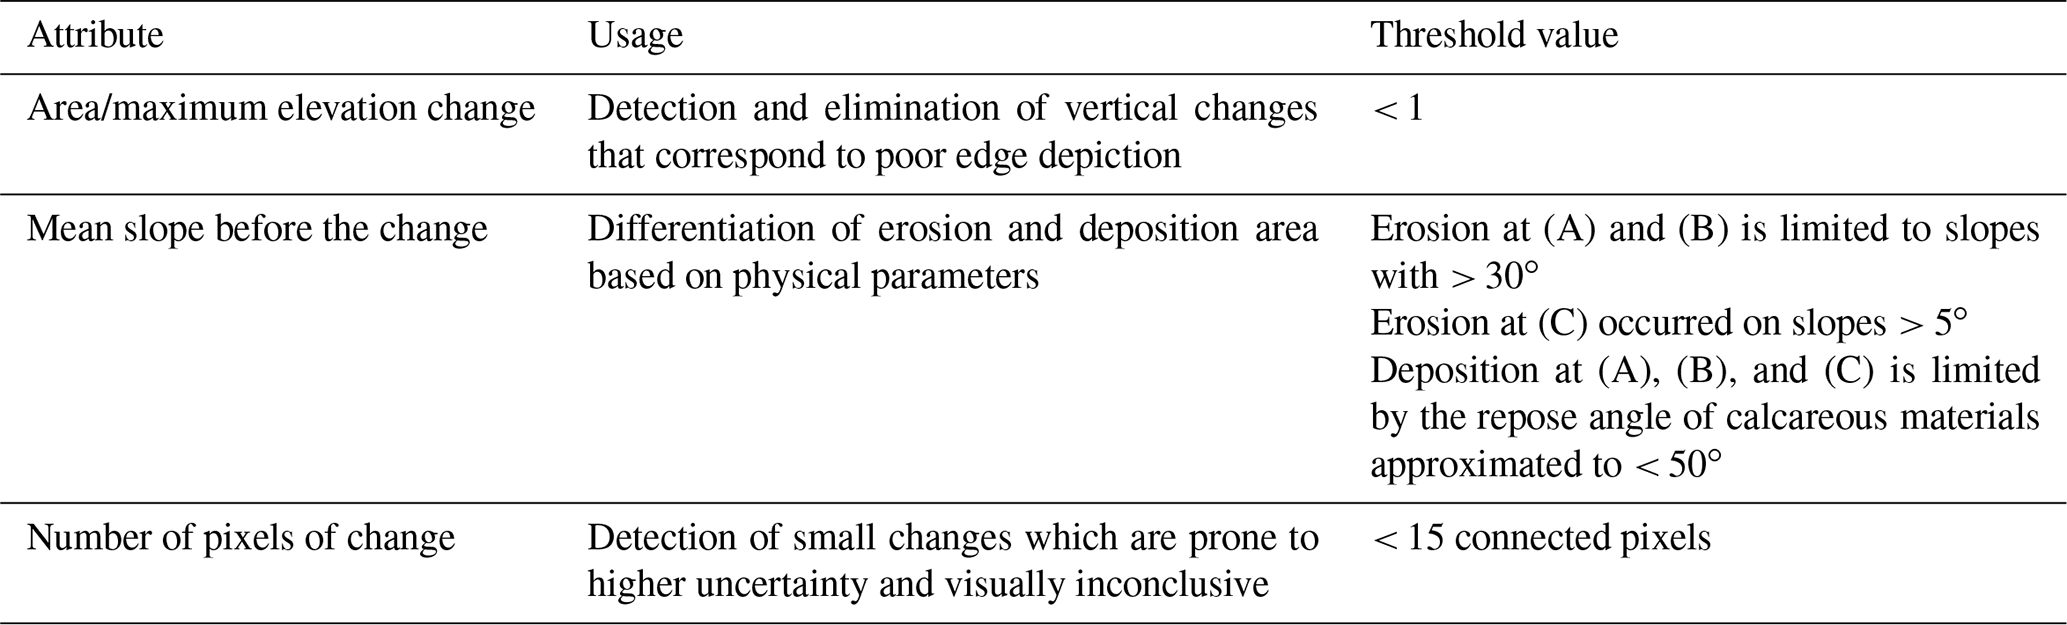
We filter the different sources of topographic changes by semi-automatic filtering and final manual inspection using 3D visualization. The filtering processes focus on the identification of “false” rockfalls, defined as over-elongated polygons in the z component in relation to their horizontal area generated due to poor edge depiction. First, we segmented the DoD using a 3 × 3 circular kernel on a binary mask of change (1) or no change (0) defined by the critical thresholds. The size of the kernel was selected to segment an approximate connected change of a minimum of 1 m2. We used descriptive statistical information from each polygon, including minimum and maximum elevation change, area of change, volume of change, and mean slope before the change, to filter the polygons using the criteria described in Table 1. The slopes at the Hochvogel are mostly highly fractured and horizontally layered; thus, rockfalls preferentially follow a pseudo-cubic form. A 3D visualization supports the final visual inspection.
The 3D-coregistration process suggests a neglectable horizontal error at the pixel level; thus, the total volume uncertainty (δV) from Eq. (3) is the sum of the uncertainty of each cell of volume (δv). The cell of volume v is calculated as in Eq. (4):
To propagate the errors of each cell of volume, the partial derivative of Eq. (4) with respect to the elevation change, which is the variable that has uncertainty, is calculated as
where .
Finally, the volume uncertainty over area A is given by Eq. (6):
The proposed workflow for the calculation of volumes of changes in steep terrain using large-format high-resolution aerial imagery results from the combination of previously published methodologies and the implementation of intermediate steps that respond to the particularities of the datasets. A summary of the methodological step is presented in Fig. S1 in the Supplement.
3.2 Frequency–magnitude curves
A frequency–magnitude curve relates the magnitude of a variable to the frequency of occurrence (Riggs, 1968). The curve is an estimate of the incremental yearly cumulative frequencies from the largest-magnitude event to the smallest (Hungr et al., 2008). We included both primary and secondary rockfalls in our analysis. We acknowledge the occurrence of coalescent events, given the (multi-)yearly temporal resolution of the datasets (Williams et al., 2019); however, we do not intend to resolve single rockfalls, but we aim to decipher the relative rockfall activity in the last decade for each of the rock face slopes that constitute the summit (Dussauge-Peisser et al., 2002; Benjamin et al., 2020; Hantz et al., 2021). We assessed the volumetric errors due to the steep topography by the iterative calculation of the volume of a known event (2016 cliff fall) using all possible combinations of DSMs (Table S6).
3.2.1 Cascading geomorphic sediment budgets
A sediment budget describes the input, transport, storage, and export of sediment in a geomorphic system. This concept provides an effective basis for representing the key components of the sediment delivery system within a catchment and for assembling the necessary data to elucidate, understand, and predict catchment sediment delivery (Walling and Collins, 2008) and estimate related natural hazards. The geomorphic sediment budget (Wheaton et al., 2010) is calculated as the sum of the masked DoD values of erosion (negative change) and deposition (positive change).
We calculate the proportion of net erosion and net deposition per year (m3 y−1) based on the number of days between acquisitions, comparable to previous studies. Conversion to mass (t) is based on reported densities of limestone 2.6 t m3 and limestone deposits 2 t m3 according to Krautblatter et al. (2012). Spatially averaged short-term wall retreat rates were calculated by dividing the total rockfall volume per year (m3 y−1) by the area over which the volumes were calculated., i.e., northern slope (253 643 m2), western slope (115 098 m2), southwestern slope (254 686 m2), southeastern slope (165 037 m2), rock face (234 329 m3), upper channelized erosive debris flow channel (53 072 m3), widened dispersive debris flow channel (91 241 m3), and outlet (34 004 m3).
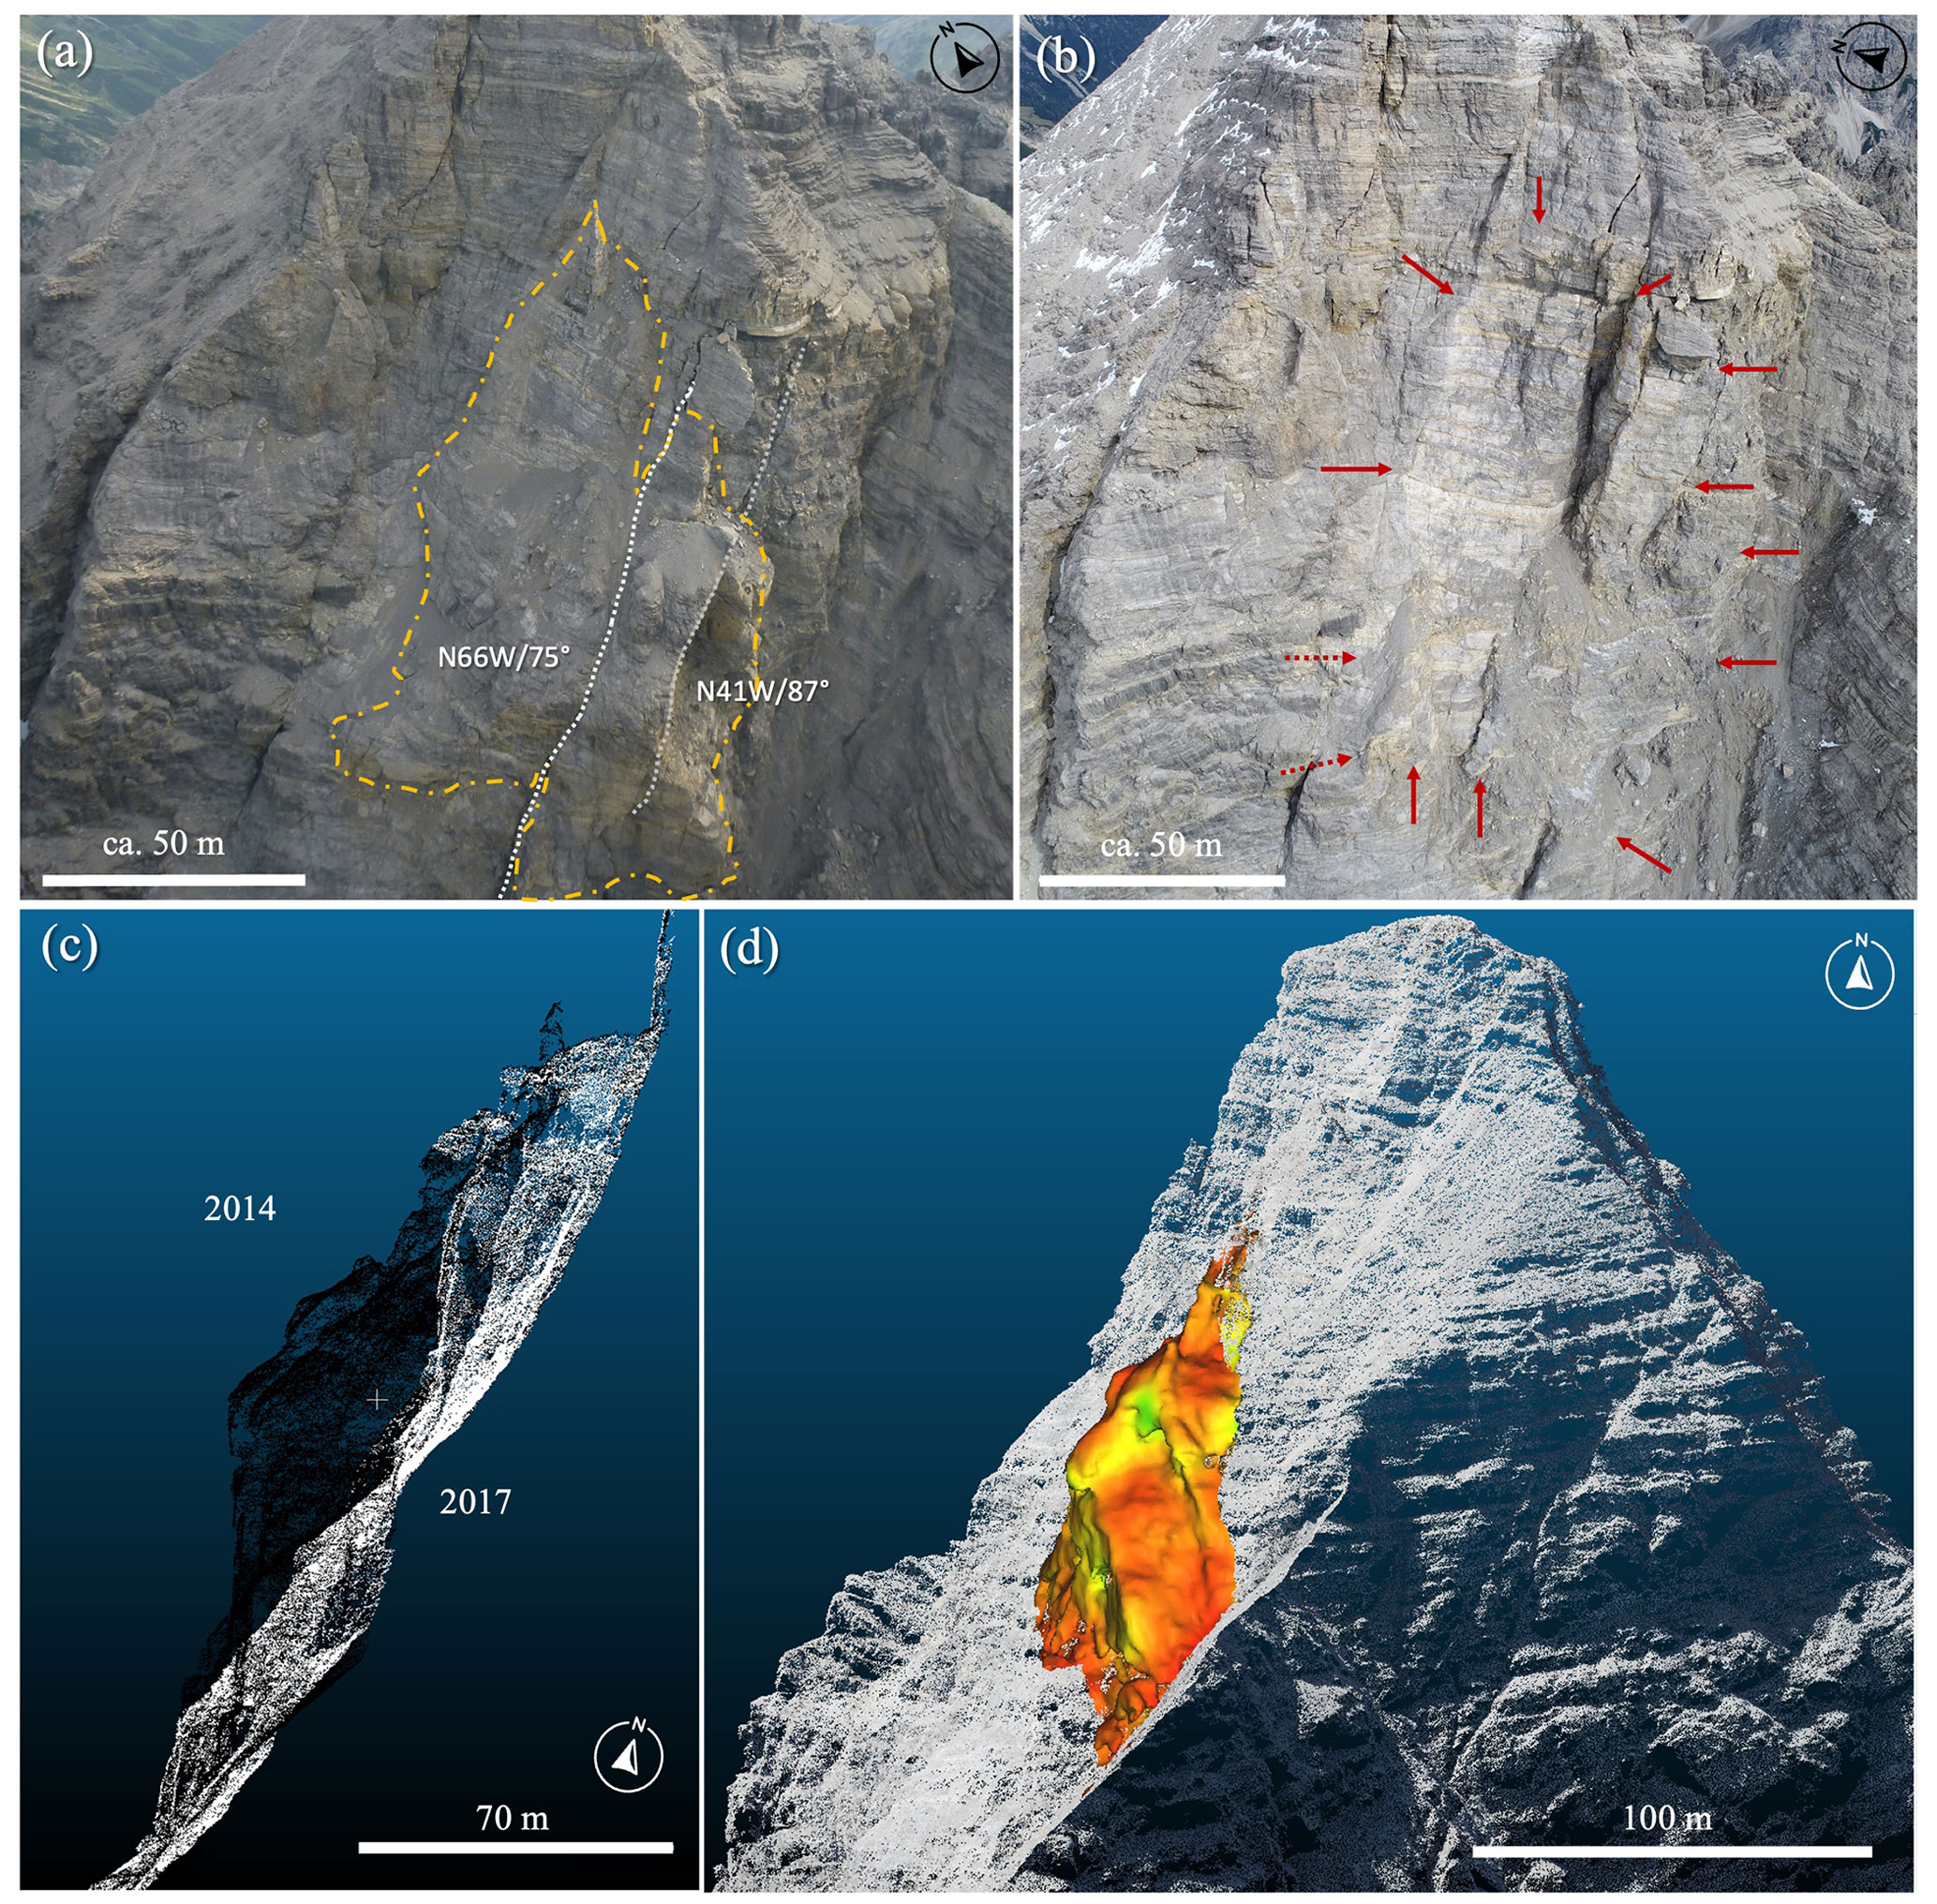
Figure 3Picture taken by Land Tyrol during a helicopter flight inspection before the cliff fall (3 July 2015). The yellow line indicates the cliff fall detachment area in the summer of 2016. The fracture orientations (in white) intend to exemplify approximate structure orientation and must be taken with caution due to the low point density in the exposed fracture surfaces. (b) Picture taken by the TUM landslide group (Andreas Dietrich) after the cliff fall (28 September 2017) using an uncrewed aerial vehicle (UAV) – DJI Phantom 4 – during a monitoring survey as part of the AlpSenseBench project on 28 September 2017. The red arrows indicate the cliff fall detachment area in the summer of 2016. (c) Photogrammetric point clouds from the surveys on 23 September 2014 in black and 7 August 2017 in white. (d) Mesh reconstruction of the cliff fall.
3.3 Volume estimation of the 2016 multi-event
3.3.1 3D cumulative volume
The 2016 rockfall dramatically changed the morphology of the southwestern slope of the Hochvogel (Fig. 3).
We calculated the total rockfall volume using the most complete photogrammetric point clouds derived from the large-format aerial imagery before the event on 23 September 2014 and after the event on 7 August 2017. We manually delimited the extent of the 2016 rockfall event based on the cloud-to-cloud distance algorithm in CloudCompare v2.0. The volume calculation was performed over a grid of 0.2 cm and an average height cell in CloudCompare v2.0 (Girardeau-Montaut, 2022). For visualization purposes, we reconstructed the detached surface by creating a mesh using the Poisson Surface Reconstruction plugin (Kazhdan et al., 2020) and the two point clouds. The approximate orientation of fractures was extracted from the photogrammetric point cloud for 23 September 2014 using the CloudCompare plugin Compass (Thiele et al., 2017).
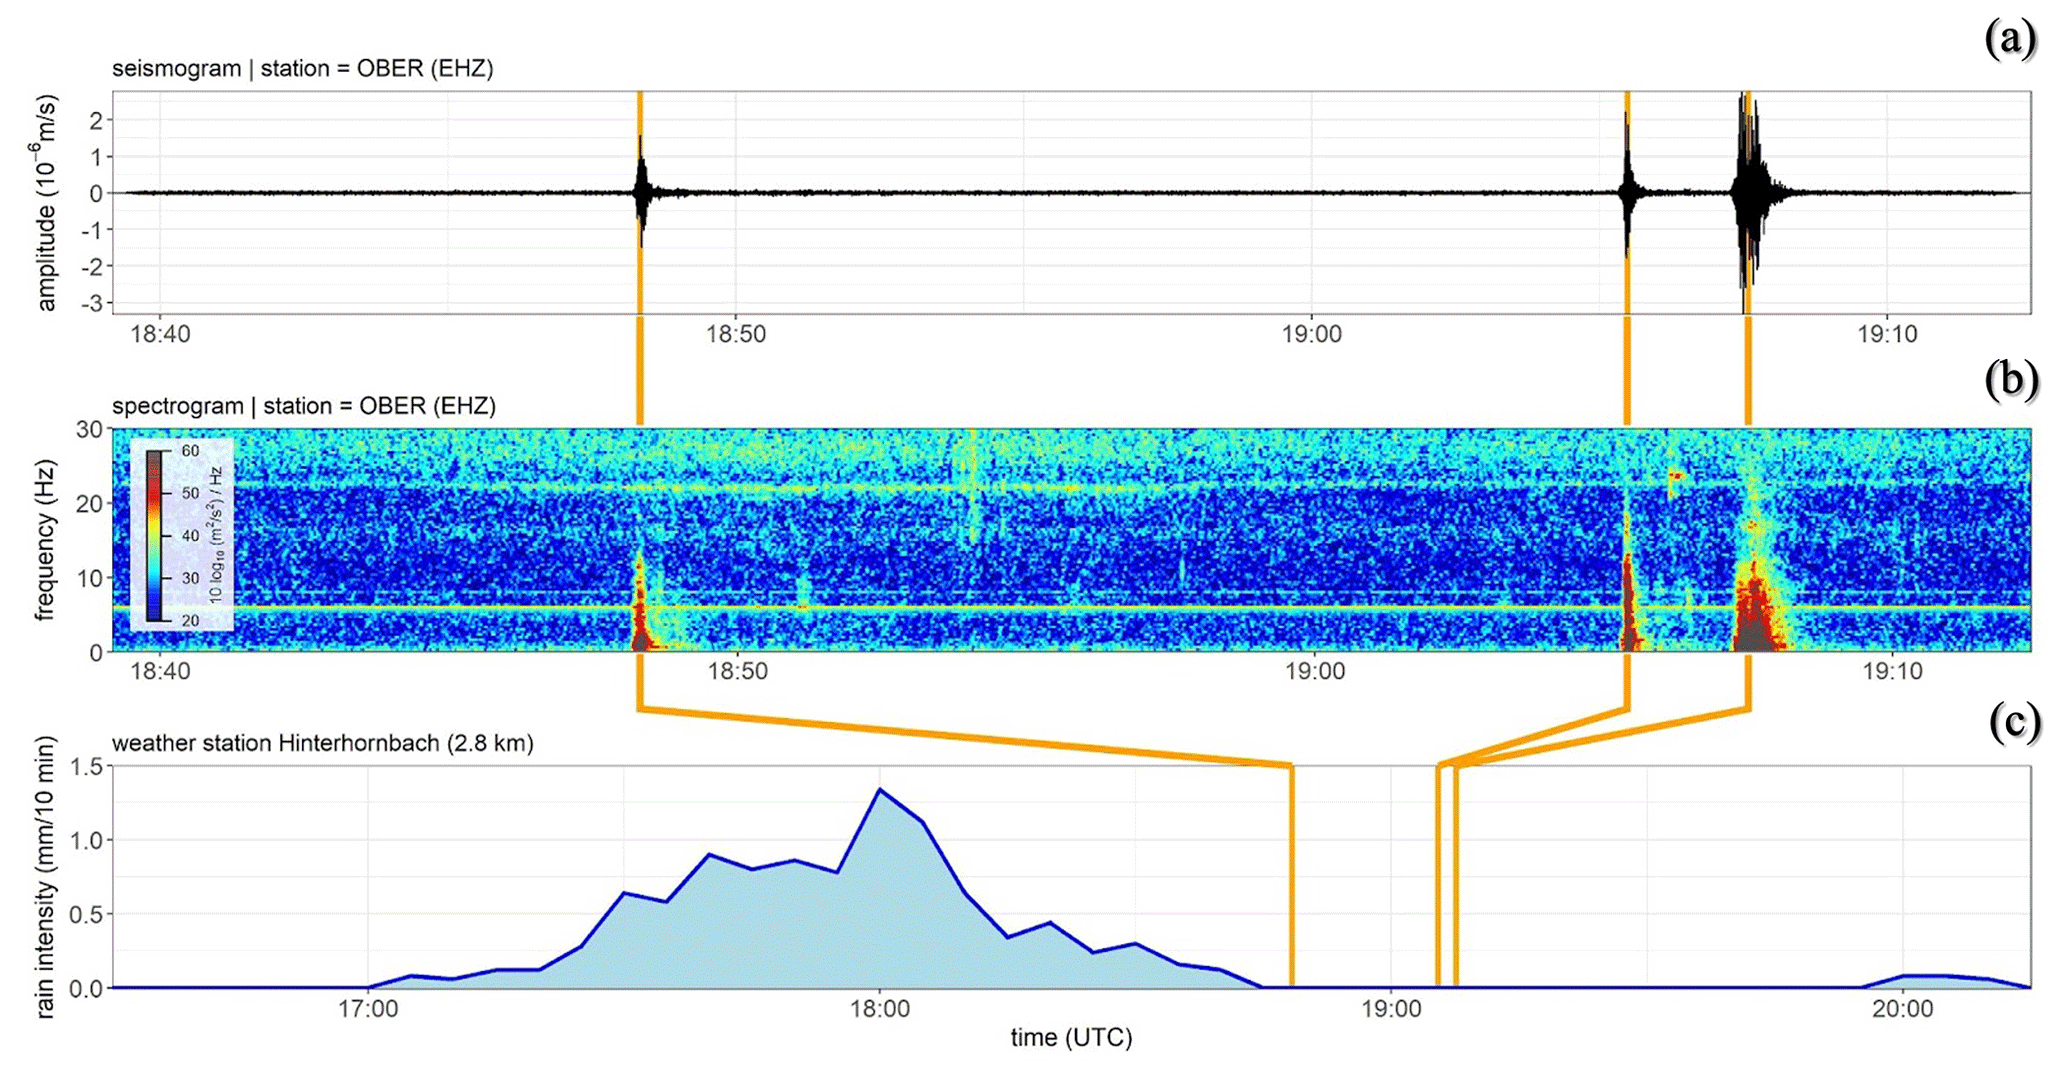
Figure 4Unmistakable rock detachments on 11 July at the Oberstdorf seismic station (OBER). (a) Amplitude of the seismic signal. (b) Spectrogram covering all frequencies up to 30 Hz. (c) Rainfall intensity at Hinterhornbach (mm (10 min)−1) before and after the rock detachments.
3.3.2 Multi-stage detachment analysis
For the time interval in which the 2016 failure occurred (9 to 11 July), we downloaded all available seismic data from seven surrounding broadband stations (distance to Hochvogel: 12–55 km) (Table S7). By analyzing the local seismic amplitude and the corresponding spectrograms at each station, we identified all seismic events with the strongest impact at the closest station in Oberstdorf (Fig. 4). Rockfalls produce a seismic impact over all frequencies between 5 and 50 Hz (Dietze et al., 2017a; Le Roy et al., 2019); in our case, we expect a clear decrease in seismic intensity with increasing distance of the stations from the Hochvogel and significant arrival time differences of up to 20 s (Fig. S4). On the contrary, earthquakes often show distinct arrivals of P and S waves, a lower-frequency content, and smaller arrival time differences. Local anthropogenic noise is characterized by higher-frequency contents and missing coincidence of the signal between different stations. Following these criteria, we identified all potential seismic signals originating from the rockfall series at the Hochvogel.
Despite significant variability in the scaling of Ep to ES (see Hibert et al., 2011), Le Roy et al. (2019) determined a relation between generated seismic energy Es and the potential energy of a rockfall Ep such that
The initially failed volume can then be derived from the potential energy if we determine the fall height of the block that generated the seismic signal. We estimated the fall height of the rockfall event from the photogrammetric point cloud differences and 3D models. A simple toppling of the center of gravity towards the slope corresponds to a fall height of 50–60 m, while sliding of the failed block suggests a probable fall height of 75 to 100 m. The calculation of the seismic energy and the determination of all needed parameters mainly follow the methodology in Le Roy et al. (2019) (Sect. S2). We estimated the error of the calculations based on Monte Carlo simulations with 1000 iterations and the variability of the different stations.
4.1 Multi-stage occurrence of the 2016 cliff fall event
The cliff fall that occurred during the summer of 2016 resulted in the detachment of 1.31 (± 0.01) × 105 m3 of dolomite following a multi-stage development. The extent of the cliff detachment is indicated by the clearer color tone on the rock surface (Fig. 3b), and the detachment area was measured to be 4777 m2 using a combination of the best photogrammetrically derived point clouds before and after the cliff fall. Prior to the cliff fall, the area was characterized by a vertical rock tower surrounded by pervasive fractures with orientation NW and pseudo-vertical dip angles that may have contributed to the multi-stage detachment by widening preexisting rock discontinuities (Fig. 3a). The rock tower had a height exceeding 60 m and was a prominent feature in the landscape. Currently, partially disconnected blocks are limited by penetrative fractures and represent areas of potential detachments. The cliff fall resulted in a significant change in the morphology of the southwestern slope, increasing the mean slope by 1∘ from 45.6 to 46.6∘.
Table 2Temporal multiphase cliff fall detachment between 9 and 11 July 2016 at the Oberstdorf station (OBER). Detected event phases and partial volumes (given as median ± SD).
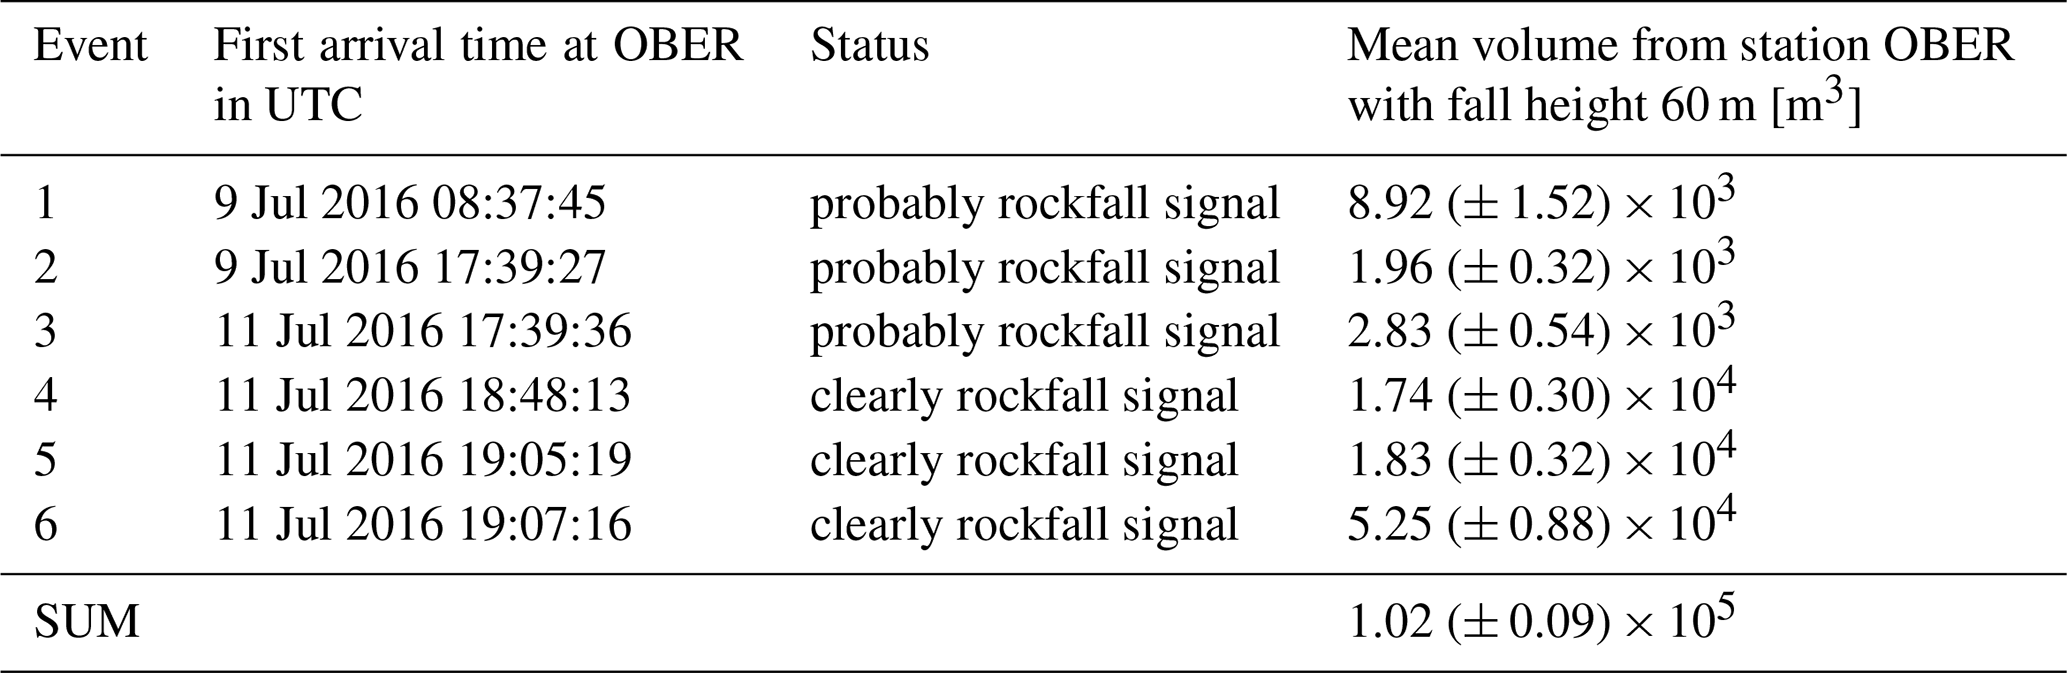
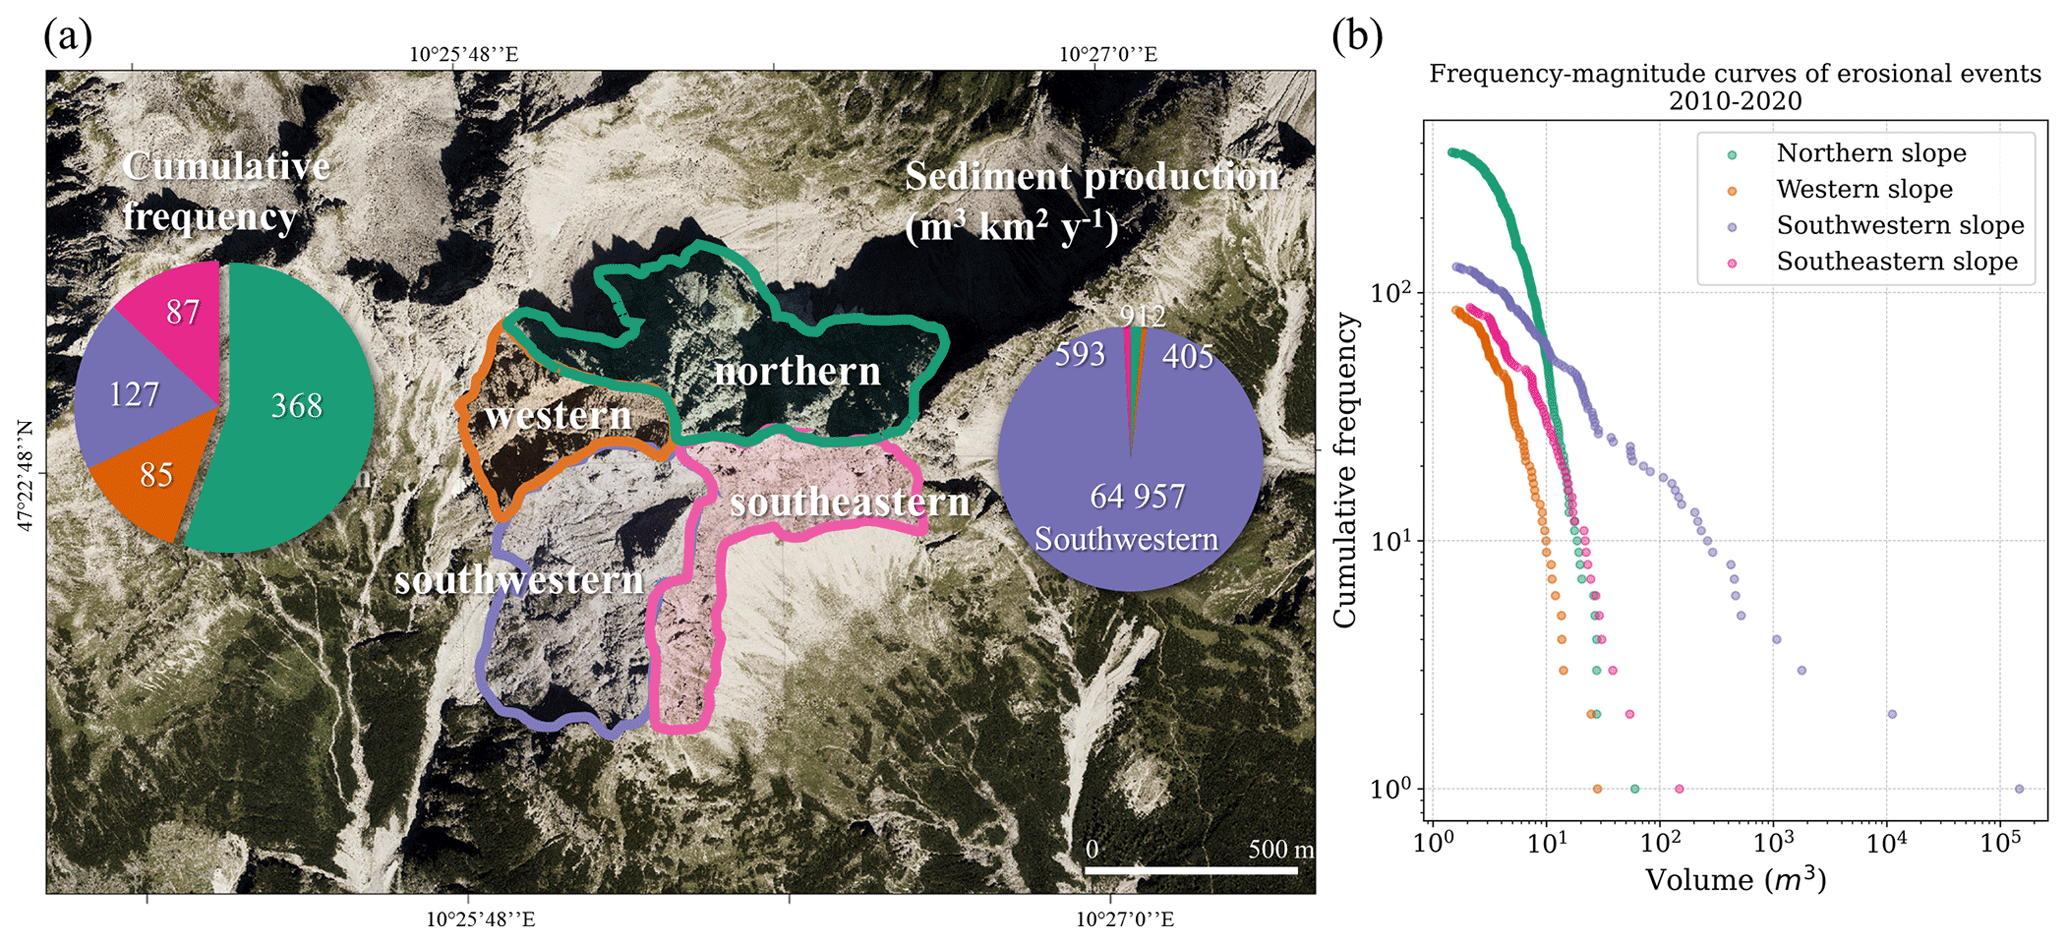
Figure 5Erosional events between 2010 and 2020, i.e., primary and secondary rockfalls grouped by slope orientation. (a) Slope orientation, cumulative frequency per slope, and sediment production per year. (b) Frequency–volume curves for the 667 erosional events on a logarithmic scale.
The seismic signal analysis indicates a progressive failure of the total mass in at least three to six portions within 3 d (Table 2). The biggest parts of the rock mass failed on the last day (11 July 2016) at 20:48, 21:05, and 21:07 LT. The volume estimation from the seismic energy at the closest station in Oberstdorf (OBER) results in a median volume of 1.02 (± 0.09) × 105 m3 for a fall height of 60 m. The estimated volume excludes smaller rockfalls, since the limited energy released by these events may not have been recorded by the seismic stations. As a result, the seismically estimated volume may underestimate the total amount of material detached.
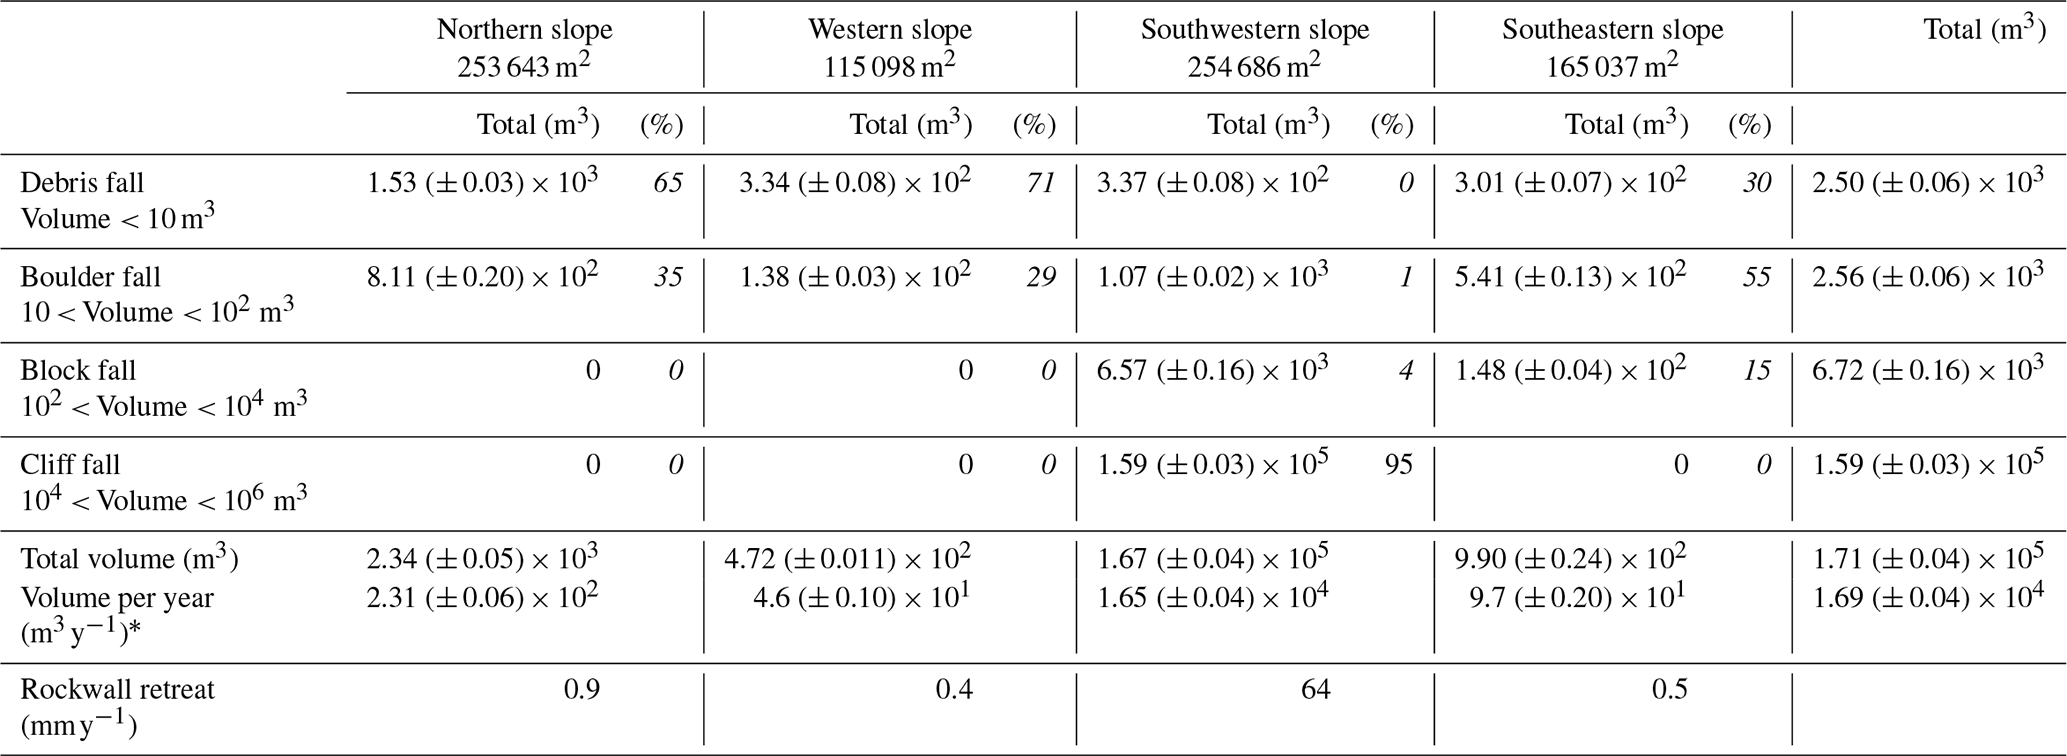
Table 3Contribution of rockfall magnitudes. Volumetric classification based on Whalley, (1974, 1984), Erismann and Abele (2001), and Krautblatter et al. (2012). ∗ Error equal to total volume percentage error of 2.4 % (Table S6). Rockwall retreat refers to the horizontal retreat of the vertical rock cliff.
4.2 Summit slope erosion
Over the last decade, the Hochvogel summit has produced 1.713 (± 0.04) × 105 m3 of sediment, corresponding to an annual production rate of 43 990 (± 1069) t y−1 when assuming a rock density of 2600 kg m−3 (Krautblatter et al., 2012). Notably, 97 % of this sediment can be attributed to the 2016 cliff fall at the southwestern slope. A total of 667 erosional events, including primary and secondary rockfalls, were detected at the Hochvogel summit, with a median volume ranging between 4.6 and 9.3 m3. The minimum detectable rockfall volume ranged between 1.4 and 2.1 m3, depending on the slope orientation. The sediment production on the four slopes of the summit showed a significant disproportion. The western and southeastern slopes had the lowest rockfall frequency, while the northern slope experienced the highest rockfall activity per year (Fig. 5). However, when considering the contribution of rockfall magnitudes following the volumetric classification based on Whalley (1974, 1984), Erismann and Abele (2001), and Krautblatter et al. (2012), debris falls dominate the northern and western slopes, while the southeastern slope has a larger proportion of boulder fall, accounting for 55 % of the total contribution (Table 3).
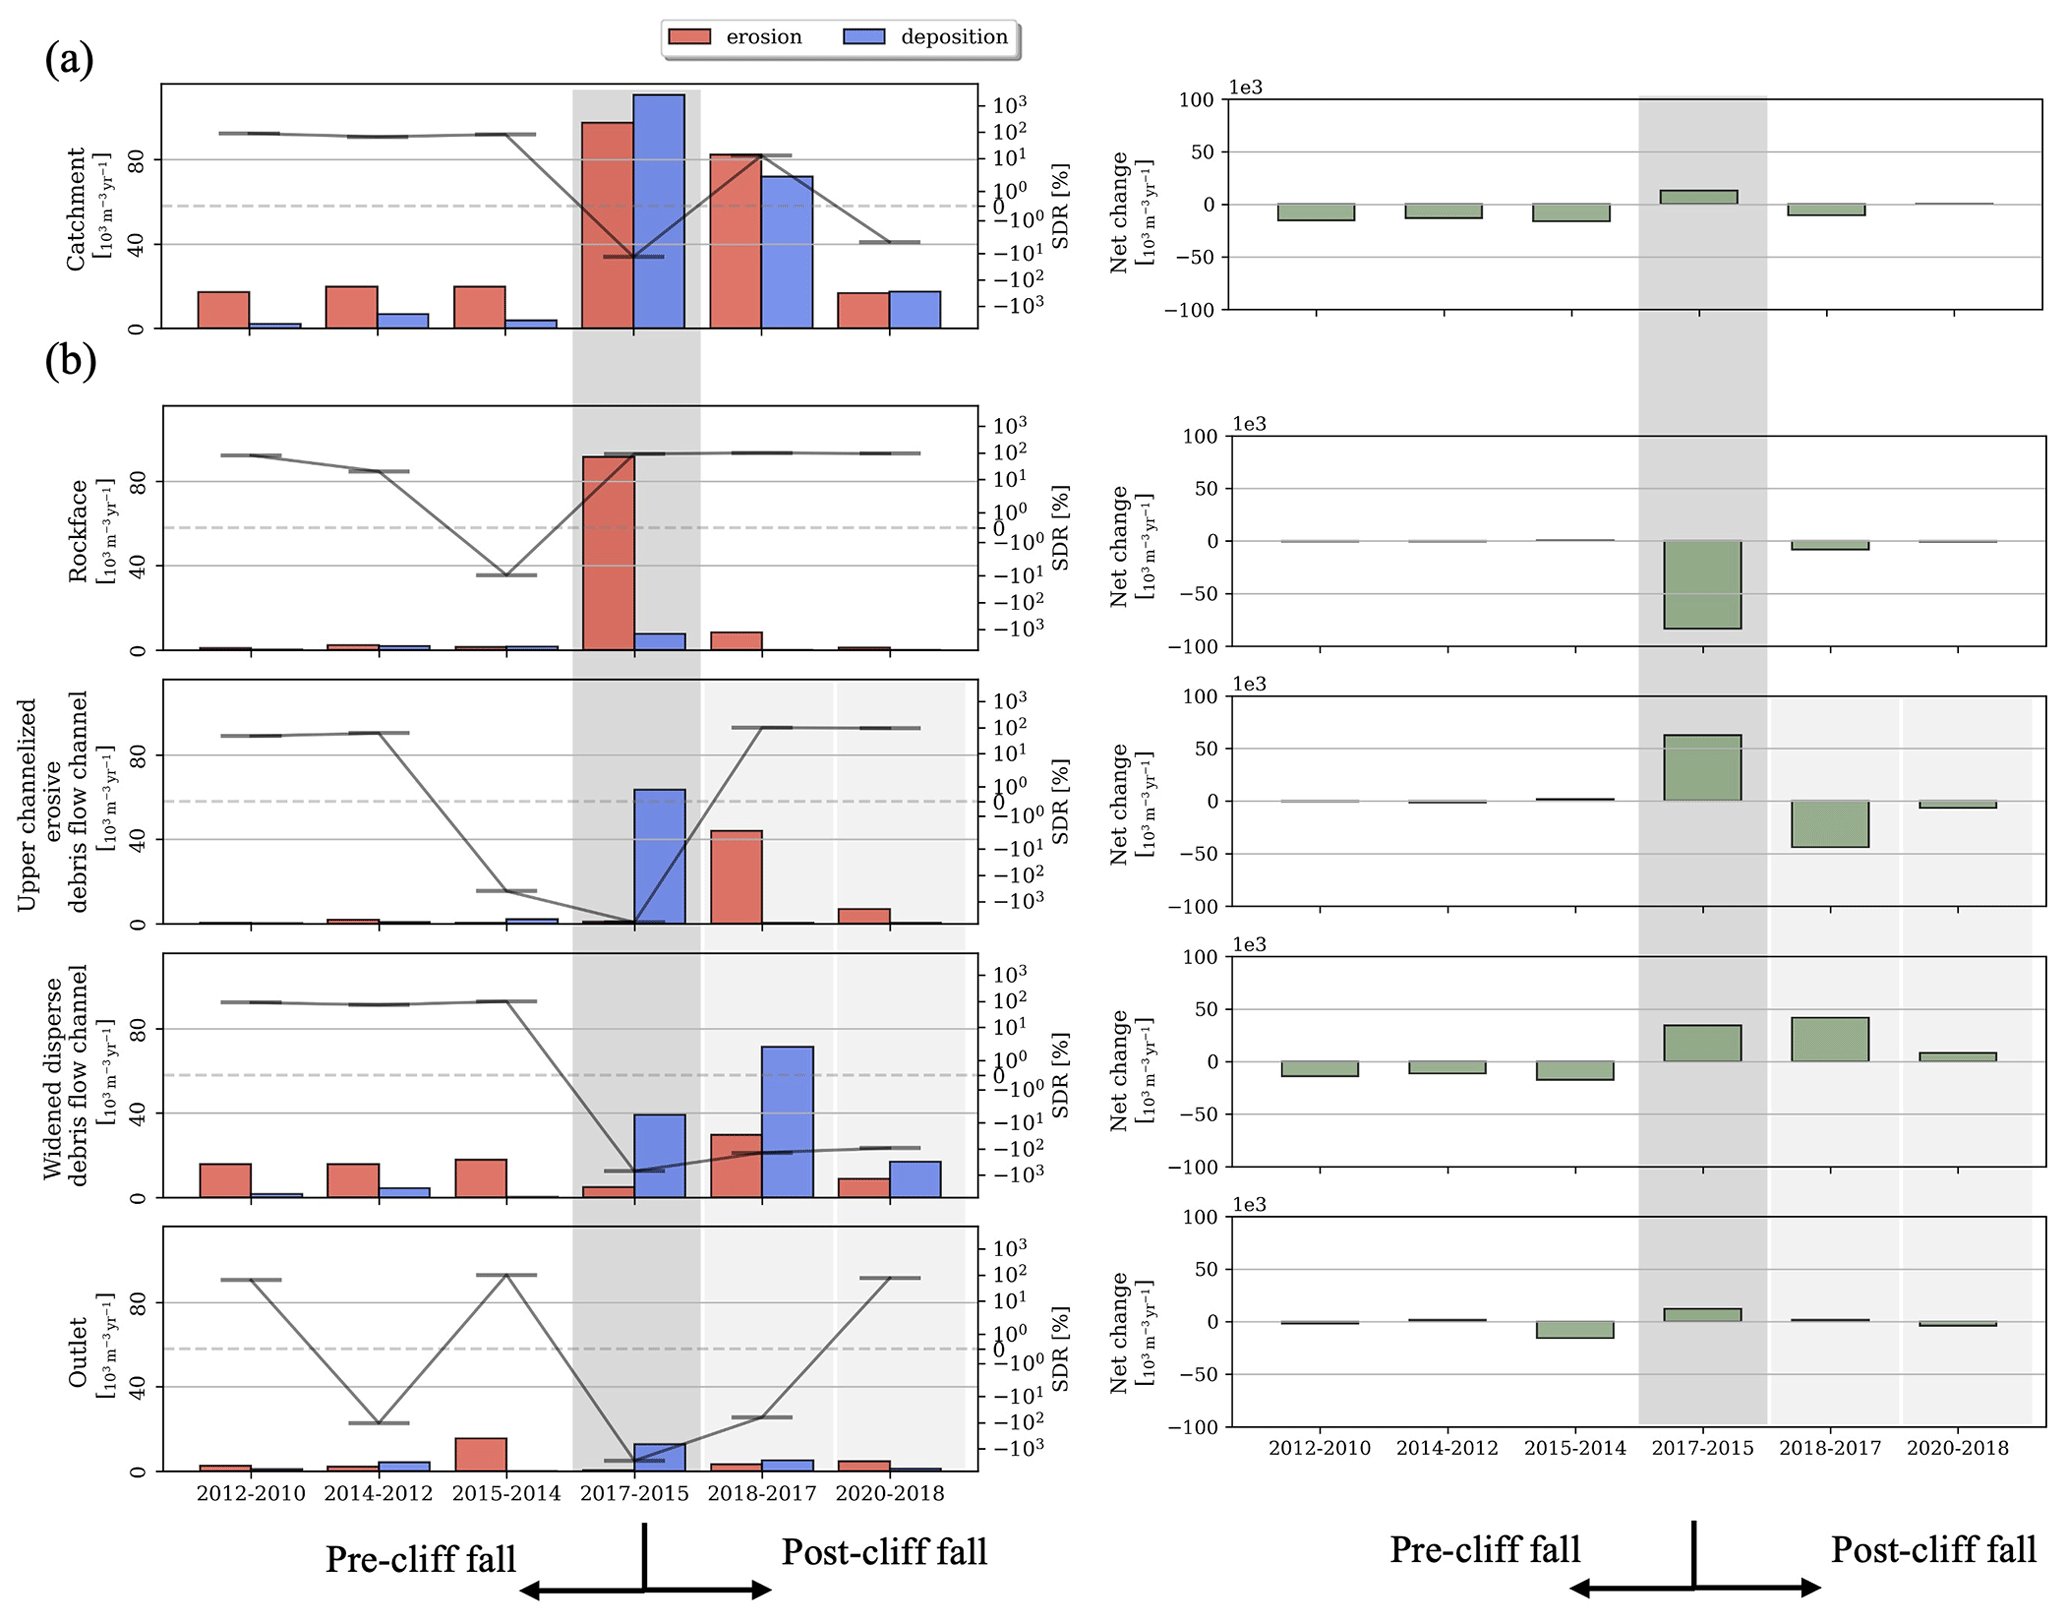
Figure 6Time series of geomorphic sediment budgets. (a) Geomorphic sediment budgets at the catchment scale. (b) Segregated sediment budget into the four morphodynamic zones. Left column: the bar plot depicts yearly volumes of erosion in red and deposition in blue (units at the left axis). The black line indicates the sediment delivery ratio expressed as the proportion of sediment leaving the morphodynamic zone from the total net erosion (units at the right axis). Right column: yearly net change calculated as the difference between erosion and deposition. The estimated uncertainty of the absolute volume is less than 2 % and thus imperceptible due to the scale of the graph. Dark gray polygons highlight the temporal stamp at which the cliff fall took place. Lighter gray indicates the system response 2 and 4 years after the event. Note how the reverse net changes propagate downslope of the system through time.
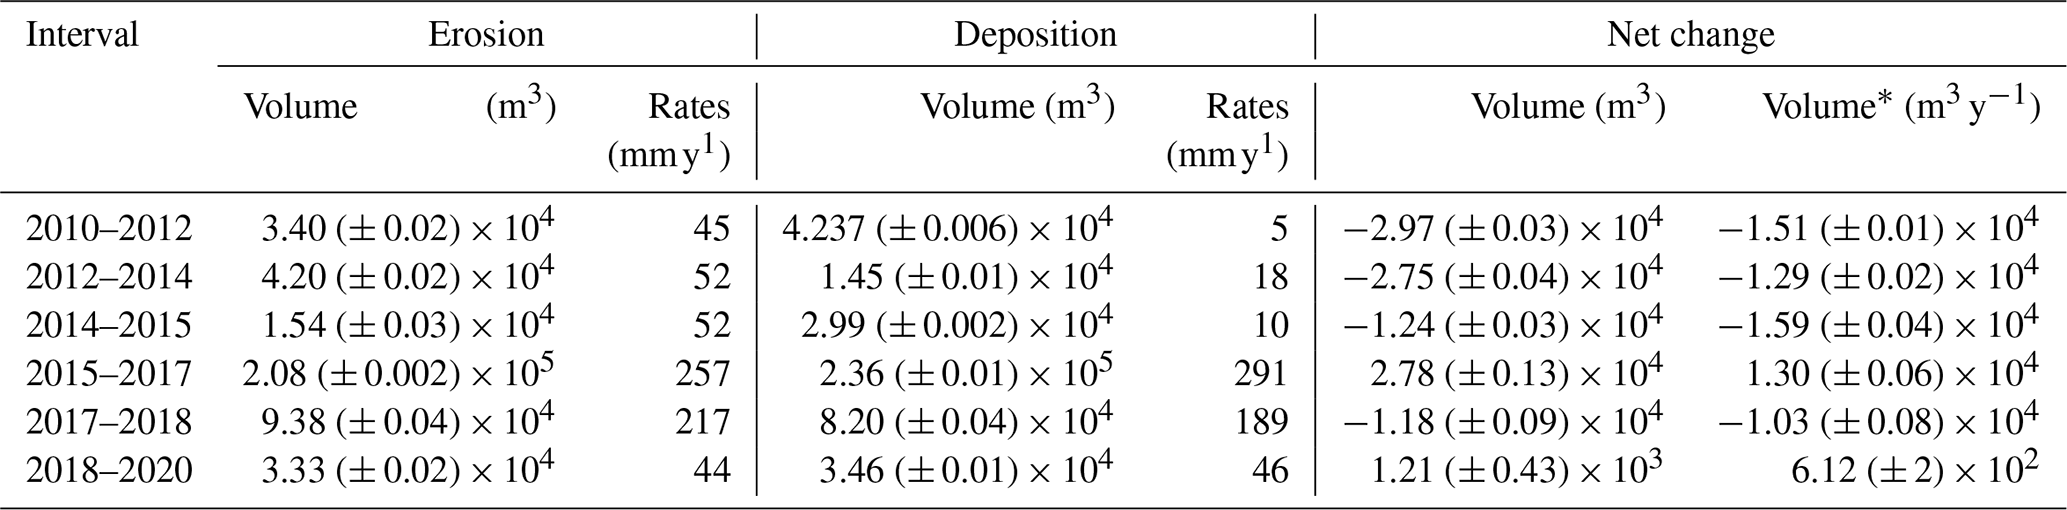
Table 4Catchment-scale erosion, deposition, and net volumes (m3). Catchment denudation rates (mm y−1) were calculated based on the affected area extent (378 642 m2). The volume uncertainty is calculated independently for each single interval and process, i.e., erosion and deposition. ∗ Error propagated from erosion and deposition uncertainties (Table S6).
4.3 Geomorphic sediment budget
The short-term denudation rates in the catchment prior to the cliff fall were 45 to 52 mm y−1, resulting in a negative catchment sediment budget ranging −1.29 (± 0.02) × 104 m3 y−1 and −1.59 (± 0.04) × 104 m3 y−1. Following the cliff fall, the catchment's denudation rates increased abruptly by 10 times, reaching 257 mm y−1. Despite the erosion of 9.74 (± 0.01) × 104 m3 y−1, the sediment delivery to the outlet was significantly reduced, resulting in a positive catchment sediment budget of 1.30 (± 0.06) × 104 m3 y−1 (Fig. 6a). At 2 years after the event, within-catchment sediment waves dominated the sediment flow to the outlet, leading to a negative sediment budget of −1.03 (± 0.08) × 104 m3 y−1. Subsequently, a slightly positive sediment budget of 6.12 (± 2) × 102 m3 y−1 evidenced the ongoing sediment redistribution within the catchment 4 years after the cliff fall, even though the catchment denudation rates returned to pre-event levels of 44 mm y−1. Catchment-scale erosion and deposition volumes at each time interval are listed in Table 4.
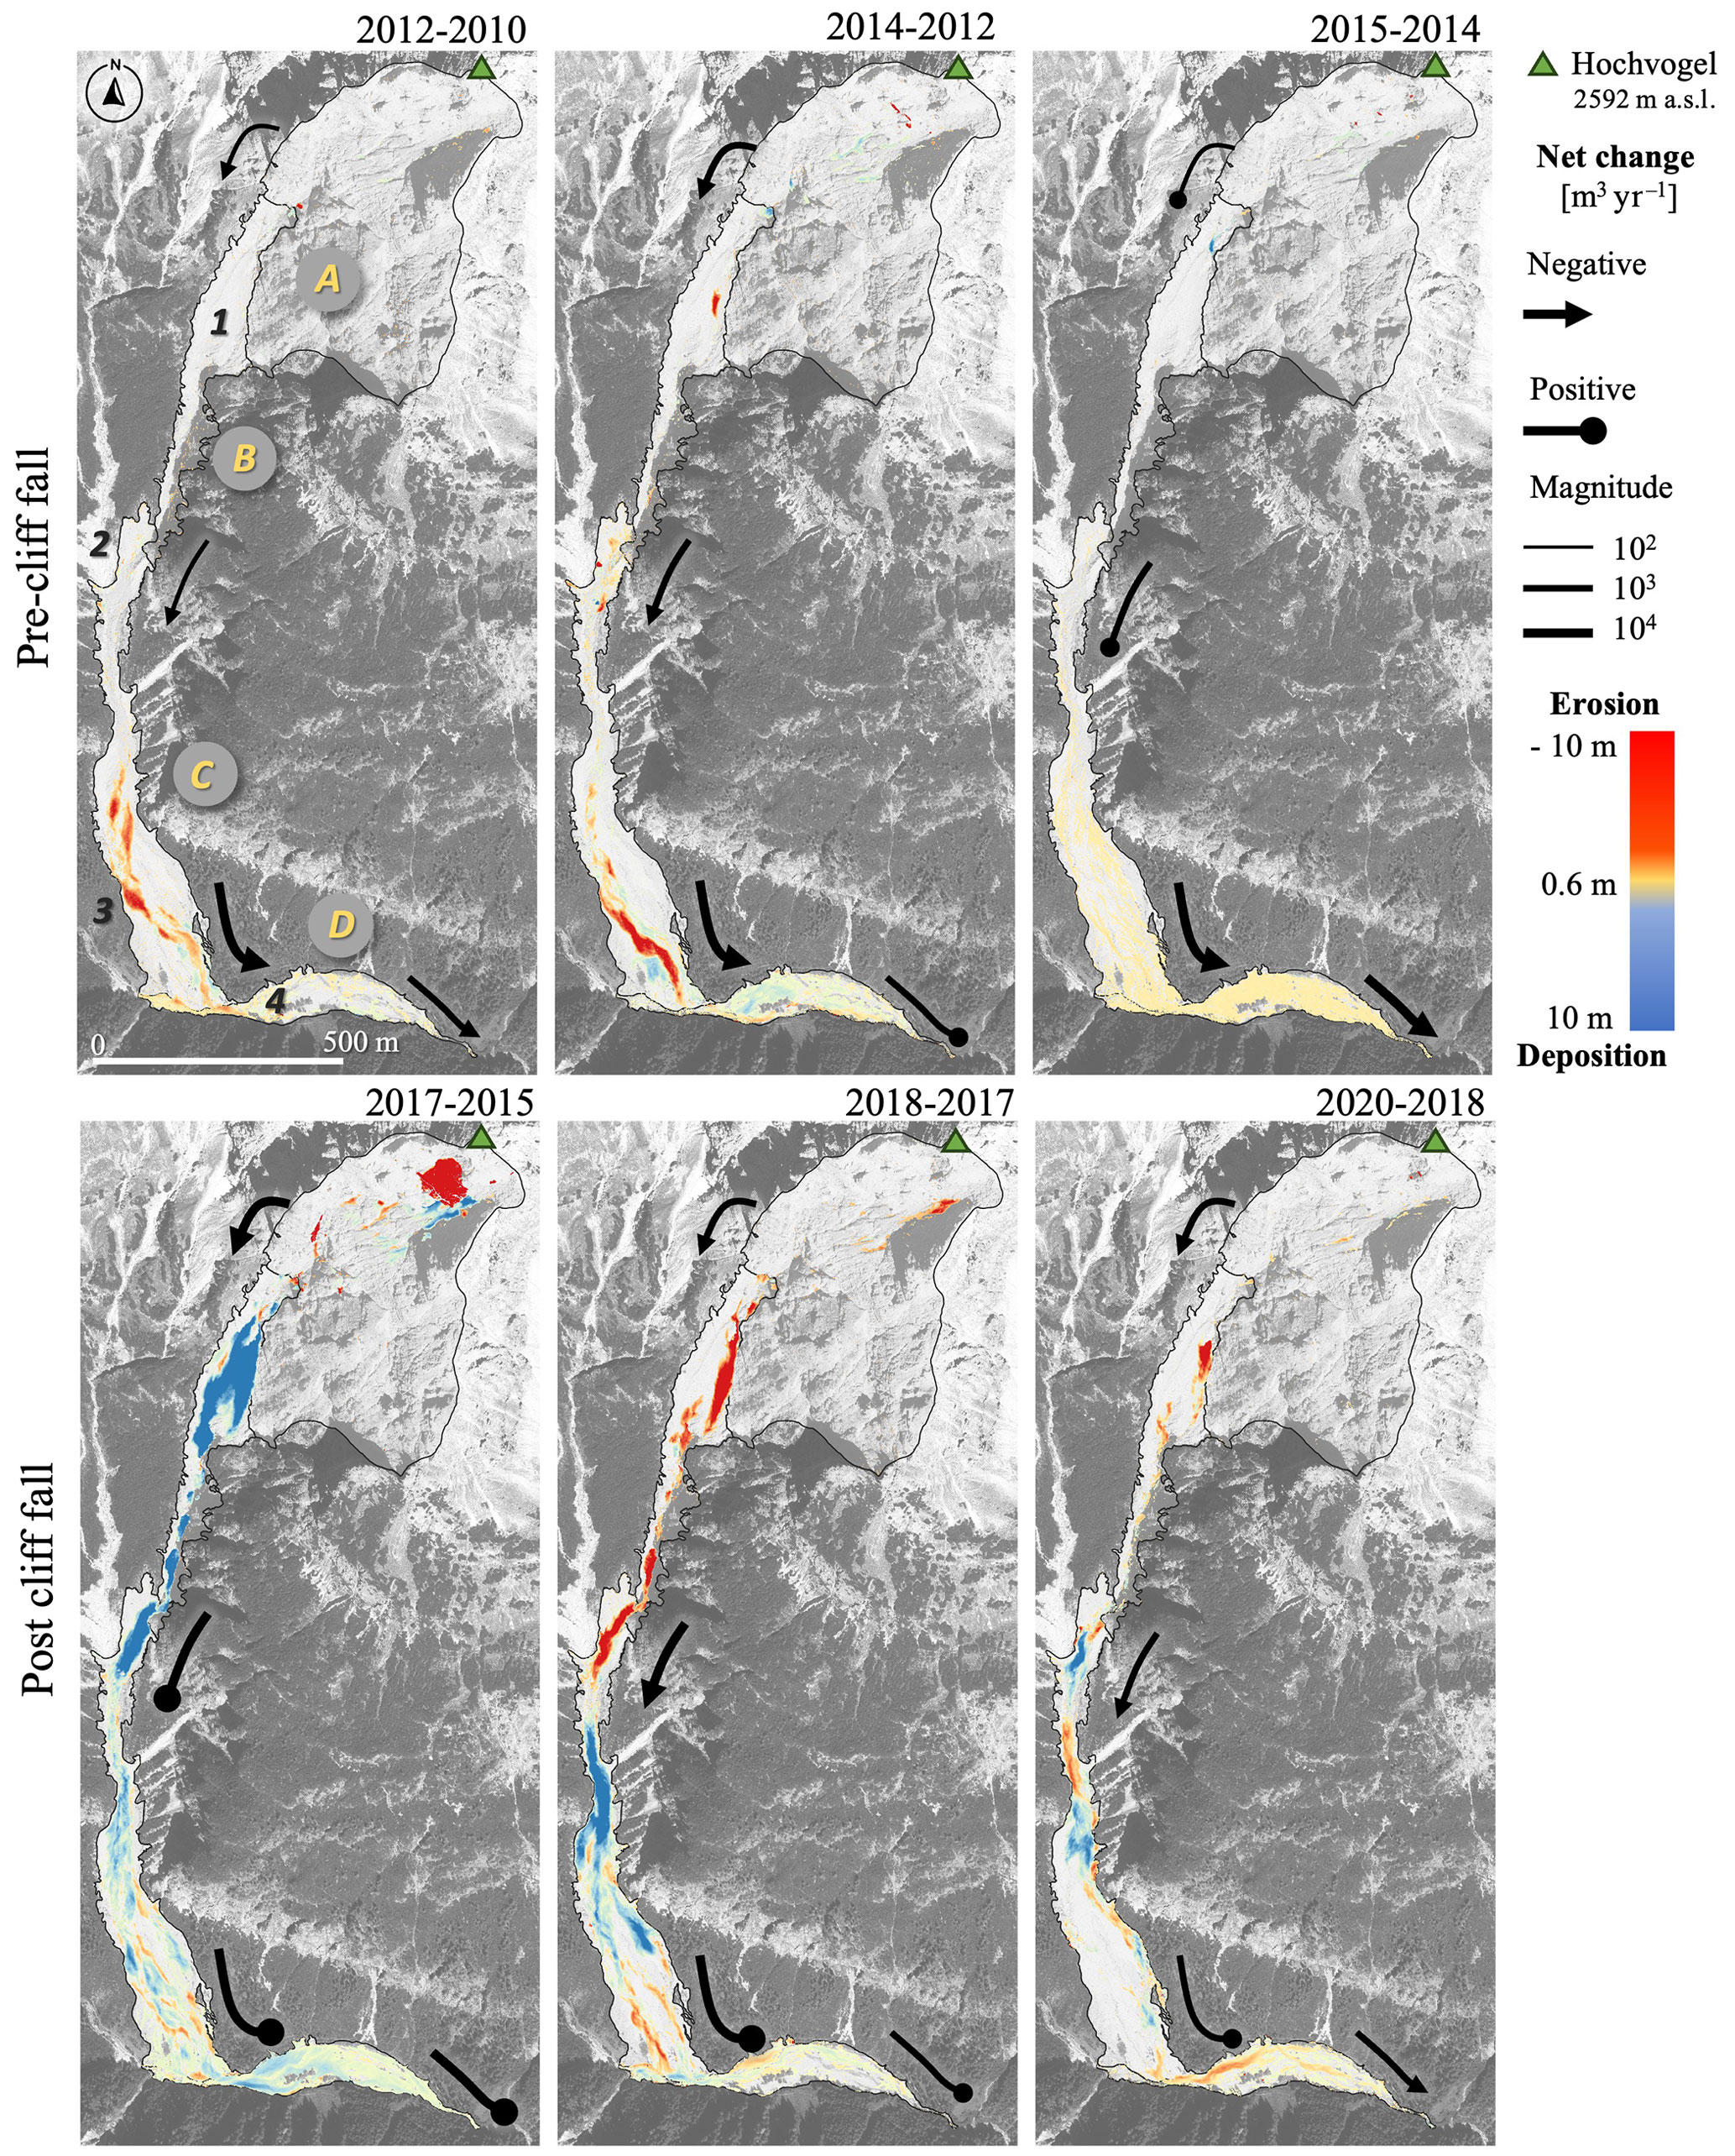
Figure 7Time series of the spatial distribution of erosional (red) and depositional (blue) areas with black arrows as an indication of sediment continuity based on the net changes. (A) Rock face, (B) upper channelized debris flow channel, (C) widened dispersed debris flow channel, and (D) outlet to the Jochbach river. Numbers (1)–(4) mark the position of morphological blockages corresponding to slope changes that promote deposition and thus attenuation in the sediment flux.
4.4 Geomorphic sediment budgets across the sediment cascade
The differentiated geomorphic sediment budgets (Fig. 6b) and time series of the spatial distribution of the differences of DSMs (Fig. 7) reveal the fast system response to the cliff fall. The concept of sediment continuity refers to the transfer or exchange of sediment across various parts of the hillslope system, which involves the conservation of mass among sediment inputs, stores, and output (Joyce et al., 2018). Sediment storage and sinks (marked as 1–4 in Fig. 7) define the boundaries between different morphodynamic zones, which are characterized by slight changes in mean slope that imprint morphological controls on transport processes. Regardless of the existence of depositional landforms, sediment continuity dominates from 2010 until 2014, as evidenced by the negative net change at all the geomorphic system zones.
An initial disruption in the sediment continuity is observed between 2014 and 2015. At the rock face, boulder and block falls occur, which detach from the subvertical wall and deposit at its base. Additionally, in the upper channelized erosive debris flow channel, less than < 102 m3 of recently deposited material (less than 2 years of residence time) is internally redistributed. However, even during this period of localized disruption, sediment redistribution continues to take place at the widened debris flow channel, which ensures sediment delivery to the outlet into the braided sediment-supercharged Jochbach river (Fig. 7).
Following the cliff fall event, there was an immediate disruption of sediment transfer among the different morphodynamic zones, with about 75 % of the produced sediment being deposited at the upper channelized erosive debris flow channel (Fig. 6b, 2017–2015). A total of 1.356 (± 0.003) × 105 m3 of sediment was deposited over the 1.5 km length of the upper channelized erosive debris flow channel. Despite the positive sediment budget at the widened disperse debris flow channel, massive deposition occurred at the outlet. The biyearly temporal resolution masks the highly dynamic sediment transport; however, the formation of a terrace of almost 3 m evidences the deposition of at least 2.60 (± 0.03) × 104 m3 after the cliff fall. Field evidence suggests the infill of the outlet floodplain with new debris that impacted the dynamics of the riverbed (Fig. S3). The pre-event channel of the Jochbach river is filled with up to 4 m of material in its deeper part at the end of 2017, 1 year after the cliff fall (Fig. 7, morphodynamic zone D). The infill results in a migration of the channel to the center of the outlet floodplain marked by a discontinuous erosional area in Fig. 7 for 2017–2018 and finally the formation of a main channel towards the north, evident in Fig. 7 by the continuous erosional pattern for the time interval between 2018 and 2020.
A dramatic inversion from deposition to erosion occurs 2 years after the cliff fall. Sediment waves or slugs deposited 8.14 (± 0.04) × 104 m3 at the apex of the widened dispersive debris flow channel, infilling the valley with 3 m of transported material, which increased to almost 10 m 4 years after the cliff fall (Figs. 7 and 9, profile C-C′). Despite the increased sediment input due to the cliff fall, there were reversed net changes between the widened dispersive debris flow channel and outlet 4 years after the cliff fall (Fig. 6, 2018–2020).
The (multi-)annual high-resolution aerial imagery datasets provide an insightful look at sediment cascades at a decadal scale. Despite the coalescence of events due to the temporal resolution, the revealed patterns of sediment redistribution and geomorphic response time caused by the increased sediment input due to a cliff fall (Owens et al., 2010) are highly relevant for the assessment of cascading risks. The proposed 3D-coregistration workflow optimizes the DSMs extracted from consecutive nadir-view large-format aerial surveys for volumetric calculations of rockfall as well as sediment erosion and deposition volumes in steep terrain. However, there are still limitations on the representation of complex topography. Thus, it requires careful thought about the validity of the measurements. Despite this, the presented results are paramount to identifying and better understanding coupling mechanisms of high-magnitude slope events at a high temporal–spatial resolution to the fluvial system at a catchment scale. The analysis of within-hillslope morphodynamics and their coupling with the fluvial system exemplifies the alpine catchment response to future climatic changes and landscape dynamics.
5.1 Validity of measurements
The main drawbacks of the presented measurements are related to (i) the nature of the nadir-view aerial imagery acquisition that limits the representation of steep topography and (ii) the scarcity of seismic stations around the Hochvogel summit that challenges the identification of small-sized rockfall volumes, constraining the measurements to high-magnitude events where seismic signals are more pronounced.
Considering the inhomogeneity of the aerial imagery, the quantitative data described above are comparable to other published results obtained by digital photogrammetry (e.g., Kaufmann and Ladstädter, 2003; Schiefer and Gilbert, 2007; Marzolff and Poesen, 2009; Fabris and Pesci, 2009; Micheletti et al., 2015; Hilger and Beylich, 2018; Geissler et al., 2021). The authors acknowledge the limitations of aerial imagery to depict vertical surfaces and in particular negative vertical surfaces. Nevertheless, the proposed workflow resulted in consistent landscape representations through time, evidenced by topographic profiles extracted from the DSM and volume calculation of the 2016 cliff fall using all possible DSM combinations (Table S6). Additionally, the back calculation of the failed volumes from the seismic signals of regional stations (Sect. 4.1) is in the range of the photogrammetrically determined volumes, thus supporting the results via a second methodological approach.
Even though we followed a very conservative approach, possible overestimations of the volumes are expected, particularly for the rock face where complex topography predominates. When visualizing the point clouds, it is possible to perceive the dense point cloud on the horizontal surfaces but few to no points on vertical and pseudo-vertical surfaces for some of the datasets (e.g., 2015 dataset). Additionally, even if the vertical sides are completely depicted, the gridded component of the analysis poorly represents the vertical topography. Nevertheless, poorly represented areas are excluded from the DSMs used for the calculation of topographic change. On the other hand, the results on the northern slope (Fig. 5a), often acquired under poorer illumination conditions, are prone to higher uncertainty (0.6 to 1.2 m). The proposed workflow optimizes the relative uncertainty in the elevation component for each dataset and assesses systematic errors minimized by a spatially uniform critical threshold, but additional research is needed to better estimate the spatial distribution of random errors and proxies that leads to the quantification of spatially variable uncertainty (Wheaton et al., 2010). Therefore, the segmentation of the DoDs was designed to filter topographic changes at each landscape compartment considering the stated data limitations. Lower uncertainty (between 0.1 and 0.3 m) is achieved at the widened dispersed debris flow channel and outlet due to more favorable geometry for the photogrammetric reconstruction, i.e., the perpendicular surface to the nadir view, which corresponds to a lower slope angle to flat topography. In spite of the discussed drawbacks, the presented workflow aims for an efficient and fast calculation of volumetric changes foreseen by the usage of aerial imagery for the early detection of future hazardous areas over wide extents or multiple basins in the context of a fast-changing climate and landscape.
The temporal resolution from large-format digital aerial surveys limits the quantification of single events; thus, the analysis of seismic datasets complements the photogrammetric record by deciphering the coalescence of events. The energy released by the rockfalls associated with the 2016 cliff fall was sufficient to be recorded despite the distance of the seismic stations (the closest station located at 11 km); therefore, we elucidate the multi-stage detachment of six possible events with exact timing (three block falls followed by three cliff falls). On the contrary, the energy released by individual debris flows event is considerably less, thus challenging the usage of the current seismic network. Note that the three latest seismic events identified as rockfalls show clear evidence of a source located close to the Hochvogel rock failure, while the first three events are harder to constrain due to their smaller amplitude (Fig. S8a–c). Nevertheless, these also show the same intensity–distance decay and signal arrival time patterns and can therefore be considered. Additionally, the respective sub-event's percentage of the total volume is very similar for the stations OBER, RETA, DAVA, MOTA, and A307A (Fig. 7 and Table S13). The stations PART and ZUGS must be excluded due to their bad signal-to-noise ratio in the relevant frequency band. For a fall height of 60 m, the volume estimated from the seismic signal at OBER is 20 % lower than that estimated photogrammetrically, but the seismic method neglects detachments that are too small to be recorded by the distant broadband sensor, detachments from the same source area but not belonging to the 3 d event, and energy that gets lost due to fragmentation of the failed mass. The other stations further away underestimate the volume due to stronger signal damping, distortion, and worse coupling compared to the closest station OBER.
5.2 Rockfall activity as a landscape reshaping mechanism
Biannual rockwall retreat rates for the 5 years prior to the cliff fall averaged 6.5 mm y−1, slightly exceeding short-term (< 10 years) rockwall retreats for limestones (Draebing et al., 2022). The maximum pre-cliff-fall rockwall retreat corresponds to 9.5 mm y−1 between 2012 and 2014. The rockwall retreat rates are consistent with previous findings of enhanced rockfall activity for carbonate cliffs (Krautblatter et al., 2012). The (multi-)annual temporal intervals used in this study are unlikely to be sensible to precursory deformations; however, patterns of erosion across the rock face slope in the years prior to the cliff fall might reveal signs of alert. Close-up observations of the area of the cliff failure evidence block fall and boulder fall at the base of the failure with volumes of 1.71 (± 0.005) × 103 m3 and 1.05 (± 0.003) × 103 m3 in 2012–2014 and 2.91 (± 0.01) × 102 m3 in 2014–2015, reflecting a main deformation area (Kromer et al., 2018). The cliff fall resulted in the rockwall retreat of 390 mm y−1 between 2015 and 2017, increasing the mean steepness of the rock face by 1 %. The consecutive detachment of at least six block falls over 3 d follows an increase in magnitude from 103 m3 to 104 m3 as previously suggested by other studies (e.g., Kromer et al., 2017; Rosser et al., 2007; Abellán et al., 2009; Benjamin et al., 2020) and is paramount for the understanding of cascading risk in alpine regions.
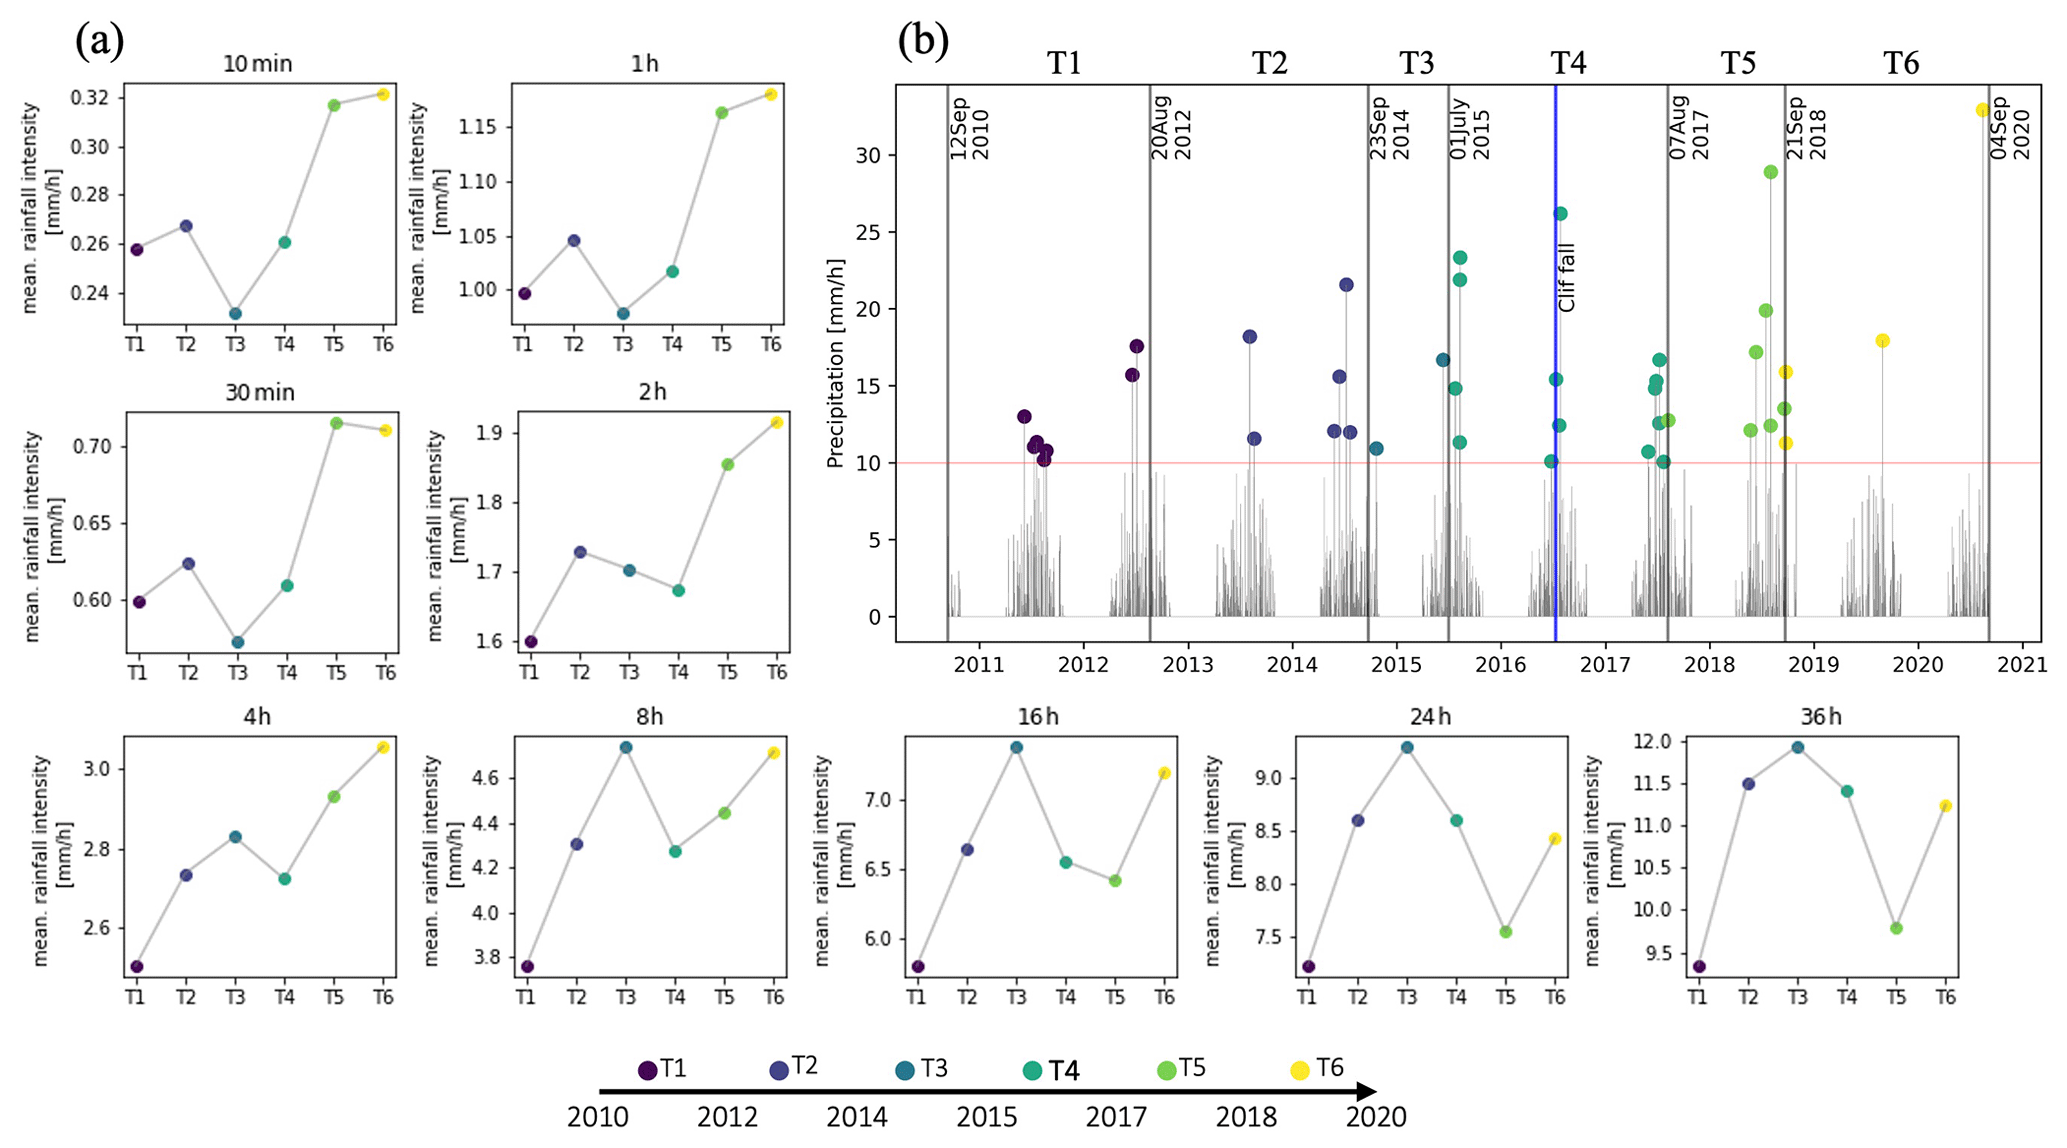
Figure 8Intensity–duration and frequency analysis for a diversity of rainfall events measured at precipitation station 6290 – Hinterhornbach (AT). Data basis: Bayerisches Landesamt für Umwelt (2022), cumulative sum over individual values. The storm analysis was performed by splitting the rainfall datasets by the acquisition dates of the aerial imagery, with T1, T2, and T3 (the years before the cliff fall) plotted in blue shades. T4 is the mean rainfall after, during, and 1 year after the cliff fall in light green. T5 and T6 are the time intervals with increased erosion in light green and yellow. (a) Mean rainfall intensity with a diversity of durations for the analyzed time intervals. (b) Discrete daily precipitation between 2011 and 2021. Dots highlight days with rainfall intensity exceeding 10 mm h−1.
Despite the greater distance between the Hochvogel summit and the seismic stations used to characterize the 2016 cliff fall compared to the original source (Le Roy et al., 2019), the energy released by the six sub-events was sufficient to record and discriminate them. Regardless of the high temporal resolution achieved with the seismic analysis compared to the photogrammetric records, the triggering mechanism for this multi-stage event is hard to constrain because of the lack of high-resolution climatic datasets at local scales. Among common rockfall triggering factors are precipitation and cyclic thermal stressing (Dietze et al., 2017b, 2021). Climatic records from the surroundings of the Hochvogel (station located at Obersdorf) showed that the multi-stage event was preceded by a phase of several dry and hot summer days. The night before the first block fall, minor amounts of rain were recorded, but the three final cliff falls on 11 July were preceded by more intense rainfall of up to 1.4 mm (10 min)−1 with a time lag of less than 1 h (Fig. 4c). Also, all recorded events happened during the morning and evening hours when a strong thermal gradient might have an influence on the stressing of the rock mass (Dietze et al., 2017b, 2021). Contrary to rockfall observations from high temporal monitoring of cliff evolution (Williams et al., 2019), the sub-events prior to the cliff fall are unlikely to follow a pattern of increasing frequency and volumes through time.
5.3 Mechanism of sediment delivery continuity under a system disturbance
Typical geomorphic responses to disturbances include increased rates of sediment remobilization, transport, and deposition (e.g., Owens et al., 2010; Bennett et al., 2013; Baer et al., 2017; Frank et al., 2019; Savi et al., 2023). However, sediment export from the basin rarely reflects changes in sediment transfer within a catchment (Walling, 1983; Walling and Collins, 2008; Burt and Allison, 2010) due to the high variability in time and scale of sediment morphodynamics. The catchment sediment budgets at the Hochvogel clearly suggest a perturbation in the system with at least a year of reaction time evidenced in the shift between predominant deposition and increased erosion. The segregated sediment budget (Fig. 6a) and the time series of spatial distribution of erosion and deposition (Fig. 7) provide insights on the predominant processes controlling the transfer of sediment within the slope. Conceptual models on sediment cascades on landslide-prone catchments propose the temporal accumulation on slopes from landslide deposits that become available for further remobilization (Harvey, 2001). Sediment transport depends on hydrological conditions and sediment supply, while superimposed debris flows are a common and efficient mechanism of sediment transport (Benda and Dunne, 1997; Schwab et al., 2008; Bennett et al., 2013; Clapuyt et al., 2019). The surroundings of the Hochvogel display an increased mean seasonal (April–November) rainfall intensity over the last decades for events with durations of less than 4 h (Fig. 8a). However, the number of days with precipitation exceeding rainfall thresholds reported in the literature for sediment transport (2.2 mm (10 min)−1) and debris flows initiation (3.8 to 9.6 mm (10 min)−1 and 5 and 15 mm h−1) (Hürlimann et al., 2019) exhibit no significant difference between the periods before and after the cliff fall, suggesting no clear rainfall-related trigger for the massive sediment redistribution after the cliff fall. Note the increased number of days with exceeding rainfall thresholds of 10 mm h−1, 3.8 mm (10 min)−1, and 9.6 mm (10 min)−1 for the time interval when the cliff fall occurred (Fig. 8b, 2015–2017: T4), while a depositional regime characterizes the sediment dynamics during this period as a consequence of the massive sediment production from the cliff fall. Conversely, the number of days exceeding common rainfall thresholds for the time interval between 2017 and 2018 (T5 in Fig. 8b) characterized by massive sediment redistribution within the catchment is similar to pre-cliff-fall intervals. These findings agree with previous studies wherein no clear rainfall trigger was found for massive sediment redistribution (e.g., Bennett et al., 2013; Frank et al., 2019). Numerical modeling demonstrates that both antecedent moisture and sediment storage are key for debris flow prediction (Bennett et al., 2013, 2014).
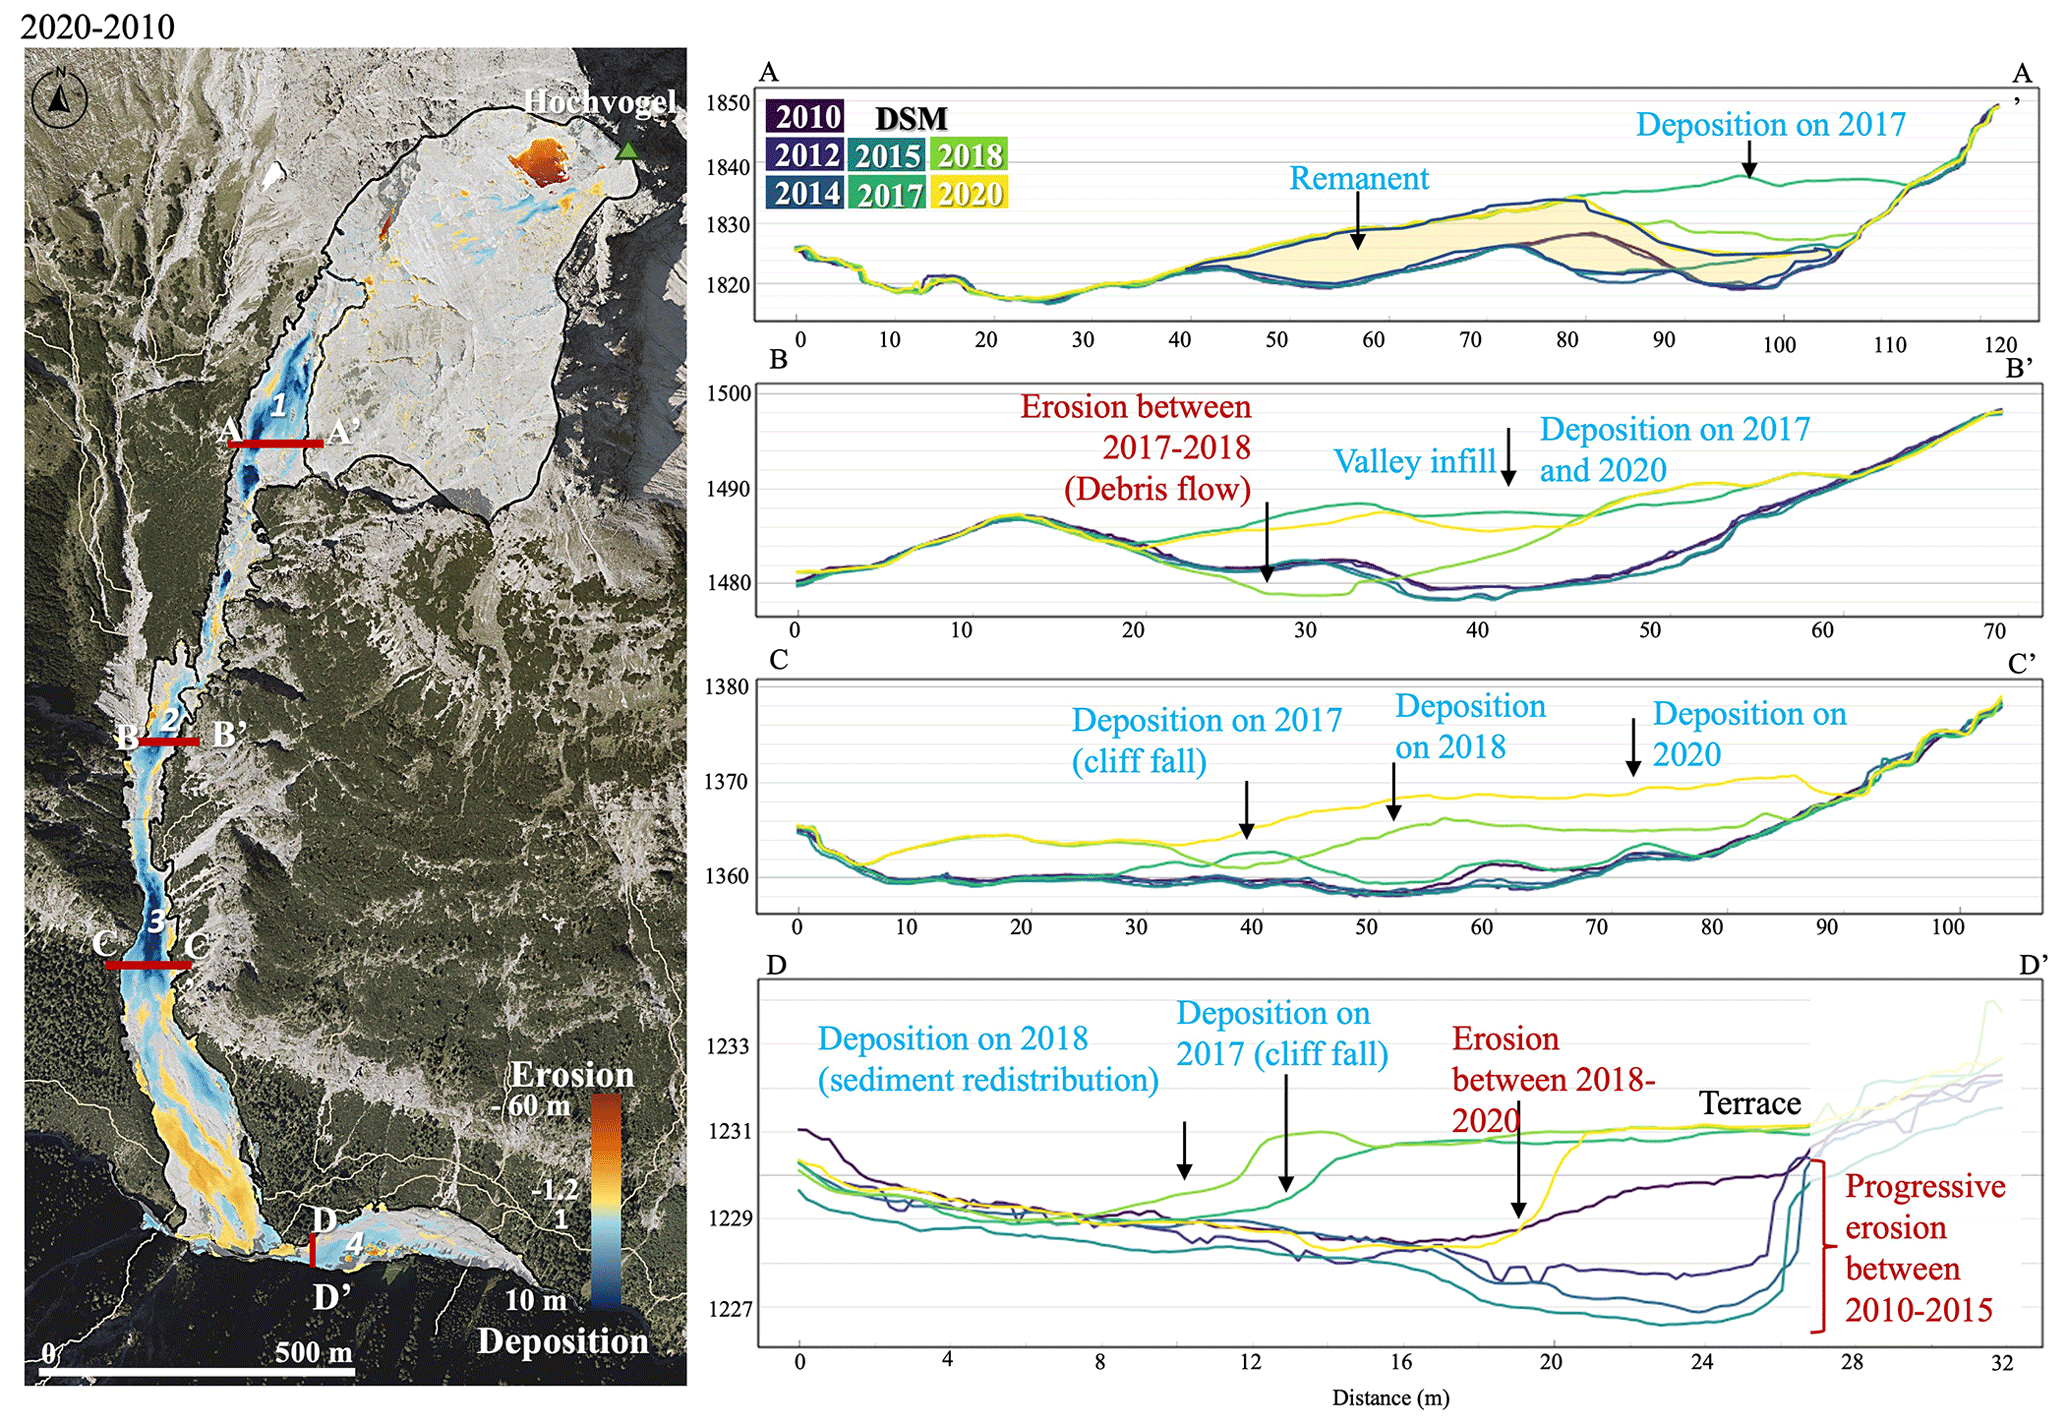
Figure 9Left: decadal topographic change. Right: topographic profiles at retention basins. Left: cumulative topographic changes between 2010 and 2020. Dark blue areas indicate remaining sediment deposits with more than 10 m in elevation. Profile A-A′ shows the formation of a depositional geoform (sediment talus) which is partially eroded in the next few years. The yellow polygon highlights the remanent sediment wedge with a depth of ca. 10 m. Profile B-B′ is located in the transfer zone between the Weittal and the lower valley. The confined valley is filled with sediment transferred from the cliff fall in 2017, partially eroded between 2017 and 2018, and filled again with sediment produced by secondary rockfalls and debris flows in 2020. Profile C-C′ exhibits the dynamic of the confined fan apex, which is slightly affected by the primary sediment produced during the cliff event but heavily impacted by the cascades. Progressive aggradation since 2017 evidenced the sediment waves in the system. Profile D-D′ shows the formation and current erosion of a terrace formed as a result of the sediment that reached the outlet of the Wildenbach catchment. An initial sediment wave partially blocked the Jochbach river with ca. 3 m of sediment. Additional sediment was annexed to the terrace in 2018. Currently, a remnant of 3 m width is observed, which is less than half of the original terrace.
Sediment transport by channelized debris flows is a common process in the studied catchment before the cliff fall event but is spatially confined to the widened dispersed debris flow channel (Fig. 7, 2010–2012, 2012–2014). Similarly to the Dolomite region (Italian Alps), debris flow initiation occurred at the outlet of a small basin where concentrated overland flow feeds an ephemeral channel that incised slope deposits (Berti and Simoni, 2005). Monitoring at the Swiss Alps suggests increased debris flow activity after a sudden sediment input from a rock avalanche or large landslide (Bennett et al., 2014; Baer et al., 2017; Frank et al., 2019). Numerical modeling by Bennett et al. (2014), calibrated for a debris-flow-prone catchment, enhanced the key role of sediment supply in debris flow formation even in erosive catchments. Even if the model results in transport-limited behavior for more than half of the time, the supply-limited condition in the debris flow channel results in highly nonlinear sediment discharge as a function of runoff. The material detached by the cliff fall entrained older deposits at the upper channelized erosive debris channel, which we traced back to 1945 by visual inspection of historical aerial imagery, increasing the amount of transported sediment downslope. Despite this, inferred trajectories of sediment waves from the visual inspection of temporal series of orthophotos, most likely coalescent debris flow and bulk erosion patterns, evidence short travel distances (< 500 m), promoting sediment transfer within the slope morphodynamic zones but rarely reaching the outlet. Multiple debris flow events were visually identified on the orthophotos based on differences in color and granulometry, but a complete separation remains challenging. Recent debris flow numerical models emphasize the importance of the topography for their motion, the role of retention basins and memory effects for the acceleration–deceleration stage of the flow (Qiao et al., 2023), and the spatial distribution of eroded volumes (de Haas et al., 2020). The sediment storage and sinks (marked as 1–4 in Fig. 7) at our study catchment spatially correspond to slope changes which might decrease flow energy and thus debris flow travel distances. The enhanced accumulation in this region is visible in the decadal topographic change in Fig. 9 (left). Currently, these areas with at least 10 m of recently cumulated sediment remain prone to mobilization, possibly extending the system relaxation times (Heckmann and Schwanghart, 2013).
Numerical models assessing the role of precipitation changes, runoff, and air temperature in sediment yield and debris flow activity suggest a reduction in both sediment supply and debris flow for the climatic predictions used. Additionally, the models identified sediment input into the sediment cascades as a key parameter for debris flow activity (Hirschberg et al., 2021). The presented results exemplify how sediment input produced by a cliff fall resulted in sediment continuity from the rock face to the outlet; however, the degree of continuity measured as the negative net change decreased considerably during the 4 years after the cliff fall (Fig. 6, right). The results align with recent observations on the key role of sediment supply in landscape connectivity (Heckmann and Schwanghart, 2013), sediment continuity (Joyce et al., 2018), and debris flow occurrences (Bennett et al., 2013; Baer et al., 2017; Hirschberg et al., 2021; Battista et al., 2022). The remaining key questions deal with the interactions of sediment supply and hydrological conditions as well as the timing and mechanisms, e.g., sediment exhaustion, required to reestablish the pre-event morphodynamics where the rock face is decoupled from the fluvial system. Predictions on the sediment cascade at the Hochvogel required a deeper understanding of the rockfall triggering factors and rates of sediment production, currently the subject of research. On the other hand, sediment storage resulting from geomorphic processes such as high-magnitude slope instability and paraglacial and glacier sediment storage often represents landforms decoupled from the present-day geomorphic process; therefore, studying the conditions that lead to increased sediment transport and reconnection of those systems supports the prediction of geomorphic impact under a changing climate.
The combination of seismic information and temporal series of high-resolution wide-extent true orthophotos and DSMs provides an accurate assessment of the temporal and special evolution of rockfalls and the subsequent massive sediment redistribution. A multi-stage detachment of more than 130 000 m3 in the Hochvogel summit, northern calcareous Alps (DE–AT), was responsible for the production of 97 % of the total sediment eroded between 2010 and 2020. We identified a significant disproportion in the contribution of rockfall magnitudes for the four slopes that constitute the summit with a predominance of debris fall for the northern and western slopes, while the southeastern slope has a large proportion of boulder fall and thus increased hazard. The seismic analysis revealed consecutive block fall with increased magnitude from 103 to 104 m3 in a time period of 3 d during the summer of 2016, strongly increasing the rockfall risk in the area. Therefore, these results underscore the need for monitoring alpine slopes to better assess possible increased rockfall activity that leads to safety concerns. We suggest the integration of wide-extent photogrammetric datasets in future alpine early-warning systems.
The time series of the spatial distribution of the differences of DSMs and differentiated geomorphic sediment budgets contributes to a better understanding of the complex nature and feedback of cascading processes. The alpine catchment quickly responded to the cliff fall within 0 to 4 years, resulting in massive sediment redistribution within the catchment and reduction in sediment delivery to the outlet. This, in turn, modified the fluvial response at the catchment outlet. Sediment continuity–transfer within the hillslope was rapidly recovered 2 years following the cliff fall. The recovered sediment flux mobilizes sediment along the geomorphic subsystems; however, the sediment waves were inefficient in delivering sediment to the catchment outlet. Relaxation times are expected beyond 10 years given that the latest observations (2020) still revealed perturbation in the system and the deposition of up to 10 m of sediment at the upper channelized debris flow, which serves as a sediment input for future debris flows.
The results present the first step towards better understanding, prediction, and early warning of alpine natural hazards under expected extreme climatic conditions. The ongoing interdisciplinary AlpSenseRely project aims to integrate high-resolution multi-scale, multi-temporal remote sensing data (large-format digital aerial photogrammetry and UAV) for an accurate quantification of temporal and spatial changes in alpine geomorphic systems.
The original aerial imagery is available at Landesamt für Digitalisierung, Breitband und Vermessung (LDBV), Bundesamt für Eich- und Vermessungswesen (BEV), and 3D RealityMaps GmbH upon request. Precipitation data are freely available at the download center from the Bayerisches Landesamt für Umwelt (https://www.gkd.bayern.de/de/meteo/niederschlag/iller_lech/hinterhornbach-oesterreich-6290/download, Bayerisches Landesamt für Umwelt, 2022). Seismic data are freely available from the reported sources in the Supplement.
The supplement related to this article is available online at: https://doi.org/10.5194/esurf-12-249-2024-supplement.
NB wrote the paper with contributions from JL. NB developed the topographic time series workflow, analyzed the data, and compiled results. JL calculated seismic volumes. JJ created DSMs and orthophotos from digital aerial imagery. MD verified and advised on the implementation of the seismic volume calculation. UM, FS, and MK provided guidance and funding. All authors checked and revised the text and the figures of the paper and contributed to the ideas developed in this study.
At least one of the (co-)authors is a member of the editorial board of Earth Surface Dynamics. The peer-review process was guided by an independent editor, and the authors also have no other competing interests to declare.
Publisher's note: Copernicus Publications remains neutral with regard to jurisdictional claims made in the text, published maps, institutional affiliations, or any other geographical representation in this paper. While Copernicus Publications makes every effort to include appropriate place names, the final responsibility lies with the authors.
We thank the Land Tyrol and particularly Thomas Figl for the open sharing of the pictures taken during the aerial inspection of the Hochvogel before the cliff fall, which helped us to better picture the magnitude of the detachment, as well as the landslide research group at TUM for the fieldwork support during the UAV acquisitions, particularly Andreas Dietrich for the UAV acquisition in 2017. We are indebted to Peter Mederer for his contribution to the early developments of the 3D-coregistration Python workflow during his internship at 3D RealityMaps GmbH and the colleagues at 3D RealityMaps GmbH, Munich, for the outstanding support with the implementation of the 3D models used for visualization, visual interpretation, and figures. We would like to thank the anonymous reviewer as well as David Mair, Anette Eltner, and Sebastien Castelltort for the time devoted to the paper; special thanks to Georgina Bennett for the constructive comments during the first review round that contributed to improving the quality of the paper.
This research was funded by the Bavarian State Ministry of the Environment and Consumer Protection (StMUV) in the framework of the project “AlpSenseRely” – Alpine remote sensing of climate-induced natural hazards: Reliability of multi-method hazard prediction in a changing climate (Teilprojekt for LMU TUSO1UFS-77318). Initial datasets were acquired during the project “AlpSenseBench” – Alpine remote sensing of climate-induced natural hazards funded by the Bavarian State Ministry for Economic Affairs, Regional Development and Energy (StMWI) (grant no. 45-6723a/15/2).
This open-access publication was funded by Ludwig-Maximilians-Universität München.
This paper was edited by Sebastien Castelltort and reviewed by Georgina Bennett, Anette Eltner, David Mair, and one anonymous referee.
Abellán, A., Jaboyedoff, M., Oppikofer, T., and Vilaplana, J. M.: Detection of millimetric deformation using a terrestrial laser scanner: experiment and application to a rockfall event, Nat. Hazards Earth Syst. Sci., 9, 365–372, https://doi.org/10.5194/nhess-9-365-2009, 2009.
Anderson, S. W.: Uncertainty in quantitative analyses of topographic change: error propagation and the role of thresholding, Earth Surf. Processes, 44, 1015–1033, https://doi.org/10.1002/esp.4551, 2019.
Baer, P., Huggel, C., McArdell, B. W., and Frank, F.: Changing debris flow activity after sudden sediment input: a case study from the Swiss Alps, Geology Today, 33, 216–223, https://doi.org/10.1111/gto.12211, 2017.
Battista, G., Schlunegger, F., Burlando, P., and Molnar, P.: Sediment Supply Effects in Hydrology-Sediment Modeling of an Alpine Basin, Water Resour. Res., 58, e2020WR029408, https://doi.org/10.1029/2020wr029408, 2022.
Bayerisches Landesamt für Umwelt: Gewässerkundlicher Dienst Bayern – Niederschlag Hinterhornbach/Österreich, Bayerisches Landesamt für Umwelt [data set], https://www.gkd.bayern.de/de/meteo/niederschlag/iller_lech/hinterhornbach-oesterreich-6290/download, last access: 16 November 2022.
Becht, M., Haas, F., Heckmann, T., and Wichmann, V.: A new modelling approach to delineate the spatial extent of alpine sediment cascades, Geomorphology, 111, 70–78, https://doi.org/10.1016/j.geomorph.2008.04.028, 2009.
Benda, L. E. and Dunne, T.: Stochastic Forcing of Sediment Routing and Storage in Channel Networks, Water Resour. Res., 33, 2865–2880, https://doi.org/10.1029/97wr02387, 1997.
Benjamin, J., Rosser, N. J., and Brain, M. J.: Emergent characteristics of rockfall inventories captured at a regional scale, Earth Surf. Processes, 45, 2773–2787, https://doi.org/10.1002/esp.4929, 2020.
Bennett, G. L., Molnar, P., Eisenbeiss, H., and McArdell, B. W.: Erosional power in the Swiss Alps: characterization of slope failure in the Illgraben, Earth Surf. Processes, 37, 1627–1640, https://doi.org/10.1002/esp.3263, 2012.
Bennett, G. L., Molnar, P., McArdell, B. W., Schlunegger, F., and Burlando, P.: Patterns and controls of sediment production, transfer and yield in the Illgraben, Geomorphology, 188, 68–82, https://doi.org/10.1016/j.geomorph.2012.11.029, 2013.
Bennett, G. L., Molnar, P., McArdell, B. W., and Burlando, P.: A probabilistic sediment cascade model of sediment transfer in the Illgraben, Water Resour. Res., 50, 1225–1244, https://doi.org/10.1002/2013wr013806, 2014.
Berger, C., McArdell, B. W., and Schlunegger, F.: Sediment transfer patterns at the Illgraben catchment, Switzerland: Implications for the time scales of debris flow activities, Geomorphology, 125, 421–432, https://doi.org/10.1016/j.geomorph.2010.10.019, 2011.
Berti, M. and Simoni, A.: Experimental evidences and numerical modelling of debris flow initiated by channel runoff, Landslides, 2, 171–182, https://doi.org/10.1007/s10346-005-0062-4, 2005.
Borselli, L., Cassi, P., and Torri, D.: Prolegomena to sediment and flow connectivity in the landscape: A GIS and field numerical assessment, CATENA, 75, 268–277, https://doi.org/10.1016/j.catena.2008.07.006, 2008.
Bracken, L. J., Turnbull, L., Wainwright, J., and Bogaart, P.: Sediment connectivity: a framework for understanding sediment transfer at multiple scales, Earth Surf. Processes, 40, 177–188, https://doi.org/10.1002/esp.3635, 2015.
Brown, A. G., Carey, C., Erkens, G., Fuchs, M., Hoffmann, T., Macaire, J.-J., Moldenhauer, K.-M., and Walling, D. E.: From sedimentary records to sediment budgets: Multiple approaches to catchment sediment flux, Geomorphology, 108, 35–47, https://doi.org/10.1016/j.geomorph.2008.01.021, 2009.
Burt, T. P. and Allison, R. J.: Sediment Cascades: An Integrated Approach, 1st edn., John Wiley & Sons, Ltd, https://doi.org/10.1002/9780470682876, 2010.
Clapuyt, F., Vanacker, V., Christl, M., Van Oost, K., and Schlunegger, F.: Spatio-temporal dynamics of sediment transfer systems in landslide-prone Alpine catchments , Solid Earth, 10, 1489–1503, https://doi.org/10.5194/se-10-1489-2019, 2019.
Deutscher Alpenverein, Sektion Donauwörth: Neue Felsstürze vom Hochvogel ins Weittal, Juli 2016 – Neue Felsstürze vom Hochvogel ins Weittal, https://www.dav-donauwoerth.de/index.php/neue-felsstuerze-am-hochvogel-juli-2016 (last access: 18 January 2024), 2016.
Deutscher Alpenverein, Sektion Donauwörth: Chronik – Sperrung des Bäumenheimer Weges, Sperrung Bäümenheimer Weg, https://www.dav-donauwoerth.de/index.php/sperrung-baeumenheimer-weg (last access: 18 January 2024), 2017.
de Haas, T., Nijland, W., de Jong, S. M., and McArdell, B. W.: How memory effects, check dams, and channel geometry control erosion and deposition by debris flows, Sci. Rep.-UK, 10, 14024, https://doi.org/10.1038/s41598-020-71016-8, 2020.
Dietrich, W. E., Dunne, T., Humphrey, N. F., and Reid, L. M.: Construction of sediment budgets for drainage basins, in: Construction of sediment budgets for drainage basins, vol. 141, USDA Forest Service, 5–23, https://www.fs.usda.gov/psw/publications/reid/Reid82a.pdf (last access: 18 January 2024), 1982.
Dietze, M., Mohadjer, S., Turowski, J. M., Ehlers, T. A., and Hovius, N.: Seismic monitoring of small alpine rockfalls – validity, precision and limitations, Earth Surf. Dynam., 5, 653–668, https://doi.org/10.5194/esurf-5-653-2017, 2017a.
Dietze, M., Turowski, J. M., Cook, K. L., and Hovius, N.: Spatiotemporal patterns, triggers and anatomies of seismically detected rockfalls, Earth Surf. Dynam., 5, 757–779, https://doi.org/10.5194/esurf-5-757-2017, 2017b.
Dietze, M., Krautblatter, M., Illien, L., and Hovius, N.: Seismic constraints on rock damaging related to a failing mountain peak: the Hochvogel, Allgäu, Earth Surf. Processes, 46, 417–429, https://doi.org/10.1002/esp.5034, 2021.
Draebing, D., Mayer, T., Jacobs, B., and McColl, S. T.: Alpine rockwall erosion patterns follow elevation-dependent climate trajectories, Commun. Earth Environ., 3, 21, https://doi.org/10.1038/s43247-022-00348-2, 2022.
Dussauge-Peisser, C., Helmstetter, A., Grasso, J.-R., Hantz, D., Desvarreux, P., Jeannin, M., and Giraud, A.: Probabilistic approach to rock fall hazard assessment: potential of historical data analysis, Nat. Hazards Earth Syst. Sci., 2, 15–26, https://doi.org/10.5194/nhess-2-15-2002, 2002.
Eltner, A. and Sofia, G.: Structure from motion photogrammetric technique, in: Developments in Earth surface process, vol. 23, edited by: Tarolli, P. and Mudd, S. M., Elsevier, 1–24, https://doi.org/10.1016/b978-0-444-64177-9.00001-1, 2020.
Erismann, T. H. and Abele, G.: Dynamics of Rockslides and Rockfalls, Springer Science & Business Media, Heidelberg, https://link.springer.com/book/10.1007/978-3-662-04639-5 (last access: 22 January 2024), 2001.
Fabris, M. and Pesci, A.: Automated DEM extraction in digital aerial photogrammetry: precisions and validation for mass movement monitoring, Ann. Geophys.-Italy, 48, https://doi.org/10.4401/ag-3247, 2009.
Fawcett, D., Blanco-Sacristán, J., and Benaud, P.: Two decades of digital photogrammetry: Revisiting Chandler's 1999 paper on “Effective application of automated digital photogrammetry for geomorphological research” – a synthesis, Prog. Phys. Geog. Earth Environ., 43, 299–312, https://doi.org/10.1177/0309133319832863, 2019.
Fischer, L., Purves, R. S., Huggel, C., Noetzli, J., and Haeberli, W.: On the influence of topographic, geological and cryospheric factors on rock avalanches and rockfalls in high-mountain areas, Nat. Hazards Earth Syst. Sci., 12, 241–254, https://doi.org/10.5194/nhess-12-241-2012, 2012.
Frank, F., Huggel, C., McArdell, B. W., and Vieli, A.: Landslides and increased debris-flow activity: A systematic comparison of six catchments in Switzerland, Earth Surf. Processes, 44, 699–712, https://doi.org/10.1002/esp.4524, 2019.
Fryirs, K.: (Dis)Connectivity in catchment sediment cascades: a fresh look at the sediment delivery problem, Earth Surf. Processes, 38, 30–46, https://doi.org/10.1002/esp.3242, 2013.
Fuchs, F., Lenhardt, W., Bokelmann, G., and the AlpArray Working Group: Seismic detection of rockslides at regional scale: examples from the Eastern Alps and feasibility of kurtosis-based event location, Earth Surf. Dynam., 6, 955–970, https://doi.org/10.5194/esurf-6-955-2018, 2018.
Geissler, J., Mayer, C., Jubanski, J., Münzer, U., and Siegert, F.: Analyzing glacier retreat and mass balances using aerial and UAV photogrammetry in the Ötztal Alps, Austria, The Cryosphere, 15, 3699–3717, https://doi.org/10.5194/tc-15-3699-2021, 2021.
Girardeau-Montaut, D.: CloudCompare v2.0, 3D point cloud and mesh processing software, Open Source Project [software], https://www.cloudcompare.org/ (last access: 18 January 2024), 2022.
Gregory, K. J. and Lewin, J.: The Basics of Geomorphology: Key Concepts, Sage, https://doi.org/10.4135/9781473909984, 2014.
Guerin, A., Ravanel, L., Matasci, B., Jaboyedoff, M., and Deline, P.: The three-stage rock failure dynamics of the Drus (Mont Blanc massif, France) since the June 2005 large event, Sci. Rep.-UK, 10, 17330, https://doi.org/10.1038/s41598-020-74162-1, 2020.
Haala, N. and Rothermel, M.: Dense Multi-Stereo Matching for High Quality Digital Elevation Models, Photogramm. Fernerkun., 2012, 331–343, https://doi.org/10.1127/1432-8364/2012/0121, 2012.
Hantz, D., Corominas, J., Crosta, G. B., and Jaboyedoff, M.: Definitions and Concepts for Quantitative Rockfall Hazard and Risk Analysis, Geosciences, 11, 158, https://doi.org/10.3390/geosciences11040158, 2021.
Harvey, A. M.: Coupling between hillslopes and channels in upland fluvial systems: implications for landscape sensitivity, illustrated from the Howgill Fells, northwest England, CATENA, 42, 225–250, https://doi.org/10.1016/s0341-8162(00)00139-9, 2001.
Heckmann, T. and Schwanghart, W.: Geomorphic coupling and sediment connectivity in an alpine catchment — Exploring sediment cascades using graph theory, Geomorphology, 182, 89–103, https://doi.org/10.1016/j.geomorph.2012.10.033, 2013.
Heckmann, T., Bimböse, M., Krautblatter, M., Haas, F., Becht, M., and Morche, D.: From geotechnical analysis to quantification and modelling using LiDAR data: a study on rockfall in the Reintal catchment, Bavarian Alps, Germany, Earth Surf. Processes, 37, 119–133, https://doi.org/10.1002/esp.2250, 2012.
Heckmann, T., Hilger, L., Vehling, L., and Becht, M.: Integrating field measurements, a geomorphological map and stochastic modelling to estimate the spatially distributed rockfall sediment budget of the Upper Kaunertal, Austrian Central Alps, Geomorphology, 260, 16–31, https://doi.org/10.1016/j.geomorph.2015.07.003, 2016.
Heißel, G. and Figl, T.: Stellungnahme der Amtssachverständigen für Geologie, Hydrogeologie und technische Geologie, sowie für den Schutz vor Erosion und vor alpinen geogenen Naturgefahren, https://www.dav-donauwoerth.de/index.php/3-gutachten-2017 (last access: 18 January 2024), 2017.
Hibert, C., Mangeney, A., Grandjean, G., and Shapiro, N. M.: Slope instabilities in Dolomieu crater, Réunion Island: From seismic signals to rockfall characteristics, J. Geophys. Res.-Earth, 116, https://doi.org/10.1029/2011jf002038, 2011.
Hilger, L. and Beylich, A. A.: Geomorphology of Proglacial Systems, Landform and Sediment Dynamics in Recently Deglaciated Alpine Landscapes, Geogr. Phys. Environ., 251–269, https://doi.org/10.1007/978-3-319-94184-4_15, 2018.
Hirschberg, J., Fatichi, S., Bennett, G. L., McArdell, B. W., Peleg, N., Lane, S. N., Schlunegger, F., and Molnar, P.: Climate Change Impacts on Sediment Yield and Debris-Flow Activity in an Alpine Catchment, J. Geophys. Res.-Earth, 126, e2020JF005739, https://doi.org/10.1029/2020jf005739, 2021.
Hirschmüller, H.: Stereo Processing by Semiglobal Matching and Mutual Information, IEEE T. Pattern Anal., 30, 328–341, https://doi.org/10.1109/tpami.2007.1166, 2008.
Hungr, O., McDougall, S., Wise, M., and Cullen, M.: Magnitude–frequency relationships of debris flows and debris avalanches in relation to slope relief, Geomorphology, 96, 355–365, https://doi.org/10.1016/j.geomorph.2007.03.020, 2008.
Hürlimann, M., Coviello, V., Bel, C., Guo, X., Berti, M., Graf, C., Hübl, J., Miyata, S., Smith, J. B., and Yin, H.-Y.: Debris-flow monitoring and warning: review and examples, Earth-Sci. Rev., 199, 102981, https://doi.org/10.1016/j.earscirev.2019.102981, 2019.
Jakob, M.: A size classification for debris flows, Eng. Geol., 79, 151–161, https://doi.org/10.1016/j.enggeo.2005.01.006, 2005.
James, L. A., Hodgson, M. E., Ghoshal, S., and Latiolais, M. M.: Geomorphic change detection using historic maps and DEM differencing: The temporal dimension of geospatial analysis, Geomorphology, 137, 181–198, https://doi.org/10.1016/j.geomorph.2010.10.039, 2012.
Joyce, H. M., Hardy, R. J., Warburton, J., and Large, A. R. G.: Sediment continuity through the upland sediment cascade: geomorphic response of an upland river to an extreme flood event, Geomorphology, 317, 45–61, https://doi.org/10.1016/j.geomorph.2018.05.002, 2018.
Kaufmann, V. and Ladstädter, R.: Quantitative analysis of rock glacier creep by means of digital photogrammetry using multi-temporal aerial photographs: Two case studies in the Austrian Alps, in: Proceedings of the 8th International Conference on Permafrost, Zurich, Switzerland, 31–35 July 2003, 525–530, ISBN 90 5809 582 7, 2003.
Kazhdan, M., Chuang, M., Rusinkiewicz, S., and Hoppe, H.: Poisson Surface Reconstruction with Envelope Constraints, Comput. Graph. Forum, 39, 173–182, https://doi.org/10.1111/cgf.14077, 2020.
Korup, O., Densmore, A. L., and Schlunegger, F.: The role of landslides in mountain range evolution, Geomorphology, 120, 77–90, https://doi.org/10.1016/j.geomorph.2009.09.017, 2010.
Krautblatter, M., Moser, M., Schrott, L., Wolf, J., and Morche, D.: Significance of rockfall magnitude and carbonate dissolution for rock slope erosion and geomorphic work on Alpine limestone cliffs (Reintal, German Alps), Geomorphology, 167, 21–34, https://doi.org/10.1016/j.geomorph.2012.04.007, 2012.
Kromer, R., Lato, M., Hutchinson, D. J., Gauthier, D., and Edwards, T.: Managing rockfall risk through baseline monitoring of precursors using a terrestrial laser scanner, Can. Geotech. J., 54, 953–967, https://doi.org/10.1139/cgj-2016-0178, 2017.
Kromer, R. A., Rowe, E., Hutchinson, J., Lato, M., and Abellán, A.: Rockfall risk management using a pre-failure deformation database, Landslides, 15, 847–858, https://doi.org/10.1007/s10346-017-0921-9, 2018.
Lacroix, P. and Helmstetter, A.: Location of Seismic Signals Associated with Microearthquakes and Rockfalls on the Séchilienne Landslide, French AlpsLocation of Seismic Signals Associated with Microearthquakes and Rockfalls on Séchilienne Landslide, B. Seismol. Soc. Am., 101, 341–353, https://doi.org/10.1785/0120100110, 2011.
Leinauer, J., Jacobs, B., and Krautblatter, M.: Anticipating an imminent large rock slope failure at the Hochvogel (Allgäu Alps), Geomechanics Tunn., 13, 597–603, https://doi.org/10.1002/geot.202000027, 2020.
Leinauer, J., Jacobs, B., and Krautblatter, M.: High alpine geotechnical real time monitoring and early warning at a large imminent rock slope failure (Hochvogel, GER/AUT), IOP Conf. Ser.-Earth Environ. Sci., 833, 012146, https://doi.org/10.1088/1755-1315/833/1/012146, 2021.
Le Roy, G., Helmstetter, A., Amitrano, D., Guyoton, F., and Roux-Mallouf, R. L.: Seismic Analysis of the Detachment and Impact Phases of a Rockfall and Application for Estimating Rockfall Volume and Free-Fall Height, J. Geophys. Res.-Earth, 124, 2602–2622, https://doi.org/10.1029/2019jf004999, 2019Manconi, A., Picozzi, M., Coviello, V., Santis, F. D., and Elia, L.: Real-time detection, location, and characterization of rockslides using broadband regional seismic networks, Geophys. Res. Lett., 43, 6960–6967, https://doi.org/10.1002/2016gl069572, 2016.
Marzolff, I. and Poesen, J.: The potential of 3D gully monitoring with GIS using high-resolution aerial photography and a digital photogrammetry system, Geomorphology, 111, 48–60, https://doi.org/10.1016/j.geomorph.2008.05.047, 2009.
McSaveney, M. J.: Recent rockfalls and rock avalanches in Mount Cook National Park, New Zealand, in: Catastrophic Landslides Effects, ocurrences and Mechanisms, vol. XV, Geological Society of America, https://doi.org/10.1130/reg15, 2002.
Micheletti, N., Lane, S. N., and Chandler, J. H.: Application of archival aerial photogrammetry to quantify climate forcing of alpine landscapes, Photogramm. Rec., 30, 143–165, https://doi.org/10.1111/phor.12099, 2015.
Owens, P. N., Petticrew, E. L., and van der Perk, M.: Sediment response to catchment disturbances, J. Soils Sediments, 10, 591–596, https://doi.org/10.1007/s11368-010-0235-1, 2010.
Qiao, Z., Li, T., Simoni, A., Gregoretti, C., Bernard, M., Wu, S., Shen, W., and Berti, M.: Numerical modelling of an alpine debris flow by considering bed entrainment, Front. Earth Sci., 10, 1059525, https://doi.org/10.3389/feart.2022.1059525, 2023.
Riggs, H. C.: Frequency Curves, US Government Printing Office, 1968.
Rosser, N., Lim, M., Petley, D., Dunning, S., and Allison, R.: Patterns of precursory rockfall prior to slope failure, J. Geophys. Res.-Earth, 112, F04014, https://doi.org/10.1029/2006jf000642, 2007.
Rothermel, Mathias., Wenzel, K., Fritsch, D., and Haala, N.: SURE: Photogrammetric surface reconstruction from imagery, in: Proceedings LC3D Workshop, Berlin, December, https://ifpwww.ifp.uni-stuttgart.de/publications/2012/Rothermel_etal_lc3d.pdf, (last access: 18 January 2024), 615–620, 2012.
Savi, S., Buter, A., Heckmann, T., Theule, J., Mao, L., and Comiti, F.: Multi-temporal analysis of morphological changes in an Alpine proglacial area and their effect on sediment transfer, CATENA, 220, 106701, https://doi.org/10.1016/j.catena.2022.106701, 2023.
Schiefer, E. and Gilbert, R.: Reconstructing morphometric change in a proglacial landscape using historical aerial photography and automated DEM generation, Geomorphology, 88, 167–178, https://doi.org/10.1016/j.geomorph.2006.11.003, 2007.
Schrott, L., Hufschmidt, G., Hankammer, M., Hoffmann, T., and Dikau, R.: Spatial distribution of sediment storage types and quantification of valley fill deposits in an alpine basin, Reintal, Bavarian Alps, Germany, Geomorphology, 55, 45–63, https://doi.org/10.1016/s0169-555x(03)00131-4, 2003.
Schwab, M., Rieke-Zapp, D., Schneider, H., Liniger, M., and Schlunegger, F.: Landsliding and sediment flux in the Central Swiss Alps: A photogrammetric study of the Schimbrig landslide, Entlebuch, Geomorphology, 97, 392–406, https://doi.org/10.1016/j.geomorph.2007.08.019, 2008.
Theler, D., Reynard, E., Lambiel, C., and Bardou, E.: The contribution of geomorphological mapping to sediment transfer evaluation in small alpine catchments, Geomorphology, 124, 113–123, https://doi.org/10.1016/j.geomorph.2010.03.006, 2010.
Thiele, S. T., Grose, L., Samsu, A., Micklethwaite, S., Vollgger, S. A., and Cruden, A. R.: Rapid, semi-automatic fracture and contact mapping for point clouds, images and geophysical data, Solid Earth, 8, 1241–1253, https://doi.org/10.5194/se-8-1241-2017, 2017.
Tucker, G. E.: Drainage basin sensitivity to tectonic and climatic forcing: implications of a stochastic model for the role of entrainment and erosion thresholds, Earth Surf. Processes, 29, 185–205, https://doi.org/10.1002/esp.1020, 2004.
Walling, D. E.: The sediment delivery problem, J. Hydrol., 65, 209–237, https://doi.org/10.1016/0022-1694(83)90217-2, 1983.
Walling, D. E. and Collins, A. L.: The catchment sediment budget as a management tool, Environ. Sci. Policy, 11, 136–143, https://doi.org/10.1016/j.envsci.2007.10.004, 2008.
Whalley, B.: The mechanics of high-magnitude low-frequency rock failure and its importance in a mountainous area, Reading Geographical Papers, George Over Ltd, London, ISBN 0704903326, 1974.
Whalley, B.: Rockfalls, in: Slope Instability, Chapter 7, John Wiley and Sons Ltd, ISBN 0471903485, 1984.
Wheaton, J. M., Brasington, J., Darby, S. E., and Sear, D. A.: Accounting for uncertainty in DEMs from repeat topographic surveys: improved sediment budgets, Earth Surf. Processes, 35, 136–156, https://doi.org/10.1002/esp.1886, 2010.
Wichmann, V., Heckmann, T., Haas, F., and Becht, M.: A new modelling approach to delineate the spatial extent of alpine sediment cascades, Geomorphology, 111, 70–78, https://doi.org/10.1016/j.geomorph.2008.04.028, 2009.
Williams, J. G., Rosser, N. J., Hardy, R. J., and Brain, M. J.: The Importance of Monitoring Interval for Rockfall Magnitude-Frequency Estimation, J. Geophys. Res.-Earth, 124, 2841–2853, https://doi.org/10.1029/2019jf005225, 2019.