the Creative Commons Attribution 4.0 License.
the Creative Commons Attribution 4.0 License.
 | 31 Jan 2024
Probing the exchange of CO2 and O2 in the shallow critical zone during weathering of marl and black shale
Tobias Roylands
Robert G. Hilton
Erin L. McClymont
Mark H. Garnett
Guillaume Soulet
Sébastien Klotz
Mathis Degler
Felipe Napoleoni
Caroline Le Bouteiller
Chemical weathering of sedimentary rocks can release carbon dioxide (CO2) and consume oxygen (O2) via the oxidation of petrogenic organic carbon and sulfide minerals. These pathways govern Earth's surface system and climate over geological timescales, but the present-day weathering fluxes and their environmental controls are only partly constrained due to a lack of in situ measurements. Here, we investigate the gaseous exchange of CO2 and O2 during the oxidative weathering of black shales and marls exposed in the French southern Alps. On six field trips over 1 year, we use drilled headspace chambers to measure the CO2 concentrations in the shallow critical zone and quantify CO2 fluxes in real time. Importantly, we develop a new approach to estimate the volume of rock that contributes CO2 to a chamber, and assess effective diffusive gas exchange, by first quantifying the mass of CO2 that is stored in a chamber and connected rock pores. Both rock types are characterized by similar contributing rock volumes and diffusive movement of CO2. However, CO2 emissions differed between the rock types, with yields over rock outcrop surfaces (inferred from the contributing rock volume and the local weathering depths) ranging on average between 73 and 1108 for black shales and between 43 and 873 for marls over the study period. Having quantified diffusive processes, chamber-based O2 concentration measurements are used to calculate O2 fluxes. The rate of O2 consumption increased with production of CO2, and with increased temperature, with an average O2:CO2 molar ratio of 10:1. If O2 consumption occurs by both rock organic carbon oxidation and carbonate dissolution coupled to sulfide oxidation, either an additional O2 sink needs to be identified or significant export of dissolved inorganic carbon occurs from the weathering zone. Together, our findings refine the tools we have to probe CO2 and O2 exchange in rocks at Earth's surface and shed new light on CO2 and O2 fluxes, their drivers, and the fate of rock-derived carbon.
- Article
(8771 KB) - Full-text XML
-
Supplement
(2465 KB) - BibTeX
- EndNote


Sedimentary rocks cover ∼ 64 % of the present-day continental surface of Earth (Hartmann and Moosdorf, 2012) and contain vast amounts of carbon in carbonate minerals and organic matter (Petsch, 2014). The chemical breakdown of these rocks can act as a source of carbon dioxide (CO2) to the near-surface reservoirs (hydrosphere–biosphere–pedosphere–atmosphere) and can be a sink of oxygen (O2), in turn, exerting an important control on the evolution of climate and life (Berner and Berner, 2012; Berner, 1999; Sundquist and Visser, 2003). Two reactions are recognized, namely (i) the oxidation of petrogenic organic carbon (OCpetro) (Petsch, 2014) and (ii) the oxidation of sedimentary sulfide minerals that produce sulfuric acid that can, in turn, dissolve carbonate minerals (Calmels et al., 2007; Li et al., 2008; Torres et al., 2014). On a global scale, these chemical weathering pathways together emit roughly as much CO2 to the atmosphere (Berner and Berner, 2012; Burke et al., 2018; Petsch, 2014; Zondervan et al., 2023) as is removed by the weathering of silicate minerals with a flux of ∼ 90–140 Mt C yr−1 (Gaillardet et al., 1999; Moon et al., 2014). How these fluxes play out over longer timescales remains difficult to assess (Petsch, 2014; Hilton and West, 2020); however, the decline in the atmospheric O2 over the last 800 000 years (Stolper et al., 2016) has been tentatively linked to changes in global oxidative weathering fluxes (Yan et al., 2021). To improve the understanding of the changes in the Earth's surface conditions over geological timescales, the mechanism and controls on oxidative weathering pathways need to be better constrained (Berner and Berner, 2012; Mills et al., 2021). Theoretical modeling of OCpetro oxidation currently relies on input kinetics of the weathering reactions from laboratory experiments (Bolton et al., 2006; Petsch, 2014; Bao et al., 2017). In situ gas exchange between rocks undergoing weathering and the atmosphere can provide much needed insight.
The first field-based fluxes of weathering-derived CO2 were reported by Keller and Bacon (1998) in a glacial till dominated by shales. More recently, Tune et al. (2020) found substantial CO2 release and O2 depletion in bedrock undergoing weathering below a forested hillslope. There, according to monitoring of gases and water chemistry, carbon release is mostly sourced from superficial soils and deep roots, with minor contributions from OCpetro oxidation (Tune et al., 2020, 2023). At both sites, the gaseous fluxes were determined on the basis of profiles of the CO2 concentration in air sampled from boreholes extending to depths of ∼ 7 m (Keller and Bacon, 1998) and of ∼ 16 m (Tune et al., 2020), using Fick's law:
where JX is the molar flux () of the particular gas species X and DX its diffusivity (i.e., the capability to allow diffusion; m2 s−1) in the studied vadose zone, and where describes the change in the concentration (mol m−3) over depth (m). An alternative approach introduced by Soulet et al. (2018) uses gas accumulation chambers drilled into shallow weathering zones. Instead of calculating a carbon flux from a presupposed diffusion coefficient, which can introduce uncertainties (Maier and Schack-Kirchner, 2014), CO2 release is measured in real time in a similar way that is commonly applied to soil surfaces (Oertel et al., 2016). This method has provided new insight into how temperature, precipitation, and topography control CO2 emissions from marls (Soulet et al., 2021) and mudstones (Roylands et al., 2022). However, for weathering chambers that are installed within the rock face, three aspects remain unexplored: (i) the rock volume that contributes to the CO2 accumulation measured in the chamber; (ii) how the diffusive movement of CO2 in the shallow weathering zone is impacted by short-term environmental changes (e.g., in temperature and hydrology); and (iii) the quantification of O2 depletion during oxidative weathering.
In this study, we investigate the weathering-driven exchange of CO2 and O2 by installing chambers into black shales and marls undergoing oxidation at two study sites in the steep terrains of the Draix-Bléone Observatory, France (Gaillardet et al., 2018; Draix-Bléone Observatory, 2015; Klotz et al., 2023). Building on research from an outcrop at the same observatory (Soulet et al., 2021), we find that chamber-based CO2 emissions vary significantly over 1 year, linked to changes in temperature and precipitation. A new theoretical framework is developed to refine CO2 flux measurements (Sect. 4.1) and applied to quantify the rock pore space that is probed during a measurement (Sect. 4.2). This allows us to normalize CO2 accumulation rates based on a contributing rock volume and return estimates of fluxes emitted from the surface of rock outcrops. The resulting CO2 fluxes can be accurately described as a function of temperature (Sect. 4.3). Using Fick's law, measurements of the O2 concentration in the chambers are then used to quantify the O2 consumption in the studied rocks (Sect. 4.4). Together, we provide new insights into the exchange of CO2 and O2 in the shallow weathering zone of sedimentary rocks.
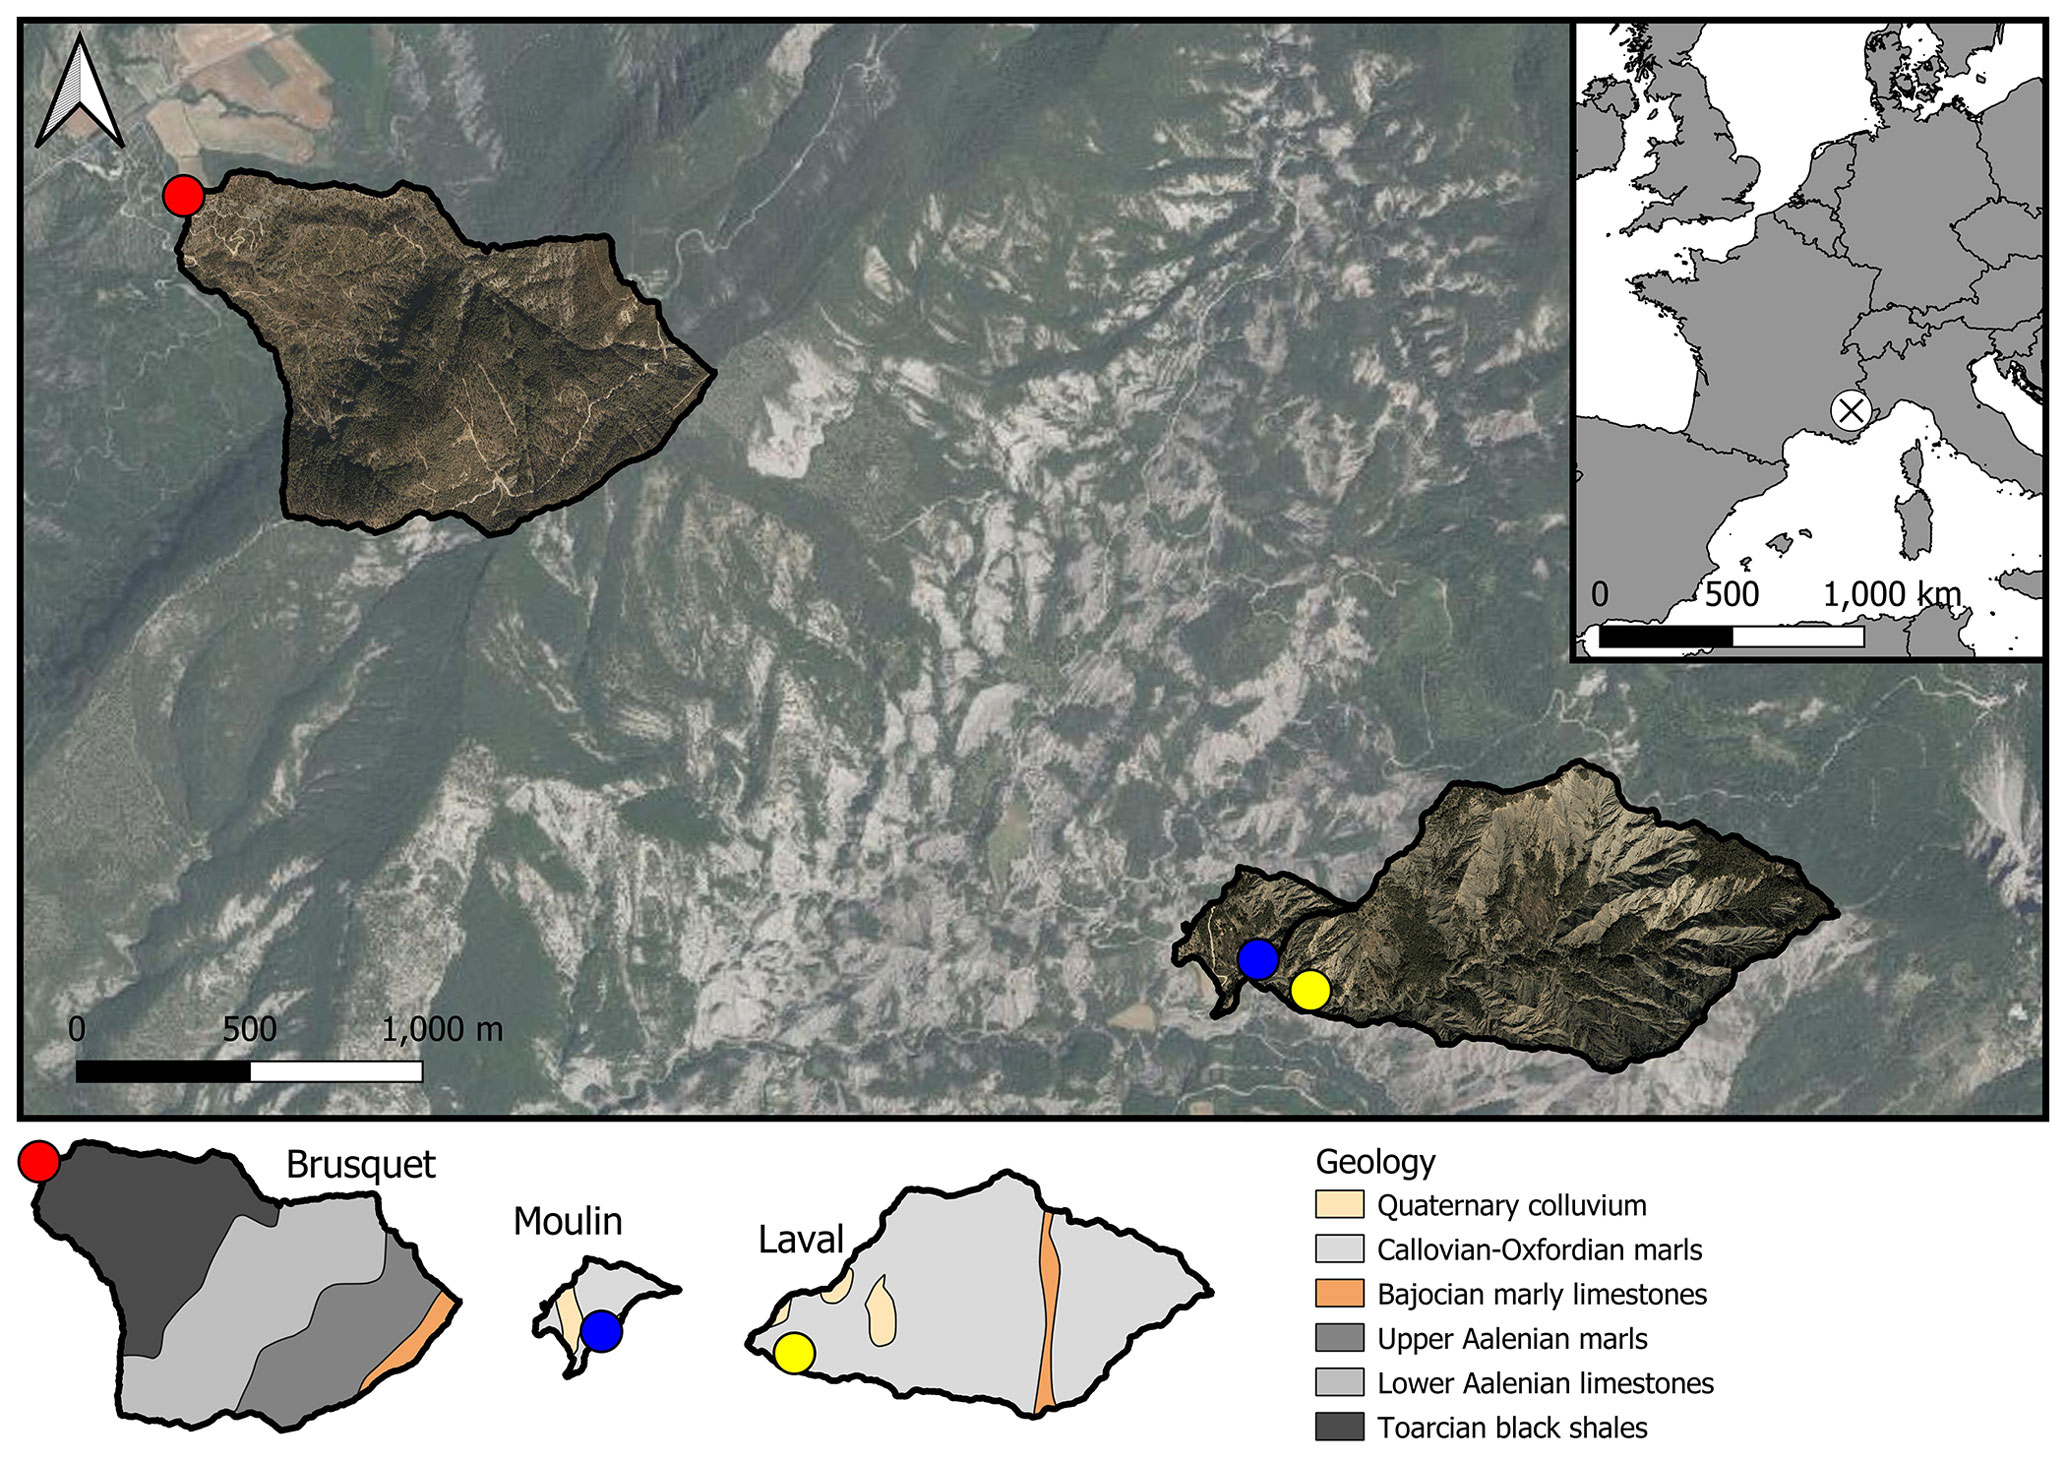
Figure 1Location of the French Draix-Bléone Observatory and of the study sites for in situ CO2 and O2 monitoring in the Brusquet catchment (red circle) and in the Moulin catchment (blue circle), alongside the location of previous research in the Laval catchment for reference (yellow circle) (Soulet et al., 2018, 2021) and geological maps of these catchments (Janjou, 2004). Meteorological stations are present at each of the catchment outlets, with a maximum distance to the study sites of 200 m (Draix-Bléone Observatory, 2015). Catchment-specific aerial imagery (Draix-Bléone Observatory, 2015) is shown alongside transparent aerial imagery of the wider area (2018 ©IGN).
2.1 Study area
The two study sites are located in the catchments of the Brusquet (area of 1.08 km2) and Moulin (0.08 km2) of the Draix-Bléone Observatory (Draix-Bléone Observatory, 2015; Klotz et al., 2023), which is part of the French network of critical zone observatories (OZCAR) (Gaillardet et al., 2018). The Brusquet site is located at 44.16251∘ N, 6.32330∘ E at 847 and the Moulin site at 44.14146∘ N, 6.36095∘ E at 874 (Fig. 1). The catchments of the Draix-Bléone Observatory have detailed measurements of river water discharge, river suspended load and bedload transport, and meteorological data over the last 4 decades (Cras et al., 2007; Mathys et al., 2003; Carriere et al., 2020; Draix-Bléone Observatory, 2015; Mathys and Klotz, 2008; Mallet et al., 2020; Klotz et al., 2023). Prior work has examined the occurrence of the solid phase of OCpetro in the Brusquet, Moulin, and Laval catchments (Graz et al., 2011, 2012; Copard et al., 2006). The Laval catchment (0.86 km2), which neighbors the Moulin catchment (Fig. 1), is the location of previous in situ measurements of rock-derived CO2 (Soulet et al., 2018, 2021).
The Moulin catchment overlays Callovian to Oxfordian marls (Mathys et al., 2003; Graz et al., 2012; Janjou, 2004). In contrast, the lithology of the Brusquet catchment consists of a sequence of Bajocian marly limestones, Aalenian marls, and limestones to Toarcian black shales (Janjou, 2004; Copard et al., 2006; Graz et al., 2011), with the study site located on the latter (Fig. 1).
The climate is transitional between Alpine and Mediterranean, with a hot and dry summer, including short and intense rainfall events during thunderstorms (up to 150 mm h−1), with rainfall events of lower intensity typically during spring and autumn (Soulet et al., 2021; Carriere et al., 2020; Mathys et al., 2003; Mallet et al., 2020). During winter, more than 100 d of frost can occur (Oostwoud Wijdenes and Ergenzinger, 1998; Rovéra and Robert, 2006), and frost cracking from ice segregation was found to control hillslope regolith production (Ariagno et al., 2022). The mean annual rainfall is ∼ 900 mm, and the mean annual air temperature is ∼ 11 ∘C, defined by high solar radiation (> 2300 h yr−1) (Soulet et al., 2021; Mallet et al., 2020; Mathys and Klotz, 2008).
Together, the climate and the erodible lithology of finely bedded, mechanically weak rocks result in a badland morphology, with V-shaped gullies, high physical weathering rates, and abrupt, sediment-loaded floods (Antoine et al., 1995; Cras et al., 2007; Le Bouteiller et al., 2021; Mathys et al., 2003). These features limit the development of soils and vegetation cover. In the late 19th century, following overgrazing in the wider area of the observatory, the Brusquet catchment was reforested (Mathys et al., 2003; Cras et al., 2007). Today ∼ 87 % of the catchment area of Brusquet is vegetated, in contrast to ∼ 46 % and ∼ 32 % of the Moulin and Laval catchments, respectively (Carriere et al., 2020; Cras et al., 2007). The sediment export fluxes of the Brusquet catchment are on average ∼ 70, ∼ 5700 and ∼ 14 300 for the Moulin and Laval catchments, respectively (Mathys et al., 2003; Carriere et al., 2020). Taking a regolith bulk density of ∼ 1.3–1.8 t m−3 into account (Mallet et al., 2020; Mathys and Klotz, 2008; Oostwoud Wijdenes and Ergenzinger, 1998; Bechet et al., 2016; Ariagno et al., 2023), a physical erosion rate of ∼ 0.04–0.05 mm yr−1, ∼ 3.2–4.4 and ∼ 8–11 mm yr−1 can be estimated for the Brusquet, Moulin, and Laval catchments, respectively. However, these values are catchment-scale averages, and the physical erosion can significantly vary spatially. On steep, bare slopes, the erosion rates may be comparably high in the different catchments of the Draix-Bléone Observatory (Carriere et al., 2020; Bechet et al., 2016; Mathys et al., 2003).
The bare surfaces in the catchments are characterized by four morphologically different layers, as reviewed by Mathys and Klotz (2008): (i) near-surface loose detrital cover of locally produced clasts or colluvial material with a thickness of ∼ 0–10 cm; (ii) the underlying upper fine regolith with a thickness of ∼ 5–20 cm; and (iii) the lower, coarse, and compact regolith, with a thickness of ∼ 10–20 cm; and (iv) the unweathered bedrock at the bottom (Oostwoud Wijdenes and Ergenzinger, 1998; Maquaire et al., 2002; Rovéra and Robert, 2006). The compactness and density of these layers increase, while the porosity decreases (from values of up to ∼ 50 %) (Bechet et al., 2016; Mallet et al., 2020; Garel et al., 2012), over depth towards the unweathered bedrock (Maquaire et al., 2002). The unweathered bedrock has a grain density of ∼ 2.7 t m−3 and a porosity of ∼ 10 %–20 % (Lofi et al., 2012). The thickness of the weathering profile varies laterally, with the thickest regolith layers and detrital cover on crests, minimal development in thalwegs, and intermediate in gullies (Maquaire et al., 2002; Esteves et al., 2005).
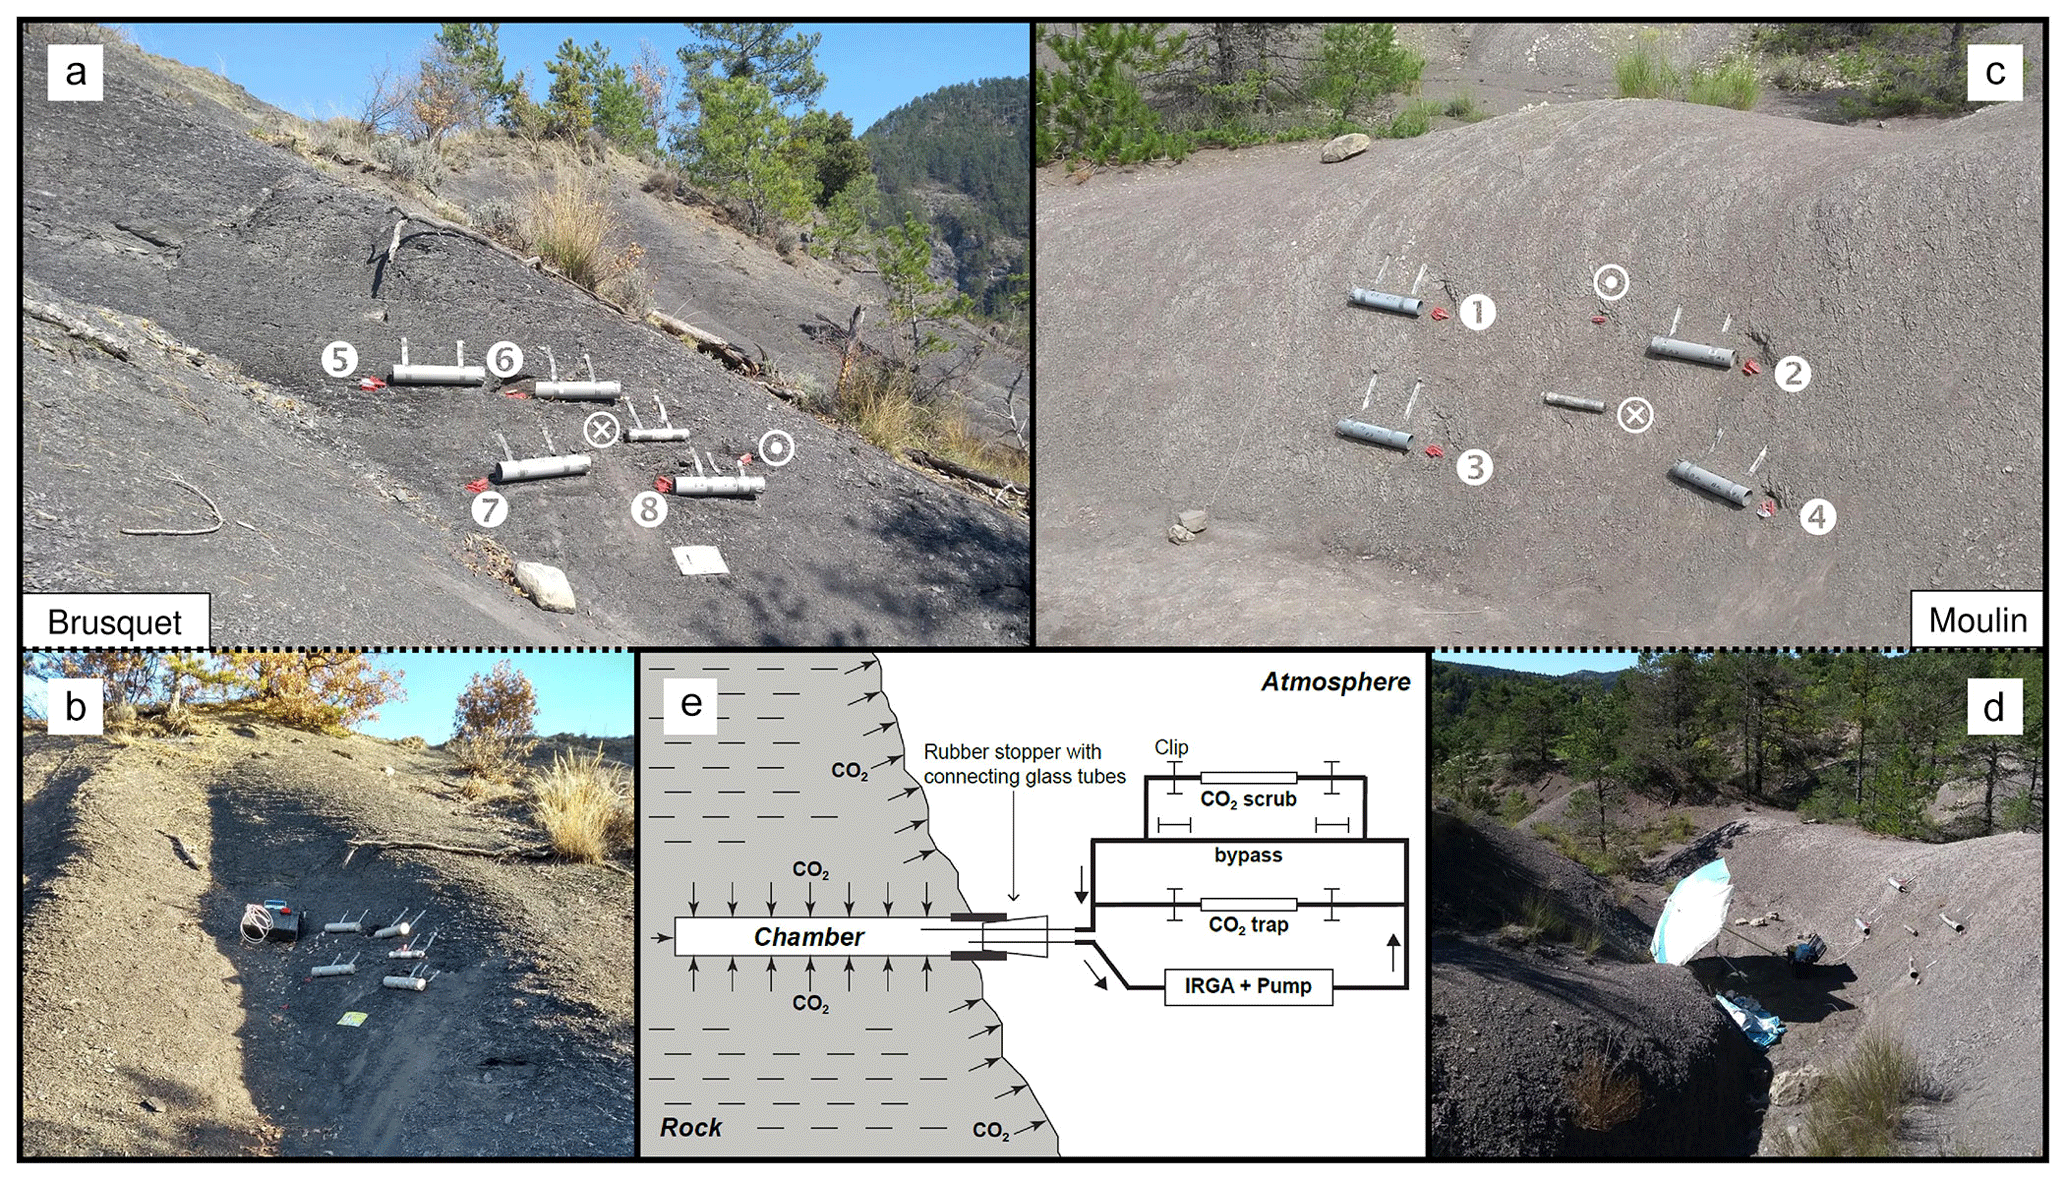
Figure 2The study sites in the Brusquet catchment (a, b) and in the Moulin catchment (c, d). Identifiers of the CO2 accumulation chambers (Table 1) are given next to their entrance. Furthermore, the location of temperature and relative humidity loggers in a further chamber with similar properties (circled dot) and on the rock surface (circled X) are shown. For scale, the gray cases (not used in the present study) next to the chambers are of ∼ 40 cm length. Panel (e) shows the design of the chambers and the sampling system adapted from Soulet et al. (2018).
2.2 Drilled gas accumulation chambers
To measure in situ the production of CO2 and consumption of O2 by oxidative reactions in the shallow critical zone of sedimentary rocks undergoing weathering, we use drilled chambers. The chambers were visited six times over the study (to capture seasonal changes in weather conditions) on 27 September 2018, 11–14 January 2019, 11–15 April 2019, 27–29 May 2019, 5–12 July 2019, and 27 September to 2 October 2019. Their design has been previously detailed (Soulet et al., 2018). In summary, a horizontal chamber is drilled directly into the exposed rock, which has been cleared of detrital cover. The shape of the drilled chambers ensures a large surface-to-volume ratio to benefit measurement of gas concentrations and potential trapping of CO2. To install the chambers to a depth of ∼ 38 cm (Fig. 2e), a mechanical drill was used, with a diameter of 2.9 cm. Rock powder left inside the chambers was blown away with a compressed-air gun. A small PVC (polyvinyl chloride) tube was inserted in the entrance of each chamber that was closed with a rubber stopper holding two glass tubes fitted with Tygon® tubing. The latter allow either connection to a gas-sampling system or sealing with WeLoc® clips. To further isolate the chamber from the atmosphere, the intersection of the PVC tube and regolith was sealed with a silicone sealant (UniBond® Outdoor Window and Door Frame), which we previously tested to be free of potential contaminants for gas sampling (Roylands et al., 2022).
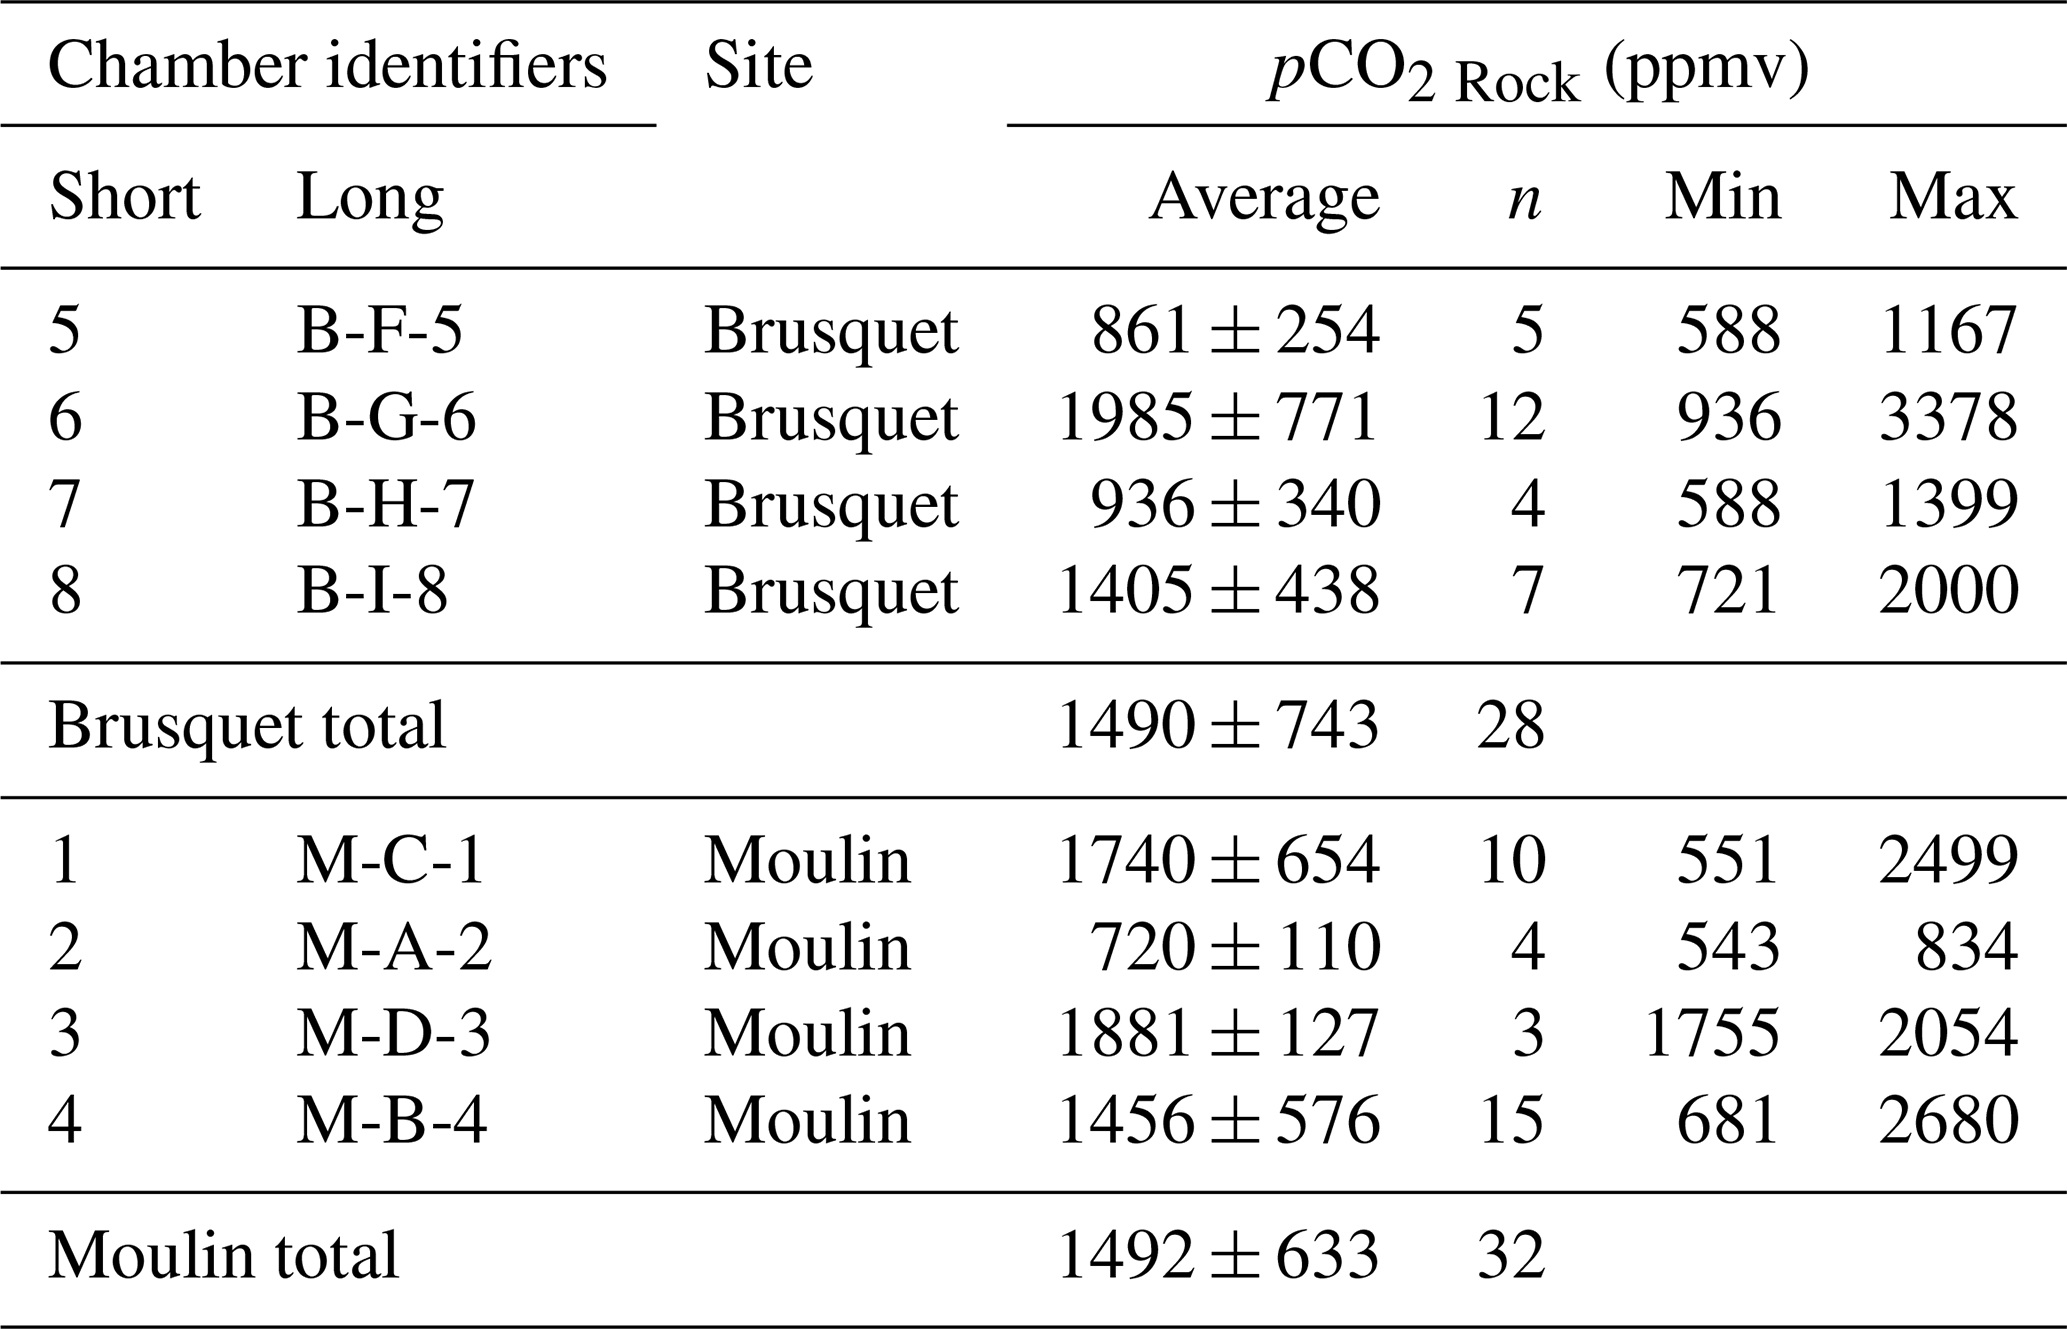
Table 1Characteristics of gas accumulation chambers drilled into weathering sedimentary rocks in the Brusquet catchment and in the Moulin catchment. For the calculation of the volume and inner surface area of the chambers, the length and insertion depth of the PVC tube and rubber stopper are used.
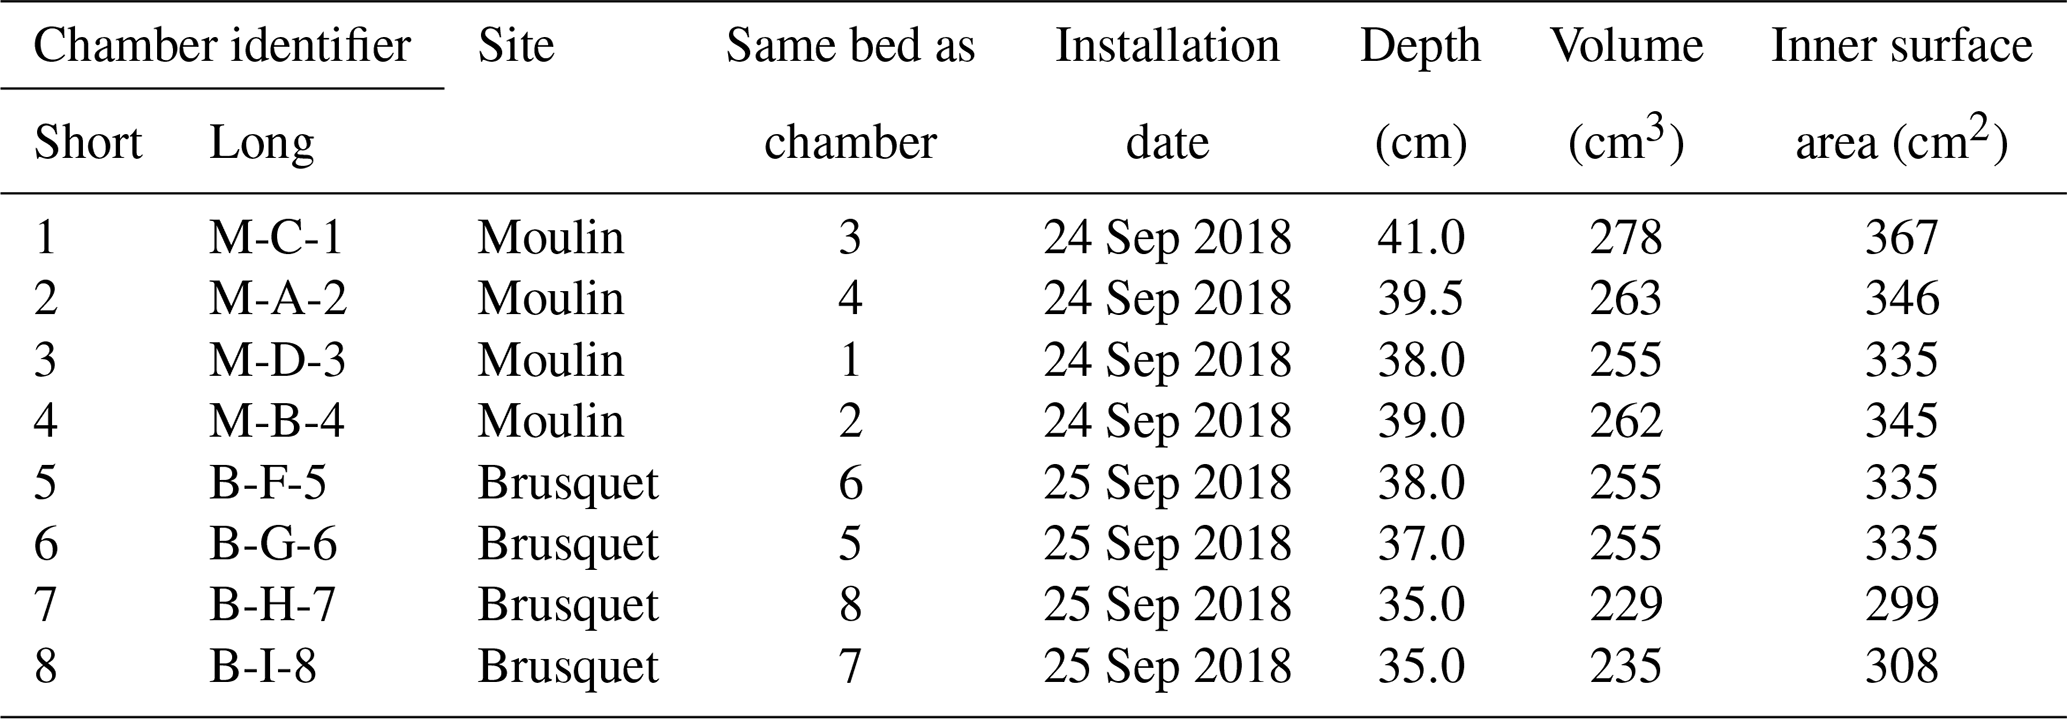
At both the Brusquet and Moulin study sites, we installed one array of four chambers placed in a square (2 × 2) (Fig. 2) (Table 1). In each array, two chambers were placed in the same rock bed with a roughly horizontal orientation at the Brusquet site and roughly vertical at the Moulin site. The minimum distance between chambers was 70 cm. The aspect, hydrological, and geomorphic setting of the location of both arrays is similar; they were placed at the upper margin of the watersheds in steep walls of gullies on a southwest- (Brusquet) and south-facing aspect (Moulin). The chambers were drilled into bare rock faces devoid of roots and with minimal soil or vegetation cover in the vicinity to exclude a contribution by them to the CO2 measurements (Fig. 2).
2.3 Rock temperature and humidity
At both sites, a chamber with the same design was installed to hold a temperature and relative humidity logger (Lascar® EL-USB-2) (Fig. 2) from 27 September 2018 onwards. A second logger was placed on the rock surface (monitoring the air directly above it), with the main body fitted inside a small PVC tube for physical protection and an aluminum foil wrapping around the tube to avoid the alteration of the temperature measurement due to the dark color of the housing of the sensor and the PVC tube.
Over the study period, technical issues with batteries of the temperature and relative humidity loggers prevented continuous data collection. To fill the gaps in the direct chamber temperature measurements, we use air temperatures from a local weather station as a proxy (Appendix A) by modifying a framework that describes soil temperatures by, amongst other variables, air temperature (Liang et al., 2014). Using the site-specific air temperatures, this approach simulates the chamber temperature well, with a root mean square error (RMSE) of 1.8 ∘C for the Brusquet catchment and 2.2 ∘C for the Moulin catchment (Appendix A).
2.4 Partial pressure of rock CO2
The partial pressure of CO2 (pCO2) was measured alongside air pressure to determine the concentrations of CO2 in the rock chambers with an infrared gas analyzer (IRGA; EGM-5 Portable Gas Analyzer, PP Systems). This is equipped with an internal pump and calibrated to pCO2 in the range of 0 to 30 000 ppmv (parts per million by volume). First, the closed-loop sampling system is purged of CO2 using an inline CO2 scrub (soda lime) (Hardie et al., 2005). This is then connected to a chamber to measure the ambient pCO2. After a short equilibration, the pCO2 in the chamber (pCO2 Chamber) is calculated from the CO2 concentration in the combined air volume of the chamber and the sampling system by accounting for the dilution introduced from the CO2-free air that was originally contained within the sampling system (Soulet et al., 2018; Roylands et al., 2022). To ensure that the determined pCO2 Chamber is representative of the ambient pCO2 in the rock pores around the chamber (pCO2 Rock), measurements are only considered if the chambers were left closed overnight so that the production of CO2 from oxidative weathering could reach a steady state with respect to diffusion between rock pores, chamber, and atmosphere.
2.5 CO2 flux measurements
Real-time measurements of CO2 release in drilled chambers have been previously described in detail (Soulet et al., 2018) and used to quantify the CO2 flux (Soulet et al., 2021; Roylands et al., 2022). In summary, one CO2 flux measurement consists of a series of repeated accumulations (typically eight or more) that are recorded over time after determining the pCO2 Rock. First, the pCO2 Chamber is lowered to a value close to the local atmosphere value using soda lime or a zeolite sieve (Sect. 2.6) (Fig. 2e). Then, CO2 is allowed to build up, typically over ∼ 6 min, before the CO2 in the chamber is again removed to a near-atmospheric value. For each repeat, the rate of CO2 accumulation q (mg C min−1) is calculated by fitting an exponential model to the recorded pCO2 change, following Pirk et al. (2016):
where is the carbon mass change (mg C) in the chamber with time (min), m0 is the initial carbon mass in the chamber (mg C), and λ (min−1) is a constant covering the sum of all processes proportional to the carbon mass difference (m(t)−m0) and relating to the diffusion of CO2 between rock pores, chamber, and atmosphere (Soulet et al., 2018). For this, the carbon mass (m; mg C) in the chamber is obtained from
where the measured pCO2 Chamber is in ppmv (cm3 m−3), V is the combined volume (cm3) of the chamber and the sampling system, P is the pressure (Pa), R is the universal gas constant (), T is the chamber temperature (K), and MC is the molar mass of carbon (g mol−1).
The CO2 accumulation rate q can be normalized to the internal surface area of the chamber SChamber (i.e., area of exchange with the surrounding rock; m2) to account for differences in the depth of the chambers, which are related to differences in volume and surface area, giving a repeat-specific flux Q ():
Alternatively, the CO2 accumulation can be reported as a molar-based flux ():
where (mmol CO2 min−1) is the molar-based analogue to q.
Previous work has noted that the CO2 accumulation rate during the first measurements is typically higher than subsequent repeats (Soulet et al., 2018). To calculate a CO2 flux from these repeated accumulations (consisting of n repeats), previous work excluded the first three repeats (q1 to q3) and took the average of a minimum of three further repeats (q4 to qn≥6) (Roylands et al., 2022; Soulet et al., 2018, 2021). We examine this further using new data collected here, which also provide constraint on the nature of the gas exchange around the chambers.
2.6 CO2 sampling
During a CO2 flux measurement, the CO2 in the chamber can be sampled by circulating it through a zeolite molecular sieve cartridge (MSC) mounted in parallel to the monitoring line (Hardie et al., 2005; Soulet et al., 2018) (Fig. 2e). The volume of carbon loaded onto a sieve is estimated by adding up the pCO2 maxima for each trapping episode minus the final pCO2 after trapping (near-atmospheric value), while accounting for the combined volume of the chamber and the sampling system.
The zeolite sieves were heated in the laboratory to 425 ∘C and purged with high-purity nitrogen gas to release the CO2 trapped onto them prior to cryogenic purification under vacuum (Garnett and Murray, 2013). The estimated sampled volume of CO2 from the chamber-based pCO2 measurements (; mL) can be compared with the volume recovered from the MSC in the laboratory (; mL), giving a sampling ratio (SR; unitless) (Roylands et al., 2022):
For this, all volumes of CO2 are normalized to 0 ∘C and 1013 mbar. The SR thus allows us to independently check calculations of carbon mass using the pCO2 data combined with the gas line and chamber volume measurements (Eqs. 2 and 3).
2.7 Measuring pO2 and O2 fluxes
While measuring pCO2, the EGM-5 portable gas analyzer, incorporating the IRGA, also records the partial pressure of oxygen in the chamber (pO2 Chamber; % ) with an electrochemical O2 sensor. The pO2 Chamber cannot be used in the same way as the pCO2 to quantify flux for two reasons: (i) the precision of the O2 sensor of ≥ 0.1 % () is insufficient to observe real-time changes in pO2 Chamber due to the expected weathering fluxes; and (ii) O2 should be consumed during oxidative weathering, and so we would require a method that replenishes oxygen, which was not done while measuring CO2 accumulation.
An alternative method to calculate an O2 flux is based on Fick's law (Eq. 1), using the diffusive gradient of the partial pressure of O2 in the rock (pO2 Rock) towards the atmospheric O2 concentration (pO2 Atm.). To obtain pO2 Rock, the pO2 Chamber measured after connecting to the chamber is corrected for the oxygen concentration in the sampling system. The pO2 recorded before and during a measurement is corrected for instrument drift. The drift correction is based on measuring the pO2 Atm. directly before or after a chamber-based measurement and assuming an average atmospheric oxygen concentration of 20.95 % ().
To quantify the exchange of O2 between the chamber, connected rock pores, and the atmosphere (; mmol O2 min−1), we describe the process via a diffusive transfer controlled by the diffusivity of O2 (; cm2 min−1) across a spatial parameter ω (describing in combination the movement across area over depth; cm1 cm−2):
If we assume that ω is the same for O2 and CO2, linking the space of O2 consumption and CO2 release, then can be related to the diffusivity of CO2 (; cm2 min−1), based on their ideal relation in air, which is independent of temperature (Angert et al., 2015):
Differences in the effective diffusivities of gas species depend on the structure of the air-filled pore space, which is expected to have identical impacts on the gaseous movement of O2 and CO2 (Angert et al., 2015; Millington, 1959; Penman, 1940). Thus, if the term (cm3 min−1) can be quantified by other means (for instance, through analysis of the pCO2 Rock and CO2 flux data), then we can quantify . These themes will be discussed later (Sect. 4.1 and 4.4).
Table 2Overview of the variability in the air temperature, chamber temperature, and rock surface temperature over the study period (27 September 2018 to 2 October 2019) (Fig. 3). A gap in the record of rock surface temperatures at the Moulin site (25 October 2018 to 11 January 2019) is not considered.
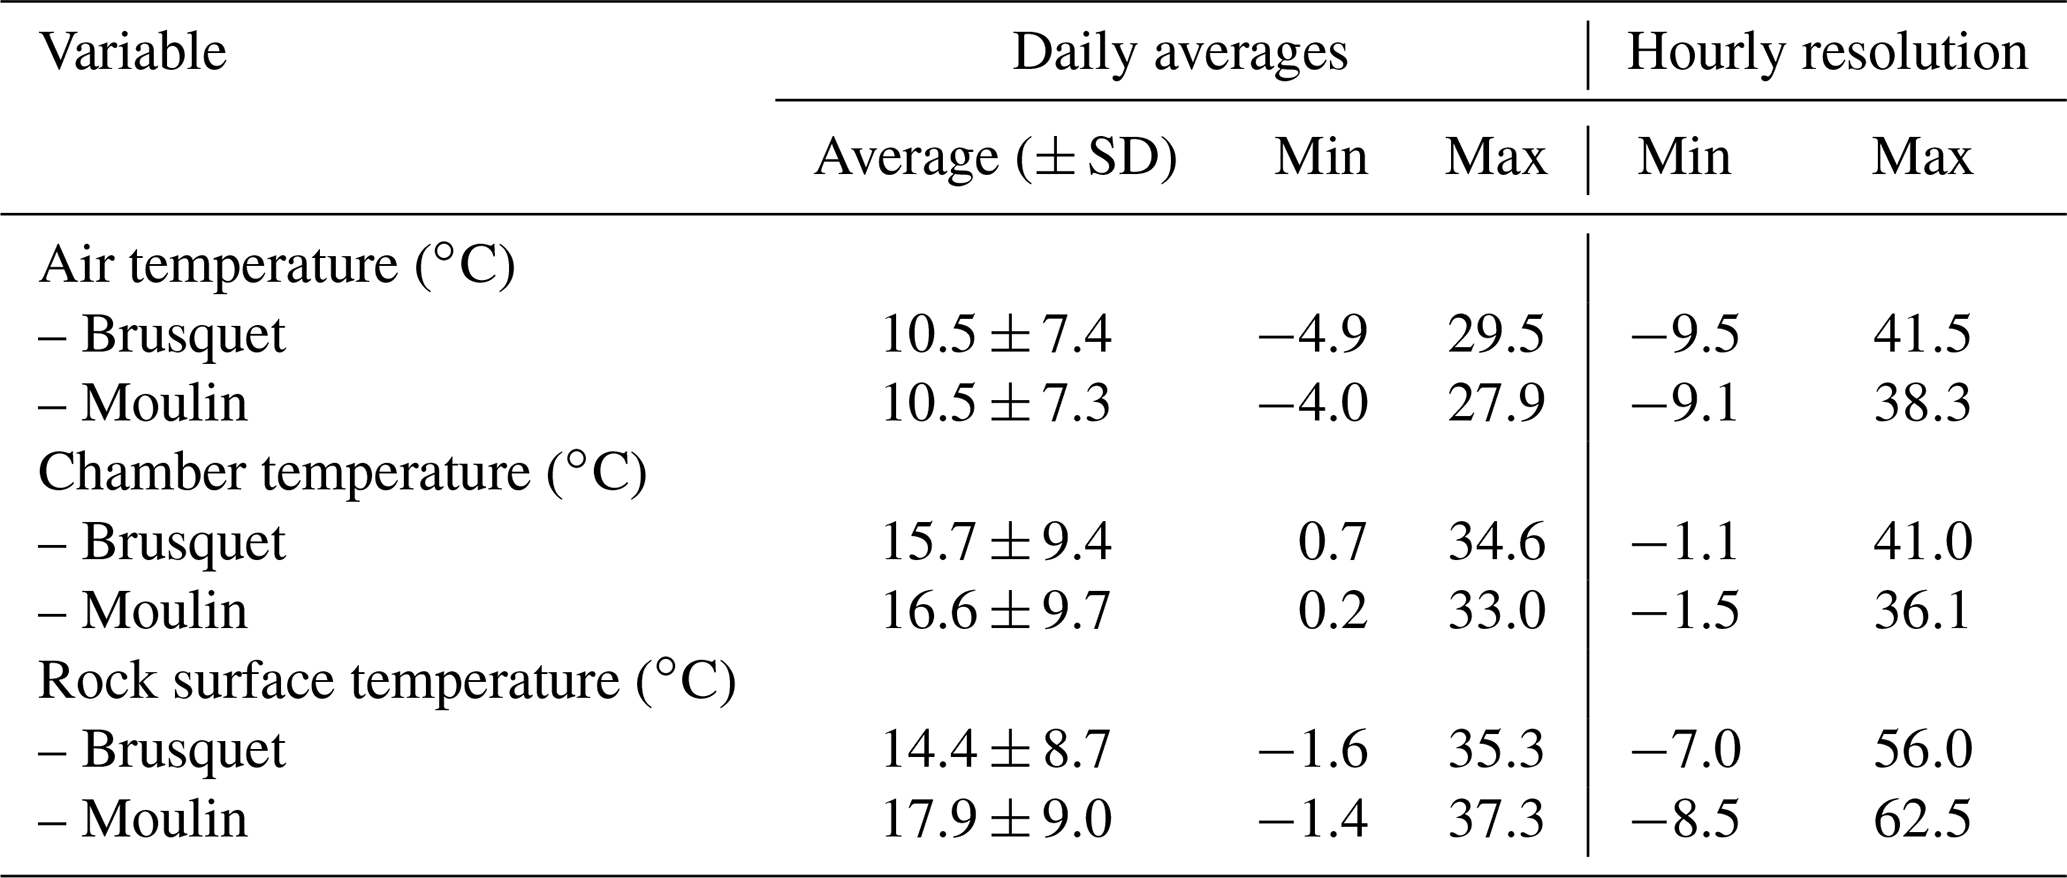
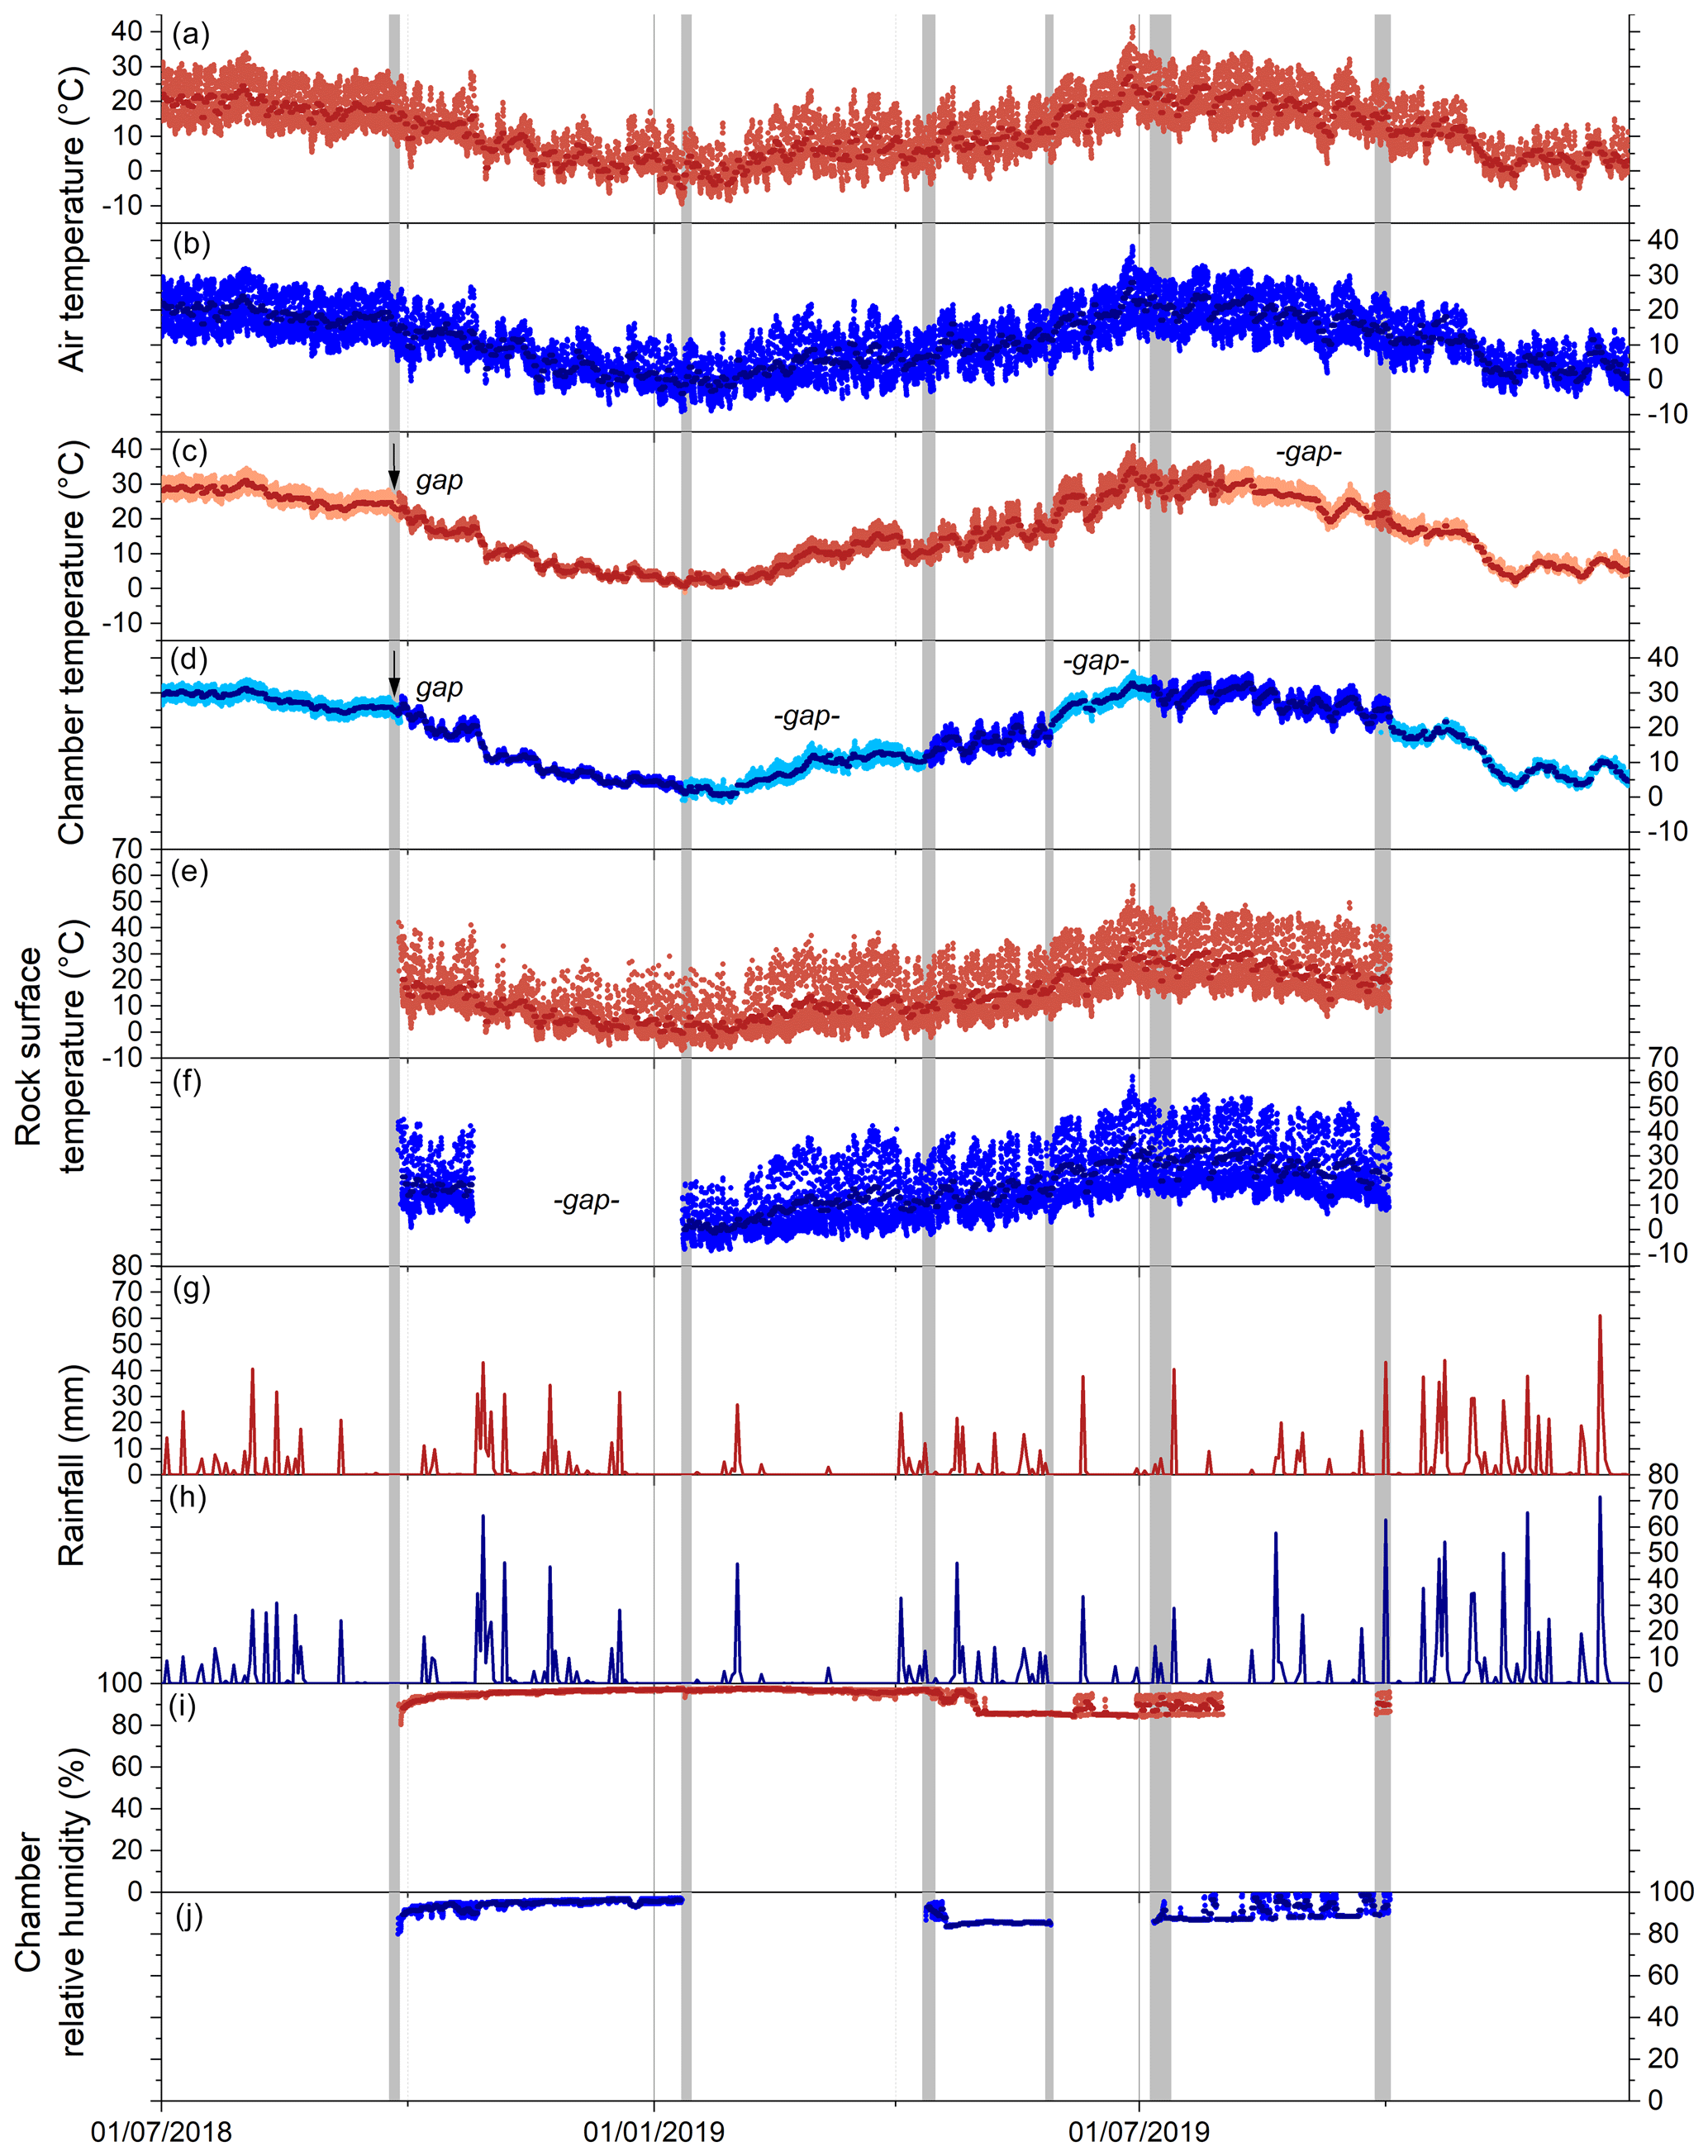
Figure 3Environmental variables for weathering chambers in 2018 and 2019, with gray shaded areas showing fieldwork visits in the Brusquet catchment (panels a, c, e, g, and i; red) and in the Moulin catchment (panels b, d, f, h, and j; blue). Daily averages are shown by darker colors in all panels. (a, b) Hourly air temperatures from meteorological stations (Draix-Bléone Observatory, 2015). (c, d) Hourly chamber temperatures. Estimated chamber temperatures are indicated by lighter colors (Sect. 2.3) and are shown for gaps in the logger record (denoted). (e, f) Hourly rock surface temperatures. (g, h) Daily rainfall. (i, j) Relative humidity in the chambers, with gaps in the record similar to the chamber temperatures.
3.1 Chamber temperature and meteorological conditions
Over the study period (27 September 2018 to 2 October 2019), similar variability in environmental conditions was recorded at the Brusquet and Moulin catchments. The temperatures of the atmosphere, chamber interiors, and at the rock surface showed daily and seasonal changes (Table 2) (Fig. 3a–f). Rainfall events were comparable in occurrence and extent, but the Brusquet catchment received less cumulative rainfall (773 mm) than the Moulin catchment (1033 mm) (Fig. 3g and h). The relative air humidity in the chambers was high and constant, with values of ∼ 93.1 ± 4.5 % (± standard deviation, SD) and ∼ 91.3 ± 4.1 % at the Brusquet and Moulin sites, respectively (not considering gaps in the record) (Fig. 3i and j).
Table 3Chamber-specific overview of pCO2 Rock, with variations over time reported as 1 SD.
3.2 pCO2 measurements and CO2 collection
The pCO2 Rock values varied between the chambers and over time. In the Brusquet catchment, the observed pCO2 Rock values were on average 1490 ± 743 ppmv (± SD, if not reported otherwise, n = 28), and 1492 ± 633 ppmv (n = 32) in the Moulin catchment (Table 3).
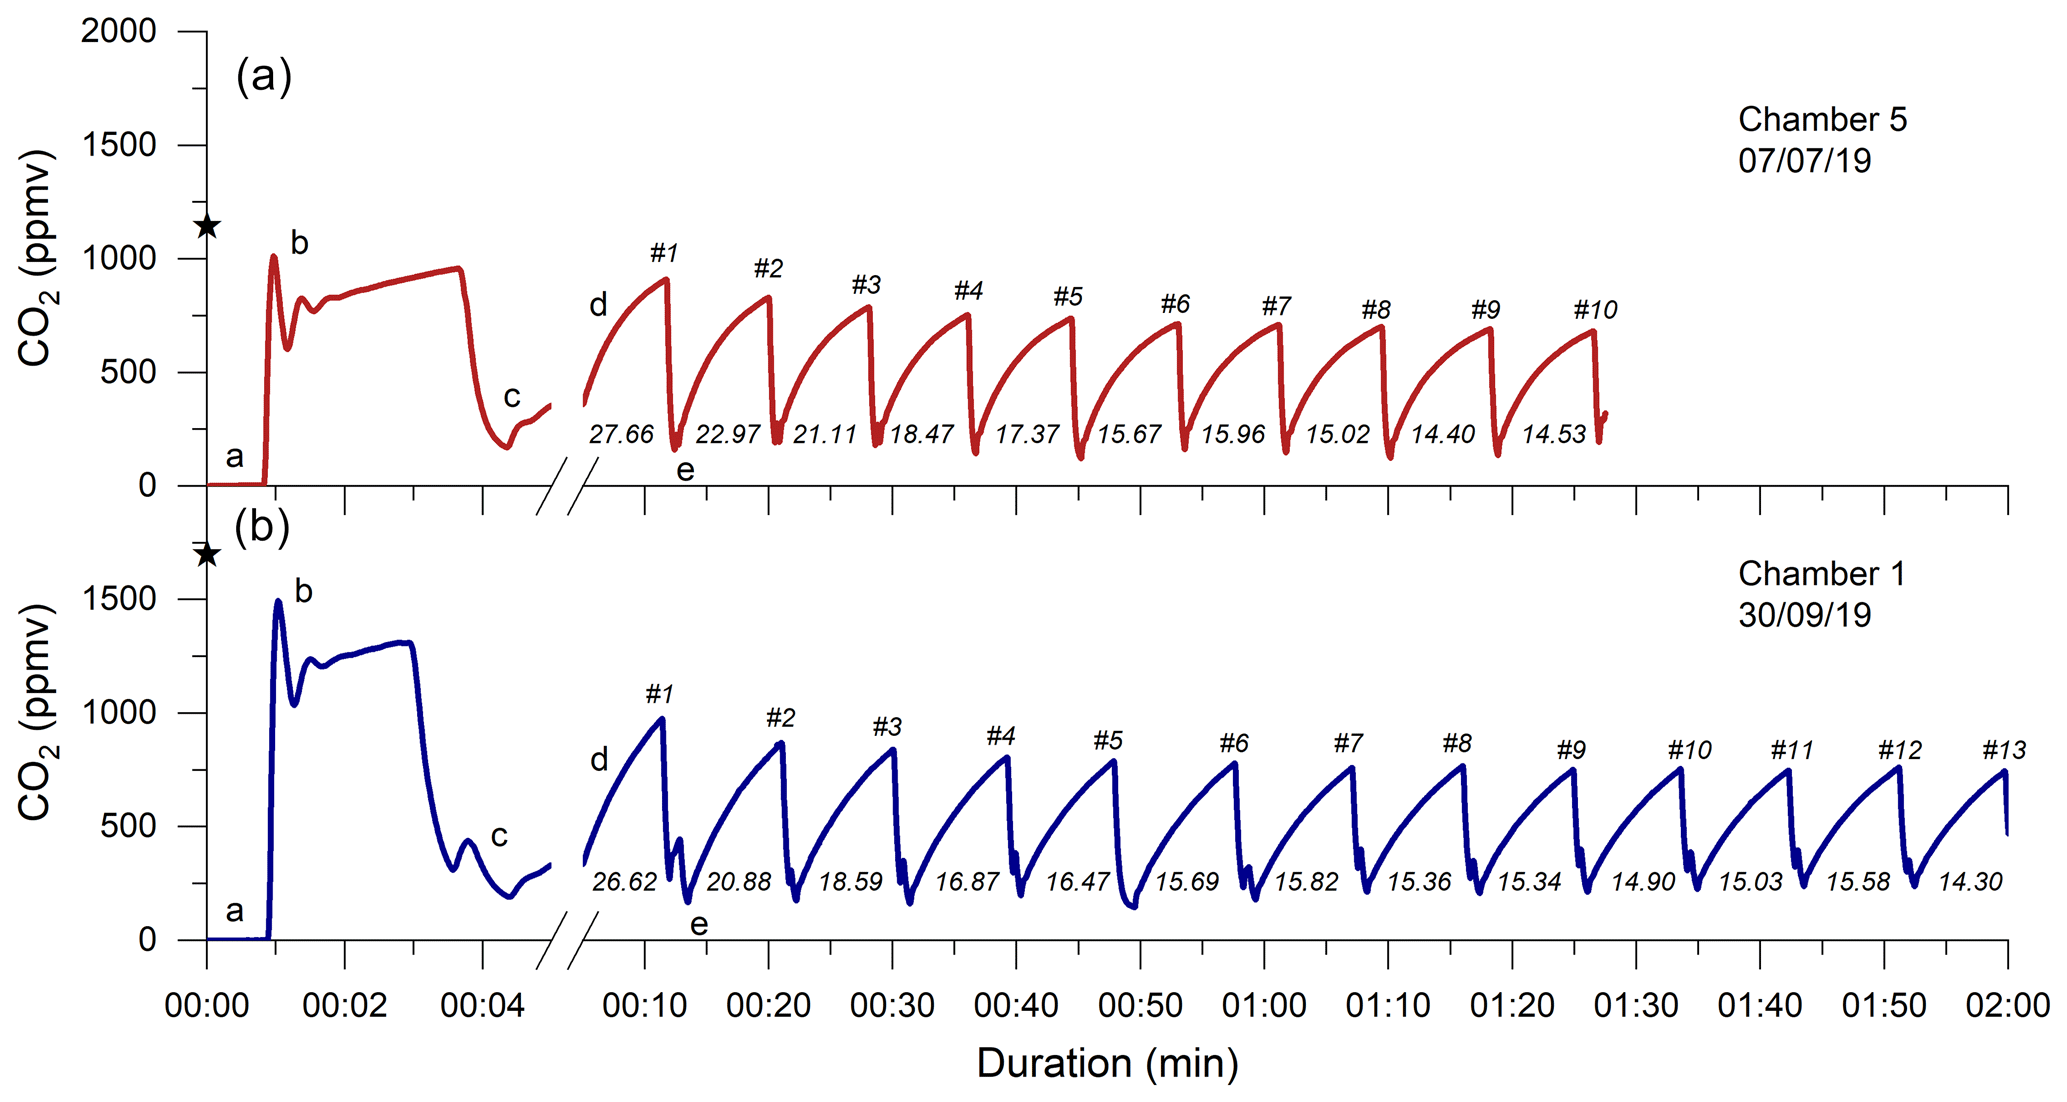
Figure 4Two examples of monitoring the CO2 concentration (ppmv) in a chamber during a flux measurement. Following connection, the CO2-free air of the sampling system (a) equilibrates with the partial pressure of CO2 in the chamber (b), which is representative of pCO2 Rock (denoted by the ⋆ symbols). After the CO2 in the chamber is removed to a near-atmospheric value (sometimes stepwise; c), the first accumulation (d) is monitored (with a change in x-axis scale), followed by further removal (e) and accumulation events (∼ 6 min; numbers denoted with a hash symbol (#)). The measured accumulation rates (q; µg C min−1 per chamber) are given for each repeat. The CO2 flux measurement of chamber 5 on 7 July 2019 (Brusquet catchment; a; red) consists of 10 repeats, and the measurement of chamber 1 on the 30 September 2019 (Moulin catchment; b; blue) consists of 13 repeats.
Following the determination of pCO2 Rock, a total of 37 CO2 flux measurements were conducted in the Brusquet catchment, of which 32 consisted of ≥ 8 repeats. In the Moulin catchment, 41 measurements were made, with 37 having ≥ 8 repeats. Every individual CO2 flux measurement showed an initial decline in the accumulation rates that approached a constant value of peak CO2 concentration (Fig. 4). Considering the repeats 6–8, averages of the CO2 accumulation rates varied between chambers and over time at each single chamber, with the occurrence of the lowest accumulation rates in winter and highest in summer. On four visits, a chamber was measured twice a day, and the observed CO2 release was higher in the afternoon than in the morning, coinciding with an increase in the chamber temperature. Overall, the observed CO2 accumulation rates (averages of q6 to q8) were on average 15.2 ± 11.7 µg C min−1 (n = 32) and 11.5 ± 8.0 µg C min−1 (n = 37) in the Brusquet catchment and in the Moulin catchment, respectively. The associated values of the fitting parameter λ (Eq. 2) were on average 0.179 ± 0.076 min−1 (n = 32) and 0.140 ± 0.061 min−1 (n = 37) in the Brusquet catchment and in the Moulin catchment, respectively.
Table 4Overview of the chamber-specific sampling ratio (SR; Eq. 6), which compares the estimated volumes of CO2 sampled in the Brusquet catchment and in the Moulin catchment with the volumes recovered in the laboratory from zeolite sieves.
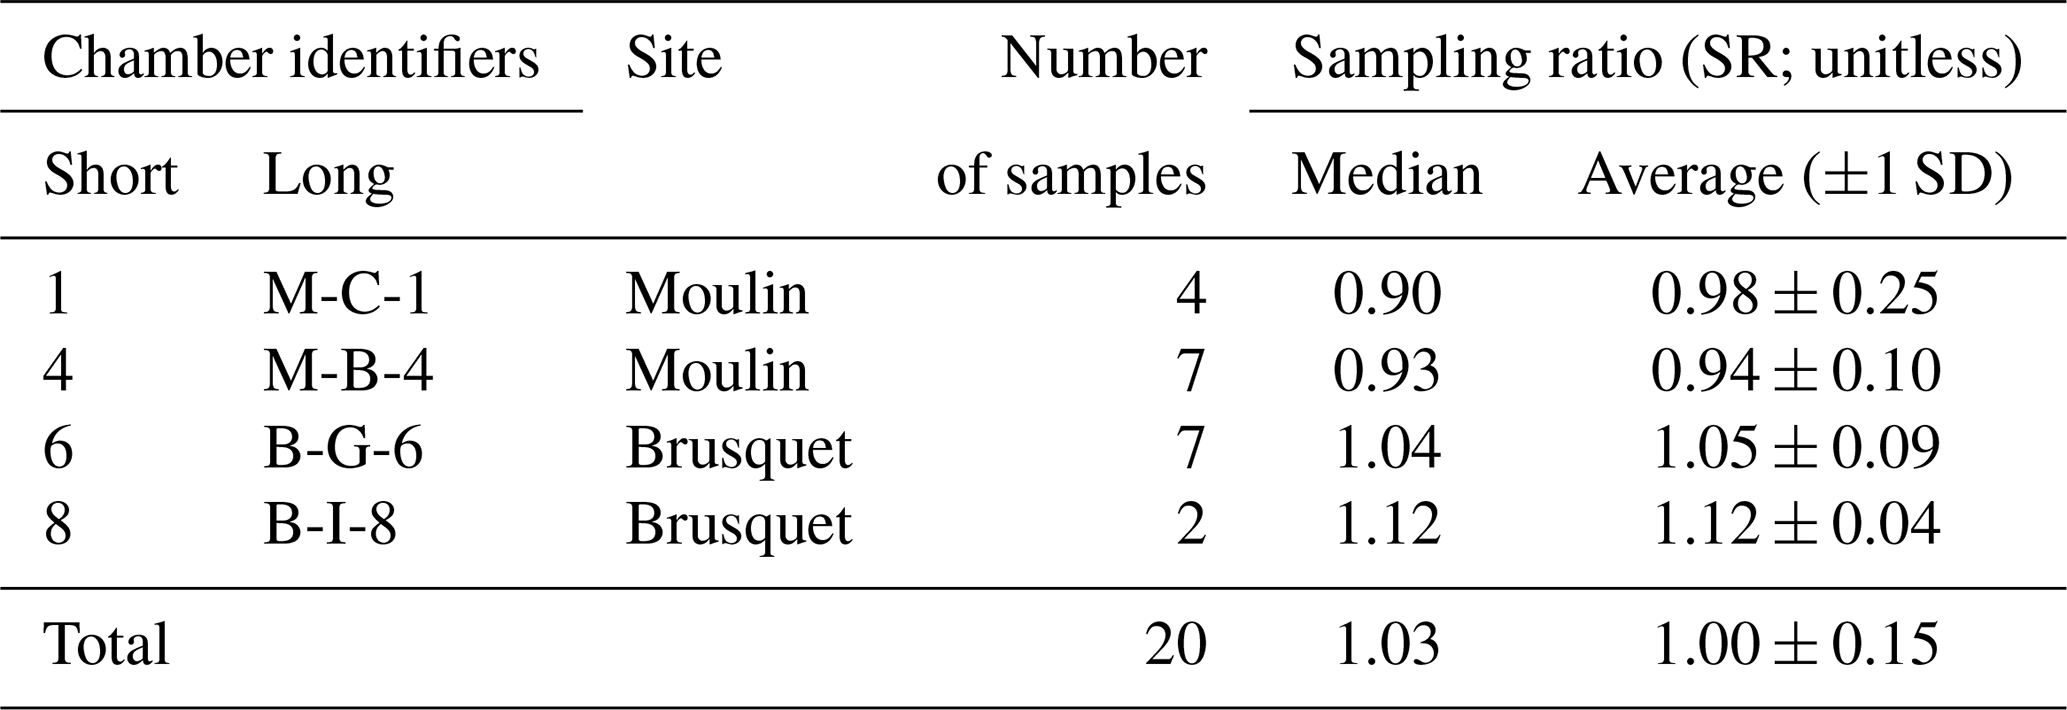
At each study site, CO2 was sampled from two chambers. Following recovery from the zeolite sieves in the laboratory, the sampling ratio (SR; Eq. 6) was quantified with an overall average of 1.00 ± 0.15 (Table 4).
3.3 pO2 measurements
The total number of usable pO2 Chamber measurements was limited to 15. The difference in pO2 between the chambers and the atmosphere (pO2 Chamber − pO2 Atm.) varied over time, ranging from zero within uncertainty (0.18 ± 0.36 %, , and ± 95 % confidence interval, CI) to −1.50 ± 0.30 % (), with the lowest pO2 Chamber values in summer and higher values (lower gradient) in winter at both sites (Fig. 12a).
Carbon dioxide release during oxidative weathering of sedimentary rocks exposed in steep mountain areas has been shown to vary with changes in temperature, precipitation, and local topography (Soulet et al., 2021; Roylands et al., 2022). Furthermore, previous studies on weathering profiles (Bolton et al., 2006; Petsch, 2014) and on the chemical composition of rivers (Calmels et al., 2007; Bufe et al., 2021; Hilton et al., 2021) indicated that geomorphological and hydrological factors are important controls on the release of CO2 and the consumption of O2 during oxidative weathering. The fluxes should also depend on the pore space characteristics of the weathering zone, such as porosity and tortuosity (Bolton et al., 2006; Brantley et al., 2013; Gu et al., 2020a, b; Soulet et al., 2021). However, we lack direct observations of how the chemical and physical properties of the weathering zone affect the in situ fluxes of CO2 and O2. In addition, only with information on the contributing rock volume to a measured rock-derived flux can we upscale and quantify CO2 and O2 fluxes from the measurement site to the landscape scale.
In the following discussion, we first propose a new approach of interpreting in situ CO2 flux measurements (Sect. 4.1.1) that allows us to assess the diffusion of CO2 and O2 in the shallow critical zone (Sect. 4.1.2). This can be used to quantify the rock volume contributing to the measured fluxes (data flow diagram in Appendix B) (Sect. 4.2). We then examine the implications of these new insights for quantifying the rock-derived CO2 release (Sect. 4.3), and then determine the coinciding O2 consumption (Appendix B) to investigate an overall redox budget of oxidative weathering in an erosive environment (Sect. 4.4).
4.1 Probing the gas exchange of the shallow critical zone
4.1.1 Explaining the patterns of CO2 accumulation during a single flux measurement
To explain the initial decline in the CO2 accumulation rates during a flux measurement that stabilizes over time (Fig. 4), we consider the known volume of a drilled chamber and distinguish it from the unknown volume of rock pore space around it. After arriving at a chamber to start a CO2 flux measurement, the initial scrubbing (before the first repeat q1) removes CO2 from the chamber (i.e., pCO2 Chamber) to a near-atmospheric level, but we assume that it does not remove the CO2 from the connected pore space to a similar pCO2 value. Repeated scrubbing and removal of CO2 after CO2 accumulations (Fig. 4) then acts to lower the CO2 concentration in the rock pore space connected to the chamber (pCO2 Rock). During this process, rock pores that are better connected to the chamber (i.e., having a shorter effective diffusion pathway) provide the initially stored CO2 earlier than rock pores that are less connected. In contrast, rock pores that are connected better to the atmosphere than to the chamber are assumed to contribute only to the atmosphere. Once the pool of “excess” CO2 in the pore space that is effectively connected to the chamber has been exhausted, subsequent CO2 accumulation rates reach a plateau and are assumed to represent the real-time production and diffusion of CO2 in the rock surrounding the chamber. This explanation requires that the air volume processed by the sampling system equals the chamber volume, whereas the gas exchange between chamber and connected rock pores happens solely via diffusion. This assumption is supported by the measured CO2 sampling ratio, SR (Eq. 6), with an average SR = 1.00 ± 0.15 (Table 4), showing that we effectively trap the chamber contents. This is similar to the recovery efficiency of ∼ 95 % of CO2 standards in the laboratory (Garnett et al., 2019).
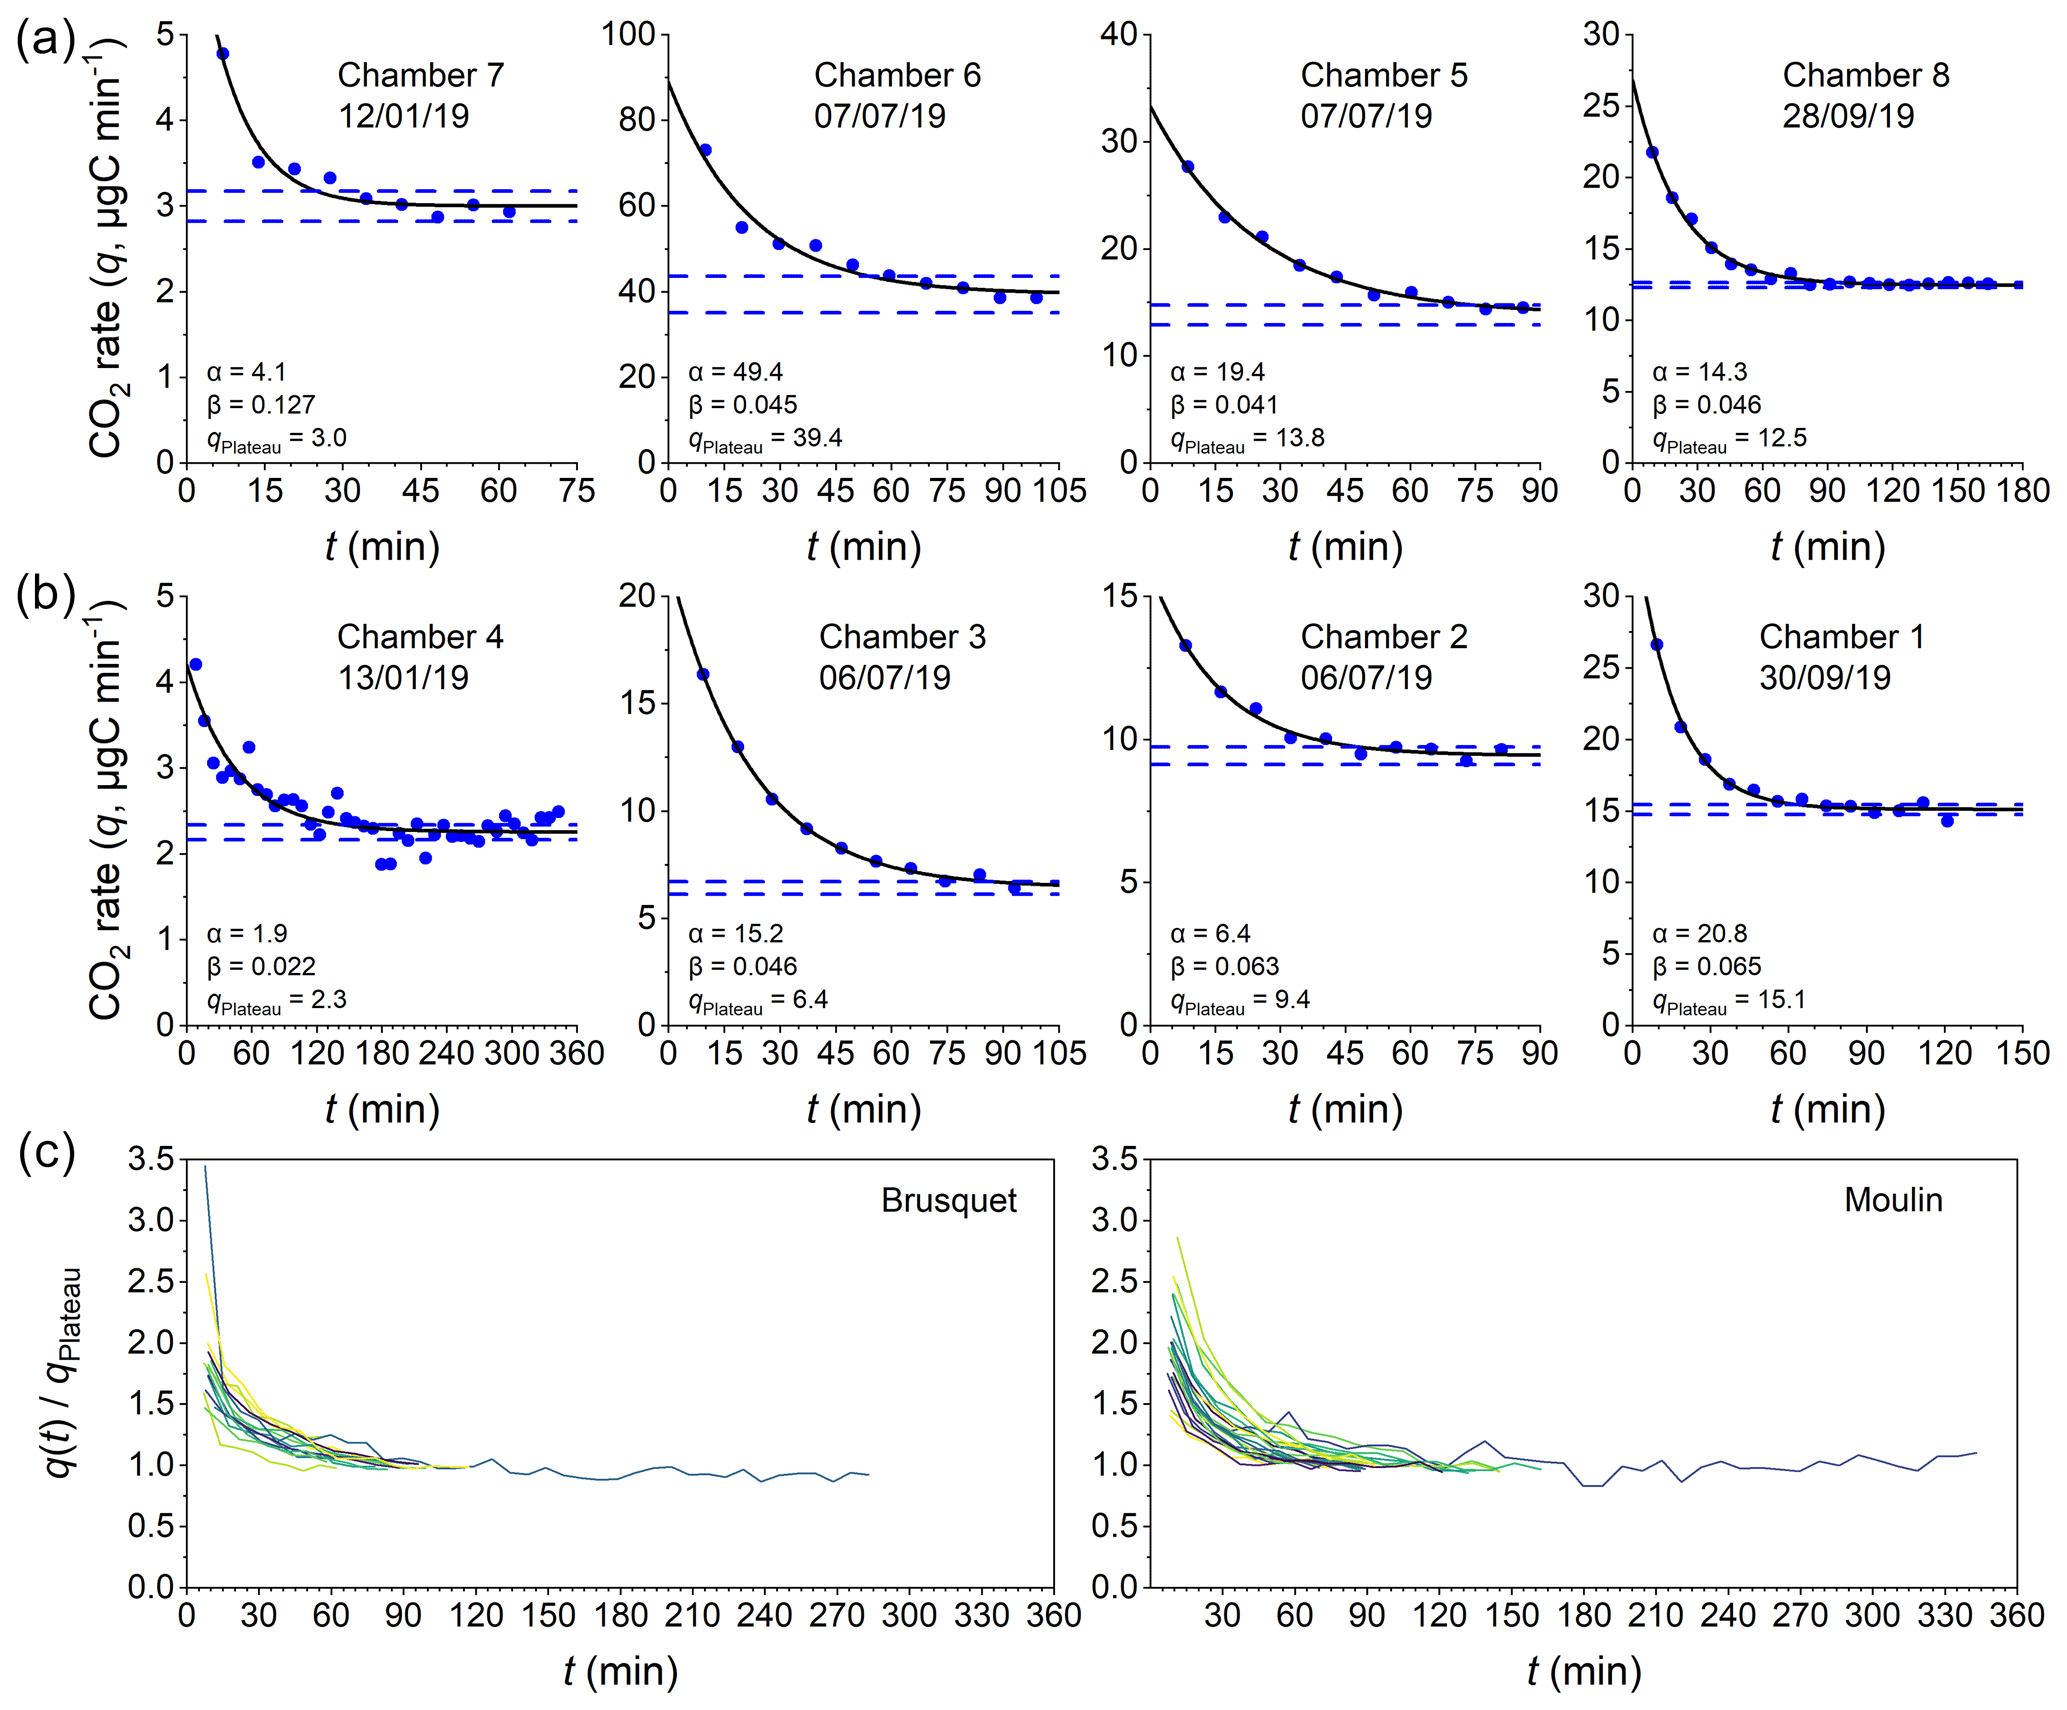
Figure 5Examples of CO2 flux measurements consisting of several repeated accumulation rate measurements. Measured accumulation rates (q; µg C min−1 per chamber; y axis) are shown alongside exponential fits (Eq. 9) describing their evolution over time (x axis) and alongside the 95 % confidence intervals of the modeled level at which the rates plateau (qPlateau) for chambers in the Brusquet catchment (a) and in the Moulin catchment (b). Dates and fitting parameters α (µg C min−1) and β (min−1) of the single flux measurements are denoted. For a comparison of the stabilizing evolution of different CO2 flux measurements, indicated by varying colors, q(t) is normalized to qPlateau for both study sites in separate plots (c).
To interpret the period in which we consider an excess of CO2 (i.e. an excess over the real-time production of CO2) to be diffusing into the chamber from a connected pore space, we introduce an exponential fitting model that describes the decrease in the CO2 accumulation rates (q) over time (Fig. 5):
where qPlateau is a constant value of the plateaued CO2 accumulation rate, the sum of α and qPlateau is the initial rate of accumulation (≈q1; mg C min−1) at the start of the flux measurement (t=0), β is the measurement-specific removal constant (min−1), and the term describes the purging of the initially stored pCO2 from the rock pore space connected to the chamber over time.
To ensure reliable results from fitting the exponential model, measurements are only considered if the last three of at least eight repeats (qn−2 to qn for n≥8) are “stabilized”, which we define as having a relative standard deviation of less than 5 %. To interpret the remaining CO2 flux measurements, chamber-specific averages of the removal constant β from stabilized measurements are used to extrapolate qPlateau for measurements that did not stabilize.
The outputs of this analysis provide a CO2 flux that represents the real-time production of CO2 (qPlateau), while quantifying the scrubbing of CO2 stored initially in the connected volume of pore space around each chamber. This allows us to assess the diffusive movement of CO2 in the shallow weathering zone (Sect. 4.1.2) and to estimate the contributing rock volume (Sect. 4.2) (Appendix B).
4.1.2 Assessing the diffusivity of the shallow weathering zone
After a CO2 flux measurement, the chamber is resealed. The chamber interior and surrounding pore space will evolve to a steady state of the diffusive movement of CO2 along a concentration gradient between the surface of the rock outcrop and the atmosphere so that pCO2 Chamber = pCO2 Rock. Thus, this steady state of a closed chamber differs from the manipulated environment of a CO2 flux measurement (Fig. 4). The comparison of the two states can shed light on the gas movement and the physical properties of the rocks undergoing weathering. Here, we explore how the observed changes in pCO2 Rock and CO2 fluxes can be explained by a framework of diffusive processes in the shallow critical zone and assess the degree to which these are modulated by weather conditions.
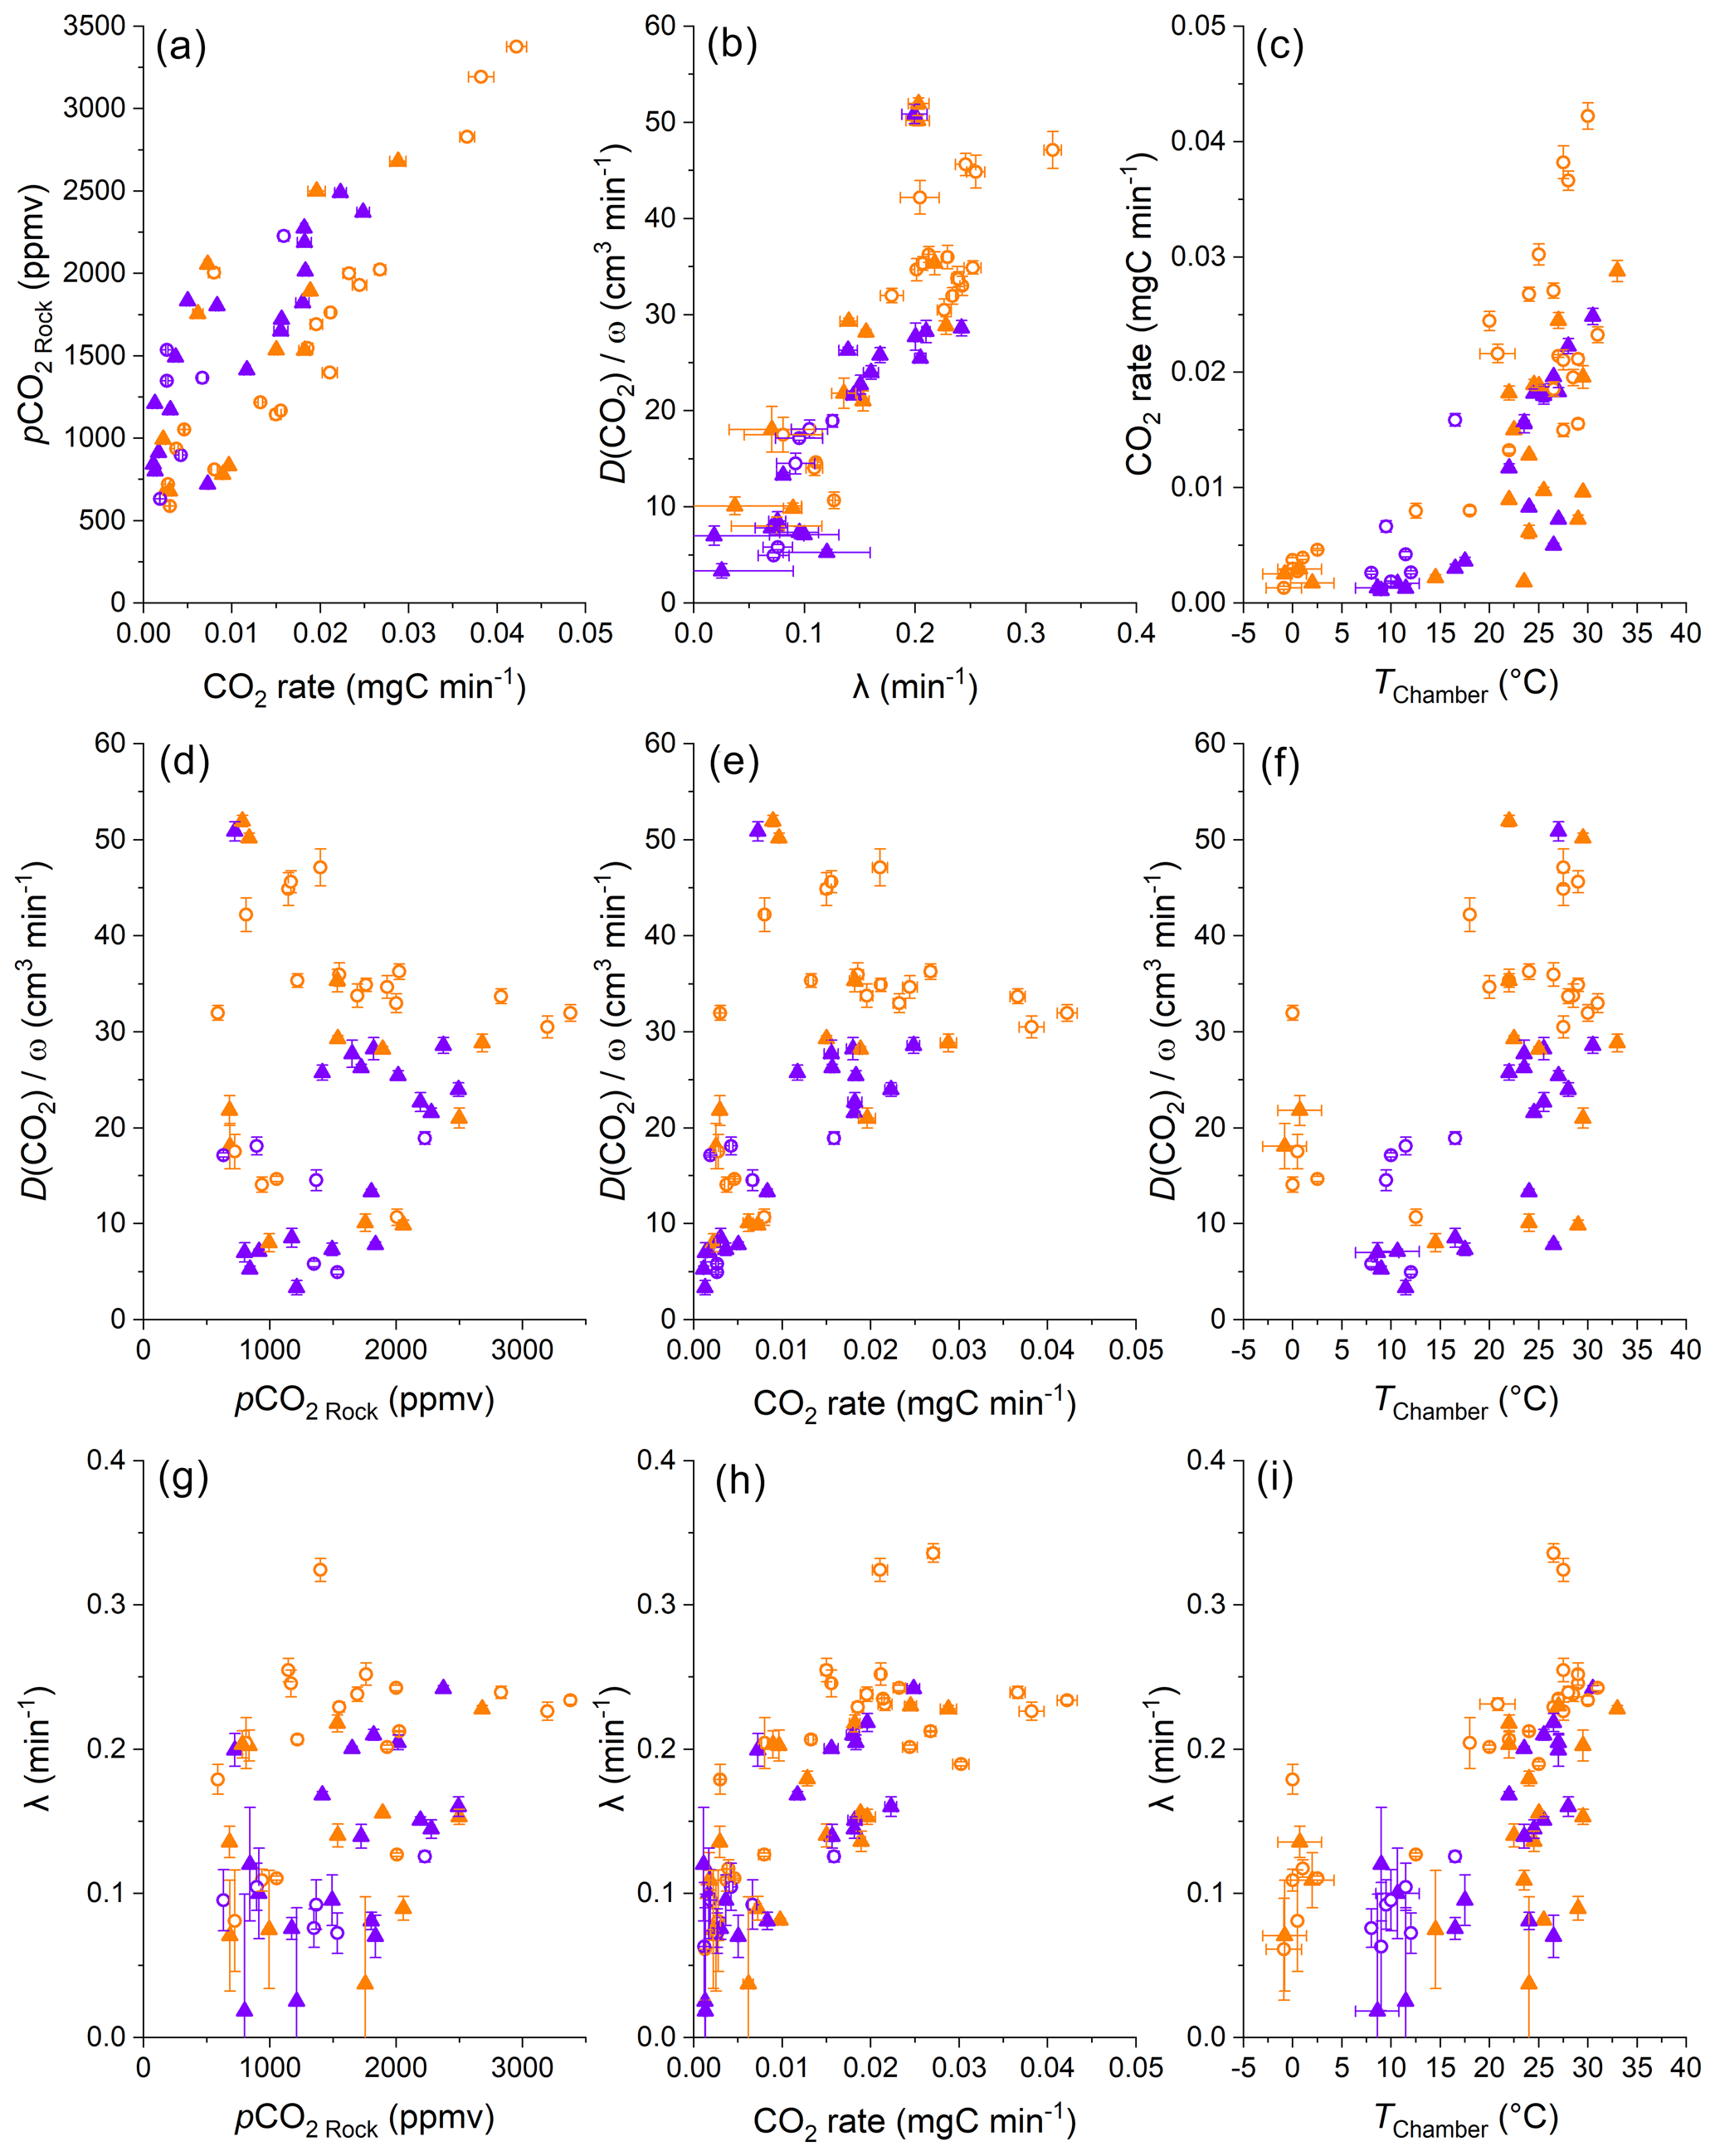
Figure 6Comparisons of the diffusivity measures λ and , CO2 accumulation rates, pCO2 Rock values, and chamber temperatures. Color coding differentiates the “dry” (orange) from “wet” samples (violet), using an approximate threshold of a cumulative precipitation of 5 mm over the last 3 d. The origin of samples is indicated with open circles for the Brusquet catchment and filled triangles for the Moulin catchment. For consistency, all parameters determined during CO2 flux measurements are calculated on the basis of the repeats 6–8 (error bars have 1 SD). Estimated temperatures are indicated by the accompanying error bars (RMSE).
According to Fick's law (Eq. 1), diffusion of gases in a porous medium is controlled by (i) the production and accumulation of CO2; (ii) the volume of space (rock pores and/or chamber) and length scale over which molecules travel towards the low-pCO2 reservoir; and (iii) the diffusivity of CO2 along their path. We find a co-variation in the pCO2 Rock and the CO2 fluxes that is similar for both sites, a relationship that can be explained by a linear regression model (Appendix C), with high pCO2 Rock values coinciding with high CO2 accumulation rates (Fig. 6a). This indicates that the contributing volume of rock pores and the diffusivity (the remaining variables from Fick's law) may be stable at both sites over the study period.
However, the ambient hydroclimate appears to modify the response of these variables. We consider measurements as being made during “wet” or “dry” periods, whereby wet measurements are those where the cumulative precipitation over the last 3 d was ≥ 5 mm. At a given pCO2 Rock value (describing the storage of CO2 in the shallow critical zone), dry conditions are associated with lower CO2 production when compared to wet conditions (Fig. 6a). With respect to the CO2 production, previous research has shown that rock-derived CO2 fluxes from drilled chambers are lower following rain events but recover subsequently over a few dry days (Soulet et al., 2021; Roylands et al., 2022). This latter observation has been linked to the degree of water saturation controlling the gas motion in the pore space and thus the supply of O2 for the oxidative weathering reactions, as well as to dissolution of weathering-derived carbon and the subsequent export of dissolved inorganic carbon (DIC) (Soulet et al., 2021; Roylands et al., 2022). It is important to note that a decrease in the production of CO2, associated with a lower O2 supply and/or with a greater uptake of carbon into the DIC, leads also to a proportional decrease in pCO2 Rock values (Roylands et al., 2022; Soulet et al., 2021). To understand the changes in the relation of pCO2 Rock and CO2 flux during wet and dry conditions, a change in the diffusivity of the contributing rock volume needs to be considered.
According to Fick's law, a lower diffusivity at a constant contributing volume of rock results in higher pCO2 Rock values. Thus, wet conditions may be associated with a decrease in the diffusivity of gases in the weathering rocks. This fits a simple model describing the effective diffusivity DRock (m2 s−1) of a given gas in porous media (such as rocks and soils) at a given temperature by
where DAir is the diffusion coefficient (m2 s−1) of the particular gas in air, τ is a dimensionless tortuosity factor, and φAir-filled is the air-filled porosity ( %) (Penman, 1940; Davidson and Trumbore, 1995). If φAir-filled decreases due to meteoric water filling the pore space, then precipitation events lower the effective diffusivity of CO2 within the critical zone (Sánchez-Cañete et al., 2018). An increase in the moisture in porous media also leads to more tortuous pathways (Millington, 1959; Davidson and Trumbore, 1995), which could further lower DRock under wet conditions. Analogously, rock moisture would also affect the diffusion of atmospheric O2 into the rock pore space, so that this framework can explain the observed decrease in the CO2 production following rain events (Roylands et al., 2022; Soulet et al., 2021).
To describe the diffusion of CO2 during the steady state of a closed chamber, we use Fick's law (Eq. 1) and the measured CO2 flux (qPlateau) and the concentration gradient of CO2 (pCO2 Rock − pCO2 Atm.) to define a measure (; cm3 min−1) that describes the effective diffusivity (cm2 min−1) of the CO2 flux towards the atmosphere over the unknown effective depth and area ω (cm1 cm−2):
The calculated values (based on repeats 6–8) are on average 27.5 ± 12.4 cm3 min−1 (n = 25) and 21.8 ± 13.2 cm3 min−1 (n = 30) for the Brusquet catchment and the Moulin catchment, respectively.
An alternative way to assess diffusivity is to use the constant λ (Eq. 2) describing the curvature of the repeated accumulations during a CO2 flux measurement (Fig. 4) (Pirk et al., 2016). Differences between λ and may be expected because λ is representative of short intervals (∼ 6 min observations), while represents a period of a few hours. We find a significant linear correlation of λ and for all samples irrespective of the study site (Fig. 6b) (Appendix D). The similarities for both metrics affirm that the accumulation rates determined during flux measurements are representative of the longer-term CO2 release towards the atmosphere.
The concordance of changes in λ and in suggests that the rock pore space is relatively homogenous in porosity and tortuosity, since the diffusive pathways of the steady state during a stabilized flux measurement differ from that of a closed chamber (Appendix E). Minor heterogeneities may explain some scatter in the correlation of λ and , as well as short-term changes in the effective rock space contributing CO2 to a chamber induced by the percolation of meteoric waters.
In more detail, we find some variability in the measures of diffusivity linked to the hydroclimatic conditions. Wet conditions coincide generally with somewhat lower values for a given λ (Fig. 6b) (Appendix D). Because the atmosphere is acting as the low-pCO2 reservoir during the steady state of a closed chamber, is likely to be more influenced by surficial processes than λ, which is affected by CO2 migration pathways towards the chamber (Appendix E). For example, lower values for a given λ may be the result of filling of surficial cracks with water, or micro-landslides, swelling of the surface rock material, and lateral expansion following rainfall events (Bechet et al., 2015), which may hinder the migration of gas. During drier conditions, cracks may significantly increase gas exchange between the rocks and the atmosphere (Weisbrod et al., 2009; Maier and Schack-Kirchner, 2014). In the study area, desiccation cracks typically appear at steep slopes during summer, when erosion by runoff is less prevailing than in spring and autumn, whereas a thick layer of loose detrital cover can be accumulated during winter due to frost weathering (Ariagno et al., 2022, 2023), when movement of surface materials is limited to solifluction (Bechet et al., 2016). Thus, the diffusivity of the rock surface presumably changes over time, with greater values during dry summer conditions (Fig. 6f and i).
The λ and values can also be explored as a function of temperature inside the chambers (Fig. 6f and i). In air, the diffusion coefficient of CO2 is strongly controlled by temperature, with an increase by a factor of ∼ 1.25 at 35 ∘C compared to 0 ∘C (Massman, 1998). However, we find a much larger change in λ and , with an average increase by a factor of ∼ 3.5 between 0 ∘C and 35 ∘C (Fig. 6f and i). This relation between temperature and diffusivity could be explained by a coinciding decrease in rock moisture. In the marls of the Laval catchment, neighboring the studied Moulin catchment, lower near-surface water contents were observed during dry summer periods, with values as low as ∼ 10 % contrasting to values of up to ∼ 25 % in winter (Mallet et al., 2020). However, the relation of rock moisture and temperature is not straightforward (Soulet et al., 2021), with precipitation being an important control on surface rock moisture. In addition, we observe high and constant relative air humidity in the chambers over the year (Fig. 3). Together, a complex hydrological control on DRock, which includes surface processes, may explain some part of the high apparent temperature sensitivity of λ and by modifying τ and φAir-filled (Eq. 10), alongside changes in DAir forced solely by temperature.
In summary, disentangling diffusive processes in the shallow weathering zone is complicated by drivers that can be interrelated and co-vary (Fig. 6). This is also commonly observed in soils (Hashimoto and Komatsu, 2006; Maier and Schack-Kirchner, 2014; Davidson and Trumbore, 1995; Tokunaga et al., 2016). Generally, hydrology and temperature are important controls on pCO2 Rock, CO2 flux, diffusivity, and potentially rock pore space, all of which contribute to the release of CO2 to the atmosphere. Interestingly, similar responses to changes in environmental controls are observed at both study sites, and they appear to have similar diffusivity measures. However, the CO2 fluxes differ significantly between sites, with greater CO2 efflux at a given rock temperature from the chambers in the Brusquet catchment compared to the Moulin catchment (Fig. 6c), which may be explained by a difference in the source of CO2 or by differences in the contributing rock volume (Sect. 4.2).
4.2 Assessing the contributing rock pore volume
4.2.1 Quantification of the contributing rock pore volume
Chamber-based measurements of CO2 flux provide insight to the variability in fluxes over time and the environmental controls that force them (e.g., Bond-Lamberty and Thomson, 2010; Oertel et al., 2016; Pirk et al., 2016; Roylands et al., 2022; Soulet et al., 2021). However, the volume of material that contributes to the measured CO2 fluxes is rarely quantified. If this could be determined, the production of CO2 can be considered in terms of the mass of reactants, allowing comparisons between different field sites and laboratory experiments (e.g., Angert et al., 2015; Kalks et al., 2021; Lefèvre et al., 2014; Soucémarianadin et al., 2018; Tokunaga et al., 2016). In the case of the internal rock chambers used here, the quantification of the contributing rock volume would allow us to upscale the fluxes over an outcrop surface area. To do this, we use the exponential fitting model (Eq. 9) that describes the transition between a closed chamber and the manipulated state during flux measurements (Figs. 4 and 5) as a way to quantify the carbon mass derived from the rock pore space. By doing so, we can use the pCO2 Rock to calculate the corresponding air volume in the rock volume contributing CO2. The volume of rock pores, in turn, is used to estimate the corresponding rock volume and its geometry and, ultimately, the rock mass to determine an absolute weathering flux.
First the mass of CO2 purged during a flux measurement from the rock pore space around the chamber is described as an excess of CO2 (CO2 excess; mg C):
with α and β being the fitting parameters from the same fitting procedure used to calculate qPlateau (Eq. 9) over time, starting at the beginning of the flux measurement (t=0) and ending when the integrated term approaches zero (tPlateau, when q(t) equals qPlateau). The air volume of the rock pores can be estimated from CO2 Excess by using the pCO2 Rock at the start of the flux measurement (when pCO2 Rock equals pCO2 Chamber). This air volume (VRock pores; cm3) is calculated by modifying Eq. (3):
Table 5Chamber-specific overview of CO2 excess, VRock pores, and CO2 accumulation rate (qPlateau), including catchment-specific summaries. Uncertainties in the minima and maxima are representing the 95 % CI, whereas averages are reported with 1 SD.
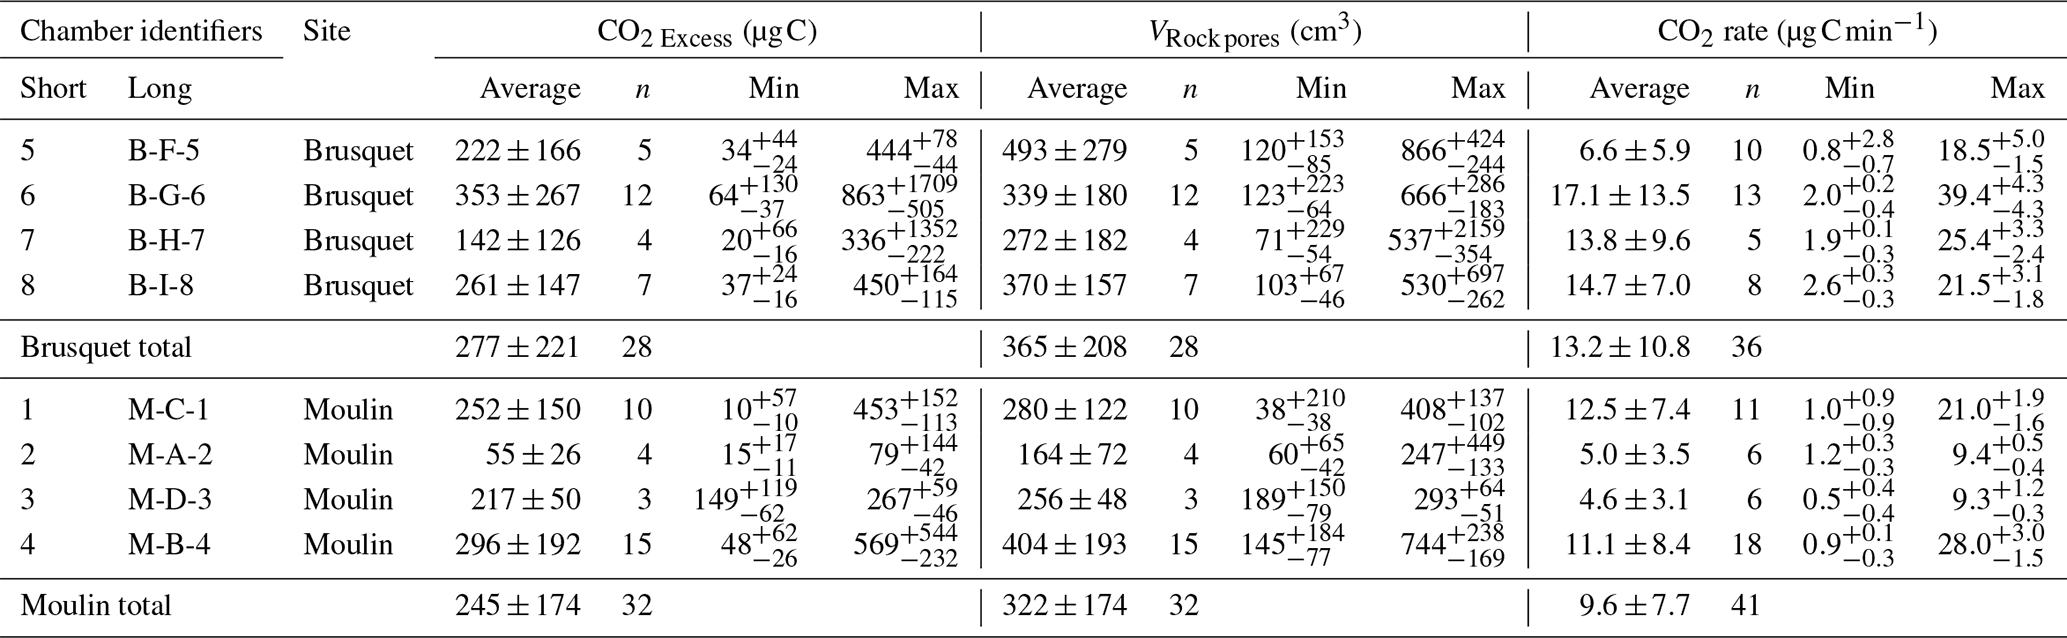
Overall, the calculated values of VRock pores are similar for both study sites, with 365 ± 208 cm3 (± 1 SD of the average of measurement-specific values) for the chambers in the Brusquet catchment and 322 ± 174 cm3 for the chambers in the Moulin catchment (Fig. 7) (Table 5). However, significant variation is observed over time for each chamber (Fig. 8), while each measurement-specific value of VRock pores is associated with a high uncertainty (Table 5). These uncertainties are not normally distributed, with an average upper relative uncertainty of 125.8 ± 140.1 % (average of 95 % CI ± 1 SD) and an average lower relative uncertainty of 47.8 ± 42.3 % for all samples.
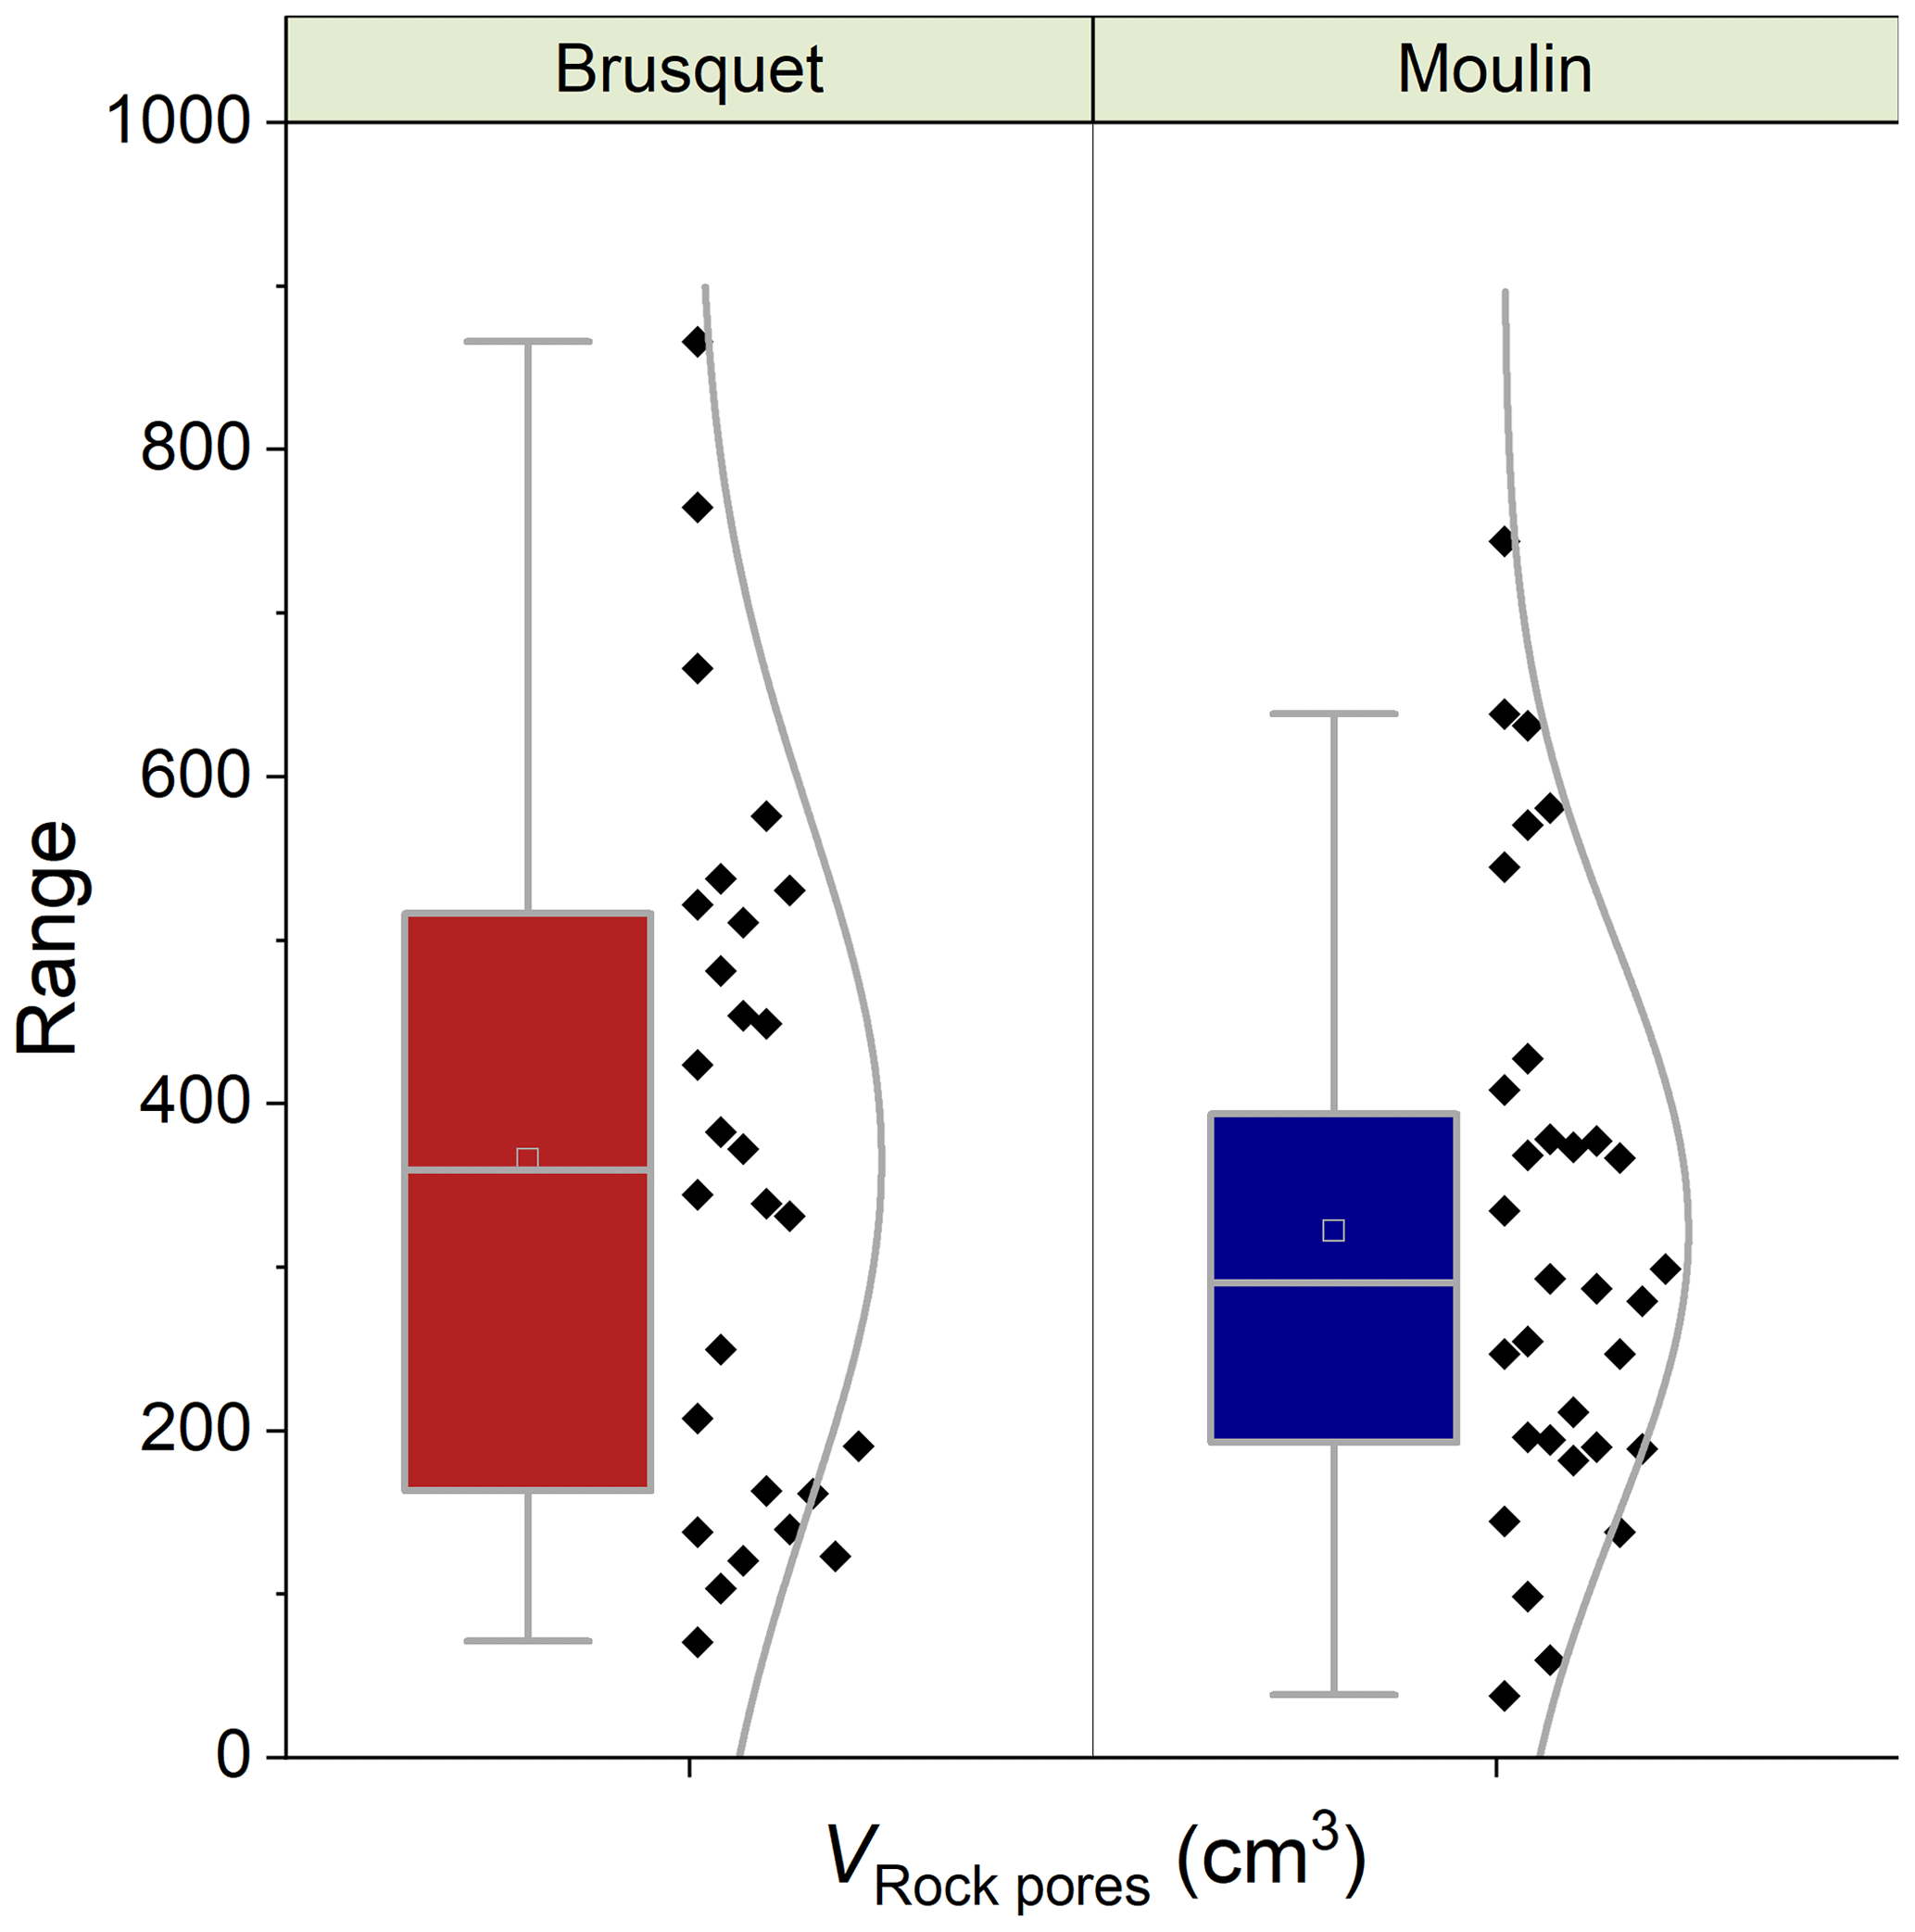
Figure 7Catchment-specific box plots and distribution curves summarizing the volume of rock pores (VRock pores) connected to each chamber determined during CO2 flux measurements, including four chambers at each site. Boxes indicate the 25 %–75 % range alongside the 1.5 interquartile ranges with the mean (open square) and median (line). Colors indicate the origin (Brusquet is in red; Moulin is in blue).
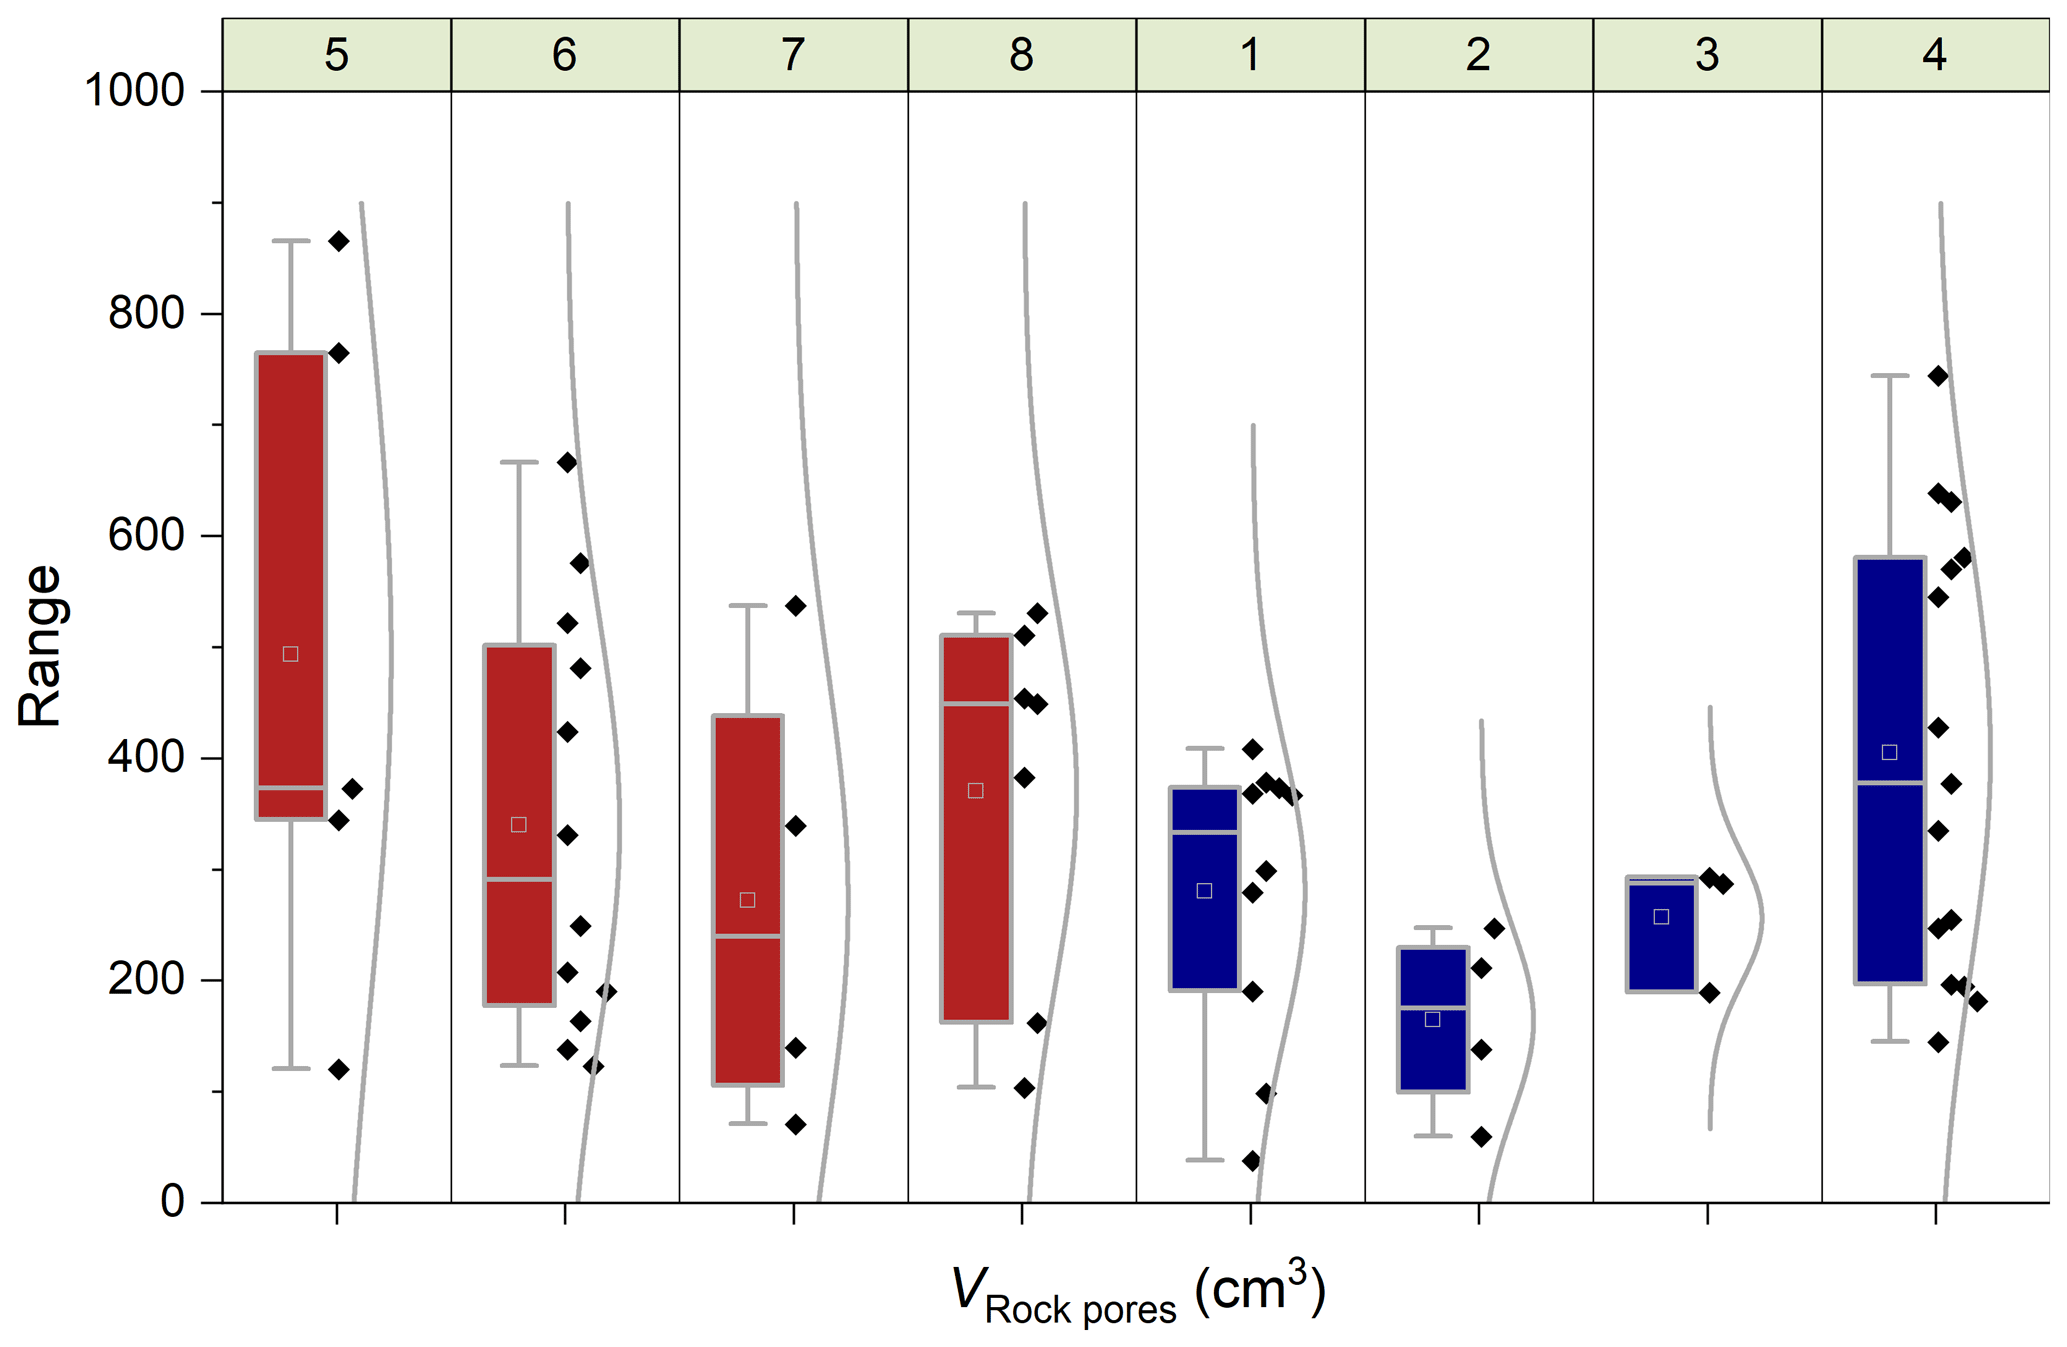
Figure 8Chamber-specific box plots and distribution curves summarizing the volume of rock pores (VRock pores) connected to each chamber determined during CO2 flux measurements. Boxes indicate the 25 %–75 % range alongside the 1.5 interquartile ranges with the mean (open square) and median (line). Panels at the top show the chamber identifiers (Table 1), and colors indicate the origin (Brusquet is in red at sites 5–8; Moulin is in blue at sites 1–4).
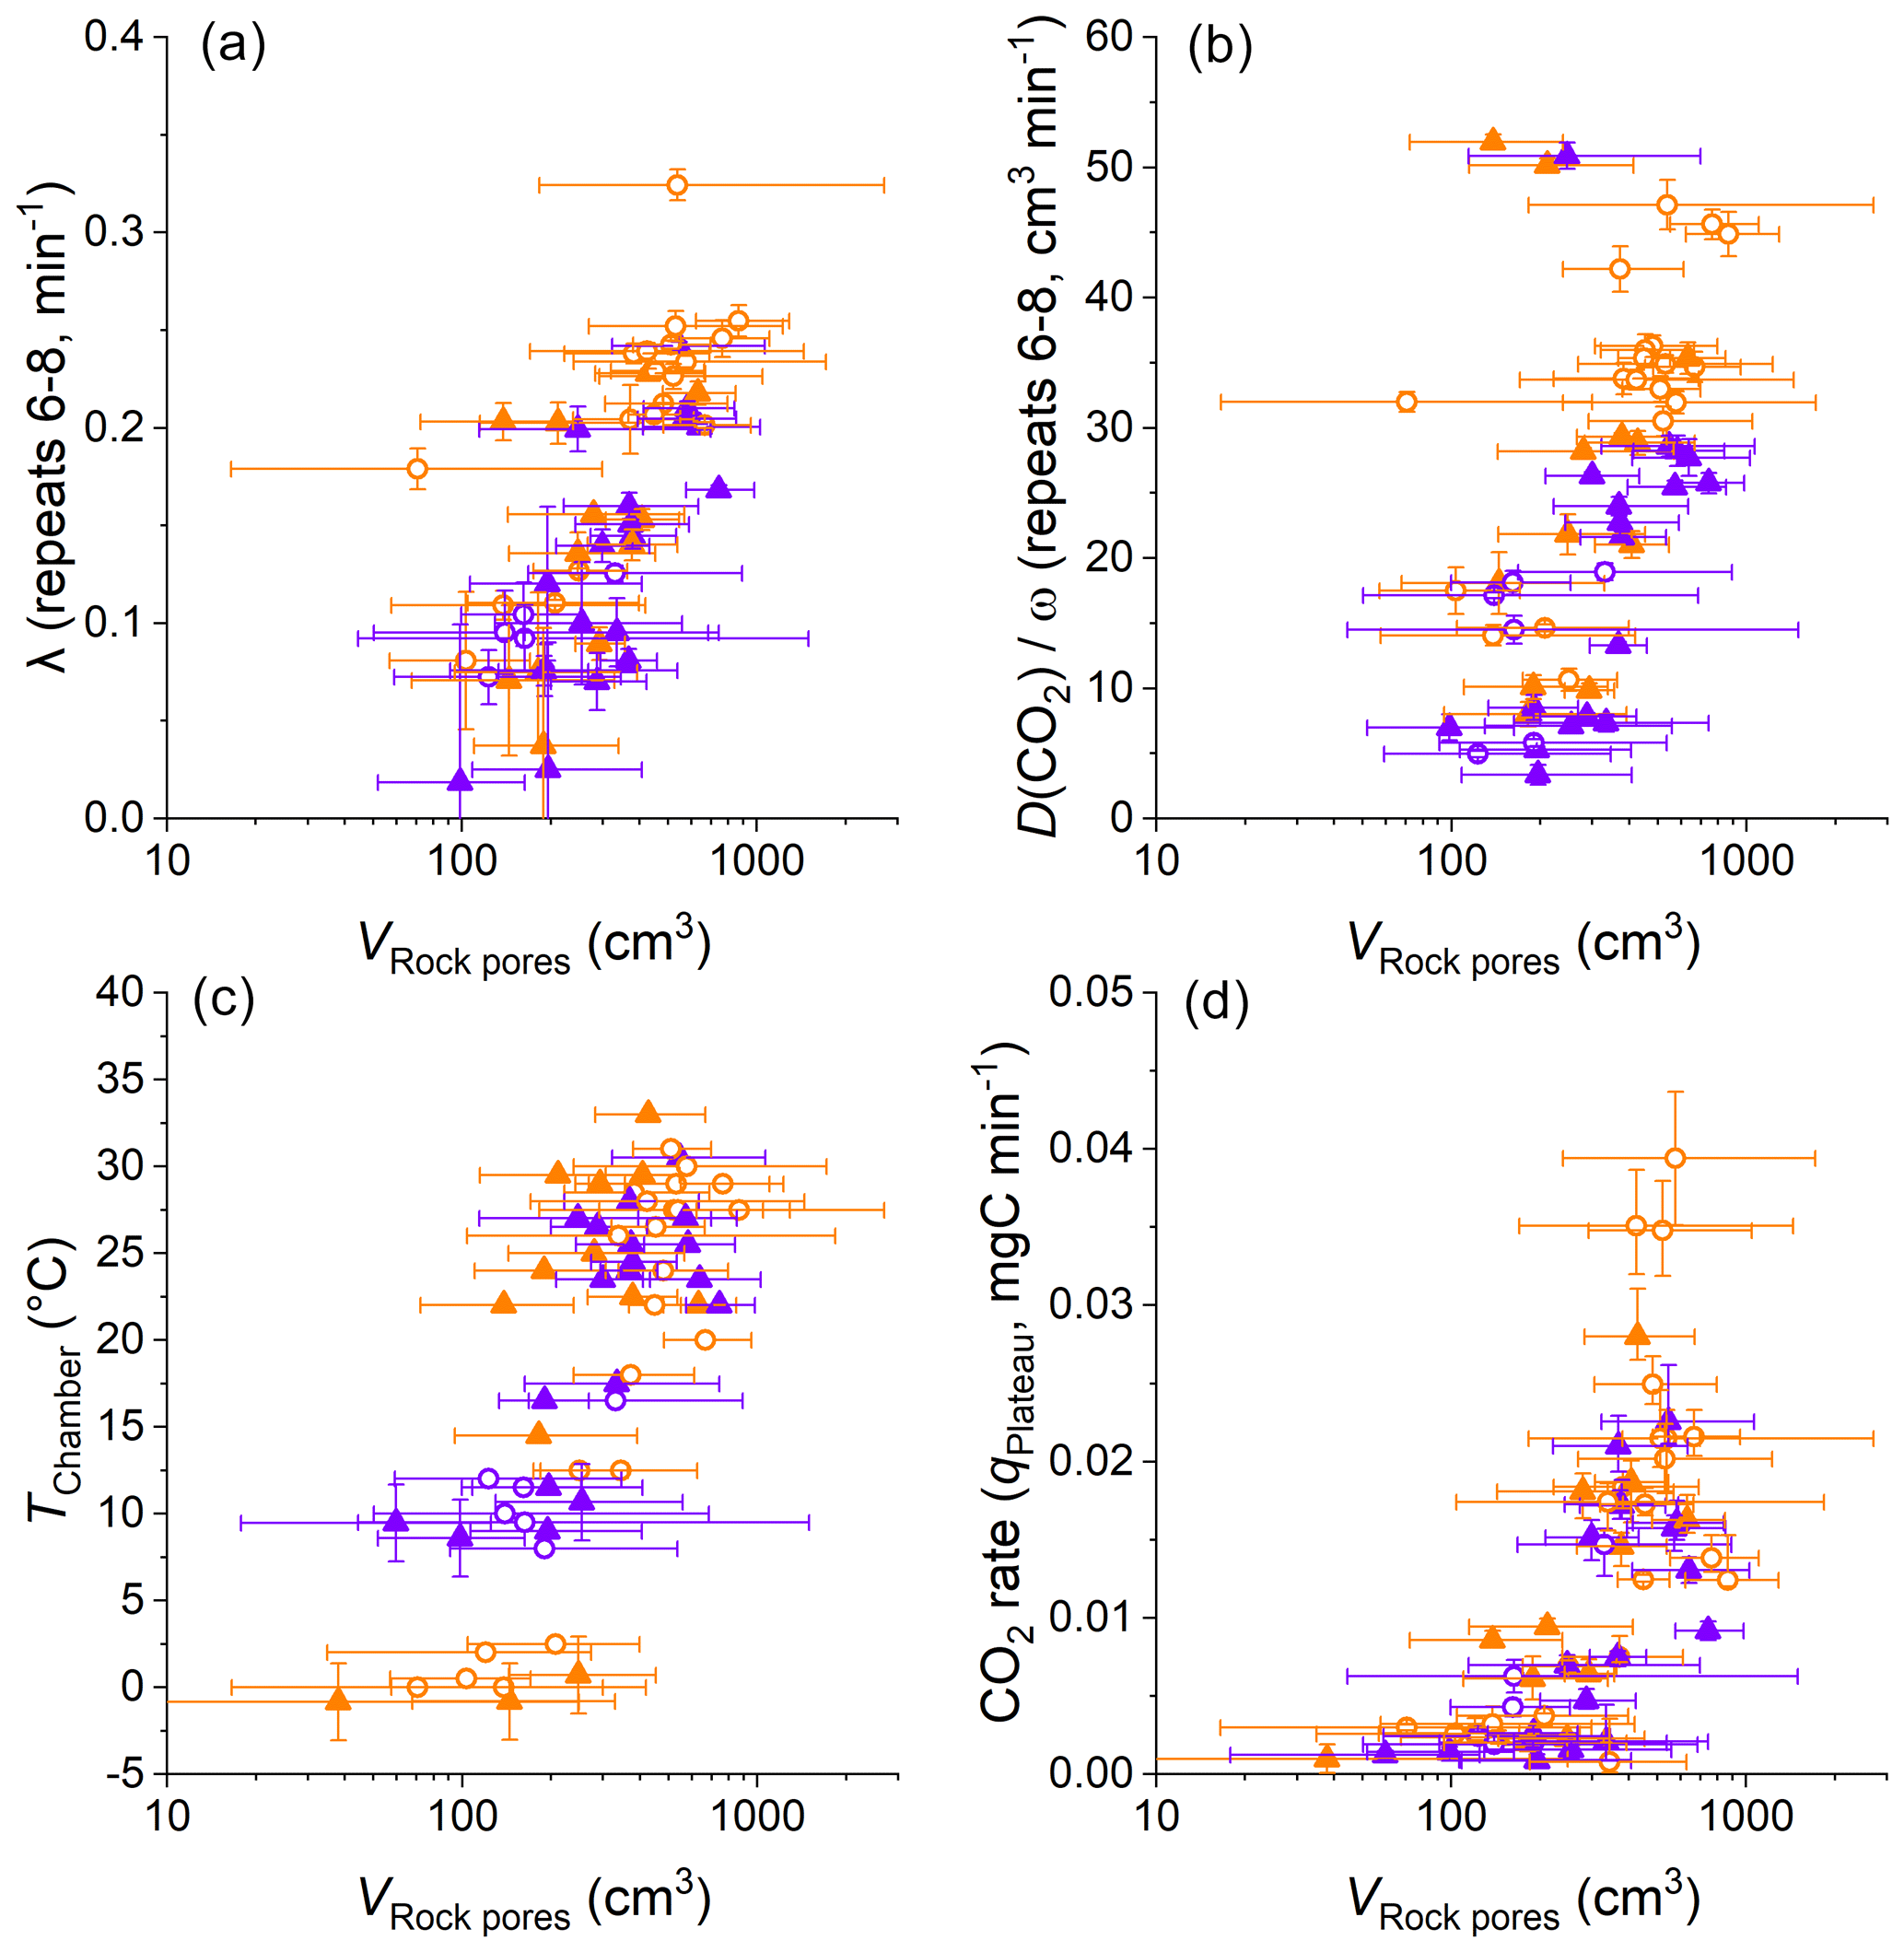
Figure 9Comparisons of VRock pores, the diffusivity measures λ and , CO2 accumulation rates, and chamber temperatures. Color coding differentiates dry (orange) from wet samples (violet) using an approximate threshold of a cumulative precipitation of 5 mm over the last 3 d. The origin of samples is indicated with open circles for the Brusquet catchment and filled triangles for the Moulin catchment. Reported values of λ and are based on the repeats 6–8 of a CO2 flux measurement (error bars show 1 SD), whereas the calculation of VRock pores (displayed on a logarithmic scale) and the CO2 accumulation rates is based on the fitting model (error bars show 95 % CI). Estimated temperatures are indicated by the accompanying error bars (RMSE).
4.2.2 Environmental controls on the contributing rock pore volume
The variation in VRock pores may be linked to changes in the diffusive processes and weather conditions (Fig. 9). Overall, higher values of λ coincide with greater values of VRock pores (all samples, with R2 of a linear regression = 0.52, p ≤ 0.001, n = 55) (Fig. 9a). This is also true for the relation between VRock pores and (Fig. 9b), which itself is positively correlated to λ (Sect. 4.1). These relationships are similar for both sites and for wet and dry conditions. The latter observation indicates that rock moisture impacts the diffusivity of CO2 and VRock pores in equal measure. This, in turn, is in line with Fick's law, with the extent of the rock pore space that contributes CO2 to a chamber depending on the potential of gas to move within the rocks undergoing weathering. In this process, the degree to which changes in the diffusivity impact the contributing rock volume is driven by the effective change in length of the diffusion paths. Here, a change in λ from 0.1 to 0.2 min−1 is associated with a change in VRock pores by a factor of ∼ 3.5, and this roughly fits the modification of the geometry of a cylinder-shaped rock pore space around a drilled chamber when doubling its effective radius.
Furthermore, differences in VRock pores coincide with changes in temperature (all samples, with R2 of a linear regression = 0.47, p ≤ 0.001, and n = 60) (Fig. 9c). This coincidence is important to consider when assessing the control of temperature on the CO2 production from chemical weathering (i.e., weathering kinetics) and is discussed later (Sect. 4.3). The coincidence of positive correlations of temperature and CO2 production and of temperature and the extent of VRock pores (indirectly connected by ) also suggests that changes in CO2 flux are associated with changes in the contributing rock pore space (all samples, with R2 of a linear regression = 0.42, p ≤ 0.001, and n = 60) (Fig. 9d).
4.2.3 Upscaling chamber-based CO2 fluxes
The determined VRock pores can be combined with the porosity of the rocks undergoing weathering to quantify the volume of rock contributing CO2 to flux measurement (VRock; cm3):
This assumes that the majority of rock pores are well connected (total porosity ≈ connected porosity), with no significant water filling of the pore space. An effective air-filled porosity of 25 %, within a 95 % confidence interval of 15 %–35 %, is assumed, based on porosity measurements (Garel et al., 2012; Mallet et al., 2020) and water saturation measurements (Mallet et al., 2020) from the Draix-Bléone Observatory.
On average, CO2 fluxes from chambers in the Brusquet catchment derive from a rock volume of cm3 (within a 95 % confidence interval, based on propagating the uncertainties in the fitting procedure and of the assigned porosity), which is similar to the release of CO2 in the Moulin catchment from rock volumes of cm3. If we visualize these volumes as a cylindrical rock layer around the drilled chambers (Fig. 2e shows the sampling distance indicated by arrows pointing towards the chamber), then its thickness would be ∼ cm. However, the geometry of this space is unknown. Instead, considering that porosities are highest at the surface of rock outcrops in the study area (Mathys and Klotz, 2008; Lofi et al., 2012; Maquaire et al., 2002; Travelletti et al., 2012; Mallet et al., 2020), where unloading and climatic controls on physical weathering act most efficiently (Bechet et al., 2016; Mathys and Klotz, 2008; Bechet et al., 2015; Cras et al., 2007; Ariagno et al., 2022), the shape of the porous and permeable rock that contributes to gas exchange is likely to be more like a cone around a chamber with a radius that declines over depth.
The knowledge of the probed layer thickness can be combined with the inner surface area of the chambers to give the spatial parameter ω (Eq. 11) and to calculate the effective diffusivity of CO2 in the air-filled rock pores zone. Overall, we find values of ranging between ∼ 0.02 and ∼ 0.34 cm2 min−1 (considering the range of at both study sites; Sect. 4.1). Interestingly, these values are similar to diffusion coefficients that were determined by laboratory experiments (despite potential differences in rock texture and pore space geometry), with O2 as the tracer gas at 22.5 ∘C, which correspond to values of 0.34 and 0.43 cm2 min−1 for limestones with porosities of 40 % and 46 % and of 0.04 and 0.17 cm2 min−1 for mudstones with porosities of 33 % and 38 %, respectively (Peng et al., 2012).
The rock volume around a chamber can be “unwrapped” to assess a surface area on an outcrop that would have the same contributing rock pore volume (SRock; cm2). This can be done if the weathering depth zRock (cm) over that CO2 is thought to be produced by oxidative weathering is considered, as follows:
The zRock value can be estimated from the morphology of bare surfaces in the study area, based on the assumption that oxidative weathering of sedimentary rocks occurs roughly at the same depths where physical properties are altered (Gu et al., 2020a, b; Lebedeva and Brantley, 2020; Brantley et al., 2013). Based on previous research in a neighboring catchment (Maquaire et al., 2002; Mathys and Klotz, 2008; Oostwoud Wijdenes and Ergenzinger, 1998; Rovéra and Robert, 2006), physical alteration mostly occurs to depths of ∼ cm at slopes similar to our study sites (corresponding to the upper two layers comprised of fine regolith overlain by loose detrital cover; Sect. 2.1). Accordingly, we estimate oxidative weathering (i.e., zRock) to extend to similar depths at both study sites.
The corresponding values calculated for SRock can be compared to the inner surface area of the chambers (Table 1). On average, SRock is smaller than the inner surface area of the drilled chambers by a factor of (confidence interval includes the considered range of the weathering depth and the uncertainty in the contributing rock volume). This means that CO2 fluxes from chambers drilled into rocks and normalized to the chamber inner surface area (Eq. 4) cannot be compared directly with topographic surface fluxes (e.g., from surface chambers), which are typically reported for soils (Oertel et al., 2016; Bond-Lamberty and Thomson, 2010). Instead, CO2 fluxes from a drilled chamber need to be corrected by considering the chamber-specific VRock and the weathering depth. The measured CO2 fluxes (Table 5) equate to a topographic surface efflux of ∼ 541 (ranging on average between 73 and 1108 ) in the Brusquet catchment and of ∼ 425 (between 43 and 873 ) in the Moulin catchment, which is roughly similar to the global mean emissions of CO2 from soils with different land cover (Oertel et al., 2016).
Carbon fluxes from oxidative weathering can be linked to a rock mass, allowing fluxes to be interpreted in terms of the overall kinetics of the oxidative weathering reactions. This is essential for theoretical carbon cycle modeling (Bolton et al., 2006; Bao et al., 2017). Following the calculation of VRock, the rock mass emitting CO2 (mRock; g) can be estimated by using an average estimate of the density of the rock grains surrounding the chambers (ρRock; g cm−3 = t m−3):
Considering a grain density of t m−3 (Lofi et al., 2012), we find that an average rock mass of and g produces the CO2 fluxes derived from chambers in the Brusquet catchment and in the Moulin catchment, respectively. To our knowledge, this allows, for the first time, an absolute report of weathering-derived CO2 fluxes that are measured in real time and in situ.
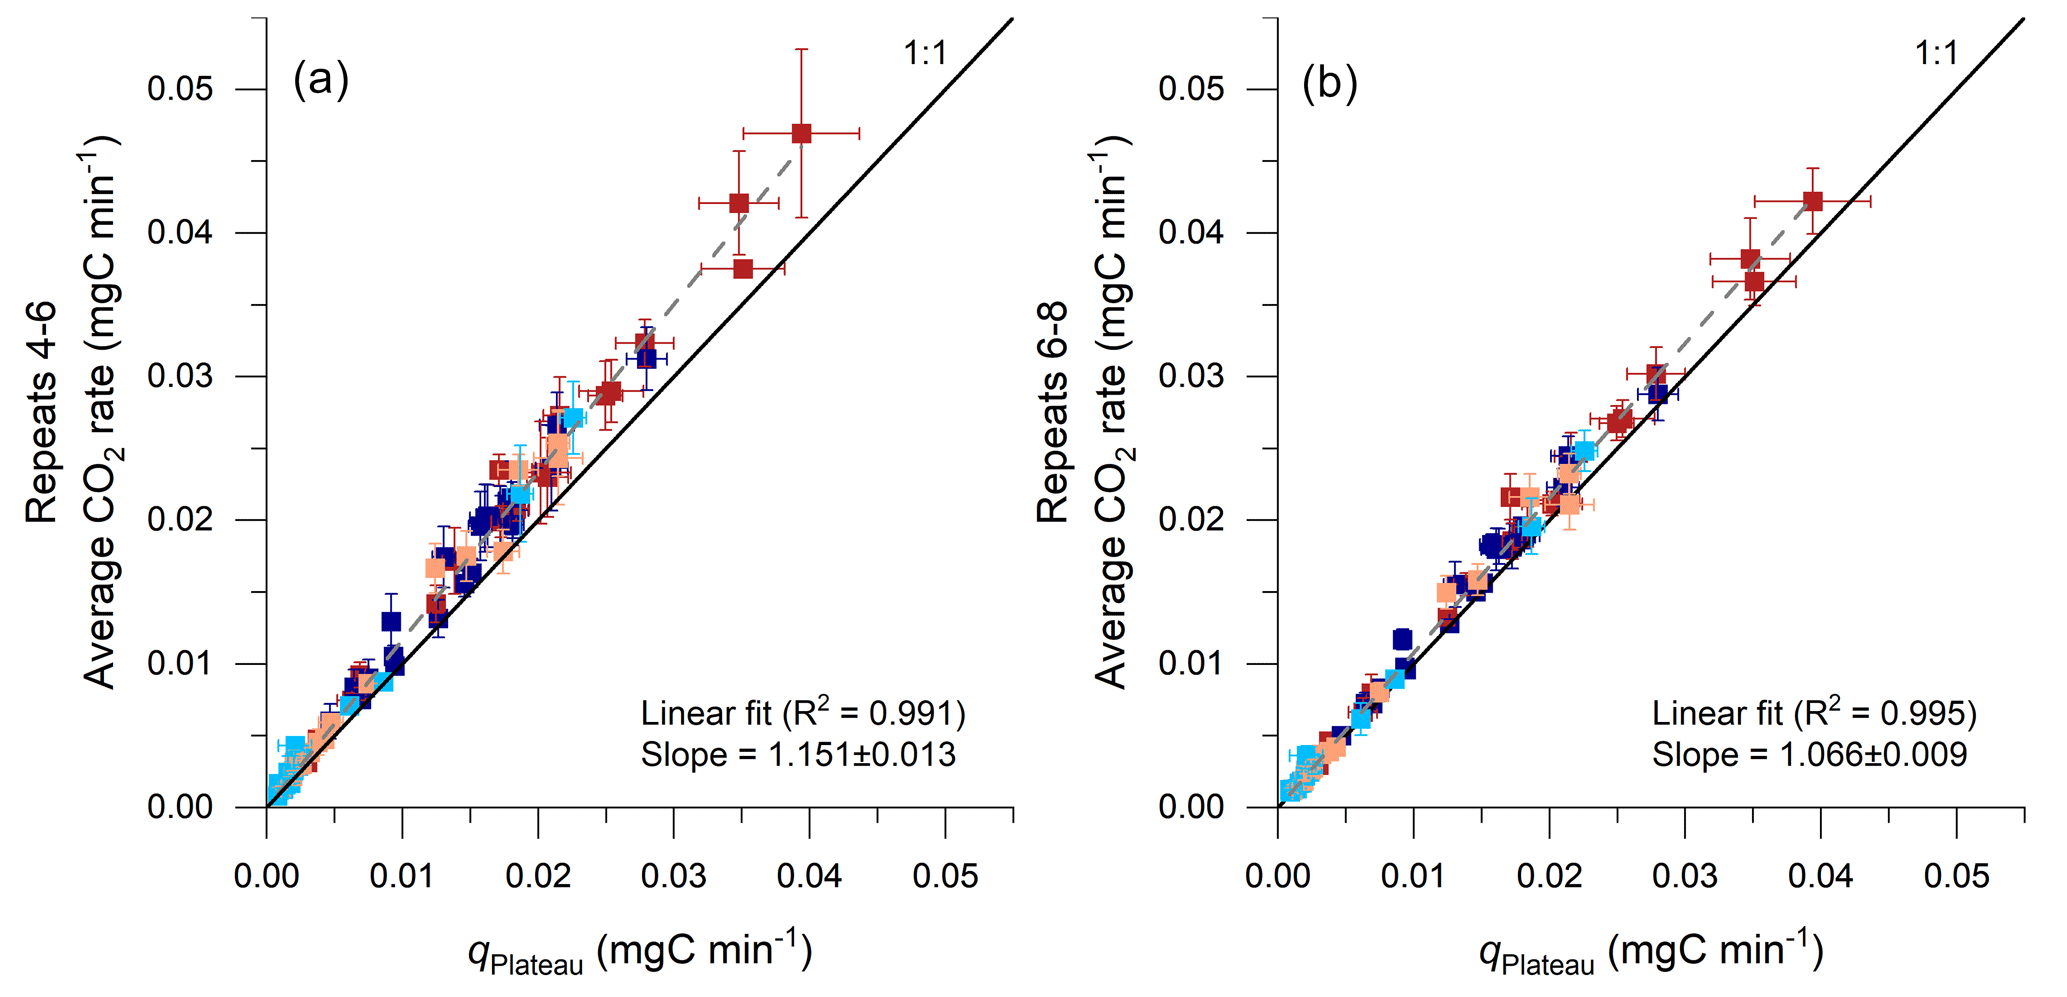
Figure 10Comparison of CO2 fluxes determined by using the average of repeated accumulation rates and by an exponential fitting model. Results from the proposed model are given on the x axis (qPlateau; Eq. 9; error bars show 95 % CI) and are compared with the averages of the repeats 4–6 (a) and of the repeats 6–8 (b) on the y axis (error bars show 2 SD), alongside a linear regression and a 1:1 line for reference. Red colors indicate samples from the Brusquet catchment (stabilized in dark colors; extrapolated fitting in light colors; Sect. 4.1.1), and blue colors indicate samples from the Moulin catchment (stabilized in dark colors; extrapolated fitting in light colors).
The combined quantification of CO2 fluxes and of the corresponding rock mass undergoing oxidative weathering means that there is an opportunity for future research to include investigations of the internal surface area of the studied rocks, which would allow reporting field-based CO2 fluxes normalized to the reacting surface areas. Such normalizations are typically considered during modeling (Bao et al., 2017; Bolton et al., 2006) to acknowledge that the internal surface area can change significantly during sedimentary rock weathering (Fischer and Gaupp, 2005). Analogously to silicate weathering rates, variations in OCpetro and carbonate weathering rates obtained from different field and laboratory conditions may be related to the conceptualization and parameterization of the reactive surface area, which needs to be considered when comparing them (Brantley et al., 2007; White and Brantley, 2003).
4.3 Implications for CO2 flux measurements
4.3.1 Accuracy of CO2 flux measurements
The time-dependency of carbon accumulations during the CO2 flux measurements (Figs. 4 and 5) has provided new insights into the nature of the shallow weathering zone (Sects. 4.1 and 4.2) and has important implications for how CO2 fluxes are quantified. In short, changes in pCO2 Chamber during the field operations are interpreted as the combination of (i) purging of CO2 stored initially in the chamber and surrounding rock pores (pCO2 Rock) and (ii) the real-time production of CO2 from oxidative weathering. At the start of a CO2 flux measurement, CO2 accumulations have important contributions from point (i)), which led previous studies to use the later repeats (q4 to qn≥6) to quantify point (ii) (Soulet et al., 2018, 2021; Roylands et al., 2022). Here, longer measurements at each chamber allow us to explore this in more detail.
The time it takes for the CO2 accumulation rates to decline and stabilize within the 95 % confidence interval of the qPlateau value derived from fitting CO2 accumulation rates over time (Eq. 9) is ∼ 90 min, corresponding to ∼ 10 repeats (Fig. 5). This implies that treating only the first three repeats of a measurement as combined signals of purging and production of CO2, as done previously in similar studies (Roylands et al., 2022; Soulet et al., 2021, 2018), returns a greater flux than qPlateau. However, the overestimate is modest; the average accumulation rate of the measured repeats 4–6 is ∼ 15 % higher than the qPlateau value (Fig. 10a). This is true for the entire data set, including stabilized and extrapolated measurements, and for the site-specific samples. The relative offset is constant, irrespective of the overall size of the CO2 accumulation (Fig. 10a), which means that flux data including non-plateaued accumulations can be corrected. It also means that any link between CO2 flux and measured environmental variables is robust (Roylands et al., 2022; Soulet et al., 2021). When taking the average of the measured repeats 6–8 (Fig. 10b), the value is ∼ 7 % higher than qPlateau.
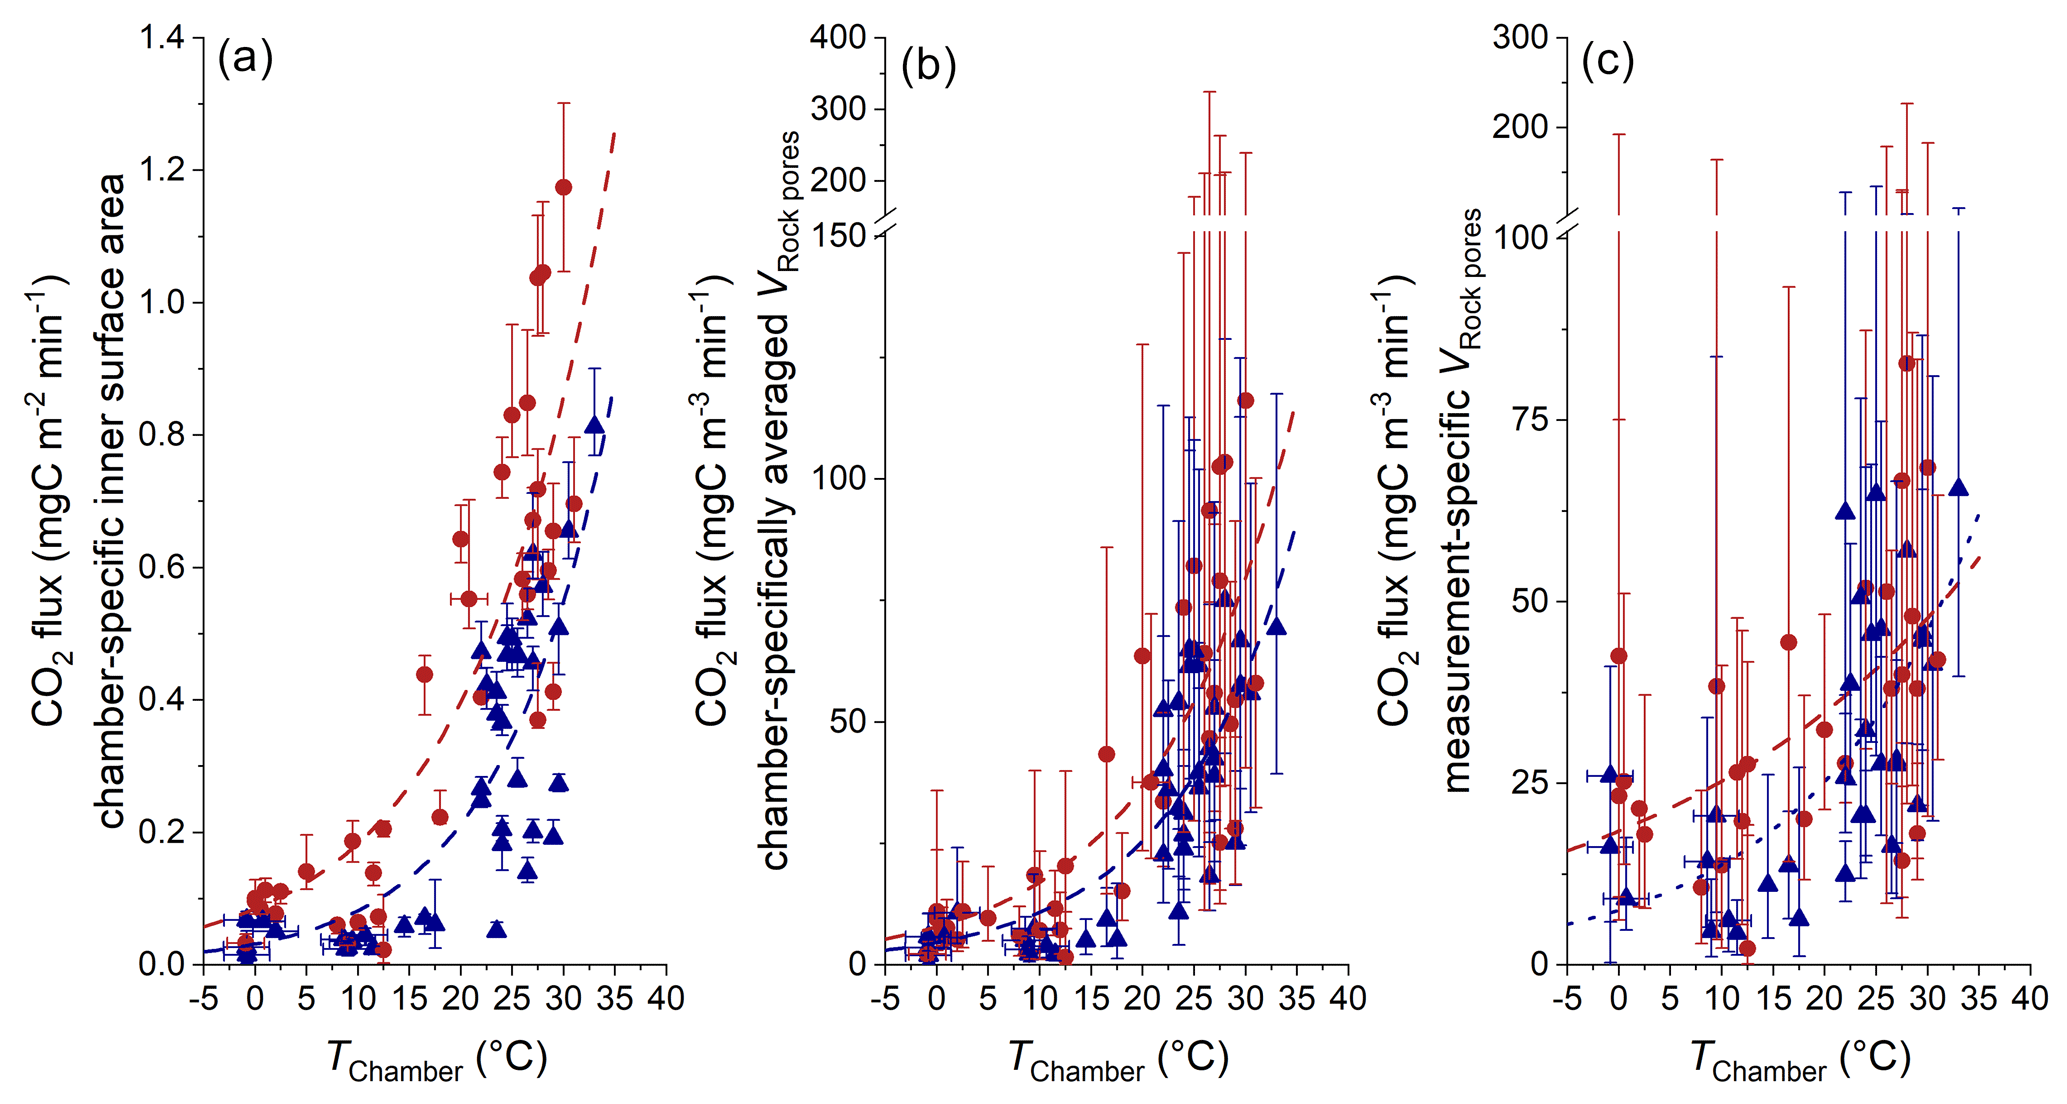
Figure 11Comparison of CO2 fluxes with different normalizations and chamber temperature. (a) Normalization to the chamber-specific inner surface area (Table 1) (including the 95 % CI of qPlateau). (b) Normalization to chamber-specific averaged VRock pores (Table 5) (including the combined uncertainty in qPlateau and the averaged 95 % CI of VRock pores). (c) Normalization to measurement-specific VRock pores (including the combined uncertainty in qPlateau and the measurement-specific 95 % CI of VRock pores). Estimated temperatures are indicated by the accompanying error bars (RMSE). Colors indicate the site of measurement (Brusquet in red circles; Moulin in blue triangles).
4.3.2 Reporting CO2 flux as a function of temperature
Recent research has highlighted that temperature controls the release of CO2 from chambers drilled into the shallow weathering zone of sedimentary rocks (Soulet et al., 2021), with an exponential response:
where F is the CO2 flux (, using the chamber-specific inner surface area), T is the temperature (∘C), F0 is the CO2 flux at 0 ∘C, and γ is the growth rate parameter () that is derived from an exponential model. For the oxidation of marls, Soulet et al. (2021) found a value for γ of 0.070 ± 0.007 (± standard error), considering five different chambers independent of their F0 values and based on daily averaged chamber temperatures. Across differences in the hydrological setting of these chambers, F0 values ranged from 35 ± 7 to 626 ± 113 , with the lowest CO2 fluxes in close proximity to a riverbed (Soulet et al., 2021).
Here, at different installation sites, we find a similar exponential response of CO2 release to temperature with γ values of 0.065 ± 0.012 (Brusquet) and 0.067 ± 0.018 (Moulin). However, using an hourly resolution for the chamber temperature (Fig. 11a) returns higher γ values (0.077 ± 0.013 at Brusquet; 0.085 ± 0.016 at Moulin). This increase in γ can be explained by an instantaneous response of weathering reactions to in situ temperature changes and fits to the observation that CO2 fluxes increased over a few hours alongside increases in the chamber temperature for chambers visited twice a day (Appendix F). Overall, this observation highlights the importance of considering the in situ environmental conditions with a high temporal resolution (Sect. 3.1).
Changes in temperature also coincide with changes in the diffusive processes in the rocks surrounding a chamber (Sect. 4.1). To differentiate changes in the diffusive framework from the CO2 production at a given temperature (i.e., weathering kinetics), the CO2 fluxes can be normalized to VRock pores, which is representative of the contributing number of rock grains undergoing oxidation (Sect. 4.2). Since the observed CO2 fluxes range by a factor of ∼ 18.2, while values of VRock pores exhibit a lower range of a factor of ∼ 5.9 (Table 5), this normalization does not diminish the importance of the temperature control on the CO2 release (Fig. 11c). However, due to large measurement-specific uncertainties that are associated with the calculation of VRock pores, a full assessment of whether higher chamber-derived CO2 fluxes at higher temperatures are partly a result of greater contributing rock volumes is hindered.
Despite the similarities of the topography, hydrology, erosion rates (Figs. 1 and 2), and VRock pores (Figs. 7 and 8), we find site-specific differences in the bulk CO2 production at a given temperature, which may be linked to differences in the source of carbon associated with the different rock types outcropping in the Brusquet catchment (black shales; F0 = 122.2 ± 41.3 ) and in the Moulin catchment (marls; F0 = 45.6 ± 20.3 ). To better understand these different weathering fluxes, future research is needed to assess the carbon source(s) and the response of the weathering reactions to changes in temperature at both study sites in more detail, for instance, by studying the chemical composition of the rocks (i.e., contents of OCpetro, carbonates, and sulfides) alongside the radiocarbon and stable carbon isotope composition of the released CO2, analogously to previous research in the neighboring Laval catchment (Soulet et al., 2018, 2021) and in the Waiapu catchment in Aotearoa / New Zealand (Roylands et al., 2022).
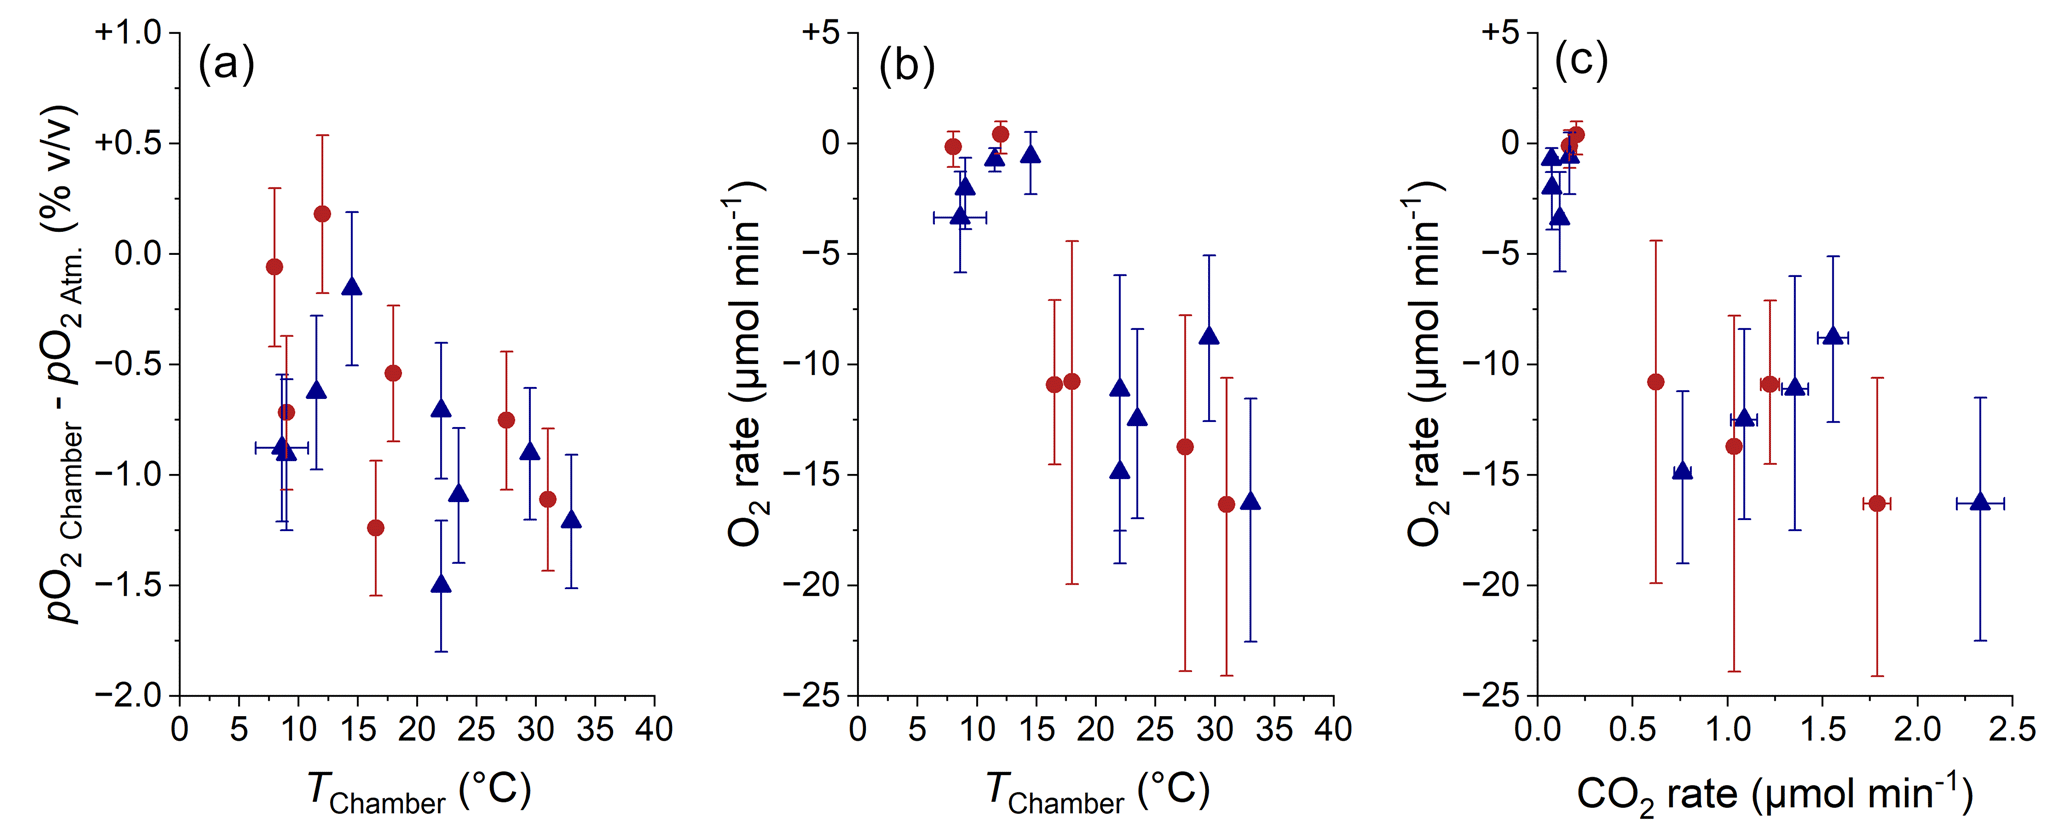
Figure 12Comparison of pO2 Chamber (a; normalized to atmospheric pO2; error bars show RMSE) and of O2 consumption rate (b; error bars show 95 % CI) with chamber temperature and comparison of O2 consumption rate with CO2 production rate (c; error bars show 95 % CI). The origin of samples is indicated with red circles for the Brusquet catchment and blue triangles for the Moulin catchment. Estimated temperatures are indicated by the accompanying error bars (RMSE).
4.4 Linking CO2 and O2 fluxes
The O2 consumption in the weathering zone provides a tool for investigating the kinetics of sedimentary rock weathering (Tune et al., 2020, 2023), analogous to previous research on soils (Hicks Pries et al., 2020; Angert et al., 2015; Sánchez-Cañete et al., 2018). Overall, pO2 Chamber values in the Brusquet catchment and in the Moulin catchment were similar to or lower than the O2 concentration of the atmosphere, confirming that the weathering zones are sinks of oxygen. The variation in pO2 Chamber over time coincides with a variation in temperature within the chambers (Fig. 12a), with roughly similar relationships for both study sites. This observation fits to the recently proposed importance of temperature controlling oxidative weathering kinetics (Soulet et al., 2021). However, due to a limited number of samples and a large measurement uncertainty, neither chamber-specific differences nor the impact of precipitation on pO2 Chamber can be evaluated accurately.
The observed pO2 Chamber values can be used to calculate a diffusive flux of O2 between the chamber, connected rock pores, and the atmosphere (Eqs. 7 and 8). This is based on the insights into the diffusive processes of the chambers and the connected rock space that come from the CO2 measurements (Sects. 2.7 and 4.1) (Appendix B). Previous work on porous media has established that the effective diffusivities of CO2 and O2 are impacted in a similar way by the structure of the air-filled pore space (Millington, 1959; Penman, 1940; Angert et al., 2015), which allows determination of the effective diffusivity of O2 from that of CO2 in the shallow weathering zone.
The calculated O2 fluxes are representative of the same rock volume that is releasing CO2, which also means that a report of absolute fluxes is possible (Sect. 4.2). Altogether, the chamber-specific O2 exchange rate in the Brusquet catchment and the Moulin catchment range between zero within uncertainty ( µmol O2 min−1) to a maximum consumption of O2 of µmol O2 min−1, with increasing O2 consumption with increasing temperature (Fig. 12b). The O2 fluxes have a greater relative uncertainty compared to the pO2 gradient because they include the measurement-specific diffusivity.
The O2 flux into the chambers and their connected rock pores can be compared with the CO2 flux from this space (Fig. 12c). At 20 ∘C, an O2 consumption rate of ∼ −8.7µmol O2 min−1 coincides with an average CO2 accumulation rate of ∼ 1.1 µmol CO2 min−1 in the Brusquet catchment and of ∼ 0.6 µmol CO2 min−1 in the Moulin catchment. This is an average ratio of ∼ 1 mol O2:0.1 mol CO2. This field-based molar ratio of O2 consumption and CO2 release is significantly lower than the theoretical ratio of weathering reactions describing the oxidation of sedimentary rocks. For example, the oxidation of OCpetro is theoretically described by a ratio of 1 mol O2:1 mol CO2 (Petsch, 2014). In addition, the oxidation of pyrite minerals coupled to the dissolution of carbonates is theoretically characterized by a ratio of up to 1.875 mol O2:1 mol CO2 if the CO2 release occurs in situ (Torres et al., 2014; Soulet et al., 2021). To investigate this discrepancy, here we discuss several mechanisms that could influence the consumption of O2 and the release of CO2 in the shallow weathering zone.
In addition to OCpetro and pyrite minerals, other minerals, such as illite, chlorite, and ankerite, can be a sink of oxygen during the weathering of sedimentary rocks (Brantley et al., 2013; Sullivan et al., 2016). However, in settings where pyrite minerals are present, the chemical weathering of these other ferrous-iron-bearing minerals progresses relatively slowly and advances only more rapidly following the complete oxidation of pyrite minerals (Gu et al., 2020a, b). Accordingly, pyrite minerals should be the dominating inorganic O2 sink at the two study sites.
It has been previously suggested that the oxidation of OCpetro progresses in a stepwise manner, with the formation of oxygenated compounds of organic matter prior to the release of CO2 (Chang and Berner, 1999), typically resulting in an increase in the relative oxygen content of OCpetro during chemical weathering (Petsch, 2014; Tamamura et al., 2015; Longbottom and Hockaday, 2019). If the oxidation of OCpetro progresses more rapidly than the separate process of CO2 release from oxygenated OCpetro in the Draix-Bléone Observatory, then this could partly explain the lower ratio of CO2 released compared to the O2 uptake. However, for rocks exposed in rapidly eroding terrains in the Draix-Bléone Observatory, previous studies did not find a significant effect of weathering on the chemical composition of OCpetro, despite a decrease in the quantities of OCpetro and pyrite minerals (Graz et al., 2011; Copard et al., 2006). Thus, it seems unlikely that the oxidation of OCpetro at both study sites deviates notably from the theoretical stoichiometry mentioned above.
Furthermore, if the sulfuric acid derived from the oxidation of pyrite minerals interacts with silicate minerals (Bufe et al., 2021; Blattmann et al., 2019), then this would lead to O2 consumption but no CO2 release. In addition, sulfuric acid could interact with OCpetro and be neutralized, yet the vast majority of OCpetro is typically made of kerogen, which is resistant to acid hydrolysis, and only minor amounts of more labile organic matter can be prone to this type of degradation (Killops and Killops, 2005; Petsch, 2014; Seifert et al., 2011; Włodarczyk et al., 2018).
Another explanation may involve the lateral transport of CO2 as part of the dissolved load, lowering the gaseous release of carbon. The oxidation of OCpetro and pyrite minerals coupled to the dissolution of carbonates occur in a humid weathering zone (Fig. 3), where CO2 may be incorporated into the dissolved inorganic carbon pool (Torres et al., 2014; Soulet et al., 2021; Roylands et al., 2022; Bao et al., 2017). A recent study has quantified the export of DIC using the molar ratio of O2 and CO2 fluxes for sedimentary rocks undergoing weathering below a forested hillslope (Tune et al., 2023, 2020). There, carbon is sourced from soils, roots, and OCpetro, with an absence of an inorganic carbon source and of pyrite minerals. If a part of the CO2 from oxidative weathering is exported as DIC in the Brusquet and the Moulin catchments, then this would raise the observed O2 consumption to CO2 release ratio and would have to do so by a factor in the range of ∼ 4 and ∼ 15. This is worthy of future research towards understanding O2 consumption in the weathering zone. Here, a more accurate quantification is hindered because the proportions of inorganic carbon release versus organic carbon release (which derive from weathering reactions with a different stoichiometry as described above) are unknown. This again calls for future work to assess the carbon sources in more detail.
Overall, we have developed the tools needed to quantify the production or consumption, storage, and movement of CO2 and O2 in the near-surface of rocks undergoing weathering (Appendix B). If combined, for example, with surface chambers (for gaseous exchange) and boreholes extending below the oxidation front (profiling gaseous and dissolved processes) (Tune et al., 2020; Tokunaga et al., 2016), alongside radiocarbon and stable carbon isotope analyses (for partitioning the weathering reactions) (Soulet et al., 2021; Roylands et al., 2022; Keller and Bacon, 1998; Tune et al., 2023), the cycling of carbon and oxygen in the total critical zone and its environmental controls could be investigated comprehensively. Using drilled chambers benefits investigations using the gradient method for profiles of gas concentrations because, with the approach suggested here, the diffusivity measures can be determined in situ and in real time, which are otherwise typically estimated (Tune et al., 2020; Maier and Schack-Kirchner, 2014; Keller and Bacon, 1998; Tokunaga et al., 2016). Furthermore, by assessing the release and movement of nitrous oxide from the subsurface (Wan et al., 2021), an overall greenhouse gas budget could be developed for sedimentary rocks undergoing weathering. This would be especially valuable for sites with a thin soil cover, which typically dominate more widespread terrains at lower slopes (Milodowski et al., 2015; Heimsath et al., 2012). There, the additional, modern carbon pool complicates the disentangling of biogeochemical processes and the corresponding source-specific CO2 and O2 fluxes (Tune et al., 2020; Keller and Bacon, 1998; Longbottom and Hockaday, 2019; Hemingway et al., 2018; Copard et al., 2006; Tune et al., 2023).
This study has further developed and assessed methods for in situ constraints on the release of CO2 and the consumption of O2 during oxidative weathering of exposed sedimentary rocks. Our new method framework allows for both accurate quantification of weathering fluxes over hourly to daily timescales, while also constraining diffusive processes in the shallow weathering zone. At two sites of the Draix-Bléone Observatory (France), accumulation chambers were installed by drilling holes directly into rocks undergoing weathering in the Brusquet catchment (black shales) and in the Moulin catchment (marls). At each site, using an array of four chambers, measurements of pCO2 Rock and CO2 fluxes were carried out alongside pO2 Rock measurements during six field trips over 1 year.
We find that during a single visit to a chamber, the accumulation rates decline over a few measurement cycles before reaching a stable CO2 accumulation rate. This pattern is consistent across the field trips and can be described by an exponential model. To explain these observations, we provide a new framework which considers the measured CO2 accumulation as a combination of the real-time CO2 production during weathering plus the release of excess CO2 built up in pore space surrounding the chambers. By doing so, we can assess the rock pore volume and rock mass that produce CO2. For the first time, this allows an absolute report of rock-derived CO2 fluxes measured in situ and in real time, providing input data for future studies modeling the chemical weathering of sedimentary rocks. The assessment of contributing rock pore space allows us also to normalize the fluxes to an outcrop surface area, enabling comparison of the weathering fluxes at the study sites to other rock types and soils across different terrains and climates. Furthermore, by studying the accumulation of CO2 in a chamber and the connected rock pore space over time, the diffusivity of gases in the shallow weathering zone and its environmental controls are investigated, including an absolute, in situ determination of the diffusion coefficients.
In addition to these insights into the CO2 release, pO2 values for the studied rocks are presented and used together with the quantification of the diffusive processes in the weathering zone to calculate O2 fluxes. It is shown that the consumption of O2 co-varies with changes in the emission of CO2 over time, which are driven by changes in temperature. However, the O2 fluxes indicate significantly greater oxidative weathering rates compared to the CO2 fluxes. We suggest that this discrepancy may result from the (i) export of inorganic carbon by the dissolved load of percolating waters lowering the effective release of gaseous CO2 and (ii) silicate weathering by sulfuric acid as a sink of O2.
A site-specific difference in the magnitude of CO2 emissions at the two study sites cannot be explained by differences in the lithological properties influencing the diffusion of gas within the rock space surrounding the chambers, as both study sites have similar characteristics, which is evidenced by diffusivity measures changing similarly alongside temperature and precipitation. This finding suggests that differences in the source of carbon are the main reason for the observed CO2 flux differences, providing an opportunity for future research to investigate the control of the chemical composition of the rocks (i.e., contents of OCpetro, carbonates and sulfides) on the CO2 flux size.
Together, this study provides a new framework to quantify the release of CO2 and the consumption of O2 during oxidative weathering of sedimentary rocks, aiding our efforts to upscale fluxes and constrain how they respond to changes in climate and the geomorphic and hydrological setting.
To fill the gaps in the direct chamber temperature measurements, we use air temperatures from a local weather station as a proxy by modifying a framework that describes soil temperatures by, amongst other variables, air temperature (Liang et al., 2014). The approach combines measured air temperatures with a Fourier-fitted function that describes the daily average temperature inside the rock chambers by weighting averaged air temperatures by the fractional duration of daylight (L) at the latitude of the Draix-Bléone Observatory. In more detail, we estimate the current chamber temperature TChamber (∘C) at an hourly resolution as follows:
where TAir−6 h is the hourly air temperature (∘C) from nearby meteorological stations (Draix-Bléone Observatory, 2015) delayed by 6 h, coeffA and coeffB are site-specific fitting coefficients, and Tmean (∘C) is the long-term trend of rock temperature described by
where coeffC1 to coeffC4 are site-specific fitting coefficients (Table A1) in a first-order Fourier-model, and TAir, 7 d (∘C) is the 7 d average of the past air temperatures at hourly resolution. Using the site-specific air temperatures, this approach simulates TChamber well, with a root mean square error (RMSE) of 1.8 ∘C for the Brusquet catchment and 2.2 ∘C for the Moulin catchment (Fig. A1).
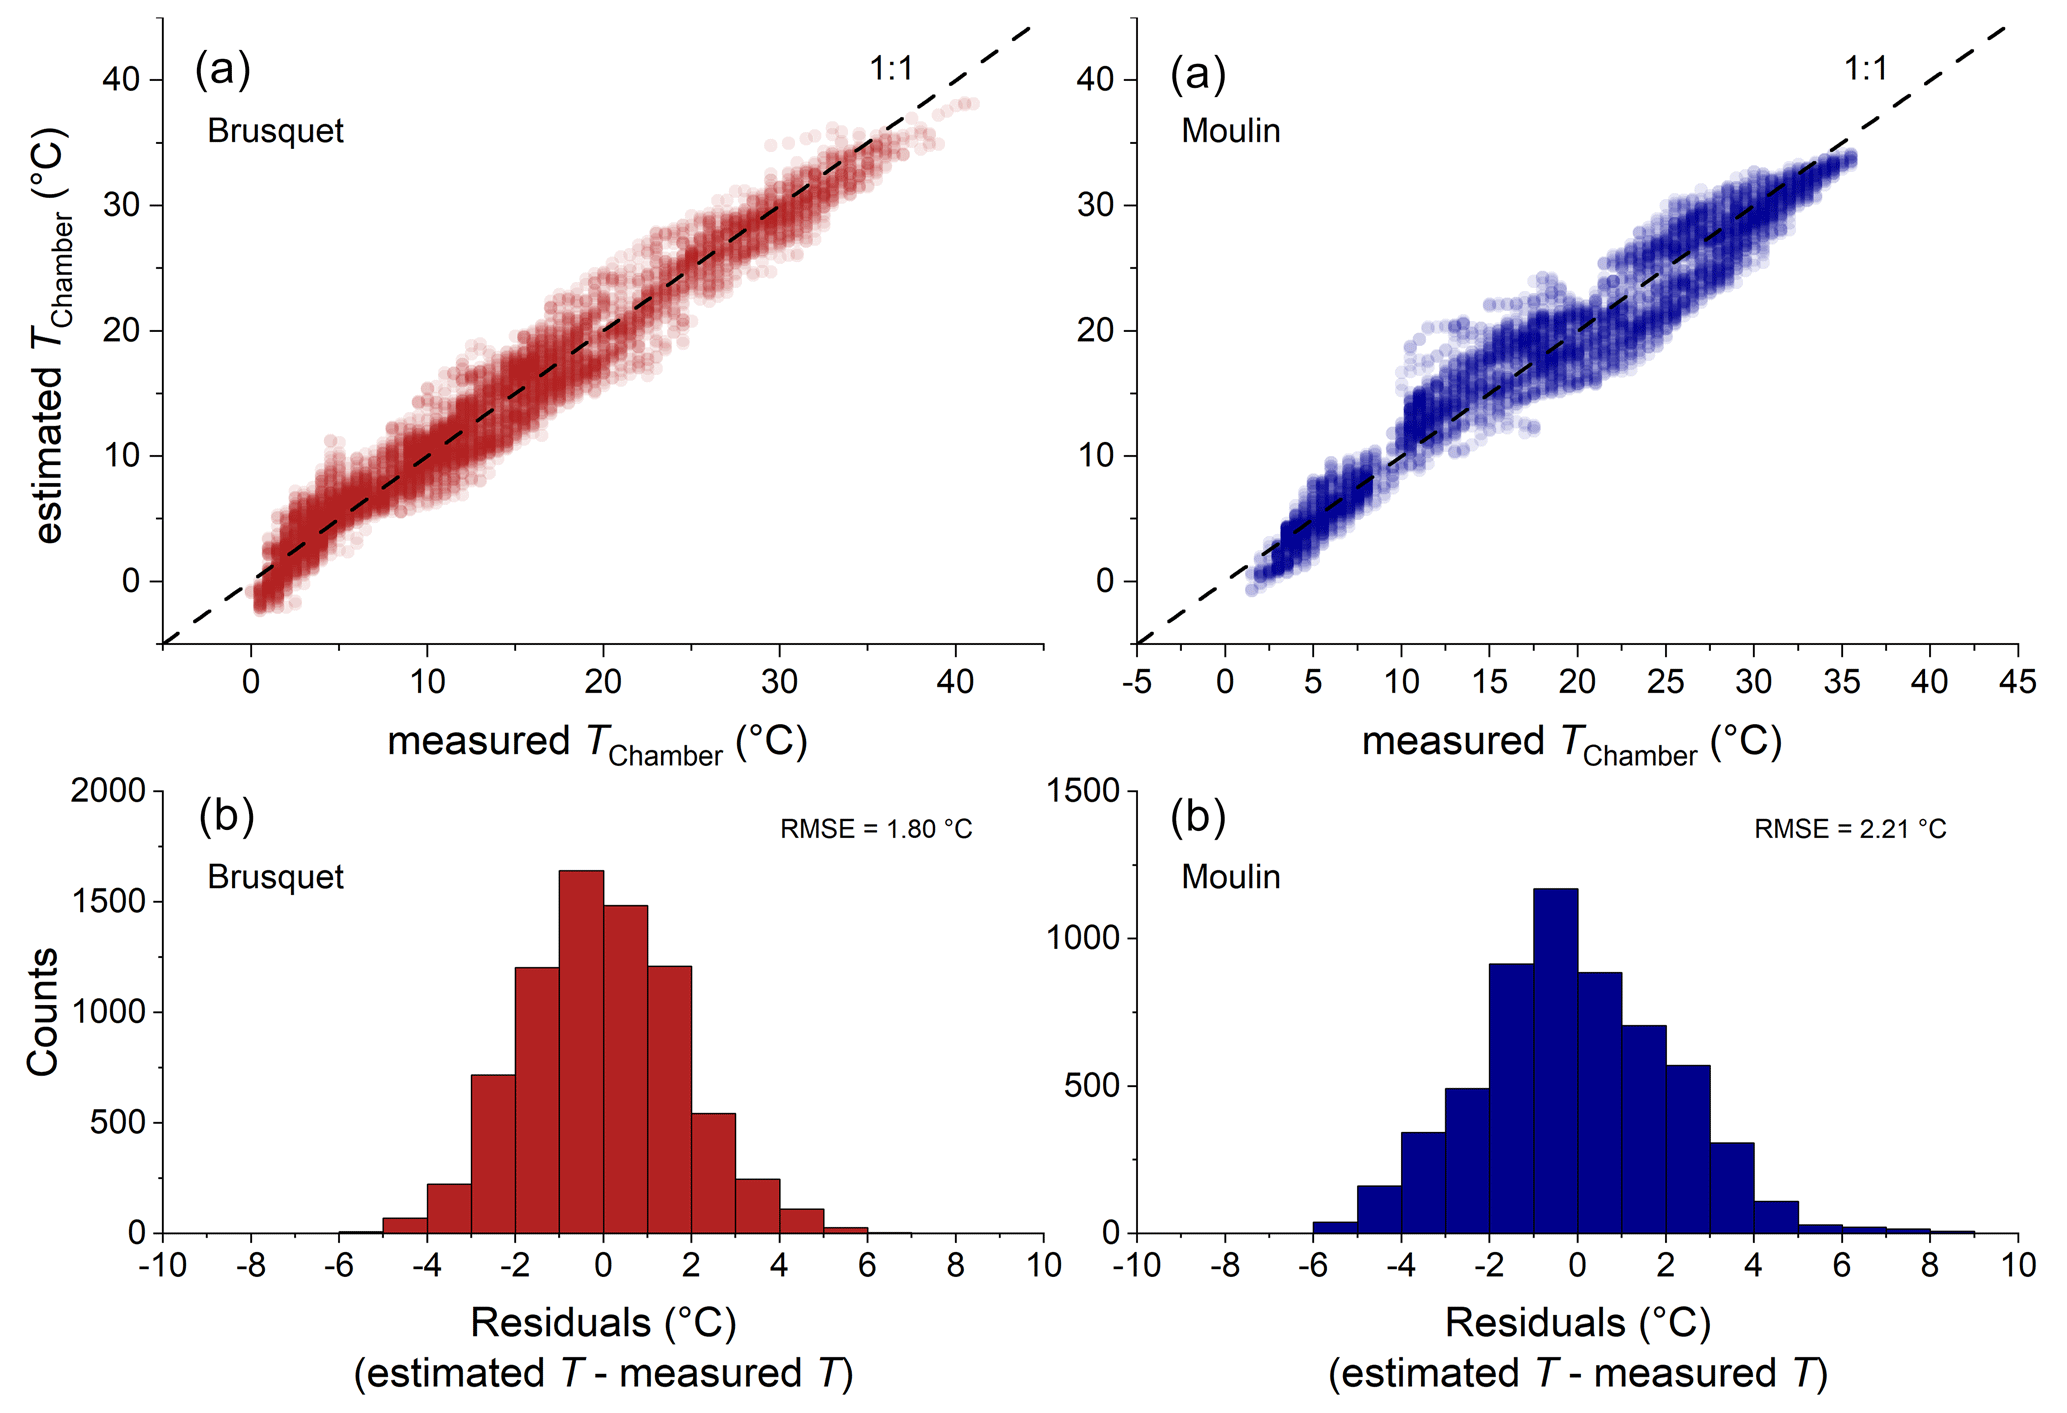
Figure A1(a) Comparison of chamber temperatures measured and estimated by a modeling framework based on air temperature and the fractional duration of daylight at the latitude of the Draix-Bléone Observatory at hourly resolution for the Brusquet catchment (red) and the Moulin catchment (blue), which agree with a 1:1 relation (dashed line). (b) Normally distributed residuals between the measured temperatures and the modeling framework.
Table A1Overview of site-specific fitting coefficients used for modeling chamber temperatures based on air temperature and fractional duration of daylight (Eqs. A1 and A2) and details of the goodness of the fitting model, based on comparisons to measured chamber temperatures with hourly and daily resolution.
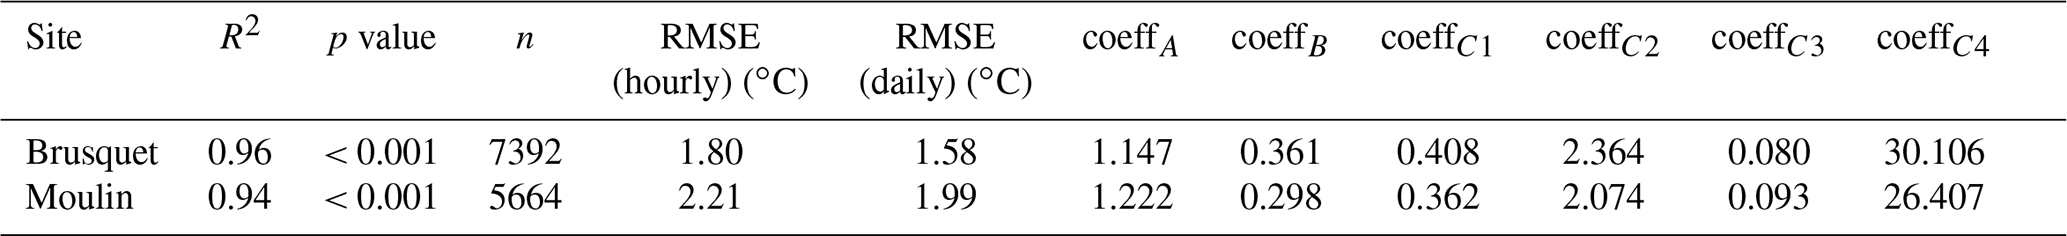
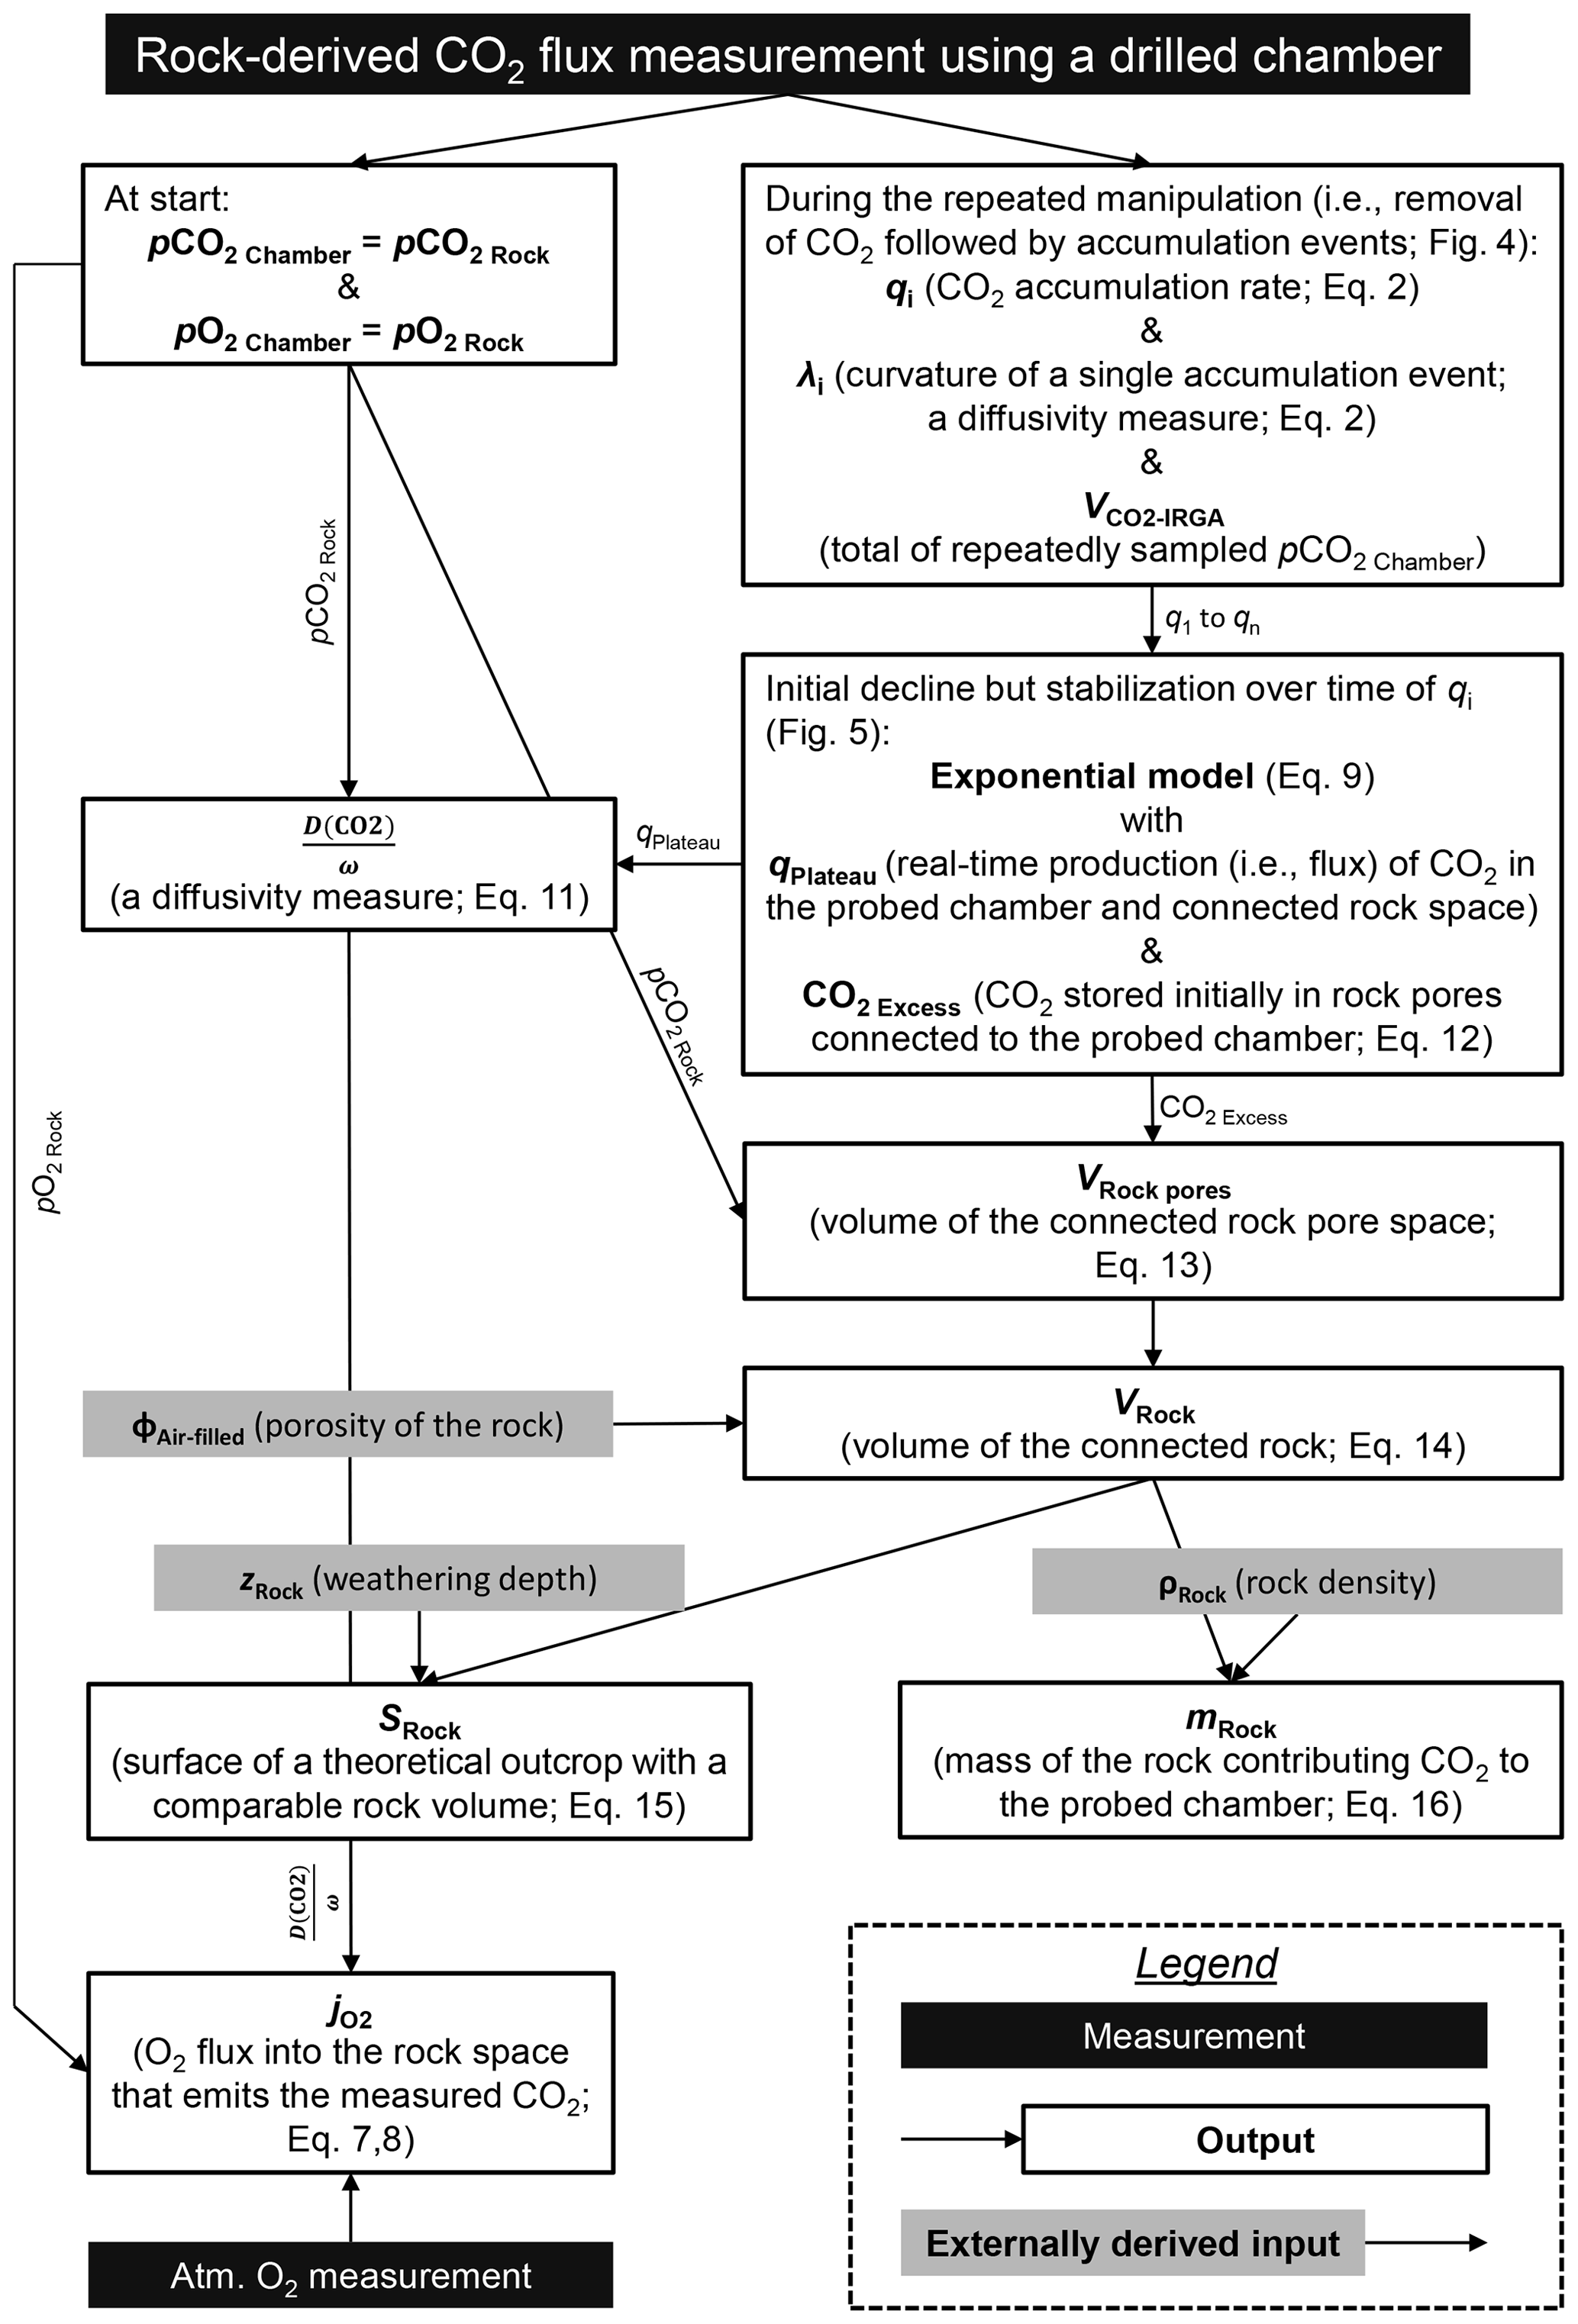
Figure B1Central data flow for the new approach developed in this study to quantify the diffusive exchange of CO2 and O2 during shallow rock weathering, based on real-time measurements using drilled headspace chambers.
Table C1Details of linear regressions comparing measurement-specific values of pCO2 Rock and CO2 accumulation (based on repeats 6–8) (with pCO2 (ppmv) = a1 × CO2 rate (µg C min−1) + a2), including the standard errors in the fitting parameters. Differentiations into dry and wet samples are based on a threshold of a cumulative precipitation of 5 mm over 3 d prior to the measurement. Both sites have similar linear regressions with overlapping standard errors.
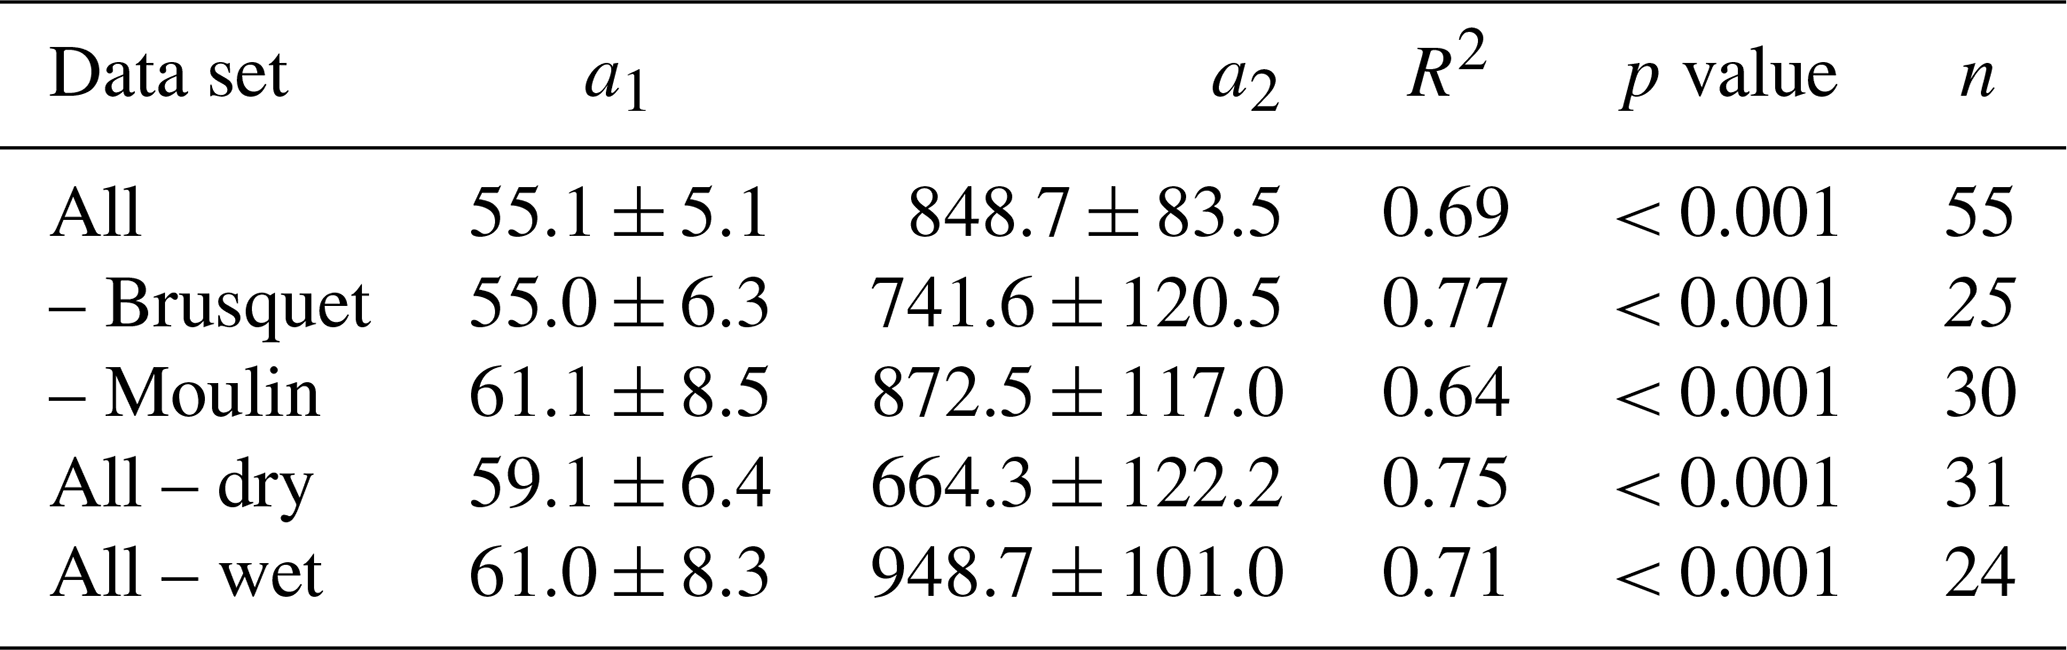
Table D1Details of linear regressions comparing the diffusivity measures and λ (with (cm3 min−1) = b1×λ (min−1) + b2), including the standard errors in the fitting parameters. Differentiations into dry and wet samples are based on a threshold of a cumulative precipitation of 5 mm over 3 d prior to the measurement. The regressions are based on using the average values from the repeats 6–8 of the flux measurements, which are typically close to stabilization of the CO2 accumulation rate because a significant number of the measurements was limited to eight repeats. Both sites have comparable linear regressions with overlapping standard errors.
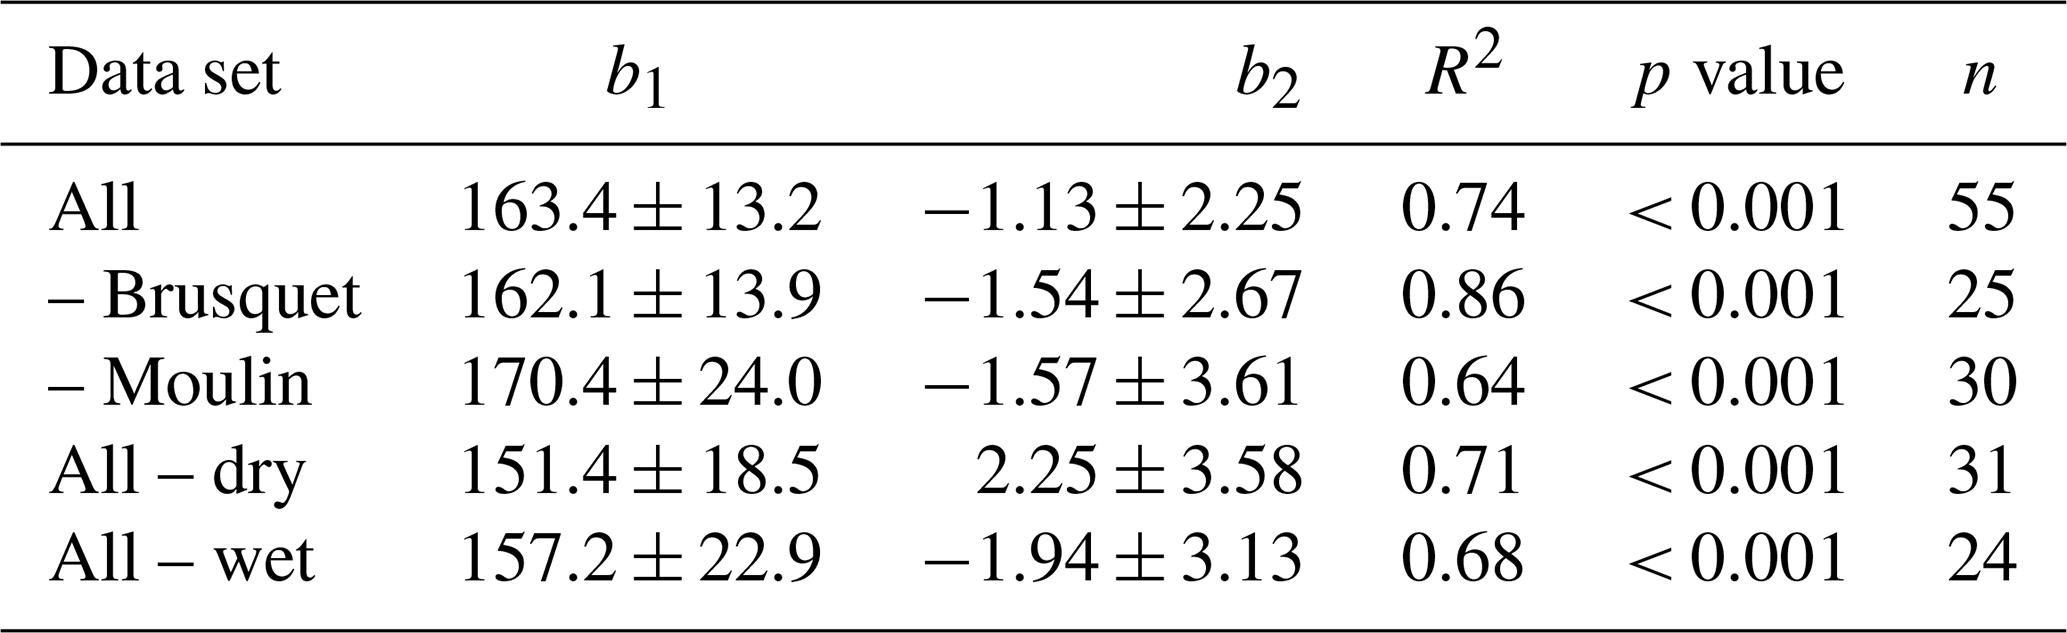
The diffusion pathways of a closed chamber differ from that of a manipulated chamber. During a flux measurement, CO2, which is released from a rock grain undergoing oxidative weathering into the pore space, moves via diffusion along a concentration gradient, which is initiated by repeatedly lowering the pCO2 Chamber to a near-atmospheric level (Soulet et al., 2018) from the rock pores towards the manipulated chamber if they are connected more effectively to the chamber than to the rock–atmosphere boundary. In contrast, without a sampling system acting as the receiving reservoir, rock-derived CO2 travels along the concentration gradient towards the atmosphere. In the latter scenario, rock pores that contribute CO2 during a flux measurement to a chamber either contribute the CO2 via diffusion directly to the atmosphere (without a pathway through the chamber) or through the chamber towards the atmosphere.
On four visits, a chamber was measured twice a day, and the observed CO2 release was higher in the afternoon than in the morning, coinciding with an increase in the chamber temperature. For chamber 5 at the Brusquet site, qPlateau increased from 1.1 to 3.8 µg C min−1 and from 2.6 to 4.7 µg C min−1, coinciding with temperate increases from −0.9 to 1.0 ∘C and from 2.0 to 5.0 ∘C, respectively. For chamber 4 at the Moulin site, qPlateau increased from 14.6 to 18.0 µg C min−1 and from 16.3 to 21.4 µg C min−1, coinciding with temperate increases from 22.5 to 26.5 ∘C and from 22.0 to 27.0 ∘C, respectively.
All data supporting the findings of this study can be found in the tables in the Supplement.
The supplement related to this article is available online at: https://doi.org/10.5194/esurf-12-271-2024-supplement.
The research was conceptualized by TR, with help from RGH and ELM. The main methods were designed by TR, with help from RGH, GS, MHG, and ELM. Field-based and laboratory geochemical measurements were led by TR, with contributions from MHG, RGH, SK, MD, and FN, and climate data and aerial imagery were provided by SK and CLB. TR led the formal analysis, investigation, data visualization, and writing of the original draft under the supervision of RGH and ELM. All authors contributed to subsequent review and editing, led by TR, RGH, ELM, and GS. Funding was acquired by RGH, TR, and MHG.
The contact author has declared that none of the authors has any competing interests.
Publisher's note: Copernicus Publications remains neutral with regard to jurisdictional claims made in the text, published maps, institutional affiliations, or any other geographical representation in this paper. While Copernicus Publications makes every effort to include appropriate place names, the final responsibility lies with the authors.
We thank Aaron Bufe and one anonymous referee for improving our paper.
This research has been supported by a European Research Council Starting Grant, H2020 European Research Council (project ROC-CO2; grant no. 678779) and the Natural Environment Research Council (NEIF Radiocarbon Grant; grant no. 2201.1019).
This paper was edited by Veerle Vanacker and reviewed by Aaron Bufe and one anonymous referee.
Angert, A., Yakir, D., Rodeghiero, M., Preisler, Y., Davidson, E. A., and Weiner, T.: Using O2 to study the relationships between soil CO2 efflux and soil respiration, Biogeosciences, 12, 2089–2099, https://doi.org/10.5194/bg-12-2089-2015, 2015.
Antoine, P., Giraud, A., Meunier, M., and Van Asch, T.: Geological and geotechnical properties of the “Terres Noires” in southeastern France: Weathering, erosion, solid transport and instability, Eng. Geol., 40, 223–234, https://doi.org/10.1016/0013-7952(95)00053-4, 1995.
Ariagno, C., Le Bouteiller, C., van der Beek, P., and Klotz, S.: Sediment export in marly badland catchments modulated by frost-cracking intensity, Draix–Bléone Critical Zone Observatory, SE France, Earth Surf. Dynam., 10, 81–96, https://doi.org/10.5194/esurf-10-81-2022, 2022.
Ariagno, C., Pasquet, S., Le Bouteiller, C., van der Beek, P., and Klotz, S.: Seasonal dynamics of marly badlands illustrated by field records of hillslope regolith properties, Draix–Bléone Critical Zone Observatory, South-East France, Earth Surf. Proc. Land., 1–14, https://doi.org/10.1002/esp.5564, 2023.
Bao, Z., Haberer, C. M., Maier, U., Amos, R. T., Blowes, D. W., and Grathwohl, P.: Modeling controls on the chemical weathering of marine mudrocks from the Middle Jurassic in Southern Germany, Chem. Geol., 459, 1–12, https://doi.org/10.1016/j.chemgeo.2017.03.021, 2017.
Bechet, J., Duc, J., Jaboyedoff, M., Loye, A., and Mathys, N.: Erosion processes in black marl soils at the millimetre scale: preliminary insights from an analogous model, Hydrol. Earth Syst. Sci., 19, 1849–1855, https://doi.org/10.5194/hess-19-1849-2015, 2015.
Bechet, J., Duc, J., Loye, A., Jaboyedoff, M., Mathys, N., Malet, J.-P., Klotz, S., Le Bouteiller, C., Rudaz, B., and Travelletti, J.: Detection of seasonal cycles of erosion processes in a black marl gully from a time series of high-resolution digital elevation models (DEMs), Earth Surf. Dynam., 4, 781–798, https://doi.org/10.5194/esurf-4-781-2016, 2016.
Berner, E. K. and Berner, R. A.: Global environment: Water, Air, and Geochemical cycles, 2nd edn., Princeton University Press, New Jersey, USA, ISBN 9780691136783, 2012.
Berner, R. A.: A New Look at the Long-term Carbon Cycle, GSA Today, 9, 1–6, 1999.
Blattmann, T. M., Wang, S.-L., Lupker, M., Märki, L., Haghipour, N., Wacker, L., Chung, L.-H., Bernasconi, S. M., Plötze, M., and Eglinton, T. I.: Sulphuric acid-mediated weathering on Taiwan buffers geological atmospheric carbon sinks, Sci. Rep., 9, 2945, https://doi.org/10.1038/s41598-019-39272-5, 2019.
Bolton, E. W., Berner, R. A., and Petsch, S. T.: The Weathering of Sedimentary Organic Matter as a Control on Atmospheric O2: II. Theoretical Modeling, Am. J. Sci., 306, 575–615, https://doi.org/10.2475/08.2006.01, 2006.
Bond-Lamberty, B. and Thomson, A.: A global database of soil respiration data, Biogeosciences, 7, 1915–1926, https://doi.org/10.5194/bg-7-1915-2010, 2010.
Brantley, S. L., Goldhaber, M. B., and Ragnarsdottir, K. V.: Crossing Disciplines and Scales to Understand the Critical Zone, Elements, 3, 307–314, https://doi.org/10.2113/gselements.3.5.307, 2007.
Brantley, S. L., Holleran, M. E., Jin, L., and Bazilevskaya, E.: Probing deep weathering in the Shale Hills Critical Zone Observatory, Pennsylvania (USA): the hypothesis of nested chemical reaction fronts in the subsurface, Earth Surf. Proc. Land., 38, 1280–1298, https://doi.org/10.1002/esp.3415, 2013.
Bufe, A., Hovius, N., Emberson, R., Caves Rugenstein, J. K., Galy, A., Hassenruck-Gudipati, H. J., and Chang, J.-M.: Co-variation of silicate, carbonate and sulfide weathering drives CO2 release with erosion, Nat. Geosci., 14, 211–216, https://doi.org/10.1038/s41561-021-00714-3, 2021.
Burke, A., Present, T. M., Paris, G., Rae, E. C. M., Sandilands, B. H., Gaillardet, J., Peucker-Ehrenbrink, B., Fischer, W. W., McClelland, J. W., Spencer, R. G. M., Voss, B. M., and Adkins, J. F.: Sulfur isotopes in rivers: Insights into global weathering budgets, pyrite oxidation, and the modern sulfur cycle, Earth Planet. Sc. Lett., 496, 168–177, https://doi.org/10.1016/j.epsl.2018.05.022, 2018.
Calmels, D., Gaillardet, J., Brenot, A., and France-Lanord, C.: Sustained sulfide oxidation by physical erosion processes in the Mackenzie River basin: Climatic perspectives, Geology, 35, 1003–1006, https://doi.org/10.1130/G24132A.1, 2007.
Carriere, A., Le Bouteiller, C., Tucker, G. E., Klotz, S., and Naaim, M.: Impact of vegetation on erosion: Insights from the calibration and test of a landscape evolution model in alpine badland catchments, Earth Surf. Proc. Land., 45, 1085–1099, https://doi.org/10.1002/esp.4741, 2020.
Chang, S. and Berner, R. A.: Coal weathering and the geochemical carbon cycle, Geochim. Cosmochim. Ac., 63, 3301–3310, https://doi.org/10.1016/S0016-7037(99)00252-5, 1999.
Copard, Y., Di-Giovanni, C., Martaud, T., Albéric, P., and Olivier, J.-E.: Using Rock-Eval 6 pyrolysis for tracking fossil organic carbon in modern environments: implications for the roles of erosion and weathering, Earth Surf. Proc. Land., 31, 135–153, https://doi.org/10.1002/esp.1319, 2006.
Cras, A., Marc, V., and Travi, Y.: Hydrological behaviour of sub-Mediterranean alpine headwater streams in a badlands environment, J. Hydrol., 339, 130–144, https://doi.org/10.1016/j.jhydrol.2007.03.004, 2007.
Davidson, E. A. and Trumbore, S. E.: Gas diffusivity and production of CO2 in deep soils of the eastern Amazon, Tellus, 47B, 550–565, https://doi.org/10.3402/tellusb.v47i5.16071, 1995.
Draix-Bléone Observatory: Observatoire hydrosedimentaire de montagne Draix-Bléone [Data set], Irstea, https://doi.org/10.17180/obs.draix, 2015.
Esteves, M., Descroix, L., Mathys, N., and Marc Lapetite, J.: Soil hydraulic properties in a marly gully catchment (Draix, France), Catena, 63, 282–298, https://doi.org/10.1016/j.catena.2005.06.006, 2005.
Fischer, C. and Gaupp, R.: Change of black shale organic material surface area during oxidative weathering: Implications for rock-water surface evolution, Geochim. Cosmochim. Ac., 69, 1213–1224, https://doi.org/10.1016/j.gca.2004.09.021, 2005.
Gaillardet, J., Dupré, B., Louvat, P., and Allègre, C. J.: Global silicate weathering and CO2 consumption rates deduced from the chemistry of large rivers, Chem. Geol., 159, 3–30, https://doi.org/10.1016/S0009-2541(99)00031-5, 1999.
Gaillardet, J., Braud, I., Hankard, F., Anquetin, S., Bour, O., and N. Dorfliger, J. R.: OZCAR: The French Network of Critical Zone Observatories, Vadose Zone J., 17, 180067, https://doi.org/10.2136/vzj2018.04.0067, 2018.
Garel, E., Marc, V., Ruy, S., Cognard-Plancq, A.-L., Klotz, S., Emblanch, C., and Simler, R.: Large scale rainfall simulation to investigate infiltration processes in a small landslide under dry initial conditions: the Draix hillslope experiment, Hydrol. Process., 26, 2171–2186, https://doi.org/10.1002/hyp.9273, 2012.
Garnett, M. H. and Murray, C.: Processing of CO2 Samples Collected Using Zeolite Molecular Sieve for 14C Analysis at the NERC Radiocarbon Facility (East Kilbride, UK), Radiocarbon, 55, 410–415, https://doi.org/10.1017/S0033822200057532, 2013.
Garnett, M. H., Newton, J.-A., and Ascough, P. L.: Advances in the Radiocarbon Analysis of Carbon dioxide at the NERC Radiocarbon Facility (East Kilbride) using Molecular sieve Cartridges, Radiocarbon, 61, 1855–1865, https://doi.org/10.1017/RDC.2019.86, 2019.
Graz, Y., Di-Giovanni, C., Copard, Y., Elie, M., Faure, P., Laggoun Defarge, F., Lévèque, J., Michels, R., and Olivier, J. E.: Occurrence of fossil organic matter in modern environments: Optical, geochemical and isotopic evidence, Appl. Geochem., 26, 1302–1314, https://doi.org/10.1016/j.apgeochem.2011.05.004, 2011.
Graz, Y., Di-Giovanni, C., Copard, Y., Mathys, N., Cras, A., and Marc, V.: Annual fossil organic carbon delivery due to mechanical and chemical weathering of marly badlands areas, Earth Surf. Proc. Land., 37, 1263–1271, https://doi.org/10.1002/esp.3232, 2012.
Gu, X., Rempe, D. M., Dietrich, W. E., West, A. J., Lin, T.-C., Jin, L., and Brantley, S. L.: Chemical reactions, porosity, and microfracturing in shale during weathering: The effect of erosion rate, Geochim. Cosmochim. Ac., 269, 63–100, https://doi.org/10.1016/j.gca.2019.09.044, 2020a.
Gu, X., Heaney, P. J., Reis, F. D. A. A., and Brantley, S. L.: Deep abiotic weathering of pyrite, Science, 370, eabb8092, https://doi.org/10.1126/science.abb8092, 2020b.
Hardie, S. M. L., Garnett, M. H., Fallick, A. E., Rowland, A. P., and Ostle, N. J.: Carbon Dioxide Capture Using a Zeolite Molecular Sieve Sampling System for Isotopic Studies (13C and 14C) of Respiration, Radiocarbon, 47, 441–451, https://doi.org/10.1017/S0033822200035220, 2005.
Hartmann, J. and Moosdorf, N.: The new global lithological map database GLiM: A representation of rock properties at the Earth surface, Geochem. Geophy. Geosy., 13, Q12004, https://doi.org/10.1029/2012GC004370, 2012.
Hashimoto, S. and Komatsu, H.: Relationships between soil CO2 concentration and CO2 production, temperature, water content, and gas diffusivity: implications for field studies through sensitivity analyses, J. For. Res., 11, 41–50, https://doi.org/10.1007/s10310-005-0185-4, 2006.
Heimsath, A. M., DiBiase, R. A., and Whipple, K. X.: Soil production limits and the transition to bedrock-dominated landscapes, Nat. Geosci., 5, 210–214, https://doi.org/10.1038/ngeo1380, 2012.
Hemingway, J. D., Hilton, R. G., Hovius, N., Eglinton, T. I., Haghipour, N., Wacker, L., Chen, M.-C., and Galy, V. V.: Microbial oxidation of lithospheric organic carbon in rapidly eroding tropical mountain soils, Science, 360, 209–212, https://doi.org/10.1126/science.aao6463, 2018.
Hicks Pries, C., Angert, A., Castanha, C., Hilman, B., and Torn, M. S.: Using respiration quotients to track changing sources of soil respiration seasonally and with experimental warming, Biogeosciences, 17, 3045–3055, https://doi.org/10.5194/bg-17-3045-2020, 2020.
Hilton, R. G. and West, A. J.: Mountains, erosion and the carbon cycle, Nat. Rev. Earth Environ., 1, 284–299, https://doi.org/10.1038/s43017-020-0058-6, 2020.
Hilton, R. G., Turowski, J. M., Winnick, M., Dellinger, M., Schleppi, P., Williams, K. H., Lawrence, C. R., Maher, K., West, M., and Hayton, A.: Concentration-Discharge Relationships of Dissolved Rhenium in Alpine Catchments Reveal Its Use as a Tracer of Oxidative Weathering, Water Resour. Res., 57, e2021WR029844, https://doi.org/10.1029/2021WR029844, 2021.
Janjou, D.: Descriptif des cartes géologiques à 1/50 000 format “vecteurs” [Map], Bur. Rech. géologiques minières, Orléans, Fr., RP-53571, 2004.
Kalks, F., Noren, G., Mueller, C. W., Helfrich, M., Rethemeyer, J., and Don, A.: Geogenic organic carbon in terrestrial sediments and its contribution to total soil carbon, SOIL, 7, 347–362, https://doi.org/10.5194/soil-7-347-2021, 2021.
Keller, C. K. and Bacon, D. H.: Soil respiration and georespiration distinguished by transport analyses of vadose CO2, 13CO2, and 14CO2, Global Biogeochem. Cy., 12, 361–372, https://doi.org/10.1029/98GB00742, 1998.
Killops, S. and Killops, V.: Introduction to Organic Geochemistry, 2nd edn., Blackwell Science Publishing, Malden, USA, 393 pp., ISBN 9780632065042, 2005.
Klotz, S., Le Bouteiller, C., Mathys, N., Fontaine, F., Ravanat, X., Olivier, J.-E., Liébault, F., Jantzi, H., Coulmeau, P., Richard, D., Cambon, J.-P., and Meunier, M.: A high-frequency, long-term data set of hydrology and sediment yield: the alpine badland catchments of Draix-Bléone Observatory, Earth Syst. Sci. Data, 15, 4371–4388, https://doi.org/10.5194/essd-15-4371-2023, 2023.
Le Bouteiller, C., Chambon, G., Naaim-Bouvet, F., and Mathys, N.: Hydraulics and rheology of natural hyperconcentrated flows from Draix-Bleone observatory, French Alps, J. Hydraul. Res., 59, 181–195, https://doi.org/10.1080/00221686.2020.1744750, 2021.
Lebedeva, M. I. and Brantley, S. L.: Relating the depth of the water table to the depth of weathering, Earth Surf. Proc. Land., 45, 2167–2178, https://doi.org/10.1002/esp.4873, 2020.
Lefèvre, R., Barré, P., Moyano, F. E., Christensen, B. T., Bardoux, G., Eglin, T., Girardin, C., Houot, S., Kätterer, T., van Oort, F., and Chenu, C.: Higher temperature sensitivity for stable than for labile soil organic carbon – Evidence from incubations of long-term bare fallow soils, Glob. Change Biol., 20, 633–640, https://doi.org/10.1111/gcb.12402, 2014.
Li, S.-L., Calmels, D., Han, G., Gaillardet, J., and Liu, C.-Q.: Sulfuric acid as an agent of carbonate weathering constrained by δ13CDIC: Examples from Southwest China, Earth Planet. Sc. Lett., 270, 189–199, https://doi.org/10.1016/j.epsl.2008.02.039, 2008.
Liang, L. L., Riveros-Iregui, D. A., Emanuel, R. E., and McGlynn, B. L.: A simple framework to estimate distributed soil temperature from discrete air temperature measurements in data-scarce regions, J. Geophys. Res.-Atmos., 119, 407–417, https://doi.org/10.1002/2013JD020597, 2014.
Lofi, J., Pezard, P., Loggia, D., Garel, E., Gautier, S., Merry, C., and Bondabou, K.: Geological discontinuities, main flow path and chemical alteration in a marly hill prone to slope instability: Assessment from petrophysical measurements and borehole image analysis, Hydrol. Process., 26, 2071–2084, https://doi.org/10.1002/hyp.7997, 2012.
Longbottom, T. L. and Hockaday, W. C.: Molecular and isotopic composition of modern soils derived from kerogen-rich bedrock and implications for the global C cycle, Biogeochemistry, 143, 239–255, https://doi.org/10.1007/s10533-019-00559-4, 2019.
Maier, M. and Schack-Kirchner, H.: Using the gradient method to determine soil gas flux: A review, Agr. Forest Meteorol., 192–193, 78–95, https://doi.org/10.1016/j.agrformet.2014.03.006, 2014.
Mallet, F., Marc, V., Douvinet, J., Rossello, P., Joly, D., and Ruy, S.: Assessing soil water content variation in a small mountainous catchment over different time scales and land covers using geographical variables, J. Hydrol., 591, 125593, https://doi.org/10.1016/j.jhydrol.2020.125593, 2020.
Maquaire, O., Ritzenthaler, A., Fabre, D., Ambroise, B., Thiery, Y., Truchet, E., Malet, J.-P., and Monnet, J.: Caractérisation des profils de formations superficielles par pénétrométrie dynamique à énergie variable: application aux marnes noires de Draix (Alpes-de-Haute-Provence, France), C. R. Geosci., 334, 835–841, https://doi.org/10.1016/S1631-0713(02)01788-1, 2002.
Massman, W. J.: A review of the molecular diffusivities of H2O, CO2, CH4, CO, O3, SO2, NH3, N2O, NO, and NO2 in air, O2 and N2 near STP, Atmos. Environ., 32, 1111–1127, https://doi.org/10.1016/S1352-2310(97)00391-9, 1998.
Mathys, N. and Klotz, S.: DRAIX: A field laboratory for research on hydrology and erosion in mountain areas, in: Proceedings of the 4th Canadian Conference on Geohazards: From Causes to Management, Presse de l'Université Laval, Québec, Canada, 2008.
Mathys, N., Brochot, S., Meunier, M., and Richard, D.: Erosion quantification in the small marly experimental catchments of Draix (Alpes de Haute Provence, France). Calibration of the ETC rainfall–runoff–erosion model, Catena, 50, 527–548, https://doi.org/10.1016/S0341-8162(02)00122-4, 2003.
Millington, R. J.: Gas Diffusion in Porous Media, Science, 130, 100–102, https://doi.org/10.1126/science.130.3367.100.b, 1959.
Mills, B. J. W., Donnadieu, Y., and Goddéris, Y.: Spatial continuous integration of Phanerozoic global biogeochemistry and climate, Gondwana Res., 100, 73–86, https://doi.org/10.1016/j.gr.2021.02.011, 2021.
Milodowski, D. T., Mudd, S. M., and Mitchard, E. T. A.: Erosion rates as a potential bottom-up control of forest structural characteristics in the Sierra Nevada Mountains, Ecology, 96, 31–38, https://doi.org/10.1890/14-0649.1, 2015.
Moon, S., Chamberlain, C. P., and Hilley, G. E.: New estimates of silicate weathering rates and their uncertainties in global rivers, Geochim. Cosmochim. Ac., 134, 257–274, https://doi.org/10.1016/j.gca.2014.02.033, 2014.
Oertel, C., Matschullat, J., Zurba, K., Zimmermann, F., and Erasmi, S.: Greenhouse gas emissions from soils – A review, Geochemistry, 76, 327–352, https://doi.org/10.1016/j.chemer.2016.04.002, 2016.
Oostwoud Wijdenes, D. J. and Ergenzinger, P.: Erosion and sediment transport on steep marly hillslopes, Draix, Haute-Provence, France: an experimental field study, Catena, 33, 179–200, https://doi.org/10.1016/S0341-8162(98)00076-9, 1998.
Peng, S., Hu, Q., and Hamamoto, S.: Diffusivity of rocks: Gas diffusion measurements and correlation to porosity and pore size distribution, Water Resour. Res., 48, W02507, https://doi.org/10.1029/2011WR011098, 2012.
Penman, H. L.: Gas and vapour movements in the soil: I. The diffusion of vapours through porous solids, J. Agr. Sci., 30, 437–462, https://doi.org/10.1017/S0021859600048164, 1940.
Petsch, S. T.: Weathering of Organic Carbon, in: Treatise on Geochemistry, vol. 12, Elsevier, Amsterdam, Netherlands, https://doi.org/10.1016/B978-0-08-095975-7.01013-5, 217–238, 2014.
Pirk, N., Mastepanov, M., Parmentier, F.-J. W., Lund, M., Crill, P., and Christensen, T. R.: Calculations of automatic chamber flux measurements of methane and carbon dioxide using short time series of concentrations, Biogeosciences, 13, 903–912, https://doi.org/10.5194/bg-13-903-2016, 2016.
Rovéra, G. and Robert, Y.: Conditions climatiques hivernales et processus d'érosion périglaciaires dans les bad-lands marneux de Draix (800 m, Alpes du Sud, France), Geogr. Phys. Quatern., 59, 31–48, https://doi.org/10.7202/013735ar, 2006.
Roylands, T., Hilton, R. G., Garnett, M. H., Soulet, G., Newton, J.-A., Peterkin, J. L., and Hancock, P.: Capturing the short-term variability of carbon dioxide emissions from sedimentary rock weathering in a remote mountainous catchment, New Zealand, Chem. Geol., 608, 121024, https://doi.org/10.1016/j.chemgeo.2022.121024, 2022.
Sánchez-Cañete, E. P., Barron-Gafford, G. A., and Chorover, J.: A considerable fraction of soil-respired CO2 is not emitted directly to the atmosphere, Sci. Rep., 8, 13518, https://doi.org/10.1038/s41598-018-29803-x, 2018.
Seifert, A.-G., Trumbore, S., Xu, X., Zhang, D., Kothe, E., and Gleixner, G.: Variable effects of labile carbon on the carbon use of different microbial groups in black slate degradation, Geochim. Cosmochim. Ac., 75, 2557–2570, https://doi.org/10.1016/j.gca.2011.02.037, 2011.
Soucémarianadin, L. N., Cécillon, L., Guenet, B., Chenu, C., Baudin, F., Nicolas, M., Girardin, C., and Barré, P.: Environmental factors controlling soil organic carbon stability in French forest soils, Plant Soil, 426, 267–286, https://doi.org/10.1007/s11104-018-3613-x, 2018.
Soulet, G., Hilton, R. G., Garnett, M. H., Dellinger, M., Croissant, T., Ogrič, M., and Klotz, S.: Technical note: In situ measurement of flux and isotopic composition of CO2 released during oxidative weathering of sedimentary rocks, Biogeosciences, 15, 4087–4102, https://doi.org/10.5194/bg-15-4087-2018, 2018.
Soulet, G., Hilton, R. G., Garnett, M. H., Roylands, T., Klotz, S., Croissant, T., Dellinger, M., and Le Bouteiller, C.: Temperature control on CO2 emissions from the weathering of sedimentary rocks, Nat. Geosci., 14, 665–671, https://doi.org/10.1038/s41561-021-00805-1, 2021.
Stolper, D. A., Bender, M. L., Dreyfus, G. B., Yan, Y., and Higgins, J. A.: A Pleistocene ice core record of atmospheric O2 concentrations, Science, 353, 1427–1430, https://doi.org/10.1126/science.aaf5445, 2016.
Sullivan, P. L., Hynek, S. A., Gu, X., Singha, K., White, T., West, N., Kim, H., Clarke, B., Kirby, E., Duffy, C., and Brantley, S. L.: Oxidative dissolution under the channel leads geomorphological evolution at the Shale Hills catchment, Am. J. Sci., 316, 981–1026, https://doi.org/10.2475/10.2016.02, 2016.
Sundquist, E. T. and Visser, K.: The Geologic History of the Carbon Cycle, in: Treatise on Geochemistry, vol. 8, edited by: Schlesinger, W. H., Holland, H. D., and Turekian, K. K., Elsevier, Amsterdam, the Netherlands, 425–472, https://doi.org/10.1016/B0-08-043751-6/08133-0, 2003.
Tamamura, S., Ueno, A., Aramaki, N., Matsumoto, H., Uchida, K., Igarashi, T., and Kaneko, K.: Effects of oxidative weathering on the composition of organic matter in coal and sedimentary rock, Org. Geochem., 81, 8–19, https://doi.org/10.1016/j.orggeochem.2015.01.006, 2015.
Tokunaga, T. K., Kim, Y., Conrad, M. E., Bill, M., Hobson, C., Williams, K. H., Dong, W., Wan, J., Robbins, M. J., Long, P. E., Faybishenko, B., Christensen, J. N., and Hubbard, S. S.: Deep Vadose Zone Respiration Contributions to Carbon Dioxide Fluxes from a Semiarid Floodplain, Vadose Zone J., 15, vzj2016.02.0014, https://doi.org/10.2136/vzj2016.02.0014, 2016.
Torres, M. A., West, A. J., and Li, G.: Sulphide oxidation and carbonate dissolution as a source of CO2 over geological timescales, Nature, 507, 346–349, https://doi.org/10.1038/nature13030, 2014.
Travelletti, J., Sailhac, P., Malet, J.-P., Grandjean, G., and Ponton, J.: Hydrological response of weathered clay-shale slopes: water infiltration monitoring with time-lapse electrical resistivity tomography, Hydrol. Process., 26, 2106–2119, https://doi.org/10.1002/hyp.7983, 2012.
Tune, A. K., Druhan, J. L., Wang, J., Bennett, P. C., and Rempe, D. M.: Carbon Dioxide Production in Bedrock Beneath Soils Substantially Contributes to Forest Carbon Cycling, J. Geophys. Res.-Biogeo., 125, e2020JG005795, https://doi.org/10.1029/2020JG005795, 2020.
Tune, A. K., Druhan, J. L., Lawrence, C. R., and Rempe, D. M.: Deep root activity overprints weathering of petrogenic organic carbon in shale, Earth Planet. Sc. Lett., 607, 118048, https://doi.org/10.1016/j.epsl.2023.118048, 2023.
Wan, J., Tokunaga, T. K., Brown, W., Newman, A. W., Dong, W., Bill, M., Beutler, C. A., Henderson, A. N., Harvey-Costello, N., Conrad, M. E., Bouskill, N. J., Hubbard, S. S., and Williams, K. H.: Bedrock weathering contributes to subsurface reactive nitrogen and nitrous oxide emissions, Nat. Geosci., 14, 217–224, https://doi.org/10.1038/s41561-021-00717-0, 2021.
Weisbrod, N., Dragila, M. I., Nachshon, U., and Pillersdorf, M.: Falling through the cracks: The role of fractures in Earth-atmosphere gas exchange, Geophys. Res. Lett., 36, L02401, https://doi.org/10.1029/2008GL036096, 2009.
White, A. F. and Brantley, S. L.: The effect of time on the weathering of silicate minerals: why do weathering rates differ in the laboratory and field?, Chem. Geol., 202, 479–506, https://doi.org/10.1016/j.chemgeo.2003.03.001, 2003.
Włodarczyk, A., Lirski, M., Fogtman, A., Koblowska, M., Bidziñski, G., and Matlakowska, R.: The Oxidative Metabolism of Fossil Hydrocarbons and Sulfide Minerals by the Lithobiontic Microbial Community Inhabiting Deep Subterrestrial Kupferschiefer Black Shale, Front. Microbiol., 9, 972, https://doi.org/10.3389/fmicb.2018.00972, 2018.
Yan, Y., Brook, E. J., Kurbatov, A. V., Severinghaus, J. P., and Higgins, J. A.: Ice core evidence for atmospheric oxygen decline since the Mid-Pleistocene transition, Sci. Adv., 7, eabj9341, https://doi.org/10.1126/sciadv.abj9341, 2021.
Zondervan, J. R., Hilton, R. G., Dellinger, M., Clubb, F. J., Roylands, T., and Ogrič, M.: Rock organic carbon oxidation CO2 release offsets silicate weathering sink. Nature, 623, 329–333, https://doi.org/10.1038/s41586-023-06581-9, 2023.
- Abstract
- Introduction
- Material and methods
- Results
- Discussion
- Conclusions
- Appendix A: Modeling chamber temperatures
- Appendix B: Data flow diagram for chamber-based CO2 and O2 flux measurements
- Appendix C: Linear regression of pCO2 Rock and CO2 accumulation rates
- Appendix D: Linear regression of diffusivity measures
- Appendix E: Different diffusion pathways of a closed versus manipulated chamber
- Appendix F: Repeated CO2 flux measurements on the same date
- Data availability
- Author contributions
- Competing interests
- Disclaimer
- Acknowledgements
- Financial support
- Review statement
- References
- Supplement