the Creative Commons Attribution 4.0 License.
the Creative Commons Attribution 4.0 License.
 | 01 Feb 2024
Flexural isostatic response of continental-scale deltas to climatically driven sea level changes
Sara Polanco
Mike Blum
Tristan Salles
Bruce C. Frederick
Rebecca Farrington
Xuesong Ding
Ben Mather
Claire Mallard
Louis Moresi
The interplay between climate-forced sea level change, erosional and depositional processes, and flexural isostasy in deep time on passive margin deltas remains poorly understood. We performed a series of conceptual simulations to investigate flexural isostatic responses to high-frequency fluctuations in water and sediment load associated with climatically driven sea level changes. We model a large drainage basin that discharges to a continental margin and produces a large deltaic depocenter, then prescribe synthetic and climatic-driven sea level curves of different frequencies to assess flexural response. Results show that flexural isostatic responses are bidirectional over 100–1000 kyr timescales and are in sync with the magnitude, frequency, and direction of sea level fluctuations and that isostatic adjustments play an important role in driving along-strike and cross-shelf river mouth migration and sediment accumulation. Our findings demonstrate that climate-forced sea level changes produce a feedback mechanism that results in self-sustaining creation of accommodation into which sediment is deposited and plays a major role in delta morphology and stratigraphic architecture.
- Article
(14194 KB) - Full-text XML
-
Supplement
(8248 KB) - BibTeX
- EndNote


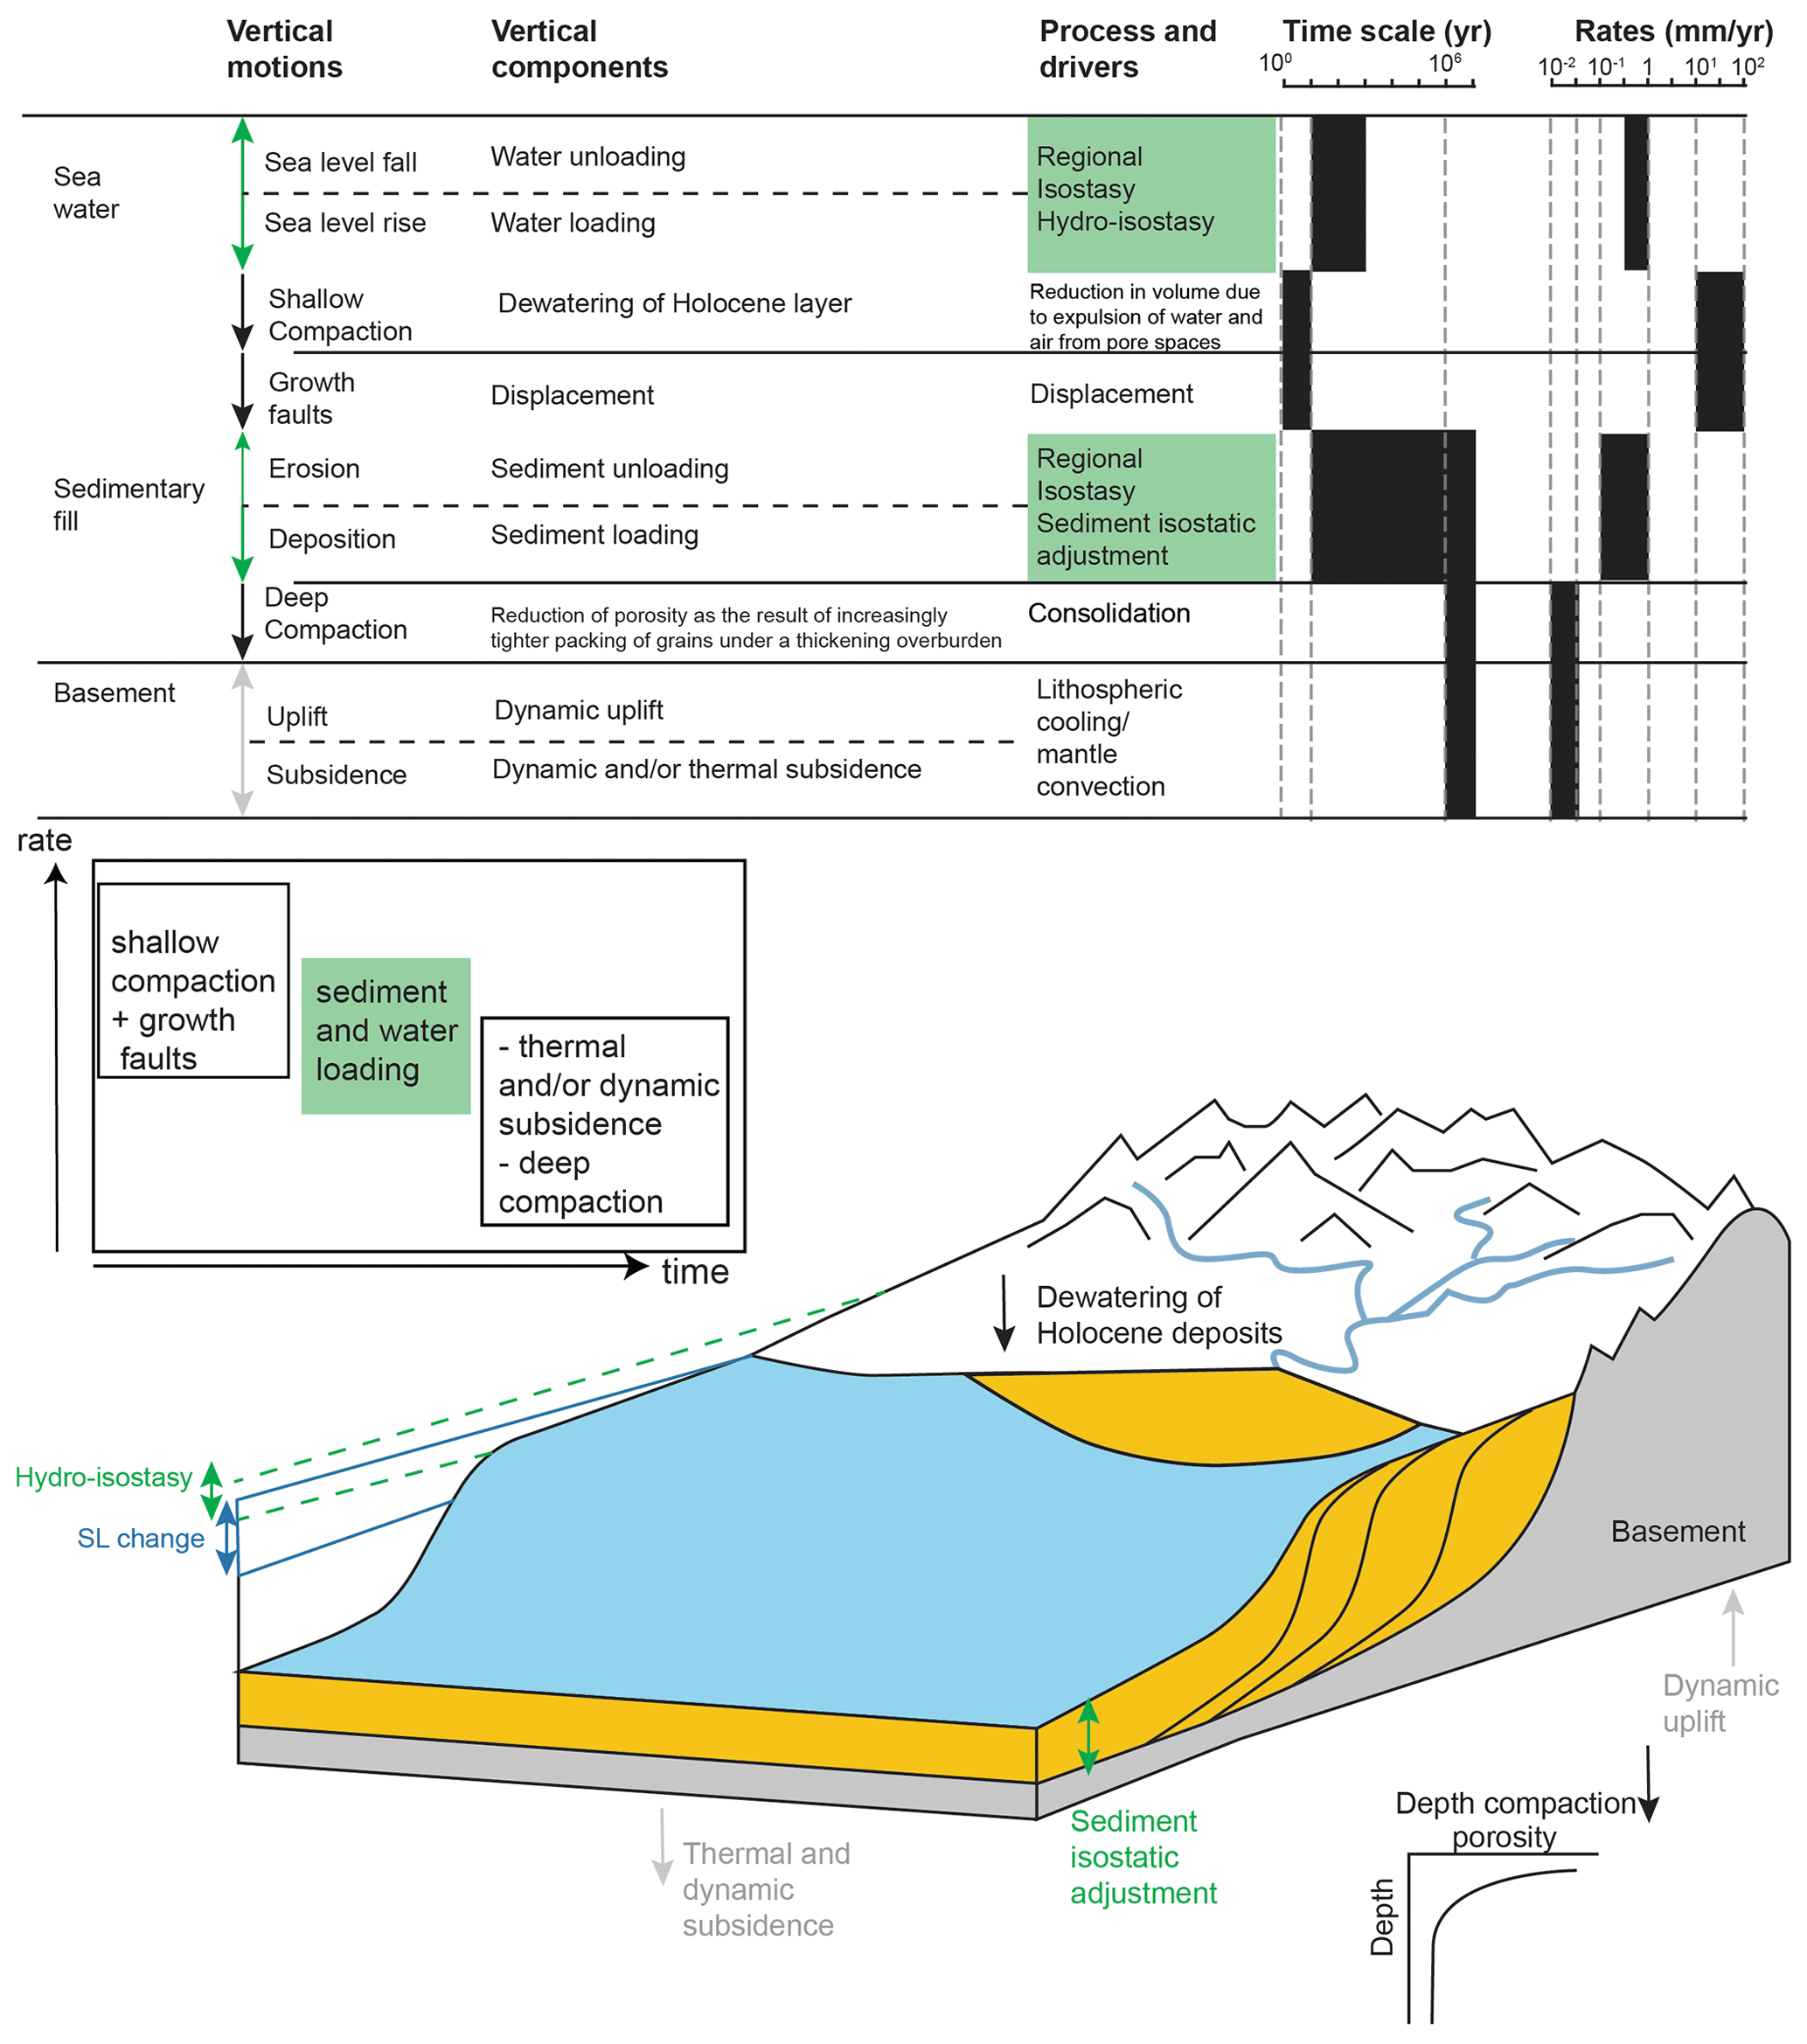
Figure 1Conceptual diagram showing the components of vertical motions in passive margins with deltaic depocenters at different spatio-temporal scales. Rates of vertical motions are from Allen and Allen (2005), Jouet et al. (2008), and Frederick et al. (2019). Processes that can result in both uplift or subsidence, referred to as bidirectional, are shown in green. Sea level change produces hydro-isostatic adjustments that affect both the landward portion of the continental margin and the ocean basin.
Flexural isostatic processes in large deltaic depocenters generally reflect the accumulation of sediment loads on the crust over tens of millions of years and, within the depositional basin itself, can be treated as unidirectional subsidence at the first order (Fig. 1; e.g., Driscoll and Karner et al., 1994; Reynolds et al., 1991; Watts et al., 2009). Over timescales of 103 to 106 years; however, the nature of flexural isostatic response to crustal loading and unloading by ice during Quaternary climate-forced glacial–interglacial cycles is well documented: such glacial isostatic adjustments (GIAs) include bidirectional (subsidence and uplift) and cyclical deflections of the Earth's surface (e.g., Clark et al., 1978; Mitrovica and Peltier, 1991; Lambeck et al., 2014; Whitehouse, 2018). In addition to near-field flexural responses to the direct loading and unloading by ice, GIA includes far-field effects and is associated with hydro-isostatic responses of shorelines to climate-forced global changes in sea level (e.g., Chappell, 1974; Thom and Chappell, 1978; Lambeck and Nakada, 1990; Lambeck et al., 2003; Potter and Lambeck, 2003; Muhs et al., 2020, and many others). The cumulative deep-time (107 to 108 years or more) subsidence within the depositional basin represents the accommodation that results in preservation of the stratigraphic record and is generally well understood, but the stratigraphic imprint of bidirectional and cyclical flexural responses to changes in sediment and water loads over shorter timescales (<106 to 107 years; Fig. 2), as driven by global climate and sea level change, remain less well known.
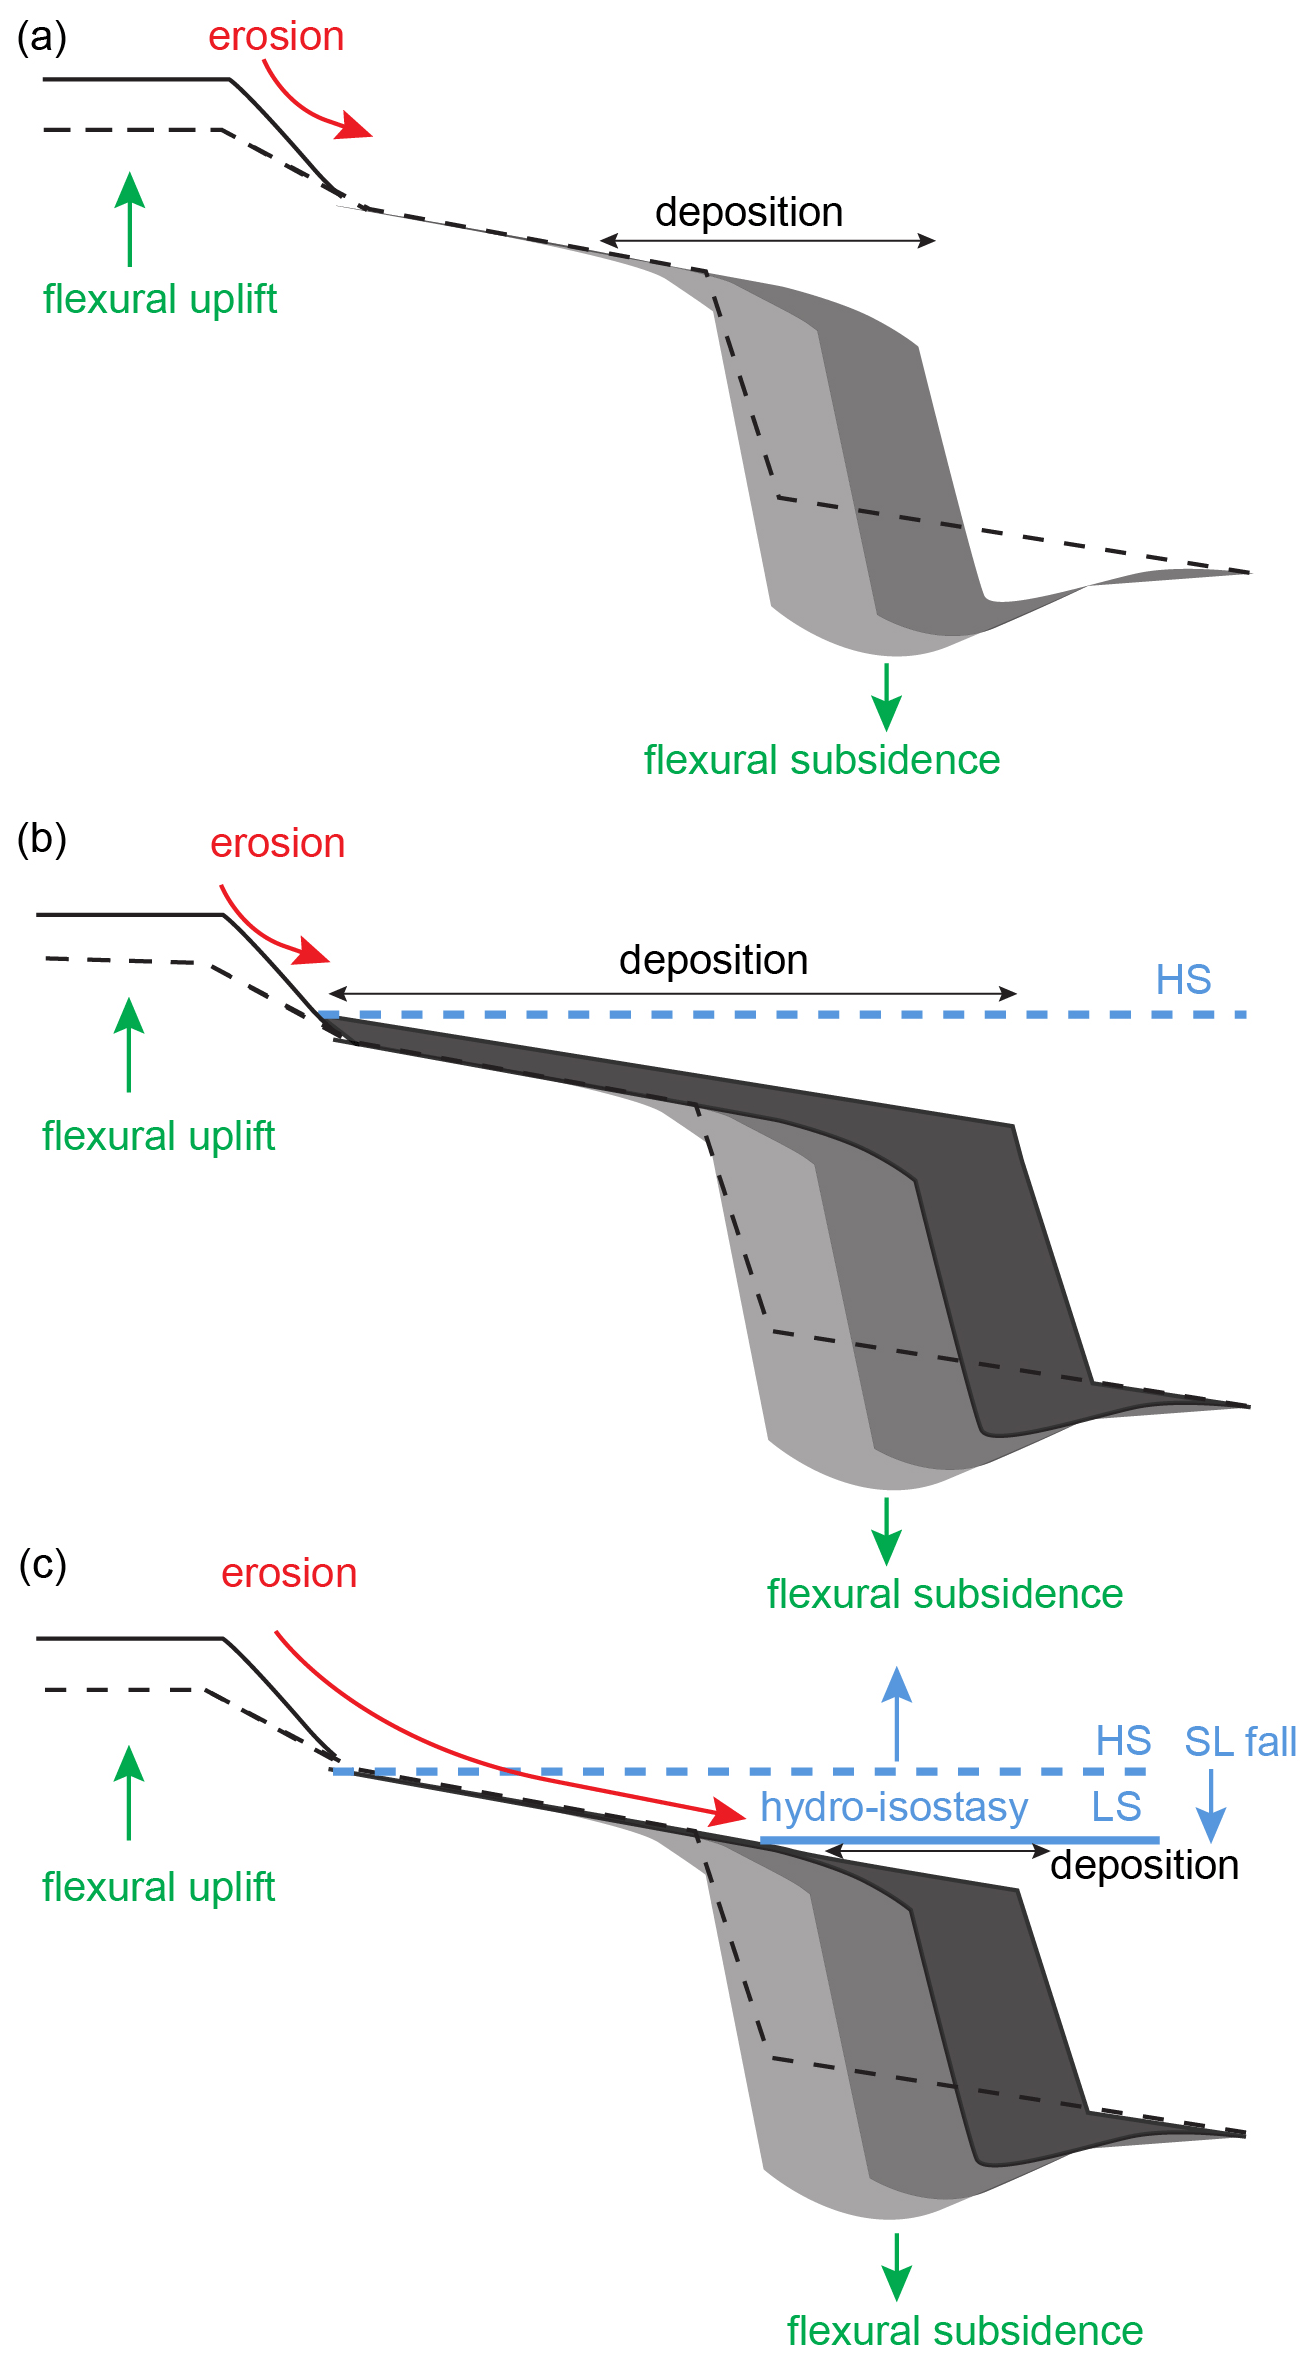
Figure 2Conceptual model illustrating the complex interaction between surface processes (erosion, red; deposition, black), sea level change, and flexural isostasy. Panel (a) shows the uplift generated by the erosion of the sediment load and the subsidence created by the deposition of the prograding sediment load. Panels (b–c) show how the position of the sediment load changes with the position of the sea level (SL) and how hydrostatic uplift takes place as a result of sea level fall. These processes and interactions have been proposed to be key to explaining the concept of continental levering (e.g., Lambeck and Nakada, 1990; Clement et al., 2016; Whitehouse, 2018). HS stands for high stand, while LS stands for low stand. The dashed black line represents the elevation and or bathymetry of the initial surface. Modified from Watts (1989).
A large body of data demonstrates close coupling over multiple timescales between climate and the globally coherent component of sea level change that reflects global changes in ice volumes (Fig. 3; Miller et al., 2020, and references therein). Interglacial periods are characterized by lower ice volumes, higher sea level, and more landward shoreline positions, and they generally result in sediment accumulation in more proximal parts of the shelf. In contrast, glacial periods are characterized by higher ice volumes, lower sea level positions, and a corresponding basinward shift in shorelines, and they generally result in the preferential transfer of sediment to the shelf margin and deep-water parts of sedimentary basins (Johannessen and Steel, 2005; Carvajal et al., 2009; Blum et al., 2008; Sømme et al., 2009; Sweet and Blum, 2016; Mason et al., 2019; Sweet et al., 2020, 2021). Bidirectional high-frequency glacio- and hydro-isostatic adjustments have been extensively studied and are known to significantly impact relative sea level histories (e.g., Clark et al., 1978; Nakada and Lambeck, 1989; Lambeck, 1995; Mitrovica and Milne, 2003; Peltier, 2004; Lambeck et al., 2014; Whitehouse, 2018). Moreover, a few studies have begun to elucidate the presence and significance of high-frequency, cyclical sediment and hydro-isostatic adjustments associated with the response of fluvial and deltaic systems to climate and sea level change. Such studies have focused on the continental-scale Mississippi River delta (e.g., Ivins et al., 2007; Blum et al., 2008; Wolstencroft et al., 2014; Kuchar et al., 2018), the Rhone delta in southern France (e.g., Jouet et al., 2008), and conceptual modeling (e.g., Blum et al., 2013).
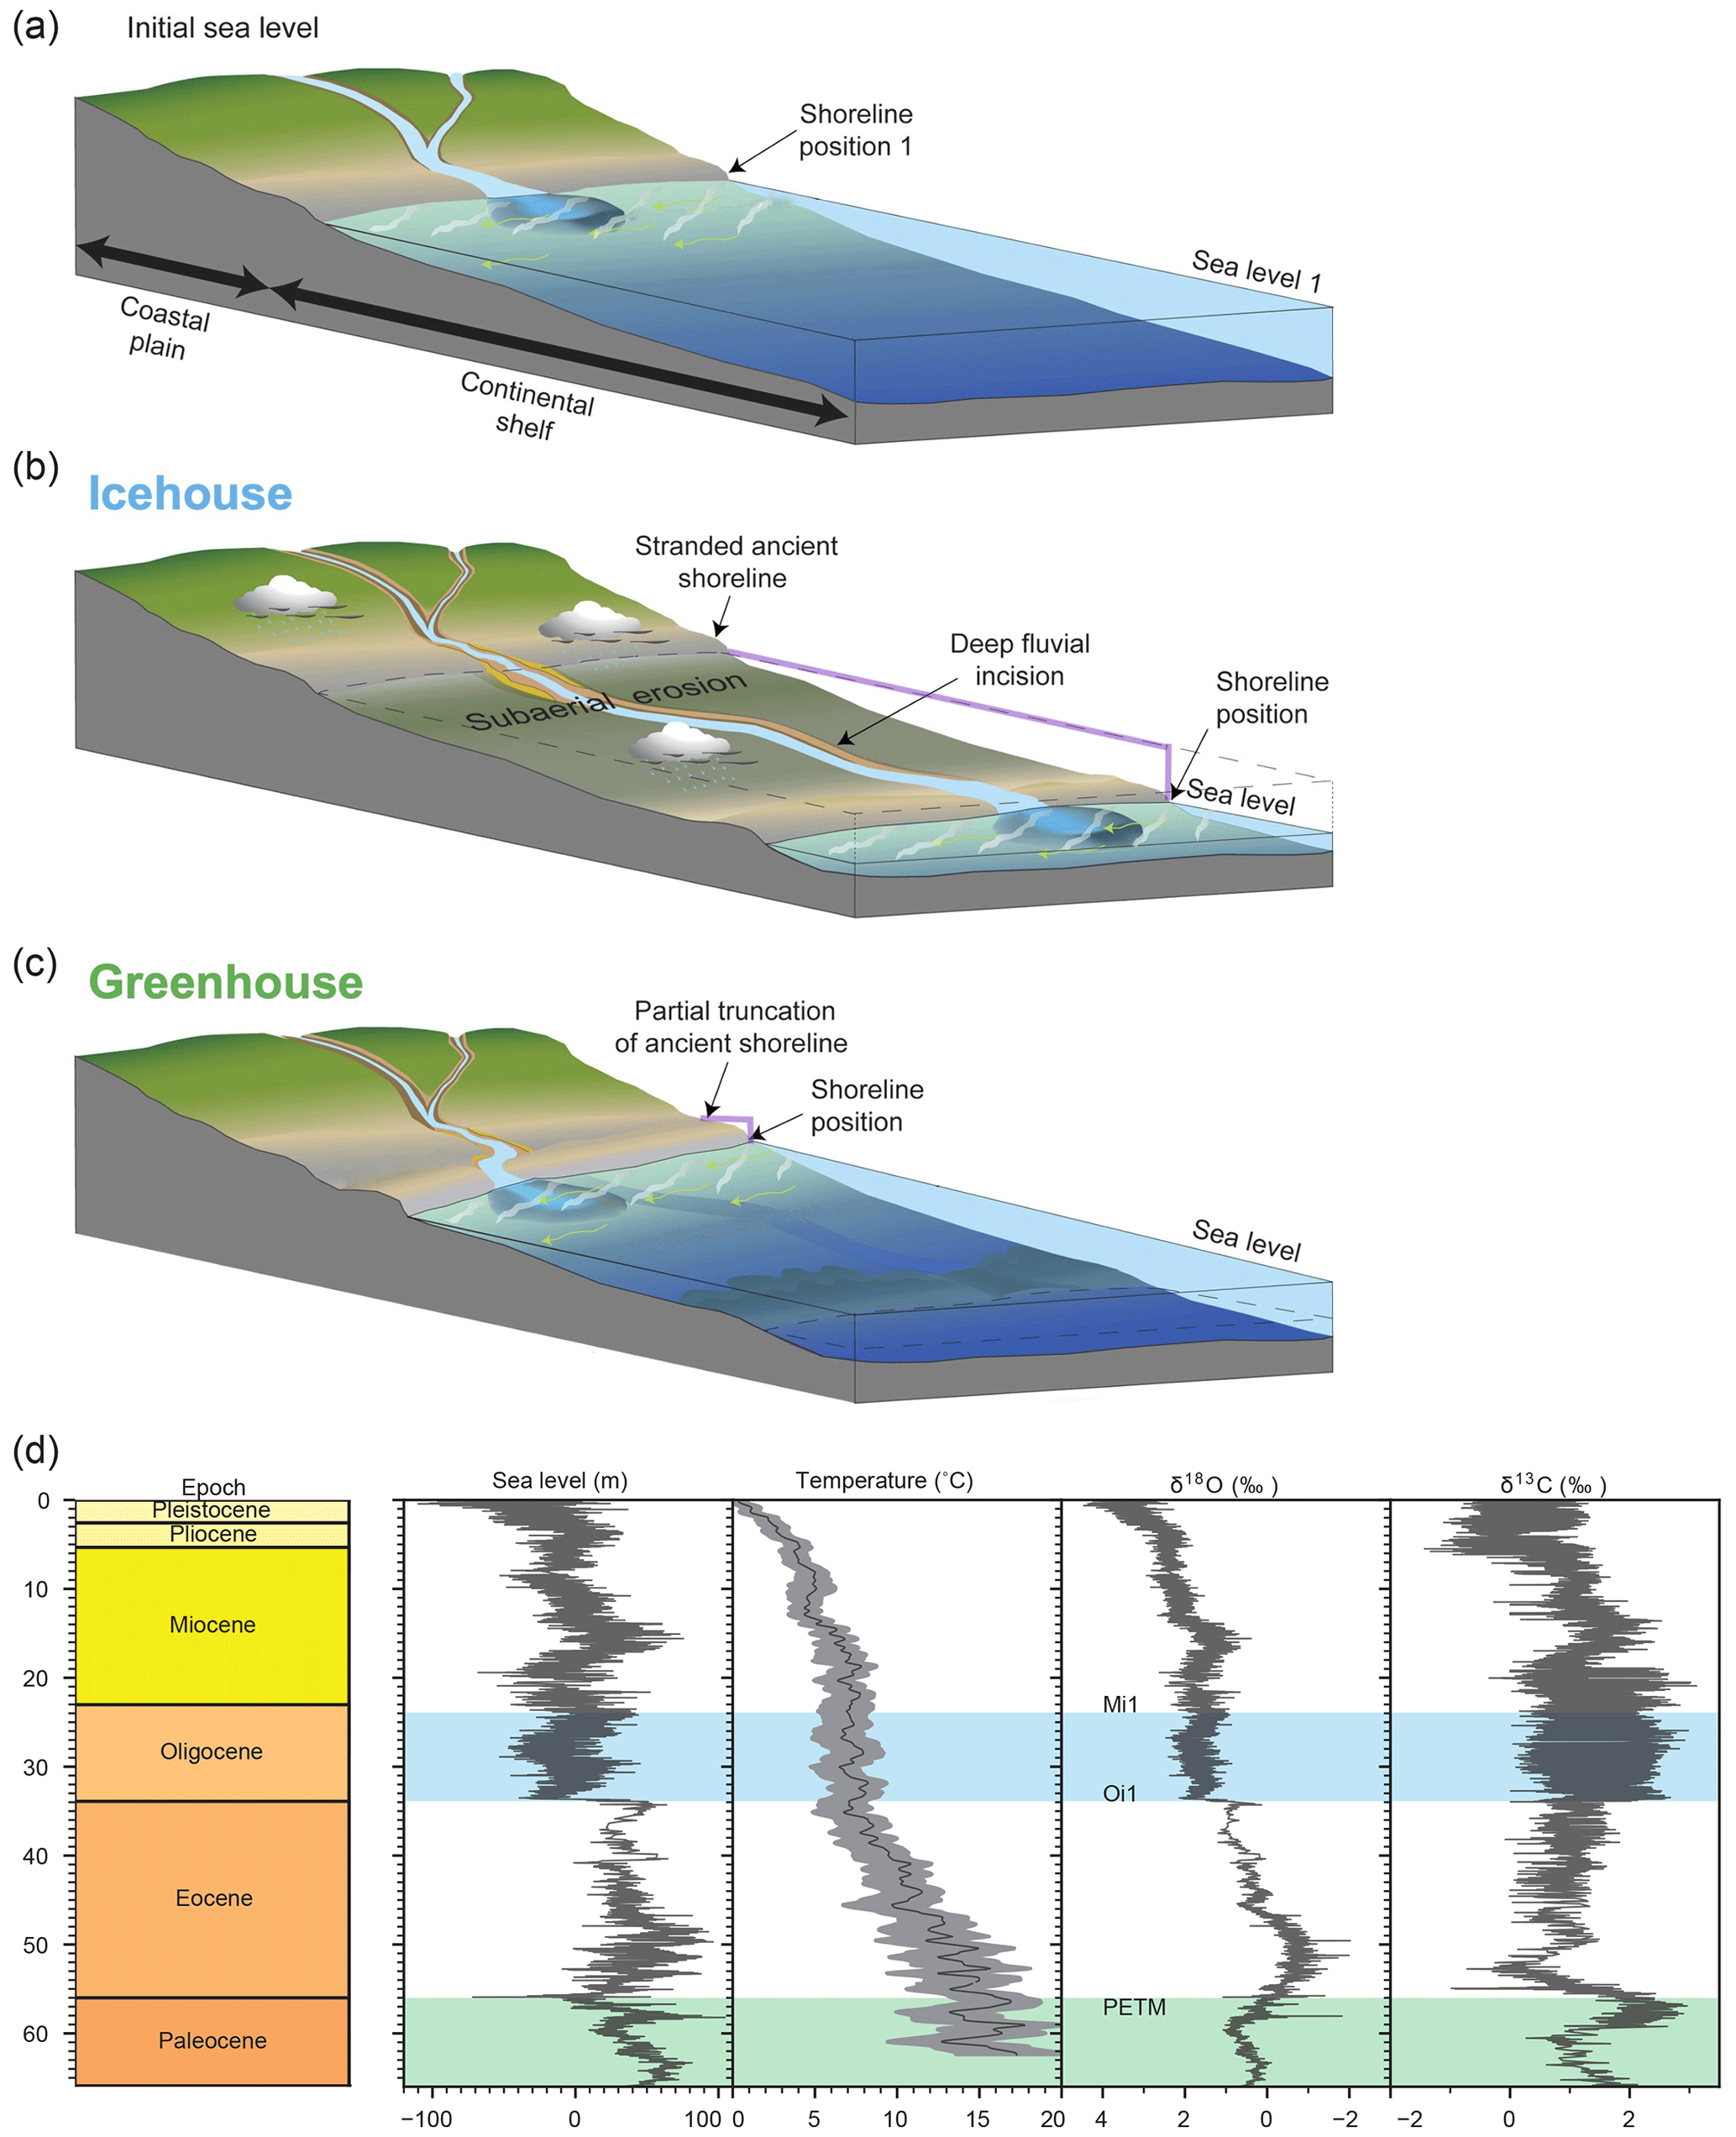
Figure 3Conceptual model for the evolution of (a) deltaic depocenters in response to sea level changes during (b) icehouse and (c) greenhouse periods. The frequent and large-amplitude variation in the sea level (purple line) during icehouse periods results in the exposure of the continental shelf and deep fluvial incision and sediment loads being deposited deep into the basin. In contrast, during greenhouse periods the smaller amplitude of the sea level variation (purple line) results in sediment being deposited closer to the continent. We test the flexural isostatic response of the aforementioned water and sediment partitioning. Figure modified from https://pubs.usgs.gov/ (Schwab et al., 2009). (d) Evidence of the coupling between climate and global sea level change that reflects global changes in ice volumes. The coupling is particularly strong in ice-free (ca. 66–56 Ma, greenhouse) and ice-dominated (ca. 33.9–23.9 Ma, icehouse) periods, which are the focus of this study. Data sources are as follows: sea level data are from Miller et al. (2020), temperature estimates are based on values of Cramer et al. (2011), benthic foraminiferal δ18O data are from Miller et al. (2020), and the carbon isotope record δ13C data are from Zachos et al. (2001).
In this paper, we use numerical models to examine the impact of climate-forced global sea level change, erosional and depositional processes, and flexural isostatic response on the stratigraphic evolution of large deltaic depocenters over timescales of 106 to 107 years (Fig. 3). We use the basin and landscape dynamics code BADLANDS (Salles and Hardiman, 2016; Salles et al., 2018) to develop a continental-scale fluvial–deltaic to deep-water sediment dispersal system and perform a series of tests where we impose synthetic and climate-driven sea level curves of different frequencies to explore the relationships between patterns of sediment accumulation, flexural subsidence, and load partitioning. The coupling of surface processes with flexural isostasy allows us to investigate feedbacks between global sea level change, erosional and depositional processes, and flexural uplift and subsidence within a dynamic framework. Hence, we use an iterative approach because the flexural response can also generate relative changes in sea level, which in turn can modify the spatio-temporal characteristics of isostatic compensation. Our approach is more comprehensive than previous studies that have investigated the role of high-frequency flexural isostatic adjustments in a static manner (e.g., Blum et al., 2008; Jouet et al., 2008), and our experiments produce the clear stratigraphic impacts of high frequency, bidirectional flexural adjustments that are driven by climate-forced global sea level change on the morphology, architecture, and long-term stratigraphic evolution of large deltaic depocenters.
Accommodation from subsidence in large passive margin deltaic depocenters is generated by multiple processes that operate over different timescales, at different depths, and at different rates. (Fig. 1). At the largest spatial and temporal scales, tectonic subsidence is initiated during the initial rifting phase by stretching and thinning of the lithosphere (e.g., Mackenzie, 1978; Galloway, 1989), followed by thermal cooling and contraction of upwelled asthenosphere, which causes the margin to subside during the post-rift phase. In some cases, the amount of post-rift subsidence may exceed the possible thermal contribution, in which case anomalous subsidence has been attributed to dynamic processes that reflect changes in mantle flow (e.g., Wang et al., 2017, 2020).
Vertical movements in passive margin deltaic depocenters over timescales of 106 years and longer are also known to include flexural isostatic response to sediment loading, which produces bending of the lithosphere (Watts et al., 2009). Flexural responses of this kind are typically characterized by subsidence in the depositional basin and development of low-amplitude peripheral bulges hundreds of kilometers onshore and/or alongshore from the depocenter. Published examples include the Amazon (Driscoll and Karner, 1994; Watts et al., 2008), Niger (Doust and Omatbola, 1990), and Mississippi (e.g., Jurkowski et al., 1984; Feng et al., 1994; Frederick et al., 2019) systems. Over shorter Milankovitch orbital timescales of 104 to 106 years, GIA results from climate-driven growth of land ice and loading of continental land masses and the inverse, i.e., melting of land ice and unloading (glacial-isostatic adjustment or GIA) (e.g., Sella et al., 2007; Milne, 2015; Whitehouse, 2018). The growth and decay of land ice also results in global sea level fall and rise, with unloading and loading of the continental shelves. The impacts of GIA and associated hydro-isostasy extend through the marine to terrestrial parts of the system to different degrees but are bidirectional and cyclical over Milankovitch timescales. GIA has a large footprint that includes development of a foredeep proximal to the ice load and a low-amplitude peripheral forebulge located thousands of kilometers away, with each migrating as a flexural wave in response to growth and decay of ice masses. By contrast, hydro-isostatic impacts are generally limited to the marine environment and the lower reaches of large fluvial–deltaic systems but can result in cycles of uplift and subsidence that have been hypothesized to drive changes in the magnitude of fluvial incision and filling of coastal plain to cross-shelf valley systems as the river mouth migrates basinward and landward (Blum et al., 2013).
Growth faults (e.g., Gagliano, 2003; Armstrong et al., 2014; Shen et al., 2016; Pizzi et al., 2020), salt tectonics (Morley et al., 2011; King et al., 2012; Jackson and Hudec, 2017), and compaction of the sediment column (Athy, 1930; Meckel et al., 2007) also contribute to long- and short-term subsidence in deltaic depocenters. Subsidence patterns associated with these drivers can affect coastal and fluvial depositional processes; for example, the steering of fluvial channels and their associated patterns of deposition due to creation of local topographic highs and lows (hundreds to thousands of square kilometers, e.g., Gagliano, 2003; Armstrong et al., 2014; Morón et al., 2017). Moreover, for the modern Mississippi and other large deltas, delta plain subsidence over timescales of 104 years or less is dominated by dewatering and consolidation of recently deposited muddy and/or peat-rich Holocene sediments within the uppermost tens of meters of strata (Törnqvist et al., 2008; Keogh et al., 2021; Steckler et al., 2022).
Subsidence processes in deltaic depocenters operate at different rates, and there is generally an inverse relationship between measured or estimated rates and the time interval over which rate measurements are integrated (e.g., Sadler, 1981, 1999; Frederick et al., 2020; Steckler et al., 2022). On one end of the spectrum, annual cycles of uplift and subsidence with amplitudes up to 60–75 mm have been recorded in the Amazon basin and the Ganges–Brahmaputra delta due to loading by, then drainage of, seasonal rains (Bevis et al., 2005; Steckler et al., 2010). Moreover, over timescales of decades to centuries, subsidence rates associated with consolidation and dewatering of Holocene deltaic sediments can be 5–15 mm yr−1 (e.g., Törnqvist et al., 2008; Jankowski et al., 2017; Keogh et al., 2021; Steckler et al., 2022). On the other end of the spectrum, time-averaged rates of vertical motion associated with deep-seated subsidence drivers (tectonic and/or dynamic subsidence, long-term loading and lithospheric flexure, and deep-seated long-term compaction) can be very low (Frederick et al., 2019): for example, over timescales of 106 years or more, flexural uplift of ∼0.1 mm yr−1 characterizes the landward margin of the Mississippi depocenter. Then, moving south from a hinge line on the delta plain, long-term subsidence rates increase from zero to ∼3 mm yr−1 at the shelf margin (e.g., Frederick et al., 2019; Fig. 11e).
Measuring vertical motion from the longer-term stratigraphic record within a sedimentary basin tends to result in a sense of unidirectional subsidence with low rates that decrease as the interval over which they are measured increases. By contrast, studies of the more recent stratigraphic record of deltaic depocenters make it clear that isostatic processes can be driven by climate change and are both bidirectional and cyclical (e.g., Blum et al., 2008; Jouet et al., 2008; Bevis et al., 2005; Steckler et al., 2010). In this paper, we use the BADLANDS modeling software (Salles and Hardiman, 2016; Salles et al., 2018) to examine the effects of climate-forced sea level change, erosional and depositional processes, and bidirectional flexural isostasy on the morphology, architecture, and stratigraphic evolution of large deltaic depocenters in deep time. BADLANDS links landscape and basin dynamics through simulation of erosion, landscape evolution, and sedimentation where the rate of river incision is described using the stream power equation (Howard, 1980). The hillslope processes are simulated based on a linear sediment transport law, which sets the transport flux equal to a linear function of topographic slope: the simple diffusion law. The isostatic response to changes in water and sediment load is calculated using a two-way coupling between BADLANDS and gFlex (Wickert, 2016), which computes the flexural deflection of the Earth's surface by using an elastic plate flexure solution. For a more detailed description of BADLANDS' constitutive laws see Salles and Hardiman (2016) and Salles et al. (2018).
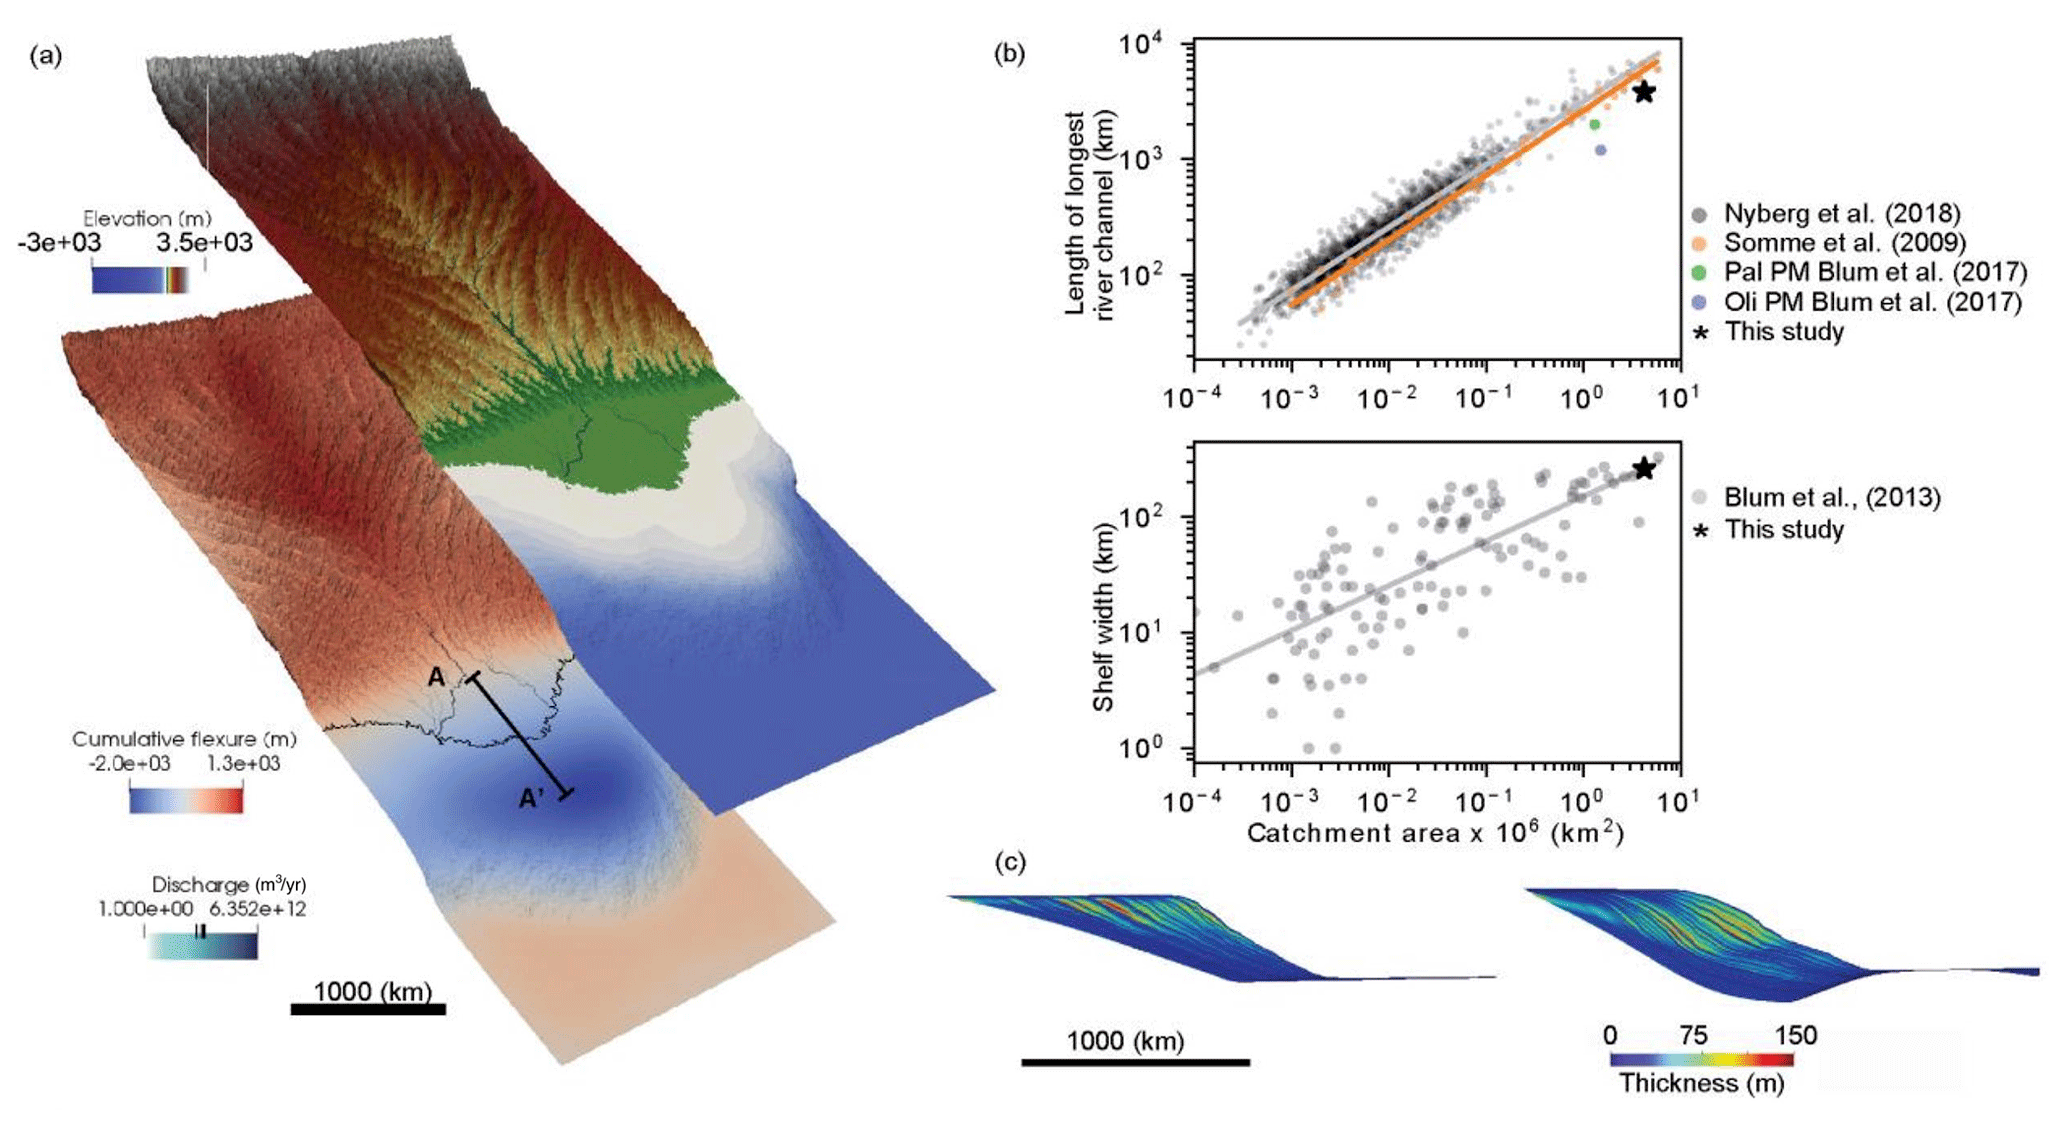
Figure 4(a) Example of the outputs from numerical simulations that show elevation and bathymetry (top) and cumulative flexure (bottom). Discharge is shown in both maps to visualize the paths of the fluvial–deltaic system Model dimensions are 4500 km × 2000 km, with a vertical exaggeration of 100×. (b) Scatter plot of river length (top) and shelf width (bottom) versus catchment area from river systems. Data are from Somme et al. (2009), Nyberg et al. (2018), Blum et al. (2013, 2017), and simulations presented in this study. Pal represents Paleocene, Oli represents Oligocene, and PM represents Paleo-Mississippi. (c) Example of synthetic stratigraphy from a simulation without (left) and with flexural compensation (right). Vertical exaggeration is 150×. Cross-section A–A′ shows where the Wheeler diagrams presented in Fig. 5 were constructed.
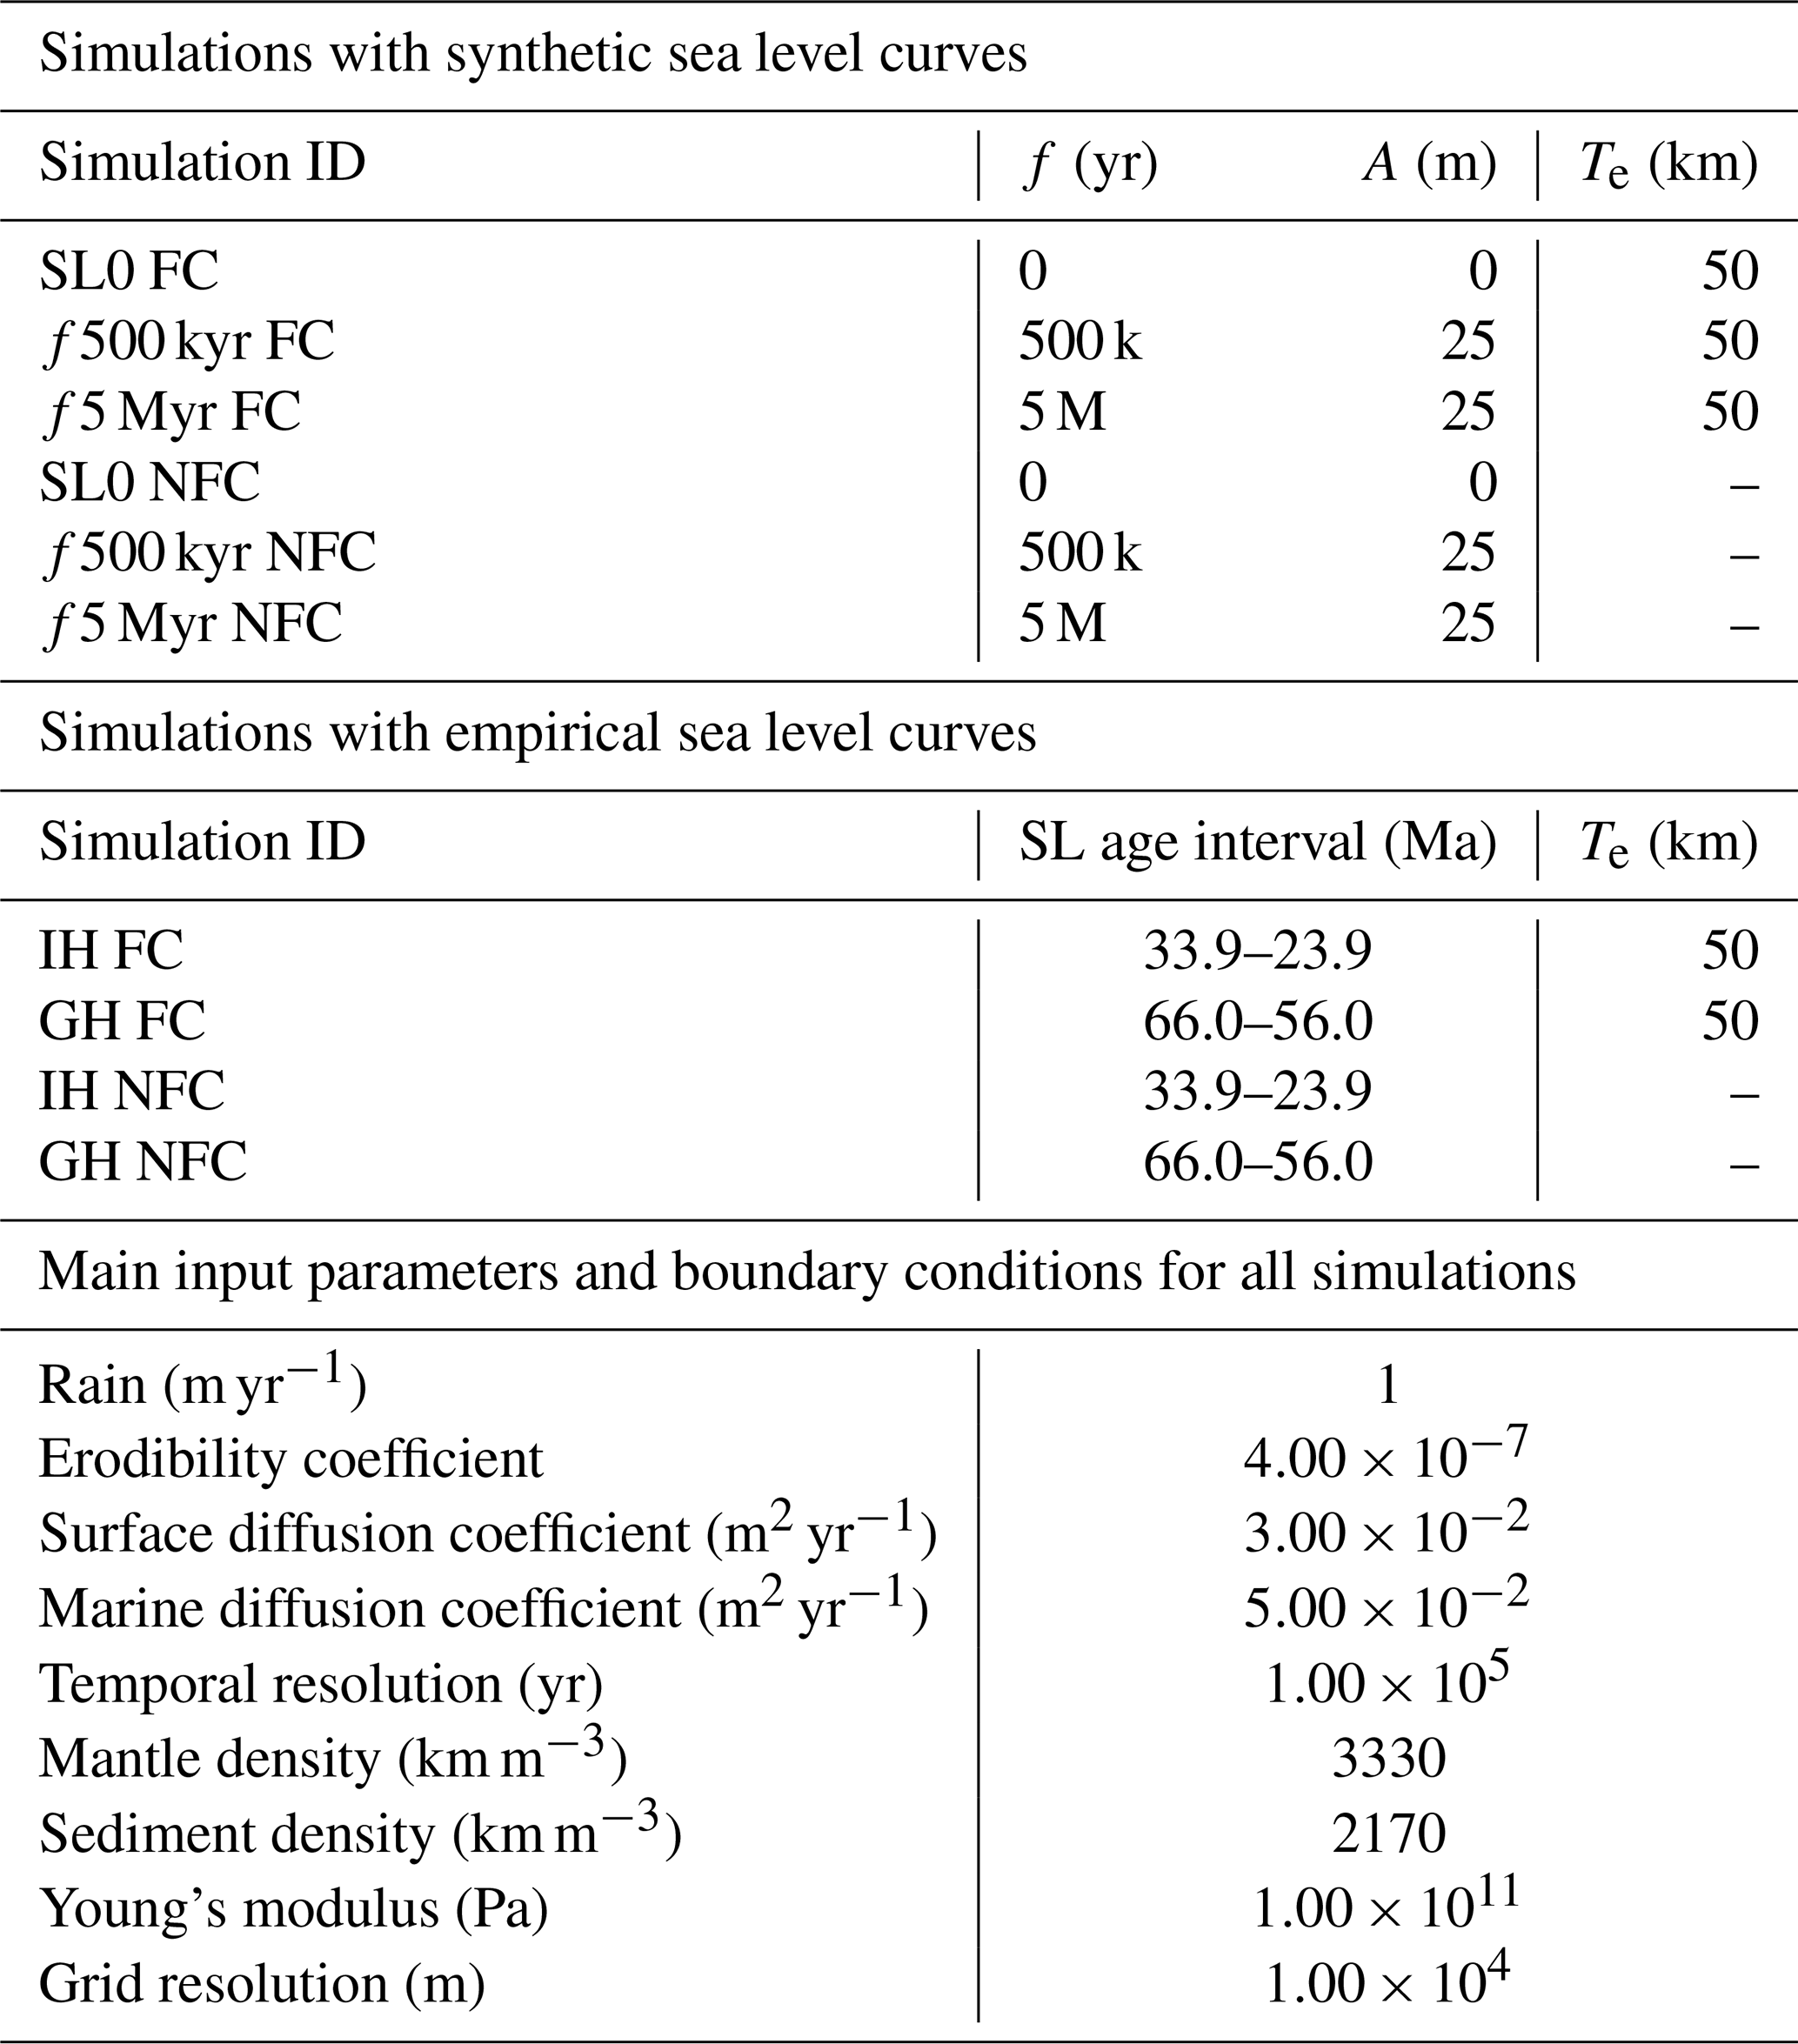
Our experimental design consists of a series of simulations where the initial configuration of the modeling domain resembles the topography of a natural source-to-sink system with 3400 m elevation in the headwaters, a length of 4500 km, a downstream-decreasing fluvial channel slope, and successive inflections in gradient associated with transitions from the coastal plain to continental shelf and from the shelf to slope (Figs. 4a, S1, S2). To ensure that our simulated drainage basin produces a point-source for sediment input to the marine domain we imposed a longitudinal topographic low in the middle of the model. The resultant drainage basin, river channels, deltas, shallow marine shelves, and shelf margins are then self-generated as a result of landscape dynamics that are in turn controlled by hillslope and channel processes, sediment diffusion, uniform precipitation, sea level changes, and flexural isostasy. The three-dimensional spatial mesh size and temporal resolution were chosen to adequately reproduce the geomorphology and architectural evolution of deltaic systems at the first order (Fig. 4c) and to ensure that the frequency of sea level fluctuations is adequately captured. Details about the boundary conditions and input parameters used in the modeling simulations can be found in Table 1 and the data repository.
Table 1Summary of the different input parameters used in the numerical simulations presented in this study. All the boundary conditions and parameters can be found in https://github.com/saraemp/egusphere-2023-53 (last access: 23 January 2024). SL represents sea level, f represents frequency, A represents amplitude, FC represents flexurally compensated simulations, NFC represents non-flexurally compensated simulations, and Te represents elastic thickness.
Our simulations produce catchment areas, river lengths, and volumes of deposited sediment that are consistent with the ranges observed in continental-scale source-to-sink systems such as the Mississippi and Amazon rivers (Fig. 4). We do not aim to reproduce the geological history of a particular continental-scale source-to-sink system, our goal is to better understand first-order relationships between sea level changes, flexural isostasy, and erosion and deposition. The general similarity between our simulated river length and catchment area and large-scale natural source-to-sink systems (Fig. 4b), supports choices made for our initial settings and allows us to draw general comparisons between simulated results and natural systems.
After the initial drainage basin and river system is formed, we perform a series of simulations that first hold sea level constant, then impose synthetic and climate-forced sea level curves. Synthetic curves were constructed to reflect frequencies of 500 kyr and 5 Myr, whereas climate-forced sea level curves were selected from intervals in geologic time with contrasting climatic regimes and therefore contrasting sea level amplitudes and directions: we extracted data from Miller et al. (2020) that correspond to the ice-free Paleocene, ca. 66–56 Ma (hereafter greenhouse) and the ice-dominated Oligocene ca. 33.9–23.9 Ma (icehouse) periods (Fig. 3b, c). These simulations are then compared to a suite of non-flexurally compensated models. The sea level curves we use are resampled to time steps of 50 kyr with outputs generated every 100 kyr. We let each simulation initialize and run for 2 Myr without any sea level fluctuations so that the delta can reach dynamic equilibrium without any disturbances in base level, and we then impose both the synthetic and climate-forced sea level changes.
For flexurally compensated models, we use an effective elastic thickness (Te) of 50 km. This value is within the range observed in passive margins (Tesauro et al., 2012) and similar values have been used in previous flexural studies of continental-scale deltaic depocenters (e.g., Driscoll and Karner, 1994; Watts et al., 2009). Moreover, we test the sensitivity to Te by running a series of simulations where Te varies from 10 to 100 km: results show similar patterns of flexural response when using Te values <60 km, whereas larger values result in a smaller flexural amplitude and larger flexural wavelength (Fig. S3), which is consistent with observations made for rigid lithosphere in cratonic regions (Tesauro et al., 2012). We use a spatially uniform Te value in all simulations and do not account for possible spatial variations that could generate small spatial differences in flexural deflections. However, we consider such differences to be negligible when compared to the flexural response caused by the large sediment loads typical of passive margins. To ensure the computed flexural response is in phase with our imposed sea level cycles, we use a temporal resolution of 100 kyr: here we have also conducted sensitivity tests with higher temporal resolution (up to 10 kyr), and the emergent behaviors are similar to those presented here.
Our models do not include the effect of waves, tides, and shelf currents, although BADLANDS is capable of simulating wave-induced longshore drift (see Salles et al., 2018, which implements the equations from Longuet-Higgins 1970). We recognize the importance of waves, tides, and shelf currents in sediment transport, but those processes move sediment volumes generally in the vicinity of deltaic depocenters and therefore would not play a crucial role in sediment load redistribution. Our simulations hold precipitation constant over time and do not include tectonic or dynamic uplift in upstream regions or lithological changes in subsurface sedimentary layers. Such parameters clearly play a role in the sediment volumes and rates delivered to the marine environment, and therefore the accumulated sediment load, but are not considered here to avoid complicating the analysis of the effect of high-frequency, high-resolution isostatic adjustments on changes in crustal loading due to both the sediment and water load, the primary effect that we aim to unravel in this paper. Our simulations also do not account for sediment compaction or sediments of different grain sizes.
4.1 Model description
All of our simulations develop a drainage basin where rivers merge on the coastal plain and form a delta and act as a point source for sediment input to the marine domain. The simulated sediment flux is controlled by river incision and hillslope diffusion, whereas river incision is governed by precipitation, drainage area, the topographic gradient, and erodibility. Hillslope diffusion is dependent on diffusivity and the topographic gradient. Once the sediment load is deposited in the marine domain, a continental shelf emerges and shelf-margin clinothems (Fig. 4c) are generated.
Our results feature the response of the fluvial–deltaic system to flexural isostasy driven by climate-forced sea level change and illustrate significant impacts on the morphology, architecture, and stratigraphic evolution of continental-scale deltaic depocenters in deep time. Below, we highlight three distinct results: (a) the effects of flexural isostasy on the morphology and stratigraphy of large deltas, (b) the flexural isostatic response to sea level change and its effect on delta evolution, and (c) the effects of hydro-isostasy on delta evolution.
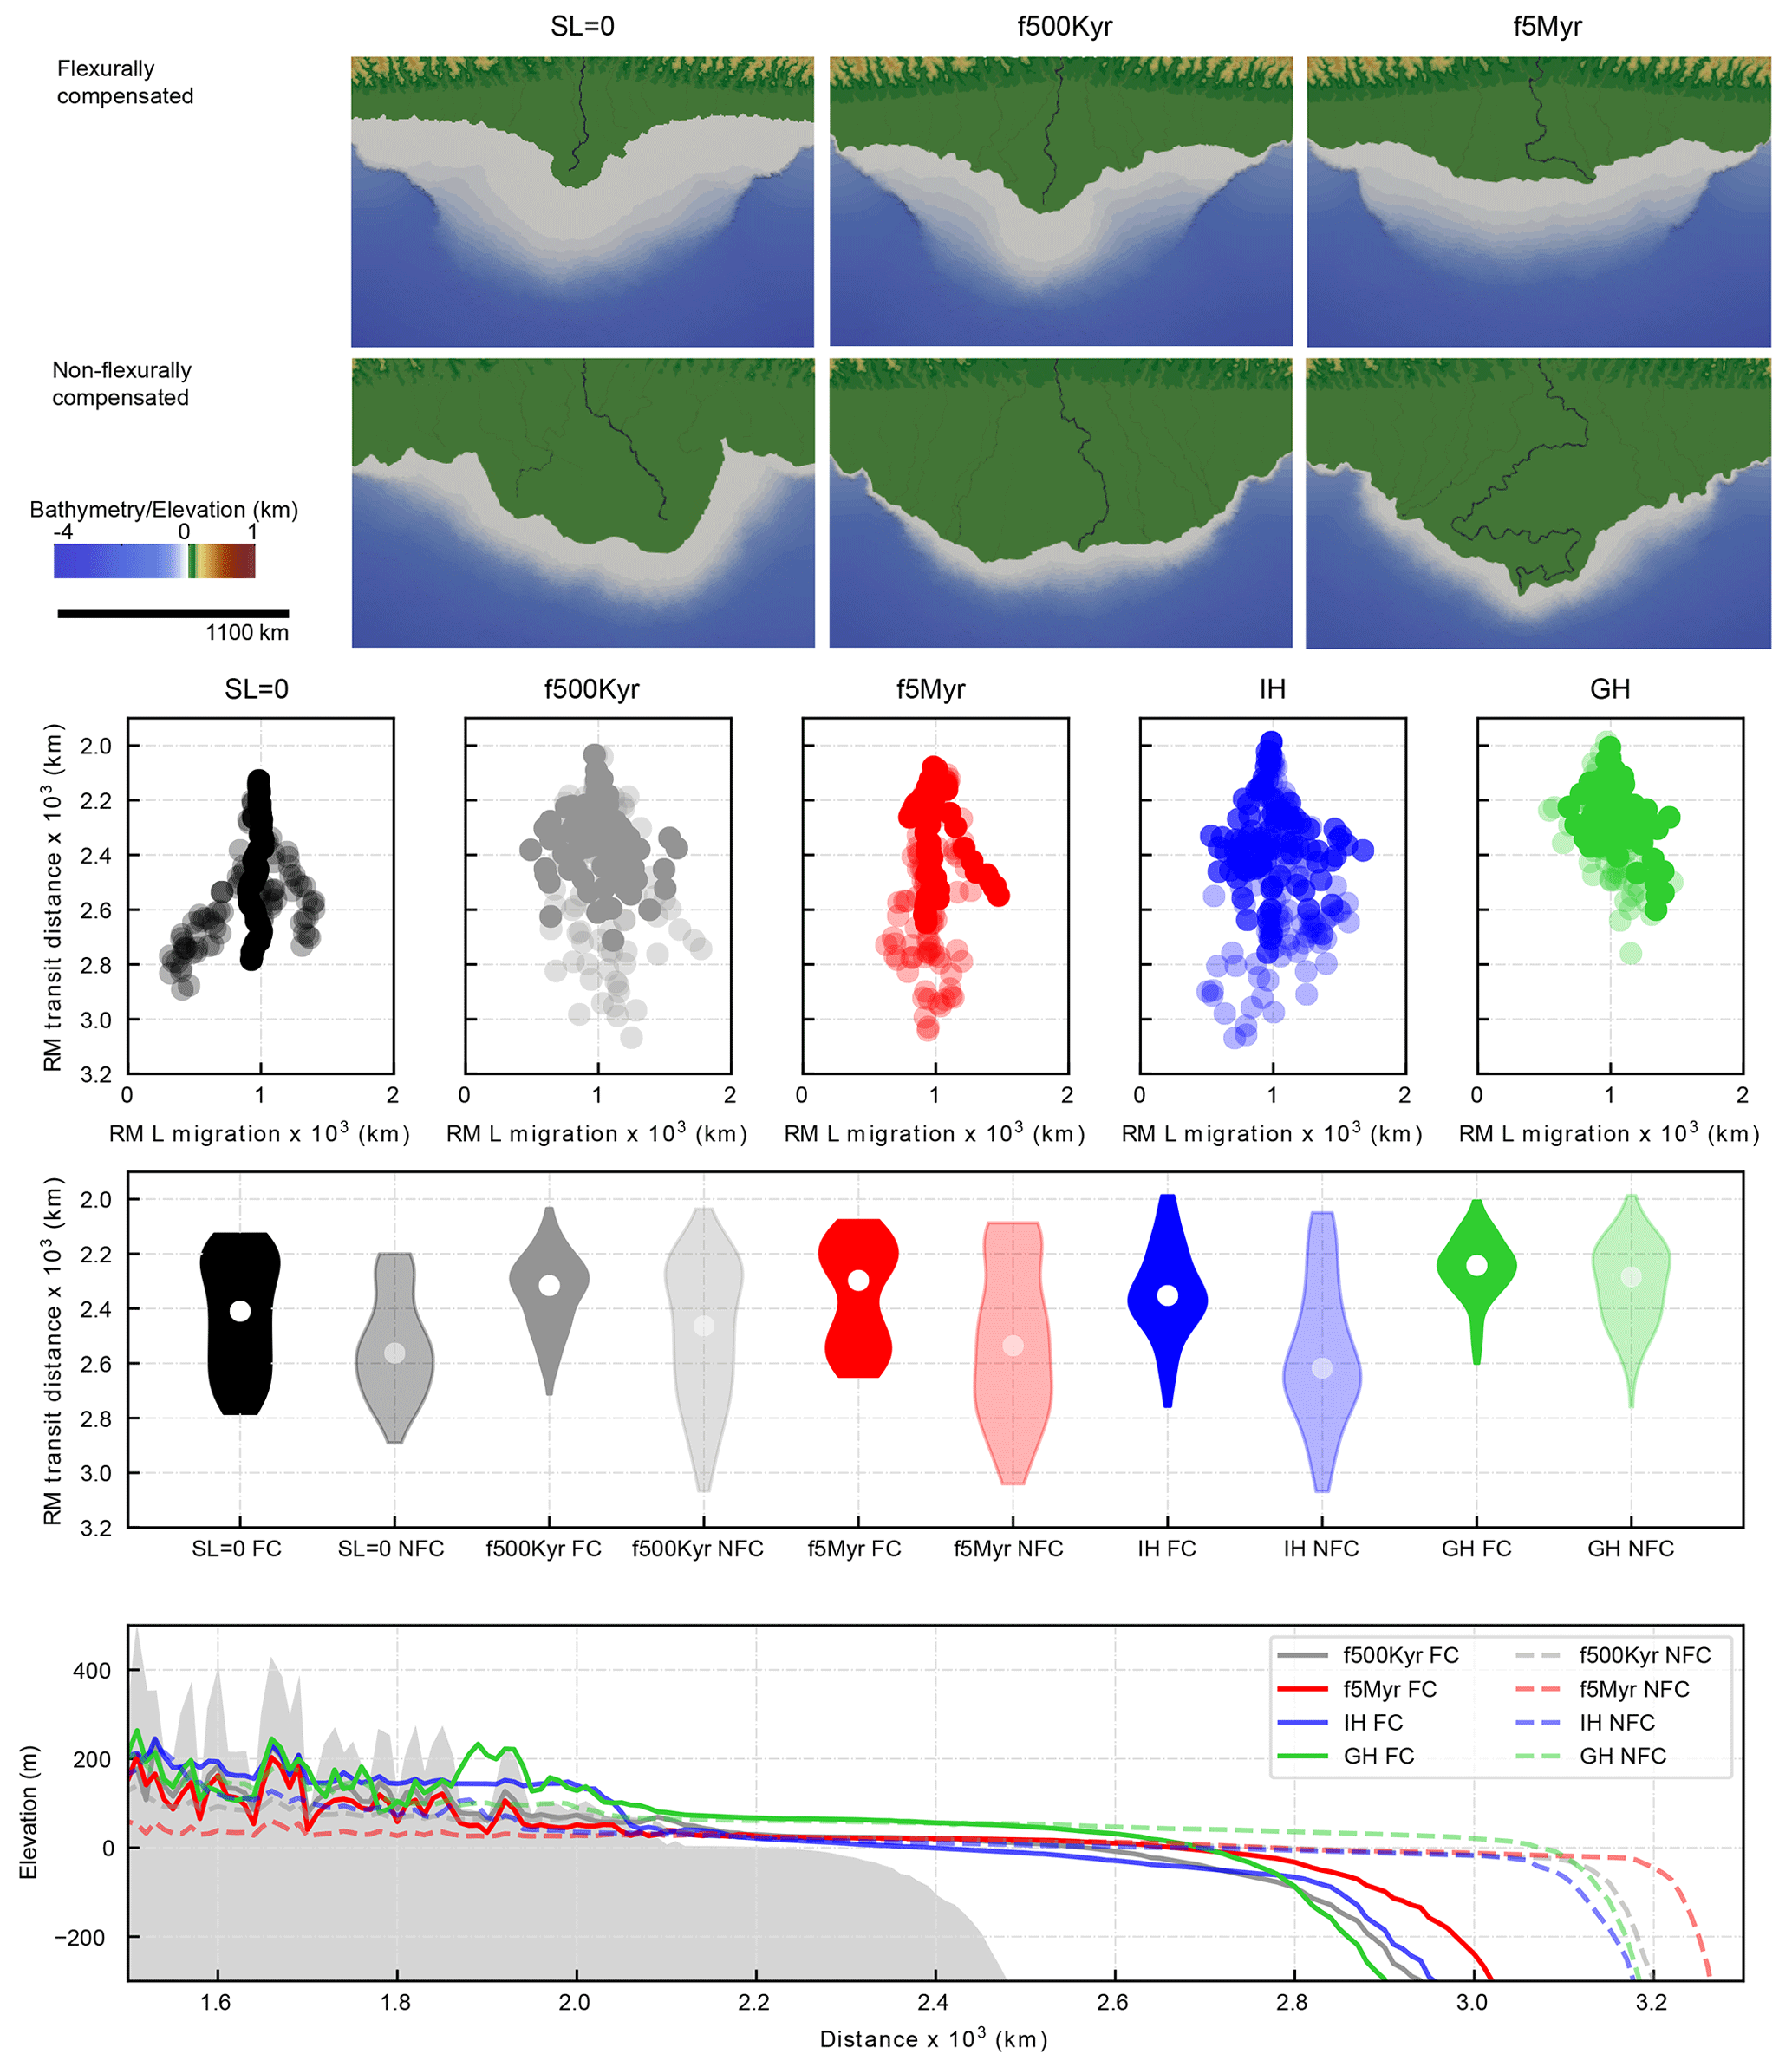
Figure 5(a) Output of numerical simulations with imposed synthetic sea level curves with different frequencies showing elevation, bathymetry, and discharge of the river mouth at 8 Myr. (b) River mouth (RM) location for each time step for all simulations, which illustrates the river mouth transit distance and lateral (L) migration. (c) Violin plots (modified kernel density plots) show that in all simulations mean river mouth transit distances (white dots) are significantly greater in non-flexurally compensated (NFC, lighter shades) simulations when compared to their flexurally compensated (FC, darker shades) counterparts. (d) Comparison of the down-dip shelf-to-slope profile for all the simulations. These results show that flexurally compensated models have significantly smaller progradation distances in the river mouth and the shelf break, smaller areal extent, and larger coastal elevations (due to flexural uplift) compared to their non-flexurally compensated counterparts. IH stands for icehouse, and GH stands for greenhouse.
4.2 Effects of flexural isostasy on the evolution of deltaic depocenters
The comparison between flexurally compensated simulations and their non-flexurally compensated counterparts allows us to isolate the effects of flexural isostasy on delta evolution. In non-flexurally compensated simulations, elevation is controlled by erosion whereas bathymetry is controlled by deposition and base-level changes caused by sea level fluctuations. By contrast, in flexurally compensated simulations vertical changes in erosion and deposition are amplified by sediment unloading and loading, which causes uplift and subsidence, respectively (Fig. 5d). In addition, the flexurally compensated simulations display peripheral bulges landward and alongshore of the deltaic depocenters, which are the result of the uplift and subsidence generated by flexural isostasy (Figs. 4a, c, S5, S6). As expected, the spatial variation in flexural response is a consequence of the spatial and temporal variations of sediment and water loads, and the bulges and curvatures noted above are absent in simulations without flexural compensation (Figs. 4c, S5, S6). Hence, our models capture features that have been used in natural systems to provide evidence of flexural isostasy.
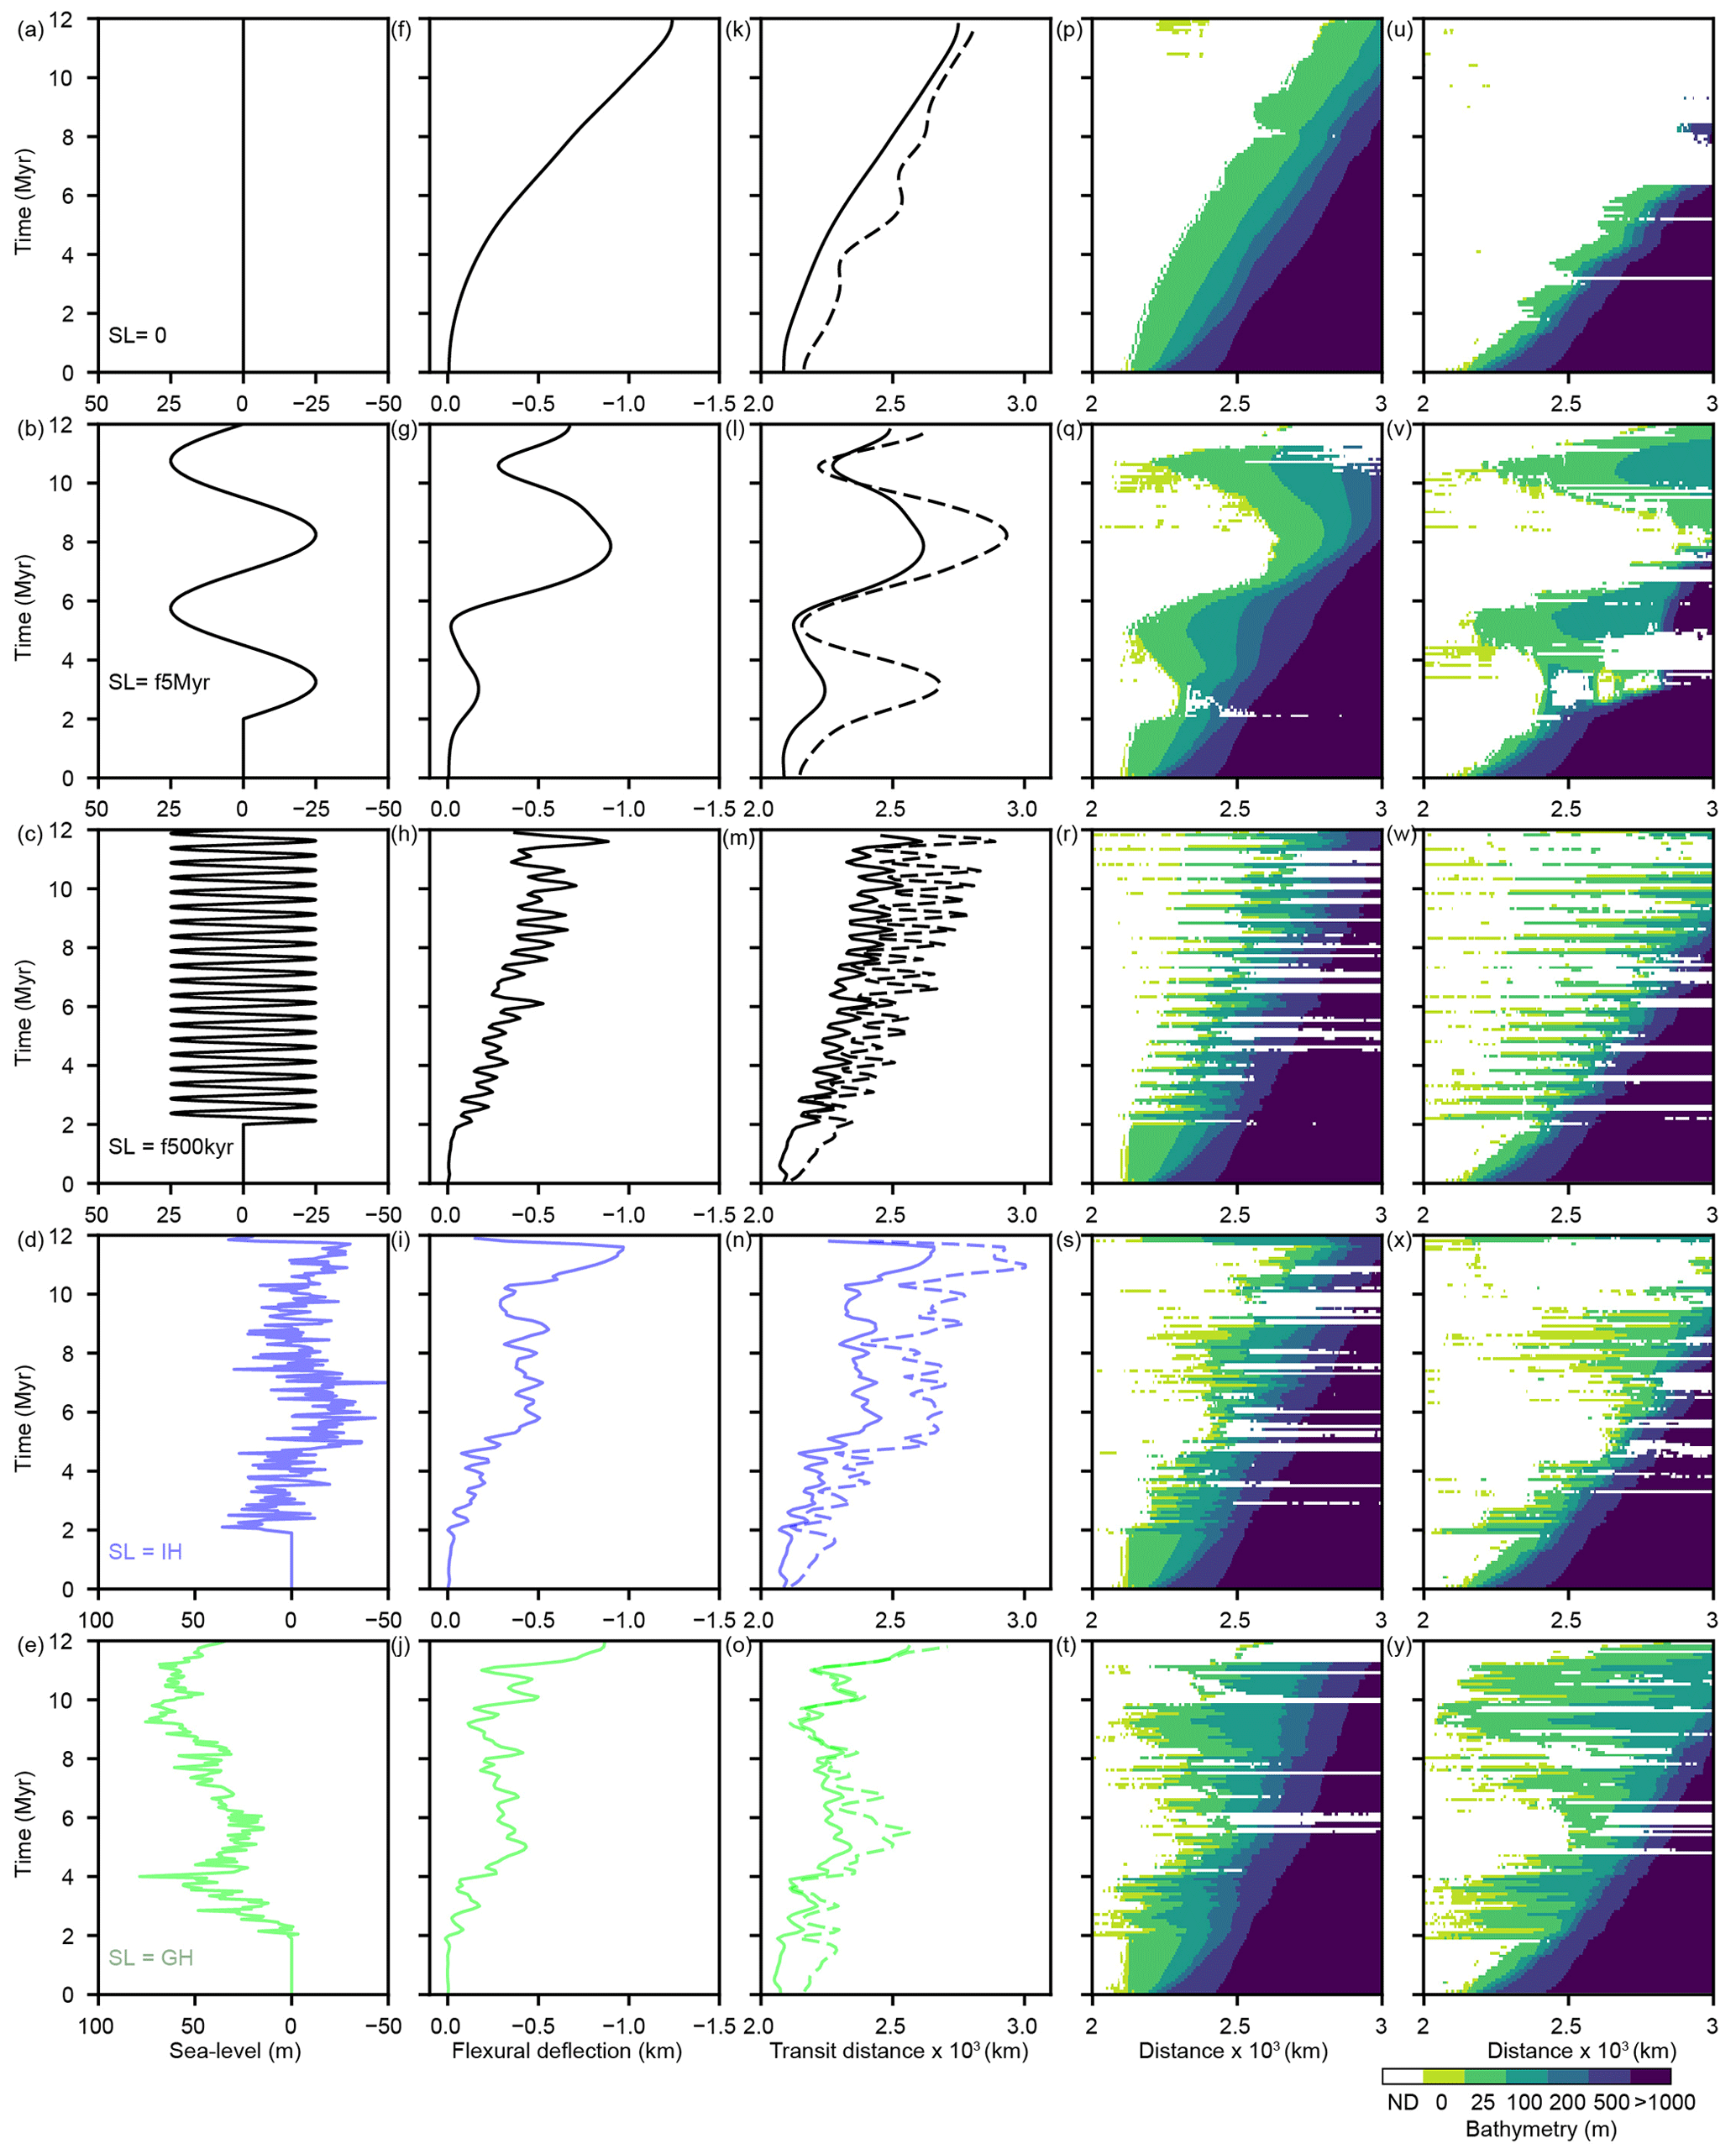
Figure 6Outputs of numerical simulations for the different scenarios where we impose synthetic (a–c) and empirical (d–e) sea level curves (SL). Outputs represent the temporal evolution of the flexural deflection (f–j) and travel distance of the river mouth (k–o). Wheeler diagrams show the changes in bathymetry through time for the flexurally compensated (p–t) and non-flexurally compensated (u–y) simulations. The location of the cross-section used to construct the Wheeler diagram is shown in Fig. 4. Wheeler diagrams are constructed using the post-processing module of BADLANDS (Salles et al., 2018). ND indicates no deposition. Model abbreviations are listed in Table 1.
In all simulations, mean river mouth transit distances and lateral river mouth migration distances are significantly greater in non-flexurally compensated simulations when compared to their flexurally compensated counterparts (Figs. 5, 6). We attribute these patterns to reduced accommodation when flexural compensation is absent, which limits sediment accumulation close to the river mouth, forces the delta to prograde farther into the coastal ocean, and forces the river channel to migrate or avulse laterally, creating laterally extensive delta plains (Fig. 5a). Conversely, in simulations with flexural compensation, accommodation increases near the delta front as the load accumulates, which reduces cross-shelf transit distances and lateral migration of the river channel (Fig. 5c). To the extent that mean maximum rates of sediment accumulation at the river mouth are an indicator of accommodation that has been generated, they are significantly smaller in non-flexurally compensated simulations when compared to their flexurally compensated counterparts (Table S1).
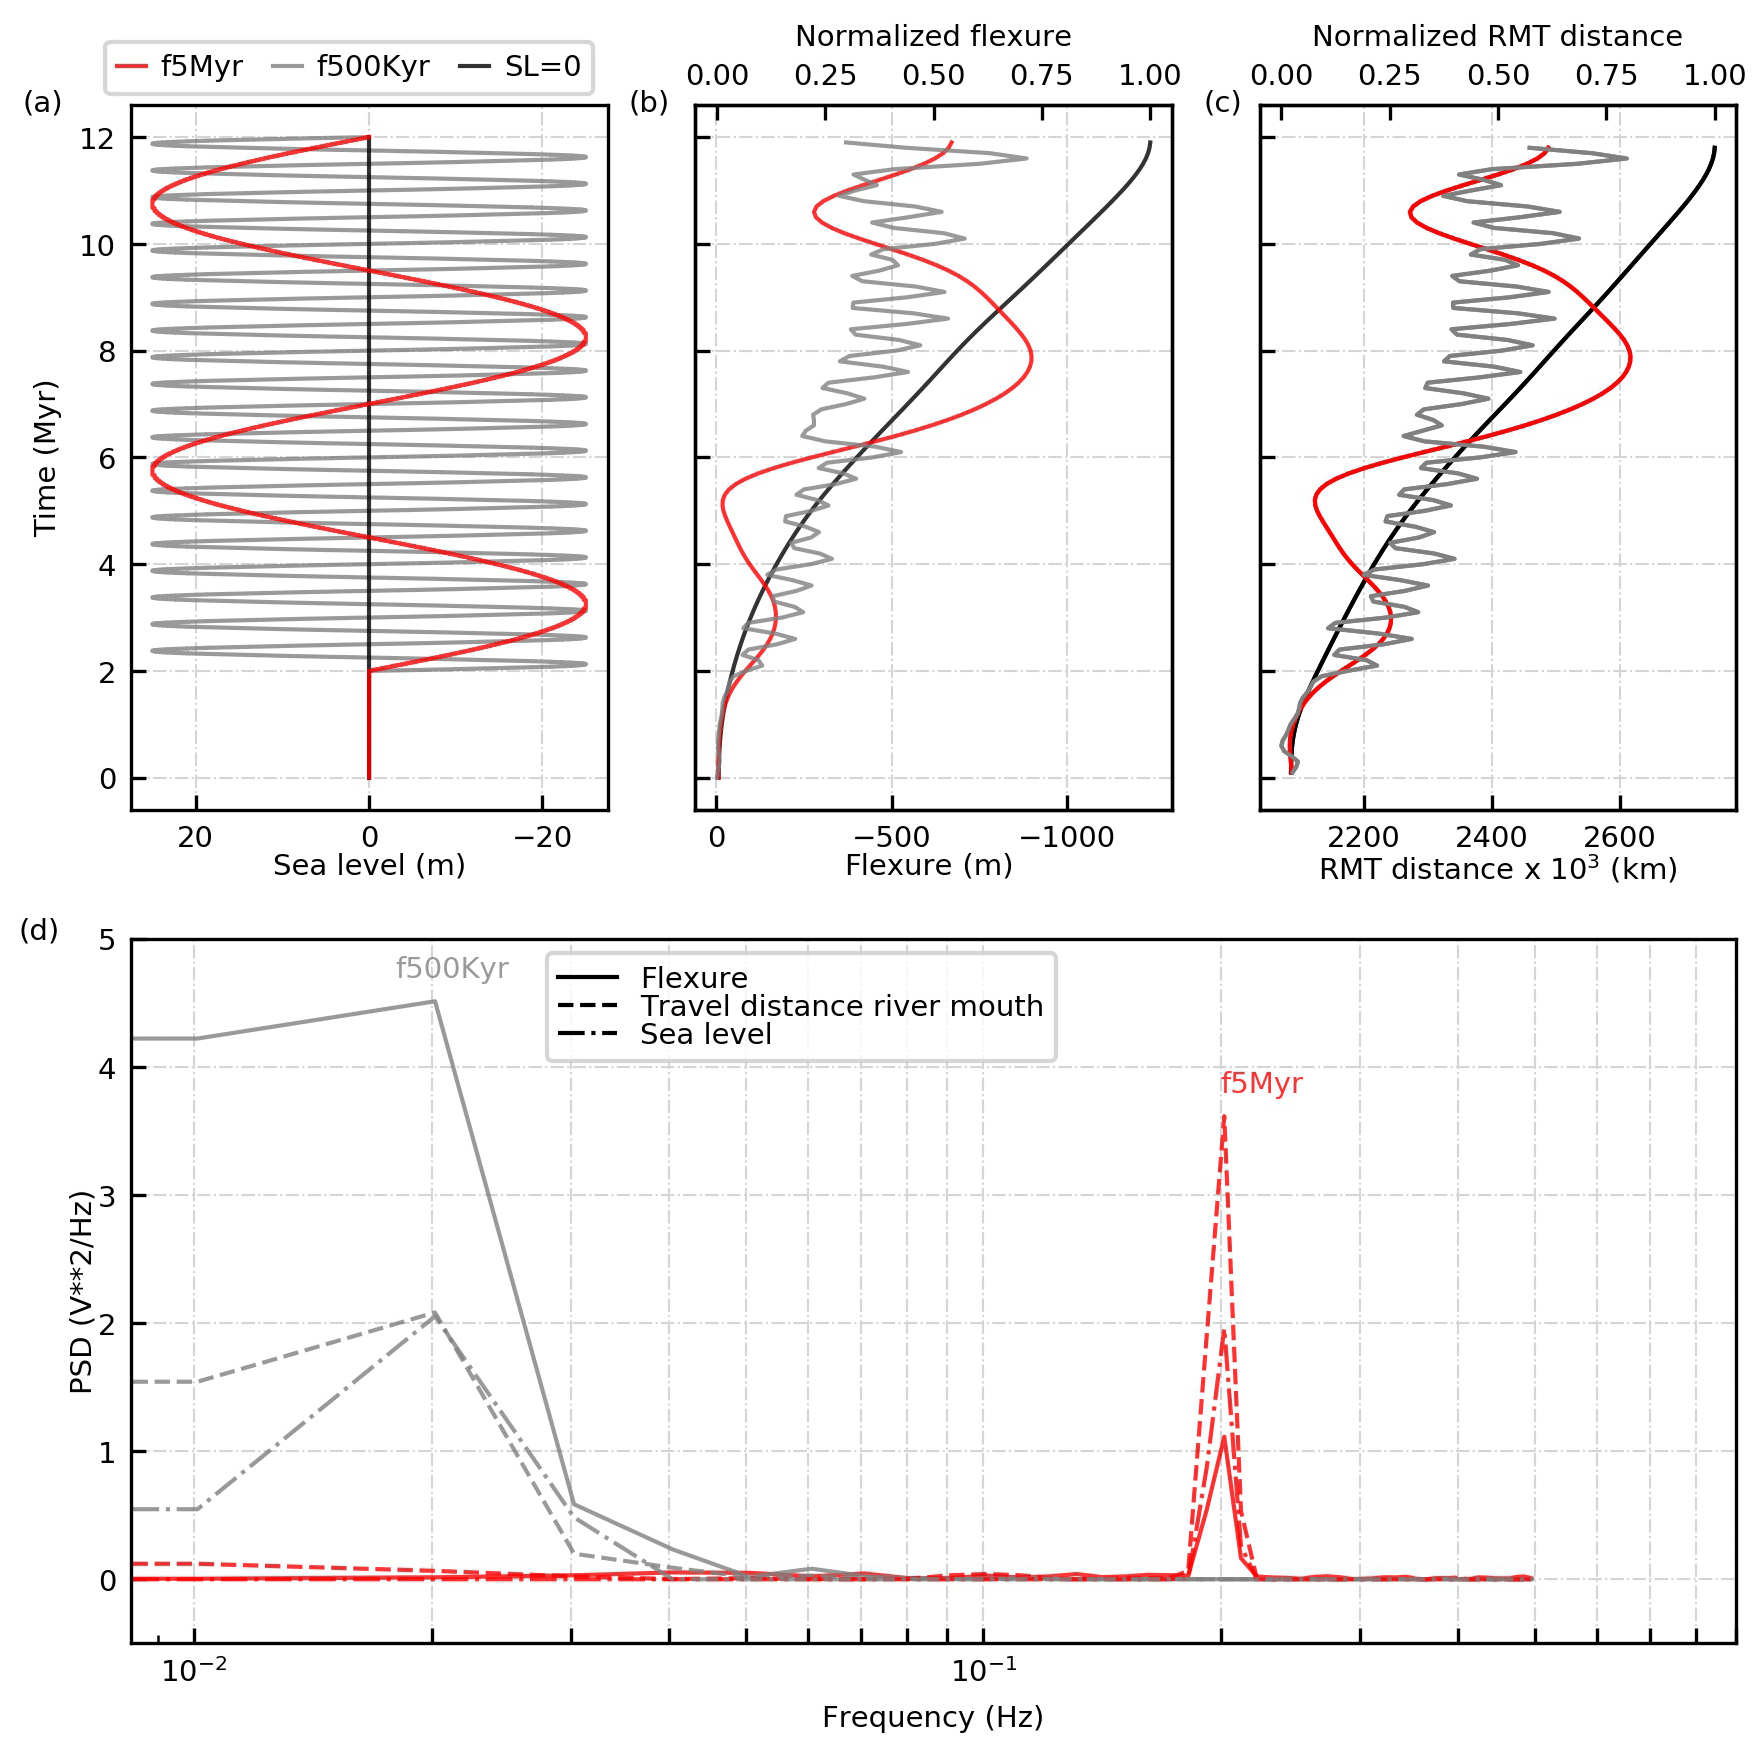
Figure 7(a) Synthetic sea level curves with a frequency of 5 Myr (red), 500 kyr (grey) and no sea level change (SL = 0, black). Comparison of (b) flexural deflection and (c) transit distance extracted at the river mouth (RMT). (d) Power spectral density (PSD) for simulations with a frequency of 5 Myr (red) and 500 kyr (grey). The correspondence in peak frequencies between sea level, flexural deflection, and river mouth migration provides further evidence of the synchronicity between flexural deflection and sea level changes.
4.3 Flexural isostatic response to sea level change and its effect on delta evolution and stratigraphy
Our simulations show a close correspondence between cross-shelf transit distances of river mouths and sea level position (Figs. 6, 7), confirming the role that sea level plays as an important driver for sediment dispersal on passive margins (e.g., Carvajal et al., 2009; Sømme et al., 2009). Hence, we first describe the flexural response to sediment and water load at the river mouth.
Simulations where we impose synthetic sea level changes show that flexural responses are bidirectional at a rate of change and direction that amplifies the climate-forced sea level changes themselves. These results therefore demonstrate that significant bidirectional flexural compensation can be important at high frequencies, in this case with sea level cycles of 500 kyr and 5 Myr (Figs. 6f–h, 7b). In each case there is a background monotonic increase in the accumulated flexural subsidence as the sediment load increases through time, but flexure is uniformly unidirectional if, and only if, sea level is held constant (Figs. 6d, 7b). The synchronicity between sea level change and flexural response is confirmed by spectral analyses that show peaks at frequencies similar to the imposed synthetic sea level fluctuations and flexural response at the river mouth (Fig. 7). Simulations that use climate-driven empirical sea level curves also show that flexural response is bidirectional, cyclical, and in-phase with the frequencies and amplitudes of sea level fluctuations as well (Fig. 6i–j), and thus reflects climate-driven changes in sediment loading and unloading, and climate-driven changes in sea level that produce change in thickness of the water column.
The synthetic stratigraphy produced by our simulations records the coupling of climate-driven sea level change, flexural compensation, and generation of accommodation, which in turn drives river mouth lateral migration and cross-shelf transit distances (Fig. 6p–y). First, simulations without flexural compensation show a larger proportion of hiatuses in the stratigraphic record when compared to flexurally compensated simulations (Fig. 6u–y), which we attribute to the absence of flexural subsidence Second, flexurally compensated simulations with no sea level change record a simple normal regression (Fig. 6u), whereas simulations with imposed synthetic and empirical sea level curves display significant hiatuses during sea level fall and basinward transit of the river mouth and shoreline (sensu the forced regression of Posamentier and Allen, 1999) but fewer hiatuses during sea level rise when the river mouth and shoreline migrate landwards. In a natural system, significant hiatuses would be produced by the valley incision and cross-shelf extension of river systems that accompanies sea level fall, whereas few hiatuses would be produced during the period of valley aggradation and filling that accompanies shortening of the river system as the shoreline steps landward during sea level rise (Fig. 6u–y). Third, simulations with higher-amplitude icehouse sea level curves show a higher number of erosional hiatuses when compared to simulations with lower-amplitude greenhouse sea level curves. We attribute this observation to more frequent and extensive subaerial exposure of the shelf, with longer and more frequent cross-shelf river mouth transits in the icehouse case and less frequent and extensive exposure of the shelf with shorter and fewer cross-shelf transits of the river mouth in the greenhouse case.
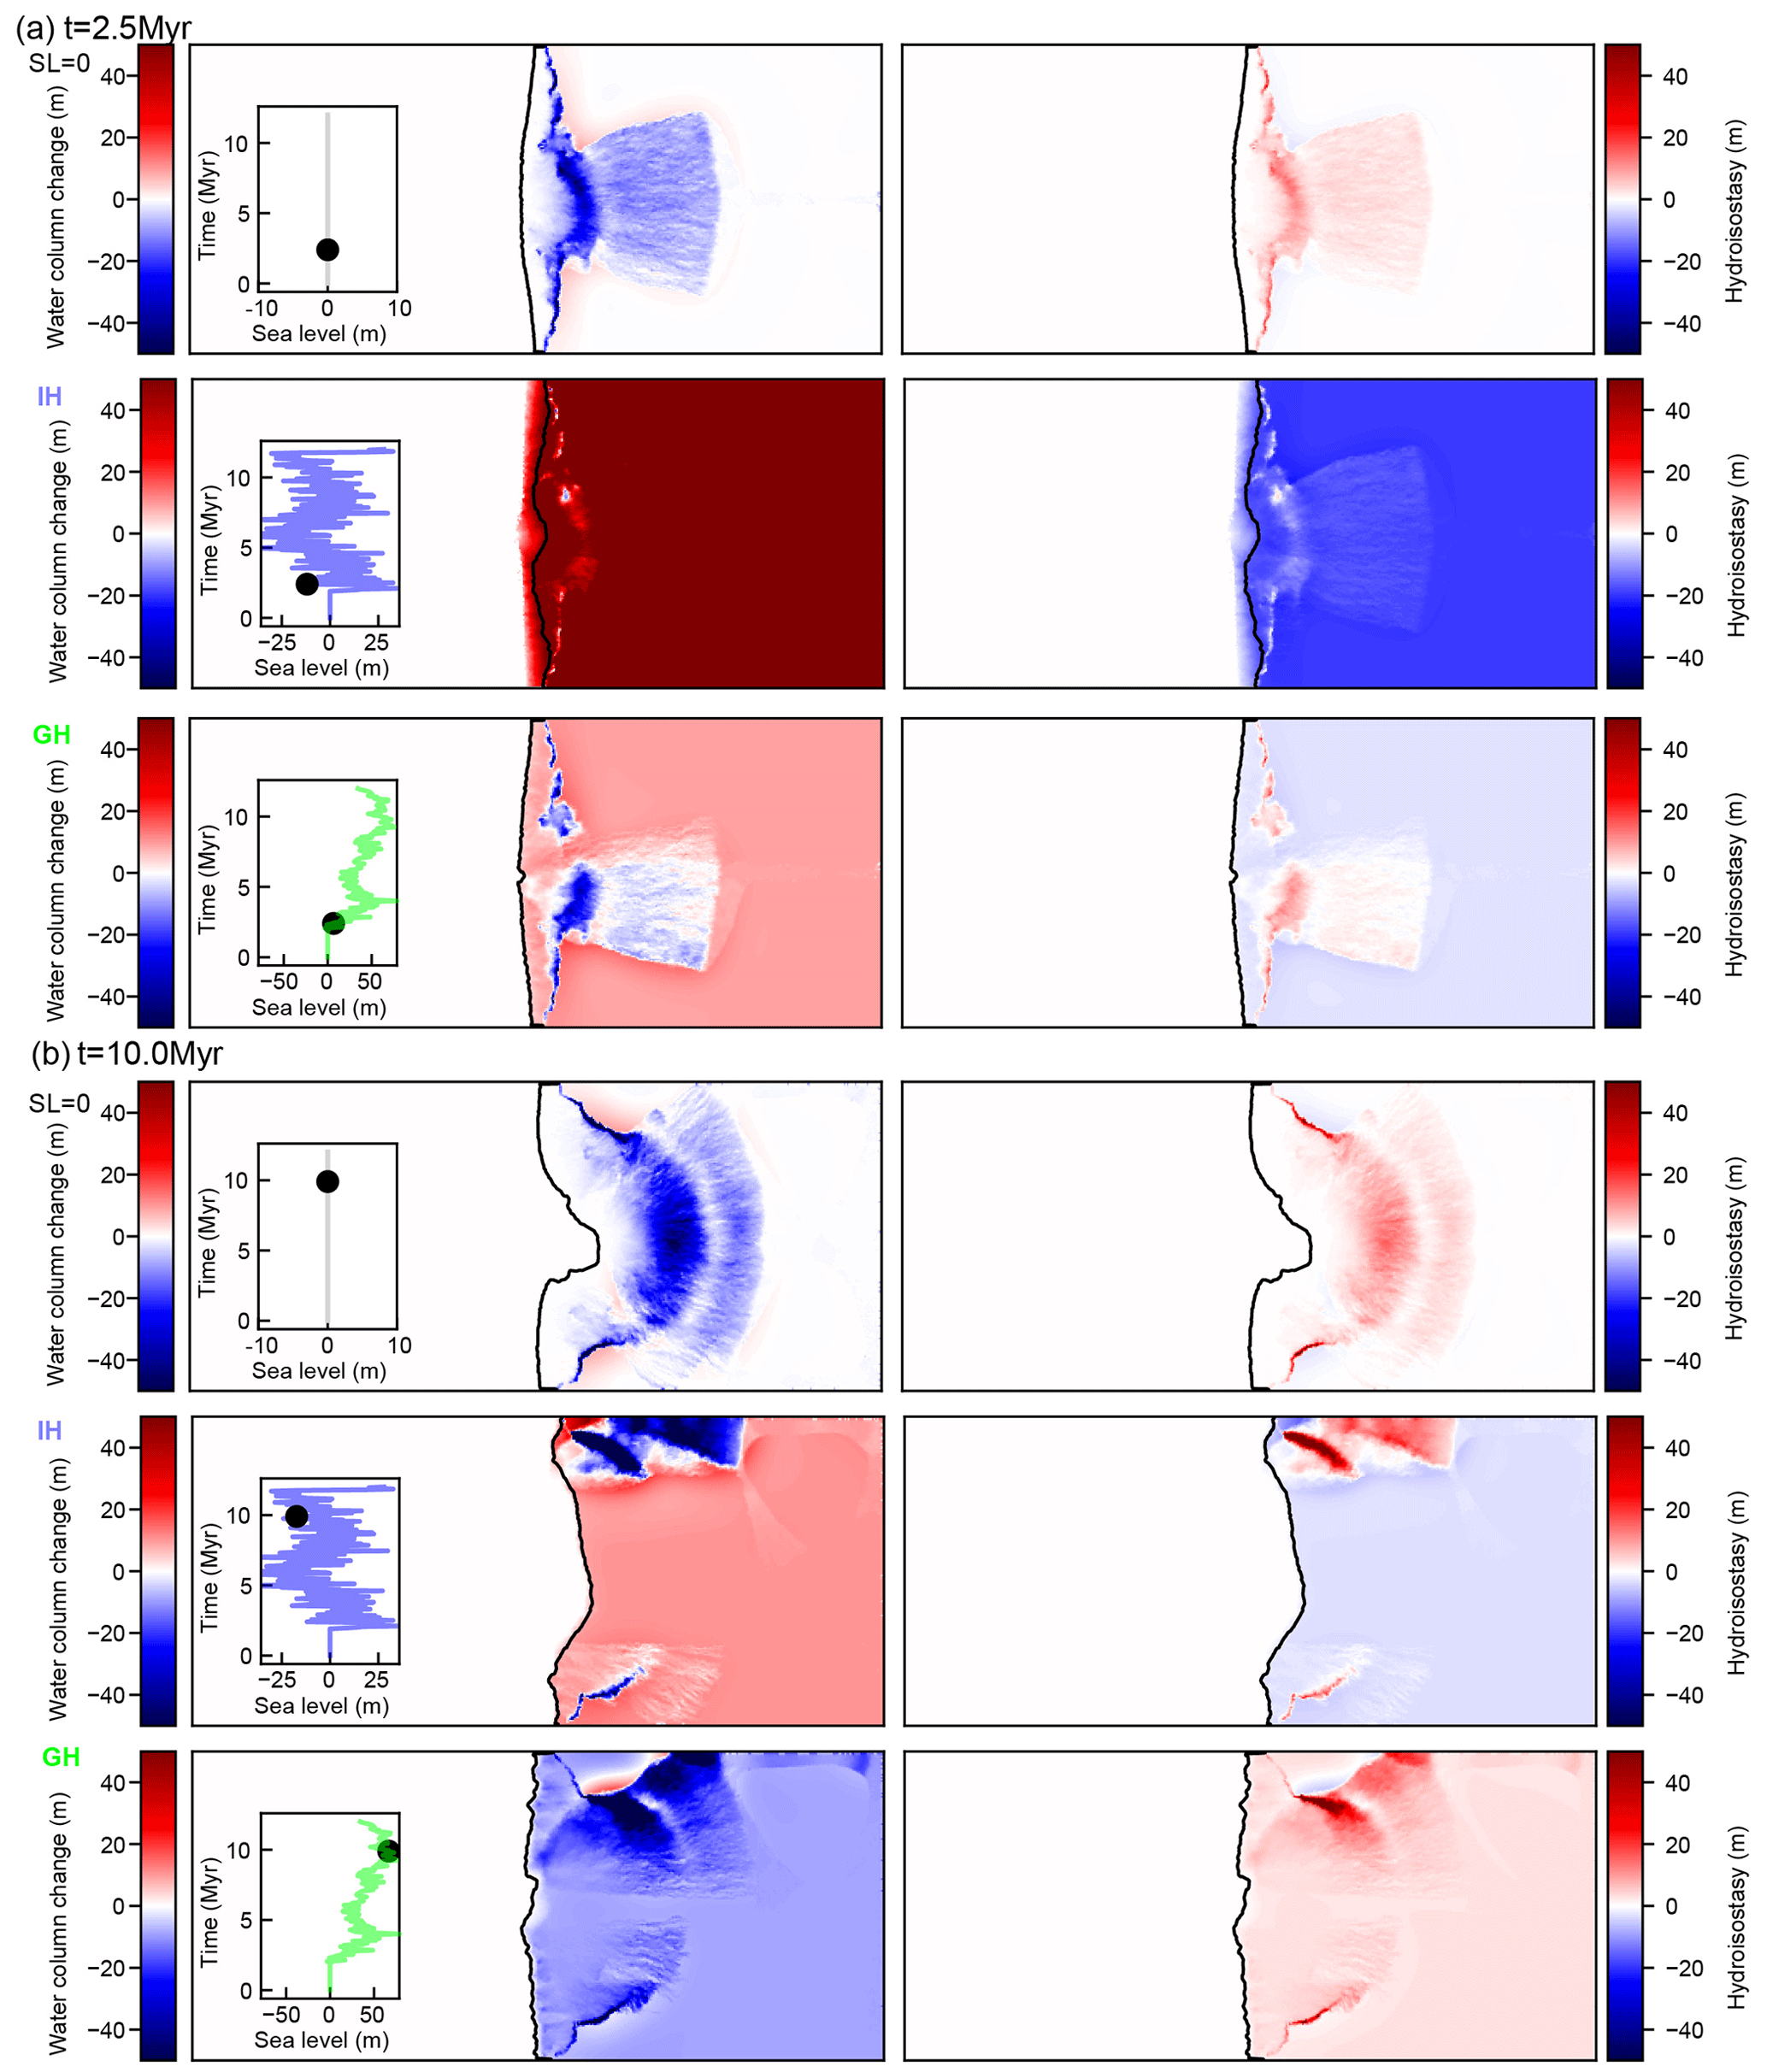
Figure 8Map views showing the temporal evolution of the change in water column (left) and associated hydro-isostasy (right) at (a) 2.5 Myr and at (b) 10 Myr in the numerical simulations with different sea level scenarios: SL0 representing 0 constant, IH standing for icehouse, and GH standing for greenhouse. These result show the vertical changes that are solely associated with the water load. Insets in the left panels show the imposed sea level curve and the round symbol the point in time when the simulation output was taken. The variations in the direction of hydro-isostasy through time for GH and IH, which contrasts with the results from the simulations with no sea level change. Note that the length of the modeling domain is 4500 km; therefore, in some cases because of the scale it might look like the hydro-isostasy is not affecting the areas proximal to the shoreline.
4.4 Hydro-isostatic effects on delta evolution
In our simulations, net vertical changes are the result of the interplay between flexural isostasy (of the sediment and water loads) and erosion and deposition. By running a series of simulations where we impose different sea level scenarios, we were able to show that hydro-isostatic effects play an important role in the spatial and temporal evolution of large deltaic depocenters (Fig. 5). To further demonstrate the importance of hydro-isostasy we isolated the component of vertical changes that are solely associated with the water load by computing changes in the water column in the marine part of the modeling domain for each time step and then calculated hydro-isostatic responses in gFlex (Wickert, 2016): we chose this approach because BADLANDS and gFlex are fully coupled to calculate the flexural isostatic compensation of both the sediment and water load, and we therefore were able to extract the water load component in the post-processing stage. As expected, our results show that the spatial variation of hydro-isostatic adjustments is a function of the magnitude and frequency of sea level change and related to the loading of the prograding sediment wedge (Figs. 8–9). In simulations where sea level is held constant, changes in relative sea level and hydro-isostasy are associated with the progradation of the sediment wedge, which changes the distribution of water depths and in turn causes variations in the gradient of the shelf, shelf margin, and slope. By contrast, simulations with sea level change experience bidirectional hydro-isostatic adjustments that vary in amplitude from the shoreline to the shelf margin (Fig. 8). We calculated the mean hydrostatic variation both along a cross-section (Fig. 9b) and at the river mouth (Fig. 9c) for each time step and found that simulations driven by a greenhouse sea level curve had a distribution skewed towards positive hydro-isostasy, which corresponds to uplift. These results are in agreement with the shelf-to-slope profile in Fig. 10 that shows that simulations with a greenhouse sea level curve have the highest elevations and bathymetries. As expected, simulations where the icehouse sea level curve was imposed display the largest range in hydro-isostatic response (Fig. 9), while the down-dip shelf-to-slope profile has elevations and bathymetries that are 20 % lower than simulations with a greenhouse sea level curve.
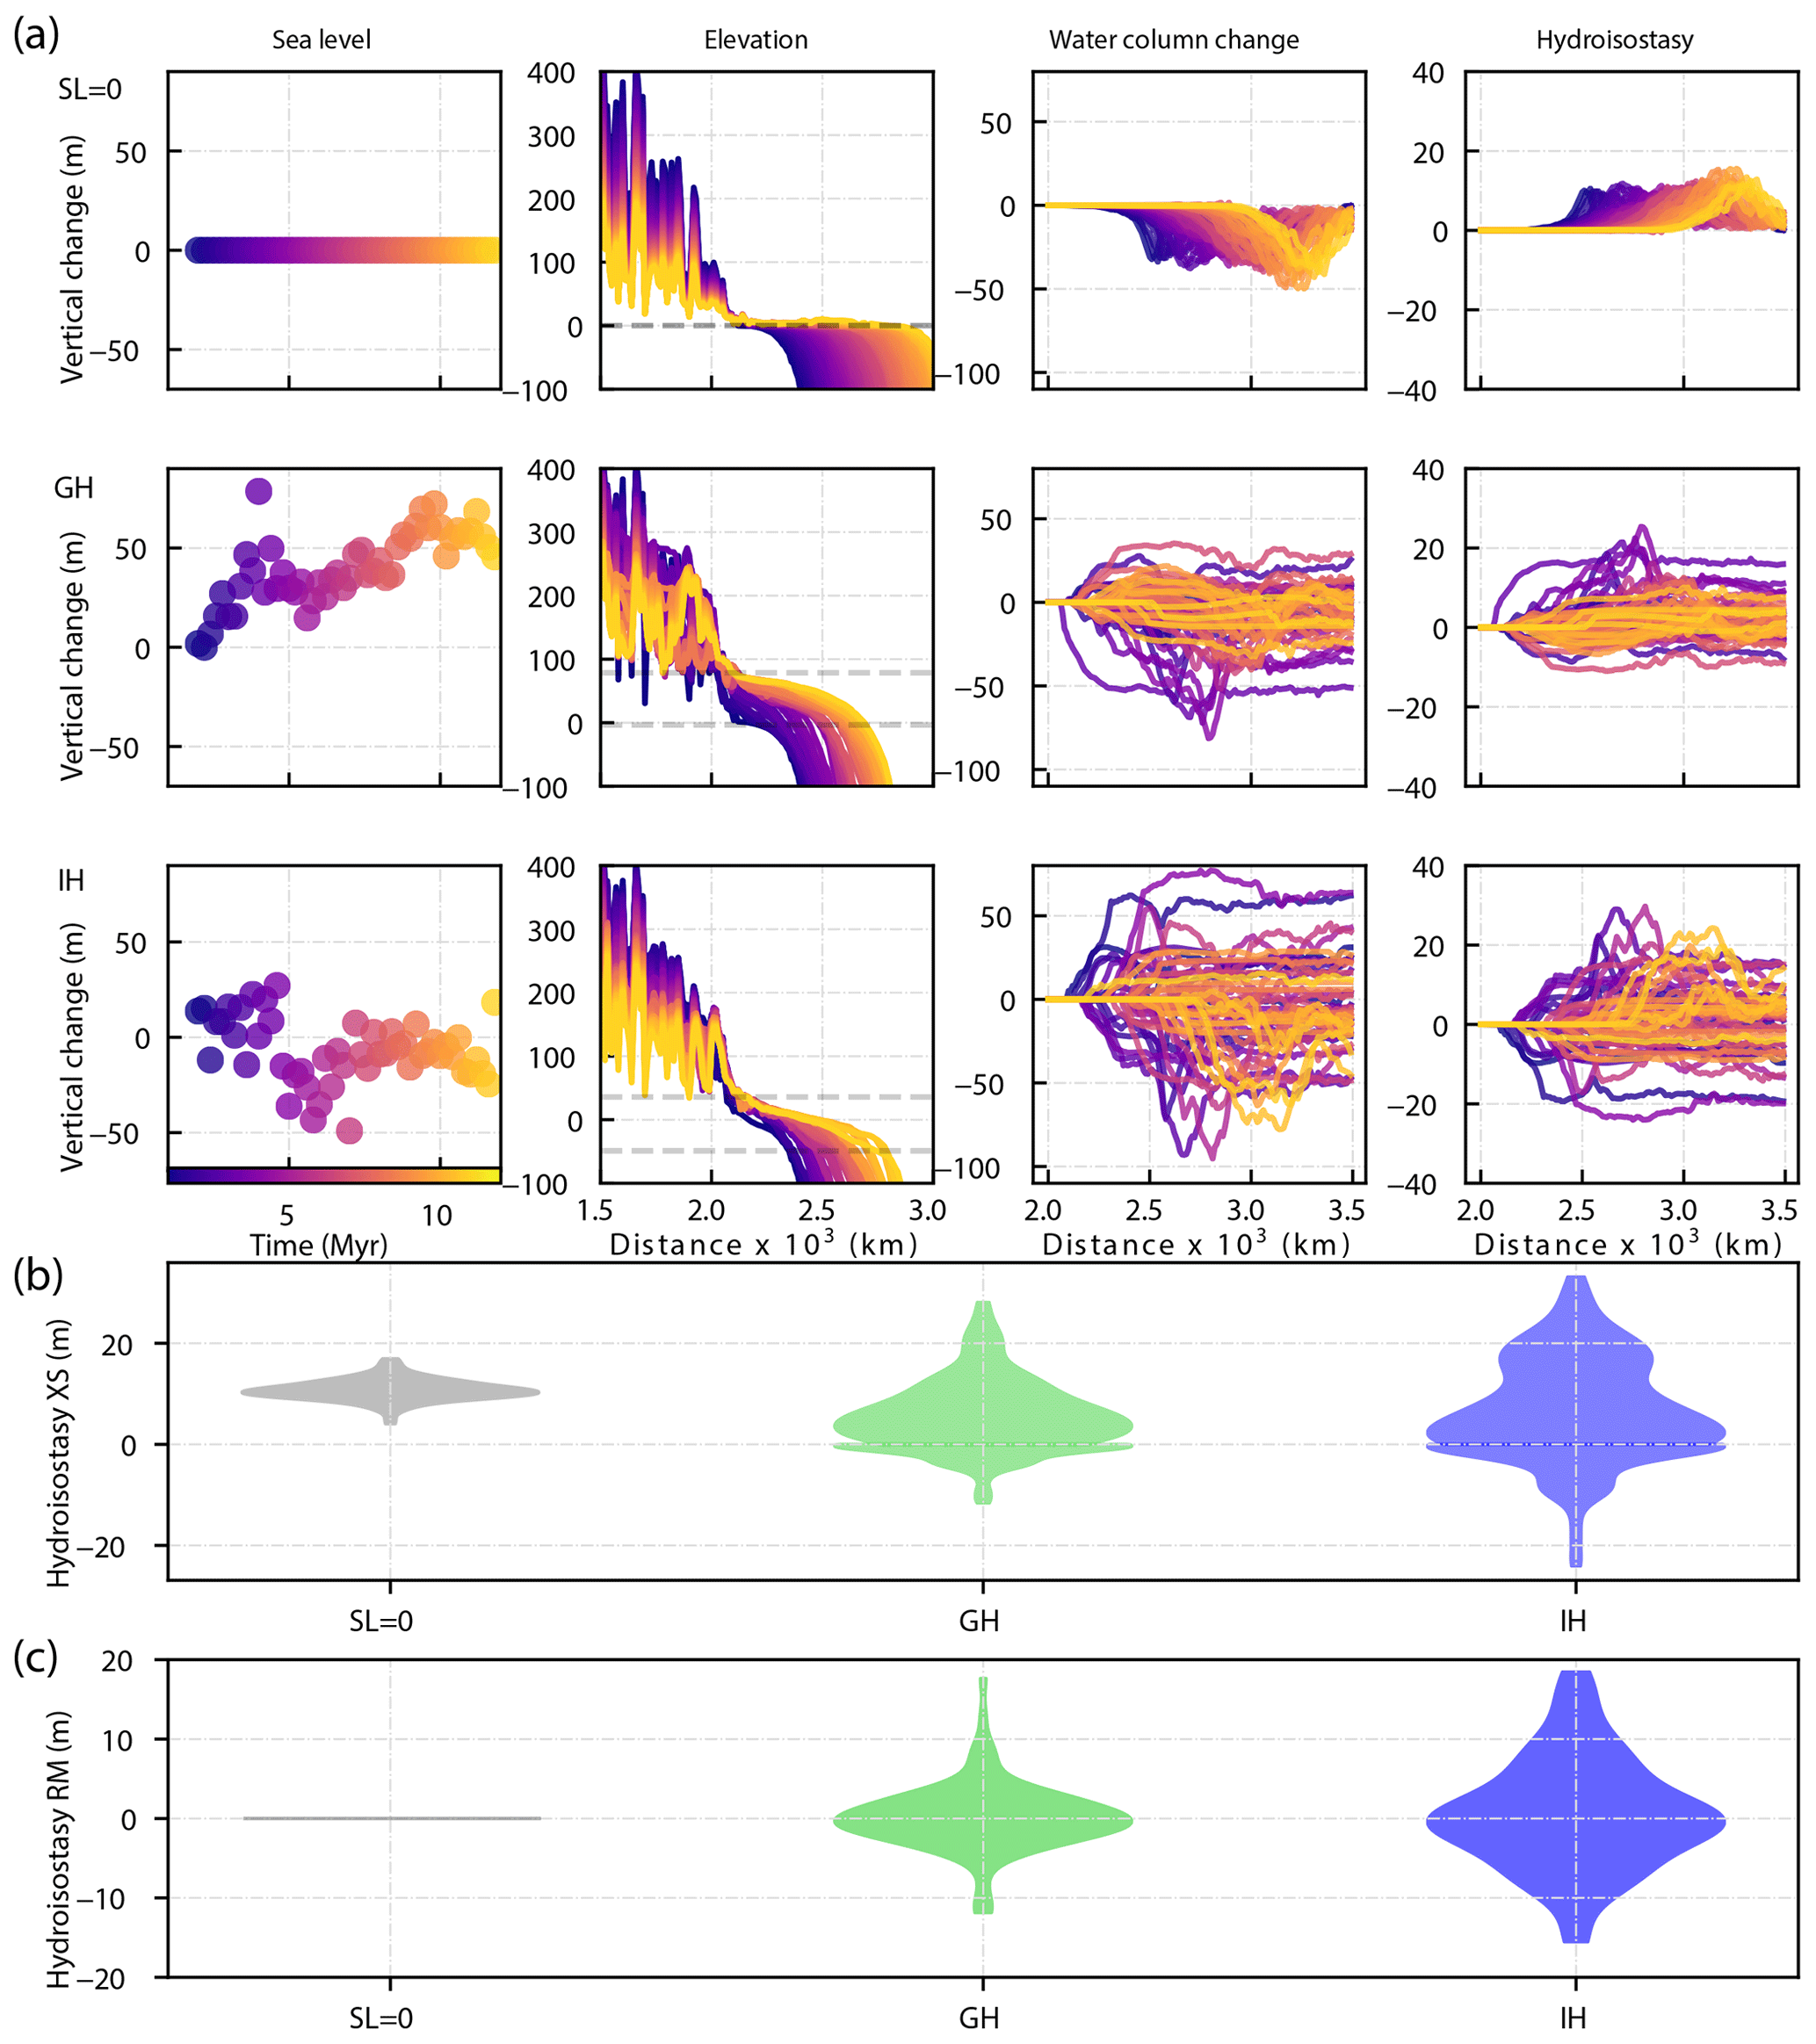
Figure 9(a) Temporal evolution of sea level, elevation, water column change, and hydro-isostasy along a down-dip section in the middle of the modeling domain for the simulations with different sea level scenarios: SL0 representing 0 constant (first row), GH standing for greenhouse (second row), and IH standing for icehouse (third row). The spatial variation of hydro-isostatic adjustments is a function of the magnitude and frequency of sea level change and related to the loading of the prograding sediment wedge. The positive values in the hydro-isostasy fluctuate because of bathymetric changes caused by the progradation of the sediment wedge and flexural subsidence. Dashed horizontal lines in the second column show the minimum and maximum sea level for each of the scenarios. Violin plots (modified kernel density plots) show the range of hydro-isostatic adjustments for the three sea level scenarios along a (b) cross-section (XS) and at (c) the river mouth (RM). Note how the largest range in the hydro-isostatic response occurs in the simulations where the icehouse sea level was imposed.
Our simulations also incorporate the effects of erosion and deposition in a dynamic manner, and in doing so we are able to interrogate the cumulative effects of feedbacks between hydro-isostasy and erosional and depositional processes. First, our simulations with no sea level change produce large cross-shelf transits of the river mouth, as well as extensive progradation of the shelf margin and slope: without flexural compensation, the final elevation of the coastal plain is simply a result of the initial topography, erosion, and deposition and base-level changes (Figs. 9, 10). Second, in natural settings, shelf margin width and water depth correlate to the length scale and gradient of river systems and the magnitude of climate-driven sea level change (e.g., Blum and Womack, 2009; Blum et al., 2013): if sea level falls, the shelf is subaerially exposed, and river mouths transit the shelf to the shelf margin, which is located in shallow water depths, whereas if sea level rises, the shelf is submerged with the shelf margin residing in significant water depths. In our simulated icehouse scenario, with high-amplitude sea level changes, the shelf is inherently wide and the shelf gradient is steeper because of the long-distance back-and-forth cross-shelf river mouth transits: the depth of valley incision during sea level fall is amplified by large magnitude hydro-isostatic uplift, whereas corresponding large magnitude hydro-isostatic subsidence in response to sea level rise enhances accommodation and results in increased valley filling as the river mouth migrates landward. In contrast, in the greenhouse scenario and holding the river-system-scale constant, the shelf is inherently narrow due to low-amplitude sea level changes, river mouth transit distances are inherently short, and the shoreline remains proximal to the shelf margin (see Blum and Womack, 2009; Blum et al., 2013): the slope of the shelf is shallower than in the icehouse case because of relatively continuous and widespread delta topset aggradation.
Finally, our simulations demonstrate the potential role of high-frequency climate-forced sea level changes in generating high-frequency flexural responses because they drive changes in the location and volume of fluvial–deltaic sediment accumulation, which then drives changes in the spatial distribution of water depths. Our results show that accommodation is not first created and then filled later but instead coevolves in sync with the actual responses of fluvio-deltaic systems to climate-driven sea level change. In this way, climate-forced sea level changes set up a feedback mechanism that results in self-sustaining destruction of accommodation and generation of hiatuses during sea level fall and self-sustaining creation of accommodation and sediment accumulation during sea level rise.
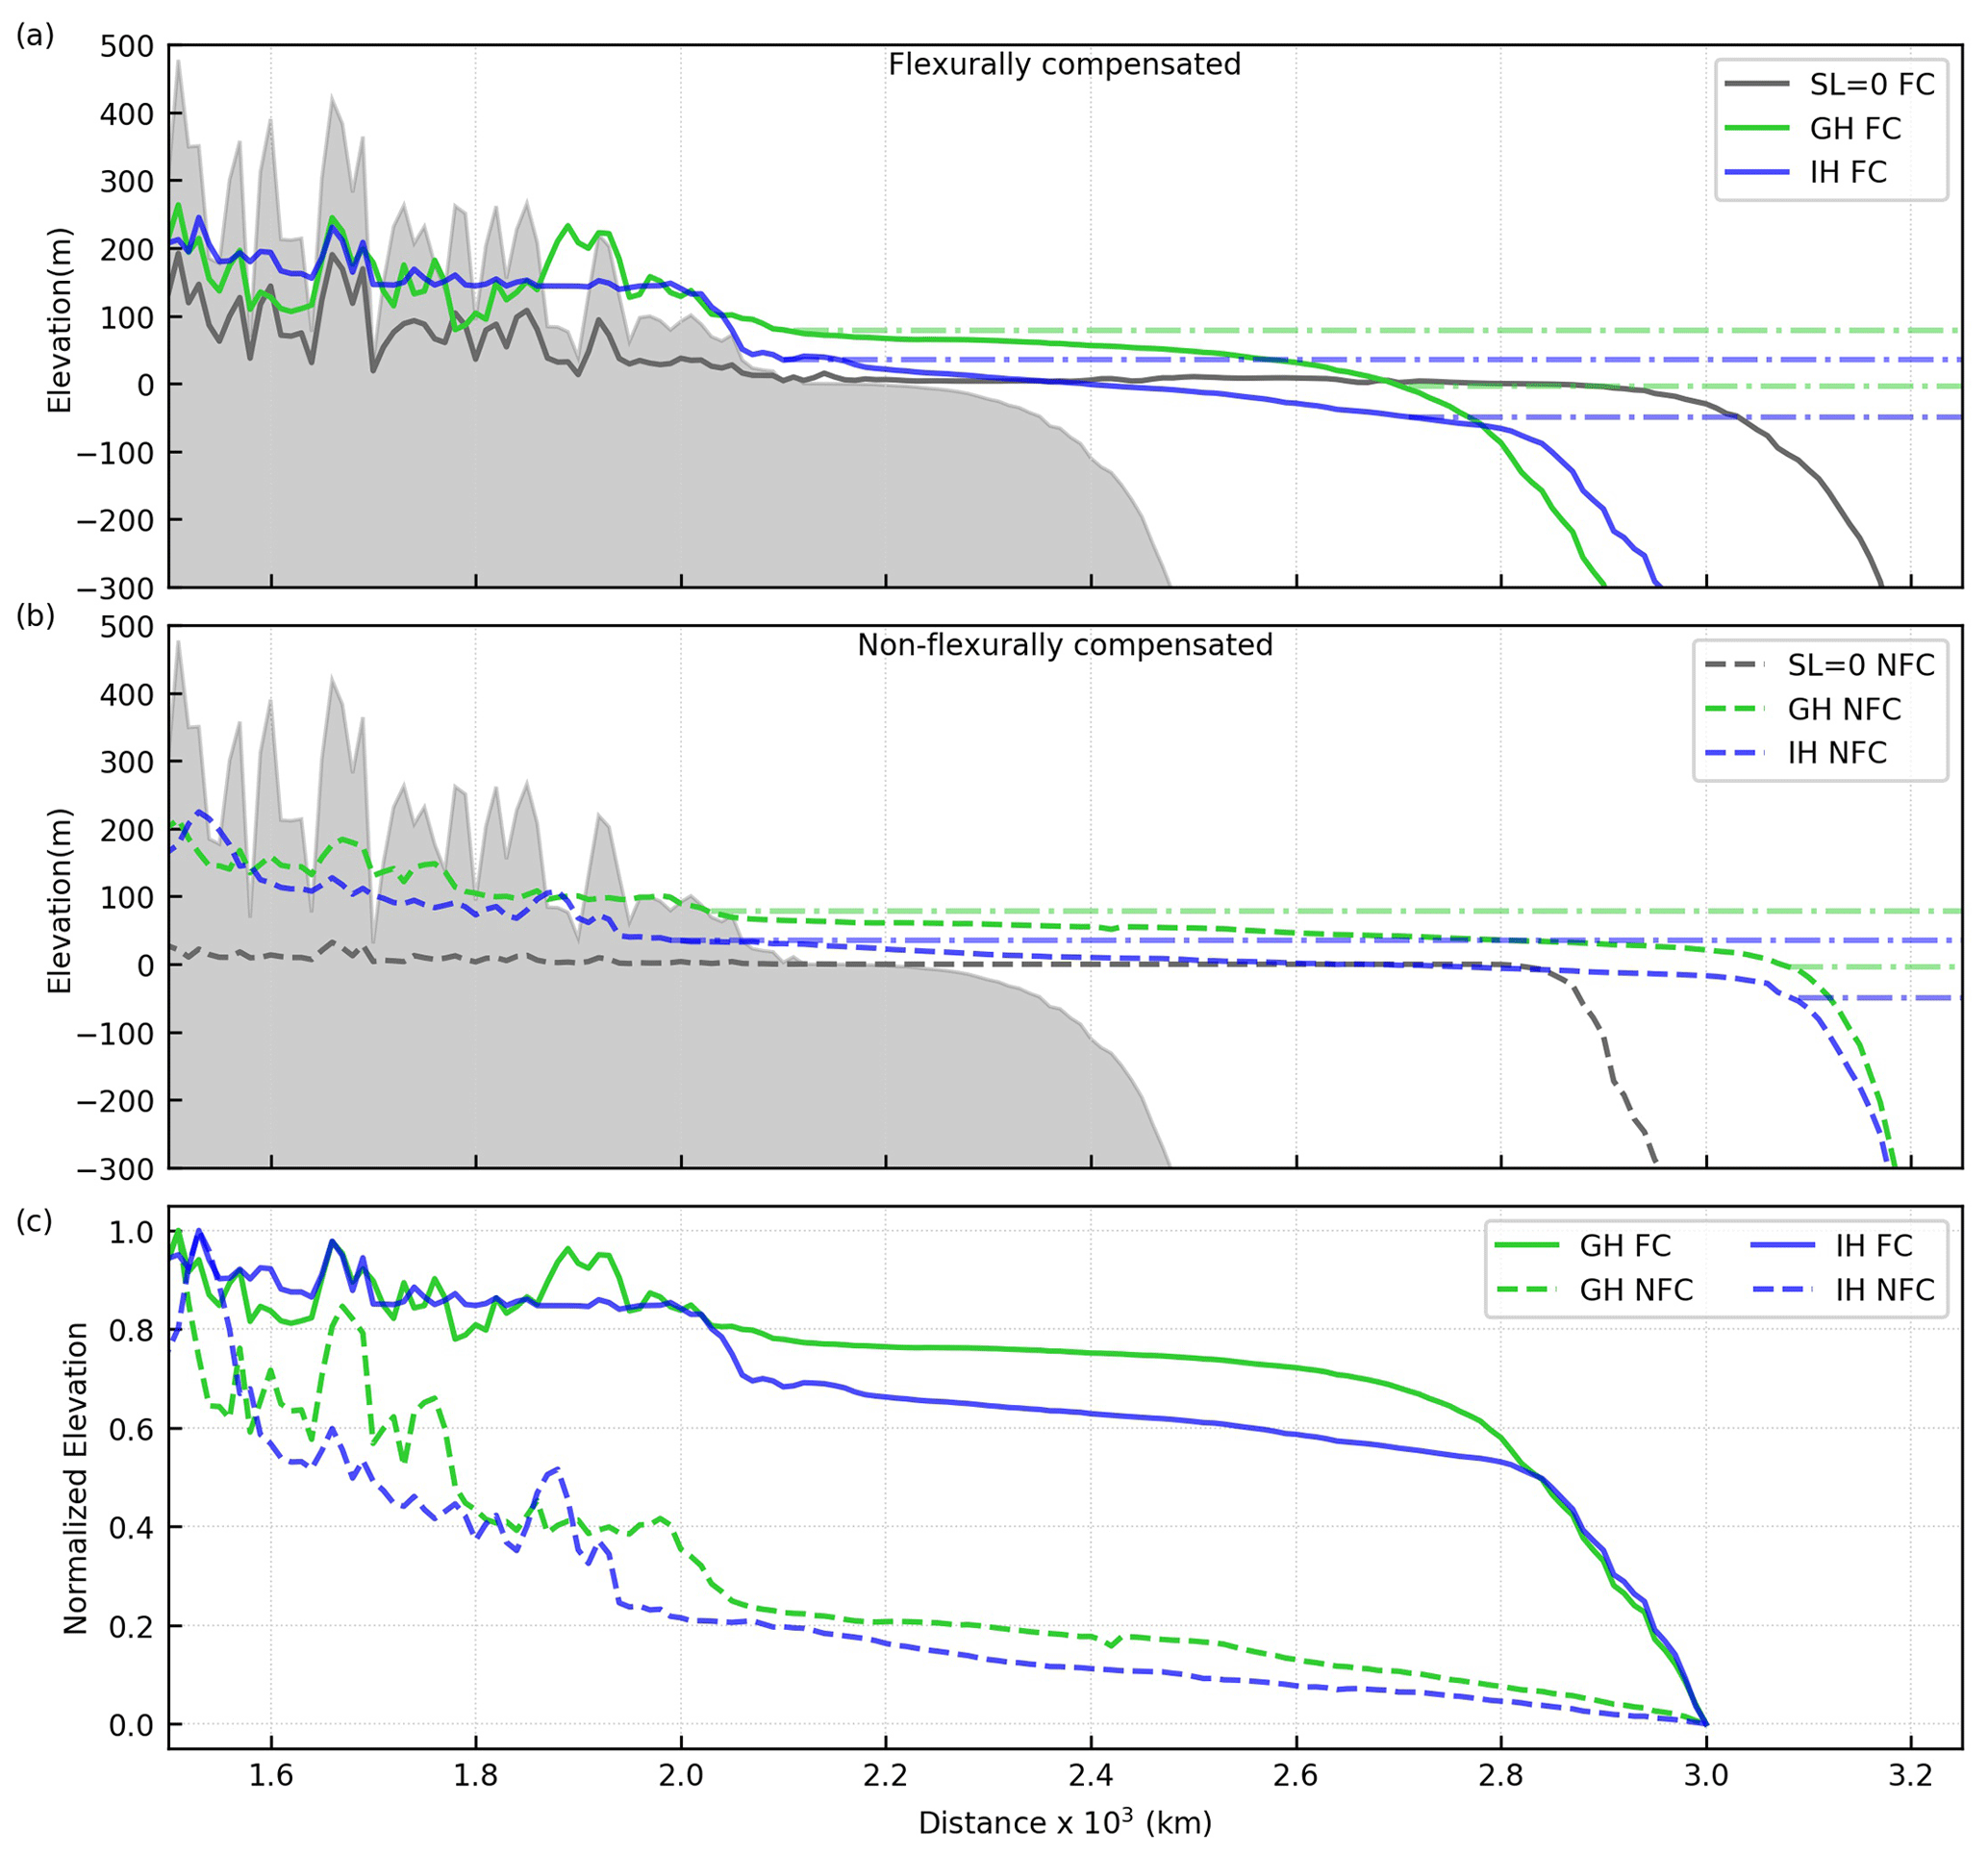
Figure 10Comparison of the down-dip shelf-to-slope profile for scenarios with no sea level change (dark grey) greenhouse conditions (green) and icehouse conditions (blue) for (a) flexurally compensated and (b) non-flexurally compensated models. The net vertical change presented in this figure is the result of the interplay between flexural isostasy and erosion and deposition. Where the flexural isostatic compensation is derived from both the sediment and water loads, the latter referred to as hydro-isostasy. Note how the shelf rollover depth adjusts to changes in sea level amplitude and frequency. In the models without flexural compensation the final elevation of the coastal plain is the result of the initial topography, in that case only erosion and base-level changes control the vertical adjustments, as illustrated by the lack of relief in the case with no sea level change. The grey-shaded background represents the longitudinal profile before the sea level condition is imposed (t=2 Myr). Horizontal dashed lines show the minimum and maximum sea level for each of the scenarios, which correspond with the upper and lower boundary of the shelf's slope.
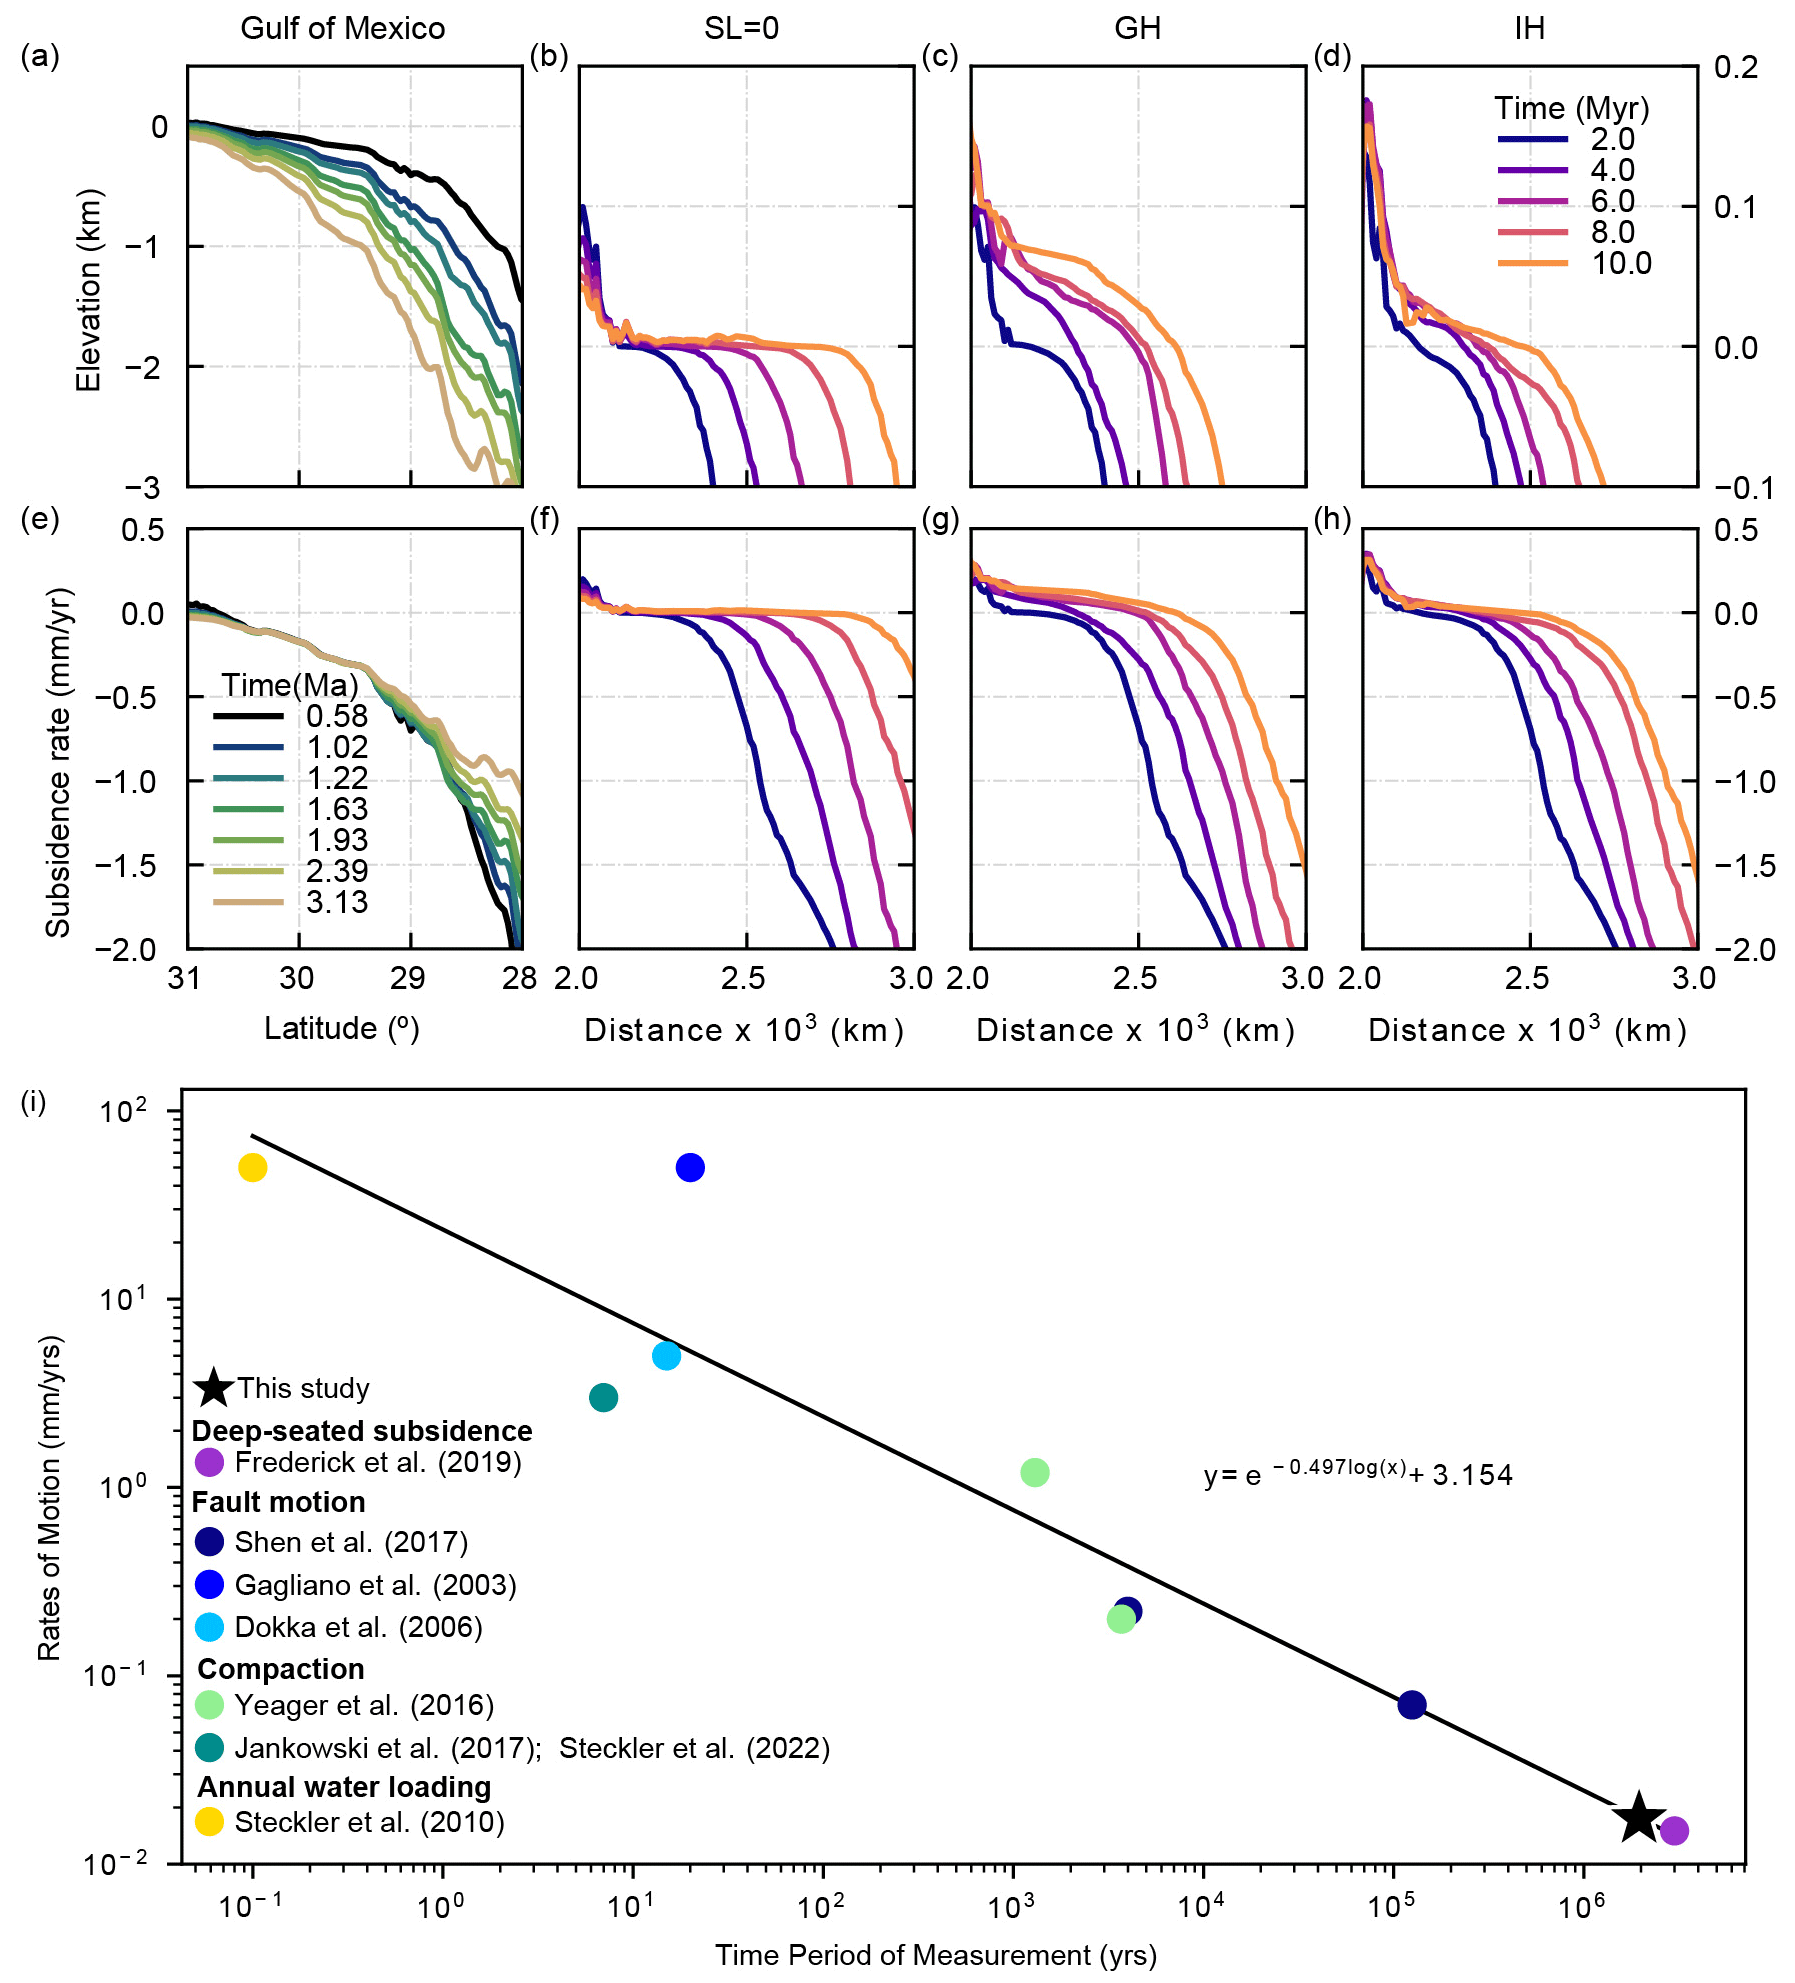
Figure 11Elevation bathymetry (top) and associated subsidence rates (bottom) from the Gulf of Mexico (a–e) and from simulations with no sea level change (SL = 0, b, f) greenhouse conditions (GH c, g) and icehouse conditions (IH d, h). (i) Vertical rates of motion measured over different timescales, illustrating a “Sadler” type rate decrease as a negative log–log relationship with timescales of measurement.
4.5 Implications for natural systems
The results of our simulations demonstrate that climate-forced sea level changes result in self-sustaining creation and destruction of accommodation into which sediment is deposited and therefore plays a major role in delta morphology and stratigraphic architecture. This self-sustaining process might help explain the discrepancies between clinothem thicknesses, relative sea level, and global mean sea level estimates (Sømme et al., 2023).
We argue that the results of the non-flexurally compensated simulations can be extrapolated to ancient deltaic systems that formed over a rigid lithosphere. We interpret that such systems will have inherently long progradation distances, areally extensive delta plains, and relatively low accommodation because of the rigid lithosphere they overlie. For example, the Triassic sequences of the North West Shelf of Australia (Martin et al., 2018; Morón et al., 2019) and the Boreal Ocean (Klausen et al., 2019) represent deltaic successions that prograded >500 km into the basin, creating widespread delta plains. Based on the fact that the reconstructed paleo-bathymetric relief of the Triassic Boreal Ocean is an order of magnitude smaller than other modern shelves, Klausen et al. (2019) conclude that a shallow marine basin is the most important prerequisite to create such a widespread delta plain. We equate those conditions to those observed in our non-flexurally compensated simulations. Another possible example of this phenomenon might be the Early Cretaceous McMurray Formation in the Alberta foreland, which represents a continental-scale river system (see Blum and Pecha, 2014; Wahbi et al., 2022), whose stratigraphic record is very thin and lacks an obvious thick deltaic depocenter within the area of preserved McMurray strata.
Our simulations show patterns and rates of bidirectional vertical motions that are similar to the chronostratigraphic data analyzed by Frederick et al. (2019; see also Fillon, 2016) from the Mississippi deltaic depocenter (Fig. 11); however, vertical motions in our models are generated by flexural isostasy alone. We therefore argue that the correspondence between subsidence and uplift patterns in the Gulf of Mexico and in our models can be used to support the idea that the majority of the vertical motions in the Gulf of Mexico at timescales of 106 years or more are generated by flexural isostatic responses to sediment and water loads.
Rates of subsidence from our study can also be compared with rates of motion generated by other processes that include fault motion, compaction, and annual water loading. As noted above, in large deltaic depocenters, such as the Mississippi and Niger deltas, the locations of growth fault systems tend to migrate basinward as the shelf margin progrades (e.g., Galloway et al., 2008; Pizzi et al., 2020), and they illustrate this inverse relationship between rates and the time over which rates are integrated. Total throw on these faults can be measured in kilometers, but motion is inherently episodic, and when faults are active they likely produce rates of vertical motion of tens of millimeters per day for short periods of time. However, long periods of quiescence in between episodes of active motion ensure that time-averaged rates of fault slip are very low over timescales of 104 years or more (e.g., Shen et al., 2017).
Our study focuses on the impact of the interplay between climate-forced sea level change, changes in sediment and water loads, and associated flexural adjustments on the evolution of continental-scale deltaic depocenters in deep time, but the results of our simulations also help explain the spatial variation of relative sea level changes in the Holocene as well (e.g., Lambeck et al., 2014; Khan et al., 2015; Whitehouse, 2018). Previous empirical studies that have calculated sea level fluctuations have noted that sea level estimates around deltas do not correspond with other adjacent sites (Lambeck et al., 2014). For example, many observations from large deltaic systems in Asia and comparisons of such data with observations from adjacent sites often indicate lower sea levels of the former, corresponding to differential subsidence rates on the order of 1 mm yr−1 for the past ∼8 ka. Interestingly, Lambeck et al. (2014) did not include data from the deltas of Chao Phraya of Thailand, the Mekong and Red rivers of Vietnam, and the Pearl and Yangtze rivers of China, for the purpose of estimating the equivalent sea level function. We suggest the mismatch between subsidence rates in large deltaic depocenters and adjacent non-deltaic sites can be attributed to the interplay between spatially non-uniform progradation and aggradation of the deltaic sediment wedge and the spatially non-uniform flexural isostatic response to changes in sediment and water load sediment load as forced by climate-driven sea level change.
We use conceptual simulations to unravel the flexural isostatic response to the interplay between climate-forced sea level change, sediment erosion, and deposition in deep time on passive margin deltaic depocenters. Our results illustrate how cumulative high-frequency, bidirectional isostatic adjustments play an important role in driving along-strike and cross-shelf river mouth migration and sediment accumulation. Our results also show that accommodation coevolves in sync with flexural isostatic adjustments to climate-driven sea level change, and the associated responses of large fluvial-deltaic systems. We find that only simulations with no imposed sea level change produce a true monotonic increase in flexural subsidence and unidirectional deltaic progradation, regardless of timescale. We therefore view cyclical and bidirectional flexural responses to be inherent in fluvial–deltaic systems because they are coupled to the increasingly well-understood nature of how surface dynamics in fluvial–deltaic systems respond to climate-forced sea level changes to produce the stratigraphic record.
The model inputs and outputs and the post-processing code used in this study are available online at https://doi.org/10.5281/zenodo.10553850 (Polanco, 2024)
The supplement related to this article is available online at: https://doi.org/10.5194/esurf-12-301-2024-supplement.
SP designed the simulations, carried them out, and prepared the manuscript. MB contributed to the conceptual design of the simulations and the manuscript writing. TS significantly contributed to the performance of the simulations and code development. TS, RF, XD, BM, and CM helped with the post-processing codes. All authors contributed to the revision and editing of the manuscript.
The contact author has declared that none of the authors has any competing interests.
Publisher's note: Copernicus Publications remains neutral with regard to jurisdictional claims made in the text, published maps, institutional affiliations, or any other geographical representation in this paper. While Copernicus Publications makes every effort to include appropriate place names, the final responsibility lies with the authors.
The authors thank the associate editors Andreas Baas, Tor Somme, Torbjörn Törnqvist, and Andy D. Wickert and an anonymous reviewer for their constructive comments on an earlier version of the manuscript.
This research has been supported by the Australian Research Council (grant no. IH130200012), the University of Melbourne, and the Australian–American Fulbright Commission.
This paper was edited by Andreas Baas and reviewed by Torbjörn Törnqvist and Tor Somme.
Allen, P. A. and Allen, J. R.: Basin Analysis: Principles and Application to Petroleum Play Assessment, Wiley, ISBN 978-0-470-67376-8, 2005.
Armstrong, C., Mohrig, D., Hess, T., George, T., and Straub, K. M.: Influence of growth faults on coastal fluvial systems: Examples from the late Miocene to Recent Mississippi River Delta, Sediment. Geol., 301, 120–132, https://doi.org/10.1016/j.sedgeo.2013.06.010, 2014.
Athy, L. F.: Density, Porosity, and Compaction of Sedimentary Rocks1, AAPG Bull., 14, 1–24, https://doi.org/10.1306/3d93289e-16b1-11d7-8645000102c1865d, 1930.
Bevis, M., Alsdorf, D., Kendrick, E., Fortes, L. P., Forsberg, B., Smalley Jr., R., and Becker, J.: Seasonal fluctuations in the mass of the Amazon River system and Earth's elastic response, Geophys. Res. Lett., 32, L16308, https://doi.org/10.1029/2005GL023491, 2005.
Blum, M., Martin, J., Milliken, K., and Garvin, M.: Paleovalley systems: Insights from Quaternary analogs and experiments, Earth-Sci. Rev., 116, 128–169, https://doi.org/10.1016/j.earscirev.2012.09.003, 2013.
Blum, M. and Pecha, M.: Mid-Cretaceous to Paleocene North American drainage reorganization from detrital zircons, Geology, 42, 607–610, https://doi.org/10.1130/g35513.1, 2014.
Blum, M. D., Tomkin, J. H., Purcell, A., and Lancaster, R. R.: Ups and downs of the Mississippi Delta, Geology, 36, 675–678, https://doi.org/10.1130/g24728a.1, 2008.
Blum, M. D., Hattier-Womack, J., Kneller, B., Martinsen, O. J., and McCaffrey, B.: Climate Change, Sea-Level Change, and Fluvial Sediment Supply to Deepwater Depositional Systems, in: External Controls on Deep-Water Depositional Systems, SEPM Society for Sedimentary Geology, https://doi.org/10.2110/sepmsp.092, 2009.
Blum, M. D., Milliken, K. T., Pecha, M. A., Snedden, J. W., Frederick, B. C., and Galloway, W. E.: Detrital-zircon records of Cenomanian, Paleocene, and Oligocene Gulf of Mexico drainage integration and sediment routing: Implications for scales of basin-floor fans, Geosphere, 13, 2169–2205, https://doi.org/10.1130/ges01410.1, 2017.
Carvajal, C., Steel, R., and Petter, A.: Sediment supply: The main driver of shelf-margin growth, Earth-Sci. Rev., 96, 221–248, https://doi.org/10.1016/j.earscirev.2009.06.008, 2009.
Chappell, J.: Late Quaternary glacio- and hydro-isostasy, on a layered earth, Quat. Res., 4, 405–428, https://doi.org/10.1016/0033-5894(74)90037-4, 1974.
Clark, J. A., Farrell, W. E., and Peltier, W. R.: Global changes in postglacial sea level: A numerical calculation, Quat. Res., 9, 265–287, https://doi.org/10.1016/0033-5894(78)90033-9, 1978.
Cramer, B. S., Miller, K. G., Barrett, P. J., and Wright, J. D.: Late Cretaceous–Neogene trends in deep ocean temperature and continental ice volume: Reconciling records of benthic foraminiferal geochemistry (δ18O and ) with sea level history, J. Geophys. Res.-Oceans, 116, C12023, https://doi.org/10.1029/2011JC007255, 2011.
Doust, H. and Omatbola, E.: Niger Delta, in: Divergent/Passive Margin Basins, 2009/05/01 ed., edited by: Edwards, J. D. and Santogrossi, P. A., AAPG, 201–238, 1990.
Driscoll, N. W. and Karner, G. D.: Flexural deformation due to Amazon Fan loading: A feedback mechanism affecting sediment delivery to margins, Geology, 22, 1015–1018, https://doi.org/10.1130/0091-7613(1994)022<1015:Fddtaf>2.3.Co;2, 1994.
Feng, J., Buffler, R. T., and Kominz, M. A.: Laramide orogenic influence on late Mesozoic-Cenozoic subsidence history, western deep Gulf of Mexico basin, Geology, 22, 359–362, https://doi.org/10.1130/0091-7613(1994)022<0359:Loiolm>2.3.Co;2, 1994.
Frederick, B. C., Blum, M., Fillon, R., and Roberts, H.: Resolving the contributing factors to Mississippi Delta subsidence: Past and Present, Basin Res., 31, 171–190, https://doi.org/10.1111/bre.12314, 2019.
Galloway, W. E.: Genetic Stratigraphic Sequences in Basin Analysis II: Application to Northwest Gulf of Mexico Cenozoic Basin1, AAPG Bull., 73, 143–154, https://doi.org/10.1306/703c9afa-1707-11d7-8645000102c1865d, 1989.
Ivins, E. R., Dokka, R. K., and Blom, R. G.: Post-glacial sediment load and subsidence in coastal Louisiana, Geophys. Res. Lett., 34, L16303, https://doi.org/10.1029/2007GL030003, 2007.
Jackson, M. P. A. and Hudec, M. R.: Salt Tectonics: Principles and Practice, Cambridge University Press, Cambridge, ISBN 9781139003988, 2017.
Jankowski, K. L., Törnqvist, T. E., and Fernandes, A. M.: Vulnerability of Louisiana's coastal wetlands to present-day rates of relative sea-level rise, Nat. Commun., 8, 14792, https://doi.org/10.1038/ncomms14792, 2017.
Johannessen, E. P. and Steel, R. J.: Shelf-margin clinoforms and prediction of deepwater sands, Basin Res., 17, 521–550, https://doi.org/10.1111/j.1365-2117.2005.00278.x, 2005.
Jouet, G., Hutton, E. W. H., Syvitski, J. P. M., and Berné, S.: Response of the Rhône deltaic margin to loading and subsidence during the last climatic cycle, Comput. Geosci., 34, 1338–1357, https://doi.org/10.1016/j.cageo.2008.02.003, 2008.
Keogh, M. E., Törnqvist, T. E., Kolker, A. S., Erkens, G., and Bridgeman, J. G.: Organic Matter Accretion, Shallow Subsidence, and River Delta Sustainability, J. Geophys Res.-Earth, 126, e2021JF006231, https://doi.org/10.1029/2021JF006231, 2021.
King, R., Backé, G., Tingay, M., Hillis, R., and Mildren, S.: Stress deflections around salt diapirs in the Gulf of Mexico, Geological Society, London, Special Publications, 367, 141–153, https://doi.org/10.1144/SP367.10, 2012.
Klausen, T. G., Nyberg, B., and Helland-Hansen, W.: The largest delta plain in Earth's history, Geology, 47, 470–474, https://doi.org/10.1130/g45507.1, 2019.
Kuchar, J., Milne, G., Wolstencroft, M., Love, R., Tarasov, L., and Hijma, M.: The Influence of Sediment Isostatic Adjustment on Sea Level Change and Land Motion Along the U.S. Gulf Coast, J. Geophys. Res.-Solid, 123, 780–796, https://doi.org/10.1002/2017JB014695, 2018.
Lambeck, K. and Nakada, M.: Late Pleistocene and Holocene sea-level change along the Australian coast, Palaeogeogr. Palaeocl., 89, 143–176, https://doi.org/10.1016/0031-0182(90)90056-D, 1990.
Lambeck, K.: Glacial isostasy and water depths in the Late Devensian and Holocene on the Scottish Shelf west of the Outer Hebrides, J. Quat. Sci., 10, 83–86, https://doi.org/10.1002/jqs.3390100109, 1995.
Lambeck, K., Purcell, A., Johnston, P., Nakada, M., and Yokoyama, Y.: Water-load definition in the glacio-hydro-isostatic sea-level equation, Quat. Sci. Rev., 22, 309–318, https://doi.org/10.1016/S0277-3791(02)00142-7, 2003.
Lambeck, K., Rouby, H., Purcell, A., Sun, Y., and Sambridge, M.: Sea level and global ice volumes from the Last Glacial Maximum to the Holocene, P. Natl. Acad. Sci. USA, 111, 15296–15303, https://doi.org/10.1073/pnas.1411762111, 2014.
Martin, J., Fernandes, A. M., Pickering, J., Howes, N., Mann, S., and McNeil, K.: The Stratigraphically Preserved Signature of Persistent Backwater Dynamics in a Large Paleodelta System: The Mungaroo Formation, North West Shelf, Australia, J. Sed. Res., 88, 850–872, https://doi.org/10.2110/jsr.2018.38, 2018.
Mason, C. C., Romans, B. W., Stockli, D. F., Mapes, R. W., and Fildani, A.: Detrital zircons reveal sea-level and hydroclimate controls on Amazon River to deep-sea fan sediment transfer, Geology, 47, 563–567, https://doi.org/10.1130/g45852.1, 2019.
McKenzie, D.: Some remarks on the development of sedimentary basins, Earth Planet. Sc. Lett., 40, 25–32, https://doi.org/10.1016/0012-821X(78)90071-7, 1978.
Meckel, T. A., Ten Brink, U. S., and Williams, S. J.: Sediment compaction rates and subsidence in deltaic plains: numerical constraints and stratigraphic influences, Basin Res., 19, 19–31, https://doi.org/10.1111/j.1365-2117.2006.00310.x, 2007.
Miller, K. G., Browning, J. V., Schmelz, W. J., Kopp, R. E., Mountain, G. S., and Wright, J. D.: Cenozoic sea-level and cryospheric evolution from deep-sea geochemical and continental margin records, Sci. Adv., 6, eaaz1346, https://doi.org/10.1126/sciadv.aaz1346, 2020.
Mitrovica, J. X. and Peltier, W. R.: On postglacial geoid subsidence over the equatorial oceans, J. Geophys. Res.-Sol. Ea., 96, 20053–20071, https://doi.org/10.1029/91JB01284, 1991.
Mitrovica, J. X. and Milne, G. A.: On post-glacial sea level: I. General theory, Geophys. J. Int., 154, 253–267, https://doi.org/10.1046/j.1365-246X.2003.01942.x, 2003.
Morley, C. K., King, R., Hillis, R., Tingay, M., and Backe, G.: Deepwater fold and thrust belt classification, tectonics, structure and hydrocarbon prospectivity: A review, Earth-Sci. Rev., 104, 41–91, https://doi.org/10.1016/j.earscirev.2010.09.010, 2011.
Morón, S., Cawood, P. A., Haines, P. W., Gallagher, S. J., Zahirovic, S., Lewis, C. J., and Moresi, L.: Long-lived transcontinental sediment transport pathways of East Gondwana, Geology, 47, 513–516, https://doi.org/10.1130/g45915.1, 2019.
Muhs, D. R., Simmons, K. R., Schumann, R. R., Schweig, E. S., and Rowe, M. P.: Testing glacial isostatic adjustment models of last-interglacial sea level history in the Bahamas and Bermuda, Quat. Sci. Rev., 233, 106212, https://doi.org/10.1016/j.quascirev.2020.106212, 2020.
Nakada, M. and Lambeck, K.: Late Pleistocene and Holocene sea-level change in the Australian region and mantle rheology, Geophys. J. Int., 96, 497–517, https://doi.org/10.1111/j.1365-246X.1989.tb06010.x, 1989.
Nyberg, B., Helland-Hansen, W., Gawthorpe, R. L., Sandbakken, P., Eide, C. H., Sømme, T., Hadler-Jacobsen, F., and Leiknes, S.: Revisiting morphological relationships of modern source-to-sink segments as a first-order approach to scale ancient sedimentary systems, Sediment. Geol., 373, 111–133, https://doi.org/10.1016/j.sedgeo.2018.06.007, 2018.
Peltier, W. R.: Global glacial isostasy and the surface of the ice-age earth: The ICE-5G (VM2) Model and GRACE, Annu. Rev. Earth Pl. Sc., 32, 111–149, https://doi.org/10.1146/annurev.earth.32.082503.144359, 2004.
Polanco, S.: saraemp/egusphere-2023-53: published model (v1.0.0), Zenodo [data set], https://doi.org/10.5281/zenodo.10553850, 2024.
Posarnentier, H. W. and Allen, G. P.: Siliciclastic Sequence Stratigraphy – Concepts and Applications, SEPM Society for Sedimentary Geology, https://doi.org/10.2110/csp.99.07, ISBN 10 1565760700, 1999.
Potter, E.-K. and Lambeck, K.: Reconciliation of sea-level observations in the Western North Atlantic during the last glacial cycle, Earth Planet. Sc. Lett., 217, 171–181, https://doi.org/10.1016/S0012-821X(03)00587-9, 2004.
Reynolds, D. J., Steckler, M. S., and Coakley, B. J.: The role of the sediment load in sequence stratigraphy: The influence of flexural isostasy and compaction, J. Geophys. Res.-Sol. Ea., 96, 6931–6949, https://doi.org/10.1029/90JB01914, 1991.
Sadler, P.: The influence of hiatuses on sediment accumulation rates, GeoResearch Forum, 15–40, 1999.
Sadler, P. M.: Sediment Accumulation Rates and the Completeness of Stratigraphic Sections, J. Geol., 89, 569–584, 1981.
Salles, T. and Hardiman, L.: Badlands: An open-source, flexible and parallel framework to study landscape dynamics, Comput. Geosci., 91, 77–89, https://doi.org/10.1016/j.cageo.2016.03.011, 2016.
Salles, T., Ding, X., and Brocard, G.: pyBadlands: A framework to simulate sediment transport, landscape dynamics and basin stratigraphic evolution through space and time, PLOS ONE, 13, e0195557, https://doi.org/10.1371/journal.pone.0195557, 2018.
Schwab, W. C., Gayes, P. T., Morton, R. A., Driscoll, N. W., Baldwin, W. E., Barnhardt, W. A., Denny, J. F., Harris, M. S., Katuna, M. P., Putney, T. R., Voulgaris, G., Warner, J. C., and Wright, E. E.: Coastal change along the shore of northeastern South Carolina the South Carolina coastal erosion study, edited by: Barnhardt, W. A. and Schwab, W. C., U.S. Dept. of the Interior, U.S. Geological Survey, Reston, Va., https://doi.org/10.3133/cir1339, 2009.
Shen, Z., Dawers, N. H., Törnqvist, T. E., Gasparini, N. M., Hijma, M. P., and Mauz, B.: Mechanisms of late Quaternary fault throw-rate variability along the north central Gulf of Mexico coast: implications for coastal subsidence, Basin Res., 29, 557–570, https://doi.org/10.1111/bre.12184, 2017.
Sømme, T. O., Helland-Hansen, W., Martinsen, O. J., and Thurmond, J. B.: Relationships between morphological and sedimentological parameters in source-to-sink systems: a basis for predicting semi-quantitative characteristics in subsurface systems, Basin Res., 21, 361–387, https://doi.org/10.1111/j.1365-2117.2009.00397.x, 2009.
Sømme, T. O., Huwe, S. I., Martinsen, O. J., Sandbakken, P. T., Skogseid, J., and Valore, L. A.: Stratigraphic expression of the Paleocene-Eocene Thermal Maximum climate event during long-lived transient uplift – An example from a shallow to deep-marine clastic system in the Norwegian Sea, Front. Earth Sci., 11, 1082203, https://doi.org/10.3389/feart.2023.1082203, 2023.
Steckler, M. S., Nooner, S. L., Akhter, S. H., Chowdhury, S. K., Bettadpur, S., Seeber, L., and Kogan, M. G.: Modeling Earth deformation from monsoonal flooding in Bangladesh using hydrographic, GPS, and Gravity Recovery and Climate Experiment (GRACE) data, J. Geophys. Res.-Sol. Ea., 115, B08407, https://doi.org/10.1029/2009JB007018, 2010.
Steckler, M. S., Oryan, B., Wilson, C. A., Grall, C., Nooner, S. L., Mondal, D. R., Akhter, S. H., DeWolf, S., and Goodbred, S. L.: Synthesis of the distribution of subsidence of the lower Ganges-Brahmaputra Delta, Bangladesh, Earth-Sci. Rev., 224, 103887, https://doi.org/10.1016/j.earscirev.2021.103887, 2022.
Sweet, M. L. and Blum, M. D.: Connections Between Fluvial To Shallow Marine Environments and Submarine Canyons: Implications For Sediment Transfer To Deep Water, J. Sediment. Res., 86, 1147–1162, https://doi.org/10.2110/jsr.2016.64, 2016.
Tesauro, M., Kaban, M. K., and Cloetingh, S. A. P. L.: Global strength and elastic thickness of the lithosphere, Global Planet. Change, 90, 51–57, https://doi.org/10.1016/j.gloplacha.2011.12.003, 2012.
Thom, B. G. and Chappell, J.: Holocene Sea Level Change: An Interpretation, Philos. T. Roy. Soc. A, 291, 187–194, 1978.
Törnqvist, T. E., Wallace, D. J., Storms, J. E. A., Wallinga, J., van Dam, R. L., Blaauw, M., Derksen, M. S., Klerks, C. J. W., Meijneken, C., and Snijders, E. M. A.: Mississippi Delta subsidence primarily caused by compaction of Holocene strata, Nat. Geosci., 1, 173–176, https://doi.org/10.1038/ngeo129, 2008.
Wahbi, A. M., Blum, M. D., and Nazworth Doerger, C.: Early Cretaceous continental-scale sediment routing, the McMurray Formation, Western Canada Sedimentary Basin, Alberta, Canada, GSA Bull., 135, 2088–2106, https://doi.org/10.1130/b36412.1, 2022.
Wang, H., Gurnis, M., and Skogseid, J.: Rapid Cenozoic Subsidence in the Gulf of Mexico Resulting From Hess Rise Conjugate Subduction, Geophys. Res. Lett., 44, 10930–10938, https://doi.org/10.1002/2017GL074959, 2017.
Wang, H., Gurnis, M., and Skogseid, J.: Continent-wide drainage reorganization in North America driven by mantle flow, Earth Planet. Sc. Lett., 530, 115910, https://doi.org/10.1016/j.epsl.2019.115910, 2020.
Watts, A. B.: Lithospheric flexure due to prograding sediment loads: implications for the origin of offlap/onlap patterns in sedimentary basins, Basin Res., 2, 133–144, https://doi.org/10.1111/j.1365-2117.1989.tb00031.x, 1989.
Watts, A. B.: Isostasy and Flexure of the Lithosphere, New York, ISBN 0 521 62272 7, 2001.
Watts, A. B., Rodger, M., Peirce, C., Greenroyd, C. J., and Hobbs, R. W.: Seismic structure, gravity anomalies, and flexure of the Amazon continental margin, NE Brazil, J. Geophys. Res.-Sol. Ea., 114, B07103, https://doi.org/10.1029/2008JB006259, 2009.
Whitehouse, P. L.: Glacial isostatic adjustment modelling: historical perspectives, recent advances, and future directions, Earth Surf. Dynam., 6, 401–429, https://doi.org/10.5194/esurf-6-401-2018, 2018.
Wickert, A. D.: Open-source modular solutions for flexural isostasy: gFlex v1.0, Geosci. Model Dev., 9, 997–1017, https://doi.org/10.5194/gmd-9-997-2016, 2016.
Wolstencroft, M., Shen, Z., Törnqvist, T. E., Milne, G. A., and Kulp, M.: Understanding subsidence in the Mississippi Delta region due to sediment, ice, and ocean loading: Insights from geophysical modeling, J. Geophys. Res.-Sol. Ea., 119, 3838–3856, https://doi.org/10.1002/2013JB010928, 2014.
Zachos, J., Pagani, M., Sloan, L., Thomas, E., and Billups, K.: Trends, Rhythms, and Aberrations in Global Climate 65 Ma to Present, Science, 292, 686–693, https://doi.org/10.1126/science.1059412, 2001.