the Creative Commons Attribution 4.0 License.
the Creative Commons Attribution 4.0 License.
 | 06 Sep 2024
Drainage rearrangement in an intra-continental mountain belt: a case study from the central South Tian Shan, Kyrgyzstan
Peter van der Beek
Taylor F. Schildgen
Edward R. Sobel
Simone Racano
Apolline Mariotti
Fergus McNab
Fluvial drainage patterns in orogenic belts reflect interactions among tectonics, climate, and lithology. The central South Tian Shan displays a complex fluvial drainage pattern that shifts from longitudinal (flowing parallel to mountain ranges) in the west to transverse (flowing across ranges) in the east. Whether such drainage patterns reflect underlying patterns of tectonic deformation, lithology, climate, or the influence of surface processes within a drainage basin is often unclear. We focus here on the large Saryjaz catchment of SE Kyrgyzstan, which marks the transition between longitudinal and transverse drainages. We analyse topographic and fluvial metrics including slope, river steepness (ksn), and the integral proxy (χ) along the river profile, and we map the spatial distribution and characteristics of knickpoints to discern the possible controls on the observed drainage pattern. We discriminate between knickpoints of different origin, namely tectonic, lithologic, glacial, and those linked to transient waves of incision. We find a series of transient knickpoints in tributaries downstream of a sharp 180° bend in the main stem of the Saryjaz river, which also marks a striking increase in channel steepness. Both observations indicate accelerated incision along this lower reach of the catchment. Knickpoint elevations and ksn below the knickpoints decrease downstream, whereas χt values of knickpoints (χ measured from the tributary junctions) remain near-constant among tributaries. These results, together with a comparison of other rivers in the vicinity that show no evidence of transient knickpoints, suggest that transient incision in the Saryjaz catchment is driven “top-down” by a large-magnitude river capture event rather than “bottom-up” by accelerated uplift or base-level fall. We estimate an erodibility parameter from 10Be-derived catchment-average denudation rates and use this to estimate the celerity of knickpoints. We find that the knickpoints started retreating at a similar time between ca. 1.5 and 4.4 Myr ago. Considering the river patterns and the timing constraints, we suggest that this capture event was likely driven by the overfill of Neogene intermontane basins, potentially affected by both tectonic and climate factors.
- Article
(8656 KB) - Full-text XML
-
Supplement
(13774 KB) - BibTeX
- EndNote


Map patterns of rivers result from interactions among climate, tectonics, and lithology (Hovius, 1996; Whipple, 2004; Babault et al., 2012; Seagren and Schoenbohm, 2019; Seagren et al., 2022; Wolf et al., 2022). River patterns in turn play a key role in source-to-sink relationships (Gupta, 1997; Horton and Decelles, 2001), biodiversity (Craw et al., 2016; Boschman et al., 2023; Stokes et al., 2023; He et al., 2024b), and tectonic evolution (e.g. Garcia-Castellanos and Jiménez-Munt, 2015; Jourdon et al., 2018; Viaplana-Muzas et al., 2019). The occurrence of both longitudinal (i.e. strike-parallel) and transverse (i.e. strike-perpendicular) drainage patterns has long been observed and discussed in different tectonic settings, from collisional (e.g. Himalaya) to intra-continental (e.g. High Atlas or Pyrenees) or accretionary (e.g. Andes), associated with either thin- or thick-skinned deformation mechanisms (e.g. Oberlander, 1985; Gupta, 1997; Babault et al., 2012; Seagren et al., 2022). One common drainage evolution model considers that longitudinal drainage patterns are controlled by active structures (e.g. faults and folds). Growth of the mountain belt steepens regional and local slopes, thereby favouring the development of transverse drainage patterns that flow parallel to the regional slopes to replace the relatively low-energy longitudinal drainage (Babault et al., 2012; Struth et al., 2015). Another model, applicable to the broken Andean foreland of NW Argentina, suggests a stable and long-lived longitudinal drainage network developing from an initial transverse pattern, likely controlled by the inconsistent regional orogenic taper and locally high relief (Seagren et al., 2022). Conversely, Wolf et al. (2022) did not describe evolutionary stages of drainage systems but rather emphasized that longitudinal or transverse drainage networks can reflect steady-state forms of tectonically or erosionally dominated mountain belts, respectively.
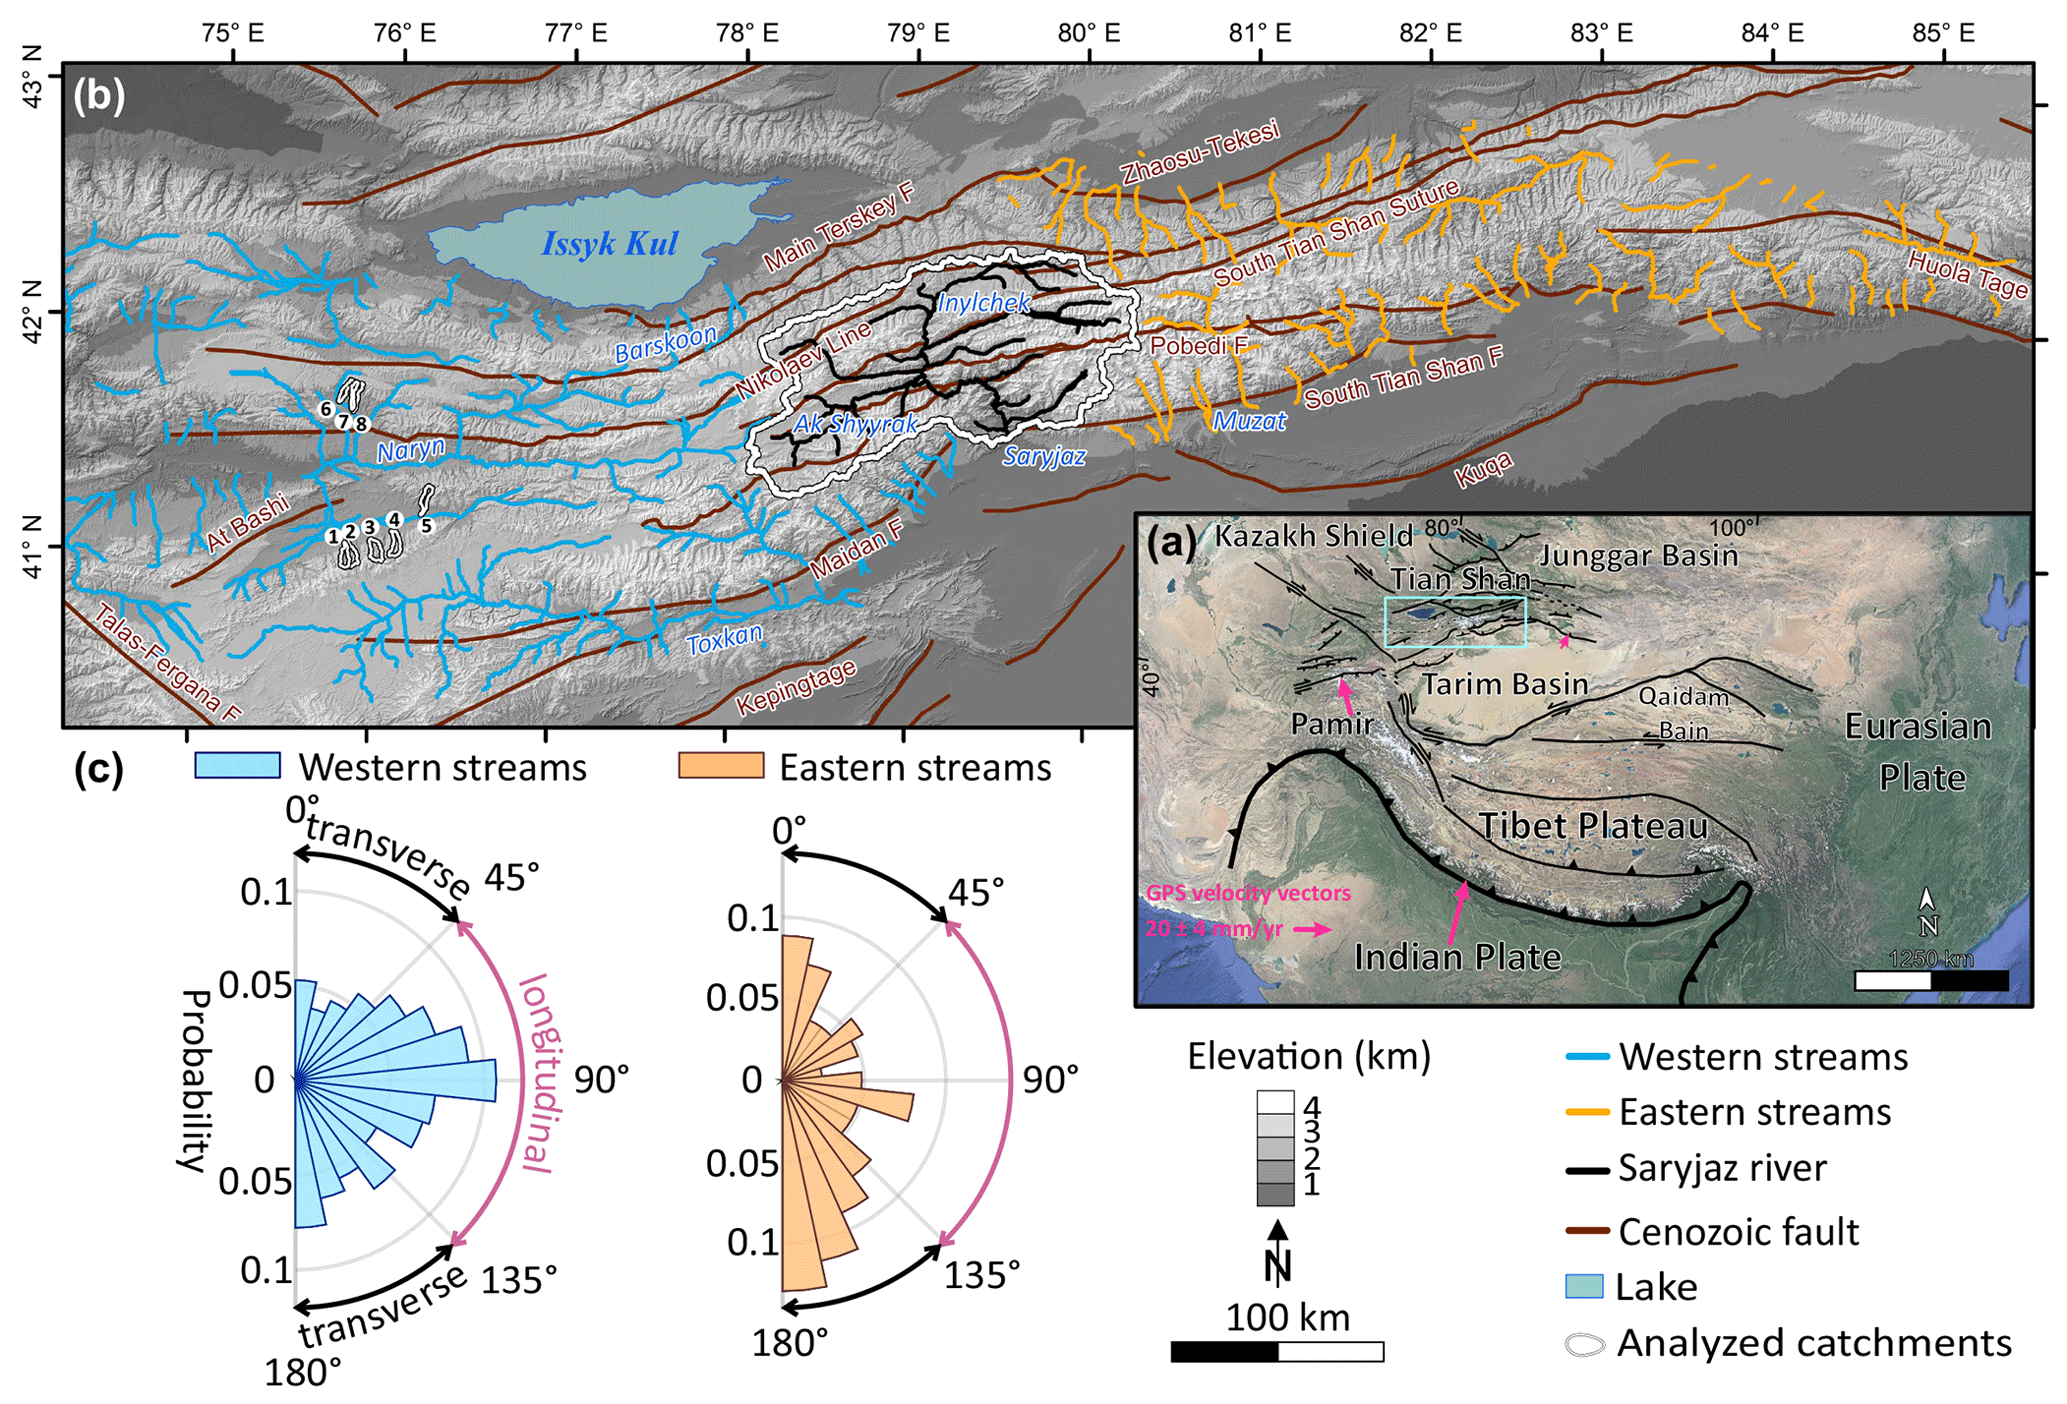
Figure 1(a) Overview of the Tian Shan, including major faults and present-day shortening rates from GPS velocity vectors (mm yr−1; Wang et al., 2001; Yang et al., 2008), with the basemap from ©Google Earth. (b) Shaded topographic map of the South Tian Shan showing the main Cenozoic faults (modified after Mikolaichuk et al., 2008) and rivers. The Saryjaz catchment is outlined, as are the small catchments used for cosmogenic erosion-rate determinations (labelled 1 to 8 on the western side of the map). Mostly longitudinal drainage to the west of the Saryjaz catchment is indicated in blue; mostly transverse drainage to the east is indicated in orange. (c) Rose diagrams of stream orientations, with blue and orange indicating streams to the west and east of the Saryjaz catchment, respectively (corresponding to the coloured channels in panel b). As the strike direction of the South Tian Shan is close to W–E, we classify stream segments with orientations between [0, 45°] and between [135°, 180°] as transverse, while those in the range [45°, 135°] are classified as longitudinal.
As the largest intracontinental orogen in central Asia, the Tian Shan exhibits complex relationships between Cenozoic deformation, topography, glacial erosion, and drainage response. GPS data show that modern N–S shortening rates across the Tian Shan decrease eastward from ∼ 17.5 to ∼ 3 mm yr−1, indicating strong spatial differences in recent deformation rates (Abdrakhmatov et al., 1996; Wang et al., 2001; Yang et al., 2008; Fig. 1a). Topographic growth within the Tian Shan and Pamir Mountains likely started between 12 and 7 Myr ago (Ma) and appears to continue today, as tectonic uplift has been shown to outpace modern erosional denudation in the eastern Tian Shan (Charreau et al., 2017, 2023; Li et al., 2022; Richter et al., 2022). The onset of Plio-Pleistocene glaciations, possibly starting from around 3 to 2.5 Ma based on records of increased erosional variability (Charreau et al., 2011; Puchol et al., 2017), likely affected relief development and may have triggered the reactivation of tectonic structures (Sobel et al., 2006b).
Within this tectonic and climatic context, the South Tian Shan lies between the Talas–Fergana Fault to the west (around 75° E) and the Huola Tage Mountain to the east (around 85° E); it is separated from the North Tian Shan by the Main Terskey Fault and from the Tarim Basin by the Maidan and South Tian Shan faults (Fig. 1). It exhibits a significant contrast between a longitudinal drainage pattern in the west and a transverse drainage pattern in the east (Yin et al., 1998; Jourdon et al., 2017; Morin et al., 2019; Fig. 1). However, it is unclear how or if the drainage pattern responded to Cenozoic structural reactivation and the uplift of individual ranges, a major change in climate, or locally intense glacial erosion, any of which may have had an impact on how regional drainage patterns have evolved.
The large Saryjaz catchment sits within the transition zone between the longitudinal and transverse drainages. As such, it may offer clues as to whether the drainage pattern has changed through time and, if so, what might have triggered the change (Fig. 1b). Here we combine quantitative analysis of topography using fluvial metrics (i.e. slope, channel steepness, and integral proxy χ) with the mapping and characterization of knickpoints throughout the Saryjaz catchment and in some smaller neighbouring catchments. Based on multiple lines of evidence that point to a landscape undergoing a transient adjustment (e.g. prominent migrating knickpoints and systematic shifts in channel steepness values), we next consider whether tectonic forcing or drainage capture can explain the observations. We use a 1-D stream-power model to explore expected differences in these metrics for an increase in rock-uplift rate versus a drainage–capture scenario. Finally, we use recently published denudation rates inferred from 10Be concentrations of river sands to calibrate an erodibility parameter and place constraints on the duration of transient knickpoint migration to help determine the role of regional forcing conditions on the drainage evolution. While this type of analysis is common in tectonically active regions, only a few studies have considered how geomorphic metrics may be used to detect drainage–capture events (Yanites et al., 2013; Giachetta and Willett, 2018; Penserini et al., 2023; Rohrmann et al., 2023).
2.1 Topographic and climatic setting
The South Tian Shan is a generally W–E-trending mountain belt characterized by a high-elevation and high-relief landscape, with numerous peaks rising to > 4000 m above sea level (Fig. 1). Piedmont elevations to the north of the mountain belt, in the intermontane Issyk Kul basin and adjacent Zhaosu–Tekesi basin, are around 1500–2000 m. The Tarim Basin acts as a foreland basin flanking the South Tian Shan, lying at elevations between 800 and 1000 m. Between the Tarim Basin and the South Tian Shan, the Kepingtage and Kuqa ranges reach elevations of ∼ 3000 m (Fig. 1b). The South Tian Shan is characterized by transient landscapes, as documented by widespread high-standing relict low-relief surfaces and elevated intermontane basins (Abdrakhmatov et al., 2001; Morin et al., 2019).
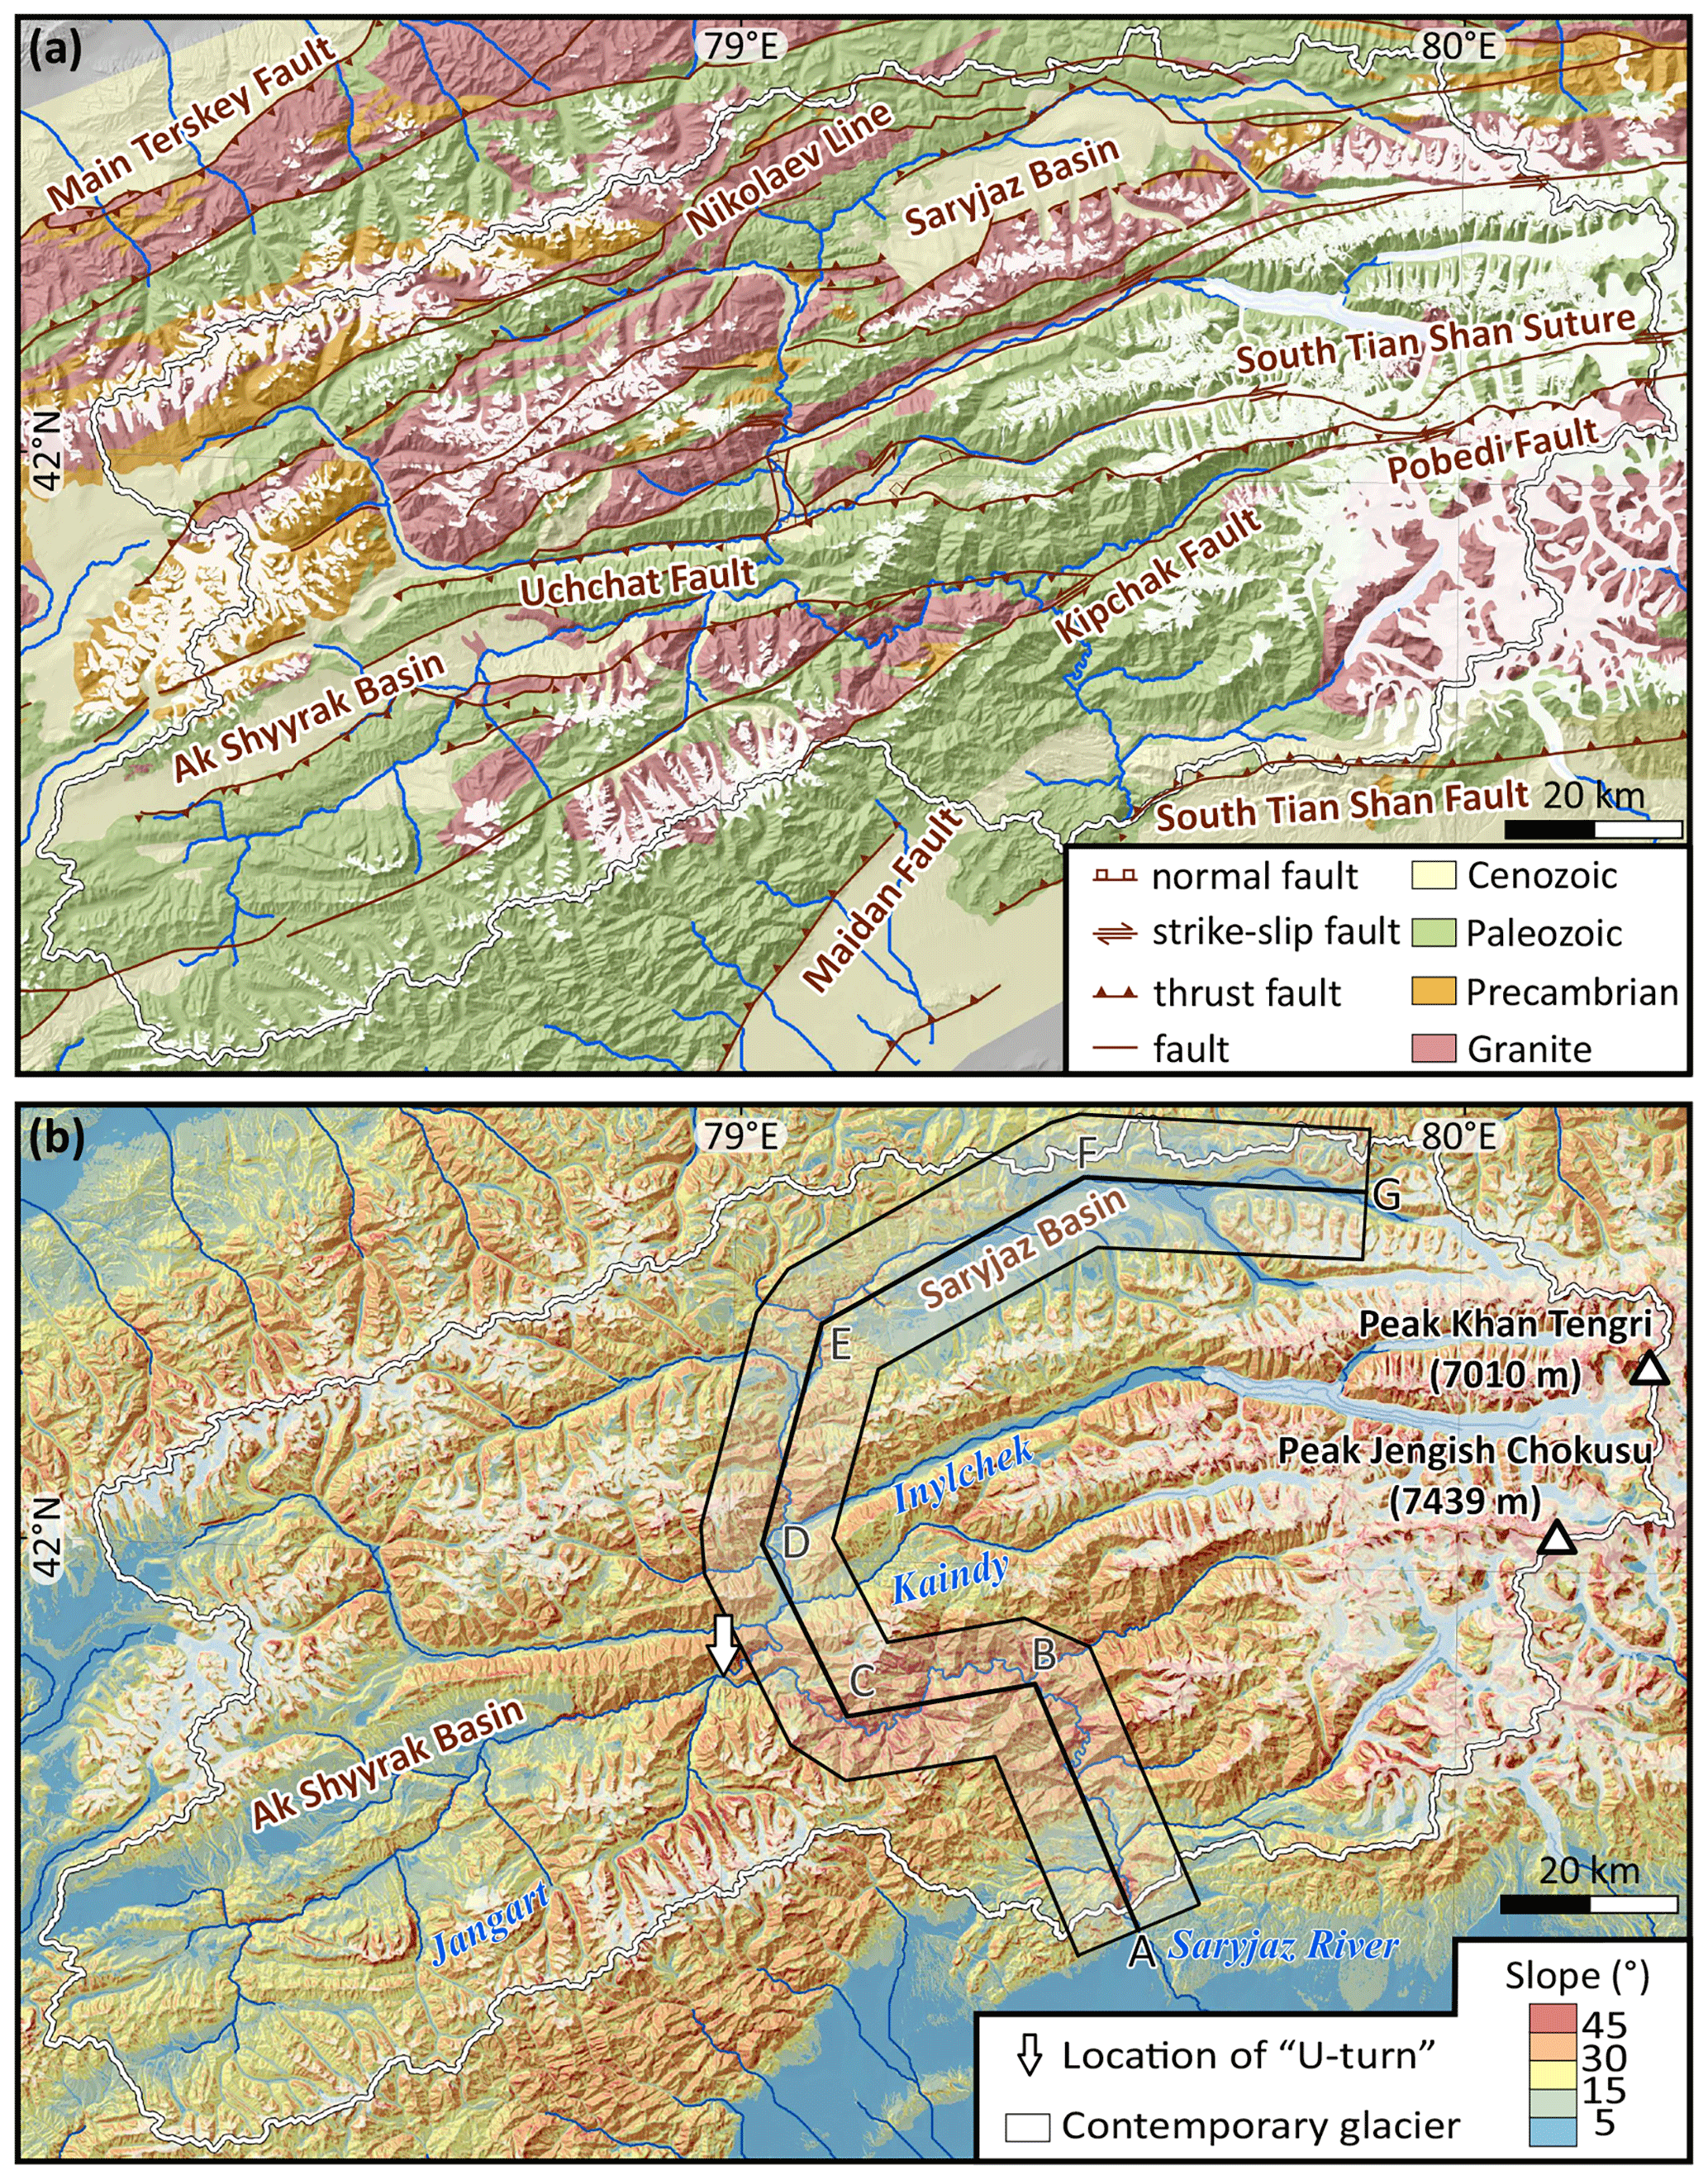
Figure 2(a) Geological map (Mikolaichuk et al., 2008; Zhukov et al., 2008) and (b) slope map of the Saryjaz catchment overlain on a shaded topographic relief. White shading in all three maps indicates contemporary glaciers. The arrow in panel (b) shows the location of the U-turn in the Saryjaz trunk stream. The bands labelled A–G indicate the location of the swath profile shown in Fig. 7a.
Within the South Tian Shan, elevations, together with relief and slopes, decrease to the east and west from a central core at about 80° E latitude. Two major peaks, Khan Tengri (7010 m) and Jengish Chokusu (or Pobeda; 7439 m), rise in this core of the orogen at the boundary between Kyrgyzstan, Kazakhstan, and China (Fig. 2b). The width of the mountain belt decreases from west to east, forming an elongated triangular shape. Drainage basins in the east (between 80–85° E; streams coloured orange in Fig. 1b) are mostly characterized by transverse streams, whereas to the west (between 74–78° E; streams coloured blue in Fig. 1b) streams show dominantly longitudinal patterns. The transition zone between these two drainage patterns hosts both the highest topography and the Saryjaz river catchment (Figs. 1 and 2). The Saryjaz river shows a combination of longitudinal and transverse components; the upstream reaches, originating in the Khan Tengri and Jengish Chokusu ranges, flow to the southwest, parallel to the mountain range, before gradually turning to the south with several sharp bends, including a prominent “U-turn” near the eastern limit of the intermontane Ak Shyyrak basin (Fig. 2). This upstream part of the catchment also includes several east-flowing longitudinal tributaries. Downstream of the U-turn, the main stem of the river flows to the SE, cutting transversely through the mountain range and into the Tarim Basin (Figs. 1 and 2).
The late Cenozoic climate of central Asia has been marked by a continuous cooling trend since ca. 15 Ma, with particularly strong cooling associated with Plio-Pleistocene global glaciations (Zachos et al., 2001; Macaulay et al., 2016; Frisch et al., 2019; Richter et al., 2022). Global cooling, together with the topographic growth of the Pamir Mountains and Tian Shan, largely contributed to the aridification of the Tarim Basin and its surroundings (Sun et al., 2017; Richter et al., 2022). Average annual precipitation throughout the southern Tian Shan varies from 455 mm in the west to only 97 mm in the east; it ranges between ∼ 200 and 300 mm in our study area (Chen et al., 2016; Guan et al., 2022).
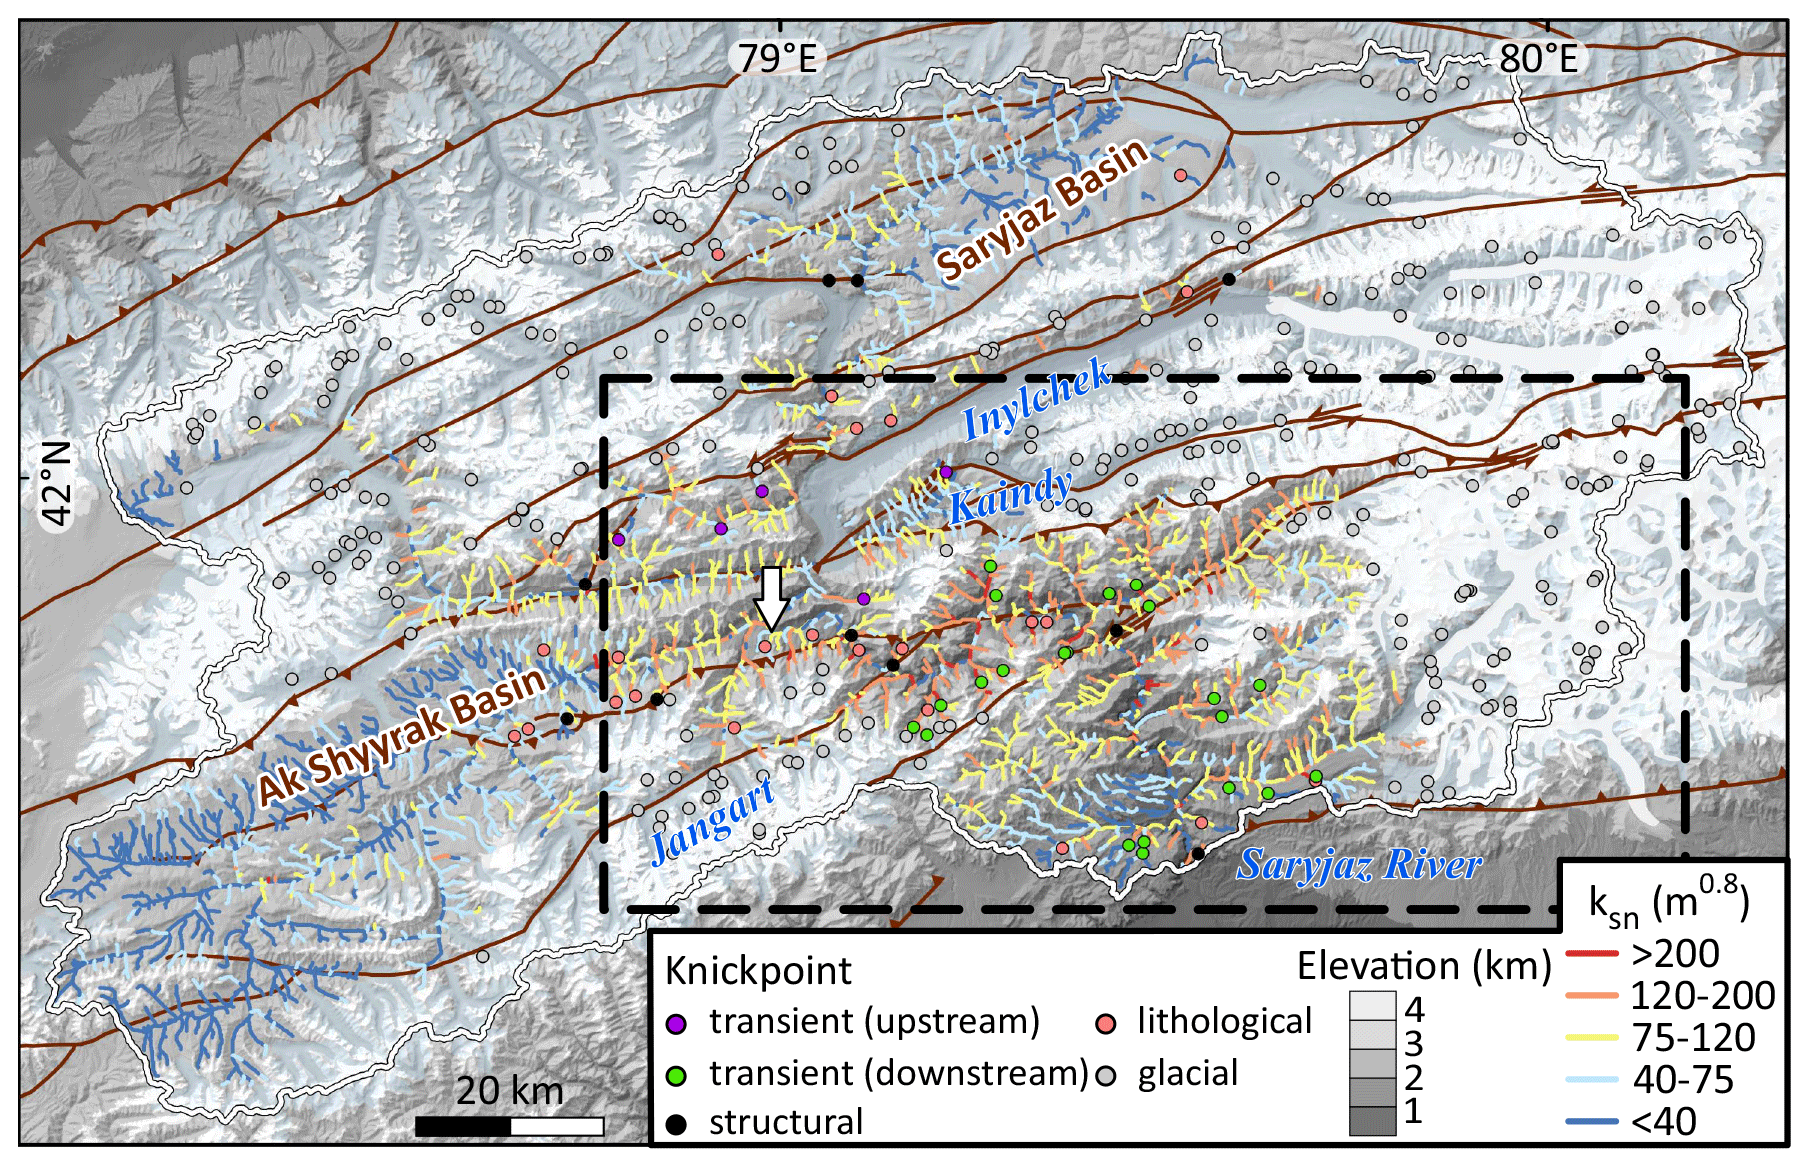
Figure 3Normalized channel steepness (ksn) map of the Saryjaz catchment and knickpoints with inferred origins overlain on a shaded topographic relief. Cenozoic faults are as in Fig. 2a. The white arrow with a black edge shows the location of the U-turn in the Saryjaz trunk stream. The dashed black box indicates extent of Fig. 5. Knickpoints coloured in green indicate transient knickpoints downstream of the U-turn, while purple ones are upstream.
Glaciers have played an important role in the late Cenozoic topographic and drainage evolution of the Tian Shan. The South Tian Shan shows widespread glacial landforms, especially in regions with elevations over 3000 to 3500 m (Stroeven et al., 2013). The geomorphologically recorded maximum positions of glaciers in the Inylchek and Saryjaz valleys occurred during the Last Glacial Maximum (marine isotope stage 2), based on 10Be exposure dating of moraine sequences, and corresponds to an estimated equilibrium line altitude (ELA) depression of 225 m (Lifton et al., 2014; Fig. 3). Former glacial extents, and glacial imprints on the landscape, are generally more extensive on the northern flank of the South Tian Shan than on its southern flank. This difference has been argued to control differential piedmont river incision, which is significantly higher on the northern than on the southern piedmont of the South Tian Shan (Malatesta and Avouac, 2018). However, the Saryjaz catchment, draining to the southern piedmont of the Tian Shan, is an exception as it was extensively glaciated but has not incised its piedmont significantly. Malatesta and Avouac (2018) explained this anomaly as a result of ongoing evacuation of sediment from the upstream glacial valleys.
2.2 Geological setting
The Tian Shan is bounded by the Tarim Basin to the south and the Kazakh platform and Junggar block to the north (Burbank et al., 1999). The basement of the Tian Shan is made up of three terranes, North Tian Shan, Middle Tian Shan, and South Tian Shan, separated by two Paleozoic sutures that also accumulated significant sinistral strike-slip: the Late Devonian–Early Carboniferous Nikolaev Line and the Late Carboniferous South Tian Shan Suture (Burtman, 1975, 2010; Biske, 1995; Bazhenov et al., 2003; Bazhenov and Mikolaichuk, 2004; Fig. 1b).
The ancestral Tian Shan was formed by the collision of the Tarim, Kazakh, and Junggar blocks and continental accretion during the Paleozoic (e.g. Dumitru et al., 2001; Xiao et al., 2013). From Mesozoic to Early Cenozoic times, the Tian Shan experienced periodic reactivation in response to several distal collisions; these included collisions between the Lhasa block and Eurasia during the Late Jurassic, between the Kohistan–Ladakh arc and Eurasia in the Late Cretaceous, between Siberia and the Mongolia–north China block during the Late Cretaceous–early Paleogene, and the most recent collision between India and Asia since the early Paleogene (Watson et al., 1987; Hendrix et al., 1992; Sobel and Dumitru, 1997; Dumitru et al., 2001; Jolivet et al., 2010; Glorie et al., 2011; Macaulay et al., 2014).
Cenozoic deformation in the South Tian Shan, based on sedimentary and thermochronology records, initiated during the late Oligocene to early Miocene (∼ 30–22 Ma) (Sobel et al., 2006a; Glorie et al., 2011; Macaulay et al., 2014; Rolland et al., 2020). Paleozoic structures, including the Nikolaev Line and the South Tian Shan Suture, have localized the Cenozoic deformation, while the terranes in between generally behaved as rigid blocks (Jolivet et al., 2010; Glorie et al., 2011; Macaulay et al., 2013, 2014; Rolland et al., 2020). This pattern of deformation has resulted in the uplift of widely spaced mountain ranges separated by intermontane basins (Burbank et al., 1999; Macaulay et al., 2014). Two such basins occur in the Saryjaz catchment, the Saryjaz and Ak Shyyrak basins, which are mainly filled with Eocene–Pliocene conglomerate, sandstone, and siltstone, as well as recent deposits of pebbles, boulders, and clay (Mikolaichuk et al., 2008, 2022; Fig. 2a). Enhanced exhumation of the intervening mountain ranges is recorded during the Late Miocene (∼ 12–8 Ma) and Plio-Pleistocene (< 5 Ma; Sobel et al., 2006b; Macaulay et al., 2013, 2014; Rolland et al., 2020), possibly resulting from an interplay between climate change and tectonic deformation (Sobel et al., 2006b; Rolland et al., 2020; Chang et al., 2021).
Two faults that were demonstrably active during the Quaternary, the Maidan Fault to the southwest and the South Tian Shan Fault to the southeast, form the southern boundary of the central South Tian Shan (Fig. 1b). Based on the dating of Quaternary sediments and analysis of geomorphological features, late Quaternary movement along the Maidan Fault has been estimated to be around 1.2 mm yr−1 vertically and 1.6 mm yr−1 laterally (Wu et al., 2019). Frequent moderate to major earthquakes along the southwestern boundary of the South Tian Shan and its frontal Jiashi–Kepingtage region (e.g. the 1902 Mw 7.7 Atushi earthquake and the 2020 Mw 6.4 Jiashi earthquake) document its current tectonic activity (Lü et al., 2021). The South Tian Shan Fault, together with the structures in the Kuqa foreland basin, has developed a fold-and-thrust belt since the Oligocene (Izquierdo-Llavall et al., 2018; Li et al., 2022). Along the South Tian Shan, N–S shortening decreases from ∼ 17.5 to ∼ 3 mm yr−1 from west to east, with deformation patterns changing from orthogonal shortening to sinistral transpression along the main structures (Yang et al., 2008). At the easternmost end of the South Tian Shan, total late Cenozoic shortening has been estimated to be only 10–15 km (Cunningham et al., 2003; Li et al., 2022). Modern average denudation rates across the eastern South Tian Shan, derived from cosmogenic nuclides, are limited to between ∼ 0.1 and 0.2 mm yr−1, lower than the estimated crustal thickening rate of around 1.3 mm yr−1 (Charreau et al., 2023). These patterns indicate that the topography of the Tian Shan is still growing laterally and vertically (Charreau et al., 2017, 2023).
Prior to examining the details of the topographic and fluvial metrics within the Saryjaz catchment and surrounding regions, we first summarize how knickpoints can be important diagnostic indicators of transient adjustment within a drainage basin and how a series of other metrics can be used to help diagnose the trigger for transient incision, such as a change in rock-uplift rates or drainage capture.
Knickpoints (or knickzones) refer to a convex step in a river's overall concave longitudinal profile (e.g. Whipple, 2004; Whipple et al., 2013). Knickpoints can be classified as (1) vertical-step knickpoints, corresponding to local river steepening; (2) slope-break knickpoints with a distinct change in river gradient downstream; or (3) knickzones if they are not discrete points (Kirby and Whipple, 2012; Lague, 2014; Neely et al., 2017). All three types of knickpoints can be either stable, i.e. anchored in space, or transient and mobile, i.e. generally migrating upstream. Stable knickpoints may occur due to lithologic change or structures accommodating differential rock uplift such as folds or faults (Crosby and Whipple, 2006; Wobus et al., 2006; Gallen and Wegmann, 2017; Giachetta and Willett, 2018; Marrucci et al., 2018; Fadul et al., 2022; Seagren et al., 2022). Transient knickpoints show no direct relationship with geological features and originate due to a change in the river network boundary conditions. In a longitudinal profile, transient knickpoints commonly separate an upstream unadjusted stream segment from a steepened downstream portion characterized by faster incision rates (Wobus et al., 2006; Kirby and Whipple, 2012; Lague, 2014; Gallen and Wegmann, 2017; Schwanghart and Scherler, 2020). Two common drivers for transient knickpoint generation and retreat include (1) drainage capture or diversion and (2) an increase in rock-uplift rate (or increase in the rate of the base-level fall). Each process leads to specific topographic characteristics of knickpoints that can be used to infer the driver for knickpoint generation, as well as its timing, if an independent calibration of knickpoint retreat rate can be made.
We place our analysis within the framework of the detachment-limited stream-power law (e.g. Whipple and Tucker, 1999; Lague, 2014), which has been widely used to describe the topographic evolution of a landscape affected by tectonic uplift U and fluvial incision E:
where z is river-profile elevation, t is time, and K is an erodibility coefficient describing how erosion is impacted by climate, lithology, hydraulic parameters, and bedload (e.g. Whipple and Tucker, 1999; Smith et al., 2022). A is the upstream drainage area. The slope , where x is horizontal upstream distance, and m and n are exponents.
At steady state, i.e. if = 0, then Eq. (1) can be rewritten as a power law relation between slope (S) and drainage area (A) as follows:
where
ks, the steepness index, is useful for comparing the relative gradients of channels with different drainage areas (Flint, 1974; Whipple and Tucker, 1999; Wobus et al., 2006), whereas the concavity index (θ) corresponds to the ratio and quantifies how rapidly the river gradient decreases downstream (Flint, 1974; Lague, 2014; Gailleton et al., 2021; Smith et al., 2022).
To compare streams among multiple catchments, a reference concavity index (θref) is commonly used to derive a normalized steepness index, ksn (Whipple and Tucker, 1999; Wobus et al., 2006; Gallen and Wegmann, 2017). Typical values for θref range between 0.4 and 0.6, based on topographic observations and modelling studies (Kirby and Whipple, 2012; Gailleton et al., 2021).
To isolate possible information on transient incision from noise in DEM data, χ analysis is an effective approach (Perron and Royden, 2013). Integrating Eq. (2) with distance upstream of a base-level elevation z(xb) gives
where A0 is a reference drainage area, and χ is an integral quantity with a dimension of distance
In steady state, with constant U and K, Eq. (4) represents a linear relationship between χ and z, and the gradient is equal to ksn when A0 = 1. A useful property of χ that we utilize is that, under the condition of spatially uniform K, if χ is calculated starting at the junction of a tributary and the trunk stream, then its value at a knickpoint can be interpreted as a proxy for how much time has passed since the onset of knickpoint migration up the tributary channel.
Transient knickpoints can also be used to determine how much incision has occurred since the onset of the forcing that triggered incision. By projecting the “relict” portion of the profile (i.e. upstream of the knickpoint) to the position of the outlet, or confluence with the trunk, one can recreate the former “steady-state” profile and provide a minimum constraint on the magnitude of incision and/or surface uplift (Harkins et al., 2007; Kirby and Whipple, 2012; Smith et al., 2022; Clementucci et al., 2023). We hereafter refer to this measurement as the “incision depth”.
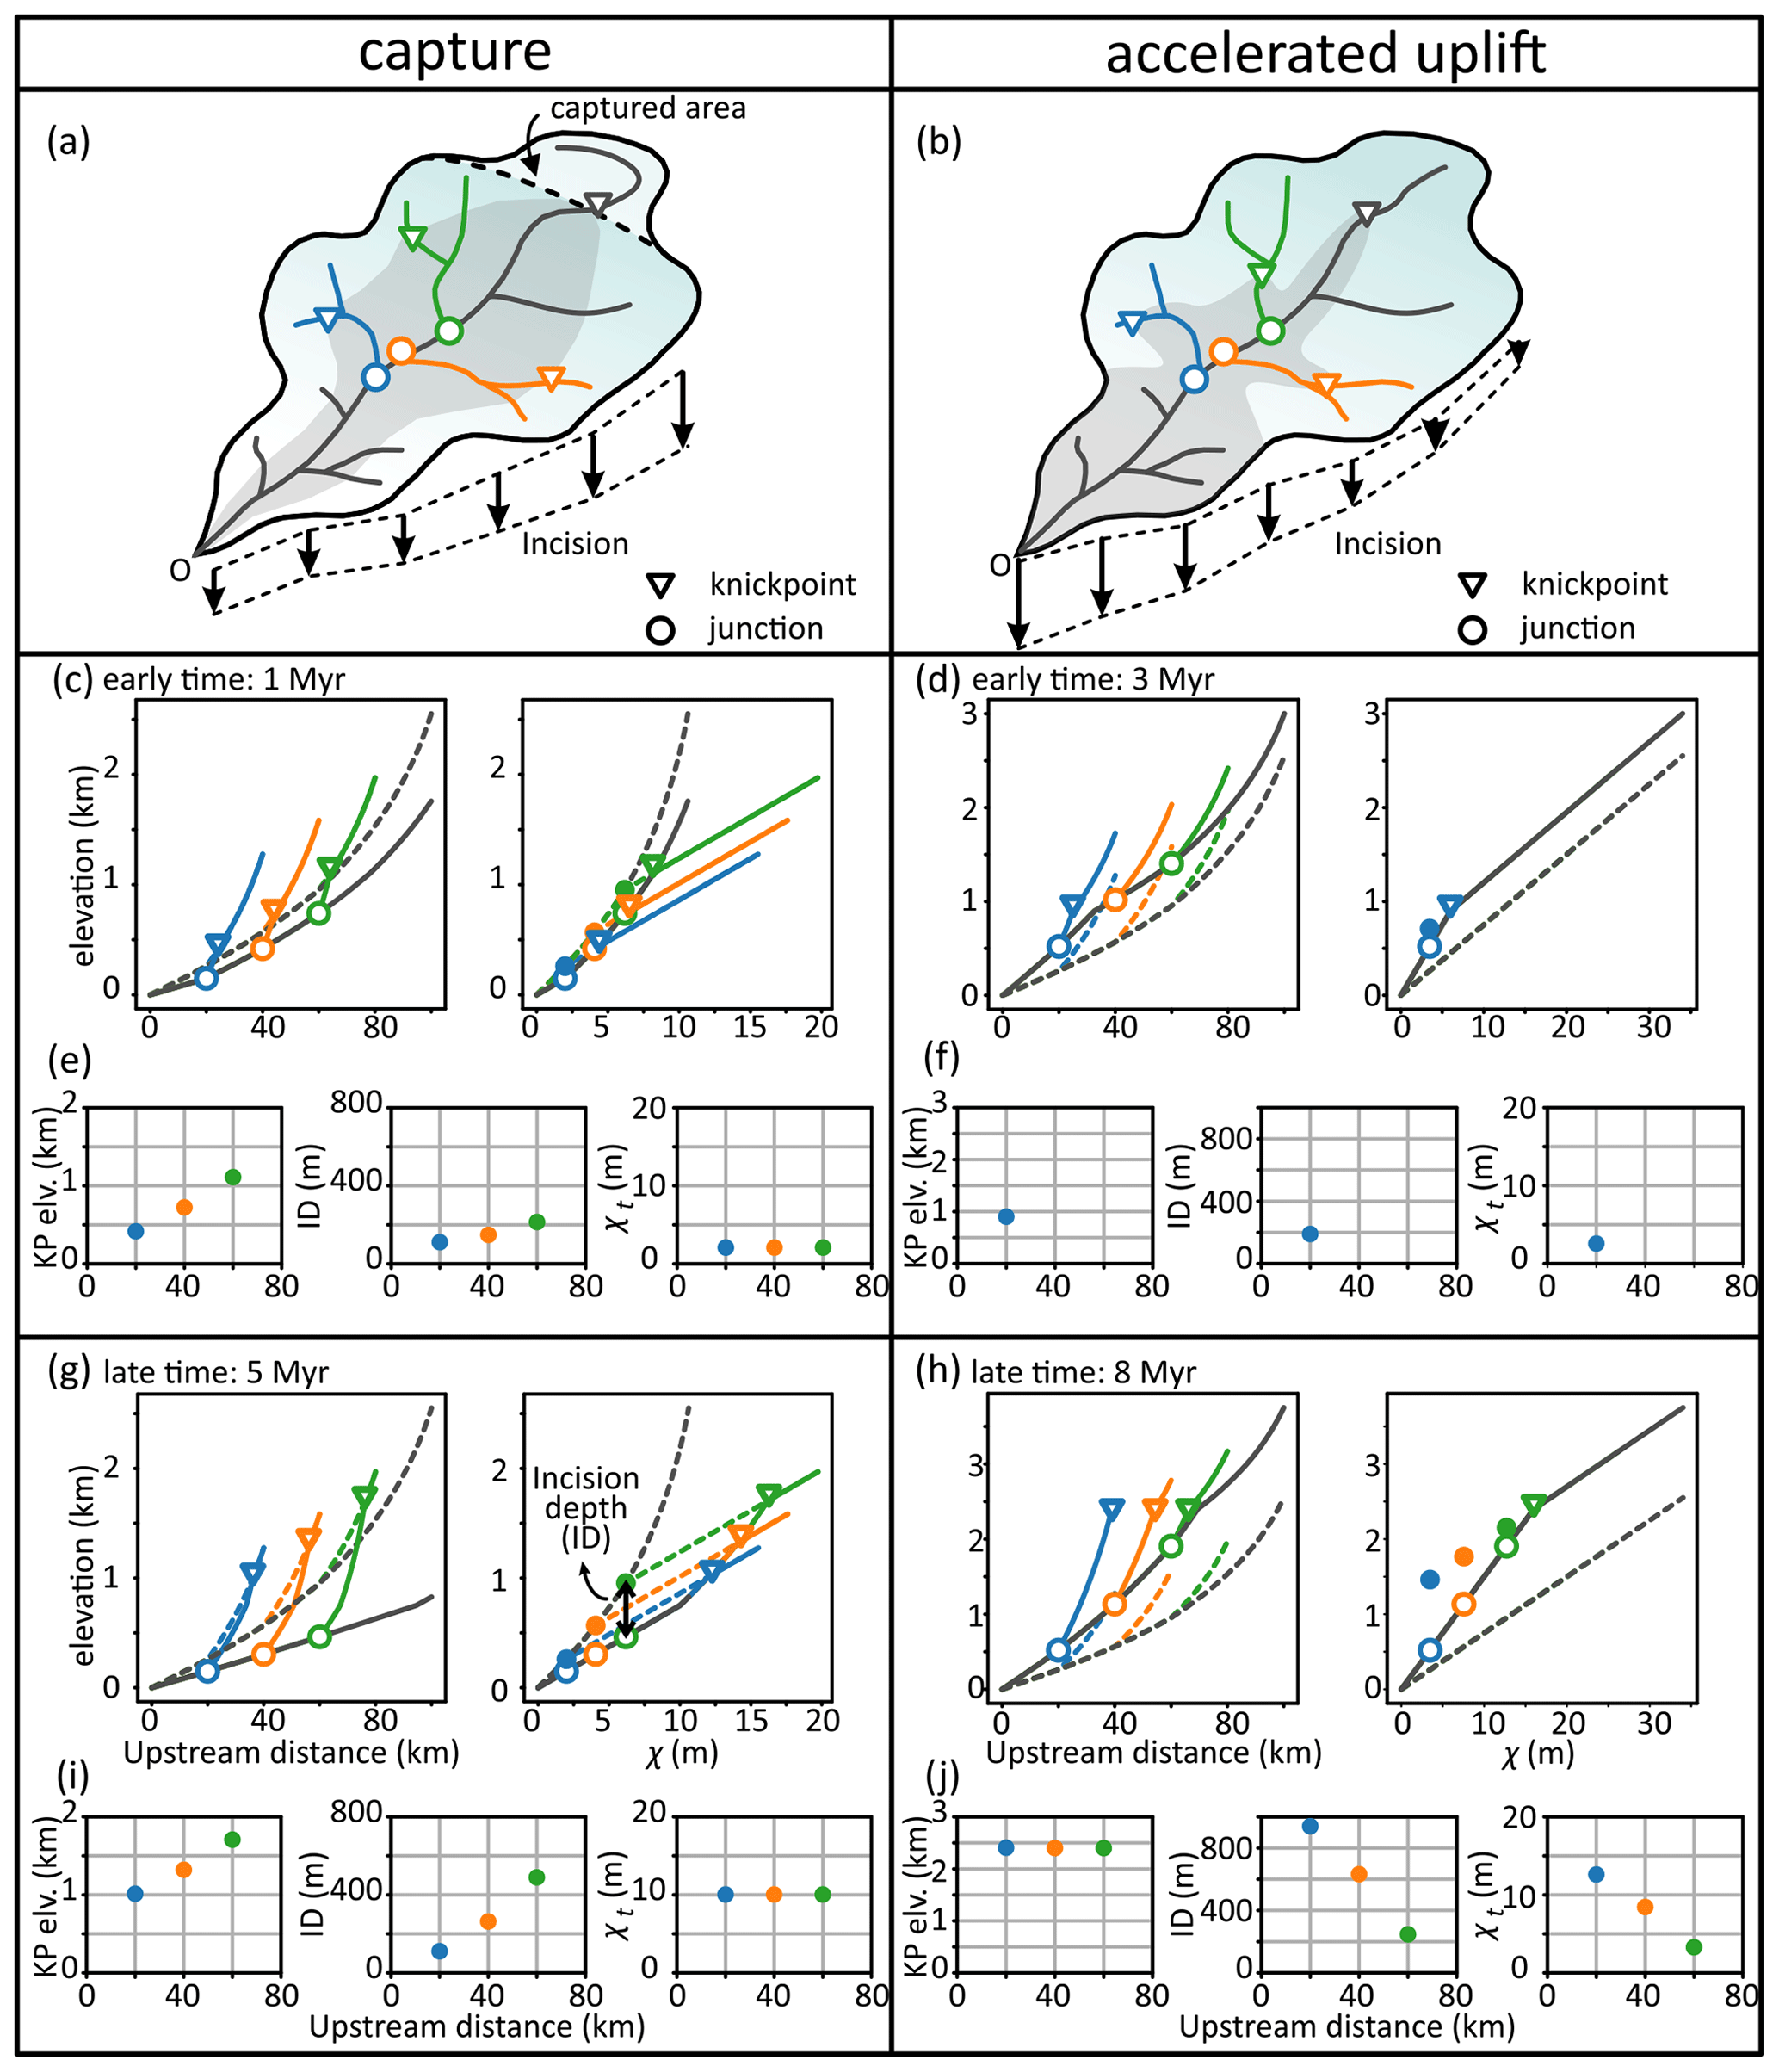
Figure 4Sketch of two common drivers for knickpoint retreat, namely (a) capture and (b) accelerated uplift. (c, d, g, and h) 1-D modelling of river profiles (on the left) and χ–z plots (on the right) at a time shortly after the event (1 and 3 Ma, respectively) and after a longer period of time (5 and 8 Ma, respectively). Dashed lines show initial profiles and solid lines show profiles after the indicated time. (e, f, i, and j) Plots of knickpoint metrics for three tributary valleys, with the knickpoint elevation (marked KP elev.), incision depth (marked ID), and migration of knickpoint (marked as χt) vs. the upstream distance of the tributary junctions.
To quantify the impact of two main hypothesized drivers of transient knickpoints, drainage-area capture and accelerated uplift, we simulated their effects on an idealized river network by solving the detachment-limited stream-power law using the method of characteristics (e.g. Rudge et al., 2015). We designed a river network with trunk stream length of 100 km and three tributaries originating at 40, 60, and 80 km from the river outlet (Fig. 4). We assume that n = 1 and that uplift is spatially uniform. The calculation of the drainage area follows Hack's law (i.e. L=kAh) with constant k = 2.1 km−0.08) and exponent h = 0.54 (average values from a recent global data set; He et al., 2024a). Other parameters, including rock-uplift rate (U = 150 m Myr−1) and erodibility (K = 2 m0.2 Myr−1) are chosen to be similar to those observed in the Saryjaz catchment (see below). In the first scenario, we show the network response to the capture of a 200 km long catchment (i.e. the addition to the trunk-stream drainage-area equivalent to a 200 km long catchment) (Fig. 4a). In the second scenario, we show the network response to a doubling in the uplift rate (or rate of relative base-level fall; Fig. 4b). For each scenario, the network is plotted in both a river long profile and χ (i.e. drainage-area normalized distance) space, along with distributions of knickpoint elevations and incision depths. Results are shown for the capture scenario and the uplift acceleration scenario shortly after the event (1 and 3 Myr, respectively) and after a longer period of time (5 and 8 Myr, respectively).
River capture diverts a stream into a neighbouring stream, leaving anomalies like sharp (i.e. ≥ 90°) bends, abandoned river valleys, wind gaps, and knickpoints near the point of capture (Bishop, 1995; Seagren and Schoenbohm, 2019; Fadul et al., 2022; He et al., 2024b; Fig. 4a). Water discharge will increase in the capturing stream, triggering incision (Bishop, 1995; Yanites et al., 2013; Giachetta and Willett, 2018; Rohrmann et al., 2023). Incision of the main stem of the capturing steam will in turn trigger a transient wave of incision that propagates up tributary valleys downstream of the capture point. In this scenario, knickpoints that occur along tributaries are initiated nearly simultaneously, moving upstream with a constant vertical velocity, which depends on initial and final incision rates, as well as the value of n (Niemann et al., 2001; Giachetta and Willett, 2018; Rohrmann et al., 2023). Knickpoints generally will not occur at the same elevation, since they start their vertical migration from different elevations along the trunk stream, whereas the duration of knickpoint migration, when corrected for tributary catchment size and erodibility, should be similar (see the plots of χt vs. distance in Fig. 4e and i and the explanation in Sect. 4.2). However, the amount of incision recorded below the knickpoints (incision depth) increases upstream, as the final trunk stream gradient will be lower than the initial trunk stream gradient (Fig. 4g). While the differences in the incision depth might initially be small (see the plots of incision depth vs. distance in Fig. 4e), over time that difference becomes more pronounced (Fig. 4i). Upstream of the capture point, the trunk stream experiences incision due to the relative base-level fall at the capture point (e.g. Yanites et al., 2013), which should consequently trigger transient incision in tributaries upstream of the capture point.
Alternatively, an increase in rock-uplift rate at the outlet of a catchment can trigger transient knickpoints (Fig. 4b). As the knickpoint in the trunk stream migrates upstream, it will initiate transient knickpoints in each subsequent tributary it encounters. Those knickpoints will also migrate up tributaries at a constant vertical rate (Niemann et al., 2001) but with different response times depending on the distance to the outlet. Specifically, tributaries closer to the outlet (starting at a lower elevation) start migrating earlier than the ones farther upstream (Wobus et al., 2006; Gallen and Wegmann, 2017; Schwanghart and Scherler, 2020; Fig. 4d). In this scenario, all transient knickpoints in the catchment should occur at a similar elevation (see the plots of knickpoint elevation vs. distance in Fig. 4f and j), but the incision depth and the onset time of incision (reflected in the distance that individual knickpoints migrated upstream of the tributary junctions) will decrease with distance from the outlet (see the plots of incision depth vs. distance and χt vs. distance in Fig. 4j).
4.1 Topographic analysis
We used the Copernicus GLO-30 digital elevation model (COP30) to analyse the topography of the central South Tian Shan. DEM processing tools in ArcGIS, the Topographic Analysis Kit (Forte and Whipple, 2019) and TopoToolbox 2 (Schwanghart and Kuhn, 2010; Schwanghart and Scherler, 2014), were used to extract catchments, topographic metrics, and fluvial metrics. Streams used for longitudinal profile and χ analysis were extracted with a minimum drainage area of 106 m2, which we found was sufficient to exclude portions of the basin dominated by hillslope processes (Montgomery, 2001). For geological information, we used the digital geological and natural-hazard maps of the Khan Tengri massif (Kyrgyzstan), with a scale of 1:200 000 created under the International Science and Technology Center (ISTC) project no. KR-920 (Mikolaichuk et al., 2008, 2022), and the geological map of the Kyrgyz Republic with a scale of 1:500 000 (Zhukov et al., 2008). We calculated θref with Bayesian optimization by minimizing a cross-validation loss (Schwanghart and Scherler, 2017) for the Saryjaz catchment. Results show a best-fit value of ∼ 0.4 (Fig. S1 in the Supplement), which we consequently used for the whole catchment. We chose 1500 m as the outlet elevation for the Saryjaz catchment.
4.2 Knickpoint analysis
4.2.1 Knickpoint identification and classification
Based on the noise-magnetic test (Schwanghart and Scherler, 2017), we chose 90 m as the tolerance to extract knickpoints using TopoToolbox 2 (Schwanghart and Kuhn, 2010; Schwanghart and Scherler, 2014). We verified the extracted knickpoints with satellite imagery to avoid potential erroneously identified knickpoints (e.g. from noise in the DEM), and classified knickpoints by describing their possible origins as (1) glacial, (2) lithologic, (3) structural (potentially linked to active faults), or (4) transient, due to either drainage reorganization or a change in tectonic uplift rate (e.g. Marrucci et al., 2018).
In the Saryjaz catchment, glacially impacted valleys are prominently U-shaped (Fig. S2a). Most valleys were glaciated down to an elevation of around 3000 to 3500 m, except the Inylchek valley, where glacial impacts reach below 2500 m (Stroeven et al., 2013). Tributaries to the main glaciated reaches commonly form hanging valleys, including along the Inylchek, Kaindy, and Jangart valleys (Fig. 2). In a longitudinal profile, a glacial knickpoint typically appears as an abrupt concave-up break close to a tributary confluence with a glaciated valley, either upstream in the tributary or downstream in the main valley (MacGregor et al., 2000; Valla et al., 2010; Fig. S2b). We identified glacial knickpoints as occurring within the mapped glacially impacted valleys (Stroeven et al., 2013) at elevations above 3000 to 3500 m (Fig. 3).
To identify structural and lithologic knickpoints, we referred to geologic mapping (Mikolaichuk et al., 2008) to classify faults as Cenozoic (i.e. Neotectonic, Quaternary, and active) or Paleozoic. Considering that the lithologic composition in the central South Tian Shan is rather constant for each geologic era, we classified the lithologies into four groups: (1) intrusive rock; (2) Precambrian metamorphic basement (gneiss, schist, amphibolite, and marble); (3) Paleozoic sedimentary rock, with a mix of clastic (e.g. sandstone, siltstone, and shale) and carbonate (e.g. limestone and dolomite) lithologies; and (4) Cenozoic clastic sediments. Knickpoints related to lithologic contrasts or to differential rock uplift are usually located on the boundaries of lithologies with different erodibilities or on mapped faults, respectively (Marrucci et al., 2018; Fadul et al., 2022). We identified lithologic and structural knickpoints as those lying within 250 m horizontal distance (chosen somewhat arbitrarily but considering that there could be some error in the positions of mapped contacts in such remote regions) from lithologic contacts or Cenozoic faults, respectively. We expect these knickpoints to be stationary, marking a spatial change in erodibility and/or rock-uplift rates. We verified our classification using satellite imagery (Fig. 3).
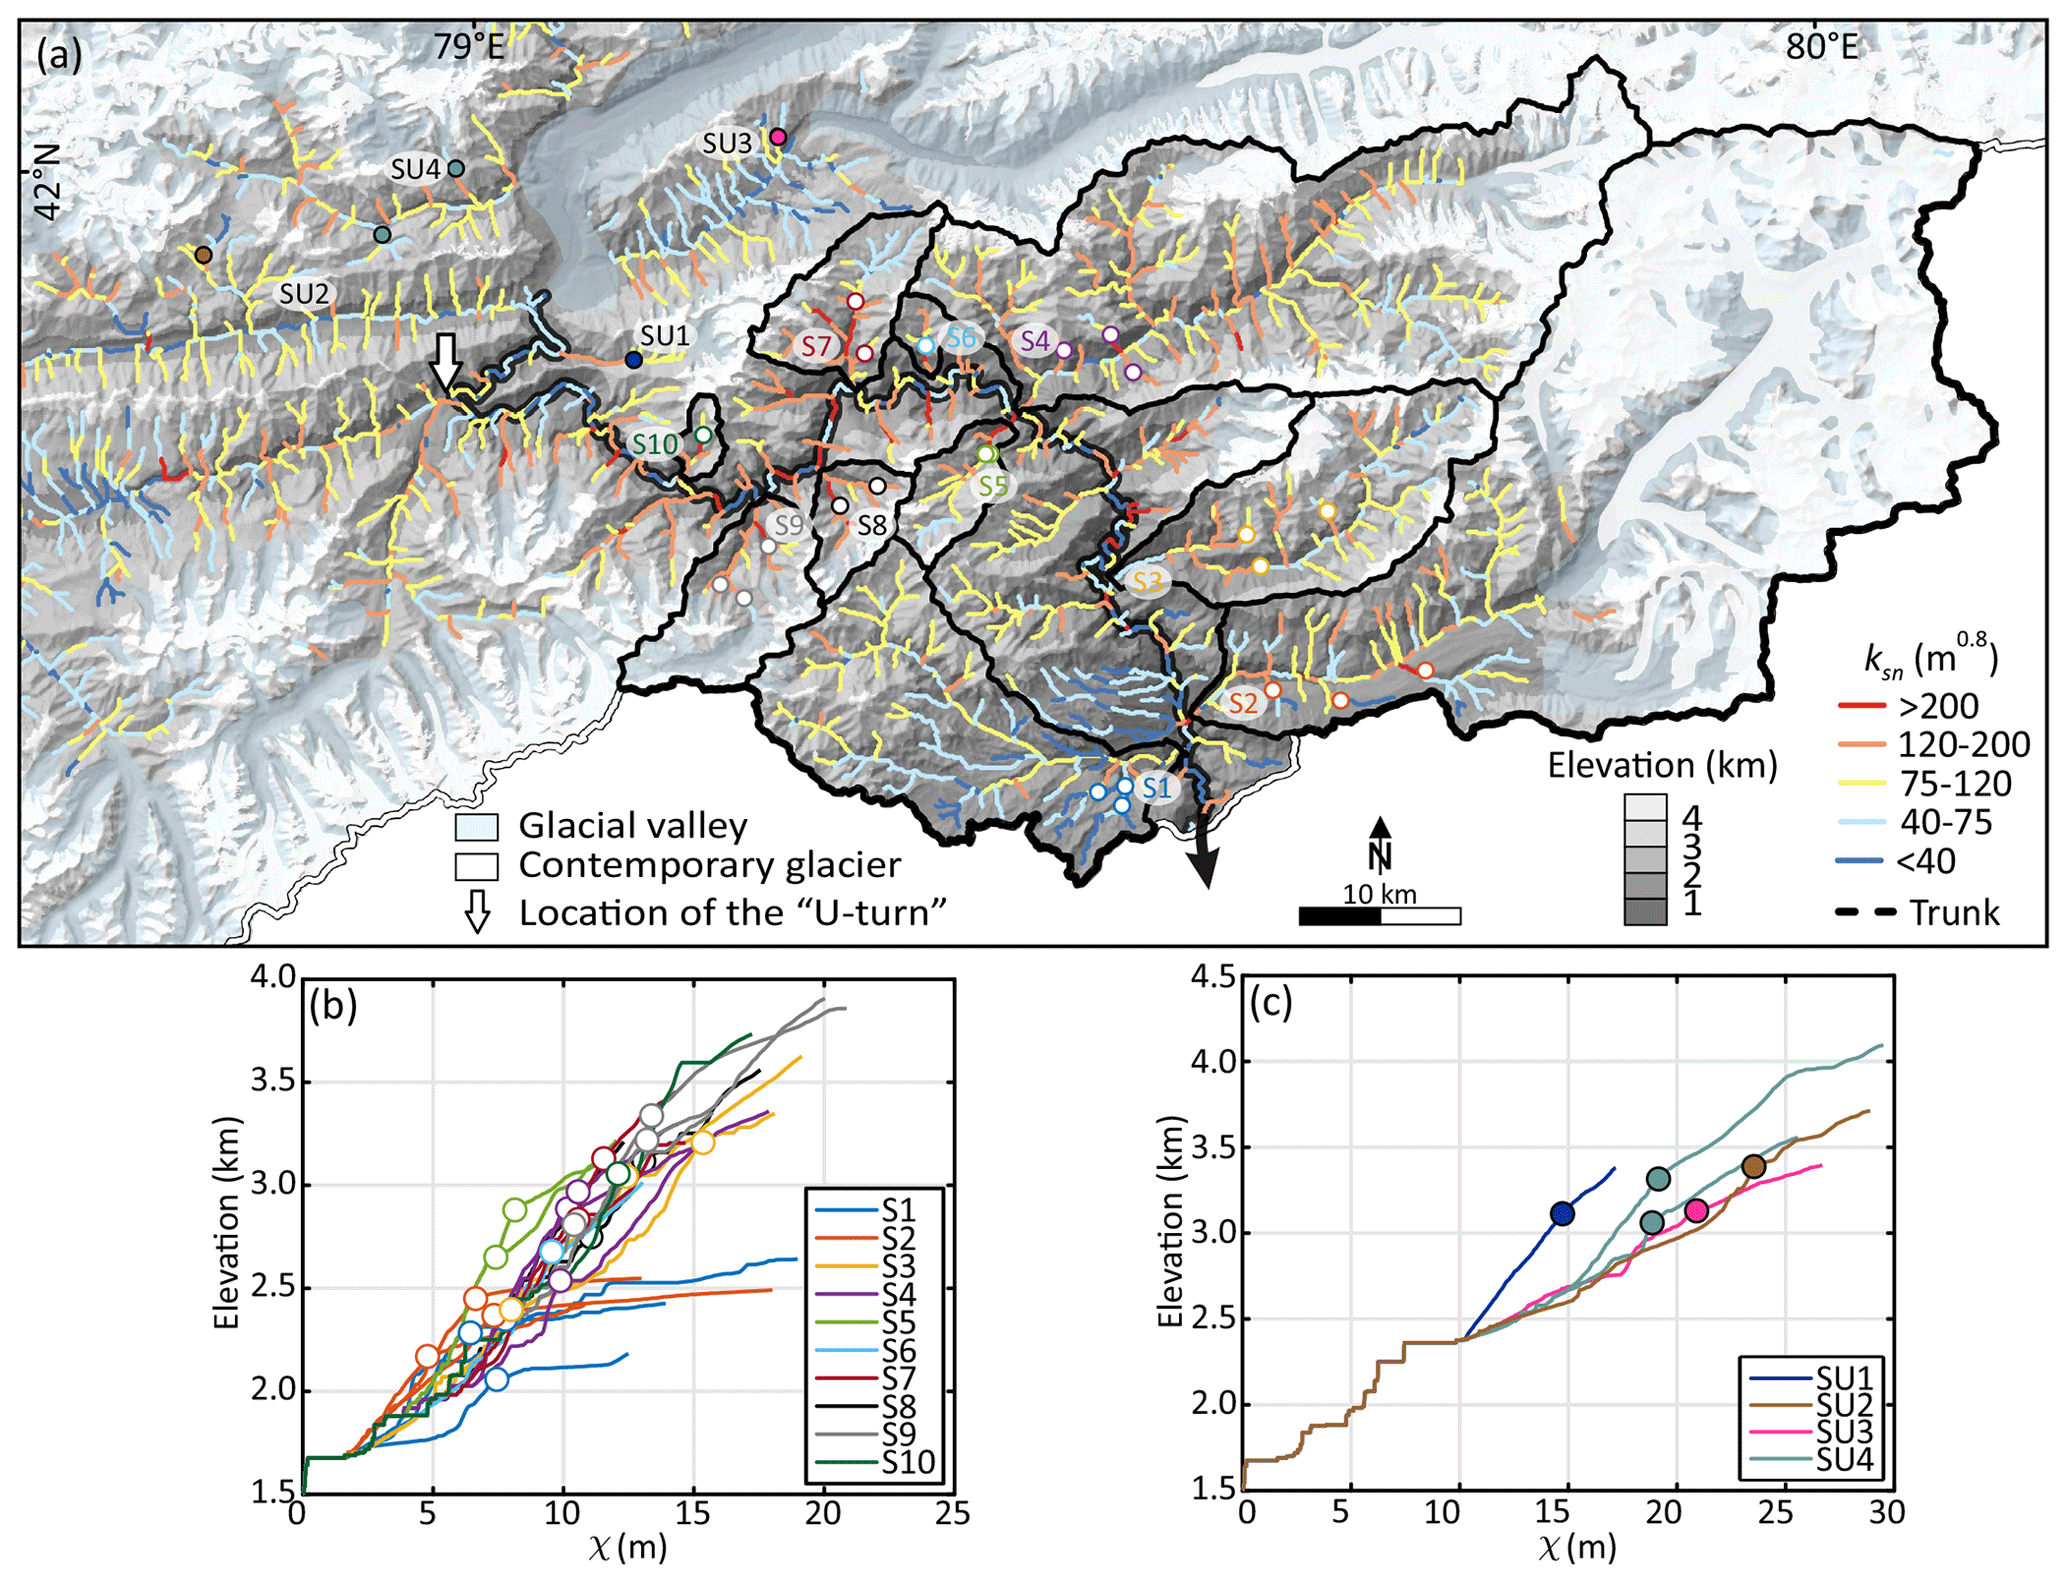
Figure 5(a) A total of 10 sub-catchments (outlined in black) downstream of the U-turn in Saryjaz (outlined in white with black edges) with transient knickpoints both downstream (label starts at S) and upstream (label starts at SU). χ–z plots of transient knickpoints (b) downstream of the U-turn and (c) upstream of the U-turn. The black shadow beneath the coloured stream indicates the flow direction of the trunk. Labels indicate the sub-catchment number, following the information in Table S1 in the Supplement.
χ analysis has been widely used for recognizing transient knickpoints (e.g. Mudd et al., 2018; Smith et al., 2022). After taking out all glacial and stable (lithological and structural) knickpoints, we used χ–z plots to identify transient reaches and slope-break transient knickpoints, which show a sustained increase in the channel steepness downstream (see Fig. 5). Subsequently, we measured the (1) elevation; (2) incision depth; (3) χ calculated from each tributary junction, which we refer to as χt; and (4) ksn of stream reaches downstream and upstream of the knickpoints, and we plotted these values against the upstream distance of the tributary junctions along the trunk stream.
4.2.2 Knickpoint migration
The horizontal knickpoint propagation rate for a detachment-limited bedrock channel is defined as follows (Whipple and Tucker, 1999; Berlin and Anderson, 2007; Goren et al., 2014; Gallen and Wegmann, 2017):
Equation (6) can be solved for dt and integrated to obtain the response time τ, corresponding to the time it has taken a perturbation (e.g. knickpoint) to travel from the river outlet (x = 0) to its current location (Whipple and Tucker, 1999; Goren et al., 2014):
Assuming n = 1,
Gallen and Wegmann (2017) highlighted that Eqs. (7) and (8) do not incorporate rock uplift, which means that the knickpoint propagation rate, as well as the response time, is independent of the rock-uplift rate. If K is uniform, then knickpoints from a common origin with the same χ values should also have the same response time τ. By calibrating K, τ can be calculated.
In the stream-power model, K reflects a combination of factors of erodibility, erosivity, and river geometry (Smith et al., 2022). An estimation of K based on the stream-power law can be found from Eq. (3) and equating U=E, as follows:
If one assumes n = 1, the ratio of the catchment-average denudation rate and the channel steepness yields the erodibility coefficient value for that catchment (e.g. Kirby and Whipple, 2012; Racano et al., 2023). A value of n = 1, indicating a linear relationship between erosion rates/channel incision rates and channel steepness, is generally expected in regions where erosion rates are relatively low, i.e. not exceeding ca. 0.2 mm yr−1 (e.g. Ouimet et al., 2009; DiBiase et al., 2010).
We utilized eight 10Be-derived catchment-average denudation rates from Kudriavtseva et al. (2023) to calibrate an average erodibility parameter for the South Tian Shan. Unfortunately, no data are available for the Saryjaz catchment itself, in particular for the downstream reach that is of most interest here, as that region is practically inaccessible. The catchments we chose for the calibration are located within the Naryn catchment, ∼ 200 km to the west of the Saryjaz catchment (Fig. 1b), and correspond to the closest erosion-rate constraints to the Saryjaz catchment currently published. These catchments underwent similar late Cenozoic tectonic and climatic histories and have similar lithologic compositions to the Saryjaz. We used the ArcGIS toolbox Basinga (Charreau et al., 2019) to calculate catchment-average denudation rates based on the concentrations of 10Be in detrital quartz. Basinga integrates variations in the Earth's magnetic field over time when considering average 10Be production rates, as well as shielding due to ice or snow cover. To account for shielding, it considers that all shielded portions of the catchment contribute a 10Be concentration of zero when calculating a catchment-average production rate. These corrections are likely important, considering that glaciers exist in the four basins to the south (i.e. cosmogenic catchments 1–4), and regional glaciations between 15 and 28 ka affected the entire South Tian Shan (Blomdin et al., 2016). To test the possible effects of previous glaciations and ice cover on catchment-average denudation rates, we compared erosion rates from three different models assuming (1) shielding of the full extent of glacial valleys plus topographic shielding, (2) shielding from only contemporary glaciers but without topographic shielding, and (3) no shielding from glaciers or topography. Following Charreau et al. (2023), snow shielding was neglected for all three scenarios due to the lack of data on depth and seasonal change in snow cover in the Tian Shan region. We calculated catchment-average ksn values that only consider the areas that we assumed to be unshielded by ice (i.e. for each scenario, the areas considered for calculating average ksn values change; Table S2).
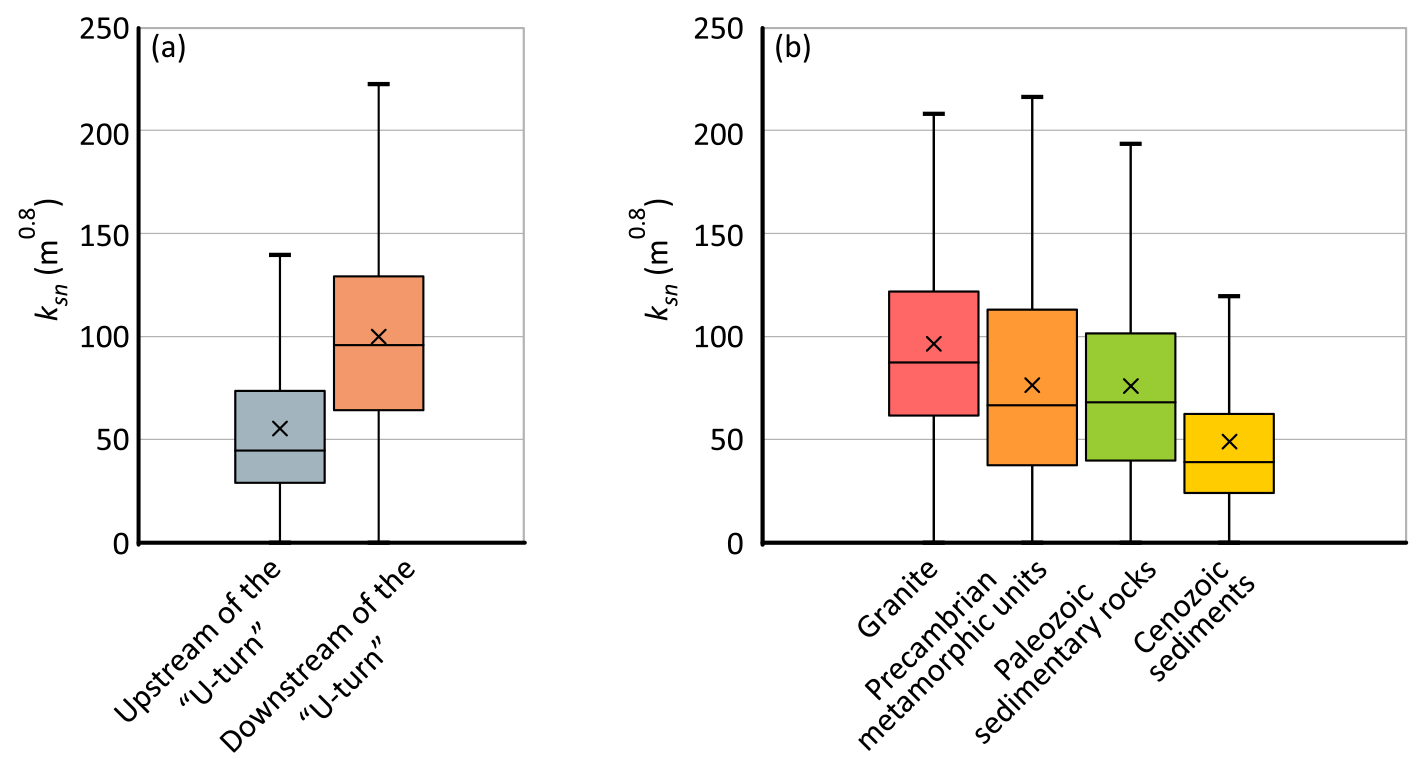
Figure 6Box plots of ksn split by areas (a) upstream and downstream of the U-turn and (b) four main lithologic units in the Saryjaz catchment. Crosses show mean values, horizontal lines are median values, boxes encompass the 25 %–75 % quartiles, and whiskers encompass 95 % of the spread in individual data points.
5.1 Topographic and fluvial metrics
The central South Tian Shan is characterized by high-elevation and high-relief topography separated by relatively flat intramontane basins. In the Saryjaz catchment, slopes of the high-relief areas (e.g. downstream of the U-turn) reach up to ∼ 76°, while they are less than 15° in the intramontane Ak Shyyrak and Saryjaz basins (Fig. 2b). Whereas the Saryjaz basin has uniform low slopes, slope gradients in the Ak Shyyrak basin increase eastward from almost flat at the divide with the Naryn River in the west to ∼ 30–45° near the junction of the Ak Shyyrak river with the main stem of the Saryjaz river in the east (Figs. 2b and S3).
The pattern of channel steepness (ksn) is consistent with the topographic patterns; steeper reaches are mostly located downstream of the U-turn, whereas the flattest reaches occur in the Ak Shyyrak and Saryjaz basins, particularly near their sources. Median ksn values are around 96 and 45 m0.8 for areas downstream and upstream of the U-turn, respectively (Fig. 6a). Similar to the distribution of slopes, streams in the Ak Shyyrak basin also show increasing ksn values, from < 40 m0.8 in the west to ∼ 120 m0.8 in the east, whereas values are consistently low throughout the Saryjaz basin (Fig. 3). A swath profile mapped along the main stem of the Saryjaz catchment shows significantly higher relief, reaching > 2.5 km, downstream of the U-turn, contrasting with relatively gentle-relief (generally < 1.5 km) regions upstream (cf. Fig. 7a).
According to the stream-power law (Eqs. 1–3), for a constant rock-uplift rate (U) and concavity index (θ), channel steepness should be higher in areas of more resistant bedrock characterized by lower erodibility (K) values (Gailleton et al., 2021; Fadul et al., 2022). Box plots of ksn values from the Saryjaz catchment confirm this prediction; the plutonic rock unit generates the steepest channels with a median ksn of 87 m0.8, whereas Precambrian metamorphic basement and Paleozoic sedimentary rocks (including clastics and carbonates) have similar average values of 67 and 68 m0.8, respectively. Cenozoic sediments show a distinctively lower average ksn value of 39 m0.8 (Fig. 6b). Compared with the major change in ksn values across the U-turn, however, ksn values from bedrock units (i.e. excluding the Cenozoic sediments) are rather concordant.
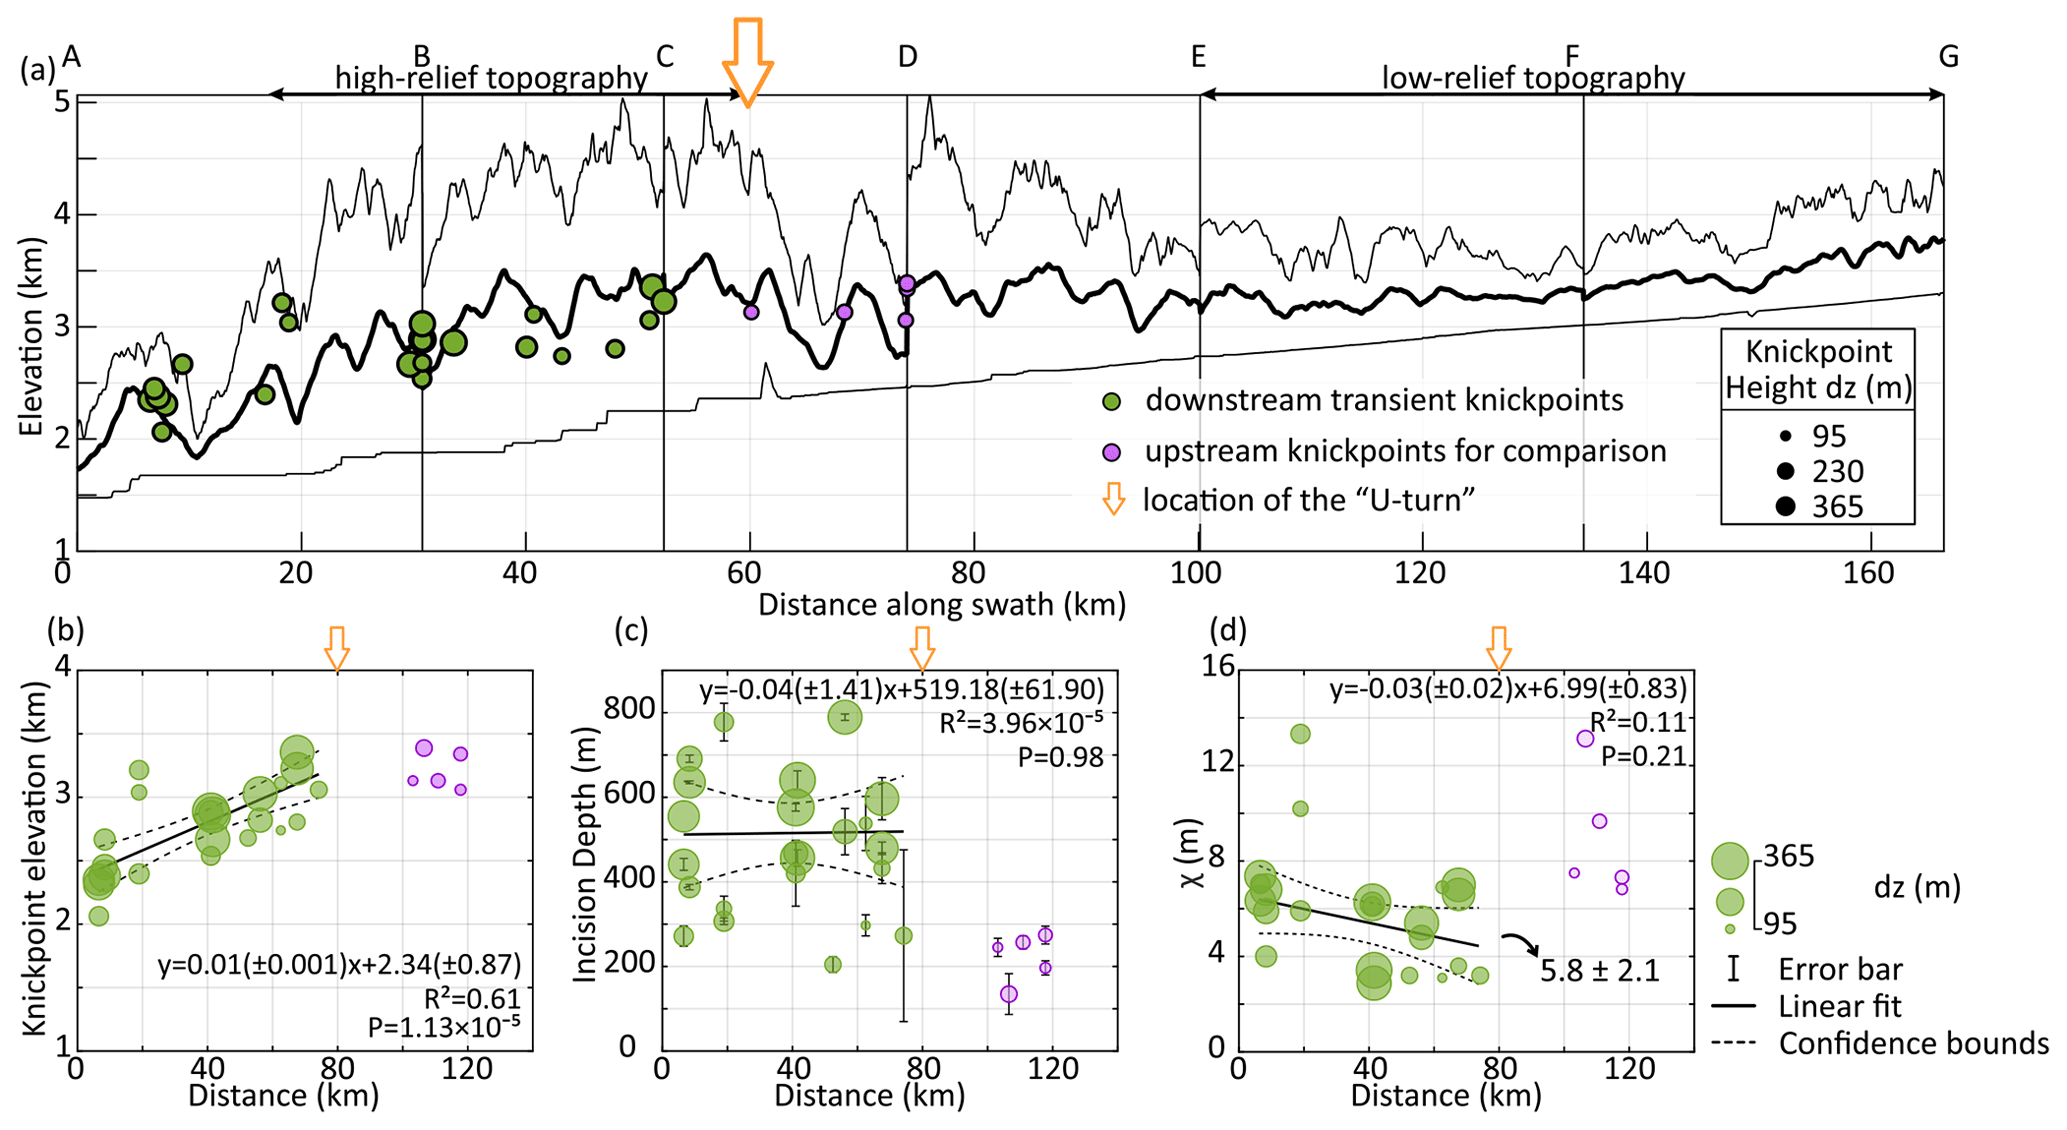
Figure 7(a) Swath profile (width = 15 km) following the main stem of the Saryjaz river (see Fig. 2b for location), showing the average (thick black line) and maximum and minimum (thin black lines) elevations, as well as transient slope-break knickpoints both downstream (green dots with black edge) and upstream (light purple dots with black edge) of the U-turn. The size of the dots scales with the knickpoint height (indicated in the legend). Plots of (b) elevation, (c) incision depth, and (d) χt against distance from the main stem outlet to the tributary junction for each sub-catchment. In panel (d), χt has a weighted mean value of 5.8 m and a standard deviation of 2.1 m. Linear regression model is weighted by knickpoint height (dz), and evaluated by R squared (shown as R2 in the plots) and p values (shown as P in the plots). The open orange arrow marks the location of the U-turn in the Saryjaz trunk river; downstream and upstream refer to relative locations of knickpoints with respect to the U-turn.
5.2 Knickpoint patterns
We automatically extracted 351 knickpoints from the Saryjaz catchment. By comparing with geological maps and satellite images, we identified 209 glacial knickpoints, 21 lithologic knickpoints, and 13 structural knickpoints (Fig. 3). The remaining 108 knickpoints do not show any clear relationship with glacial or geological mapping. We also assess knickpoint patterns from six catchments that drain the South Tian Shan front both west and east of the Saryjaz outlet (Fig. S8).
Using χ–z plots, we identified 24 major slope-break knickpoints and 84 vertical-step knickpoints within the Saryjaz catchment (Figs. 3, 5, and S4). All of the major transient slope-break knickpoints are located in tributaries downstream of the U-turn. Based on their locations, we delineated 10 sub-catchments along the trunk of the Saryjaz catchment and labelled them 1 to 10, starting from near the outlet (Fig. 5a). As shown in Table S1 and Fig. 7a and b, most of the major transient knickpoints are located at elevations between ∼ 2000 and ∼ 3500 m. Elevations of knickpoints generally increase with upstream distance up to 80 km from the outlet; this trend is statistically significant (Fig. 7b). Exceptions include two smaller knickpoints from sub-catchment 3 (i.e. 18.9 km from the outlet) that lie at elevations of more than 3000 m; these two knickpoints do not appear to follow the same trend as other knickpoints with similar distances from the outlet (Fig. 7b). Note that the upstream distance from the outlet is defined here as the distance from the main stream junction of the tributary in which the knickpoint occurs to the outlet of the Saryjaz catchment (Fig. 7b–d).
Incision depths of the tributaries below the knickpoints vary between ∼ 200 and ∼ 800 m, with an average of 480 ± 181 m, showing no statistically significant trend with distance from the outlet of the Saryjaz catchment (Table S1; Fig. 7c). To assess patterns of knickpoint retreat while correcting for different tributary catchment areas (and, later, estimate the timescales of knickpoint migration), we extracted χ distances of each knickpoint from the tributary junctions with the Saryjaz trunk stream, termed χt here. χt values calculated in this way lie between 3 and 8 m for most sub-catchments, with a weighted mean value of 5.8 m and standard deviation of 2.1 m (Table S1; Fig. 7d), although two knickpoints show χt values beyond the standard deviation (Fig. 7d); these are the same knickpoints that plot above the trend of increasing knickpoint elevations with distance from the outlet in Fig. 7b. ksn values downstream of the knickpoints range from 66 to 376 m0.8, with an average of 180 ± 81 m0.8, while upstream ksn values range from 13 to 150 m0.8, with an average of 88 ± 41 m0.8 (Table S1; Fig. S5a). These ksn values, both downstream and upstream of the knickpoints, slightly increase with increasing distance from the outlet of the Saryjaz catchment (Fig. S5b), while the ratios of upstream/downstream ksn values show a consistent value between 1 and 3, except for one knickpoint from sub-catchment 2, which shows a much higher ratio of around 10 (Table S1; Fig. S5c). Considering their similar χt values, ksn ratios, and range of incision depths, the knickpoints downstream of the U-turn likely have a common origin.
We also identified five transient knickpoints upstream of the U-turn and added them to the swath profile, elevation vs. distance, and incision depth vs. distance plots for comparison (Fig. 7). These upstream knickpoints consistently lie at higher elevations, between 3000 and 3500 m, without a clear upstream trend in elevation, while the incision depths of these knickpoints are relatively constant and much lower than those downstream of the U-turn, with an average of 222 ± 57 m (Fig. 7b and c).
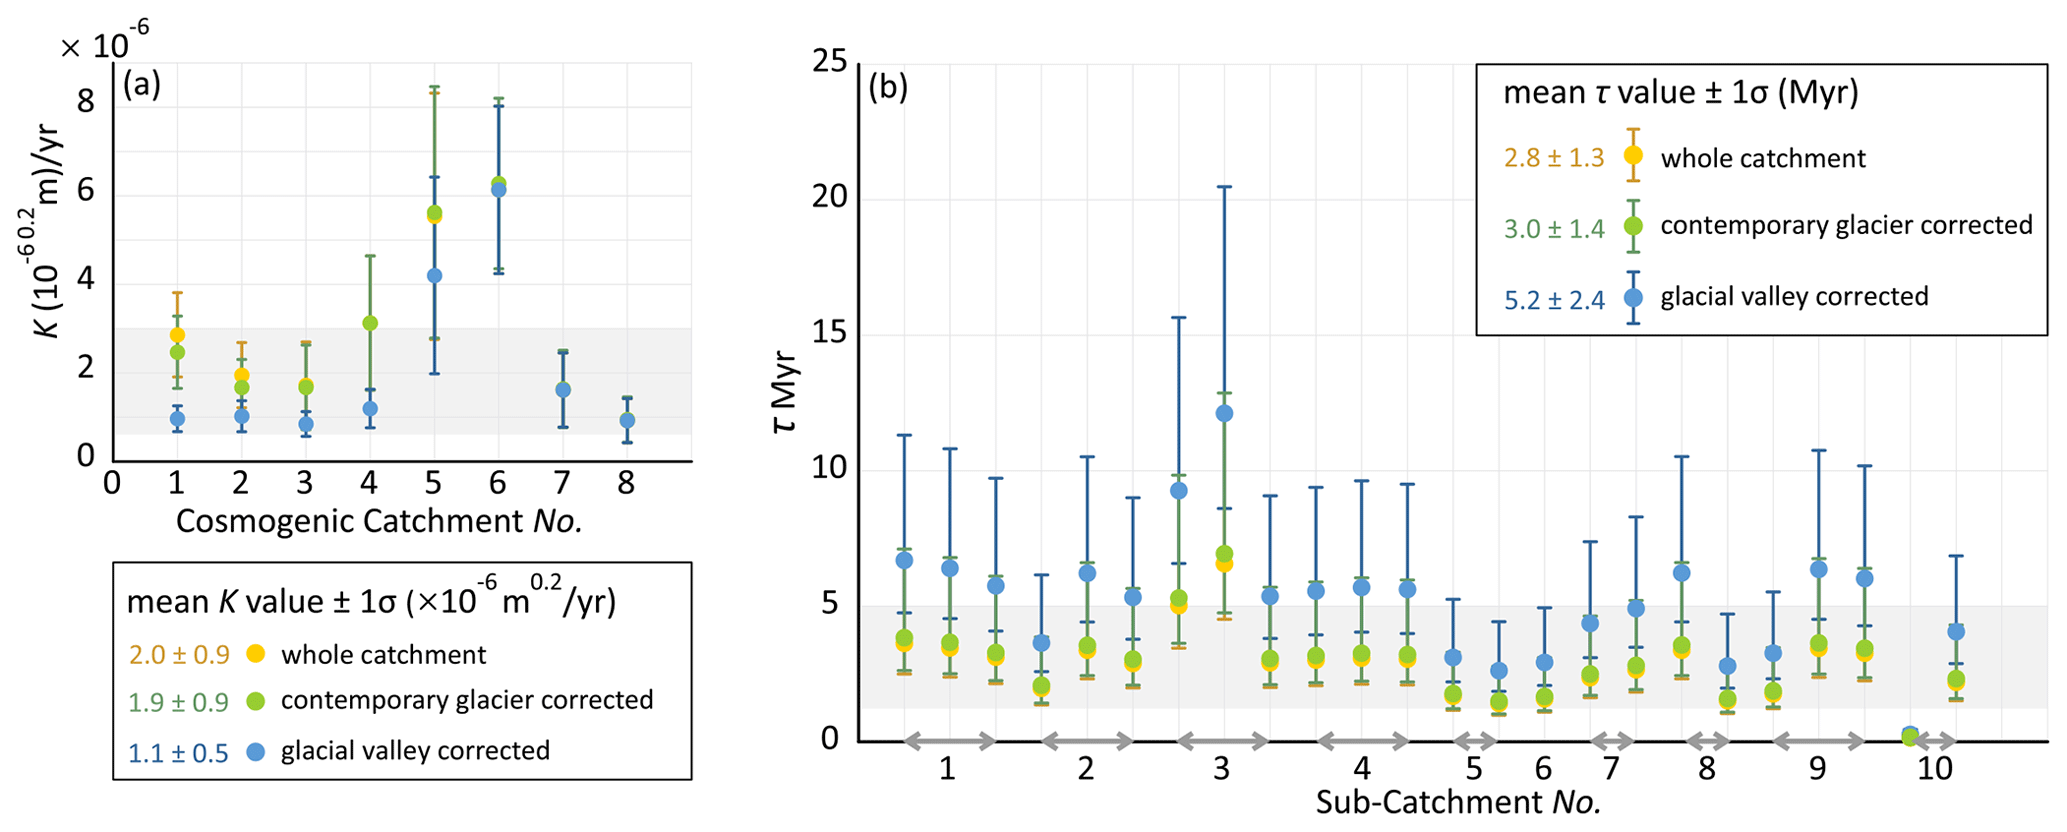
Figure 8(a) Plots of erodibility for the eight catchments analysed with 10Be on modern sands, and (b) inferred response times for the knickpoints mapped in the 10 tributary catchments downstream of the U-turn in the Saryjaz catchment. Both are plotted with 1σ errors. In both plots, estimates are given following the calculation of denudation rates for three scenarios: (1) the whole catchment is for areas without topographic or ice shielding, (2) contemporary glacier corrected is for shielding from only current glaciers, and (3) glacial valley corrected is for shielding of the full extent of glacial valleys plus topographic shielding. The original data set is provided in Table S3.
In contrast to the Saryjaz and its tributaries, streams draining the southern flank of the central South Tian Shan to the east and west of the Saryjaz catchment, and crossing either the Maidan or South Tian Shan fault, do not show any conspicuous knickpoints or knickzones, especially between 2000 and 3000 m elevation (Fig. S8).
5.3 Timescale of transient knickpoint migration
As shown in Table S2, the catchments for which 10Be analyses on river sands were performed (Kudriavtseva et al., 2023) show relatively low denudation rates between 0.038 and 0.32 mm yr−1, depending on which ice-cover model was chosen. Results for models 1 (no shielding correction) and 2 (corrected for contemporary glacier extent) are very similar, whereas model 3 (corrected for maximum glacier extent) leads to lower inferred denudation rates for these catchments. Integration timescales associated with these calculated denudation rates range from 1.9 to 15.8 kyr. Importantly, only the most slowly eroding catchments have integration times that extend back to the most recent glacial advance at ca. 16 ka (Lifton et al., 2014). For that reason, including a shielding calculation for the full glaciated extent of valleys is probably not reasonable, as the calculation assumes complete shielding for the entire integration time. We include those calculations as an extreme end-member case, but we consider the denudation rates derived from the other two scenarios (no shielding or shielding by contemporary glacier extents only) to be more realistic.
To calibrate the erodibility parameter K, we use Eq. (9), assuming n = 1. Our derived estimates of K for the three different methods of estimating the denudation rate show a consistent mean value from 1.1 to 2.0 × 10⁻⁶ m0.2 yr−1, except for cosmogenic catchments 5 and 6, which yield much higher K estimates of around 6 × 10⁻⁶ m0.2 yr−1 (Table S2; Fig. 8a). These outliers can be explained by the different lithologies of the catchments: cosmogenic catchments 5 and 6 equally expose Cenozoic sediments and Paleozoic sedimentary rock, whereas the other six catchments (i.e. cosmogenic catchments 1, 2, 3, 4, 7, and 8) comprise predominantly Proterozoic and Paleozoic bedrock. Considering that the Saryjaz catchment, in particular the 10 sub-catchments used for knickpoint retreat analysis, is characterized by relatively consistent exposure of Paleozoic intrusive and sedimentary rocks, we adopt the K values derived from cosmogenic catchments 1, 2, 3, 4, 7, and 8, i.e. 1.1 ± 0.5 to 2.0 ± 0.9 × 10⁻⁶ m0.2 yr−1, depending on the method of estimating denudation rates (Table S2). To determine the time since the onset of knickpoint migration, we use χt as the retreat distances (Table S1; Fig. 7d). Following Eq. (8), we obtain a range of response times, averaging 2.8 ± 1.3 Myr for the “no correction” denudation rates, 3.0 ± 1.4 Myr for the “current-glacier-corrected” denudation rates, and 5.2 ± 2.4 Myr for “glacial-valley-corrected” denudation rates (Table S3; Fig. 8b).
6.1 Origin of the transient knickpoints
Although locally we identify lithologic and structural knickpoints, their number and distribution are rather limited (Fig. 3), and they are generally not associated with substantial changes in channel steepness. Along the main stem of the Saryjaz catchment, tributary catchments downstream of the major U-turn show distinctly high ksn values exceeding 200 m0.8, associated with steep topographic slopes of up to ∼ 76° (Figs. 2b, 3, and S3) and major knickpoints that appear to be transiently migrating upstream. Those major knickpoints show increasing elevation with distance from the outlet and relatively constant χt values (Table S1; Fig. 7). When compared to our model predictions (Fig. 4), both of these trends point toward incision being driven by drainage capture rather than by accelerated uplift. The incision depths of the tributaries, in contrast, do not show any clear trend with distance from the outlet, contrasting with the models that would predict either an increase (in the case of capture) or a decrease (in the case of accelerated uplift) in the incision depth of tributaries upstream. However, the predicted increase in incision depth with distance upstream in a drainage–capture scenario could be subtle, especially shortly after the event (Fig. 4e), and could be masked by local contingencies such as slight variations in erosional resistance or basin hydrology. Additionally, incision depth is also potentially more sensitive to noise than the other two metrics because it involves extrapolation (sometimes over quite large distances) of the slope near the knickpoint.
In contrast, tributaries upstream of the U-turn, especially within the intermontane basins, show lower slopes (mostly < 30°) and generally lack slope-break knickpoints. The five transient knickpoints that we identified upstream of the U-turn (Figs. 3 and 5) are all located within 40 km of the U-turn, and they occur at elevations of around 3000 m (Fig. 7b). They show the characteristics of slope-break knickpoints in χ–z plots (Fig. 5c) with incision depths of less than 300 m (Fig. 7c). We suggest that these knickpoints could be due to the same capture event that produced the knickpoints downstream; enhanced incision at and downstream of the capture point would have triggered increased incision upstream of the capture point as the whole river profile starts to approach a new equilibrium form (e.g. Yanites et al., 2013; Penserini et al., 2024).
Importantly, rivers draining the South Tian Shan to the Tarim Basin both east and west of the Saryjaz catchment lack evidence for transient knickpoints between 2000 and 3000 m elevation (Fig. S8), which would be expected if the transient incision along the Saryjaz river were driven by accelerated uplift along the south flank of the South Tian Shan, accommodated by the South Tian Shan and/or Maidan faults. Moreover, thermochronology data from the vicinity of the lower Saryjaz river (i.e. from the Muzart valley; see Fig. 1b for location) suggest a decrease in bedrock exhumation rates in the last ca. 5 Myr (Lyu et al., 2024), which has been explained as indicating the deformation propagating into the foreland thrust system (Fig. 1b) and implies a recent decrease rather than increase in activity and consequently uplift rates along the South Tian Shan fault.
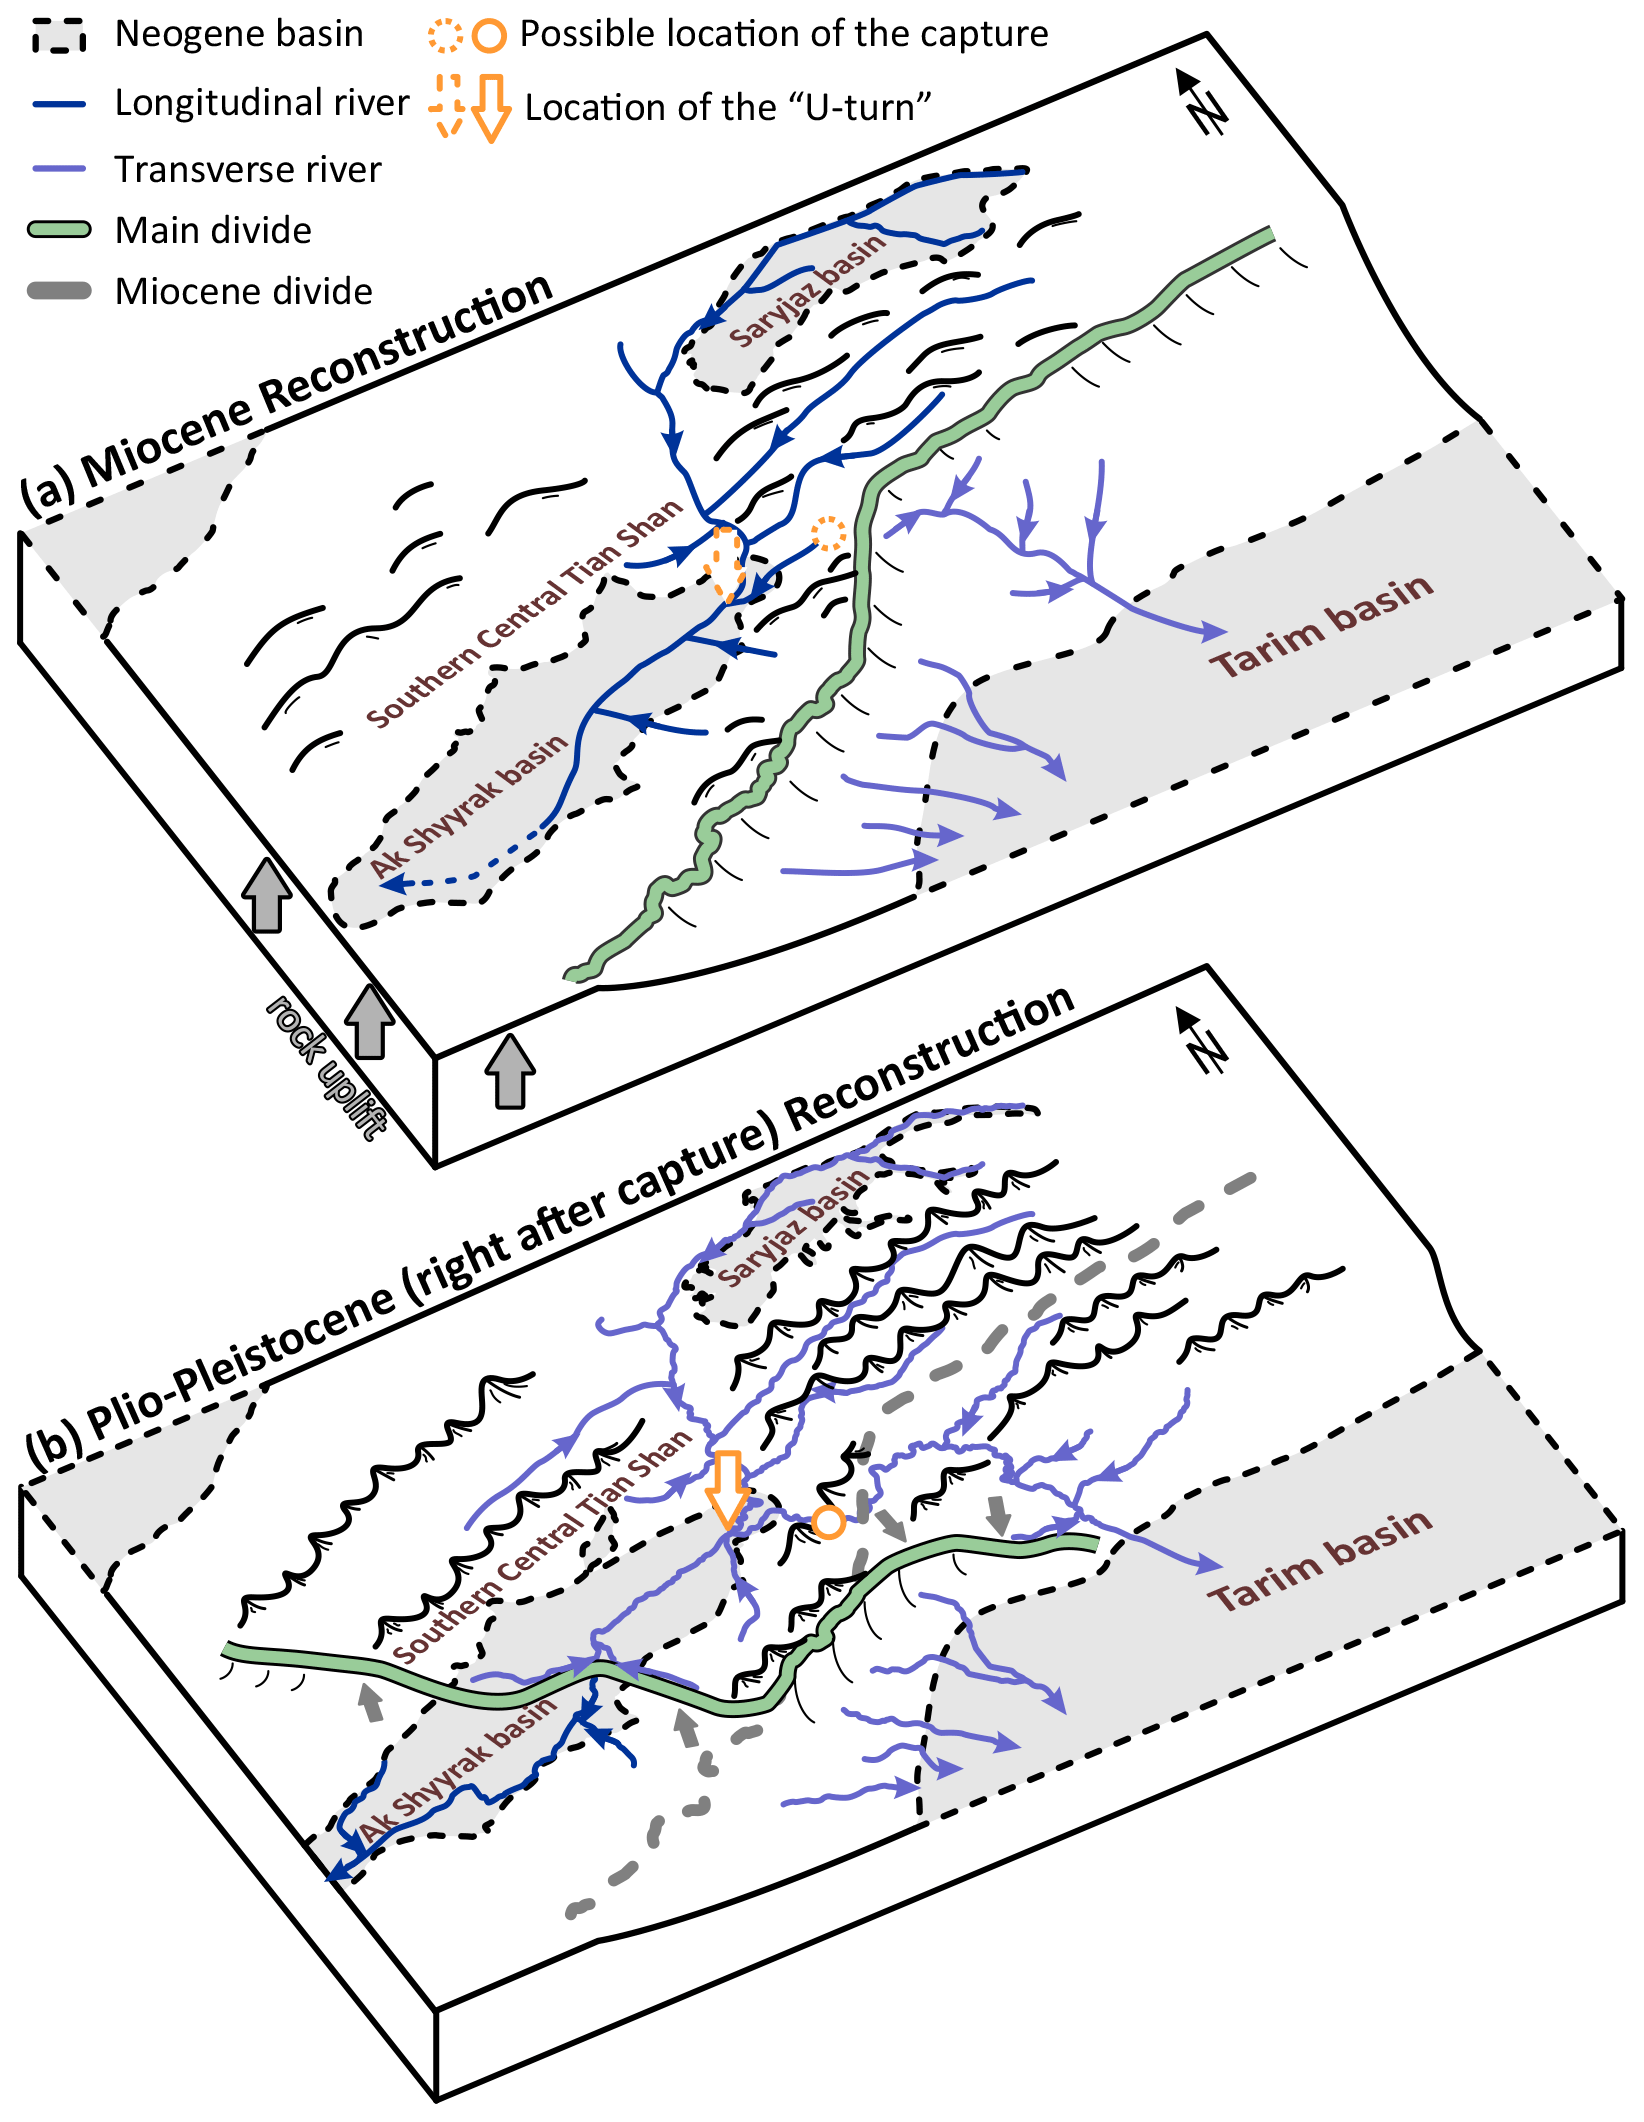
Figure 9Topography and drainage reconstruction of the Saryjaz catchment in (a) Miocene time, before capture, and (b) Plio-Pleistocene time, right after capture. Grey arrows with a black edge in panel (a) indicate that rock uplift in the Miocene generated relief and a topographic barrier, as described in Sect. 6.3. Note the migration of the main drainage divide from its Miocene location (dashed grey line in panel b) to the thick green line with a black edge in panel (b). The direction of migration is indicated by the grey arrows. White arrows with an orange edge show the location of U-turn, and the white dots with orange edges indicate the possible capture point.
Together, our observations are more consistent with transient knickpoint migration within the Saryjaz catchment being triggered top-down by relatively recent drainage capture rather than bottom-up by accelerated uplift. We infer that the capture position may have been near the U-turn or slightly downstream it. Thus, the Ak Shyyrak river would correspond to a palaeo-downstream reach of the upper Saryjaz, which was captured by the lower Saryjaz river (Fig. 9).
6.2 Drainage evolution in the Saryjaz catchment
Our study provides empirical evidence for a large-magnitude capture event in which a transverse stream replaced the longitudinal lower reaches of the Saryjaz catchment near the U-turn. We suggest that in the Miocene, a west-flowing river connected two intermontane basins, Saryjaz and Ak Shyyrak. The southern flank of the central South Tian Shan would have represented a drainage divide between this longitudinal west-flowing or internal drainage and short transverse systems draining into the Tarim Basin (Fig. 9a). The simplest triggering mechanism for this capture event would have been overtopping of the divide due to river aggradation in the Ak Shyyrak basin during the Plio-Pleistocene period. Support for this mechanism is provided by the occurrence of sedimentary remnants, inferred from satellite imagery and shown in the Quaternary geological map as “mid-Pleistocene deposits”, east of and high above the Saryjaz river in the vicinity of the U-turn (Fig. S6; Mikolaichuk et al., 2008). Following capture, the entire upper part of the Saryjaz basin would have been diverted southward to flow into the Tarim Basin instead of westward into the Ak Shyyrak basin (Fig. 9b). The capture thus added a substantial additional area draining to the reaches of the Saryjaz catchment downstream of the U-turn, which would have drastically increased the water discharge and increased channel incision in those downstream reaches, creating transient knickpoints that migrated from the trunk stream up into each tributary.
The capture of the upper Saryjaz and reversal of the Ak Shyyrak river would have transformed the original NE–SW-trending drainage divide on the southern flank of the central South Tian Shan into the current NW–SE-trending divide between the Saryjaz and Naryn catchments (Fig. 9). Today, the divide between the Saryjaz and Naryn catchments is located near Paterbashik lake and is characterized by low slopes and low channel steepness values on both sides (Fig. S7a). However, slightly lower χ values to the east of the divide (Fig. S7b) suggest that the divide has migrated westward along the Ak Shyyrak valley by the repeated capture of upper Naryn tributaries (Bishop, 1995; Shelef and Goren, 2021) and that this process is still ongoing. The elevation of the current divide between the Ak Shyyrak and the Naryn rivers at Paterbashik lake is around 3500 m, a few hundred metres higher than the highest sedimentary remnants along the Saryjaz river near the U-turn at around 3200 m (Figs. S6 and S7). The divide lies within Neogene sediments, providing a minimum elevation reached by the fill of the Ak Shyyrak basin prior to capture and supporting a scenario in which capture was driven by overtopping of the Ak Shyyrak basin. However, vertical incision from transient knickpoints measured in this study mostly range between 200 and 800 m, with an average of 480 ± 181 m (Table S1; Fig. 7). The incision is smaller than the elevation difference of approximately 900 m between the relict sediments at around 3200 m and the valley bottom near the U-turn at about 2300 m. The river profiles will take several million years to re-equilibrate after a major capture event such as we infer (Fig. 4). However, the transient nature of the catchments downstream of the U-turn implies that incision is still ongoing, this large difference suggests that the Miocene upper Saryjaz catchment may have been a closed basin and/or that the upper Naryn River basin experienced substantial sedimentary infill since the time of capture to raise its elevation. Without direct age data on the basin fill for further study, we cannot dismiss the latter possibility. However, it is possible that the pre-capture upper Saryjaz was an internally drained basin without a connection to the Naryn. In any case, the simple overtopping of a divide somewhere downstream of the U-turn would have resulted in capture of this drainage and subsequent incision.
6.3 Possible drivers of capture
Transient knickpoint migration times calculated here indicate that the timing of the capture event likely falls between 2.8 ± 1.3 and 5.2 ± 2.4 Ma, depending on the inferred value of K (Fig. 8b). As discussed in Sect. 5.3, the latter estimate represents an extreme end-member case, and we infer the most probable timing of the capture to be Plio-Pleistocene (roughly between 1.5 and 4.4 Ma). Although we argue that the immediate trigger for the capture was the overtopping of a pre-existing divide by the sedimentary fill of the Ak Shyyrak basin, there may be underlying tectonic or climatic drivers for this sedimentary filling. Previous studies in the regions surrounding the Ak Shyyrak basin and the Saryjaz catchment indicate changes in both the topography and erosion rates since the Late Miocene, which may relate to the capture. We summarize events that may be relevant in this context below.
Several lines of evidence point to southward growth of the central South Tian Shan in the Late Miocene to Early Pliocene. Carbonate Δ18O values in dune and interdune deposits from the western Kepingtage range (Fig. 1b) show a negative excursion between 12 and 7 Ma, indicating desertification that was likely caused by the formation of a high-elevation barrier in the Pamir Mountains and Tian Shan, blocking westerly moisture sources (Richter et al., 2022). Moreover, increasing erosion and sedimentation rates, as recorded by both low-temperature thermochronology and magnetostratigraphic data (Sobel et al., 2006a; Chang et al., 2019; Jia et al., 2020, 2021), and changes in sediment provenance (Rittner et al., 2016; Richter et al., 2022) indicate the growth of the Kepingtage and Kuqa ranges from the Late Miocene to the Pliocene. Apatite (U–Th)/He cooling ages of 10 to 5 Ma from the high-elevation Pobedi massif, south of the Pobedi fault (Rolland et al., 2020; Figs. 1b and 2a), as well as from glacial valley bottoms, for example, in the Muzart valley to the east and the Barskoon valley to the northwest of the Saryjaz catchment (Macaulay et al., 2014; Chang et al., 2021; Lyu et al., 2024; Fig. 1b) also suggest relatively rapid exhumation at that time. Erosion-rate estimates derived from in situ 10Be in dated sedimentary records from the southeast and northeast Tian Shan (Puchol et al., 2017) show an increase in erosion rates between ∼ 9 and ∼ 4 Ma. These data also show an increase in the variability in erosion rates between 3 and 1 Ma (Puchol et al., 2017), which may correspond to a transient readjustment of the landscape in response to the onset of the Quaternary glacial cycles that started at around 3–2.5 Ma in the Tian Shan region (Prud'homme et al., 2021).
Consequently, we consider the following possible landscape evolution scenario. During the Late Miocene, the main structures in the southern flank of the central South Tian Shan (e.g. Maidan Fault and South Tian Shan Fault) were reactivated as frontal thrusts. The uplift of the frontal range generated sufficient relief to create a topographic barrier similar to the current Kepingtage and Kuqa ranges to the south of the Tian Shan and isolated the hinterland as intermontane wedge-top basins (e.g. the Ak Shyyrak basin), which started to fill with sediments, increasing the base level for the upstream of Saryjaz catchment (e.g. Sobel et al., 2003; Streit et al., 2017). Enhanced erosion in the high-elevation regions during the onset of Quaternary glacial cycles may have contributed to a pulse in sediment production. A combination of decreased sediment transport out of the basins and increased sediment delivery rates from surrounding peaks would have accelerated basin filling, creating conditions favourable for basin overfilling and resulting in drainage capture and reorganization (Streit et al., 2017). In summary, we infer that both tectonic and climatic drivers may have contributed to the drainage reorganization of the Saryjaz catchment, sometime between ∼ 1.5 and 4.4 Ma, by influencing the filling of the intramontane Ak Shyyrak basin. This scenario implies that the Saryjaz river was initially defeated by rock uplift of the South Tian Shan in the Miocene, preventing it from reaching its present outlet toward the south. The river only reconnected to the Tarim Basin later, after the capture event. Thus, a delay could have existed between orogen building and drainage reorganization, as observed in different geological settings (e.g. Babault et al., 2018; Rohrmann et al., 2023).
6.4 Implications for models of drainage development in mountain belts
Our observations and the inferred model of drainage development in the central South Tian Shan share similarities with some of the recently suggested general models for drainage development in mountain belts but are not fully compatible with any of them. The main observations that the models should explain are (1) drainage patterns in the South Tian Shan are longitudinal in the west, where both total shortening and shortening rates are higher, and transverse in the east, where total shortening and shortening rates are lower; and (2) the Saryjaz catchment shows evidence of transformation from a longitudinal to a transverse drainage pattern. Such a transformation is similar to what has been reported from the Atlas Mountains, the Pyrenees, and the eastern Cordillera of Colombia (e.g. Babault et al., 2012, 2013; Struth et al., 2015). However, in the case of the central South Tian Shan, this transformation cannot be taken as an indication of a general development from longitudinal to transverse drainage as the mountain belt matures because both the shortening rates and total shortening, as well as modern denudation rates, are higher in the west, which is characterized by longitudinal drainage, than in the east, which is characterized by transverse drainage (Charreau et al., 2017, 2023; Grin et al., 2018; Kudriavtseva et al., 2023).
The situation in the central South Tian Shan is more akin to that in the central Andean broken foreland of NW Argentina, where Seagren et al. (2022) argued for an opposite chronology, with drainage developing from initial transverse to longitudinal patterns. Such a chronology appears consistent with the spatial pattern of the transverse drainage in the east, where the total shortening is lower, and longitudinal drainage in the west, where higher amounts of shortening are recorded. However, the temporal drainage evolution we describe here implies the transformation from longitudinal to transverse drainage that is inconsistent with the spatial patterns if we interpret these in a space-for-time substitution approach.
Wolf et al. (2022) suggested that longitudinal versus transverse drainage patterns indicate the state of an orogen that is dominated by tectonics in the first case and by erosion in the latter. The observed drainage patterns of the South Tian Shan appear consistent with such a model. We note, however, that, even in the east, surface uplift currently outpaces erosion (Charreau et al., 2017, 2023), suggesting that the orogen has not yet reached a steady state. However, one could argue that parts of orogens that are at the threshold between the two tectonic states (potentially including the Saryjaz catchment) could be particularly vulnerable to switches from one drainage pattern to the other through only minor variations in boundary conditions.
The drainage evolution recorded by the Saryjaz catchment thus appears to be controlled by the transient defeat and re-establishment of through-going drainage due to the interaction of tectonics and climate (e.g. Sobel et al., 2003; Heidarzadeh et al., 2017; Streit et al., 2017) rather than by conforming to a generally applicable model of drainage development in mountain belts. This conclusion underlines the importance of local contingent factors in driving drainage development relative to more systemic drivers.
In this paper, we have studied the fluvial drainage pattern in the Saryjaz catchment located in the South Tian Shan. Our results show the following.
-
A transient landscape exists in the Saryjaz catchment, especially downstream of the U-turn along the trunk stream, characterized by steepened reaches, by transient knickpoints that increase in elevation upstream, and by consistent χt values (measured from their confluence with the trunk stream), while the amount of incision below the tributary knickpoints does not show a statistically significant spatial trend.
-
By considering the impacts of drainage capture versus tectonically driven accelerated uplift on river topographic metrics from 1-D river-profile modelling, we infer that the transient landscape in the Saryjaz catchment was triggered by a large-magnitude drainage–capture event which replaced an extensive longitudinal drainage system with a transverse draining system.
-
By estimating bedrock erodibility based on basin-average denudation rates and channel steepness combined with a knickpoint celerity model, we suggest that knickpoint retreat in the tributaries downstream of the U-turn likely started sometime between 1.5 and 4.4 Ma, thereby dating the capture event.
-
The capture event may have been triggered by sediments overtopping the outlet of the Ak Shyyrak basin, resulting in the spillover of the upper Saryjaz into the lower Saryjaz river and the reversal of the Ak Shyyrak river.
-
From the Late Miocene to the Plio-Pleistocene, the South Tian Shan went through distinct tectonic and climatic changes, both of which may have helped to drive drainage reorganization. Considering our reconstructed landscape evolution scenario, we infer that drainage reorganization can be triggered by local contingent factors that drive transient defeat and the re-establishment of through-going drainage and does not necessarily conform to a generally applicable model of drainage development in mountain belts.
The Copernicus GLO-30 digital elevation model (COP30) data are found in a publicly available data set at https://doi.org/10.5270/ESA-c5d3d65 (European Space Agency, 2015). TopoToolbox 2 is available on GitHub at https://github.com/wschwanghart/topotoolbox.git (Schwanghart and Scherler, 2014). The Topographic Analyis Kit (TAK) is also available on GitHub at https://github.com/amforte/Topographic-Analysis-Kit.git (Forte and Whipple, 2019). A Python script for the 1-D river-profile evolution model is available through the Zenodo repository at https://doi.org/10.5281/zenodo.11505509 (McNab and Gong, 2024).
The supplement related to this article is available online at: https://doi.org/10.5194/esurf-12-973-2024-supplement.
LG: conceptualization, software, visualization, and writing (original draft preparation and review and editing). PvdB: conceptualization, methodology, and writing (review and editing). TS: conceptualization, methodology, and writing (review and editing). ES: conceptualization and writing (review and editing). SR: software and writing (review and editing). AM: software and writing (review and editing). FM: software and writing (review and editing).
The contact author has declared that none of the authors has any competing interests.
Publisher's note: Copernicus Publications remains neutral with regard to jurisdictional claims made in the text, published maps, institutional affiliations, or any other geographical representation in this paper. While Copernicus Publications makes every effort to include appropriate place names, the final responsibility lies with the authors.
This study forms part of Lingxiao Gong's doctoral thesis at the University of Potsdam and has been supported by a Chinese Scholarship Council (CSC) grant. We thank Wolfgang Schwanghart, Gerold Zeilingerand Stefanie Tofelde for discussions and comments on an early draft, and Leo Günther for suggestions on the river evolution script. We extend our gratitude to one anonymous reviewer and Julien Babault for their insightful feedback, which helped to significantly improve our paper. We also thank editors Tom Coulthard and Simon Mudd for handling this paper.
This research has been supported by the European Research Council (Consolidator grant no. 863490 – GyroSCoPe to Taylor F. Schildgen) and the China Scholarship Council (scholarship no. 202006400013 to Lingxiao Gong).
This paper was edited by Simon Mudd and reviewed by Julien Babault and one anonymous referee.
Abdrakhmatov, K. Y., Aldazhanov, S. A., Hager, B. H., Hamburger, M. W., Herring, T. A., Kalabaev, K. B., Makarov, V. I., Molnar, P., Panasyuk, S. V., Prilepin, M. T., Reilinger, R. E., Sadybakasov, I. S., Souter, B. J., Trapeznikov, Y. A., Tsurkov, V. Y., and Zubovich, A. V.: Relatively recent construction of the Tien Shan inferred from GPS measurements of present-day crustal deformation rates, Nature, 384, 450–453, https://doi.org/10.1038/384450a0, 1996.
Abdrakhmatov, K. E., Weldon, R., Thompson, S., Burbank, D., Ch, R., Miller, M., and Molnar, P.: Origin, direction, and rate of modern compression of the central Tien Shan (Kyrgyzstan), Russ. Geol. Geophys., 42, 1585–1609, 2001.
Babault, J., Van Den Driessche, J., and Teixell, A.: Longitudinal to transverse drainage network evolution in the High Atlas (Morocco): The role of tectonics, Tectonics, 31, 1–15, https://doi.org/10.1029/2011TC003015, 2012.
Babault, J., Teixell, A., Struth, L., Van Den Driessche, J., Arboleya, M. L., and Tesón, E.: Shortening, structural relief and drainage evolution in inverted rifts: Insights from the Atlas Mountains, the eastern Cordillera of Colombia and the Pyrenees, Geol. Soc. Spec. Publ., 377, 141–158, https://doi.org/10.1144/SP377.14, 2013.
Babault, J., Viaplana-Muzas, M., Legrand, X., Van Den Driessche, J., González-Quijano, M., and Mudd, S. M.: Source-to-sink constraints on tectonic and sedimentary evolution of the western Central Range and Cenderawasih Bay (Indonesia), J. Asian Earth Sci., 156, 265–287, https://doi.org/10.1016/j.jseaes.2018.02.004, 2018.
Bazhenov, M. L. and Mikolaichuk, A. V.: Structural evolution of Central Asia to the north of Tibet: A synthesis of paleomagnetic and geological data, Geotectonics, 38, 379–393, 2004.
Bazhenov, M. L., Collins, A. Q., Degtyarev, K. E., Levashova, N. M., Mikolaichuk, A. V., Pavlov, V. E., and Van der Voo, R.: Paleozoic northward drift of the North Tien Shan (Central Asia) as revealed by Ordovician and Carboniferous paleomagnetism, Tectonophysics, 366, 113–141, https://doi.org/10.1016/S0040-1951(03)00075-1, 2003.
Berlin, M. M. and Anderson, R. S.: Modeling of knickpoint retreat on the Roan Plateau, western Colorado, J. Geophys. Res.-Earth, 112, F03S06, https://doi.org/10.1029/2006JF000553, 2007.
Bishop, P.: Drainage rearrangement by river capture, beheading and diversion, Prog. Phys. Geog. Earth Environ., 19, 449–473, https://doi.org/10.1177/030913339501900402, 1995.
Biske, Y. S.: Late Paleozoic collision of the Tarimskiy and Kirghiz–Kazakh paleocontinents (English translation), Geotectonics, 29, 26–34, 1995.
Blomdin, R., Stroeven, A. P., Harbor, J. M., Lifton, N. A., Heyman, J., Gribenski, N., Petrakov, D. A., Caffee, M. W., Ivanov, M. N., Hättestrand, C., Rogozhina, I., and Usubaliev, R.: Evaluating the timing of former glacier expansions in the Tian Shan: A key step towards robust spatial correlations, Quaternary Sci. Rev., 153, 78–96, https://doi.org/10.1016/j.quascirev.2016.07.029, 2016.
Boschman, L. M., Carraro, L., Cassemiro, F. A. S., de Vries, J., Altermatt, F., Hagen, O., Hoorn, C., and Pellissier, L.: Freshwater fish diversity in the western Amazon basin shaped by Andean uplift since the Late Cretaceous, Nat. Ecol. Evol., 7, 2037–2044, https://doi.org/10.1038/s41559-023-02220-8, 2023.
Burbank, D. W., Mclean, J. K., Bullen, M., Abdrakhmatov, K. Y., and Miller, M. M.: Partitioning of intermontane basins by thrust-related folding, Tien Shan, Kyrgyzstan, Basin Res., 11, 75–92, https://doi.org/10.1046/j.1365-2117.1999.00086.x, 1999.
Burtman, V. S.: Structural geology of the Tien Shan, USSR, Journ. Sci., 275-A, 157–186, 1975.
Burtman, V. S.: Tien Shan, Pamir, and Tibet: History and geodynamics of Phanerozoic oceanic basins, Geotectonics, 44, 388–404, https://doi.org/10.1134/S001685211005002X, 2010.
Chang, J., Li, D., Min, K., Qiu, N., Xiao, Y., Wu, H., and Liu, N.: Cenozoic deformation of the Kalpin fold-and-thrust belt, southern Chinese Tian Shan: New insights from low-T thermochronology and sandbox modeling, Tectonophysics, 766, 416–432, https://doi.org/10.1016/j.tecto.2019.06.018, 2019.
Chang, J., Glorie, S., Qiu, N., Min, K., Xiao, Y., and Xu, W.: Late Miocene (10.0 ∼ 6.0 Ma) Rapid Exhumation of the Chinese South Tianshan: Implications for the Timing of Aridification in the Tarim Basin, Geophys. Res. Lett., 48, e2020GL090623, https://doi.org/10.1029/2020GL090623, 2021.
Charreau, J., Blard, P.-H., Puchol, N., Avouac, J.-P., Lallier-Vergès, E., Bourlès, D., Braucher, R., Gallaud, A., Finkel, R., Jolivet, M., Chen, Y., and Roy, P.: Paleo-erosion rates in Central Asia since 9 Ma: A transient increase at the onset of Quaternary glaciations?, Earth Planet. Sc. Lett., 304, 85–92, https://doi.org/10.1016/j.epsl.2011.01.018, 2011.
Charreau, J., Saint-Carlier, D., Dominguez, S., Lavé, J., Blard, P. H., Avouac, J. P., Jolivet, M., Chen, Y., Wang, S. L., Brown, N. D., Malatesta, L. C., and Rhodes, E.: Denudation outpaced by crustal thickening in the eastern Tianshan, Earth Planet. Sc. Lett., 479, 179–191, https://doi.org/10.1016/j.epsl.2017.09.025, 2017.
Charreau, J., Blard, P., Zumaque, J., Martin, L. C. P., Delobel, T., and Szafran, L.: Basinga: A cell-by-cell GIS toolbox for computing basin average scaling factors, cosmogenic production rates and denudation rates, Earth Surf. Proc. Land., 44, 2349–2365, https://doi.org/10.1002/esp.4649, 2019.
Charreau, J., Blard, P.-H., Lavé, J., Dominguez, S., and Li, W. S.: Unsteady topography in the eastern Tianshan due to imbalance between denudation and crustal thickening, Tectonophysics, 848, 229702, https://doi.org/10.1016/j.tecto.2022.229702, 2023.
Chen, Y., Li, W., Deng, H., Fang, G., and Li, Z.: Changes in Central Asia's Water Tower: Past, Present and Future, Sci. Rep., 6, 35458, https://doi.org/10.1038/srep35458, 2016.
Clementucci, R., Ballato, P., Siame, L., Fox, M., Lanari, R., Sembroni, A., Faccenna, C., Yaaqoub, A., and Essaifi, A.: Surface Uplift and Topographic Rejuvenation of a Tectonically Inactive Range: Insights From the Anti-Atlas and the Siroua Massif (Morocco), Tectonics, 42, e2022TC007383, https://doi.org/10.1029/2022TC007383, 2023.
Craw, D., Upton, P., Burridge, C. P., Wallis, G. P., and Waters, J. M.: Rapid biological speciation driven by tectonic evolution in New Zealand, Nat. Geosci., 9, 140–144, https://doi.org/10.1038/ngeo2618, 2016.
Crosby, B. T. and Whipple, K. X.: Knickpoint initiation and distribution within fluvial networks: 236 waterfalls in the Waipaoa River, North Island, New Zealand, Geomorphology, 82, 16–38, https://doi.org/10.1016/j.geomorph.2005.08.023, 2006.
Cunningham, D., Owen, L., Snee, L., and Jiliang, L.: Structural framework of a major intracontinental orogenic termination zone: the easternmost Tien Shan, China, J. Geol. Soc., 160, 575–590, https://doi.org/10.1144/0016-764902-122, 2003.
DiBiase, R. A., Whipple, K. X., Heimsath, A. M., and Ouimet, W. B.: Landscape form and millennial erosion rates in the San Gabriel Mountains, CA, Earth Planet. Sc. Lett., 289, 134–144, https://doi.org/10.1016/j.epsl.2009.10.036, 2010.
Dumitru, T. A., Zhou, D., Chang, E. Z., Graham, S. A., Hendrix, M. S., Sobel, E. R., and Carroll, A. R.: Uplift, exhumation, and deformation in the Chinese Tian Shan, in: Paleozoic and Mesozoic Tectonic Evolution of Central and Eastern Asia: From Continental Assembly to Intracontinental Deformation, Geol. Soc. Am. Mem., 194, https://doi.org/10.1130/0-8137-1194-0.71, 71–99, 2001.
European Space Agency: Copernicus Glo-30 Global Digital Elevation Model, Copernicus DEM [data set], https://doi.org/10.5270/ESA-c5d3d65, 2015.
Fadul, C. M., Oliveira, P., and Val, P.: Ongoing landscape transience in the eastern Amazon Craton consistent with lithologic control of base level, Earth Surf. Proc. Land., 47, 3117–3132, https://doi.org/10.1002/esp.5447, 2022.
Flint, J. J.: Stream gradient as a function of order, magnitude, and discharge, Water Resour. Res., 10, 969–973, https://doi.org/10.1029/WR010i005p00969, 1974.
Forte, A. M. and Whipple, K. X.: Short communication: The Topographic Analysis Kit (TAK) for TopoToolbox, Earth Surf. Dynam., 7, 87–95, https://doi.org/10.5194/esurf-7-87-2019, 2019 (code available at: https://github.com/amforte/Topographic-Analysis-Kit.git, last access: 2 September 2024).
Frisch, K., Voigt, S., Verestek, V., Appel, E., Albert, R., Gerdes, A., Arndt, I., Raddatz, J., Voigt, T., Weber, Y., and Batenburg, S. J.: Long-Period Astronomical Forcing of Westerlies' Strength in Central Asia During Miocene Climate Cooling, Paleoceanography and Paleoclimatology, 34, 1784–1806, https://doi.org/10.1029/2019PA003642, 2019.
Gailleton, B., Mudd, S. M., Clubb, F. J., Grieve, S. W. D., and Hurst, M. D.: Impact of Changing Concavity Indices on Channel Steepness and Divide Migration Metrics, J. Geophys. Res.-Earth, 126, e2020JF006060, https://doi.org/10.1029/2020JF006060, 2021.
Gallen, S. F. and Wegmann, K. W.: River profile response to normal fault growth and linkage: an example from the Hellenic forearc of south-central Crete, Greece, Earth Surf. Dynam., 5, 161–186, https://doi.org/10.5194/esurf-5-161-2017, 2017.
Garcia-Castellanos, D. and Jiménez-Munt, I.: Topographic Evolution and Climate Aridification during Continental Collision: Insights from Computer Simulations, PLOS ONE, 10, e0132252, https://doi.org/10.1371/journal.pone.0132252, 2015.
Giachetta, E. and Willett, S. D.: Effects of River Capture and Sediment Flux on the Evolution of Plateaus: Insights From Numerical Modeling and River Profile Analysis in the Upper Blue Nile Catchment, J. Geophys. Res.-Earth, 123, 1187–1217, https://doi.org/10.1029/2017JF004252, 2018.
Glorie, S., De Grave, J., Buslov, M. M., Zhimulev, F. I., Stockli, D. F., Batalev, V. Y., Izmer, A., Van Den Haute, P., Vanhaecke, F., and Elburg, M. A.: Tectonic history of the Kyrgyz South Tien Shan (Atbashi-Inylchek) suture zone: The role of inherited structures during deformation-propagation, Tectonics, 30, https://doi.org/10.1029/2011TC002949, 2011.
Goren, L., Fox, M., and Willett, S. D.: Tectonics from fluvial topography using formal linear inversion: Theory and applications to the Inyo Mountains, California, J. Geophys. Res.-Earth, 119, 1651–1681, https://doi.org/10.1002/2014JF003079, 2014.
Grin, E., Schaller, M., and Ehlers, T. A.: Spatial distribution of cosmogenic 10Be derived denudation rates between the Western Tian Shan and Northern Pamir, Tajikistan, Geomorphology, 321, 1–15, https://doi.org/10.1016/j.geomorph.2018.08.007, 2018.
Guan, X., Yao, J., and Schneider, C.: Variability of the precipitation over the Tianshan Mountains, Central Asia. Part I: Linear and nonlinear trends of the annual and seasonal precipitation, Int. J. Climatol., 42, 118–138, https://doi.org/10.1002/joc.7235, 2022.
Gupta, S.: Himalayan drainage patterns and the origin of fluvial megafans in the Ganges foreland basin, Geology, 25, 11, https://doi.org/10.1130/0091-7613(1997)025<0011:HDPATO>2.3.CO;2, 1997.
Harkins, N., Kirby, E., Heimsath, A., Robinson, R., and Reiser, U.: Transient fluvial incision in the headwaters of the Yellow River, northeastern Tibet, China, J. Geophys. Res.-Earth, 112, 1–21, https://doi.org/10.1029/2006JF000570, 2007.
He, C., Yang, C.-J., Turowski, J. M., Ott, R. F., Braun, J., Tang, H., Ghantous, S., Yuan, X., and Stucky de Quay, G.: A global dataset of the shape of drainage systems, Earth Syst. Sci. Data, 16, 1151–1166, https://doi.org/10.5194/essd-16-1151-2024, 2024a.
He, C., Braun, J., Tang, H., Yuan, X., Acevedo-Trejos, E., Ott, R. F., and Stucky de Quay, G.: Drainage divide migration and implications for climate and biodiversity, Nat. Rev. Earth Environ., 5, 177–192, https://doi.org/10.1038/s43017-023-00511-z, 2024b.
Heidarzadeh, G., Ballato, P., Hassanzadeh, J., Ghassemi, M. R., and Strecker, M. R.: Lake overspill and onset of fluvial incision in the Iranian Plateau: Insights from the Mianeh Basin, Earth Planet. Sc. Lett., 469, 135–147, https://doi.org/10.1016/j.epsl.2017.04.019, 2017.
Hendrix, M. S., Graham, S. A., Carroll, A. R., Sobel, E. R., McKnight, C. L., Schulein, B. J., and Wang, Z.: Sedimentary record and climatic implications of recurrent deformation in the Tian Shan: Evidence from Mesozoic strata of the north Tarim, south Junggar, and Turpan basins, northwest China, Geol. Soc. Am. Bull., 104, 53–79, https://doi.org/10.1130/0016-7606(1992)104<0053:SRACIO>2.3.CO;2, 1992.
Horton, B. K. and Decelles, P. G.: Modern and ancient fluvial megafans in the foreland basin system of the central Andes, southern Bolivia: implications for drainage network evolution in fold-thrust belts, Basin Res., 13, 43–63, https://doi.org/10.1046/j.1365-2117.2001.00137.x, 2001.
Hovius, N.: Regular spacing of drainage outlets from linear mountain belts, Basin Res., 8, 29–44, https://doi.org/10.1111/j.1365-2117.1996.tb00113.x, 1996.
Izquierdo-Llavall, E., Roca, E., Xie, H., Pla, O., Muñoz, J. A., Rowan, M. G., Yuan, N., and Huang, S.: Influence of Overlapping décollements, Syntectonic Sedimentation, and Structural Inheritance in the Evolution of a Contractional System: The Central Kuqa Fold-and-Thrust Belt (Tian Shan Mountains, NW China), Tectonics, 37, 2608–2632, https://doi.org/10.1029/2017TC004928, 2018.
Jia, Y., Sun, J., Lü, L., Pang, J., and Wang, Y.: Late Oligocene-Miocene intra-continental mountain building of the Harke Mountains, southern Chinese Tian Shan: Evidence from detrital AFT and AHe analysis, J. Asian Earth Sci., 191, 104198, https://doi.org/10.1016/j.jseaes.2019.104198, 2020.
Jia, Y., Glotzbach, C., Lü, L., and Ehlers, T. A.: Cenozoic Tectono-Geomorphologic Evolution of the Pamir-Tian Shan Convergence Zone: Evidence From Detrital Zircon U-Pb Provenance Analyses, Tectonics, 40, e2020TC006345, https://doi.org/10.1029/2020TC006345, 2021.
Jolivet, M., Dominguez, S., Charreau, J., Chen, Y., Li, Y., and Wang, Q.: Mesozoic and Cenozoic tectonic history of the central Chinese Tian Shan: Reactivated tectonic structures and active deformation, Tectonics, 29, TC6019, https://doi.org/10.1029/2010TC002712, 2010.
Jourdon, A., Petit, C., Rolland, Y., Loury, C., Bellahsen, N., Guillot, S., Le Pourhiet, L., and Ganino, C.: New structural data on Late Paleozoic tectonics in the Kyrgyz Tien Shan (Central Asian Orogenic Belt), Gondwana Res., 46, 57–78, https://doi.org/10.1016/j.gr.2017.03.004, 2017.
Jourdon, A., Le Pourhiet, L., Petit, C., and Rolland, Y.: Impact of range-parallel sediment transport on 2D thermo-mechanical models of mountain belts: Application to the Kyrgyz Tien Shan, Terra Nova, 30, 279–288, https://doi.org/10.1111/ter.12337, 2018.
Kirby, E. and Whipple, K. X.: Expression of active tectonics in erosional landscapes, J. Struct. Geol., 44, 54–75, https://doi.org/10.1016/j.jsg.2012.07.009, 2012.
Kudriavtseva, A., Codilean, A.T., Sobel, E.R., Landgraf, A., Fülöp, R.H., Dzhumabaeva, A., Abdrakhmatov, K., Wilcken, K.M., Schildgen, T., Fink, D., Fujioka, T., Gong, L., Rosenwinkel, S., Merchel, S., and Rugel, G.: Impact of Quaternary glaciations on denudation rates in North Pamir–Tian Shan inferred from cosmogenic 10Be and low‐temperature thermochronology, J. Geophys. Res.-Earth, 128, e2023JF007193, https://doi.org/10.1029/2023JF007193, 2023.
Lague, D.: The stream power river incision model: Evidence, theory and beyond, Earth Surf. Proc. Land., 39, 38–61, https://doi.org/10.1002/esp.3462, 2014.
Li, W., Chen, Y., Yuan, X., Xiao, W., and Windley, B. F.: Intracontinental deformation of the Tianshan Orogen in response to India-Asia collision, Nat. Commun., 13, 3738, https://doi.org/10.1038/s41467-022-30795-6, 2022.
Lifton, N., Beel, C., Hättestrand, C., Kassab, C., Rogozhina, I., Heermance, R., Oskin, M., Burbank, D., Blomdin, R., Gribenski, N., Caffee, M., Goehring, B. M., Heyman, J., Ivanov, M., Li, Y., Li, Y., Petrakov, D., Usubaliev, R., Codilean, A. T., Chen, Y., Harbor, J., and Stroeven, A. P.: Constraints on the late Quaternary glacial history of the Inylchek and Sary-Dzaz valleys from in situ cosmogenic 10Be and 26Al, eastern Kyrgyz Tian Shan, Quaternary Sci. Rev., 101, 77–90, https://doi.org/10.1016/j.quascirev.2014.06.032, 2014.
Lü, L., Li, T., Chen, Z., Chen, J., Jobe, J. T., and Fang, L.: Active Structural Geometries and Their Correlation With Moderate (M 5.5–7.0) Earthquakes in the Jiashi–Keping Region, Tian Shan Southwestern Front, Tectonics, 40, e2021TC006760, https://doi.org/10.1029/2021TC006760, 2021.
Lyu, L., Li, T., Jia, Y., and Chen, J.: Multi-stage Cenozoic exhumation history of southern Central Tian Shan: implications for geodynamic and sedimentary evolution, EGU General Assembly 2024, Vienna, Austria, 14–19 Apr 2024, EGU24-7773, https://doi.org/10.5194/egusphere-egu24-7773, 2024.
Macaulay, E. A., Sobel, E. R., Mikolaichuk, A., Landgraf, A., Kohn, B., and Stuart, F.: Thermochronologic insight into late Cenozoic deformation in the basement-cored Terskey Range, Kyrgyz Tien Shan, Tectonics, 32, 487–500, https://doi.org/10.1002/tect.20040, 2013.
Macaulay, E. A., Sobel, E. R., Mikolaichuk, A., Kohn, B., and Stuart, F. M.: Cenozoic deformation and exhumation history of the Central Kyrgyz Tien Shan, Tectonics, 33, 135–165, https://doi.org/10.1002/2013TC003376, 2014.
Macaulay, E. A., Sobel, E. R., Mikolaichuk, A., Wack, M., Gilder, S. A., Mulch, A., Fortuna, A. B., Hynek, S., and Apayarov, F.: The sedimentary record of the Issyk Kul basin, Kyrgyzstan: climatic and tectonic inferences, Basin Res., 28, 57–80, https://doi.org/10.1111/bre.12098, 2016.
MacGregor, K. R., Anderson, R. S., Anderson, S. P., and Waddington, E. D.: Numerical simulations of glacial-valley longitudinal profile evolution, Geology, 28, 1031–1034, https://doi.org/10.1130/0091-7613(2000)028<1031:NSOGVL>2.3.CO;2, 2000.
Malatesta, L. C. and Avouac, J. P.: Contrasting river incision in north and south Tian Shan piedmonts due to variable glacial imprint in mountain valleys, Geology, 46, 659–662, https://doi.org/10.1130/G40320.1, 2018.
Marrucci, M., Zeilinger, G., Ribolini, A., and Schwanghart, W.: Origin of knickpoints in an Alpine context subject to different perturbing factors, Stura Valley, Maritime Alps (North-Western Italy), Geosciences, 8, 10–13, https://doi.org/10.3390/geosciences8120443, 2018.
McNab, F. and Gong, L.: Simulating knickpoint migration due to drainage capture and accelerated base-level fall with the 1D detachment-limited stream-power law, Zenodo [code], https://doi.org/10.5281/zenodo.11505509, 2024.
Mikolaichuk, A., Apayarov, F., and Gordeev, D.: Correlation of geological complexes of the Khan-Tengri Mountain massif, Earth ArXiv [preprint], https://doi.org/10.31223/X5KM18, 2022.
Mikolaichuk, A. V., Apayarov, F. K., Buchroithner, M. F., Chernavskaja, Z. I., Skrinnik, L. I., Ghes, M. D., Esmintsev, A. N., Charimov, T. A.: Digital Geological Map of the Khan Tengri Massif (Kyrgyzstan), ISTC Project No. KR-920, map and report, https://www.kyrgyzstan.ethz.ch/other-projects/istc-project-no-kr-920/index.html (last access: 22 August 2024), 2008.
Montgomery, D. R.: Slope Distributions, Threshold Hillslopes, and Steady-state Topography, Am. J. Sci., 301, 432–454, https://doi.org/10.2475/ajs.301.4-5.432, 2001.
Morin, J., Jolivet, M., Barrier, L., Laborde, A., Li, H., and Dauteuil, O.: Planation surfaces of the Tian Shan Range (Central Asia): Insight on several 100 million years of topographic evolution, J. Asian Earth Sci., 177, 52–65, https://doi.org/10.1016/j.jseaes.2019.03.011, 2019.
Mudd, S. M., Clubb, F. J., Gailleton, B., and Hurst, M. D.: How concave are river channels?, Earth Surf. Dynam., 6, 505–523, https://doi.org/10.5194/esurf-6-505-2018, 2018.
Neely, A. B., Bookhagen, B., and Burbank, D. W.: An automated knickzone selection algorithm (KZ-Picker) to analyze transient landscapes: Calibration and validation, J. Geophys. Res.-Earth, 122, 1236–1261, https://doi.org/10.1002/2017JF004250, 2017.
Niemann, J. D., Gasparini, N. M., Tucker, G. E., and Bras, R. L.: A quantitative evaluation of Playfair's law and its use in testing long-term stream erosion models, Earth Surf. Proc. Land., 26, 1317–1332, https://doi.org/10.1002/esp.272, 2001.
Oberlander, T. M.: The origin of drainage transverse to structures in orogens, in: Tectonic Geomorphology, edited by: Morisawa, M. and Hack, J. T., Allen & Unwin, Boston, USA, 155–182, ISBN 0-04-551098-9, 1985.
Ouimet, W. B., Whipple, K. X., and Granger, D. E.: Beyond threshold hillslopes: Channel adjustment to base-level fall in tectonically active mountain ranges, Geology, 37, 579–582, https://doi.org/10.1130/G30013A.1, 2009.
Penserini, B. D., Morell, K. D., Codilean, A. T., Fülöp, R. H., Wilcken, K. M., Yanites, B. J., Kumar, A., Fan, S., and Mearce, T.: Magnitude and timing of transient incision resulting from large‐scale drainage capture, Sutlej River, Northwest Himalaya, Earth Surf. Proc. Land., 49, 334–353, 2024.
Perron, J. T. and Royden, L.: An integral approach to bedrock river profile analysis, Earth Surf. Proc. Land., 38, 570–576, https://doi.org/10.1002/esp.3302, 2013.
Prud'homme, C., Scardia, G., Vonhof, H., Guinoiseau, D., Nigmatova, S., Fiebig, J., Gerdes, A., Janssen, R., and Fitzsimmons, K. E.: Central Asian modulation of Northern Hemisphere moisture transfer over the Late Cenozoic, Commun. Earth Environ., 2, 106, https://doi.org/10.1038/s43247-021-00173-z, 2021.
Puchol, N., Charreau, J., Blard, P. H., Lavé, J., Dominguez, S., Pik, R., Saint-Carlier, D., and Team, A.: Limited impact of Quaternary glaciations on denudation rates in Central Asia, Geol. Soc. Am. Bull., 129, 479–499, https://doi.org/10.1130/B31475.1, 2017.
Racano, S., Schildgen, T., Ballato, P., Yıldırım, C., and Wittmann, H.: Rock-uplift history of the Central Pontides from river-profile inversions and implications for development of the North Anatolian Fault, Earth Planet. Sc. Lett., 616, 118231, https://doi.org/10.1016/j.epsl.2023.118231, 2023.
Richter, F., Pearson, J., Vilkas, M., Heermance, R. V., Garzione, C. N., Cecil, M. R., Jepson, G., Moe, A., Xu, J., Liu, L., and Chen, J.: Growth of the southern Tian Shan-Pamir and its impact on central Asian climate, Geol. Soc. Am. Bull., 135, 1859–1878, https://doi.org/10.1130/B36471.1, 2022.
Rittner, M., Vermeesch, P., Carter, A., Bird, A., Stevens, T., Garzanti, E., Andò, S., Vezzoli, G., Dutt, R., Xu, Z., and Lu, H.: The provenance of Taklamakan desert sand, Earth Planet. Sc. Lett., 437, 127–137, https://doi.org/10.1016/j.epsl.2015.12.036, 2016.
Rohrmann, A., Kirby, E., and Schwanghart, W.: Accelerated Miocene incision along the Yangtze River driven by headward drainage basin expansion, Sci. Adv., 9, eadh1636, https://doi.org/10.1126/sciadv.adh1636, 2023.
Rolland, Y., Jourdon, A., Petit, C., Bellahsen, N., Loury, C., Sobel, E. R., and Glodny, J.: Thermochronology of the highest central Asian massifs (Khan Tengri - Pobedi, SE Kyrgyztan): Evidence for Late Miocene (ca. 8 Ma) reactivation of Permian faults and insights into building the Tian Shan, J. Asian Earth Sci., 200, 104466, https://doi.org/10.1016/j.jseaes.2020.104466, 2020.
Rudge, J. F., Roberts, G. G., White, N. J., and Richardson, C. N.: Uplift histories of Africa and Australia from linear inverse modeling of drainage inventories, J. Geophys. Res.-Earth, 120, 894–914, https://doi.org/10.1002/2014JF003297, 2015.
Schwanghart, W. and Kuhn, N. J.: TopoToolbox: A set of Matlab functions for topographic analysis, Environ. Modell. Softw., 25, 770–781, https://doi.org/10.1016/j.envsoft.2009.12.002, 2010.
Schwanghart, W. and Scherler, D.: Short Communication: TopoToolbox 2 – MATLAB-based software for topographic analysis and modeling in Earth surface sciences, Earth Surf. Dynam., 2, 1–7, https://doi.org/10.5194/esurf-2-1-2014, 2014 (code available at: https://github.com/wschwanghart/topotoolbox.git, last access: 2 September 2024).
Schwanghart, W. and Scherler, D.: Bumps in river profiles: uncertainty assessment and smoothing using quantile regression techniques, Earth Surf. Dynam., 5, 821–839, https://doi.org/10.5194/esurf-5-821-2017, 2017.
Schwanghart, W. and Scherler, D.: Divide mobility controls knickpoint migration on the Roan Plateau (Colorado, USA), Geology, 48, 698–702, https://doi.org/10.1130/G47054.1, 2020.
Seagren, E. G. and Schoenbohm, L. M.: Base Level and Lithologic Control of Drainage Reorganization in the Sierra de las Planchadas, NW Argentina, J. Geophys. Res.-Earth, 124, 1516–1539, https://doi.org/10.1029/2018JF004885, 2019.
Seagren, E. G., McMillan, M., and Schoenbohm, L. M.: Tectonic Control on Drainage Evolution in Broken Forelands: Examples From NW Argentina, Tectonics, 41, e2020TC006536, https://doi.org/10.1029/2020TC006536, 2022.
Shelef, E. and Goren, L.: The rate and extent of wind-gap migration regulated by tributary confluences and avulsions, Earth Surf. Dynam., 9, 687–700, https://doi.org/10.5194/esurf-9-687-2021, 2021.
Smith, A. G. G., Fox, M., Schwanghart, W., and Carter, A.: Comparing methods for calculating channel steepness index, Earth-Sci. Rev., 227, 103970, https://doi.org/10.1016/j.earscirev.2022.103970, 2022.
Sobel, E. R. and Dumitru, T. A.: Thrusting and exhumation around the margins of the western Tarim basin during the India-Asia collision, J. Geophys. Res.-Sol. Ea., 102, 5043–5063, https://doi.org/10.1029/96jb03267, 1997.
Sobel, E. R., Hilley, G. E., and Strecker, M. R.: Formation of internally drained contractional basins by aridity-limited bedrock incision, J. Geophys. Res.-Sol. Ea., 108, 2344, https://doi.org/10.1029/2002JB001883, 2003.
Sobel, E. R., Chen, J., and Heermance, R.: Late Oligocene–Early Miocene initiation of shortening in the Southwestern Chinese Tian Shan: Implications for Neogene shortening rate variations, Earth Planet. Sc. Lett., 247, 70–81, https://doi.org/10.1016/j.epsl.2006.03.048, 2006a.
Sobel, E. R., Oskin, M., Burbank, D., and Mikolaichuk, A.: Exhumation of basement-cored uplifts: Example of the Kyrgyz Range quantified with apatite fission track thermochronolgy, Tectonics, 25, TC2008, https://doi.org/10.1029/2005TC001809, 2006b.
Stokes, M. F., Kim, D., Gallen, S. F., Benavides, E., Keck, B. P., Wood, J., Goldberg, S. L., Larsen, I. J., Mollish, J. M., Simmons, J. W., Near, T. J., and Perron, J. T.: Erosion of heterogeneous rock drives diversification of Appalachian fishes, Science, 380, 855–859, https://doi.org/10.1126/SCIENCE.ADD9791, 2023.
Streit, R. L., Burbank, D. W., Strecker, M. R., Alonso, R. N., Cottle, J. M., and Kylander-Clark, A. R. C.: Controls on intermontane basin filling, isolation and incision on the margin of the Puna Plateau, NW Argentina (∼ 23° S), Basin Res., 29, 131–155, https://doi.org/10.1111/bre.12141, 2017.
Stroeven, A. P., Hättestrand, C., Heyman, J., Kleman, J., and Morén, B. M.: Glacial geomorphology of the Tian Shan, J. Maps, 9, 505–512, https://doi.org/10.1080/17445647.2013.820879, 2013.
Struth, L., Babault, J., and Teixell, A.: Drainage reorganization during mountain building in the river system of the Eastern Cordillera of the Colombian Andes, Geomorphology, 250, 370–383, https://doi.org/10.1016/j.geomorph.2015.09.012, 2015.
Sun, J., Liu, W., Liu, Z., Deng, T., Windley, B. F., and Fu, B.: Extreme aridification since the beginning of the Pliocene in the Tarim Basin, western China, Palaeogeogr. Palaeocl., 485, 189–200, https://doi.org/10.1016/j.palaeo.2017.06.012, 2017.
Valla, P. G., van der Beek, P. A., and Lague, D.: Fluvial incision into bedrock: Insights from morphometric analysis and numerical modeling of gorges incising glacial hanging valleys (Western Alps, France), J. Geophys. Res.-Earth, 115, F02010, https://doi.org/10.1029/2008JF001079, 2010.
Viaplana-Muzas, M., Babault, J., Dominguez, S., Van Den Driessche, J., and Legrand, X.: Modelling of drainage dynamics influence on sediment routing system in a fold-and-thrust belt, Basin Res., 31, 290–310, https://doi.org/10.1111/bre.12321, 2019.
Wang, Q., Zhang, P. Z., Freymueller, J. T., Bilham, R., Larson, K. M., Lai, X., You, X., Niu, Z., Wu, J., Li, Y., Liu, J., Yang, Z., and Chen, Q.: Present-day crustal deformation in China constrained by global positioning system measurements, Science, 294, 574–577, https://doi.org/10.1126/science.1063647, 2001.
Watson, M. P., Hayward, A. B., Parkinson, D. N., and Zhang, Z. M.: Plate tectonic history, basin development and petroleum source rock deposition onshore China, Mar. Petrol. Geol., 4, 205–225, https://doi.org/10.1016/0264-8172(87)90045-6, 1987.
Whipple, K. X.: Bedrock Rivers And The Geomorphology of Active Orogens, Annu. Rev. Earth Pl. Sc., 32, 151–185, https://doi.org/10.1146/annurev.earth.32.101802.120356, 2004.
Whipple, K. X. and Tucker, G. E.: Dynamics of the stream-power river incision model: Implications for height limits of mountain ranges, landscape response timescales, and research needs, J. Geophys. Res.-Sol. Ea., 104, 17661–17674, https://doi.org/10.1029/1999JB900120, 1999.
Whipple, K. X., DiBiase, R. A., and Crosby, B. T.: Bedrock Rivers, in: Treatise on Geomorphology, vol. 9, Elsevier, 550–573, https://doi.org/10.1016/B978-0-12-374739-6.00254-2, 2013.
Wobus, C., Whipple, K. X., Kirby, E., Snyder, N., Johnson, J., Spyropolou, K., Crosby, B., and Sheehan, D.: Tectonics from topography: Procedures, promise, and pitfalls, in: Tectonics, Climate, and Landscape Evolution, Geological Society of America Spec. Publ., 398, 55–74, https://doi.org/10.1130/2006.2398(04), 2006.
Wolf, S. G., Huismans, R. S., Braun, J., and Yuan, X.: Topography of mountain belts controlled by rheology and surface processes, Nature, 606, 516–521, https://doi.org/10.1038/s41586-022-04700-6, 2022.
Wu, C., Zheng, W., Zhang, P., Zhang, Z., Jia, Q., Yu, J., Zhang, H., Yao, Y., Liu, J., Han, G., and Chen, J.: Oblique Thrust of the Maidan Fault and Late Quaternary Tectonic Deformation in the Southwestern Tian Shan, Northwestern China, Tectonics, 38, 2625–2645, https://doi.org/10.1029/2018TC005248, 2019.
Xiao, W., Windley, B. F., Allen, M. B., and Han, C.: Paleozoic multiple accretionary and collisional tectonics of the Chinese Tianshan orogenic collage, Gondwana Res., 23, 1316–1341, https://doi.org/10.1016/j.gr.2012.01.012, 2013.
Yang, S., Li, J., and Wang, Q.: The deformation pattern and fault rate in the Tianshan Mountains inferred from GPS observations, Sci. China Ser. D, 51, 1064–1080, https://doi.org/10.1007/s11430-008-0090-8, 2008.
Yanites, B. J., Ehlers, T. A., Becker, J. K., Schnellmann, M., and Heuberger, S.: High magnitude and rapid incision from river capture: Rhine River, Switzerland, J. Geophys. Res.-Earth, 118, 1060–1084, https://doi.org/10.1002/jgrf.20056, 2013.
Yin, A., Nie, S., Craig, P., Harrison, T. M., Ryerson, F. J., Xianglin, Q., and Geng, Y.: Late Cenozoic tectonic evolution of the southern Chinese Tian Shan, Tectonics, 17, 1–27, https://doi.org/10.1029/97TC03140, 1998.
Zachos, J., Pagani, H., Sloan, L., Thomas, E., and Billups, K.: Trends, rhythms, and aberrations in global climate 65 Ma to present, Science, 292, 686–693, https://doi.org/10.1126/science.1059412, 2001.
Zhukov, Y. V., Zakharov, I. L., Berezansky, A. V., and Izraileva, R. M.: Geological map of Kyrgyz Republic, scale 1:500 000, Agency of Geology and Mineral Resources of the Kyrgyz Republic, Bishkek, Kyrgyzstan, 2008.