the Creative Commons Attribution 4.0 License.
the Creative Commons Attribution 4.0 License.
 | 12 Nov 2025
Progressive destabilization of a freestanding rock pillar in permafrost on the Matterhorn (Swiss Alps): Hydro-mechanical modeling and analysis
Jan Beutel
Michael Dietze
Alexander Bast
Robert Kenner
Marcia Phillips
Johannes Leinauer
Simon Mühlbauer
Felix Pfluger
Michael Krautblatter
Permafrost rock slopes have been extensively studied, yet the thermal and mechanical dynamics of the transition zone between the permafrost and overlying seasonally frozen layers warrant further investigation. This study investigates the progressive destabilization of a freestanding rock pillar forming the transition zone between the permafrost and the active layer on the Matterhorn Hörnligrat, with an ultimate collapse on 13 June 2023. We provide a comprehensive analysis that integrates field observations, laboratory findings, and mechanical modeling from the first destabilization to the final failure of the rock pillar. Based on multi-method field observations since 2008, we analyze the kinematic, thermal, and seismic evolution leading up to failure. GNSS and inclinometer measurements reveal a strong seasonal displacement pattern with a marked acceleration beginning in 2022. Time-lapse imagery documents a visible acceleration 10 d prior to the collapse, while seismic monitoring with three nearby seismometers identifies precursors and failure dynamics. Weather data and permafrost temperature records indicate a critical role of water percolation into permafrost, driving rapid, short-term thawing at depth through non-conductive heat fluxes. Laboratory experiments show that this thawing significantly reduces the friction angle along fractures by over 50 %. The integration of the laboratory experiments into a thermomechanical model allows us to reproduce the seasonal distinct displacement pattern observed in the field and thereby bridges the gap between experimental data and in situ field applications. This case study highlights the critical role of enhanced water percolation as a widespread phenomenon in warming mountain permafrost regions, manifested in the increasing frequency of rockfall events observed in such environments.
- Article
(14017 KB) - Full-text XML
-
Supplement
(5916 KB) - BibTeX
- EndNote


Gravity-driven rock slope failures occur in a wide range of topographical settings and pose a significant risk to underlying infrastructure or climbing routes. The stability of steep rock slopes is influenced not only by the strength of the rock itself but also by mechanical weaknesses in the rock structure, such as joints or faults (Terzaghi, 1962). Gravity-driven rock slope failures occur when the downward-driving stress exceeds the resisting strength (Abramson et al., 2002), either by enhanced loading mechanisms (e.g., earthquake-induced dynamic stress; Havenith et al., 2002; Gischig et al., 2015) or by strength-reducing failure processes (such as fracture propagation; Eberhardt et al., 2004; Petley, 2004). These failure processes are typically related to the structural predisposition, lithology, and topography of the rock slope (Stead and Wolter, 2015), weathering driven by thermomechanical processes (Watson et al., 2004; Gischig et al., 2011), or frost cracking (Matsuoka and Murton, 2008; Girard et al., 2013), as well as the infiltration of water and related pore pressure, hydrostatic pressure, and cryostatic pressure (Rivière et al., 2019; Agliardi et al., 2020). The resulting changes in ground conditions affect the geotechnical properties and thus often lead to temporary or continuous acceleration of rock masses, potentially resulting in failure. Instabilities typically develop as a result of long-term processes over years and decades to millennia, in discontinuous, inhomogeneous, anisotropic, and non-elastic (DIANE) materials with nonlinear spatial and temporal controls, making them inherently difficult to analyze (Krautblatter and Moore, 2014). In high-elevation mountain terrain, various external drivers, such as deglaciation or permafrost warming/degradation and ice loss related to rising air temperatures, promote a critical state in many rock slopes (Deline et al., 2021; Draebing et al., 2024). Such progressive destabilization can ultimately lead to failure (Wieczorek and Jäger, 1996), either solely through gravitational processes or in combination with various triggers, such as intense rainfall, repeated freeze–thaw cycles, or earthquakes (Dietze et al., 2017; Leinauer et al., 2024). As the related rockfall and rock slope failures can further trigger catastrophic large-scale hazard events via complex process chains (e.g., Huggel et al., 2005, 2012; Westoby et al., 2014; Haeberli et al., 2017; Walter et al., 2020), understanding and minimizing the risk associated with such cascading processes in a changing climate are of primary interest (Jacquemart and Weber et al., 2024; IPCC, 2022) and a prerequisite for reliable early warning systems.
Broader implications of permafrost degradation in response to atmospheric warming (Gruber et al., 2004), such as the successive deepening of the active layer observed globally (Noetzli et al., 2022, 2024) and related changes in water flow (Magnin and Josnin, 2021; Ben-Asher et al., 2023), have been widely discussed. Monitoring data document strong seasonal fluctuations in displacement rates (Cicoira et al., 2022), coinciding with (i) the onset of thaw near the surface (Hasler et al., 2012; Weber et al., 2017), (ii) warming and thawing at depth induced by infiltration of relatively warm liquid water from rain or snowmelt into colder zones in the substrate (non-conductive heat transport; Hasler et al., 2011), and (iii) increased piezometric heads in a dense fracture network (Offer et al., 2025; Scandroglio et al., 2025). Despite the existence of theoretical expectations of significant changes in friction from thawing rock–rock contacts along fractures (Krautblatter et al., 2013), empirical data elucidating these processes are scarce. Furthermore, the intricate interactions between the active layer's hydrology, thermal regime, and mechanical stability during seasonal thaw cycles have not been comprehensively studied.
Although permafrost rock slopes have been extensively studied, detailed investigations into the specific dynamics of the transient zone between the permafrost and the overlying seasonally frozen active layer – particularly the mechanisms driving seasonal displacement patterns – remain scarce. This study investigates the progressive destabilization of frozen rock masses on permafrost, examining the hypothesis that short-term thawing induced by non-conductive heat transport reduces friction along fractures at depth, thereby progressively destabilizing rock masses in steep slopes. To test our hypothesis, we integrate laboratory experiments and multi-method field observations from a freestanding rock pillar on the Matterhorn Hörnligrat into a thermomechanical model able to reproduce the transition from a slow- to a fast-moving regime over nearly 1 decade. This combined analysis yields unprecedented insights into the processes leading to the final failure of the Matterhorn rock pillar on 13 June 2023 that can be predicted with a prospective failure time forecasting model. Analysis of experimental data collected at the Matterhorn Cryosphere Observatory (Weber et al., 2019) leading to this model includes (i) the assessment of the potential for a prospective forecast of small failure with volumes ranging from a few tens to hundreds of cubic meters based on kinematic indicators, (ii) evaluation of the presence of seismic precursors and seismic response, and (iii) the identification of coincident variations in ambient seismic noise. Finally, laboratory-inferred friction angles for frozen and unfrozen fractures using Matterhorn rock samples are determined. As a result, seasonal reductions in the coefficient of friction due to short-term thawing events are modeled. The model output is then compared to observed displacement patterns and further environmental parameters.
The Matterhorn Cryosphere Observatory
The Matterhorn is one of the most iconic mountains in the European Alps at the Swiss–Italian border (see Fig. 1a) and has been an attractive destination for mountaineers since its first ascent in 1865. In summer 2003, the release of a rock volume of approximately 1500–2000 m3 from the northeastern Hörnligrat at 3500 m a.s.l. occurred in two distinct events on 15 and 16 July, revealing large volumes of compact ice on the scarp's failure plane (Weber et al., 2019). Triggered by the observation of ice remaining intact in the fracture zone, first investigations were started to better understand the interplay of ice and fractured frozen bedrock (Gruber and Haeberli, 2007; Noetzli and Gruber, 2009). Wireless sensor technology enabled real-time in situ measurements of fracture kinematics and thermal conditions in and around the 2003 rockfall zone at 3500 m a.s.l. at unprecedented scale and data quality in such an environment (Hasler et al., 2008; Beutel et al., 2009). This benchmark field site has since been maintained further and expanded with further sensors and to higher elevation at the Solvay hut 4003 m a.s.l. (Hasler et al., 2012; Weber et al., 2018b, 2022) and today constitutes one of the longest and most comprehensive multi-method bedrock permafrost monitoring sites (Weber et al., 2019). Together with similar instrumentation and monitoring techniques on the Italian side (Pogliotti et al., 2015, 2023), the Matterhorn Cryosphere Observatory today spans an entire north–south transect from the valley bottoms to the summit (Beutel et al., 2024).
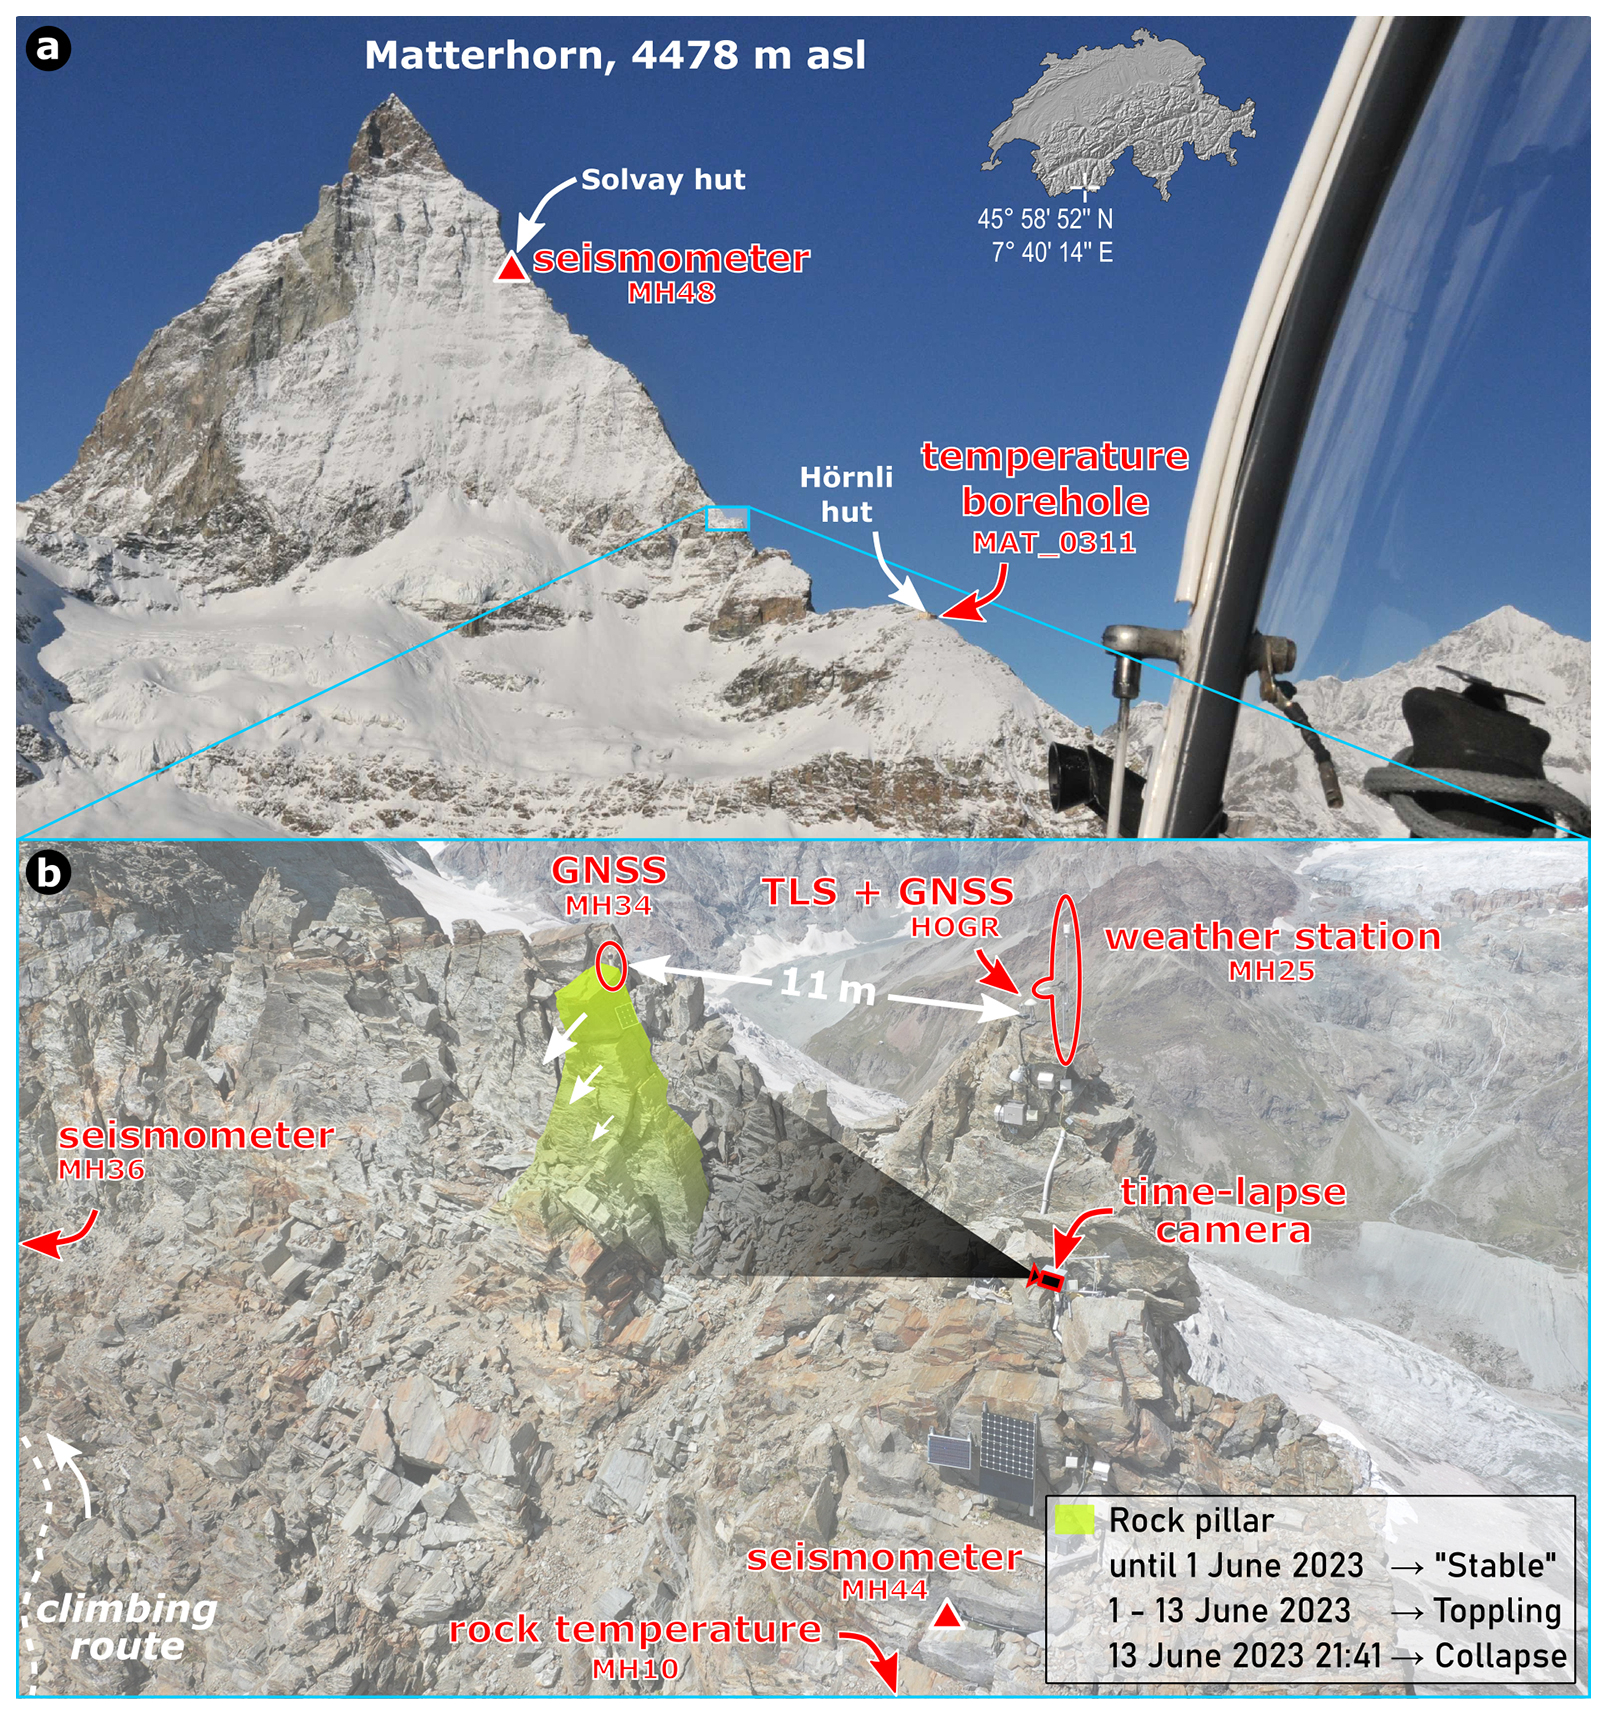
Figure 1(a) The Matterhorn Hörnligrat Cryosphere Observatory is located along the northeastern ridge of the Matterhorn, with the main study site located between the Hörnli hut and the Solvay hut. (b) A zoom to 3500 m a.s.l. highlights the freestanding rock pillar with a volume of approx. 20 m3 in yellow and labels the surrounding sensors in red. The white reference line between GNSS MH34 (rock pillar) and GNSS HOGR (mounting plate for terrestrial laser scanner) represents a distance of 11 m. Rock samples for the laboratory experiments were collected behind the rock pillar on the northern side. The dashed white line marks the climbing route in the flank just below the rock pillar, via which approximately 3000 climbers attempt to reach the summit each year, mostly between July and mid-September.
Geologically, the Hörnligrat field site is situated above the Penninic metasediments and ophiolites of the Combin Zone and is composed of gneiss and amphibolite from the Dent Blanche nappe, which primarily forms the Matterhorn summit (Pleuger et al., 2007). The albite gneiss in this area features a distinctive mylonite banding on a decimeter to meter scale, dipping southeast in alignment with the Dent Blanche overthrust (Bucher et al., 2004). The field site's surroundings on the southern side are heavily fractured, with numerous primary fault structures running parallel to the ridge and dipping nearly vertically. In contrast, the north-facing part of the ridge remains relatively stable, as evidenced by lichen growth (Hasler et al., 2012). Laboratory analyses of rock samples from the site reveal (i) extremely low porosity (0.9 % for gneiss and 1.3 % for amphibolite), (ii) metamorphic lamination in gneiss and varied fabric orientations in amphibolite, and (iii) a significant increase in P-wave velocity upon freezing (9 %–13 % for gneiss and 16 %–20 % for amphibolite, depending on the direction of cleavage; Draebing and Krautblatter, 2012).
The Zermatt region at 1600 m a.s.l. experiences a dry inner-alpine climate with a mean annual air temperature (MAAT) of 3.5 °C (1961–1990) and 4.7 °C (1991–2020; MeteoSwiss, 2019). While reanalysis data with a 1×1 km2 grid suggest a regional MAAT of −6.7 °C for the field site area (1961–1990 period; Hiebl et al., 2009), local measurements at the site indicate an MAAT of −3.7 °C for the 2011–2012 period (Weber et al., 2017). Winter temperatures can drop to −27 °C, precipitation primarily falls as snow with occasional rainfall during summer, and strong winds exceeding 100 km h−1 lead to preferential snow deposition in fractures, on ledges, and on other concave microtopographical features (Weber et al., 2019). On the northern side of the ridge, there is a small ice field within a steep, heterogeneous rock face, while, on the southern side, snow accumulates in couloirs and on rock bands during winter, disappearing completely in the spring and summer (Hasler et al., 2012).
Permafrost conditions vary across the ridge. On the southern side, local permafrost is present with an active layer several meters thick, where rock temperatures at 1 m depth can reach up to 10 °C in summer. In contrast, the northern side features extensive permafrost with a thin active layer of only a few meters, indicated by moderately positive summer temperatures (the 98th percentile corresponds to 2.0 °C) at the same depth (Hasler et al., 2012; Weber et al., 2017, 2018a). Near the Hörnli hut, on the Matterhorn ridge at 3342 m a.s.l., active layer depth varies between 3 and 5 m (PERMOS).
Apart from the rockfall event in the summer of 2003, numerous smaller rockfalls on the order of few m3 to tens of m3 have been observed and documented in the immediate area of the 2003 scarp, on the surrounding ridges, and on the lower flanks. A freestanding rock pillar (approx. 20 m3; see Fig. 1b) that stood isolated from the main ridge collapsed on 13 June 2023 at 21:41 UTC – luckily without consequences. Due to the extensive long-term monitoring activities at the Matterhorn Hörnligrat field site (see Fig. 1b), a wide range of data is available (see Sect. 3.1).
3.1 In situ field measurement data
The instrumentation of the Matterhorn Hörnligrat field site consists of time-lapse cameras, a weather station, a net radiometer, sensor rods providing bedrock temperature and resistivity data, crackmeters, GNSS sensors with embedded inclinometers, and seismometer stations (for details, see Weber et al., 2019, and Cicoira et al., 2022). Curated data are available online (Weber and Beutel, 2025). In this study, we make use of the following data records:
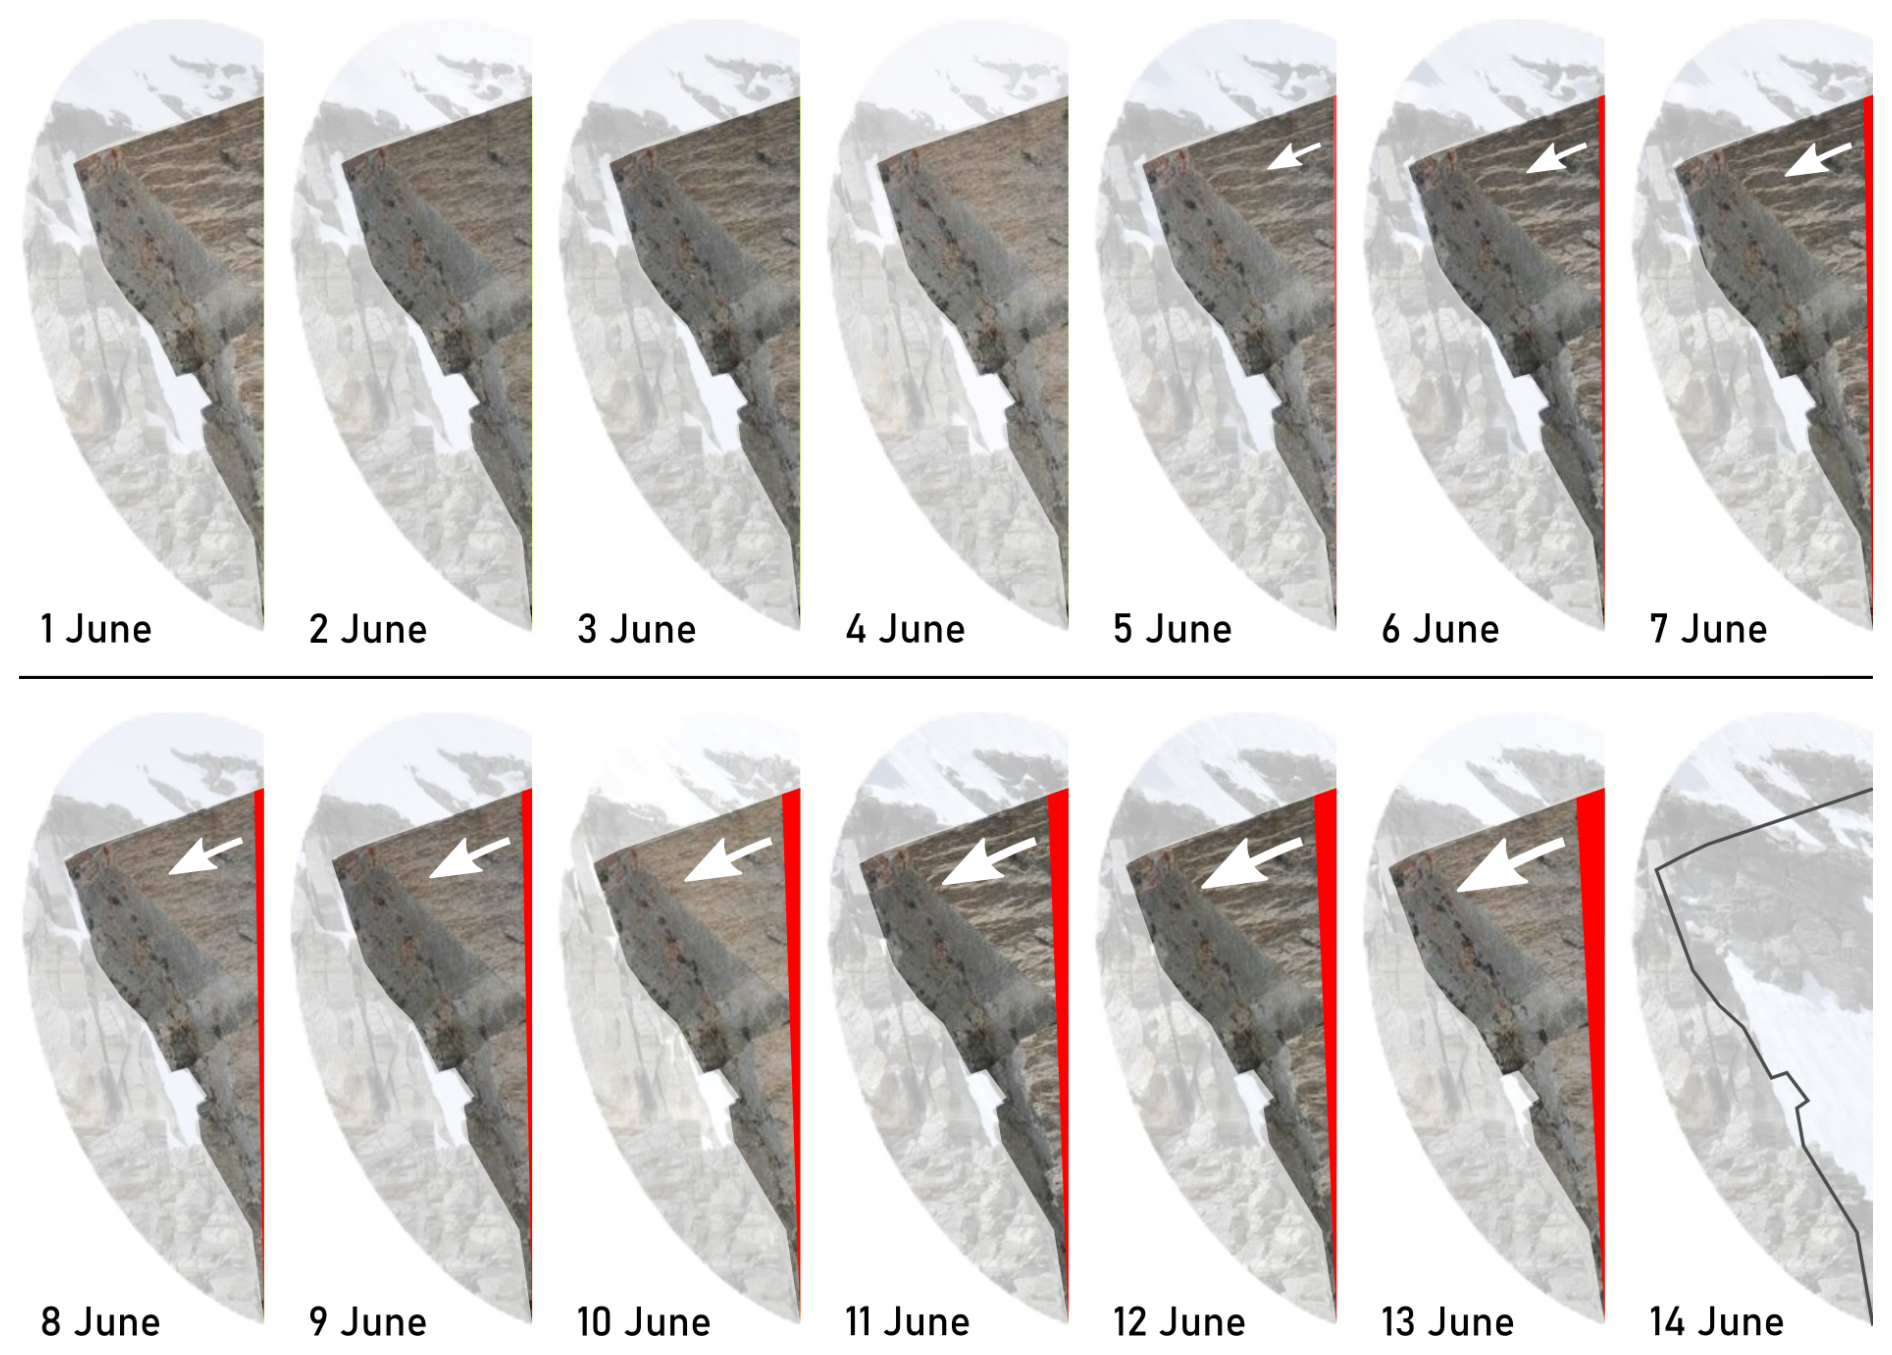
Figure 2Clip of the time-lapse images focusing on the toppling rock pillar from 1 to 14 June 2023 (one selected image per day; the camera's perspective is represented by a gray-shaded area in Fig. 1). The visible shift to the left (south–east) is represented in red. An animated GIF created with ImageMagick (ImageMagick Studio LLC, 2024) is available in the video supplement (https://doi.org/10.5281/zenodo.13643168; Weber, 2024).
- Time-lapse images.
-
A remote-controlled time-lapse Nikon D300 camera, with a 24 mm f/2.8D fixed focal length lens (Keller et al., 2009), provides high-resolution images taken at approximately 2 h intervals. To illustrate the field of view and the visible displacement over the 14 d prior to the collapse of the rock pillar, one manually selected picture per day was displayed as a time series (see Fig. 2 and animated as a GIF in the video supplement; Weber, 2024).
- Terrestrial laser-scanning campaigns.
-
Three campaigns have been performed using terrestrial laser scanning (TLS) with instruments located both on the Matterhorn Hörnligrat and near the Hörnli hut 300 m below. In this study, we use the point clouds acquired on 27 July 2015 and 20 August 2018 from a platform 20 m east-northeast of the monitored rock pillar. The scene was scanned using the RIEGL 3D terrestrial laser scan VZ-1000 in 2015 and the long-range version VZ6000 in 2018. The rock pillar was scanned with a spatial resolution of about 1 cm, and RGB photographs were taken with the internal cameras of the LiDAR scanners.
- Displacement and rotation measurements.
-
Four GNSS stations mounted near or on top of selected topographic features (using a mast elevating the GNSS antenna ∼10 cm above the rock pillar for a clear-sky view) are used to assess the large-scale movement of individual buttresses on the ridge: (i) a high-performance Leica GRX1200+ GNSS receiver with a Leica AR10 antenna was installed on the ridge in December 2010 (see MH42/HOGR in Fig. 1), serving as a reference. (ii) Three PermaSense wireless GNSS stations (Cicoira et al., 2022), consisting of an L1 GNSS based on a u-blox LEA 6T receiver with a Trimble Bullet III antenna and an integrated two-axis inclinometer based on a MEMS component (Murata SCA830-D07) supporting a ±30 mg offset accuracy over the operating temperature range, provide the spatial and rotational displacements once a day and every 2 min, respectively, starting 2015/16. Typically, these spatial displacement data are post-processed using double-differencing GNSS processing along short baselines to derive daily position coordinates (details are given in Sect. 5.2 in Weber et al., 2019). Furthermore, almost 20 crackmeters are located in and around the rockfall zone at different aspects (Weber et al., 2019).
- Continuous seismic data.
-
Three seismometer stations consisting of a three-component seismometer (Lennartz electronic low-noise seismometer LE-3DliteMKIII with a 1–100 Hz passband) and a Nanometrics Centaur digital recorder (a 24-bit high-resolution seismic data acquisition system paced by GPS with a sampling rate of 250 sps) provide continuous seismic data records on the ridge (position MH44 in Fig. 1), in the detachment zone (position MH36 in Fig. 1) and at the Solvay hut at 4003 m a.s.l. (position MH48 in Fig. 1; UIBK and WSL/SLF, 2015).
- Ambient weather data and ground surface temperatures.
-
A Vaisala WXT520 weather station is available both at the rockfall zone at 3500 m a.s.l. and at the Solvay hut at 4003 m a.s.l., measuring air temperature, humidity, pressure, wind speed and wind direction, liquid precipitation, and hail. Different near-surface temperature profiles both in intact bedrock (up to 1 m depth) and in larger fractures (up to 3.5 m depth) are available over a period of up to 18 years. Ground temperature data from a permafrost borehole (up to 10 m depth) are available near the Hörnli hut (3260 m a.s.l.; see Fig. 1). Further long-term climate data, including snow height measurements, are available from the Swiss IMIS weather station (ZER4) at Stafelalp at 2408 m a.s.l. with a baseline distance of 3.1 km (Intercantonal Measurement and Information System IMIS, 2023).
3.2 Field data analysis
- LiDAR point cloud analysis.
-
The point clouds were co-registered by matching stable terrain sections using the iterative closest point algorithm (Chen and Medioni, 1991). For comparison, the point clouds were further processed with F2S3, a feature-based algorithm to define 3D displacements between point clouds (Gojcic et al., 2020). The 3D vectors were split into the magnitude, dip angle, and azimuth of the displacement. Hereby, the dip angle indicates the steepness of the movement, ranging from 0° for a horizontal displacement to −90° for a vertical downward displacement. The values obtained for the individual components were attributed to the point cloud from 2018 using linear interpolation to visualize the results. The point cloud was then colored according to the displacement angles and magnitudes, respectively.
- Kinematic precursor analysis.
-
We use daily position data from the GNSS devices and hourly downsampled inclination data for the kinematic precursor analysis. These are fed into the prospective failure time forecasting model of Leinauer et al. (2023), based on the linear inverse velocity method for brittle failure (Fukuzono, 1985). The model enables data smoothing, detection of the onset of acceleration (OOA), and failure time forecasting. Data smoothing is necessary, as the first derivatives of displacement and inclination (displacement rate/velocity and inclination rate) are very sensitive even to small fluctuations in the raw data. To minimize the effect of subjective smoothing window lengths, a set of multiple windows ranging from 5 to 12 d is applied. The OOA is the start of significant kinematic precursors. Within the tool, it is detected based on four criteria indicating a sustainable acceleration regime: (1) increasing displacement rate, (2) decreasing inverse velocity, (3) decreasing 50 % quantile, and (4) inverse velocity <1% quantile. After OOA detection, failure time forecasts are calculated prospectively for each time step and presented as predicted life expectancy per smoothing window.
- Seismic precursor and response analysis.
-
For the seismic waveform analysis in the time and frequency domain, the instrument response was not removed due to the identical setup of the seismometer stations (see Sect. 3.1), as converting to real-world units, such as velocity, can introduce additional uncertainties. Firstly, the Hilbert envelope of all waveform components and the root mean square were used as a proxy for the energy level. The Hilbert envelope amplitude was cumulated and normalized to compare the seismic response to the pillar collapse recorded at the different seismometers. Secondly, seismic sensors also allow us to probe subtle but progressive changes in the ground structure (Larose et al., 2015; Cook and Dietze, 2022). For this, we computed ambient seismic noise cross-correlations to estimate relative seismic wave velocity changes, (Snieder, 2004). The data from all three stations were cut into 50 % overlapping, 30 min long windows. For each window, the data were deconvoluted, filtered to the most energetic persistent frequency band (2–4 Hz), sign-cut, and spectrally whitened to remove any possible correlation bias. Since the full-time-series spectrograms did not show major contamination of the signals by high-energy pulses, we refrained from muting such possible high-energy events from the data. The cross-correlation functions within a both-sided correlation length of 5 s were computed for all component pairs (Z-Z, N-N, E-E) of the closest station pair MH36/MH44 and averaged. To infer the time series from the 30 min correlation functions, we used the stretching technique (Sens-Schönfelder and Wegler, 2006) in a time window of 1.1 to 1.7 s of the cross-correlation data with respect to the mean cross-correlation function of the entire time span. The time window of 1.1–1.7 s was identified based on the overall stability of the cross-correlation amplitude and is a compromise between the integration of sufficient wave periods and adequate signal-to-noise ratio (Illien et al., 2022). We started at a lag of 1.1 s, i.e., skipping two periods of the filtered datasets, to avoid the leakage of early-arrival wave effects into our cross-correlation window, as those waves are prone to changes in noise source characteristics. Stretching was done for a potential 20 % wave velocity change resolved by 2000 steps. All calculations were performed using the R package eseis v.0.8.0 (Dietze, 2018). Thirdly, we also used the seismic datasets to detect discrete seismic events prior to and after the occurrence of the rock pillar collapse (starting 1 June 2023 and ending 16 June 2023). We detected events based on the classic STA-LTA detector (Allen, 1982) on the 5–20 Hz filtered signal envelopes with short- and long-term windows of 0.5 and 180 s respectively, an on-ratio of 3, and an off-ratio of 1 (cf. Dietze et al., 2017). We removed all detections that did not register at all three stations within a common time window of 1 s or that happened within a 10 s time window after a previously detected event (i.e., assumed repeated impact signals of one event). All events were manually checked to remove unwanted signals from sources like earthquakes, helicopters, mountaineers, or atmospheric dynamics. The remaining events were analyzed by their durations and time of occurrence, both for the total time span of interest and at the diurnal scale. To avoid edge effects in the kernel density estimate of the circular diurnal data, we expanded the diurnal event timings by copies of those timings −24 and +24 h, before calculating the density estimate and then truncating it at 0 and 24 h again (cf. Dietze et al., 2017). Fourthly and lastly, the Fourier amplitude spectrum and power spectral density were estimated by Welch's average periodogram method for 0.5 s segments overlapping by 95 % of each component on all three seismometers (Bendat and Piersol, 2011; Krischer et al., 2015; ObsPy Development Team, 2019). The derived spectrograms were then used to describe the seismic response to the rock pillar collapse in the frequency domain over time.
- Ambient conditions analysis.
-
On the basis of in situ measured hourly time series (i.e., rock temperatures, air temperatures, humidity, precipitation, and radiation), daily and monthly aggregates were calculated following the Guide to Climatological Practices (WMO, 2023). These data enable us to characterize the temporal variation in the local site conditions (weather and ground) and derive the potential environmental drivers.
3.3 Laboratory experiment setup
The rock samples were collected at the Matterhorn Hörnligrat field site, just behind and north of the freestanding rock pillar, and consist of gneiss. According to Mamot et al. (2020), this gneiss is clearly laminated and contains bands of mica (18.5 %). Its main components are quartz (46.8 %) and feldspar (22.9 %), with additional minerals identified in the sample, including chloritoid and epidote, along with traces of chlorite, amphibole, and rutile. Cylinders with a diameter of 148 mm and a height of 82 mm were drilled/cut in the mechanical laboratory of the Landslide Group at the Technical University of Munich. Following the International Society for Rock Mechanics and Rock Engineering (ISRM) recommendations for standardized tests (Coulson, 1970; Ulusay, 2015), we produced a uniform and reproducible roughness of the sample surfaces using abrasive grinding powder with a grit of 80 grains per inch (Federation of European Producers of Abrasives, FEPA, standard). We then saturated the rock cylinders in a water bath under atmospheric pressure for at least 72 h before further preparing pairs of samples with different wetting at the interface (A – fully saturated; B – moistened) in both unfrozen (10 °C) and frozen (−5 °C) states. Dry conditions are not considered in this study because natural alpine bedrock is generally close to saturation. Field measurements and previous studies indicate that only the uppermost 8–10 cm of the rock surface may intermittently become drier due to atmospheric exposure (Sass, 2005). This assumption is particularly valid in permafrost or seasonally frozen rock mass, where freeze–thaw processes further promote moisture retention. Specifically, ice segregation during freezing induces suction forces that draw water toward the freezing front, thereby increasing pore water content and enhancing saturation. Consequently, the bulk of the rock volume in permafrost environments remains at or near full saturation, rendering the influence of dry conditions negligible for the purposes of our experimental setup and modeling framework.
We performed six tests using the prepared pairs for each condition (two different degrees of water saturation in both unfrozen and frozen conditions; 24 tests in total). Using the custom-built shear apparatus installed in a temperature-controlled cooling box (for details, see Mamot et al., 2018), we applied a normal stress level of 200 kPa and a constant strain rate of s−1. On the basis of the measured shear strengths, we estimated the friction angle for both frozen and unfrozen conditions, assuming zero cohesion in the Mohr–Coulomb theorem. We compared this analysis to a scenario considering cohesion for frozen conditions (see Fig. S1 in the Supplement), following the stress- and temperature-dependent failure criterion for ice-filled fractures by Mamot et al. (2018, 2020). The comparison yields consistent results for the inferred friction angle (see Sect. 4.2).
3.4 Thermomechanical analysis by numerical modeling
We apply the 2D mechanical modeling framework UDEC by Itasca Consulting Group (2019) to analyze the mechanical and kinematic reaction of the rock pillar to the seasonal freezing conditions of rock discontinuities – from frozen to thawed/wet surfaces and back to frozen – by implementing the results of the conducted laboratory experiment (Sect. 4.2). UDEC employs the distinct element method to model a discontinuous and anisotropic rock mass as discrete blocks bounded by defined discontinuities, such as joints or faults. These discontinuities represent contact areas between blocks, allowing block interactions through sliding, toppling, or rotation during simulation.
The structural geometry of the model was deviated according to mapped clusters of discontinuities as revealed by Hasler et al. (2012) and projected into the 2D profile (abstracted from the terrestrial laser scan conducted in 2016). Only mechanically relevant discontinuities were included in the model. Discontinuity clusters with a strike angle greater than 30° relative to the profile were excluded from the modeling study. For simplicity, we kept joint spacing fixed to 1 m; Hasler et al. (2012) reported spacing in the range of 0.2 and 2 m. To minimize block interlocking and facilitate sliding, we incorporated a Voronoi-based discrete fracture network as an additional set of irregular discontinuities. This honeycomb-like structure enabled the model to determine preferred shear paths. The angle of the squeezed Voronoi structures was deviated from the geometry of the rock faces and planes next to the pillar. To take into account the kinematics of the rock pillar, which are affected by the rock mass below, the model domain was extended 10 m into depth and on both sides.
Blocks were meshed with a maximum edge length of 0.5 m and were assigned to an elastic material model with parameters of density ρintact rock of 2650 kg m−3, a bulk modulus of 40 GPa, and a shear modulus of 17 GPa, according to lab tests conducted on gneissic rock samples, with the aim of simulating intact, rigid blocks allowing preferred movement mainly along defined discontinuities. The Mohr–Coulomb model was used as a shear criterion, representing frozen discontinuities by ϕfrozen=80° and unfrozen discontinuities by ϕunfrozen=40°, respectively. Cohesion was kept constant at 0 MPa (models with varying cohesion showed no significant change in deformation behavior), as were the joint normal and shear stiffness at kN=85 and kS=30 GPa m−1. All discontinuities in the mechanically relevant model domain were assigned the same friction angles throughout the simulated periods. To focus solely on the mechanics at the pillar's base, we fixed the shear parameters of its upper part and the ridge beneath to ϕ=80°, c=1 MPa, and tensile strength σtensile=0.5 MPa in all simulations. This enforced toppling behavior prevents the model from tracking smaller rockfalls/rock slides from above (see Fig. S2). Model boundaries were fixed with no-velocity conditions at the left, bottom, and right sides of the model space, and a gravitational force of 9.81 m s−2 was assigned. The model was initialized with a vertical in situ stress ratio of k=0.5 () accounting for topographic effects on stress distribution, parameterized with properties for frozen discontinuities and additional added cohesion c=0.1 MPa and cycled until reaching an equilibrium state (v=0 m s−1) for all blocks inside the model domain.
4.1 Field observations from the Matterhorn
4.1.1 Environmental drivers and ground temperature
Both the rock and air temperatures measured on the Hörnligrat in spring 2023 and the month of failure (June 2023) are within the range of the long-term average (see Figs. 3a–c and 4a and b). In contrast, the rock temperature at 2 m depth measured near the Hörnli hut was remarkably high in the winter preceding the failure (Fig. 4c and d). No peculiarity could be detected in either short- or long-wave radiation (see Fig. S3). Within the period 2017–2021 with complete time series, we have average annual values for rock temperature (south-facing, at 60 cm depth, sensor MH10) of 1.3 °C, air temperature of −4.3 °C, and relative humidity of 60 %.
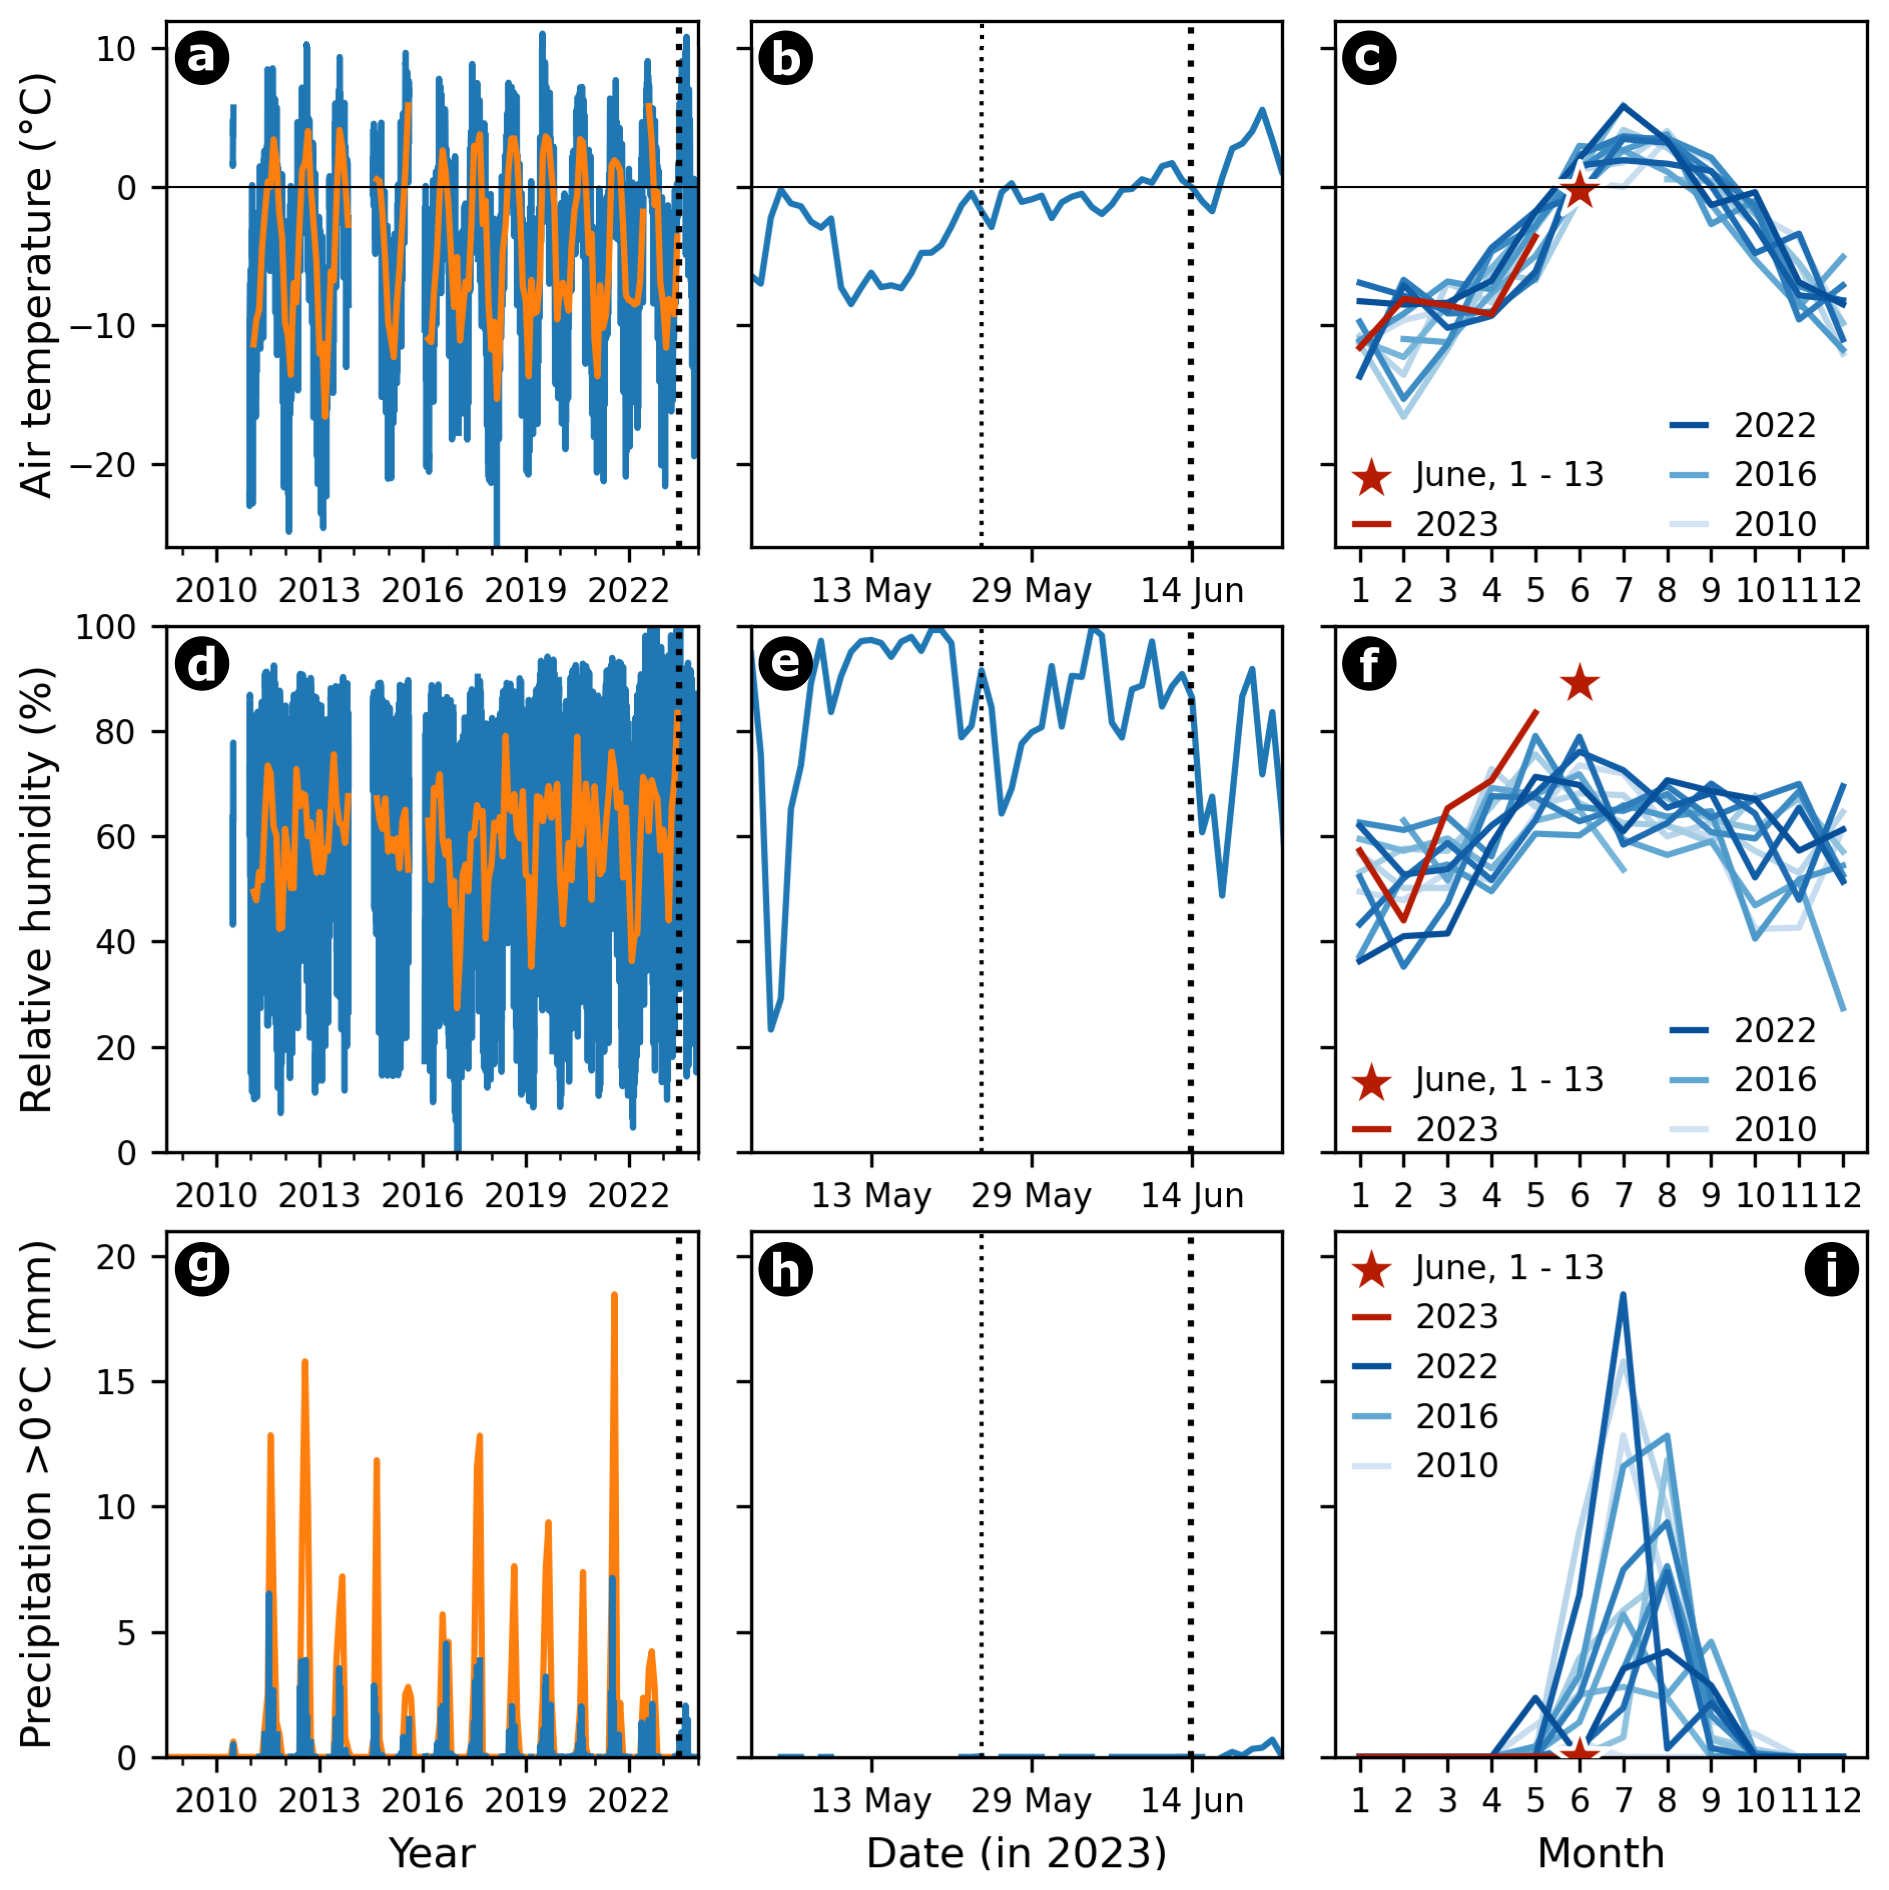
Figure 3Air temperature, relative humidity, and precipitation data measured with the Vaisala weather station (position MH25) until 23 June 2023. The left column (a, d, g) shows a time series with a daily mean in blue and a rolling monthly mean in orange. The middle column (b, e, h) zooms in on the period from 1 May to 23 June 2023 with dotted and dashed black lines indicating the estimated onset of water infiltration and the time of collapse of the rock pillar, respectively. The right column (c, f, i) shows the seasonal pattern for the same period in the years 2010–2022 in blue and in the year 2023 in red. In 2023, air temperatures likely followed the long-term average, while humidity in spring and June was remarkably high and precipitation (>0 °C) was completely absent.
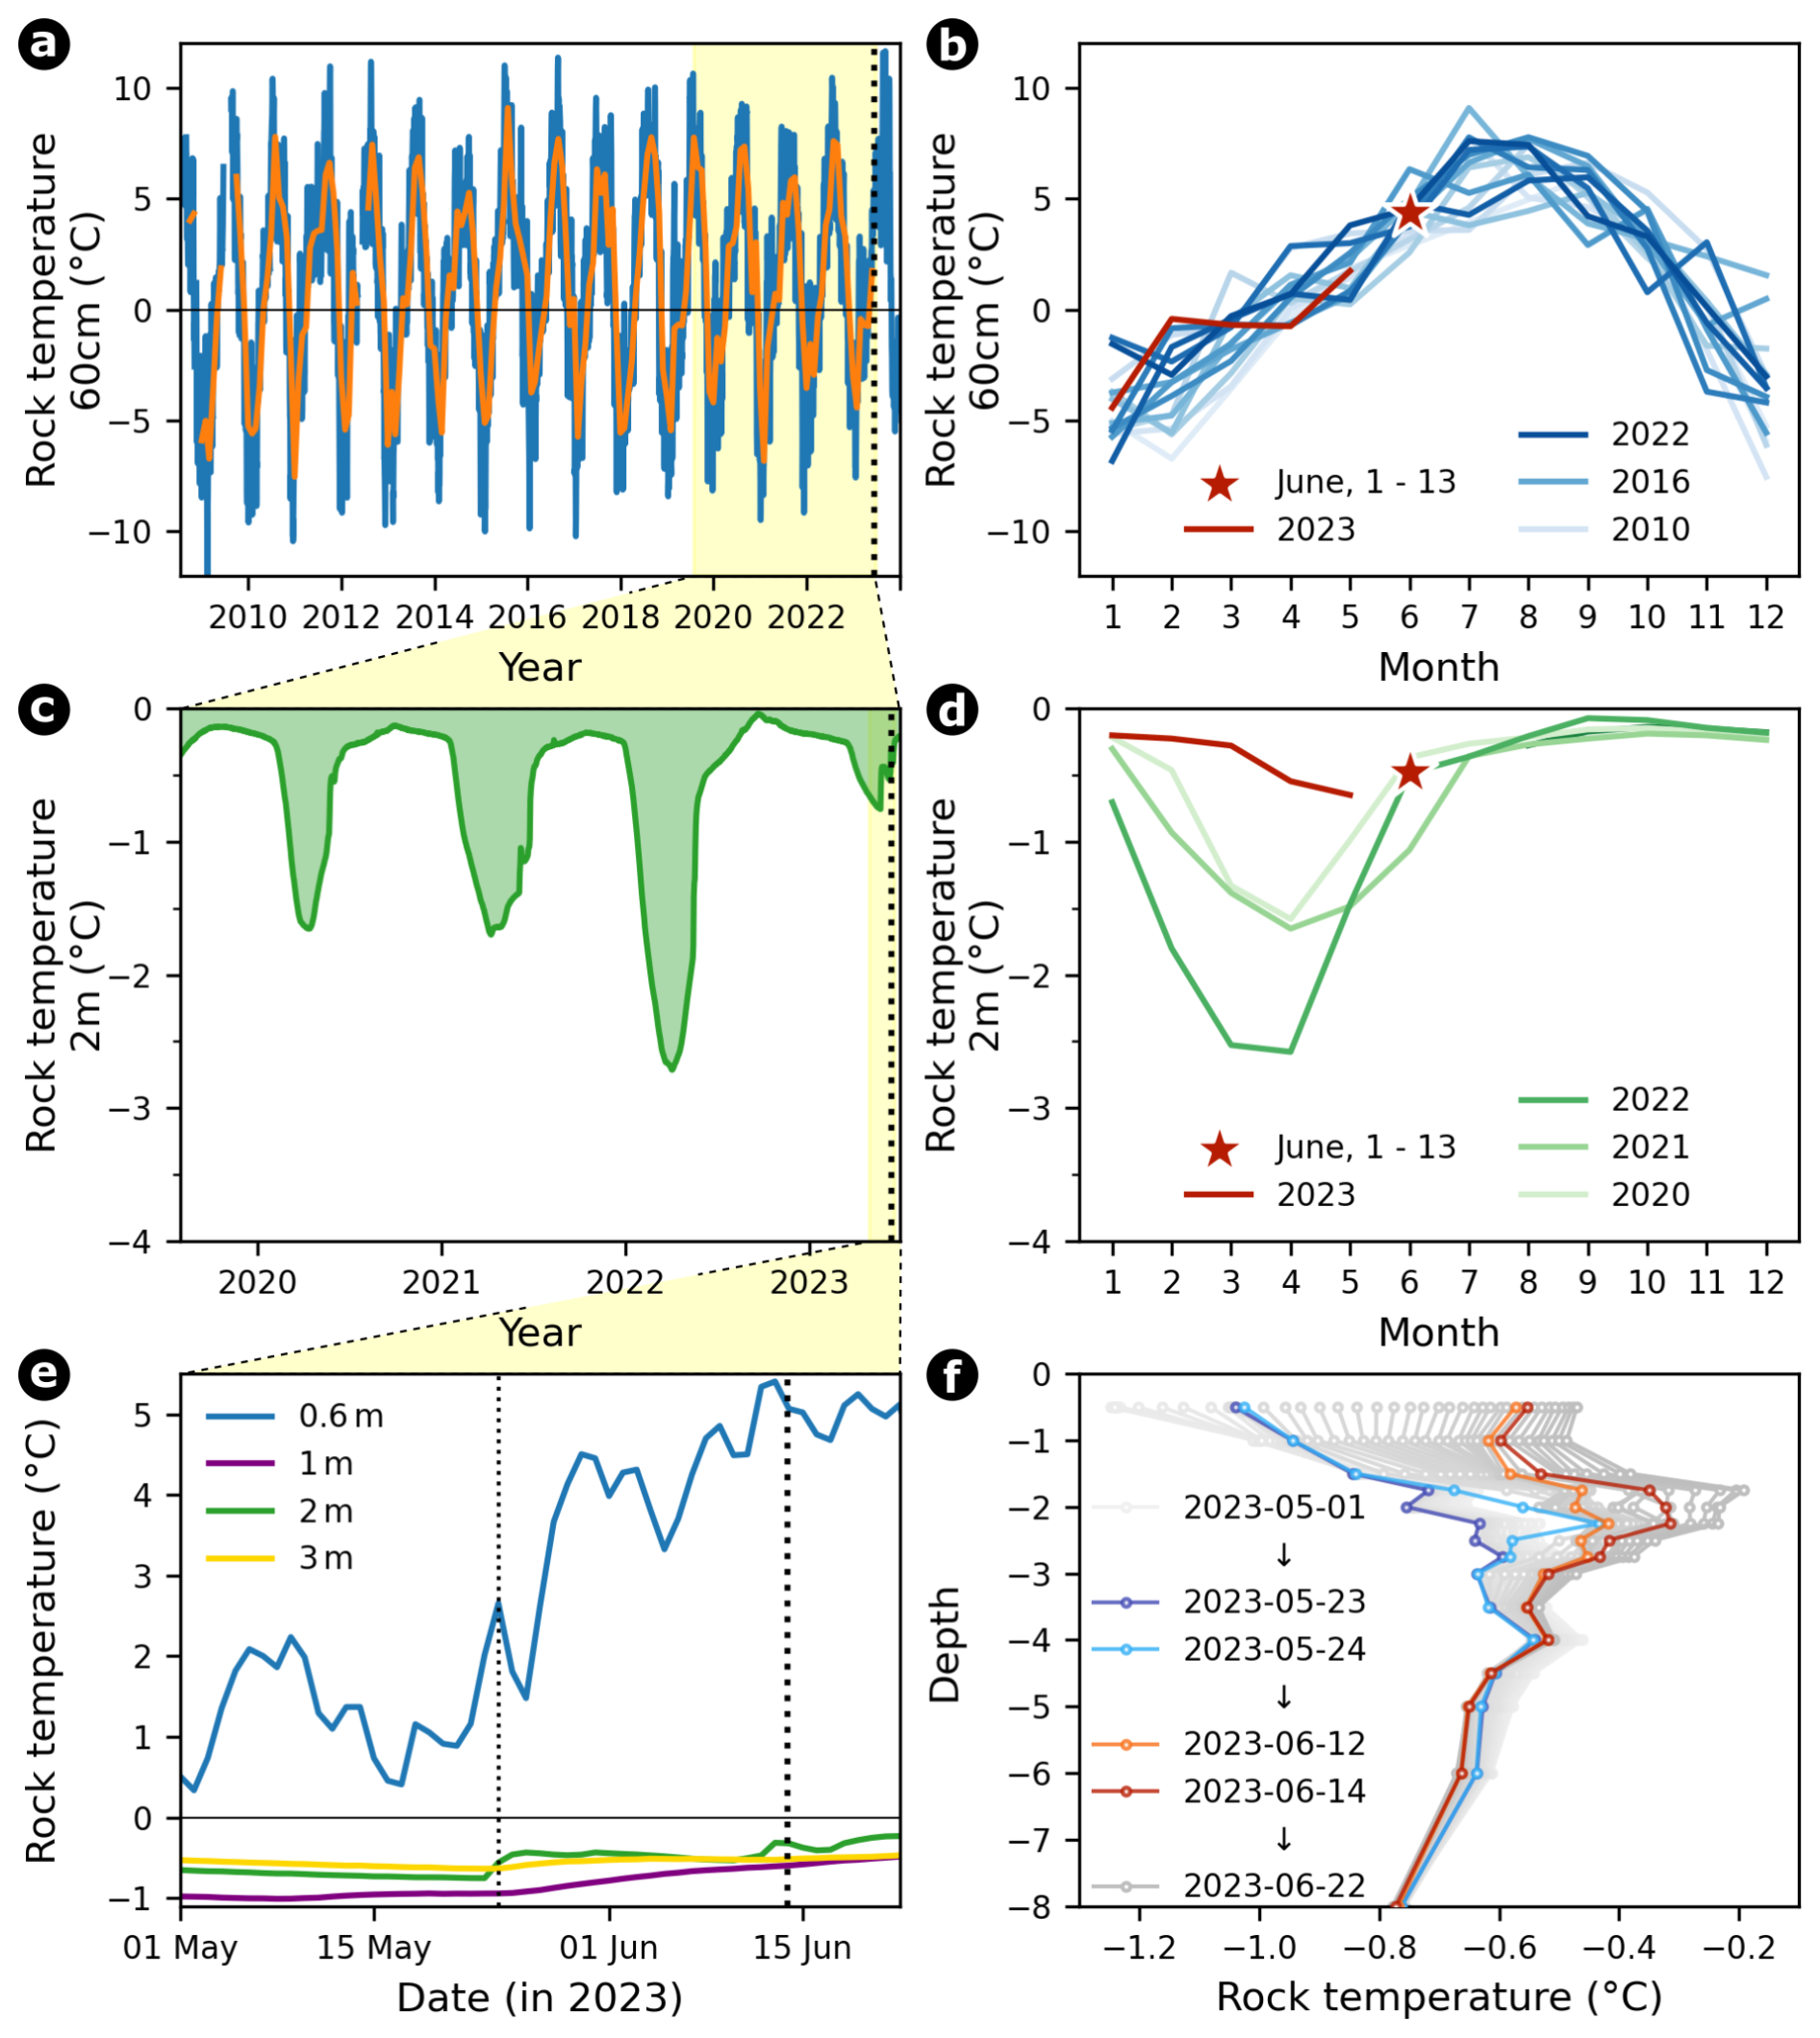
Figure 4Rock temperature at the Matterhorn Hörnli field site (at 60 cm depth, south exposed, position MH10) and next to the Hörnli hut (ranging from 0.5 to 10 m depth, flat, SLF borehole MAT_0311). The left column (a, c, e) shows time series with a daily mean for different time periods and depths/locations: (a) rock temperature at 60 cm depth measured in situ on the ridge with daily mean in blue and a rolling monthly mean in orange, (c) rock temperature at 2 m depth measured in the borehole next to the Hörnli hut, and (e) a zoom-in with rock temperature measured on the ridge (0.6 m) and next to the Hörnli hut (1, 2, and 3 m) from 1 May to 23 June 2023. The complete borehole temperature time series measured next to the Matterhorn Hörnli hut is shown in Fig. S8.
4.1.2 Displacement patterns
The point cloud analysis provides insights into the movement process of the rock pillar. The 3D displacement magnitude between 27 July 2015 and 20 August 2018 increased from bottom to top from about 9 to 20 cm (see Fig. 5), characteristic for toppling as the dominant movement process. The displacement azimuth was uniformly directed towards 140° (SE). Accordingly, the dip angle of the movement was steepest at the southeastern side of the rock pillar (approx. −23 °C) and less inclined on the northwestern side (approx. −13°; see Fig. S4). Extrapolating the top-down decrease in the displacement magnitude and assuming toppling only, zero displacements are reached 8.9 m below the top of the rock pillar. This equals a point about 5 m below the ground surface; the long-term active layer thickness at the Hörnli hut borehole is around 3–5 m.
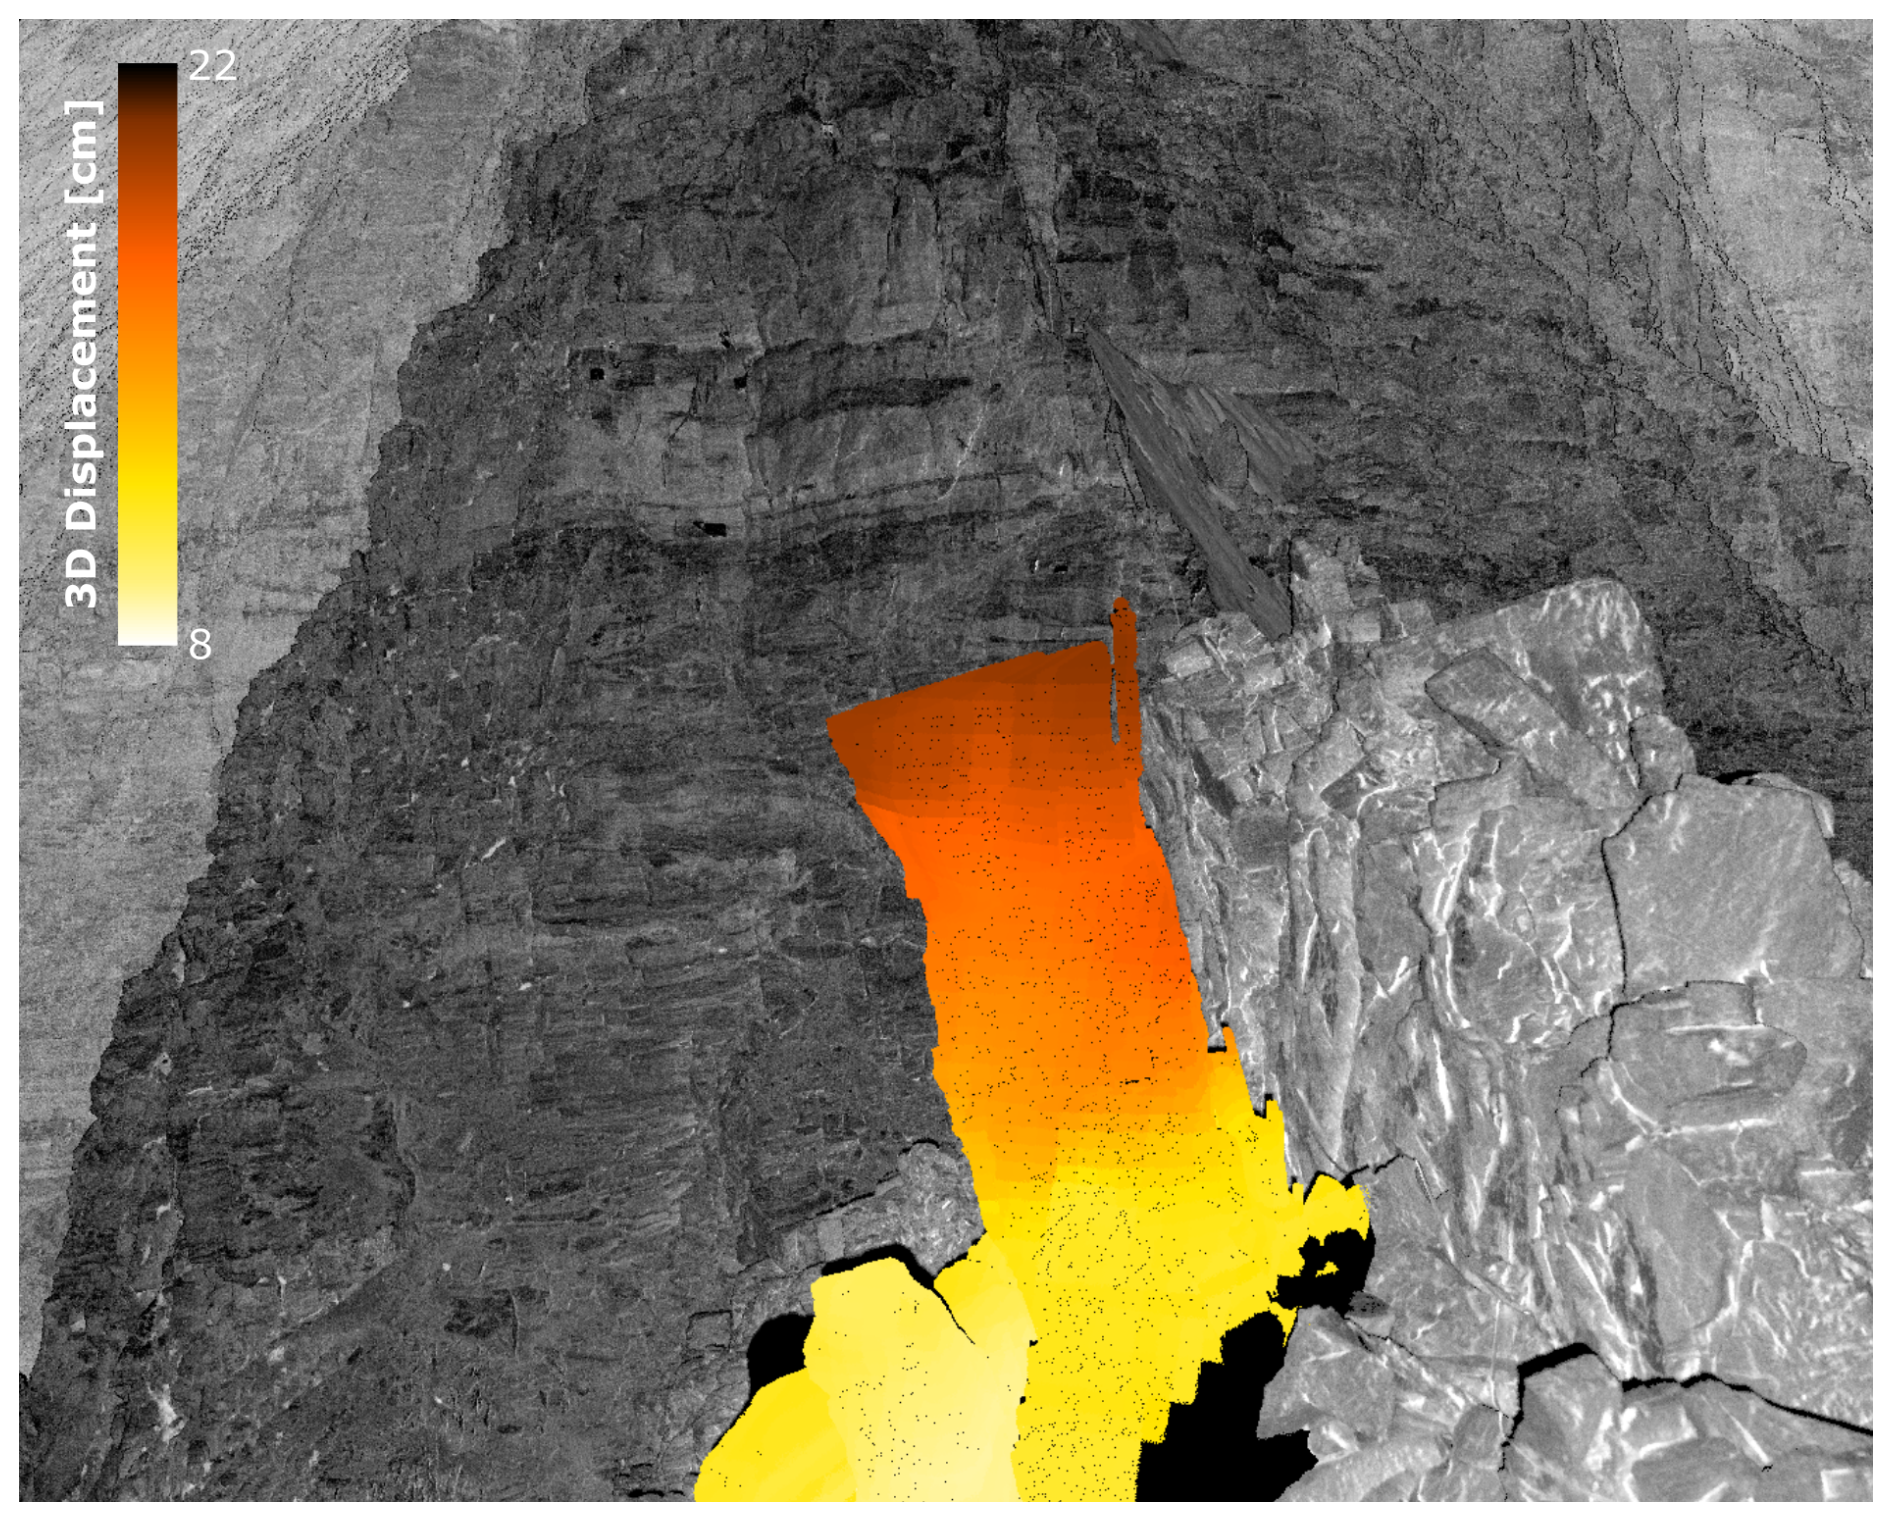
Figure 5Isolated point cloud analysis showing the 3D displacement between the terrestrial laser scans on 27 July 2015 and 20 August 2018 (change in dip angle is shown in Fig. S4). During this period, the GNSS station (deployed at the upper-right corner of the rock pillar) moved by 21 cm relative to the permanently installed TLS mounting plate.
The long-term GNSS tracking data of the pillar show a steady but seasonally accelerated movement in one direction away from the ridgeline. In summer 2022, the signal accelerates by a factor of ∼4x compared to the previous long-term trend (see Fig. 6) until the final failure happens in June 2023. This spontaneous acceleration starting in summer 2022 can be identified by looking at the monthly (see Fig. 6a and b) and annual displacement rates (see Fig. 6c), as well as the rotational rates (see Fig. S5a–d). During the winter deceleration period, the signal amplitude returns to similar levels in the 2 years prior to failure to those during all the years before, suggesting a pronounced seasonality of the acceleration. During the increase in the displacement rates observed in summer 2022, there is no significant change in the direction of the movement (see Fig. 7c and d). Close to the time of collapse, the spatial and rotational components measured by in situ GNSS and MEMS inclinometer show a sudden acceleration starting ∼10 d prior to failure (see Fig. 7b).
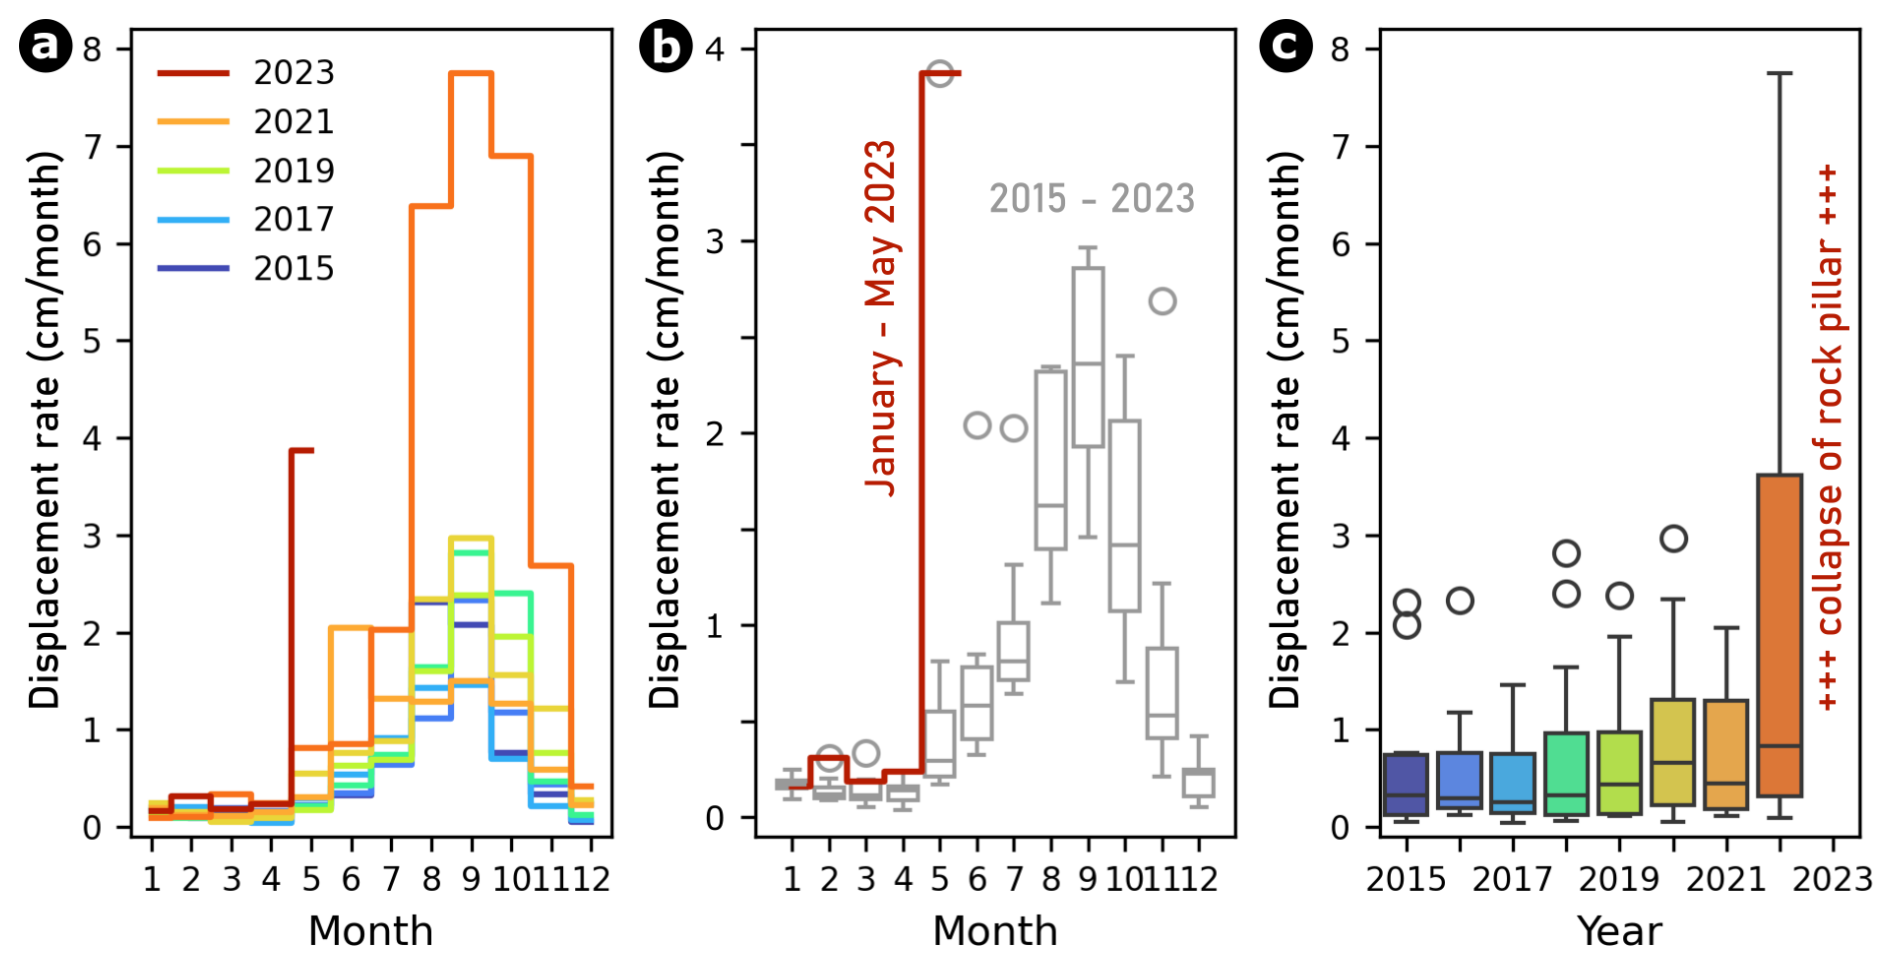
Figure 6Monthly and annual spatial displacement rates of the rock pillar measured with a permanent GNSS station.
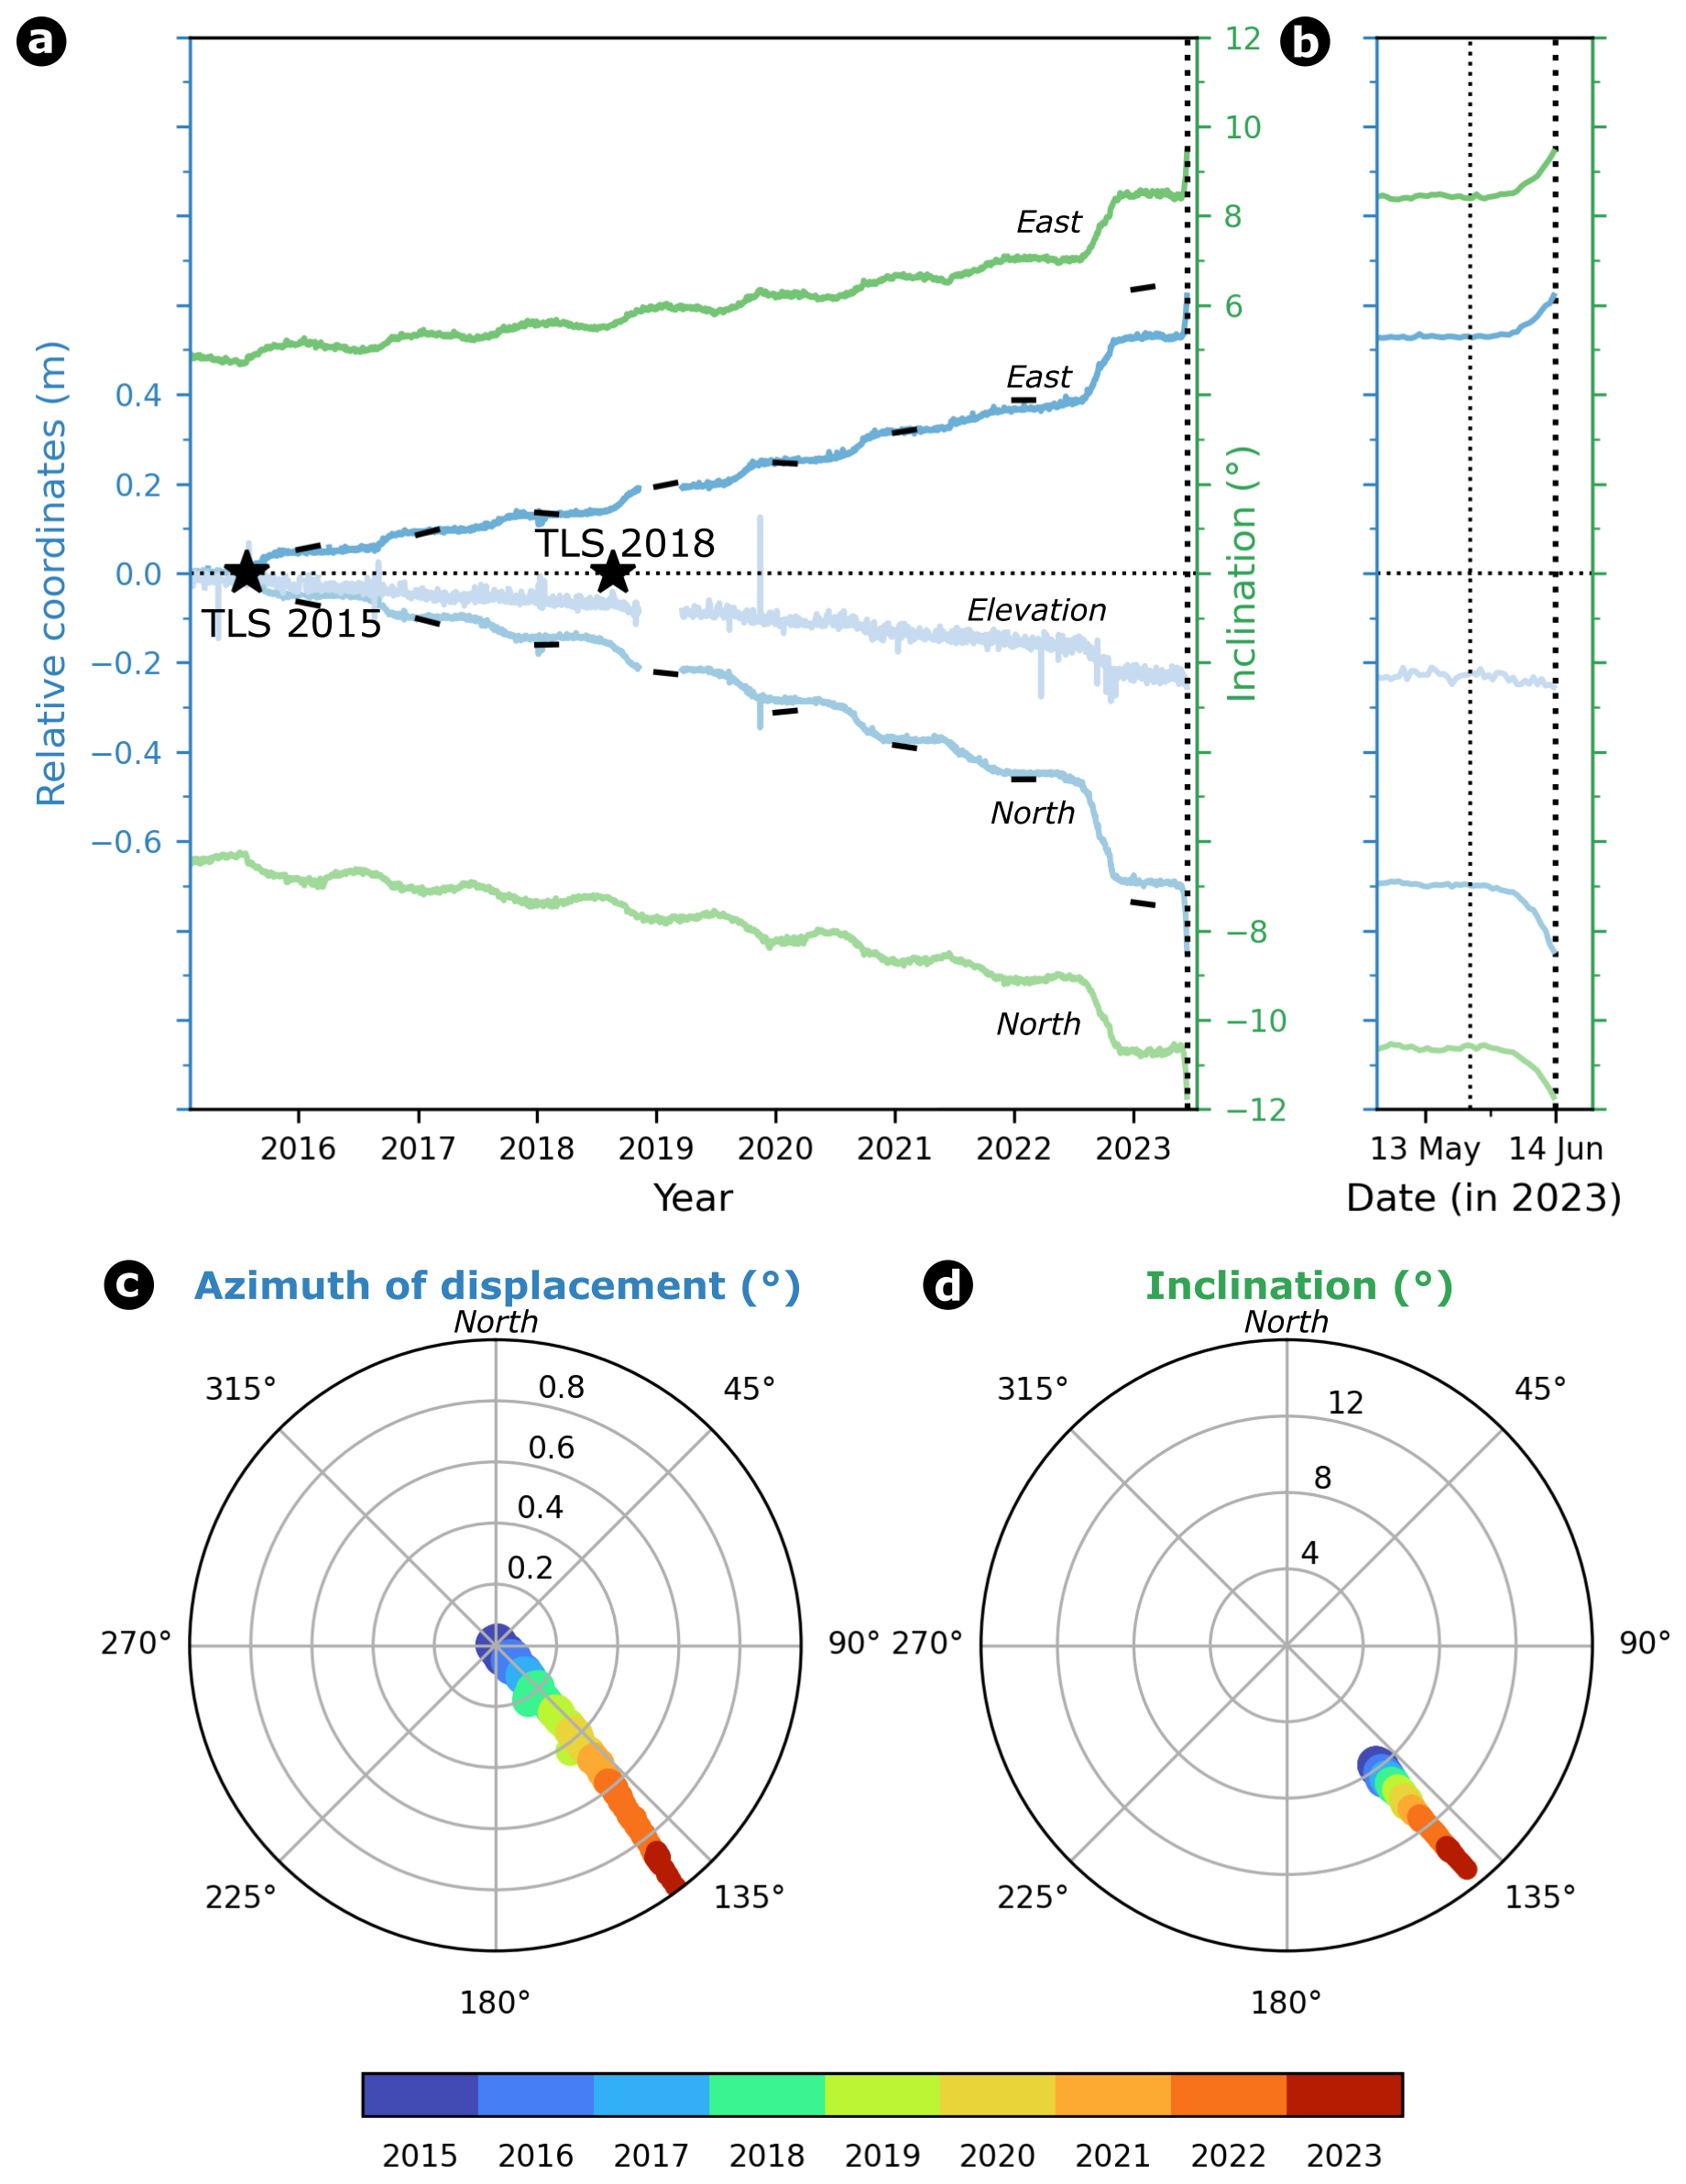
Figure 7Spatial (azimuth; blue) and rotational (inclination; green) displacement time series for the period 2015–2023 (a) and a zoom-in on the period from 1 May to 23 June 2023 (dotted and dashed black lines indicate the estimated onset of water infiltration and the time of the collapse of the rock pillar, respectively), indicating a sudden acceleration starting ∼10 d prior to failure (b). The black lines during the winter months represent the displacements calculated from inclinometer data, assuming a toppling motion of the rock pillar with a tilt radius of 10 m. The measured spatial displacements (north and east) can therefore be fully attributed to this toppling behavior until a change in the kinematic process occurred in 2022. The polar visualization of the (c) spatial and (d) rotational displacements shows a matching direction of movement or tilting.
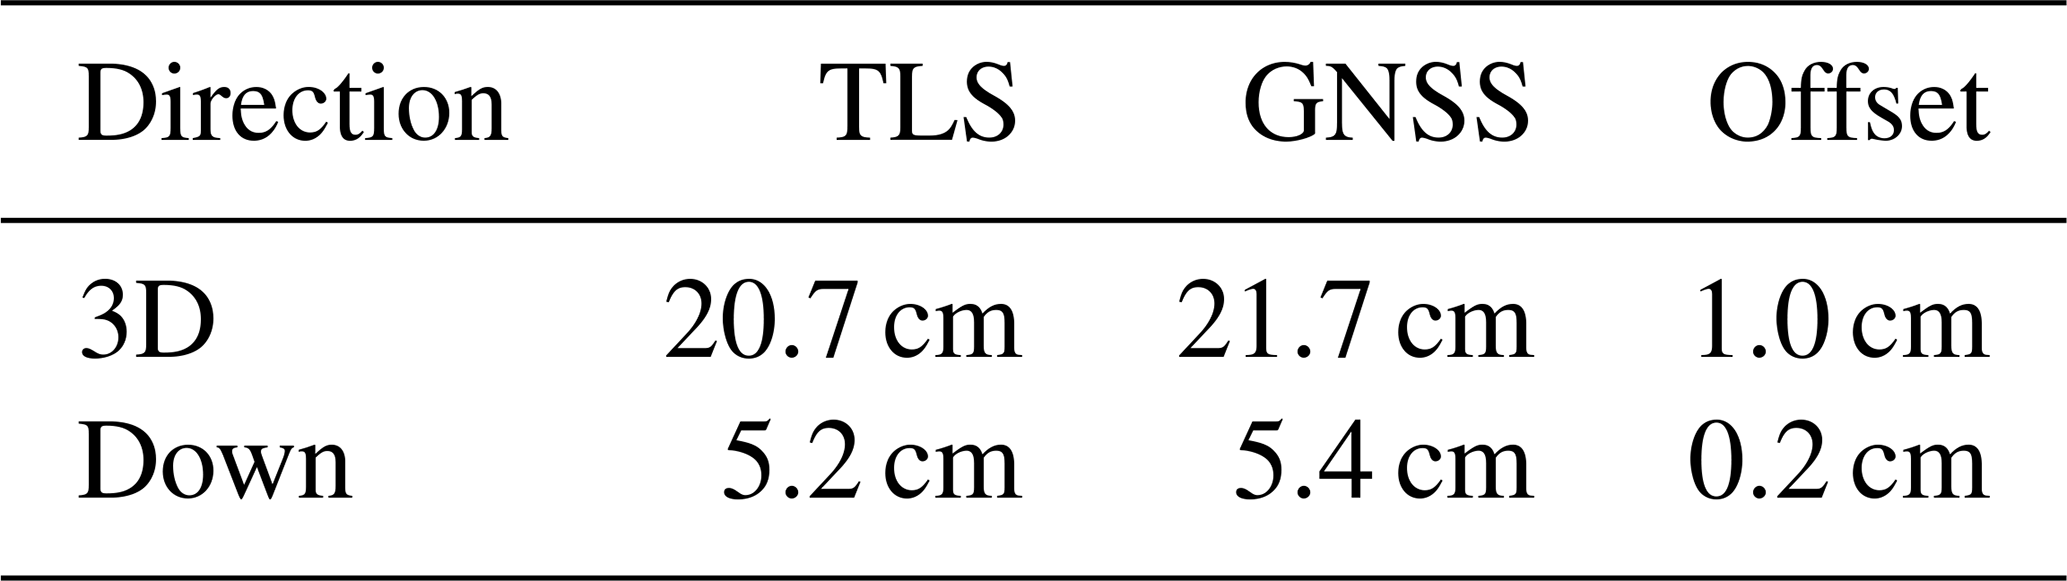
The multi-method dataset and analysis available allow a partial head-to-head comparison of methods: both local terrestrial laser scanning (TLS) and continuous in situ GNSS measurements agree well in capturing the translatory displacements (see Table 1). Assuming an estimated tilt radius of 8.9 m, the rotation derived from TLS is estimated at 1.3° for the time interval between the TLS campaigns, whereas the in situ inclinometer yields 1.22° for the same period.
Table 1Comparison of rock pillar displacement between July 2015 and August 2018 derived from TLS campaigns and continuous GNSS monitoring.
4.1.3 Prospective forecast
The prospective forecast analysis shows an onset of acceleration (OOA) on 2 June and 6 June 2023 for the daily smoothed spatial and hourly rotational displacement data, respectively, with a prediction of failure for 12 June ±1 d and 14 June ±0.5 d, respectively (see Fig. 8). The true time of failure is between these forecasts, on 13 June 2023. Due to stronger fluctuations and short-term data gaps in the inclination data, longer smoothing windows had to be applied for the inclination data than for the GNSS daily position data (Leinauer et al., 2023). However, as the smoothing includes past data, this distorts forecasts towards later expected failure times, which explains the differences between the two forecasts.
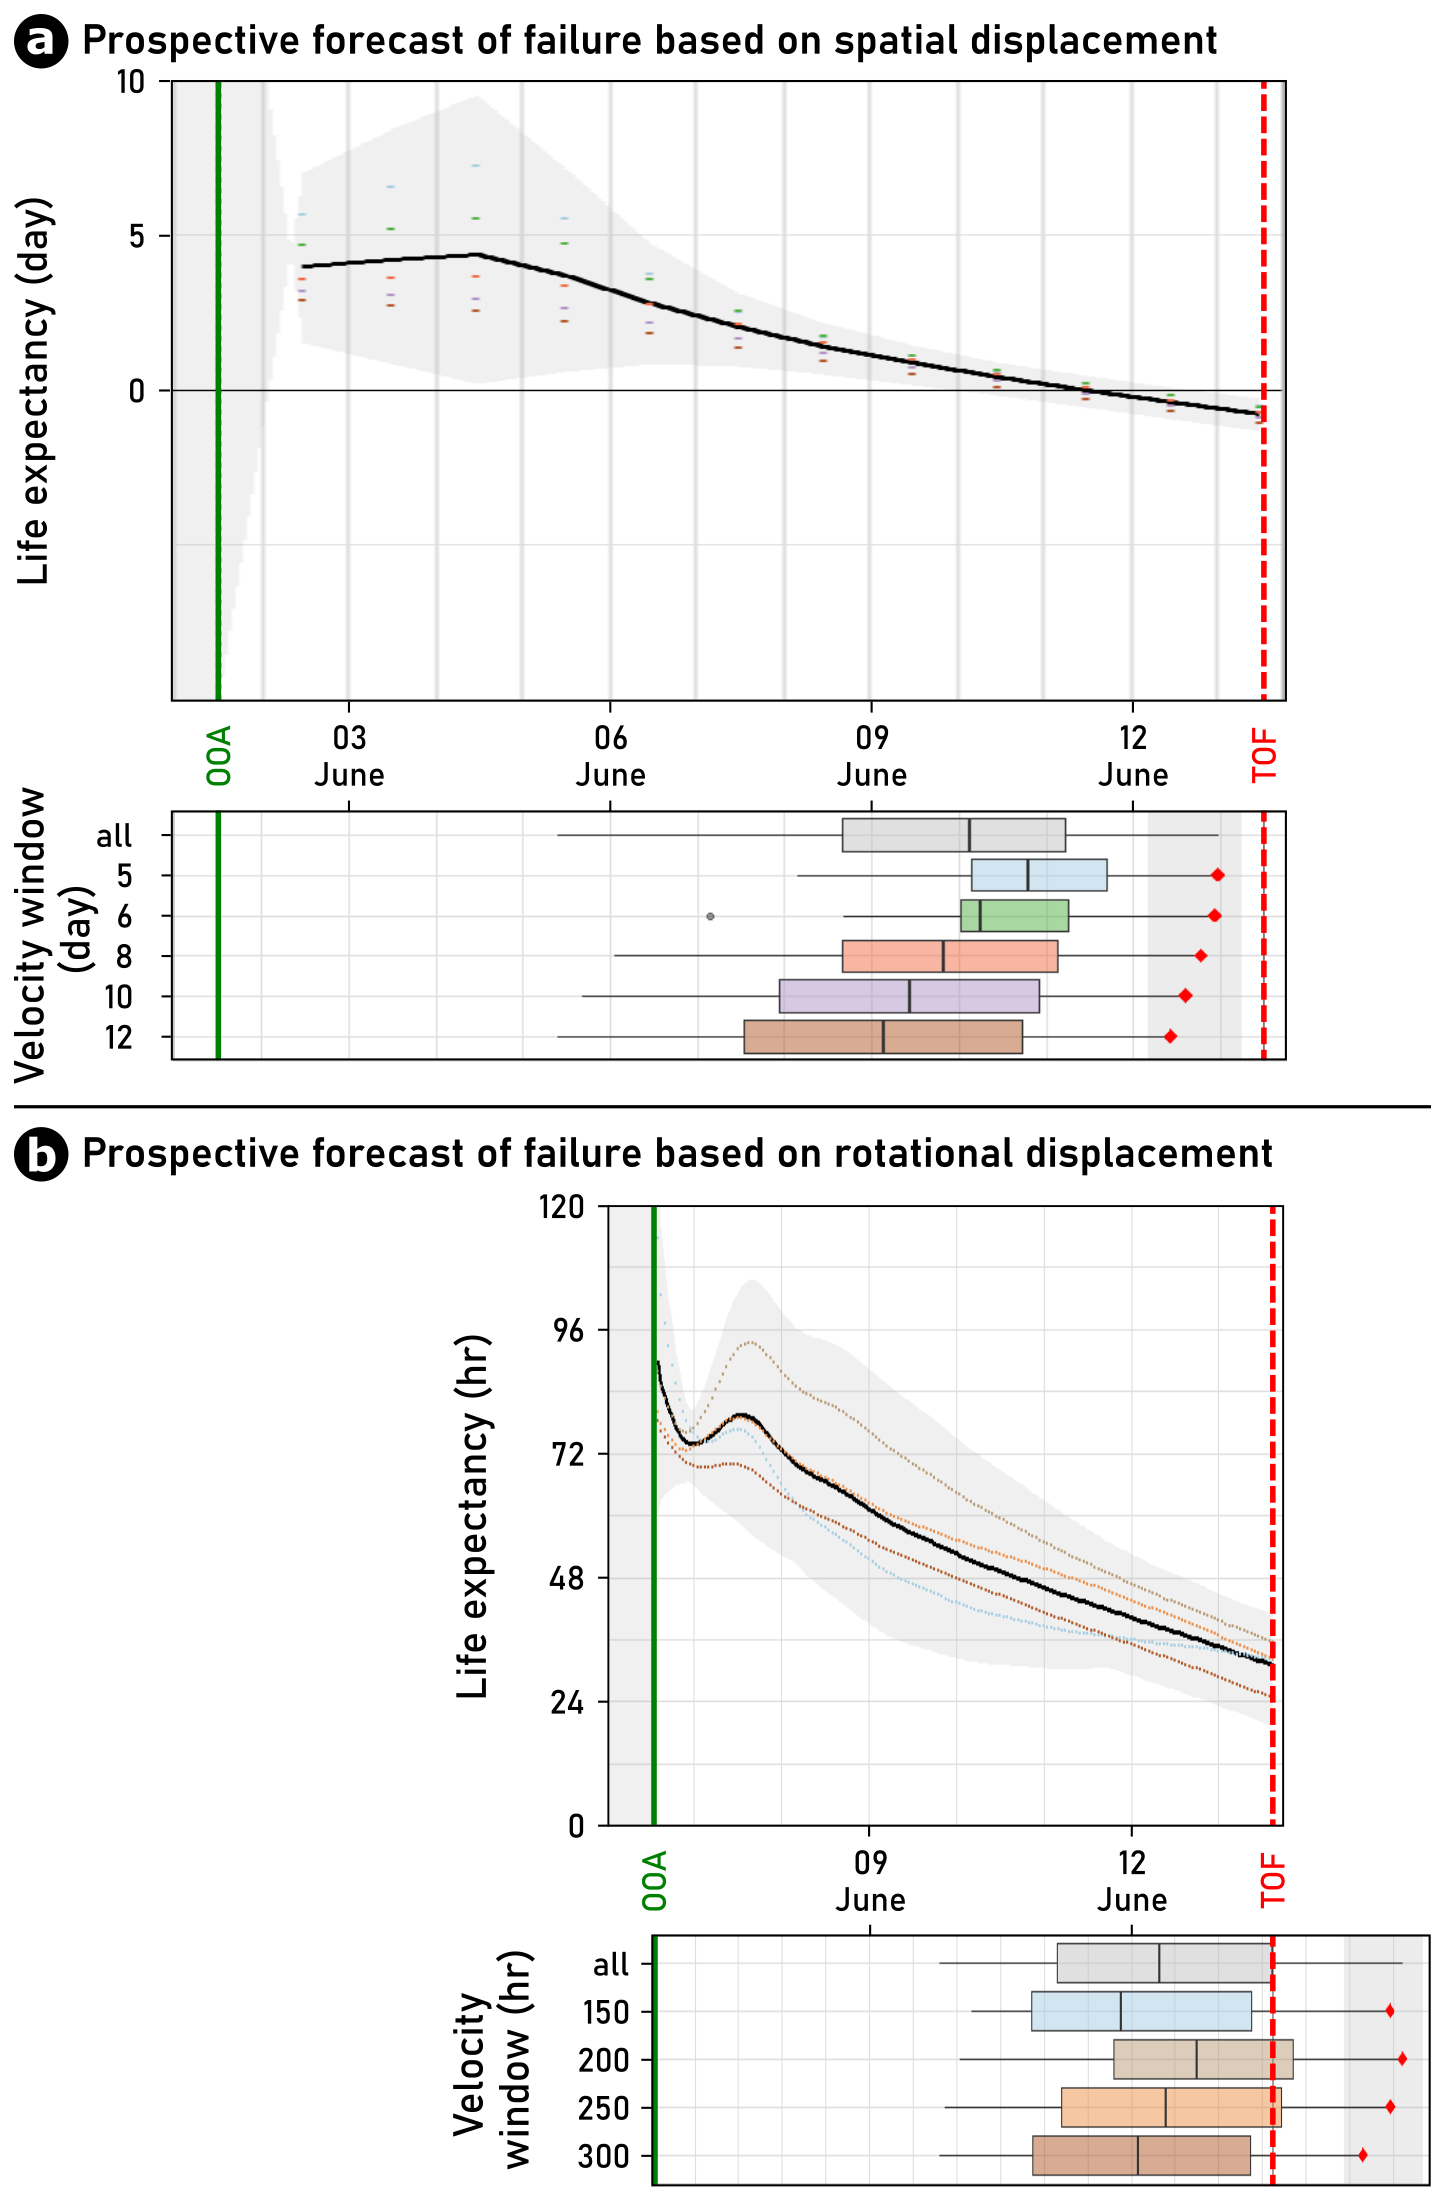
Figure 8Prospective forecast of failure based on (a) spatial and (b) rotational displacement. The onset of acceleration (OOA; green solid line) is detected 12 and 7 d before failure. Colored points mark the life expectancy at the time when the forecast was calculated for each smoothing window length. The black line marks the mean forecast, and the gray area is the forecast uncertainty. The collapse of the rock pillar (time of failure, TOF; dashed red line) is in between forecasts in panels (a) and (b). Boxplots include all forecasts since the OOA per velocity window (colored points in the life expectancy plot in panel (a) indicating estimated time of failure), with the median as a black vertical line, the interquartile as a box, and 1.5 times the interquartile range of the minimum or maximum data point as whiskers, while the red diamonds date to the latest forecast.
4.1.4 Ambient seismic energy and noise
The seismometer stations provide information on ground motion variability. Based on ambient seismic noise data exhibiting typical diurnal fluctuations, we could detect a distinct increase in the lower noise level (5 % percentile over the last 24 h) with lead time to failure of 9 d in the frequency bands 2–4 Hz (see Fig. 9a) and 20–80 Hz (see Fig. 9c), although the increase persists for a shorter time in the 5–20 Hz frequency band (see Fig. 9b). Further short-term increased energy levels of this type were already observed from 5–7 June. Noise cross-correlation analysis (see Fig. 10a) yielded a stable correlogram with 30 min resolution. Its conversion to relative seismic wave velocity change (; see Fig. 10b) shows a systematic increase in velocity from the start of the studied time period until a few days before the failure of the rock pillar. In that time span, there was a 6 % increase in wave velocity that graded into a progressive, ongoing decline by about 5 % in the last 1.5 d before the failure. Superimposed on the overall trends are shorter fluctuations with a smaller amplitude (3 %–4 %) and wavelengths of about 2 d. Coherence values reach typical values above 0.8 throughout the analyzed time period (see Fig. 10c).
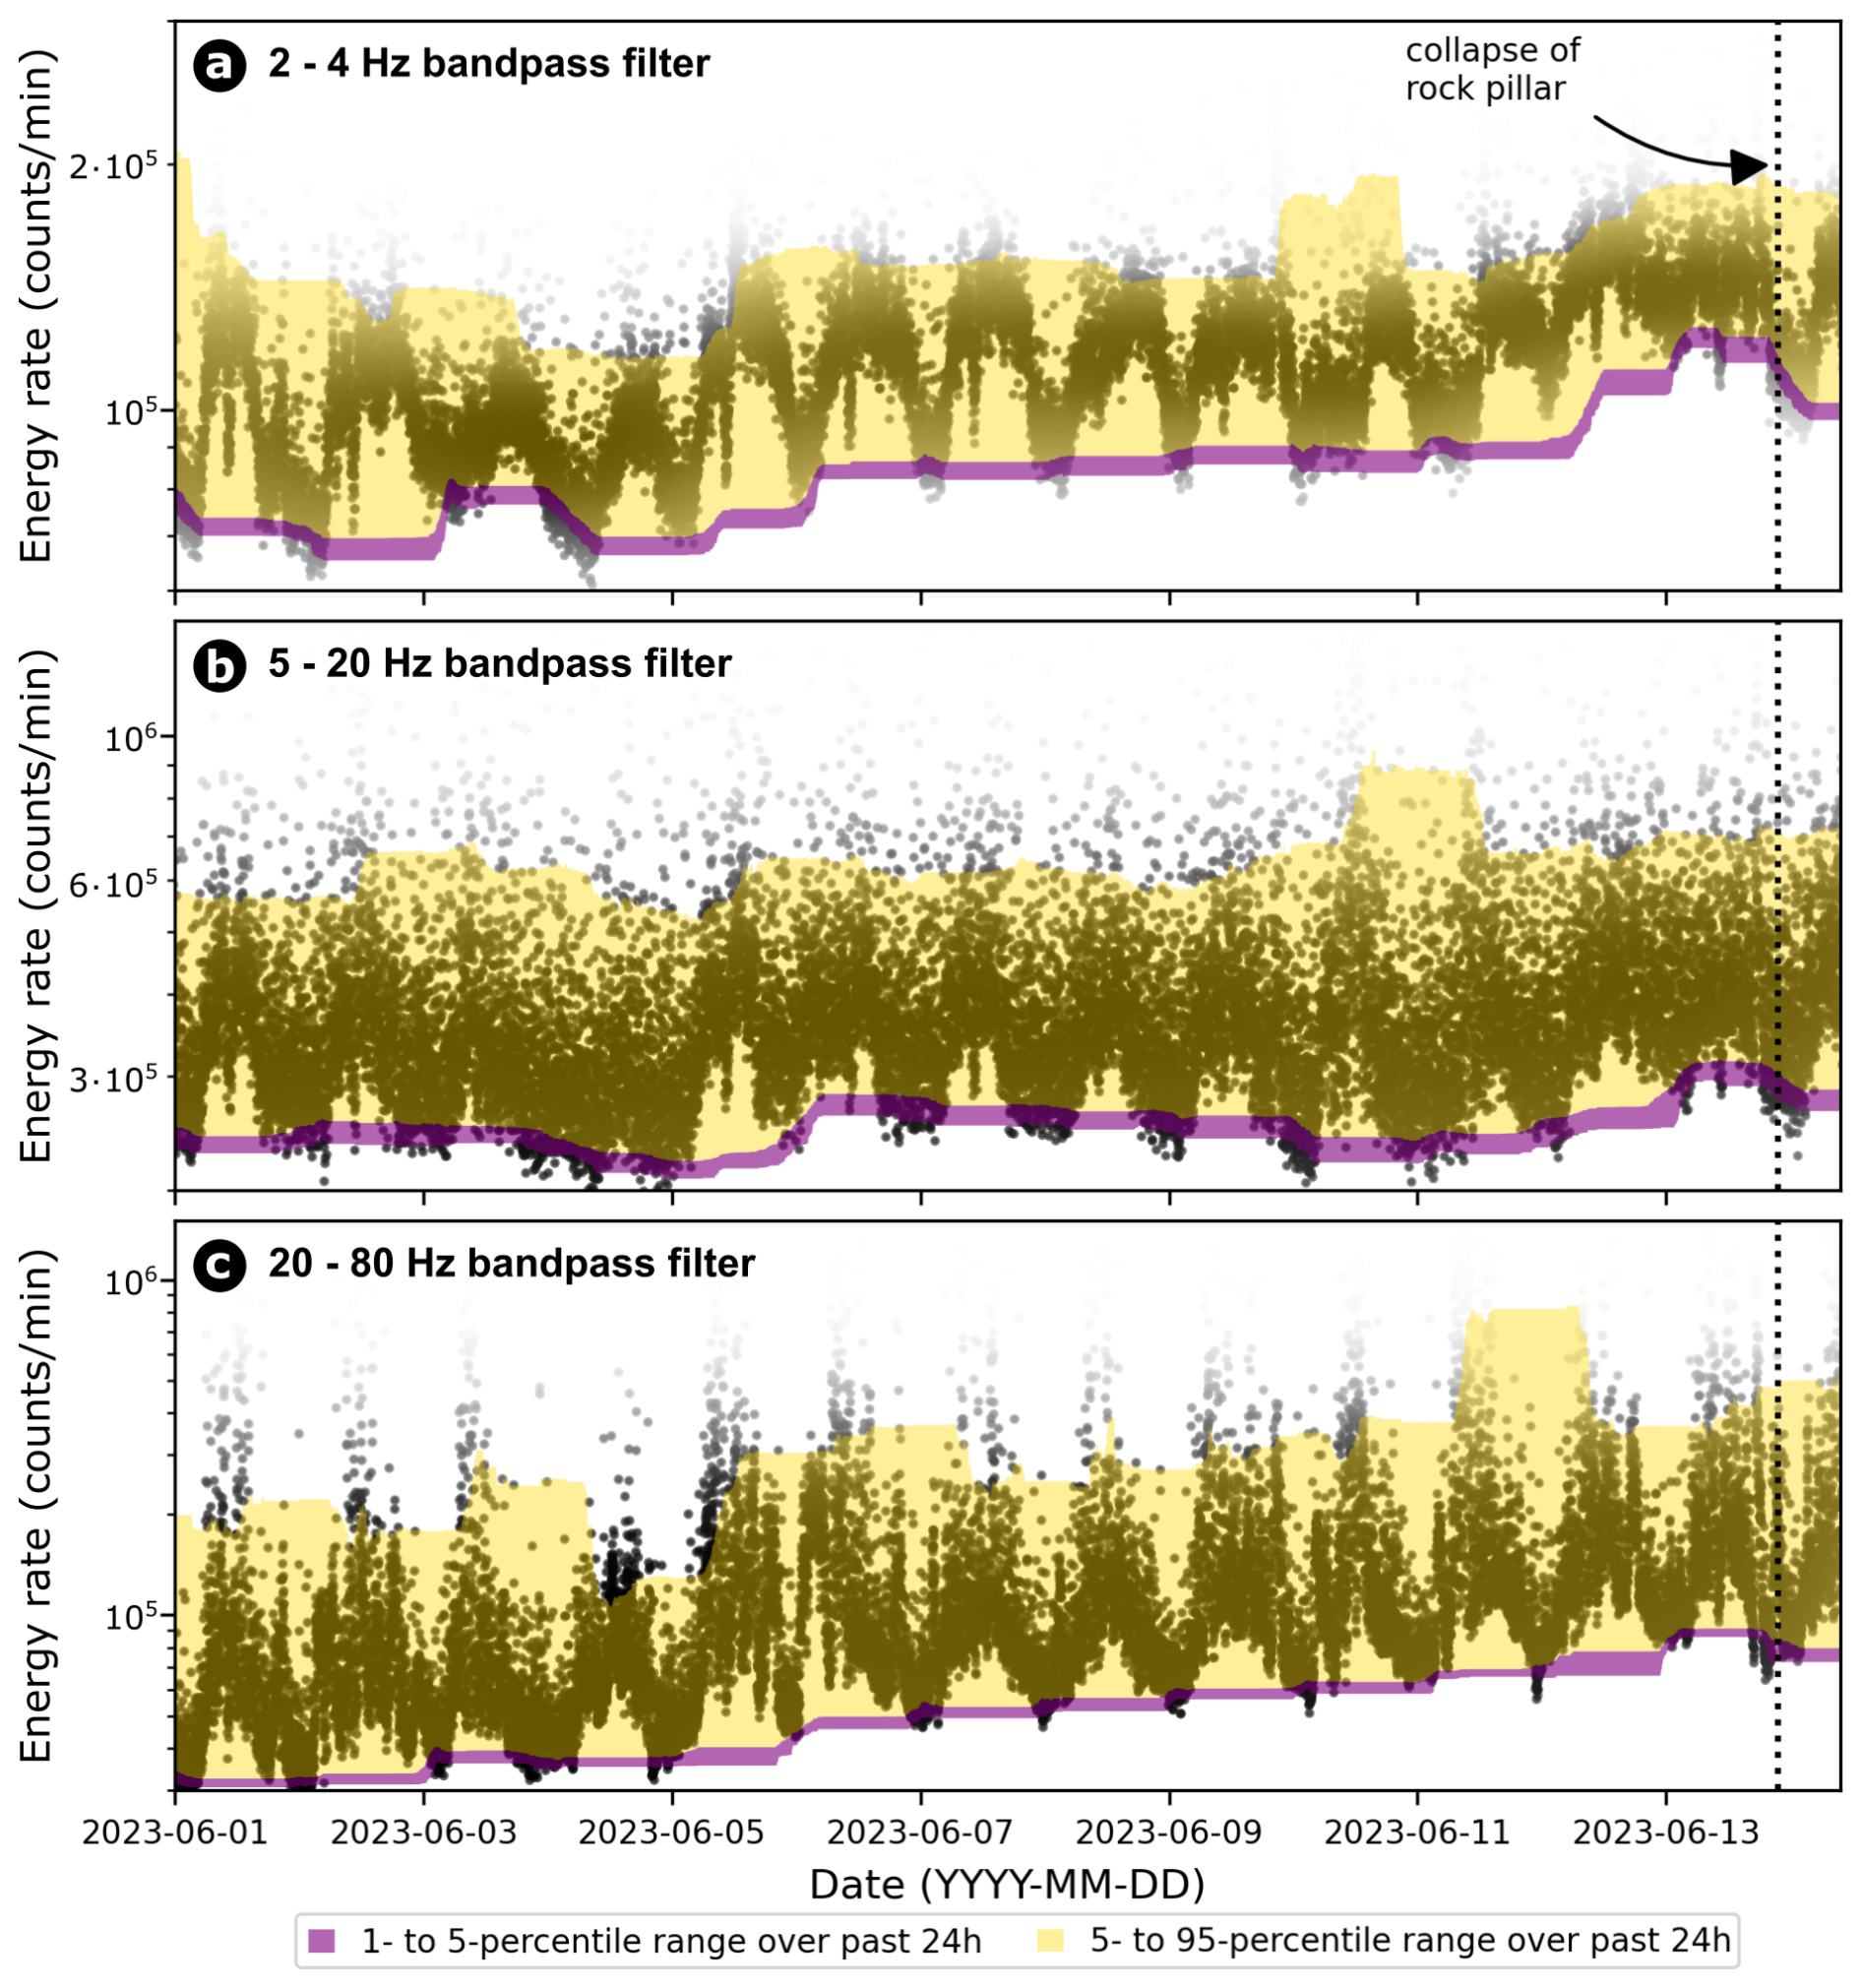
Figure 9Evolution of seismic energy (logarithmic scale) prior to the collapse at the closest seismometer station (MH44; Fig. 1) in the frequency bands (a) 2–4 Hz, (b) 5–20 Hz, and (c) 20–80 Hz. The saturation of dots represents the kernel density estimation based on Gaussian kernels; an increasing baseline of the energy level appears towards failure.
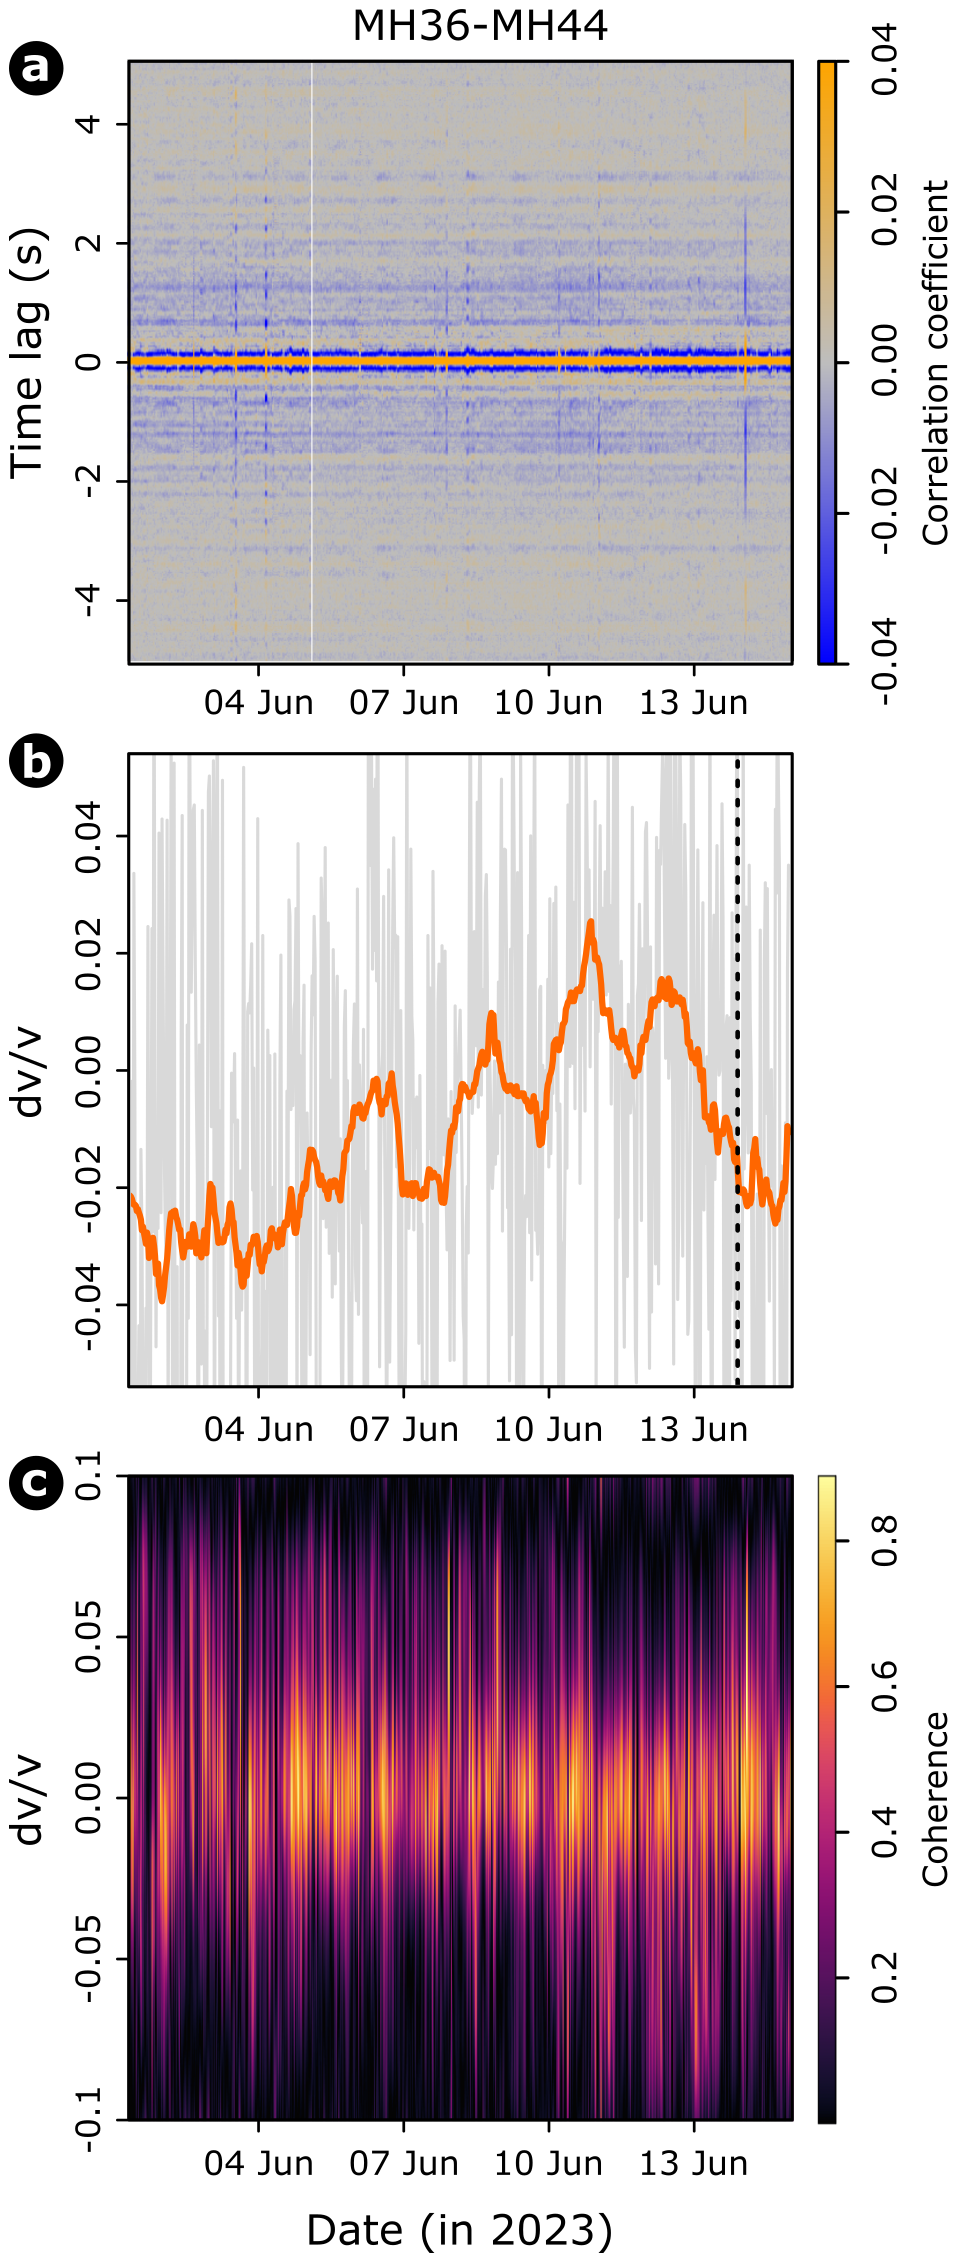
Figure 10Seismic noise cross-correlation analysis. (a) Correlogram of average cross-correlations across all seismic components for the station pair MH36–MH44. (b) Raw 30 min resolved (gray lines) and 24 h running average time series (orange line) of values. The dashed black line marks the occurrence of the rock pillar collapse. (c) Raw, unsmoothed coherence plot of correlation functions and master trace.
4.1.5 Seismic precursors and response
In the period from 1 to 15 June 2023, seismic event detection yielded a total of 15 916 events that were jointly recorded by all three stations. After manually removing erroneous events, a total of 14 339 signals remained, which, according to their signal properties and spatial heterogeneity (cf. Dietze et al., 2017; Cook and Dietze, 2022), represent slope activity and fracturing of rock or ice rather than regional earthquakes, anthropogenic activity, or other uninterpretable seismic activity. The remaining events showed a log-normal distribution of their duration (see Fig. 11a), where the dominant portion lasted about 0.5 to 10 s and is followed by a long-duration tail. We discriminated those two groups by symmetrically extending the duration range below the primary mode of the empirical distribution (2.1 s) until 99 % of the area was reached, which was achieved at the interval 0.5–9.0 s. Hence, we set the breakpoint between short and long events at 9.0 s. The two event clusters (see Fig. 11d and e for representative examples) show clear differences in amplitudes between the seismic stations, with the highest ground velocities at the station close to the rock pillar, and they lack distinct P- and S-wave arrival times. The waveforms of those two groups revealed that the short events are almost exclusively short bursts of seismic energy typical for rock bridge failures or ice cracking (Weber et al., 2018a; Dietze et al., 2021). When plotting the evolution of the two groups of events with time (see Fig. 11b), two distinct patterns occur. The short events reach a short-term maximum rate around 4 June, followed by a second rise until 1–2 d before the collapse of the rock pillar. The long events, typical for small mass-wasting events and their trajectories within the detection range of the seismometer stations, show an overall declining trend from 4 June onwards, which is disturbed by a maximum activity rate around 10 June and an activity minimum during the failure of the rock pillar. The discrimination of the two groups based on event duration becomes even clearer in the diurnal activity patterns (see Fig. 11c). The short events happen predominantly at night, whereas the long events predominantly happen during daytime hours.
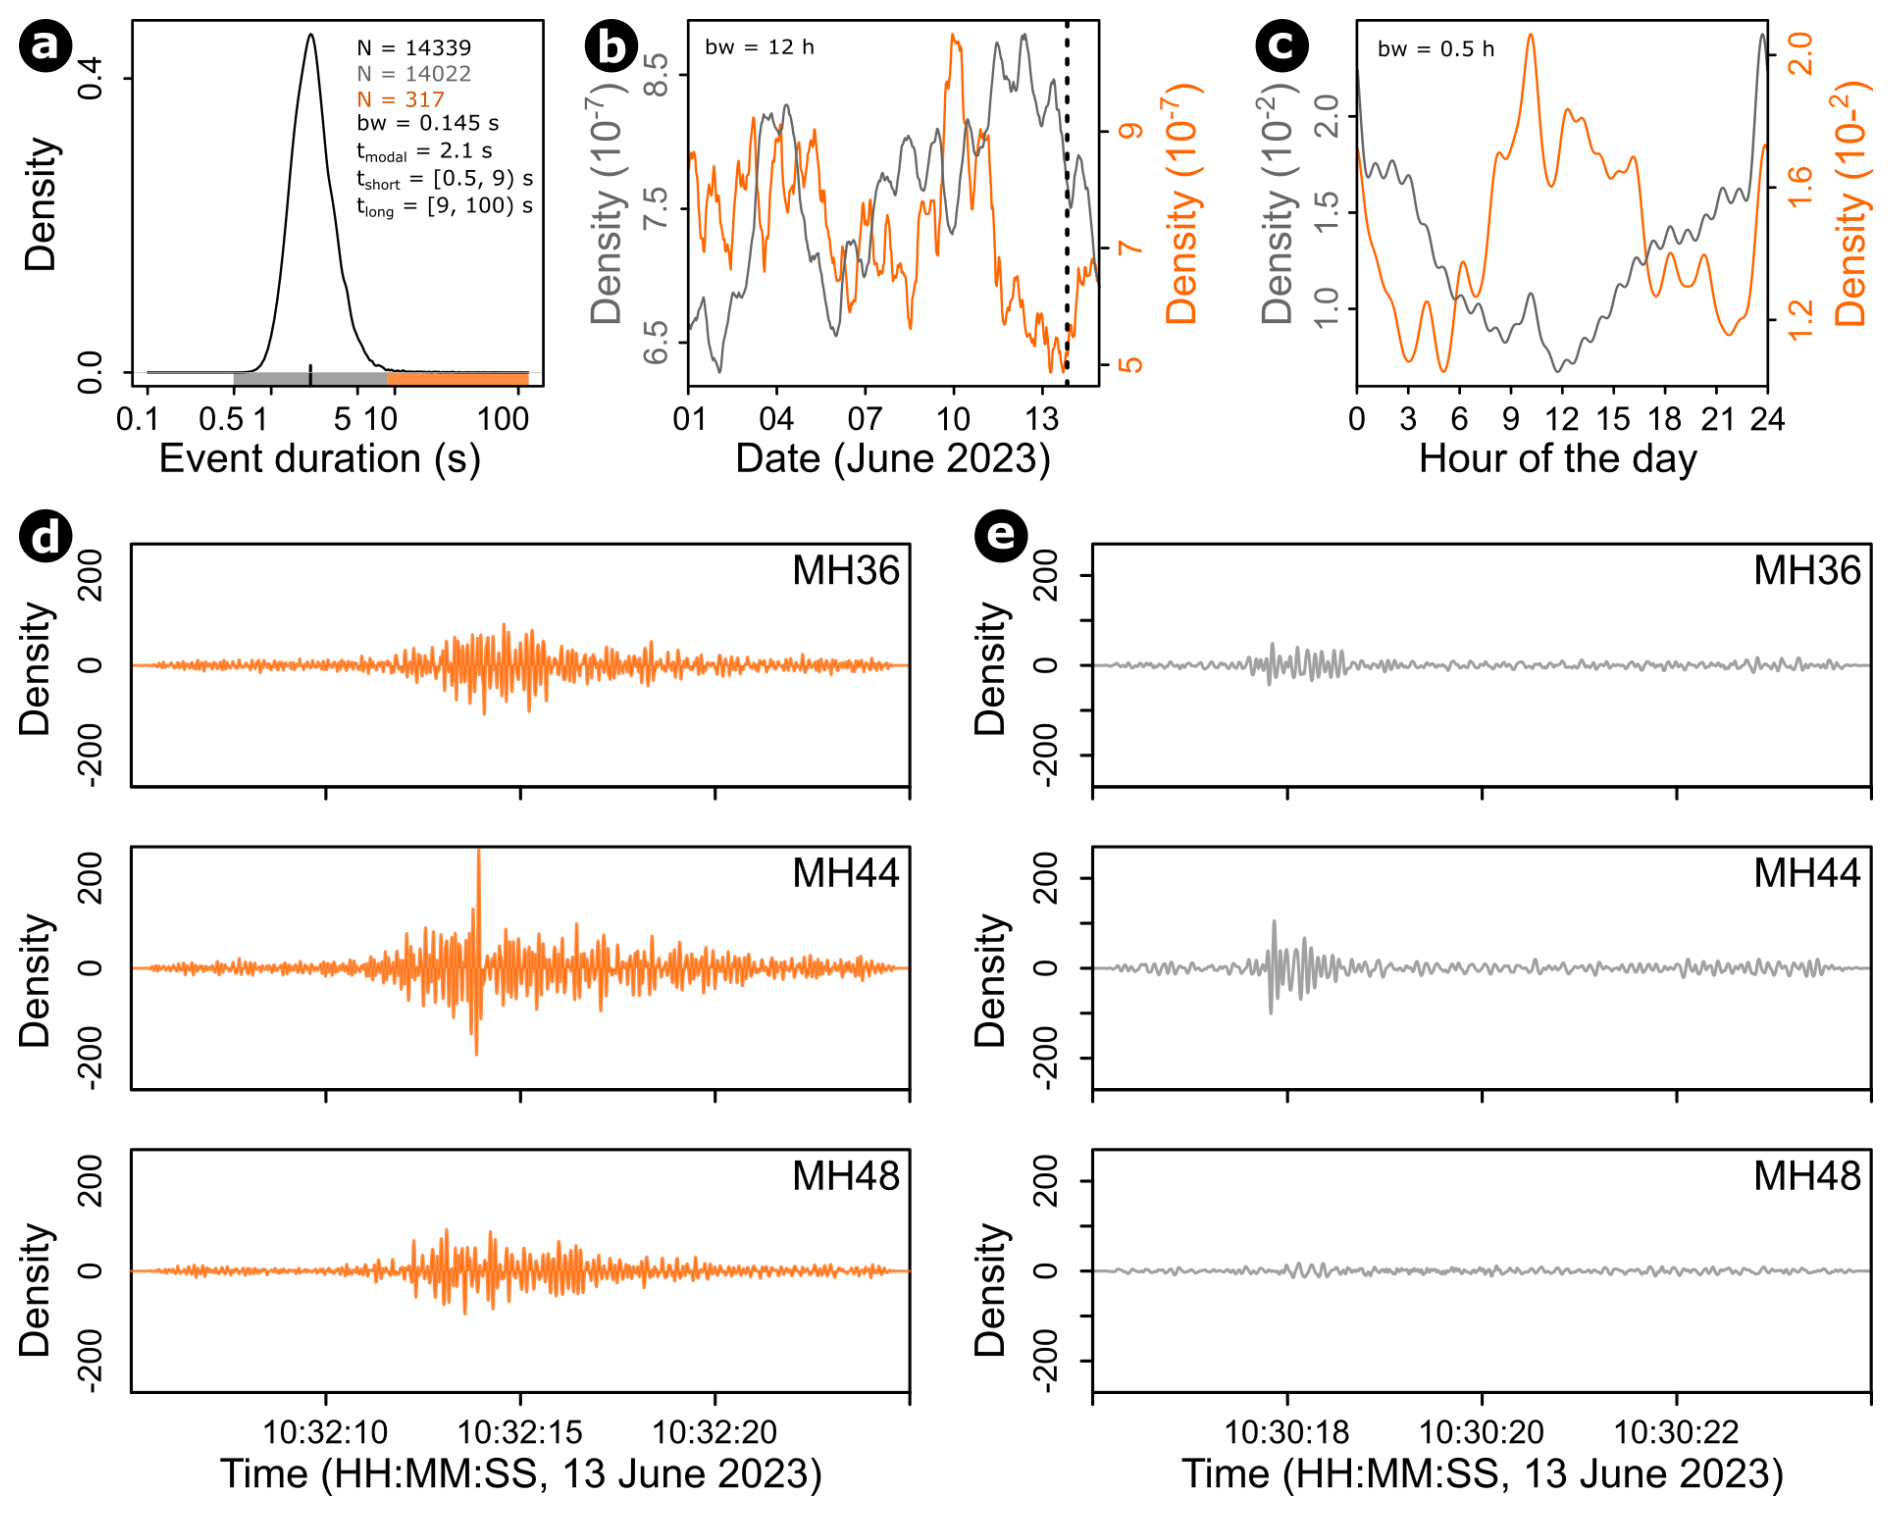
Figure 11Temporal emergence patterns of seismically detected events, depicted as kernel density estimate plots. (a) Duration of STA-LTA-picked events with basic statistic characteristics, kernel bandwidth = bw, number of cases by color. The gray bar indicates “short events”, and the orange bar shows “long events”. (b) Event density curves for the studied time period, with colors as in panel (a). The dashed gray line indicates the time of collapse for the main rock pillar. (c) Occurrence of events at the diurnal scale, with colors as in panel (a). Example waveforms of a long (d, orange) and a short (e, gray) event, recorded by the three seismometer stations (MH36, MH44, and MH48) and filtered 5–20 Hz.
The seismic response to the impact of the falling rock pillar is clearly visible at all three seismometer stations at a distance of just under 10, around 30, and over 800 m in both the time and frequency domains (see Fig. 12a–c). The energy estimate over time derived from the Hilbert envelope amplitude allows us to track the energy released by the impacting rock for 23 s, followed by an elevated seismic noise level lasting over 1 min. The comparison of all three stations confirms this duration of measurable energy due to the repeated impact of the falling rock mass in the steep underlying slope.
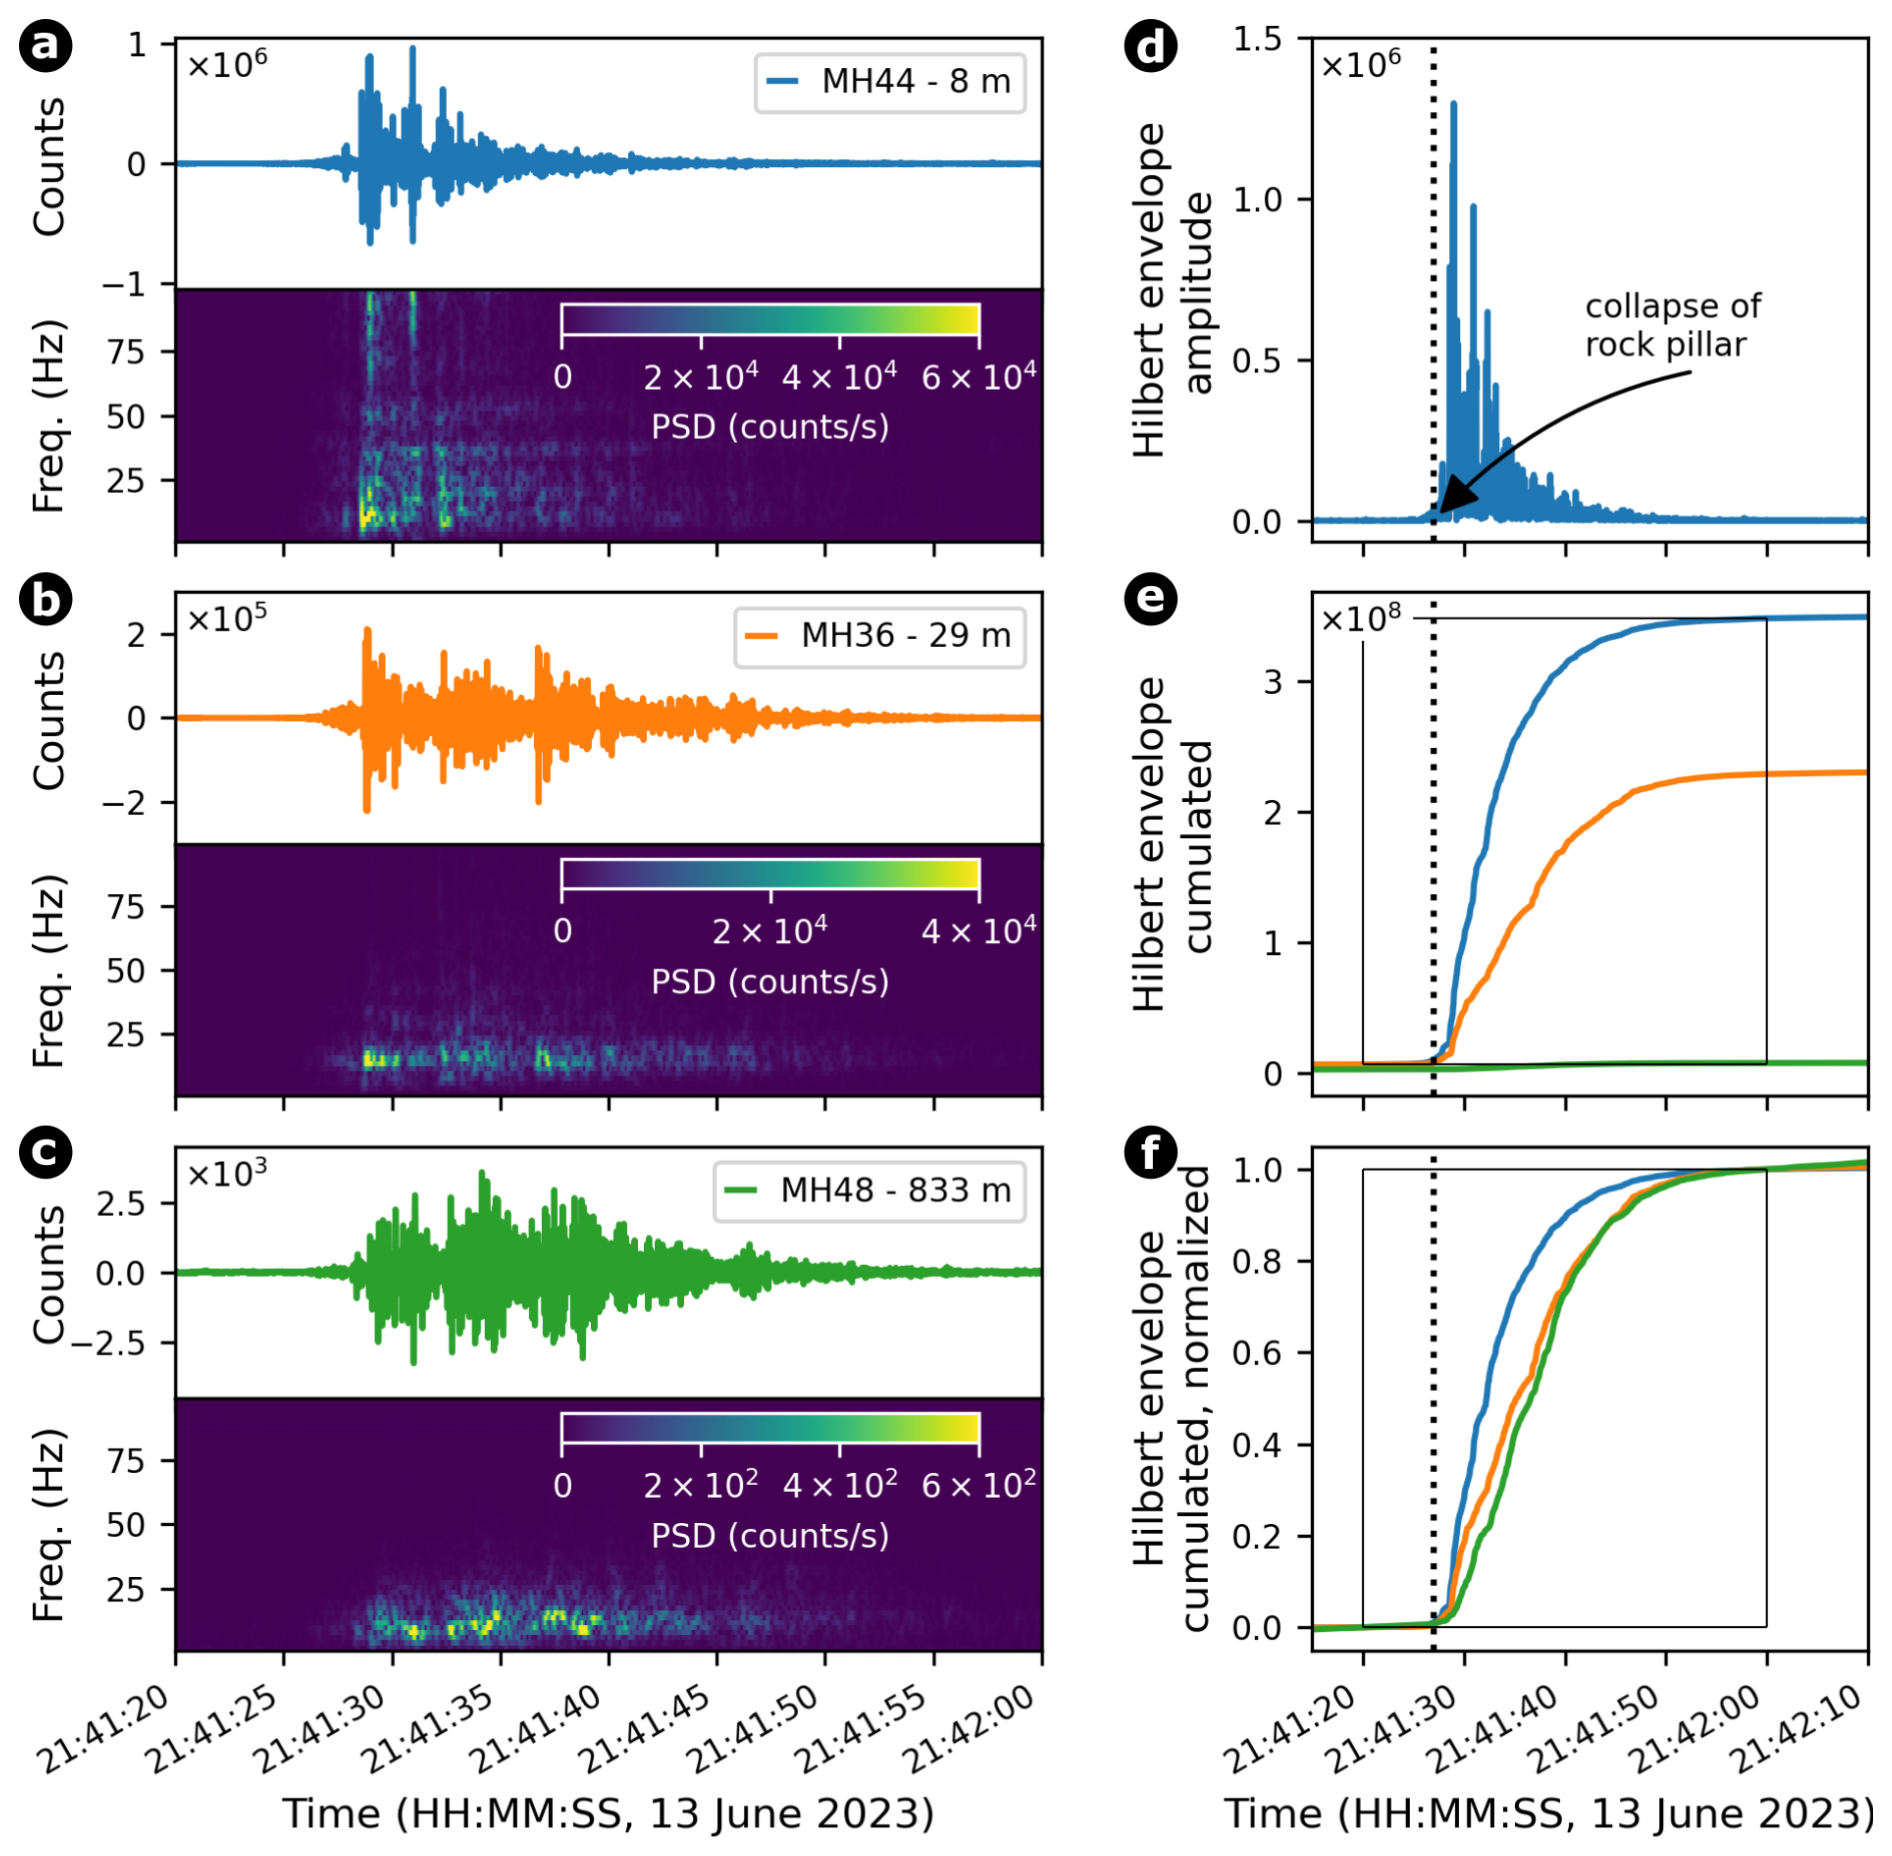
Figure 12Seismic response to the impact of the collapsing rock pillar (dotted black line): (a–c) waveform and spectrogram and (d–f) energy estimate based on the Hilbert envelope for the northern component of the three seismometer stations, MH44 (blue), MH36 (orange), and MH48 (green).
4.2 Laboratory-inferred friction angle
The laboratory experiments show significantly increased shear strengths for frozen fractures compared to unfrozen ones for both tested degrees of water saturation (see Fig. 13). The estimated friction angles for the different conditions under the simplified assumption that the cohesion in the Mohr–Coulomb theory is equal to 0 are shown in Fig. 13. Note that, according to the Mohr–Coulomb diagram, neglecting cohesion can lead to a potential underestimation of shear strength at small volumes (less than 7–8 m overburden, corresponding to a normal stress level of <200 kPa) and an overestimation at big volumes (more than 7–8 m overburden, corresponding to a normal stress level of >200 kPa).
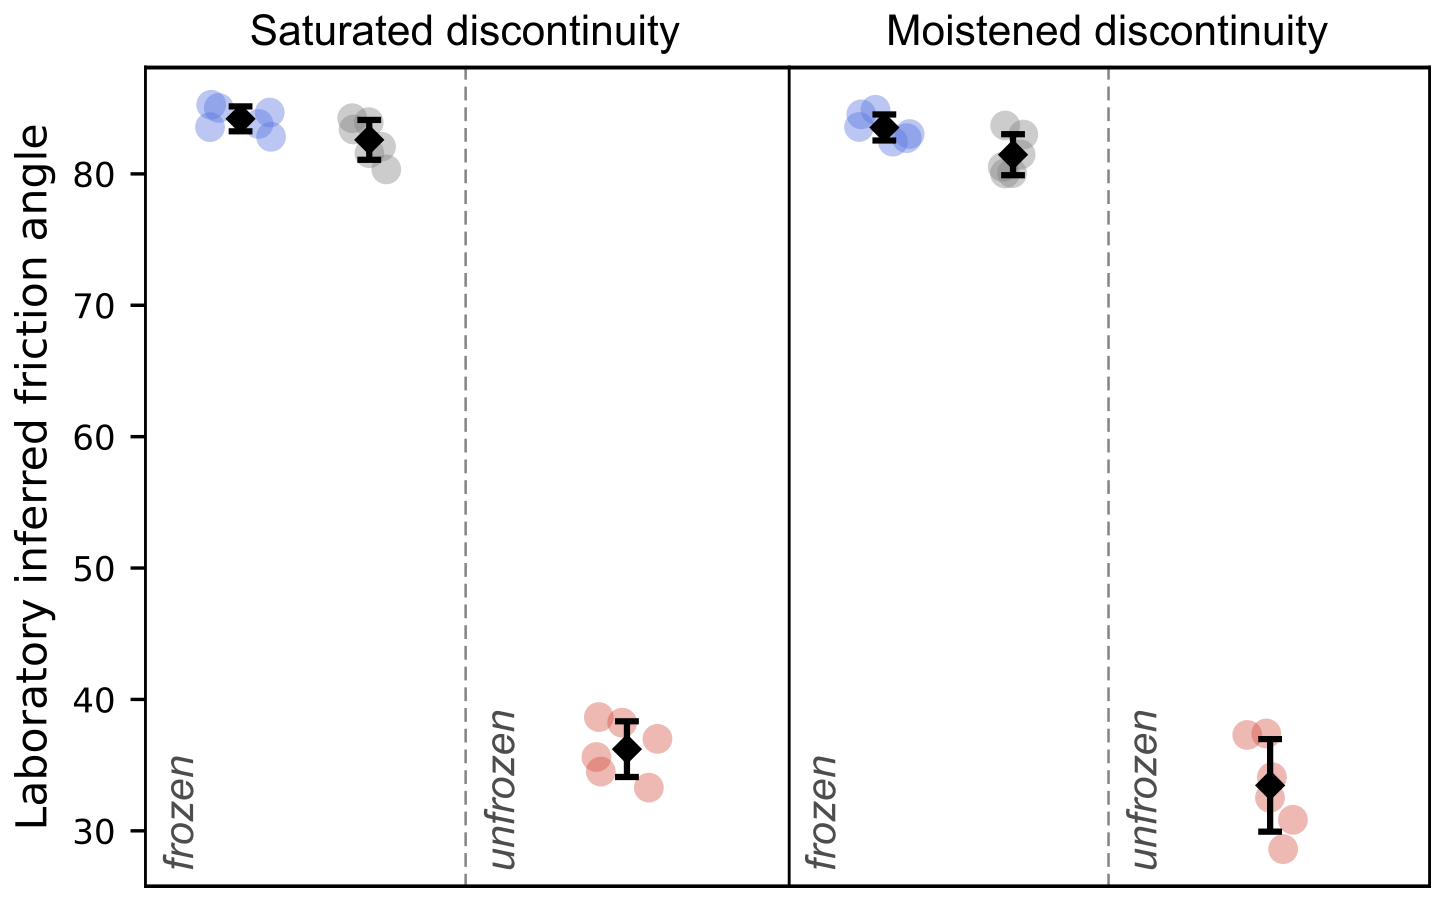
Figure 13Laboratory-inferred friction angles grouped by degrees of saturation and temperature (diamonds refer to arithmetic mean, ± standard deviation): while red refers to an unfrozen state (+10 °C) with an assumed cohesion of 0 kPa, blue and gray refer to a frozen state (−5 °C) without cohesion (0 kPa) and the cohesion value according to the Mohr–Coulomb failure criterion in Mamot et al. (2018), respectively. The influence of cohesion on the inferred friction angle is shown in Fig. S1.
While we assume that unfrozen rock contacts exhibit negligible cohesion, we conceptually expect the cohesion for frozen fractures to range between zero and that of ice-filled fractures. Considering a cohesion for ice-filled fractures at −5 °C equals 356–485 kPa (according to Eq. 6 in Mamot et al., 2018), we still get friction angles of 83° for saturated conditions and 81° for moistened conditions. Regardless of whether the influence of freezing on cohesion is accounted for (see Fig. S1), freezing leads to a significant increase in the friction angle compared to unfrozen conditions. Therefore, in this study, we express the change in shear stress purely to the friction angle, and we attribute it as “laboratory-inferred friction angle”, irrespective of the cohesion and friction components.
4.3 Mechanical modeling
The mechanical simulation reproduced the observed seasonal displacement pattern of the rock pillar (see Fig. 14a). The blocks tracked in the model recorded a displacement function shape similar to the actual displacement measured (compare Fig. 14a and b and Fig. 7), although at a magnitude of 10−3 m lower than measured. Seasonal water infiltration during snowmelt (see gray bars in Fig. 14b) and subsequent thawing and wetting of shear surfaces at depth were implemented through a temporary reduction of 50 % from ϕ=80° to ϕ=40° according to the mechanical experiments (see Fig. 13) for a fixed duration of 1500 mechanical time steps. Afterwards, refreezing was simulated by reversing the temporary reduction in the friction angle and cycling until reaching the equilibrium velocity of the overall model domain. The simulation of four thawing periods clearly demonstrated accelerated motion, which decelerated with a time lag once frozen conditions resumed. A brief drop in the friction angle destabilized the model, contrasting sharply with the much longer duration (about 5 times) of the high friction angle required to regain equilibrium. The failure mode of the rock pillar can be classified as “toppling” according to Cruden and Varnes (1996): shearing along vertical joints and horizontally inclined step-paths caused the pillar to tilt forward.
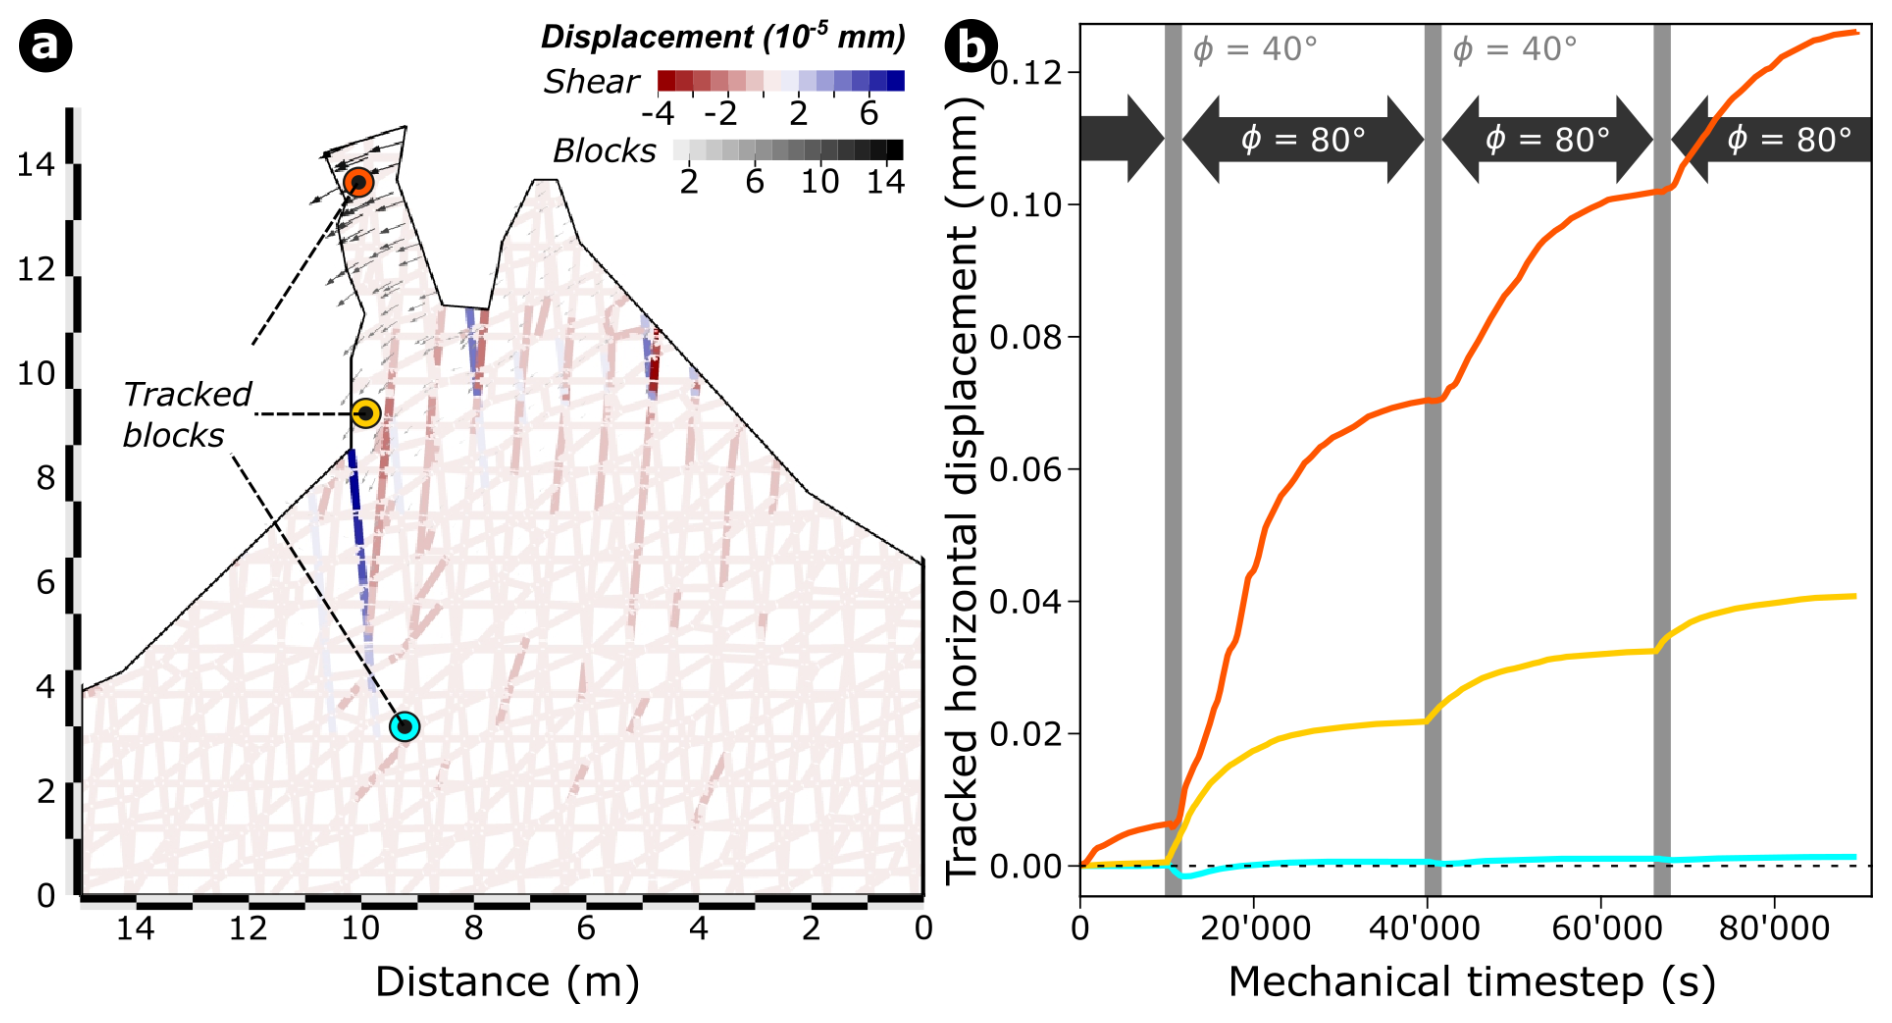
Figure 14(a) Numerically calculated spatial distribution and magnitude of displacements of blocks and individual joints for the freestanding Matterhorn rock pillar after calculation of 90 000 mechanical time steps. (b) Modeled effect of the seasonal but short-term drop in friction angles along fractures (between blocks) induced by temporary thawing due to percolating snowmelt water (gray bars).
In this study, we demonstrate how temporary thawing of discontinuities in bedrock permafrost induces cyclic and seasonal stress and strain on rock masses. While previous studies have observed this behavior in laboratory experiments (e.g., Jia et al., 2017) and deformation time series (e.g., Weber et al., 2017), this study provides a comprehensive, integrated multi-method analysis including field observations, laboratory findings, and mechanical modeling investigating the early destabilization to the final failure of a single free-standing rock pillar. This type of cyclical destabilization, driven predominantly by seasonal thaw and infiltration periods, is expected to intensify over time due to prolonged unfrozen periods in a warming climate, potentially leading larger and more frequent slope failures, especially in steep periglacial environments (Ravanel and Deline, 2015; Legay et al., 2021; Jacquemart and Weber et al., 2024). Our study further shows the need for a deeper understanding of the spatial propagation of thaw fronts within jointed rock masses.
5.1 Integrated multi-method analysis of failure
The combination of GNSS, TLS, inclinometer, thermal, ambient environmental, and seismic field data provides a comprehensive understanding of the processes leading to the evolution of the failure of the Matterhorn rock pillar on 13 June 2023. Displacement magnitudes derived from TLS increased from 9 cm at the base to 20 cm at the top between 2015 and 2018, suggesting toppling as the dominant failure mechanism. This behavior is confirmed by the complementary inclinometer data capturing an inclination change of approximately 1.3° between the TLS campaigns. The GNSS and inclinometer data added valuable temporal resolution. With an estimated center of rotation at 10 m depth, the overall displacement pattern can be explained until 2022. Together with the time-lapse images (see Fig. 2 and video supplement, Weber, 2024), these datasets provide a coherent picture of the progressive destabilization of the pillar. The displacement and inclination data show repeated phases with increased rates and strong acceleration in the years preceding the collapse, coinciding with changing in situ ground conditions due to seasonal transitions. These fluctuations underscore the influence of short-term environmental factors such as enhanced snowmelt, as was observed in June 2023 at the study site. The rapid decrease in snow depth is supported at the nearby IMIS weather station Stafelalp/ZER4 located 1000 m lower (see Fig. S6).
Seismic data provided further insights into the pre-failure behavior of the rock pillar. While the direct observations of displacement and inclination (see Figs. 5 and 7) precisely constrain the surface expression of underlying mechanisms and material property changes, it is the seismic data that allow constraints of these internal dynamics. These insights are, however, indirect and may not be confused with the clear systematic evolution of the surface towards the failure. While increased cracking activity was detected in the days leading up to the collapse, no precursory rockfall events were observed, suggesting that the failure process was primarily driven by internal weakening. Notably, the seismic wave velocity () increased systematically in the weeks before failure, reflecting the closure of microcracks under stress due to thermal expansion or the stiffening of the rock mass. This trend reversed abruptly 1–2 d before failure, with a 5 % decline in velocity, indicating rapid critical destabilization. This destabilization and the increasing displacement rate (see Fig. 7) apparently occurred under only minor emission of short-lived seismic signals (see Fig. 11b). The contrasting diurnal activity of long (mainly during the day but also peaking around midnight) and short (mainly at night) events points at thermal forcing of crack propagation and mass wasting, in agreement with other studies (Collins and Stock, 2016; Dietze et al., 2017; Weber et al., 2018a). These findings indicate that integrating analysis with event detection could be useful as a spatially integrative tool for assessing rock slope stability, especially when typical precursor signals like smaller rockfall events do not occur.
While each of the empirical metrics of deformation and material property change can be interpreted independently of each other and can be caused by independent transient, seasonal, diurnal, and weather-related drivers, it is the consistent evolution of the multi-method approach during the last few weeks that implies the progressive evolution of the system towards failure. Some observations highlight the specificity of the progressive destabilization solely to the rock pillar and not to the broader slope. For instance, a minor displacement (0.3 mm) recorded by crackmeter MH02 (see Fig. S7), located a few tens of meters away from the pillar, was not accompanied by significant signals in the GNSS and inclinometer data for the rock pillar. This suggests that the failure process was confined to the pillar itself, with the broader rock slope not responding synchronously to the same environmental forcing. This differentiation aligns with the varying predispositions across the slope, such as differences in rock structure, fracture patterns, or thermal and hydrological conditions.
5.2 Coupling laboratory tests and mechanical modeling
The concept that thawing induced by short-term, non-conductive heat transport (e.g., infiltrating snowmelt water or rainfall) decreases the friction angle along existing discontinuities to the extent that it significantly accelerates displacement has been shown in this paper. This previously unexplored and underestimated mechanism not only explains the seasonal destabilization of fractured rock frequently observed and described (Hasler et al., 2012; Ravanel et al., 2017) but also opens new pathways for a profound understanding of failure initiation in perennially frozen rock masses under dynamic and changing environmental conditions.
We assume that thawing can lead to a drop in the friction angle of rock contacts due to several interrelated factors, such as changes in the microstructural conditions along the fracture. Notably, wetting alone does not affect the friction angle, as we do not observe any significant difference in friction angle across various degrees of water saturation (see Fig. 13). Similarly, water pressure does not directly impact friction, as it only modifies the effective normal stress on the shearing surface, thereby only altering the shear strength accordingly; rather, it alters shear strength by changing the effective stress conditions. In contrast, we postulate that freezing can enhance friction by promoting ice formation in the cavities along the fracture, which facilitates cryosuction and the transport of liquid water to ice, resulting in the development of thin ice patches. As thawing removes this ice, the friction angle decreases due to the loss of these ice-induced strengthening effects.
By incorporating these insights into mechanical models, we successfully simulated the distinct displacement behavior of the rock slope, including the characteristic seasonal patterns observed at the Matterhorn. The mechanical model demonstrates that reduced friction angles caused by the temporary thawing of fracture surfaces can precisely replicate the observed annual acceleration and deceleration cycles. This alignment between simulated and in situ field data underscores the robustness of the model and highlights the critical role of thawing-induced friction reduction in controlling rock slope dynamics. The magnitudes between measured and modeled displacement of the rock pillar differ due to the following reasons: upscaling of laboratory-deviated shear parameters from decimeter to decameter size at the field site represents a distinct simplification, neglecting natural irregularities in the geometry of joints, such as the presence of rock bridges (limited joint trace length), the heterogeneous distribution of discontinuities, or varying joint roughness. In addition, other factors, such as hydrostatic pressure or thermal expansion/contraction of rock, which may have acted under natural field conditions, were excluded in the UDEC modeling approach.
A key aspect of this work is the integration of specific laboratory experiments used to quantify friction angles and cohesion. While laboratory conditions provide controlled environments for testing, real-world rock slopes present far greater complexity due to inhomogeneous fracture networks and variable infill materials such as sediments, ice, water, and air. Our findings align with those of Mamot et al. (2018), who also emphasized the role of small ice patches at rock–rock contact zones in enhancing cohesion. However, the cohesive strength of these ice patches may differ significantly from that of distinct rock–ice interfaces, and their behavior under stress needs further investigation.
Acoustic emission (AE) monitoring could enhance our understanding of these processes by providing real-time insights into the fracturing of ice patches and the evolution of cohesion. AE data could reveal whether fractures propagate predominantly through the ice, along ice–rock interfaces, or through the rock itself, offering a more nuanced understanding of the mechanical interplay at these interfaces, but they have proven to be difficult, if not impossible, to apply in a natural environment (Weber et al., 2018b). Hence, seismic sensors provide a complementary tool that can probe the continuum of sources of those signals. AE focuses on high frequency and, thereby, very localized signals, whereas seismometers are sensitive at larger distances and to more powerful emissions due to rock bridge failures (Dietze et al., 2021; Lagarde et al., 2023). The clear diurnal pattern of short (<9 s) seismic pulses implies thermal contraction as the main driver of those events. The progressive increase in those types of signals towards the rock pillar collapse (see Fig. 11) underlines the value of this proxy as a precursor probe, at least for surface-near detachments (Leinauer et al., 2024).
5.3 Prediction of small rock slope failures
Recent advances in failure time forecast modeling, such as those based on the inverse velocity method (Carlà et al., 2017), have demonstrated promise for anticipating rock slope failures across various scales and types (Leinauer et al., 2023). These models provide a robust, methodologically unified framework for integrating diverse observational datasets. However, their accuracy is highly dependent on the quality and resolution of precursor measurements. For small-scale failures, like the rock pillar in this study, limited experience and documentation of precursory behavior – especially for very small (<104 m3) or very large (>106 m3) events – still pose a significant challenge. Late detection or an absence of lead time can hinder effective early warning and risk mitigation efforts.
In the case of the Matterhorn rock pillar collapse, displacement data suggest that a lead time of at least 5–11 d could have been achieved. This time frame would have allowed sufficient evaluation of additional measurements and forecasts before initiating mitigation measures, which typically require at least 1 d to implement. However, it is important to note that forecast uncertainties are higher during the early stages of the precursory phase and decrease as failure approaches (see Fig. 8). Furthermore, the relation between failing volume and precursor duration also influences the time available for early warning. Theoretical models suggest that smaller failing volumes are associated with shorter precursory phases (Rose and Hungr, 2007). Interestingly, the relatively long precursory phase observed in this study, despite the small size of the pillar, may be linked to specific preconditioning factors and the gradual nature of the failure process. We are aware that the precursory phase might be significantly shorter in other cases (e.g., free fall from steep or overhanging walls); nevertheless, this observation is promising for future risk mitigation efforts, as it underscores the potential to monitor even small-scale deformations with sufficient precision to enable timely interventions.
Although clear precursor acceleration trends were observed, challenges remain in the application of these findings to seismic data. While displacement data allowed clear precursor detection, the and seismic activity exhibited greater variability and lacked consistent warning patterns. This underscores the need for high-quality, multi-method observational datasets to enhance the reliability of forecasts, particularly for small-scale failures. Additionally, improving our understanding of the link between environmental forcing, mechanical processes, and failure dynamics will further refine predictive models.
5.4 A benchmark framework to explain rockfall in permafrost rock slopes
This study provides new insights into the critical role of water percolation on the progressive destabilization of frozen rock slopes. Besides purely conductive heat transfer characterized by the material properties, energy available at the surface is additionally transported into the subsurface through the infiltration of water and water vapor along discontinuities in the rock (fractures, fissures; Blikra and Christiansen, 2014) or, in the case of larger voids, air circulation (Kane et al., 2001). With regard to the thermal regime at greater depth, the fast water percolation is bounded by the continuously frozen permafrost body below the seasonal active layer. When reaching first frozen contact surfaces in the subsurface, non-conductive heat transport causes rapid thaw at these surfaces, impacting the local thermal regime fast, at different times, and with a magnitude different from the conductive heat transport permeating the whole rock mass. In deeper layers or at times when warm water infiltration is reduced beyond a critical threshold, the water successively cools down and refreezes, causing latent heat to be dispersed into the colder permafrost.
Short-term thawing of discontinuities in the ground, induced by non-conductive heat flux from percolating snowmelt water, likely weakened the rock pillar's base, accelerating internal deformation. Anomalies in the borehole temperatures next to the Hörnli hut (SLF borehole MAT_0311; see Figs. 4 and S8) indicate coincident occurrence of non-conductive heat fluxes at depth (see Fig. S9). Such hydrological forcing, particularly prominent in spring and early summer, represents a critical destabilizing factor (see Sect. 5.2) that complements the long-term trends captured by GNSS and TLS. The toppling kinematics observed both in observations and in the model mainly result from shearing along the steep shear planes and the oblique geometry of the rock pillar.
Interestingly, this event occurred almost simultaneously with the Fluchthorn (46.89° N, 10.23° E; 3396 m a.s.l.; approx. 106 m3) and Piz de las Sterlas (46.51° N, 9.95° E; 3140 m a.s.l.; approx. 7.5×10⁴ m3) rock slope failures on 11 June 2023 (PERMOS, 2024), both larger by several orders of magnitude. While the spatial and temporal coincidence may be partly attributable to shared climatic drivers, the variability in local preconditioning factors highlights the complexity of rock slope instability mechanisms. In addition, temperature anomalies recorded within a few days of the event in several PERMOS boreholes – from Valais (e.g., Hörnli hut, Wisse Schijen, Breithorn Herbriggen) over Gotthard massif (Gemsstock) to the Eastern Alps (e.g., Schafberg) – indicate that environmental forcing was not limited to a specific region but extended across much of the Swiss Alps in the time period of the rock slope failures. This temporal coincidence suggests that regional-scale environmental conditions, such as snowmelt and temperature anomalies, may play a crucial role in preconditioning and triggering slope failures. The broad spatial coverage suggests that both regional-scale climatic trends and localized site-specific predispositions must be considered to fully understand the drivers of these failures.
Therefore, other environmental factors should also be considered in this context. For example, discharge measurements from Zmuttbach above Zermatt (approx. 2000 m a.s.l., shown in Fig. S10) show a clear upward trend in discharge with the onset of acceleration observed prior to the failure of the Matterhorn rock pillar, correlating with increasing snowmelt rates in high mountain areas. These findings highlight the importance of coupling quantitative monitoring, such as hydrological observations, with well-calibrated mechanical models. The replication of seasonal thawing-induced displacement patterns for the first time in a succinct thermomechanical model represents a significant advancement in understanding and a prerequisite for future forecasting of seasonal destabilization in mountain permafrost. This capability has profound implications for early warning systems, enabling the identification of transient changes in rock stability driven by thawing, which can inform timely hazard mitigation efforts. Further research, detailing and quantitatively assessing the many individual process components happening simultaneously and especially at depth below the surface, is necessary.
This study provides a valuable benchmark for understanding the mechanisms driving the increased frequency and magnitude of gravity-driven rock slope failures in a globally warming mountain permafrost. By combining long-term field observations, laboratory experiments, and thermomechanical modeling to investigate the failure of a rock pillar on the Matterhorn on 13 June 2023, we demonstrate that short-term thawing induced by water-induced non-conductive heat transport plays a crucial role in destabilizing permafrost rock slopes. The infiltration of water into frozen fractures leads to localized warming and thawing at depth, reducing friction along fracture surfaces and promoting progressive destabilization.
Our findings underscore the importance of integrating multi-method monitoring with experimental and modeling approaches to understand the processes leading to rock slope failure and to anticipate and mitigate the impacts of climate change on rock slope stability. While our study provides unprecedented insights into the processes governing permafrost rock failure, the lack of direct moisture measurements in bedrock permafrost remains a limitation. Future research should focus on quantifying water content dynamics to further refine our understanding of the interplay between thermal, hydraulic, and mechanical processes in degrading permafrost rock slopes.
Data generated in this study are fully available at https://doi.org/10.1594/PANGAEA.983718 (Weber and Beutel, 2025) and https://doi.org/10.12686/SED/NETWORKS/1I (UIBK and WSL/SLF, 2015). IMIS data are available on envidat (https://doi.org/10.16904/envidat.406; Intercantonal Measurement and Information System IMIS, 2023). While borehole temperature time series can be requested from SLF Davos, access to discharge data is subject to approval by ALPIQ.
A time-lapse GIF with daily images 2 weeks prior to the failure is available at https://doi.org/10.5281/zenodo.13643168 (Weber, 2024).
The supplement related to this article is available online at https://doi.org/10.5194/esurf-13-1157-2025-supplement.
SW and JB conducted the fieldwork, acquired the data, and carried out the data pre-processing. SW and MK developed the concept of the study. SW performed the analysis and prepared the figures with support from RK for the TLS analysis, JL for the forecast, MD for the seismic analysis, SM for the laboratory experiments, and FP for the mechanical modeling. SW prepared the manuscript with revision and final approval from all authors.
At least one of the (co-)authors is a member of the editorial board of Earth Surface Dynamics. The peer-review process was guided by an independent editor, and the authors also have no other competing interests to declare.
Publisher's note: Copernicus Publications remains neutral with regard to jurisdictional claims made in the text, published maps, institutional affiliations, or any other geographical representation in this paper. While Copernicus Publications makes every effort to include appropriate place names, the final responsibility lies with the authors. Views expressed in the text are those of the authors and do not necessarily reflect the views of the publisher.
The authors would like to thank the many helpers and PermaSense team members, especially Johann Junghardt for the TLS acquisition in the year 2015 and Alessandro Cicoira and Dominik Amschwand for their support during maintenance fieldwork. We are grateful to Marit Van Tiel for facilitating contact and arranging access to the discharge plot with data made available by ALPIQ. We further acknowledge the two anonymous referees who provided valuable comments that helped to improve and clarify the article. Finally, we thank the handling associate editor, Dirk Scherler, for his constructive feedback and suggestions.
This paper was edited by Dirk Scherler and reviewed by two anonymous referees.
Abramson, L. W., Lee, T. S., Sharma, S., and Boyce, G. M.: Slope stability and stabilization methods, 2nd edn., John Wiley & Sons, Inc., 2002. a
Agliardi, F., Scuderi, M. M., Fusi, N., and Collettini, C.: Slow-to-fast transition of giant creeping rockslides modulated by undrained loading in basal shear zones, Nature Communications, 11, 1352, https://doi.org/10.1038/s41467-020-15093-3, 2020. a
Allen, R.: Automatic phase pickers: Their present use and future prospects, Bulletin of the Seismological Society of America, 72, S225–S242, https://doi.org/10.1785/BSSA07206B0225, 1982. a
Ben-Asher, M., Magnin, F., Westermann, S., Bock, J., Malet, E., Berthet, J., Ravanel, L., and Deline, P.: Estimating surface water availability in high mountain rock slopes using a numerical energy balance model, Earth Surf. Dynam., 11, 899–915, https://doi.org/10.5194/esurf-11-899-2023, 2023. a
Bendat, J. S. and Piersol, A. G.: Random Data: Analysis and Measurement Procedures, 4th edn., Wiley, ISBN 978-0-470-24877-5, 2011. a
Beutel, J., Gruber, S., Hasler, A., Lim, R., Meier, A., Plessl, C., Talzi, I., Thiele, L., Tschudin, C., Woehrle, M., and Yuecel, M.: PermaDAQ: A scientific instrument for precision sensing and data recovery in environmental extremes, in: The 8th ACM/IEEE International Conference on Information Processing in Sensor Networks, San Francisco, California, USA, http://dl.acm.org/citation.cfm?id=1602165.1602190 (last access: 14 October 2025), 2009. a
Beutel, J., Cicoira, A., Morra di Cella, U., Pogliotti, P., and Weber, S.: Insights from steep-bedrock, high-altitude mountain permafrost laboratory at the Matterhorn, EGU General Assembly 2024, Vienna, Austria, 14–19 Apr 2024, EGU24-19057, https://doi.org/10.5194/egusphere-egu24-19057, 2024. a
Blikra, L. H. and Christiansen, H. H.: A field-based model of permafrost-controlled rockslide deformation in Northern Norway, Geomorphology, 208, 34–39, https://doi.org/10.1016/j.geomorph.2013.11.014, 2014. a
Bucher, K., Dal Piaz, G. V., Oberhänsli, R., Gouffon, Y., Martinotti, G., and Polino, R.: Blatt 1347 Matterhorn. Geol. Atlas Schweiz 1:25 000, Erläut. 107, Bundesamt für Wasser und Geologie, Wabern, ISBN 3-906723-66-6, 2004. a
Carlà, T., Intrieri, E., Di Traglia, F., Nolesini, T., Gigli, G., and Casagli, N.: Guidelines on the use of inverse velocity method as a tool for setting alarm thresholds and forecasting landslides and structure collapses, Landslides, 14, 517–534, https://doi.org/10.1007/s10346-016-0731-5, 2017. a
Chen, Y. and Medioni, G.: Object modeling by registration of multiple range images, in: 1991 IEEE International Conference on Robotics and Automation Proceedings, vol. 3, 2724–2729, https://doi.org/10.1109/ROBOT.1991.132043, 1991. a
Cicoira, A., Weber, S., Biri, A., Buchli, B., Delaloye, R., Da Forno, R., Gärtner-Roer, I., Gruber, S., Gsell, T., Hasler, A., Lim, R., Limpach, P., Mayoraz, R., Meyer, M., Noetzli, J., Phillips, M., Pointner, E., Raetzo, H., Scapozza, C., Strozzi, T., Thiele, L., Vieli, A., Vonder Mühll, D., Wirz, V., and Beutel, J.: In situ observations of the Swiss periglacial environment using GNSS instruments, Earth Syst. Sci. Data, 14, 5061–5091, https://doi.org/10.5194/essd-14-5061-2022, 2022. a, b, c
Collins, B. D. and Stock, G. M.: Rockfall triggering by cyclic thermal stressing of exfoliation fractures, Nature Geoscience, 9, 395–400, https://doi.org/10.1038/ngeo2686, 2016. a
Cook, K. L. and Dietze, M.: Seismic Advances in Process Geomorphology, Annual Review of Earth and Planetary Sciences, 50, 183–204, https://doi.org/10.1146/annurev-earth-032320-085133, 2022. a, b
Coulson, J. H.: The effects of surface roughness on the shear strength of joints in rock, PhD thesis, University of Illinois at Urbana-Champaign, ISBN 9798659549506, 1970. a
Cruden, D. M. and Varnes, D. J.: Landslide types and processes, U.S. National Academy of Sciences, Special Report – National Research Council, Transportation Research Board, 247, 36–57, 1996. a
Deline, P., Gruber, S., Amann, F., Bodin, X., Delaloye, R., Failletaz, J., Fischer, L., Geertsema, M., Giardino, M., Hasler, A., Kirkbride, M., Krautblatter, M., Magnin, F., McColl, S., Ravanel, L., Schoeneich, P., and Weber, S.: Chapter 15 – Ice loss from glaciers and permafrost and related slope instability in high-mountain regions, in: Snow and Ice-Related Hazards, Risks, and Disasters, 2nd edn., edited by: Haeberli, W. and Whiteman, C., Hazards and Disasters Series, Elsevier, 501–540, ISBN 978-0-12-817129-5, 2021. a
Dietze, M.: The R package “eseis” – a software toolbox for environmental seismology, Earth Surf. Dynam., 6, 669–686, https://doi.org/10.5194/esurf-6-669-2018, 2018. a
Dietze, M., Turowski, J. M., Cook, K. L., and Hovius, N.: Spatiotemporal patterns, triggers and anatomies of seismically detected rockfalls, Earth Surf. Dynam., 5, 757–779, https://doi.org/10.5194/esurf-5-757-2017, 2017. a, b, c, d, e
Dietze, M., Krautblatter, M., Illien, L., and Hovius, N.: Seismic constraints on rock damaging related to a failing mountain peak: the Hochvogel, Allgäu, Earth Surface Processes and Landforms, 46, 417–429, https://doi.org/10.1002/esp.5034, 2021. a, b
Draebing, D. and Krautblatter, M.: P-wave velocity changes in freezing hard low-porosity rocks: a laboratory-based time-average model, The Cryosphere, 6, 1163–1174, https://doi.org/10.5194/tc-6-1163-2012, 2012. a
Draebing, D., Mayer, T., Jacobs, B., Binnie, S. A., Dühnforth, M., and McColl, S. T.: Holocene warming of alpine rockwalls decreased rockwall erosion rates, Earth and Planetary Science Letters, 626, 118496, https://doi.org/10.1016/j.epsl.2023.118496, 2024. a
Eberhardt, E., Stead, D., and Coggan, J. S.: Numerical analysis of initiation and progressive failure in natural rock slopes – The 1991 Randa rockslide, Int. J. Rock Mech. Min., 41, 69–87, https://doi.org/10.1016/S1365-1609(03)00076-5, 2004. a
Fukuzono, T.: A method to predict the time of slope failure caused by rainfall using the inverse number of velocity of surface displacement, Landslides, 22, 8–13_1, https://doi.org/10.3313/jls1964.22.2_8, 1985. a
Girard, L., Gruber, S., Weber, S., and Beutel, J.: Environmental controls of frost cracking revealed through in-situ acoustic emission measurements in steep bedrock, Geophys. Res. Lett., 40, 1748–1753, https://doi.org/10.1002/grl.50384, 2013. a
Gischig, S., Moore, J. R., Evans, K. F., Amann, F., and Loew, S.: Thermomechanical forcing of deep rock slope deformation: 2. The Randa rock slope instability, Journal of Geophysical Research: Earth Surface, 116, https://doi.org/10.1029/2011JF002007, 2011. a
Gischig, V. S., Eberhardt, E., Moore, J. R., and Hungr, O.: On the seismic response of deep-seated rock slope instabilities – Insights from numerical modeling, Engineering Geology, 193, 1–18, https://doi.org/10.1016/j.enggeo.2015.04.003, 2015. a
Gojcic, Z., Zhou, C., and Wieser, A.: F2S3: Robustified determination of 3D displacement vector fields using deep learning, Journal of Applied Geodesy, 14, 177–189, https://doi.org/10.1515/jag-2019-0044, 2020. a
Gruber, S. and Haeberli, W.: Permafrost in steep bedrock slopes and its temperature-related destabilization following climate change, J. Geophys. Res., 112, F02S18, https://doi.org/10.1029/2006JF000547, 2007. a
Gruber, S., Hoelzle, M., and Haeberli, W.: Permafrost thaw and destabilization of Alpine rock walls in the hot summer of 2003, Geophys. Res. Lett., 31, L13504, https://doi.org/10.1029/2004GL020051, 2004. a
Haeberli, W., Schaub, Y., and Huggel, C.: Increasing risks related to landslides from degrading permafrost into new lakes in de-glaciating mountain ranges, Geomorphology, 293, 405–417, https://doi.org/10.1016/j.geomorph.2016.02.009, 2017. a
Hasler, A., Talzi, I., Beutel, J., Tschudin, C., and Gruber, S.: Wireless sensor networks in permafrost research: Concept, requirements, implementation, and challenges, in: Proceedings of the 9th International Conference on Permafrost 2008, Fairbanks, Alaska, ISBN 978-0-9800179-2-2, 2008. a
Hasler, A., Gruber, S., Font, M., and Dubois, A.: Advective heat transport in frozen rock clefts: Conceptual model, laboratory experiments and numerical simulation, Permafrost and Periglacial Process., 22, 378–389, https://doi.org/10.1002/ppp.737, 2011. a
Hasler, A., Gruber, S., and Beutel, J.: Kinematics of steep bedrock permafrost, J. Geophys. Res., 117, F01016, https://doi.org/10.1029/2011JF001981, 2012. a, b, c, d, e, f, g, h
Havenith, H.-B., Jongmans, D., Faccioli, E., Abdrakhmatov, K., and Bard, P.-Y.: Site effect analysis around the seismically induced Ananevo rockslide, Kyrgyzstan, Bulletin of the Seismological Society of America, 92, 3190, https://doi.org/10.1785/0120010206, 2002. a
Hiebl, J., Auer, I., Böhm, R., Schöner, W., Maugeri, M., Lentini, G., Spinoni, J., Brunetti, M., Nanni, T., Tadić, M., Perčec Bihari, Z., Dolinar, M., and Müller-Westermeier, G.: A high-resolution 1961–1990 monthly temperature climatology for the greater Alpine region, Meteorologische Zeitschrift, 18, 507–530, https://doi.org/10.1127/0941-2948/2009/0403, 2009. a
Huggel, C., Zgraggen-Oswald, S., Haeberli, W., Kääb, A., Polkvoj, A., Galushkin, I., and Evans, S. G.: The 2002 rock/ice avalanche at Kolka/Karmadon, Russian Caucasus: assessment of extraordinary avalanche formation and mobility, and application of QuickBird satellite imagery, Nat. Hazards Earth Syst. Sci., 5, 173–187, https://doi.org/10.5194/nhess-5-173-2005, 2005. a
Huggel, C., Allen, S., Deline, P., Fischer, L., Noetzli, J., and Ravanel, L.: Ice thawing, mountains falling – are alpine rock slope failures increasing?, Geology Today, 28, 98–104, https://doi.org/10.1111/j.1365-2451.2012.00836.x, 2012. a
Illien, L., Sens-Schönfelder, C., Andermann, C., Marc, O., Cook, K. L., Adhikari, L. B., and Hovius, N.: Seismic Velocity Recovery in the Subsurface: Transient Damage and Groundwater Drainage Following the 2015 Gorkha Earthquake, Nepal, Journal of Geophysical Research: Solid Earth, 127, e2021JB023402, https://doi.org/10.1029/2021JB023402, 2022. a
ImageMagick Studio LLC: ImageMagick, https://imagemagick.org (last access: 14 October 2025), 2024. a
Intercantonal Measurement and Information System IMIS: IMIS measuring network, EnviDat [data set], https://doi.org/10.16904/envidat.406, 2023. a, b
IPCC: The Ocean and Cryosphere in a Changing Climate: Special Report of the Intergovernmental Panel on Climate Change, Cambridge University Press, Cambridge, https://doi.org/10.1017/9781009157964, 2022. a
Itasca Consulting Group: UDEC – Universal distinct element code (user's manual), manual, Itasca International, Minneapolis, United States, 2019. a
Jacquemart, M., Weber, S., Chiarle, M., Chmiel, M., Cicoira, A., Corona, C., Eckert, N., Gaume, J., Giacona, F., Hirschberg, J., Kaitna, R., Magnin, F., Mayer, S., Moos, C., van Herwijnen, A., and Stoffel, M.: Detecting the impact of climate change on alpine mass movements in observational records from the European Alps, Earth-Science Reviews, 258, 104886, https://doi.org/10.1016/j.earscirev.2024.104886, 2024. a, b
Jia, H., Leith, K., and Krautblatter, M.: Path-dependent frost-wedging experiments in fractured, low-permeability granite, Permafrost and Periglacial Processes, https://doi.org/10.1002/ppp.1950, 2017. a
Kane, D. L., Hinkel, K. M., Goering, D. J., Hinzman, L. D., and Outcalt, S. I.: Non-conductive heat transfer associated with frozen soils, Global and Planetary Change, 29, 275–292, https://doi.org/10.1016/S0921-8181(01)00095-9, 2001. a
Keller, M., Beutel, J., and Thiele, L.: Demo Abstract: Mountainview–Precision Image Sensing on High-Alpine Locations, Adjunct Proceedings of the 6th European Workshop on Sensor Networks (EWSN), 2009. a
Krautblatter, M. and Moore, J. R.: Rock slope instability and erosion: toward improved process understanding, Earth Surface Processes and Landforms, 39, 1273–1278, https://doi.org/10.1002/esp.3578, 2014. a
Krautblatter, M., Funk, D., and Günzel, F.: Why permafrost rocks become unstable: A rock-ice-mechanical model in time and space, Earth Surf. Process. Landf., 38, 876–887, https://doi.org/10.1002/esp.3374, 2013. a
Krischer, L., Megies, T., Barsch, R., Beyreuther, M., Lecocq, T., Caudron, C., and Wassermann, J.: ObsPy: A bridge for seismology into the scientific Python ecosystem, Computational Science & Discovery, 8, 014003, https://doi.org/10.1088/1749-4699/8/1/014003, 2015. a
Lagarde, S., Dietze, M., Hammer, C., Zeckra, M., Voigtländer, A., Illien, L., Schöpa, A., Hirschberg, J., Burtin, A., Hovius, N., and Turowski, J. M.: Rock slope failure preparation paced by total crack boundary length, Communications Earth & Environment, 4, 201, https://doi.org/10.1038/s43247-023-00851-0, 2023. a
Larose, E., Carrière, S., Voisin, C., Bottelin, P., Baillet, L., Guéguen, P., Walter, F., Jongmans, D., Guillier, B., Garambois, S., Gimbert, F., and Massey, C.: Environmental seismology: What can we learn on earth surface processes with ambient noise?, Journal of Applied Geophysics, 116, 62–74, https://doi.org/10.1016/j.jappgeo.2015.02.001, 2015. a
Legay, A., Magnin, F., and Ravanel, L.: Rock temperature prior to failure: Analysis of 209 rockfall events in the Mont Blanc massif (Western European Alps), Permafrost and Periglacial Processes, 32, 520–536, https://doi.org/10.1002/ppp.2110, 2021. a
Leinauer, J., Weber, S., Cicoira, A., Beutel, J., and Krautblatter, M.: An approach for prospective forecasting of rock slope failure time, Communications Earth & Environment, 4, 1–10, https://doi.org/10.1038/s43247-023-00909-z, 2023. a, b, c
Leinauer, J., Dietze, M., Knapp, S., Scandroglio, R., Jokel, M., and Krautblatter, M.: How water, temperature, and seismicity control the preconditioning of massive rock slope failure (Hochvogel), Earth Surf. Dynam., 12, 1027–1048, https://doi.org/10.5194/esurf-12-1027-2024, 2024. a, b
Magnin, F. and Josnin, J.-Y.: Water Flows in Rock Wall Permafrost: A Numerical Approach Coupling Hydrological and Thermal Processes, Journal of Geophysical Research: Earth Surface, 126, e2021JF006394, https://doi.org/10.1029/2021JF006394, 2021. a
Mamot, P., Weber, S., Schröder, T., and Krautblatter, M.: A temperature- and stress-controlled failure criterion for ice-filled permafrost rock joints, The Cryosphere, 12, 3333–3353, https://doi.org/10.5194/tc-12-3333-2018, 2018. a, b, c, d, e
Mamot, P., Weber, S., Lanz, M., and Krautblatter, M.: Brief communication: The influence of mica-rich rocks on the shear strength of ice-filled discontinuities, The Cryosphere, 14, 1849–1855, https://doi.org/10.5194/tc-14-1849-2020, 2020. a, b
Matsuoka, N. and Murton, J.: Frost weathering: Recent advances and future directions, Permafrost and Periglacial Process., 19, 195–210, https://doi.org/10.1002/ppp.620, 2008. a
MeteoSwiss: Climate normals from all measuring stations with long-time series of measurrements, Swiss Federal Office of Meteorology and Climatology, MeteoSwiss, https://www.meteoswiss.admin.ch/home/climate/swiss-climate-in-detail/climate-normals/normal-values-per-measured-parameter.html (last access: 14 October 2025), 2019. a
Noetzli, J. and Gruber, S.: Transient thermal effects in Alpine permafrost, The Cryosphere, 3, 85–99, https://doi.org/10.5194/tc-3-85-2009, 2009. a
Noetzli, J., Christiansen, J., Guglielmin, H. H., Hrbáček, M., Isaksen, F., Smith, K., Zhao, S. L., and Streletskiy, D. A.: Permafrost temperature and active layer thickness, in: State of the climate in 2021 – Global climate, Bulletin of the American Meteorological Society, 103, 41–43, 2022. a
Noetzli, J., Isaksen, K., Barnett, J., Christiansen, H. H., Delaloye, R., Etzelmüller, B., Farinotti, D., Gallemann, T., Guglielmin, M., Hauck, C., Hilbich, C., Hoelzle, M., Lambiel, C., Magnin, F., Oliva, M., Paro, L., Pogliotti, P., Riedl, C., Schoeneich, P., Valt, M., Vieli, A., and Phillips, M.: Enhanced warming of European mountain permafrost in the early 21st century, Nature Communications, 15, 10508, https://doi.org/10.1038/s41467-024-54831-9, 2024. a
ObsPy Development Team: ObsPy 1.1.1, Zenodo [code], https://doi.org/10.5281/zenodo.1040770, 2019. a
Offer, M., Weber, S., Krautblatter, M., Hartmeyer, I., and Keuschnig, M.: Pressurised water flow in fractured permafrost rocks revealed by borehole temperature, electrical resistivity tomography, and piezometric pressure, The Cryosphere, 19, 485–506, https://doi.org/10.5194/tc-19-485-2025, 2025. a
PERMOS: PERMOS Database, Swiss Permafrost Monitoring Network, Davos and Fribourg, Switzerland, https://doi.org/10.13093/permos-2024-01, 2024. a
Petley, D. N.: The evolution of slope failures: mechanisms of rupture propagation, Nat. Hazards Earth Syst. Sci., 4, 147–152, https://doi.org/10.5194/nhess-4-147-2004, 2004. a
Pleuger, J., Roller, S., Walter, J. M., Jansen, E., and Froitzheim, N.: Structural evolution of the contact between two Penninic nappes (Zermatt-Saas zone and Combin zone, Western Alps) and implications for the exhumation mechanism and palaeogeography, International Journal of Earth Sciences, 96, 229–252, https://doi.org/10.1007/s00531-006-0106-6, 2007. a
Pogliotti, P., Guglielmin, M., Cremonese, E., Morra di Cella, U., Filippa, G., Pellet, C., and Hauck, C.: Warming permafrost and active layer variability at Cime Bianche, Western European Alps, The Cryosphere, 9, 647–661, https://doi.org/10.5194/tc-9-647-2015, 2015. a
Pogliotti, P., Cremonese, E., and Morra di Cella, U.: Warming Permafrost in the Western Alps: A Further Evidence of Elevation Dependent Alpine, https://doi.org/10.4000/rga.11784, 2023. a
Ravanel, L. and Deline, P.: Rockfall Hazard in the Mont Blanc Massif Increased by the Current Atmospheric Warming, in: Engineering Geology for Society and Territory, vol. 1, edited by: Lollino, G., Manconi, A., Clague, J., Shan, W., and Chiarle, M., Springer International Publishing, Cham, 425–428, https://doi.org/10.1007/978-3-319-09300-0_81, 2015. a
Ravanel, L., Magnin, F., and Deline, P.: Impacts of the 2003 and 2015 summer heatwaves on permafrost-affected rock-walls in the Mont Blanc massif, Science of The Total Environment, 609, 132–143, https://doi.org/10.1016/j.scitotenv.2017.07.055, 2017. a
Rivière, A., Jost, A., Gonçalvès, J., and Font, M.: Pore water pressure evolution below a freezing front under saturated conditions: Large-scale laboratory experiment and numerical investigation, Cold Regions Science and Technology, 158, 76–94, https://doi.org/10.1016/j.coldregions.2018.11.005, 2019. a
Rose, N. D. and Hungr, O.: Forecasting potential rock slope failure in open pit mines using the inverse-velocity method, International Journal of Rock Mechanics and Mining Sciences, 44, 308–320, https://doi.org/10.1016/j.ijrmms.2006.07.014, 2007. a
Sass, O.: Rock moisture measurements: Techniques, results, and implications for weathering, Earth Surface Processes and Landforms, 30, 359–374, https://doi.org/10.1002/esp.1214, 2005. a
Scandroglio, R., Weber, S., Rehm, T., and Krautblatter, M.: Decadal in situ hydrological observations and empirical modeling of pressure head in a high-alpine, fractured calcareous rock slope, Earth Surf. Dynam., 13, 295–314, https://doi.org/10.5194/esurf-13-295-2025, 2025. a
Sens-Schönfelder, C. and Wegler, U.: Passive image interferometry and seasonal variations of seismic velocities at Merapi Volcano, Indonesia, Geophysical Research Letters, 33, https://doi.org/10.1029/2006GL027797, 2006. a
Snieder, R.: Extracting the Green's function from the correlation of coda waves: A derivation based on stationary phase, Physical Review E, 69, 046610, https://doi.org/10.1103/PhysRevE.69.046610, 2004. a
Stead, D. and Wolter, A.: A critical review of rock slope failure mechanisms: The importance of structural geology, Journal of Structural Geology, 74, 1–23, https://doi.org/10.1016/j.jsg.2015.02.002, 2015. a
Terzaghi, K.: Stability of steep slopes on hard unweathered rock, Geotechnique, 12, 251–270, https://doi.org/10.1680/geot.1962.12.4.251, 1962. a
UIBK and WSL/SLF: Matterhorn Cryosphere Observatory, Switzerland, Seismic Network, University of Innsbruck and WSL Institute for Snow and Avalanche Research SLF, ETH Zurich [data set], https://doi.org/10.12686/SED/NETWORKS/1I, 2015. a, b
Ulusay, R.: The ISRM suggested methods for rock characterization, testing and monitoring: 2007–2014, Bulletin of Engineering Geology and the Environment, https://doi.org/10.1007/978-3-319-07713-0, 2015. a
Walter, F., Amann, F., Kos, A., Kenner, R., Phillips, M., de Preux, A., Huss, M., Tognacca, C., Clinton, J., Diehl, T., and Bonanomi, Y.: Direct observations of a three million cubic meter rock-slope collapse with almost immediate initiation of ensuing debris flows, Geomorphology, 351, 106933, https://doi.org/10.1016/j.geomorph.2019.106933, 2020. a
Watson, A. D., Moore, D. P., and Stewart, T. W.: Temperature influence on rock slope movements at Checkerboard Creek, in: Proceedings of the ninth International Symposium on Landslides, vol. 2, 1293–1298, ISBN 9780415356657, 2004. a
Weber, S.: Collapse of a freestanding rock pillar at Matterhorn Hörnligrat: daily high-resolution images show kinematic precursor, Zenodo [video], https://doi.org/10.5281/zenodo.13643168, 2024. a, b, c, d
Weber, S. and Beutel, J.: In-situ measurements in steep bedrock permafrost in an Alpine environment on the Matterhorn Hörnligrat, Zermatt Switzerland: 2008–2024, PANGAEA [data set], https://doi.org/10.1594/PANGAEA.983718, 2025. a, b
Weber, S., Beutel, J., Faillettaz, J., Hasler, A., Krautblatter, M., and Vieli, A.: Quantifying irreversible movement in steep, fractured bedrock permafrost on Matterhorn (CH), The Cryosphere, 11, 567–583, https://doi.org/10.5194/tc-11-567-2017, 2017. a, b, c, d
Weber, S., Fäh, D., Beutel, J., Faillettaz, J., Gruber, S., and Vieli, A.: Ambient seismic vibrations in steep bedrock permafrost used to infer variations of ice-fill in fractures, Earth and Planetary Science Letters, 501, 119–127, https://doi.org/10.1016/j.epsl.2018.08.042, 2018a. a, b, c
Weber, S., Faillettaz, J., Meyer, M., Beutel, J., and Vieli, A.: Acoustic and Microseismic Characterization in Steep Bedrock Permafrost on Matterhorn (CH), Journal of Geophysical Research: Earth Surface, 123, 1363–1385, https://doi.org/10.1029/2018JF004615, 2018b. a, b
Weber, S., Beutel, J., Da Forno, R., Geiger, A., Gruber, S., Gsell, T., Hasler, A., Keller, M., Lim, R., Limpach, P., Meyer, M., Talzi, I., Thiele, L., Tschudin, C., Vieli, A., Vonder Mühll, D., and Yücel, M.: A decade of detailed observations (2008–2018) in steep bedrock permafrost at the Matterhorn Hörnligrat (Zermatt, CH), Earth Syst. Sci. Data, 11, 1203–1237, https://doi.org/10.5194/essd-11-1203-2019, 2019. a, b, c, d, e, f, g
Weber, S., Beutel, J., Häusler, M., Geimer, P. R., Fäh, D., and Moore, J. R.: Spectral amplification of ground motion linked to resonance of large-scale mountain landforms, Earth and Planetary Science Letters, 578, 117295, https://doi.org/10.1016/j.epsl.2021.117295, 2022. a
Weber, S., Beutel, J., and Cicoira, A.: In-situ measurements in steep bedrock permafrost in an Alpine environment on the Matterhorn Hörnligrat, Zermatt Switzerland: 2008–2023, PANGAEA [data set], https://doi.org/10.1594/PANGAEA.967586, 2024.
Westoby, M. J., Glasser, N. F., Brasington, J., Hambrey, M. J., Quincey, D. J., and Reynolds, J. M.: Modelling outburst floods from moraine-dammed glacial lakes, Earth-Science Reviews, 134, 137–159, https://doi.org/10.1016/j.earscirev.2014.03.009, 2014. a
Wieczorek, G. F. and Jäger, S.: Triggering mechanisms and depositional rates of postglacial slope-movement processes in the Yosemite Valley, California, Geomorphology, 15, 17–31, https://doi.org/10.1016/0169-555X(95)00112-I, 1996. a
WMO – World Meteorological Organization: Guide to Climatological Practices, Tech. rep., World Meteorological Organization, ISBN 978-92-63-10100-6, https://library.wmo.int/records/item/60113-guide-to-climatological-practices?offset=8 (last access: 14 October 2025), 2023. a