the Creative Commons Attribution 4.0 License.
the Creative Commons Attribution 4.0 License.
 | 07 Feb 2025
Geomorphic imprint of high-mountain floods: insights from the 2022 hydrological extreme across the upper Indus River catchment in the northwestern Himalayas
Abhishek Kashyap
Kristen L. Cook
Mukunda Dev Behera
The interaction of tectonics, surface processes, and climate extremes impacts how the landscape responds to extreme hydrological events. In 2022, an anomalous precipitation event occurred during the monsoon season along the lower–middle reaches of the upper Indus River, resulting in short-lived high-magnitude flooding and socioeconomic disruption downstream. To understand the spatial relationship between the geomorphic response and climatic controls of this flood event, as well as their primary triggers, we performed a landscape analysis using topographic metrics and quantified the causal association between hydroclimatic variables. Temperature anomalies in upstream glaciated subcatchments had a considerable impact on snow cover distribution, based on our observations. As snow cover changed, glacial-melt runoff rose, contributing to increased fluvial stream power after traversing higher-order reaches. The higher-order reaches of the upper Indus River received an anomalously high amount of precipitation, which, when combined with substantial glacial-melt discharge, contributed to an extreme flood across the high-relief, steep-gradient channels. The flood-affected regions had high mean basin ksn (normalized steepness index) values and stream length–gradient (SL) index values, with numerous spikes in their magnitudes along their channel profiles downstream. To determine how the lower–middle reaches of the upper Indus River responded to this flood event, we employed the enhanced vegetation index (EVI) and the normalized difference water index (NDWI) as change indicator metrics. We observed an inverse causal influence of the NDWI on the EVI and a statistically significant relationship between anomalous stream power and the relative EVI, suggesting that the downstream channel morphology changed rapidly during this episodic event and highlighting the EVI as a useful indicator of geomorphic change. We suggest that this extreme flood event resulted from the interaction of anomalous glacial melt and anomalous precipitation over a high-relief landscape, with a certain causal connection to anomalous temperature observed over the event duration. The synoptic observations suggest that this meteorological condition involves the interaction of the Indian summer monsoon (ISM) and western-disturbance (WD) moisture fluxes. However, the geomorphic consequences of such anomalous monsoon periods, as well as their influence on long-term landscape change, are still unclear.
- Article
(7409 KB) - Full-text XML
-
Supplement
(1216 KB) - BibTeX
- EndNote


High-mountain floods in the Himalayas are associated with several processes, including the coupling of the Indian summer monsoon (ISM) and western-disturbance (WD) circulations (Houze et al., 2011), cloudbursts (Dimri et al., 2016), anomalous precipitation, cloud-scale interconnected atmospheric anomalies (Dimri et al., 2017), and geomorphically driven surface processes (Sharma et al., 2017). There is growing recognition that landscapes may evolve through the cumulative effects of extreme episodic events, particularly in rapidly eroding terrains (Korup, 2012; Cook et al., 2018). Recent studies suggest that even minor shifts in weather patterns can have a significant impact on the frequency and magnitude of floods (Knox, 2000; Liu et al., 2015; Benito et al., 2015; Sharma et al., 2022). It has also been suggested that high-magnitude flood occurrences in the bedrock rivers draining the Himalayas are the geomorphic agents with the most significant impact on the evolution of the regional landscape, as well as on the residents of regions downstream (Bookhagen et al., 2005a; Sharma et al., 2017; Panda et al., 2020).
The Tibetan Plateau and its surrounding mountainous regions, such as the Himalayas and the Karakoram, are critical for the downstream hydrology and water availability of the Indus River system (Hewitt, 2009; Immerzeel et al., 2010) (Fig. 1). The majority of the hydrological budget of the Indus River comes from precipitation, snowmelt, and glaciers, but the relative contributions of these factors vary among the major contributing tributaries (Bookhagen and Burbank 2010; Wu et al., 2021). The upper Indus River catchment receives precipitation from two distinct climatic systems, WDs and the ISM, across its foreland and highlands in the northwestern (NW) Himalayas (Bookhagen and Burbank, 2006, 2010). However, it remains unclear how these two distinct circulation patterns interact over the Himalayan landscape and what their potential influence on long-term geomorphic change might be (Dimri et al., 2015, 2017; Ray et al., 2019).
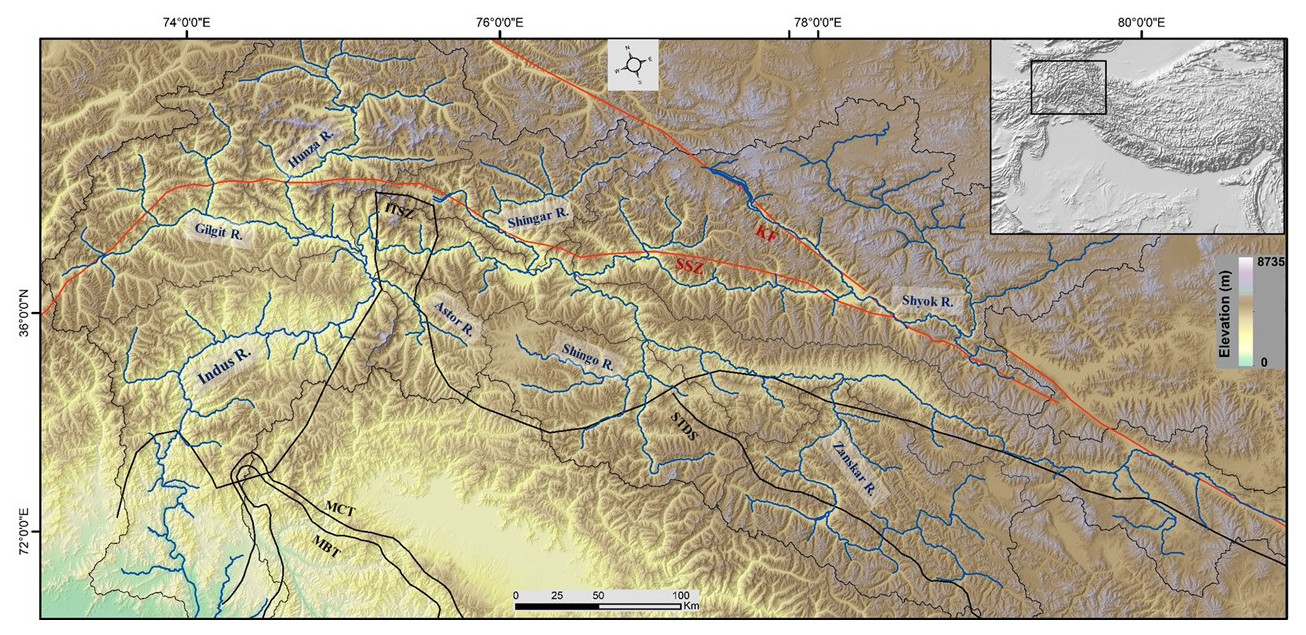
Figure 1Regional topographic setting of the upper Indus River catchment, along with its major tributaries (R: River), overlaid with the outlines of major geological structures. (MBT: Main Boundary Thrust. MCT: Main Central Thrust. STDS: South Tibetan Detachment System. ITSZ: Indus–Tsangpo Suture Zone. SSZ: Shyok Suture Zone. KF: Karakoram fault.)
Short-duration episodic weather events have a significant influence on hillslope surface processes and rates of bedrock erosion by modulating mass movement and subsequent landscape evolution (Snyder et al., 2003; Bookhagen et al., 2005b; Srivastava et al., 2017). During such events, a large amount of sediment is transported through the fluvial system, some of which is temporarily deposited in low-gradient reaches, altering the landscape before being finally deposited in oceanic sinks (Goodbred et al., 2003; Panda et al., 2020). The geomorphic signatures of the catchment morphology are vital for understanding and identifying the channel response involved in such events, as well as the processes and patterns of erosion (Kashyap and Behera, 2024; Sharma et al., 2017).
From the beginning of July until the end of August 2022, large portions of the Indus River catchment experienced unprecedented monsoon precipitation (Otto et al., 2023; Nanditha et al., 2023). Some recent studies have suggested that the primary triggers of this anomalous precipitation event were an intensely low atmospheric circulation pattern, low sea surface temperatures across the eastern Pacific, and the advent of a La Niña event (Otto et al., 2023; Nanditha et al., 2023). This extreme precipitation event resulted in a catastrophic flood in the low-elevation flood plains of the Indus River catchment (Jones, 2022; Otto et al., 2023; Ma et al., 2023). This severe flood had an extreme impact on the southern provinces of Pakistan, causing the internal displacement of about ∼30–32 million people and the deaths of ∼1500–1600 people (Bhutto, 2022; Khokhar, 2022; Ma et al., 2023). Economic losses in excess of USD ∼25–30 billion have been anticipated (Bhutto, 2022; Otto et al., 2023). According to reports, the peak flow rate of the 2022 flood exceeded that of the disastrous 2010 floods that occurred across Pakistan (Bhutto, 2022; Nanditha et al., 2023). The magnitude of fluvial discharge in the upstream tributaries of the Indus River increased predominantly as a result of increased streamflow across glaciated channels (NDMA, 2022). However, the geomorphic consequences and main drivers of this high-magnitude flooding in the upper Indus River catchment have not been evaluated yet.
In the present study, we evaluated the spatial distribution of channel changes in the mountainous portion of the upper Indus River catchment due to the extreme precipitation event that occurred during the months of July and August 2022. We employed a channel slope–discharge product along the trunk channel of the upper Indus River to estimate the anomalies in stream power resulting from the anomalous precipitation event during July and August 2022. We used a random-forest-based machine-learning approach to compare the observed and predicted intensities of precipitation and runoff by assessing the mean climatology of independent hydroclimatic variables. We further quantified the causal relationship between hydroclimatic drivers using nonlinear time-series data over the event duration. We investigated the channel response to this episodic flood event by using the normalized difference water index (NDWI) and the enhanced vegetation index (EVI) as change indicator metrics and comparing these metrics to event characteristics such as anomalous precipitation, stream power, and channel metrics. We aim to better understand the controls on where and when these types of extreme hydrological events may substantially modify rivers and landscapes, allowing for better anticipation of the associated geomorphic hazards, and we also seek to better constrain the potential role of these episodic events in driving long-term geomorphic change across the western syntaxial region.
In the Himalayas, the erosion rates are high, and the landscape of the mountainous terrain is shaped by interactions between river systems and basement tectonics (Jaiswara et al., 2019, 2020). Among the Himalayan river systems, the upper Indus River is unique, featuring a fully developed ∼1200–1400 km long, eighth–ninth-order drainage network that enters the Himalayan terrain as an antecedent channel and cuts right through the seismically active belt in the Indus River gorges (Fig. 1). This catchment is highly affected by recurrent landslides and debris flow, as well as by episodic glacial and landslide dams, which represent significant geomorphic hazards (Korup and Montgomery, 2008; Korup et al., 2010a, b).
The upper Indus River flows through the highly tectonically active region of the Nanga Parbat–Haramosh massif (NP-HM), which is one of the highest-relief regions on Earth ( m) and has a strong potential for rapidly eroding uplifted material (Leland et al., 1998; Shahzad et al., 2009; Korup et al., 2010a, b). The NP-HM region experiences the highest recorded rates of denudation and channel incision on Earth (∼12 mm yr−1), as well as high rates of tectonic uplift (∼4–10 mm yr−1), and forms river anticlines across extremely weak crust (Koons et al., 2002, 2013; Zeitler et al., 2001, 2014; Butler, 2019). This has a significant impact on the tectonics and morphology of the western Himalayas (Hewitt, 2009; Zeitler et al., 2014). The upper Indus River catchment (UIRC) is characterized by an extremely steep channel gradient of –25°, a high topographic relief of ∼4000–5000 m, and a large number of snow-covered peaks (Hewitt, 2007; Farinotti et al., 2020).
As a fraction of the total annual discharge, snowmelt constitutes up to 50 % in the upper Indus River catchment (UIRC) (Bookhagen and Burbank, 2006, 2010; Scherler et al., 2011). Due to the western-disturbance (WD) inclination, the UIRC experiences a lot of precipitation in winter and spring (Kapnick et al., 2014), while the influence of the ISM in the region weakens toward the northwest due to the orographic barrier of the high mountains (Forsythe et al., 2017). Annual precipitation in the UIRC increases with elevation. Across the northern valley floors – in the rain shadows – it ranges from 100–200 mm yr−1, while at elevations of ∼4000–4400 m a.s.l. (above sea level), it ranges from 600–800 mm yr−1, and above ∼5000 m a.s.l., it ranges from 1500–2000 mm yr−1 (Sharif et al., 2013; Wu et al., 2021). From October to March, the monthly mean temperatures in the UIRC are below freezing at elevations m (Archer, 2004). Discharge in the tributary channels of the upper Indus River that depend on glacier meltwater has a strong association with summertime mean air temperatures across the Karakoram (Forsythe et al., 2017; Wu et al., 2021).
3.1 Data used
In the present study, we used a 30 m Shuttle Radar Topography Mission (SRTM) digital elevation model (DEM) for landscape characterization and to estimate geomorphic quantitative parameters. To investigate the impact of the climatic variables driving this extreme event on regional erosion processes, we utilized daily precipitation datasets from CHIRPS (Climate Hazards Group InfraRed Precipitation with Station data – Version 2.0 Final) for the period from 1 July to 31 August, covering 40 years (1982–2022). Several previous studies have investigated CHIRPS precipitation datasets at daily, monthly, and annual temporal scales across the Indus Basin (Gao et al., 2018; Ullah et al., 2021; Nawaz et al., 2021; Shahid et al., 2021). These studies have extensively evaluated CHIRPS's performance against regional ground datasets obtained from meteorological stations. Several studies (Katsanos et al., 2016; Paredes-Trejo et al., 2017; Bai et al., 2018; Gao et al., 2018) have recommended CHIRPS for hydrological analysis and water resource management due to its fine spatiotemporal resolution.
We investigated the spatiotemporal distribution of hydrometeorological variables using daily datasets from 1 July to 31 August. ERA5-Land, a daily aggregated ECMWF climate reanalysis dataset with a spatial resolution of 11 132 m, provided data on 2 m air temperature, skin temperature, dew point temperature, snowmelt, and runoff. We used remote-sensing-based indices to detect signatures of anomalous changes over the landscape. We computed these metrics over the monthly mean for July and August 2022 using daily datasets for the MODIS-based normalized difference water index (NDWI); normalized difference snow index (NDSI); snow albedo; EVI; and surface reflectance bands B1 and B2, which have a 500 m spatial resolution.
3.2 Drainage network extraction and landscape analysis
We extracted the drainage network from the DEM using the ArcGIS platform. A regional slope map was produced by running a 1000 m radius mean filter over the slope model derived from the DEM, and a regional relief map was generated by passing a 1000 m circular-radius focal range window over the DEM. Further analysis of the DEM and the derived flow accumulation data was performed in MATLAB using the “Transient-profiler” tools (Jaiswara et al., 2019, 2020). We extracted the longitudinal profiles of the bedrock channels within an accumulation region of about 1×10⁶ m2 and the channel network of the upper Indus River catchment using TopoToolbox (Wobus et al., 2006; Kirby and Whipple, 2012; Schwanghart and Scherler, 2014). We used a 1000 m smoothing window and a 20 m vertical interval to sample the channel networks in order to reduce the noise and artifacts embedded in the elevation data.
3.3 Quantitative geomorphic parameters
We used geomorphic quantitative parameters, such as the SL (stream length–gradient) index, normalized steepness index (ksn), and stream power of the upper Indus River trunk channel, to evaluate the influence of the high-magnitude flooding event across the upper Indus River during July and August 2022. To evaluate the spatial variability in the flood magnitude and channel morphology, these metrics were plotted on the longitudinal profile of the trunk channel.
3.3.1 Stream length–gradient index (SL index)
Rivers often achieve an equilibrium or steady state between erosion and sedimentation, which is represented by a concave longitudinal river profile (Schumm et al., 2000). Tectonic, lithological, and/or climatic factors often result in shifts in river profiles from this expected steady-state condition (Hack, 1973; Burbank and Anderson, 2011). Here, we use the stream length–gradient (SL) index to identify zones of topographic break and changes in the channel gradient of the longitudinal profile, employing the following equation:
where SL denotes the steepness or gradient of the profile for the local reach, L is the total river length from the midpoint of the local reach to the highest point on the channel, ΔH is the change in elevation over the reach, and ΔL is the length of the reach. Thus, represents the channel slope or gradient of the reach. A sharp lithological variation and/or differential uplift across active structures are frequently linked to an abrupt change in the SL index along the river (Hack, 1973; Jaiswara et al., 2020; Kashyap et al., 2024).
3.3.2 Channel steepness index
We extracted the bedrock profile of the upper Indus River, which can be described using the power-law relationship between the upstream drainage area (A) and channel gradient (S) as follows (Jaiswara et al., 2019, 2020; Kashyap et al., 2024):
where is the channel steepness index, is the channel concavity index, m and n are positive constants, and E is the erosion rate at a steady state (Wobus et al., 2006; Kirby and Whipple, 2012). The relative magnitude of ks is often related to the surface uplift rate as well as the erosional efficiency across a bedrock catchment (Snyder et al., 2003; Wobus et al., 2006).
3.3.3 Stream power estimation
The normalized steepness index (ksn) has emerged as an important topographic metric, featuring a significant correlation with erosion rates over a wide range of timescales (Wobus et al., 2006; Jaiswara et al., 2019; Kashyap et al., 2024). However, one major drawback of ksn is that it includes an assumption of spatially constant precipitation because the upstream drainage area is used as a proxy for discharge (Adams et al., 2020; Leonard et al., 2023).
In the present study, we incorporate precipitation intensity into the stream power calculation to analyze the anomalous stream power observed along the trunk channel during the flood event. We estimate the precipitation-induced stream power using the slope–discharge method, which involves multiplying the accumulated flow distance weighted by precipitation by the hyperbolic tangent function of the channel gradient along the flow path (Adams et al., 2020; Leonard et al., 2024). The estimation of stream power (KsnQ) as a function of channel discharge can be calculated as
where S is the channel gradient, FD is the accumulated flow distance, and p is the accumulated precipitation (Leonard et al., 2023, 2024). Thus, KsnQ is a normalized version of the channel steepness metric that uses the product of the channel gradient (S) and upstream discharge (Q), estimated from the mean precipitation (P), as a fluvial-discharge proxy. This enables KsnQ to account for the spatial and temporal variability in precipitation observed along the upper Indus River during the high-magnitude flood event. Accumulated precipitation resolves spatial patterns well and scales nearly linearly with relevant discharge, particularly for large and long-lasting precipitation events (Rossi et al., 2016; Leonard et al., 2023, 2024).
3.4 Machine-learning-based approach for modeling the anomalous event characteristics
The random forest (RF) technique is a supervised machine-learning method that has been used as a tree-based ensemble technique and includes a bagging or bootstrapping algorithm (Breiman, 2001; Wolfensberger et al., 2021). In the present study, we use an RF-based multivariate regression approach to estimate the anomalous precipitation and runoff intensity for July and August 2022, using the independent variables obtained from classifying variable importance. Accordingly, we employ the following equation:
where hi(x) denotes the ith regression tree output (hi) on sample x. Therefore, the prediction from the RF approach is the mean of the predicted values of all the decision trees. T denotes the regression trees for the regression prediction.
Based on the mean climatology of the last 40 years, we predicted the daily anomalous precipitation and runoff intensity for the 2022 event and compared them with the observed actual values. We employed the highest-significance variables, as well as precipitation and runoff data from 1982 to 2021, as a training set. We utilized a time-series cross-validation approach in this study to evaluate the random forest model's performance in predicting the precipitation and runoff corresponding to the high-elevation flood event that occurred in the upper Indus River catchment in July and August 2022. Given the temporal dependence and sequential pattern of hydroclimatic data, using a normal K-fold cross-validation method could result in data leakage by allowing future data to inform past projections. To address this issue, we employed time-series cross-validation to maintain the data within chronological order. We trained the model using a sliding-window method, gradually moving the training window forward in time with each iteration. Specifically, we designed the first training window to contain data from the first 30 years, leaving the last 10 years for testing. In each successive iteration, we increased the training window by 1 year and retrained the model on the expanded training set. We trained these models on meteorological variables obtained from the classification of the most significant variables, as well as on other physical drivers associated with high-elevation flood episodes in the region. We evaluated the model's performance based on the accuracy of the precipitation and runoff predictions, using metrics such as the mean absolute error (MAE), mean square error (MSE), and root mean square error (RMSE) (Tables S1 and S2 in the Supplement). We computed these metrics for each rolling window to gain insight into the model's performance across various time periods, especially in the lead-up to the 2022 flood event. In order to utilize the independent variables to estimate these event characteristics, we first classified the hydroclimatic variables based on their importance using the RF classification approach. Then, using the RF multivariate regression approach, we selected only the independent variables with the highest significance to estimate the anomalous precipitation and runoff intensity during the event duration.
3.5 Causal discovery among hydroclimatic variables
Causal methodologies have been utilized to evaluate whether and how changes in one hydroclimatological variable during an anomalous extreme event influence the magnitude of another (Runge et al., 2019a; Nowack et al., 2020). To understand how an extreme event is regulated over high mountainous terrain, a temporal investigation of event characteristics is required. Using this evaluation, we can gain insight into how the conditioning hydroclimatic variables that regulate these extreme events evolve throughout the event duration in a catchment (Runge, 2018; Krich et al., 2020). Understanding directional dependencies is crucial for distinguishing them from connections that cannot be deduced using any statistical model (Kretschmer et al., 2017; Karmouche et al., 2023).
In this study, we use causal stationarity and the absence of contemporaneous causal effects for the time-series datasets, applying the PCMCI and MCI approaches, defined as follows (Tibau et al., 2022; Runge et al., 2023). The PCMCI approach is a causal identification technique that combines the momentary conditional independence (MCI) approach with the PC (Peter and Clark) algorithm (Runge et al., 2019b; Nowack et al., 2020). Given a set of multivariate time series, the PCMCI approach estimates a time-series graph that depicts the conditional independencies among the time-lagged factors (Runge et al., 2014, 2019a). In addition to the PCMCI approach, we use the ParCorr linear independence test, based on partial correlations (Runge et al., 2014, 2023).
In order to evaluate the meteorological disturbances associated with the upper Indus River flood of 2022, we identified the causal lag connection between hydroclimatic variables, with a specific focus on exploring the meteorological conditions leading up to and occurring during the flood event. We focused on identifying the short-term meteorological drivers that triggered the anomalous-precipitation-driven, high-elevation flood and on understanding the distribution of the flood's immediate impacts within the upper Indus River catchment. We emphasize that this study does not attempt to explore the causality of long-term climatic changes or assess the full geomorphic consequences of the flood on the landscape. We deliberately limit the scope to comprehend the meteorological conditions and their direct impact on the flood during the July–August 2022 period. By narrowing our focus to short-term hydroclimatic interactions, we aim to offer insights into key atmospheric processes and their role in shaping the event's severity, rather than the flood's broader or longer-term geomorphic impacts.
In the present study, we use daily datasets of hydroclimatological variables and group them as follows: temperature gradient (Tg), including air temperature, surface temperature, and dew point temperature; rainfall gradient (Rg), including precipitation intensity, runoff, and snowmelt; and anomalous-change (Ac) indicators, including the EVI, NDWI, and NDSI (covering 1 July to 31 August 2022, i.e., 62 observational intervals). We evaluate the causal interference between these hydroclimatic variables using the MCI approach, employing a maximum 2 d lag period (τmax=2) and a significance threshold set to 0.05 (α=0.05), in order to examine the spatially interdependent relationships among these variables during 2 d event periods.
3.6 Moisture pathways
Recent studies have used the Hybrid Single-Particle Lagrangian Integrated Trajectory (HYSPLIT) model (https://www.ready.noaa.gov/HYSPLIT_traj.php, last access: 4 December 2019) to determine the probable moisture parcel source region (Joshi et al., 2023) and to identify moisture pathways (Wang et al., 2018; Joshi et al., 2023). To determine the backward trajectory following the anomalous precipitation events, this study used the HYSPLIT model. We used three starting heights (500, 1000, and 3000 m a.s.l.) to calculate the backward trajectory for each day of July and August 2022 as the HYSPLIT model required the start date and time, location, and height of each precipitation event (Wang et al., 2018). This study used meteorological data with a spatial resolution of 1°×1° from the Global Data Assimilation System of the National Centers for Environmental Prediction (NCEP-GDAS).
4.1 Geomorphic analysis of the terrain of the upper Indus River
The upper Indus River is around ∼1400–1600 km long and forms multiple loops, both parallel to and in opposition to the regional structural trend. Its bed elevation ranges from ∼500 to 6000 m. The river exhibits distinct morphological characteristics along its flow path with regard to its topographic attributes and derivatives. Over the elevated low-relief landscape in the Tibetan Plateau, the relief and channel gradient range from ∼0–500 m and 0–10°, respectively; the SL index values correspond to , and the mean basin ksn values are m0.9 (Figs. 2 and 3a). Then, as the river traverses the NP-HM region, there is a progressive rise in the local relief and channel gradient to –3000 m (–35°), which is also reflected in the SL index (2.5×10⁴) and the mean ksn value ( m0.9). This region is characterized by topographic discontinuities across active structures, leading to high relief variation and topographic roughness.
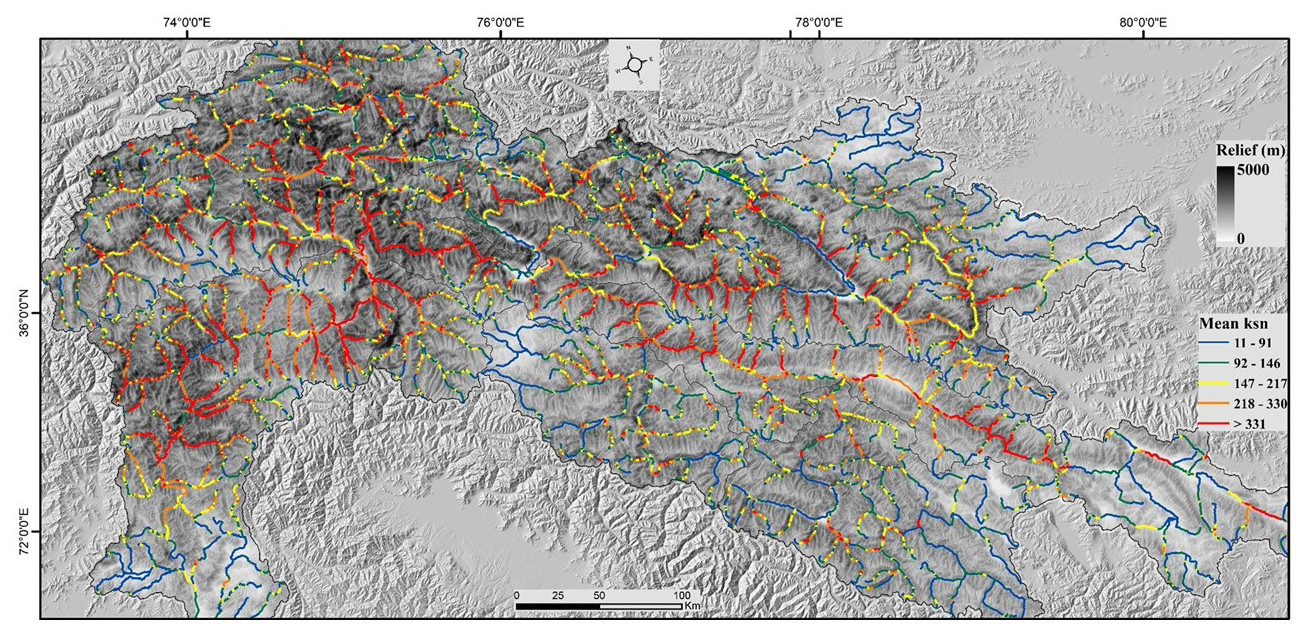
Figure 2Spatial distribution of local relief, overlaid with mean basin ksn ranges across the upper Indus River catchment.
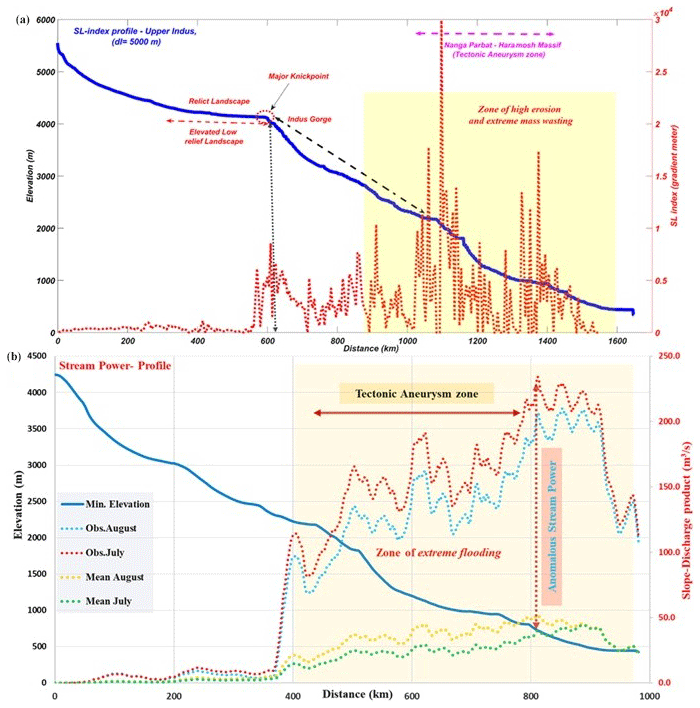
Figure 3(a) Longitudinal profile of the trunk channel of the upper Indus River, depicted with the SL index (“dl” refers to change in channel length, and “dh” refers to change in channel elevation). (b) The longitudinal profile of the trunk channel of the upper Indus River, depicted with stream power (“Obs.August” and “Obs.July” refer to observations for August and July related to stream power for the year 2022, whereas “Mean August” and “Mean July” represent the average stream power for the previous 40 years of climatological observations). The stream power profile is illustrated only for the highest-order trunk channel of the upper Indus River, as indicated by the dashed black line in panel (a).
The tributaries in the upstream glaciated valleys that flow parallel to the structural trend have a higher mean channel gradient (–30°) and topographic relief (–3000 m) (Fig. 2). When these tributary channels start to descend toward the main stream after following the glaciated landscape, the SL index and ksn values for the trunk channels show a significant rise at a mean elevation of ∼3000–4000 m. Approaching the southern mountain front, the main trunk channel relief and channel gradient are ∼1000–2000 m and ∼15–25°, respectively (Fig. 3a).
The spatial association of higher ksn values ( m0.9), topographic relief (∼1500–2000 m), and longitudinal increases in channel gradient along the main downstream upper Indus River channel suggests a higher erosional regime. The high values of these various topographic metrics highlight zones of accelerated erosion, where the river is in gradational disequilibrium. Furthermore, this tectonically active southern front coincides with a region that receives significant levels of annual mean precipitation (∼1500–2500 mm yr−1), suggesting a tectonics–climate linkage in the erosional process.
4.2 Spatial distribution of hydroclimatic anomalies over the event duration
The downstream reach of the upper Indus River trunk channel received a significant amount of anomalous precipitation (–80 mm d−1) during the observation period of July and August 2022 (Fig. 4a and b). The spatial variability in anomalous precipitation had a range of –40 mm d−1 along the major glaciated tributaries, such as the Hunza, Astor, Gilgit, Shingo, and Zanskar rivers. In July and August 2022, the total extent of anomalous precipitation was around ∼900–1000 mm per month, approximately 300 %–400 % more than the long-term (1982–2022) mean climatology. From July to August 2022, there was continuous precipitation in the high-gradient downstream region, and due to the antecedent weather conditions, extreme precipitation likely produced suitable conditions for high-magnitude flooding. The potential geomorphic response to such anomalous precipitation is suggested by the resulting anomalous stream power over the downstream channels (Fig. 4c and d). The spatial distribution of anomalous stream power shows that the greatest increase occurred at ∼400–800 km along the channel profile downstream. For both July and August 2022, we observed a significant rise in stream power, reaching m3 s−1 above the mean values (Fig. 3b).
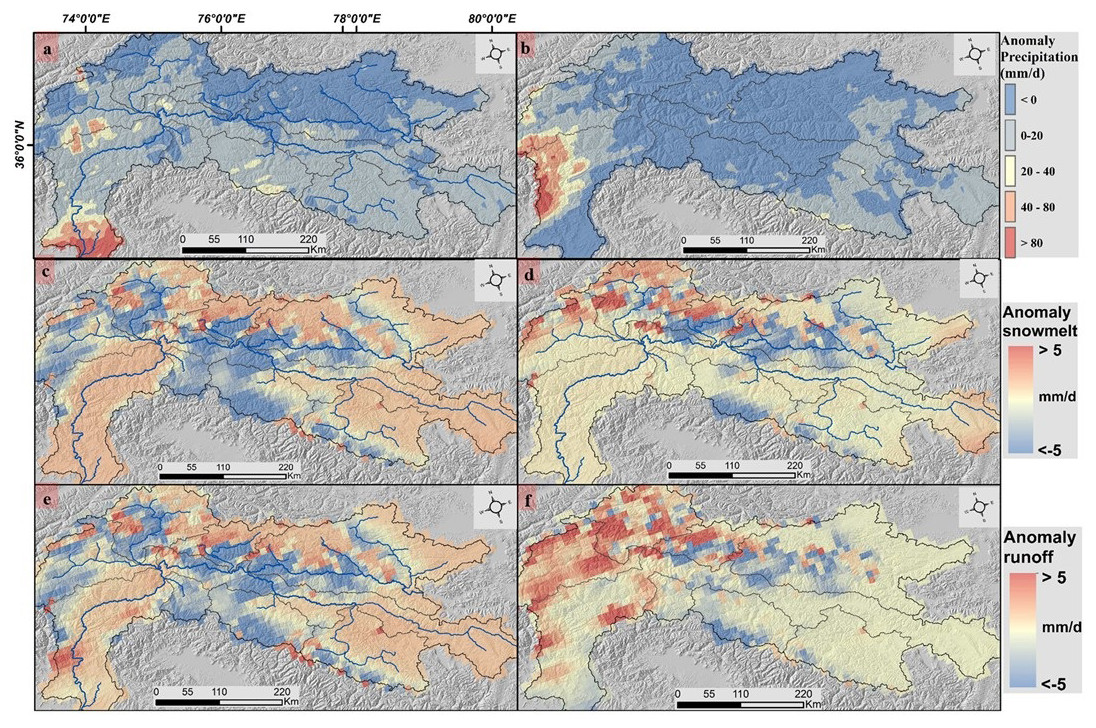
Figure 4Spatial distributions of hydrometeorological variables across the upper Indus River catchment for the anomalous months of July and August 2022. (a) Precipitation (July). (b) Precipitation (August). (c) Snowmelt (July). (d) Snowmelt (August). (e) Runoff (July). (f) Runoff (August).
During the observation period, other variables, such as runoff and snowmelt, also showed positive anomalies across the upstream glaciated subcatchments in the Karakoram (Fig. 4e and f). Furthermore, during July and August 2022, the temperature variables indicated a positive deviation from the mean climatological trend over the glaciated catchments. In the upstream subcatchments of the Shyok, Shingar, Hunza, and Gilgit rivers, air and dew point temperatures reached ∼3 °C above the mean, while surface temperatures reached ∼6 °C above the mean (Fig. 5). The spatial distribution of anomalous temperatures aligns well with the magnitude of anomalous snowmelt and runoff across the upstream glaciated catchments.
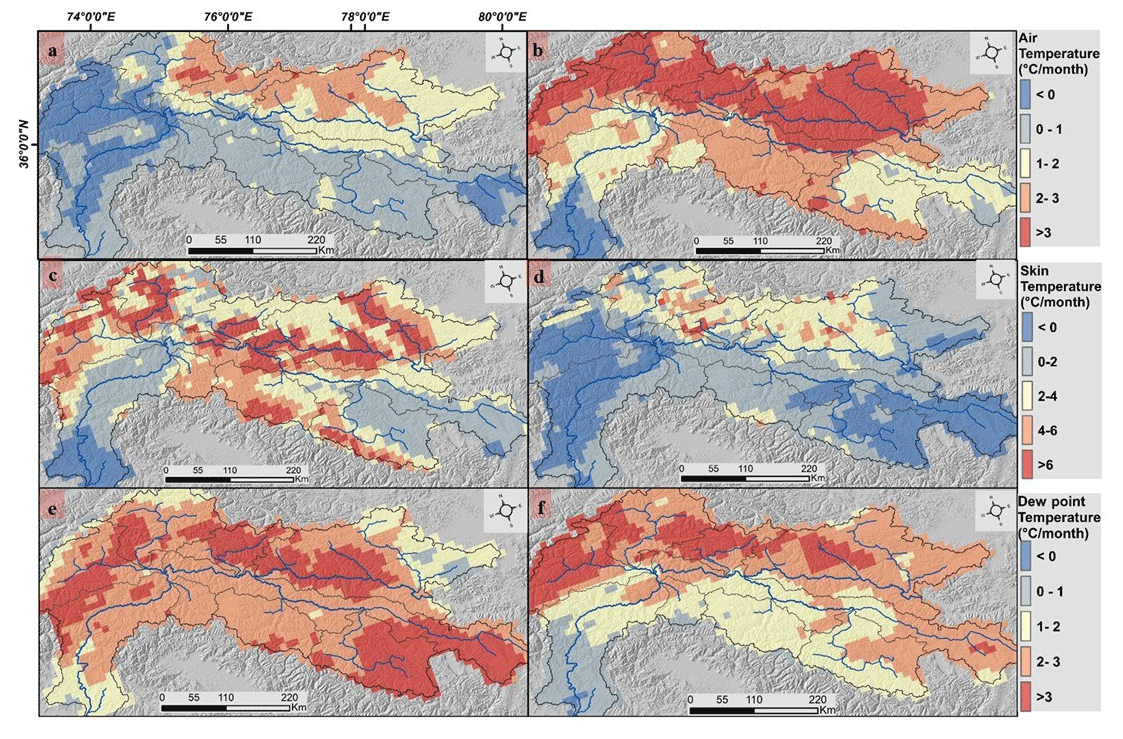
Figure 5Spatial distributions of hydrometeorological variables across the upper Indus River catchment for the anomalous months of July and August 2022. (a) Air temperature (July). (b) Air temperature (August). (c) Surface temperature (July). (d) Surface temperature (August). (e) Dew point temperature (July). (f) Dew point temperature (August).
We also observed a significant shift in the spatial distribution of change indicator variables during the observation period. In July 2022, the lower–middle reaches of the upper Indus River exhibited a negative change in the EVI (∼0–0.21) and a positive relative NDWI (∼0.15–0.20). Such an inverse relationship between these two change indicators was also found in the upstream channel in August. During the event, the tributary channels in the upstream glaciated landscape experienced a significant change in snow cover distribution, as demonstrated by the spatial variations in the relative NDSI (∼0–0.63). The changes in relative snow cover correspond directly to increases in snowmelt and glacial runoff across glaciated catchments (Fig. 6). We observed a significant relationship (p<0.005; R=0.81) between the relative EVI metric and the anomalous stream power in the upper Indus River trunk channel and along its main tributaries. The anomalous stream power of the upper Indus River and all of its major tributaries corresponds to a proportion of EVI change that exceeds that across low-gradient regions. This positive relationship, with an increasing trend, suggests a substantial geomorphic response due to extreme flooding. However, a negative relationship between anomalous stream power and the EVI can also be observed across the channels of the Astor and Shingo rivers (Fig. 7).
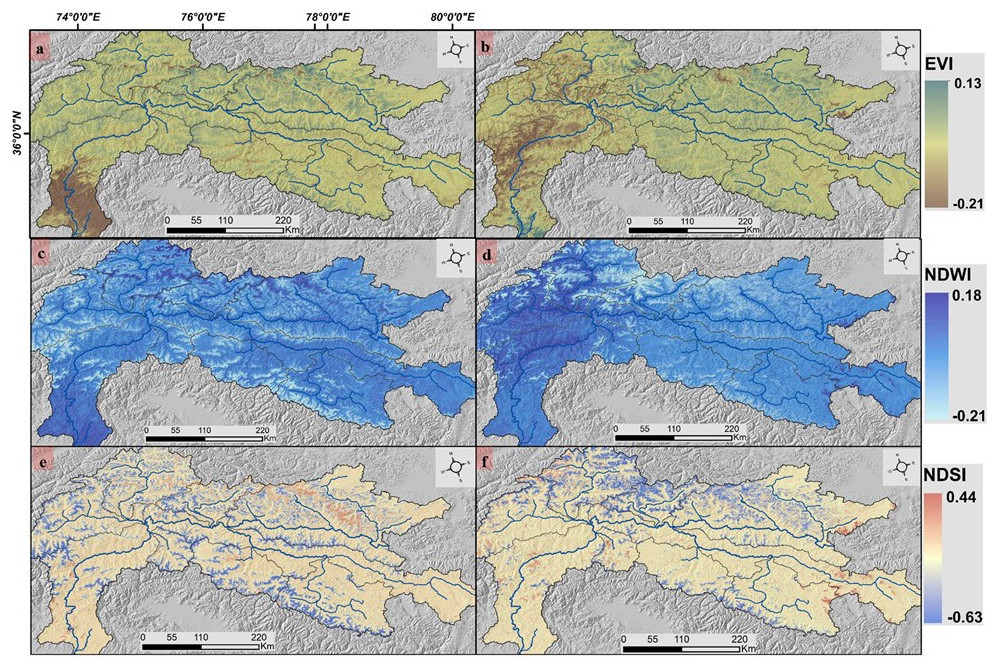
Figure 6Spatial distributions of hydrometeorological variables across the upper Indus River catchment for the anomalous months of July and August 2022. (a) EVI (July). (b) EVI (August). (c) NDWI (July). (d) NDWI (August). (e) NDSI (July). (f) NDSI (August).
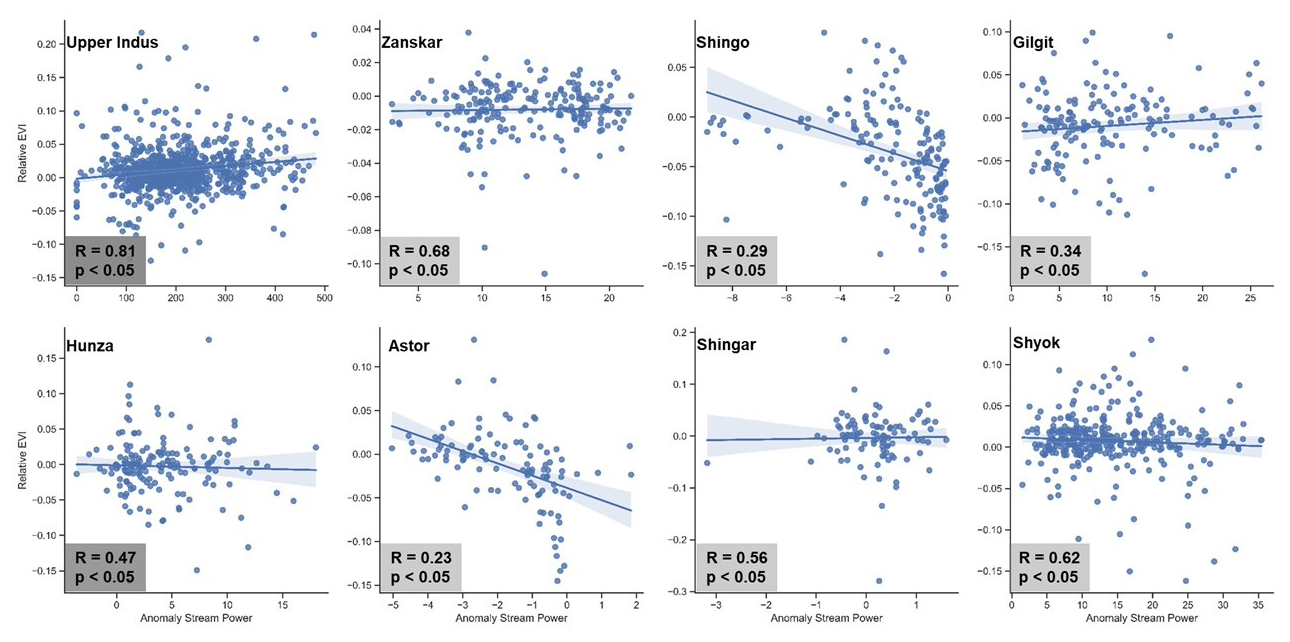
Figure 7Statistical relationship between the relative EVI and anomalous stream power from 1 July to 31 August 2022 with respect to the upper Indus River catchment and all its major tributaries.
4.3 Machine-learning-based approach for quantifying the event anomalies
The RF-classification-based determination of variable importance indicates that dew point temperature is the most significant variable in estimating precipitation intensity. Other significant variables include surface temperature and air temperature. The relative NDSI was the variable of highest significance for estimating precipitation in all subcatchments except the Shingar River (Fig. S1 in the Supplement). Snowmelt, dew point temperature, the relative NDSI, and surface temperature are the most significant variables for each subcatchment when estimating runoff intensity. Surface temperature holds the highest significance in the trunk channel catchment of the upper Indus River, followed by air temperature and precipitation intensity (Fig. S2). The anomalous precipitation and runoff intensity are then estimated using these independent variables, with the highest significance obtained during classification.
The results show that the upper Indus River catchment received significantly more precipitation and runoff than predicted on multiple occasions in July and August 2022 (Fig. 8). The anomalous and extreme characteristics of the hydroclimatic and terrestrial drivers could explain this phenomenon. The upper Indus River catchment received a significant amount of anomalous precipitation, with an intensity of mm d−1, which is much higher than the predicted intensity for the period of observation. The channels in the higher-relief landscapes, such as those of the Astor and Gilgit rivers, encountered the second-highest anomalous incidence, with intensities of ∼80–100 mm d−1. The upstream glaciated catchments, such as the Shyok, Shingo, and Hunza rivers, also show persistent anomalous intensities of up to ∼100 mm d−1. The least impacted catchments were the Zanskar and Shingo rivers, despite experiencing high rates of precipitation, ranging from ∼60–80 mm d−1.
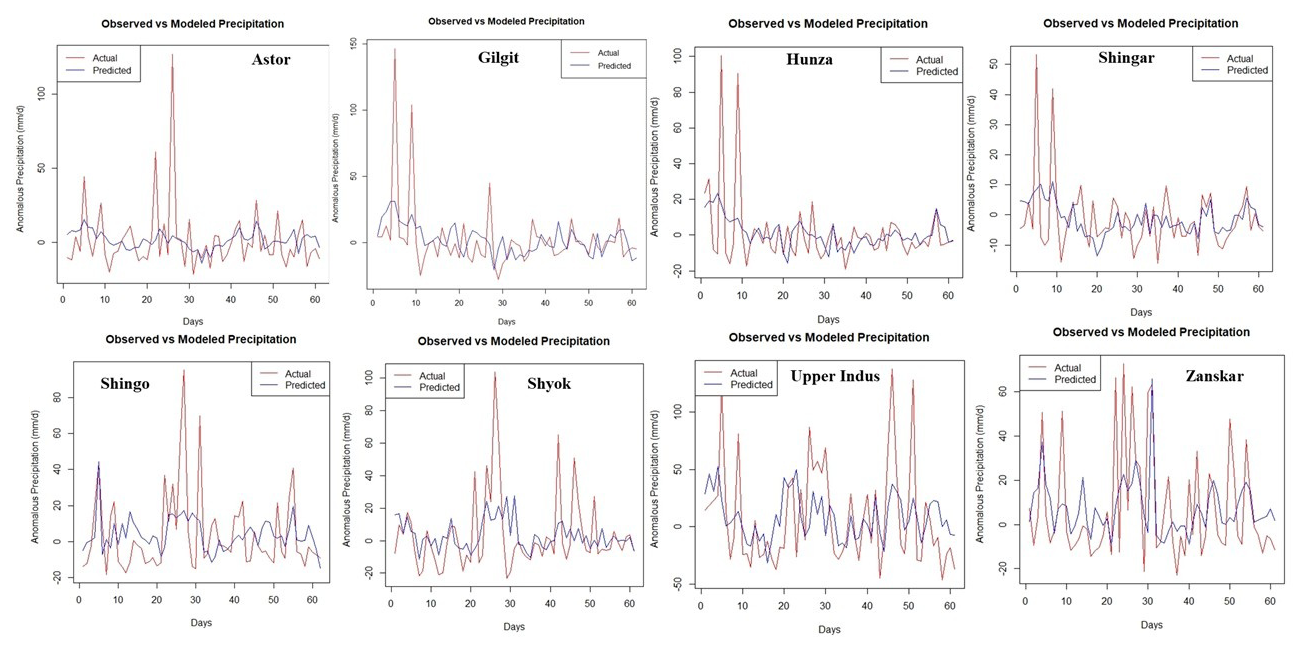
Figure 8Random-forest-regression-based comparison of observed vs. modeled anomalous precipitation from 1 July to 31 August 2022 with respect to the upper Indus River catchment and all its major tributaries.
Distributions of observed and predicted runoff show that the intensity of observed runoff corresponds to the precipitation trend. During the observation period, the upper Indus River catchment experienced much higher runoff rates. This catchment was followed by upstream glaciated subcatchments, including the Shyok (∼30–60 mm d−1), Shingo, and Gilgit (∼20–30 mm d−1) rivers. However, in the majority of the upstream subcatchments, the observed anomalous runoff intensity was insignificant (Fig. 9).
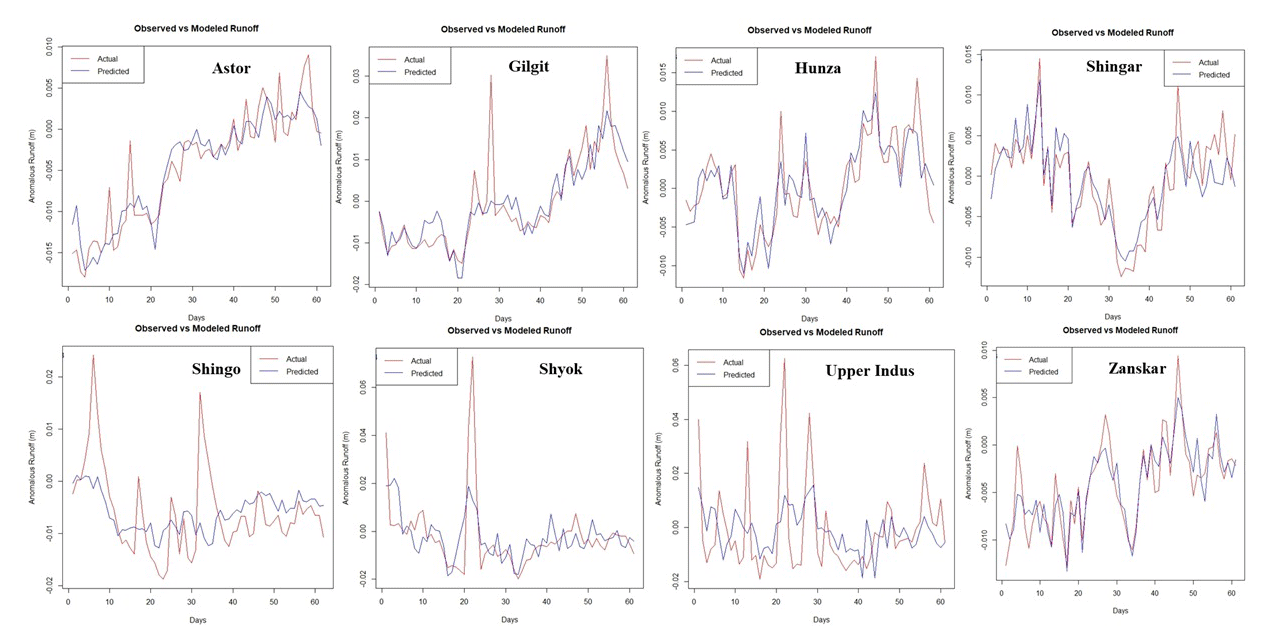
Figure 9Random-forest-regression-based comparison of observed vs. modeled anomalous runoff from 1 July to 31 August 2022 with respect to the upper Indus River catchment and all its major tributaries.
4.4 Causal relationship among hydroclimatic variables over the event duration
The causal analysis showed that the impact of numerous meteorological variables on the extreme flood across the terrain of the upper Indus River varied significantly. We observed a significant causal lagged connection between dew point temperature and the NDSI, both of which positively influenced precipitation intensity, with a 1 d lag observed across the upper Indus River catchment. Similarly, precipitation intensity and snowmelt exhibited a positive causal influence on the NDWI, with a 1 d lag period. For instance, the cross-correlation between precipitation and dew point temperature, which has a positive impact, is >0.4 over the event duration. There was a significant negative causal influence of the NDWI on the EVI, indicating an inversely proportional relationship across the observational lag period. The hydroclimatic variables, such as the precipitation intensity, snowmelt, NDWI, EVI, NDSI, air temperature, and surface temperature, exhibited nonlinear and nonstationary trends from 1 July to 31 August 2022, as shown by the autocorrelation and PCMCI magnitude throughout the time series. The auto-MCI ranges of these variables are comparatively very low. Runoff and dew point temperatures exhibit stationarity and a linear trend throughout the time series, with relatively high auto-MCI ranges. It is also observed that dew point temperature has a significant inherent connection with snowmelt and the NDSI, indicating that these variables have a direct causative relationship with a high cross-MCI range (Fig. 10). In a causal investigation, edges with arrows indicate a link between the drivers. However, depending on the available metrics, there may be an instant causal connection between the drivers. It should be observed that this relationship may not have been determined to be causative.

Figure 10Causal detection among hydroclimatic drivers featuring nonlinear time series from 1 July to 31 August 2022 with respect to the upper Indus River catchment, with a maximum allowable lag of 2 d at the 95 % confidence interval. (The following drivers are shown in the circles: dew point temperature (DT), surface temperature (ST), air temperature (AT), precipitation intensity (P), snowmelt (SM), runoff (RF), the normalized difference water index (NDWI), the normalized difference snow index (NDSI), and the enhanced vegetation index (EVI). The node color represents autocorrelation, whereas the link color represents the strength of the directional link. The lag level at which the link was found significant is indicated by the link label; the absence of this label indicates that the link was found at zero lag.)
4.5 Identifying moisture trajectories for the anomalous precipitation event
Based on observations of moisture source uptake along trajectories for the observation period from 1 July to 31 August 2022, precipitation across the orographic ridges of the upper Indus River terrain was delivered along two major pathways – one from Mediterranean Sea sources, such as western-disturbance-derived moisture from the onset of the monsoon, and another from the ISM, originating from the Bay of Bengal and the Arabian Sea. The WD routes provided the moisture sources for the precipitation along the 3000 m height trajectories, while the Arabian Sea, the Bay of Bengal, and the Himalayan foreland provided the moisture along the 500 and 1000 m trajectories. Furthermore, the anomalous temperature gradient observed for the months of July and August 2022 shows that the steep bedrock valleys cause abnormal air–mass feedback. The substantial divergence in the air–mass curve from mid-July to mid-August 2022 suggests that there may have been very high precipitation and temperature fluctuations during these periods (Fig. 11).
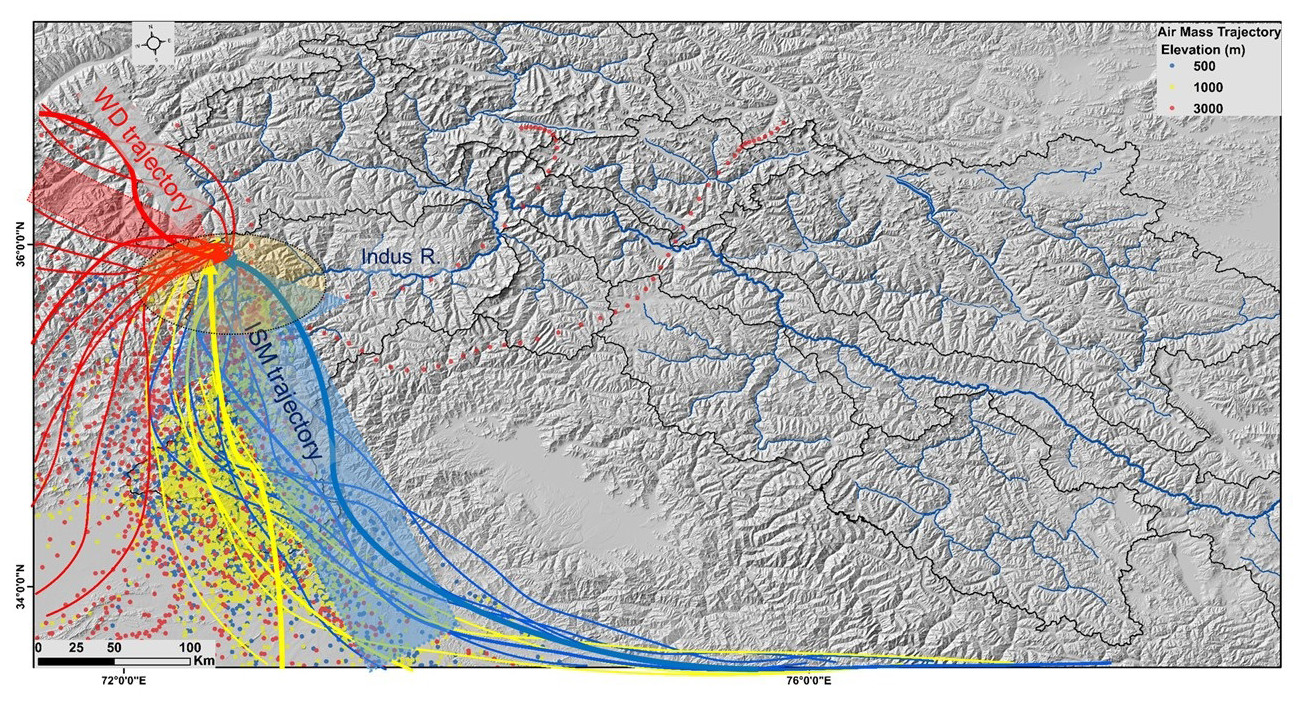
Figure 11Moisture pathways (backward trajectories) for the anomalous precipitation event across the upper Indus River catchment from 1 July to 31 August 2022. (The solid blue lines denote the trajectory at 500 m elevation, the solid yellow lines denote the trajectory at 1000 m elevation, and the solid red lines denote the trajectory at 3000 m elevation. The dotted blue and yellow lines indicate the ISM pathways, whereas the dotted red lines indicate the WD pathways).
5.1 Spatial relationship between topographic metrics and event anomalies
To characterize the geomorphic response to this extreme flood, we estimated the stream power over the trunk channel of the upper Indus River as an event anomaly. Understanding the spatial distribution of stream power along the longitudinal profile of bedrock rivers is essential for evaluating catchment-scale variability in channel responses to anomalous precipitation events (Whipple et al., 2000; Kaushal et al., 2020). The peaks and troughs in the stream power profile regulate the morphological characteristics of the bedrock channels (Schneider et al., 2014; Bawa et al., 2014; Sinha et al., 2017). The river morphology and channel shape are significantly impacted by temporal variations in flooding intensity during anomalous precipitation events (Bookhagen and Strecker, 2012; Scherler et al., 2011).
The initial ∼400–600 km segment of the upper Indus River is characterized by low-gradient channels as the river traverses the elevated low-relief landscape. After traversing the main stream and joining the highest-order channel across the syntaxial region, the river experiences a sharp rise in the stream power profile downstream. The western syntaxial region (NP-HM) in the NW Himalayas is one of the most rapidly uplifting (–10 mm yr−1) and eroding ( mm yr−1) regions on Earth, featuring extreme topographic relief (>3000 m) (Figs. 1 and 2). The sudden increase in the stream power of the upper Indus River after it traverses the NP-HM, along with the resultant extreme flood in the lower–middle reaches, was also attributed to the high elevation change ( m) and steep channel gradient (–30°) (Fig. 3b). The spatial variability in stream power is also strongly correlated with other topographic metrics, such as ksn and the SL index, which demonstrate a considerable rise in their longitudinal profiles when the channel crosses the NP-HM region (Fig. 3a). We observed that the stream power distribution along the longitudinal profiles of the upper Indus River is characterized by numerous peaks during both months of anomalous precipitation, July and August 2022 (Fig. 3b). The present study, which estimates stream power driven by anomalous precipitation, identifies regions across the upper Indus River catchment with high erosion potential corresponding to the 2022 flood event. However, field validation or high-resolution pre- and post-event DEMs are required to quantify the rate of erosion and the patterns triggered by this extreme flood event. Our analysis primarily draws upon pre- and post-event observations from remote-sensing-based indices and topographic analysis to spatially correlate estimated stream power with channel metrics.
The upstream glaciated channels of the trans-Himalayan and Karakoram ranges have a substantial glacial influence on erosion, contributing to the main trunk channel of the upper Indus River. Therefore, such high-magnitude floods ought to propagate through the channels of high mountainous tributaries, such as the Shyok, Gilgit, and Hunza rivers, depending on the landscape characteristics of the upper Indus River catchment. A moderate change in the distribution pattern of snow cover may have a significant impact on glacial runoff and substantially contribute to fluvial discharge. In addition to the southern mountain front, the headwaters and syntaxial zone of the upper Indus River catchment received a significant amount of precipitation, which contributed to the anomalous rise in stream power and substantially contributed to this extreme flood, influencing the channel geometry of the lower–middle reaches and driving high bedrock erosion (Fig. 4). However, the lower–middle reaches, with higher stream power, are distinguished by steep channel valleys and the absence of sediment deposition. This observation suggests that the higher-order channels of the upper Indus River, traversing higher-relief and steep-gradient valleys, likely possess direct first-order control over the pattern of erosion when combined with an anomalous rate of precipitation (Fig. 3b).
5.2 Hydrological extremes and causal connections
Our observations suggest that the interactions of glacial runoff with fluvial discharge over the steep-gradient channels combined to drive the extreme flood event across the upper Indus River catchment. These extreme hydrological episodes imply that the possible responses of atmospheric instabilities may be elevation-dependent (Dimri et al., 2015; Forsythe et al., 2017; Ullah et al., 2021; Sharma et al., 2022). They began with anomalous rises in temperature gradients over the glaciated subcatchments of the upper Indus River terrain, which drove rapid changes in snow cover distribution (Figs. 5 and 6). This directly impacted the magnitude of glacial runoff and contributed to an anomalous rise in fluvial stream power as it traversed downstream over higher-relief fluvial reaches (Fig. 6). The lower–middle reaches of the upper Indus River catchment witnessed an anomalous amount of precipitation intensity from early July to late August 2022 (Fig. 4). When compared to the annual mean climatology, the precipitation intensity in the lower–middle reaches of the upper Indus River was roughly ∼150 %–200 % higher during the 2022 monsoon period. The 2022 upper Indus River flood represents an abrupt change from the region's prior precipitation and runoff patterns. To study this anomaly, we utilized a random forest model trained on climatological data from the last 40 years (1982–2021), with an emphasis on the months of July and August. The model used previous climatology as a training dataset to estimate precipitation and runoff, which are significant drivers of flooding. Despite the resilience of the random forest model, the results revealed a substantial difference between the model's predictions and the actual observed data obtained from the 2022 flood event. The model, based on 40 years of past data, failed to capture the increased precipitation and runoff patterns observed in July and August 2022 (Figs. 8 and 9). The model's inability to predict rainfall intensity, as well as subsequent runoff, highlights the anomalous nature of the event. This disparity demonstrates that the 2022 flood not only was unusual but also went beyond the typical climatological shifts observed over the previous 4 decades. This emphasizes the necessity for future modeling efforts to include other predictors, such as changes in snowmelt dynamics, atmospheric circulation anomalies, and other nonstationary phenomena.
The moisture flux trajectories observed across the lower–middle reaches of the upper Indus River during the 2022 monsoonal period reveal two distinct sources of moisture pathways, indicating that the combined effect of westerly-driven precipitation and the active monsoon phase likely caused this episodic event (Wang et al., 2018) (Fig. 11). Over the past years, interactions between the moisture-laden ISM and southward-penetrating upper-level WD depressions have been linked to certain catastrophic western Himalayan floods, such as those that occurred in 2010 across Pakistan and 2013 in Uttarakhand, India (Rasmussen and Houze, 2012; Vellore et al., 2016; Dimri et al., 2016; Sharma et al., 2017). This anomalous rise in precipitation intensity rates contributes to the rapid increase in stream power across steep valleys. The combined causal influence of temperature and precipitation intensity, along with topography, plays an important role in modulating such episodic events as these variables ultimately regulate the amount of solid precipitation, influence changes in snow cover, and have a significant impact on snowmelt runoff (Fig. 10) (Bovy et al., 2016; Godard and Tucker, 2021; Delaney et al., 2023). This flood highlights the importance of understanding the cause-and-effect relationship between temperature and precipitation in high-elevation uplands.
5.3 Channel response to an extreme flood
This study used EVI change analysis as a significant event characteristic to capture changes in channel morphology triggered by the 2022 upper Indus River flood. The anomalous runoff events during the flood significantly altered channel geometries, and these changes were reflected in the spatial and temporal variations in the EVI (Fig. 6). Geomorphic processes such as inundation, erosion, and landsliding submerged or removed vegetation in areas characterized by drastic shifts in EVI ranges (Anderson and Goulden, 2011). The reduction in EVI ranges along steep channels highlights the expansion of waterbodies during flooding, while the surrounding areas experienced erosion and landslides due to extreme discharge. The broader geomorphic consequences of extreme hydrological events – such as river channel widening, sediment deposition, and riverbank erosion – are frequently linked to such changes in vegetation cover (Olen et al., 2016; Starke et al., 2020; Clift and Jonell, 2021; Scheip and Wegmann, 2021). While the EVI cannot directly measure hydrologic parameters, its ability to reflect vegetation loss makes it a useful proxy for assessing the intensity of geomorphic processes during floods. This capability is particularly important in high-mountain landscapes, such as the upper Indus River region, where steep terrain and glacial–fluvial regimes amplify the effects of extreme events.
We utilize the NDWI and EVI as change indicator metrics to understand changes in channel morphology resulting from this extreme flood event. The spatial variability in the EVI corresponds significantly with the increase in NDWI intensity observed downstream during July and August 2022 (Fig. 6). The substantial decrease in EVI values along downstream channels has also been attributed to the anomalous precipitation event, which led to increased surface runoff, higher NDWI limits, and subsequent flood deposits. We observed a significant direct causal influence of precipitation and snowmelt on the NDWI, with a 1 d lagged connection (Fig. 10). This combined causal relationship between precipitation and snowmelt with NDWI intensity indicates that anomalous runoff occurred across both glacial and fluvial channels. Further, the inverse causal connection (negative MCI ranges) between the NDWI and EVI illustrates the rapid change in channel geometry due to increases in fluvial discharge over the lower–middle reaches (Fig. 10).
The change in river morphology driven by the high-magnitude flood episodes is also documented by the statistically significant relationship (p<0.005; R=0.81) between the anomalous stream power and relative EVI values observed across the lower–middle reaches of the upper Indus River (Fig. 7). It is generally assumed that relative vegetation intensity serves an indicator of geomorphic change that results from short-duration, high-magnitude hydrological events (Olen et al., 2016; Starke et al., 2020; Clift and Jonell, 2021; Scheip and Wegmann, 2021). Thus, we anticipate that the EVI acts as a spatial indicator of changes in channel morphology observed across the lower–middle reaches of the trunk channel during the monsoon period of 2022 (Fig. 7), suggesting that distributions of event characteristics, such as the NDWI and EVI, can be useful for detecting relative changes in channel morphology triggered by high-magnitude floods.
Our study reveals several significant event characteristics of the 2022 upper Indus River flood. Our analysis shows that the upper Indus River flood originated from elevated glacial channels due to an anomalous temperature rise, which increased glacial runoff. This increase in runoff across glaciated catchments, after traversing fluvial reaches, enhanced fluvial discharge and likely increased the stream power in the region affected by anomalous precipitation. The synoptic observation of moisture pathways indicates that this anomalous precipitation incident is linked to the interaction of southward-moving midlatitude westerly troughs and eastward-advancing southwestern monsoon circulation. We observe a statistically significant relationship between anomalous stream power and changes in the relative EVI across the lower–middle reaches, which serves as a significant geomorphic indicator of changes in channel morphology. This will aid in determining the reliability of the EVI as a consistent indicator of geomorphic change, as well as its applicability in studying the geomorphic evolution of regional landscapes. This extreme flood illustrates how causal connections between temperature and precipitation across high-relief, steep-gradient channels can magnify impacts. Such hydrological events may serve as efficient geomorphic agents of erosion and, therefore, play a significant role in the coupling of climatic extremes, topography, and erosion. This study underscores the susceptibility of elevated syntaxial regions to short-lived, high-magnitude flooding, emphasizing the need for additional research to determine the causal relationship between the drivers of hydrological extremes. Significant research is needed to understand the long-term impact of these extreme climatic events on geomorphic processes in the region.
This study utilizes open-source datasets acquired from remote sensing and an open-source platform, with the methodological tools also being open-source, as detailed with appropriate sources and citations in the “Data used” section of the paper. For quantitative geomorphic parameter estimation in this study, we used an SRTM-based 30 m DEM obtained from the open-source OpenTopography platform (https://opentopography.org/, Open Topography, 2025). We obtained precipitation datasets from CHIRPS (Funk et al., 2015). This study uses various hydroclimatic datasets from ERA5-Land, featuring post-processed daily statistics from 1950 to the present (https://cds.climate.copernicus.eu/stac-browser/collections/derived-era5-land-daily-statistics, C3S, 2017). All change indicators employed in the present study (the NDWI, NDSI, and EVI) were sourced from MODIS datasets, available at https://modis.gsfc.nasa.gov/data/dataprod/ (NASA, 2000).
We employed the “Tigramite” Python package for causal discovery, which includes methods for constraint-based causal discovery and causal effect estimation designed for time series (https://github.com/jakobrunge/tigramite) (Runge, 2025; Runge et al., 2019a, b, 2023).
The supplement related to this article is available online at: https://doi.org/10.5194/esurf-13-147-2025-supplement.
AK: conceptualization, formal analysis, methodology, and writing (original draft, review, and editing). KLC: supervision, visualization, and writing (review and editing). MDB: supervision and validation.
The contact author has declared that none of the authors has any competing interests.
Publisher's note: Copernicus Publications remains neutral with regard to jurisdictional claims made in the text, published maps, institutional affiliations, or any other geographical representation in this paper. While Copernicus Publications makes every effort to include appropriate place names, the final responsibility lies with the authors.
The authors acknowledge the authorities of the Indian Institute of Technology Kharagpur (https://www.iitkgp.ac.in/phd, last access: 3 February 2025), India, for facilitating this study. Abhishek Kashyap thanks the Ministry of Education, Government of India, for granting a PhD research fellowship. Abhishek Kashyap acknowledges the IRD South–North mobility scheme (https://en.ird.fr/training-south, last access: 20 June 2023), managed by Campus France, for supporting mobility and facilitating a major part of this study at ISTerre (Institut des Sciences de la Terre), Université Grenoble Alpes, France. The authors express their gratitude to the associate editor and editors of this journal for granting a full APC waiver for this publication.
Abhishek Kashyap is funded by a PhD fellowship from the Ministry of Education, Government of India. The IRD South–North mobility scheme supported the project, enabling Abhishek Kashyap to carry out part of his research at ISTerre, UGA, France.
This paper was edited by Sagy Cohen and reviewed by two anonymous referees.
Adams, B. A., Whipple, K. X., Forte, A. M., Heimsath, A. M., and Hodges, K. V.: Climate controls on erosion in tectonically active landscapes, Sci. Adv., 6, eaaz3166, https://doi.org/10.1126/sciadv.aaz3166, 2020.
Anderson, R. G. and Goulden, M. L.: Relationships between climate, vegetation, and energy exchange across a montane gradient, J. Geophys. Res., 116, G01026, https://doi.org/10.1029/2010JG001476, 2011.
Archer, D.: Hydrological implications of spatial and altitudinal variation in temperature in the upper Indus basin, Hydrol. Res., 35, 209–222, https://doi.org/10.2166/nh.2004.0015, 2004.
Bai, L., Shi, C., Li, L., Yang, Y., and Wu, J.: Accuracy of CHIRPS Satellite-Rainfall Products over Mainland China, Remote Sens., 10, 362, https://doi.org/10.3390/rs10030362, 2018.
Bawa, N., Jain, V., Shekhar, S., Kumar, N., and Jyani, V.: Controls on morphological variability and role of stream power distribution pattern, Yamuna River, western India, Geomorphology, 227, 60–72, https://doi.org/10.1016/j.geomorph.2014.05.016, 2014.
Benito, G., Macklin, M. G., Panin, A., Rossato, S., Fontana, A., Jones, A. F., Machado, M. J., Matlakhova, E., Mozzi, P., and Zielhofer, C.: Recurring flood distribution patterns related to short-term Holocene climatic variability, Sci. Rep., 5, 16398, https://doi.org/10.1038/srep16398, 2015.
Bhutto, F.: The west is ignoring Pakistan's super-floods. Heed this warning: tomorrow it will be you, 9 September 2022, The Guardian, https://www.theguardian.com/commentisfree/2022/sep/08/pakistan-floods-climate-crisis (last access: 9 September 2022), 2022.
Bookhagen, B. and Burbank, D. W.: Topography, relief, and TRMM-derived rainfall variations along the Himalaya, Geophys. Res. Lett., 33, 2006GL026037, https://doi.org/10.1029/2006GL026037, 2006.
Bookhagen, B. and Burbank, D. W.: Toward a complete Himalayan hydrological budget: Spatiotemporal distribution of snowmelt and rainfall and their impact on river discharge, J. Geophys. Res., 115, 2009JF001426, https://doi.org/10.1029/2009JF001426, 2010.
Bookhagen, B. and Strecker, M. R.: Spatiotemporal trends in erosion rates across a pronounced rainfall gradient: Examples from the southern Central Andes, Earth Planet. Sc. Lett., 327–328, 97–110, https://doi.org/10.1016/j.epsl.2012.02.005, 2012.
Bookhagen, B., Thiede, R. C., and Strecker, M. R.: Abnormal monsoon years and their control on erosion and sediment flux in the high, arid northwest Himalaya, Earth Planet. Sc. Lett., 231, 131–146, https://doi.org/10.1016/j.epsl.2004.11.014, 2005a.
Bookhagen, B., Thiede, R. C., and Strecker, M. R.: Late Quaternary intensified monsoon phases control landscape evolution in the northwest Himalaya, Geology, 33, 149, https://doi.org/10.1130/G20982.1, 2005b.
Bovy, B., Braun, J., and Demoulin, A.: A new numerical framework for simulating the control of weather and climate on the evolution of soil-mantled hillslopes, Geomorphology, 263, 99–112, https://doi.org/10.1016/j.geomorph.2016.03.016, 2016.
Breiman, L.: Random Forests, Mach. Learn., 45, 5–32, https://doi.org/10.1023/A:1010933404324, 2001.
Burbank, D. W. and Anderson, R. S.: Tectonic geomorphology, John Wiley & Sons, ISBN 978-1-4443-3887-4, 2011.
Butler, R. W. H.: Tectonic evolution of the Himalayan syntaxes: the view from Nanga Parbat, SP, 483, 215–254, https://doi.org/10.1144/SP483.5, 2019.
Clift, P. D. and Jonell, T. N.: Monsoon controls on sediment generation and transport: Mass budget and provenance constraints from the Indus River catchment, delta and submarine fan over tectonic and multimillennial timescales, Earth-Sci. Rev., 220, 103682, https://doi.org/10.1016/j.earscirev.2021.103682, 2021.
Cook, K. L., Andermann, C., Gimbert, F., Adhikari, B. R., and Hovius, N.: Glacial lake outburst floods as drivers of fluvial erosion in the Himalaya, Science, 362, 53–57, https://doi.org/10.1126/science.aat4981, 2018.
C3S – Copernicus Climate Change Service: ERA5-Land: Post-processed daily hydroclimatic statistics from 1950 to present, C3S [data set], https://cds.climate.copernicus.eu/stac-browser/collections/derived-era5-land-daily-statistics (last access: 1 December 2022), 2017.
Delaney, I., Anderson, L., and Herman, F.: Modeling the spatially distributed nature of subglacial sediment transport and erosion, Earth Surf. Dynam., 11, 663–680, https://doi.org/10.5194/esurf-11-663-2023, 2023.
Dimri, A. P., Niyogi, D., Barros, A. P., Ridley, J., Mohanty, U. C., Yasunari, T., and Sikka, D. R.: Western Disturbances: A review, Rev. Geophys., 53, 225–246, https://doi.org/10.1002/2014RG000460, 2015.
Dimri, A. P., Yasunari, T., Kotlia, B. S., Mohanty, U. C., and Sikka, D. R.: Indian winter monsoon: Present and past, Earth-Sci. Rev., 163, 297–322, https://doi.org/10.1016/j.earscirev.2016.10.008, 2016.
Dimri, A. P., Chevuturi, A., Niyogi, D., Thayyen, R. J., Ray, K., Tripathi, S. N., Pandey, A. K., and Mohanty, U. C.: Cloudbursts in Indian Himalayas: A review, Earth-Sci. Rev., 168, 1–23, https://doi.org/10.1016/j.earscirev.2017.03.006, 2017.
Farinotti, D., Immerzeel, W. W., De Kok, R. J., Quincey, D. J., and Dehecq, A.: Manifestations and mechanisms of the Karakoram glacier Anomaly, Nat. Geosci., 13, 8–16, https://doi.org/10.1038/s41561-019-0513-5, 2020.
Forsythe, N., Fowler, H. J., Li, X.-F., Blenkinsop, S., and Pritchard, D.: Karakoram temperature and glacial melt driven by regional atmospheric circulation variability, Nat. Clim. Change, 7, 664–670, https://doi.org/10.1038/nclimate3361, 2017.
Funk, C., Peterson, P., Landsfeld, M., Pedreros, D., Verdin, J., Shukla, S., Husak, G., Rowland, J., Harrison, L., Hoell, A., and Michaelsen, J.: The climate hazards infrared precipitation with stations – a new environmental record for monitoring extremes, Sci. Data, 2, 150066, https://doi.org/10.1038/sdata.2015.66, 2015.
Gao, F., Zhang, Y., Ren, X., Yao, Y., Hao, Z., and Cai, W.: Evaluation of CHIRPS and its application for drought monitoring over the Haihe River Basin, China, Nat. Hazards, 92, 155–172, https://doi.org/10.1007/s11069-018-3196-0, 2018.
Godard, V. and Tucker, G. E.: Influence of Climate-Forcing Frequency on Hillslope Response, Geophysical Res. Lett., 48, e2021GL094305, https://doi.org/10.1029/2021GL094305, 2021.
Goodbred, S. L., Kuehl, S. A., Steckler, M. S., and Sarker, M. H.: Controls on facies distribution and stratigraphic preservation in the Ganges–Brahmaputra delta sequence, Sediment. Geol., 155, 301–316, https://doi.org/10.1016/S0037-0738(02)00184-7, 2003.
Hack, J. T.: Stream-profile analysis and stream-gradient index, Journal of Research of the US Geological Survey, 1, 421–429, 1973.
Hewitt, K.: Tributary glacier surges: an exceptional concentration at Panmah Glacier, Karakoram Himalaya, J. Glaciol., 53, 181–188, https://doi.org/10.3189/172756507782202829, 2007.
Hewitt, K.: Catastrophic rock slope failures and late Quaternary developments in the Nanga Parbat–Haramosh Massif, Upper Indus basin, northern Pakistan, Quaternary Sci. Rev., 28, 1055–1069, https://doi.org/10.1016/j.quascirev.2008.12.019, 2009.
Houze, R. A., Rasmussen, K. L., Medina, S., Brodzik, S. R., and Romatschke, U.: Anomalous Atmospheric Events Leading to the Summer 2010 Floods in Pakistan, B. Am. Meteorol. Soc., 92, 291–298, https://doi.org/10.1175/2010BAMS3173.1, 2011.
Jaiswara, N. K., Kotluri, S. K., Pandey, A. K., and Pandey, P.: Transient basin as indicator of tectonic expressions in bedrock landscape: Approach based on MATLAB geomorphic tool (Transient-profiler), Geomorphology, 346, 106853, https://doi.org/10.1016/j.geomorph.2019.106853, 2019.
Jaiswara, N. K., Kotluri, S. K., Pandey, P., and Pandey, A. K.: MATLAB functions for extracting hypsometry, stream-length gradient index, steepness index, chi gradient of channel and swath profiles from digital elevation model (DEM) and other spatial data for landscape characterisation, Appl. Comput. Geosci., 7, 100033, https://doi.org/10.1016/j.acags.2020.100033, 2020.
Jones, B.: How melting glaciers fueled Pakistan's fatal floods, 30 August 2022, https://www.vox.com/science-and-health/2022/8/30/23327341/pakistan-flooding-monsoon-melting-glaciers-climate-change (last access: 30 August 2022), 2022.
Joshi, S. K., Kumar, S., Sinha, R., Rai, S. P., Khobragade, S., and Rao, M. S.: Identifying moisture transport pathways for north-west India, Geol. J., 58, 4428–4440, https://doi.org/10.1002/gj.4759, 2023.
Kapnick, S. B., Delworth, T. L., Ashfaq, M., Malyshev, S., and Milly, P. C. D.: Snowfall less sensitive to warming in Karakoram than in Himalayas due to a unique seasonal cycle, Nat. Geosci., 7, 834–840, https://doi.org/10.1038/ngeo2269, 2014.
Karmouche, S., Galytska, E., Runge, J., Meehl, G. A., Phillips, A. S., Weigel, K., and Eyring, V.: Regime-oriented causal model evaluation of Atlantic–Pacific teleconnections in CMIP6, Earth Syst. Dynam., 14, 309–344, https://doi.org/10.5194/esd-14-309-2023, 2023.
Kashyap, A. and Behera, M. D.: The influence of landslide morphology on erosion rate variability across western Himalayan catchments: Role of westerlies and summer monsoon interaction in the landscape characterization, Geol. J., 59, 1112–1125, https://doi.org/10.1002/gj.4913, 2024.
Kashyap, A., Behera, M. D., and Pradhan, B.: Differential surface uplift and knickpoint evolution along the transient Teesta river in the eastern Himalayas, J. Asian Earth Sci., 260, 105974, https://doi.org/10.1016/j.jseaes.2023.105974, 2024.
Katsanos, D., Retalis, A., and Michaelides, S.: Validation of a high-resolution precipitation database (CHIRPS) over Cyprus for a 30-year period, Atmos. Res., 169, 459–464, https://doi.org/10.1016/j.atmosres.2015.05.015, 2016.
Kaushal, R. K., Sarkar, A., Mishra, K., Sinha, R., Nepal, S., and Jain, V.: Spatio-temporal variability in stream power distribution in the Upper Kosi River basin, Central Himalaya: Controls and geomorphic implications, Geomorphology, 350, 106888, https://doi.org/10.1016/j.geomorph.2019.106888, 2020.
Khokhar, M. N.: Rich countries caused Pakistan's catastrophic flooding. Their response? Inertia and apathy, The Guardian, https://www.theguardian.com/commentisfree/2022/sep/05/rich-countries-pakistan-flooding-climate-crisis-cop27 (last access: 5 September 2022), 2022.
Kirby, E. and Whipple, K. X.: Expression of active tectonics in erosional landscapes, J. Struct. Geol., 44, 54–75, https://doi.org/10.1016/j.jsg.2012.07.009, 2012.
Knox, J. C.: Sensitivity of modern and Holocene floods to climate change, Quaternary Sci. Rev., 19, 439–457, https://doi.org/10.1016/S0277-3791(99)00074-8, 2000.
Koons, P., Zeitler, P., Chamberlain, C., Craw, D., and Meltzer, A.: Mechanical links between erosion and metamorphism in Nanga Parbat, Pakistan Himalaya, Am. J. Sci., 302, 749–773, 2002.
Koons, P. O., Zeitler, P., and Hallet, B.: Tectonic aneurysms and mountain building, Treat. Geomorphol., 5, 318–349, 2013.
Korup, O.: Earth's portfolio of extreme sediment transport events, Earth-Sci. Rev., 112, 115–125, https://doi.org/10.1016/j.earscirev.2012.02.006, 2012.
Korup, O. and Montgomery, D. R.: Tibetan plateau river incision inhibited by glacial stabilization of the Tsangpo gorge, Nature, 455, 786–789, https://doi.org/10.1038/nature07322, 2008.
Korup, O., Montgomery, D. R., and Hewitt, K.: Glacier and landslide feedbacks to topographic relief in the Himalayan syntaxes, P. Natl. Acad. Sci. USA, 107, 5317–5322, https://doi.org/10.1073/pnas.0907531107, 2010a.
Korup, O., Densmore, A. L., and Schlunegger, F.: The role of landslides in mountain range evolution, Geomorphology, 120, 77–90, https://doi.org/10.1016/j.geomorph.2009.09.017, 2010b.
Kretschmer, M., Runge, J., and Coumou, D.: Early prediction of extreme stratospheric polar vortex states based on causal precursors, Geophys. Res. Lett., 44, 8592–8600, https://doi.org/10.1002/2017GL074696, 2017.
Krich, C., Runge, J., Miralles, D. G., Migliavacca, M., Perez-Priego, O., El-Madany, T., Carrara, A., and Mahecha, M. D.: Estimating causal networks in biosphere–atmosphere interaction with the PCMCI approach, Biogeosciences, 17, 1033–1061, https://doi.org/10.5194/bg-17-1033-2020, 2020.
Leland, J., Reid, M. R., Burbank, D. W., Finkel, R., and Caffee, M.: Incision and differential bedrock uplift along the Indus River near Nanga Parbat, Pakistan Himalaya, from 10Be and 26Al exposure age dating of bedrock straths, Earth Planet. Sc. Lett., 154, 93–107, https://doi.org/10.1016/S0012-821X(97)00171-4, 1998.
Leonard, J. S., Whipple, K. X., and Heimsath, A. M.: Isolating climatic, tectonic, and lithologic controls on mountain landscape evolution, Sci. Adv., 9, eadd8915, https://doi.org/10.1126/sciadv.add8915, 2023.
Leonard, J. S., Whipple, K. X., and Heimsath, A. M.: Controls on topography and erosion of the north-central Andes, Geology, 52, 153–158, https://doi.org/10.1130/G51618.1, 2024.
Liu, P., Li, L., Guo, S., Xiong, L., Zhang, W., Zhang, J., and Xu, C.-Y.: Optimal design of seasonal flood limited water levels and its application for the Three Gorges Reservoir, J. Hydrol., 527, 1045–1053, https://doi.org/10.1016/j.jhydrol.2015.05.055, 2015.
Ma, Y., Hu, X., Chen, Y., Hu, Z., Feng, T., and Feng, G.: Different Characteristics and Drivers of the Extraordinary Pakistan Rainfall in July and August 2022, Remote Sens., 15, 2311, https://doi.org/10.3390/rs15092311, 2023.
Nanditha, J. S., Kushwaha, A. P., Singh, R., Malik, I., Solanki, H., Chuphal, D. S., Dangar, S., Mahto, S. S., Vegad, U., and Mishra, V.: The Pakistan Flood of August 2022: Causes and Implications, Earth's Future, 11, e2022EF003230, https://doi.org/10.1029/2022EF003230, 2023.
NASA: MODIS Daily Datasets, NASA Goddard Space Flight Center [data set], https://modis.gsfc.nasa.gov/data/dataprod/ (last access: 10 February 2023), 2000.
Nawaz, M., Iqbal, M. F., and Mahmood, I.: Validation of CHIRPS satellite-based precipitation dataset over Pakistan, Atmos. Res., 248, 105289, https://doi.org/10.1016/j.atmosres.2020.105289, 2021.
NDMA: NDMA monsoon 2022 daily situation, report no. 093, NDMA, https://reliefweb.int/report/pakistan/ndma-monsoon-2022-daily-situation-report-no-93-dated-14th (last access: 15 September 2022), 2022.
Nowack, P., Runge, J., Eyring, V., and Haigh, J. D.: Causal networks for climate model evaluation and constrained projections, Nat. Commun., 11, 1415, https://doi.org/10.1038/s41467-020-15195-y, 2020.
Olen, S. M., Bookhagen, B., and Strecker, M. R.: Role of climate and vegetation density in modulating denudation rates in the Himalaya, Earth Planet. Sc. Lett., 445, 57–67, https://doi.org/10.1016/j.epsl.2016.03.047, 2016.
Open Topography: High-resolution topography data and tools, https://opentopography.org (last access: 5 December 2022), 2025.
Otto, F. E. L., Zachariah, M., Saeed, F., Siddiqi, A., Kamil, S., Mushtaq, H., Arulalan, T., AchutaRao, K., Chaithra, S. T., Barnes, C., Philip, S., Kew, S., Vautard, R., Koren, G., Pinto, I., Wolski, P., Vahlberg, M., Singh, R., Arrighi, J., Van Aalst, M., Thalheimer, L., Raju, E., Li, S., Yang, W., Harrington, L. J., and Clarke, B.: Climate change increased extreme monsoon rainfall, flooding highly vulnerable communities in Pakistan, Environ. Res.: Clim., 2, 025001, https://doi.org/10.1088/2752-5295/acbfd5, 2023.
Panda, S., Kumar, A., Das, S., Devrani, R., Rai, S., Prakash, K., and Srivastava, P.: Chronology and sediment provenance of extreme floods of Siang River (Tsangpo-Brahmaputra River valley), northeast Himalaya, Earth Surf. Proc. Land., 45, 2495–2511, https://doi.org/10.1002/esp.4893, 2020.
Paredes-Trejo, F. J., Barbosa, H. A., and Lakshmi Kumar, T. V.: Validating CHIRPS-based satellite precipitation estimates in Northeast Brazil, J. Arid Environ., 139, 26–40, https://doi.org/10.1016/j.jaridenv.2016.12.009, 2017.
Rasmussen, K. L. and Houze, R. A.: A Flash-Flooding Storm at the Steep Edge of High Terrain: Disaster in the Himalayas, B. Am. Meteorol. Soc., 93, 1713–1724, https://doi.org/10.1175/BAMS-D-11-00236.1, 2012.
Ray, K., Pandey, P., Pandey, C., Dimri, A. P., and Kishore, K.: On the recent floods in India, Curr. Sci., 117, 204–218, 2019.
Rossi, M. W., Whipple, K. X., and Vivoni, E. R.: Precipitation and evapotranspiration controls on daily runoff variability in the contiguous United States and Puerto Rico, J. Geophys. Res.-Earth, 121, 128–145, https://doi.org/10.1002/2015JF003446, 2016.
Runge, J.: Causal network reconstruction from time series: From theoretical assumptions to practical estimation, Chaos, 28, 075310, https://doi.org/10.1063/1.5025050, 2018.
Runge, J.: tigramite, GitHub [code], https://github.com/jakobrunge/tigramite (last access: 4 February 2025), 2025.
Runge, J., Gao, P., Garcin, F., and Faltings, B.: Churn prediction for high-value players in casual social games, in: 2014 IEEE Conference on Computational Intelligence and Games (CIG), 26–29 August 2014, Dortmund, Germany, 1–8, https://doi.org/10.1109/CIG.2014.6932875, 2014.
Runge, J., Nowack, P., Kretschmer, M., Flaxman, S., and Sejdinovic, D.: Detecting and quantifying causal associations in large nonlinear time series datasets, Sci. Adv., 5, eaau4996, https://doi.org/10.1126/sciadv.aau4996, 2019a.
Runge, J., Bathiany, S., Bollt, E., Camps-Valls, G., Coumou, D., Deyle, E., Glymour, C., Kretschmer, M., Mahecha, M. D., Muñoz-Marí, J., Van Nes, E. H., Peters, J., Quax, R., Reichstein, M., Scheffer, M., Schölkopf, B., Spirtes, P., Sugihara, G., Sun, J., Zhang, K., and Zscheischler, J.: Inferring causation from time series in Earth system sciences, Nat. Commun., 10, 2553, https://doi.org/10.1038/s41467-019-10105-3, 2019b.
Runge, J., Gerhardus, A., Varando, G., Eyring, V., and Camps-Valls, G.: Causal inference for time series, Nat. Rev. Earth Environ., 4, 487–505, https://doi.org/10.1038/s43017-023-00431-y, 2023.
Scheip, C. M. and Wegmann, K. W.: HazMapper: a global open-source natural hazard mapping application in Google Earth Engine, Nat. Hazards Earth Syst. Sci., 21, 1495–1511, https://doi.org/10.5194/nhess-21-1495-2021, 2021.
Scherler, D., Bookhagen, B., and Strecker, M. R.: Spatially variable response of Himalayan glaciers to climate change affected by debris cover, Nat. Geosci., 4, 156–159, https://doi.org/10.1038/ngeo1068, 2011.
Schneider, J. M., Turowski, J. M., Rickenmann, D., Hegglin, R., Arrigo, S., Mao, L., and Kirchner, J. W.: Scaling relationships between bed load volumes, transport distances, and stream power in steep mountain channels: Tracer Erlenbach, J. Geophys. Res.-Earth, 119, 533–549, https://doi.org/10.1002/2013JF002874, 2014.
Schumm, S. A., Dumont, J. F., and Holbrook, J. M.: Active tectonics and alluvial rivers, in: Vol. 276, Cambridge University Press, Cambridge, ISBN 9780521890588, 2000.
Schwanghart, W. and Scherler, D.: Short Communication: TopoToolbox 2 – MATLAB-based software for topographic analysis and modeling in Earth surface sciences, Earth Surf. Dynam., 2, 1–7, https://doi.org/10.5194/esurf-2-1-2014, 2014.
Shahid, M., Rahman, K. U., Haider, S., Gabriel, H. F., Khan, A. J., Pham, Q. B., Mohammadi, B., Linh, N. T. T., and Anh, D. T.: Assessing the potential and hydrological usefulness of the CHIRPS precipitation dataset over a complex topography in Pakistan, Hydrolog. Sci. J., 66, 1664–1684, https://doi.org/10.1080/02626667.2021.1957476, 2021.
Shahzad, F., Mahmood, S. A., and Gloaguen, R.: Drainage network and lineament analysis: An approach for Potwar Plateau (Northern Pakistan), J. Mt. Sci., 6, 14–24, https://doi.org/10.1007/s11629-009-0206-4, 2009.
Sharif, M., Archer, D. R., Fowler, H. J., and Forsythe, N.: Trends in timing and magnitude of flow in the Upper Indus Basin, Hydrol. Earth Syst. Sci., 17, 1503–1516, https://doi.org/10.5194/hess-17-1503-2013, 2013.
Sharma, S., Shukla, A. D., Bartarya, S. K., Marh, B. S., and Juyal, N.: The Holocene floods and their affinity to climatic variability in the western Himalaya, India, Geomorphology, 290, 317–334, https://doi.org/10.1016/j.geomorph.2017.04.030, 2017.
Sharma, S., Sati, S. P., Basavaiah, N., Pandey, S., Sundriyal, Y. P., Rana, N., Singh, P., Pradhan, S., Shukla, A. D., Bhushan, R., Bhatt, R., and Juyal, N.: Mid to late Holocene climate variability, forest fires and floods entwined with human occupation in the upper Ganga catchment, India, Quaternary Sci. Rev., 293, 107725, https://doi.org/10.1016/j.quascirev.2022.107725, 2022.
Sinha, R., Mohanta, H., Jain, V., and Tandon, S. K.: Geomorphic diversity as a river management tool and its application to the Ganga River, India, River Res. Appl., 33, 1156–1176, https://doi.org/10.1002/rra.3154, 2017.
Snyder, N. P., Whipple, K. X., Tucker, G. E., and Merritts, D. J.: Importance of a stochastic distribution of floods and erosion thresholds in the bedrock river incision problem, J. Geophys. Res., 108, 2001JB001655, https://doi.org/10.1029/2001JB001655, 2003.
Srivastava, P., Kumar, A., Chaudhary, S., Meena, N., Sundriyal, Y. P., Rawat, S., Rana, N., Perumal, R. J., Bisht, P., Sharma, D., Agnihotri, R., Bagri, D. S., Juyal, N., Wasson, R. J., and Ziegler, A. D.: Paleofloods records in Himalaya, Geomorphology, 284, 17–30, https://doi.org/10.1016/j.geomorph.2016.12.011, 2017.
Starke, J., Ehlers, T. A., and Schaller, M.: Latitudinal effect of vegetation on erosion rates identified along western South America, Science, 367, 1358–1361, https://doi.org/10.1126/science.aaz0840, 2020.
Tibau, X.-A., Reimers, C., Gerhardus, A., Denzler, J., Eyring, V., and Runge, J.: A spatiotemporal stochastic climate model for benchmarking causal discovery methods for teleconnections, Environ. Data Sci., 1, e12, https://doi.org/10.1017/eds.2022.11, 2022.
Ullah, W., Wang, G., Lou, D., Ullah, S., Bhatti, A. S., Ullah, S., Karim, A., Hagan, D. F. T., and Ali, G.: Large-scale atmospheric circulation patterns associated with extreme monsoon precipitation in Pakistan during 1981–2018, Atmos. Res., 253, 105489, https://doi.org/10.1016/j.atmosres.2021.105489, 2021.
Vellore, R. K., Kaplan, M. L., Krishnan, R., Lewis, J. M., Sabade, S., Deshpande, N., Singh, B. B., Madhura, R. K., and Rama Rao, M. V. S.: Monsoon-extratropical circulation interactions in Himalayan extreme rainfall, Clim. Dynam., 46, 3517–3546, https://doi.org/10.1007/s00382-015-2784-x, 2016.
Wang, N., Zeng, X.-M., Guo, W.-D., Chen, C., You, W., Zheng, Y., and Zhu, J.: Quantitative diagnosis of moisture sources and transport pathways for summer precipitation over the mid-lower Yangtze River Basin, J. Hydrol., 559, 252–265, https://doi.org/10.1016/j.jhydrol.2018.02.003, 2018.
Whipple, K. X., Hancock, G. S., and Anderson, R. S.: River incision into bedrock: Mechanics and relative efficacy of plucking, abrasion, and cavitation, Geol. Soc. Am. Bull., 112, 490–503, https://doi.org/10.1130/0016-7606(2000)112<490:RIIBMA>2.0.CO;2, 2000.
Wobus, C., Whipple, K. X., Kirby, E., Snyder, N., Johnson, J., Spyropolou, K., Crosby, B., and Sheehan, D.: Tectonics from topography: Procedures, promise, and pitfalls, in: Tectonics, Climate, and Landscape Evolution, Geological Society of America, https://doi.org/10.1130/2006.2398(04), 2006.
Wolfensberger, D., Gabella, M., Boscacci, M., Germann, U., and Berne, A.: RainForest: a random forest algorithm for quantitative precipitation estimation over Switzerland, Atmos. Meas. Tech., 14, 3169–3193, https://doi.org/10.5194/amt-14-3169-2021, 2021.
Wu, K., Liu, S., Jiang, Z., Liu, Q., Zhu, Y., Yi, Y., Xie, F., Ahmad Tahir, A., and Saifullah, M.: Quantification of glacier mass budgets in the Karakoram region of Upper Indus Basin during the early twenty-first century, J. Hydrol., 603, 127095, https://doi.org/10.1016/j.jhydrol.2021.127095, 2021.
Zeitler, P. K., Koons, P. O., Bishop, M. P., Chamberlain, C. P., Craw, D., Edwards, M. A., Hamidullah, S., Jan, M. Q., Khan, M. A., Khattak, M. U. K., Kidd, W. S. F., Mackie, R. L., Meltzer, A. S., Park, S. K., Pecher, A., Poage, M. A., Sarker, G., Schneider, D. A., Seeber, L., and Shroder, J. F.: Crustal reworking at Nanga Parbat, Pakistan: Metamorphic consequences of thermal-mechanical coupling facilitated by erosion, Tectonics, 20, 712–728, https://doi.org/10.1029/2000TC001243, 2001.
Zeitler, P. K., Meltzer, A. S., Brown, L., Kidd, W. S., Lim, C., and Enkelmann, E.: Tectonics and topographic evolution of Namche Barwa and the easternmost Lhasa block, Tibet, in: Toward an Improved Understanding of Uplift Mechanisms and the Elevation History of the Tibetan Plateau, Geological Society of America Special Papers, Geological Society of America, 23–58, https://doi.org/10.1130/2014.2507(02), 2014.