the Creative Commons Attribution 4.0 License.
the Creative Commons Attribution 4.0 License.
 | 15 Sep 2025
Grain size dynamics using a new planform model – Part 2: Determining the relative control of autogenic processes and subsidence
Jean Braun
Alexander C. Whittaker
Marine Prieur
Sebastien Castelltort
The interpretation of grain size trends within the stratigraphic record has a wide range of applications, including the identification of external forcing events. Within fluvial systems, it is not yet well constrained as to how autogenic processes, i.e. those internal to the basin, influence grain size signatures. Using a recently developed model, GravelScape (Wild et al., 2025b), that couples the self-similar fining model (Fedele and Paola, 2007) to a Landscape Evolution Model, we investigate what controls the importance of autogenic processes and, in turn, their influence on grain size fining. For this, we perform a large number of numerical experiments by varying (1) the ratio between the incoming sediment flux and integrated subsidence rate (F), which characterizes the degree of bypass of the system; (2) the ratio of the discharge leaving the mountain to the discharge generated within the subsiding basin (β), which controls the shape of the topography of the basin; (3) the erodibility (K), which impacts the steady state or transient nature of the basin; and (4) the transport coefficient (G), which determines the transport- vs. detachment-limited behaviour of the depositional system that also influences the topography. We demonstrate that there exist two differing regimes for long-term grain size fining: one dominated by autogenic processes and one dominated by underlying subsidence. The subsidence-dominated regime occurs when the mean deposition matches the underlying subsidence, which is typical of low-bypass (filling) and low-slope systems (i.e. low values of F, high values of β, and low values of G). The autogenic-dominated regime occurs mostly under high bypass with steep topography when local variability in deposition rate is important (i.e. high F, high G, and low β). We also show that there is a strong correlation between the intensity of autogenic processes and the surface slope and across-basin topographic variability (rugosity). We introduce a framework in which we map the different regimes for grain size fining as a function of bypass (F) and surface geometry (β). We finally illustrate its use for the proper interpretation of grain size fining trends by positioning a series of natural systems within this framework.
- Article
(6509 KB) - Full-text XML
- Companion paper 1
- Companion paper 2
-
Supplement
(3241 KB) - BibTeX
- EndNote


Sedimentary systems are an essential source of information regarding the nature, duration, and amplitude of past tectonic and climatic events (Castelltort et al., 2023; Romans et al., 2016; Carretier et al., 2020; Armitage et al., 2011; Sømme et al., 2009). The fidelity of the sedimentary record is however affected by autogenic processes, i.e. that are internal to the sedimentary systems (Scheingross et al., 2020; Hajek and Straub, 2017; Jerolmack and Paola, 2010). These autogenic processes involve sediment recycling at the intra-basin scale and have characteristic times that are usually smaller than those associated with the external perturbations (Scheingross et al., 2020). Despite this, autogenic processes can impact the preservation of longer timescale, externally driven signals (Scheingross et al., 2020). This impact can be important and counter-intuitive. For example, Hill et al. (2012) have shown that, in certain cases, external signals may even be better recorded by lower preservation (subsidence) systems with little autogenic shredding rather than in a higher preservation but highly reworked stratigraphic section.
While preservation is a function of the rate of creation of accommodation (mostly through subsidence), the amplitude of autogenic processes is mostly controlled by surface processes such as channel avulsion or depositional pulses that generate variability within the system. To quantify the importance of autogenic processes, Straub and Esposito (2013) as well as Jobe et al. (2016) have described ratios of vertical aggregation relative to lateral mobility and variability appear to control stratigraphic completeness. Similarly, Ganti et al. (2011) have reported from analysing laboratory-scale experiments that autogenic processes affect the stratigraphic record on timescales that are smaller than or equal to the channel avulsion timescale. Furthermore, Straub et al. (2009) have described autogenic processes as being linked to the filling of topographic lows that can be described through an associated compensation timescale explained through avulsions and temporal variability in deposition rate. Toby et al. (2022) relate autogenic processes and compensation infilling of topographic lows as being dependent on the system's surface active layer1.
Within the stratigraphic record, grain size fining observations have been commonly used to constrain subsidence patterns in space (Duller et al., 2010; Whittaker et al., 2011) and time (D'Arcy et al., 2017) or to document tectonic or climatic events (Armitage et al., 2011). Many of these studies have used the self-similar grain size fining approach of Fedele and Paola (2007) to interpret grain size data as being primarily controlled by deposition rate, which they have equated to subsidence rate. However, in addition to external forcings, grain size trends are known to be influenced by topography and autogenic processes (such as avulsions or drainage re-organization) that will alter local erosion and depositional patterns (Hajek and Straub, 2017). The importance of channel mobility on grain size fining in particular has not been addressed in past applications of the grain size self-similar model of Fedele and Paola (2007).
We have recently developed a planform grain size fining model (GravelScape) by coupling the self-similar algorithm of Fedele and Paola (2007) to the FastScape Landscape Evolution Model (LEM) (Bovy et al., 2023) that predicts the spatial and temporal evolution of the surface topography from alluvial fan to plain environments and simulates processes such as rugosity (across-basin variability in topography) and channel avulsions (Wild et al., 2025b) (also shown in the Video supplement). We used it to demonstrate that the grain size fining trends predicted by the approach of Fedele and Paola (2007) under the assumption that deposition rate is equal to subsidence rate (Duller et al., 2010) are not valid in multi-channel landscapes with topography is under a state of high bypass, i.e. when incoming sediment flux is large compared to the basin-integrated subsidence rate. We have also shown (Wild et al., 2025b) that topography exerts a significant control on grain size fining under certain conditions, a conclusion that can only be reached with a model that predicts both grain size fining and topographic evolution.
Here, we propose using the coupled model to better quantify and parameterize the autogenic controls on grain size fining and determine under which topographic and subsidence conditions grain size fining trends can be used to constrain subsidence patterns as suggested by Duller et al. (2010). We will test a wide range of model parameters to determine what controls the amplitude of autogenic processes in sedimentary systems and their subsequent impact on stratigraphic grain size fining. More specifically, we quantify the difference in grain size fining between multi-channel and single-channel approaches (creating a parameter called grain size deviation) and attempt to explain it through correlations with basin internal dynamic parameters. From this we develop a conceptual framework describing under what basin conditions autogenic vs. subsidence dynamics dominate the grain size record in the stratigraphy.
2.1 GravelScape
To study the importance of autogenic processes relative to external forcings on grain size fining trends, we use a coupled model (GravelScape) that is fully described in Wild et al. (2025b). Here, we will only give essential elements and introduce equations that are necessary for the comprehension of the work presented here. The model comprises the Landscape Evolution Model (LEM) solving the Stream Power Law (SPL) enhanced for the effect of sediment transport and deposition (Davy and Lague, 2009; Yuan et al., 2019):
where h is surface topography, U is surface uplift or subsidence, K is the erodibility parameter, G is a dimensionless depositional parameter, represents variations in precipitation rate around a mean value that is included in the definition of K and G, A is drainage area, is topographic slope in the direction of water flow, and m and n are the area and slope exponents, respectively. G controls whether the system is transport-limited (G>0.4) or detachment-limited (G<0.4). Its value is not well known, but it has been constrained to be moderately transport limited of the order of 0.7 (Guerit et al., 2019) from a wide survey of sedimentary fans. Values of Kf are poorly constrained as its units and value strongly depend on the slope exponent m. The direction of water flow is computed from the surface topography and allows for flow divergence by assuming that, at every node of the model, discharge is distributed to all lower-elevation neighbouring nodes in proportion to slope.
Grain size is computed using the self-similar grain size fining model of Fedele and Paola (2007) for gravel, which assumes that mean grain size, , and its standard deviation, ϕ, vary in a constant ratio during fining that is, in turn, controlled by the ratio between local deposition rate, r, and sediment flux, qs, according to
where x* is a dimensionless distance along flow path and
where the primary components controlling the fining are , and is the mean grain size where flow initiated. See Wild et al. (2025b) for a more detailed version of the coupling of the two equations, and see Fedele and Paola (2007) for a description of the coefficients C1 and C2. Note that, in GravelScape, the deposition rate r and sediment flux qs are obtained from the solution of the LEM, contrary to most previous uses of the model of Fedele and Paola (2007) that have made the simplifying assumption that deposition rate can be directly equated with subsidence rate (e.g. Duller et al., 2010; Whittaker et al., 2011).
We will use a controlled setup similar to that of Duller et al. (2010) and also used in Wild et al. (2025b), in which sediment is produced in an orogenic area of width LM uplifting at a rate U0 resulting in a sedimentary flux, . Subsidence rate, σ, in the adjacent basin of width LB is assumed to vary as an exponential function of distance, x, from the mountain front,
simulating flexural isostasy under the weight of the adjacent mountain. The elevation at the opposite side of the mountain front (i.e. right hand-side, edge of the basin in our setups) is assumed to be held at a constant elevation, which we will refer to as the base level. As proposed by Duller et al. (2010), we introduce the parameter F,
that measures the degree of bypass of the system. Small F values (i.e. ) correspond to low-bypass systems where most of the sediment coming from the mountain is trapped in the basin, whereas large F values (i.e. F>10) correspond to high-bypass systems where most of the sediment coming from the mountain leaves the basin at its outer end. Under these conditions, one can derive an analytical solution to the fining model of Fedele and Paola (2007) (Wild et al., 2025b), which we will use to estimate, by comparing it to GravelScape's predictions, the contribution from autogenic processes to the grain size fining trend, relative to that resulting from the imposed basement subsidence.
2.2 Controls on surface topography in a sedimentary system
As shown in Braun (2022), fan extent and the subsequent foreland basin long profile are mostly controlled by the distribution of rainfall between the mountain (source) area and the basin (sink) area, with basement subsidence only playing a secondary role in low-bypass (low F) systems. In high-bypass systems, the sedimentary flux remains relatively constant across the basin. At steady state using the Stream Power Law (Eq. 1), sedimentary flux is equal to the product between drainage area (to power m+1) and slope (to power n), which implies that the slope must vary as the inverse of discharge. Near the mountain front, discharge is relatively constant and equal to the product of the mountain surface area by the assumed precipitation rate. The slope must therefore be relatively constant, which leads to the formation of a sedimentary fan. Away from the mountain front, rainfall in the basin substantially contributes to the discharge, which therefore increases and causes the slope to decrease to form an alluvial plain. Therefore, the transition between the steep, constant slope fan and the alluvial plain takes place where the contribution to discharge from rainfall in the basin equates the discharge from the mountain area. This explains the broad one-to-one relationship between upstream catchment area and fan area across many scales (Bull, 1962; Blair and McPherson, 1994). It also implies that one of the main controls on the shape of the topography in the basin area is the difference in precipitation rate between the mountain and basin areas (Braun, 2022). To illustrate this point, we can derive the parameter β:
where νM and νB are the relative precipitation rates in the mountain and basin areas, respectively. β is the ratio of the contribution to discharge from the mountain area, νMLM, and from precipitation in the basin, νBLB, multiplied by the relative wavelength of the subsidence function, α. β is in fact the ratio of the length/size of the fan, to the size of the subsidence function, .
In short, β is a measure of the difference in area (extent) and precipitation rate between the orogen catchment and the sedimentary basin. Combinations of high precipitation and drainage area in the orogen with low basin length and basin aridity result in high, orogen-dominant β values. Inversely, large basin areas, especially with higher precipitation relative to the orogen, result in low, basin-dominant β values. We keep α constant in all our simulations and change only vm to increase or decrease β. To emphasize the impact of changing vm on β, within figures and referring to specific values within the figures, we normalize β by α (Fig. 1).
Different topographic profiles predicted by GravelScape for different values of the parameter β are shown in Fig. 1 . We see that as β increases, the transition point between the steep fan and the curved alluvial plain moves towards the edge of the basin, and the surface topography evolves from concave and steep near the mountain front (low β values) to convex and flat (high β values). High β values correspond to the “constrained systems” in which the distance from the mountain front to the edge of the basin is smaller than the natural width of the fan, i.e. the width it would occupy if it were allowed to develop beyond the base level.
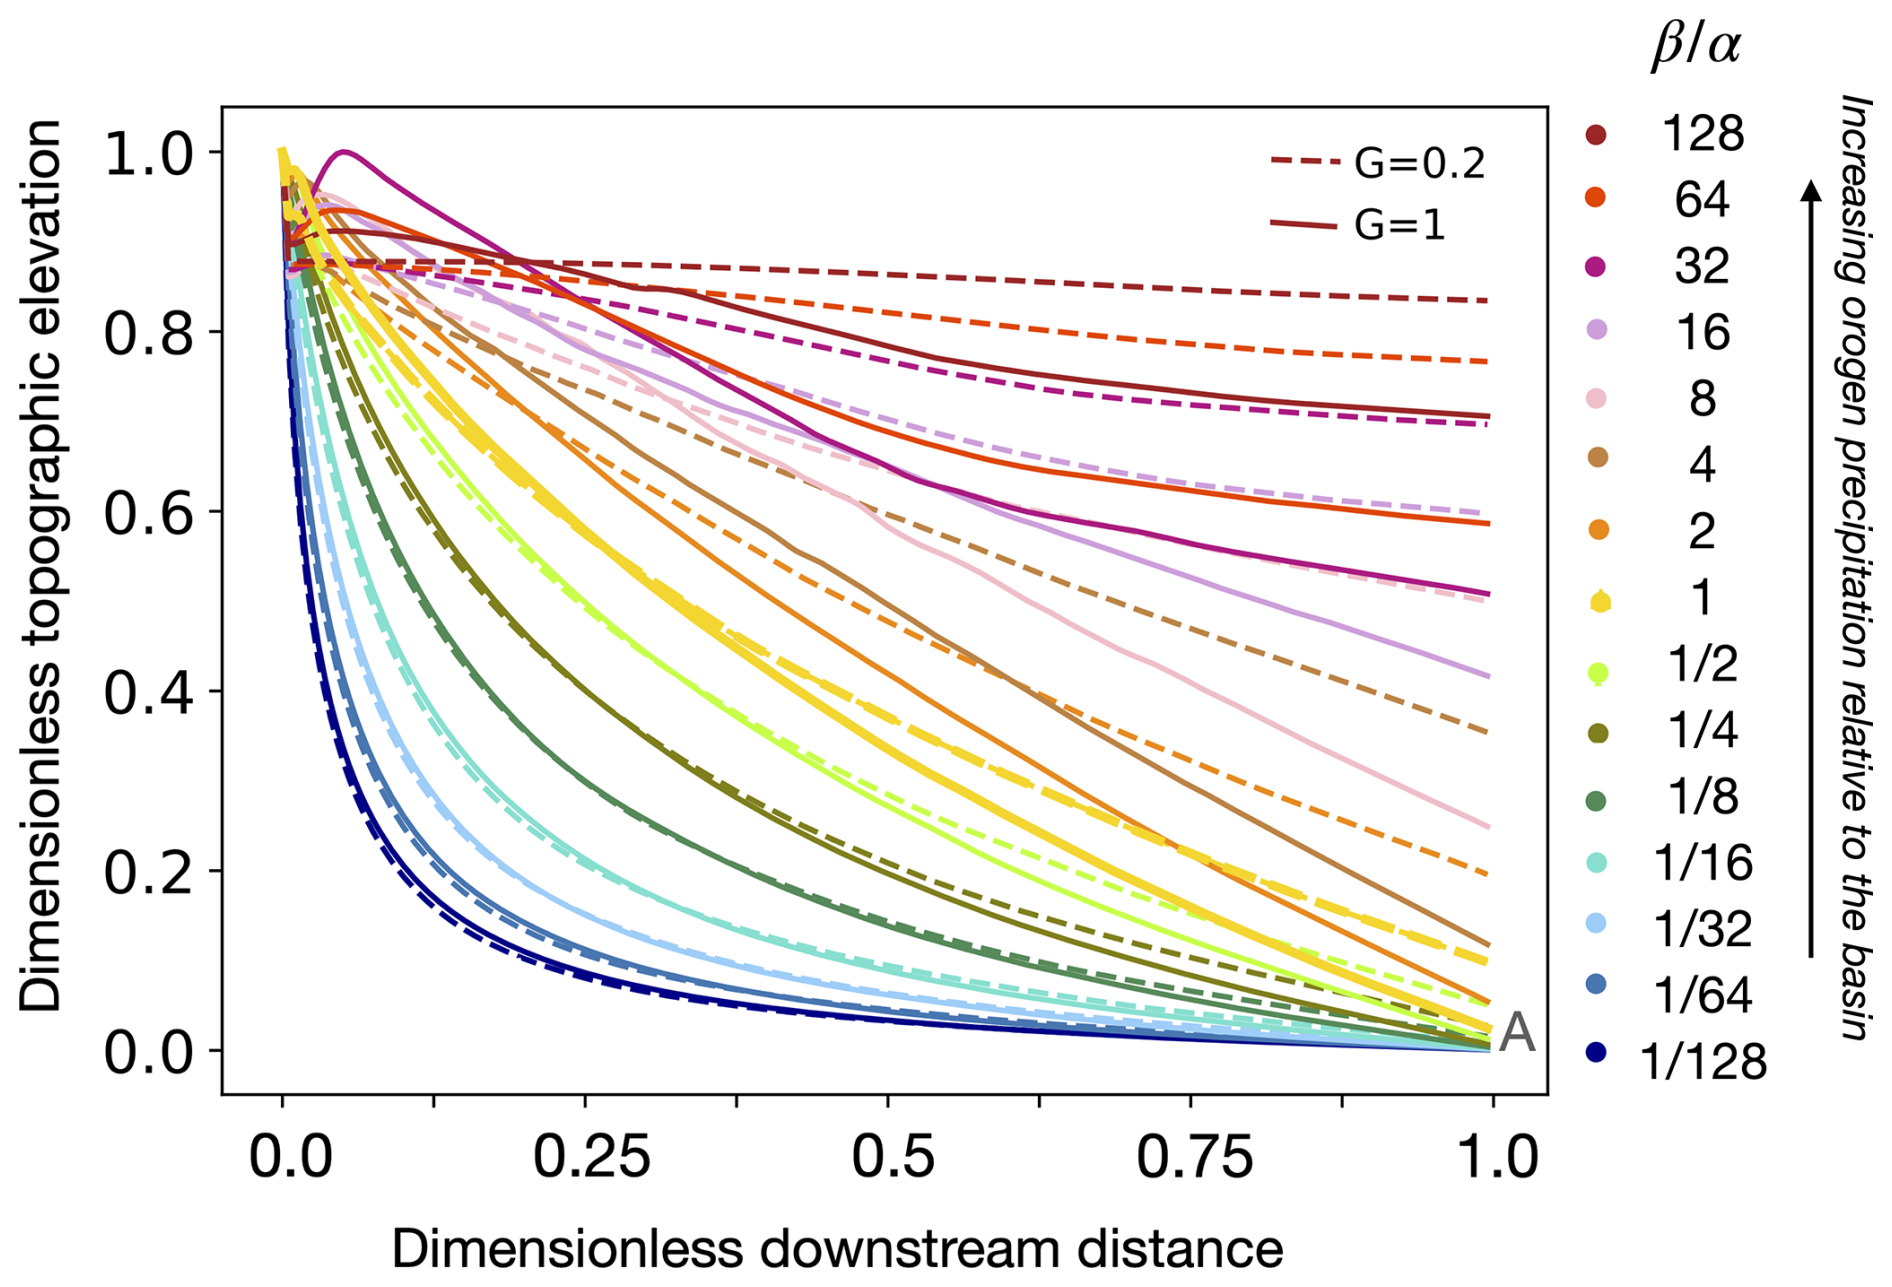
Figure 1Surface topography averaged across the basin at steady state predicted by GravelScape for various values of the parameter β defined in Eq. (6) and for different values of the depositional parameter G (transport-limited (G=1) vs detachment-limited (G=0.2)). All topographic profiles have been normalized to 1 at the mountain front.
Note that β, through its control on discharge partitioning between the mountain and basin contributions, only affects the position of the transition from steep to curved segments (and subsequent channel profile), whereas the slope at the mountain front (and therefore absolute topographic height) is controlled by additional factors (e.g. G and K) and by the magnitude of the sediment flux from the mountain, qs,i, as explained by the analytical solution for the slope at x=0 given in Braun (2022),
for high-bypass systems (i.e. when subsidence can be neglected). Essentially, the higher the value of G (and the lower the value of K), the steeper the fan with the same fan extent as shown in Braun (2022) and Wild et al. (2025b). Note that the dependence of basin slope on G and K is not apparent in Fig. 1, where we chose to normalize the topographic profiles. In the case n=1, K also controls the response time of the system (i.e. the time it takes to reach its final steady-state height), but G does not (Braun, 2022).
In situations where the surface topography predicted by GravelScape is characterized by very low slopes (e.g. under-filled basins with low F, low G, or high β), local minima can develop that affect the computation of the flow routing needed to solve the modified SPL equation (Eq. 1). In these situations, we use the method developed in Cordonnier et al. (2019) to adjust the flow routing and compute the geometry of the resulting lakes forming around each local minimum. In these filled lakes, the algorithm by Yuan et al. (2019) to solve equation (Eq. 1) cannot be used, and sediment is uniformly dumped as a first-order attempt to represent lacustrine deposition, and no grain size can be accurately computed using the grain size fining model of Fedele and Paola (2007). We checked that all model runs presented in this work were not strongly influenced by the presence of local minima.
In this work, we will vary model parameters G, K, F, and β to assess the impact of subsidence and topography on grain size fining under a near-constant orogen flux at steady state. For simplicity, we will refer to the respective parameters G, K, F, and β as the depositional, erodibility, bypass, and orogen discharge efficiency.
2.3 Modelled autogenic dynamics
Within our model, the river planform changes over time and space despite constant forcing conditions (see Video supplement), and we refer to this as model autogenic dynamics. These changes arise from the interactions between the depositional and erosional terms in Eq. (1). Erosion leads to the formation of channels and deposition to their progressive infilling, which, in turn, affects local slope and the relative distribution of water flow between a node and its neighbours. This may lead, through downstream cascading, to discrete events that reorganize large parts of the drainage network, similar to avulsions that have been observed in laboratory experiments (Clarke et al., 2010) and natural systems (Smith et al., 1989).
Hajek and Straub (2017) describe many autogenic processes, and their associated landforms, on the basis of spatial and temporal scale. Our Landscape Evolution Model can only reproduce autogenic processes that occur over long timescales (102–107 years) as well as large lateral (101–104 km) and vertical spatial scales (100–102 m). This scale matches with the descriptions of Hajek and Straub (2017) for autogenic dynamics such as (1) the regrading of the depositional surface (longitudinal river planform changes); (2) avulsions; and (3) channel convergence, divergence, and, to a limited extent, bifurcations. All of these are observed in the model (as described above). Smaller-scale autogenic processes described in Hajek and Straub (2017), with vertical scales under 100 m, such as those that involve bedforms (e.g. dunes or bars) or channel reach dynamics (e.g. riffle and pools; cut banks and point bars; meanders dynamics), cannot be reproduced in a Landscape Evolution Model based on Eq. (1).
3.1 Grain size fining deviation, ΔD
We now present results obtained with the coupled model to quantify the relative contributions from external forcings and autogenic processes to the control of grain size fining trends. For this, we define ΔD the difference at the basin outlet between the multi-channel (2D) grain size GravelScape solution computed in the largest channel and that predicted for a single channel using the method of Duller et al. (2010), i.e. assuming that deposition rate is equal to the imposed subsidence rate. We will call this quantity the grain size fining deviation and define it as
where is the mean grain size computed by GravelScape at the exit of the basin within the largest main channel (i.e. at the y location of the maximum discharge), is the mean grain size predicted by Duller et al. (2010), and the symbols indicate a temporal average, once the system has reached steady state. We computed ΔD for a large number of simulations varying G, K, and β, which control the surface topography, and varying F (through σ0 while keeping a constant U), which controls the degree of bypass of the system. The results are shown in Fig. 2, where each panel shows how ΔD varies as a function of β and F. The dependence on K and G can be appreciated by inspecting the different panels from left to right and top to bottom, respectively. All values are computed when the system has reached steady state (constant apex topography) or is approaching it (i.e. within 90 % of their steady-state topography, for model runs characterized by a low value of K). The regions of model space where local minima dominate are left blank to exclude them from our interpretation of these results.
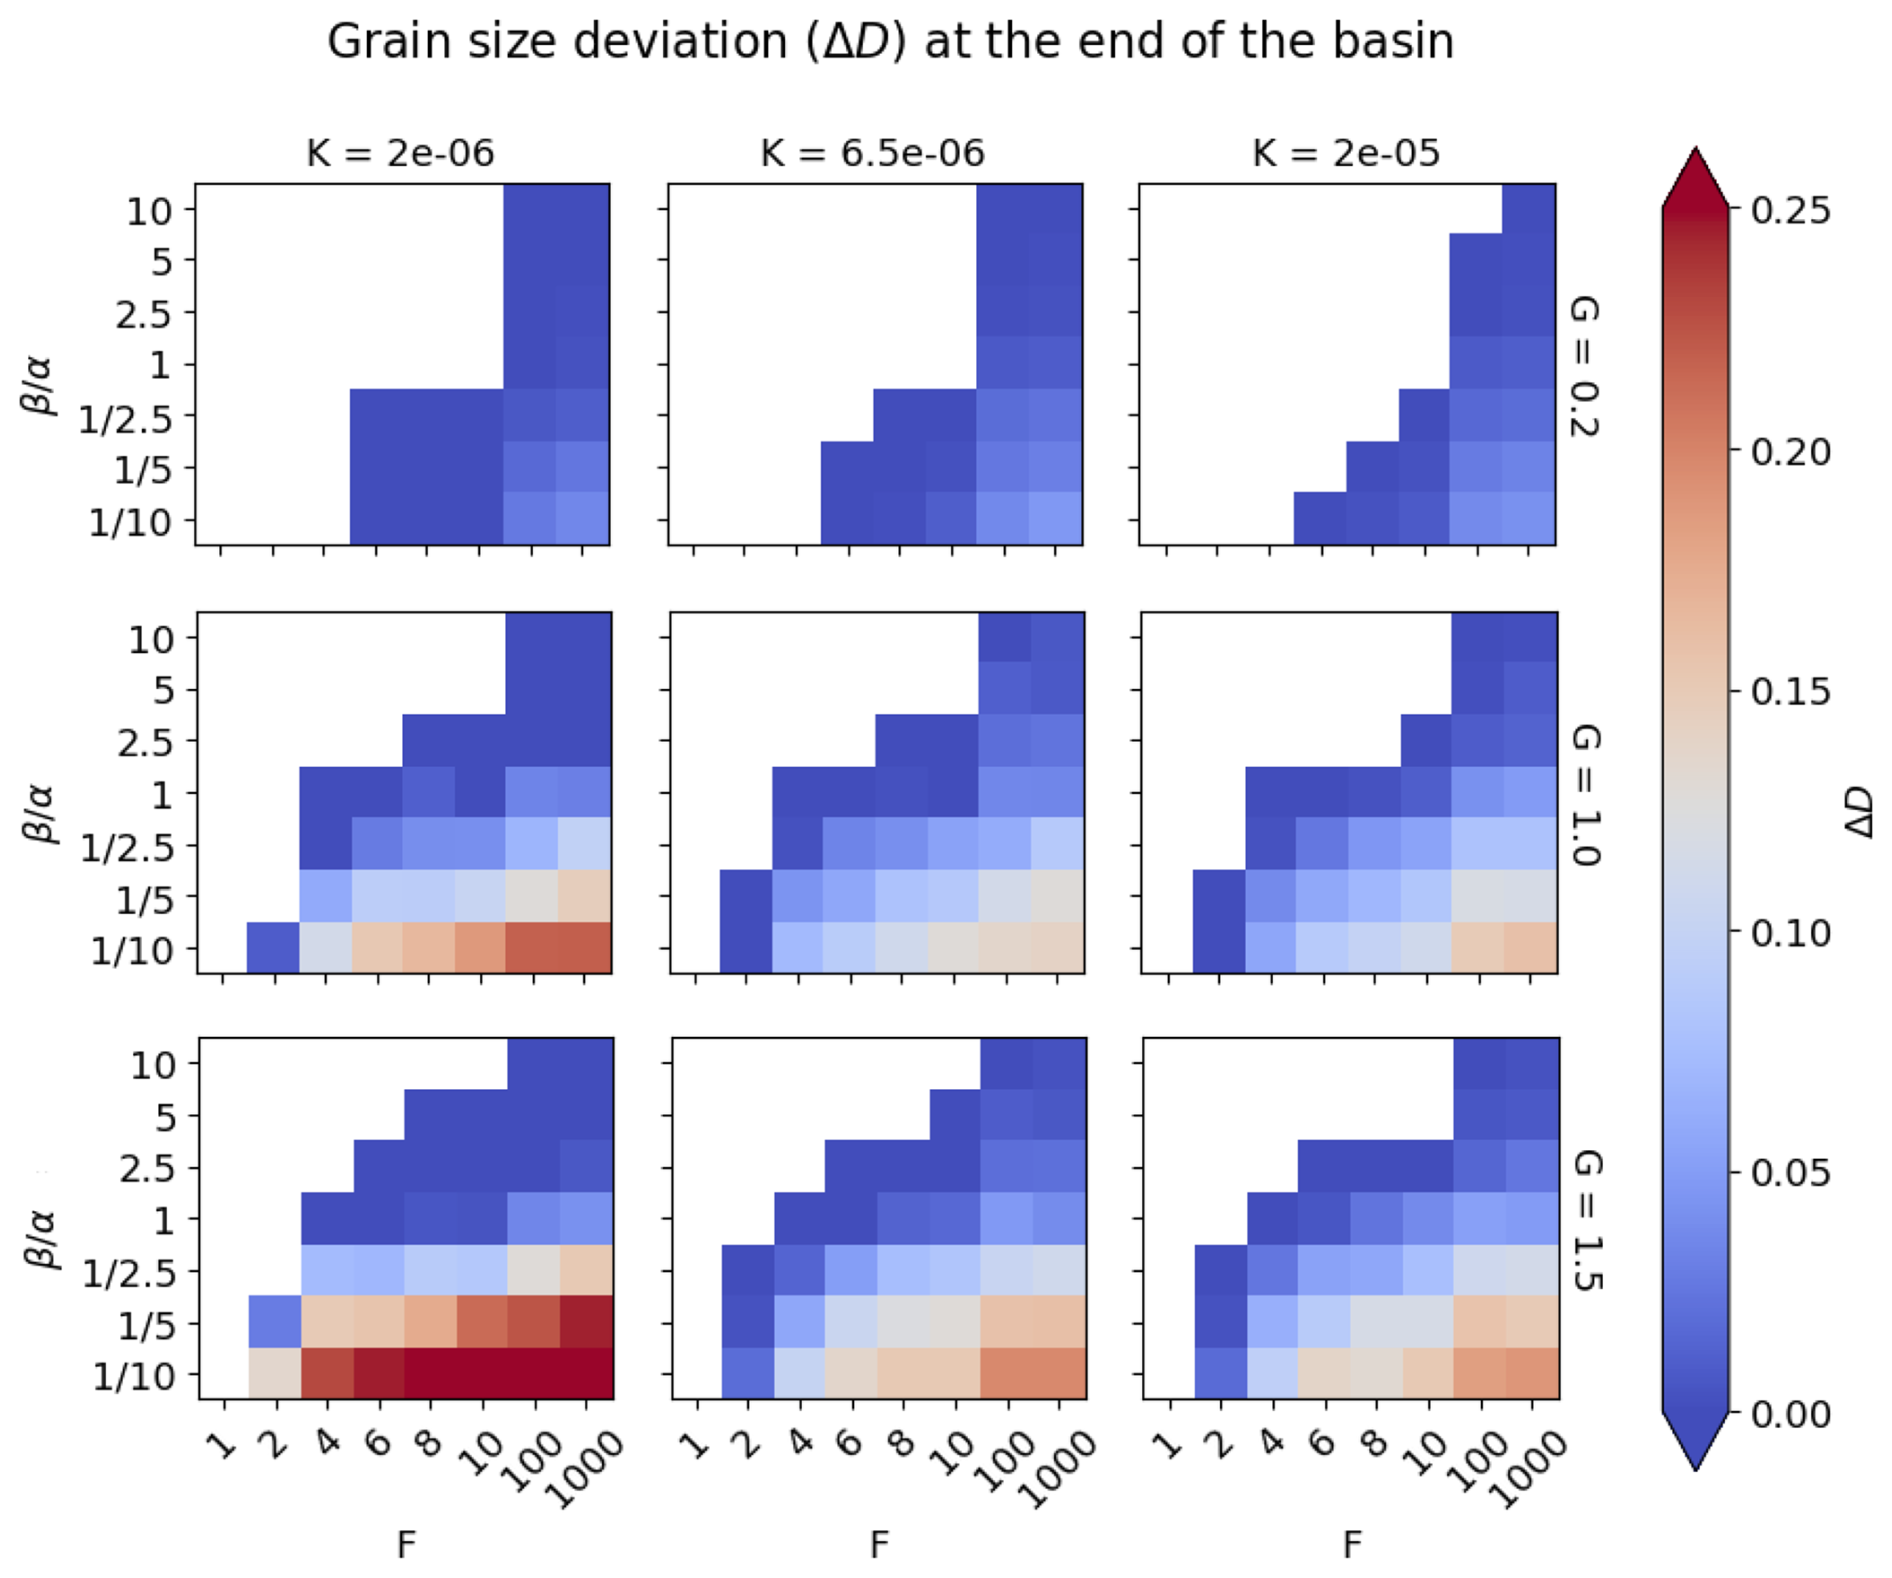
Figure 2Grain size deviation of the GravelScape multi-channel solution relative to the subsidence controlled solution by Duller et al. (2010) with changing model parameters F, β, G, and K. Areas in red highlight high internal dynamics (e.g. topography, channel dynamics) control on grain size fining.
We see that the grain size deviation, ΔD, is controlled by all four factors, with ΔD increasing with increasing values of F, β, and G but decreasing with increasing values of K. If we discard the model runs with low values of K that have not yet reached their steady state at the end of the experiments, i.e. those shown on the left column in Fig. 2, we see that the dependence on K is minimal.
In absolute terms, the maximum values of ΔD are around 15 % to 20 % and are reached for high F and high G values, corresponding to systems in high bypass and in transport-limited conditions. Conversely, systems that are in low bypass (low F) or in detachment-limited conditions (low G) show less than a few percent deviation in grain size fining compared to the predictions of a one-dimensional model, assuming that fining is controlled by subsidence only.
In Fig. 3, we show the grain size predicted by GravelScape at the exit of the basin, which we call . A value of 1 indicates no fining, and a value of 0.5 corresponds to 50 % fining from the original source distribution. Each panel corresponds to the same specific values of K, G, β, and F as in Fig. 2. As demonstrated by Duller et al. (2010), we see a strong dependence of grain size fining on F, with high-bypass (high F) systems showing the least fining (smaller value of ). Contrary to Duller et al. (2010), we also see a strong dependence on β and G and thus on topography. Finally, we see little to no dependence of on K, demonstrating that the apparent dependence of ΔD on K is indeed an artifact due to the fact that the model experiments with low K values have not reached steady state. Figure 3 also demonstrates that similar downstream final values of fining can be observed by changing multiple parameters (e.g. β and G) for the same F values.
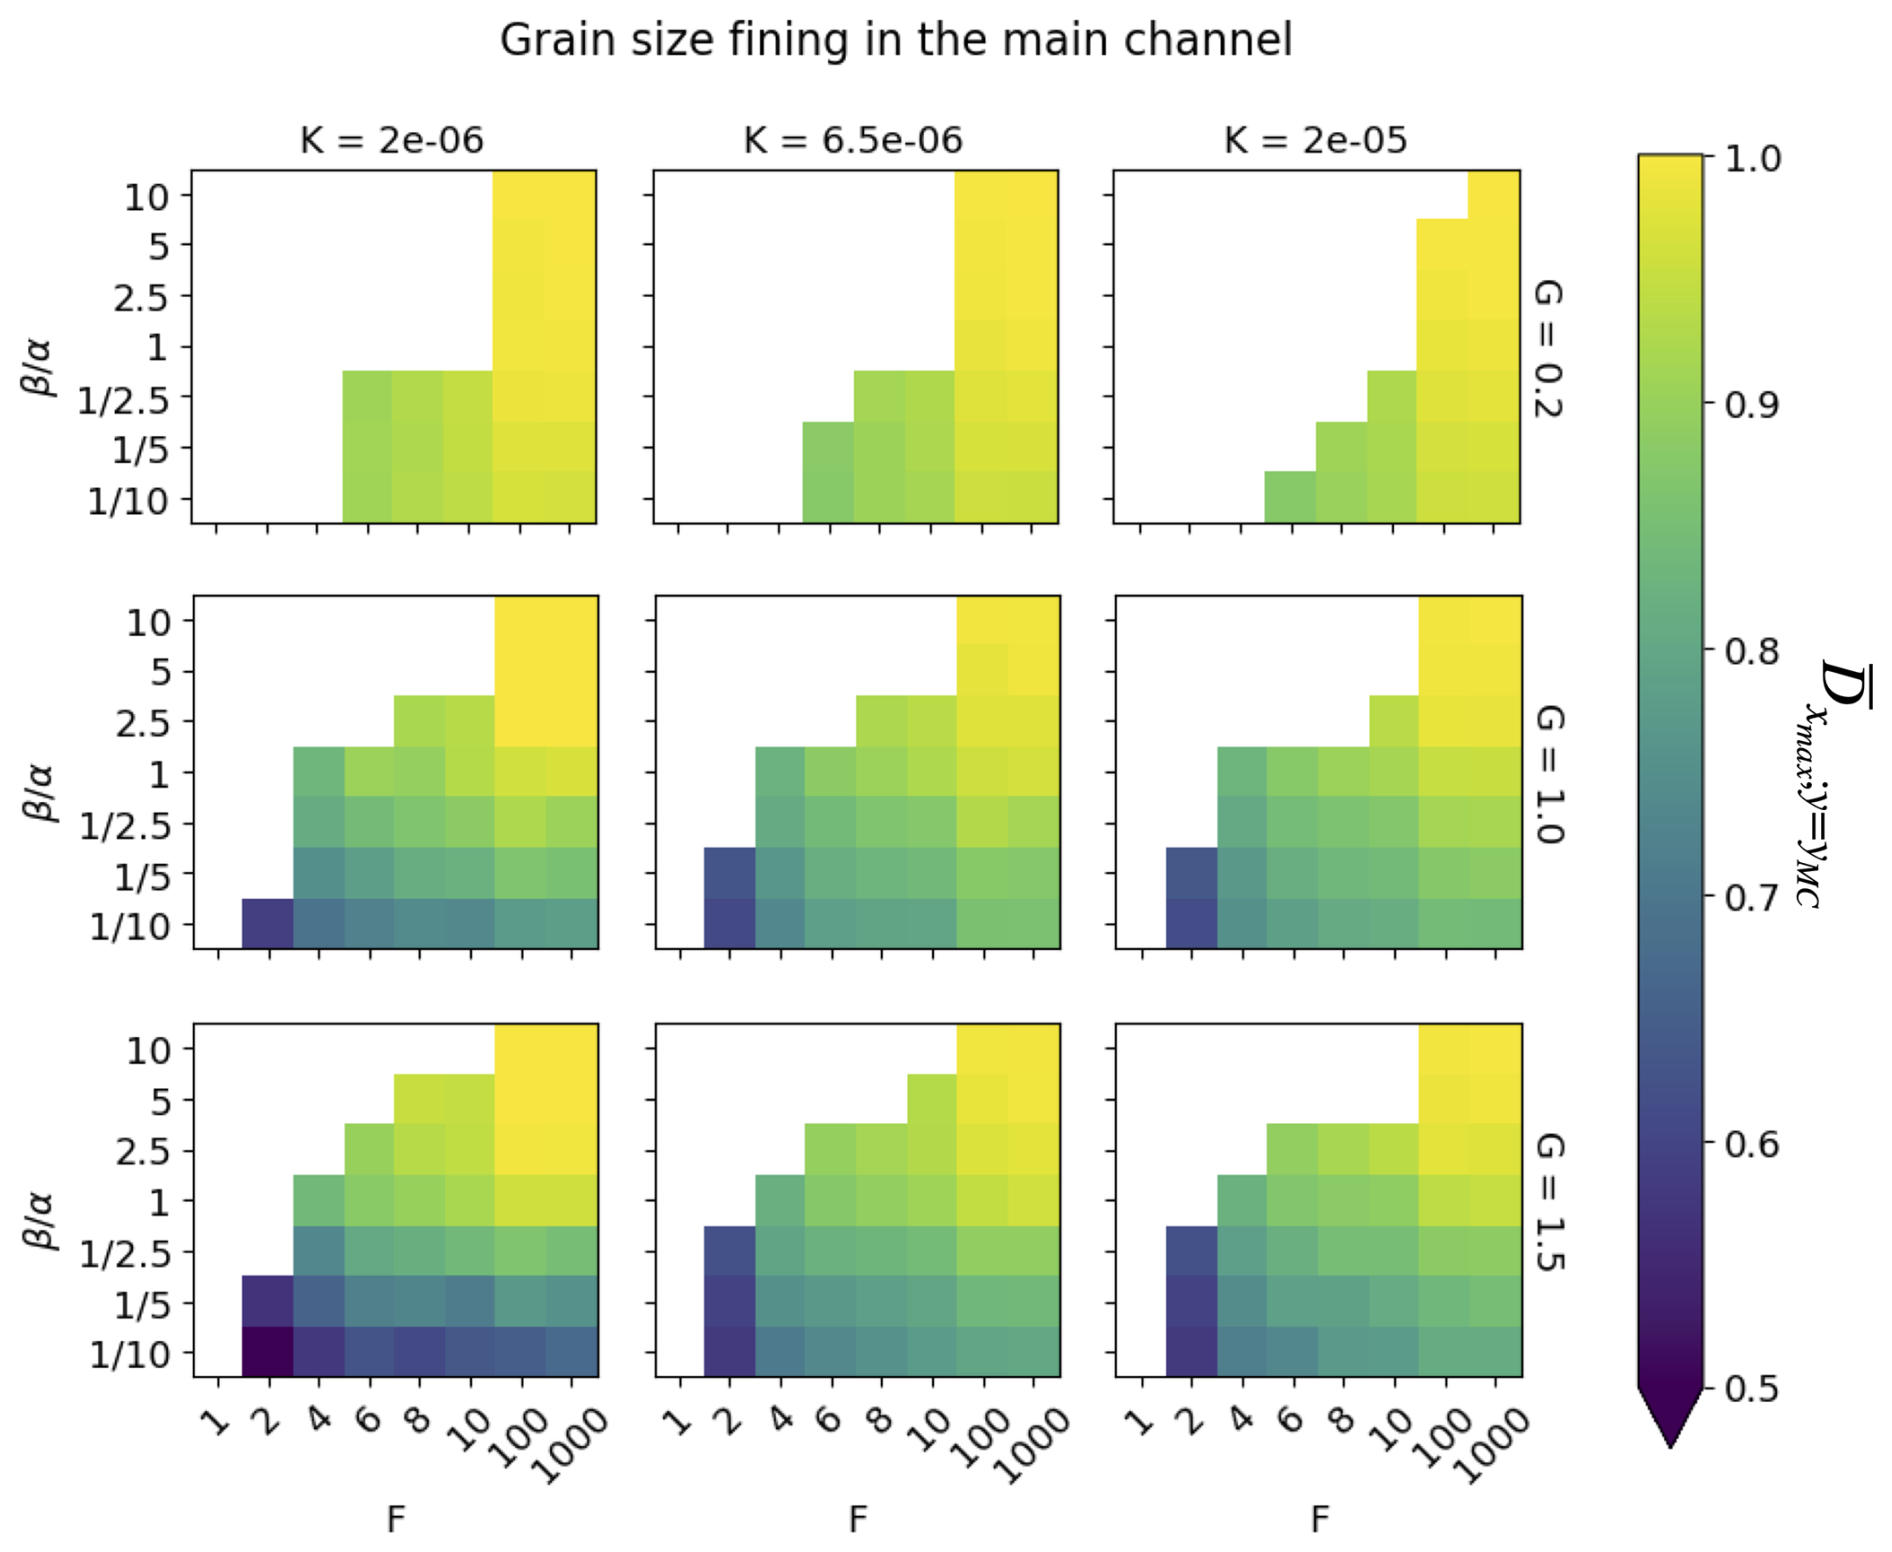
Figure 3Computed grain size at the outlet of the basin within the largest channel of the GravelScape multichannel solution for various values of the model parameters F, β, G, and K at or near (within 90 % of) steady state.
For completeness, in the Supplement, Figs. S3 and S4, we show plots of predicted grain size and other autogenic quantities derived from the model as a function of downstream distance.
Combining the results from the Figs. 2 and 3, we see that the greatest grain size deviation is produced under high bypass (high F) because GravelScape predicts much more fining than expected from Duller et al. (2010). This is because of a strong dependence of grain size fining on topography, which is not predicted by Duller et al. (2010), as high values of G corresponding to more transport-limited systems producing higher fans, and low β values producing shorter and steeper fans, cause more fining and thus grain size deviation from Duller et al. (2010). The dependence on K is less important, except that systems that are characterized by low values of K will take longer to reach steady state and are therefore likely to produce more fining than expected from their basement subsidence.
To demonstrate this last point, we ran the low-K experiment (i.e. where m1−2 m yr−1) for longer than the reference 25 Myr used in all model runs presented in Figs. 2 and 3. We show the results in Fig. 4. In Fig. 4a we show the evolution of the basin apex topography as a function of time with the different time periods over which we computed the deposition rate and grain size fining shown in different colours: dark blue when the system has reached 90 % of its final topography, light blue when it has reached 95 %, and orange and yellow when it has reached steady state. In Fig. 4b and c, we compare the predicted deposition rate (averaged in the y direction and over the time span indicated in panel a) to the imposed subsidence rate and the predicted grain size fining (similarly averaged) to the predictions of Duller et al. (2010), respectively. We also show in Fig. 4c the grain size fining obtained at steady state with a larger value of K (i.e. m1−2 m yr−1) for reference. We see that the mean deposition rate converges towards the subsidence rate, and the fining rate converges towards the solution predicted with a higher K value, as the system moves towards steady state (i.e. from dark blue to yellow). This clearly demonstrate that K has no influence on the grain size fining at steady state but shows an impact during the transient steady state (i.e. even with values within 90 % of steady state showed deviation) where more fining was produced than expected (similar to a lower F) and there is more deviation from the constant, imposed subsidence rate. This is because, before the system reaches steady state, the erosion rate in the mountain is smaller than the imposed uplift rate, and, therefore, the flux coming out of the orogen, qs,i, is smaller than the value, U×LM, which we have used to compute F and impose a constant subsidence rate. In Wild et al. (2025c), we will further develop this point for natural systems and, in particular, for foreland basins, where subsidence rate and erosion rate in the source area are intimately linked by flexural isostasy.
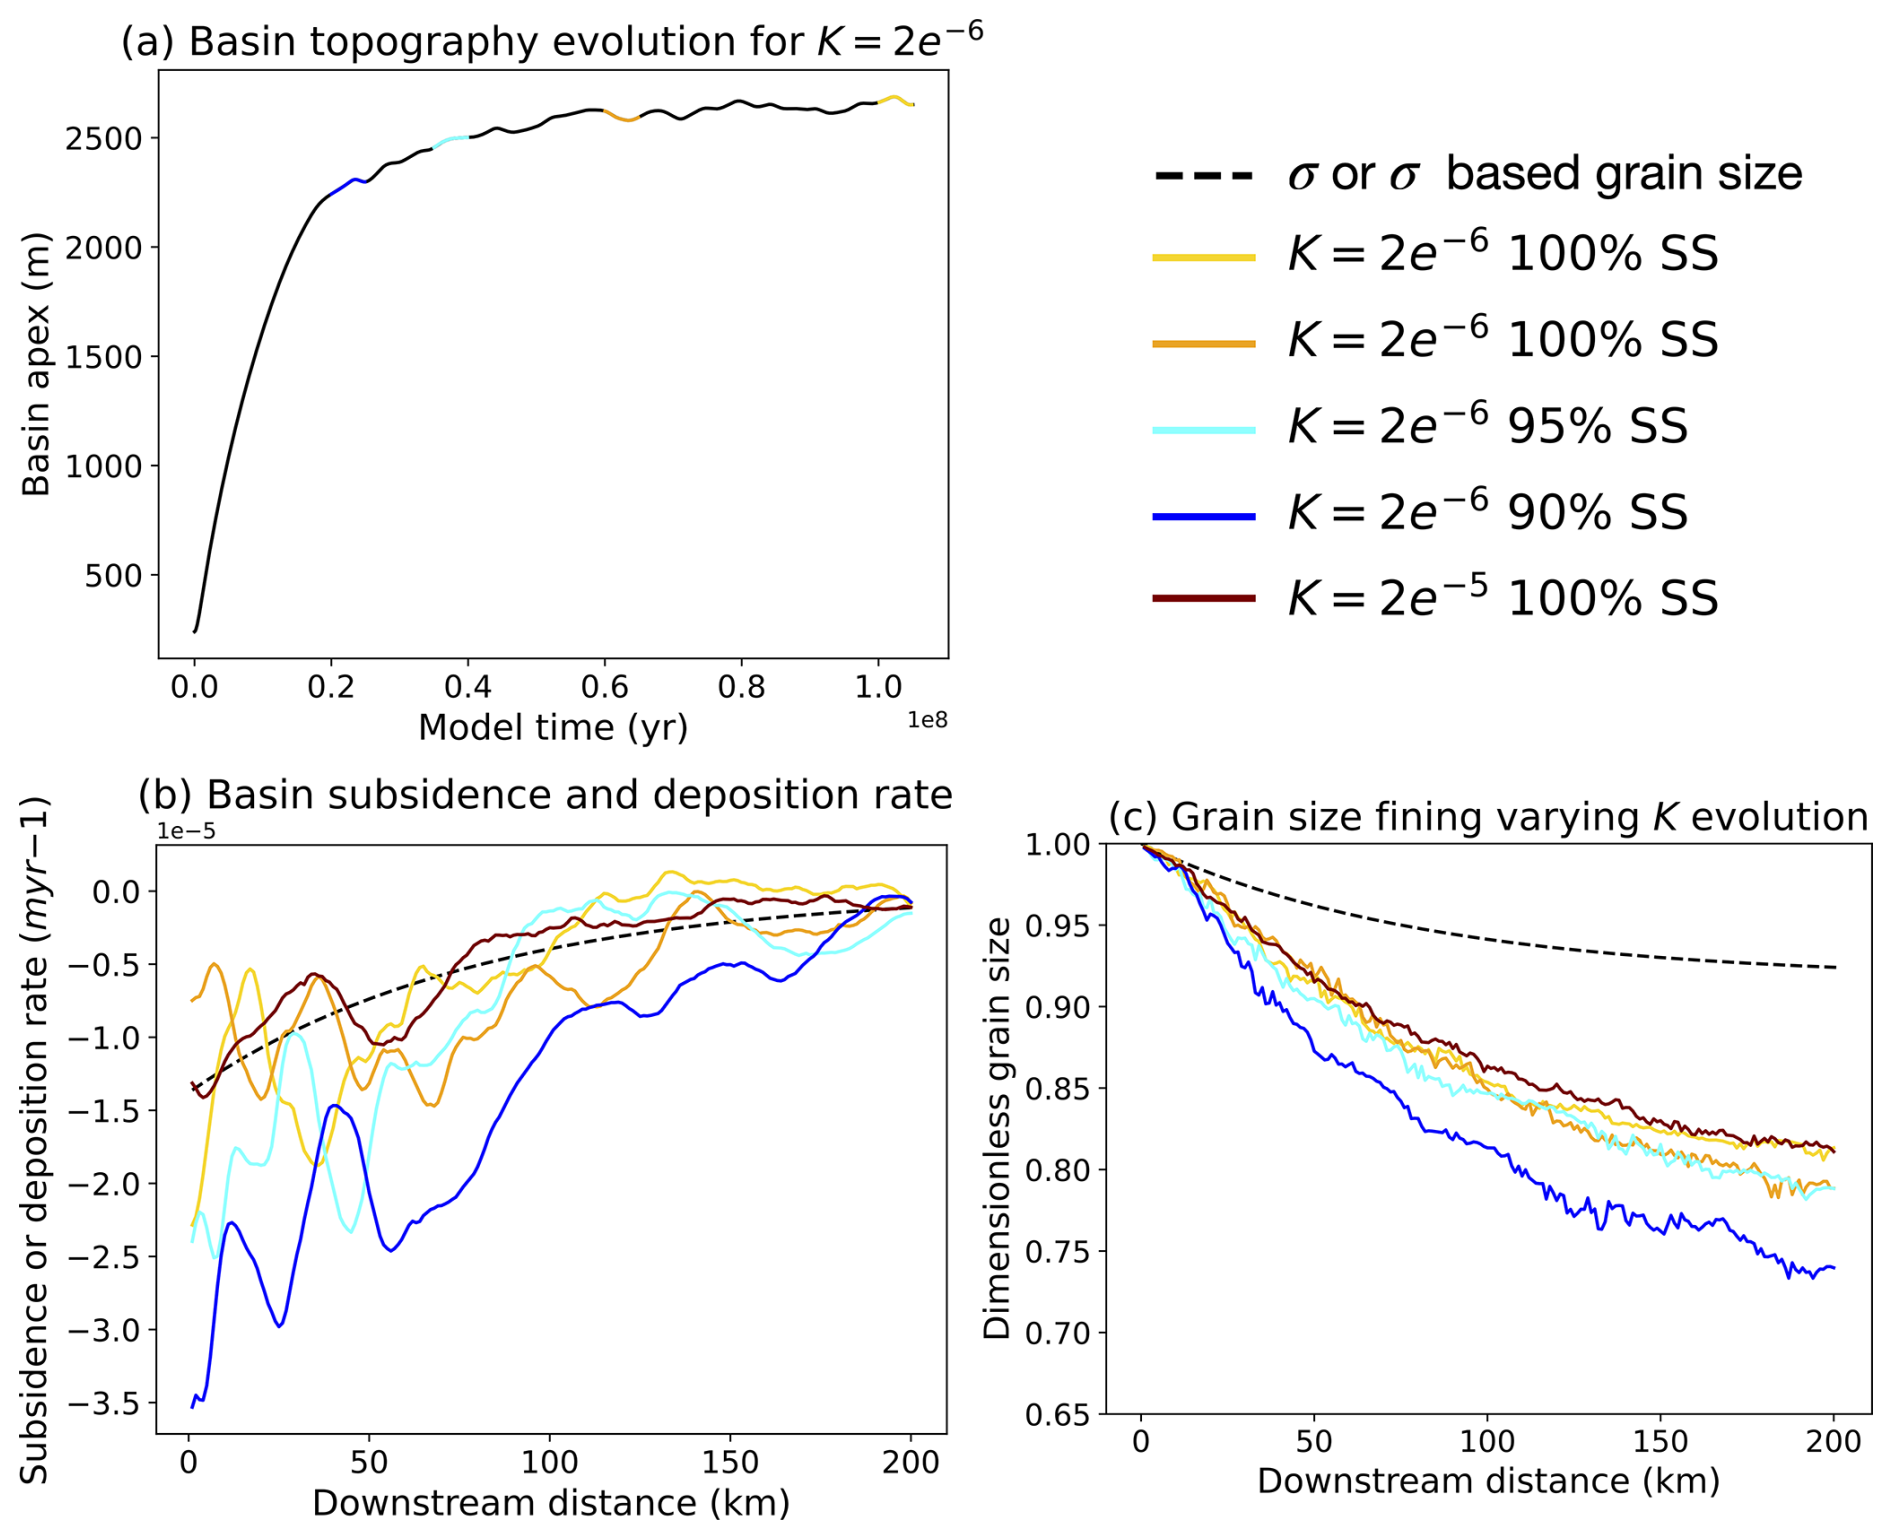
Figure 4Deposition rate and grain size fining on the way to steady state. (a) Time evolution of the maximum topography in the basin with 2.5 Myr time intervals over which averaging is performed in panel (b) and (c) indicated in different colours. (b) Imposed subsidence rate (dashed line) and deposition rate averaged in the y direction and over the time span indicated in panel (a). (c) Grain size fining predicted by Duller et al. (2010) in response to subsidence only (dashed line) and grain size predicted by GravelScape at different times in the evolution of the system towards steady state. The brown line corresponds to a solution with a high value of K that has reached steady state. All model runs assume moderate bypass (F=10), transport-limited conditions (G=1) and low mountain precipitation . All solutions shown are not affected by local minima.
3.2 The link between internal dynamics and grain size deviation
3.2.1 Depositional divergence (dv)
We now proceed to determine the link between divergence in grain size fining, ΔD, and autogenic processes. To compute grain size fining, the approaches of both GravelScape and Duller et al. (2010) use the model of Fedele and Paola (2007), which assumes that fining is in proportion to deposition rate (scaled by sediment flux). The difference between the two methods (multiple- vs. single-channel) is therefore likely to be explained by differences in the effective deposition rate they predict as mentioned in Wild et al. (2025b). To quantify this difference, we define a parameter sensitive to local deposition rate fluctuations. We explicitly remove the background mean deposition rate, induced by basement subsidence, to isolate the amplitude of depositional variability. We call this parameter the depositional divergence rate, , defined as
where is the deposition rate (units of m yr−1) computed by GravelScape (negative where/when there is deposition and positive where there is erosion), σ is the subsidence rate (m yr−1), (<0) means that only deposition is considered, and indicates an average in the x and y directions and over time (once the system has reached steady state). The denominator () is the mean erosion rate (in m yr−1) in the source area (the mountain). To illustrate this concept, in Fig. 5a we show the patterns of deposition/erosion rate predicted by GravelScape in an arbitrary model run at an arbitrary time step. We see that the system is dominated by deposition (because the basin basement is forced to subside) but that large variations in deposition rate appear in response to the channelized nature of transport in GravelScape. In Fig. 5b, we show profiles of the deposition/erosion rate obtained by averaging values obtained by GravelScape in the y direction for different values of the model parameters F and G. We see that the deposition rate follows the trend of the imposed subsidence rate but that relatively large variations in erosion rate are predicted, even after averaging in the y direction. The resulting values of the depositional divergence are shown in Fig. 5c.
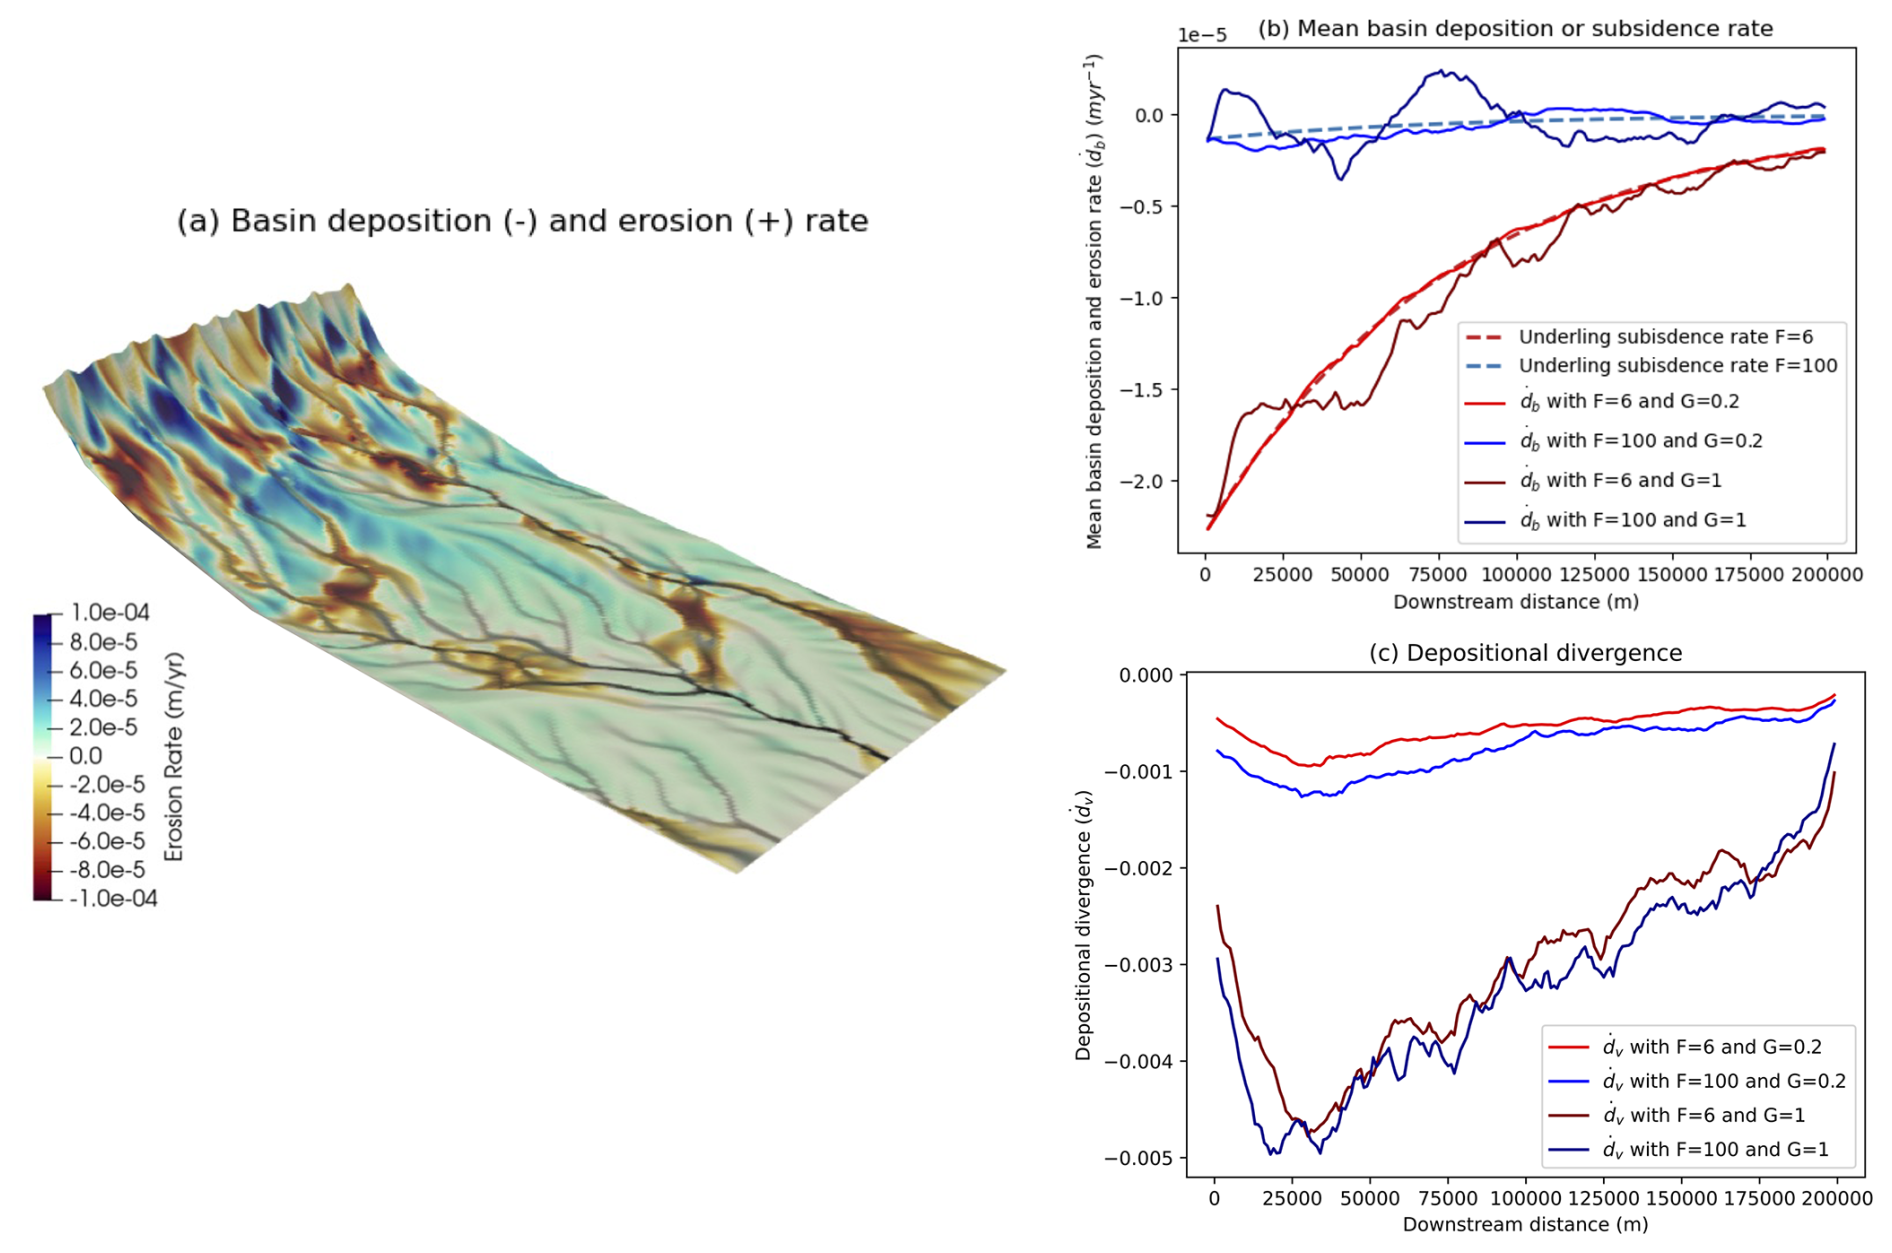
Figure 5(a) Example of variations in deposition and erosion rate across the basin at steady state computed by GravelScape. (b) Comparison between the subsidence rate and the computed steady-state deposition/erosion rate averaged in the y direction for different values of the model parameters F and G. (c) Corresponding values of the depositional divergence, .
At steady state (Fig. 5), is a direct measure of the relative amplitude of autogenic processes around the mean, i.e. the processes that cause deposition and erosion events unrelated to the external forcing, in our case, the sediment flux from the mountain and the basement subsidence in the basin. Indeed, if the autogenic processes are negligible, deviations in local deposition rate are small compared to the imposed subsidence rate, and is small in comparison to the incoming sediment flux. Alternatively, if local deviations in deposition rate become more important than the incoming sediment flux, is larger than 1. Further analysis shows that when orogen discharge, β, is high or the system is more “detachment-limited” (i.e. low G), then the magnitude of depositional divergence and the variability are relatively reduced. When β is low or the system approaches transport-limited conditions, for both high- and low-bypass conditions, we see a much greater magnitude of depositional divergence, particularly near the mountain front with a larger variability in the down-system direction.
3.2.2 Rugosity (η)
In the approach of Duller et al. (2010), deposition is equated with subsidence, and no surface topography is needed or computed. On the contrary, in GravelScape, the deposition (and erosion) of sediment is a function of the shape of the surface topography as shown by the form of Eq. (1). Therefore, any difference in grain size fining trend between the two approaches is therefore likely to be related to the shape of the surface topography, i.e. its mean slope and the rugosity of the surface. Based on previous work (Braun, 2022), we have already explained how the slope is function of the model parameters (K, G, β, and F), but little is known about the model controls of the surface roughness (or rugosity) that is caused by internal processes and, in particular, the presence of multiple channels.
To quantify the rugosity, we define a rugosity parameter, η, as the standard deviation of the topography in the y direction, averaged in the x and over time at steady state:
Defined in this way, the rugosity parameter, η, can also be regarded as the average height difference between the interfluves and the channels or as the thickness of the sediment active layer that is reworked (incised and infilled) over multiple steady-state time steps. This is also similar to the concept of the active layer described in Toby et al. (2022). To illustrate this point, in Fig. 6 we show cross-sections in the y direction of the surface topography predicted by GravelScape for an arbitrary model run and time step. We see that at all three locations, the surface topography fluctuates by tens of metres, with the lows corresponding to channels and the highs to interfluves.
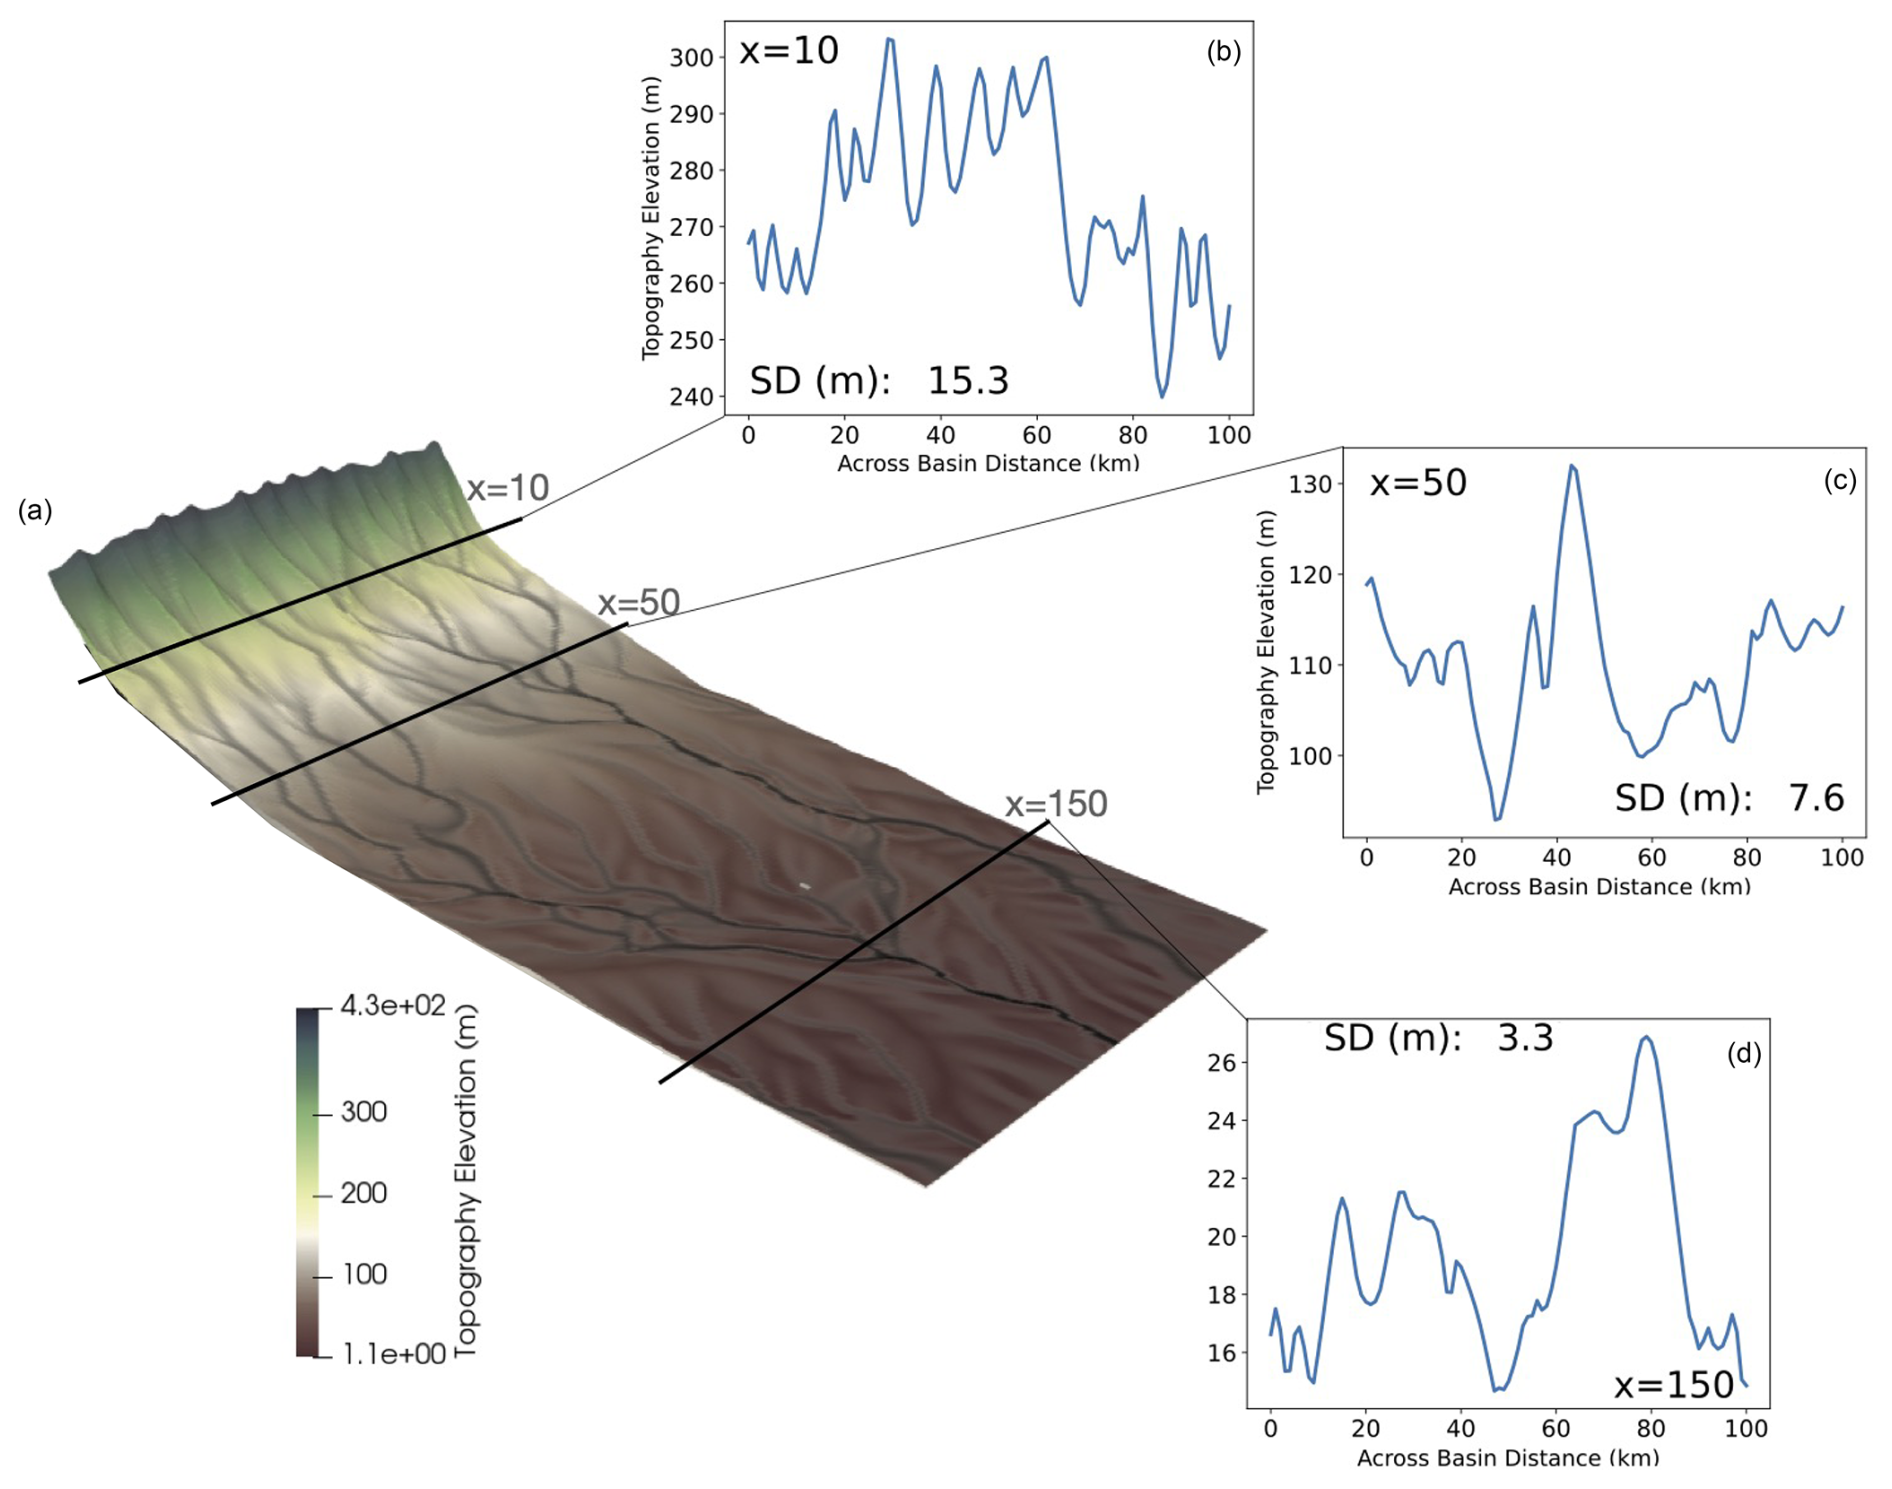
Figure 6(a) Example of a GravelScape predicted topography. Panels (b), (c), and (d) are topographic profiles at three locations (x) distant from the mountain front by 10, 50, and 150 km, respectively. The across-basin distance is the y direction in the model.
3.2.3 Links between ΔD and dv, η, and S
We now proceed to further analyse the model runs we have performed with GravelScape using a wide range of model parameters (as shown in Fig. 7) by searching for relationships that may exist among the grain size deviation, ΔD, or the depositional divergence, , and the surface rugosity, η, the slope, S, or K across all model setups. Here, the slope, S, is the derivative of the surface topography in the x direction averaged over the x and y directions and over time, at steady state. The results are shown in Fig. 7.
In each of the diagrams shown in Fig. 7, each model experiment is summarized by a single point, averaged across the entire basin (for the slope) or at the basin outlet (for the grain size). The range of model parameters (F, G, β, and K) we consider are the same as those used in Figs. 2 and 3 and not considering the models affected by local minima.
We see that there exists a strong correlation (r2>0.75) between the depositional divergence and the grain size deviation (Fig. 7a). This is a direct consequence of the assumption made in the model of Duller et al. (2010) for grain size fining that fining is in proportion to deposition rate relative to sediment flux. This, indeed, implies that where the deposition rate diverges most from the subsidence rate (large values of ), the departure from the single-channel model of Duller et al. (2010) is largest. In other words, grain size fining exceeds what is expected from a one-to-one relationship with subsidence in regions of enhanced deposition that is caused by the heterogeneity in deposition rate inherent to a system that transports and deposits sediment in distinct, multiple channels.
In Fig. 7b we see that the depositional divergence is, in turn, related to the product of the rugosity by the erodibility. This product, ηK, has units of m yr−1 (in cases where n in the slope exponent in the SPL is 1) and can be regarded as a measure of the rate at which the rugosity or the side of a channel is eroded away and is therefore a proxy for the rate of the across-system (or interfluve) reworking. Depositional divergence, at steady state, describes the amplitude of erosion and deposition around the mean rate due to local erosion followed by subsequent local infilling during the next depositional event. When the basin experiences local erosion (e.g. especially under high bypass), depositional divergence therefore controls the rate at which channels change their shape and direction and can subsequently impact channel avulsion and mobility. The correlation showed on Fig. 7b demonstrates that the autogenic processes leading to the depositional divergence are physical (and not random or numerical in nature) as they are directly related to the rate of change of channel geometry, as shown through rugosity, predicted by the basic equation (the modified SPL) at the core of the sediment transport model of GravelScape.
Interestingly, the rugosity itself appears to be strongly correlated with the slope (Fig. 7c). This is easily explained when considering that it is the ratio between the slopes along and across a channel that determines the stability of any given channel. If the across-channel slope becomes smaller than the along-channel slope, an avulsion takes place. As the rugosity controls the across-slope and the slope in the x direction is approximately equal to the along-channel slope, the two should therefore be correlated. This is further proof that the deviation in grain size fining predicted by GravelScape with fluvial channel dynamics results from deterministic, physical reasons and not random (or numerical) artefacts.
Finally, in Fig. 7d we show a relationship between grain size deviation and the product of slope and K. This is a direct consequence of the relationship between depositional divergence and the product of rugosity by K and the strong correlation between rugosity and slope. This demonstrates that, although the correlation of the grain size deviation is much higher when directly related to the autogenic depositional deviation parameter, higher autogenic grain size deviation tends to occur under landscapes with steeper slopes.
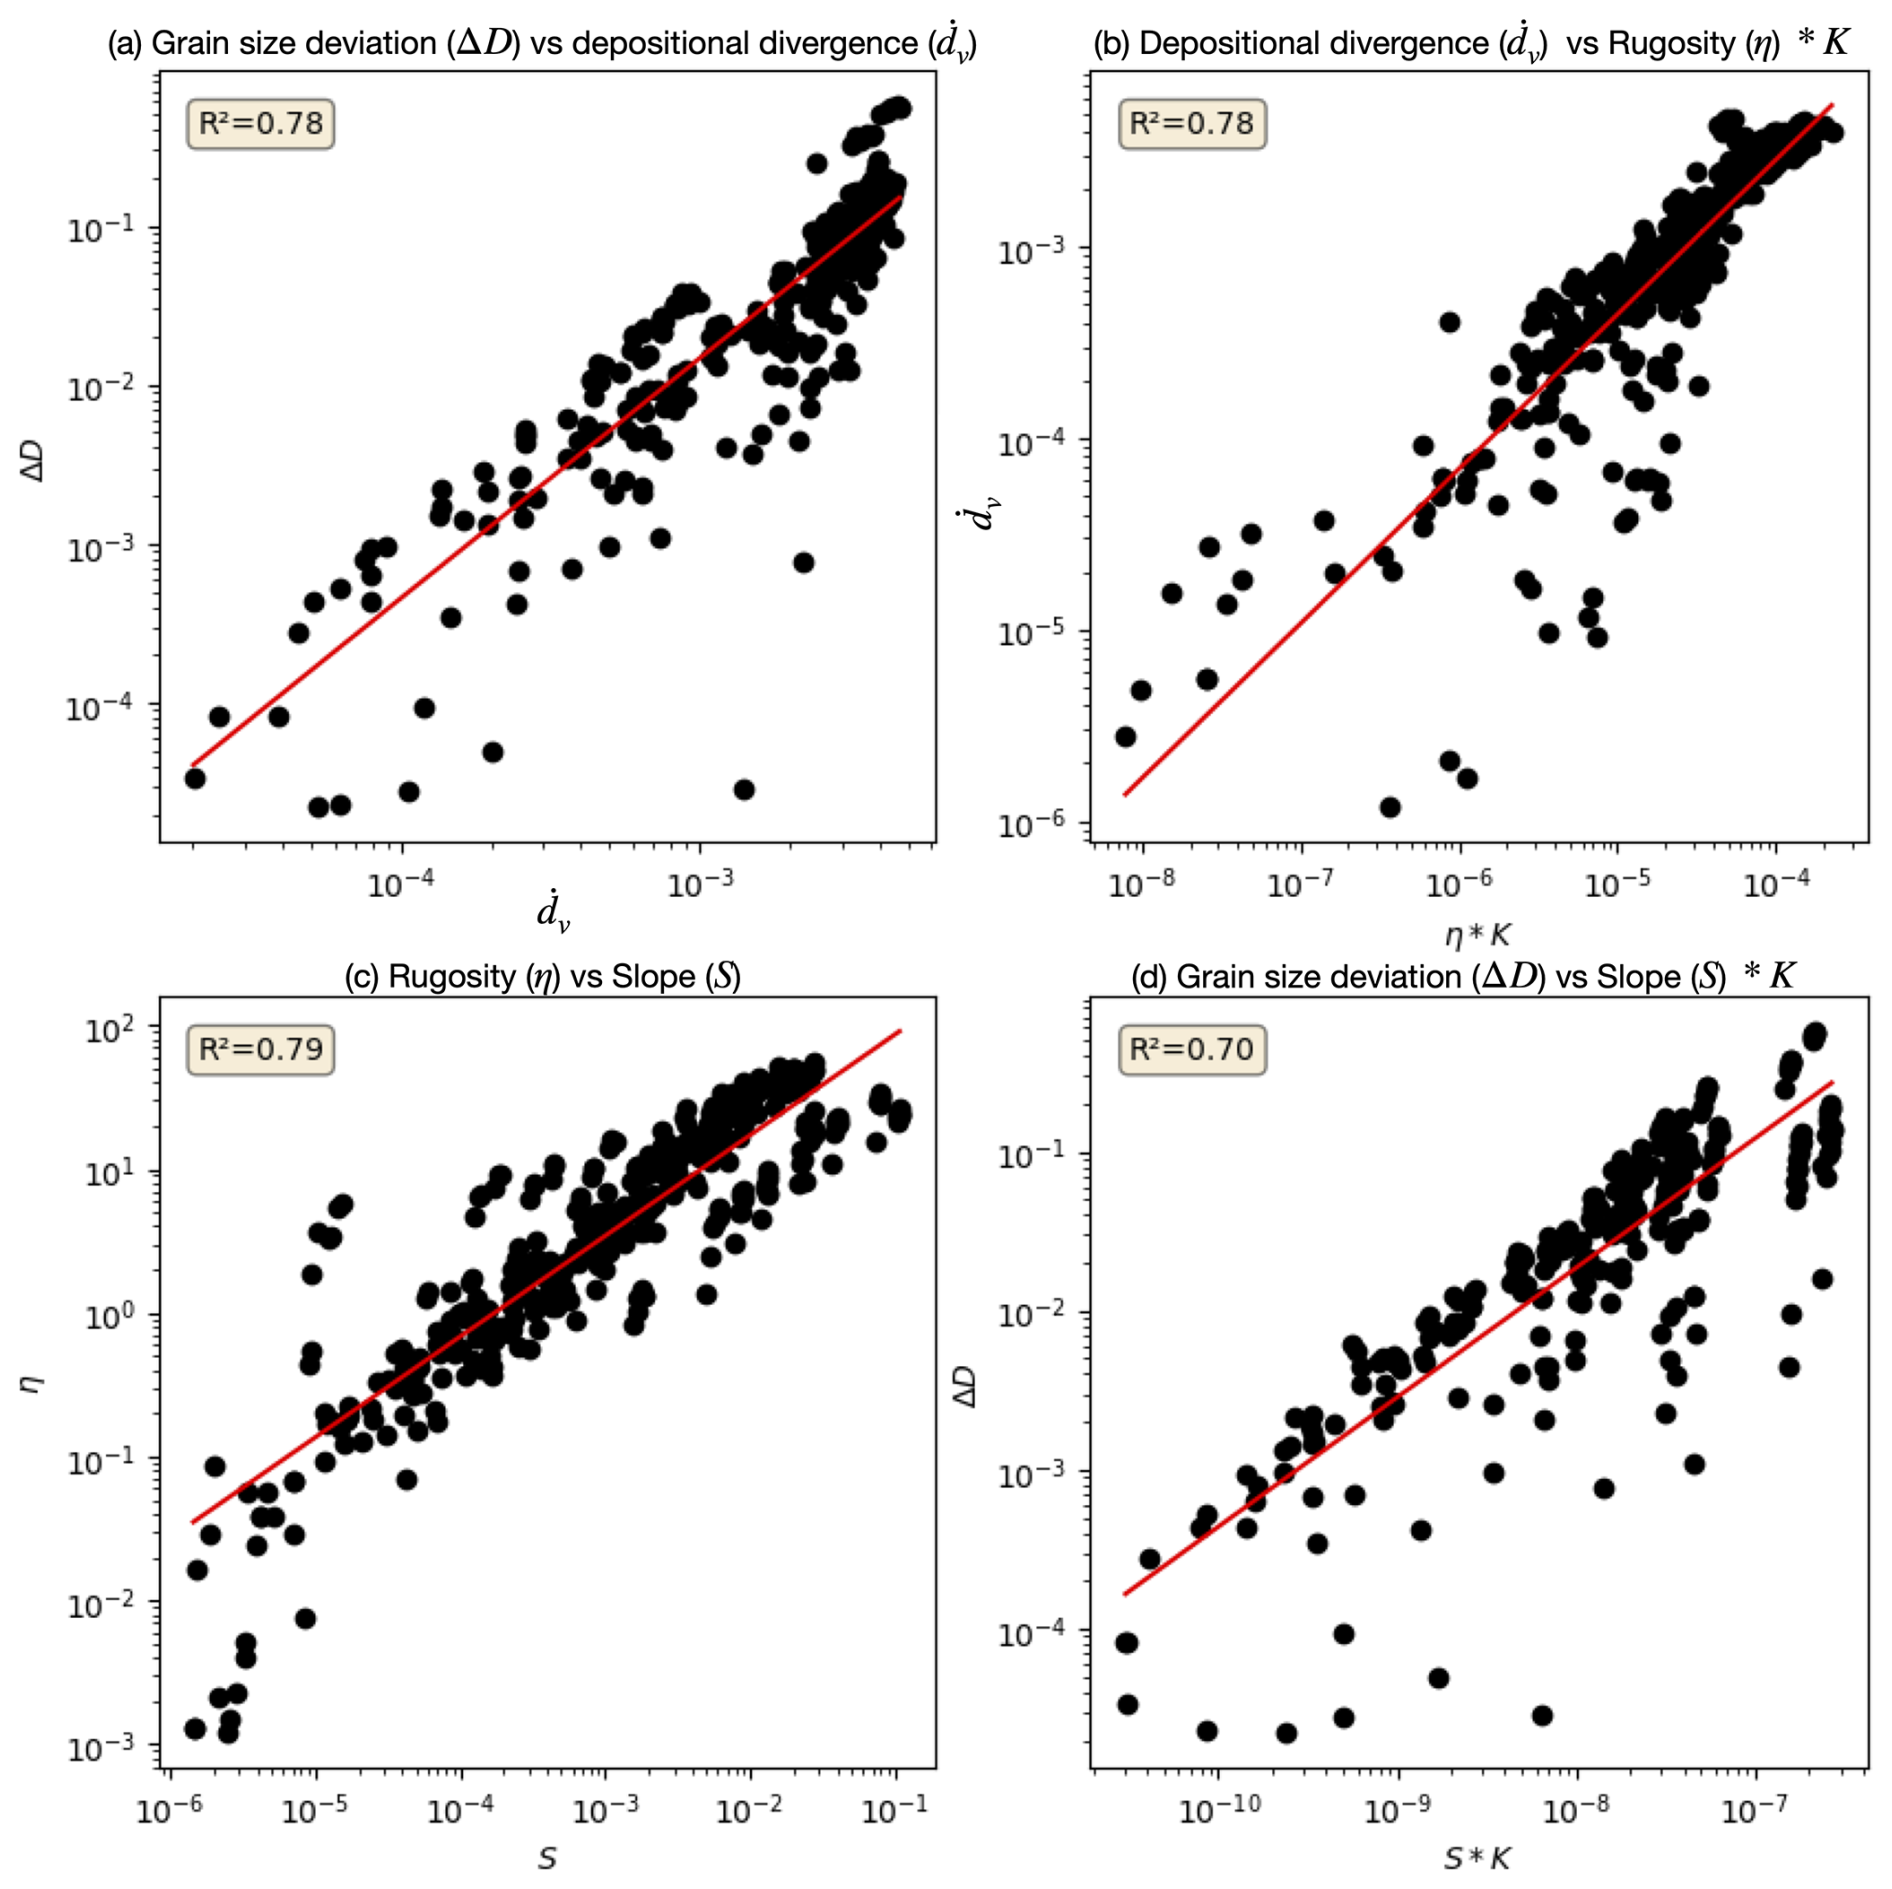
Figure 7Correlations between grain size deviation, depositional divergence, surface rugosity, and slope for all model experiments performed in this study obtained by varying model parameters F, K, G, and β. Model runs affected by local minima have been neglected. (a) Grain size deviation, ΔD, against depositional divergence, ; (b) depositional divergence, , against the product of surface rugosity, η, and erodibility, K; (c) surface rugosity, η, against surface slope, S; and (d) grain size deviation, ΔD, against the product of slope, S, by K. In each panel, the red line shows the trend of the least-squares regression in log space, and the resulting coefficient of variation is given in the inset.
In summary, we have seen that under certain circumstances, namely high-bypass efficiency (F values), low orogen discharge efficiency (β values), or high depositional efficiency (G values), the grain size fining predicted by GravelScape deviates markedly from predictions made assuming a single channel and a deposition controlled by subsidence only (we refer to this difference as the grain size deviation, ΔD). We have shown (see Fig. 7) that grain size deviation is proportional to the contribution to sedimentation from autogenic processes, which we quantified by introducing a depositional divergence factor, . Furthermore, we have shown that the magnitude of these autogenic processes, especially under high bypass, is correlated to surface rugosity, η, and slope, S.
4.1 A new generalized framework to interpret grain size fining data
To further synthesize our results and facilitate their use for the interpretation of grain size fining data, we have developed a generalized framework to determine under which basin-wide configurations grain size fining is dominantly controlled by subsidence (i.e. mean deposition rate) or by autogenic dynamics (i.e. depositional divergence). The framework is based on two maps shown in Fig. 8a and b, one of the grain size fining (Fig. 8a) and one of the grain size fining deviation (Fig. 8b) as a function of two variables, F and β. These maps are obtained by averaging the results shown in Figs. 3 and 2 over G and K, respectively. This averaging is justified by the low dependence of these results on K and the fact that the value of G is difficult to assess but likely to be relatively close to 1 as many alluvial, continental sedimentary systems are predominately, moderately transport-limited (Guerit et al., 2019). In Appendix B and Fig. B1, we show maps similar to those shown in Fig. 8 but using the slope, S, along the vertical axis.
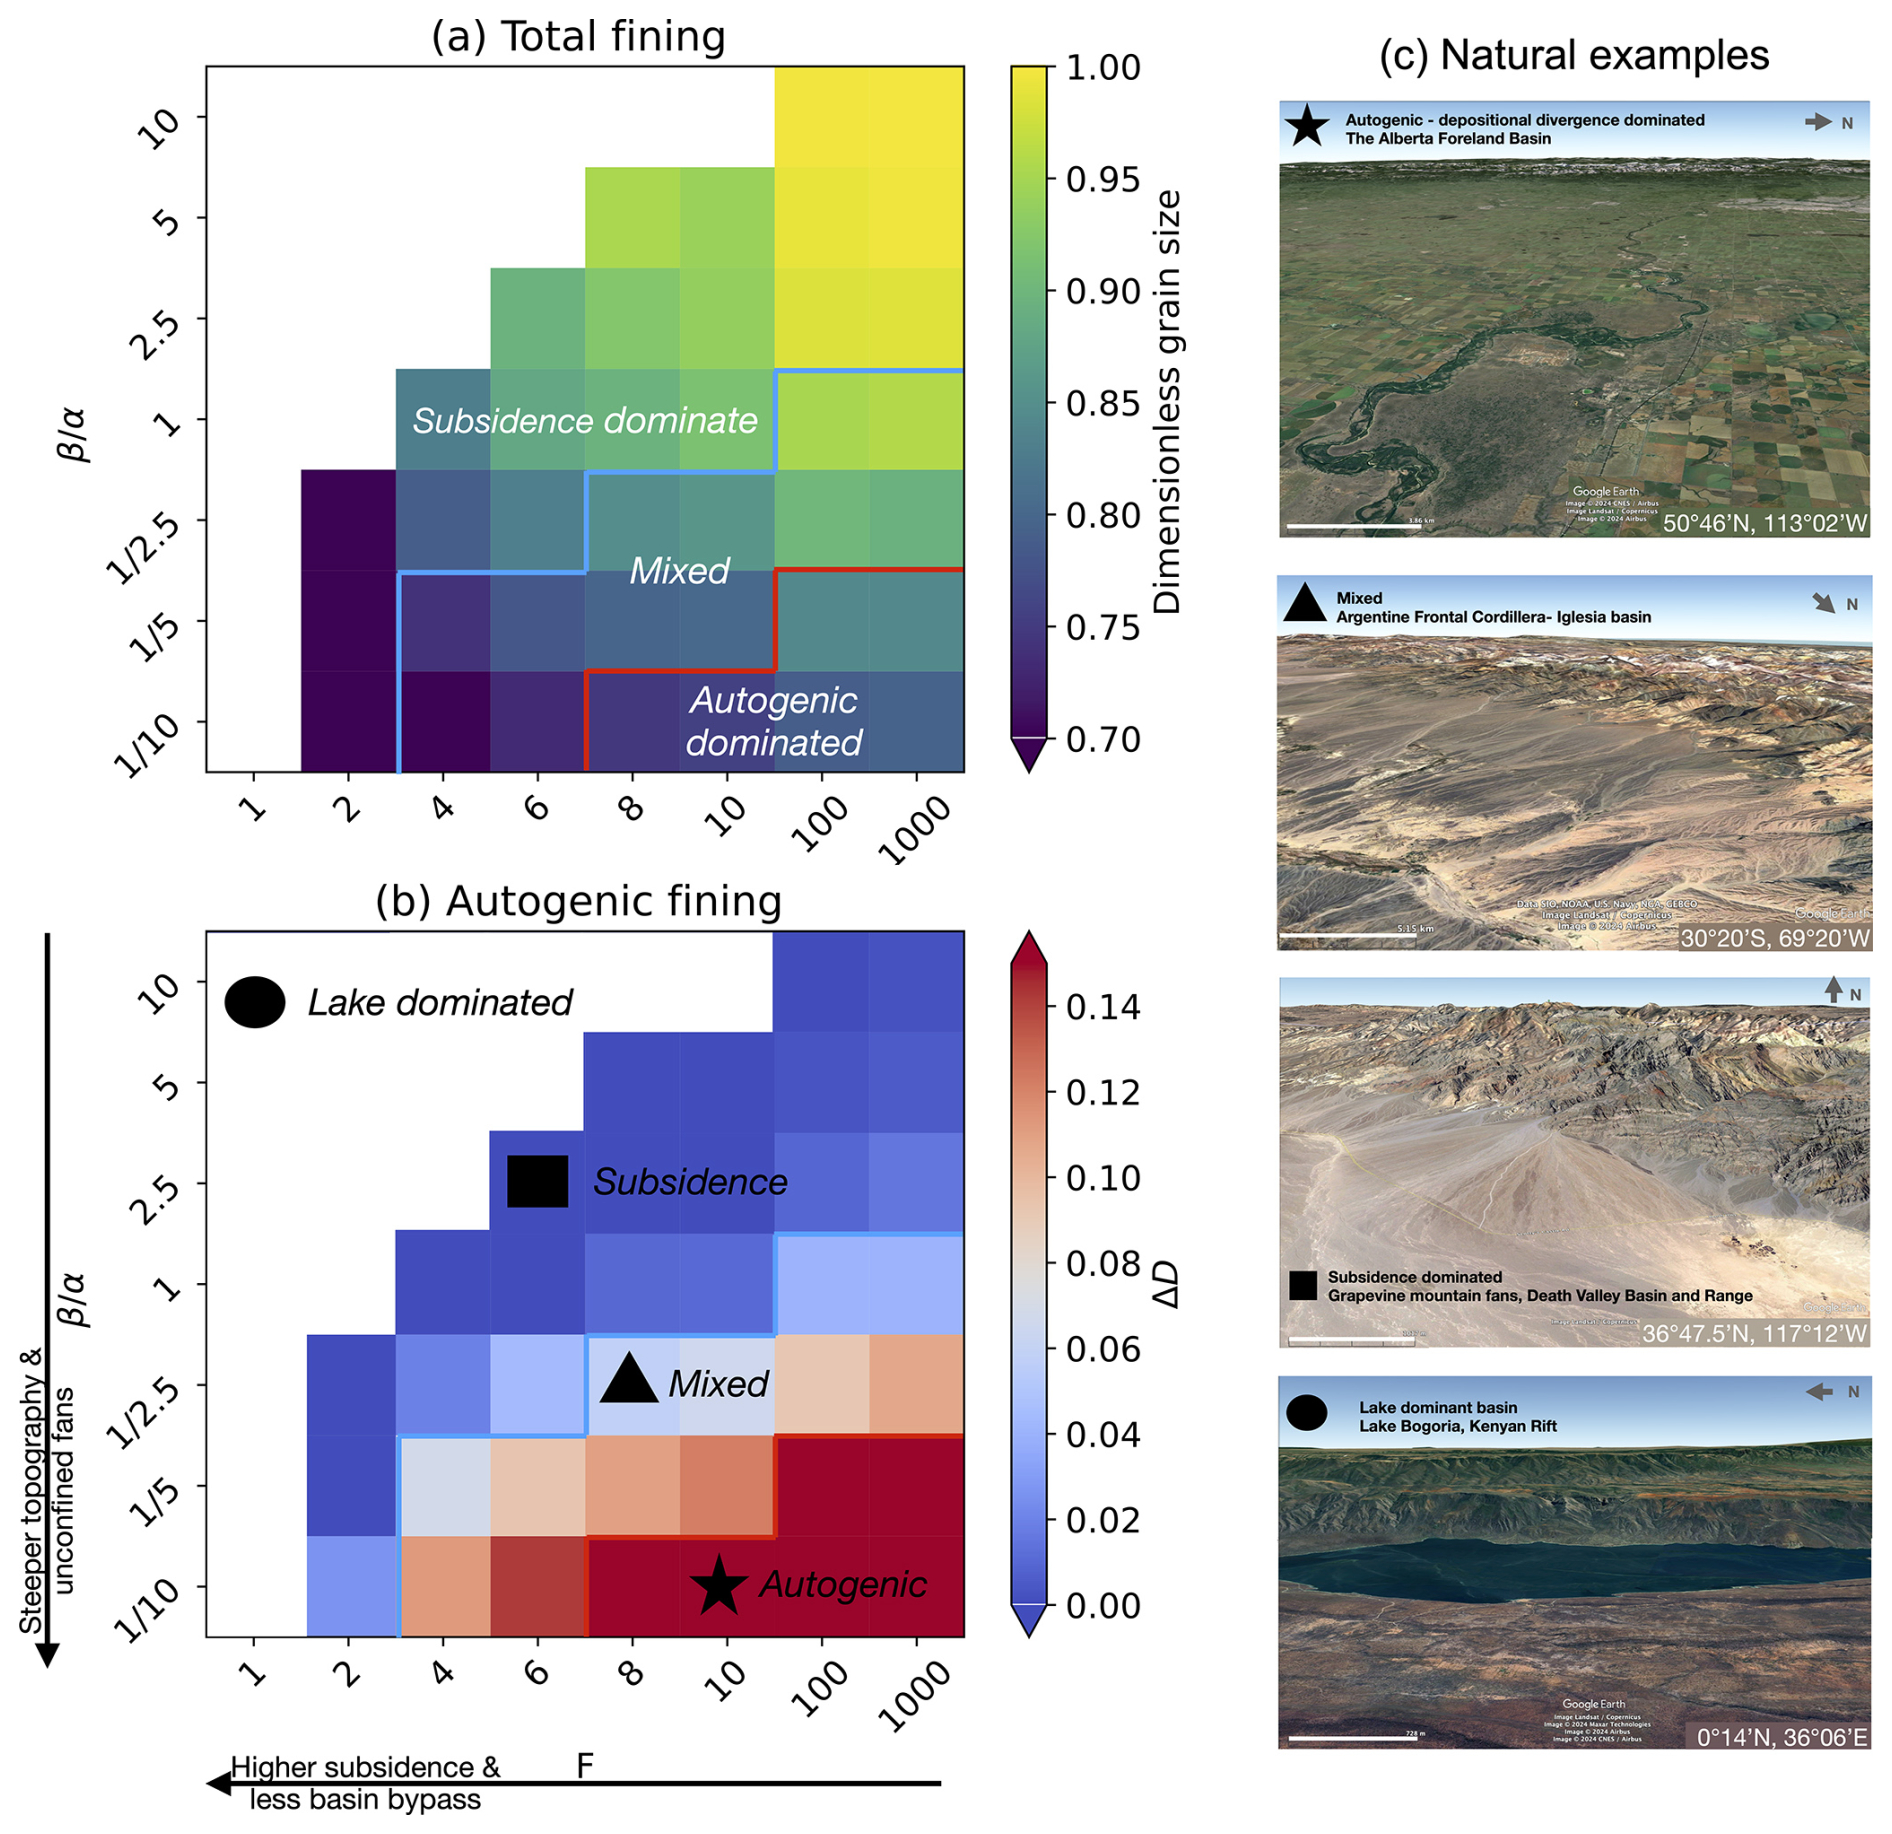
Figure 8Proposed framework to interpret grain size fining trends. Maps of (a) total grain size fining and (b) grain size deviation as a function of F and β and (c) select natural examples from the literature that we have located in our framework. Red (star) areas in plot (b) indicate conditions where autogenic (β)-driven grain size fining is indistinguishable from (see plot a) or exceeds any subsidence (F)-driven fining. Darker blue (square) areas in plot (b) indicate that subsidence dominated fining is distinguishable with limited autogenic (β) influence. Map imagery sourced from ©Google Earth 2024.
In these maps (Fig. 8a and b), we define three main regimes for grain size fining based on the grain size divergence computed by GravelScape: (1) a subsidence-dominated regime, where grain size deviation is insignificant (under 5 %); (2) an autogenic-dominated regime (including transient and steady-state systems), where grain size deviation is larger than the fining induced from subsidence (i.e. that predicted from Duller); and (3) a mixed regime, where grain size divergence is non-negligible (over 5 %) but not greater than the subsidence-induced fining. Note that the top-left region in both panels (a) and (b) of Fig. 8 corresponds to model parameter values that lead to unrealistically flat topographies such that the solution is dominated by the presence of numerous local minima. We do not include modelling results in this region in our framework as it represents situations that are inadequate for measuring grain size.
We see that where total fining is larger than 30 % (bottom-left corner), the system is consistently in the subsidence-dominated regime. In other words, autogenic grain size fining alone cannot explain fining above 25 %–30 %. These subsidence-dominated systems are in low-bypass and steep slopes (low β values). At the diagonally opposite side of the map, i.e. in systems characterized by high bypass and low slopes (high β), there is little to no fining (less than 2.5 %, top-right corner) as neither subsidence nor autogenic processes can produce fining. In our new framework, the subsidence-based interpretation for grain size fining of Duller et al. (2010) is equivalent to a trajectory in the subsidence-dominated regime from these two locations, i.e. from the bottom left to the top right. This means that in order for grain size to be interpreted as a function of subsidence only, increasing values of F must be accompanied by decreasing values of slopes or increasing β.
The presence of an autogenic-dominated regime in the bottom-right corner of the Fig. 8 map, corresponding to high bypass and low β (high slopes), has two implications. Firstly, the one-to-one relationship between grain size fining and F breaks down in systems that are characterized by high slopes. In other words, following a horizontal trajectory in our framework at constant, high slope values, we do not observe the decrease in grain size fining with increasing F due to the importance of autogenic processes. Secondly, high-bypass systems may experience substantial fining in proportion to their slope. This situation corresponds to a trajectory along a vertical path in our framework in the high-bypass regime, where progressive fining corresponds to increasing slopes or an increasing importance of autogenic processes, in systems that are all characterized by high bypass.
These findings have important implications for the interpretation of grain size fining. Firstly, there is a danger to interpret grain size fining trends only as a direct measure of present-day or past subsidence only, whereas some of the fining may be due to autogenic processes. To avoid this over-interpretation of data, one should compare the subsidence derived from the grain size fining trend to preserved sedimentary thickness, where possible. Another option suggested by our work is to consider the topography and, in particular, the surface slope. Secondly, we postulate that in a high-slope, high-bypass system, grain size fining is likely to be dominated by autogenic processes and should therefore not be used to constrain subsidence patterns.
4.2 Illustrating our framework with natural examples in modern systems
To illustrate the use of the framework, we have compared our modelled sedimentary systems to the natural systems (Fig. 8 c) according to their bypass characteristics and their surface slope and confinement, which we assume to be indicative of β.
Extension in the Basin and Range area (Norton, 2011) has led to a high subsidence and accommodation rate in the Death Valley graben (Hammond et al., 2012), resulting in an under-filled sedimentary basin with an active depositional surface that presently lies 86 m below sea-level (Burchfiel and Stewart, 1966) and where large lakes frequently form (Blackwelder, 1933; Grasso, 1996). This indicates low F conditions. The relatively large size of the catchment, especially along the western side of Death Valley, compared to the extent of the fans, as well as the relatively linear slopes of the fans, is indicative of a value near or just above 1, which positions the Death Valley fans in the subsidence-dominated regime (the square in Fig. 8b). This is consistent with the fining observed by D'Arcy et al. (2017) and interpreted as reflecting the spatial distribution of subsidence suggested by the underlying stratigraphy (D'Arcy et al., 2017).
Megafans exiting the Himalayas (e.g. the Kosi megafan) are of similar extent than the flexure wavelength of the underlying crust resulting in a large β values with low slopes. This is confirmed by their convex or linear surface topography (Chakraborty et al., 2010). The resulting low slopes and high β are likely to minimize autogenic deviation and positions them in the upper portions of the framework, where there is little fining unless there is subsidence. This is in agreement with the findings by Dingle et al. (2016) of fining trends limited to parts of the Kosi fan characterized by higher subsidence. However, Dingle et al. (2017) attribute some of the fining observed to abrasion, a process not yet included in our model setup.
The Iglesia basin is a piggy-back basin fed by crustal shortening and uplift in the Argentine Frontal Cordillera (Beer et al., 1990). The basin is in moderate to high bypass (Harries et al., 2019). The flexurally controlled subsidence is likely to be much greater than the fan extent leading to small values of β. This is confirmed by the fan concave up topography (Harries et al., 2019). This should position the system in the mixed to autogenic-controlled regime (the triangle in Fig. 8b). This is consistent with the internal reworking described by Harries et al. (2019).
High-bypass systems can also be found near mature orogenic settings such as the Alberta Basin of southern Canada, where subsidence and in-filling rate has greatly decreased since the onset of collision in the Jurassic and again in the Cretaceous (Mossop and Shetsen, 1994). The sedimentary fans that form adjacent to the Canadian Cordillera have much smaller extent than the flexural wavelength of the underlying old cratonic lithosphere (Koohzare et al., 2008), implying a small β value and high slope. These systems are likely to be in the autogenic-dominated fining (the star in Fig.8b) regime as suggested by the well-documented importance of autogenic processes within the post-glacial fans of southern Alberta Campbell (1998).
For completeness, we also positioned the Kenyan rift as a lake-dominated, under-filled system where deposition is dominated by lacustrine processes in the local minima-dominated regime (the circle in Fig. 8b), where the self-similar grain size fining model of Duller et al. (2010) does not apply.
4.3 Implications for the stratigraphic record
Past studies (D'Arcy et al., 2017; Whittaker et al., 2011) have used grain size fining trends extracted from the stratigraphic record as a tool to estimate past histories of subsidence in sedimentary basins. This can be effective in situations where topography is low (high β) or the basin is filling (low F), but we have also shown that this can lead to overestimating the subsidence rate in transient basins or systems where autogenic processes contribute significantly to grain size fining. Thus, there is a need to identify when autogenic induced grain size fining is most likely dominating the record.
The general relationship we have evidenced between depositional divergence, rugosity, and slope (Fig. 7b and c) is useful for this, as it could be used by field geologists to estimate the magnitude of the autogenic processes controlling the depositional divergence by measuring rugosity (or channel depth). In turn, because we have shown that, in most situations, grain size deviation is proportional to depositional divergence (Fig. 7a), a measure of rugosity can be used to estimate whether grain size fining is affected by autogenic processes and/or whether a grain size fining trend can be used to constrain basement subsidence.
A combined approach of estimating stratigraphic thickness (F), while also considering paleoslope, assessing reworking, or measuring maximum channel to interfluve depth (rugosity), would be most ideal to indicate the general relevance of autogenic induced fining within the system (because slope and rugosity correlate with grain size deviation as shown in Fig. 7b). This means that if a system has high paleochannel depths and slopes, combined with evidence for reworking, it is likely to be strongly influenced by autogenic processes, and grain size fining estimates may overestimate the subsidence rate. Conversely, paleo systems with thick stratigraphic packages characterized by low paleochannel depths and slopes with relatively uniform infilling would have grain size fining rates more closely controlled by basement subsidence.
Further consideration should be taken specific to grain size and its response and recovery to perturbations. Whipple and Meade (2006) have described how sediment flux returns back to the value set by the tectonic forcing after a climate perturbation and that tectonics therefore determine the underlying sedimentary record over long enough timescales and constant conditions. The same trend is predicted for grain size signals (Armitage et al., 2011), with subsidence rate controlling the long-term trend and climate-driven perturbation producing only relatively short-lived deviations from that trend. Our new findings show that, firstly, in high-bypass systems, long-term grain size fining can be set by the autogenic dynamics, especially in systems characterized by steep surface topography (low β) and in a transport-dominated state (high G). Secondly, we have also shown that, under high bypass, grain size fining becomes a function of β, which, in turn, is related to the size of the source catchment (or the sedimentary fan) relative to the subsidence pattern (or flexure wavelength), weighted by the relative precipitation rate in the source and basin areas. This implies that variations in precipitation between the basin and catchment (in space or time) could impact the long-term sediment recorded through grain size fining trends beyond a short-lived perturbation.
Our main findings can be summarized as follows:
-
Deviations from a subsidence-based interpretation of grain size fining trends are controlled by the intensity of autogenic processes.
-
The magnitude of those autogenic processes, measured by introducing the depositional divergence, , is proportional to surface slope and rugosity and is therefore the result of a physical process at play within the model and not the result of numerical instabilities.
-
Different model parameters, namely the shape parameter β, the bypass parameter F, the erodibility parameter K, and the depositional parameter G, impact basin grain size fining, and only select combinations promote either subsidence- or autogenic-dominated grain size fining.
-
We proposed an averaged framework (Fig. 8) to help interpret grain size fining data that maps grain size fining and deviations from a subsidence-based interpretation of grain size fining as a function of bypass (or F) and slope (or β).
-
The framework helps define the conditions for using grain size fining trends to infer subsidence patterns, as well as the conditions where autogenic processes dominate grain size fining, i.e. high bypass (high F) and steep slopes (low β).
-
We have demonstrated its usefulness by positioning various natural systems into the framework and shown how this can help determine whether, for each of them, subsidence or autogenic processes dominate grain size fining.
In the third paper (Wild et al., 2025c) of this series of three, we propose using the framework and what we have learned from the theoretical work presented in the first two to interpret stratigraphic transects in a synthetic foreland basin. For this, we will couple GravelScape to a simple model of the isostatic flexure of the crust/lithosphere. In doing so, we will produce a system where subsidence is in proportion to the weight of the evolving orogen and is therefore in constant transient evolution towards steady state. The next step will consist of studying, in a source-to-sink approach, the response of such a coupled system to imposed perturbations in climate or tectonic activity, as was done previously without considering the effect of autogenic processes on grain size fining (e.g. Armitage et al., 2011).
Another obvious extension of our theoretical work will be to use it to interpret grain size data from well-documented sites such as Death Valley, the Himalayan Foreland, or the Iglesia basin of Argentina. The work presented here suggests that a joint inversion of the grain size data and topography (slope and extent of the fan) could yield constraints on the value of model parameters (such as G or K) and subsequently allow us to better assess the contribution of autogenic processes to grain size fining before using such data to infer subsidence patterns.
Finally, additional developmental work could involve further exploring sand fining allowing, for example, for bimodal distributions; adding an abrasion component to fining; or incorporating a feedback between grain size and the transport/erodibility parameters of the LEM component of GravelScape.
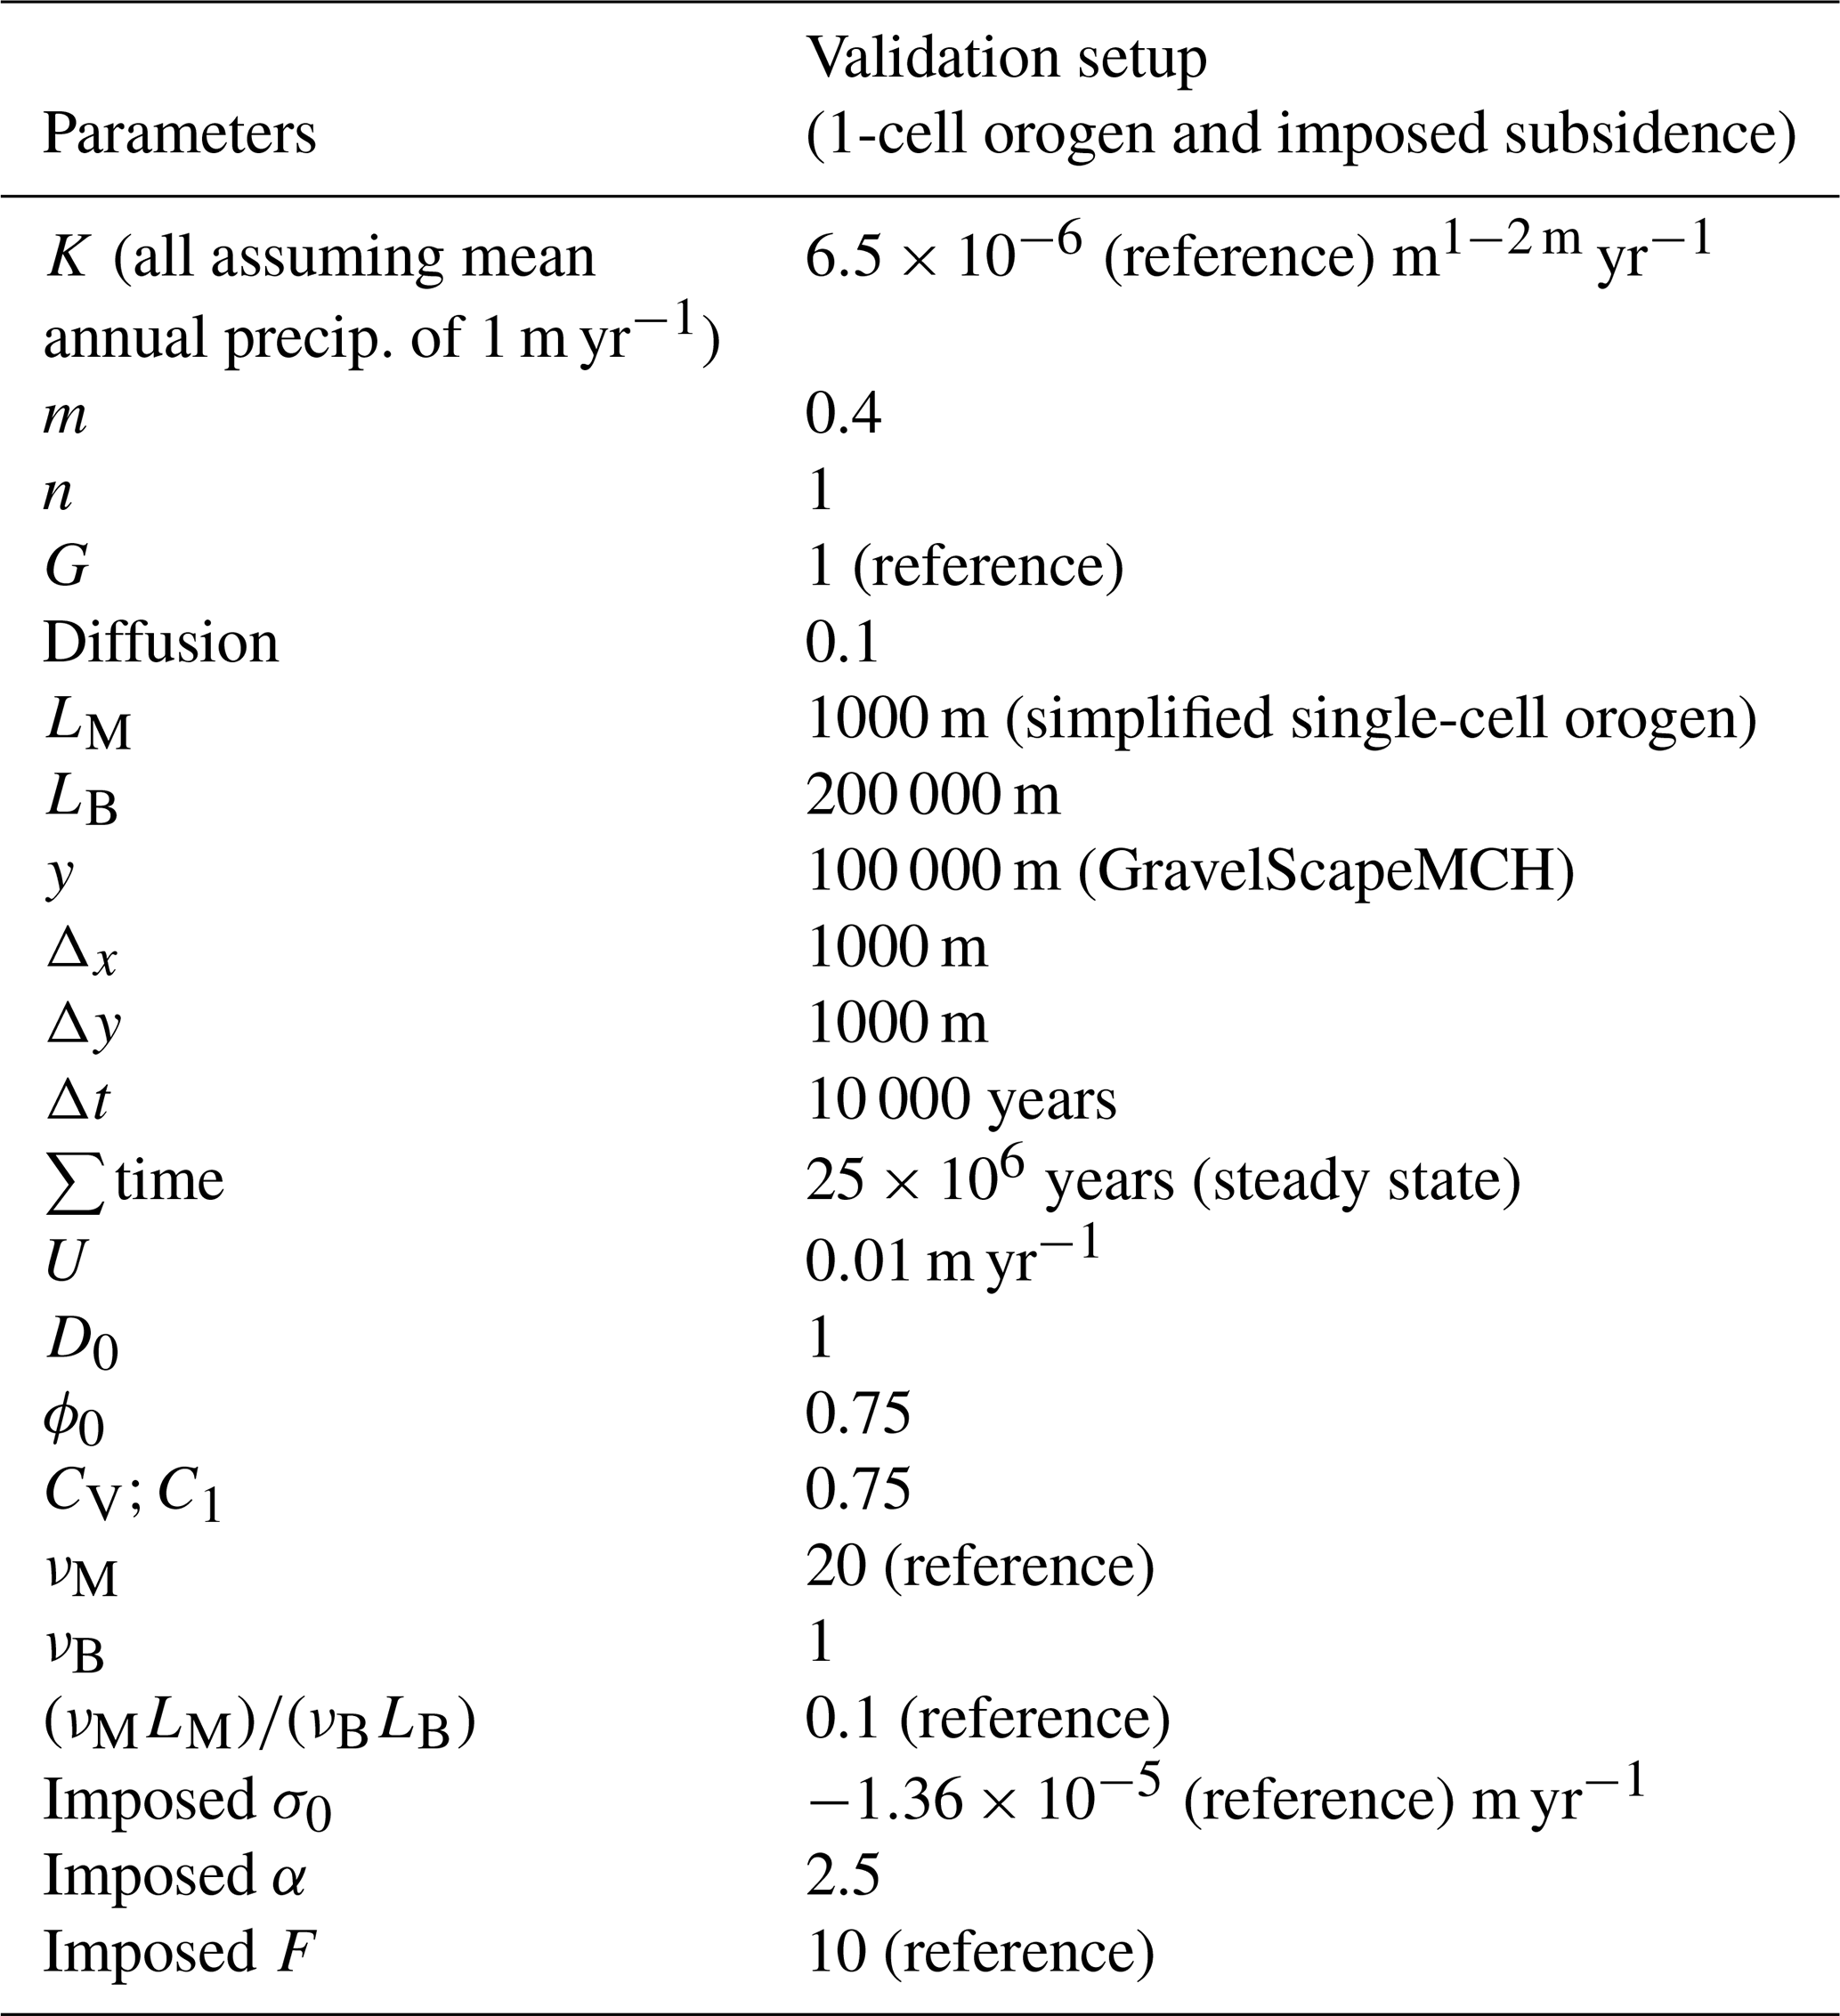
Table A1Reference GravelScape model parameters. Note that we often tested a range of values. Unless stated on the figures, the model had the following inputs used.
The framework maps in Fig. B1 are similar to those shown in Fig. 8 but with slope, S, replacing β along the vertical axis. In Fig. B1a and b, we used the slope averaged over the entire basin LB. In Fig. 8c and d, we used the slope averaged over, Lf, the theoretical size of the fan according to Braun (2022), i.e. the size of the upstream mountain catchment LM, weighted by the ratio of precipitation rates in the mountain and in the basin, i.e. . Grain size fining and grain size fining deviation are measured over the same distances, i.e. LB for panels a and b and Lf for panels c and d.
We considered slope a general alternative to β, since there was a similar pattern of grain size deviation in the framework and a general high correlation between slope and grain size deviation. Within the main text, we prioritized β configurations as one approach to inducing higher slopes and more autogenically dominated conditions, due to β's measurability at the landscape scale. However, our results also showed how transient conditions (lower K) and higher G can increase slope and autogenic dynamics. With limited subsidence, any initial topography present within the basin could perpetuate increased slope, rugosity, and autogenic fining conditions. However, under high subsidence conditions, impacts of initial topography in a basin would likely be rapidly buried, leading to flatter slopes, low across-basin topographic variability, and subsidence-dominated fining conditions. There are many more scenarios that could impact slope and subsequent autogenic fining conditions that warrant further study.
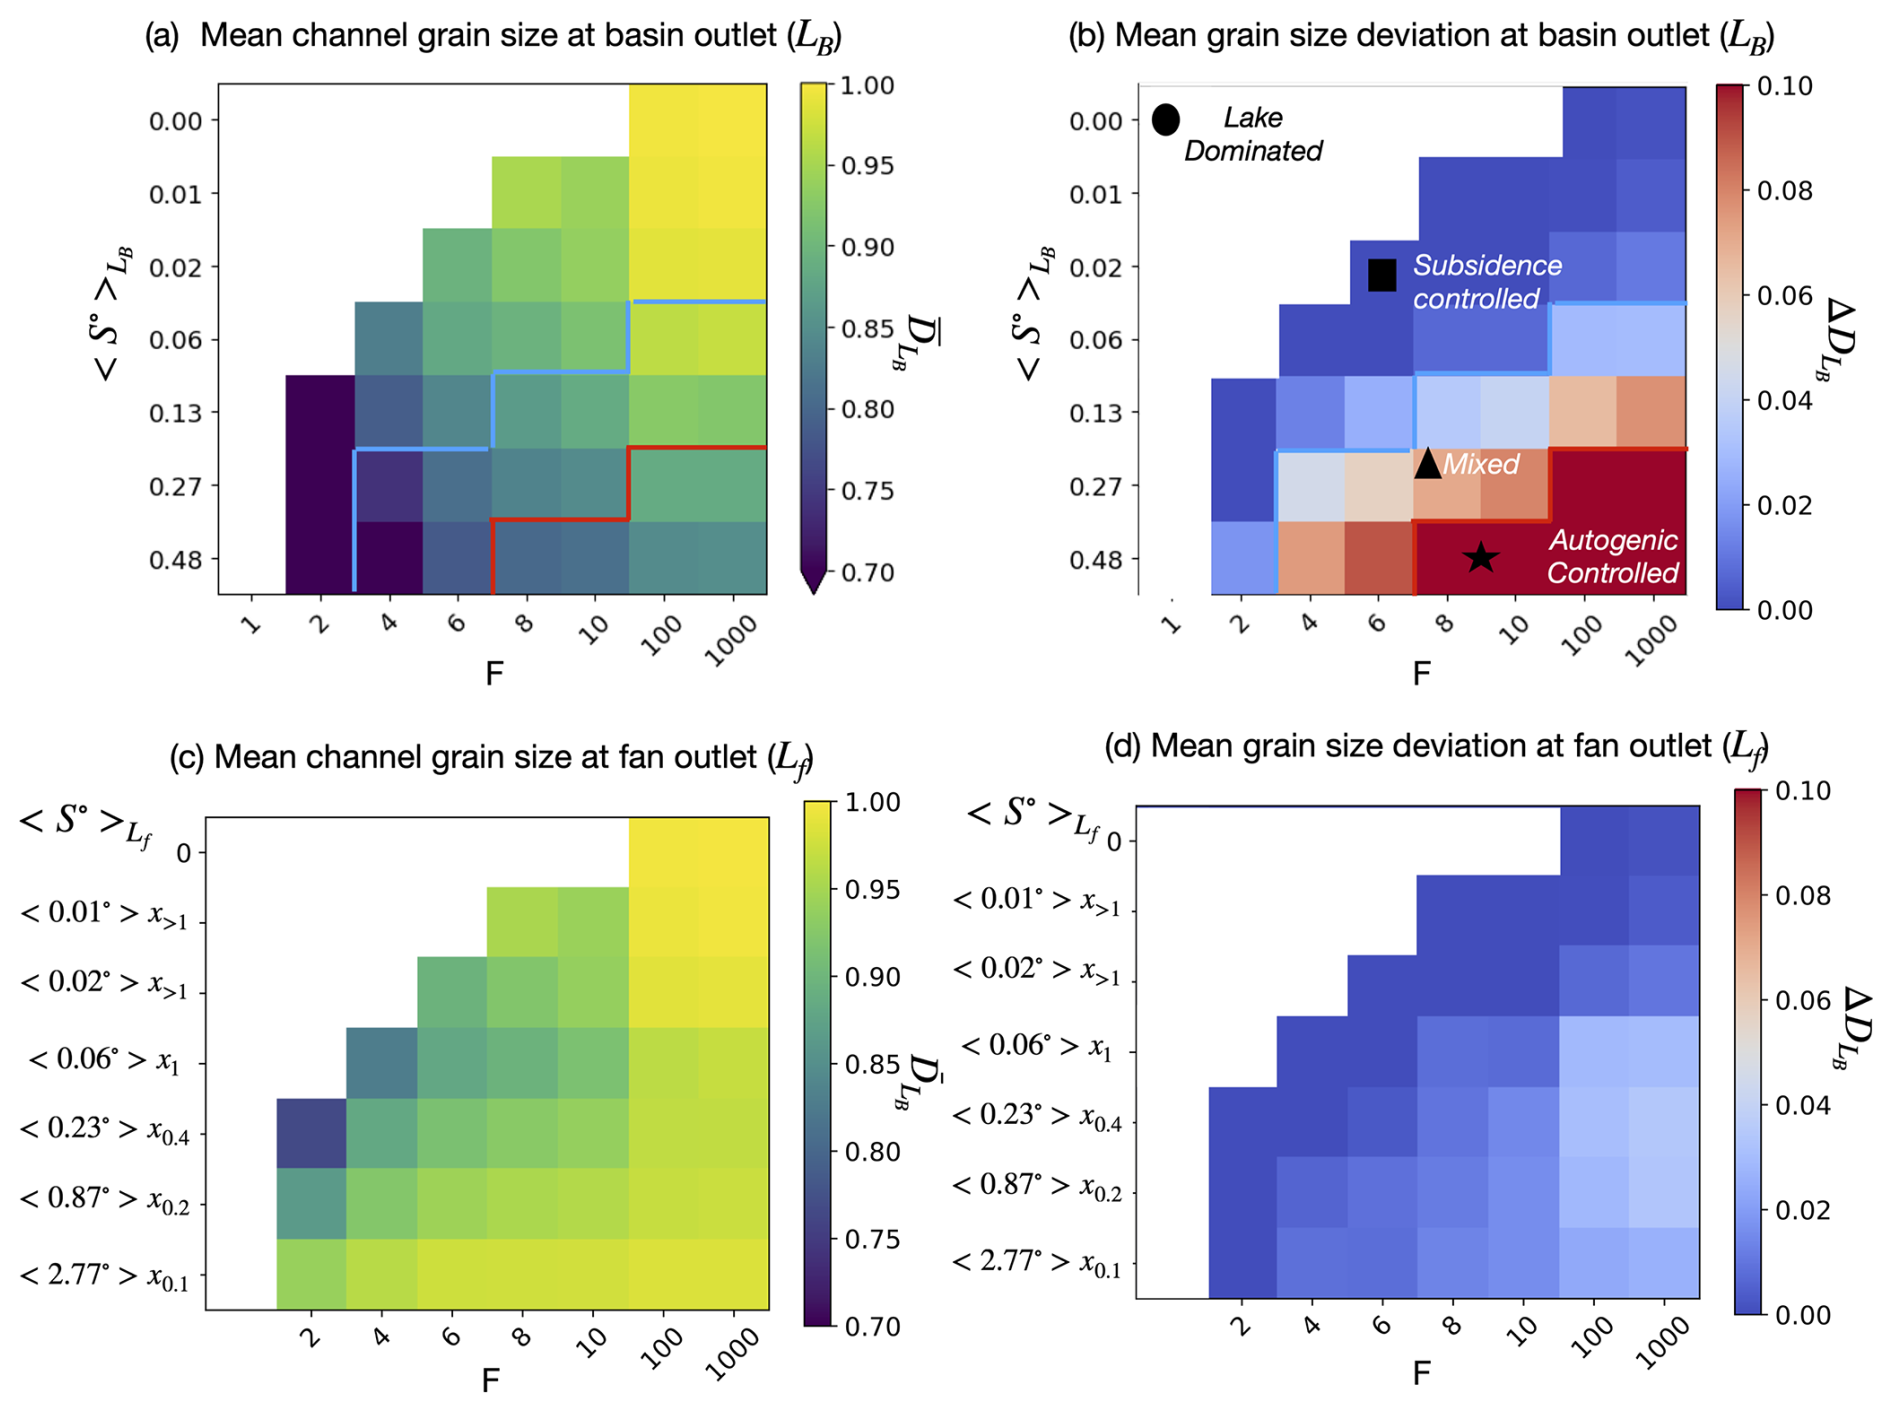
Figure B1Proposed framework to interpret grain size fining trends. Maps of (a) total grain size fining and (b) grain size deviation as a function of F and S. Panels (c) and (d) are the same as panels (a) and (b) but averaging slope and computing total fining and deviation at the end of the fan, i.e. at x=Lf.
The GravelScape source code and example Python applications are available at https://doi.org/10.5281/zenodo.15641112 (Wild et al., 2025a). GravelScape code also depends on LEM repositories: Bovy and Lange (2023) Fastscape v0.10, available at https://doi.org/10.5281/zenodo.8375653, and Bovy et al. (2023) Fastscape-fortran v2.8, available at https://doi.org/10.5281/zenodo.8392416.
Numerical modelling results and example notebooks are available at https://doi.org/10.5281/zenodo.15641112 (Wild et al., 2025a). No further data sets were used in this article.
A video demonstration of the GravelScape grain size fining model with an uplifting orogen and a subsiding (imposed) basin is available at https://doi.org/10.5446/70575 (Wild, 2025).
The supplement related to this article is available online at https://doi.org/10.5194/esurf-13-889-2025-supplement.
AW: conceptualization, formal analysis, investigation, methodology, software, validation, visualization, writing (original draft preparation), writing (review and editing). JB: supervision, resources, software, conceptualization, methodology, visualization, writing (original draft preparation), and writing (review and editing). AW: supervision, conceptualization, methodology, and writing (review and editing). SC: supervision, conceptualization, and writing (review and editing). MP: conceptualization and writing (review and editing).
The contact author has declared that none of the authors has any competing interests.
Publisher’s note: Copernicus Publications remains neutral with regard to jurisdictional claims made in the text, published maps, institutional affiliations, or any other geographical representation in this paper. While Copernicus Publications makes every effort to include appropriate place names, the final responsibility lies with the authors.
The authors thank Benoit Bovy for general help with xarray-simlab and FastScape curation. We would also like to thank Charlotte Fillon for her comments during committee meetings and the earlier phases of this research. We would also like to thank scientists within the Earth Surface Process Modelling Section at the GFZ Potsdam and members of the S2S-Future Marie Curie ITN for their general feedback and discussions.
This research has been supported by EU Horizon 2020 (grant no. 860383).
The article processing charges for this open-access publication were covered by the GFZ Helmholtz Centre for Geosciences.
This paper was edited by Kieran Dunne and reviewed by Eric Barefoot and three anonymous referees.
Armitage, J. J., Duller, R. A., Whittaker, A. C., and Allen, P. A.: Transformation of tectonic and climatic signals from source to sedimentary archive, Nat. Geosci., 4, 231–235, https://doi.org/10.1038/ngeo1087, 2011. a, b, c, d
Beer, J. A., Allmendinger, R. W., Figueroa, D. E., and Jordan, T. E.: Seismic stratigraphy of a Neogene piggyback basin, Argentina, AAPG Bull., 74, 1183–1202, 1990. a
Blackwelder, E.: Lake Manly: an extinct lake of Death Valley, Geogr. Rev., 23, 464–471, 1933. a
Blair, T. C. and McPherson, J. G.: Alluvial fans and their natural distinction from rivers based on morphology, hydraulic processes, sedimentary processes, and facies assemblages, J. Sediment. Res., 64, 450–489, 1994. a
Bovy, B., Braun, J., Glerum, A., and Wolf, S.: fastscape-lem/fastscapelib-fortran: Release v2.8 (v2.8.4), Zenodo [code], https://doi.org/10.5281/zenodo.8392416, 2023. a
Bovy, B. and Lange, R.: fastscape-lem/fastscape: Release v0.1.0 (0.1.0), Zenodo [code], https://doi.org/10.5281/zenodo.8375653, 2023. a
Braun, J.: Comparing the transport-limited and ξ–q models for sediment transport, Earth Surf. Dynam., 10, 301–327, https://doi.org/10.5194/esurf-10-301-2022, 2022. a, b, c, d, e, f, g
Bull, W. B.: Relations of alluvial fan size and slope to drainage basin size and lithology in western Fresno County, California, US Geological Survey Professional Paper, 450, 51–53, 1962. a
Burchfiel, B. C. and Stewart, J.: “Pull-apart” origin of the central segment of Death Valley, California, Geol. Soc. Am. Bull., 77, 439–442, 1966. a
Campbell, C.: Postglacial evolution of a fine-grained alluvial fan in the northern Great Plains, Canada, Palaeogeogr. Palaeoclimatol. Palaeoecol., 139, 233–249, 1998. a
Carretier, S., Guerit, L., Harries, R., Regard, V., Maffre, P., and Bonnet, S.: The distribution of sediment residence times at the foot of mountains and its implications for proxies recorded in sedimentary basins, Earth Planet. Sci. Lett., 546, https://doi.org/10.1016/j.epsl.2020.116448, 2020. a
Castelltort, S., Fillon, C., Lasseur, É., Ortiz, A., Robin, C., Guillocheau, F., Tremblin, M., Bessin, P., Guerit, L., Dekoninck, A., et al.: The Source-to-Sink Vade-mecum: History, Concepts and Tools|Vade-mecum de l'approche Source-To-Sink: Histoire, Concepts et Outils, SEPM (Society for Sedimentary Geology), https://doi.org/10.2110/sepmcsp.16, 2023. a
Chakraborty, T., Kar, R., Ghosh, P., and Basu, S.: Kosi megafan: Historical records, geomorphology and the recent avulsion of the Kosi River, Quaternary Int., 227, 143–160, 2010. a
Clarke, L., Quine, T. A., and Nicholas, A.: An experimental investigation of autogenic behaviour during alluvial fan evolution, Geomorphology, 115, 278–285, 2010. a
Cordonnier, G., Bovy, B., and Braun, J.: A versatile, linear complexity algorithm for flow routing in topographies with depressions, Earth Surf. Dynam., 7, 549–562, https://doi.org/10.5194/esurf-7-549-2019, 2019. a
D'Arcy, M., Whittaker, A. C., and Roda-Boluda, D. C.: Measuring alluvial fan sensitivity to past climate changes using a self-similarity approach to grain-size fining, Death Valley, California, Sedimentology, 64, 388–424, 2017. a, b, c, d
Davy, P. and Lague, D.: Fluvial erosion/transport equation of landscape evolution models revisited, J. Geophys. Res.-Earth Surf., 114, F03007, https://doi.org/10.1029/2008JF001146, 2009. a
Dingle, E. H., Sinclair, H. D., Attal, M., Milodowski, D. T., and Singh, V.: Subsidence control on river morphology and grain size in the Ganga Plain, Am. J. Sci., 316, 778–812, https://doi.org/10.2475/08.2016.03, 2016. a
Dingle, E. H., Attal, M., and Sinclair, H. D.: Abrasion-set limits on Himalayan gravel flux, Nature, 544, 471–474, 2017. a
Duller, R., Whittaker, A., Fedele, J., Whitchurch, A., Springett, J., Smithells, R., Fordyce, S., and Allen, P.: From grain size to tectonics, J. Geophys. Res.-Earth Surf., 115, F03022, https://doi.org/10.1029/2009jf001495, 2010. a, b, c, d, e, f, g, h, i, j, k, l, m, n, o, p, q, r, s, t, u, v
Fedele, J. J. and Paola, C.: Similarity solutions for fluvial sediment fining by selective deposition, J. Geophys. Res.-Earth Surf., 112, F02038, https://doi.org/10.1029/2005jf000409, 2007. a, b, c, d, e, f, g, h, i, j, k
Ganti, V., Straub, K. M., Foufoula‐Georgiou, E., and Paola, C.: Space‐time dynamics of depositional systems: Experimental evidence and theoretical modeling of heavy‐tailed statistics, J. Geophys. Res.-Earth Surf., 116, F02011, https://doi.org/10.1029/2010jf001893, 2011. a
Grasso, D. N.: Hydrology of modern and late Holocene lakes, Death Valley, California, vol. 95, US Department of the Interior, US Geological Survey, Water-Resources Investigations Report 95-4237, 1996. a
Guerit, L., Yuan, X.-P., Carretier, S., Bonnet, S., Rohais, S., Braun, J., and Rouby, D.: Fluvial landscape evolution controlled by the sediment deposition coefficient: Estimation from experimental and natural landscapes, Geology, 47, 853–856, https://doi.org/10.1130/g46356.1, 2019. a, b
Hajek, E. A. and Straub, K. M.: Autogenic sedimentation in clastic stratigraphy, Annu. Rev. Earth Planet. Sci., 45, 681–709, https://doi.org/10.1146/annurev-earth-, 2017. a, b, c, d, e
Hammond, W. C., Blewitt, G., Li, Z., Plag, H.-P., and Kreemer, C.: Contemporary uplift of the Sierra Nevada, western United States, from GPS and InSAR measurements, Geology, 40, 667–670, 2012. a
Harries, R. M., Kirstein, L. A., Whittaker, A. C., Attal, M., and Main, I.: Impact of recycling and lateral sediment input on grain size fining trends – Implications for reconstructing tectonic and climate forcings in ancient sedimentary systems, Basin Res., 31, 866–891, https://doi.org/10.1111/bre.12349, 2019. a, b, c
Hill, J., Wood, R., Curtis, A., and Tetzlaff, D. M.: Preservation of forcing signals in shallow water carbonate sediments, Sediment. Geol., 275, 79–92, 2012. a
Jerolmack, D. J. and Paola, C.: Shredding of environmental signals by sediment transport, Geophys. Res. Lett., 37, https://doi.org/10.1029/2010GL044638, 2010. a
Jobe, Z. R., Howes, N. C., and Auchter, N. C.: Comparing submarine and fluvial channel kinematics: Implications for stratigraphic architecture, Geology, 44, 931–934, 2016. a
Koohzare, A., Vaníček, P., and Santos, M.: Pattern of recent vertical crustal movements in Canada, J. Geodynam., 45, 133–145, 2008. a
Mossop, G. and Shetsen, I. C.: Geological atlas of the Western Canada sedimentary basin, Canadian Society of Petroleum Geologists and Alberta Research Council, https://ags.aer.ca/reports/atlas-western-canada-sedimentary-basin (last access: 26 May 2025), 1994. a
Norton, I.: Two-stage formation of Death Valley, Geosphere, 7, 171–182, 2011. a
Romans, B. W., Castelltort, S., Covault, J. A., Fildani, A., and Walsh, J. P.: Environmental signal propagation in sedimentary systems across timescales, Earth-Sci. Rev., 153, 7–29, https://doi.org/10.1016/j.earscirev.2015.07.012, 2016. a
Scheingross, J. S., Limaye, A. B., McCoy, S. W., and Whittaker, A. C.: The shaping of erosional landscapes by internal dynamics, Nat. Rev. Earth Environ., 1, 661–676, https://doi.org/10.1038/s43017-020-0096-0, 2020. a, b, c
Smith, N. D., Cross, T. A., Dufficy, J. P., and Clough, S. R.: Anatomy of an avulsion, Sedimentology, 36, 1–23, 1989. a
Sømme, T. O., Helland-Hansen, W., Martinsen, O. J., and Thurmond, J. B.: Relationships between morphological and sedimentological parameters in source-to-sink systems: a basis for predicting semi-quantitative characteristics in subsurface systems, Basin Res., 21, 361–387, https://doi.org/10.1111/j.1365-2117.2009.00397.x, 2009. a
Straub, K. M. and Esposito, C. R.: Influence of water and sediment supply on the stratigraphic record of alluvial fans and deltas: Process controls on stratigraphic completeness, J. Geophys. Res.-Earth Surf., 118, 625–637, 2013. a
Straub, K. M., Paola, C., Mohrig, D., Wolinsky, M. A., and George, T.: Compensational stacking of channelized sedimentary deposits, J. Sediment. Res., 79, 673–688, 2009. a
Toby, S. C., Duller, R. A., De Angelis, S., and Straub, K. M.: Morphodynamic limits to environmental signal propagation across landscapes and into strata, Nat. Commun., 13, 292, https://doi.org/10.1038/s41467-021-27776-6, 2022. a, b
Whipple, K. X. and Meade, B. J.: Orogen response to changes in climatic and tectonic forcing, Earth Planet. Sci. Lett., 243, 218–228, 2006. a
Whittaker, A. C., Duller, R. A., Springett, J., Smithells, R. A., Whitchurch, A. L., and Allen, P. A.: Decoding downstream trends in stratigraphic grain size as a function of tectonic subsidence and sediment supply, Geol. Soc. Am. Bull., 123, 1363–1382, https://doi.org/10.1130/b30351.1, 2011. a, b, c
Wild, A.: Grain size dynamics using a new planform model, TIB AV [video], https://doi.org/10.5446/70575, 2025. a
Wild, A., Braun, J., and Bovy, B.: fastscape-50 lem/GravelScape: GravelScape, Zenodo [code, data], https://doi.org/10.5281/zenodo.15641112, 2025a. a, b
Wild, A. L., Braun, J., Whittaker, A. C., and Castelltort, S.: Grain size dynamics using a new planform model – Part 1: GravelScape description and validation, Earth Surf. Dynam., 13, 875–887, https://doi.org/10.5194/esurf-13-875-2025, 2025b. a, b, c, d, e, f, g, h, i
Wild, A. L., Braun, J., Whittaker, A. C., and Castelltort, S.: Grain size dynamics using a new planform model – Part 3: Stratigraphy and flexural foreland evolution, Earth Surf. Dynam., 13, 907–922, https://doi.org/10.5194/esurf-13-907-2025, 2025c. a, b
Yuan, X. P., Braun, J., Guerit, L., Rouby, D., and Cordonnier, G.: A New Efficient Method to Solve the Stream Power Law Model Taking Into Account Sediment Deposition, J. Geophys. Res.-Earth Surf., 124, 1346–1365, https://doi.org/10.1029/2018jf004867, 2019. a, b
Reworked layer equal to the depth between fluvial channels and interfluves, which can also be referred to as the variability in topography across the basin or the rugosity.
- Abstract
- Introduction
- Methods
- Model results
- Model synthesis and discussion
- Conclusions
- Appendix A: Input parameters
- Appendix B: Alternate framework of slope vs F
- Code availability
- Data availability
- Video supplement
- Author contributions
- Competing interests
- Disclaimer
- Acknowledgements
- Financial support
- Review statement
- References
- Supplement
- Article
(6509 KB) - Full-text XML
- Abstract
- Introduction
- Methods
- Model results
- Model synthesis and discussion
- Conclusions
- Appendix A: Input parameters
- Appendix B: Alternate framework of slope vs F
- Code availability
- Data availability
- Video supplement
- Author contributions
- Competing interests
- Disclaimer
- Acknowledgements
- Financial support
- Review statement
- References
- Supplement