the Creative Commons Attribution 4.0 License.
the Creative Commons Attribution 4.0 License.
 | 15 Sep 2025
Grain size dynamics using a new planform model – Part 3: Stratigraphy and flexural foreland evolution
Jean Braun
Alexander C. Whittaker
Sebastien Castelltort
Within the stratigraphic record, grain size fining has been commonly used to infer subsidence, rate and its variability has been interpreted as a signature of external forcing events. We have recently developed a model (Wild et al., 2025b) that predicts grain size fining within a two-dimensional Landscape Evolution Model to predict the effect of autogenic processes on grain size fining. Here, we couple it to a flexural model to predict the stratigraphic evolution of a foreland basin, the distribution of grain size fining, and which of subsidence or autogenic processes dominates in controlling the fining. We show that, throughout its evolution, the foreland basin experiences a gradual increase in the bypass ratio, F, that provokes a gradual shift from subsidence-dominated to autogenically dominated grain size fining but also progressively alters stratigraphic preservation. The amplitude, and therefore efficiency, of autogenic processes in controlling grain size fining processes is modulated by the shape of the surface topography that we control by changing the rainfall gradient and extent of the basin confinement compared to the orogen. We also show how the evolution of the basin can be mapped in the framework we recently developed (Wild et al., 2025c) to interpret grain size fining data. Finally, we demonstrate how the model results and our findings can be used to interpret the stratigraphy and grain size information stored in a real foreland basin, namely the Alberta Basin of Western Canada.


Foreland basins are large-scale geological features, i.e. tens to hundreds of kilometres in size, that develop by flexure of the lithosphere in the vicinity of a mountain belt (Beaumont, 1981). Their evolution and stratigraphy are therefore closely linked to the uplift and erosional history of the mountain. The depth of the basin is set by the height of the mountain, while its width mostly depends on the effective elastic thickness (EET) of the lithosphere (Turcotte and Schubert, 2014). The magnitude of the incoming sedimentary flux from the mountain is a function of the uplift rate and erosional efficiency of surface processes (Beaumont, 1981), which may be modulated by climate and rock strength during landscape evolution (Allen and Densmore, 2000; Armitage et al., 2011; Leonard et al., 2023) . As collision progresses and the mountain grows, the incoming flux and subsidence within the basin therefore change with time (Covey, 1986; DeCelles and Giles, 1996; Catuneanu, 2004), and the basin tends to evolve from under-filled to bypass conditions (Allen and Homewood, 2009; Allen et al., 2013). Initial topography can impact the timing of basin infilling and, when initial conditions raise elevation, promote more continental opposed to marine dominated infilling conditions (Gérard et al., 2023). When sediment flux from the orogen exceeds the rate of accommodation space by subsidence, the basin widens by flexure under the weight of its own sedimentary fill (Flemings and Jordan, 1989; Beaumont, 1981; Catuneanu, 2019). This behaviour is mostly applicable to the retro-foreland basin, i.e. which forms on the stable side of the mountain, while the pro-foreland basin is constantly fed back into the orogen or, in part, into the subduction channel (Naylor and Sinclair, 2008).
This complex evolution of foreland basins is recorded in the depositional facies and thickness of stratigraphy but also by the distribution of grain size within the stratigraphic record (DeCelles and Giles, 1996; Duller et al., 2010; Armitage et al., 2011). Grain size data are often used to describe depositional environment and the bypass state of the basin. For example, Cant and Stockmal (1989), Mossop and Shetsen (1994), and Poulton et al. (1990) interpreted the evolution of the Western Canada foreland basin based, in part, on the distribution of grain size. They noted an early transition from flysch (typically finer-grained and related to deeper marine turbites) to molasse (typically coarser-grain continental-derived sediments) and, later during the more mature stages of the basin evolution, the outwards migration of the locus of deposition of the coarsest sediments as the basin progressively fills and transitions into bypass. Allen and Homewood (2009) also note that many foreland basins show a similar evolution trend towards high bypass, and the bypass state of the basin has subsequent implications for grain size fining (Duller et al., 2010).
Numerical models have been extensively used in the past to study the evolution of foreland basins and reproduce their stratigraphy (Beaumont, 1981; Flemings and Jordan, 1989; Sinclair et al., 1991; Johnson and Beaumont, 1995; García-Castellanos et al., 1997; Tucker and van Der Beek, 2013). Models have also been extensively used to study how foreland basins react to climatic and tectonic events (Allen and Densmore, 2000) and how these external signals are stored in the basin stratigraphy (Allen et al., 2013). Special emphasis has been put on studying and reproducing the distribution of grain size in the stratigraphic record (Armitage et al., 2011, 2013), mostly using the self-similar grain size fining model of Fedele and Paola (2007), which assumes that fining is proportional to deposition rate, scaled by sediment flux.
However, many models often used a very simple representation of how sediment is deposited in the basin, based on simple geometrical or mass conservation arguments (Flemings and Jordan, 1989; Armitage et al., 2011) or a simple diffusion equation (Sinclair et al., 1991). Also, many used a 1D approach (Johnson and Beaumont, 1995; Beaumont, 1981; Flemings and Jordan, 1989; Sinclair et al., 1991; García-Castellanos et al., 1997; Naylor and Sinclair, 2008) that prevents the simulation of planform river dynamics that controls, in part, the amplitude of autogenic processes.
Yet, internal processes can also dominate the stratigraphic record (Scheingross et al., 2020; Hajek and Straub, 2017; Harries et al., 2019). For example, using a coupled model for river incision in the mountain and sediment transport (diffusion) in the basin, Humphrey and Heller (1995) showed that periodic oscillations in sediment flux from the mountain may arise that are recorded in the foreland basin stratigraphy independently of any external (tectonic or climatic) periodic forcing.
In a series of companion papers (Wild et al., 2025b, c), we have developed a new model, GravelScape (the video in the Supplement shows an example model run) that combines a planform Landscape Evolution Model with the grain size fining model of Fedele and Paola (2007) and used it to show that local deposition, driven by topographic variations, can alter grain size distribution, causing greater background fining down-basin driven by autogenic dynamics under select conditions (high bypass with steep topography). As shown in Wild et al. (2025b, c), autogenic processes also affect the rate of grain size fining, which can only be properly assessed by two-dimensional, planform models where the first-order physics of channel dynamics is properly represented.
Here, we propose using this model to simulate the evolution of grain size fining and how it is recorded in the stratigraphy within a multi-dimensional (x, y, and z) orogenic system, taking into account the potential effect of autogenic processes on the basin stratigraphy and the distribution of grain size. For this we will couple GravelScape to a flexural model that will provide a tight coupling between uplift and erosion in the mountain and subsidence and sediment deposition in the foreland basin.
The results of this paper will be presented in three parts. In the first part, we will show how GravelScape can be used to predict the stratigraphy and grain size distribution within a sedimentary basin using an imposed sedimentary flux and subsidence function. In doing so, we will highlight the relative contributions of tectonics and autogenic processes within stratigraphic profiles under imposed states of bypass and with different basin configurations that affect its surface topography. These results will then be used, in the second part, to interpret the predictions of a more complex, fully coupled model run, i.e. which includes both the mountain and basin areas such that sediment flux and subsidence are no longer imposed but rather result from uplift and erosion in the mountain and flexure in the basin in proportion to the height of the mountain. In the third part, we will reinterpret the stratigraphic record of the Alberta foreland basin in Western Canada using the results of the previous two sections to demonstrate the importance of autogenic processes in controlling stratigraphy and grain size distribution in a natural system.
In Wild et al. (2025b), we developed a new model, GravelScape, that combines the Landscape Evolution Model, or LEM (FastScape Bovy et al., 2023), to the self-similar model of Fedele and Paola (2007) for grain size fining that assumes that fining is a function of deposition rate normalized by sediment flux. The LEM predicts erosion in the mountain or source area and deposition and erosion in the basin or sink area according to a modified version of the Stream Power Law (SPL) that considers erosion and sediment transport and deposition (Davy and Lague, 2009; Yuan et al., 2019):
where h is the surface topography, U the rock uplift rate, A the drainage area, and the dimensionless spatial or temporal variations in precipitation rate from a reference value contained in the coefficients K and G. K is the erodibility coefficient, m and n are the area and slope exponents, and G is the dimensionless transport coefficient. t is the time variable and s the spatial variable in the direction of steepest slope, such that is the slope in the direction of water flow. Even though our model can predict three-dimensional stratigraphy, the basic equations it solves are two-dimensional; i.e. they depend on only on x and y at each time step. It is therefore more appropriate to call our model two-dimensional that stacks planform solutions in the third dimension to produce a stratigraphy (z).
In this work, we use two different modelling approaches. First, we impose subsidence and precipitation gradients similar to Wild et al. (2025c) to generate stratigraphy at steady state, and later we compute foreland basin evolution with flexure. In all setups, we use a value of G=1, which corresponds to a moderately transport-limited system with m=0.4 and n=1. In this case, controls the response time of the system. We selected high-magnitude values of K in the range , so that steady state is reached within 20–25 Myr. We also assume a value of U=10 mm yr−1 and a uniform precipitation rate such that . See Table 1 for a complete list of all other parameters.
Table 1Model inputs and parameter values with definitions in the text or directly in the table.
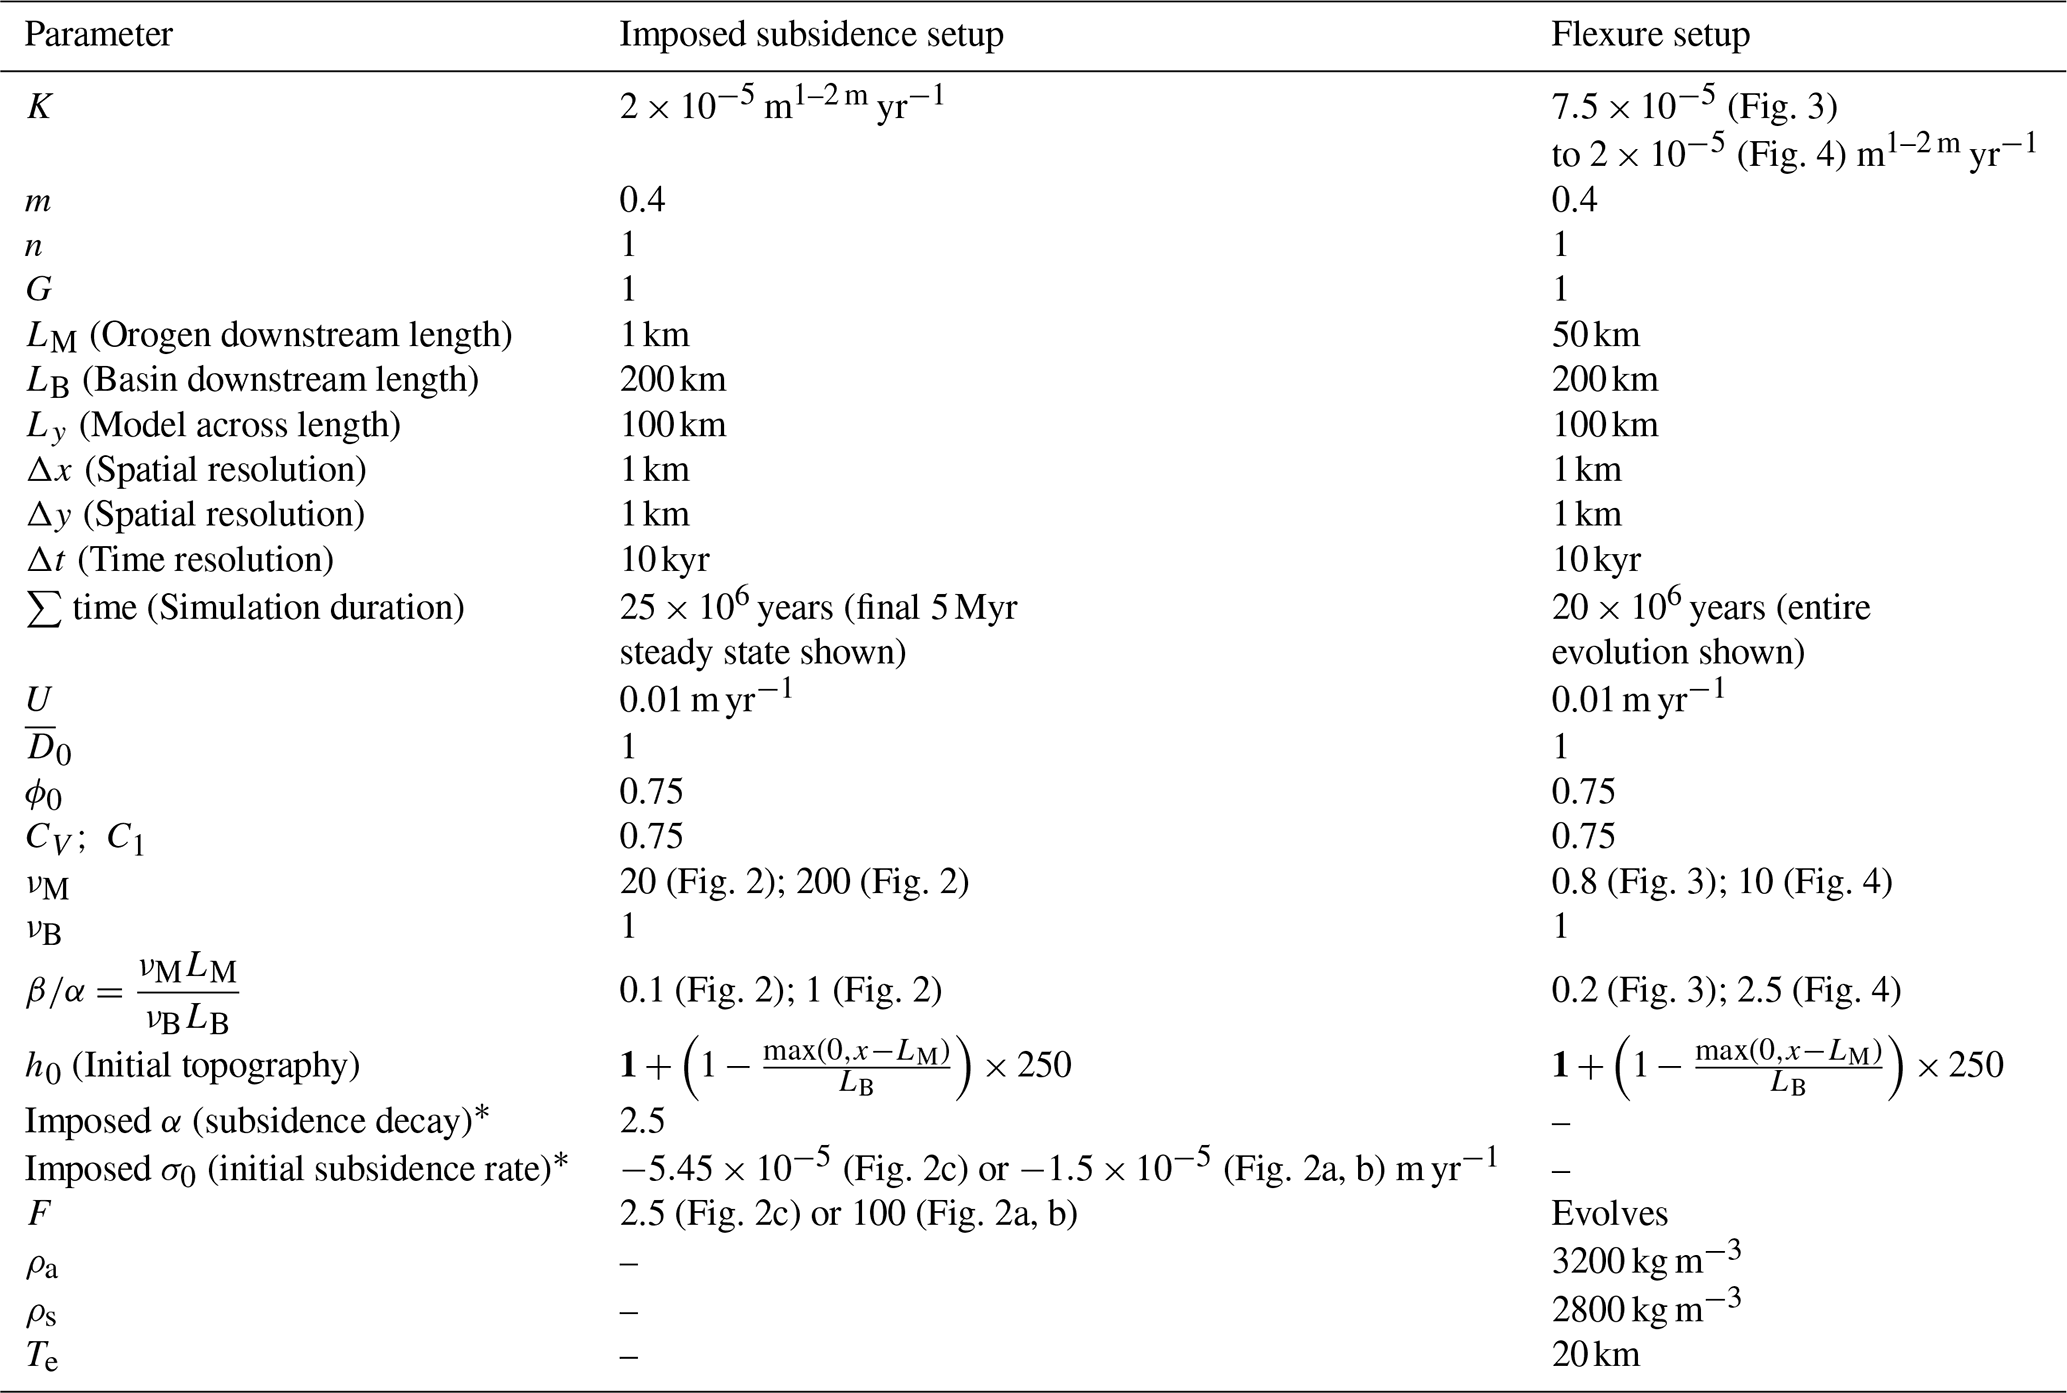
* See Wild et al. (2025b) or Wild et al. (2025c) for the full equation for imposed subsidence rate as an exponential function of downstream distance.
In GravelScape, we compute the flow of water assuming that water can be passed from one node to any of its downhill neighbours on a rectangular grid in proportion to local slope. This allows the formation of multiple channels and the convergence or divergence of flow paths, in response to changes in topography related to erosion or deposition. We have shown in Wild et al. (2025c) that this will lead to channel avulsions, the rate of which is controlled by internal and external parameters of the model and, in particular, K, the erodibility coefficient. We have also shown that these avulsions lead to local variability in deposition and erosion rate that have an amplitude proportional to surface slope and surface rugosity (a proxy for channel depth).
We coupled GravelScape to a flexure model that computes the surface deflection, w, caused by isostatic flexure under the weight of topographic variations, Δh, resulting from uplift, erosion, and sedimentation. This is governed by the following biharmonic equation (Turcotte and Schubert, 2014):
where D is the flexural rigidity, a function of the effective elastic plate thickness Te; ρa and ρs are the densities of the asthenosphere and surface rocks, respectively; and g is the acceleration due to gravity. The resulting deflection, w, is added to the uplift term in Eq. (1). In all model simulations, we use constant values of Te=20 km, ρa=3200 kg m−3, and ρs=2800 kg m−3. We imposed a slight initial topography (h0) in the model to promote continental conditions in the foreland basin, where we can compute grain size (see Gérard et al., 2023, for a description of how initial topography impacts foreland basin evolution).
As explained in Wild et al. (2025b), GravelScape also includes a two-dimensional version of the self-similar grain size fining model proposed by Fedele and Paola (2007). In this model, grain size D is a function of a dimensionless variable y*, expressed as
This expression is obtained by integrating the deposition rate normalized by sediment flux along flow paths. Here, is the mean grain size in the source area, and ϕ0 is its standard deviation. According to the self-similar model, both the mean and standard deviation in grain size decrease proportionally along the flow path. For a detailed explanation of the grain size model, see Fedele and Paola (2007); for its implementation in the two-dimensional Landscape Evolution Model, see Wild et al. (2025b).
Past applications of the self-similar grain size model have assumed that deposition is equal to basement subsidence rate (e.g. Duller et al., 2010; Whittaker et al., 2011). However, Wild et al. (2025b) and Wild et al. (2025c) have shown that this need not be the case when deposition rate is calculated as an independent output of the LEM. In this case, Wild et al. (2025c) have shown that autogenic processes can lead to substantial grain size fining in high-bypass systems where little to no subsidence takes place. They have also shown that the amplitude of this autogenic grain size fining is in proportion to surface slope and rugosity.
In the remaining part of this paper, we will use a set of variables and quantities to describe the sedimentary system that were introduced in Duller et al. (2010), Wild et al. (2025b), and Wild et al. (2025c). They include the following:
-
F, the bypass parameter, defined as the ratio of orogen sediment flux entering the basin relative to the total integrated vertical subsidence rate within the basin (Duller et al., 2010);
-
β, the ratio of the size of the sedimentary fan that forms at the foot of the mountain to the wavelength of the basin subsidence function (or flexural wavelength in the case of a foreland basin); the size of the fan is, in turn, controlled by the width of the mountain (LM) catchments feeding the fan, weighted by the relative precipitation rate between the basin (νB) and the mountain (νM) areas (see Wild et al., 2025c, for an exact definition of β); Braun (2022) and Wild et al. (2025c) have shown that β controls the shape of the surface topography of the basin, with low β values producing concave topographies made of a steep and short fan connecting smoothly to an alluvial plain and large β values leading to linear or convex topographies with more extensive fans. Within figures and specific β, values within the text have been normalized by/excluding α such that they can be directly compared, despite different flexural conditions and α, within the framework figures of Wild et al. (2025c) and Fig. 1. All changes in β discussed in the text have been induced by changing orogen precipitation (vm) relative to the basin (vb).
-
η, the surface rugosity defined as the standard deviation of the topography in the y direction (Wild et al., 2025c); it can be regarded as a proxy for channel depth;
-
, the depositional deviation, defined as the mean of the positive departure in sedimentation rate from the basement subsidence rate (Wild et al., 2025c); we have shown that it is a good measure of the amplitude of autogenic processes caused by channel avulsions;
-
μ, the channel mobility frequency, that we defined here as the number of times the largest channel has changed its position between two time steps over a given length of time, τ=4–5 Myr, divided by the number of time steps over the same period; a mobility frequency of 1 entails that the channel moved at every time step, and a frequency of 0 entails no movement over the period τ.
Finally, Wild et al. (2025c) introduced a framework to facilitate the interpretation of grain size fining data. It explains under which conditions basement subsidence or autogenic processes dominate grain size fining. This framework is summarized in Fig. 1 as a phase diagram in the F–β space. Four domains have been defined, including (1) an autogenic-dominated domain (in black colour) at high F (high bypass) and low β (high slope) values; (2) a subsidence-dominated domain (middle grey colour) in a band that goes from low F, low β values to high F, high β values; (3) a mixed regime, where both subsidence and autogenic processes equally contribute to fining, that is comprised of the first two; and (4) a region in the upper-left corner of the parameter space (low F, high β values) where surface topography is so subdued that local minima (or topographic depressions) form such that the self-similar grain size fining model is not applicable.
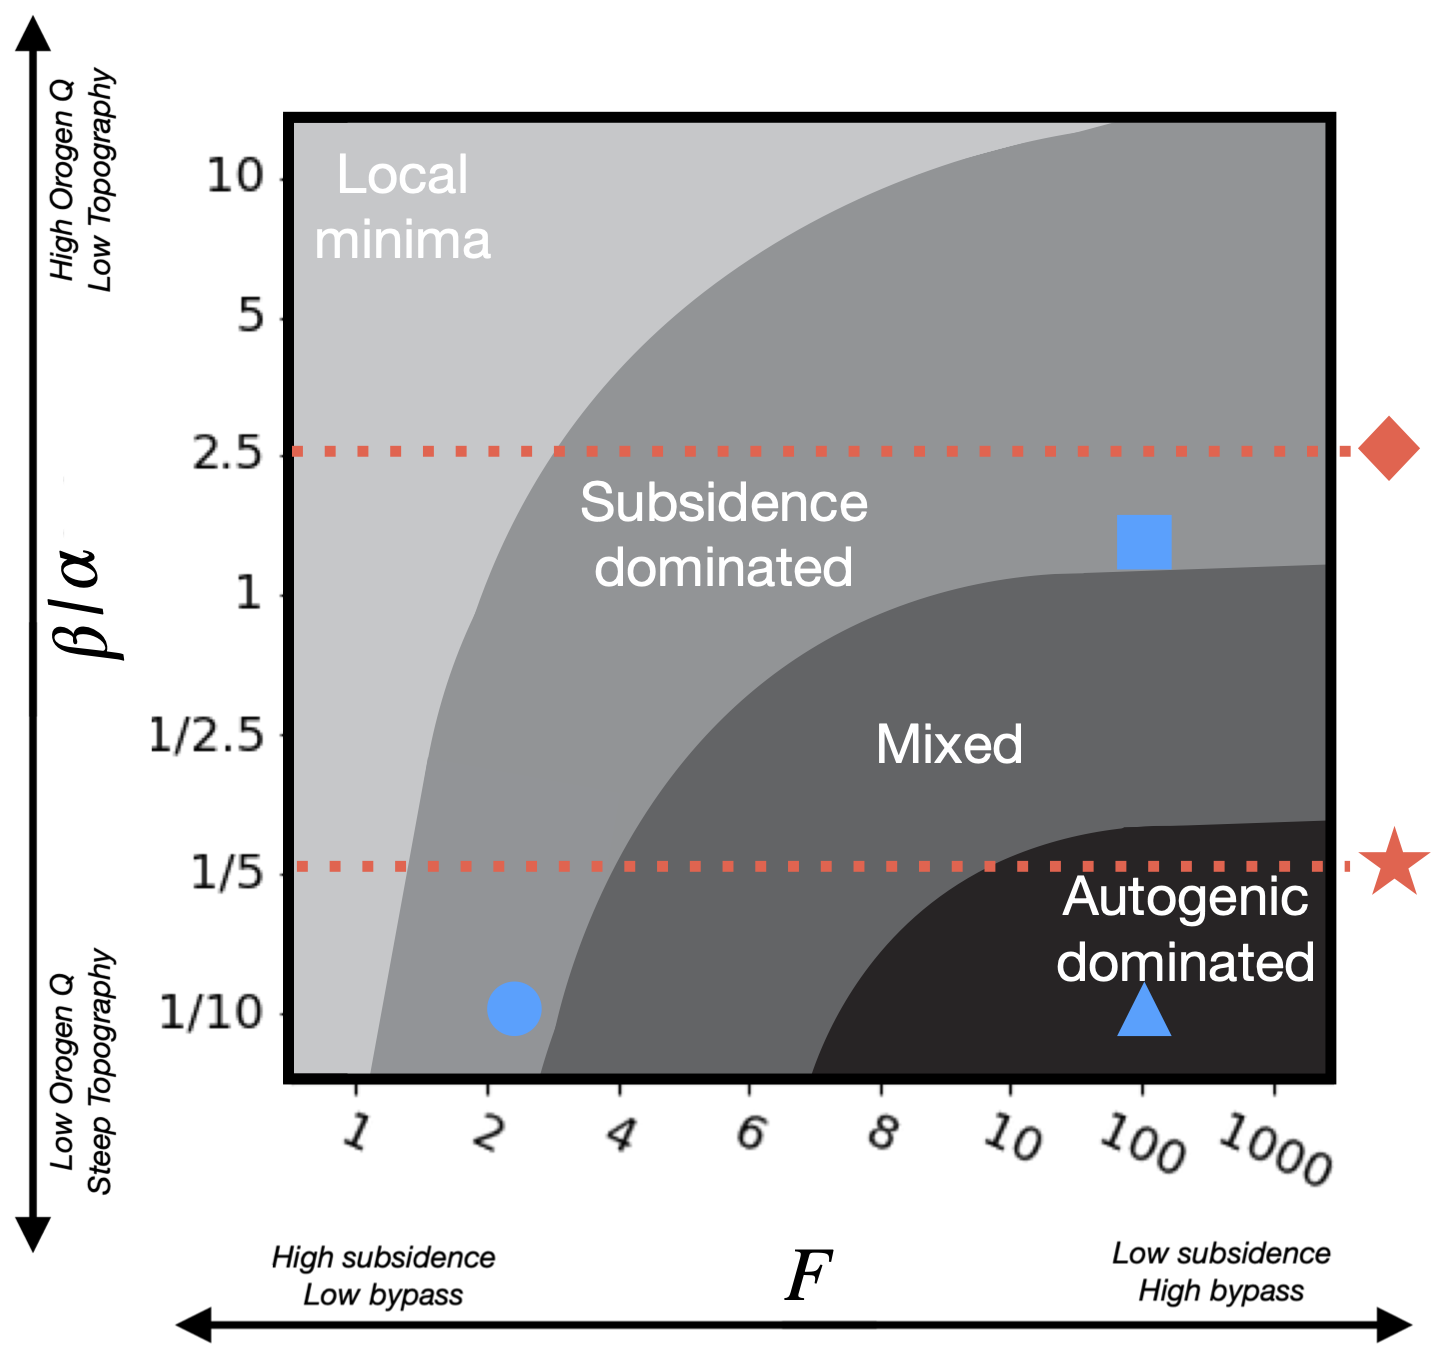
Figure 1Conceptual framework developed in Wild et al. (2025c) in the F–β space to express under which conditions autogenic processes, subsidence, or local minima dominate the grain size fining rate. Blue symbols represent model experiments shown in panels (a) (triangle), (b) (square), and (c) (circle) of Fig. 2. The lower red dashed line (with the star) corresponds to the path followed by the system in the flexure-driven model experiment shown in Fig. 3. The upper red dashed line (with the diamond) corresponds to a similar experiment performed with a high β value and shown in Fig. 4.
In Fig. 2, we show the stratigraphic grain size profiles predicted by GravelScape for three model experiments with an imposed incoming sedimentary flux and an imposed exponential subsidence function, as done in Wild et al. (2025b, c). These plots differ by the value of the parameters F and β. In panel (a), the system is in high bypass (F=100) and has a concave topography (). In panel (b), the system is in high bypass (F=100) and has a convex topography () where the orogen drainage and fan area dominates over the entire basin. In panel (c), we show a basin in low bypass (F=2.5) with a concave topography (). In each panel of Fig. 2, we show contours of predicted grain size values along a vertical cross-section from the mountain front to the system base level, along the center of the model (sub-panel 1), along the entire surface of the model at the last time step (sub-panel 2), and along two vertical cross-sections (sub-panels 3 and 4) perpendicular to the first one at two locations along the x axis as indicated by red lines in the first cross-section and the top surface view. All stratigraphic cross-sections in Fig. 2 cover time steps (and thus depth) from the final 5 Myr after steady-state conditions have been reached and do not show the underlying bedrock. When generating stratigraphic profiles, we have plotted grain size values only in “major channels”, i.e. defined as where discharge (or drainage area) is greater than a threshold value (Ac) and filled the remaining areas or “floodplains” in dark blue. This is done to emphasize major channels, channel mobility, and channel reworking. In the plan views in the last time steps (sub-panels 2), channel mobility can be estimated from the shape of the channels and the proportion of the basin covered by floodplains. Within the stratigraphic profiles that cut across the basin, rugosity (across-basin variation in topography) can be estimated by considering surface topographic relief and the amplitude of the cross-cutting patterns of infilling and incision within the across-basin stratigraphy.
.
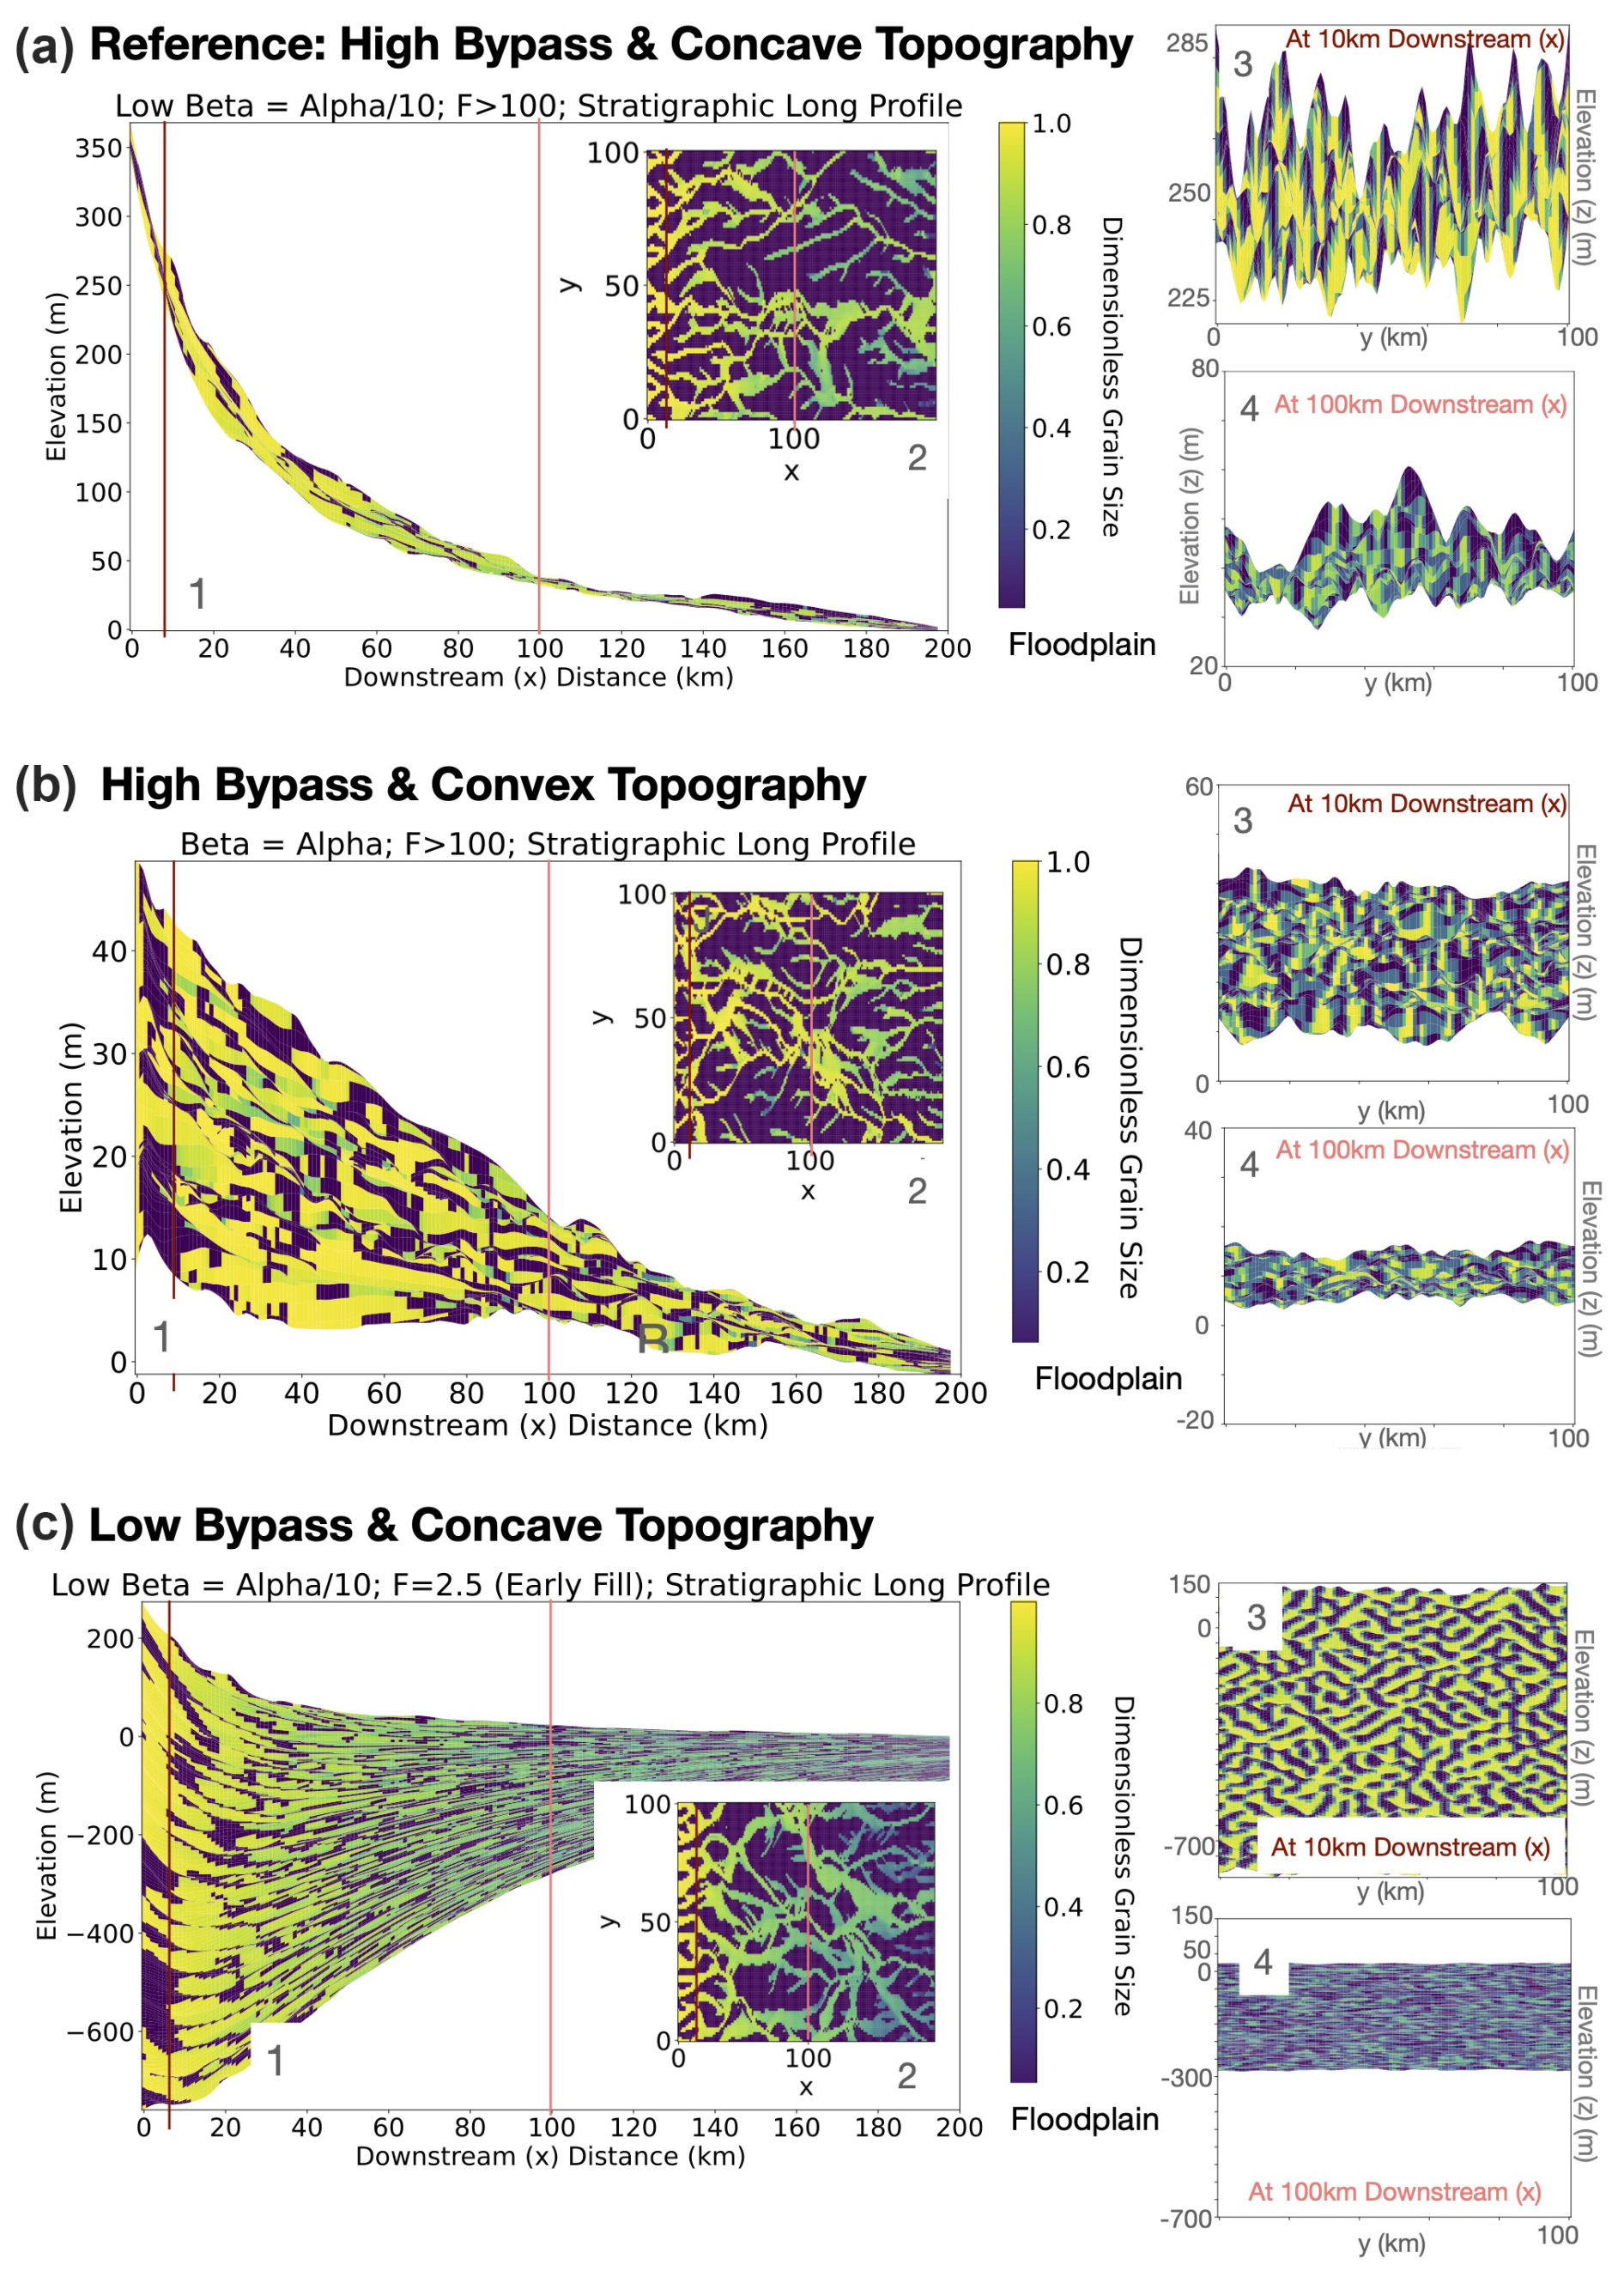
Figure 2Model results with imposed subsidence. Stratigraphic section computed through the basin and along its surface under (a) high bypass and with a concave topography, (b) high bypass and with a convex topography, and (c) low bypass and with a concave topography. In each panel, predicted grain size is shown along a vertical section in the x direction (Sect. 1) and two sections in the y direction (Sects. 3 and 4) as well as along the model final topography (inset labelled 2). Grain size is shown where large channels were actively depositing; elsewhere a dark-blue colour is used to represent what we will refer to as floodplain areas. Wherever large channels were not depositing coarse gravel grains during a given time step was filled in dark blue as floodplain. All model parameters are given in Table 1
When vertical accommodation is minor (Fig. 2a and b), stratigraphic results show generally less (<30 %) grain size fining within the channel and much less stratigraphic thickness relative to Fig. 2c since there is less overall accommodation/sedimentation. Sedimentation that does occur is controlled by local lateral and longitudinal (x and y) accommodation within the topographic profile that responds over time to pulses of incision and deposition leading to strong depositional divergence. Rugosity, cross-cutting, and interfluve reworking of channels within the stratigraphic packages is high (Fig. 2a3). Comparing Fig. 2a and b, we note that topography, rugosity, and cross-cutting are greater with lower β.
When subsidence dominates the stratigraphy (Fig. 2c), it controls the rapid (>30 %) grain size fining rates within the channels (Fig. 2c1 and c2), preservation is high (thick stratigraphic layers in Fig. 2c1), the across-basin rugosity is low (no reworking, little topographic variation, or incising/cross-cutting of channels in Fig. 2c3 and c4), and the channel mobility is high, producing many course-grain channels that deposit ample sediment and are well preserved (Fig. 2c3). Relative to the high-bypass example, the final topography in the fan is only marginally depressed (the apex is at 250 m in panel (c) compared to 350 m in panel (a)) despite the much higher subsidence rate, demonstrating that the shape of the topography is controlled by the size of the upstream catchment and the flux of sediment coming out of the mountain and, to a much lesser degree, by the subsidence, as shown in Braun (2022).
Wild et al. (2025c) have shown that grain size fining is dominated by autogenic dynamics under high bypass (high F values) when surface slopes are high (low β values) such as in Fig. 2a or by subsidence under low bypass (low F values) such as in Fig. 2c, in agreement with previous studies (Duller et al., 2010; Whittaker et al., 2011; Armitage et al., 2013) where autogenic processes were neglected. High-bypass (high F values) and low-surface-slope systems (high β values) such as in Fig. 2b see less or no grain size fining. The results presented here therefore confirm that our new model produces stratigraphy records that are in accordance with the basic findings of Wild et al. (2025c).
They also illustrate the extent to which subsidence is required to preserve grain size fining information in stratigraphy. In high-bypass systems (F⪆100), time is highly condensed in the stratigraphic column (Fig. 2a), and the patterns of deposition are mostly controlled by autogenic processes, rendering the preservation of external signals very unlikely. This can be appreciated by considering the surface rugosity in Fig. 2a3 and 4 that is of the same amplitude as the thickness of the layer deposited over the last 5 Myr of the model run. The rugosity can be seen as a proxy for the depth of the active layer and thus indicates that the entire sediment package deposited during the last 5 Myr is still being reworked and that any temporal information about the evolution of the system over these last 5 Myr has been lost. To the contrary, the surface rugosity, and thus thickness of the active layer, in experiments shown in Fig. 2b and c is much smaller than the thickness of the sedimentary package deposited over the last 5 Myr. In these situations, the time resolution of the stratigraphic record is much finer and can be estimated as the ratio of the rugosity (approximately 5 m and 50, respectively) to the thickness deposited (30 and 900 m, respectively) multiplied by the time span of deposition (5 Myr), which gives approximate temporal resolutions of 800 and 300 kyr for experiments in Fig. 2b and c, respectively.
This model confirms that preservation of potential external signals is optimal or that the relative amplitude of autogenic processes is minimal in systems characterized by fast subsidence (high F values) and low surface slope/rugosity (high β values). This is in line with the theoretical predictions of Ganti et al. (2011) derived from scaled laboratory experiments.
4.1 Flexural foreland evolution under a low β setup
We now present results of the fully coupled model, i.e. combining GravelScape with the flexural model and considering an evolving orogen and its retro-foreland basin. Although we only plotted the basin evolution from the mountain toe (0 km) to 200 km, we also modelled the evolving orogen to calculate the flexural response of the basin dynamically. For the main focus of this paper (Fig. 3), the value of the EET, Te=20 km (Table 1), that we have chosen is such that the wavelength of the resulting flexural defection (≈200 km) is much greater than the size of the fan. The size of the fan (≈20 km) is set by the size of the orogen (50 km) and the relative precipitation product in the orogen (0.8) compared to the basin (1) (Braun, 2022). In our model setup, annual precipitation is incorporated into the definition of K, so relative precipitation values are dimensionless factors that determine the proportion of precipitation above or below the mean annual rate falling in the basin versus the orogen. In this situation, the surface topography is mostly controlled by surface processes and only by the subsidence at very low F values (Braun, 2022). This leads to a relatively small value for (see Wild et al., 2025c, for an exact definition of β), which is typical of many foreland basins, with the exception of mega fans, which could extend beyond the lithosphere flexural wavelength, or in situations where the mountain is very close to an ocean (such as in the Southern Alps of Te Waipounamu / South Island, Aotearoa / New Zealand). This choice of a low β value leads to relatively high surface slopes in the basin, which helps prevent the formation of local minima or lake depressions, which affect the grain size computations as discussed in Wild et al. (2025b, c). The choice of low β also allows for autogenic dynamics to potentially impact grain size fining as predicted in the Wild et al. (2025c) framework (also shown in Fig. 1) that were otherwise reduced in high β settings.
In Fig. 3 we present a series of stratigraphic sections through the foreland basin for the duration of the model. The various panels in Fig. 3 show (a) the stratigraphy where colours are proportional to the value of F at the time of deposition, (b) the grain size in the main channel, (c) the grain size along a vertical section at the center of the basin, (d) deposition or erosion averaged in the y direction, and (e) the surface rugosity, at the time of deposition. The dark-blue areas (low grain size) in panel (c) correspond to regions where deposition took place along channel interfluves or what can be associated with floodplains. In two small insets, we show, in panel (a), the time evolution of the maximum topography (apex) in the orogen and in the basin and, in panel (e), the mobility frequency computed over five time intervals in the basin evolution as a function of x. Within the inset of panel (a) (a2), we also show the e-folding time towards topographic steady state in the orogen and in the basin. These times are also indicated in all stratigraphic sections of panels (a) to (e) as a blue (mountain steady state) and orange line (basin steady state). The channel mobility shown as an inset in Fig. 3e was calculated as the frequency of movement of the largest channel over 4 Myr time windows. These time intervals are also indicated as dashed black lines in the stratigraphic sections. In the following description of these results, we have divided the foreland basin evolution into four phases based primarily on its degree of evolution towards steady state and, in particular, the bypass parameter, F. Note that the exact value for F during each stage of the basin evolution may vary depending on the basin configuration. However, the general trend for F is independent of model parameters as is its effect on the evolution of grain size trends and autogenic dynamics.
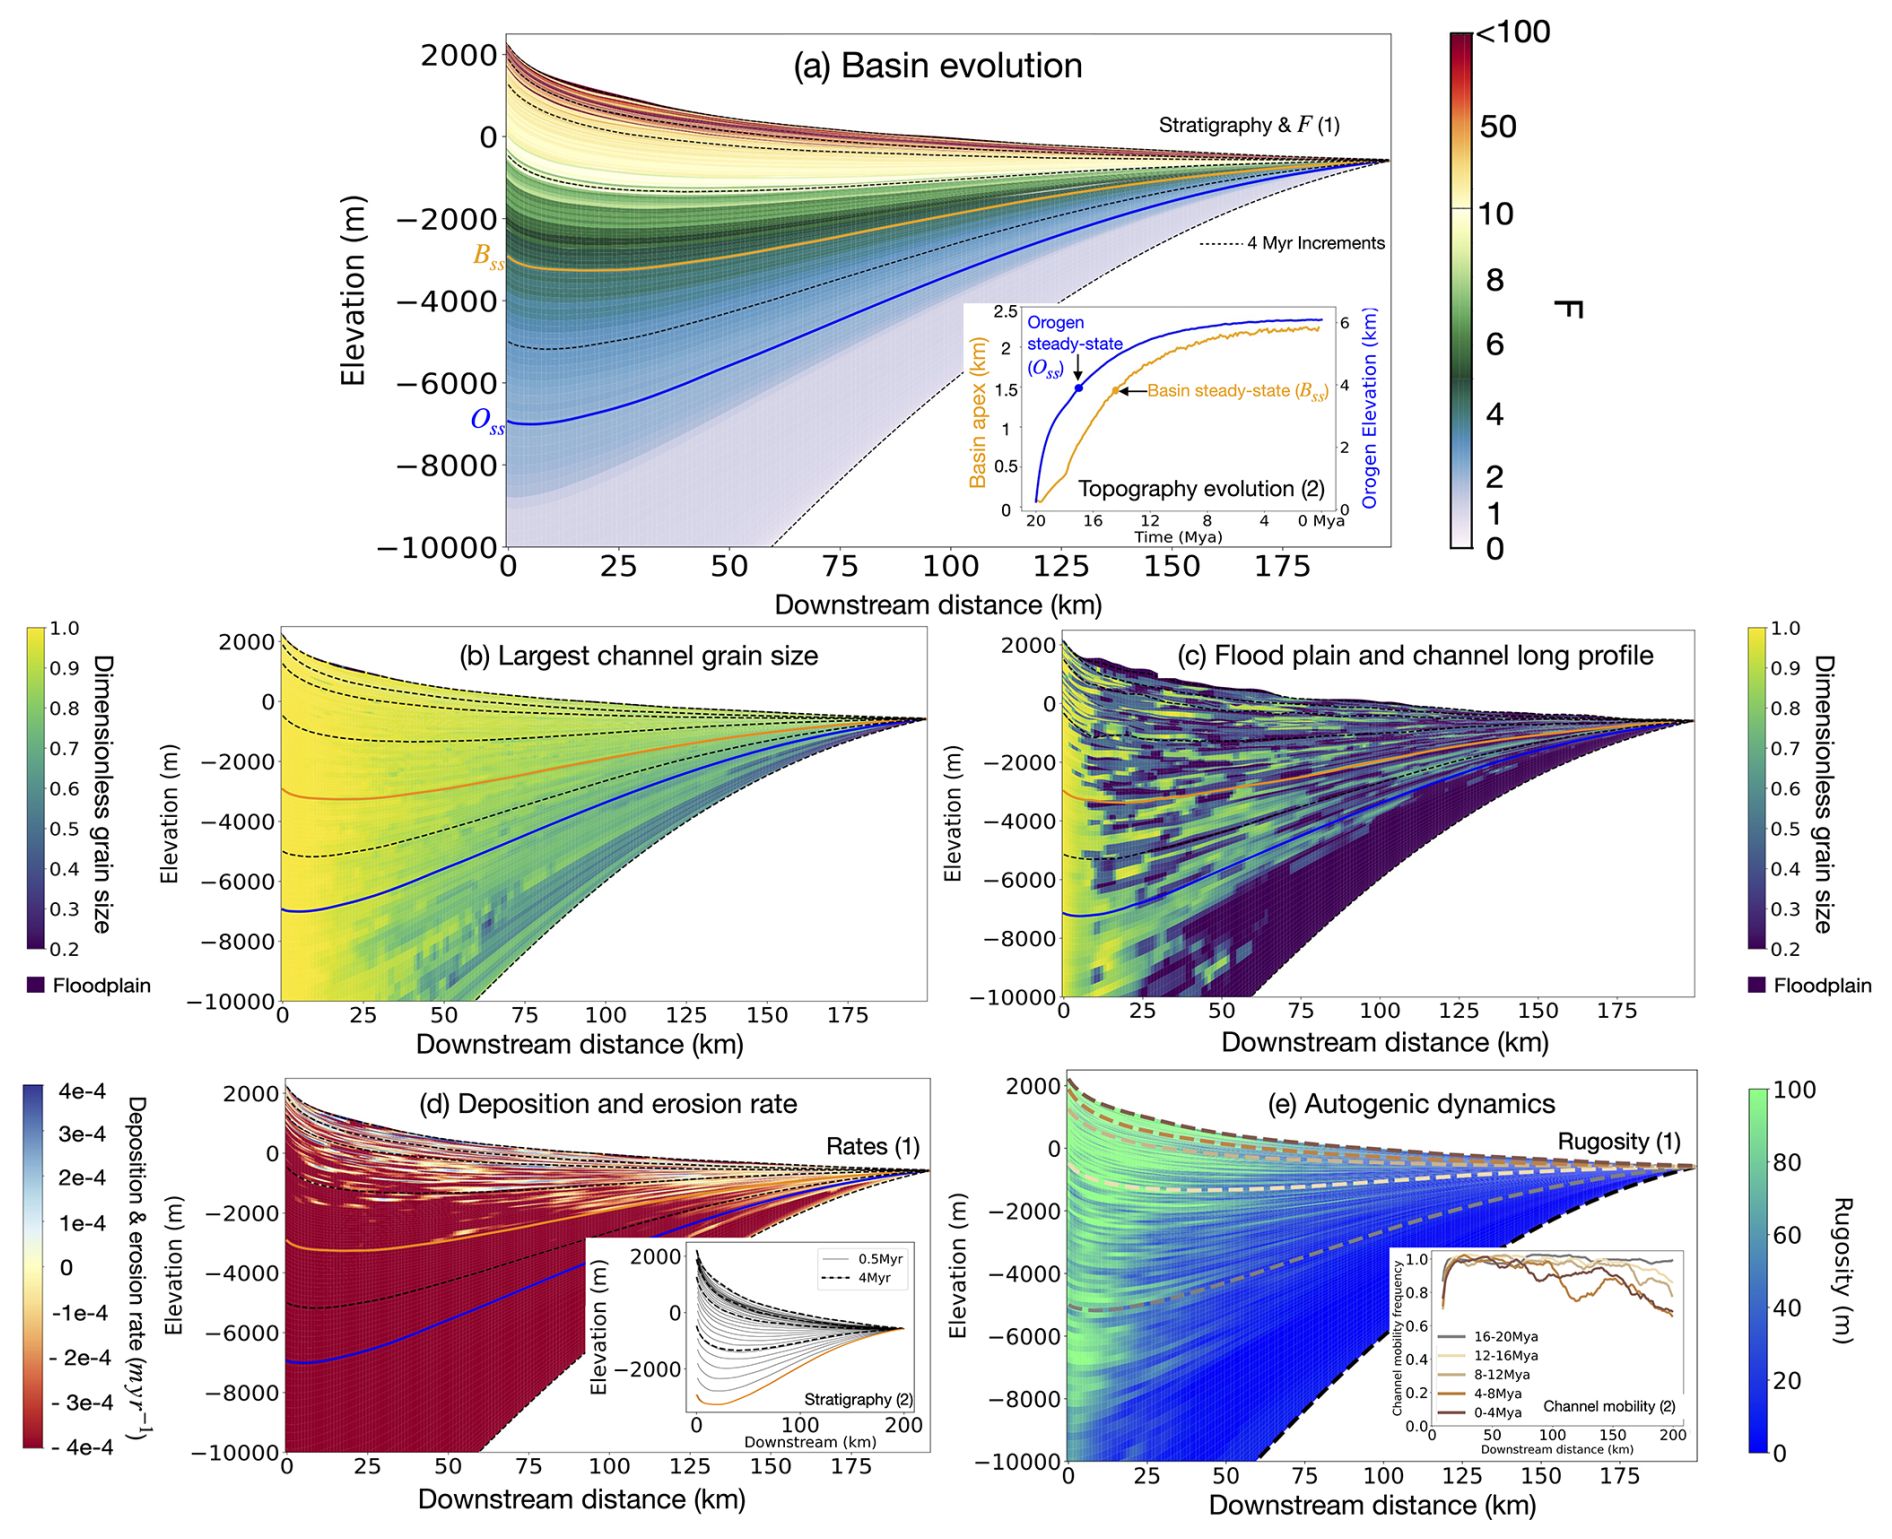
Figure 3Model results using fully coupled model. Vertical cross-section through the model stratigraphy computed at the last time step of the 20 Myr model duration. (a) Computed F value, (b) computed grain size deposited along the main channel, (c) computed grain size at a given cut (y=10) section through the basin (dark blue areas correspond to floodplains), (d) deposition rate averaged in the y direction, and (e) rugosity. In all panels, the blue line correspond to the time when the mountain height approaches its steady-state value; the orange line is the equivalent for the basin maximum height, and the black dashed lines correspond to time markers every 4 Myr in the evolution of the model. In the small inset of panel (a) we show the time evolution of the maximum topography in the mountain and in the basin. In the small inset of panel (e), we show the computed channel mobility frequency as a function of the x position for different time intervals as indicated. See Table 1 for model input parameters.
Early in the collision, during what we shall call Phase 0 (light–blue–white section with F<1 in Fig. 3a), the orogen grows, and basin subsidence is fast, but little sediment is produced yet; this leads to a mostly “starved” foreland basin. During this phase, the basin is so under-filled that it becomes a large local depression. In this situation, our algorithm to solve the modified SPL cannot be used, and sediment is deposited uniformly across the basin, simulating deposition in a lacustrine environment where the self-similar grain size fining model cannot be used. In other real-life settings, this would be a marine basin in to which turbidites or marine stratigraphy might be deposited.
During Phase 1 (darker shades of blue for in Fig. 3a), the basin and orogen are in a transient state on their way to the steady-state topographic height, and the subsidence is largely driven by flexure in response to the loading of the growing orogen. The growth of the orogen and of its mean slope results in a steadily increasing erosion rate in the mountain area and sediment flux into the basin. This leads to a progressive increase in F to values that rapidly exceed 1, as the basin fills and enters a bypass state. As F increases, grain size fining in the main channel shows coarsening upwards, i.e. less fining (Fig. 3b). During this transient phase towards steady state, rugosity is relatively low, except in the fan area, but channel mobility is high across most of the basin (Fig. 3e). Deposition rate is relatively uniform across the basin in response to the rapid subsidence (Fig. 3d). This generates thick stratigraphic packages (approximately 15 and 7 km deposited in the first two 4 Myr intervals). The strong fining trend that is observed during most of this phase is indicative of a system where sedimentation rate is dominated by subsidence (F<4) and the effect of autogenic processes is minimal (low rugosity) (Wild et al., 2025c). During Phase 1, the system can be positioned in the low β vs low F (bottom left) corner of the framework of Wild et al. (2025c) (Fig. 1).
We define Phase 2 (shifting from blues to greens for in Fig. 3a) as the period when topographic steady state in the mountain has been reached (the blue line in the stratigraphic sections) until topographic steady state in the basin has also been reached (the orange line in the stratigraphic sections). During this phase, basin subsidence transitions from being predominantly driven by the load of the mountain to the weight of the sediment itself. In this maturing phase of evolution, the system transitions into a progressive higher-bypass regime in which the value of F increases to very large values. Despite this increase in F, we see that the fining trend in the main channel remains relatively constant (Fig. 3b). We also see an increase in floodplain deposition (Fig. 3c), an increase in rugosity, and a decrease in channel mobility (Fig. 3e) that indicate that autogenic processes become more important. This is confirmed by an increase in variability in deposition rate (Fig. 3b). This strongly suggests that grain size fining is becoming progressively dominated by autogenic processes and less by subsidence. During Phase 2, the Fig. 3 system can therefore be positioned in the low β vs intermediate to high F region or mixed regime of the framework of Wild et al. (2025c) (Fig. 1).
Phase 3 is defined as the period after basin topographic steady state has been reached (yellow to red contours corresponding to F>10 values in Fig. 3a). With a constant flux from the mountain, the subsidence generated due to sediment loading continues but at a much slower pace than in Phase 2. The level of bypass increases with time (less than a few hundred metres of sediment is deposited in every 4 Myr intervals), which explains the rapidly decreasing subsidence rate (less sediment deposited cause less subsidence). During this phase, erosional unconformities can be observed that can extend across the entire basin or occur locally despite constant external conditions. These unconformities are better expressed in the model run shown in Fig. 4 with higher precipitation in the mountain area (and thus higher β and higher F bypass values).
During Phase 3 (high bypass), grain size in the main channel is relatively coarse but some fining still takes place (Fig. 3b). Channel mobility is lower than during Phases 1 and 2 (Fig. 3e), resulting in a larger proportion of floodplain areas (Fig. 3c). Channels also appear to cut into material previously deposited in floodplains (Fig. 3c). This and the very high rugosity (close to 100 m) (Fig. 3e) indicate higher reworking. Phase 3 also shows the highest variation in deposition rate in the upper reaches of the basin, i.e. near the fan (Fig. 3d). All these factors indicate that autogenic processes are very active and of high amplitude. With high-bypass (high F) conditions, this suggests that the observed low to moderate grain size fining has become totally autogenic-dominated. During Phase 3, the system should be position in the low-β vs high F (bottom-right) corner of the framework of Wild et al. (2025c) (also shown in Fig. 1).
4.2 Flexural foreland evolution under a high β setup
In Fig. 4, we show the results of a model run identical to the model run shown in Fig. 3 except for a higher β value, obtained by increasing the precipitation rate in the mountain area to be 10 times larger than in the basin area, such that β=2.5α, and a slightly lower K ( m1–2 m yr−1), in order to produce a more comparable response time to Fig. 3 despite the increasing precipitation. Consequently, the size of the fan is larger than the wavelength of the resulting flexural defection and would extend beyond the model length, similar to a megafan or confined system as described in Braun (2022). Note that, based on the framework of Wild et al. (2025c) (Fig. 1), a model experiment should be subsidence-dominated, regardless of the value of F.
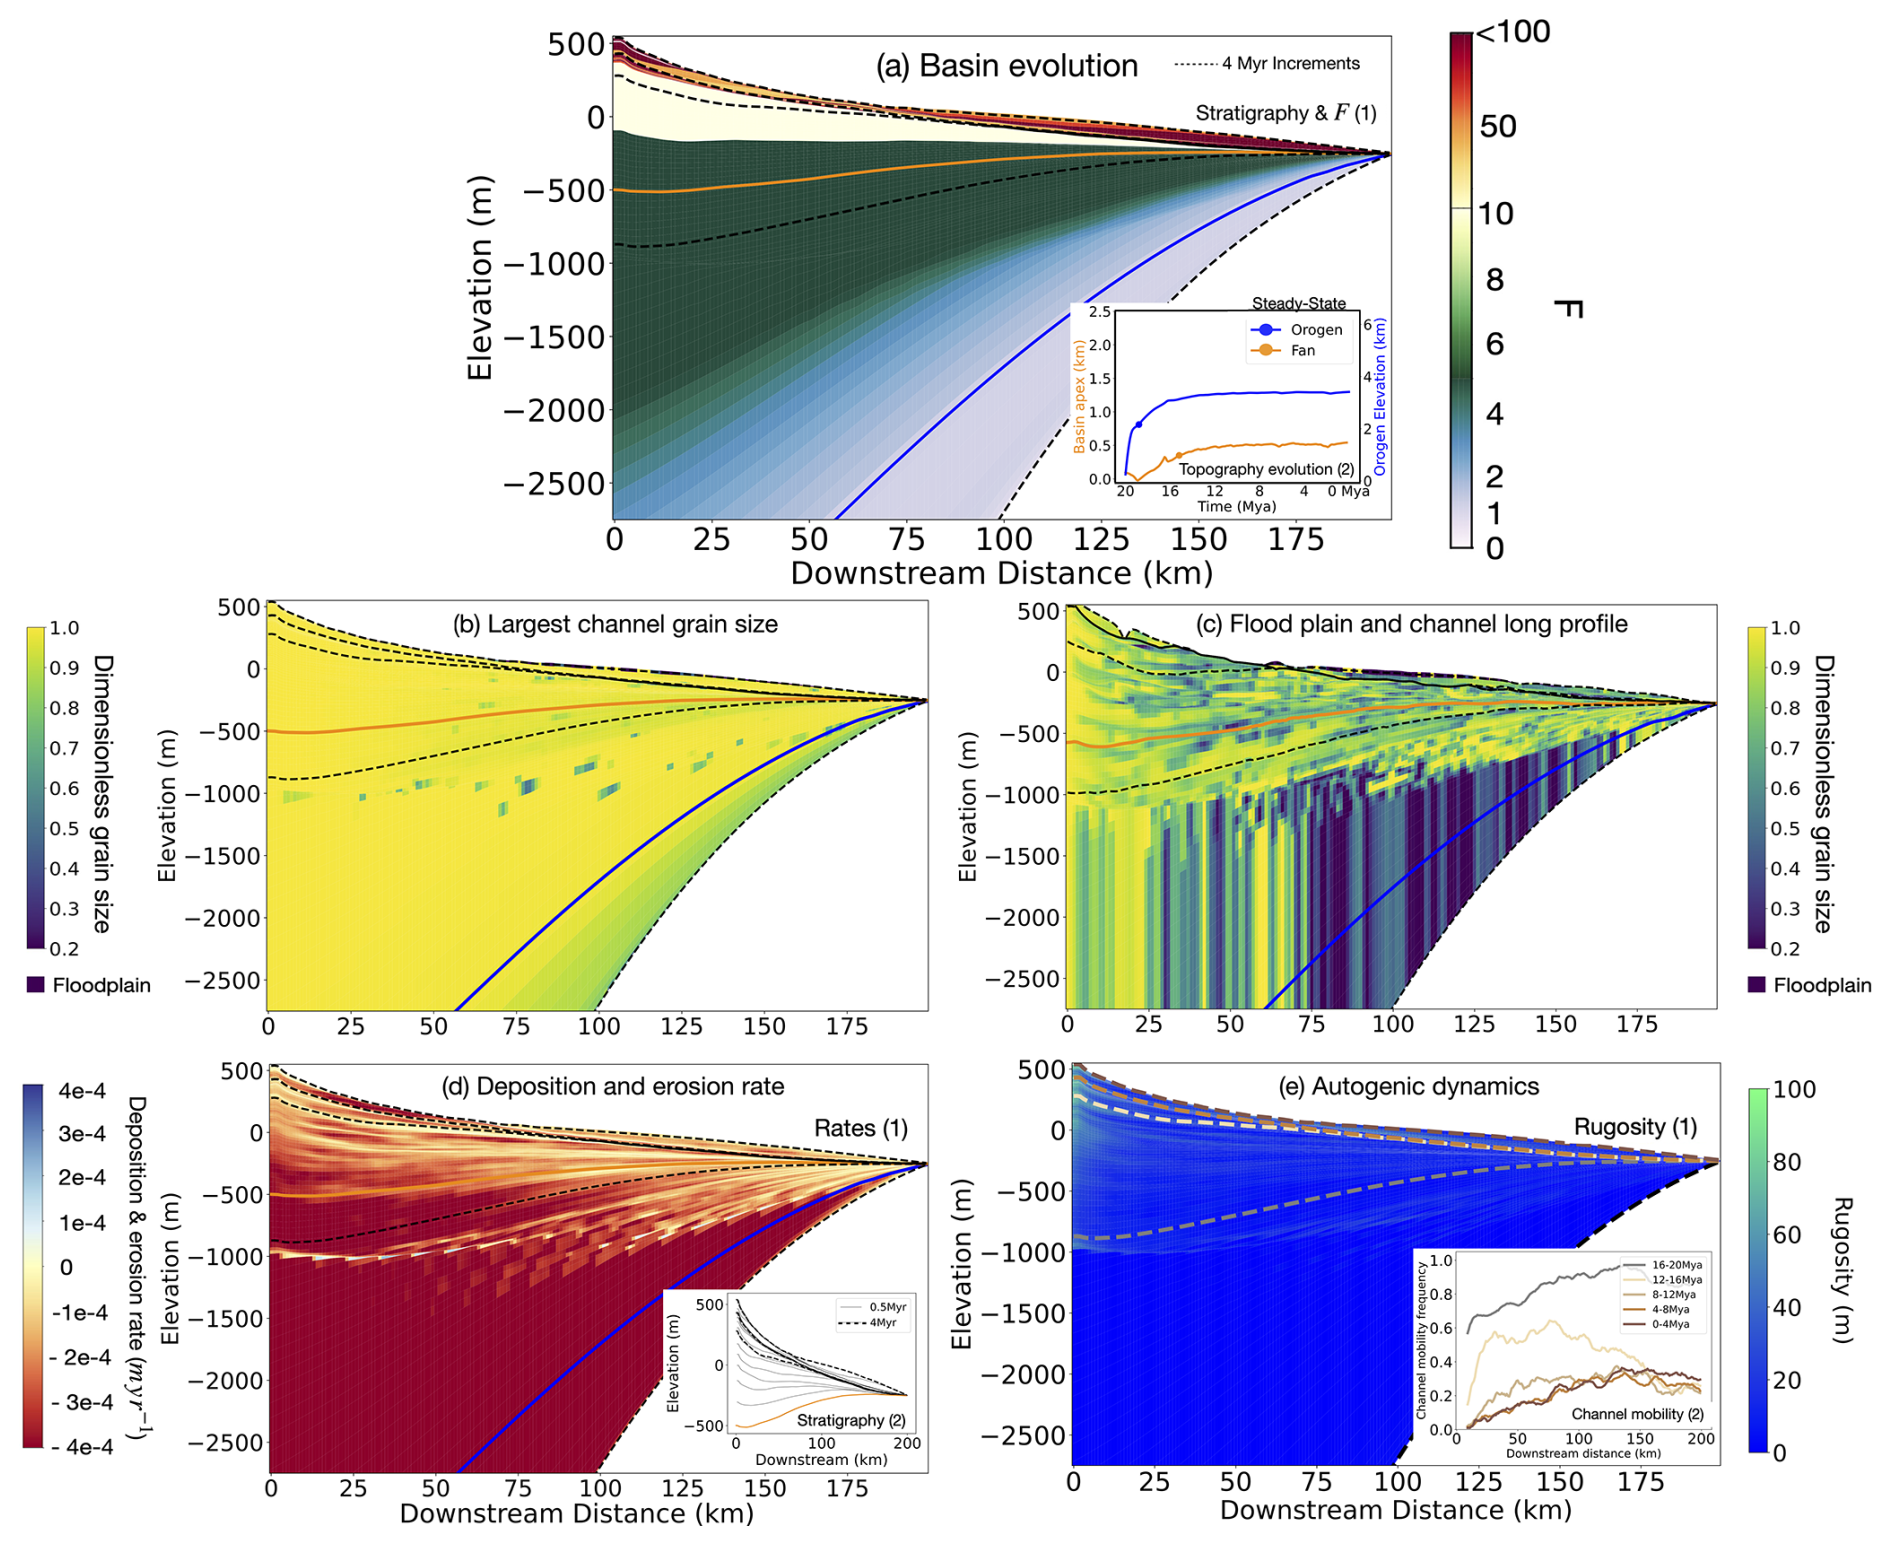
Figure 4High (β>α) foreland basin that falls within the local minima (low F) to subsidence dominated regime (Fig. 1). Panels show: basin evolution of F (a), largest channel grain size (b), computed grain size at a given cross-cut through the basin (y=10) (c), deposition and erosion (d), (e) autogenic dynamics such as rugosity (e1) and channel mobility at 4 Myr intervals (e2). In all panels, the blue line correspond to the time when the mountain height approaches its steady-state value; the orange line is the equivalent for the basin maximum height, and the black dashed lines correspond to time markers every 4 Myr in the evolution of the model. Early periods (e.g. around F<2) of basin evolution are likely impacted by local minima. See Table 1 for model input parameters.
We see (Fig. 4) that the timing of Phases 0 to 3, as defined for the low β case, remains the same, except that the F values at steady state are much higher in Fig. 4 compared to Fig. 3. Due to the enhanced precipitation rate in the orogen, the basin more rapidly reaches a state of high bypass compared to the low β scenario, but the sediment thickness accumulated in the basin is substantially reduced. Furthermore we see, in Fig. 4b, that channel fining occurs early in the basin evolution, i.e. when F<10, or early in Phase 1. Once bypass is reached (F>10) in the high β scenario, i.e. during Phases 2 and 3, no further channel fining is observed (Fig. 4b), and channel mobility (Fig. 4e) is reduced. This is in contrast to results shown in Fig. 3, where downstream fining in the channel is observed under high-bypass F values and downstream channel mobility occurs. Around and after orogen steady state is reached, pulses of deposition and erosion result in unconformities and stratigraphic layers that are highly truncated downstream (Fig. 4d). In the final stages of the model simulation the main depositional depocenter migrates towards the downstream areas of the model.
Equipped with the results of this fully coupled numerical experiment (example in Fig. 3) in an unconstrained basin (low β), we now propose re-analyzing the stratigraphy of the Alberta foreland basin in Western Canada that has already been extensively studied and modelled (Catuneanu, 2004; Mossop and Shetsen, 1994; Leckie and Smith, 1992; Beaumont, 1981), to assess whether we can use the framework developed in Wild et al. (2025c) to determine the relative importance of subsidence vs autogenic processes in its stratigraphy and the potential impact it has had on grain size distribution within the basin.
5.1 General evolution
The Alberta Basin formed by lithospheric flexure associated with the accretion of the Intermontane Superterrane against Western Canada in the Jurassic to form the early Rocky Mountains/Columbian Orogen (Mossop and Shetsen, 1994). This basin should be an ideal example of a foreland system that has experienced a transition from subsidence- to autogenic-dominated control due a number of factors: (1) it is a retro-arc foreland basin (Price, 1974), which, therefore, according to Naylor and Sinclair (2008) would tend to fill and reach high bypass over time; (2) it is underlain by a relatively thick elastic plate (the strong North American craton) (Gordy and Frey, 1977), which results in a very long flexural wavelength (Flemings and Jordan, 1989; Flück et al., 2003) and, therefore, a basin that is much wider than the orogen resulting in a small β value; (3) the basin has been evolving gradually for well over 100 Myr (Price, 1974); and (4) the orogen lithology consists of several erodible sedimentary terranes (Monger and Price, 2002) that are likely to generate high initial sedimentary flux. However, contrary to our synthetic example described in the previous section, the Alberta Basin has experienced periods of both subsidence and uplift and, recently, has been subject to periods of rapid glacial isostatic adjustment (Mossop and Shetsen, 1994) causing non-monotonous variations in F.
It has been well described that the collision began much earlier in southern Alberta than in northern Alberta (Mossop and Shetsen, 1994). Consequently, at any given time in the evolution of the Alberta Basin, its northern and southern parts may have been in different states of bypass (or characterized by different F values) and, therefore, showed different level of autogenic vs subsidence grain size fining during the same time period. We have focused our comparison of model predictions to the general evolution of the system in mid-southern Alberta (between Swan Hills and Cypress Hills area) from the mid-Jurassic onwards, generally avoiding issues arising from the three-dimensional nature of the collision or pre-existing basement structures, namely the underlying Peace and Sweetgrass arches (Fig. 5).
In Fig. 5, we show a stratigraphic cross-section across the basin, as well as paleogeographic maps for selected geological times. Within the upper Jurassic (Fig. 5a (dark green) or b6), central-southern Alberta exhibited subsidence in response to early mountain building and was inundated by a shallow seaway accumulating thick marine shales. This would likely represent Phase 0 in our model where the basin is under-filled (low F), its surface is below base level, coarse fluvial sediments do not propagate very far, and the grain size fining regime is largely non-fluvial and therefore not subsidence-dominated.
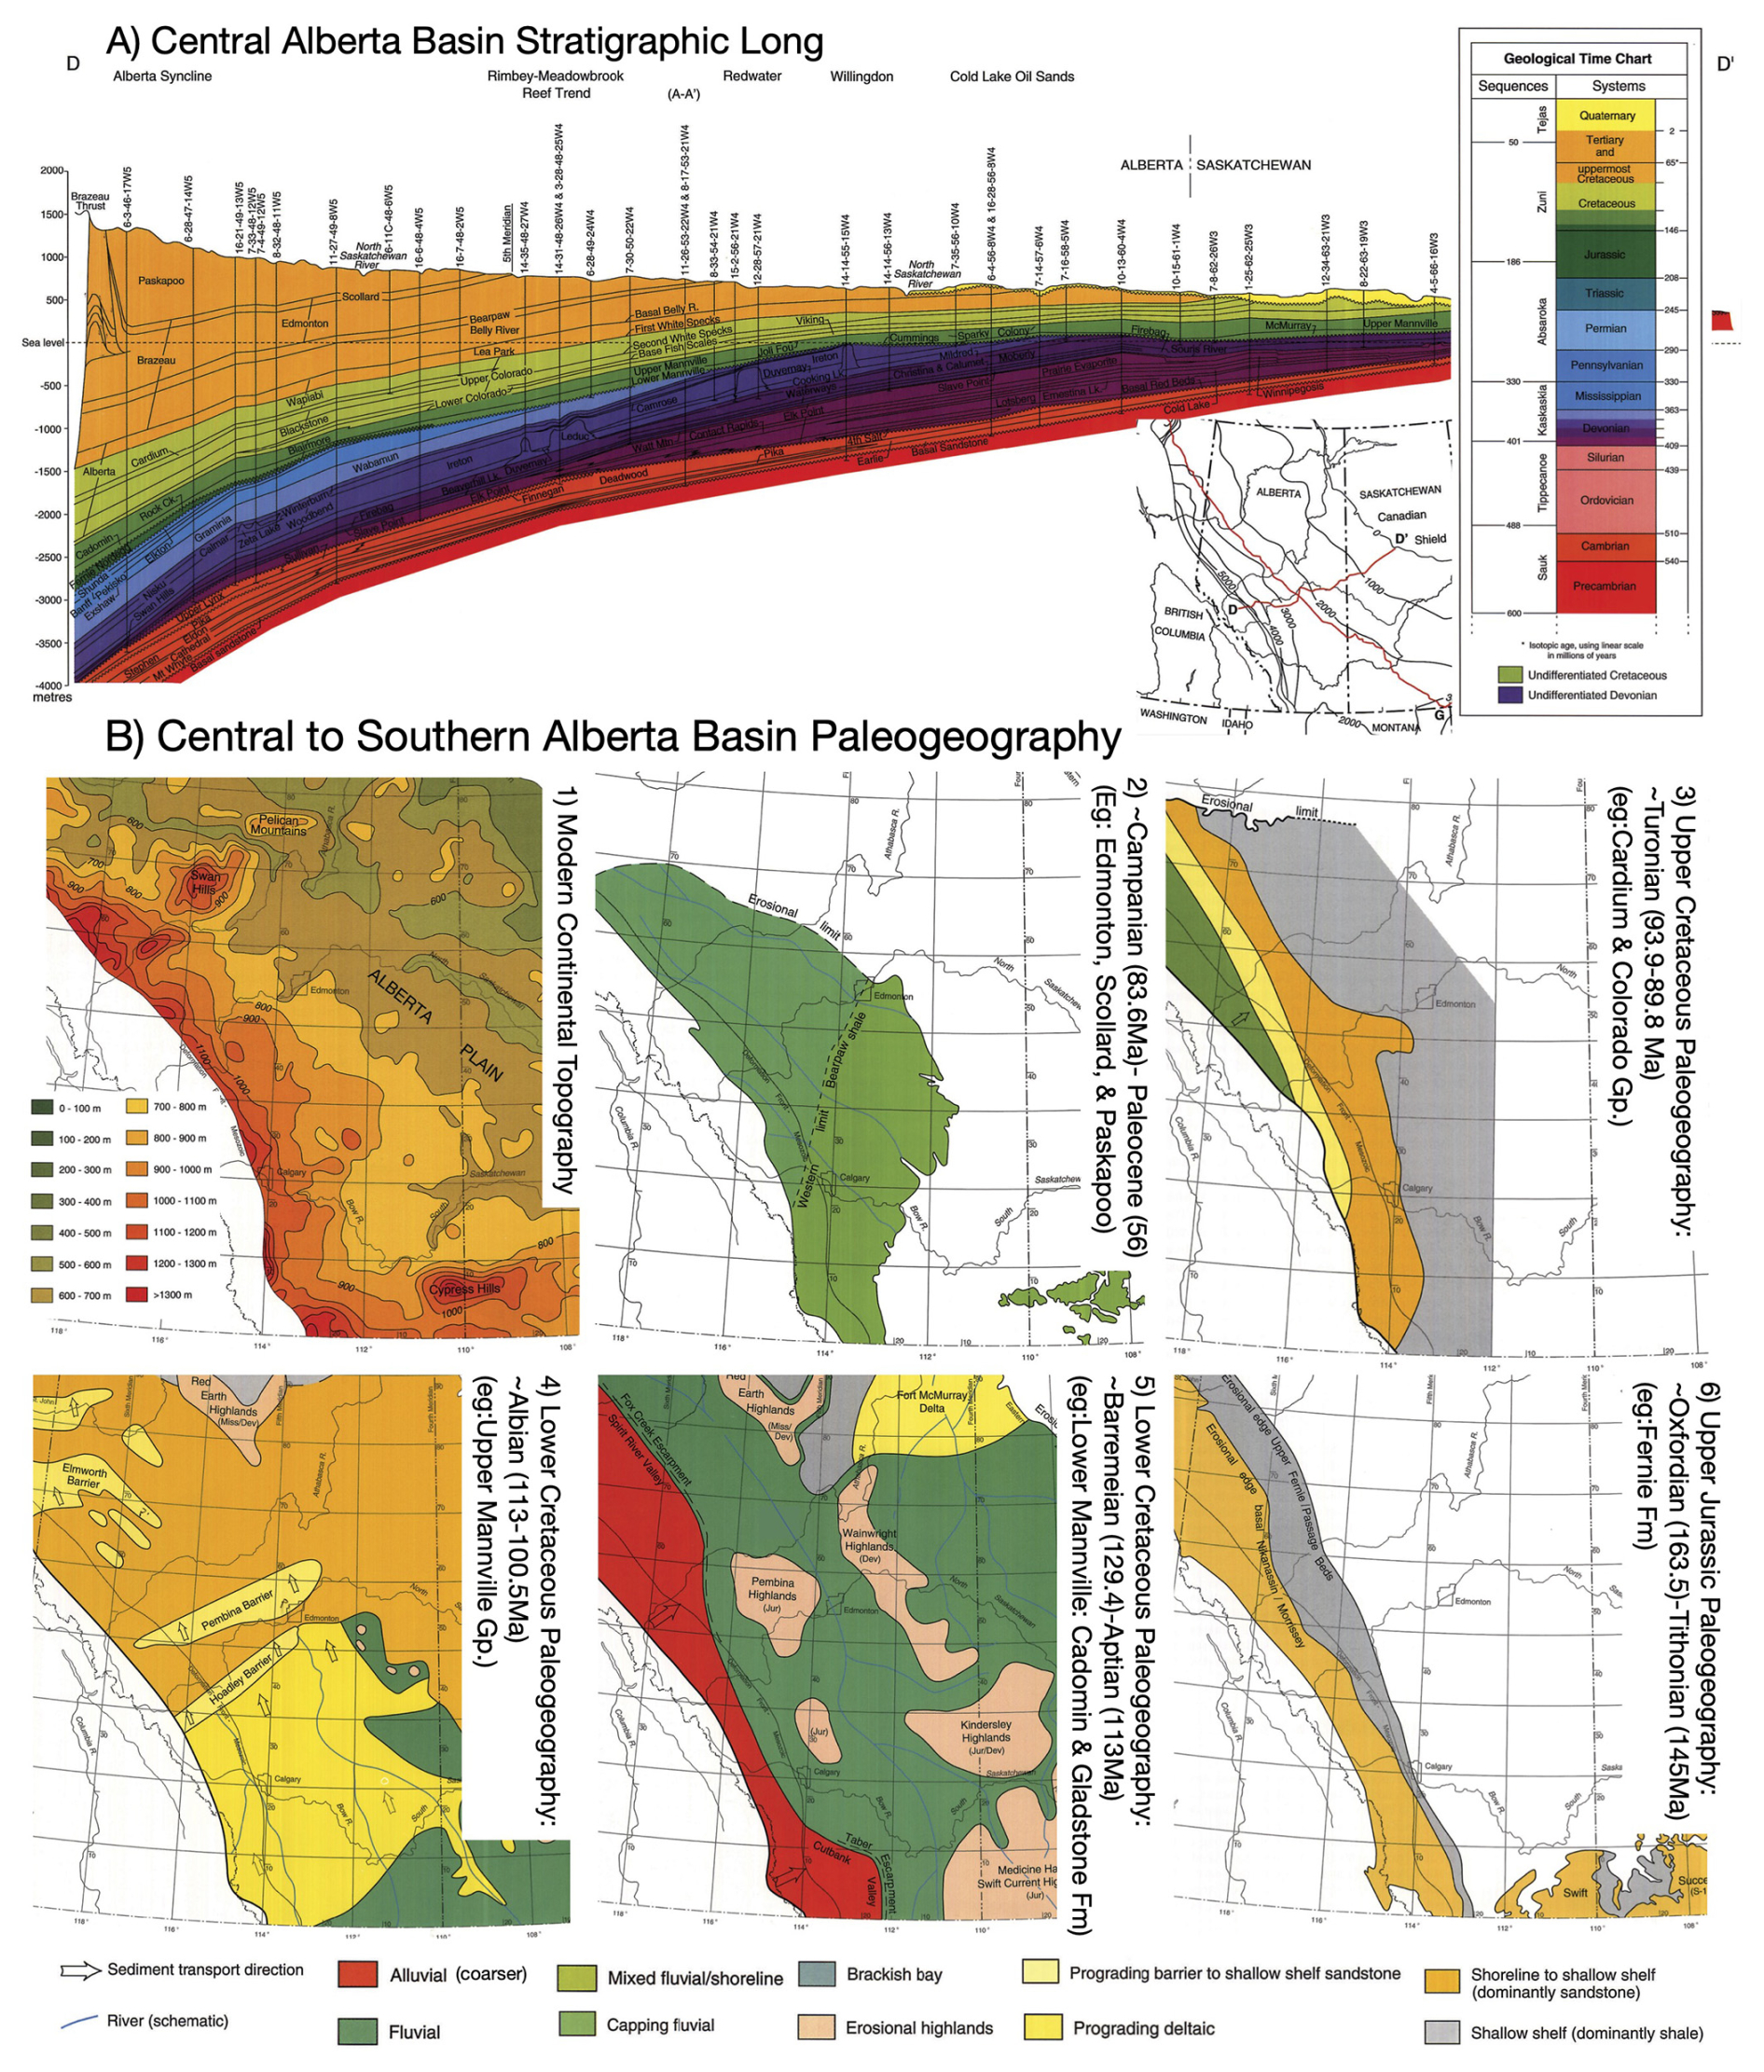
Figure 5Images were compiled and modified from the Atlas of the Western Canada Sedimentary Foreland Basin (Mossop and Shetsen, 1994) under the Open Alberta Licence (https://open.alberta.ca/licence, last access: 26 May 2025). Panel (a) shows the stratigraphic thicknesses and ages perpendicular (D to D') to the orogen and “downstream” (x) within the central Alberta foreland system south of Edmonton. The exact stratigraphic D–D' transect location is shown on an inset map of Western Canada in subset A. Subsets B show the modern topographic elevation (1) or paleogeography (2–6) with fluvial propagation vs marine inundation extents at several time intervals between the upper Jurassic (b6) and present (b1).
After an initial phase of mountain building, there is a well-defined erosional unconformity, which corresponds to a tectonic quiescence and rebound episode in the Canadian Cordillera from 140 to 125 Ma (Leckie and Cheel, 1997). Previous work suggests that long-wavelength uplift may have occurred due to unloading of the orogenic front (Johnson and Dalrymple, 2019). Following this unconformity is an extensive alluvial facies unit called the Cadomin Formation, made of clast-supported, subrounded, dominantly coarse conglomerates (with local sandstone occurrences). It is hundreds of kilometres in spatial extent within a fluvial system flowing northward (Johnson and Dalrymple, 2019; Leckie and Cheel, 1997) to eastward (McLean, 1977) for 12–18 Myr during roughly the Barremian–Aptian (White and Leckie, 1999) (Fig. 5a, above the dark green, or b). As evidenced by the erosional unconformity at the base of the Cadomin Formation and the propagation of coarse fluvial grains (gravel conglomerate with interbedded sands and occasional finer clasts McLean, 1977) away from the orogenic front, it is likely that during this phase, the basin had rapidly entered a state of high bypass and, thus, a highly autogenic-dominated regime (e.g. F>10). The Cadomin Formation has a thickness of 1–200 m (McLean, 1977) accumulated over 12–18 Myr (White and Leckie, 1999), implying an extraction rate of approximately to (m yr−1), which we would consider low within our model simulations and indicative of a state of high bypass (e.g. Fig. 2a had a subsidence rate of (m yr−1), resulting in F≥100).
Following this tectonic quiescence, mountain building reactivated in the Cretaceous when the Insular Superterrane collided with North America and reactivated the eastward thrusting of the Intermontane Superterrane. Subsidence resumed as well. Throughout the Albian, there are varying occurrences of brackish bay, delta, and shallow marine shelf deposits, while any fluvial propagation of coarse grains that was observed in the Cadomin Fm is significantly reduced (e.g. Fig. 5a (light green) or b4). The foreland trough, parallel to the Rocky Mountain front, substantially broadened and deepened during the Cretaceous such that the stratigraphic preservation is much higher than in the underlying upper Jurassic interval. Based on the lack of fluvial propagation and high marine inundation, we are likely back in a Phase 0 to 1 of basin filling. One could argue that a Phase 1, early-filled basin (where F approaches and even briefly exceeds 1) occurred during select pulses throughout the Cretaceous where the fluvial and delta facies propagated further (Fig. 5b3) due to variations in uplift in time and space. But any grain size fining would likely still be subsidence-dominated on account of the low F associated with active mountain building. Mossop and Shetsen (1994) argue for high variability in the fluvial front and the extent of marine inundation events throughout the Cretaceous, which is likely linked to sea-level oscillations.
By the end of the Cretaceous (i.e. above the Bearpaw Formation in Fig. 5a (gold)), the marine seaway retreated due to the increased sediment flux and reduced subsidence resulting both from the effective erosion of the mountain belt that limited its height and thus the resulting flexure. However, the sediment flux from the mountain continued to be high and comparable to the flexure-driven subsidence (Catuneanu, 2004). Thus, in the Uppermost Cretaceous and into the Tertiary (Fig. 5a gold and b2), the basin entered Phase 1–2, with the majority of the basin consistently above sea level and fluvial (dark green-mainly sandstone) sediments transported over very long distances. Subsidence generally continued at a reduced pace during most of the Mesozoic and Cenozoic (see Fig. 5a), most likely in response to the load of the sediment, and allowing for the preservation of strata (Mossop and Shetsen, 1994; Leckie and Smith, 1992) and, thus, with F values comprised between 1 and 10, indicating a potential combination of subsidence and autogenic/transient control on fining.
Finally, during the Quaternary period the system entered what can be considered Phase 3 in the foreland basin evolution with strong bypass (F>10) or erosion (Fig. 5a). Quaternary deposition is limited to the outer basin in Saskatchewan (Mossop and Shetsen, 1994). The modern topography of the central-southern Alberta Basin is high near the orogenic front (700–1000 m) with ample slope (promoting channel mobility and a thick active layer), which, with the small β value, promotes a high autogenic influence on grain size fining. The modern fans developing at the surface of the Alberta Basin have been described as being dominated by internal processes (Campbell, 1998) and are therefore likely to be in a autogenic-dominated fining regime.
To examine a range of foreland basin evolution spanning low- to high-bypass regimes (F>100), we implemented a compressed (200 km), time-accelerated (20 Myr) basin evolution in our model simulations in which scaling K and U produced orogen elevations from 1000 to 10 000 m. While this approach offers an idealized overview of foreland basin evolution, it differs from the Alberta Basin in a number of ways. Some of these include, changes in base level over time (Mossop and Shetsen, 1994), spatial and temporal variations in erodibility in the mountain area due to localized igneous and metamorphic lithologies (Monger and Price, 2002), and the N–S diachronous evolution of the collision (Mossop and Shetsen, 1994). Thus, simulation time (1 Myr) should not be directly equated to Alberta Basin stratigraphy in terms of timing or thickness.
Keeping these complexities in mind, we can further estimate key model inputs (G, K, and flexure wavelength/α) and parameters (β) for the Alberta Basin that have not already been as fully discussed as F. A global compilation by Guerit et al. (2019) suggests that systems tend to favour a slight transport limitation (laboratory median of G=0.7), with common values of G ranging from 0 to 3.1. The response time and K are also difficult to constrain due to lateral growth of the mountain by terrane accretion of varied lithologies over the basin's long lifespan, exceeding 100 Myr (Mossop and Shetsen, 1994). Episodic high uplift events, such as during the 100–99 Ma Viking Formation, show spatially variable sedimentary responses across the basin, with downstream sediment infilling in some areas but not others (Peper, 1993), indicating that the system's response time exceeds 1 Myr. The parameter is one of the dominant controls on response time (see equations in Braun, 2022; Braun et al., 2015), resulting in estimates of K on the order of 10−7 to 10−8 m1–2 m yr−1 with response time estimates of 10–100 Myr (based on the above descriptions). Elastic plate thickness in the Alberta foreland basin is estimated at 20–60 km, yielding a flexural wavelength λ of 274–739 km, assuming a lithosphere–asthenosphere density contrast (Δp) of 500 kg m−3 (Flück et al., 2003). The adjacent craton, 60–150 km e-thickness, produces longer flexural wavelengths >739 km (Flück et al., 2003). Early in basin evolution, limited sediment cover and a thick cratonic basement (Gordy and Frey, 1977) likely led to a rigid, long-wavelength system (Flemings and Jordan, 1989), suggesting a potential rigid-end α range (e.g. 0.2–0.5).
Evidence suggests a value of for the Western Canada foreland basin, more consistent with Fig. 3 than Fig. 4, due to the rain shadow effect and the large downstream basin relative to the orogen. Recall the relationship (Wild et al., 2025c), where β can be derived from a ratio of orogen vs basin precipitation and length. Satellite imagery and paleogeographic maps (Mossop and Shetsen, 1994) show the Canadian Rockies as a series of ranges approximately 50–200 km wide, while the foreland basin spans on the order of +1000 km, bounded to the east by the Canadian Shield. Precipitation data (1971–2000) indicate 300–1500 mm yr−1 over the orogen and 300–500 mm yr−1 across the basin (Rivera and Calderhead, 2022), resulting in an orogen that is ∼2–3 times wetter. Keep in mind that Cretaceous seaways (e.g. Fig. 5) may have increased basin moisture and reduced the rain shadow effect, while aridification may have enhanced precipitation gradients. Using modern averages, can be estimated around 0.2 to 0.4.
5.2 Autogenic-dominated example: the Cadomin Formation
The early Cretaceous Cadomin Formation is described in areas as a megafan similar to the Kosi Fan, India, but with coarser grain sizes (e.g. on average 1–3 cm gravels clasts that reach up to a maximum of 40 cm, McLean, 1977) and with some preserved evidence of autogenic dynamics (Leckie and Cheel, 1997). Amalgamation, frequent shifting, and bank cutting of channels that have been described within the stratigraphy (Leckie and Cheel, 1997) match our stratigraphic results of an autogenic-dominated fining system under very high bypass with reworking (Fig. 2). However, recent work has identified terraces in the upper basin that are preserved in the stratigraphy (Johnson and Dalrymple, 2019) and are indicative of aggrading and incision pulses (similar to our depositional divergence) during this period, which have been interpreted as related to climate cyclicity. This alternation of well-sorted and poorly sorted episodes within the conglomerate has been described as a potential series of inter-flood episodes characterized by reworking and flood episodes without time for sorting (Johnson and Dalrymple, 2019). Banded argillic horizons within the soil deposits are also evidence of climate seasonality (Johnson and Dalrymple, 2019; Jablonski and Dalrymple, 2016) around this time that may impact the grain size signal.
We propose that the Cadomin Fm would be located in the lower-right corner of the framework (Fig. 1) in the region with a low β and high F, where autogenic dynamics dominate the grain size record. We reiterate that the Cadomin Fm was deposited during a period of tectonic quiescence in the orogen collision and rebound in the basin (Leckie and Cheel, 1997; Johnson and Dalrymple, 2019), indicative of a high bypass F. We can also infer a generally low β value for the Cadomin Fm from (1) the extent of the basin (i.e. the orogen existed several hundreds of kilometres from the shoreline, Smith and Leckie, 1990), which is likely to be larger than the size of the orogen resulting in a lower β value; and (2) a generally semi-arid climate for Western Canada around the Jurassic–early Cretaceous transition, as indicated by the presence of silcrete in the paleosols (Leckie and Cheel, 1997; Leckie and Nadon, 1997; Ludvigson et al., 2015), which is the modern environments where steep fan to plain topography is observed (e.g. Mongolia). Furthermore, the system during the Cadomin clearly exhibits some reworking and variations in grain size (Johnson and Dalrymple, 2019) typical of the autogenic dominated regime described in Wild et al. (2025c) and shown in Fig. 2a.
Seasonality could also have impacted climatic gradients between the newly formed orogen and basin. It is possible that the efficiency of the autogenic dominated grain size fining during the Cadomin Formation may have fluctuated under a cyclic climate, with periods of enhanced precipitation in the mountain causing variations in β. Periods of enhanced precipitation in the mountain would have caused an increase in β and a decrease in surface slope, rugosity, and magnitude of autogenic processes (Wild et al., 2025c). This, in turn, would have decreased the grain size fining and caused the propagation of the coarse grain front further into the basin, as observed by Johnson and Dalrymple (2019) and previously interpreted as periods of intense flooding. We have shown that our approach to modelling and interpreting foreland basin evolution, including identifying when such basins may record autogenic dynamics based on spatial gradients and sediment bypass, can be applied to real mountain belts. We suggest that this framework could be useful for analyzing other foreland basins at different stages of evolution.
Our new GravelScape model can be used to help interpret grain size distributions within the stratigraphy of foreland basins. In particular, we have shown the following:
-
Grain size fining evolves in a foreland basin by transitioning from an under-filled regime (Phase 0) to a subsidence-dominated regime (Phase 1), a mixed (subsidence and transient/autogenic) regime (Phase 2), and a final bypass autogenic-dominated regime (Phase 3).
-
Grain size fining can tell us a lot about the basin dynamics and, in particular, that (1) coarsening upwards with decreasing stratigraphic thickness (increasing F) is one of the clearest indications of a subsidence dominated basin (Phase 1 in Fig. 3); (2) a system that shows consistent fining with no coarsening upwards despite decreasing stratigraphic thickness (increasing F) is likely dominated by autogenic/transient fining or a combination of subsidence and autogenic fining (Phase 2 and 3 in Fig. 3); and (3) a system with little to no fining under high bypass (Fig. 4) is characterized by a long transport length of sediment (i.e. high β or low G) and little autogenic-dynamic-induced grain size fining.
-
Increasing depositional variance within the basin, reduced channel mobility, increased reworking/rugosity, the presence of unconformities, and increasing floodplain area all indicate a transition into a high bypass and autogenic-dominated grain size regime.
-
During periods of subsidence-dominated grain size fining (Phase 1 and 2), variations in sedimentary flux in response to external forcings are likely to cause spatial and temporal variations in grain size fining in response to a changing F value (as demonstrated by Armitage et al., 2011); we have also shown that in periods of autogenic-dominated grain size fining, climatic events can be recorded through the effect they will have on the value of β, which strongly influences the efficiency of autogenic-dominated grain size fining, as seen in the Cadomin Formation.
Further work is, however, needed to disentangle the relative importance of subsidence and autogenic processes in preserving or “shredding” the grain size information recorded in foreland basin stratigraphy.
The GravelScape source code and example Python applications are available at https://doi.org/10.5281/zenodo.15641112 (Wild et al., 2025a). GravelScape code also depends on LEM repositories: Bovy and Lange (2023) Fastscape v0.10, available at https://doi.org/10.5281/zenodo.8375653, and Bovy et al. (2023) Fastscape-fortran v2.8, available at https://doi.org/10.5281/zenodo.8392416.
Numerical modelling results and example notebooks are available at https://doi.org/10.5281/zenodo.15641112 (Wild et al., 2025a). Descriptions, plots, and data on the Alberta Basin are provided in the Geological Atlas of the Western Canada Sedimentary Basin (Mossop and Shetsen, 1994). No further data sets were used in this article.
A video demonstration of the GravelScape grain size fining model with an uplifting orogen and a subsiding (imposed) basin is available at https://doi.org/10.5446/70575 (Wild, 2025).
ALW: conceptualization, formal analysis, investigation, methodology, software, validation, visualization, writing (original draft preparation), writing (review and editing). JB: supervision, resources, software, conceptualization, methodology, validation, visualization, writing (original draft preparation), and writing (review and editing). ACW: supervision, conceptualization, methodology, validation, and writing (review and editing). SC: supervision, conceptualization, and writing (review and editing).
The contact author has declared that none of the authors has any competing interests.
Publisher’s note: Copernicus Publications remains neutral with regard to jurisdictional claims made in the text, published maps, institutional affiliations, or any other geographical representation in this paper. While Copernicus Publications makes every effort to include appropriate place names, the final responsibility lies with the authors.
The authors thank Benoit Bovy for general help with xarray-simlab and FastScape curation. We would also like to thank Charlotte Fillon for her comments during committee meetings and the earlier phases of this research. We would also like to thank scientists within the Earth Surface Process Modelling Section at the GFZ Potsdam and members of the S2S-Future Marie Curie ITN for their general feedback and discussions. Finally, we would like to thank Randy Enkin and members of the Pacific Geoscience Center for their general discussions and recommending the Geological Atlas of the Western Canada Sedimentary Basin.
This research has been supported by the EU Horizon 2020 (grant no. 860383).
The article processing charges for this open-access publication were covered by the GFZ Helmholtz Centre for Geosciences.
This paper was edited by Kieran Dunne and reviewed by Eric Barefoot and three anonymous referees.
Allen, P. A. and Densmore, A.: Sediment flux from an uplifting fault block, Basin Res., 12, 367–380, 2000. a, b
Allen, P. A. and Homewood, P.: Foreland basins, John Wiley & Sons, 368 pp., 2009. a, b
Allen, P. A., Armitage, J. J., Carter, A., Duller, R. A., Michael, N. A., Sinclair, H. D., Whitchurch, A. L., and Whittaker, A. C.: The Qs problem: Sediment volumetric balance of proximal foreland basin systems, Sedimentology, 60, 102–130, https://doi.org/10.1111/sed.12015, 2013. a, b
Armitage, J. J., Duller, R. A., Whittaker, A. C., and Allen, P. A.: Transformation of tectonic and climatic signals from source to sedimentary archive, Nat. Geosci., 4, 231–235, https://doi.org/10.1038/ngeo1087, 2011. a, b, c, d, e
Armitage, J. J., Jones, T. D., Duller, R. A., Whittaker, A. C., and Allen, P. A.: Temporal buffering of climate-driven sediment flux cycles by transient catchment response, Earth Planet. Sc. Lett., 369, 200–210, 2013. a, b
Beaumont, C.: Foreland basins, Geophys. J. Int., 65, 291–329, 1981. a, b, c, d, e, f
Bovy, B.: fastscape-lem/fastscape: Release v0.1.0beta3, Zenodo, https://doi.org/10.5281/zenodo.4435110, 2021.
Bovy, B., Braun, J., Glerum, A., and Wolf, S.: fastscape-lem/fastscapelib-fortran: Release v2.8 (v2.8.4), Zenodo [code], https://doi.org/10.5281/zenodo.8392416, 2023. a, b
Bovy, B. and Lange, R.: fastscape-lem/fastscape: Release v0.1.0 (0.1.0), Zenodo [code], https://doi.org/10.5281/zenodo.8375653, 2023. a
Braun, J.: Comparing the transport-limited and ξ–q models for sediment transport, Earth Surf. Dynam., 10, 301–327, https://doi.org/10.5194/esurf-10-301-2022, 2022. a, b, c, d, e, f
Braun, J., Voisin, C., Gourlan, A. T., and Chauvel, C.: Erosional response of an actively uplifting mountain belt to cyclic rainfall variations, Earth Surf. Dynam., 3, 1–14, https://doi.org/10.5194/esurf-3-1-2015, 2015. a
Campbell, C.: Postglacial evolution of a fine-grained alluvial fan in the northern Great Plains, Canada, Palaeogeogr. Palaeocl., 139, 233–249, 1998. a
Cant, D. J. and Stockmal, G. S.: The Alberta foreland basin: relationship between stratigraphy and Cordilleran terrane-accretion events, Can. J. Earth Sci., 26, 1964–1975, 1989. a
Catuneanu, O.: Retroarc foreland systems- evolution through time, J. Afr. Earth Sci., 38, 225–242, 2004. a, b, c
Catuneanu, O.: First-order foreland cycles: Interplay of flexural tectonics, dynamic loading, and sedimentation, J. Geodynam., 129, 290–298, 2019. a
Covey, M.: The evolution of foreland basins to steady state: evidence from the western Taiwan foreland basin, Foreland Basins, 77–90, https://doi.org/10.1002/9781444303810.ch4, 1986. a
Davy, P. and Lague, D.: Fluvial erosion/transport equation of landscape evolution models revisited, J. Geophys. Res.-Earth, 114, F03007, https://doi.org/10.1029/2008JF001146, 2009. a
DeCelles, P. G. and Giles, K. A.: Foreland basin systems, Basin Res., 8, 105–123, 1996. a, b
Duller, R., Whittaker, A., Fedele, J., Whitchurch, A., Springett, J., Smithells, R., Fordyce, S., and Allen, P.: From grain size to tectonics, J. Geophys. Res.-Earth, 115, F03022, https://doi.org/10.1029/2009jf001495, 2010. a, b, c, d, e, f
Fedele, J. J. and Paola, C.: Similarity solutions for fluvial sediment fining by selective deposition, J. Geophys. Res.-Earth, 112, F02038, https://doi.org/10.1029/2005jf000409, 2007. a, b, c, d, e
Flemings, P. B. and Jordan, T. E.: A synthetic stratigraphic model of foreland basin development, J. Geophys. Res.-Sol. Ea., 94, 3851–3866, 1989. a, b, c, d, e, f
Flück, P., Hyndman, R., and Lowe, C.: Effective elastic thickness Te of the lithosphere in western Canada, J. Geophys. Res.-Sol. Ea., 108, https://doi.org/10.1029/2002JB002201, 2003. a, b, c
Ganti, V., Straub, K. M., Foufoula‐Georgiou, E., and Paola, C.: Space‐time dynamics of depositional systems: Experimental evidence and theoretical modeling of heavy‐tailed statistics, J. Geophys. Res.-Earth, 116, F02011, https://doi.org/10.1029/2010jf001893, 2011. a
García-Castellanos, D., Fernàndez, M., and Torné, M.: Numerical modeling of foreland basin formation: a program relating thrusting, flexure, sediment geometry and lithosphere rheology, Comput. Geosci., 23, 993–1003, 1997. a, b
Gordy, P. L. and Frey, F. R.: Geology of the Rocky Mountains and Foothills of Alberta, B. Can. Petrol. Geol., 25, 1–11, 1977. a, b
Guerit, L., Yuan, X.-P., Carretier, S., Bonnet, S., Rohais, S., Braun, J., and Rouby, D.: Fluvial landscape evolution controlled by the sediment deposition coefficient: Estimation from experimental and natural landscapes, Geology, 47, 853–856, https://doi.org/10.1130/g46356.1, 2019. a
Gérard, B., Rouby, D., Huismans, R. S., Robin, C., Fillon, C., and Braun, J.: Impact of Inherited Foreland Relief on Retro-Foreland Basin Architecture, J. Geophys. Res.-Sol. Ea., 128, e2022JB024967, https://doi.org/10.1029/2022jb024967, 2023. a, b
Hajek, E. A. and Straub, K. M.: Autogenic sedimentation in clastic stratigraphy, Annu. Rev. Earth Pl. Sc., 45, 681–709, https://doi.org/10.1146/annurev-earth-063016-015935, 2017. a
Harries, R. M., Kirstein, L. A., Whittaker, A. C., Attal, M., and Main, I.: Impact of recycling and lateral sediment input on grain size fining trends–Implications for reconstructing tectonic and climate forcings in ancient sedimentary systems, Basin Res., 31, 866–891, https://doi.org/10.1111/bre.12349, 2019. a
Humphrey, N. and Heller, P.: Natural oscillations in alluvial basins: Implications for sequence stratigraphy and seismic interpretation, Geology, 23, 431–434, 1995. a
Jablonski, B. V. and Dalrymple, R. W.: Recognition of strong seasonality and climatic cyclicity in an ancient, fluvially dominated, tidally influenced point bar: Middle McMurray Formation, Lower Steepbank River, north-eastern Alberta, Canada, Sedimentology, 63, 552–585, 2016. a
Johnson, D. and Beaumont, C.: Preliminary results form a planform kinematic model of orogen evolution, surface processes and the development of clastic foreland basin stratigraphy, Stratigraphic evolution of foreland basins, https://doi.org/10.2110/pec.95.52.0003, 1995. a, b
Johnson, M. F. and Dalrymple, R. W.: Alluvial terracing in a falling-stage braidplain: the lower Cretaceous Cadomin Formation, west-central Alberta, Canada, J. Sediment. Res., 89, 701–727, 2019. a, b, c, d, e, f, g, h
Leckie, D. A. and Cheel, R.: Sedimentology and depositional history of Lower Cretaceous coarse-grained elastics, southwest Alberta and southeast British Columbia, B. Can. Petrol. Geol., 45, 1–24, 1997. a, b, c, d, e, f
Leckie, D. A. and Nadon, G. C.: Evolution of Fluvial Landscapes in the Western Canada Foreland Basin: Late Jurassic to the Modern, Natural Resources Canada, Geological Survey of Canada, Open File, 3555. https://doi.org/10.4095/209372, 1997. a
Leckie, D. A. and Smith, D. G.: Regional setting, evolution, and depositional cycles of the Western Canada Foreland Basin: Chapter 1, Vol. 55, https://doi.org/10.1306/M55563C2, 1992. a, b
Leonard, J. S., Whipple, K. X., and Heimsath, A. M.: Isolating climatic, tectonic, and lithologic controls on mountain landscape evolution, Sci. Adv., 9, eadd8915, https://doi.org/10.1126/sciadv.add8915, 2023. a
Ludvigson, G., Joeckel, R., Murphy, L., Stockli, D., González, L., Suarez, C., Kirkland, J., and Al-Suwaidi, A.: The emerging terrestrial record of Aptian-Albian global change, Cretaceous Res., 56, 1–24, 2015. a
McLean, J.: The Cadomin Formation: stratigraphy, sedimentology, and tectonic implications, B. Can. Petrol. Geol., 25, 792–827, 1977. a, b, c, d
Monger, J. and Price, R.: The Canadian Cordillera: geology and tectonic evolution, CSEG Recorder, 27, 17–36, 2002. a, b
Mossop, G. and Shetsen, I.: Geological atlas of the Western Canada sedimentary basin, Canadian Society of Petroleum Geologists and Alberta Research Council, https://ags.aer.ca/reports/atlas-western-canada-sedimentary-basin (last access: 26 May 2025), 1994. a, b, c, d, e, f, g, h, i, j, k, l, m, n
Naylor, M. and Sinclair, H.: Pro- vs. retro-foreland basins, Basin Research, 20, 285–303, https://doi.org/10.1111/j.1365-2117.2008.00366.x, 2008. a, b, c
Peper, T.: Quantitative subsidence analysis of the Western Canada foreland basin with implications for short-term facies changes, Tectonophysics, 226, 301–318, 1993. a
Poulton, T., Tittemore, J., and Dolby, G.: Jurassic strata of northwestern (and west-central) Alberta and northeastern British Columbia, B. Can. Petrol. Geol., 38, 159–175, 1990. a
Price Jr., W. E.: Simulation of alluvial fan deposition by a random walk model, Water Resour. Res., 10, 263–274, https://doi.org/10.1029/WR010i002p00263, 1974. a, b
Rivera, A. and Calderhead, A. I.: Glacial melt in the Canadian Rockies and potential effects on groundwater in the plains region, Water, 14, 733, https://doi.org/10.3390/w14050733, 2022. a
Scheingross, J. S., Limaye, A. B., McCoy, S. W., and Whittaker, A. C.: The shaping of erosional landscapes by internal dynamics, Nat. Rev. Earth Environ., 1, 661–676, https://doi.org/10.1038/s43017-020-0096-0, 2020. a
Sinclair, H., Coakley, B., Allen, P., and Watts, A.: Simulation of foreland basin stratigraphy using a diffusion model of mountain belt uplift and erosion: an example from the central Alps, Switzerland, Tectonics, 10, 599–620, 1991. a, b, c
Smith, D. and Leckie, D.: The Paleogeographic Evolution of the Western Canada Foreland Basin, B. Can. Petrol. Geol., 38, 181–181, 1990. a
Tucker, G. and van Der Beek, P.: A model for post-orogenic development of a mountain range and its foreland, Basin Res., 25, 241–259, 2013. a
Turcotte, D. L. and Schubert, G.: Geodynamics, Cambridge University Press, https://www.cambridge.org/highereducation/books/geodynamics/E0E847DA9FE68BDB90C2E457791F0C98?utm_campaign=shareaholic&utm_medium=copy_link&utm_source=bookmark (last access: 26 May 2025), 2014. a, b
White, J. M. and Leckie, D. A.: Palynological age constraints on the Cadomin and Dalhousie formations in SW Alberta, B. Can. Petrol. Geol., 47, 199–222, 1999. a, b
Whittaker, A. C., Duller, R. A., Springett, J., Smithells, R. A., Whitchurch, A. L., and Allen, P. A.: Decoding downstream trends in stratigraphic grain size as a function of tectonic subsidence and sediment supply, Geol. Soc. Am. Bull., 123, 1363–1382, https://doi.org/10.1130/b30351.1, 2011. a, b
Wild, A.: Grain size dynamics using a new planform model, TIB AV [video], https://doi.org/10.5446/70575, 2025. a
Wild, A., Braun, J., and Bovy, B.: fastscape-lem/GravelScape: GravelScape, Zenodo [code], https://doi.org/10.5281/zenodo.15641112, 2025a. a, b
Wild, A. L., Braun, J., Whittaker, A. C., and Castelltort, S.: Grain size dynamics using a new planform model – Part 1: GravelScape description and validation, Earth Surf. Dynam., 13, 875–887, https://doi.org/10.5194/esurf-13-875-2025, 2025b. a, b, c, d, e, f, g, h, i, j, k
Wild, A. L., Braun, J., Whittaker, A. C., Prieur, M., and Castelltort, S.: Grain size dynamics using a new planform model – Part 2: Determining the relative control of autogenic processes and subsidence, Earth Surf. Dynam., 13, 889–905, https://doi.org/10.5194/esurf-13-889-2025, 2025b. a, b, c, d, e, f, g, h, i, j, k, l, m, n, o, p, q, r, s, t, u, v, w, x, y, z, aa, ab, ac, ad, ae
Yuan, X. P., Braun, J., Guerit, L., Rouby, D., and Cordonnier, G.: A New Efficient Method to Solve the Stream Power Law Model Taking Into Account Sediment Deposition, J. Geophys. Res.-Earth, 124, 1346–1365, https://doi.org/10.1029/2018jf004867, 2019. a
- Abstract
- Introduction
- Methods
- Imposed subsidence stratigraphic end members
- Fully coupled foreland basin evolution
- Application to a case example: the Alberta Basin
- Conclusions and future work
- Code availability
- Data availability
- Video supplement
- Author contributions
- Competing interests
- Disclaimer
- Acknowledgements
- Financial support
- Review statement
- References