the Creative Commons Attribution 4.0 License.
the Creative Commons Attribution 4.0 License.
 | 18 Feb 2026
New outdoor experimental river facility to study river dynamics
Basem M. M. Mahmoud
Emily Dickson
André Renault
Mélanie Trudel
Pascale M. Biron
Leonard S. Sklar
Jay Lacey
The Outdoor Experimental River Facility (OERF) is a new large-scale, semi-natural research facility designed to study river dynamics at scales that bridge small laboratory models and natural rivers. The facility comprises a 50 m long, 20 m wide floodplain corridor and is designed to sustain discharges up to 800 L s−1, allowing subcritical, fully rough flow with field-like Reynolds numbers approaching 105 – beyond values typical of small-scale planform experiments constrained by Froude similarity. This paper reports the first of three planned experimental campaigns at the OERF, providing a foundational assessment of facility capabilities and operational constraints to guide subsequent sinuous and vegetated experiments with sediment recirculation. In an initial 338 h (∼ 14 d) straight-channel run without upstream sediment supply, a bi-modal gravel–sand bed (initial median diameter = 10 mm) progressively armoured to ∼ 22 mm, and reach-scale planform change remained modest despite a width-to-depth ratio of 12 and near-threshold mobility. A three-phase, mathematically designed inlet bar–pool perturbation increased local velocities by 8 %–27 % and produced limited lateral bank erosion (∼ 2.5–7.5 cm). The results delineate a narrow operational window for sustained bar growth and migration, long adjustment times, practical constraints of outdoor operation, and the moderating role of bank-material strength and toe armouring. Together, these findings show that field-like hydraulics are achievable within the facility while clarifying what limits mobility at this scale, and they motivate future experiments that couple hydrodynamic similarity with controlled sediment recirculation/feed and refined boundary controls to advance understanding of controls on bank erosion and planform evolution.
- Article
(9852 KB) - Full-text XML
- BibTeX
- EndNote


Rivers shape landscapes over geologic time-scales (Wohl, 2020; Sklar, 2024), which on human time-scales, can threaten infrastructure and ecosystems through erosion and flooding (Wohl, 2010; Smith, 2020). Predicting reach-scale planform dynamics such as riverbank erosion and channel migration rates remains difficult (Saadon et al., 2021), since evolution depends on many coupled processes such as flow dynamics, sediment transport and sorting, and bank strength and failure processes (Kleinhans et al., 2024). Existing models cannot capture all these relevant processes that emerge from transient, and multi-scale feedback often acting near thresholds and under highly variable conditions (Church and Ferguson, 2015; Zhao et al., 2022). This persistent challenge has motivated a research philosophy of process-based investigation that spans diverse approaches (e.g., field monitoring, physical modelling, and numerical simulation) and at scales that range from small laboratory water tables to field-scale experiments (Paola et al., 2009). Some of these processes, such as sediment sorting and cohesive effects are scale-dependent, and are inherently difficult to study at planform scale with existing facilities (Kleinhans et al., 2014, 2024).
In order to preserve the similarity of the processes affecting planform evolution, researchers have moved from conventional engineering scaling, which is unfeasible, to more effective relaxed scaling requirements (Paola et al., 2009; Kleinhans et al., 2014, 2024). These experiments typically aim to: (1) maintain the relevant flow regime (typically subcritical flow, appropriate for investigations of morphological features such as alternate bars); (2) ensure sediment is mobile at the intended transport stage and mode (e.g., bedload vs. suspension, partial vs. full mobility); and (3) achieve the right hydraulic resistance regime at the boundaries (e.g., hydraulically rough bed vs. viscosity-dominated). To simultaneously satisfy these requirements at reduced scales, researchers often force deliberate distortions, such as vertical exaggeration, steepened channel slope, or the use of lightweight sediment (Gorrick and Rodríguez, 2014), each of which can alter flow dynamics or sediment transport (e.g., Ashworth et al., 1996; Lu et al., 2013; Kleinhans et al., 2015).
Studying planform evolution processes at reduced scale commonly challenges simultaneous satisfaction of these scaling rules, especially with evolving bed and banks. Most physical modelling experiments with erodible boundaries are conducted in small-scaled laboratory flumes (Métivier et al., 2017; Phillips et al., 2022). These models typically feature streams with depths less than 10 cm, median grain sizes (D50) less than 10 mm, widths less than 1 m, and discharges on the order of 10 L s−1. In such setups, a hydraulically rough bed can conflict with the need for sufficient sediment mobility (Kleinhans et al., 2014). Many experiments therefore end up bedload-dominated and thus behave morphodynamically more like gravel-bed rivers (e.g., Van Dijk et al., 2012), while scarcely representing suspension-dominated sand-bed rivers. This limitation is more evident for floodplain flow when flow depth is shallower than 1 cm (e.g., Braudrick et al., 2009) which is likely laminar. Accordingly, floodplain construction and bank strength that strongly depend on fine-sediment exchange and overbank deposition tend to be under-represented in small-scale experimentation (Lajeunesse et al., 2010).
Investigating scale-dependent processes requires larger-scale research, which is challenging. Bank erosion is governed by near-bank stresses and turbulence structure that contribute to sequences of toe scour, undercutting, and mass failure (Simon et al., 2000; Engel and Rhoads, 2017; Das et al., 2019). For example, Roy et al. (2020) observed in controlled undercut experiments that near-bank turbulence intensities peak within the most eroded zone, highlighting how turbulence strength (i.e., at sufficiently high Reynolds number) can govern bank erosion rates. In gravel-bed rivers, for example, the near-boundary entrainment is dominated by turbulent stresses, and the forcing experienced by banks and bed grains is mediated by large, energetic flow structures rather than by mean flow alone (Roy et al., 2004; Nikora, 2007). Biota (e.g., vegetation and microbial effects) and cohesion play a vital role in controlling bank erosion (van Dijk et al., 2013; Vignaga et al., 2013). These effects are scale-dependent and difficult to represent at small scales. As stated by Kleinhans et al. (2014, p. 44), “no convenient theory is available to scale bank erosion rate and floodplain sedimentation”. These challenges make meandering experiments typically more demanding to sustain than braided patterns (e.g, Peakall et al., 2007; Braudrick et al., 2009). Furthermore, sediment sorting can be scale-dependent. Not only does scaling down a gravel-sand mixture often force the finer fraction into the silt-clay range, but viscous effects can then dominate the transport, inhibiting the non-cohesive sorting and armouring processes that are naturally dominant at the prototype scale (Hassan et al., 2024). These dependencies do not imply that low Reynolds number experiments are unrepresentative in general (Paola et al., 2009), rather, they identify specific mechanisms (particularly those tied to flow anisotropy, intermittency, turbulence structure, secondary circulation, bank material strength, and bank–floodplain exchange) for which regime fidelity becomes more essential.
Despite the importance of large-scale experiments for studying scale-sensitive processes in river morphodynamics, there are only a few large-scale experimental flume channels available. The Outdoor StreamLab (OSL) at the St. Anthony Falls Laboratory (SAFL) in Minnesota, USA (operational since 2008), offers a 40 m × 20 m basin with a meandering sand-bed stream, enabling for example detailed studies of sediment transport and flow-vegetation interactions under controlled yet field-like conditions (UMN-CSE, 2023; Métivier et al., 2016). The River Experiment Center (REC) at the Korea Institute of Civil Engineering and Building Technology (KICT) in Andong, South Korea (established in 2009), features three prototype channels, each approximately 600 m long, facilitating large-scale experiments on flow patterns, sediment transport, and hydraulic structure stability (KICT, 2023; Han et al., 2019). The Aqua Restoration Research Center (ARRC) in Kakamigahara City, Japan (operational since 1998), includes three 800 m long experimental streams designed to simulate natural river conditions (PWRI-NRDA, 2023). Together, these facilities have deepened our understanding of rivers, resulting in more than 50 publications on a range of topics, as illustrated in Fig. 1. However, none of them allow for dynamic evolution of the river planform at a reach scale. Therefore, expanding and diversifying experimental facilities is crucial to accurately capture the complexity of river behaviors.
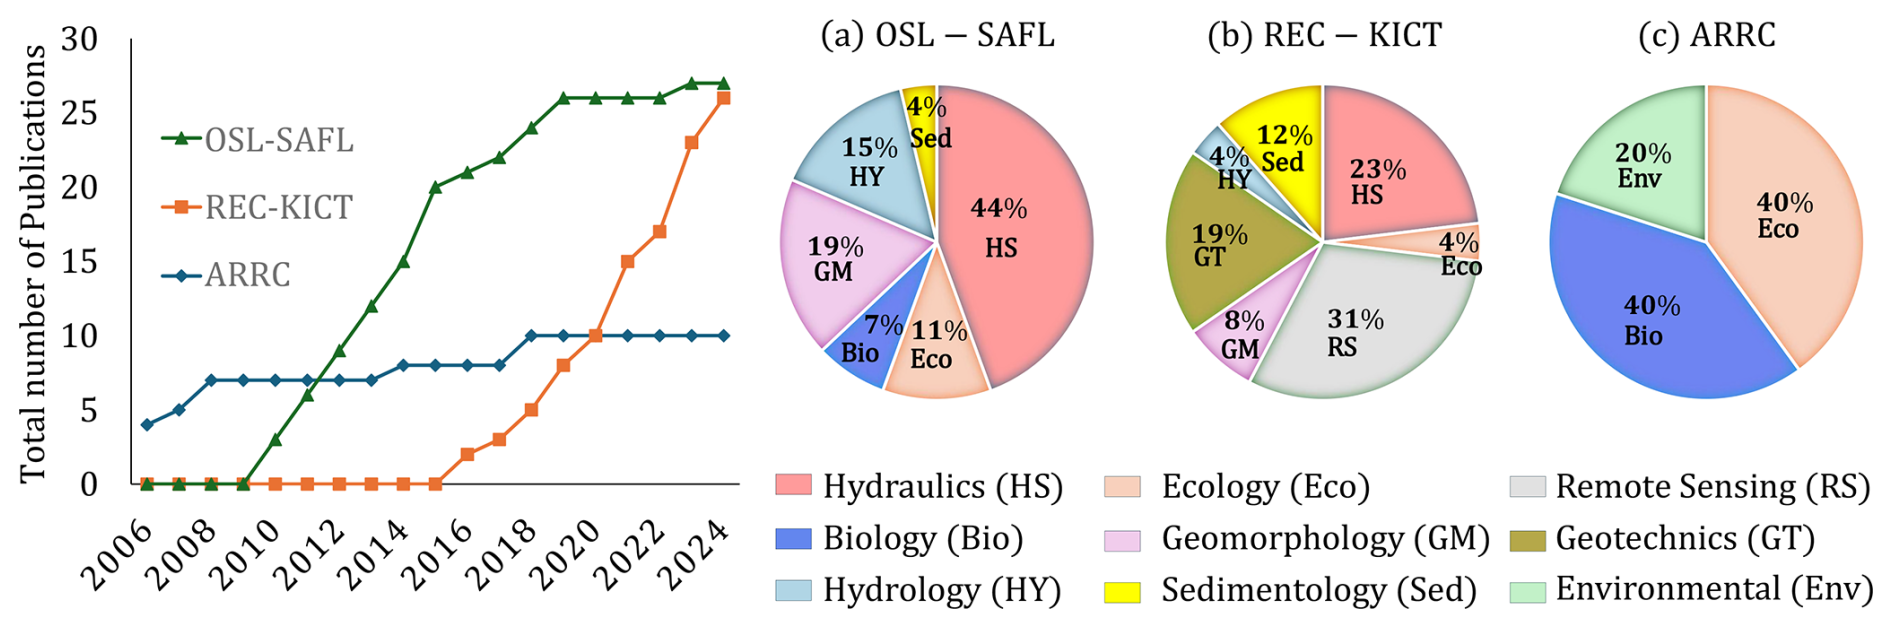
Figure 1Number of publications from the large-scaled outdoor experimental facilities: Outdoor StreamLab (OSL) at the St. Anthony Falls Laboratory (SAFL), River Experiment Center (REC) at the Korea Institute of Civil Engineering and Building Technology (KICT), and Aqua Restoration Research Center (ARRC), with categorized research fields contributions. Only English language articles published in journals with an impact factor greater than 1.5 according to the 2024 Clarivate Journal Citation Report are included.
At the Université de Sherbrooke, in Quebec, Canada, a large-scale river facility known as the Outdoor Experimental River Facility (OERF) has recently been constructed (operational since 2019) to help bridge the gap between field and laboratory-scale studies. This large-scale facility is unique in its ability to allow the banks to erode, allowing for natural processes of bank erosion and planform evolution to occur. This paper reports on the first of three planned experimental campaigns at the OERF, which together aim to isolate key controls on bank erosion and planform adjustment: (study 1) a straight channel with no sediment supply (this study); (study 2) a sinuous channel with sediment recirculation; and (study 3) a vegetated sinuous channel with sediment recirculation. We view this paper as a foundational exploration of the facility’s capabilities and operational challenges, providing essential lessons for the design of subsequent experiments, and sharing these capabilities with the broader research community. It is hoped that publicizing the OERF's capabilities will foster research partnerships to design and conduct future experimental campaigns. In this paper we: (1) introduce the design and capabilities of the OERF, and compare it to natural rivers and other facilities; (2) report the results of initial experiments in a straight channel configuration, including the effects of a novel bar perturbation; and (3) evaluate these results to illustrate opportunities and constraints of working at large scale. We frame the study around four themes relevant to large-scale experimentation: (i) the narrow operational window in parameter space for sustained bar building and lateral migration; (ii) the longer adjustment timescales of a large system and the transient evolution away from initial conditions; (iii) the challenges of an outdoor setting (e.g., seasonal algal growth, rainfall, wildlife); and (iv) the importance of bank-material strength and toe armouring for erosion.
2.1 Facility components
The OERF (Outdoor Experimental River Facility) is composed of four primary components: a main reservoir, an approach channel, a river-floodplain basin (50 m long and 20 m wide), and a sediment trap (Fig. 2). The OERF recirculating system stores up to 1500 m3 of water. Water is pumped from the main reservoir to the approach channel, which is designed to dissipate energy and reduce turbulence before the flow enters the river floodplain. A sharp-crested weir is situated at the transition between the approach channel and the floodplain, which can be used to measure flow. Once the water passes through the river floodplain, it flows into the main sediment trap before returning to the main reservoir.
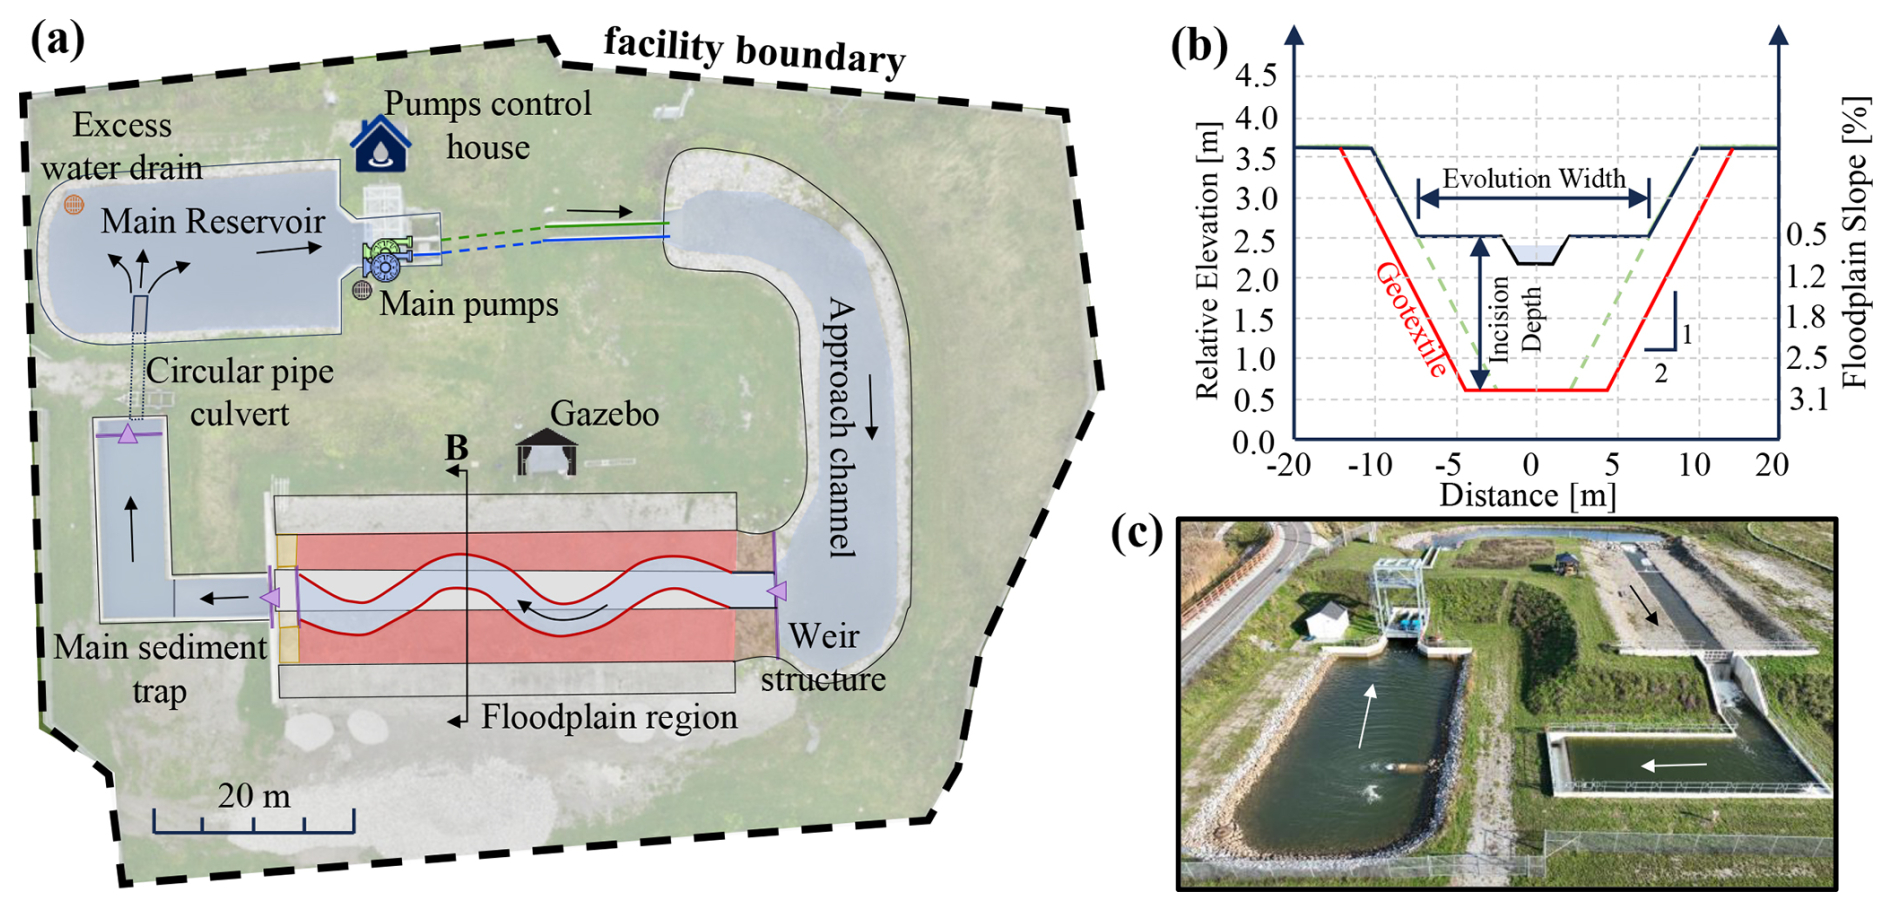
Figure 2The Outdoor Experimental River Facility Components. (a) Plan view, (b) distorted cross-section in the floodplain at 20 m upstream the river outlet, the potential evolution width and incision depth vary with floodplain slope shown on the secondary (right) y axis. Green dashed lines extend the design corridor side-slope, while the red line marks the geotextile boundary. (c) Oblique aerial drone photo of the facility.
The water circulation at the OERF is controlled from a pump house, with remote operation capabilities via a local WiFi network and emergency stop buttons located near the floodplain for safety. The water system is driven by two variable-speed 100 hp centrifugal pumps, which together can deliver a maximum flow rate of approximately 800 L s−1. The facility includes a dedicated bay for a third identical pump, enabling a future increase in capacity to about 1200 L s−1 without major civil works.
To maintain hydraulic equilibrium and prevent groundwater exchange, the reservoir, approach channel, and river region are lined with an impermeable geomembrane. In the river floodplain corridor, the membrane is buried beneath a substrate layer at least 1 m thick, which is composed of silt, sand, and gravel. The experimental corridor can accommodate various river geometries based on experimental designs and objectives. The corridor substrate and surface grain-size distribution are specified on a per-experiment basis.
Reconfiguring the bed from one experiment to the other typically involves (i) removing and stockpiling the existing substrate, (ii) placing a new substrate (either freshly delivered material or a processed fraction of the existing substrate), and, when needed, (iii) sieving and/or blending using heavy machinery (e.g., excavators and a rotary drum screener) under close guidance of the research team. Survey control (GNSS, total station, and laser levels) is used to set elevations and slopes, and ground marking is used to guide trenching of the designed channel. The heavy-machinery phase (substrate handling, rough grading, and placement of coarse protections) can be completed in up to 3 full days for a typical channel rebuild, while subsequent manual finishing (e.g., trimming banks and side slopes, detailing geomorphic features, or local surface conditioning) commonly requires from 1 to 2 weeks, depending on the required level of geometric detail; experiments involving vegetation establishment require longer preparation times. As the facility is not yet winterized, major reconfigurations are generally limited to one primary channel design per operating season (approximately April to November).
Both the inlet and outlet boundary conditions are implemented using temporary control structures (e.g., wooden weirs) that can be adjusted in elevation and geometry to meet experiment-specific targets (e.g., water-surface elevation, conveyance, and measurement configuration). The downstream control for the experiments reported here was managed using an adjustable sluice gate constructed from plywood logs, with the opening tuned to limit backwater effects in the study reach. To reduce sensitivity of the experimental reach to local scour/deposition at the boundaries, the bed near the inlet and near the outlet is locally protected with small sections of bed leveled riprap (with protection lengths adapted to the targeted discharge range and experimental objectives).
The facility is designed to accommodate sediment transport experiments with and without external sediment supply. The sediment recirculation system was under construction during the initial experiments presented in this paper, therefore sediments were not recirculated. The sediment-recirculation system will enable controlled reintroduction of a sediment–water mixture pumped from a smaller downstream sediment trap to the upstream inlet. The system will employs a 6 in. eductor (Model FFTLS14-6-D, Elmridge Jet Apparatus) driven by a secondary motive pump (20 hp); the eductor will use differential pressure to entrain sediment and water via a vertically oriented 3 in. suction pipe. The recirculation loop will be provisioned for instrumentation with manometers on the motive and suction lines and a flowmeter unit at the discharge line. At the outlet, both bedload and some suspended material will be captured with reinjection either in a highly mixed zone immediately downstream of the inlet weir or via a transverse manifold designed to normally distribute sediment across the channel width. This upgrade should be paired with equipment for quantifying supply (e.g., inline mass/flux monitoring) and for repeatable sampling of the injected mixture.
2.2 Data acquisition capabilities
The OERF is designed to allow the floodplain corridor to drain completely when the pumps are stopped, facilitating rapid and efficient data collection. Topographic data are acquired using multirotor UAVs capable of RGB photogrammetry (e.g., DJI Matrice 300 series), multispectral imaging (e.g., DJI Mavic 3 Multispectral), and LiDAR (e.g., Zenmuse L2). Ground-based elevation control and survey are obtained with GNSS-RTK receivers (e.g., Leica GS18) and a robotic total station (e.g., Leica Viva TS15); laser levels are used for rapid local elevation checks, slope adjustments, and instrument setup.
Hydrometric measurements are supported by pressure transducers for stage monitoring. Flow velocities within the channel are measured using either large-scale particle image velocimetry (LSPIV) from UAV video, electromagnetic current meters (ECM), acoustic Doppler velocimeters (ADV), or propeller-type current meters. Sediment-transport sampling infrastructure includes portable bedload samplers (e.g., Helley–Smith) and bedload traps (e.g., Bunte-type) deployable at selected cross-sections.
2.3 Comparison with natural rivers and existing facilities
As a large-scale outdoor facility, the OERF is situated between typical small-scale laboratory channels and natural rivers. The green shading in Fig. 3 shows a design envelope of feasible combinations of discharge, slope, median grain size, and channel width that can be configured within the facility limits. These combinations were computed from standard open-channel hydraulic relations, assuming a rectangular cross-section and normal depth (MATLAB code in the supplements).
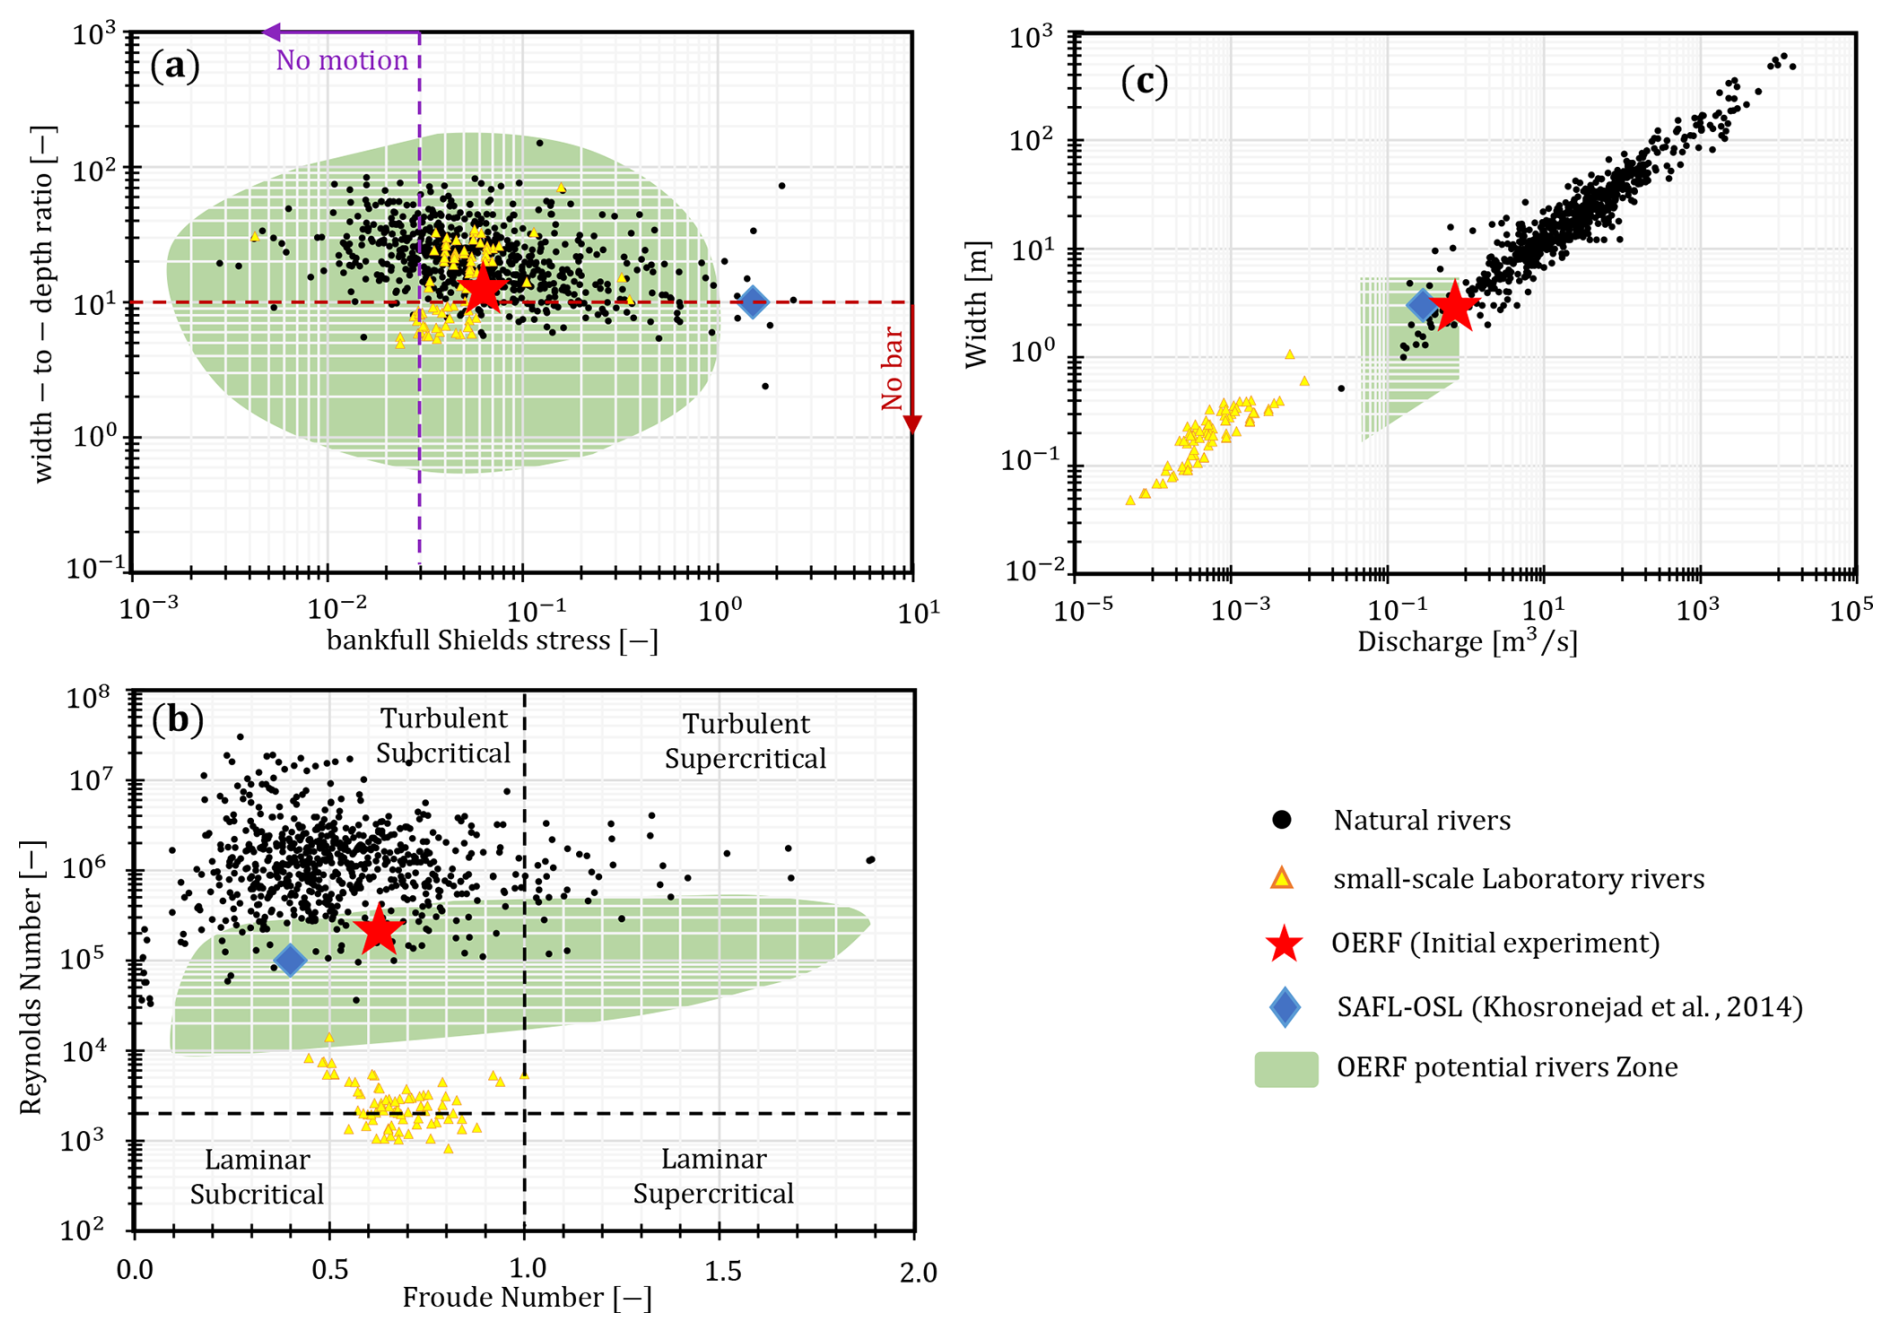
Figure 3OERF in comparison with other experimental facilities and natural rivers. (a) Width–to–depth ratio vs. bankfull Shields number, θ = ; no-motion guide line at θc = 0.03 for D50, representing the lower bound of visually defined incipient-motion thresholds in gravel-bed rivers (Buffington and Montgomery, 1997); No-bar guide line at = 10, below which free (periodic) alternate bars are not expected (Crosato and Mosselman, 2020). (b) Reynolds vs. Froude number with schematic regime quadrants. (c) Width vs. discharge. The green shaded area marks the range of OERF potential channels, constrained by current facility limits: discharge 50–800 L s−1, slope 0.1 %–3 %, median grain size D50 = 2–100 mm, channel width 0.2–5 m, and flow depth < 0.5 m. The envelope represents feasible design combinations; extreme bounds may not be possible simultaneously. Natural rivers dataset from Phillips et al. (2022), filtered to include only sand-bedded and gravel bed rivers. Laboratory small-scale rivers from Métivier et al. (2017). St. Anthony Falls Laboratory (SAFL) – Outdoor StreamLab (OSL) from Khosronejad et al. (2014).
Within this parameter space, researchers can use the OERF to work at meter-scale widths while maintaining field-like hydraulic similarity. Typical combinations yield turbulent, subcritical flows with Reynolds numbers clustered around Re∼ 105 and Froude numbers near Fr≈ 0.6. These values overlap the low-width corner of the natural-river data compilation (Re≈ 106) and extend beyond most small-scale facilities (Re≈ 103) while keeping Fr < 1 over most of the envelope. Scaling to larger rivers with Re≳ 106 would still require some relaxation of Reynolds similarity, but the present regime preserves the essential turbulent character at widths (0.2–5 m) and grain sizes (D50 = 2–100 mm).
Practical constraints make the current operational window narrower than the theoretical envelope. Pump capacity (Qmax≈ 800 L s−1), slope < 3 %, depth < 0.5 m, and available sediment sources limit D50 given the attainable combinations of velocity and depth. Outdoor operation adds expense, variability (e.g., algal growth, rainfall), and bank properties (roughness, strength) are more difficult to control than in a smaller flume. Consequently, only a subset of parameter combinations is currenlty practical for sustained runs.
Even with these constraints, the envelope reaches dimensionless regimes associated with bar formation and planform dynamics. Width-to-depth ratios span from single digits to on the order of 102 (median ≈ 16, max ≈ 221), and maximum bankfull Shields numbers approaching ≈ 1.45 at D50 of 2 mm. Thus, there exists a parameter space where the OERF can be configured to probe questions about scale-dependent processes. With the ability to sustain field-like Reynolds number on the order of 105, researchers are enabled to test bank erosion, near-bank turbulence, and migration processes under fully rough and turbulent conditions. The 50 m × 20 m corridor provides lateral accommodation to study secondary circulations and channel–floodplain exchange. Floodplain can be built from mixed sand-gravel substrates and, where desired, amended with fines and live vegetation. Bank strength can, therefore, evolve through root reinforcement and microbially mediated aggregation under outdoor conditions (sunlight, temperature, rainfall).
3.1 Design of initial experiments
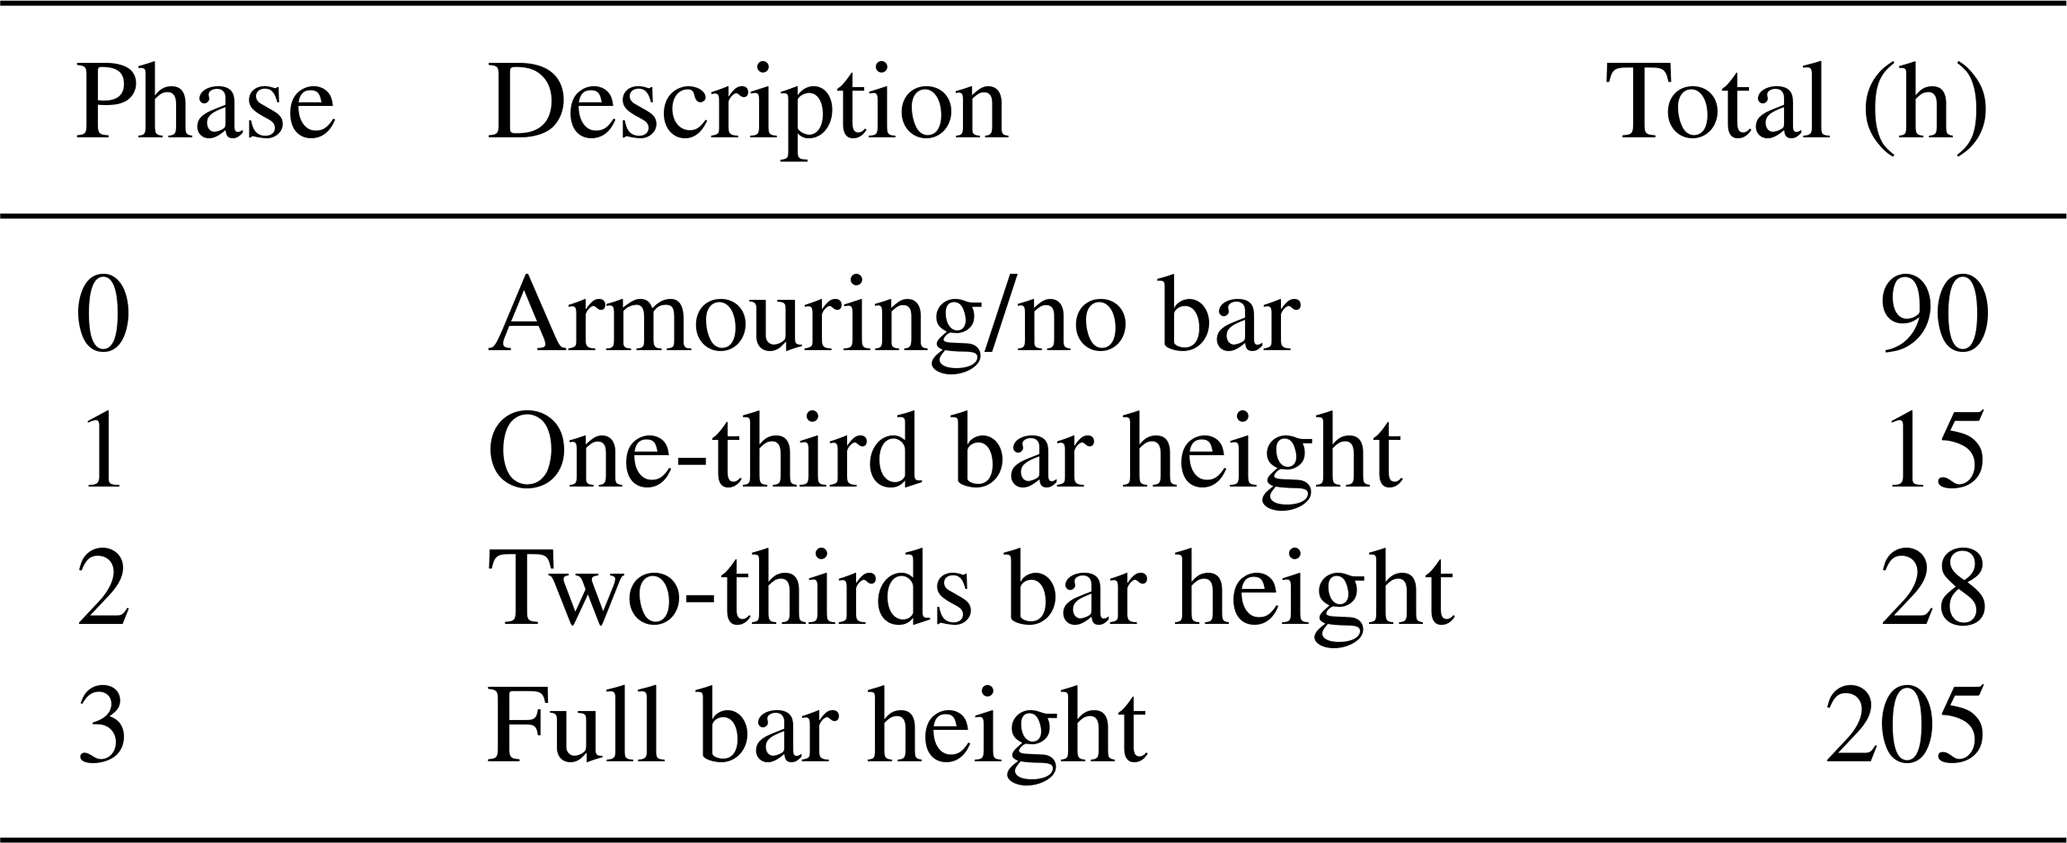
To test the operation and capabilities of the OERF, we conducted a series of preliminary experiments. Detailed descriptions of the design and results of the initial experiments are available in the publicly available MSc thesis of Dickson (2023). These initial runs were designed to explore thresholds in channel planform evolution without inlet sediment supply. Rather than targeting sustained free alternate bars or reach-scale incipient meandering, we tested whether a controlled, localized bed topography perturbation could generate forced bar-like responses with associated near-bank forcing and sediment sorting (armouring) under sediment-limited conditions. A 90 h conditioning run (Phase 0 in Table 2) preceded the imposed perturbation to allow water-working of placed sediments to allow the bed to adjust to initial hydraulic conditions. Subsequent phases introduced a controlled bar–pool perturbation near the inlet (Sect. 3.2) in three height increments to evaluate whether a localized topographic impulse could trigger development of alternate bars and lateral migration under sediment-limited conditions.
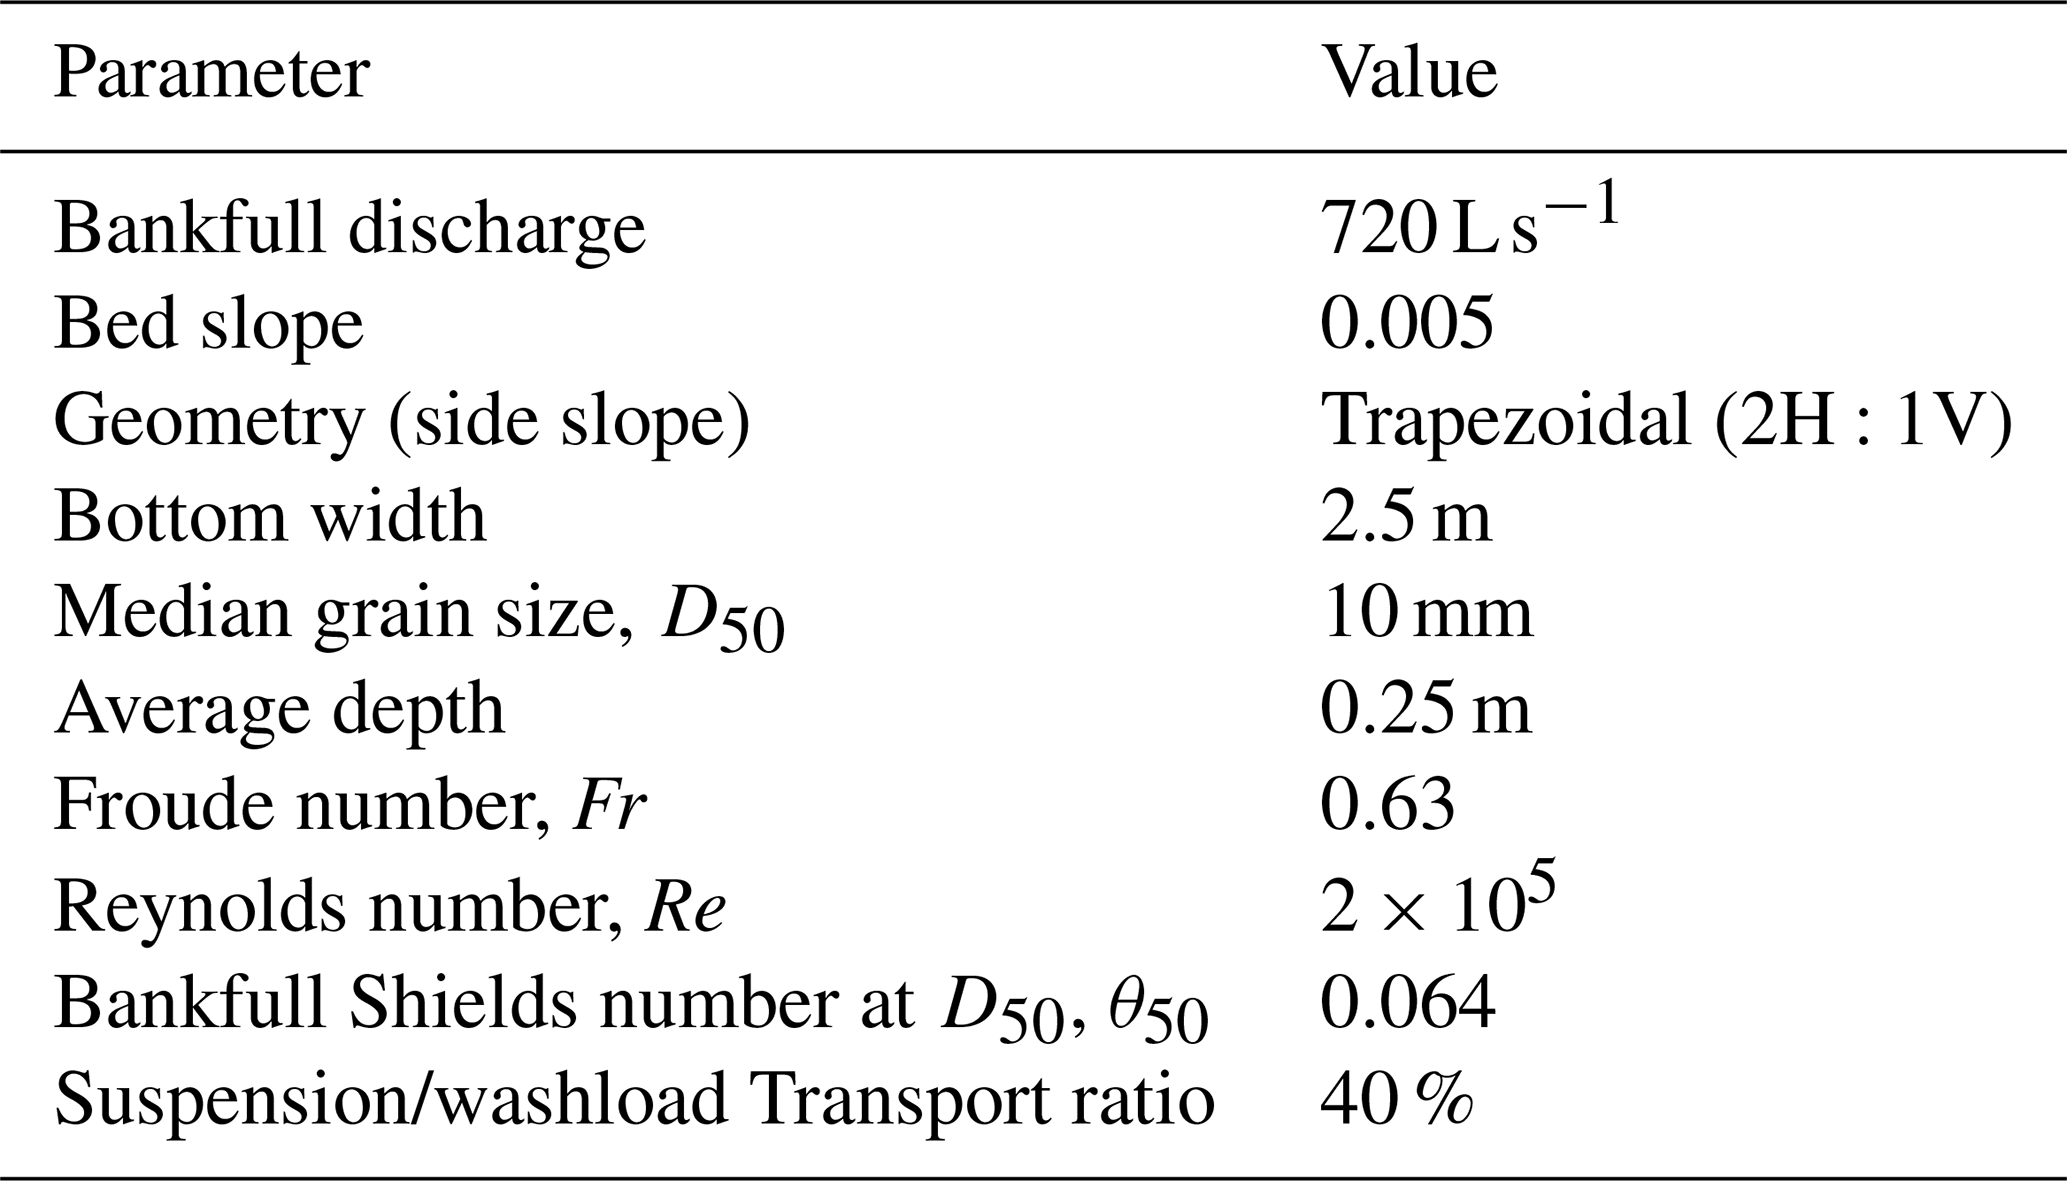
Operating conditions (Table 1) included: steady discharge (Q) = 720 L s−1, bed slope (S) = 0.005, trapezoidal cross-section geometry (2H:1V), bottom width (W) = 2.5 m, and median surface grain size (D50) = 10 mm). These choices yield subcritical, fully rough flow (Fr≈ 0.63; Re≈ 2 × 10⁵) at width–to–depth 12. Although bar theory suggests that free, migrating alternate bars typically require 20–25 (Kleinhans and van den Berg, 2011; Kleinhans et al., 2024) and are rarely observed when < 10 (Crosato and Mosselman, 2020), we selected a moderate ratio to balance sediment mobility with experimental control. This design choice was based on the assumption that topographic perturbations can force bars to develop in channels with ratios below the free-bar threshold (Redolfi et al., 2021). Furthermore, scaling analyses indicate that small-scale laboratory channels require ratios approximately 1.5 times larger than their natural counterparts to reproduce equivalent bar patterns (Kleinhans et al., 2014). In these initial exploratory runs, we therefore aimed to probe the thresholds for morphodynamic adjustment by implementing a controlled, incrementally increased perturbation, while operating within a conservative mobility regime to avoid a rapid transition to multi-thread behavior. This configuration placed the experiment within the OERF's operational envelope (Fig. 3), preserving field-like turbulent similarity while remaining practical to implement.
The initial bed and banks were composed of the floodplain material placed over the geomembrane, featuring a bi-modal grain-size distribution (GSD) of coarse gravel and sand (Fig. 4). The sediment composition includes approximately 50 % gravel, 46 % sand, and 4 % of fines, with particle sizes ranging from less than 0.08 to 112 mm, which corresponds to a poorly sorted GSD according to Folk and Ward (1957), with a Sorting Coefficient of 1.2.
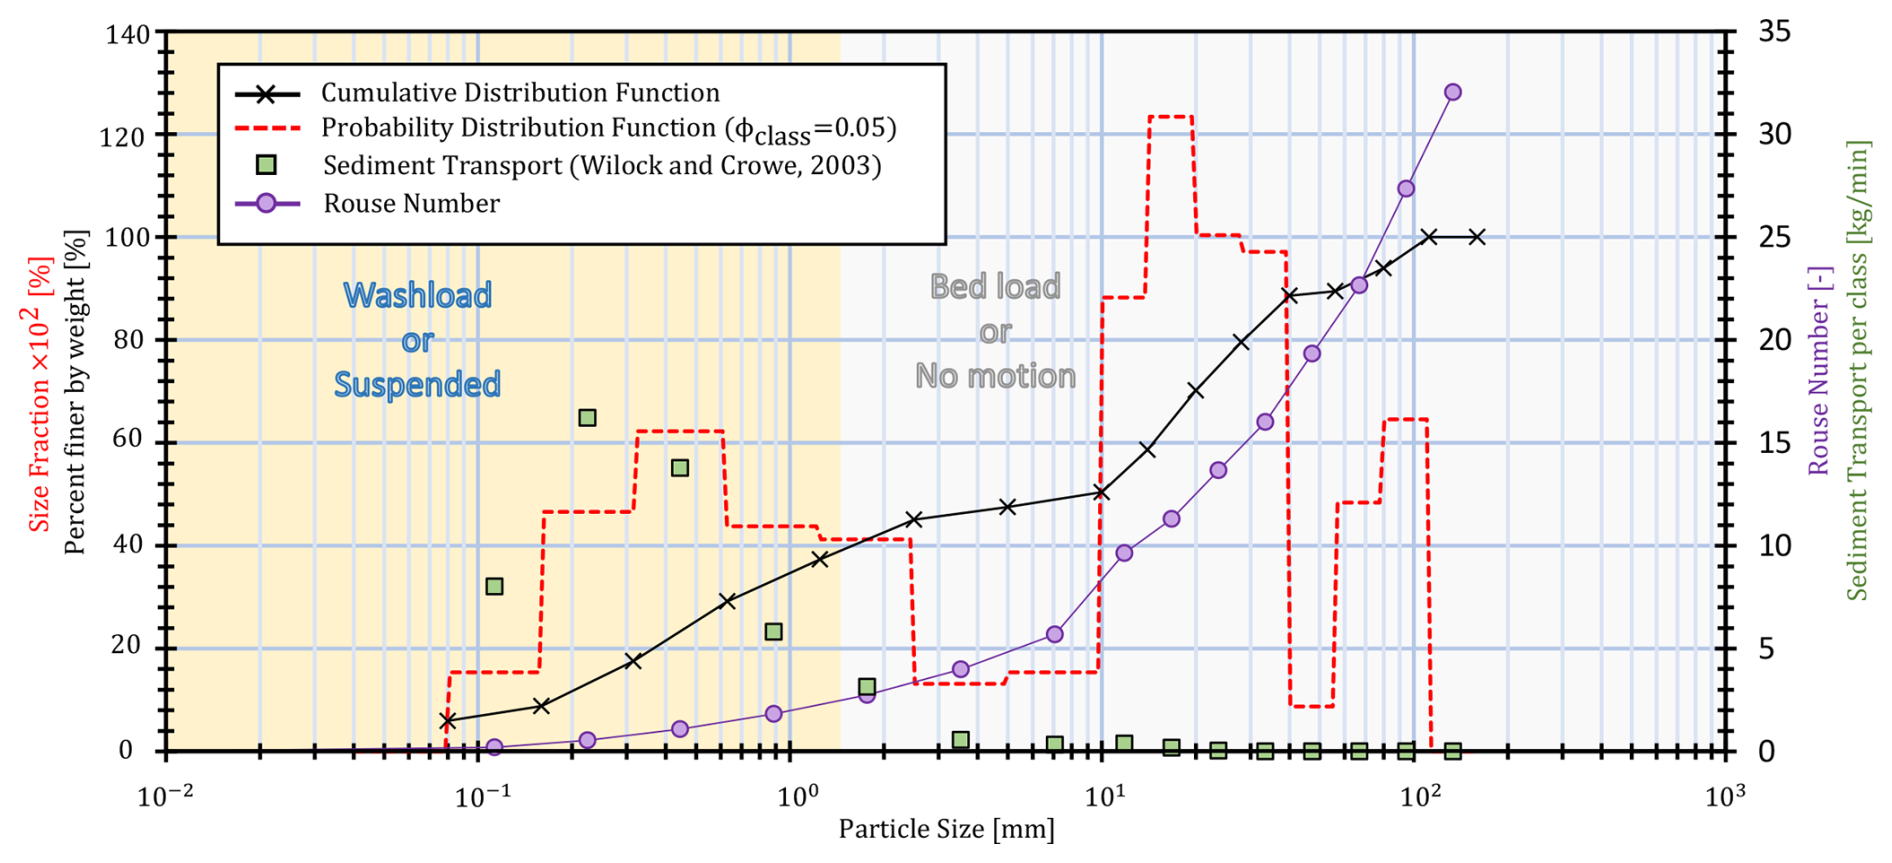
Figure 4OERF grain size and sediment transport characteristics in preliminary experiments based on the physical parameters outlined in Table 1. The cumulative distribution function (black line) and the probability distribution function (red dashed line, binned by log transformed grain size ϕclass = 0.5, values multiplied by 102 for clarity) are read on the primary y axis at left. The Rouse number (purple line with circles), computed following Borsje et al. (2014) using the fall-velocity expression of Ferguson and Church (2004), together with the sediment-transport rate per grain-size class predicted by the Wilcock and Crowe (2003) formula (green squares), are read on the secondary y axis at right. Background shading denotes bedload transport regime threshold based on the Rouse-number = 2.5 (Borsje et al., 2014).
The experimental channel conditions were designed to generate an average transport stage (i.e. ratio of Shields parameter to a critical value of 0.045) greater than 1.2. Here, the critical Shields number for D50 was chosen to be 0.045 as suggested by Buffington and Montgomery (1997). Under these initial conditions (Table 1) more than 60 % of the initial GSD was predicted to be transported as bedload or no-motion, with a transport capacity of up to 50 kg min−1 using the surface-based predictor of Wilcock and Crowe (2003) (Fig. 4).
3.2 Inlet perturbation design
Previous experimental studies have used controlled perturbations to trigger bars and bend instabilities. The objective is to simulate perturbations in the inflow and sediment influx that are observed in nature. However, there has been various designs for these perturbations in experimental geomorphology. Early laboratory studies used a static planimetric perturbation by imposing an inflow at a fixed angle (e.g., Friedkin (1945); see Kleinhans et al. (2024) for historical context). This approach was later adopted in river experiments which aligns with the theoretical framework of Lanzoni and Seminara (2006). In theory, bend instabilities create disturbances that propagate downstream which require persistent upstream forcing to sustain meandering in relatively short flumes; a condition later proven mathematically by Weiss and Higdon (2022). Based on Friedkin (1945) simple configuration, Braudrick et al. (2009) aligned the entrance channel at a small angle to a downstream straight reach, creating a bend that seeded flow vorticity, bank erosion, and meander growth. While Van Dijk et al. (2012) used a transversely movable inlet to impose time-varying planform forcing and accelerate meandering. In straight channels, other work has promoted alternate-bar development by partially blocking the upstream entrance (Nelson et al., 2010). Here, we used a constructed bar–pool unit near the inlet to perturb the flow with the goal of catalyzing bank erosion.
We designed the bar–pool unit following the morphometric framework of Redolfi et al. (2020) and Froude-similitude outlined by Parker et al. (2003) (Fig. 5). To ensure morphological consistency, the scaling factor was determined by identifying the discharge in the Redolfi et al. (2020) experiments that produced a width-to-depth ratio comparable to that of the present study. This condition was met at a discharge of 2.5 L s−1 in their flume experiments. Based on this reference case, we adopted a scaling factor of 10, consistent with scaling ratios derived for discharge, channel width, and median grain size. Accordingly, the dimensions of the perturbation structure were scaled to 230 mm in height, 43 mm in relief, and 21 m in wavelength. Relief is defined as the standard deviation of detrended bed elevations within the bar unit, which is about one-fifth of the maximum bar height (Fig. 5).
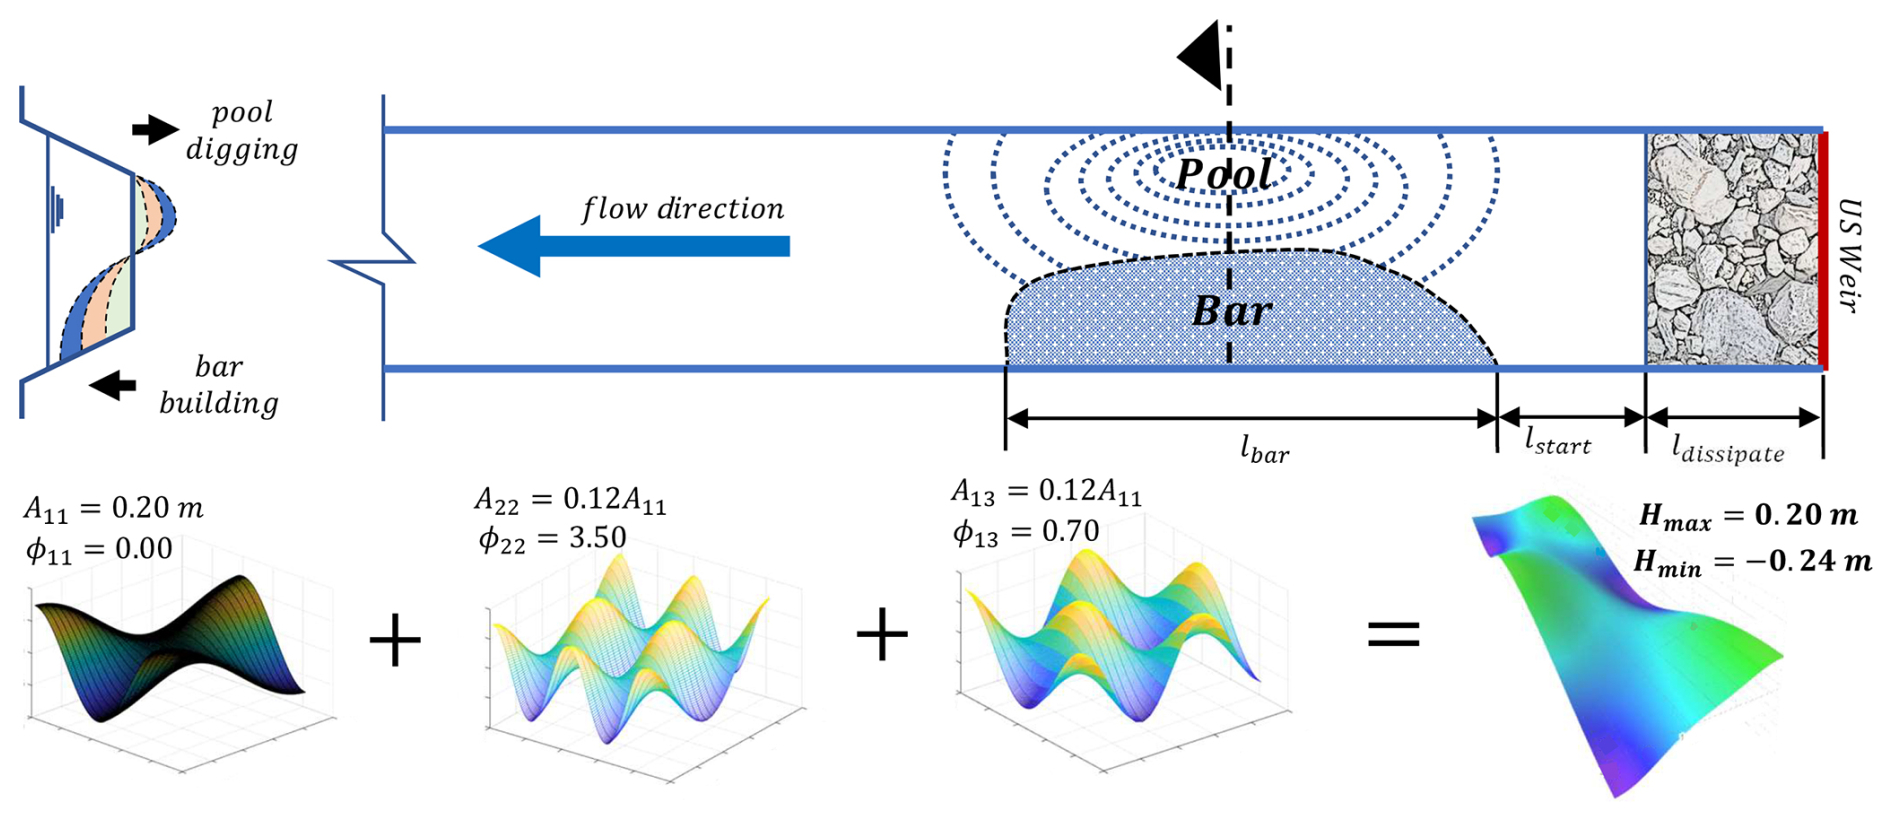
To generate the perturbation topography, Fourier components (harmonics) were applied as , with amplitudes (Anm) and phases (ϕnm), for longitudinal (n) and transverse (m) modes tuned to reproduce a realistic bar-pool asymmetry (Fig. 5). A sensitivity analysis of these harmonics can be explored at https://www.math3d.org/NJYVGn2Eg (last access: 12 February 2026).
We only constructed the upstream half of the unit to explore whether subsequent erosion and deposition would extend the bar-pool morphology downstream. The bar was made with non-erodible (sandbags filled with < 10 mm sediment) to preserve geometry between phases; the adjacent pool was excavated into the bed substrate to maintain cross-sectional area as bar height increased through three steps (Table 2). We positioned the perturbation near the inlet to maximize its hydraulic influence and the usable experimental length downstream. We allocated approximately 4.45 m of upstream channel length for post-cascade energy dissipation and an additional 4.0 m for flow development (Fig. 5).
3.3 Rationale and hypothesis for experimental design
Meandering initiation thresholds and planform adjustment pathways have been documented previously for gravel-bed channels (Knighton, 2014; Rhoads and Welford, 1991; Rhoads, 2020). Straight channel configurations are inherently unstable, and under a range of conditions should evolve into a meandering pattern through stages as described by Knighton (2014). Initially, bedform development (Stage 1) leads to the formation of alternating bars that concentrate flow and drive bed erosion (Rhoads and Welford, 1991). Subsequently, the formation of pools and cross-over riffles (Stages 2 and 3) amplify bank erosion and accelerate bend formation (Rhoads, 2020), ultimately resulting in increased sinuosity characterized by riffles at inflection points and pools at bend apexes. Laboratory studies have demonstrated that inlet perturbations or geometric asymmetries can seed this sequence of planform evolution (Braudrick et al., 2009; Van Dijk et al., 2012).
In designing our initial experiments in the OERF, we hypothesized that under steady discharge and in the absence of upstream sediment supply, meandering could still develop due to entrainment of sediment supplied by bank erosion leading to downstream bar development. In particular, we hypothesized that a localized bar–pool perturbation would concentrate shear stress near the outer bank, enhance secondary circulation, and trigger initial bend growth via bank erosion, pool scour, and downstream deposition of eroded material into bars. The null hypothesis was that the armoured channel bed would remain stable, inhibiting sediment transport and morphological evolution over the time scale of the experiment. This would be consistent with experiments showing that terminating upstream sediment supply can eliminate alternate bars and promote bed coarsening (Venditti et al., 2012).
3.4 Measurements and data processing
High-resolution topography was acquired at the end of each of the four phases using multirotor UAV imagery for structure-from-motion (SfM) photogrammetry with 80 % forward and side overlap at a flight altitude of 10 m. Flights used a DJI Mavic 2 Pro; when that drone was unavailable, a DJI Mini 2 was used, which increased DEM noise relative to the Mavic 2 Pro. Ground control points (GCPs) were established with a Leica Viva TS15 total station set with benchmarks that had been established by GNSS-RTK. Each flight was georeferenced using a minimum of 6 and a maximum of 12 GCPs. Images were processed in Pix4Dmapper with phase DEMs and orthomosaics were exported at a 2 mm grid resolution. DEMs of Difference (DoD) were then computed in ArcGIS between phases to map erosion and deposition within the corridor applying a minimum detectable change threshold of 2.5 cm.
To track bed-surface coarsening, nadir photographs were acquired at fixed locations using a smartphone held approximately 90° to the bed. Each image covered a 1.0 m × 0.70 m patch and included a metric ruler for scale. Images were imported to AutoCAD (2D) and scaled by matching the photographed ruler length. A 5 cm mesh grid was overlaid and a grid-by-number sampling was performed (Bunte and Abt, 2001). The b axis was digitized as a polyline, yielding about 275 pebble measurements per patch. Surface size distributions were computed from the empirical cumulative distribution of the measured b axes.
Velocity profiles were collected with a side-looking acoustic Doppler velocimeter (ADV) mounted on a rigid traverse. The measurement cross-section was located at the bar apex. A fixed sampling grid was used: near-bank rows were 2.5, 5.0, 7.5, 10, 15, and 20 cm above the bed with lateral offsets of 2.5, 5.0, 7.5, 10, 15, and 20 cm from the bank; mid-channel columns were 100, 140, and 180 cm from the bank with vertical offsets of 2.5, 4.0, 6.0, 10, and 15 cm above the bed. At each point the ADV sampled at 50 Hz for 120 s using a ∼ 1 cm3 sampling volume.
Shear velocity u∗ was estimated by fitting the time-averaged vertical profiles to the logarithmic law with κ = 0.41 (Biron et al., 2004; Dey, 2014). Fits were restricted to heights outside near-bed interference and within the presumed log-layer; because many sampling heights in these runs lay above the inner ∼ 20 % of depth, the resulting u∗ estimates carry additional uncertainty; profiles lacking a coherent log-region were discarded (Afzalimehr and Anctil, 1999). Bed shear stress was computed as . The Shields number is reported using the phase-specific surface D50 (initial 10 mm, ≈ 17 mm after Phase 0, ≈ 22 mm after Phase 3). For reference, the critical stress was estimated as with θc = 0.045, i.e. τc≈ 728 D50 (with D50 in metres, τc in Pa).
Water depth was recorded with a submerged pressure transducer (Solinst Levelogger) installed at mid–reach to track steady discharge conditions and changes in depth. Atmospheric pressure was removed by barometric compensation using a co-located barometer. Sensors experienced episodic fouling by filamentous algae (see examples in Dickson, 2023); which was periodically cleaned to maintain data quality.
Bank retreat adjacent to the perturbation was quantified between phases using cross-sectional geometry rather than planform banklines to capture changes in bank topography (i.e., the bank edge position was nearly fixed and retreat was limited). For each phase, we extracted elevation profiles from the DEMs (at the same location as the ADV section) and measured the horizontal shift of the bank side-slope due to erosion including undercutting.
4.1 Physical responses of the OERF
Over the initial 90 h conditioning run, the channel was allowed to freely evolve from the original straight channel configuration under constant flow conditions and no external sediment supply. Only limited morphological change was observed during this period, with the channel remaining predominantly straight (Fig. 6). Minor bed elevation fluctuations of about ± 2 cm occurred near the outlet, likely due to backwater effects, and a coarse surface layer developed on the bed (Fig. 7a).
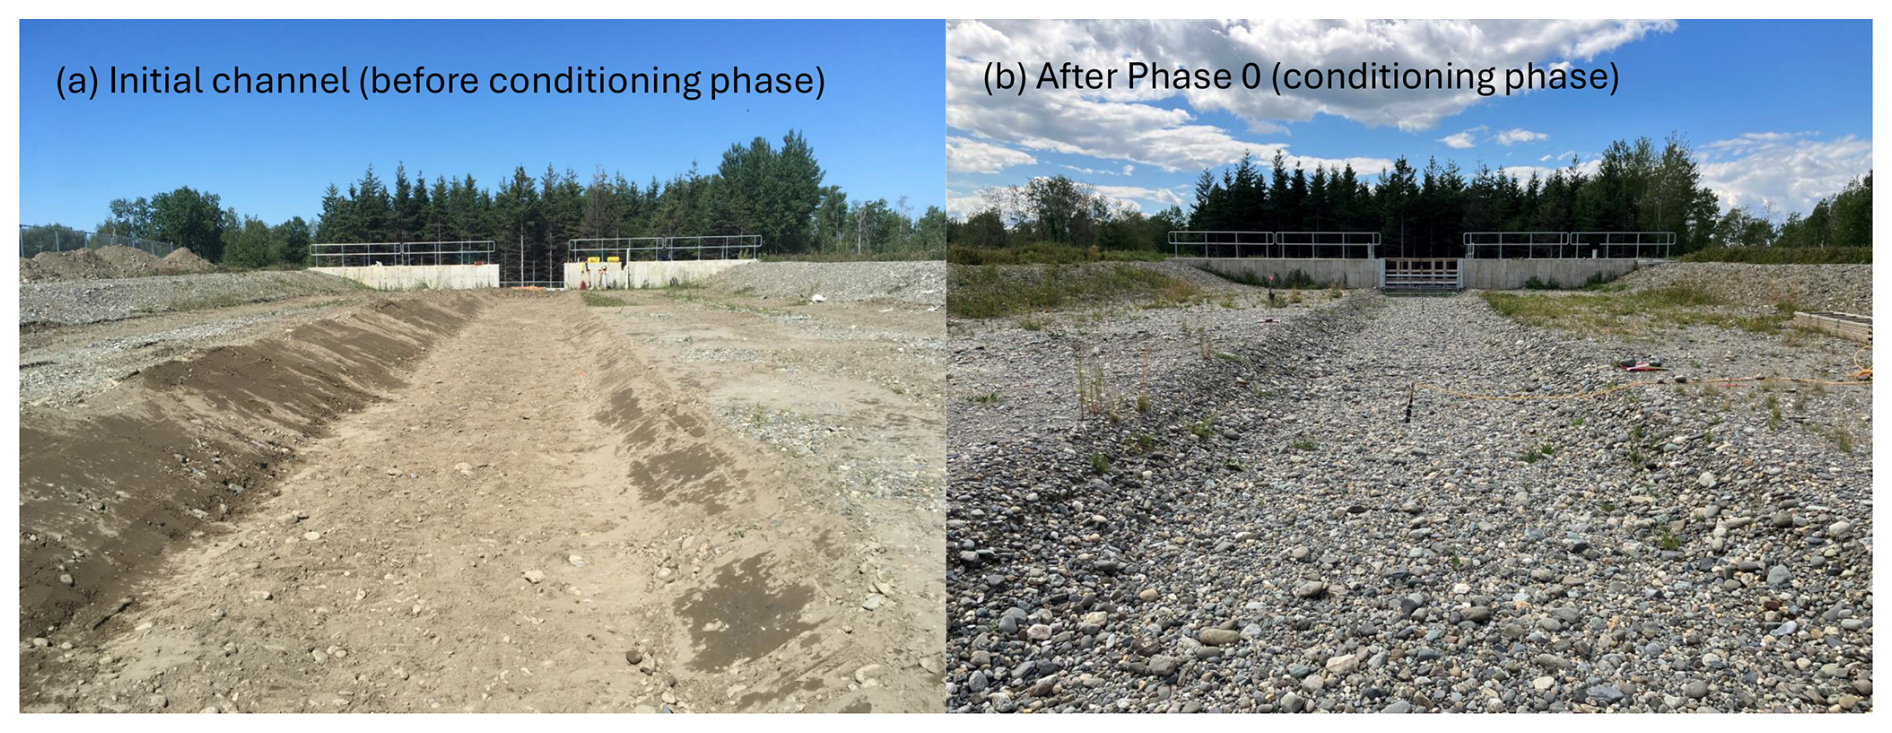
Figure 6Oblique photographs of the straight channel showing channel adjustment under the conditioning run (phase 0). (a) Initial condition after construction, prior to water-working. (b) After the Phase 0 conditioning run (90 h), showing rapid bed-surface coarsening and development of the armour layer.
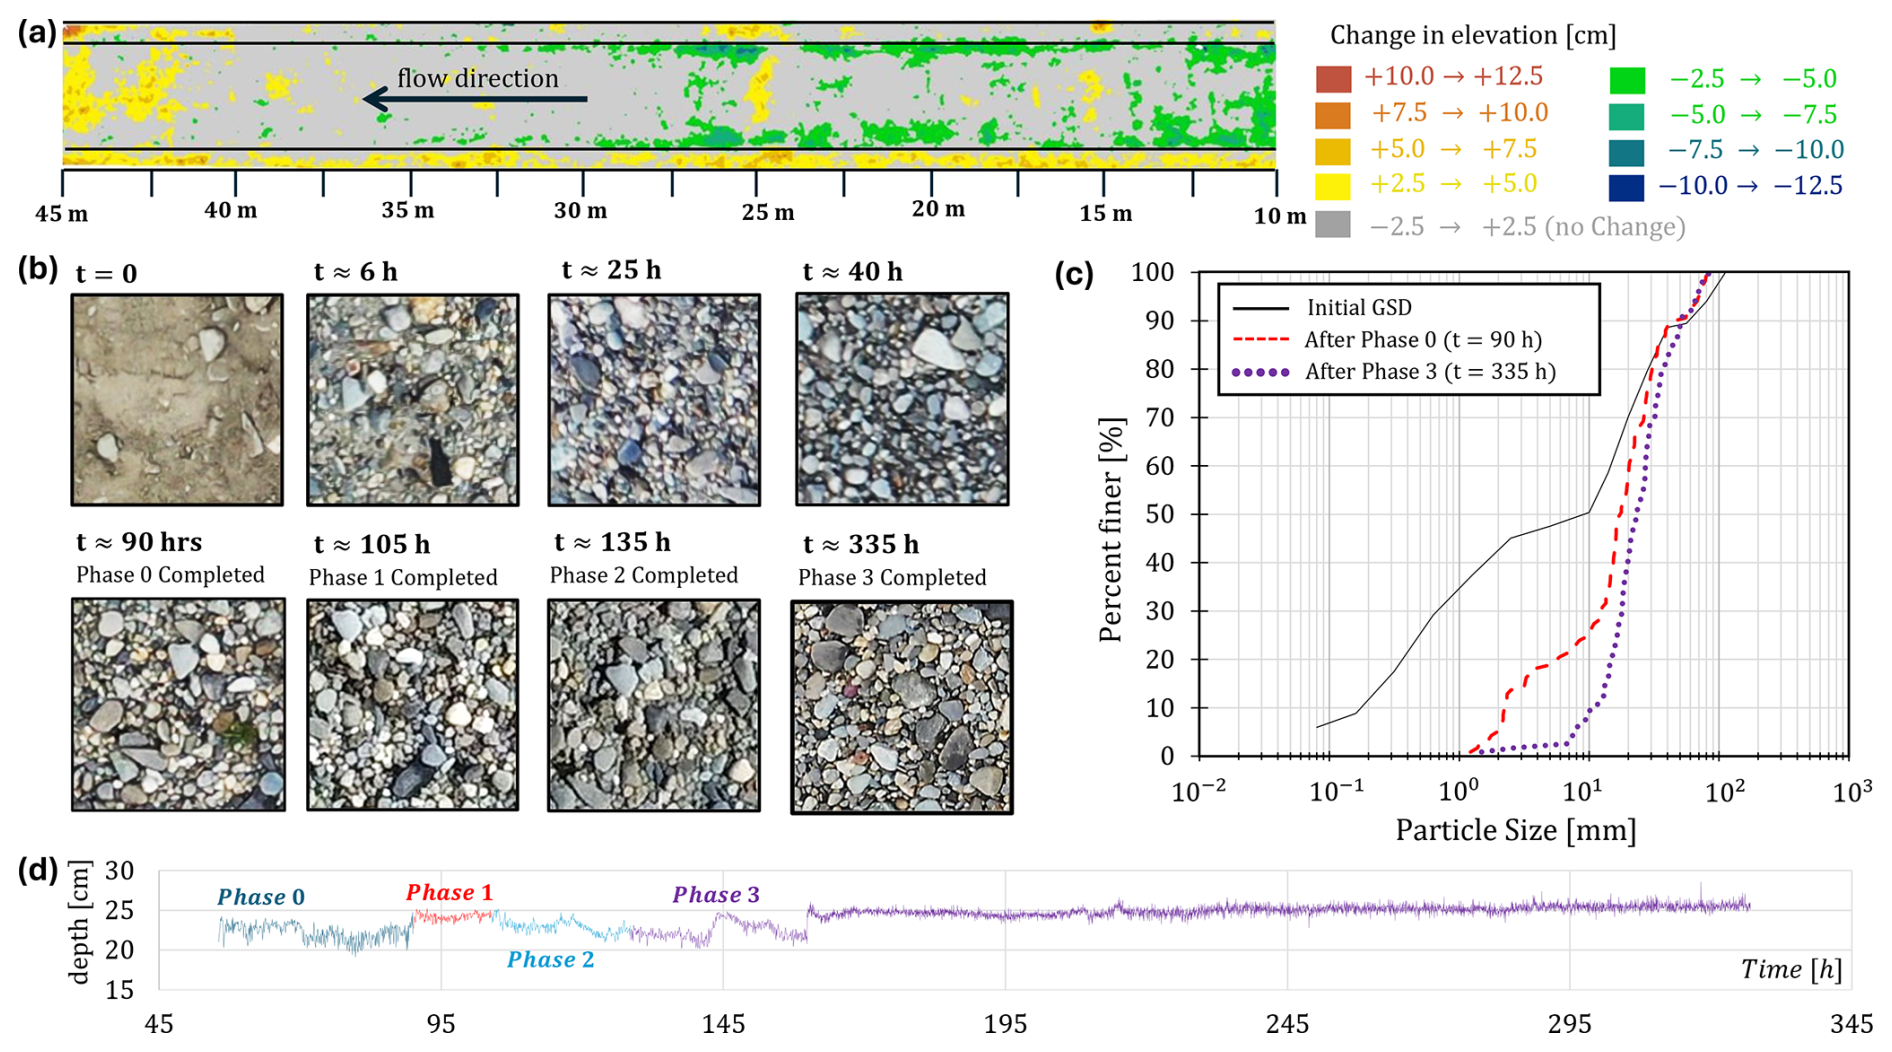
Figure 7Physical response of armouring processes. (a) Topographic change after phase 0 (t = 90 h) with elevation change classified by colour scale (in cm). (b) Texture evolution of surface composition across the four phases in a 50 cm × 50 cm frame at midstream (40 m from upstream). (c) GSD: initial (Volume-by-weight), and post-Phase 0 and Phase 3 (digitally sieved, grid-by-number). (d) Flow depth at midstream (longitudinally and transversely) over the four phases.
During this initial run, an armouring process gradually became dominant. Approximately 40 % of the initial fine-grained sediment was removed as suspended load, leaving behind larger gravel particles (> 10 mm) that exhibited transport rates below 1 kg min−1 (Fig. 4). Consequently, the median grain size (D50) increased from 10 to 17 mm, and then to 22 mm post phase 3, reflecting continuous bed coarsening (Fig. 7c). Visual inspection revealed a transition from matrix to clast-supported bed structure over the experiment (Fig. 7b). The stable armour layer reduced channel erodibility, limiting morphological evolution and increasing lateral channel stability (Rachelly et al., 2022). These armouring dynamics are consistent with patterns observed in natural gravel-bed rivers subjected to reduced sediment supply (Dietrich et al., 1989; Chin et al., 1994) and align with laboratory flume findings reported by Elgueta-Astaburuaga and Hassan (2017). Depth measurements show that as armouring developed, flow depths stabilized, demonstrating the linkage between bed texture and hydraulic conditions (Fig. 7d). Together, these observations highlight the mixed-sediment tendency for a rapid sedimentological adjustment (selective transport and surface coarsening), which outpaces longer-timescale morphological adjustment associated with alternate-bar growth and planform change, particularly apparent when mobility is limited and upstream sediment supply is absent (Lanzoni, 2000; Kleinhans et al., 2013). Detailed information and results of additional numerical modeling of the armouring process are available in the publicly available MSc thesis of Renault (2024).
Following the conditioning run, a bar-pool perturbation was introduced to accelerate morphodynamic adjustments and test whether bar-scale topographic forcing could generate measurable bank response and downstream morphodynamic adjustment under sediment-limited conditions. The perturbation, in three incremental phases, progressively influenced local flow dynamics and channel morphology (Fig. 8a). During Phase 1 (bar at height), minor bank erosion occurred on the right bank adjacent to the perturbation, with lateral erosion ranging between 2.5 and 5 cm. Phase 2 (bar at height) resulted in more pronounced erosion, extending approximately 2 m downstream with maximum erosion reaching about 7.5 cm. By Phase 3 (full bar height), erosion further expanded approximately 4 m downstream on the right bank opposite the perturbation, with lateral erosion ranging from 2.5 to 5 cm. Notable erosion was also observed on the left bank, beginning approximately 6 m downstream of the perturbation and extending approximately 8 m further downstream, with erosion between 2.5 and 7.5 cm. Cross-sectional profiles shown in Fig. 8c detail the progressive deformation of the bank through these phases. This limited cross-sectional evolution reflects high bank-material strength due to the stabilizing influence of the coarse tail of the grain size distribution and armouring at the toe of the bank. Bank cohesion, particularly in the upper portion of the bank above the water line, also contributed to limiting lateral adjustment.
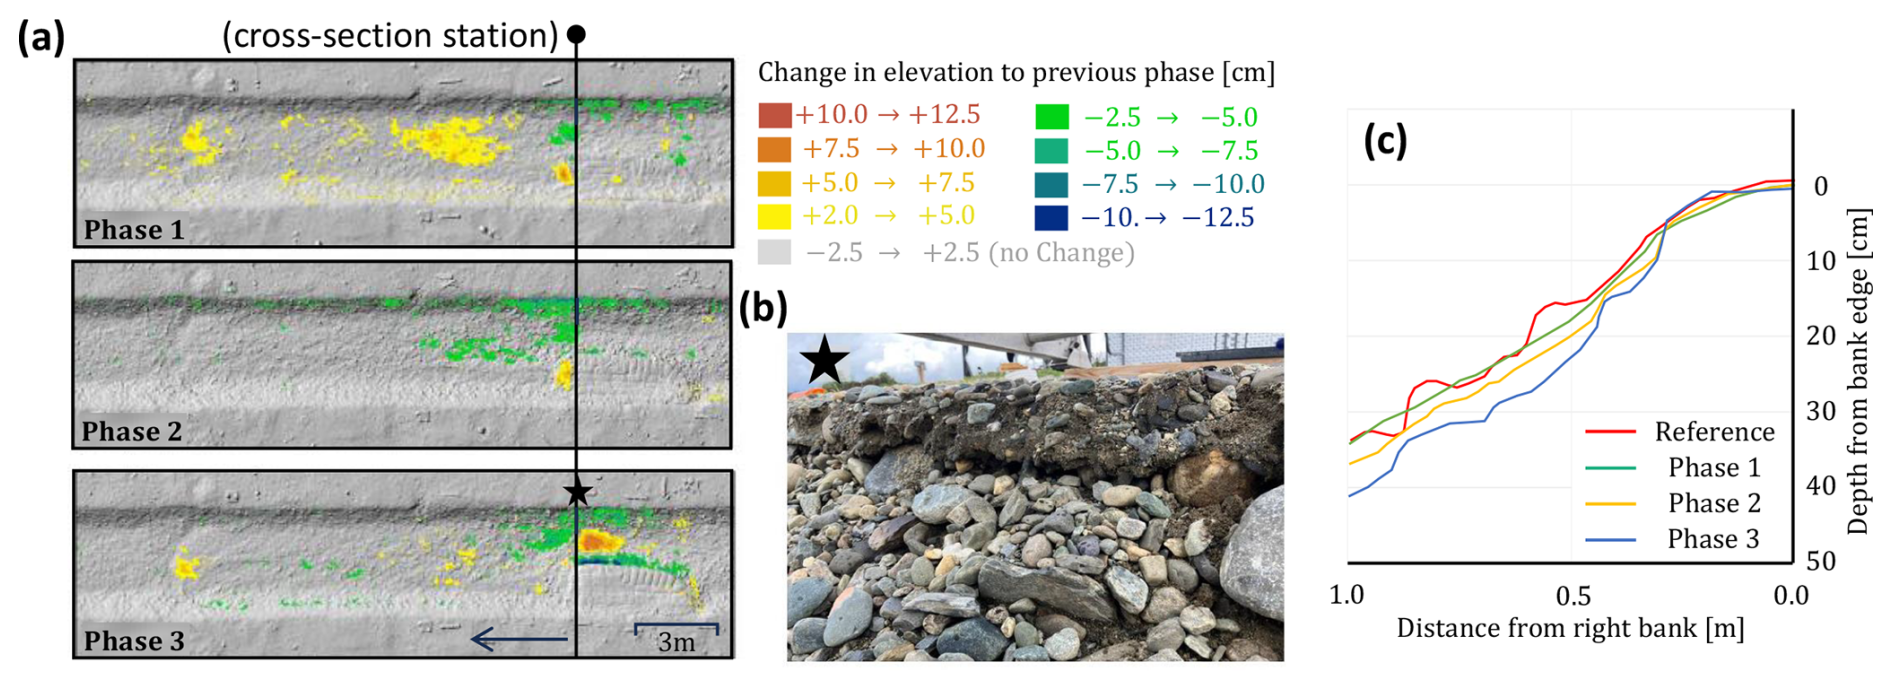
Figure 8Physical response to the inlet perturbation. (a) Topographic changes over Phases 1–3, highlighting zones of erosion and deposition relative to the pre-perturbation reference. The black vertical line marks the location of the cross-section shown in (c). (b) Field image of the eroded right bank post phase 3 taken at the apex of the bar and the location of maximum pool scour identified on (a) with a black star. (c) Cross-sectional elevation profiles at the right bank, extracted at the location shown in (a), showing progressive erosion across phases.
Despite these local responses, reach-scale morphology remained largely straight over the experiment duration, and no sustained bar pattern or planform reorganization emerged within the experiment timescale. Together with the absence of upstream sediment supply and the conditioned, armoured bed, these observations indicate that planform adjustments were modest under the explored combinations of discharge, grain size, and bank strength, and they emphasize the need to tune sediment mobility and sediment boundary conditions to allow morphological responses to develop on comparable timescales to sorting processes.
4.2 Flow structure, velocities, and shear stress
As part of the facility characterization, we used ADV measurements to test the applicability of intrusive, point-based velocity profiling in a large channel with evolving bed and bank boundaries, with particular attention to near-bank flow where instrument placement and flow disturbance can be most limiting. The impact of the bar perturbations on velocity distribution and bed shear stress was investigated using a side-looking ADV indicated in Figs. 9 and 10. Although this dataset does not aim to resolve the full turbulence structure, it provides an indicator of how the imposed topography redistributed high-velocity flow and near-bed forcing locally.
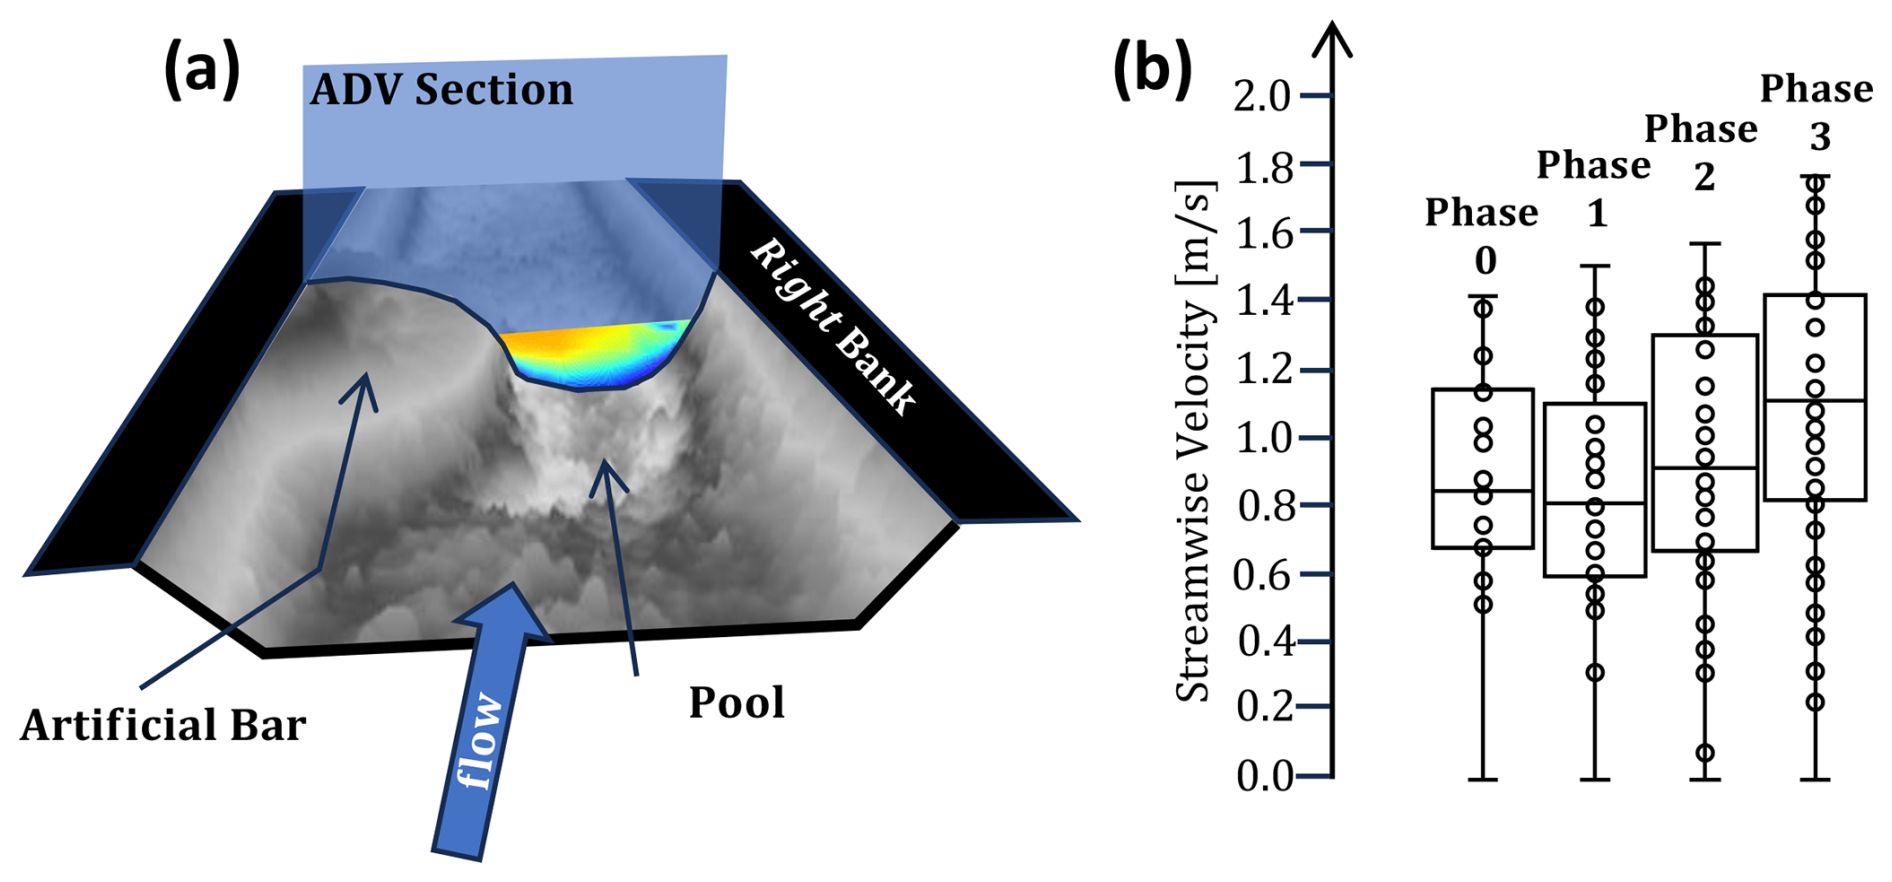
Figure 9(a) Schematic perspective of the artificial perturbation at full form, showing the location of the ADV cross-section (blue overlay). (b) Boxplots of the streamwise velocity component (u, in m s−1) for each phase. Each box aggregates all time-averaged values from the ADV measurement points. These data represent the distribution of u across space (all points) and over time (averaged per point), describing the statistical evolution of streamwise flow velocity in response to progressive bar-pool perturbation.
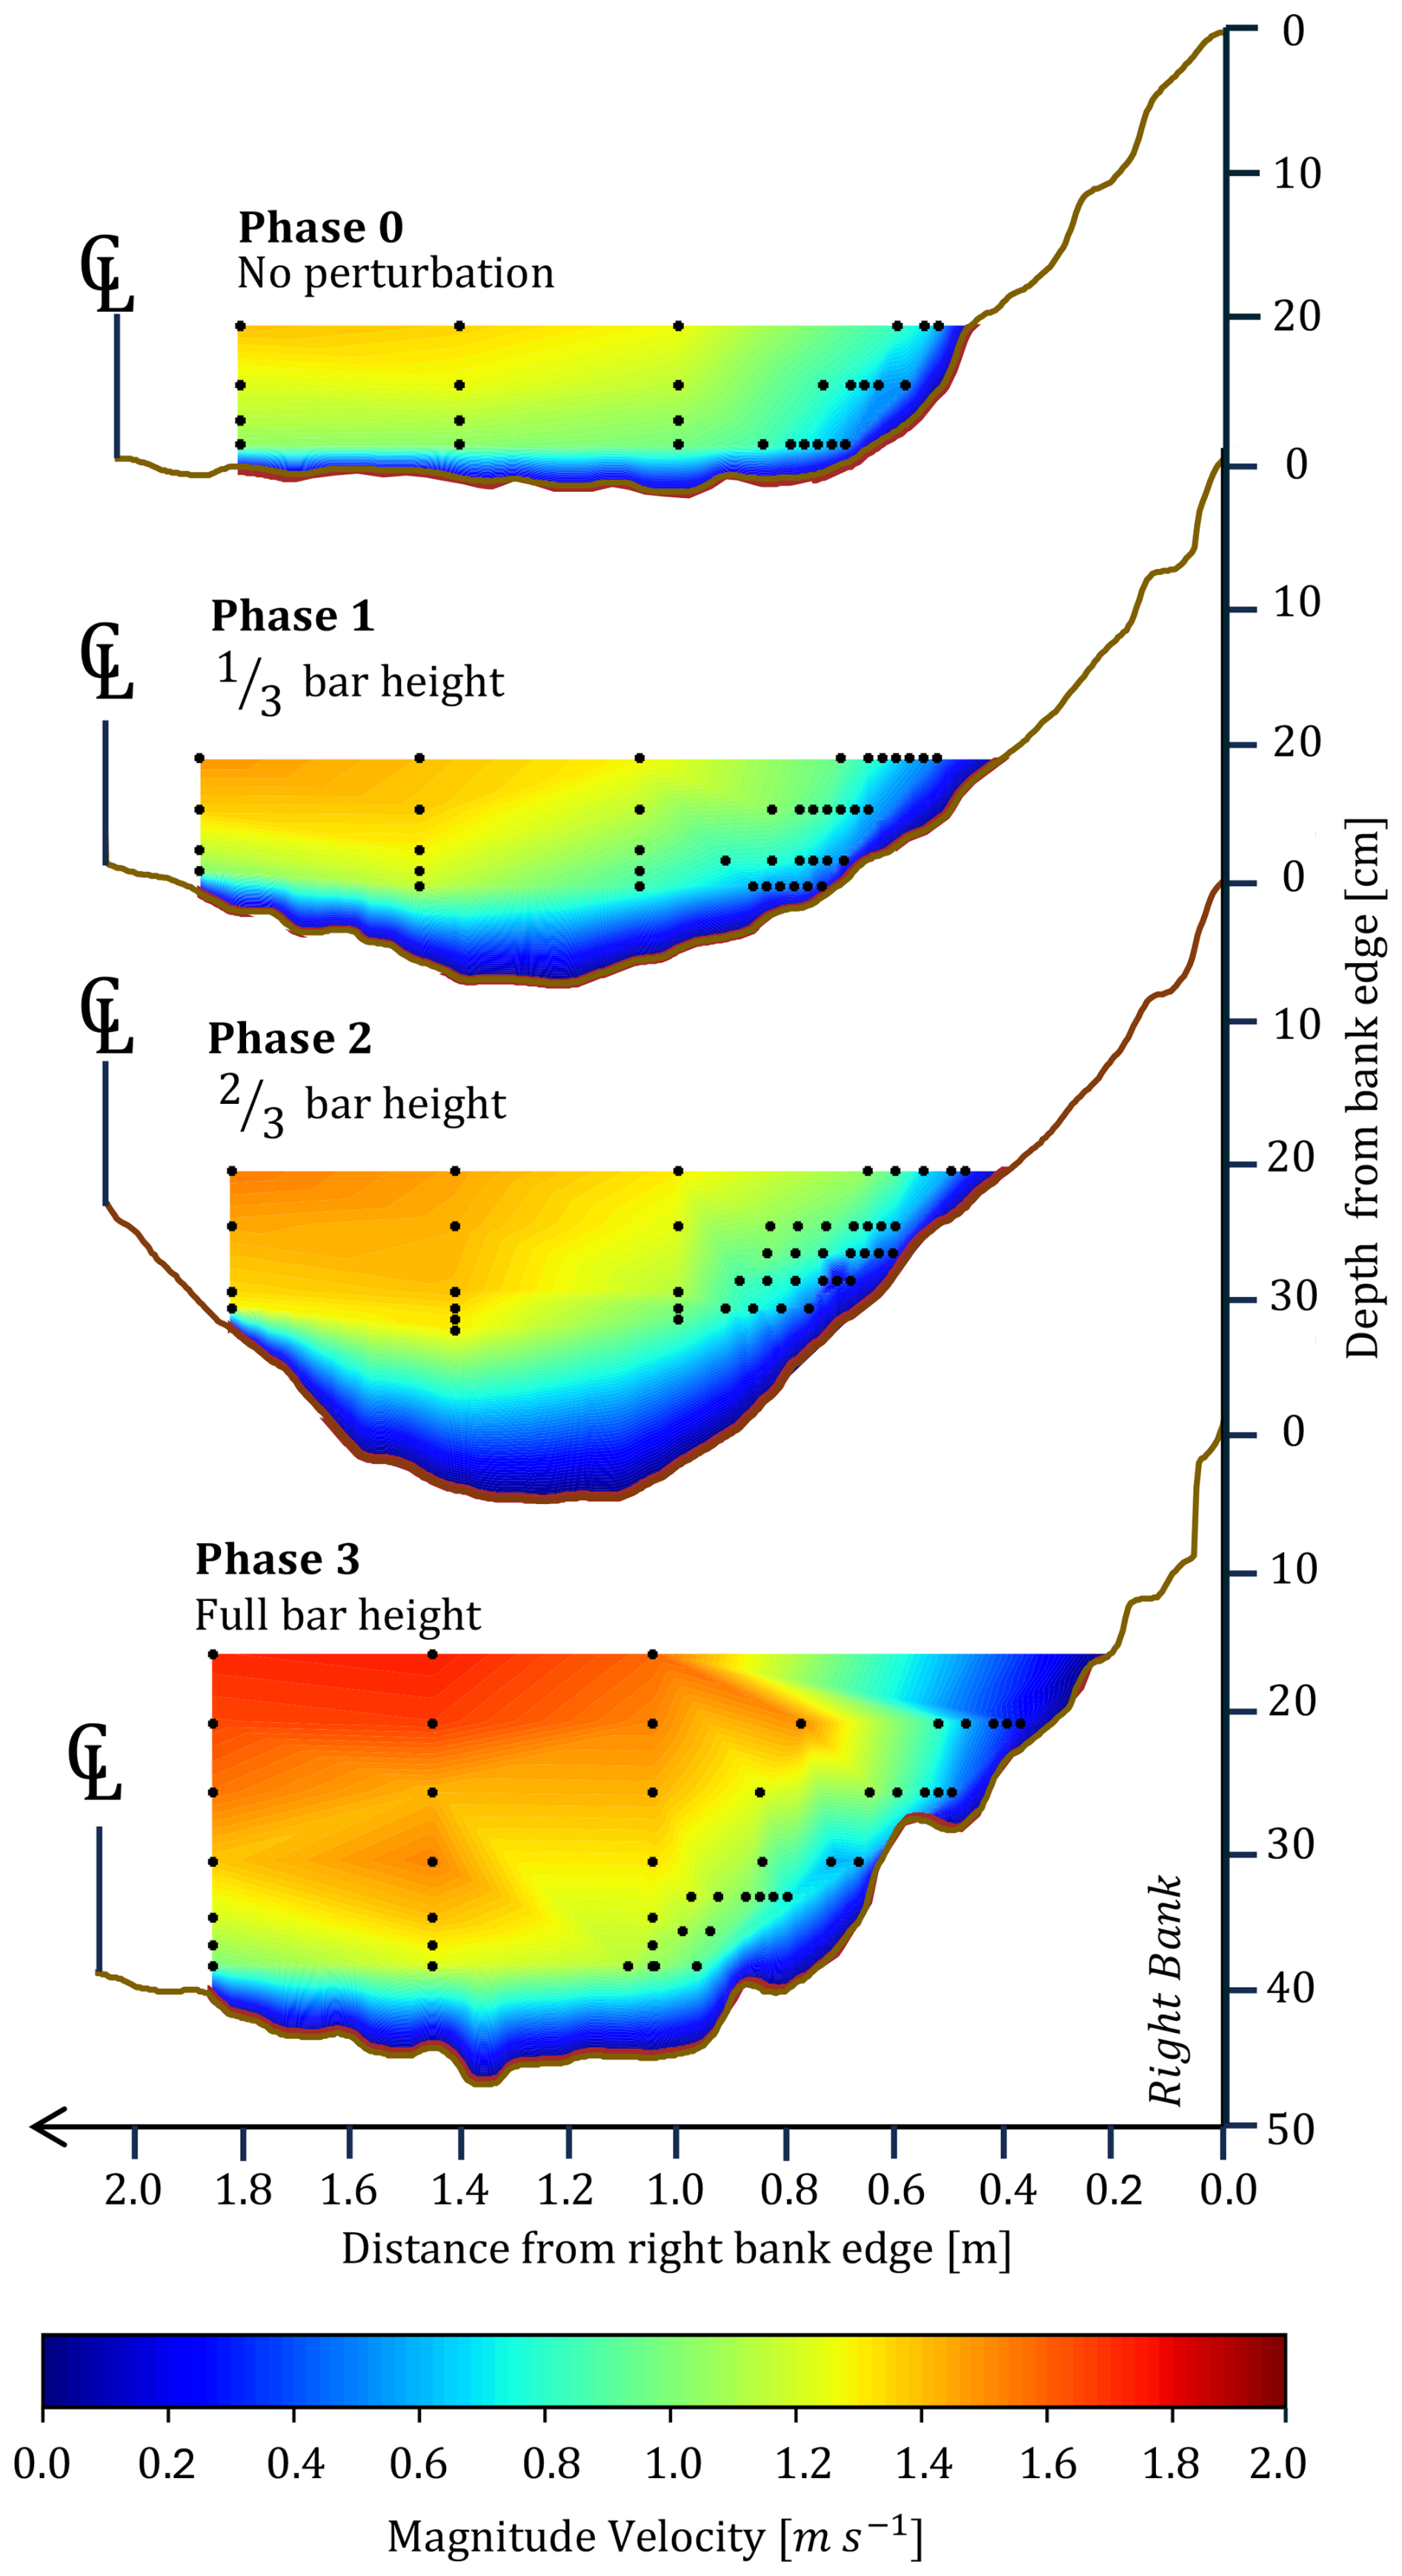
Figure 10Time-averaged velocity magnitude fields for Phases 0, 1, 2, and 3 at the bar apex in m s−1. Black dots indicate ADV measurement locations. The topographic profile represents the surveyed cross-section at the end of each Phase.
Peak streamwise velocities in the upstream zone rose from 1.38 m s−1 (Phase 0) to 1.49 m s−1 (Phase 1), an increase of about 8 %. Subsequent phases showed further increases to 1.56 m s−1 (Phase 2) and 1.75 m s−1 (Phase 3), about 13 % and 27 % above Phase 0. Mean streamwise velocities initially decreased slightly, from 0.88 m s−1 in Phase 0 to 0.84 m s−1 in Phase 1, then increased to 0.90 m s−1 (Phase 2) and 1.07 m s−1 (Phase 3) (Fig. 9). The core region of maximum velocity shifted toward the right bank as the bar grew and the adjacent pool deepened, indicating lateral deflection and redistribution of high-velocity flow induced by the perturbation. Each phase combined an increase in bar height (non-erodible sandbags) with excavation of an erodible pool to maintain cross-sectional area. In Phase 1 the pool excavation effect was sufficiently pronounced to counterbalance the small bar relief, explaining the temporary drop in mean velocity despite a higher peak.
Bed shear stress was quantified at the perturbation cross-section using log-law method. Phase-median stresses were τ0≈ 10, 16, 29, and 20 Pa for Phases 0–3, respectively, corresponding to median Shields numbers θ≈ 0.06, 0.10, 0.18, and 0.12. For reference, phase-specific critical stresses based on the mid-reach surface D50 (not the local bed at the perturbation) were τc≈ 7, 12, 15, and 16 Pa. Thus, τ0 exceeded τc from Phase 1 onward and peaked in Phase 2, coincident with the strongest observed local bank retreat. The decrease in median τ0 in Phase 3, despite higher peak velocities, is consistent with momentum redistribution as the pool deepened and with growth of a coarse near-bank surface that limited effective shear at the log-layer fitting heights.
4.3 Lessons learned
Several lessons emerged during the preliminary experimental phase at the OERF, many of which stem from the inherent challenges with large-scale, outdoor flume experiments. Each constraint points to practical refinements for future experiments.
Achieving measurable bend growth at this scale requires tuning sediment mobility and bank forcing to the feasible experimental run time while preserving channel form. To shift from a straight channel to a self-maintained meandering planform, without overshooting into braiding, future experiments should couple stronger bank-erosion drivers (e.g., higher stream power, steeper slope, greater sediment load) with sufficient bank strength to maintain width–to–depth ratios within the meandering domain ( 50; Fredsøe, 1978). As it is well known that vegetation and cohesive sediments are key mechanisms for meandering (Van Dijk et al., 2012; Kleinhans et al., 2024), future experiments should also integrate these factors. With the current conditions of the OERF, particles coarser than ∼30 mm remained immobile at the available shear stresses and tended to cluster, locally locking parts of the bed and banks; for future experiments, sieving the bed sediment mixture to limit the coarse tail to ∼ 30 mm is recommended.
For future experiments in the OERF exploring controls on bank erosion and lateral migration, we recommend: (i) activating the sediment-recirculation system, (ii) developing a capacity to feed the recirculation system with additional sediment to widen the range of possible sediment supply (rate and grain-size distribution). This would avoid progression toward a supply-limited, increasingly static and low mobility and armoured state, which is a key distinction between recirculating and sediment-feed experimental setups (Parker and Wilcock, 1993; Wilcock and DeTemple, 2005; Kleinhans, 2005), (iii) extending run duration from days to weeks, and (iv) tuning operating combinations (slope, sediment distribution, width) to accelerate expected morphological response rates to maximize the available experimental time window.
In addition, to accelerate planform evolution, we suggest creating an initially sinuous channel planform and exploring the influence of discharge variability. Other physical improvements to the OERF should include a flow-straightening diffuser below the entrance cascade to reduce turbulence intensity at the inlet and a PID-controlled tail-gate weir to reduce downstream backwater effects.
Measuring shear stress in the OERF channel remains challenging due to the roughness of the bed and banks (Biron et al., 2004). In our initial experiments, large protruding clasts distorted velocity profiles while challenges in precise ADV placement meant that many sampling positions lay outside the inner 20 % of depth where log-law conditions are most defensible (Afzalimehr and Anctil, 1999). As ADVs measure only a single point at a time, it can take many minutes to hours to obtain several profiles across a section. Within this time, the bed may change (aggrade or erode) under mobile conditions, creating discontinuities between ADV measurements at different locations. Moreover, the lack of suspended sediment in the water column resulted in insufficient seeding for acoustic reflection, limiting data quality. For future experiments, especially in the case of increasing sediment mobility, non-intrusive techniques should be explored such as Laser Doppler Velocimetry (LDV) and Large-Scale Particle-Image Velocimetry (LSPIV) (Fujita et al., 1998; Lewis and Rhoads, 2015).
We also encountered uncertainty in drone-based topographic survey differences when we acquired Structure-from-Motion (SfM) data with two different unmanned aerial vehicles (UAVs) (DJI Mavic 2 Pro and DJI Mini 2). UAV-SfM was generally successful for reconstructing reach-scale topography at the scale of the OERF; however, calculating DEMs of Difference (DoDs) from digital elevation models (DEMs) generated by different UAVs is not recommended. Differences in camera specifications and calibration, lens distortion, image footprint, and flight stability can introduce systematic offsets between surveys that propagate into the DEMs and can be misinterpreted as real topographic change, particularly for low-altitude flights (e.g., 10 m above ground level) and under low-light or gusty conditions. For future work we therefore recommend standardizing DoD workflows by using a single UAV platform and repeatable flight plans across all surveys, ideally a real-time kinematic (RTK) enabled UAV with improved positional stability (light-weight UAVs like DJI mini are not recommended for SfM). While UAVs offer substantial advantages in operational flexibility and sensor options (e.g., multispectral imaging and LiDAR) that are valuable for vegetation and floodplain studies, they remain weather-sensitive (e.g., rain and strong winds). Given the good site access at the OERF, we plan to evaluate complementary survey approaches. This including terrestrial laser scanning (TLS) (Heritage and Hetherington, 2007; Brasington et al., 2012; Lague, 2020) and close-range SfM using global navigation satellite system (GNSS) (e.g., via a camera rigidly mounted to the GNSS pole or an integrated GNSS-camera unit) (Jaud et al., 2020) or fixed-cameras configurations. These methods should provide improved repeatability for targeted sub-reach differencing. TLS or an integrated GNSS-camera unit are particularly advantageous for resolving steep banks and local undercutting where nadir UAV imagery can be geometrically weaker.
Environmental factors introduced additional complications. The growth of filamentous algae during the experiments interfered with sensor performance and could have altered channel hydraulics modifying sediment dynamics. This necessitated frequent manual cleaning of algae, the setup of temporary filtration systems, and the formulation of a broader water quality management plan. Research in the OERF also entails operational challenges inherent to outdoor facilities. For example, runoff from heavy rainfall can erode channel banks where flow spills off the floodplain, and birds and other wildlife may find the facility an attractive habitat. These complexities illustrate the challenges involved in maintaining consistent boundary conditions across multi-day experiments under semi-natural conditions.
In this contribution, we introduced the Outdoor Experimental River Facility (OERF) at the Université de Sherbrooke, Quebec, Canada, and quantified its operating envelope relative to natural rivers and existing small and large river laboratories. This paper reports the first of three planned experimental campaigns at the OERF (a straight channel with no sediment supply), intended as a foundational exploration of facility capabilities and operational constraints to guide subsequent experiments using an initially sinuous planform, sediment recirculation, and floodplain vegetation. We also reported results of the initial set of experiments with a straight–channel planform and staged bar–pool perturbation to explore thresholds of bank erosion and lateral migration.
Within the feasible design space, flow in the OERF's 3 m wide gravel bedded channel was subcritical and fully rough at field–like Reynolds numbers (on the order of 105). Under constant discharge without upstream sediment supply, the bed rapidly armoured (surface D50 from ∼ 10 to ∼ 22 mm), and reach–scale planform change remained limited over 338 h run time. The bar-pool perturbation increased local velocities (by 8 %–27 %) and concentrated shear stress along the outer bank, producing measurable but spatially confined bank retreat. Log–law shear stress estimates yielded median τ0 of ∼ 10, 16, 29, and 20 Pa across perturbation phases 0–3, exceeding phase–reference τc after Phase 1. Together, these results demonstrate that experiments in the OERF can reproduce field–like hydraulics and illustrate the difficulty of catalyzing planform evolution at scale under sediment–limited conditions, where rapid armouring can outpace the longer-timescale morphological response.
Our initial experiments also provide lessons for future researchers designing outdoor experiments at this scale, including: (i) adding controlled sediment recirculation, extending run durations, and tuning slope, sediment grain size distributions (GSDs), and width–depth combinations to increase rates of morphological change; (ii) improve boundary controls through inlet flow–straightening/diffusion and tail–gate regulation; (iii) develop non-intrusive velocity measurements; and (iv) balance stronger bank-erosion drivers with additional bank strength such as floodplain vegetation to remain within the meandering domain (). Finally, although the staged bar-pool perturbation produced only local effects within the available experimental run time, testing hypotheses regarding the influence of perturbation type, magnitude, and timing on bank erosion and on bend-scale morphodynamics remains a promising research opportunity for future experiments at the OERF. Researchers at the OERF encourage collaborative research, and we welcome external partnerships to co-design and conduct future experimental campaigns.
All datasets supporting this study is deposited in the Université de Sherbrooke Dataverse (Borealis) under the collection “GREAUS – Outdoor Experimental River Facility (OERF)/Données expérimentales” and made openly available at https://doi.org/10.5683/SP3/4VX2YI (Mahmoud et al., 2025).
All authors (BMMM, ED, AR, MT, PMB, LSS, JL) contributed to the conceptualization, design, and execution of the experiments. ED led the design of the channel geometry and initial experiments. BMMM led the bar-pool perturbation design. AR contributed numerical simulations that informed the armouring analysis. BMMM, ED, and AR acquired and analyzed experimental data. BMMM prepared the original manuscript draft and led editing. All authors reviewed and revised the manuscript and approved the final version.
The contact author has declared that none of the authors has any competing interests.
Publisher's note: Copernicus Publications remains neutral with regard to jurisdictional claims made in the text, published maps, institutional affiliations, or any other geographical representation in this paper. The authors bear the ultimate responsibility for providing appropriate place names. Views expressed in the text are those of the authors and do not necessarily reflect the views of the publisher.
We thank the Groupe de Recherche sur l'Eau de l'Université de Sherbrooke (GREAUS) for financial, logistical and technical support. We are grateful to the laboratory technicians Nicolas Simard and Daniel Breton for their assistance with OERF operations, instrumentation, and data collection. We thank Referee 1 (Prof. Maarten Kleinhans) and Referee 2 (anonymous) for their constructive and insightful comments, which helped improve the framing and clarity of this manuscript. We also thank Prof. Jeremy Venditti for his insightful feedback, which was incorporated into this revised manuscript.
This research has been supported by the Fonds de recherche du Québec – Nature et technologies (FRQNT) (grant no.Team Research Project – 285933), and the Natural Sciences and Engineering Research Council of Canada (grant nos. RGPIN-2019-05501; RGPIN-2023-05495). The construction of the Research Complex for Hydrology, Hydraulics, and the Environment of the Université de Sherbrooke which includes the OERF was supported by the Canadian Government’s Post-Secondary Institutions Strategic Investment Fund, the Québec Government, the University of Sherbrooke, the UdeS Foundation, and several private donors and municipal partners: MRC de Memphrémagog, MRC Brome-Missisquoi, MRC du Granit, MRC du Val-Saint-François, and the City of Granby.
This paper was edited by Tom Coulthard and reviewed by Maarten Kleinhans and one anonymous referee.
Afzalimehr, H. and Anctil, F.: Velocity distribution and shear velocity behaviour of decelerating flows over a gravel bed, Can. J. Civil Eng., 26, 468–475, 1999. a, b
Ashworth, P., Peakall, J., and Best, J.: Physical Modelling in Fluvial Geomorphology: Principles, Applications and Unresolved Issues, John Wiley & Sons, 221–253, ISBN 9780471968115, 1996. a
Biron, P. M., Robson, C., Lapointe, M. F., and Gaskin, S. J.: Comparing different methods of bed shear stress estimates in simple and complex flow fields, Earth Surf. Proc. Land., 29, 1403–1415, 2004. a, b
Borsje, B., Kranenburg, W., Roos, P., Matthieu, J., and Hulscher, S.: The role of suspended load transport in the occurrence of tidal sand waves, J. Geophys. Res.-Earth, 119, 701–716, 2014. a, b
Brasington, J., Vericat, D., and Rychkov, I.: Modeling river bed morphology, roughness, and surface sedimentology using high resolution terrestrial laser scanning, Water Resour. Res., 48, W11519, https://doi.org/10.1029/2012WR012223, 2012. a
Braudrick, C. A., Dietrich, W. E., Leverich, G. T., and Sklar, L. S.: Experimental evidence for the conditions necessary to sustain meandering in coarse-bedded rivers, P. Natl. Acad. Sci. USA, 106, 16936–16941, 2009. a, b, c, d
Buffington, J. M. and Montgomery, D. R.: A systematic analysis of eight decades of incipient motion studies, with special reference to gravel-bedded rivers, Water Resour. Res., 33, 1993–2029, 1997. a, b
Bunte, K. and Abt, S. R.: Sampling surface and subsurface particle-size distributions in wadable gravel-and cobble-bed streams for analyses in sediment transport, hydraulics, and streambed monitoring, US Department of Agriculture, Forest Service, Rocky Mountain Research Station, https://doi.org/10.2737/RMRS-GTR-74, 2001. a
Chin, C., Melville, B., and Raudkivi, A.: Streambed armoring, J. Hydraul. Eng., 120, 899–918, 1994. a
Church, M. and Ferguson, R.: Morphodynamics: Rivers beyond steady state, Water Resour. Res., 51, 1883–1897, 2015. a
Crosato, A. and Mosselman, E.: An integrated review of river bars for engineering, management and transdisciplinary research, Water, 12, 596, https://doi.org/10.3390/w12020596, 2020. a, b
Das, V. K., Roy, S., Barman, K., Chaudhuri, S., and Debnath, K.: Study of clay–sand network structures and its effect on river bank erosion: an experimental approach, Environ. Earth Sci., 78, 591, https://doi.org/10.1007/s12665-019-8613-5, 2019. a
Dey, S.: Fluvial hydrodynamics, Springer, 109–115, https://doi.org/10.1007/978-3-642-19062-9, 2014. a
Dickson, E.: Characterization and prediction of fluvial bank retreat using novel physical experiments, Degree of master of science (geography, urban and environmental studies), Concordia University, https://spectrum.library.concordia.ca/id/eprint/992699/ (last access: 12 Febraury 2026), 2023. a, b
Dietrich, W. E., Kirchner, J. W., Ikeda, H., and Iseya, F.: Sediment supply and the development of the coarse surface layer in gravel-bedded rivers, Nature, 340, 215–217, 1989. a
Elgueta-Astaburuaga, M. A. and Hassan, M. A.: Experiment on temporal variation of bed load transport in response to changes in sediment supply in streams, Water Resour. Res., 53, 763–778, 2017. a
Engel, F. L. and Rhoads, B. L.: Velocity profiles and the structure of turbulence at the outer bank of a compound meander bend, Geomorphology, 295, 191–201, 2017. a
Ferguson, R. and Church, M.: A simple universal equation for grain settling velocity, J. Sediment. Res., 74, 933–937, 2004. a
Folk, R. L. and Ward, W. C.: Brazos River bar [Texas]; a study in the significance of grain size parameters, J. Sediment. Res., 27, 3–26, 1957. a
Fredsøe, J.: Meandering and braiding of rivers, J. Fluid Mech., 84, 609–624, 1978. a
Friedkin, J. F.: A laboratory study of the meandering of alluvial rivers, United States Waterways Experiment Station, https://usace.contentdm.oclc.org/digital/collection/p266001coll1/id/9666 (last access: 12 Ferbruary 2026), 1945. a, b
Fujita, I., Muste, M., and Kruger, A.: Large-scale particle image velocimetry for flow analysis in hydraulic engineering applications, J. Hydraul. Res., 36, 397–414, 1998. a
Gorrick, S. and Rodríguez, J. F.: Scaling of sediment dynamics in a laboratory model of a sand-bed stream, J. Hydro-Environ. Res., 8, 77–87, 2014. a
Han, E. J., Kim, Y. D., Baek, K. O., and Seo, I. W.: Relation between transverse dispersion and diffusion at meandering channel in two-dimensional mixing based on tracer tests, Environ. Earth Sci., 78, 1–11, 2019. a
Hassan, M. A., Parker, G., Hassan, Y., An, C., Fu, X., and Venditti, J. G.: The roles of geometry and viscosity in the mobilization of coarse sediment by finer sediment, P. Natl. Acad. Sci. USA, 121, e2409436121, https://doi.org/10.1073/pnas.2409436121, 2024. a
Heritage, G. and Hetherington, D.: Towards a protocol for laser scanning in fluvial geomorphology, Earth Surf. Proc. Land., 32, 66–74, 2007. a
Jaud, M., Bertin, S., Beauverger, M., Augereau, E., and Delacourt, C.: RTK GNSS-assisted terrestrial SfM photogrammetry without GCP: Application to coastal morphodynamics monitoring, Remote Sensing, 12, 1889, https://doi.org/10.3390/rs12111889, 2020. a
Khosronejad, A., Kozarek, J. L., and Sotiropoulos, F.: Simulation-based approach for stream restoration structure design: Model development and validation, J. Hydraul. Eng., 140, 04014042, https://doi.org/10.1061/(ASCE)HY.1943-7900.000090, 2014. a
KICT: River Experiment Center (Andong), https://www.kict.re.kr/menu.es?mid=a20302030000 (last access: 20 November 2023), 2023. a
Kleinhans, M.: Upstream sediment input effects on experimental dune trough scour in sediment mixtures, J. Geophys. Res.-Earth, 110, F04S06, https://doi.org/10.1029/2004JF000169, 2005. a
Kleinhans, M. G. and van den Berg, J. H.: River channel and bar patterns explained and predicted by an empirical and a physics-based method, Earth Surf. Proc. Land., 36, 721–738, 2011. a
Kleinhans, M. G., Ferguson, R. I., Lane, S. N., and Hardy, R. J.: Splitting rivers at their seams: bifurcations and avulsion, Earth Surf. Proc. Land., 38, 47–61, 2013. a
Kleinhans, M. G., van Dijk, W. M., van de Lageweg, W. I., Hoyal, D. C., Markies, H., van Maarseveen, M., Roosendaal, C., van Weesep, W., van Breemen, D., Hoendervoogt, R., and Cheshier, N.: Quantifiable effectiveness of experimental scaling of river-and delta morphodynamics and stratigraphy, Earth-Sci. Rev., 133, 43–61, 2014. a, b, c, d, e
Kleinhans, M. G., Braudrick, C., van Dijk, W. M., Van de Lageweg, W. I., Teske, R., and Van Oorschot, M.: Swiftness of biomorphodynamics in Lilliput-to Giant-sized rivers and deltas, Geomorphology, 244, 56–73, 2015. a
Kleinhans, M. G., McMahon, W. J., and Davies, N. S.: What even is a meandering river? A philosophy-enhanced synthesis of multilevel causes and systemic interactions contributing to river meandering, Geological Society, London, Special Publications, 540, 43–74, https://doi.org/10.1144/SP540-2022-138, 2024. a, b, c, d, e, f
Knighton, D.: Fluvial forms and processes: a new perspective, Routledge, 205–212, https://doi.org/10.4324/9780203784662, 2014. a, b
Lague, D.: Terrestrial laser scanner applied to fluvial geomorphology, in: Developments in earth surface processes, Elsevier, 23, 231–254, 2020. a
Lajeunesse, E., Malverti, L., Lancien, P., Armstrong, L., Metivier, F., Coleman, S., Smith, C. E., Davies, T., Cantelli, A., and Parker, G.: Fluvial and submarine morphodynamics of laminar and near-laminar flows: A synthesis, Sedimentology, 57, 1–26, 2010. a
Lanzoni, S.: Experiments on bar formation in a straight flume: 1. Uniform sediment, Water Resour. Res., 36, 3337–3349, 2000. a
Lanzoni, S. and Seminara, G.: On the nature of meander instability, J. Geophys. Res.-Earth, 111, F04006, https://doi.org/10.1029/2005JF000416, 2006. a
Lewis, Q. W. and Rhoads, B. L.: Resolving two-dimensional flow structure in rivers using large-scale particle image velocimetry: An example from a stream confluence, Water Resour. Res., 51, 7977–7994, 2015. a
Lu, J., Liao, X., and Zhao, G.: Experimental study on effects of geometric distortion upon suspended sediments in bending channels, Sediment. Geol., 294, 27–36, 2013. a
Mahmoud, B. M. M., Dickson, E., Renault, A., Trudel, M., Biron, P., Sklar, L., and Lacey, J.: Data and code for: New outdoor experimental river facility to study river dynamics (article submission), V1, Borealis [data set/code], https://doi.org/10.5683/SP3/4VX2YI, 2025. a
Métivier, F., Paola, C., Kozarek, J., and Tal, M.: Experimental studies and practical challenges in fluvial geomorphology, Tools in Fluvial Geomorphology, 2nd edn., Wiley Online Library, 454–475, https://doi.org/10.1002/9781118648551.ch20, ISBN 9780470684054, 2016. a
Métivier, F., Lajeunesse, E., and Devauchelle, O.: Laboratory rivers: Lacey's law, threshold theory, and channel stability, Earth Surf. Dynam., 5, 187–198, https://doi.org/10.5194/esurf-5-187-2017, 2017. a, b
Nelson, P. A., Dietrich, W. E., and Venditti, J. G.: Bed topography and the development of forced bed surface patches, J. Geophys. Res.-Earth, 115, F04024, https://doi.org/10.1029/2010JF001747, 2010. a
Nikora, V.: 3 Hydrodynamics of gravel-bed rivers: scale issues, Developments in Earth Surface Processes, 11, 61–81, 2007. a
Paola, C., Straub, K., Mohrig, D., and Reinhardt, L.: The “unreasonable effectiveness” of stratigraphic and geomorphic experiments, Earth-Sci. Rev., 97, 1–43, 2009. a, b, c
Parker, G. and Wilcock, P. R.: Sediment feed and recirculating flumes: Fundamental difference, J. Hydraul. Eng., 119, 1192–1204, 1993. a
Parker, G., Toro-Escobar, C. M., Ramey, M., and Beck, S.: Effect of floodwater extraction on mountain stream morphology, J. Hydraul. Eng., 129, 885–895, 2003. a
Peakall, J., Ashworth, P. J., and Best, J. L.: Meander-bend evolution, alluvial architecture, and the role of cohesion in sinuous river channels: a flume study, J. Sediment. Res., 77, 197–212, 2007. a
Phillips, C. B., Masteller, C. C., Slater, L. J., Dunne, K. B., Francalanci, S., Lanzoni, S., Merritts, D. J., Lajeunesse, E., and Jerolmack, D. J.: Threshold constraints on the size, shape and stability of alluvial rivers, Nature Reviews Earth & Environment, 3, 406–419, 2022. a, b
PWRI-NRDA: Aqua Research Restoration Center, https://www.pwri.go.jp/team/kyousei/eng/about/m2_02%20facility_outline.htm (last access: 21 November 2023), 2023. a
Rachelly, C., Vetsch, D. F., Boes, R. M., and Weitbrecht, V.: Sediment supply control on morphodynamic processes in gravel-bed river widenings, Earth Surf. Proc. Land., 47, 3415–3434, 2022. a
Redolfi, M., Welber, M., Carlin, M., Tubino, M., and Bertoldi, W.: Morphometric properties of alternate bars and water discharge: a laboratory investigation, Earth Surf. Dynam., 8, 789–808, https://doi.org/10.5194/esurf-8-789-2020, 2020. a, b
Redolfi, M., Musa, M., and Guala, M.: On steady alternate bars forced by a localized asymmetric drag distribution in erodible channels, J. Fluid Mech., 916, A13, https://doi.org/10.1017/jfm.2021.122, 2021. a
Renault, A.: Modélisation numérique de la formation d'une couche de pavage dans une rivière expérimentale novatrice, Degree of Master of Science, Département de génie civil et de génie du bâtiment, Université de Sherbrooke, QC, http://hdl.handle.net/11143/21515 (last access: 12 Febraury 2026), 2024. a
Rhoads, B. L.: River dynamics: geomorphology to support management, Cambridge University Press, 186–233, https://doi.org/10.1017/9781108164108, 2020. a, b
Rhoads, B. L. and Welford, M. R.: Initiation of river meandering, Prog. Phys. Geog., 15, 127–156, 1991. a, b
Roy, A. G., Buffin-Belanger, T., Lamarre, H., and Kirkbride, A. D.: Size, shape and dynamics of large-scale turbulent flow structures in a gravel-bed river, J. Fluid Mech., 500, 1–27, 2004. a
Roy, S., Barman, K., Das, V., Debnath, K., and Mazumder, B.: Experimental investigation of undercut mechanisms of river bank erosion based on 3D turbulence characteristics, Environmental Processes, 7, 341–366, 2020. a
Saadon, A., Abdullah, J., Muhammad, N., Ariffin, J., and Julien, P.: Predictive models for the estimation of riverbank erosion rates, Catena, 196, 104917, https://doi.org/10.1016/j.catena.2020.104917, 2021. a
Simon, A., Curini, A., Darby, S. E., and Langendoen, E. J.: Bank and near-bank processes in an incised channel, Geomorphology, 35, 193–217, 2000. a
Sklar, L. S.: Grain size in landscapes, Annu. Rev. Earth Pl. Sc., 52, 663–692, 2024. a
Smith, L. C.: Rivers of power: how a natural force raised kingdoms, destroyed civilizations, and shapes our world, Penguin UK, 132–133, 316–317, ISBN 9780316411981, 2020. a
UMN-CSE: Outdoor StreamLab – Anthony Falls Laboratory, https://cse.umn.edu/safl/outdoor-streamlab (last access: 20 November 2023), 2023. a
Van Dijk, W. M., Van de Lageweg, W., and Kleinhans, M. G.: Experimental meandering river with chute cutoffs, J. Geophys. Res.-Earth, 117, F03023, https://doi.org/10.1029/2011JF002314, 2012. a, b, c, d
van Dijk, W. M., van de Lageweg, W. I., and Kleinhans, M. G.: Formation of a cohesive floodplain in a dynamic experimental meandering river, Earth Surf. Proc. Land., 38, 1550–1565, 2013. a
Venditti, J., Nelson, P., Minear, J., Wooster, J., and Dietrich, W.: Alternate bar response to sediment supply termination, J. Geophys. Res.-Earth, 117, F02039, https://doi.org/10.1029/2011JF002254, 2012. a
Vignaga, E., Sloan, D. M., Luo, X., Haynes, H., Phoenix, V. R., and Sloan, W. T.: Erosion of biofilm-bound fluvial sediments, Nat. Geosci., 6, 770–774, 2013. a
Weiss, S. F. and Higdon, J. J.: Dynamics of meandering rivers in finite-length channels: linear theory, J. Fluid Mech., 938, A11, https://doi.org/10.1017/jfm.2022.131, 2022. a
Wilcock, P. R. and Crowe, J. C.: Surface-based transport model for mixed-size sediment, J. Hydraul. Eng., 129, 120–128, 2003. a, b
Wilcock, P. R. and DeTemple, B. T.: Persistence of armor layers in gravel-bed streams, Geophys. Res. Lett., 32, L08402, https://doi.org/10.1029/2004GL021772, 2005. a
Wohl, E.: A world of rivers: environmental change on ten of the world's great rivers, University of Chicago Press, 198–201, ISBN 9780226904788, 2010. a
Wohl, E.: Rivers in the Landscape, John Wiley & Sons, 225–253, ISBN 9781119535430, 2020. a
Zhao, K., Coco, G., Gong, Z., Darby, S. E., Lanzoni, S., Xu, F., Zhang, K., and Townend, I.: A review on bank retreat: Mechanisms, observations, and modeling, Rev. Geophys., 60, e2021RG000761, https://doi.org/10.1029/2021RG000761, 2022. a