
the Creative Commons Attribution 4.0 License.
the Creative Commons Attribution 4.0 License.
 | 02 Sep 2026
Fluvio-alluvial source-sink relationships at the Skeleton Coast of northern Namibia: a parametric analysis
Joel Mohren

Janek Walk
Julian Krieger
Wolfgang Römer
Anna Nguno
Frank Lehmkuhl
The hyperarid Skeleton Coast of Namibia hosts a diverse suite of alluvial landforms, often shaped by varying degrees of lateral and distal confinement primarily through fan coalescence, the Atlantic Ocean, and the Skeleton Coast Erg. Considerable heterogeneity also characterises the source areas, as reflected in catchment morphometry, lithology, and coast-perpendicular moisture gradients, where larger inland-draining catchments intercept more precipitation. On the regional scale, this heterogeneity blurs (hydro-) morphometric source-sink relationships between alluvial landforms and catchments, despite overall geomorphic drainage maturity which could imply similar efficacy in source-sink communication.
To disentangle these patterns, we mapped 67 drainage systems and obtained a dataset including (hydro-) morphometric, climatic, and geologic parameters for these systems. An exploratory data analysis framework combining cluster and partial correlation analyses was applied to these datasets after quality filtering and outlier removal, retaining 47 alluvial landforms. Three distinct clusters were identified for both alluvial landforms and catchments, with limited matching observed between alluvial landform and catchment clusters. The clearest source-sink coupling is attributed to a cluster of near-coastline fans, spanning much of the study area but with a spatial focus on its northern portion. By contrast, the majority of alluvial landforms form bajadas strongly influenced by the Skeleton Coast Erg, where distal confinement masks simple morphometric scaling.
Our results highlight fan confinement as the main driver affecting source-sink relationships at the Skeleton Coast. Fan morphometry appears to be more decisive than catchment properties, with fan gradient (< 1° on average) emerging as a reliable discriminator. No robust lithological or climatic (as inferred from modern climatological data) control on fan morphometry could be identified, although Sentinel-1 radar backscatter indicates more stable fan surfaces south of the Skeleton Coast Erg.
Overall, the Skeleton Coast represents a low-dynamics dryland margin where fan gradient provides the most meaningful parameter for source–sink analysis. Least-confined fans show the strongest coupling and thus constitute promising targets for paleoenvironmental reconstruction, while environmental conditions in the southern portion of the study area may have so far provided the most favourable conditions for long-term archive preservation.
- Article
(11156 KB) - Full-text XML
- BibTeX
- EndNote


Alluvial deposits can store a variety of information on environmental factors and processes affecting these deposits before, during, and after deposition has occurred (e.g. Bowman, 2019a). As such, the sediments provide a window to infer time-integrated information on environmental conditions controlling the detachment and conveyance of sediments in the source areas until deposition in the sink within a given fluvial routing system (see e.g. Fryirs and Brierley, 2012; Harvey, 2011). In addition to traditional field mapping, a wealth of methodologies is available to researchers for obtaining information about (paleo-)environmental processes from alluvial deposits at the sink and/or along the sediment routing pathways, including mineralogical and sedimentological (e.g. Krapf et al., 2005; Lustig, 1965; Harvey et al., 2003; D'Arcy et al., 2016), (geo-)chronological and/or morphostratigraphic (e.g. Bartz et al., 2020a, b; Harvey et al., 1999a, b; Owen et al., 2002, 2006, 2011, 2014; Woor et al., 2023b; D'Arcy et al., 2019, 2025), geophysical (e.g. Arboleda-Zapata et al., 2023; Franke et al., 2014) and remote sensing-based methods (e.g. Harvey, 1996; Pipaud and Lehmkuhl, 2017; Woor et al., 2023a; Walk et al., 2020; D'Arcy et al., 2018; Frankel and Dolan, 2007). In general, there is a tendency toward an increase in the diversity of applied methodology at smaller spatial scales and number of systems studied (e.g. Walk et al., 2022, 2023), while in model space, landscape evolution modelling increasingly allows to identify factors influencing fan formation and source-sink coupling in fluvial systems (Wild et al., 2025a, b, c). From a morphological point of view, any sediment transport from clast-dominated debris flows to more water-dominated fluvial flows can result in the formation of gently sloping radial landforms termed alluvial fans, although a holistic definition of these landforms is still a matter of debate (see Lehmkuhl and Owen, 2024, for a detailed review). The formation of such landforms requires sufficient accommodation space for the sediments to distribute in the sink, which is usually achieved in areas downstream of transition between high-relief and low-relief topography, a point in space marking the location of the initial fan apex (e.g. Bowman, 2019a). The tendency of alluvial deposition processes to form such distinct landforms – either as individual fans, coalescing fans, coalescing fans forming bajadas – or ultimately hardly delimitable deposits as part of pediments, has been exploited on regional to global scales to mathematically explain source-sink dynamics, i.e. alluvial deposition vs. catchment morphometric and parametric coupling (e.g. Walk et al., 2020; Woor et al., 2023a; Harvey et al., 1999b; Bull, 1964, 1977; Crosta and Frattini, 2004; Bahrami, 2013a; Silva et al., 1992; Harvey, 2005). This approach is explicitly reliant on the assumption that for a given spatial scale, environmental conditions in the source area are related to the alluvial landform formation in the sink area (e.g. Bull, 1977; Crosta and Frattini, 2004). As with many natural systems (e.g. Hack, 1957), regularly inferred allometric relationships between catchment and fan follow a power-law relationship, i.e.,
where the variables A and B are placeholders for fan (index f) and catchment (index c) variables. The classic list of variables used in Eq. (1) often includes area (ac, af), gradient (gf), and Melton's ruggedness number (Mc), the latter representing a steepness index for the catchment (Crosta and Frattini, 2004; Melton, 1965). For undisturbed source-sink systems at steady state, Eq. (1) as af(ac) and gf(ac) relationships (i.e., af = f(ac) and gf = f(ac); throughout this manuscript, the abbreviated form is used) usually predict that increasing catchment sizes result in non-linearly increasing fan areas and decreasing fan gradients, as larger catchments can release more sediments with a tendency toward higher water-sediment ratios as compared to smaller catchments (see Crosta and Frattini, 2004, and Woor et al., 2023a, for detailed reviews). The relationship gf(Mc) has been proposed to reflect fluvial vs. debris flow alluvial fan evolution (Jackson et al., 1987).
Such morphometry-based research has been pushed during the past 2 decades by availability of high-resolution digital terrain model (DTM) data covering most parts of planet Earth (and other planets, e.g. Wilkinson et al., 2023), which has led to a growing database of morphometrical and parametrical information on both fans and catchments (e.g. Wilkinson and Currit, 2023; Woor et al., 2023a; Walk et al., 2020).
Research has focused on the coefficients x1 and exponents y1 of Eq. (1), in tandem with regression analyses to assess the quality of parametric source-sink coupling (e.g., Harvey et al., 1999b; Crosta and Frattini, 2004; Karymbalis et al., 2016; Harvey, 2005). The aim of such studies is to assess the importance of different environmental factors, predominantly tectonics, climate, lithology, and fan confinement including post-depositional alterations, to the overall fan formation (e.g., Bull, 1977). Few studies have interpreted such source-sink relationship patterns by linear regression (e.g. Bahrami, 2013a), i.e.,
where the coefficients x2 and x3 denote the slope of the regression and the intersection with the ordinate. Such attempts, however, can violate isometry by a non-origin intersection of the regression (Church and Mark, 1980), although datasets can still be interpreted by linear regression without considering the intercept, such that the relationship is only assessed for the data range (Montgomery et al., 2021). Given the power-law relationship expressed in Eq. (1), logarithmising yields a linear relationship of log-transformed variables. This transformation allows to straightforwardly determine the proportion of the variation in the dependent variable predictable from the independent variable (r2):
In a given natural setting, however, even strong and significant bivariate correlations may be strongly controlled by other variables, potentially diluting the bivariate relationship significance (Erb, 2020). Using a multivariate dataset, more robust, i.e. isolated, bivariate relationship estimates can be obtained from partial correlation analysis (e.g. Erb, 2020; Sepúlveda and Padilla, 2008). In addition, the analysis of very heterogenous study areas, e.g. characterised by non-uniform catchment lithologies (Silva et al., 1992), local tectonics (Bahrami, 2013a), or fan confinement (Stokes and Mather, 2015), may benefit from efforts to homogenise such datasets. This step can be conducted manually, i.e., by subjectively separating groups of fans according to common fan and/or catchment properties, such as often conducted to aid the interpretation of regression analysis data (e.g. Harvey, 2005; Silva et al., 1992). Especially regarding post-depositional alterations, the fan age (and/or subsequent fan activities) can be crucial for the abovementioned analyses, as the probability in alterations of fan morphology (and/or in catchment metrics) increases with increasing post-progradation system lifetime, which is usually related to climate and/or base-level changes (e.g. Allen, 2008). Conversely, in settings of long-term environmental stability, alluvial systems may evolve into persistent geomorphic archives that register environmental change mainly through subtle variations in sediment routing. Assessing how faithfully such archives preserve evidence of source–sink coupling is thus essential for their interpretation.
In this light, alluvial deposits situated along the Skeleton Coast of northern Namibia could be suspected to indicate weak source-sink coupling by their morphometrical properties: At least some of the deposits are believed to reflect Middle Pleistocene to Pliocene progradation (Lehmkuhl and Owen, 2024; Stollhofen et al., 2014; Miller et al., 2021), where fan confinement and post-depositional alteration is achieved by the coastal location and sea-level changes, as e.g. evident for the Horingbaai fan situated at the southern margin of the Skeleton Coast (Stollhofen et al., 2014). The predominant deposition mode has been shown to be somewhat heterogenous across the different systems, ranging from distributive fluvial systems (e.g. Krapf et al., 2005) to hyperconcentrated to sheet flow dominated alluvial fans or fan deltas (Lehmkuhl and Owen, 2024; Stollhofen et al., 2014). Furthermore, a coast-parallel dune belt, the Skeleton Coast Erg, has overridden alluvial deposits along the coast, blocking overland transport of alluvial sediments towards the coastline potentially around or after the Last Glacial Maximum (LGM; Miller et al., 2021; Blümel et al., 2000). The fact that deposits along the Skeleton Coast are not uniformly affected by post-depositional alterations increases the overall heterogeneity in alluvial landform properties, exemplified by different degrees of desert pavement formation and CaSO4 surface encrustation as observed in the field (Fig. 1).
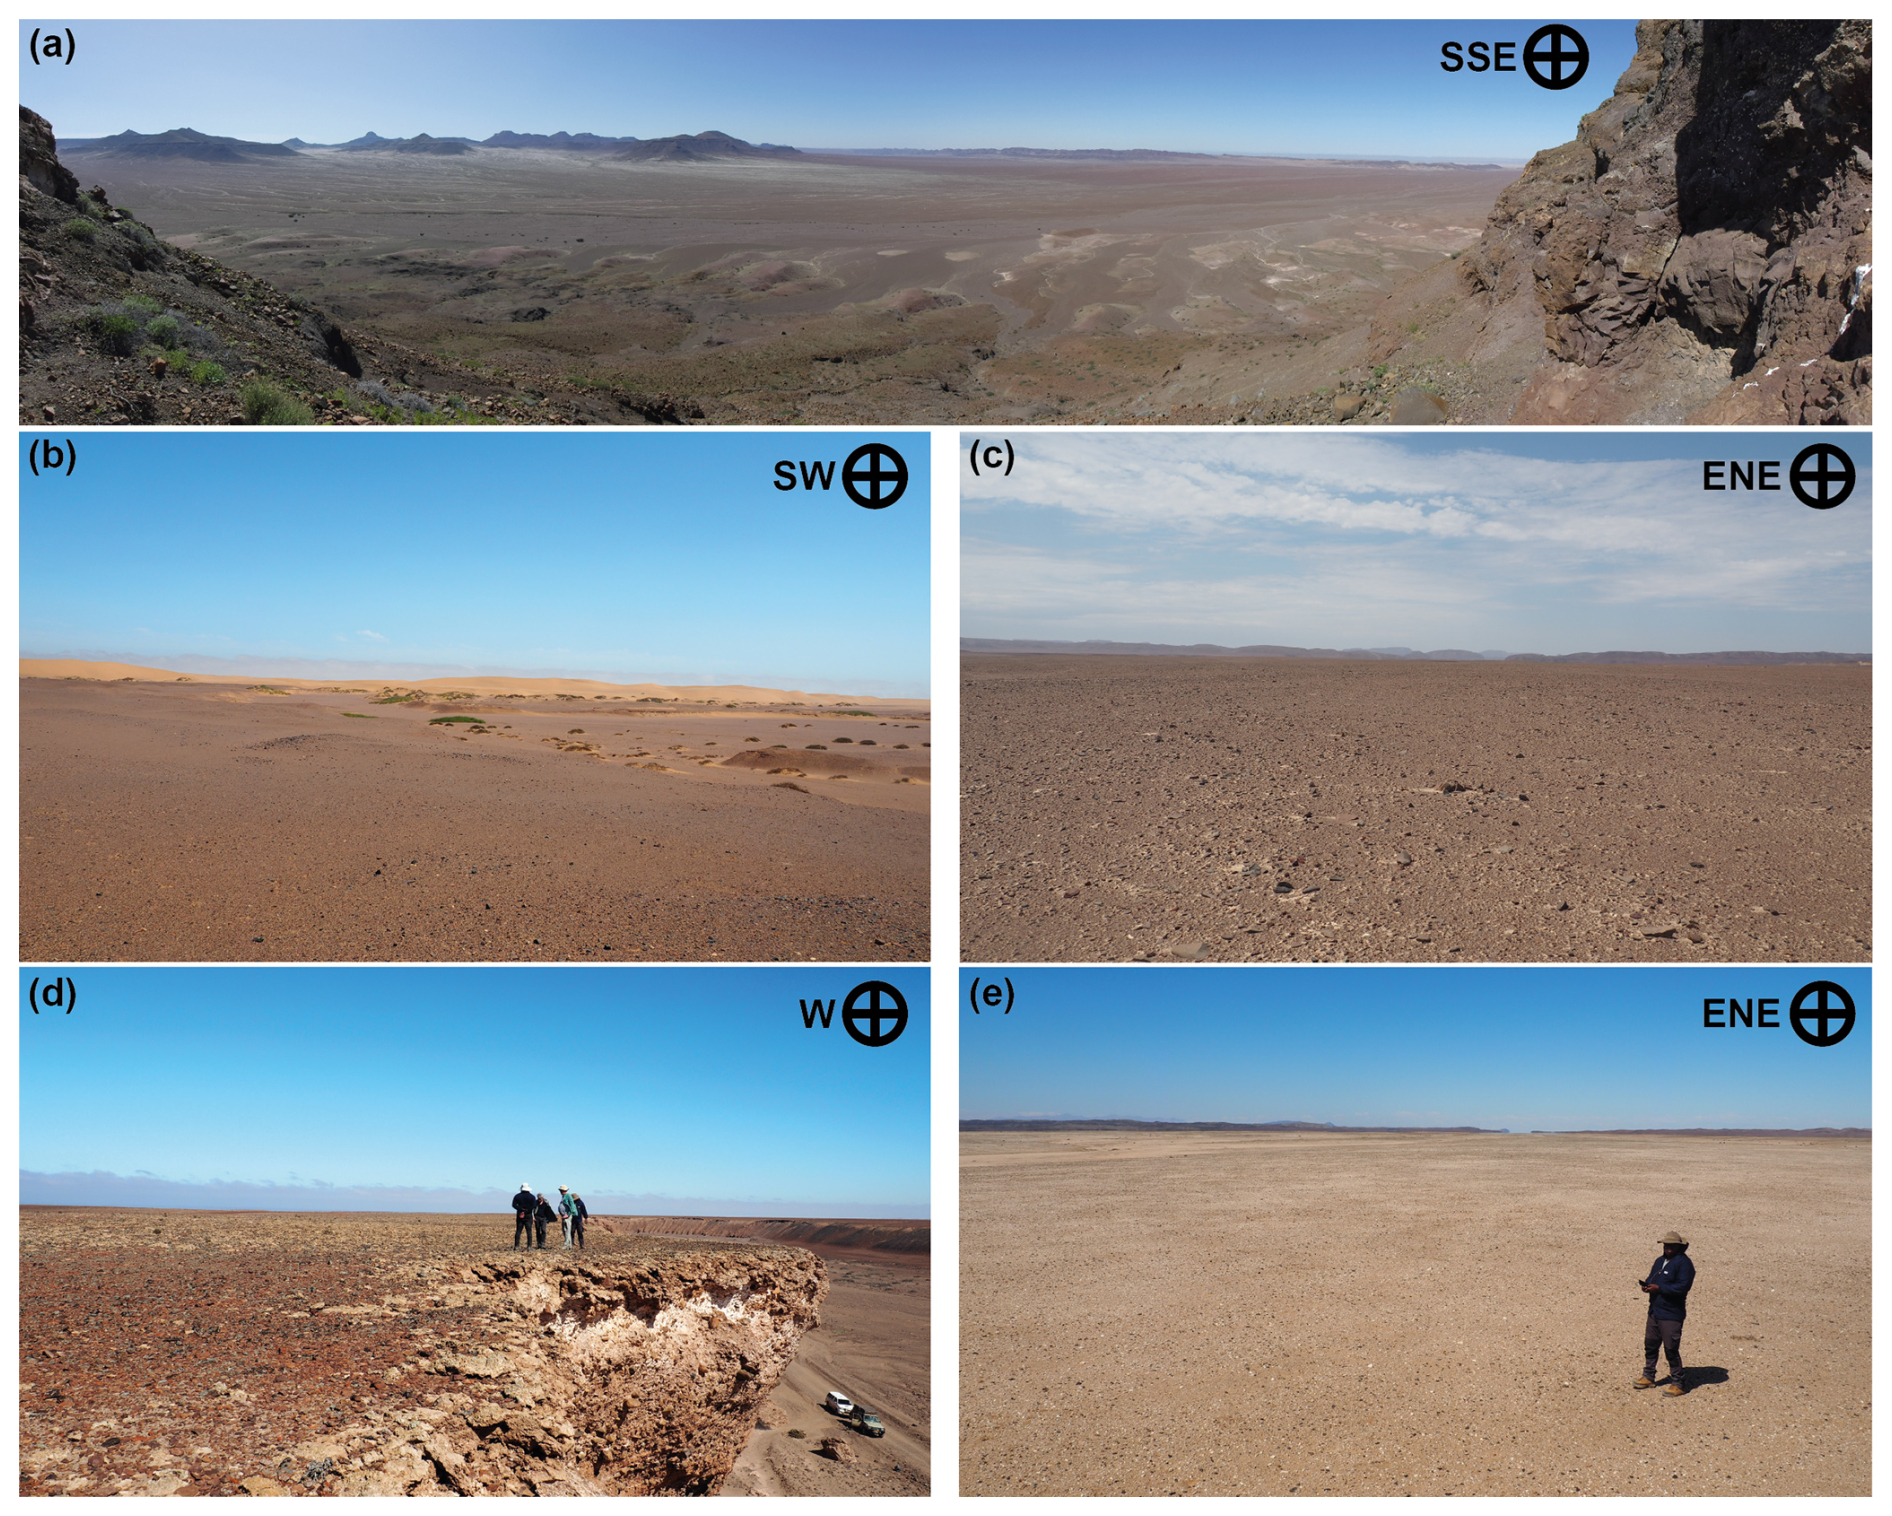
Figure 1Examples of different alluvial fans investigated in this study. From north to south: (a) Sechomib, IDs #11.1 and 11.2, 18.4° S, 12.6° E; (b) Kharu-Gaiseb, #30, 19.9° S, 13.2° E; (c) Koigab, #44, 20.5° S, 13.4 ° E; (d) Messum (upper), #62.2, 21.4° S, 14.0° E; and (e) Horingbaai, #63, 21.6° S, 13.9° E. Note the different surface generations evident in panel (a), dunes of the Skeleton Coast Erg overlying alluvial deposits and blocking overland flow in panel (b), desert pavement, often on CaSO4-encrusted surfaces in panels (c) to (e). Images were taken during field campaigns in 2022 and 2023.
However, the Skeleton Coast is situated on a passive continental margin characterised by minimal (neo-)tectonic activity and arid conditions presumed to have largely persisted since the early Cretaceous, preserving a Cretaceous to Miocene planation surface, i.e. the Namib Plains (see Goudie and Viles, 2015e, for a comprehensive review). This environment has contributed to widespread preservation of alluvial systems, such that pre-Holocene fan shapes can be still identified from satellite imagery. Furthermore, and as a result from the abovementioned planation, most catchments are confined to the hinterland by the Great Escarpment, providing a spatial frame for catchment extent and precipitation gradients, the latter which increase gradually towards the hinterland (Jacobsen et al., 1995). This setting presents a potential frame to accumulate and archive viable information of (paleo-) environmental conditions in alluvial landforms over the long-term as in other dryland regions (e.g. Bartz et al., 2020a; Walk et al., 2022, 2023; Woor et al., 2023b).
In this regard, the environmental conditions encountered along the Skeleton Coast pose an analogue to the setting of coastal alluvial fans found at the Atacama Desert in northern Chile (see Walk et al., 2020). However, the Skeleton Coast fans are much larger in size and of greater antiquity, thus categorised as large-scale type III' fans in the recent global comparison of alluvial fan systems provided by Lehmkuhl and Owen (2024). The classification assigns the cratonic environment at the Skeleton Coast to provide conditions for alluvial deposition characterised by comparably low sediment production and flux, while alluvial landforms range at the upper end of global fan size (> 103 km radius) and time (on million-years timescales). As such, the alluvial deposits may represent valuable climate archives for the Quaternary.
However, available information on paleoenvironmental conditions along the Skeleton Coast has either temporal (see e.g. Stuut et al., 2002; Walsh et al., 2023) or spatial (see e.g. Stollhofen et al., 2014) limitations, which justifies a focus on a comprehensive analysis on alluvial landforms along the Skeleton Coast. A comprehensive regional interpretation of such archives would strongly benefit from knowledge on the characteristics of fluvio-alluvial source sink-relationships, allowing for a regional comparison of fan systems to identify drivers in transient fan evolution. Thus, we here take the unique setting as a challenge to investigate these relationships based on (hydro-)morphometric, geologic, and climatic datasets for the fluvio-alluvial landforms located along the Skeleton Coast. We seek to resolve the heterogeneity of both fan and catchment characteristics not by subjective grouping but by using cluster analysis to semi-objectively group the studied systems by their variable manifestations, allowing for a more targeted interpretation of our datasets (cf. Crosta and Frattini, 2004; Saito, 1980; Karymbalis et al., 2016). This approach allows us to separate clusters of source-sink-systems and examine the contribution of individual factors to alluvial landform evolution.
Drainage along the Skeleton Coast of northern Namibia is characterised by broadly east-west (E-W) oriented catchments, achieving sediment conveyance from the hinterland towards the Atlantic Ocean (Fig. 2). Drainage north of the Huab River (ocean pour point at 20.9° S) is mostly confined to the Namib Plains, i.e., the area between the ocean and the Great Escarpment less than 200 km inland, the latter forming the main watershed of Skeleton Coast drainage at ≈ 1000 m above sea level (a.s.l.). Exceptions include the Hoanib (19.5° S) and Hoarusib (19.1° S) drainages, which have significant portions of their catchments incising into the hinterland east of the Great Escarpment. A similar observation holds for the Huab and Ugab (21.2° S) fluvial systems, which drain an area commonly referred to as The Escarpment Gap (Kempf, 2010), allowing the Ugab river to extend its catchment ≈ 400 km from the coastline.
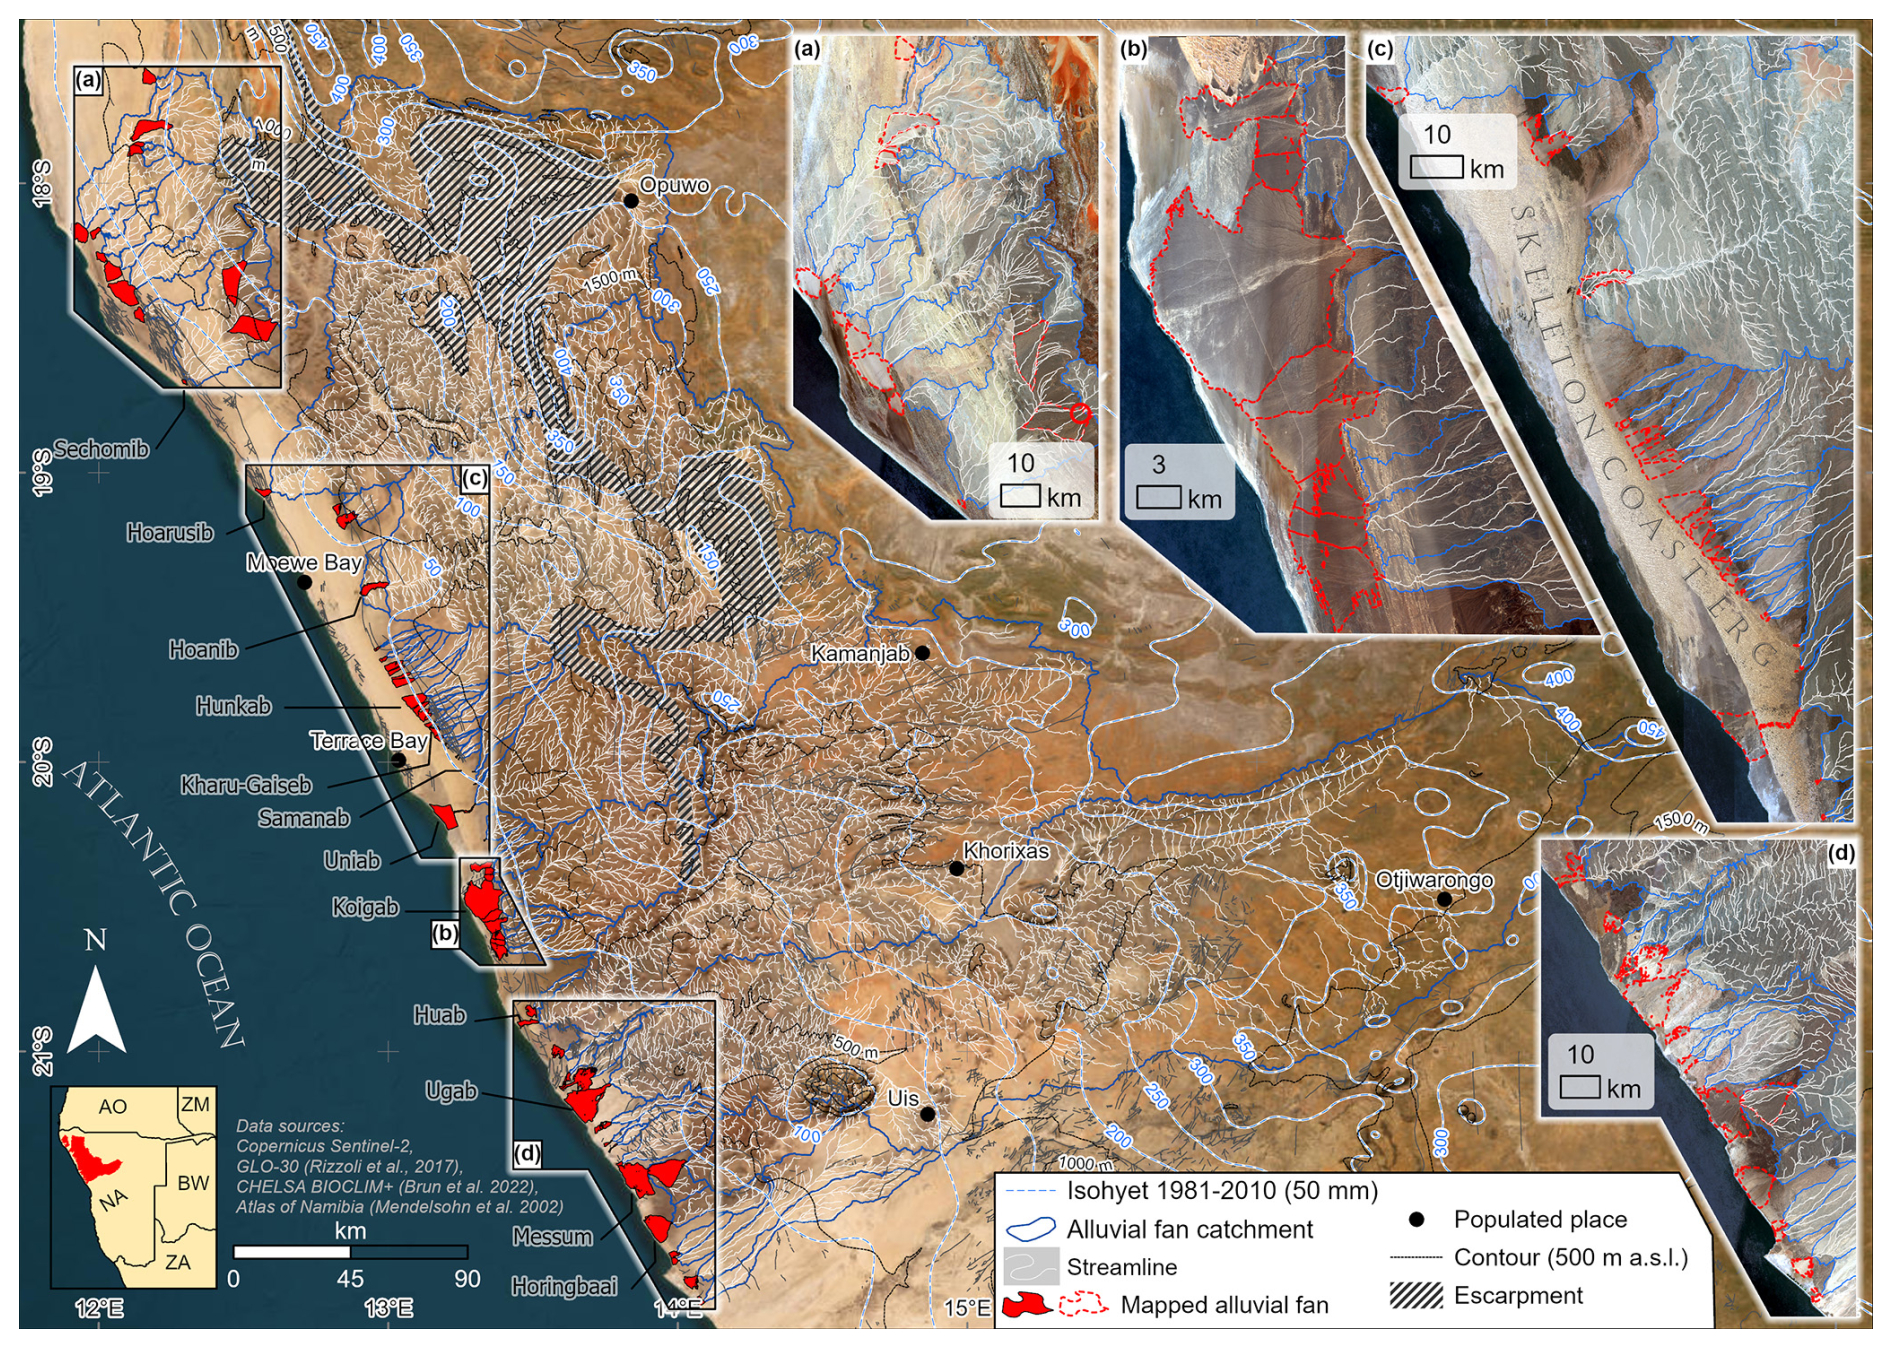
Figure 2Overview on the study area, spanning the Skeleton Coast of Namibia and its hinterland. Magnification of the different alluvial landforms as mapped in this study is provided in panels (a) to (d).
The general eastward confinement of drainage has important implications for the rainfall the fluvial systems of the Skeleton Coast can collect. Modern mean annual rainfall gradually increases from the coastline (< 50 mm yr−1) towards the hinterland, with about 100–200 mm yr−1 of rainfall received by the headwater areas close to the Great Escarpment (Jacobsen et al., 1995; Mendelsohn et al., 2003). Hyperaridity at the Skeleton Coast is predominantly governed by the cold Benguela Current and upwelling of cold water offshore, plus the latitudinal position, which lies within the descending limb of the Hadley Circulation (Blümel, 2013). The hyperarid conditions along the coast are somewhat modulated by advection of fog from the ocean, which can be traced even beyond the Great Escarpment (Andersen and Cermak, 2018; Olivier, 1995). For example, Li et al. (2018) measured a total fog water amount of about 90 mm within 80 rainless days (August to November) in 2015 at Kleinberg (23.0° S, 180 m a.s.l.). At Gobabeb (23.6° S, 405 m a.s.l.) the authors measured the 80 d fog amount to exceed mean annual rainfall by a factor of about 1.3. Closer to the coast, Lancaster (1984) measured about 34 mm of precipitation from fog at Swakopmund (1967–1975 with data gaps; 22.6° S, 20 m a.s.l.). Fog precipitation carries aerosols and salts (Na+, Cl−, Ca2+, and SO; Klopper et al., 2020) contributing to onshore gypsum crust (gypcrete; CaSO4 × 2H2O) formation (e.g. Eckardt and Spiro, 1999; Watson, 1979) and driving salt weathering processes (Goudie and Viles, 2015c). In hyperarid environments, these mechanisms can enhance surface preservation of alluvial surfaces (e.g. Mohren et al., 2020; Rech et al., 2003), but can also promote sediment production as observed in the coastal Atacama Desert (Walk et al., 2022).
Increasing rainfall towards the hinterland is concentrated in austral summer and predominantly related to the migration of tropical-temperate troughs originating from the South Indian Convergence Zone, with moisture sources mainly coming from the northwest (Geppert et al., 2022; Harrison, 1984; Todd and Washington, 1999; Hart et al., 2010; Macron et al., 2014). While the history of aridity in Namibia is generally a matter of debate in terms of both space and time, (hyper-)arid conditions can be assumed to have persisted at the Skeleton Coast during the Quaternary and beyond, punctuated by less arid episodes (Goudie and Viles, 2015b; Dupont et al., 2005). Regarding the latter, grain size analyses of drill-core sediments collected offshore and slightly south of our study area (≈ 20° S) indicate that over the past ≈ 300 kyr, less arid conditions and stronger winds were associated with glacial stages along the Namibian coast, whereas interglacials were characterised by more arid conditions and weaker winds (Stuut et al., 2002).
Governed by this climate regime, long-term coastal plain bedrock erosion rates quantified from in situ 10Be are well below 2 m Myr−1 along the Skeleton Coast spanning our study area (recalculated from Bierman and Caffee, 2001). However, luminescence and 14C ages of fluvio-alluvial deposits in major rivers and slack water-type deposits indicate several pulses of discharge in the region during the Late Pleistocene and Holocene (a review of such ages is provided by Walsh et al., 2023). A significant modulation of fan morphology and alluvial deposition is exerted by the deposition of aeolian sands, which has resulted in the formation of the Skeleton Coast Erg (e.g. Krapf et al., 2003; Fig. 2c). This dune belt is about 6–20 km wide and stretches parallel to the coast between ≈ 20.4 and 19.1° S. The aeolian sands comprising the erg are sourced from local bedrock, beach deposits, and from fluvial systems such as the Koigab, whereby the sediments are redistributed northwards due to alongshore wind systems (Svendsen et al., 2003). The aeolian sediments have overridden alluvial deposits along the coast and provide barriers against overland flow from the hinterland, with the eastern and western rims of the erg potentially undergoing significant shifts over time (Blümel et al., 2000). While larger fluvial systems are frequently reported to break through the erg during high-discharge events, widespread slack-water deposits on its eastern rim are indicative of the barrier effect of the erg against overland flow (e.g. Eitel et al., 2005). The age of the present erg is not well constrained. A late Quaternary minimum age for the formation (Blümel et al., 2000), potentially after the LGM (Miller et al., 2021), appears to be likely. Aeolian sands along the Skeleton Coast have been shown to increase streamflow strength if sluiced e.g. by dune slope failure, favouring transitions to mass flows (Svendsen et al., 2003). However, the damming effect of the erg is likely to provoke significant flooding once the dunes become overspilled; the dissection of several alluvial deposits (e.g. Uniab and Hunkab fans) is attributed to such flooding (Blümel et al., 2000).
At present day, rainfall occurring between the coast and the Great Escarpment supplies ephemeral rivers (Jacobsen et al., 1995), which have mostly incised into Precambrian metasedimentary rocks belonging to the Damara Supergroup (predominantly schists and limestone; see Mendelsohn et al., 2003). These rocks are typically exposed within the Central-Western Plains, which is a low-relief landscape towered by inselbergs (Fig. 2d). The inselbergs are mainly composed of Cambrian Damaran granitoid rocks (exposed predominantly south of 20.5° S) and include the Brandberg as highest peak of Namibia (2579 m a.s.l.; Goudie and Viles, 2015e). In the far north, Damara rocks host a more rugged landscape, commonly termed Kunene Hills (Goudie and Viles, 2015e; Fig. 2a, c). In between the Kunene hills to the north and the Central-Western Plains to the south, exposed rocks tend to be younger and of magmatic origin, belonging to the Cretaceous Etendeka Group (predominantly basalts, latites, and quartz latites; Miller, 2008; fans and catchment outlets shown in Fig. 2b). Etendeka rocks are ubiquitously exposed within our study area but concentrate within the Koigab, Uniab, and adjacent catchments (19.4–21.4° S). This landscape is generally referred to as Etendeka Plateau, characterised by mesa-like hills reaching relative heights of 700–800 m above the surrounding plains (Goudie and Viles, 2015a).
Svendsen et al. (2003) suggested that basaltic bedrock may enhance flow viscosity (and strength) in these catchments due to the presence of smectite as a weathering product primarily produced from Etendeka basalts. As smectite is more swellable than other clay minerals, its presence can be important to initiate hyperconcentrated flows (Svendsen et al., 2003). In general, hyperconcentrated flow deposits appear to be dominating along the Skeleton Coast (cf. Krapf et al., 2003, 2005; Svendsen et al., 2003; Miller et al., 2021; Stollhofen et al., 2014).
The sediments detached from the basin bedrock can encounter vast accommodation space when reaching the low-relief coastal area via fluvial transport, providing favourable conditions for the formation of alluvial fans. Alluvial landforms mostly occur as individual fans, coalescent fans, or as part of bajadas. Krapf et al. (2003) provided a detailed description of the major Skeleton Coast ephemeral rivers, the corresponding alluvial deposits, and their post-depositional alterations. Individual fans were also studied in more detail (including sedimentological and/or geochronological work), such as the Koigab (Krapf et al., 2005), Uniab (Miller et al., 2021; Scheepers and Rust, 1999), Hooringbai (Stollhofen et al., 2014), and Hoarusib (Vogel, 1989) fans. The picture emerging from these contributions is that the alluvial fan systems at the Skeleton Coast are considerably heterogeneous not only in terms of their catchments but also in the timing of major phases of alluvial deposition (e.g. Hooringbai progradation between 2.7 and 2.2 Ma, Stollhofen et al., 2014; Uniab aggradation after 180 ka, Scheepers and Rust, 1999) and post-depositional alterations of the fan surfaces. The latter is predominantly achieved by braided river-dominated processes, dissecting and re-shaping fan surfaces (e.g. Krapf et al., 2003, 2005; Stollhofen et al., 2014), and by marine (e.g. Stollhofen et al., 2014; Krapf et al., 2005; Miller et al., 2021) and wind erosion (Krapf et al., 2003). On surfaces that have been sufficiently stable over longer time periods, gypsum crusts may develop from coastal fog precipitation, armouring deflation surfaces (Stollhofen et al., 2014; Fig. 1). The proximity to the ocean does not only imply post-depositional marine erosion, but limits terrestrial fan progradation to the coastline (Krapf, 2003).
3.1 Raw data acquisition and preparation
As an inherent part of regional morphometric analyses, different freely available digital elevation models (DEMs) were tested to identify the most accurate digital representation of the Skeleton Coast. The accuracy assessments were conducted for the 30 m products of the Advanced Spaceborne Thermal Emission and Reflection Radiometer (ASTER; Abrams et al., 2020), Shuttle Radar Topography Mission (SRTM; Farr et al., 2007), Advanced Land Observing Satellite (ALOS; Tadono et al., 2014), and the Copernicus DEM (GLO-30; Rizzoli et al., 2017). For the assessment, an approach outlined by Kramm and Hoffmeister (2019) was followed, testing the vertical accuracy against laser altimetry ICESat-2 (Ice, Cloud, and Elevation Satellite 2; Neumann et al., 2019) data. The GLO-30 product showed the best vertical accuracies (RMSE ≈ 1 m) and was therefore selected as the elevation source for morphometric analyses and fan delineation (see Appendix A for details). As an additional morphometric parameter describing surface roughness, C-band Synthetic Aperture Radar (SAR) backscatter data was acquired for the fan areas using Google Earth Engine and Sentinel-1 (S1) time series data (see Ullmann and Stauch, 2020 for a detailed method description). Sentinel-1 backscatter data has, e.g., been investigated in the hyperarid Atacama Desert, linking surface cover and surface dynamics to alterations in the backscatter signal (Ullmann et al., 2019). The backscatter signal largely relates to surface roughness and conductivity on cm-scales (e.g. Gupta, 2018); Ullmann et al. (2019) generally found a very high signal stability of C-Band in vast parts of the desert. For our study region, the S1 data available at the time of processing in Google Earth Engine was limited to the years 2017–2021, ascending orbit, and narrow incidence angle range (31.1–39.5°; collection snippet: ee.ImageCollection(”COPERNICUS/S1_GRD”)).
Co-polarised (VV) dry season (i.e., austral winter) data was averaged into a single raster at 10 m horizontal resolution, providing a noise-removed, radiometrically calibrated, and terrain-corrected product (based on SRTM DEM). Image coverage per year and pixel was consistent at 15 ± 5 images across all alluvial landforms. Such time-integrated averaging reduces speckle and minimises short-term moisture variability, producing a stable VV signal, with less alteration from individual events such as exceptional overland flow. From comparing the VV backscatter data with visual ground truthing conducted on site (e.g., Messum, Koigab; Fig. 1), we find that CaSO4-encrusted surfaces increase signal reflectivity as compared to the non-encrusted surroundings, providing a tool for relative comparison of surface abundances indicated by the degree of encrustation (cf. Stollhofen et al., 2014).
Climate data used in this study was obtained from two sources. Firstly, satellite-derived fog and low cloud cover data for the time period 2015–2017 generated by Andersen and Cermak (2018) was provided in raw format by the authors of the original publication. The original point data (3.2 km spacing) was rasterised by ordinary Kriging using exponential semi-variogram model and variable search radius (cf. Earls and Dixon, 2007) producing a raster of 5 km horizontal resolution. To be able to calculate averaged fog occurrences over narrow landforms, the raster was resampled to 321 m resolution (nearest resampling; factor 15). Likewise, precipitation (mean annual and mean maximum) and wind speed (mean maximum) data as obtained from the CHELSA-BIOCLIM+ dataset for the time period 1981–2010 (Brun et al., 2022a, b; Karger et al., 2017) was resampled to a horizontal resolution of 303 m (factor 3).
Finally, digital geological data (lithology and faults) at a scale of 1:250 000 was provided by the Geological Survey of Namibia (GSN, 1996; 1998; 2002b, a; 2006a, b; 2008; 2009; 2010b, a; 2011a, b), which we merged and broadly reclassified by rock type (sedimentary, metamorphic, and igneous subdivided into volcanic and plutonic).
3.2 Fan mapping and catchment delineation
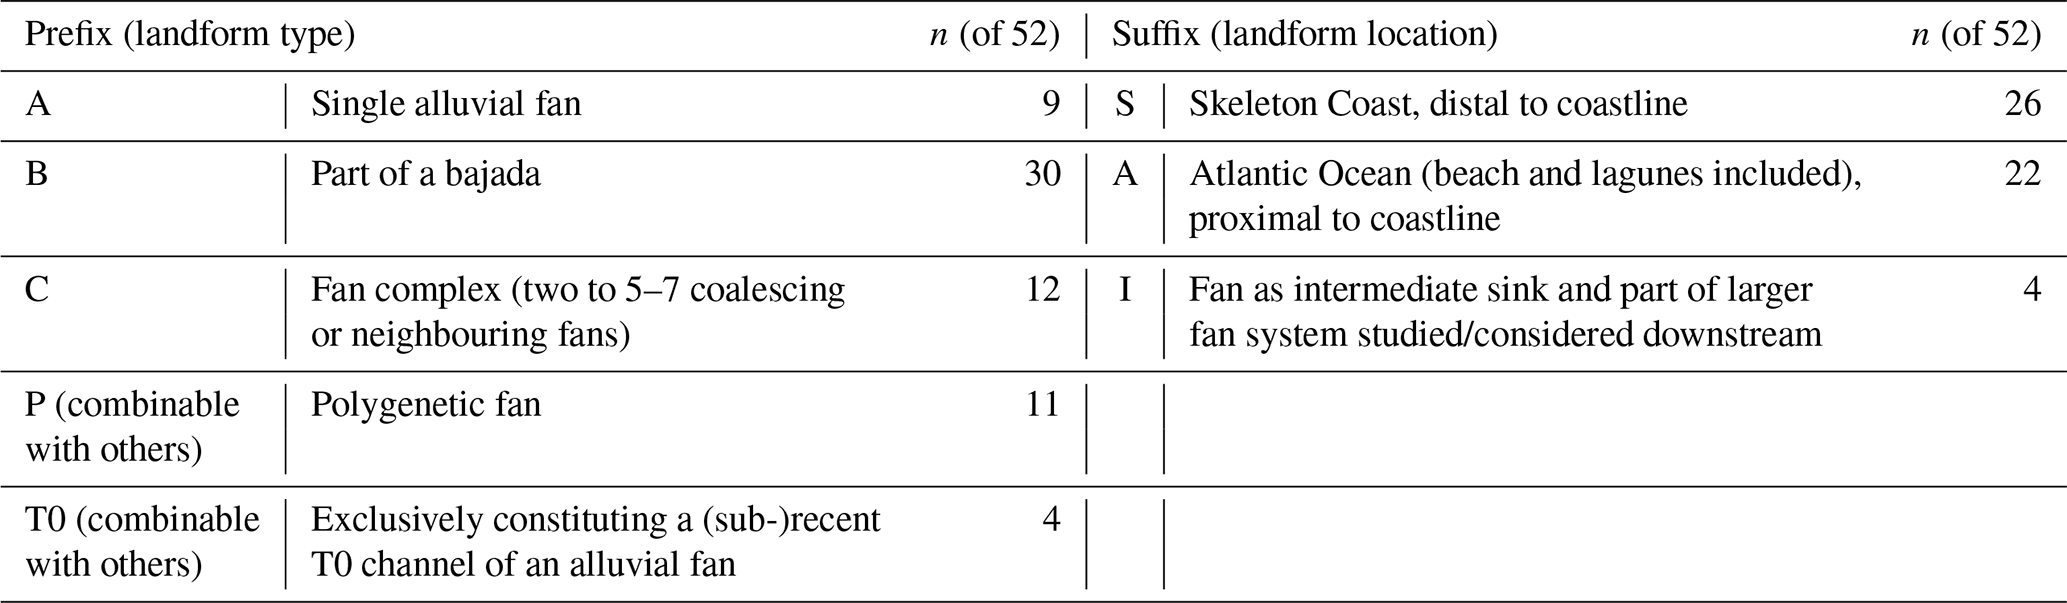
Along the Skeleton Coast, alluvial deposits were mapped at the catchments' outlets, assigning one alluvial landform to a source area. This mapping strategy constitutes an oversimplification, since morphologically well-defined single fans are uncommon along the Skeleton Coast. However, it also reflects the heterogeneous nature of alluvial deposition within the study area. In general, the maximum alluvial landform extent, which could – at a high confidence – be attributed to the landform, was mapped. Especially at the apex areas, some generalization was unavoidable since the modern catchment outlet does not necessarily reflect the true palaeoapex of the alluvial landform system. The mapping of the fans belonging to the IDs #43 and #44 (Koigab) was partially based on those by Krapf et al. (2005). Outcropping bedrock was excluded from the alluvial landform polygons. Only those fans were mapped with associated catchments draining a total area larger than 4 km2. Mapping was conducted using ESRI's World Imagery (true colour composites) with a spatial resolution of ≤ 0.5 m and accuracies of < 9 m. The date range and satellite types included in the composites spanned July 2018 to March 2023 and WorldView-2, WorldView-3, and GeoEye-1 (all Maxar Technologies), respectively. Aided by GLO-30-derived hillshade data, mapping was conducted in ArcGIS Pro (ver. 3.0.0) at a scale range of 1:1000 to 1:5000. The dataset includes single alluvial fans, fans as part of a bajada, fan complexes, and polygenetic fans (see Table 1 for classification by type and location). The distinction between fan complexes and bajadas generally followed the approach used by Walk et al. (2020), using 5–7 neighbouring fans as the threshold between the two groups. Polygenetic alluvial landforms are characterised by more than one major feeder channel. Mapping included parts of the sedimentary Gui-uin flood basin of the Hoanib river (e.g. Eitel et al., 2005; Stanistreet and Stollhofen, 2002), reflecting the damming situation east of the Skeleton Coast Erg as evident for most of the other adjacent systems, where the ponding is however less permanent. Given this heterogeneity in mapped alluvial deposits, we generally use the term “alluvial landform” in the main text, but use the term “fan” interchangeably, e.g., in variable notation. We justify this inaccuracy with enhanced readability and the fact that the methodological approach we chose largely excludes non-fan type landforms (Sect. 4.2).
Table 1Classification of alluvial landforms according to type and location and number of landforms assigned to the individual groups.
A mapping quality assessment was performed using a four-grading system, subjectively evaluating mapping success by assigning alluvial landforms into distinct classes (Table B1). Single dunes or sand sheets covering clearly identifiable fan surfaces (i.e., not below the main body of the Skeleton Coast Erg) were not clipped out, as they represent temporary (on very short timescales as compared to the erg) morphodynamic features.
Upstream of the apices, the corresponding catchments were identified by watershed delineation in ArcGIS Pro (ver. 3.0.0) using the GLO-30 DEM. In order to obtain an optimised delineation result ignoring effects of DEM artefacts, resolution-dependent misrepresentation of narrow valleys, and shallow endorheic basins on surface flow routing, hydrographic model results based on both limited filling (z fill limit = 10 m) and unlimited filling (no z fill limit) were combined and reconciled, generating the final catchment extent.
3.3 Morpho-parametrical data generation
Based on the geodata available for this study, several morpho-parametric datasets could be obtained (Table 2). The list includes morphometric measures commonly applied in geomorphological studies (see e.g. Bowman, 2019b, for an overview) for both alluvial fans (index f) and catchments (index c), including planar area (af and ac), radius (rf), perimeter (pc), and length (lc). Variable rf (fan radius) is defined as the longest distance from the apex, and lc denotes the longest distance within a given catchment measured from the catchment outlet.
Table 2All variables obtained in this study (variables in bold font were used for clustering).
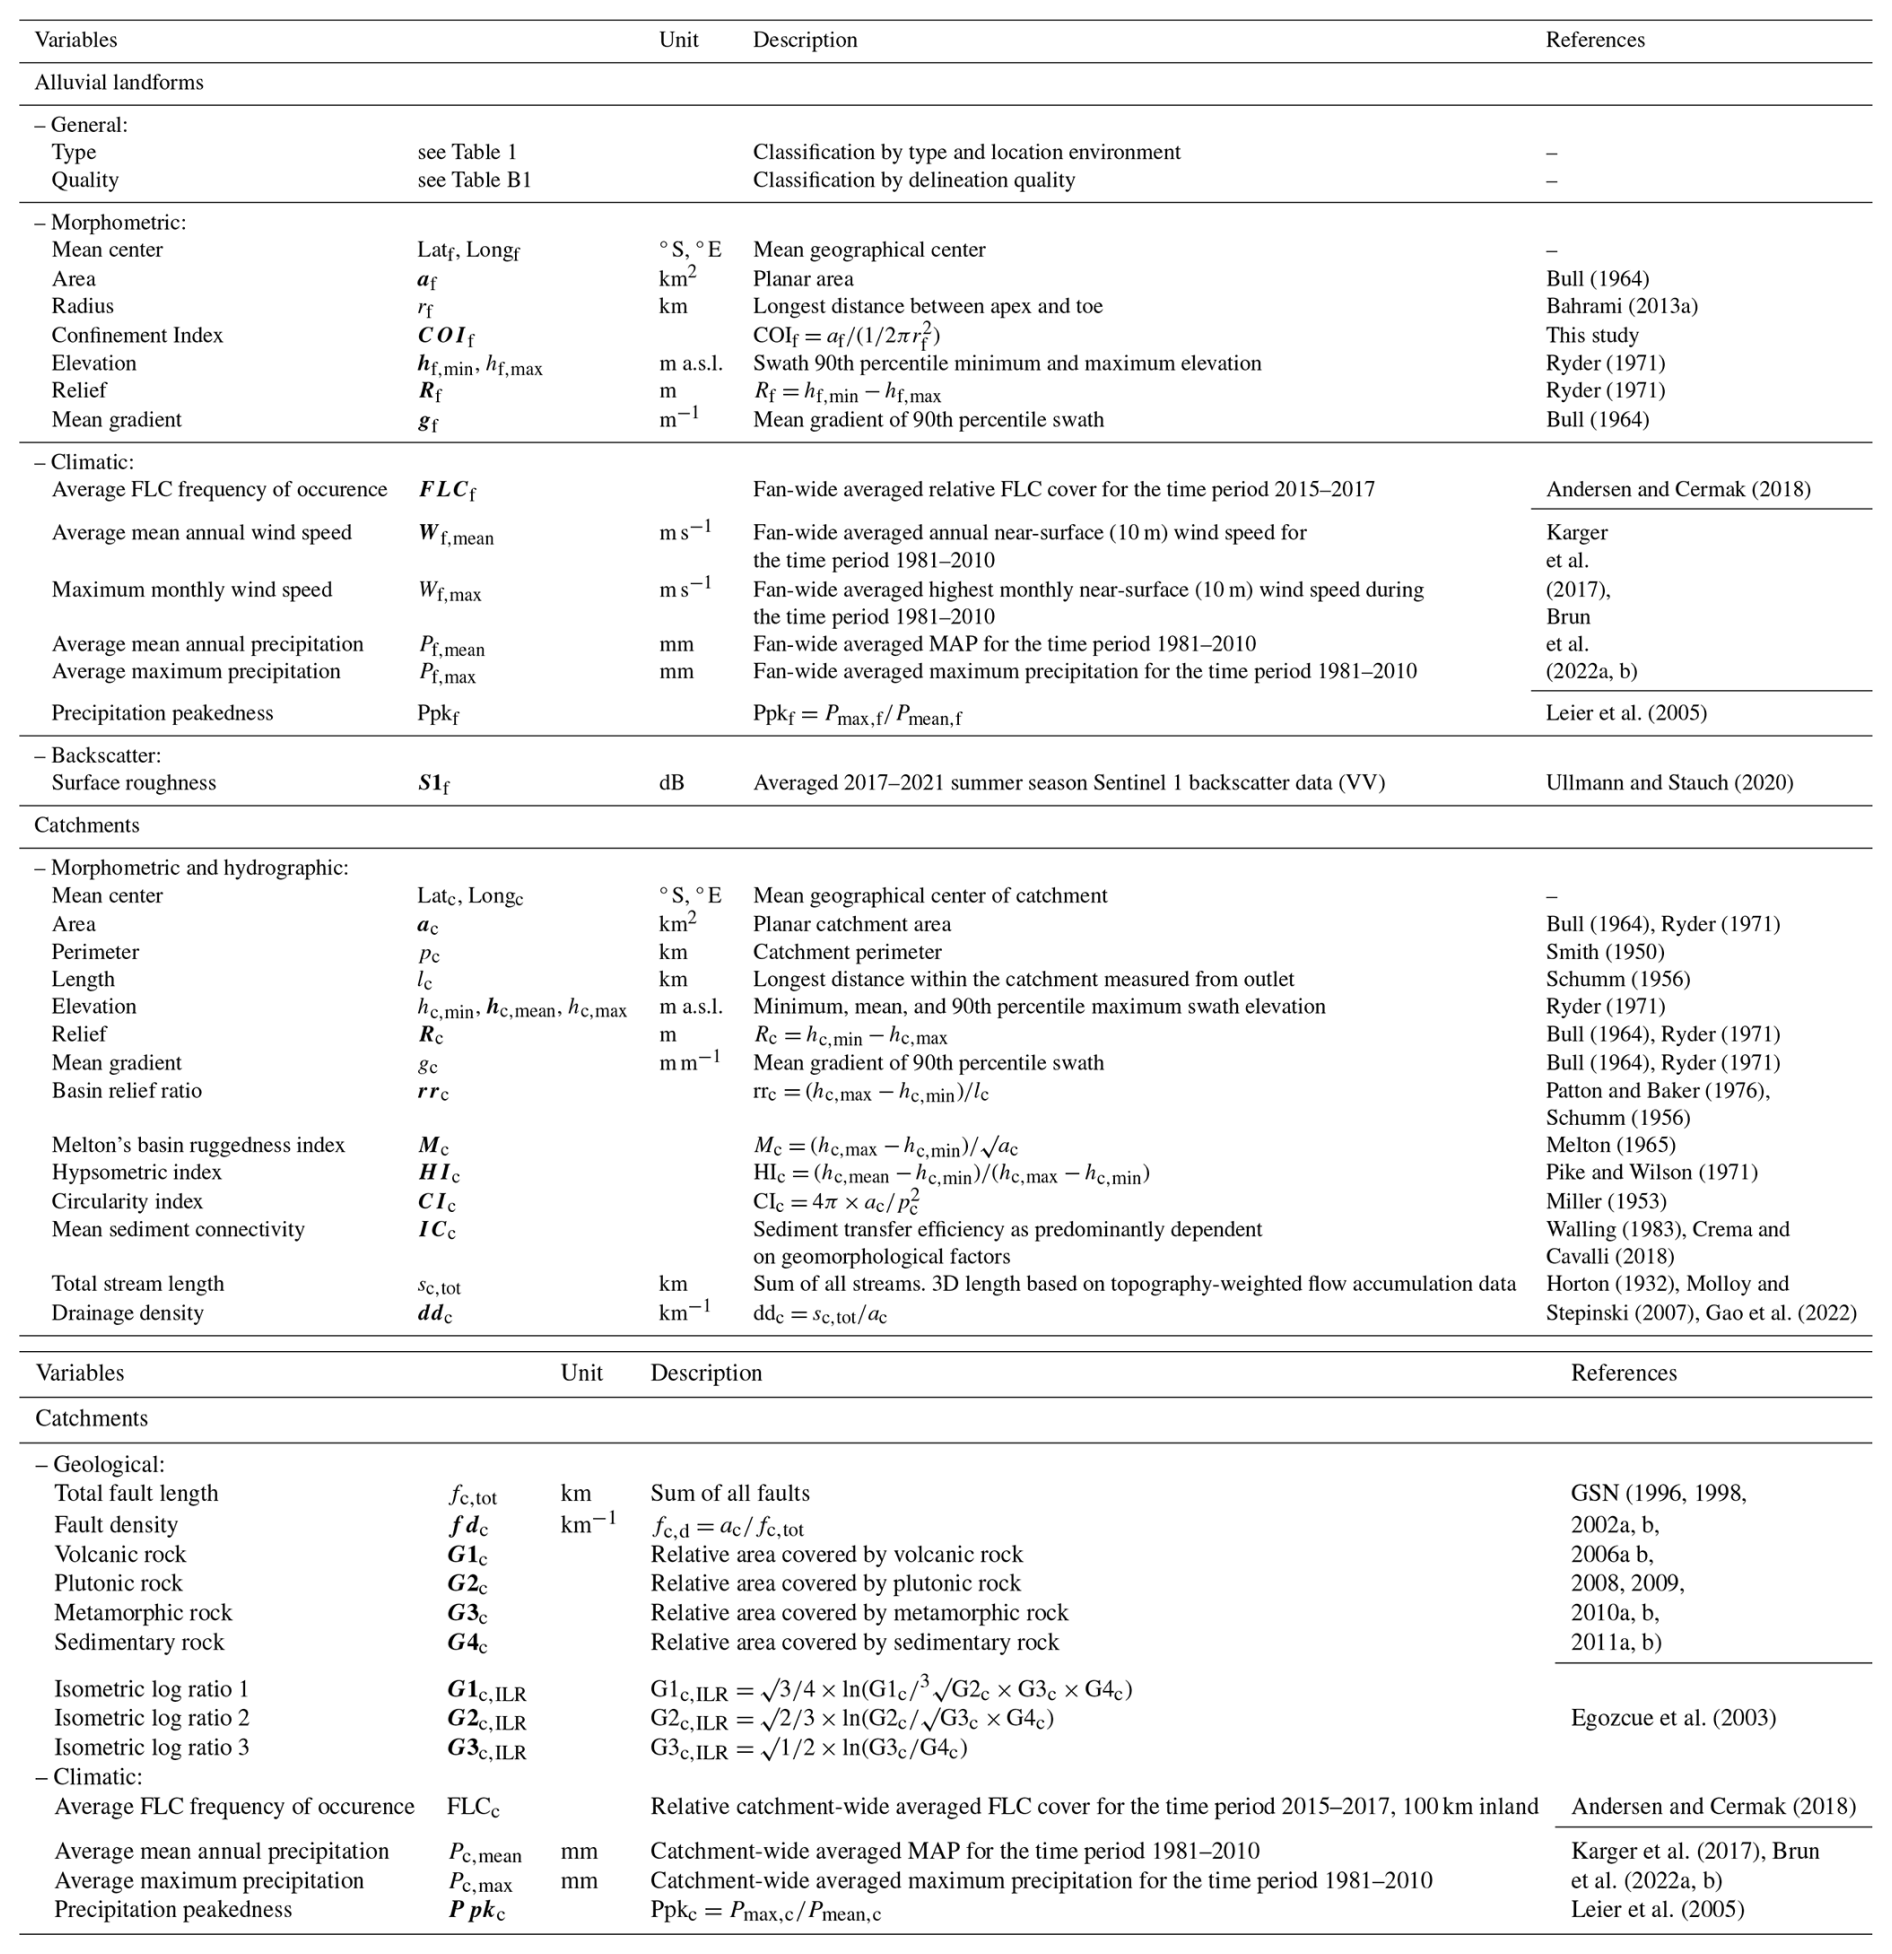
Based on these fundamental variables, further data was derived, including mean center location (latf, longf, latc, lonc), landform relief (Rf and Rc), elevation (hf and hc), and gradient (gf and gc). All elevation and gradient data were obtained from swath profiles, with maximum elevation defined by the 90th percentiles to reduce topographic noise. Using the 90th percentile we obtained the most plausible and comparable results across our study area, e.g., by alleviating the impact of individual inselbergs on catchment metrics. Gradients were calculated as mean from individual section gradients, as defined by each elevation point along the swath profiles. The swath profiles were obtained by using the focal statistics tool in ArcGIS Pro on E-W rotated landforms, the rotation angle being defined by the angle between apex/pour point and landform mean geographical center. Large landforms that exceeded the input cell limit of the tool were processed in Matlab (ver. 2022b). Further indices were calculated for the watersheds: Basin-relief-ratio (rrc), i.e., relief per drainage length (Patton and Baker, 1976; Schumm, 1956), Melton's basin ruggedness (Mc), the hypsometric integral (HIc) to assess the geomorphic development of the catchments (Pike and Wilson, 1971; hypsometric curves were obtained using SAGA GIS ver. 9.7.1), and the circularity index (CIc; Miller, 1953). Similarly to CIc, previous studies used the fan length versus width to infer depositional environment characteristics (e.g. Bahrami, 2013a; Ghahraman and Nagy, 2024). In this study, we apply a similar approach, calculating the relationship between af and the theoretical area of a perfect half-circle defined by rf to approximate fan confinement (COIf). To complement the alluvial landforms parametric dataset, the Sentinel-1 mean backscatter data was obtained for the mapped fan areas (S1f). In a similar fashion, the CHELSA-BIOCLIM+ climate data (modern mean annual precipitation, Pc,mean, Pf,mean and maximum mean annual precipitation, Pc,max, Pf,max) was extracted for both the catchment and alluvial landform areas. For the catchments, the geological data from GSN (G1c to G4c) were extracted, and fault densities fdc were calculated from total fault length fc,tot. Fault densities usually relate to tectonic activity, which over longer timescales can cause drainage reorganization (e.g. Bahrami, 2013b). On shorter timescales, significant fault movement and associated tremor can trigger mass movements (e.g. Crosta et al., 2014); both pathways may affect alluvial landform morphodynamics.
From the CHELSA-BIOCLIM+ precipitation data, precipitation peakedness (Ppkf, Ppkc) was calculated as the ratio between maximum precipitation and MAP, the former defined as the averaged maximum monthly precipitation (February or March in our study area), as outlined by Leier et al. (2005). Wind speeds were only obtained for the alluvial landforms (Wf,mean, Wf,max) to include potential effects of wind erosion on alluvial landform alteration. The dataset containing averaged relative frequencies of low cloud cover occurrence was clipped to both fan (FLCf) and catchments (FLCc). For the latter, a spatial limitation exists, as the accuracy of the data strongly declines at a distance exceeding about 100 km from the coastline (Hendrik Andersen, personal communication, 2023). We thus clipped the data to the 100 km range, implying that the largest catchments are not fully covered by FLCc data. However, the generally strongly declining (advective) fog occurrence towards the hinterland (Olivier, 1995) indicate that low cloud cover frequencies beyond that boundary can be considered insignificant when compared to FLCc to the west.
In hydromorphometric studies, common hydrographic parameters applied are related to the stream networks within the fluvial systems, with drainage density often used to assess the degree of landscape dissection (e.g. Howard, 1997; Collins and Bras, 2010; Mohren et al., 2020). The classic GIS-based approach of stream path determination relies on a noise-removed DTM used to generate flow directions and flow accumulations based on a minimum inflow value per pixel. However, especially in heterogenous hyperarid landscapes, characterised by ephemeral streams, different types of relief (mountainous to level), lithology (hard bedrock to unconsolidated sediments), surface cover (bare bedrock to encrusted), and patterns of fluvial erosion (v-shaped valleys to gullies), this standard approach often fails to capture the (present-day) stream networks as observed on true-color remote sensing data or in the field. For the Skeleton Coast of Namibia, difficulties in sediment routing mostly focused on the coastal and southern low-relief areas, which required the abovementioned merging of filled and non-filled drainage areas. As for the stream networks, streams in the low-relief areas appeared over-represented compared to the higher-relief areas, as commonly observed in similar studies (e.g. Mohren et al., 2020; Howard, 1997). To mitigate these issues, we applied a terrain morphology-based method to extract channel networks directly relying on valley detection by identifying and connecting concave-upward topography (Gao et al., 2022; Molloy and Stepinski, 2007). We calculated the tangential curvature for the GLO-30 DEM using a 5 × 5 moving window and kept all pixel values ≤ −0.0002 m−1 to obtain a first representation of the drainage network. After vectorization, we filtered the individual patches of the drainage network by polygon circularity (CI, as defined in Table 2) and area a, using the threshold provided by Molloy and Stepinski (2007) to eliminate non-valley landforms (CI > 0.3, a > 20 pixels). The reconverted raster was then thinned and used to flag the stream network; all other areas were weighted by a value of −0.005 to allow flow accumulation fading when calculating the final topography-weighted stream network using the toolbox provided by Dilts (2015). As such, we obtained a stream network (representing the weighted flow accumulation < 200 pixels, i.e., ≈ 0.2 km2) that resembles the classic approach but puts less weight on the flat areas. The final stream lengths sc,tot were calculated including elevation data to account for 2D shortenings in steep terrain (see Howard, 1997). Since the stream networks include disconnected parts due to flow accumulation fading, no further hydromorphic metrics were obtained for this study. However, another parameter describing the sediment connectivity (ICc) within the catchments (Walling, 1983) was obtained using the SedInConnect toolbox (ver. 2.3; Crema and Cavalli, 2018), with the non-filled DEM used for surface roughness and weighting factor estimation. Although the toolbox was designed to obtain sediment connectivity measures for high-resolution DEMs, it is also applicable to medium-resolution digital elevation data in comparative studies (e.g. Zanandrea et al., 2019; Gay et al., 2015; Walk et al., 2020).
3.4 Precursory statistical analyses and correlation tests
The choice of parameters used in this study followed the rationale of compiling a pool of intuitive variables to describe the source-sink systems along the Skeleton Coast. To provide basic descriptive information, the data was first characterised by value ranges and distributional properties. A standard power-law relationship analysis was conducted (Eq. 1). However, given the pronounced heterogeneity of landforms and environmental conditions at both drainage and sink locations, a simple statistical description of individual variables from the bulk dataset would risk being misleading – or, in some cases, statistically unsound. To address this, we focused on reducing dataset heterogeneity, which can be achieved by cluster analysis.
Cluster analysis is an exploratory multivariate method that groups objects – in our case, alluvial landforms and catchments – in such a way that internal similarity within groups is maximised while dissimilarity between groups is increased (detailed descriptions of the method are provided by Backhaus et al., 2025a, and Cleff, 2019). Applied here, clustering provides a means to distinguish alluvial landform and drainage systems along the Skeleton Coast, with the potential to improve the robustness of subsequent statistical analysis and group-wise characterization.
To optimise clustering results, input variables should be independent and standardised to avoid the influence of (metric) scaling when distances between different groups are calculated. To achieve a suitable dataset containing variables relevant for clustering, we conducted a pairwise correlation analysis and excluded variables showing a strong interdependence (cutoff value defined by Pearson's correlation coefficient r > 0.7; cf. Backhaus et al., 2025b). In addition, the lithological data were transformed using the isometric log-ratio (ILR) method to achieve variable independency (Egozcue et al., 2003). Compared to other transformations (e.g., the centred log-ratio), ILR has been shown to yield more reliable results in exploratory multivariate analyses (Chen et al., 2019). Prior to transformation, zero values were replaced by a constant of 0.0001, and the relative contributions of the four lithology variables were adjusted accordingly. For clarity, we denote each IRL-transformed variable according to its numerator (G1c,ILR, G2c,ILR, G3c,ILR; see Table 2).
Finally, the reduced variable set was tested for multivariate normality by calculating squared Mahalanobis distances and assessing variance with a chi-squared test (threshold value p = 0.001; calculated using SPSS ver. 29.0.2.0). While cluster analysis does not strictly require normally distributed input data (Cleff, 2019), the test can be used to flag potential multivariate outliers from the dataset.
3.5 Cluster analyses
Clustering was performed in Matlab (ver. R2024a) using the linkage function on z-transformed data. Given the comparably small size of the datasets we investigate, hierarchical clustering with subsequent k-means optimization was applied (e.g. Backhaus et al., 2025a). Both datasets – catchments and alluvial landforms – were clustered separately to identify possible correlation patterns between groups.
To determine robust cluster solutions, different combinations of proximity measures (similarity and distance) and agglomerative fusion algorithms were tested. Following the recommendations of Backhaus et al. (2025a), outliers were first removed using the Single Linkage algorithm with Squared Euclidean Distance. This step aims to improve the stability of subsequent clustering. The cleaned datasets were then re-clustered with alternative proximity measures and fusion algorithms, and the resulting dendrograms were evaluated visually and using the cophenetic correlation coefficient, which quantifies how well the dendrogram preserves the pairwise distances of the original distance matrix (Sokal and Rohlf, 1962; Gere, 2023).
The optimal number of clusters was determined with the Caliński and Harabasz criterion (Caliński and Harabasz, 1974). Among the candidate solutions, dendrograms containing more than three objects per cluster and the highest cophenetic coefficients were visually compared to assess the separation performance. The final clustering choice was based on a balance between (i) agreement with the number of clusters determined by the Caliński and Harabasz criterion and (ii) a reasonable cophenetic distance.
To objectively evaluate robustness, split-half test were performed: the datasets were randomly divided, clustered independently using the selected fusion algorithm and proximity measure, and then compared against the full-population cluster solution (Backhaus et al., 2025a). Only solutions that largely reproduced the population clusters were retained. Afterwards, k-means optimization was conducted using the kmeans function in Matlab.
The interpretation of the resulting clusters relied on t- and F-statistics to evaluate how well variables were represented within each cluster relative to the total population and to assess within-cluster homogeneity (Backhaus et al., 2025a). In addition, boxplots were used for visualization, and the spatial distribution of clusters was examined for contextual interpretation. To further investigate linkages of clusters and variables (hereafter termed “supportive”), partial correlation analyses were performed on log-transformed data at the 95 % significance confidence level. Special attention was given to commonly (hereafter termed “classical”) investigated morphometric relationships defined by Eq. (1), namely. af(ac), gf(ac), and gf(Mc), to identify variables influencing theses correlations.
4.1 Alluvial landform mapping, variable statistics and relationships
From our mapping efforts a total number of n = 67 alluvial landforms could be identified along the Skeleton Coast of Namibia. Of these, n = 52 landforms could be delineated with sufficient confidence (mapping quality grades 1–3). For clustering, we considered both catchments and alluvial deposits separately to maximise comprehensiveness. Accordingly, we provide statistical analyses for both the full dataset (hereafter referred to as “catchment dataset”) and the quality-filtered dataset (hereafter referred to as “fan dataset”). An overview of the number of landforms retained after the different workflow steps we applied, and the counts used for display in our figures, is provided in Table B2 in addition to the information given in the main text and figure captions.
Statistically, both Kolmogorov–Smirnoff and Shapiro–Wilk tests indicate that the majority of variables deviates from a normal distribution. At the p = 0.05 significance level, the null hypothesis of normality could only be accepted for gf, Wf,mean, Wf,max, HIc, ddc, G1c,ILR, and G2c,ILR (Table B3). Consultation of histograms, boxplots, and QQ-Plots generally confirm these test results, with the exception of hc,mean, Mc, and ICc, which appear to be reasonably normally distributed despite contrary test outcomes. However, caution is required when interpreting mean values and standard deviations for individual variables (Table B3).
The catchments analysed in this study are located between 17.6–21.6° S and 12.1–15.6° E, with areas ranging from ≈ 4 to ≈ 29 000 km2, with other metrical variables (pc, lc) showing similar ranges on a relative scale (Figs. 1, 3a, Table B4). Likewise, catchment relief varies from 85 to 2380 m. These large ranges decrease for the derivates and indices obtained from the morphometrical data: Melton's ruggedness index Mc averages at 0.04 ± 0.01. The maturity index HIc (0.44 ± 0.09) and the corresponding hypsometric curves (Fig. 3b) generally indicate mature to monadnock stages of drainage evolution (sensu Strahler, 1952a). The Messum catchment (alluvial landform IDs #62.1 and #62.2) is a notable outlier (HIc = 0.21), as its upstream drainage portion incises the Brandberg massif (hc,max ≈ 2500 m a.s.l.). The Brandberg is also drained by the Ugab river (#57) and catchment #66, but their larger lateral extents balance hc,min over surrounding level areas, preventing similar low HIc values.
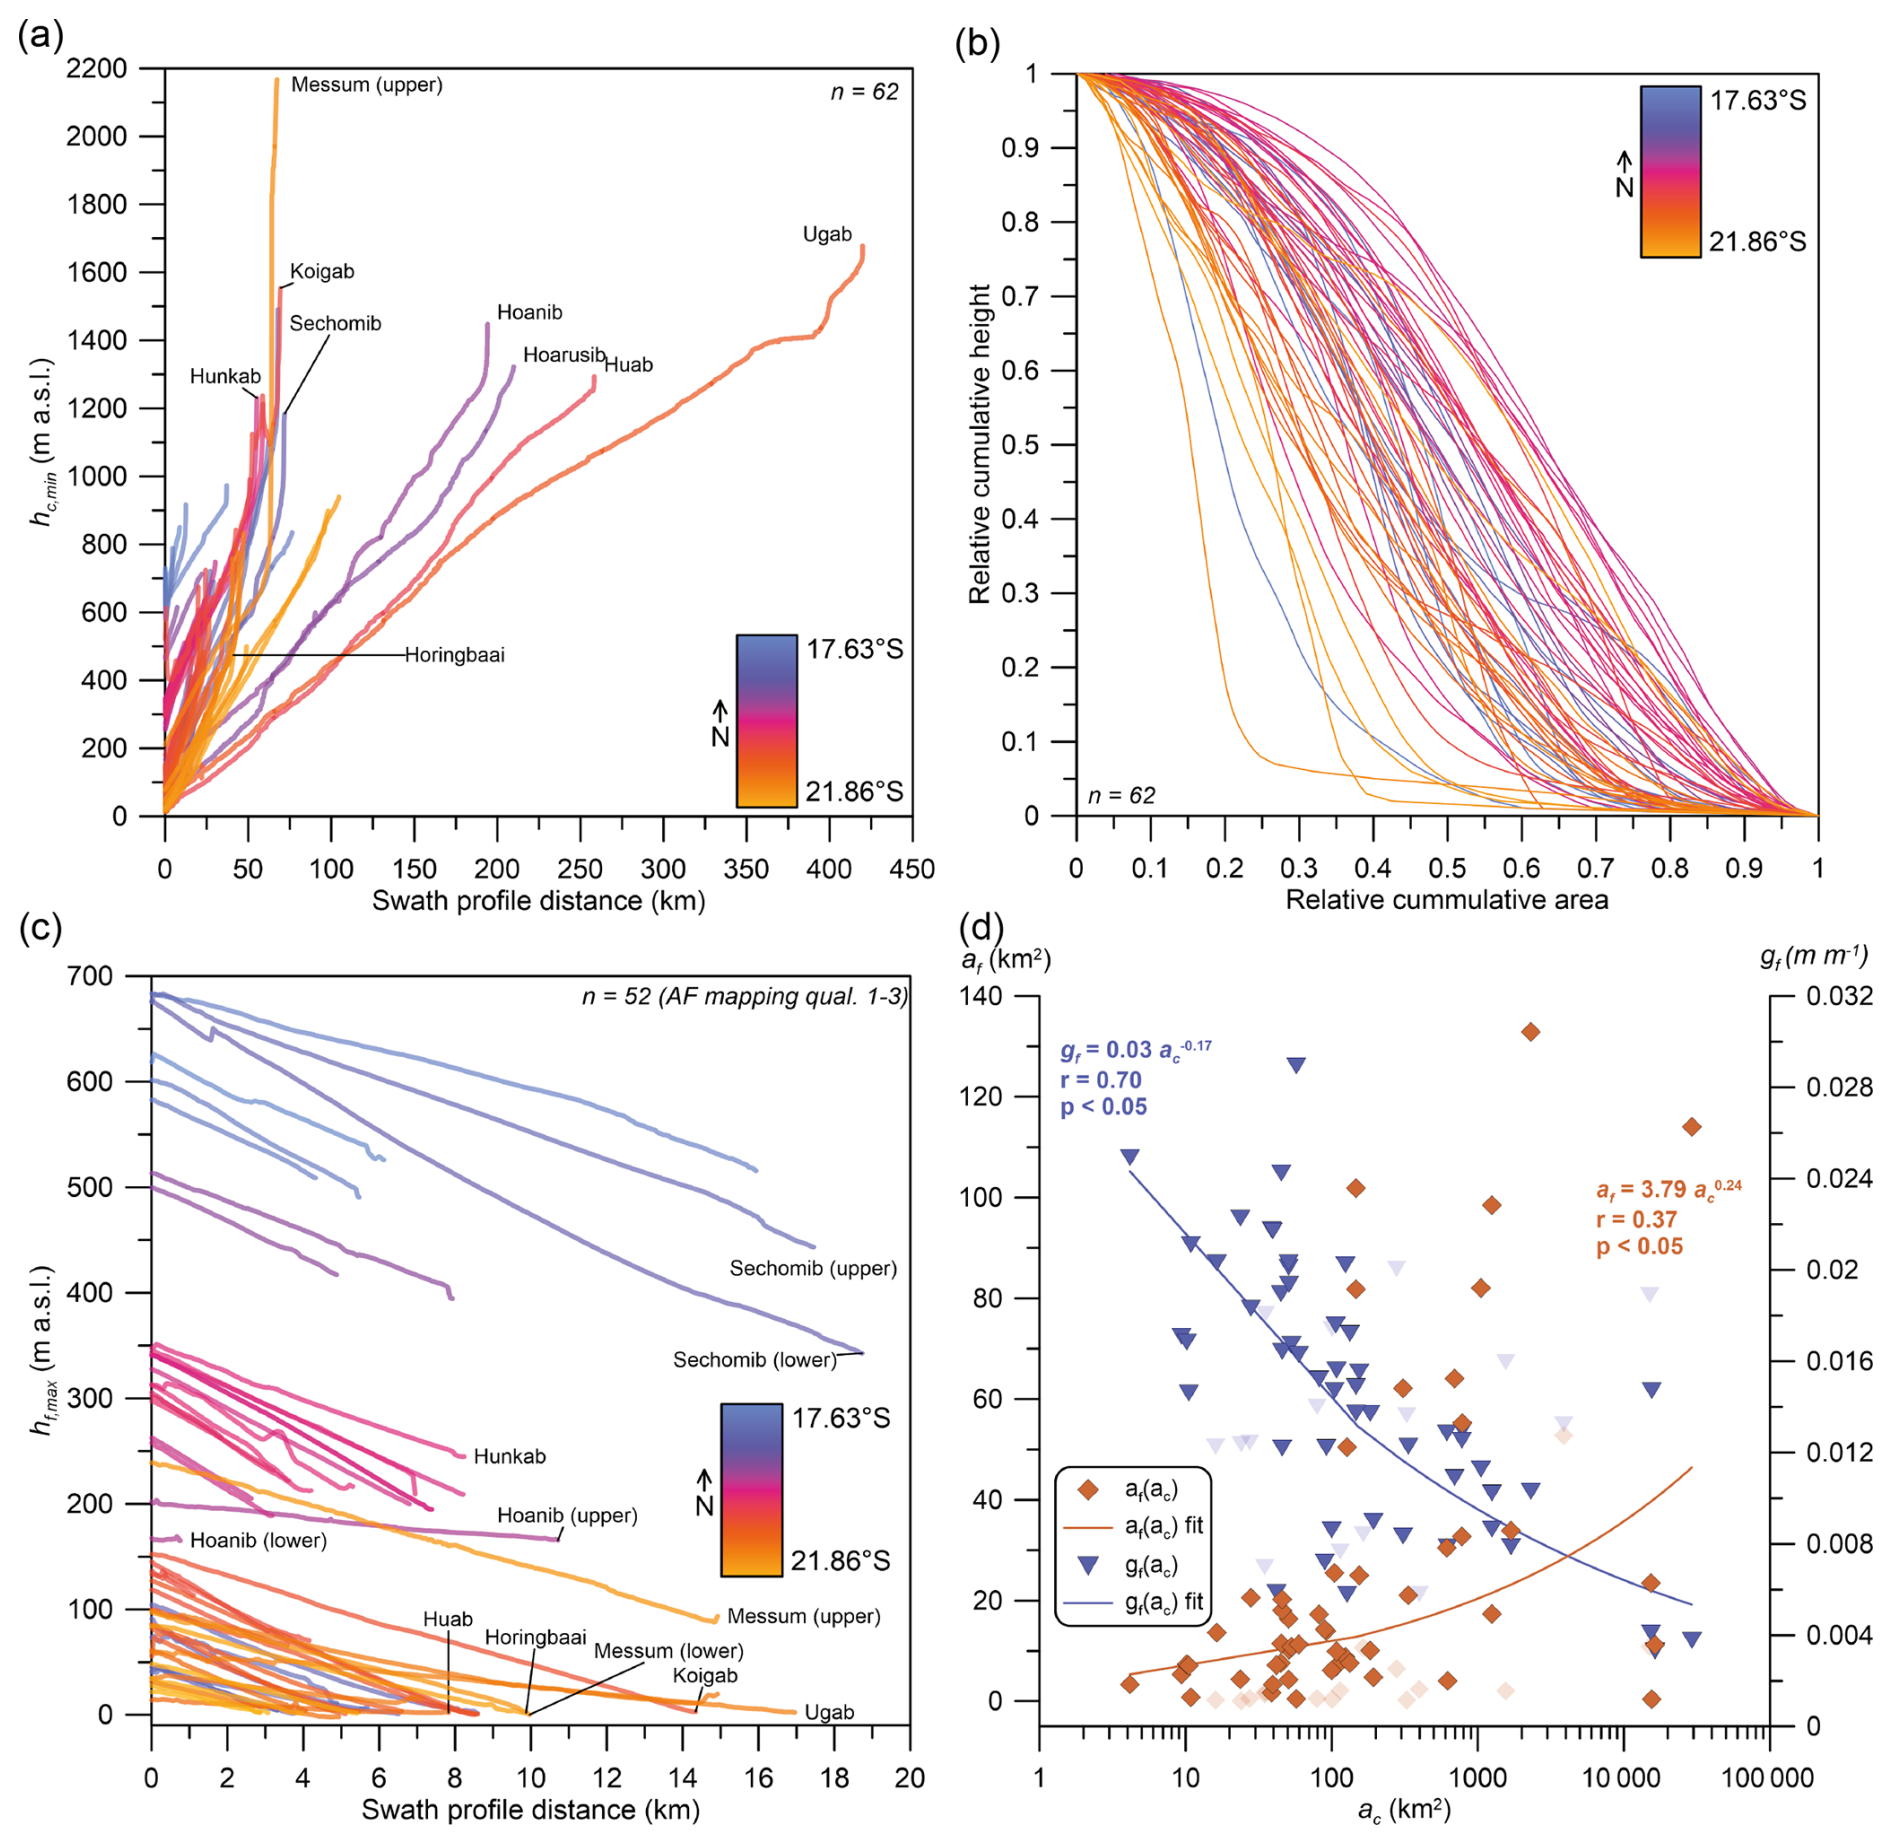
Figure 3Catchment swath profiles (a), hypsometric curves (b), alluvial deposit swath profiles (c), and power-law relationships between fan and catchment morphometrics (d). Data in panels (a) and (b) is shown for n = 62 catchments, with nested subcatchments not being shown for clarity. In panel (c), all alluvial deposits featuring a mapping quality that deemed sufficient (quality class < 4, cf. Table B1) are shown (n = 52). Likewise, data from this fraction of the population is used to derive the power correlations as shown in panel (d), with the remaining data shown as greyed-out symbols.
Regarding the alluvial landforms, elevation-based grouping is evident from hf,max (Fig. 3c). Deposits located in the northern parts of the Skeleton Coast tend to terminate distant from the coastline, whereas southern fans tend to reach the Atlantic. Central alluvial deposits group as they are blocked by the Skeleton Coast erg. Approximately half of the landforms terminate proximally, i.e. at a distance ≈ 4–37 km from the coastline (suffix type S in Tables 1, B5). The other half reaches the beach area (suffix type A). Only a fraction occurs as single alluvial fan (n = 9, prefix type A), with more than 80 % of the landforms being confined. A minority are classified as polygenetic (n = 11, prefix type P) or constituting exclusively a (sub-) recent channel of an alluvial fan (n = 4, prefix type T0). The strong confinement of alluvial landforms is also reflected by COIf, ranging between values of 0.08 and 0.64 (median 0.24).
The largest fan in our dataset is the Koigab fan (#44, 20.5° S; 133 km2), which is comparatively weakly confined (COIf = 0.43). The smallest mapped alluvial landform covers an area of 0.3 km2 (#33, rf = 0.8 km). Several landforms exhibit dataset extremes: the upper Sechomib fan (#11.1; 18.3° S) has the largest fan radius (18.5 km) and receives the highest amount of annual precipitation (90 mm, excluding fog). A minimum amount of annual precipitation of about 20 mm at fan #67 (21.9° S) illustrates the hyperarid conditions at the Skeleton Coast. This finding is underscored by the lowest Pf,max value of the dataset (49.1 mm) and lowest precipitation peakedness (2.5) found at the location of fan #67. The largest values for fan-wide averaged maximum precipitation (471 mm) and Ppkf (5.2) are found in the opposite (i.e., northern) direction, at fan #2 (17.8° S). Nearby, the lower Sechomib fan (#11.2, 18.5° S) has the highest relief (333 m). The highest backscatter value (−11.8) from the Sentinel-1 data is recorded for the Gui-uin basin (#17.2, 19.4° S; lowest: −19.92, #11). Likewise, the lowest relief (4 m) is recorded there (#17.1, 19.4° S).
Overall, alluvial landforms along the Skeleton Coast show a mean gradient of 0.014 ± 0.06 m−1 (1.4 % or 0.8°). Wind speeds average at 4.2 ± 0.6 m s−1 annually, with maximum annual wind speeds being statistically similar (4.6 ± 0.7 m s−1).
Fan dataset relation of af, ac, and gf, by means of Eq. (1) reveal af(ac) and gf(ac) power-law relationships significant at the 95 % confidence level (r2 = 0.14 and 0.49), with x1 = 3.79 and y1 = 0.24 for af(ac), and x1 = 0.03 and y1 = −0.17 for gf(ac), respectively (Fig. 3d). The gf(Mc) relationship is also significant (r2 = 0.36), with x1 = 0.11 and y1 = 0.66.
Following the scheme of Backhaus et al. (2025a) for cluster analysis, highly pairwise-correlated variables (r > 0.70) of the fan and catchment datasets were eliminated. This approach left n = 22 variables, with n = 8 variables describing the mapped alluvial deposits, and n = 14 variables describing the catchments (Table B6). Most reduction is caused by strong correlations between climate variables, geographical location, and elevation. Apart from precipitation peakedness (Ppk) and the excluded geographic/elevation variables, no linear bivariate relationships between alluvial landform and catchment variables were identified. Both fan and catchment datasets approximate multivariate normality, although systems #3, #27, #44 (Koigab), and #57 (Ugab) could be flagged as potential outliers (Tables B7 and B8).
4.2 Data clustering
4.2.1 Catchment dataset
Single linkage hierarchical clustering revealed two groups of catchment outliers. A distinct group of five catchments (#13 – Hoarusib, #17.1, #17.2, #53 – Huab, and #57 – Ugab, with #17.1 and #17.2 representing nested subcatchments of the Gui-uin basin) showed properties that clearly separated them from the main population. In addition, up to n = 14 catchments appeared individually or in pairs as disconnected cases (Fig. C1).
Testing different fusion algorithms and proximity measures on the data cleaned at different levels showed that retaining the tightly clustered outlier group did not improve subsequent clustering, while its removal generally resulted in cluster structures with lower quality as indicated by the split-half tests and F-values (see below). Consequently, we removed n = 7 outliers, which were separated from the bulk dendrogram by >5 % cophenetic distance: #3, #10, #27, #43, #57, #62.1, and #62.2, the latter two representing nested Messum subcatchments.
The comparison of different clustering approaches resulted in the choice of Ward's method with squared Euclidean distances, which achieved a cophenetic correlation of 0.65 (Fig. 4, Table B9). The Caliński and Harabasz criterion suggested an optimal solution of four clusters (Fig. C2). Subsequent k-means cluster optimization reassigned #35 from cluster 1 to cluster 3. Robustness of the solution was confirmed by split-half evaluation (Figs. C3 and C4).
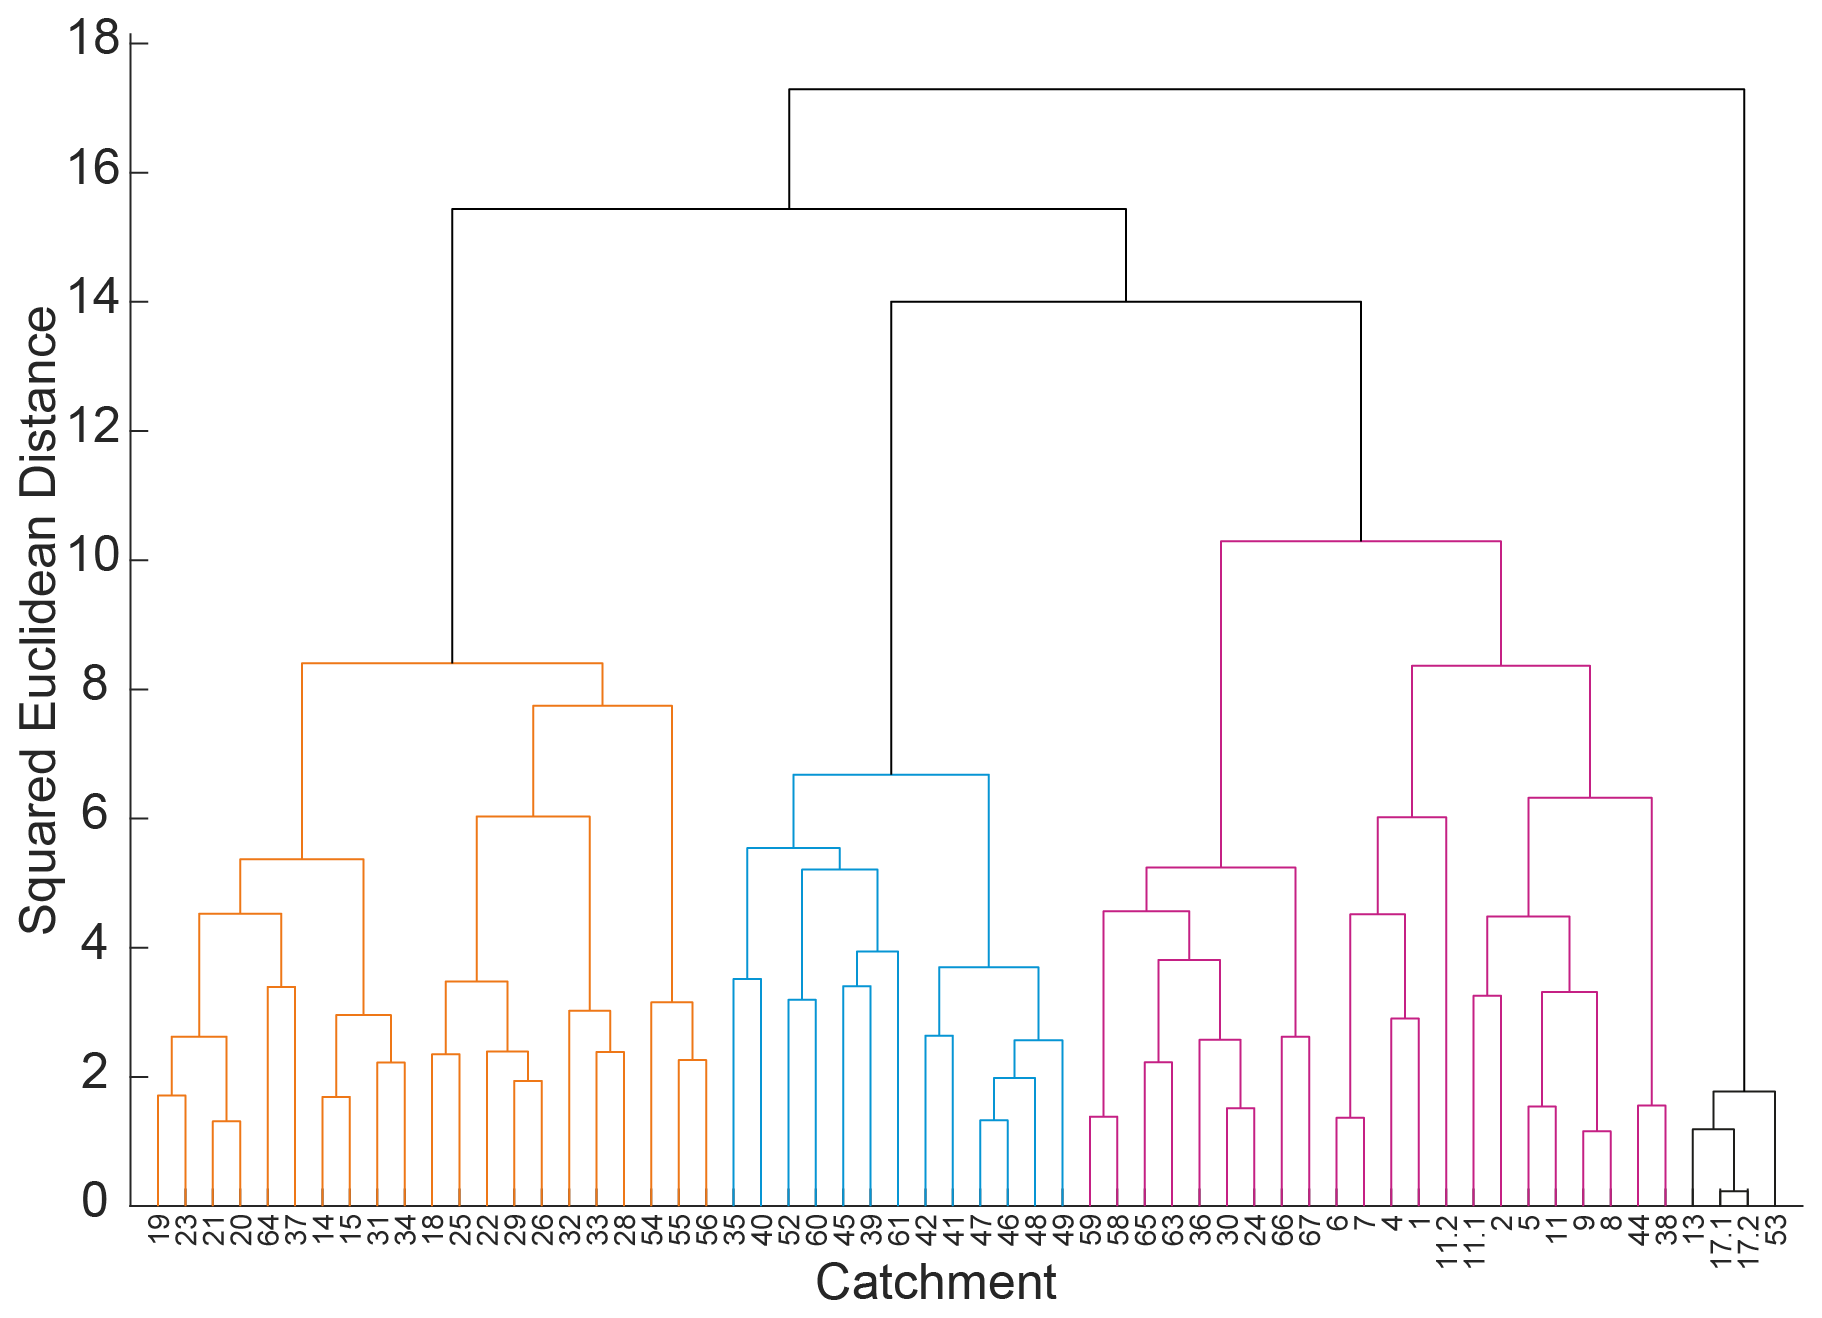
Figure 4Cluster assignments based on Ward's fusion algorithm (squared Euclidean distance) for n = 60 catchments (outliers removed).
4.2.2 Fan dataset
For the fan dataset, there was a potential to remove up to n = 14 cases, shrinking the dataset to n = 38 (Fig. C5). To avoid such excessive data loss, we removed only the most distant cases, defined as being separated by more than ≈ 33 % of the total cophenetic distance across the single linkage dendrogram: #11.1, #11.2, #17.1, #17.2, and #62.2 (n = 47).
The Caliński and Harabasz criterion suggested three clusters (Fig. C6). Among the highest-ranked fusion algorithms, both Complete Linkage with Euclidean distance (cophenetic correlation 0.72) and Ward's method with squared Euclidean distance (0.64) produced very similar cluster assignments. However, the Ward solution performed better in split-half testing compared to the alternatives, including similarity-based measures (Figs. 5, C7 and C8, Table B10). Despite these results, some inconsistencies remained for the chosen algorithm. Clusters 2 and 3 contained nearly all cases previously flagged as potential outliers (#5, 9, 10, 44, 56, 57, 62.1, 63), with the exception of #2. This group did show few falsified cluster assignments during the split half test (Fig. C8). K-means optimization did not alter any cluster assignments.
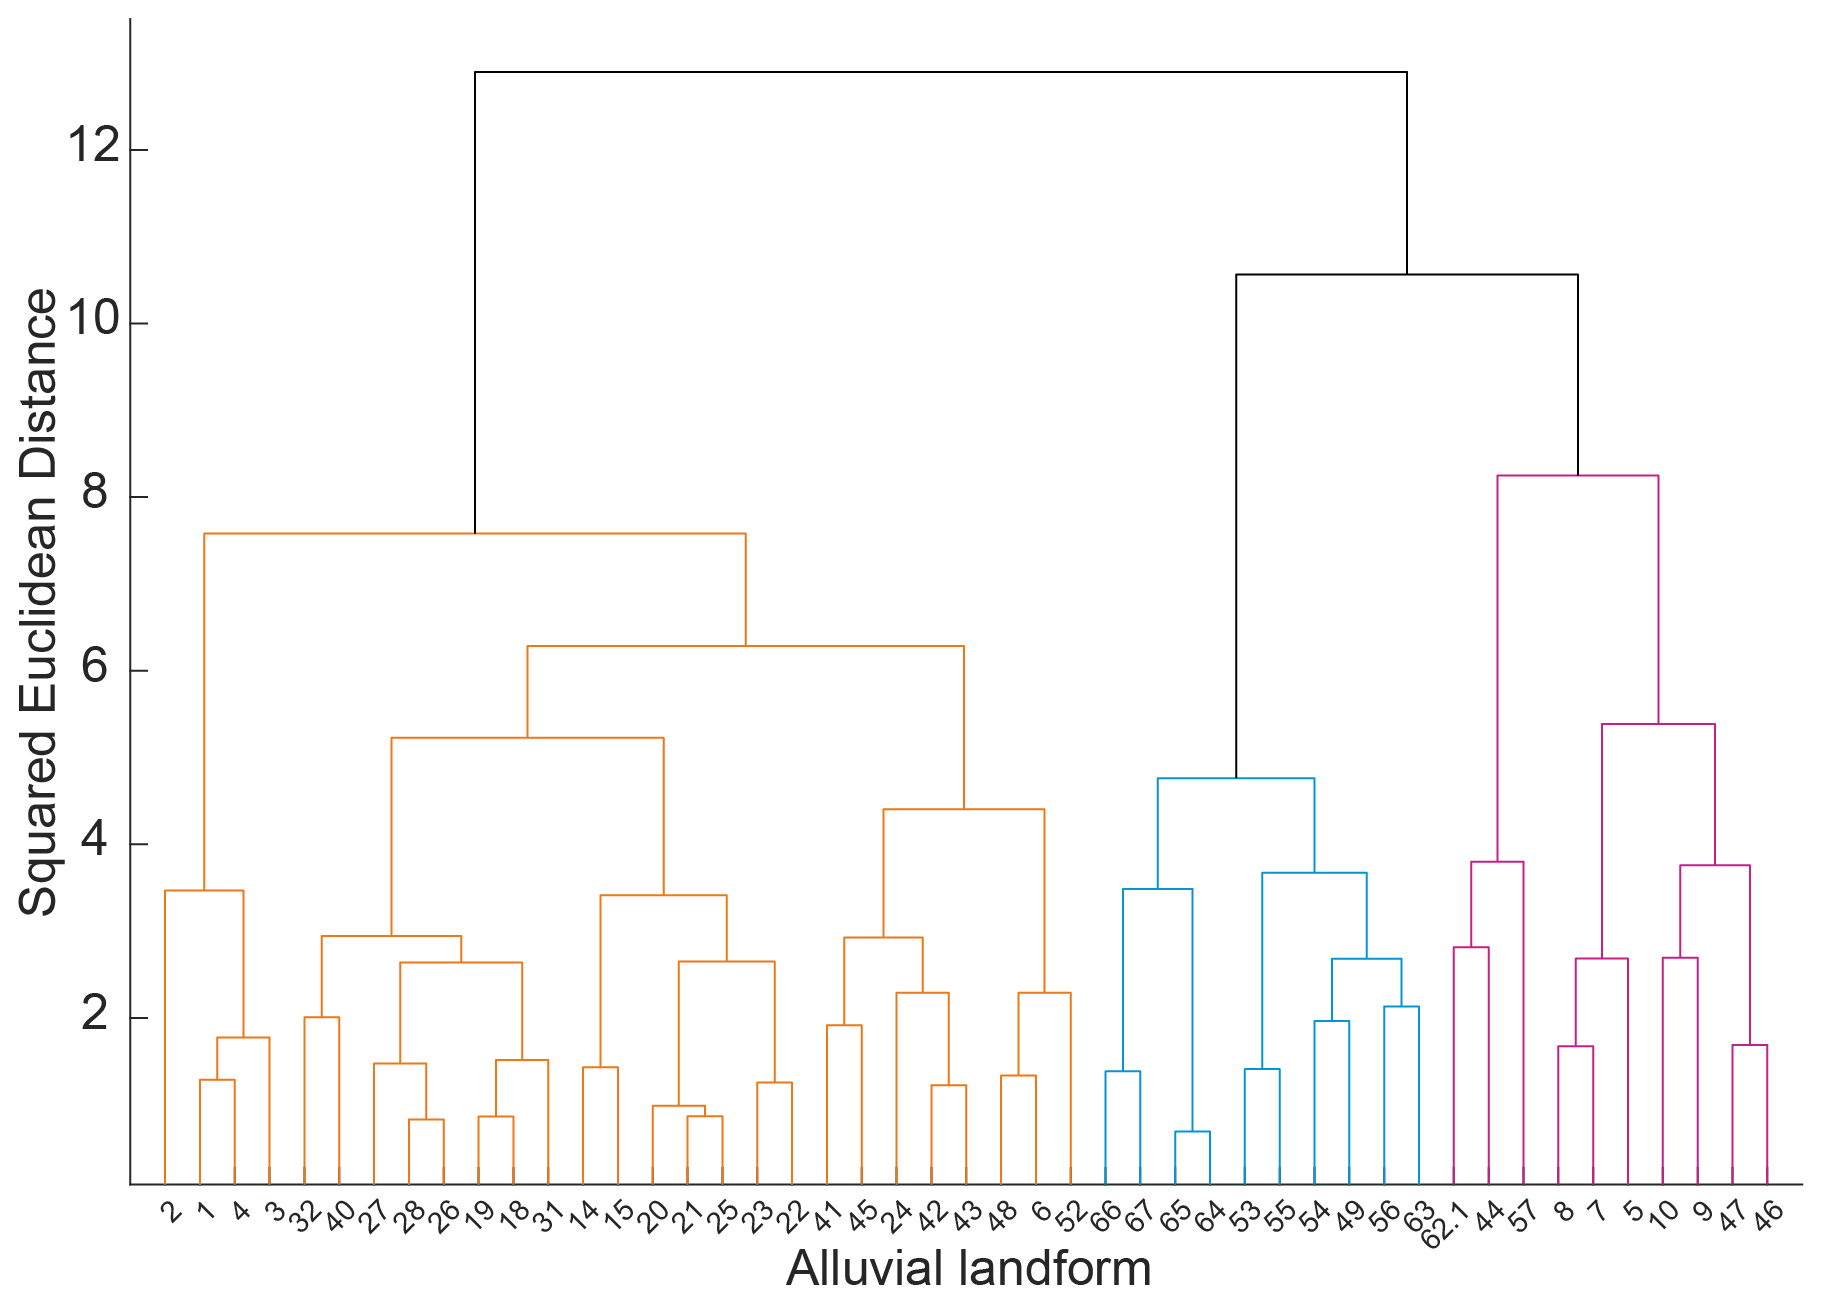
Figure 5Cluster assignments based on Ward's fusion algorithm (squared Euclidean distance) for n = 47 alluvial landforms (outliers removed).
4.3 Cluster properties
4.3.1 Cluster structures and geographic patterns
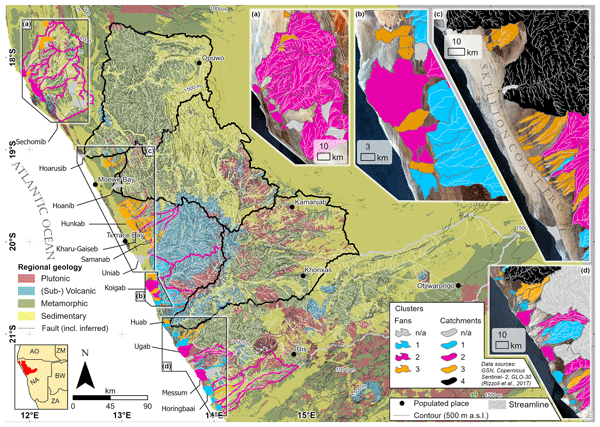
Excluding the tight outlier cluster of catchments identified by single linkage clustering (C4c), both clustering of catchments (C1c, C2c, C3c) and fans (C1f, C2f, C3f) yielded three main clusters. From visual inspection of the geographical distribution of the different clusters it becomes evident that C4c is indeed grouping those catchments that reach beyond the Great Escarpment (ac = 15 000–16 300 km2), while C2c tends to include the next-smaller catchments (250–880 km2; Fig. 6). C1c catchments, similar to alluvial deposits clustered in C1f, are absent north of ≈ 20° S. C3c catchments are mostly located near the Skeleton Coast Erg, similar to alluvial deposits clustering in C3f. Cluster C2f is distributed along the Skeleton Coast except in the immediate hinterland of the erg.
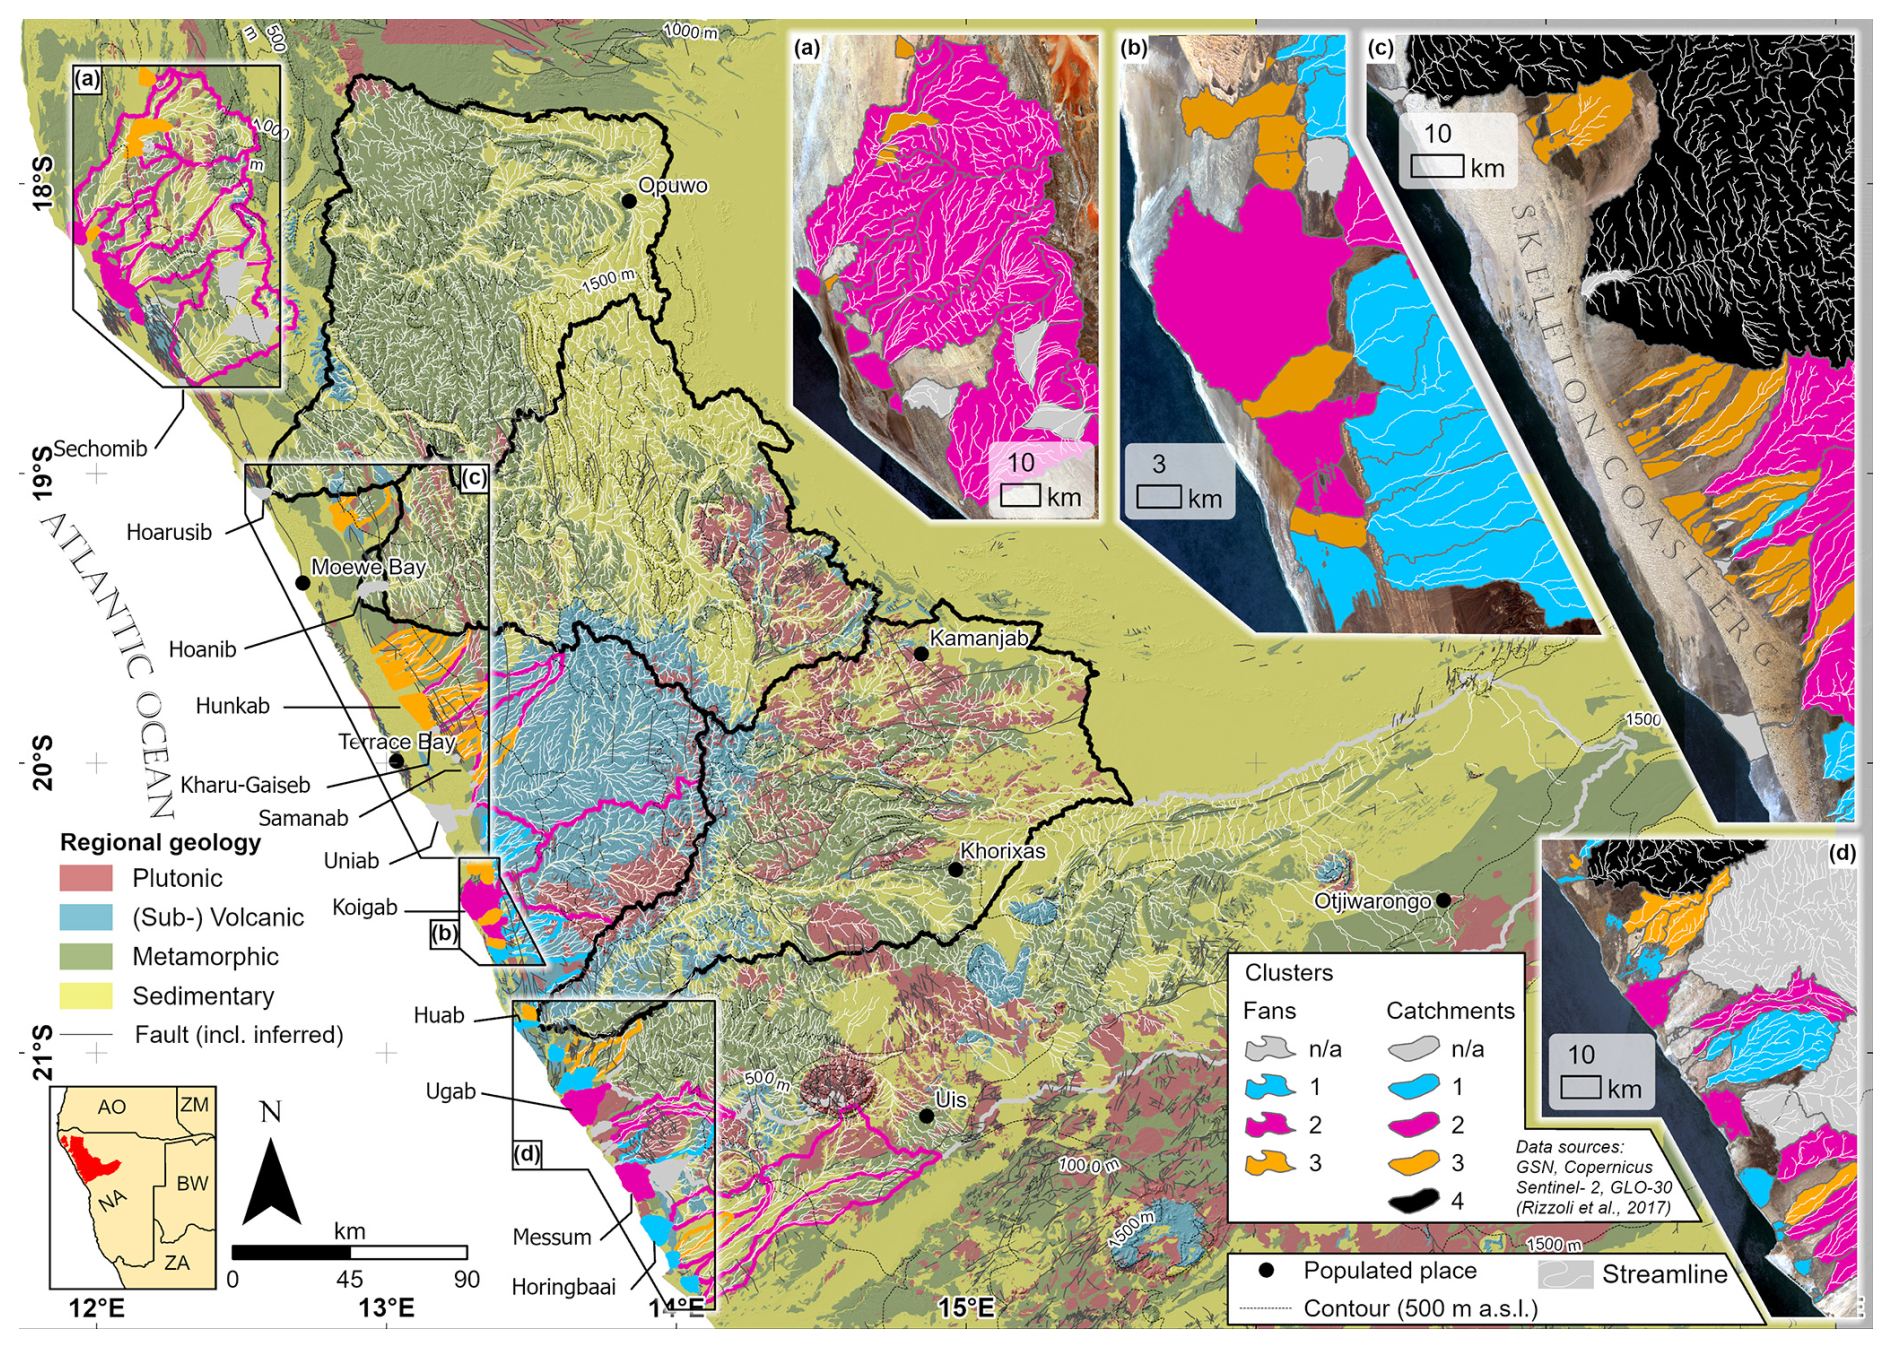
Figure 6Geological map of the Skeleton Coast of Namibia, including catchment and alluvial landform clusters.
These spatial patterns align well with the manual classification used to differentiate the different alluvial landforms (Table 1). For instance, C1f and C2f predominantly debouch near the Atlantic (90 % and 100 % of the cluster cases, respectively), while C3f fans are mostly hinterland-terminating (89 % of the cases in that cluster). Fan types also differ, as C3f fans are strongly associated with bajadas (89 %; i.e., dominant fan type is B-S; Table B11). C1f fans are more frequently parts of coalescing fan systems (60 %), while C2f landforms show a balanced distribution across types. In the cleaned dataset, intermediate sink deposits (n = 0), polygenetic fans (n = 8), and fluvial channel deposits (n = 2) play no major role, suggesting that the outlier removal homogenised the datasets toward fan-like landforms. In the catchment dataset, the majority of alluvial landforms classified as part of bajadas (n = 13) and being situated distal from the coastline (n = 14) are combined in Cc3, while Cc2 presents the most heterogenous combination of alluvial landform types.
4.3.2 Cluster homogeneity and statistical characterizations
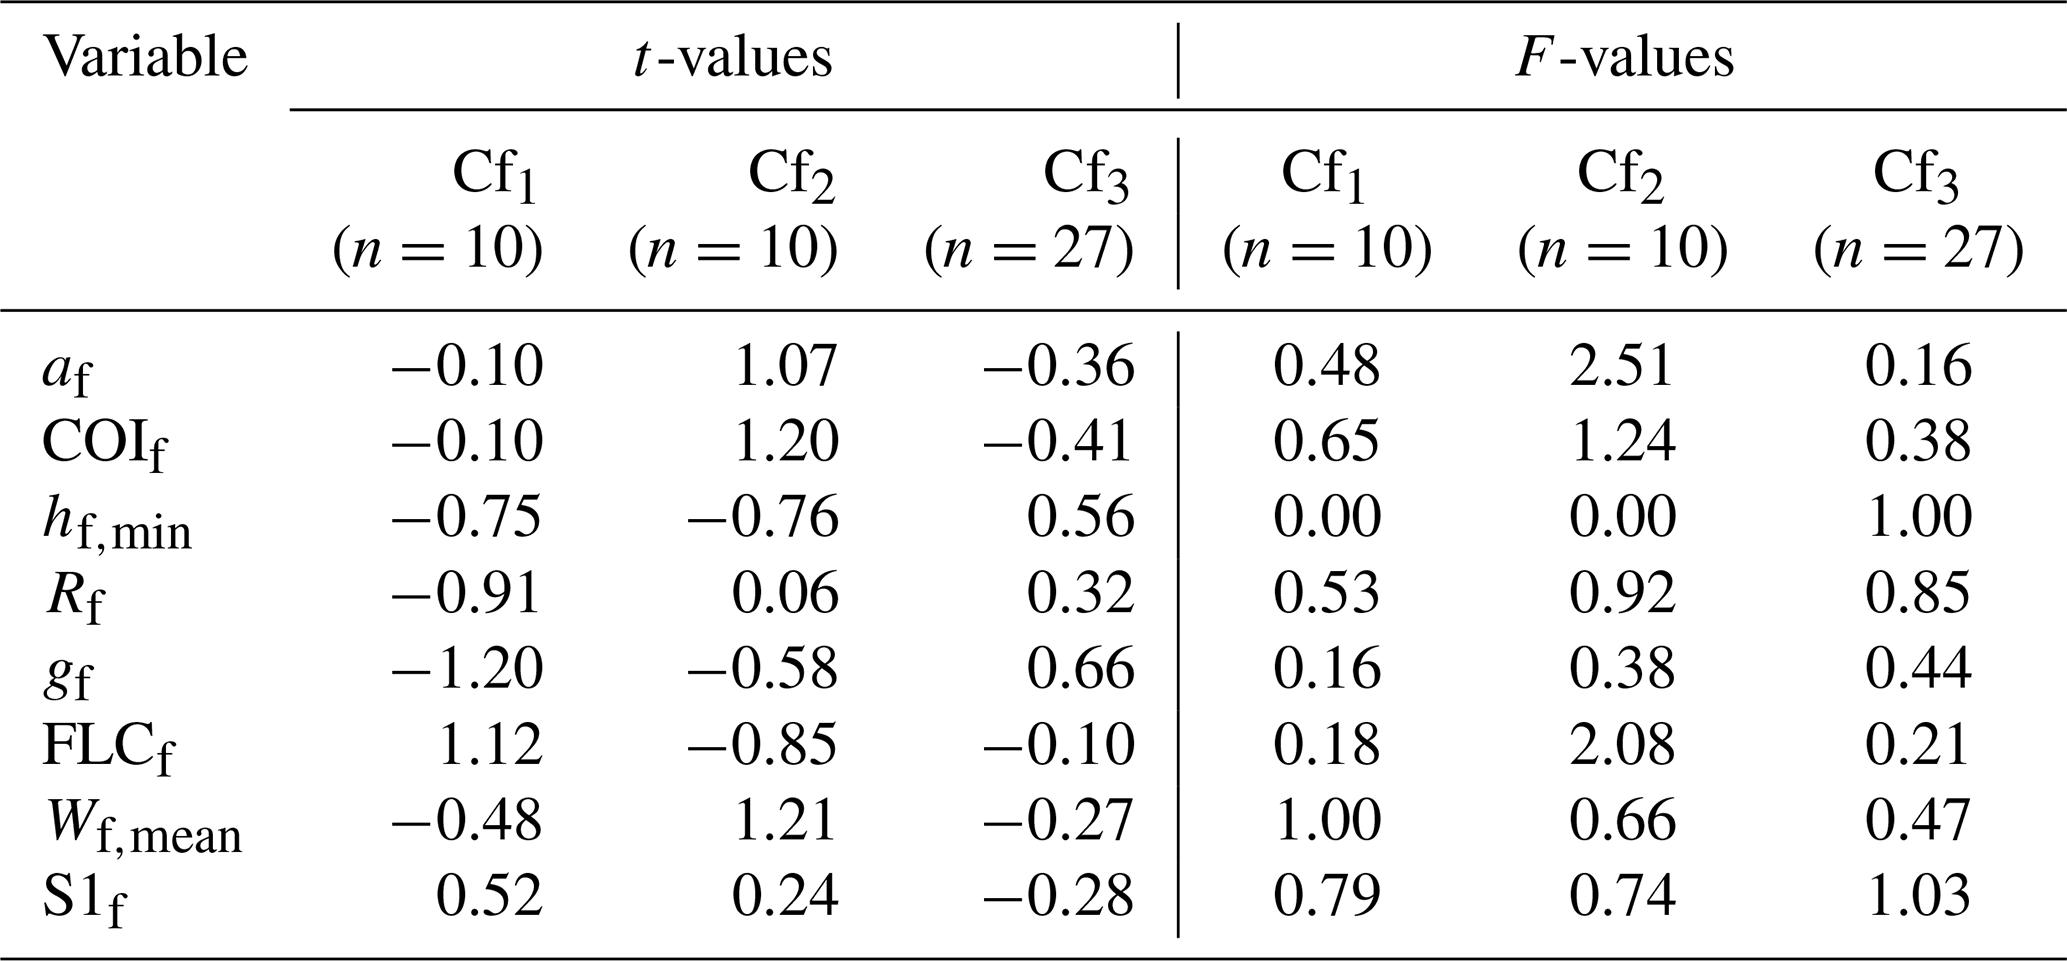
F-values indicate that all fan clusters are sufficiently homogeneous relative to population variance (Table 3). Notable exceptions are found in cluster C2f, where af and FLCf scatter widely (F > 2). Here, a prominent t-value of −0.85 for FLCf is thus uninformative, but overrepresentation in Wf,mean (t = 1.21) and underrepresentation in hf,min (t = −0.75, similar to C1f) remain diagnostic. C1f generally shows underrepresented variables, most strongly gf (t = −1.20), but is overrepresented in FLCf (t = 1.12). C3f is characterised by higher values in gf (t = 0.66) and lower values in COIf (t = −0.41).
Table 3t- and F-values calculated for the fan dataset after clustering.
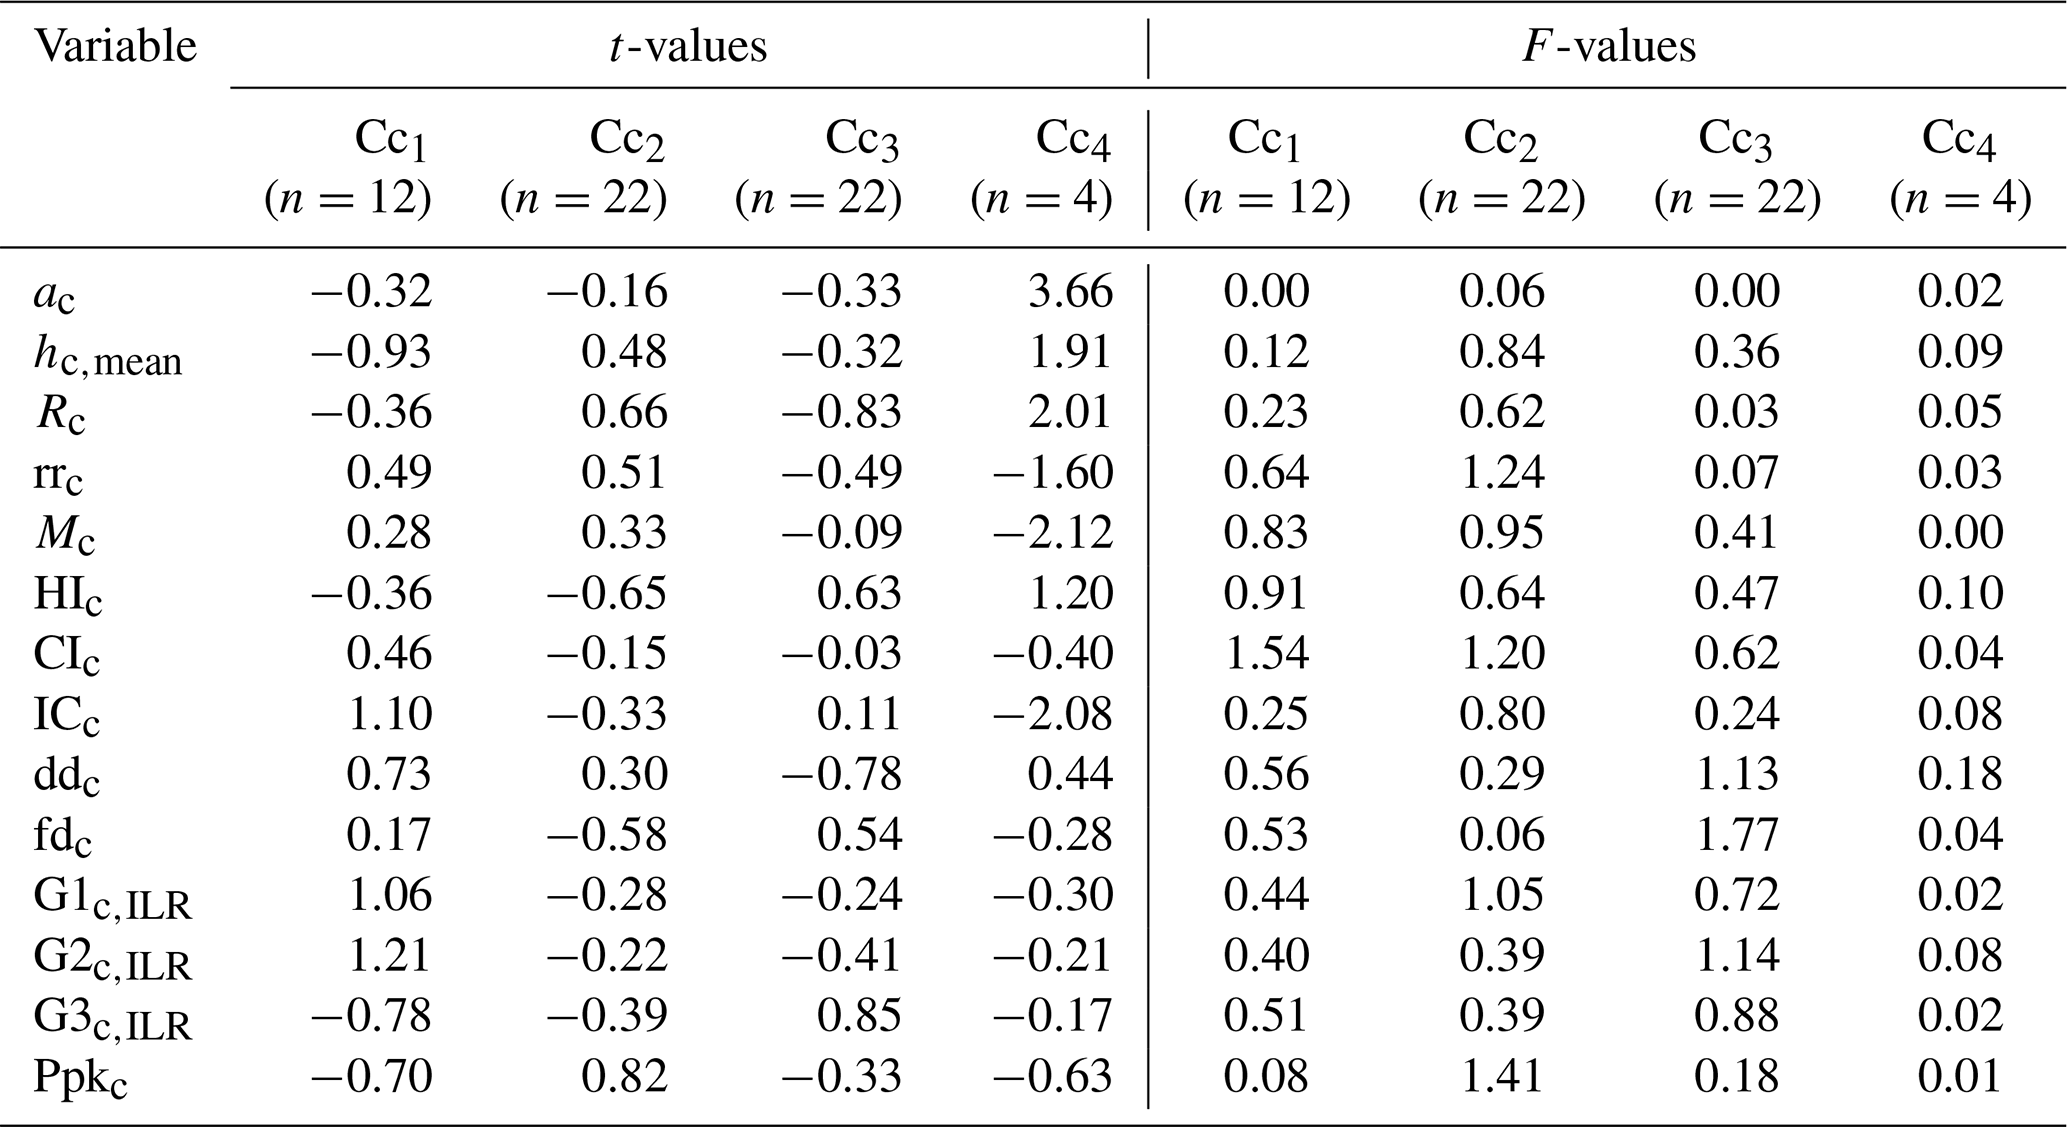
Regarding the catchments, C4c stands out by extreme t-values and strong internal consistency, reflecting its outlying nature but also small case number (n = 4; Table 4). Across all clusters, variable ac stands out as showing very homogenous values; the area ranking indicates that Cc1 and Cc3 are very similar in ac. Cluster C1c, is further defined by lower values in hc,mean (t = −0.93) but is overrepresented in G1c,ILR (t = 1.06), G2c,ILR (t = 1.21), and ICc (t = 1.10). C2c is, generally at less extreme t-values as C1c, characterised by overrepresentation in Rc (t = 0.66), underrepresentation in HIc (t = −0.65), and a scattered Ppkc (F = 1.41). The third catchment cluster, C3c, has lower values in Rc (t = −0.83), but high values in G3c,ILR (t = 0.85). In terms of clustering significance, CIc appears to play a minor role, as indicated by two elevated F-values and minor differences in t-values.
Table 4t- and F-values calculated for the catchment dataset after clustering.
Box-and-whisker plots confirm these tendencies (Fig. 7a, b). Fan cluster separation is largely driven by gf, while in catchments, clusters are distinguished best by relief (Rc), with a general trend of Cc3 < Cc1 < Cc3 (Fig. 8).
No clear separation variable can be identified from the catchments associated to the Cf1 to Cf3 clusters (Fig. C9).
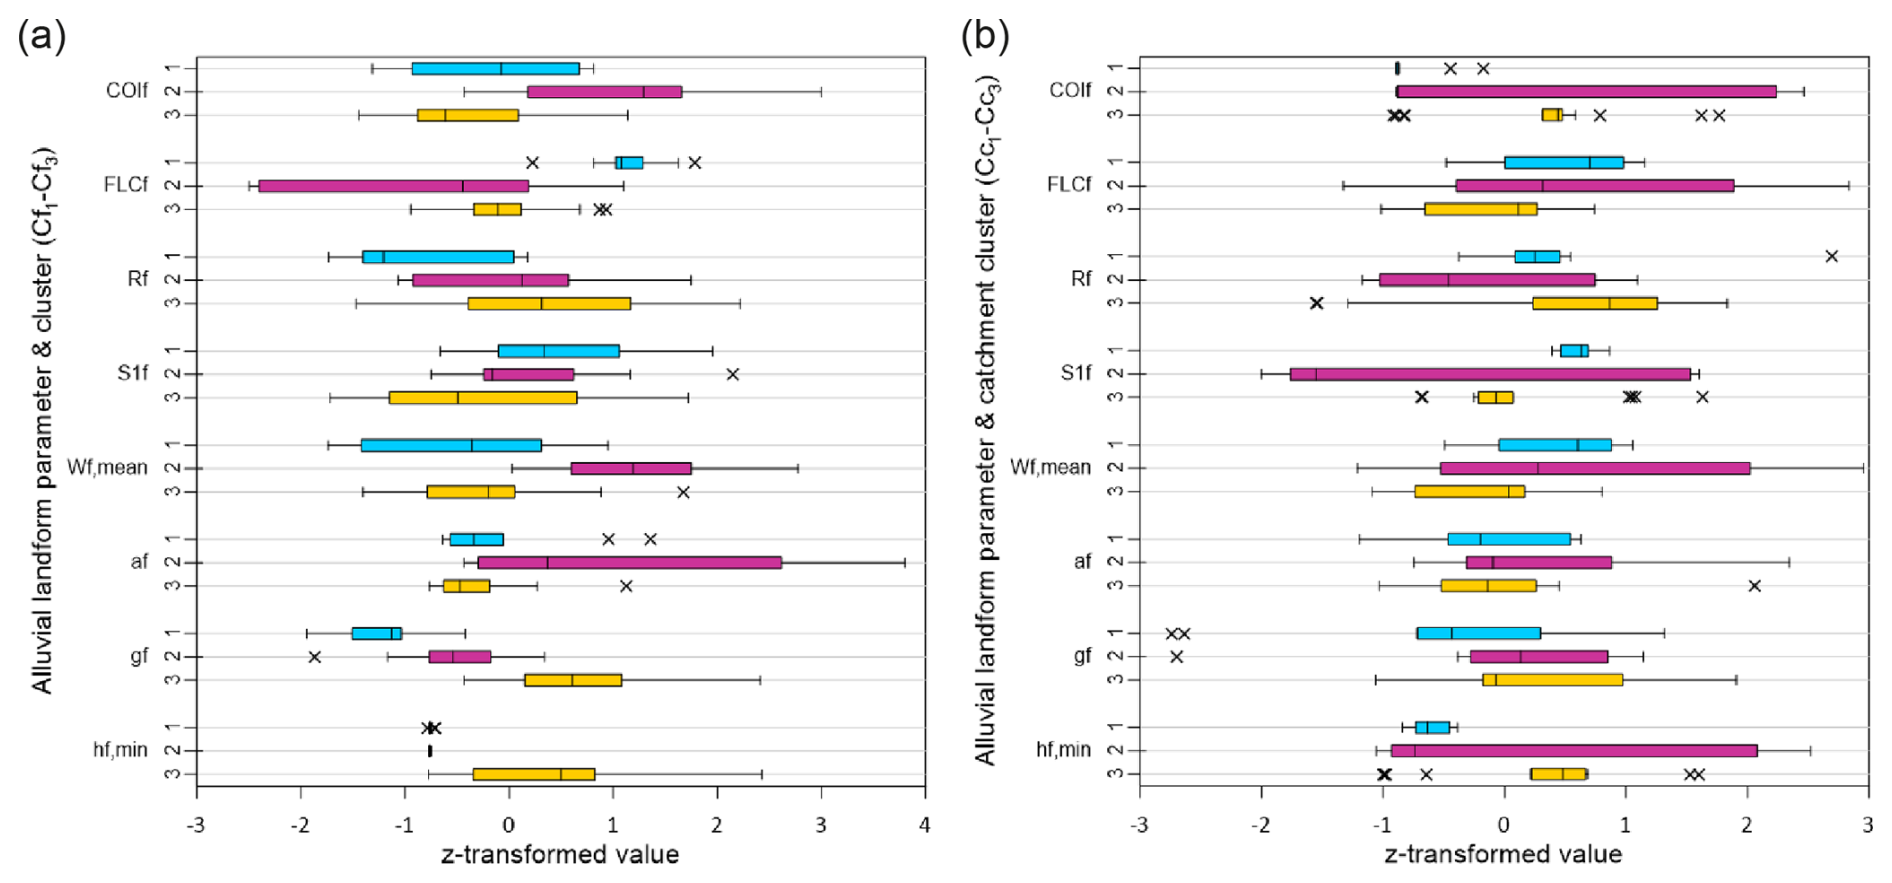
Figure 7Boxplots showing the median, 25 % and 75 % quartiles, 1.5× interquartile range and outliers (indicated by crosses) for the alluvial landform variables used to cluster the fan dataset, applied to the alluvial landform (a) and catchment clusters (b). Z-transformed data as used for the clustering is shown to account for the different scales of the individual variables.
The catchment dataset box-and-whisker plots indicate a more pronounced cluster separation as for the fan dataset. In addition to the overrepresentation in igneous lithology (G1c,IRL and G2c,IRL) and ICc, comparably high values in ddc and low values in Ppkc are evident in cluster C1c (Fig. 8). The metamorphic rock-dominated cluster Cc3 further appears to be characterised by low values in ddc and rrc. When alluvial landform variables are considered in the catchment clusters, a separation between Cc1 and Cc3 becomes evident in COIf, S1f, and hf,min, while Cc2 does generally show high value ranges (Fig. 7b). Alluvial landform values in Cc3 are, however, often considered outliers with respect to the box-and-whisker 1.5× interquartile range.
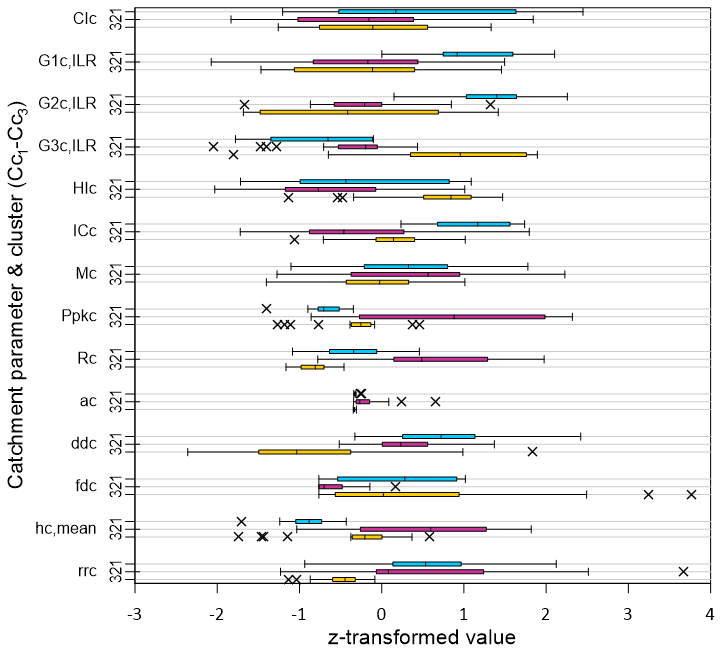
Figure 8Boxplots showing the median, 25 % and 75 % quartiles, 1.5× interquartile range and outliers (indicated by crosses) for the catchment variables used to cluster the catchment dataset. Z-transformed data as used for the clustering is shown to account for the different scales of the individual variables.
4.3.3 Cross-dataset cluster matching
Excluding those cases where both alluvial landform and catchment of a given drainage system were filtered out during the data cleaning process, a total of n = 41 drainage system pairs could be matched between catchment and fan clusters. Notable is the finding that no connection exists between clusters C3c and C2f, the latter having the smallest number of pairable cases (n = 7). However, about one third (n = 13) of all pairs link clusters C3c and C3f (Fig. 9 and Table B12). C3f also pairs frequently with C1c (n = 6). C2c shows the broadest distribution across fan cluster matches (n = 14 in total). From the sink perspective, C1f is the only cluster linked to all catchment clusters, while C2f and C3f are more frequently combined with C2c and C3c, respectively.
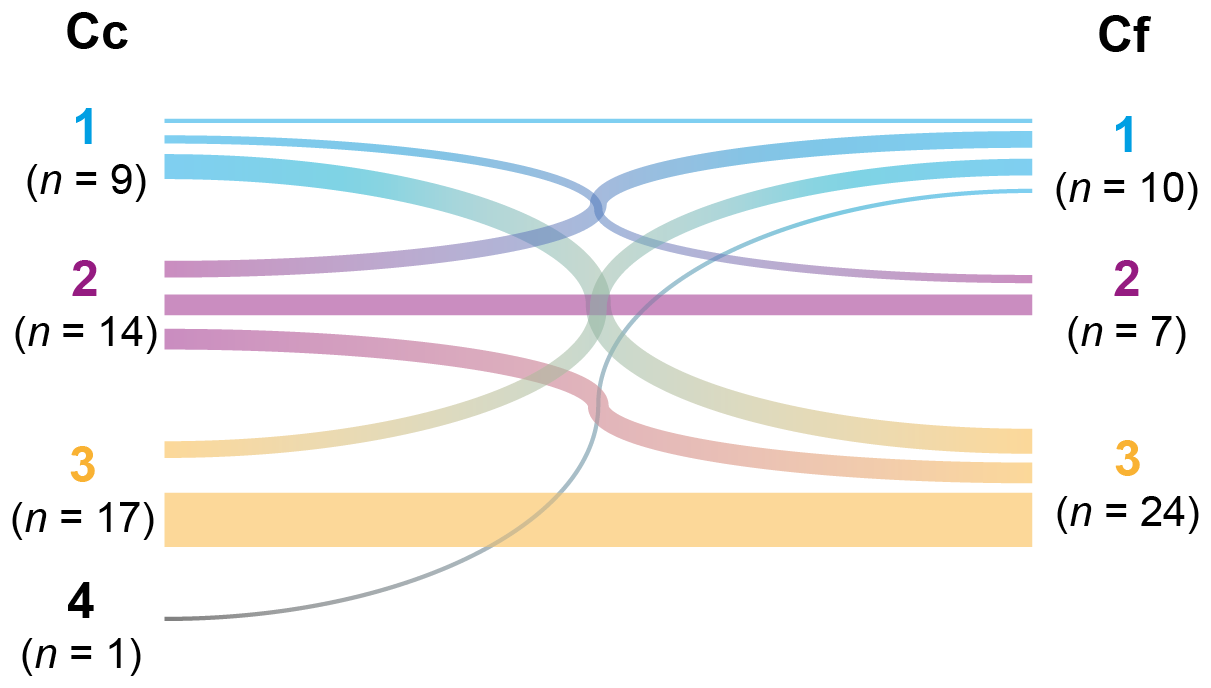
Figure 9Schematic combination diagram of the catchment (Cc) and fan (Cf) dataset clusters. The thickness of the individual connection lines corresponds to the number of cluster pairs. Note that for several cases no combination could be achieved as alluvial landforms or catchments were classified as outliers, reducing the number of pairable cluster objects to n = 41.
4.3.4 Correlation and scaling relationships
Partial correlation analysis identified 66 significant power-law correlations (p < 0.05, r > 0.70), with strong variations in calculated partial coefficient of determination values in each of the correlations (up to 0.5 in r2; Tables 5, B13). However, nearly half of the correlations appear to be strongly outlier-driven or lack clear causality (e.g., Wf,mean and fdc). Furthermore, ten valid relationships reflect direct fan or catchment area-relief scaling. These functional relationships (i.e., Rc(ac) and Rf(af)) show that in many clusters, relief increases with area (Table 5). For other relief-related variables, linear correlations (i.e., y1 = ≈ 1) appear in clusters Cf1 and Cf2 (Rc(hc,mean) and Mc(rrc)). Both clusters and cluster Cc1 calculated for the fan dataset show several inner-catchment relief-related morphometric relationships, involving Rc, hc,mean, rrc, HIc, Mc, and ICc. Notable are the ICc(ac) and ICc(Rc) inverse relationships in cluster Cf2, while in cluster Cf1, rrc and Mc scale with HIc.
Table 5Supportive strong (partial r > 0.70) power correlations between parameters within the obtained clusters (excluding outlier-driven and causality-lacking relationships, and cluster Cf4. Cc clusters were tested for both catchment and fan datasets, significant at the 95 % confidence level.
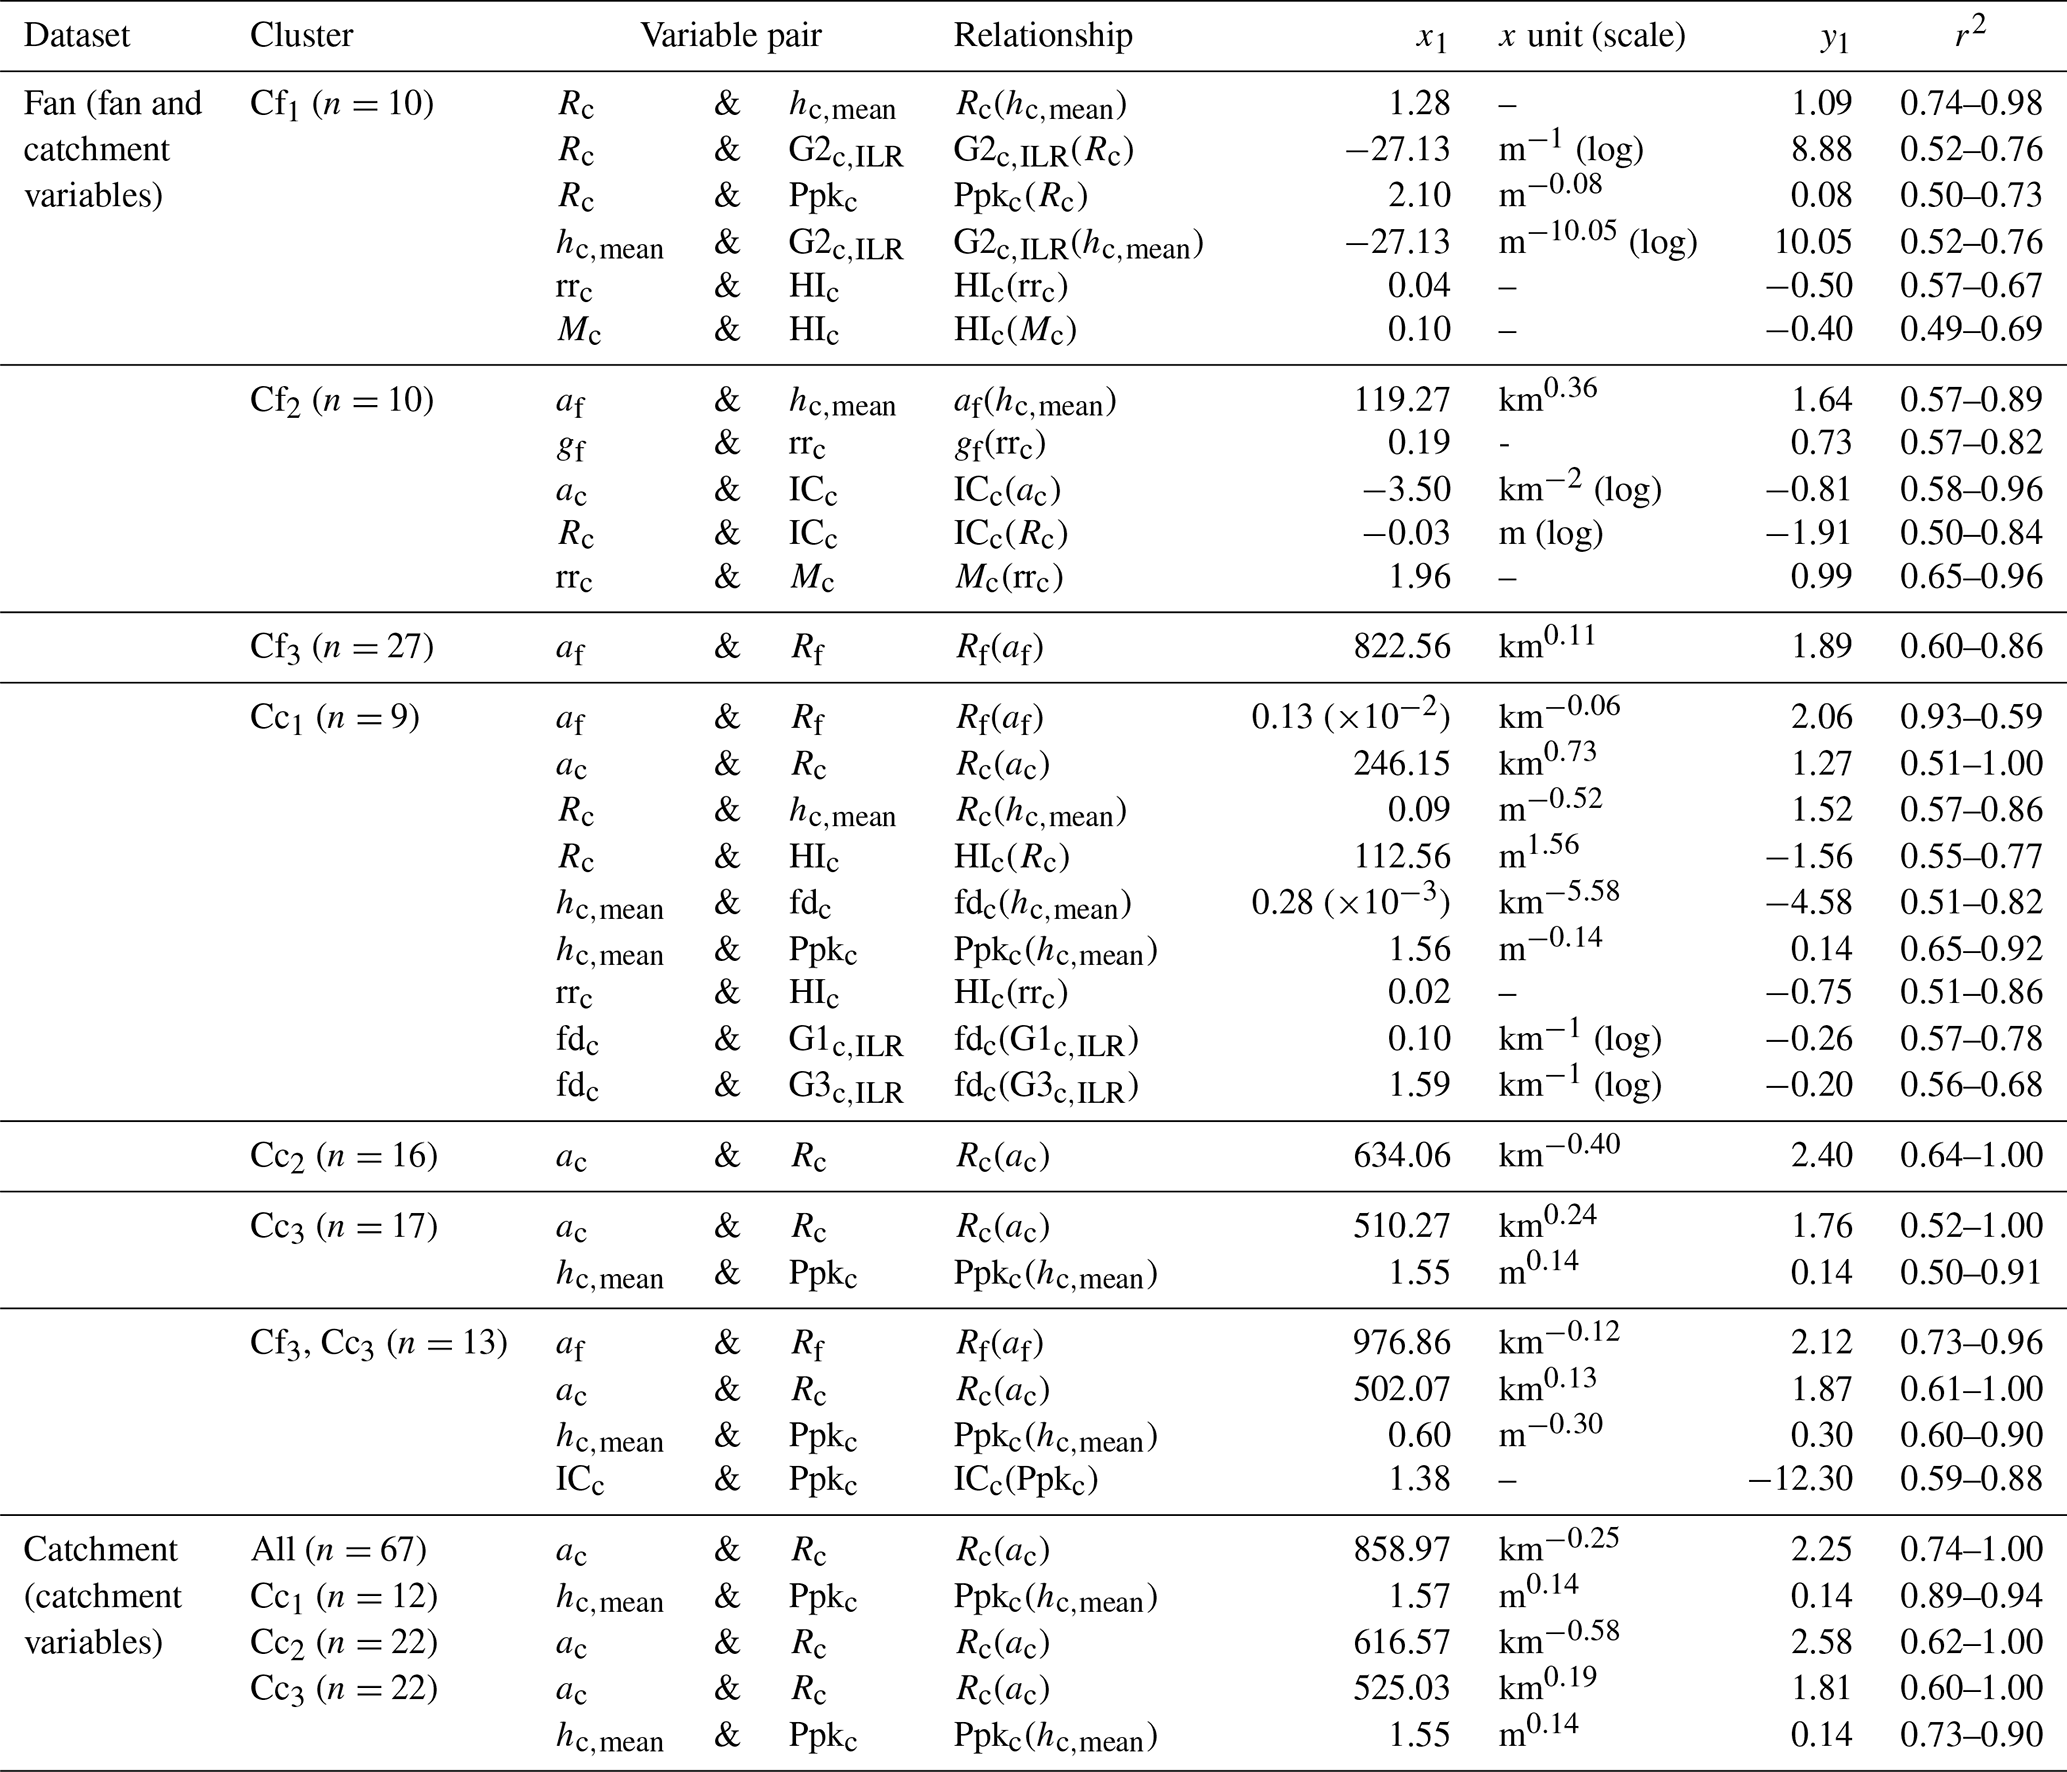
Power-law correlations between hc,mean and Ppkc occur in clusters Cc1, Cc3 (exponent y1 = 0.14 in both), and matching pairs of clusters Cf3 and Cc3 but not in Cc2. However, a statistically significant linear regression (Eq. 2) strengthens these (positive) relationships (r2 = 0.93 in Cc1; r2 = 0.91 in Cc3) and reflects the variable relationship better than by power-law. Geological variables tend to be influenced by hc,mean in cluster Cf1 (G2c,ILR) and Cc1 (fdc), indicating that mean elevation tends to increase with the relative amount of plutonic rocks in cluster Cf1 and with fault density in cluster Cc1. In Cc1, inverse relationships between lithology (G1c,ILR and G3c,IRL) and fdc are evident, i.e. fault density decreases with the relative amount of volcanic and metamorphic rocks.
The group of supportive variable pairs includes two links between fans and catchments, both in cluster Cf2: af(hc,mean) and gf(rrc). The power-law relationships imply that fan areas in this cluster are extremely sensitive to elevation gain in the catchments (y1 = 1.64), while fan gradient scales with linear catchment relief gradient (rrc, ratio of relief and catchment length) by y1 = 0.73. Thus, steeper fan gradients are associated with a higher rrc in Cf2.
Regarding classical fan power functions, most catchment clusters yield non-significant results. An exception is the gf(Mc) relationship, which is significant in the Cf1 cluster and the Cf3–Cc3 cluster combination (Fig. 10, Table 6).
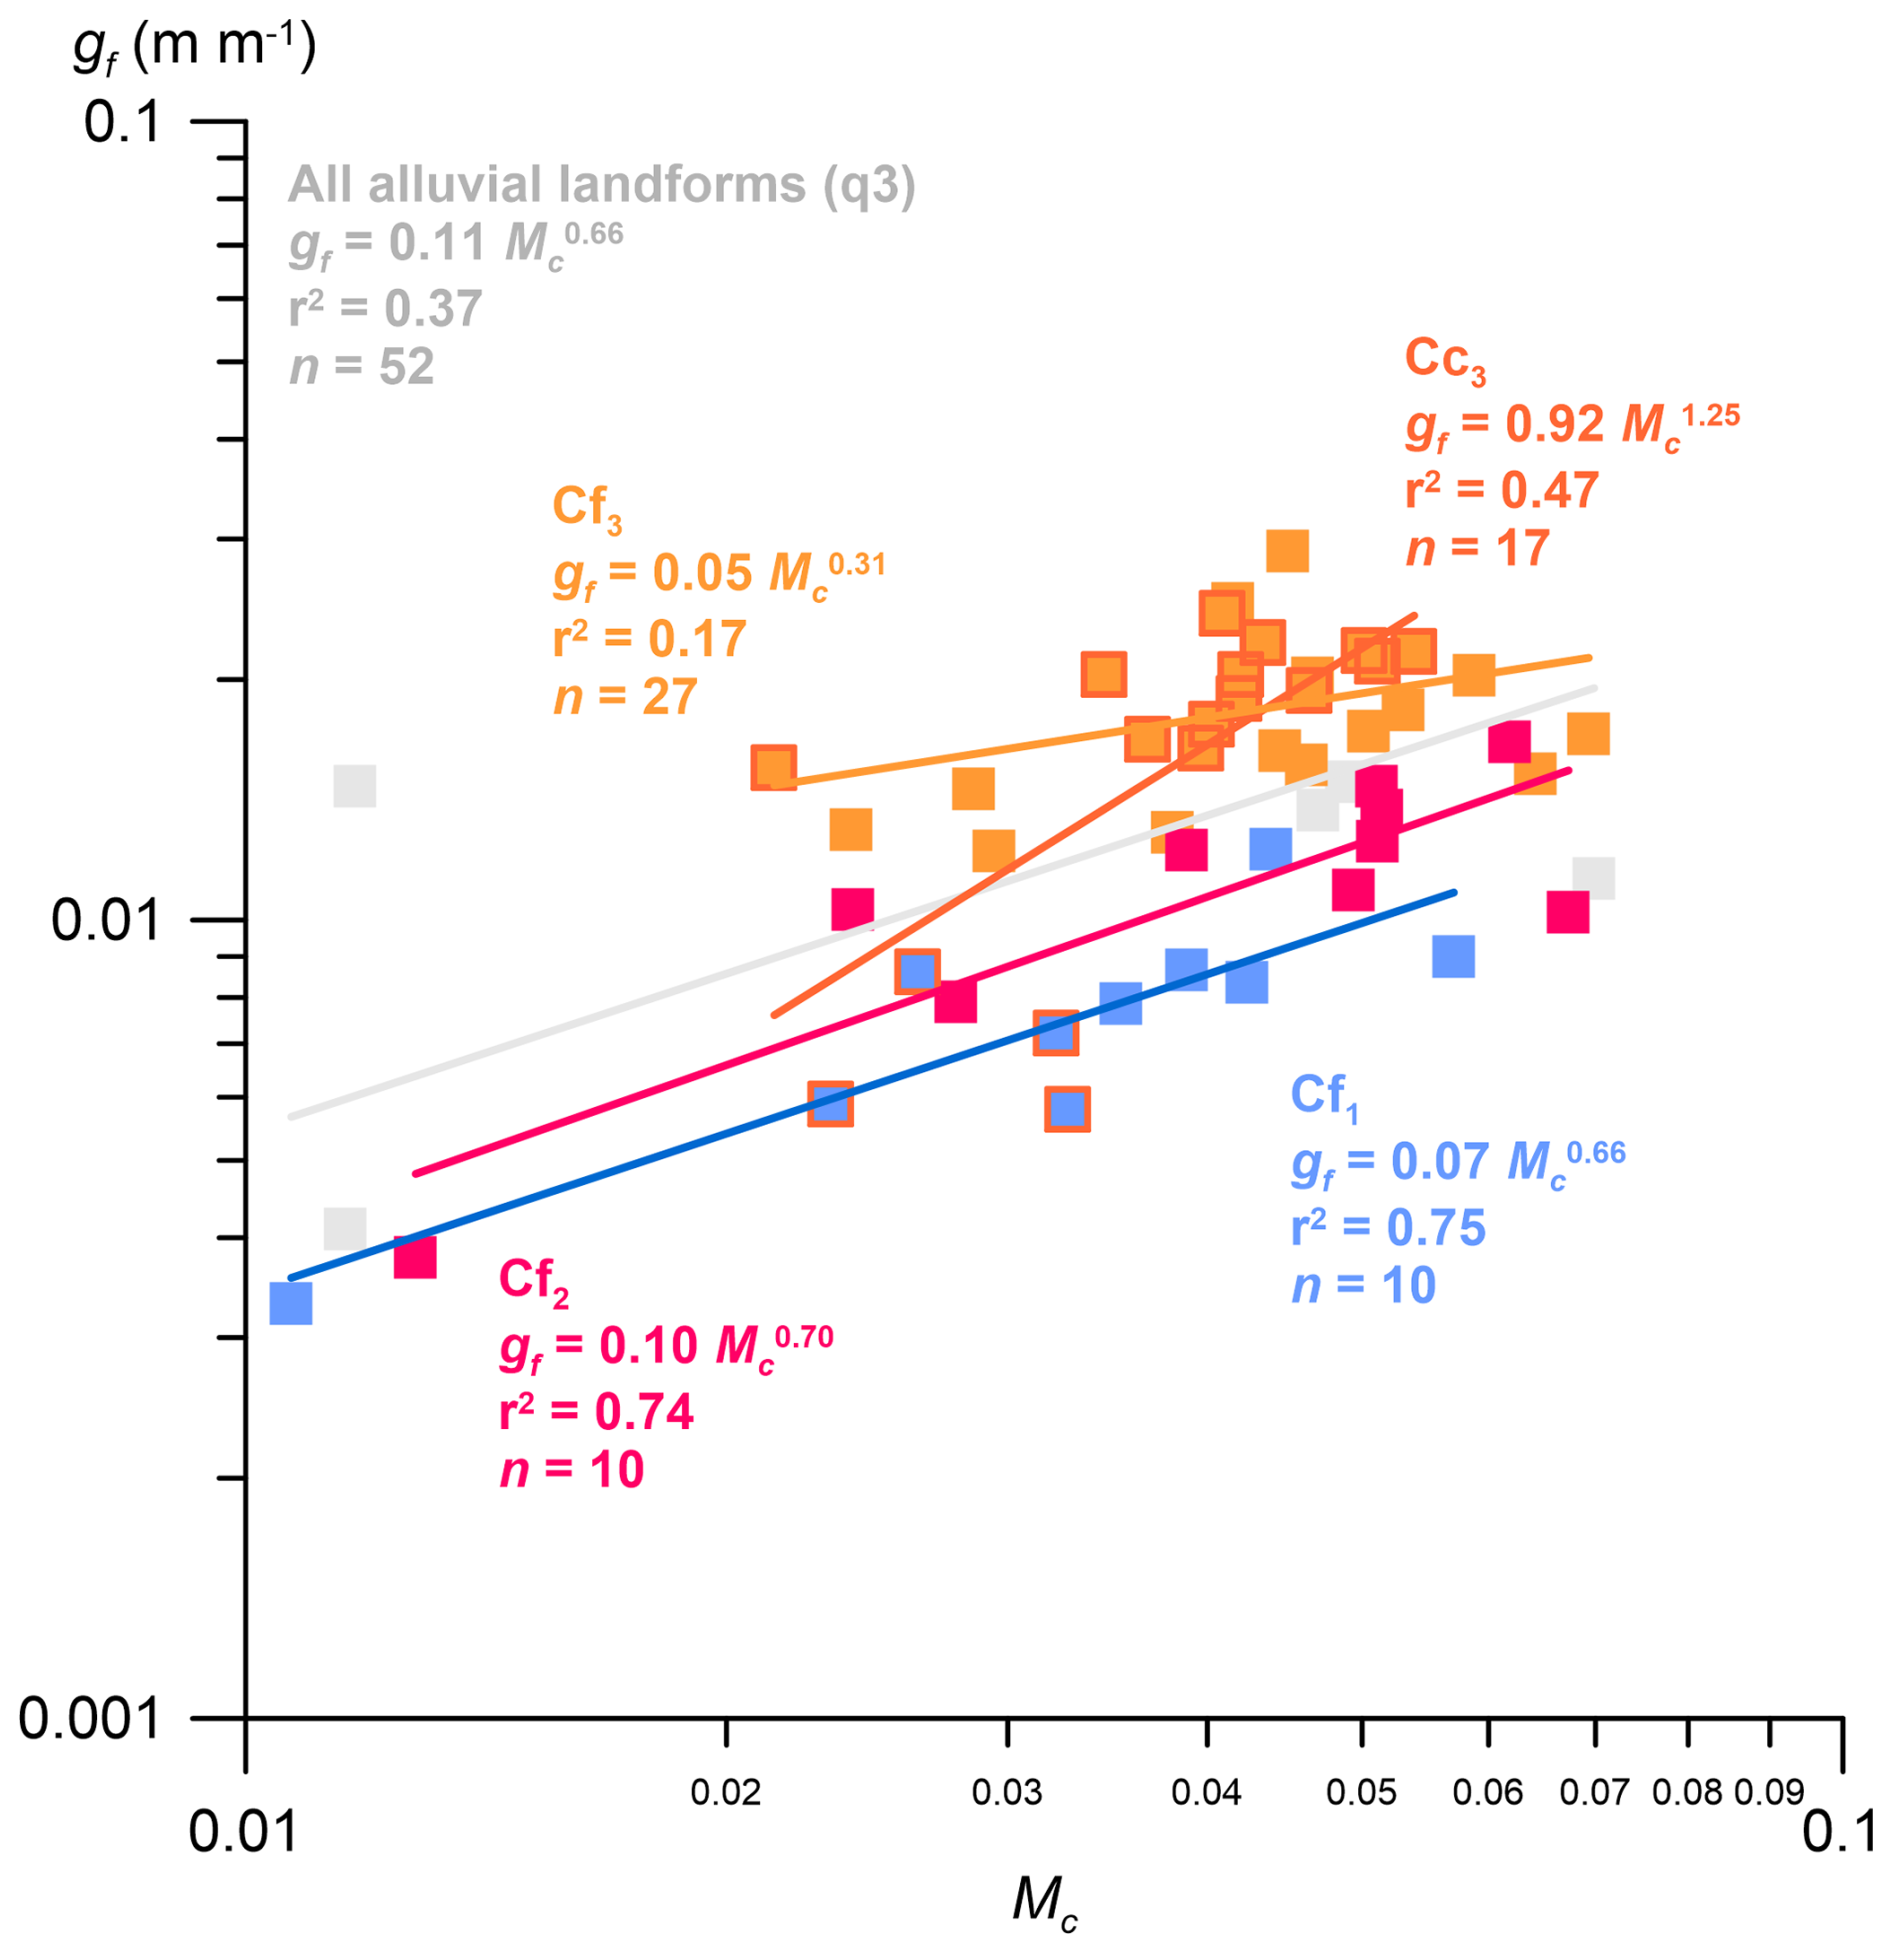
Figure 10Power-law relationships between fan gradient (gf) and Melton's number (Mc) for the fan dataset population and clusters Cf1, Cf2, Cf3, and Cc3 (framed squares).
Table 6Classical power-law relationships significant at the 95 % confidence level between the variables af, gf, ac, and Mc in different clusters (population based on the fan dataset).
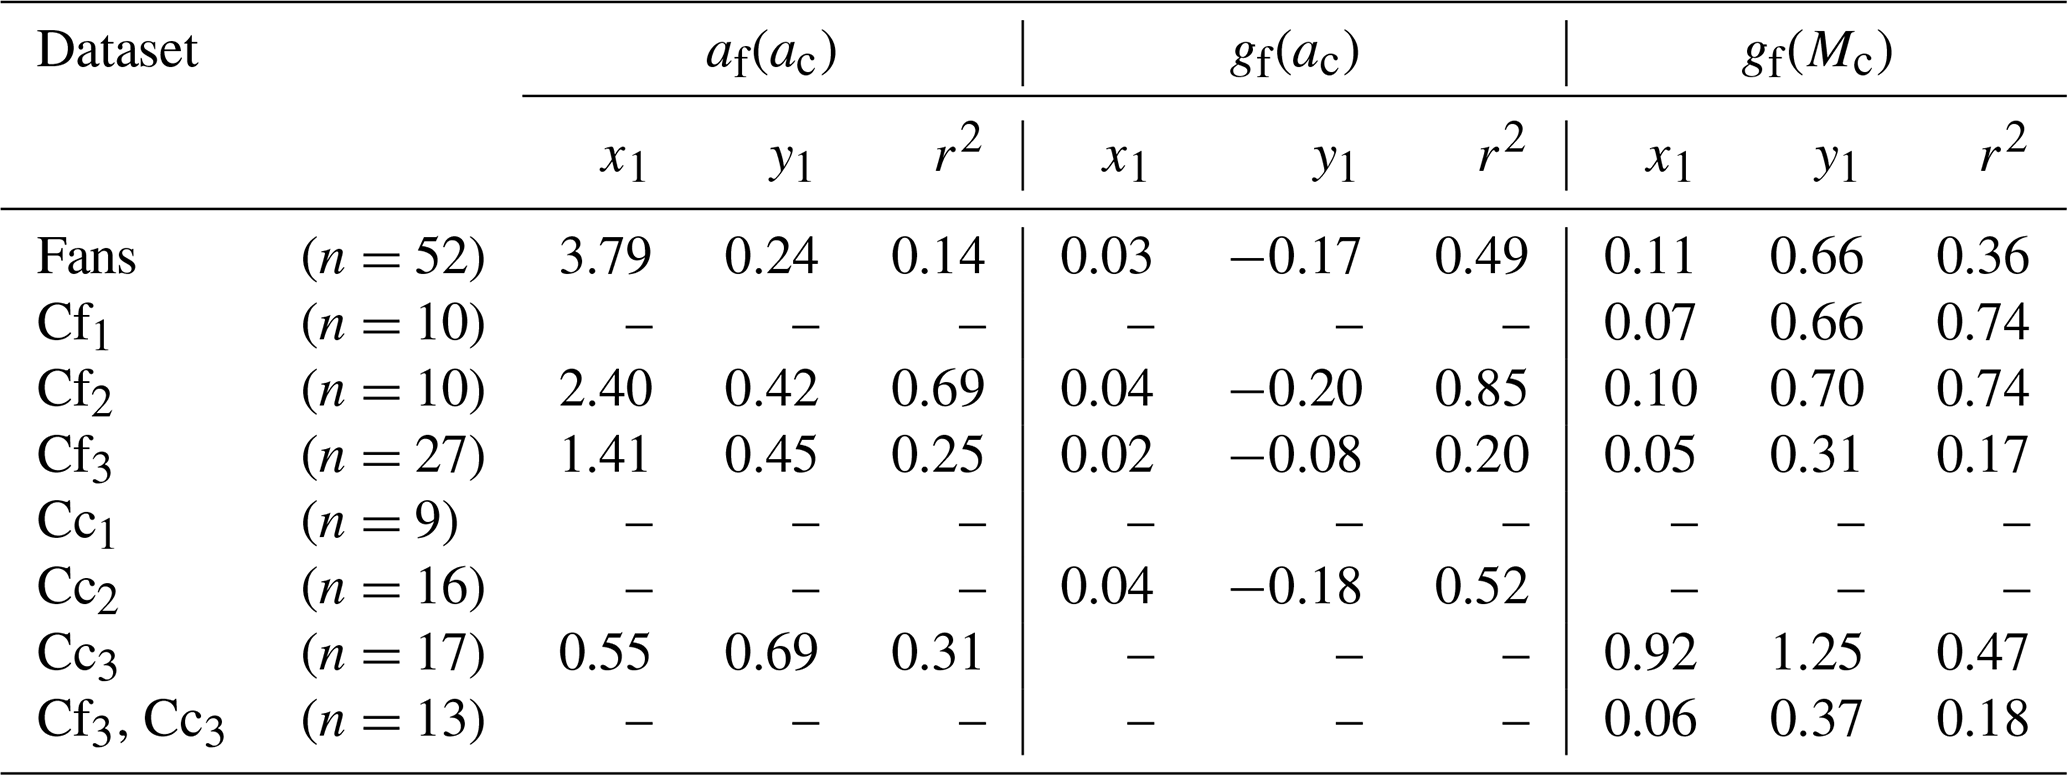
The power-law relationship gf(Mc) obtained for the cases clustered in Cf1 and Cf2 is very similar to that calculated for the non-clustered dataset (x1 = 0.07–0.11, y1 = 0.66–0.70), although the correlation appears to be much stronger for the clustered data (r2 = 0.74). Cf2 shows especially strong correlations for all three variable relationships af(ac), gf(ac), and gf(Mc).
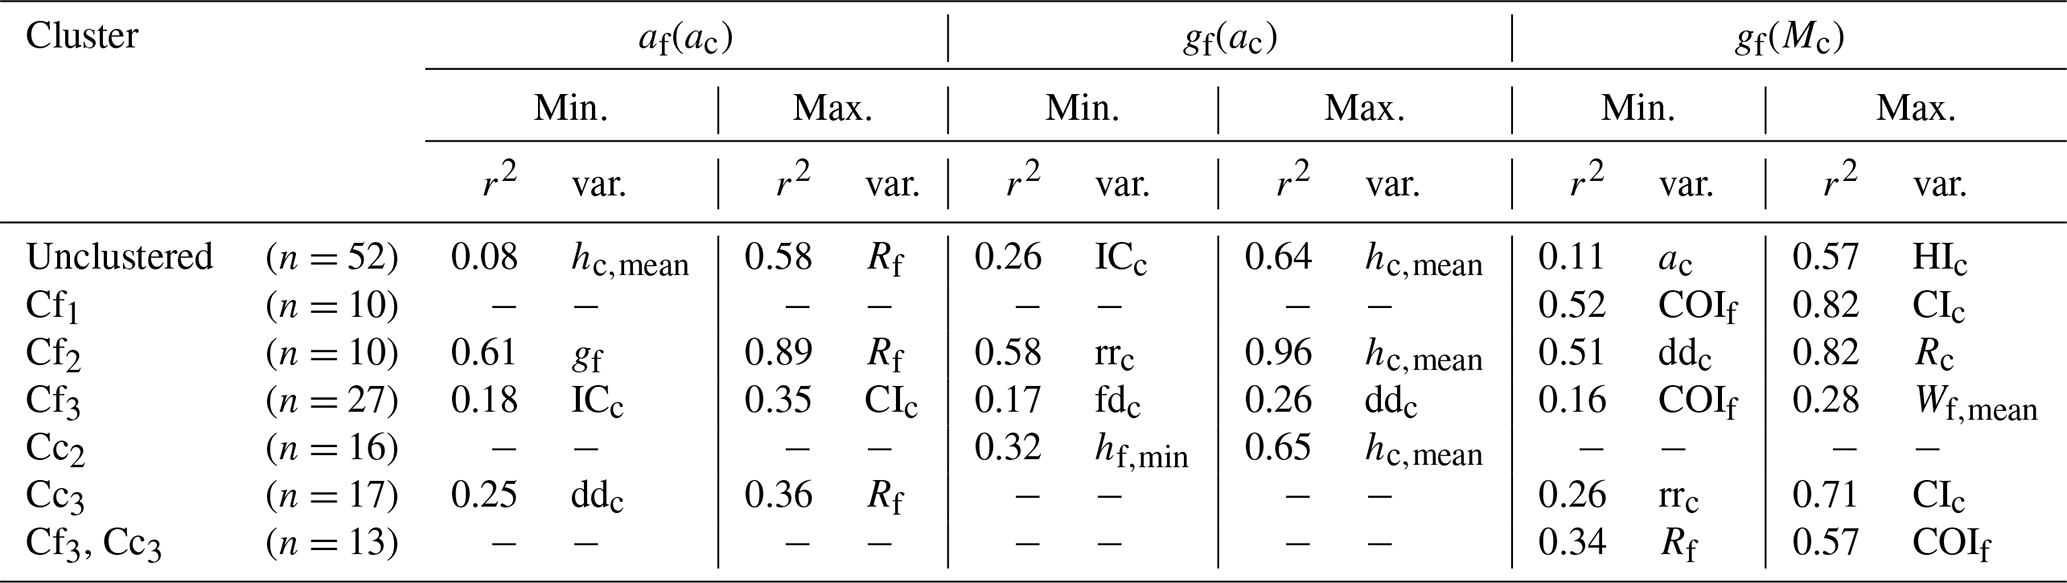
The robustness of the power correlations in Cf2 is underscored by the results of partial analysis, as all coefficients of determination remain above r2 = 0.5 in this cluster (Table 7). In the other clusters, only the gf(Mc) relationship remains in a similar correlation range in Cf1. In more than two thirds of all relationships, catchment variables (hc,mean, rrc, ICc, ddc, fdc) cause the minimum partial correlation, while COIf, hf,min, gf, and Rf appear to represent major influencing fan variables.
Table 7Partial correlation analysis data for the classical relationships shown in Table 6: minimum and maximum correlation coefficients significant at the 95 % confidence level, and associated control variables (var.).
5.1 Cluster analysis performance
Before discussing patterns of alluvial deposition along the Skeleton Coast of Namibia, we briefly evaluate the performance and reasonability of our methodological approach. This evaluation rests on (1) the choice of input data and (2) the cluster reasonability and robustness (e.g. Backhaus et al., 2025a).
A central source of uncertainty lies in the different spatial and temporal integration scales of the datasets. More specifically, catchment morphometrics and geological parameters integrate over topography-building timescales, whereas climate variables and, to some extent, alluvial landform morphometrics may reflect shorter-term conditions. The latter is amplified by post-depositional alterations, as many deposits along the Skeleton Coast likely predate 100 ka (Scheepers and Rust, 1999; Stollhofen et al., 2014) but have since been affected by other processes such as coastal erosion (e.g. Miller et al., 2021) and erg confinement (e.g. Krapf, 2003). However, such mismatches are not unique to our study but common in alluvial fan research, and despite them, fundamental scaling relationships – such as fan area and gradient versus catchment area or Melton's ruggedness index (Eq. 1) – generally appear to remain robust (see the global review on dryland fans provided by Woor et al., 2023a). Nevertheless, we acknowledge that the varying degrees of alluvial landform confinement in our study area impose a limitation when using planar fan area af as a key morphometric variable to interpret source-to-sink coupling. A potentially more meaningful metric could, in principle, be derived from fan thickness and/or volume. Unlike af, such measures may capture the influence of confinement on fan progradation and aggradation more sufficiently, and thus relate fan sediment storage more adequately to their drainage systems. However, owing to the diversity of depositional settings, irregular fan geometries, and uncertainties in the morphology of the underlying bedrock surface, we are unable to provide such a proxy with a level of accuracy comparable to that of af. We note, however, that the two-dimensional area of the individual swath profiles – bounded by their minimum and maximum elevation curves – shows a strong linear relationship with af (r = 0.92 for n = 67 landforms; Fig. C10). It therefore seems likely that metrics incorporating fan thickness would also be strongly correlated with af, and thus fail the initial variable filter step described in Sect. 3.4. An implication would be that these metrics would not provide a significant gain in morphometric information for the approach we follow.
Regarding climate, a certain variability in synoptic patterns during the Quaternary is evident for southern Africa (e.g., Stuut and Lamy, 2004; Stuut et al., 2002; Heine, 2004, 1998). Although past less arid phases promoted more active fan formation, relative gradients in moisture between coast and hinterland probably persisted throughout the Quaternary (see paleoclimate models for southern Africa of Heine, 1998, and Blümel, 2013). Despite model and downscaling-depended uncertainties, a glimpse in glacial climate conditions across our study area is provided by the CHELSA-TraCE21k dataset, which is based on the Community Climate System Model Version 3 and a reconstructed paleo-orography for that time, downscaled to a spatial resolution of 1 km (Karger et al., 2020, 2023). From here, dividing modern (Brun et al., 2022a) by LGM (Karger et al., 2023) precipitation model data (Pc,mean; LGM data prepared as described in Sect. 3.3) yields relative catchment-wide change factors ranging from ≈ 0.6 (#55) to ≈ 1.2 (#2), with a mean value of 0.9 across the investigated drainage areas (Fig. C11). Values < 1 therefore indicate higher (modelled) precipitation during the LGM, suggesting slightly less arid conditions in our study area, with a spatial focus to the near-coast catchment areas. More importantly, the LGM precipitation gradient towards the hinterland generally mimics the gradient presented by modern precipitation data.
Analogously, fog advection patterns may have followed broadly comparable gradients in the past. However, the modern climate dataset used in this study relies on gauge-corrected European Centre for Atmospheric Research (ECMWF) climatic reanalysis interim (ERA-Interim) data (Brun et al., 2022a, b; Karger et al., 2017), which does not account for precipitation from fog (Träger-Chatterjee et al., 2010). Large-scaled climate models tend to provide contradictive data at Namibia's coastline (see Karger et al., 2017) and generally fail to capture low-intensity precipitation from fog in a sufficient manner (Hemp and Hemp, 2024). This is problematic in the Skeleton Coast setting, given that fog constitutes a major water input (e.g., Li et al., 2018; Lancaster, 1984), contributing to the preservation of alluvial surfaces by cementation (Sect. 2). As an attempt to overcome the missing information on fog input, we used the independent dataset provided by Andersen and Cermak (2018). Yet, its short observational record of approximately three years introduces substantial uncertainty when drawing conclusions from modern spatial patterns with respect to long-term topographic evolution, and it did not provide information of significant value for the catchment areas (Sect. 4.1, Table B6).
As valid for the other modern climate parameters applied in this study, timescale-related uncertainties are inevitably attached to the wind data we used. There are indications that wind regimes may have varied during the Quaternary (e.g., Stuut and Lamy, 2004; Gingele, 1996), providing arguments for a late Quaternary formation of the Skeleton Coast Erg (Miller et al., 2021; Krapf et al., 2005; Sect. 2). However, given the strong role of the erg in shaping fan morphology, wind must be considered a relevant driver for morphometric analysis, even on modern timescales.
Evaluating the cluster analyses as conducted in this study, cluster performance depended strongly on outlier handling. Partial removal of outliers identified by single linkage fusion yielded cophenetic correlation coefficients of 0.64–0.65. While these coefficient values are moderate compared to other applications (e.g., > 0.8 in Santi Malnis and Rothis, 2024), they are within the acceptable range for exploratory clustering (cf. Gere, 2023). Especially in the catchment dataset, complete removal of the Cc4 outlier cluster did not improve cluster recovery, as confirmed by split-half tests.
The fan dataset showed similar behaviour: Ward's linkage produced lower cophenetic correlation (0.64) than complete linkage (0.72) but yielded more reproducible cluster in split-half tests. This indicates that split-half evaluation is the more meaningful measure of clustering robustness in our context. Limitations are nevertheless evident in imperfect cluster recovery, elevated cluster F-values (Tables 3 and 4), and wide within-cluster variable value ranges (Figs. 7 and 8). In this regard, especially Cf2 and Cc2 can be considered as transitional clusters, while a clearer separation is achieved between Cf1 and Cf3 as well as Cc1 and Cc3. This finding is supported by the strong heterogeneity in Cf2 alluvial landform types (Table 1). Given the substantial population share of cluster Cf2 and Cc2 (21 % and 37 %, respectively), more rigorous outlier removal could have been justified. At least for the catchment dataset, however, a thorough outlier removal would have resulted in two strongly heterogeneous clusters (as suggested by the Caliński and Harabasz criterion). Furthermore, the important metric capturing the fan gradient (gf) is distinctly separated between the catchment clusters (Fig. 7a).
An interesting insight into the clustering procedure is illustrated by the separation of fans #62.1 and #62.2, and #11.1 and #11.2. Both #62 landforms belong to the Messum drainage (21.4° S) and are characterised by very similar precipitation and wind conditions (< 16 % difference in Wf,mean and Ppkf), gradient, and surface roughness (10 % difference in S1f and gf). On the (sub-)catchment scale, both systems were identified as outliers and removed from analysis, as only (sub-)catchment area and mean elevation differ by ≈ 16 %. Regarding the alluvial landforms, greater differences are evident for fan size af (17 %), fan confinement COIf (37 %; #62.2 < #62.1), and fan relief Rf (56 %). The largest differences, however, are encountered for low cloud cover frequencies FLCf (90 %) and minimum elevation hf,min (100 %), both variables being dictated by the proximity to the Atlantic Ocean. Both variables represent strong cluster variables in Cf2, with hf,min indicating an extremely low scatter. While these differences explain why #62.1 was assigned to cluster Cf2 and highlight the discriminating power of individual variables, they provide to some extent justification for a separate treatment of these systems.
A contrasting scenario is evident for the Hoanib/Gui-uin subsytems (#17.1, 17.2). Here, differences of more than 30 % are evident for most variables (af, COIf, Rf, gf, FLCf), but both alluvial landforms were classified as outliers. This finding can be argued to reflect the unusual, wetland-like and strongly vegetated depositional setting in the basin (Stanistreet and Stollhofen, 2002), highlighted by exceptionally high Sentinel-1 backscatter values from vegetation and elevated electric conductivity (see e.g. Gupta, 2018 for details on the method). At the catchment scale, the close similarity of the nested subcatchments (< 4 % differences across all variables) explains their joint assignment to cluster Cc4. These examples demonstrate that despite the existence of transitional clusters, the applied clustering approach is robust and meaningful. In particular, the clear differentiation according to fan type supports the validity of the procedure.
It should be noted that fan cluster Cf2 includes many of the fans that have been in focus of research at the Skeleton Coast (Koigab #44, Ugab #57, and lower Messum #62.1), but does not include the Salt (#49) and Horingbaai (#63) fans, which have been described as fans very similar to Koigab and Messum by means of size, gradients, deposits (gravels) and primary morphodynamic process type (braided-river dominated; Krapf et al., 2005). Our cluster approach, however, groups the Salt and Horingbaai fans in Cf1, which does not show any further notable correlations except for the gf(Mc) power-law correlation. The regression, however, is remarkably similar to the gf(Mc) relationship obtained for cluster Cf2 and the bulk fan dataset (Table 6), bridging the two clusters in this regard.
5.2 Morphometrical characterization of alluvial landforms along the Skeleton Coast of Namibia
5.2.1 The sink perspective
The power-law correlation analysis performed for the initial (i.e., bulk fan and catchment) and clustered datasets indicate that despite alluvial landform confinement, correlations significant at the 95 % confidence level exist between source and sink metrics. The power-law correlation strengths for the classical variable pairs (r2 = 0.14, 0.49, and 0.36, respectively) are on the lower end of what has been reported for dryland mountain-front fan systems, were r2 often exceeds a value of 0.5 (see e.g. Bowman, 2019d). In the comprehensive review on global dryland fans provided by Woor et al. (2023a) only 15 % of the assessed fan system studies showed r2 values below 0.5 for the af(ac) power-law relationship, while the same statement applies to 37 % of the gf(ac) relationships. Low af(ac) correlations are usually encountered where fans are laterally – and especially distally – confined (cf. e.g. Silva et al., 1992; Walk et al., 2020; Stokes and Mather, 2015), although the relationship appears to be relatively robust even in confinement scenarios (e.g. Woor et al., 2023a; Karymbalis et al., 2022).
In our study area, outlier systems in Cc4 highlight the evident mismatch in the af(ac) power-law relationships, with strongly above-median catchments linked to alluvial landforms at sizes all below the third quartile of fan area. All those systems represent outliers due to their catchment properties irrespective of their sinks. Additionally, the af(ac) coefficient x1 and the exponent y1 of the fan dataset regression function represent a combination of unusually high coefficient (x1 = 3.79) but low af increase per unit increase in ac (y1 = 0.24). This relationship is uncommon for global dryland fan systems which tend to show values in the range 0.25–1.22 for x1 and 0.66–0.97 for y1 (interquartile ranges of the datasets reviewed by Woor et al., 2023a). In cluster Cf2, the exponent y1 is 0.42, but still remains below the usual source-sink relationship. Here, however, mean catchment elevation appears to have a strong impact on fan area. Apart from fan confinement, the pattern of lower increase in fan area per unit increase in catchment area may also point to differences in the rate of sediment transfer, either due to the availability of the material or of factors which are associated with the transport of the sediments within the catchment. This characterization of fan systems along the Skeleton Coast provides arguments for their exceptional classification as typical cratonic systems, as conducted by Lehmkuhl and Owen (2024). However, the general small fan sizes, generally below 10 km in radius even in the least-confined cluster Cf2, do not fit their generalised scheme.
The supportive partial correlation analyses further reveal that fan confinement and post-depositional modification – particularly by the Skeleton Coast Erg – largely explain the weak af(ac) relationships. We identify fan confinement COIf – and not the related variable ac – as most influential variable for the gf(Mc) power-law relationship in fan clusters Cf1 and Cf3, together combining more than 70 % of all sufficiently mapped alluvial landforms. In cluster Cf2, confinement exerts little control (t = 1.20), and both af(ac) and gf(ac) power-law relationships appear more robust compared to the other clusters. This finding is surprising, given the indications for a transitional characteristic of this cluster as detailed in Sect. 5.1. In fact, fan area shows a large variance in Cf2 (Fig. 7a, Table 3), highlighting both the transitional nature of the cluster and the limited significance of this variable for cluster definition.
Regarding the association of fan gradient and catchment size in our study area, the normally distributed fan gradients and the x1 coefficients and y1 exponents from the gf(ac) relationship place the systems of the Skeleton Coast on the lower end of dryland fan systems investigated on Earth (see Woor et al., 2023a). This finding further indicates that fan gradient tends to characterise source-sink-coupling better than fan area along the Skeleton Coast of Namibia, supported by its importance as discriminant variable for the clustering. Based on a detailed examination of morphological and stratigraphic evidence, Krapf et al. (2005) characterised the Koigab and adjacent fans as rather steep braided river-dominated fans, also referred to as fluvial distributive systems (Stollhofen et al., 2014). Our analysis reproduces the fan gradients obtained by Krapf et al. (2005) for the Koigab, Sout, Salt, Horingbaai and lower Messum fans. We find that all these systems lie within 1 standard deviation from the mean value of 0.014 (±0.006), describing the typical fan gradient along the Skeleton Coast of Namibia. The normal distribution may also be deemed indicative for a limited influence of coastal basement surface gradient on fan gradient. Regarding the recently provided definition of alluvial fans by Lehmkuhl and Owen (2024), however, the alluvial landforms found along the Skeleton Coast of Namibia would not be classified as alluvial fans, given the low fan gradients falling below the 1–20° range defined by the authors. Instead, a definition as fluvial distributive systems as applied by Stollhofen et al. (2014) appears more appropriate.
5.2.2 The source perspective
Focusing on the catchment properties, Melton's Ruggedness Index values range far below those found elsewhere, i.e., approximately in the order of a magnitude as compared to other dryland fans (e.g. Karymbalis et al., 2016; Woor et al., 2023a; Church and Mark, 1980; Valkanou et al., 2013). Together with low fan gradients, Melton's number indicates that alluvial landform formation along the Skeleton Coast is generally governed by fluvial activity rather than debris flows (cf. Karymbalis et al., 2016; Valkanou et al., 2013; Woor et al., 2023a). This finding aligns with what has been previously reported for individual fans (Krapf et al., 2003, 2005; Miller et al., 2021; Stollhofen et al., 2014; Svendsen et al., 2003; Stanistreet and Stollhofen, 2002). The gf(Mc) exponents y1 of 0.66–0.70 imply that fan gradient increases less rapidly than catchment ruggedness, which contradicts the general assumption that both variables should correlate linearly (i.e. y1 = 1.00; Church and Mark, 1980). However, different factors have been proposed to cause a deviation from a linear relationship, including strong differences in age, lithology, and sediment connectivity (Church and Mark, 1980).
In this regard, the large number of strong correlations between catchment metrics in cluster Cf2 are indicative for the importance of relief in the source areas, implying that the amount of potential energy for runoff is a function of relief (e.g. Strahler, 1952b). This relationship is not directly reflected by the inverse relationship between sediment connectivity and catchment relief. Instead, catchment area appears to be a more indicative parameter for the abovementioned causality, as reflected by the inverse relationship between catchment area and sediment connectivity. Likewise, a positive relationship between relief per catchment length (rrc) and sediment connectivity can be identified. This relationship may be considered as outlier-driven (Table B13) but it retains its positive trend when the outlier case (#57, Ugab) is removed. This finding may further points to similar sediment routing environments in the Cf2 catchments, which may cause the strong power-law correlation between gf and ac, in addition to the more obvious gf(Mc) and gf(rrc) relationships (Tables 6, 7, and B13).
Also related to catchment energetics, the catchments of cluster Cf1 and Cc1 (fan dataset) show a strong inverse association of relief indices with catchment maturity (HIc; Table 5) but not with sediment connectivity. Here, positive linear relationships between mean catchment elevation and relief are achieved by the fact that pour points are all within 85 m above sea level, implying that the relief roughly mimics the maximum (90th percentile as used in this study) catchment elevation. The high negative exponents (y1 ≈ −1.5), and the moderate to high correlation coefficients of the relationship between catchment relief and hypsometric index (Table 5), are very similar to what has been constrained for very mature and monadnock basins in Southeastern India (e.g. Yammani and Nagabathula, 2024; recalculated from their Fig. 8f). The missing link to sediment connectivity in these cases could be explained by non-morphometrical factors, as discussed in Sect. 5.3. However, both abovementioned clusters – Cf1 and Cc1 – have their spatial focus on the southern part of the Skeleton Coast, with Cf1 catchments often draining the low-relief and denuded coastal plains located within the Great Escarpment gap (Fig. 2). Hence, low-relief topography, rather than local high-relief features (e.g. Messum crater, Brandberg; other inselbergs), dominates fan formation in the cluster, although the significance of high-relief landforms such as the Brandberg massif might not be not captured in our data due to swath profile averaging (Sect. 4.1).
As a whole, the generally mature and elongated (low and uniform circularity) but otherwise heterogenous drainage systems along the Skeleton Coast of Namibia can be divided into distinct groups: igneous rocks-dominated, highly connected and densely drained low-elevated catchments (Cc1) contrast a cluster of low-relief and low drainage density, less mature and non-igneous rock type dominated catchments (Cc3). More than 75 % of the catchments belonging to the latter group drain the hinterland of the Skeleton Coast Erg and match the fans in cluster Cf3. Very limited correlation patterns for the combined cases of Cf3 and Cc3, however, indicate that although both fan and catchments reflect considerable spatial coincidences, spatial confinement of the fans and a low relief of the catchments is mostly responsible for the cluster overlap. The finding that only the fans associated with Cc1 are somewhat sharply defined (Fig. 7b), but no notable correlations are obtained for catchment clusters in general, points to the hypothesis that geomorphic source-sink coupling identification is more successful when focusing on fan and not catchment properties. In other words, the form and morphometric properties of alluvial fans depend (partly) on the configuration of the present landforms in the sink area (e.g., pediments, abrasion surfaces, elevated dykes, and inherited landforms emerging from the pediments). As this landform configuration is independent of the characteristics of the catchments, the confinement imparted by these elements in the depositional sites tends to modify the association between the characteristics of catchments and alluvial fans and the source-sink relationships. While this finding highlights the considerable potential of accurately estimating fan thickness and/or volume to further refine source-to-sink coupling analyses in our study area, it may nevertheless appear counterintuitive, given that strong source-sink relationships using catchment metrics as predictor variables do exist at the Skeleton Coast. However, it again can be best explained by fan confinement, in combination with spatial foci of such confinement: while the northern alluvial fans do not debouch into the Atlantic Ocean, the southern fans have a tendency to do so. The central fan systems are similarly confined by the Skeleton Coast Erg. Especially for small-scaled catchments, this spatial clustering achieves a certain homogenisation in terms of catchment lithology and morphometric gradients, hence the stricter spatial separation of alluvial fan clusters (Cf1 – south, Cf3 – central) might be more effective when being related to their catchments.
In this regard, the gf(ac) power-law relationship in the transitional Cc2 cluster is likely to be controlled by the northernmost coastal fan systems. The catchments in Cc2 may be characterised as (comparably) high elevation and relief landforms which are least mature. As the gf(ac) relationship is most effectively influenced by elevation (hf,min and hc,mean; Table 7) and the regression coefficient x1 and exponent y1 are similar to those for the fan dataset and fan cluster Cf2, the relationship in Cc2 may be regarded as plausible despite low correlation coefficients.
5.3 The role of climate and surface preservation
5.3.1 Precipitation
In a typical continental setting, the role of tectonics and climate in alluvial fan development may be assessed by considering the timescales these two factors typically act upon. In this regard, the general landscape setup favourable for alluvial fan development can be achieved by tectonics, and different phases of progradation, aggradation and incision can at least to some extent be controlled by (Quaternary) climate cyclicity (e.g. Silva et al., 1992; Whipple and Trayler, 1996; Bahrami, 2013a; Harvey, 2005; Walk et al., 2020; Bowman, 2019c). For example, in the hyperarid coastal environment of the Atacama Desert, Bartz et al. (2020a) and Walk et al. (2023) showed that even in a tectonically active setting such as found in the subduction zone of northern Chile, alluvial fans can be reasonably interpreted as climate archives, if the temporal integration timescales are kept sufficiently short in comparison to topography building by tectonics. For the Skeleton Coast of Namibia, situated at a passive continental margin with limited tectonic activity reported (Goudie and Viles, 2015d), the timescales that allow alluvial deposits to be interpreted as climate archives may extent considerably beyond the Late Pleistocene.
In general, modern climate data (Wf,mean and Ppkc) show strong internal correlations and also align with geological parameters and mean catchment elevation. In particular, precipitation peakedness is positively (and linearly) correlated with catchment elevation in the small Cc1 and Cc3 catchments, increasing by roughly one unit per 500 m gain in elevation. This finding may be driven by the generally E-W elongated shapes of the catchments which implies that more elongated catchments reach higher elevations. Further it implies that the eastern, less arid hinterlands are more likely to be affected by exceptional rainfall events. Such a spatial pattern could potentially shift sediment sourcing relevant for alluvial fan formation towards these areas over the long term, despite the observed downstream decrease in discharge in ephemeral river systems (Jacobsen et al., 1995).
In our dataset, high low-cloud cover frequencies in Cf1 fans did not translate into significant fan clustering variables, suggesting that we are unable to link modern fog precipitation based on the FLCf dataset with alluvial landform morphometrics. Besides the general problem of temporal limitations inherent to the climate data (Sect. 5.1), a possible explanation is that low cloud cover does not necessarily imply that fog approaches coastal surfaces. In fact, inter-annual vertical shifts in low cloud cover elevation is evident (Andersen et al., 2019). Furthermore, precipitation from fog peaks several tens of kilometres behind the coastline (Lancaster, 1984). However, over timescales of topography formation, a spatial proximity of such inland fog precipitation and elevated precipitation peakedness may become relevant in terms of sediment production and transport capabilities. For instance, Walk et al. (2022) highlighted the importance of Quaternary fluctuations of sea surface temperature and sea level on the availability of fog and sea spray driving weathering under coastal hyperaridity.
5.3.2 Wind
Along the Skeleton Coast of Namibia, southwestern wind directions predominate (e.g. Lancaster, 1982). Deflected to alongshore winds, they have been shown to be mainly responsible for northward migration of sand north of the Koigab river, forming and shaping the dunes of the Skeleton Coast Erg (Lancaster, 1982; Krapf et al., 2005; Svendsen et al., 2003). Such sand accumulations are important agents in fluvio-aeolian interactions along the Skeleton Coast, affecting the fluvial conveyance of hinterland sediments towards the coastline by barrier effects (e.g. Krapf et al., 2003, 2005; Miller et al., 2021) and flow strength modulation (Svendsen et al., 2003).
Modern wind data identify Cf2 as the cluster most exposed to strong wind velocities. The Koigab fan, included in this cluster, has been shown to undergo aeolian winnowing under prevailing southwesterly winds (Krapf et al., 2003, 2005). At the fan's location, elevated wind speeds are modelled in the BIOCLIM+ dataset of Brun et al. (2022a). The tight range in elevated Cf2 mean annual wind speeds is, however, governed by the northernmost fan systems, where ≈ 6 m s−1 are reached. Here, the westward protruding landmasses of Cape Fria allow the alongshore winds to affect a vast corridor of the coastal plain, including the hinterland fans of Cf2. Despite this exposure, we are unable to capture alluvial landform modifications related to wind. Cluster Cf2 actually shows the strongest source–sink coupling, and we cannot link the Skeleton Coast Erg wind regime to fan confinement. This finding may be related to the fact that the dunes affect the modelled wind data by their topography (see Karger et al., 2017) and to other factors that have been shown to be responsible for dune formation, such as roughness of the preexisting topography (Miller et al., 2021).
5.3.3 Surface preservation
Surface roughness, measured via Sentinel-1 backscatter, plays only a minor role in our clustering efforts. Nonetheless, spatial trends are apparent: Cf1 and Cc1 exhibit relatively high medians, and the latter a narrow value range (Fig. 7b). If low Sentinel-1 backscatter values are interpreted to indicate the presence of gypsum-encrusted surfaces on alluvial fans along the Skeleton Coast of Namibia, those areas appear to be more frequently found south of the Skeleton Coast Erg. The presence of such encrusted surfaces implies both landform antiquity and preservation (Stollhofen et al., 2014; Mohren et al., 2020). Thus, the southern fans may be regarded as older and/or less prone to local (fluvial/aeolian) surface modification, and/or that incision and fan dissection sourced from the catchment is more important than fan aggradation, leaving behind isolated patches of stable surfaces. These morphometric patterns are indicative for significant environmental changes as captured by both on- (Walsh et al., 2023) and offshore (Stuut et al., 2002) sediment records, causing alluvial landform alterations during the Quaternary despite generally persisting hyperaridity. The Horingbaai fan delta exemplifies this, with dissected but heavily encrusted sediments dated to 2.2–2.7 Ma (Stollhofen et al., 2014). Its placement in cluster Cf1 highlights how low roughness can mark older fan surfaces in our study area.
5.4 The role of catchment lithology and tectonics
5.4.1 Fault density and tectonic activity
Fault densities along the Skeleton Coast are comparably low. Median and mean values are roughly two-thirds and one-half, respectively, of those reported for the coastal Atacama Desert (Walk et al., 2020), and an order of magnitude below values in other tectonically active regions such as southern Egypt (see Theilen-Willige, 2024). Within our dataset, fault density appears meaningful only in cluster Cc2, which contains the largest catchments except for those grouped in Cc4. In cluster Cc2, however, fault density remains underrepresented relative to the Skeleton Coast fault abundances.
Some relationships are evident in the fan dataset (Cc1), where fault density is inversely associated with the relative amount of igneous and metamorphic bedrock and mean catchment elevation. The trend between fault density and catchment mean elevation could indicate a likely concentration of tectonic activity near the coast. Another interpretation may be that fault density reduces mean elevation as rocks along faults are more fractured, thereby enhancing landscape lowering and reducing mean elevation. Given that Earthquakes have been reported in northwestern Namibia in modern times (Goudie and Viles, 2015d), a certain relationship between neotectonics and alluvial fan formation may exist. However, independent evidences pointing on the influence of fault density on drainage and fan development is missing and it is also likely that the correlations are governed by other factors. For example, mapping coverage affected by remoteness issues towards the hinterland likely play a significant role here.
5.4.2 Catchment lithology
Catchment lithology provides somewhat clearer contrasts. Cluster Cc1 is dominated by igneous rocks, whereas Cc3 comprises catchments with mostly Precambrian metasedimentary rocks of the Damara Supergroup reflecting long-term denudation without magmatic rejuvenation. However, the two largest catchments that predominantly drain Etendeka basalts – the Uniab and Koigab catchments (Geological Survey of Namibia (GSN), 1998, 2010a; Miller, 2008) – are not included in the igneous rock cluster Cc1. This cluster assignment suggests that bedrock lithology is secondary to (often correlating) morphometric variables in shaping cluster patterns.
The weak relationship between lithology and fan gradients (only outlier-driven correlations in the Cc1 fan dataset) provides another case point. While Krapf et al. (2003) proposed that higher fan gradients are linked to smectite-rich sediment loads derived from basaltic bedrock increasing flow strengths, our analysis does not confirm such dependency on the regional scale. Instead, the relationships between fan gradient and Melton's number in clusters Cf1 and Cf2 are strong and very similar. This similarity holds despite the fact that both clusters are being differently characterised in terms of fan gradient and other parametric statistics such as catchment lithology.
Despite long-term hyperaridity and presumably persistent coastline-perpendicular climatic gradients, fluvio-alluvial source-sink systems along the Skeleton Coast of Namibia present a strong (hydro-)morphometrical heterogeneity. By combining cluster and partial correlation analysis on a parametrical dataset, we reduced this heterogeneity and identified robust source-sink relationships. As a key result, both alluvial landforms and catchments can be grouped into three distinct clusters.
Regarding the sinks, the southern portion of the Skeleton Coast is dominated by coastal fans with comparably low fan gradients, which are closely associated with catchment ruggedness. Alluvial deposition in the central portion of the Skeleton Coast is strongly affected by the Skeleton Coast Erg, distally confining high-gradient – although still low on the global perspective – bajadas. A third cluster is more dispersed across the Skeleton Coast with a spatial concentration in the north. Under present-day climatic conditions, the fans in this cluster face greater wind velocities but reflect the strongest source-sink coupling. Here, the sourcing catchments reflect robust linkages between sediment connectivity and relief.
The, in general, geomorphologically mature catchments along the Skeleton Coast group strongly by area, relief, and lithology. The latter, however, is a weaker discrimination variable than the group of – often correlating – morphometrical variables in our methodological approach. A correspondence between low-relief, low-drainage-density metamorphic catchments and central bajadas east of the Skeleton Coast Erg appears geographically controlled rather than parametrically defined. Excluding outliers, the largest and least mature catchments form the only drainage cluster with a robust, though weak, morphometric coupling between alluvial fans and catchments.
The clustering results highlight the impact of spatial confinement on parametric source-sink coupling along the Skeleton Coast of Namibia. Among the morphometric variables we applied, fan gradient emerges as the most reliable indicator of coupling. On a global scale, the Skeleton Coast stands out for unusually weak responses of fan gradient to catchment morphometry, the latter which reflects a low-dynamics environment.
Altogether, our approach provides fundamental knowledge on the characteristics of fluvio-alluvial source sink-relationships, which should be considered when alluvial deposits are investigated as (paleo-)environmental archives along the Skeleton Coast. The least-confined fans (cluster Cf2) offer the clearest source-sink signal and may be prioritised for such work, with fans located south of the Skeleton Coast Erg generally providing the most favourable conditions for related analyses, given their antiquity and stability.
A quality assessment of the most common digital elevation models (DEMs) – ASTER, SRTM, ALOS, and GLO-30, was conducted in northwestern Namibia to identify the DEM with the lowest vertical error for morphometric analyses. Following the approach of Kramm and Hoffmeister (2019), ICESat-2 data were used as ground control points (GCPs). To quantify the vertical error, both the Root Mean Square Error (RMSE) and the Normalized Median Absolute Deviation (NMAD) were calculated.
The RMSE is widely used to quantify the average deviation of predicted elevations of sample points within a given DEM (hDEM,i) from the elevations of the ICESat-2 data (hICESat,i) for a total of n = 35 000 ICESat points:
Squaring the differences prevents the cancellation of positive and negative errors. Due to the squaring of errors the RMSE is sensitive to outliers. The NMAD is a robust estimator based on the median of absolute height differences at sample points from the whole-product (hDEM, hICESat) median error:
Multiplication by a constant of 1.4826 makes the calculation consistent with the standard deviation for normally distributed errors, making it less sensitive to outliers (Höhle and Höhle, 2009). Overall, the GLO-30 data achieved the highest accuracy (RMSE: 1.10 m, NMAD: 0.56 m). The next best results were obtained for ALOS (RMSE: 3.50 m, NMAD: 1.66 m). SRTM showed slightly higher errors (RMSE: 4.65 m, NMAD: 2.47 m), while ASTER generally produced the largest errors (RMSE: 11.26 m, NMAD: 8.40 m). The relationship of the errors with the underlying geology and landforms was tested, but no clear correlation could be observed across all datasets.
While the GLO-30 DEM is a downsampled product primarily derived from TanDEM-X data, it was calibrated using only a small subset of ICESat-2 points, with 10 points per 50 km segment. The majority of ICESat-2 points were used as validation ground control points to assess the accuracy of the final DEM heights (Rizzoli et al., 2017).
Table B1Quality assignment levels for mapped alluvial landforms.
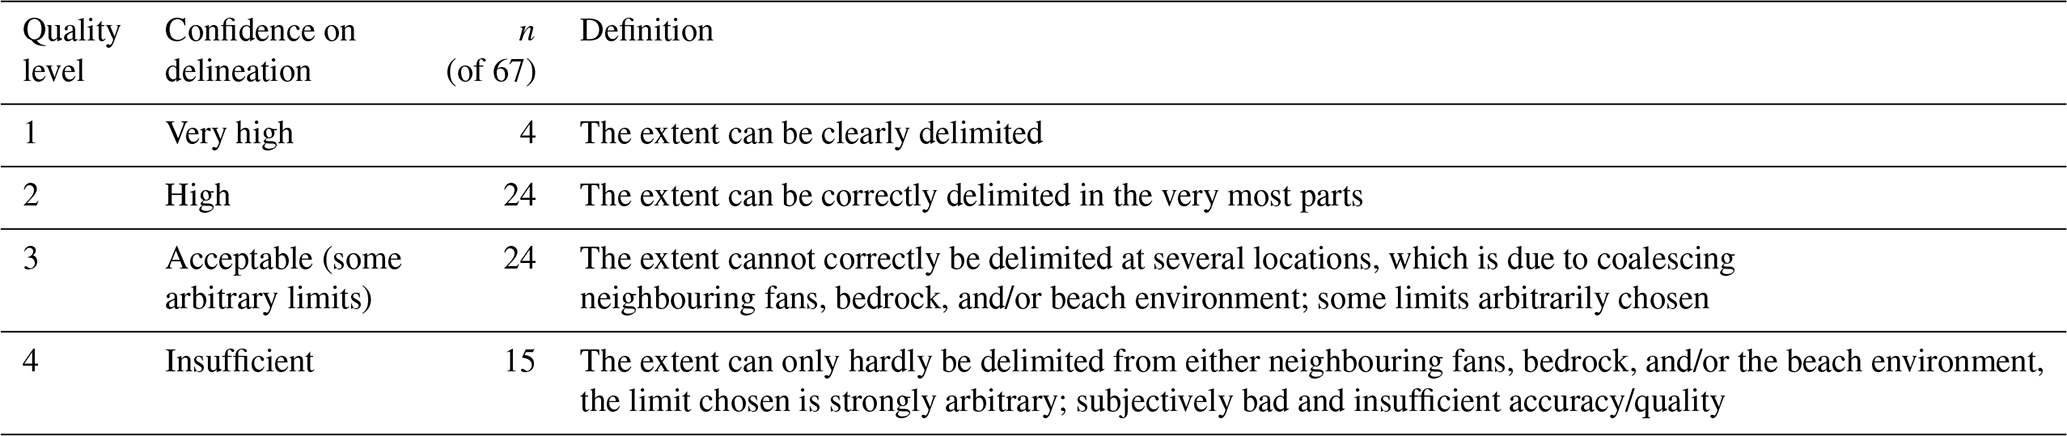
Table B2Overview of the number of landforms retained after the different workflow steps we applied, and the counts used for display in the figures throughout the main text.
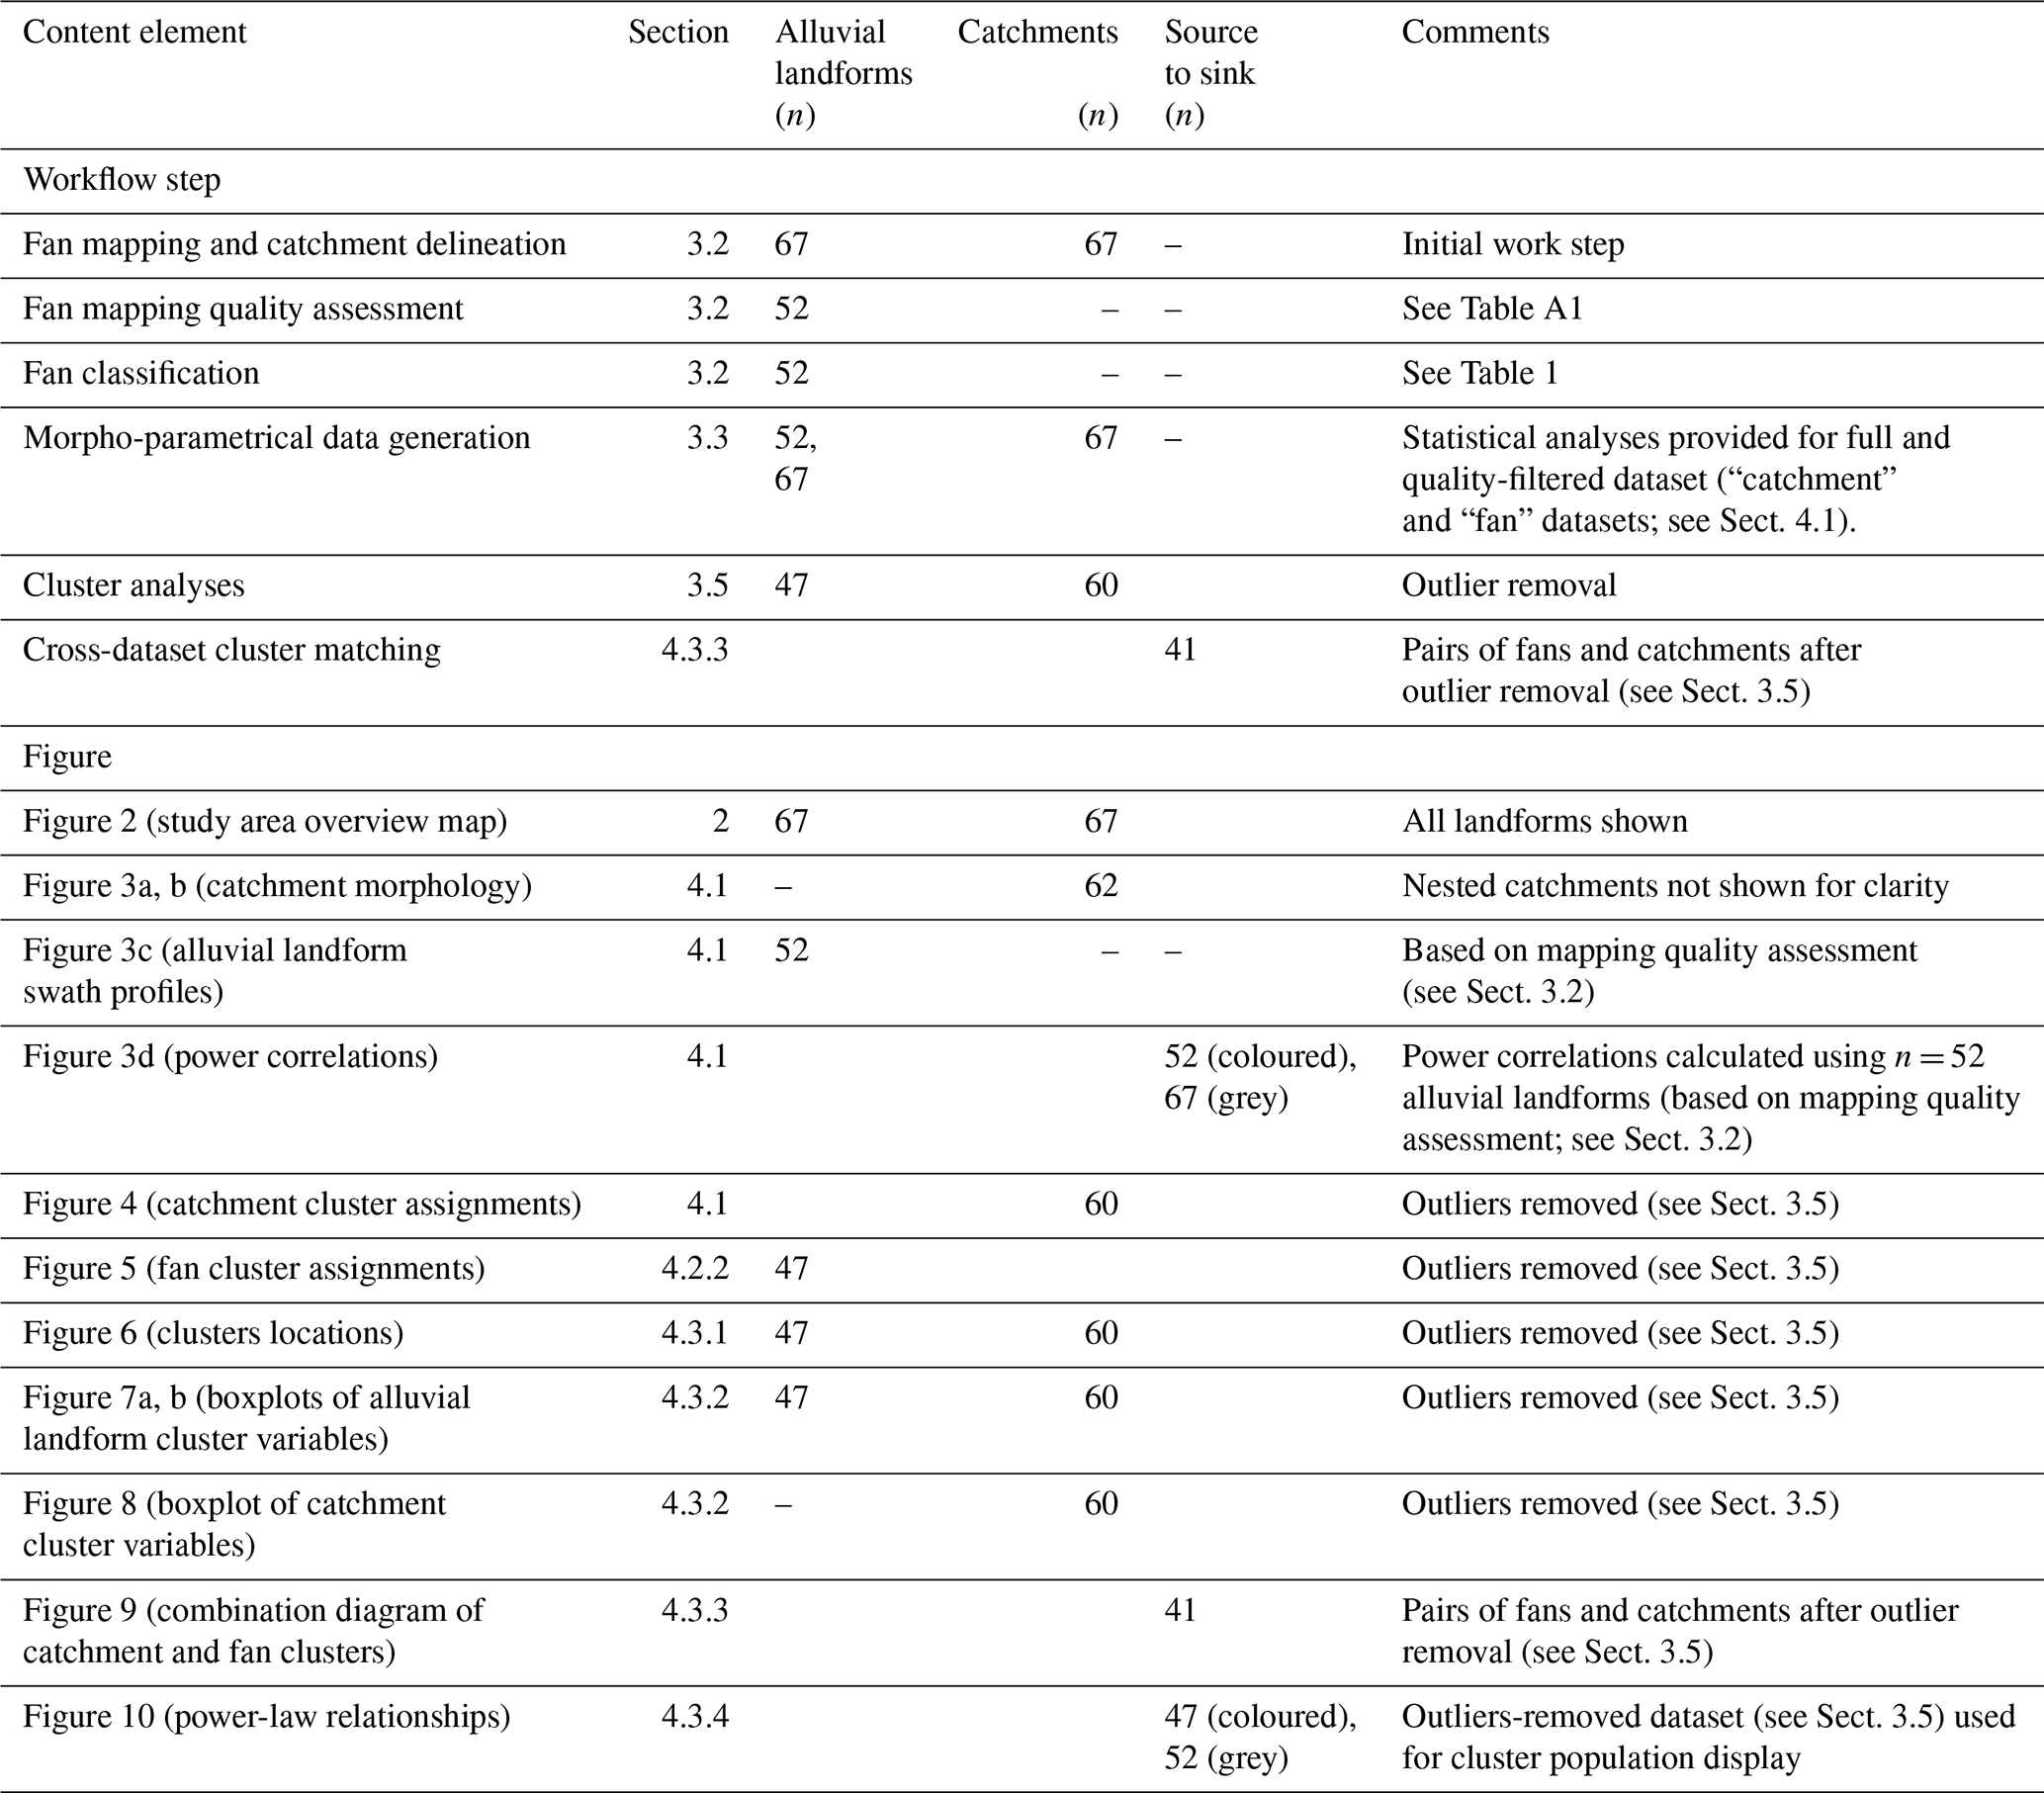
Table B3Variable statistics.
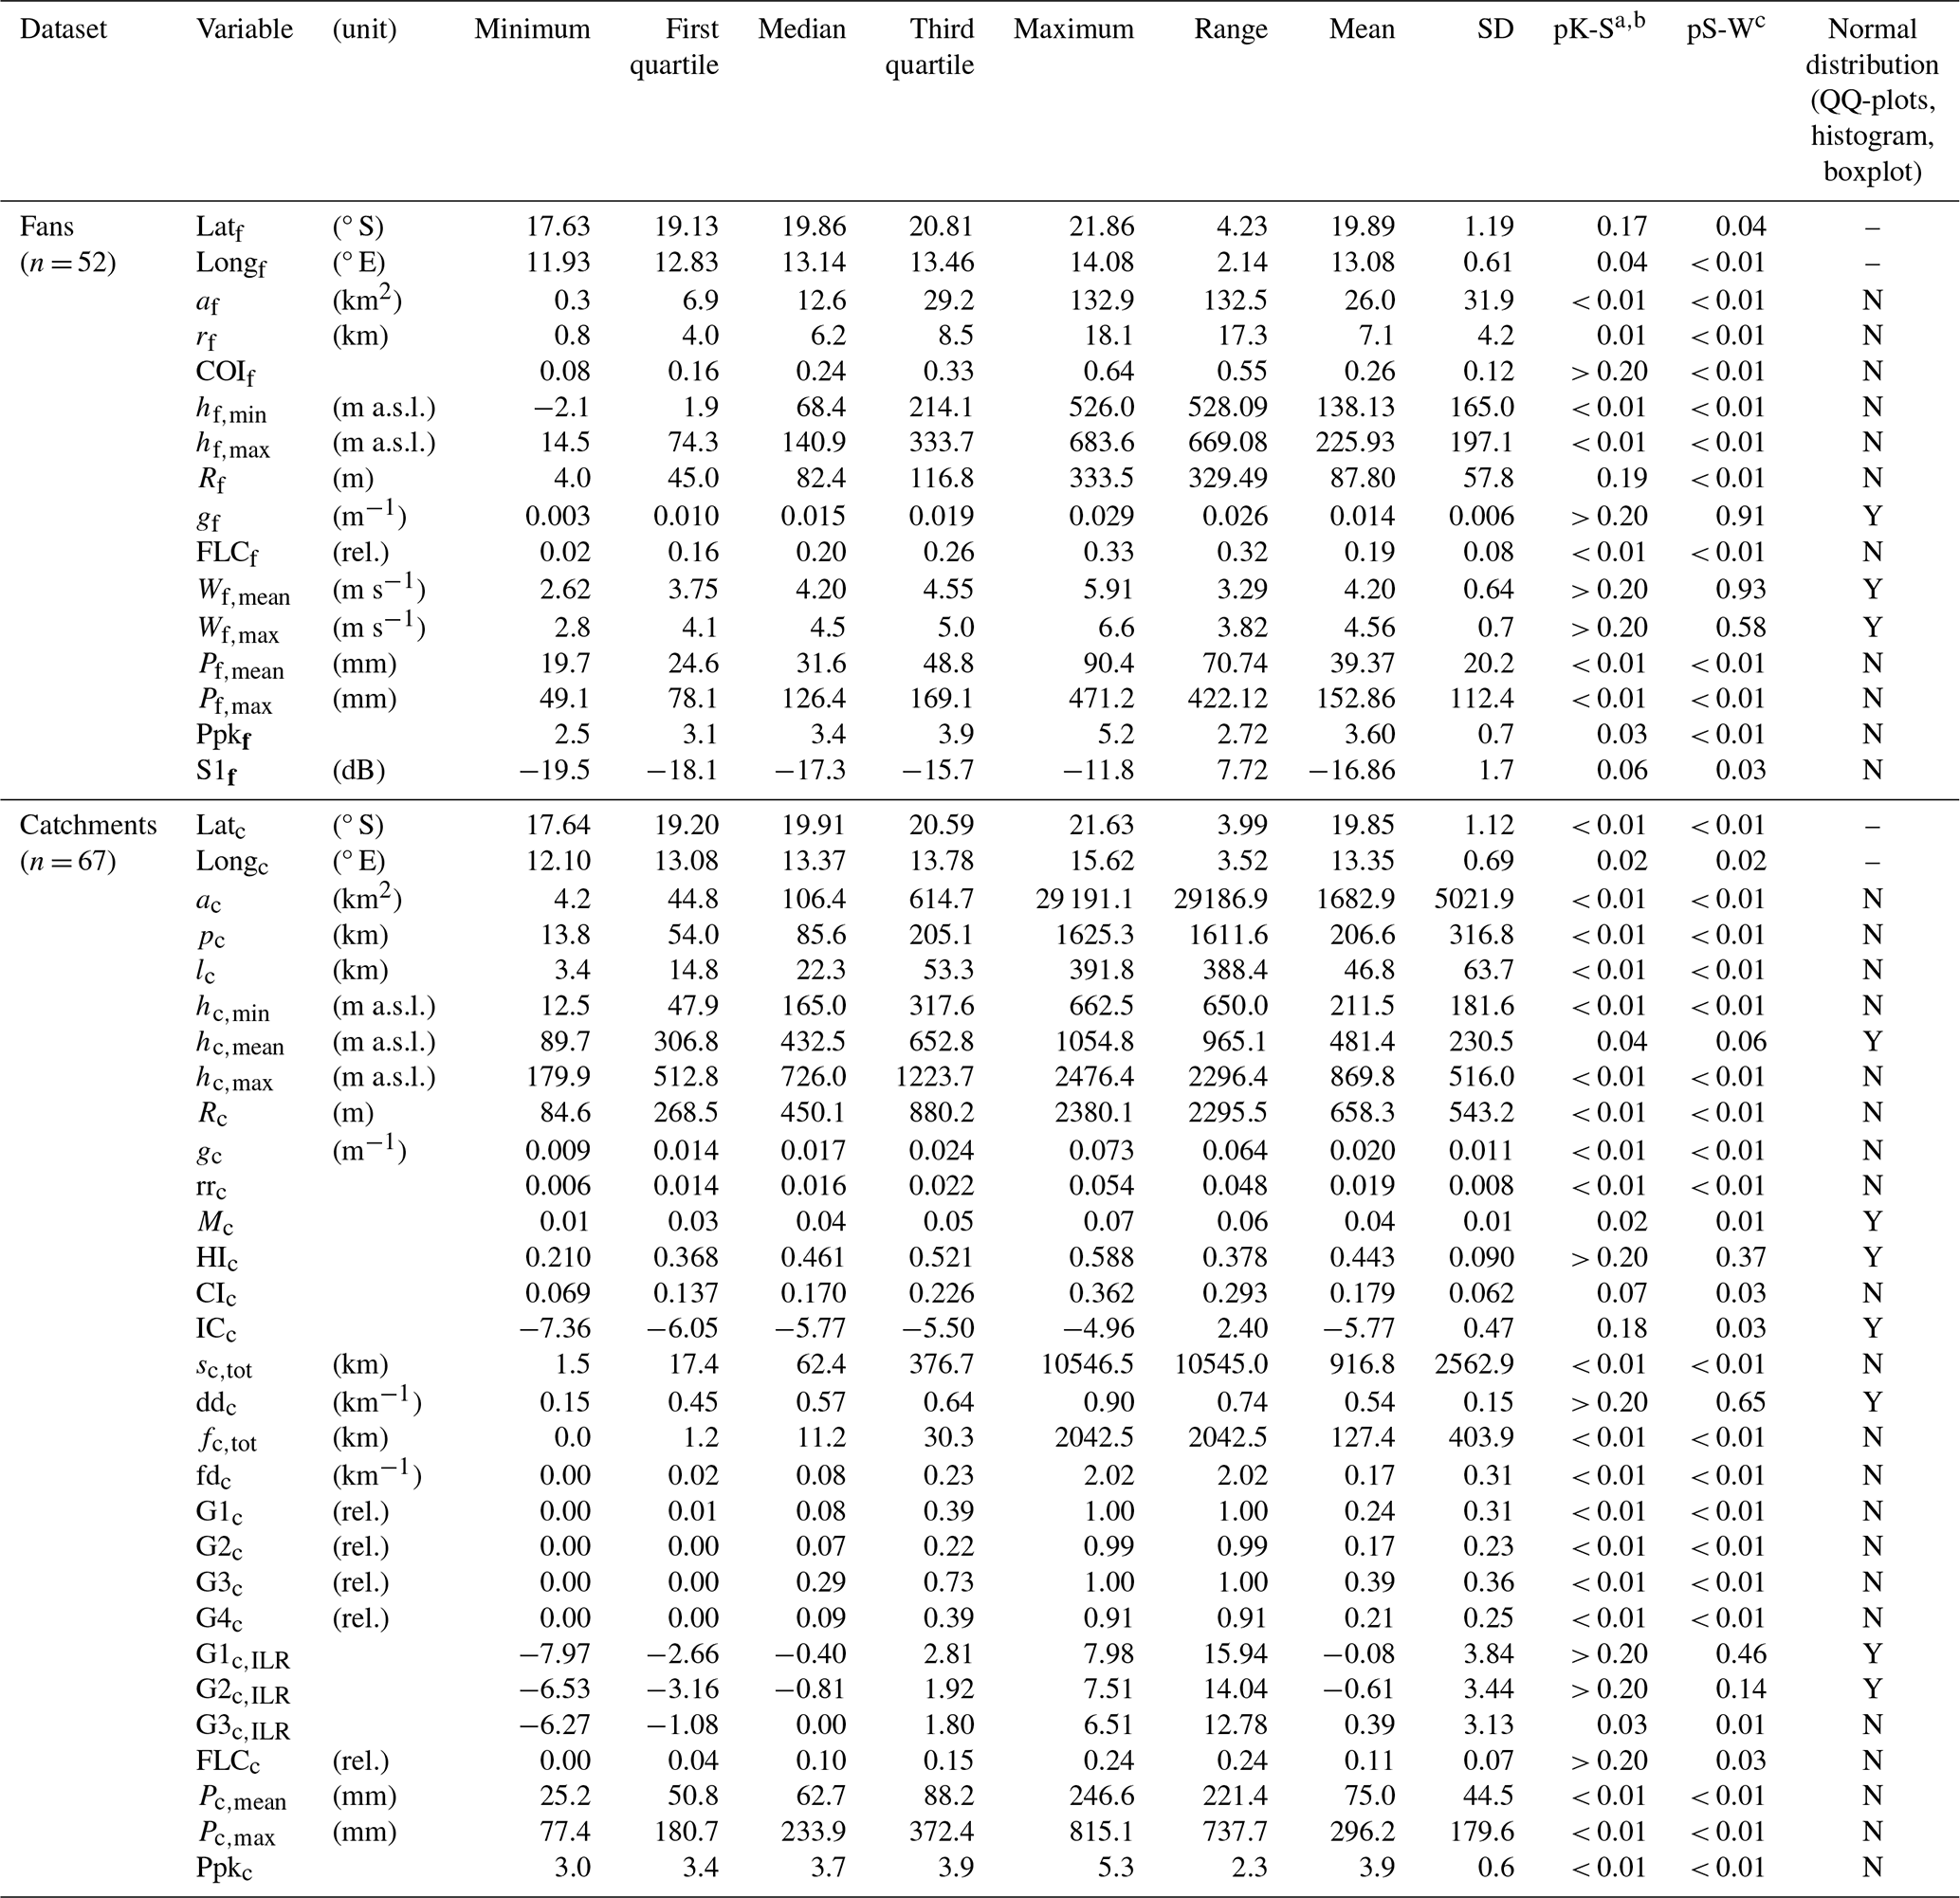
a Kolmogorov–Smirnov test p value. b Lilliefors significance correction. c Shapiro–Wilk test p value.
Table B4All catchment parametric data generated in this study.
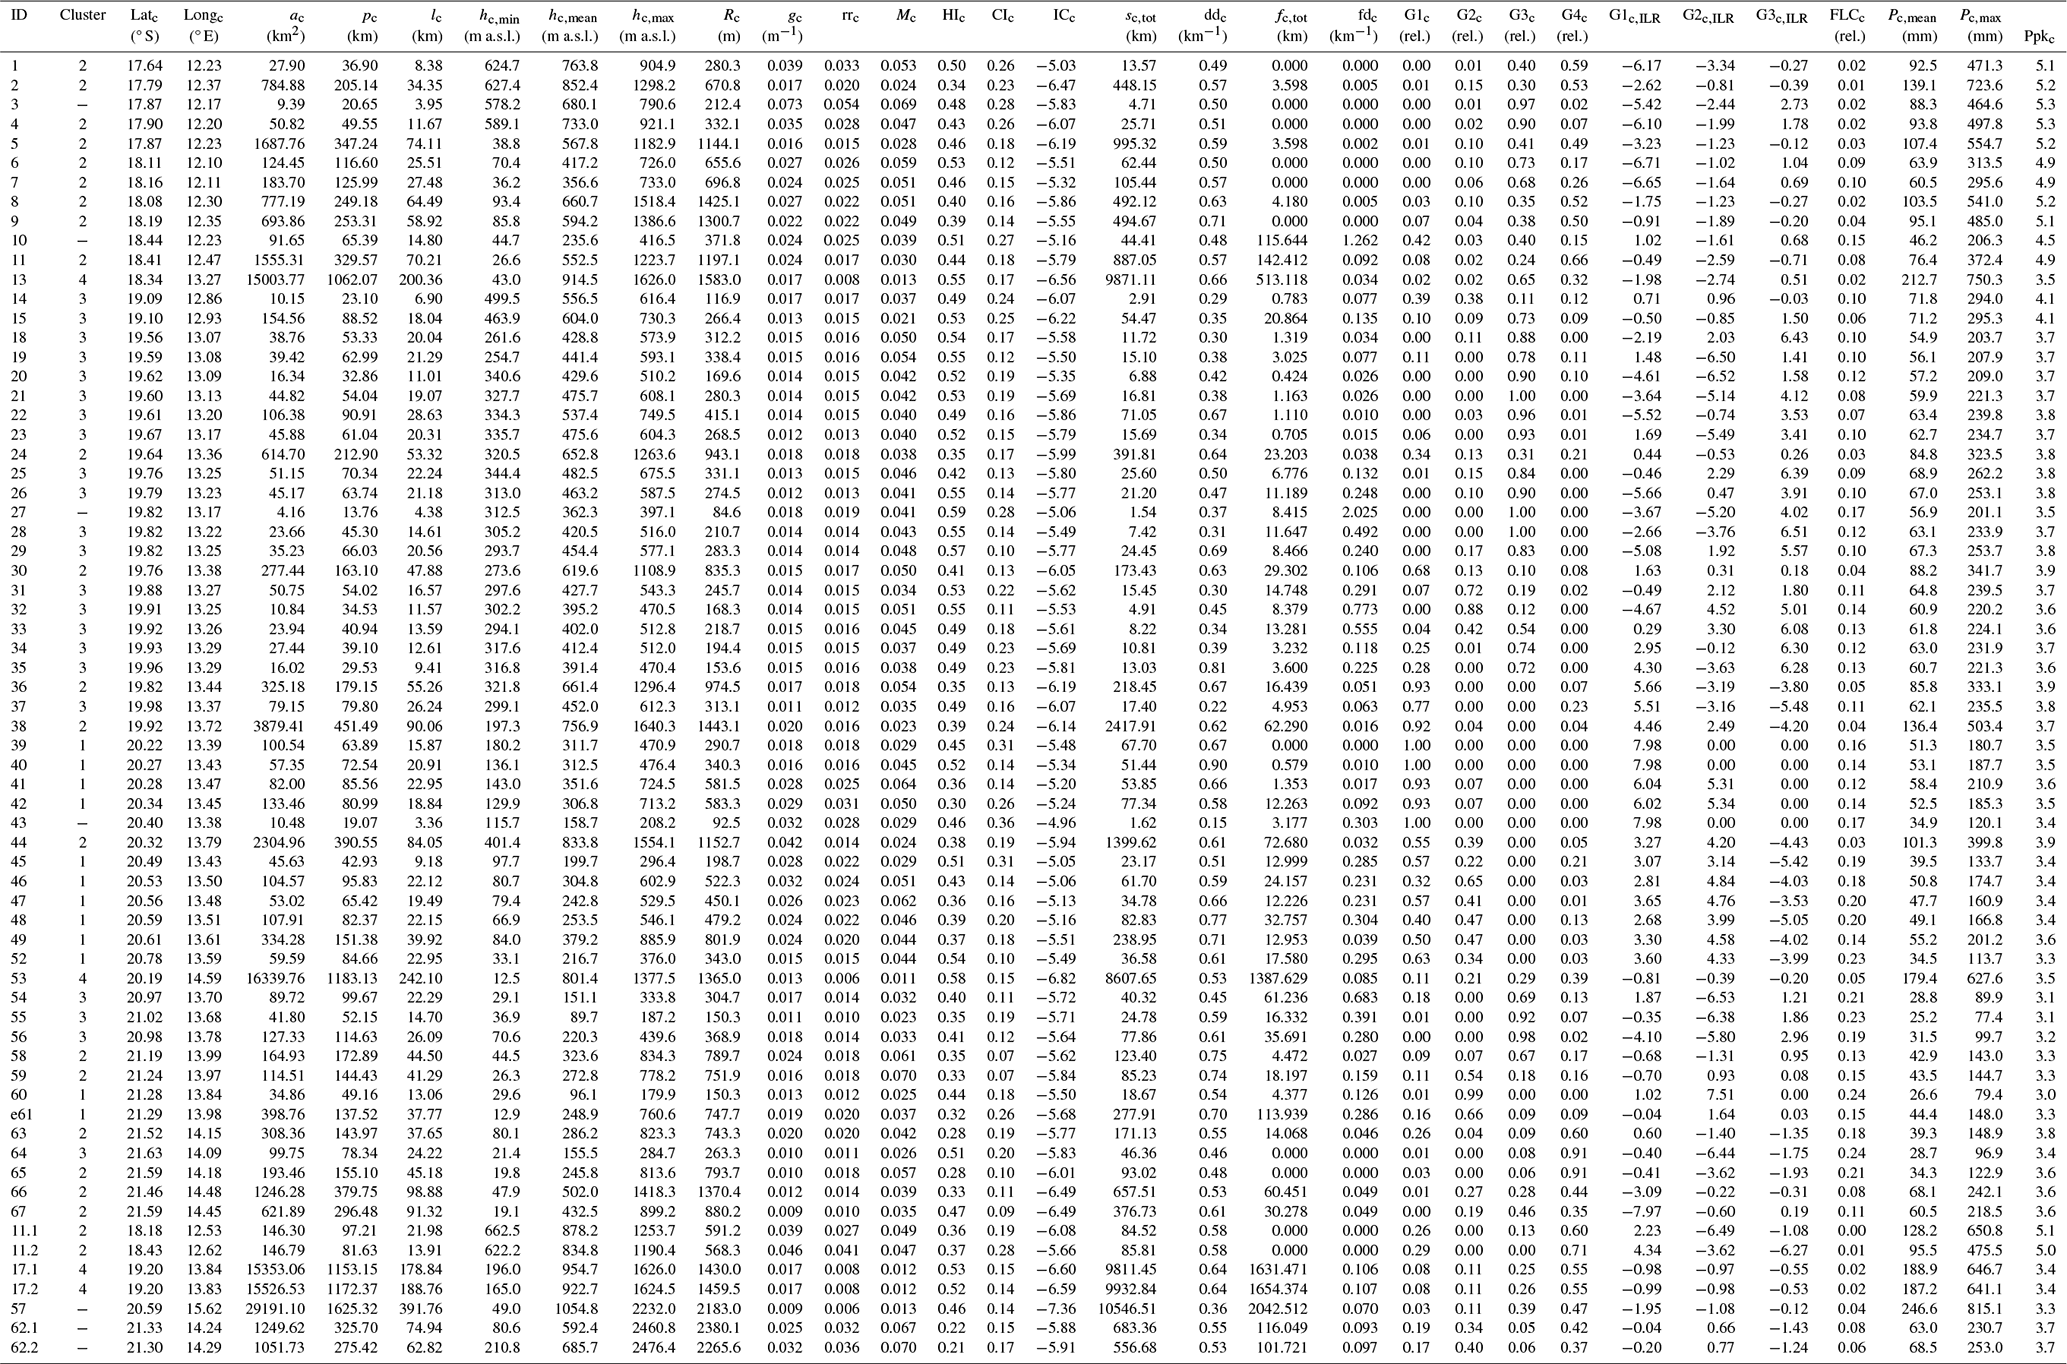
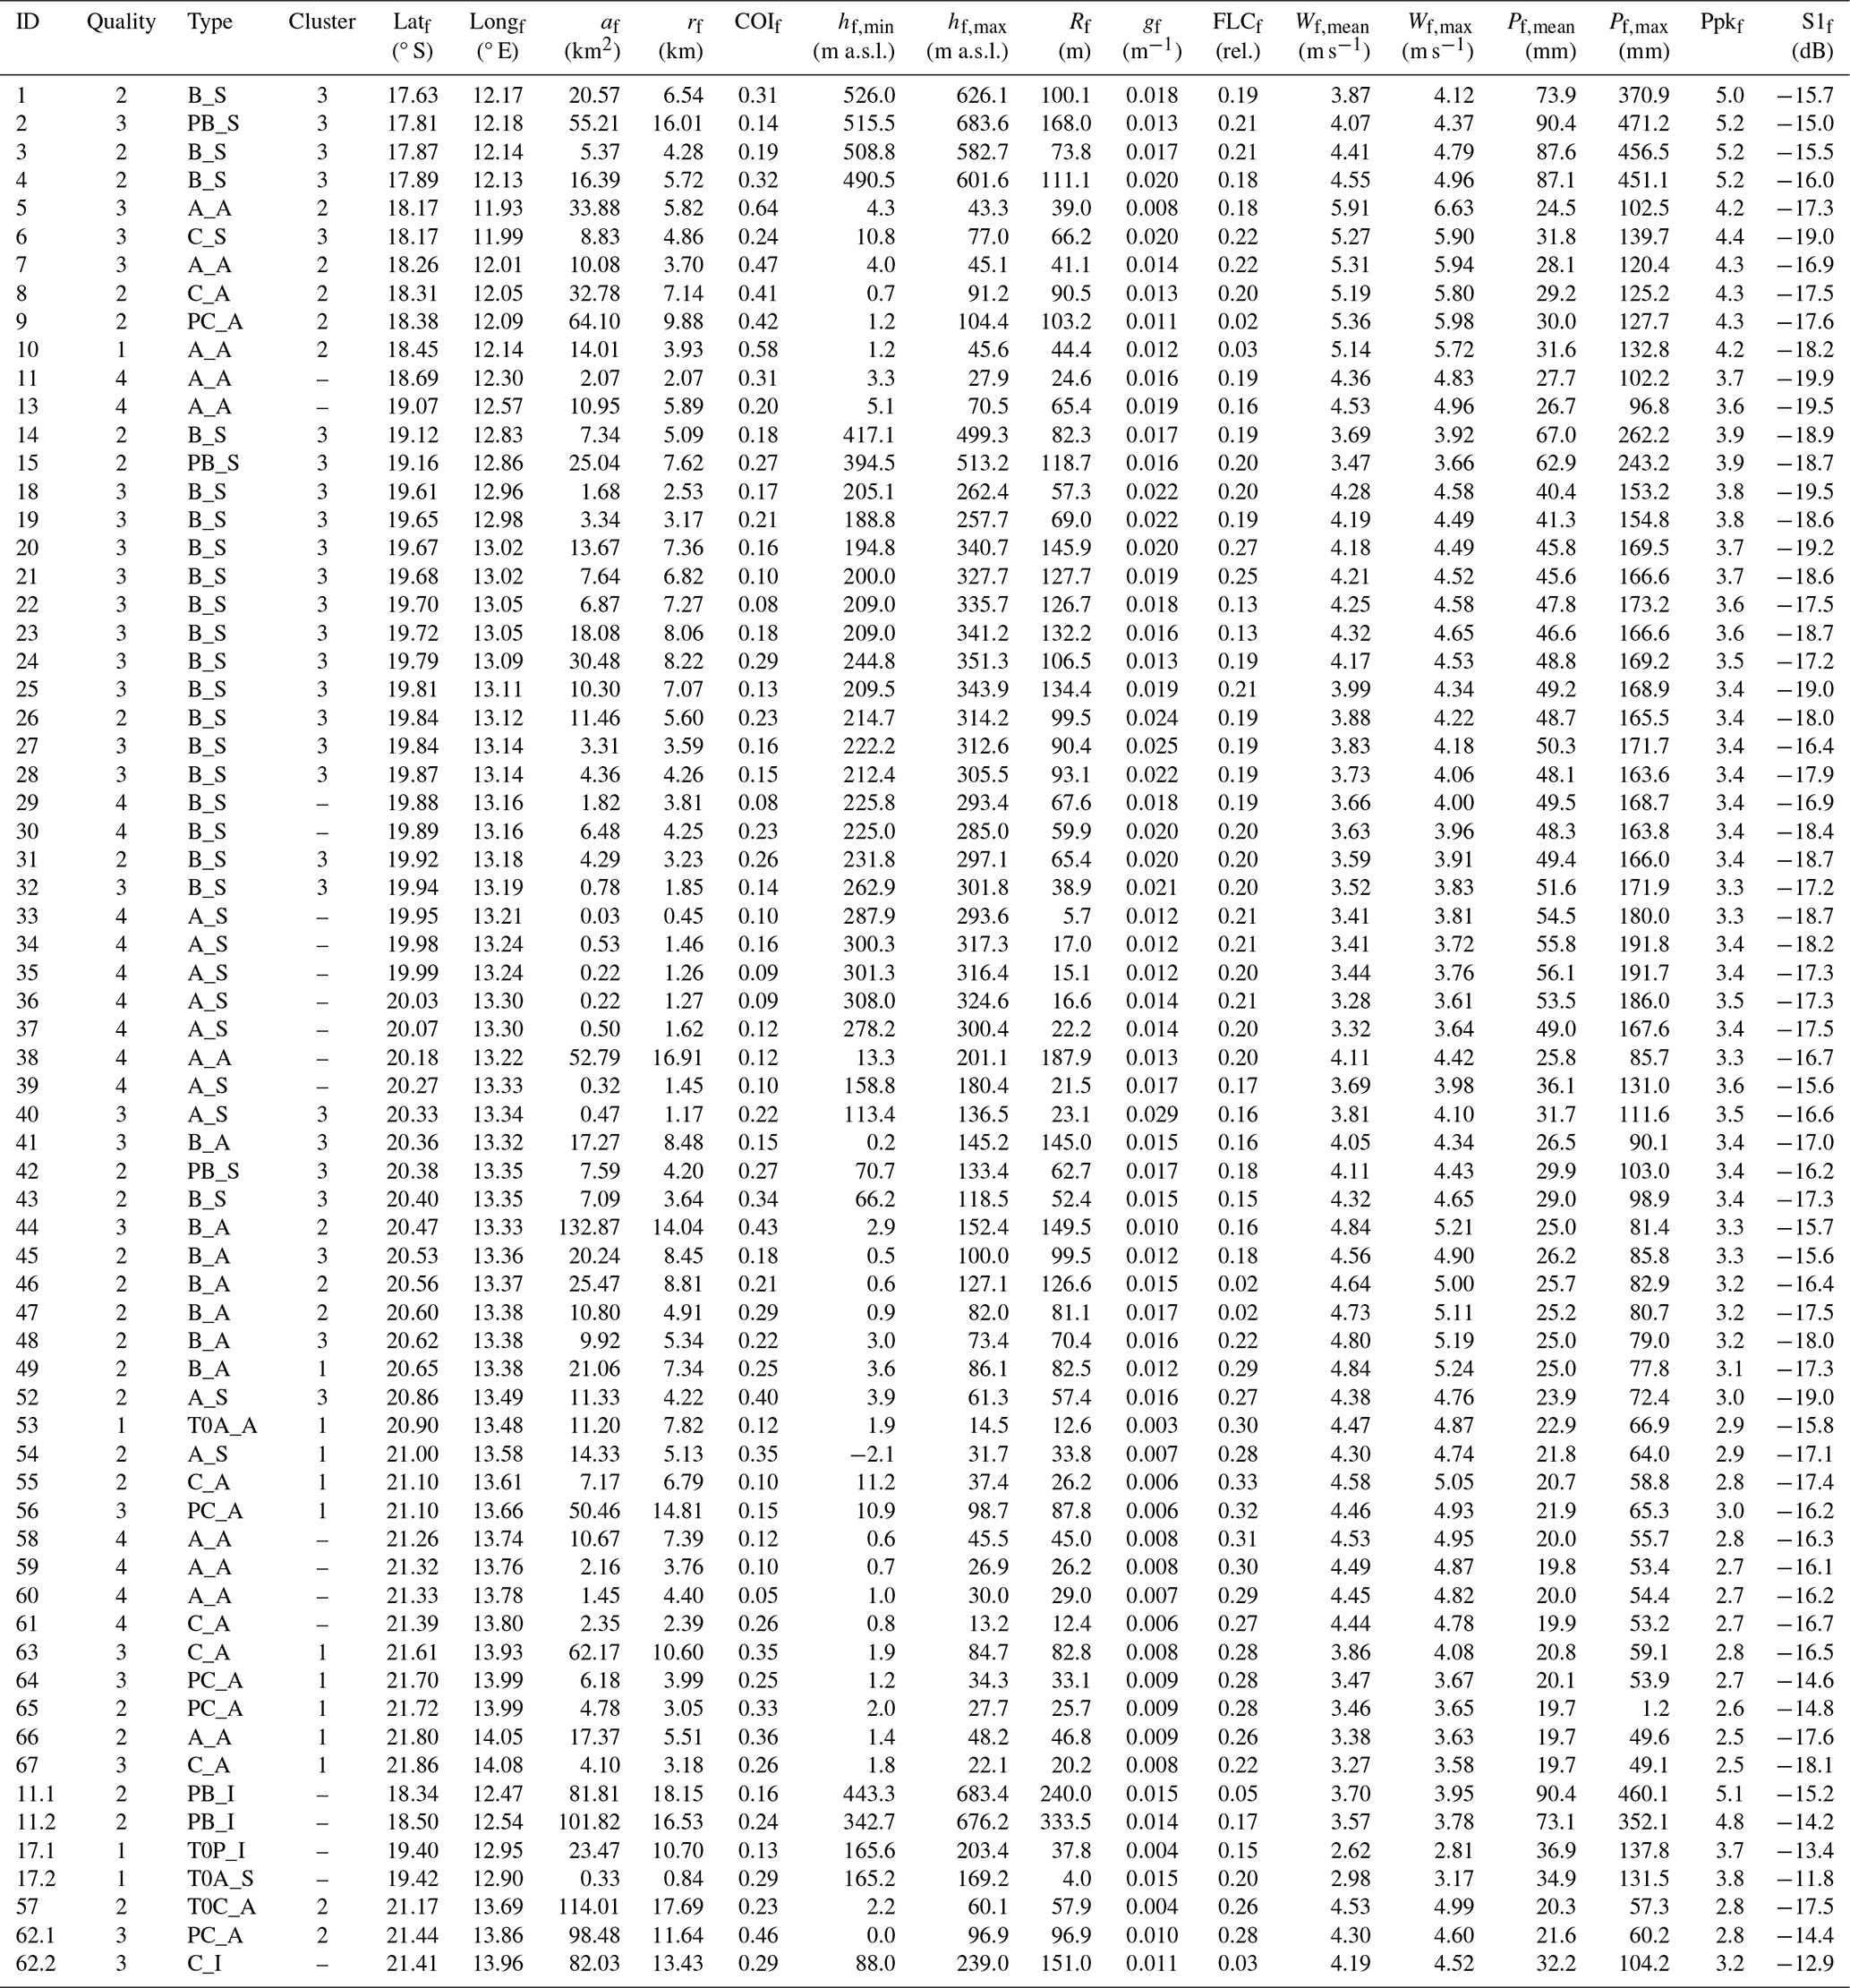
Table B6Bivariate strong linear correlations among the variables (bold variables retained for cluster analysis).
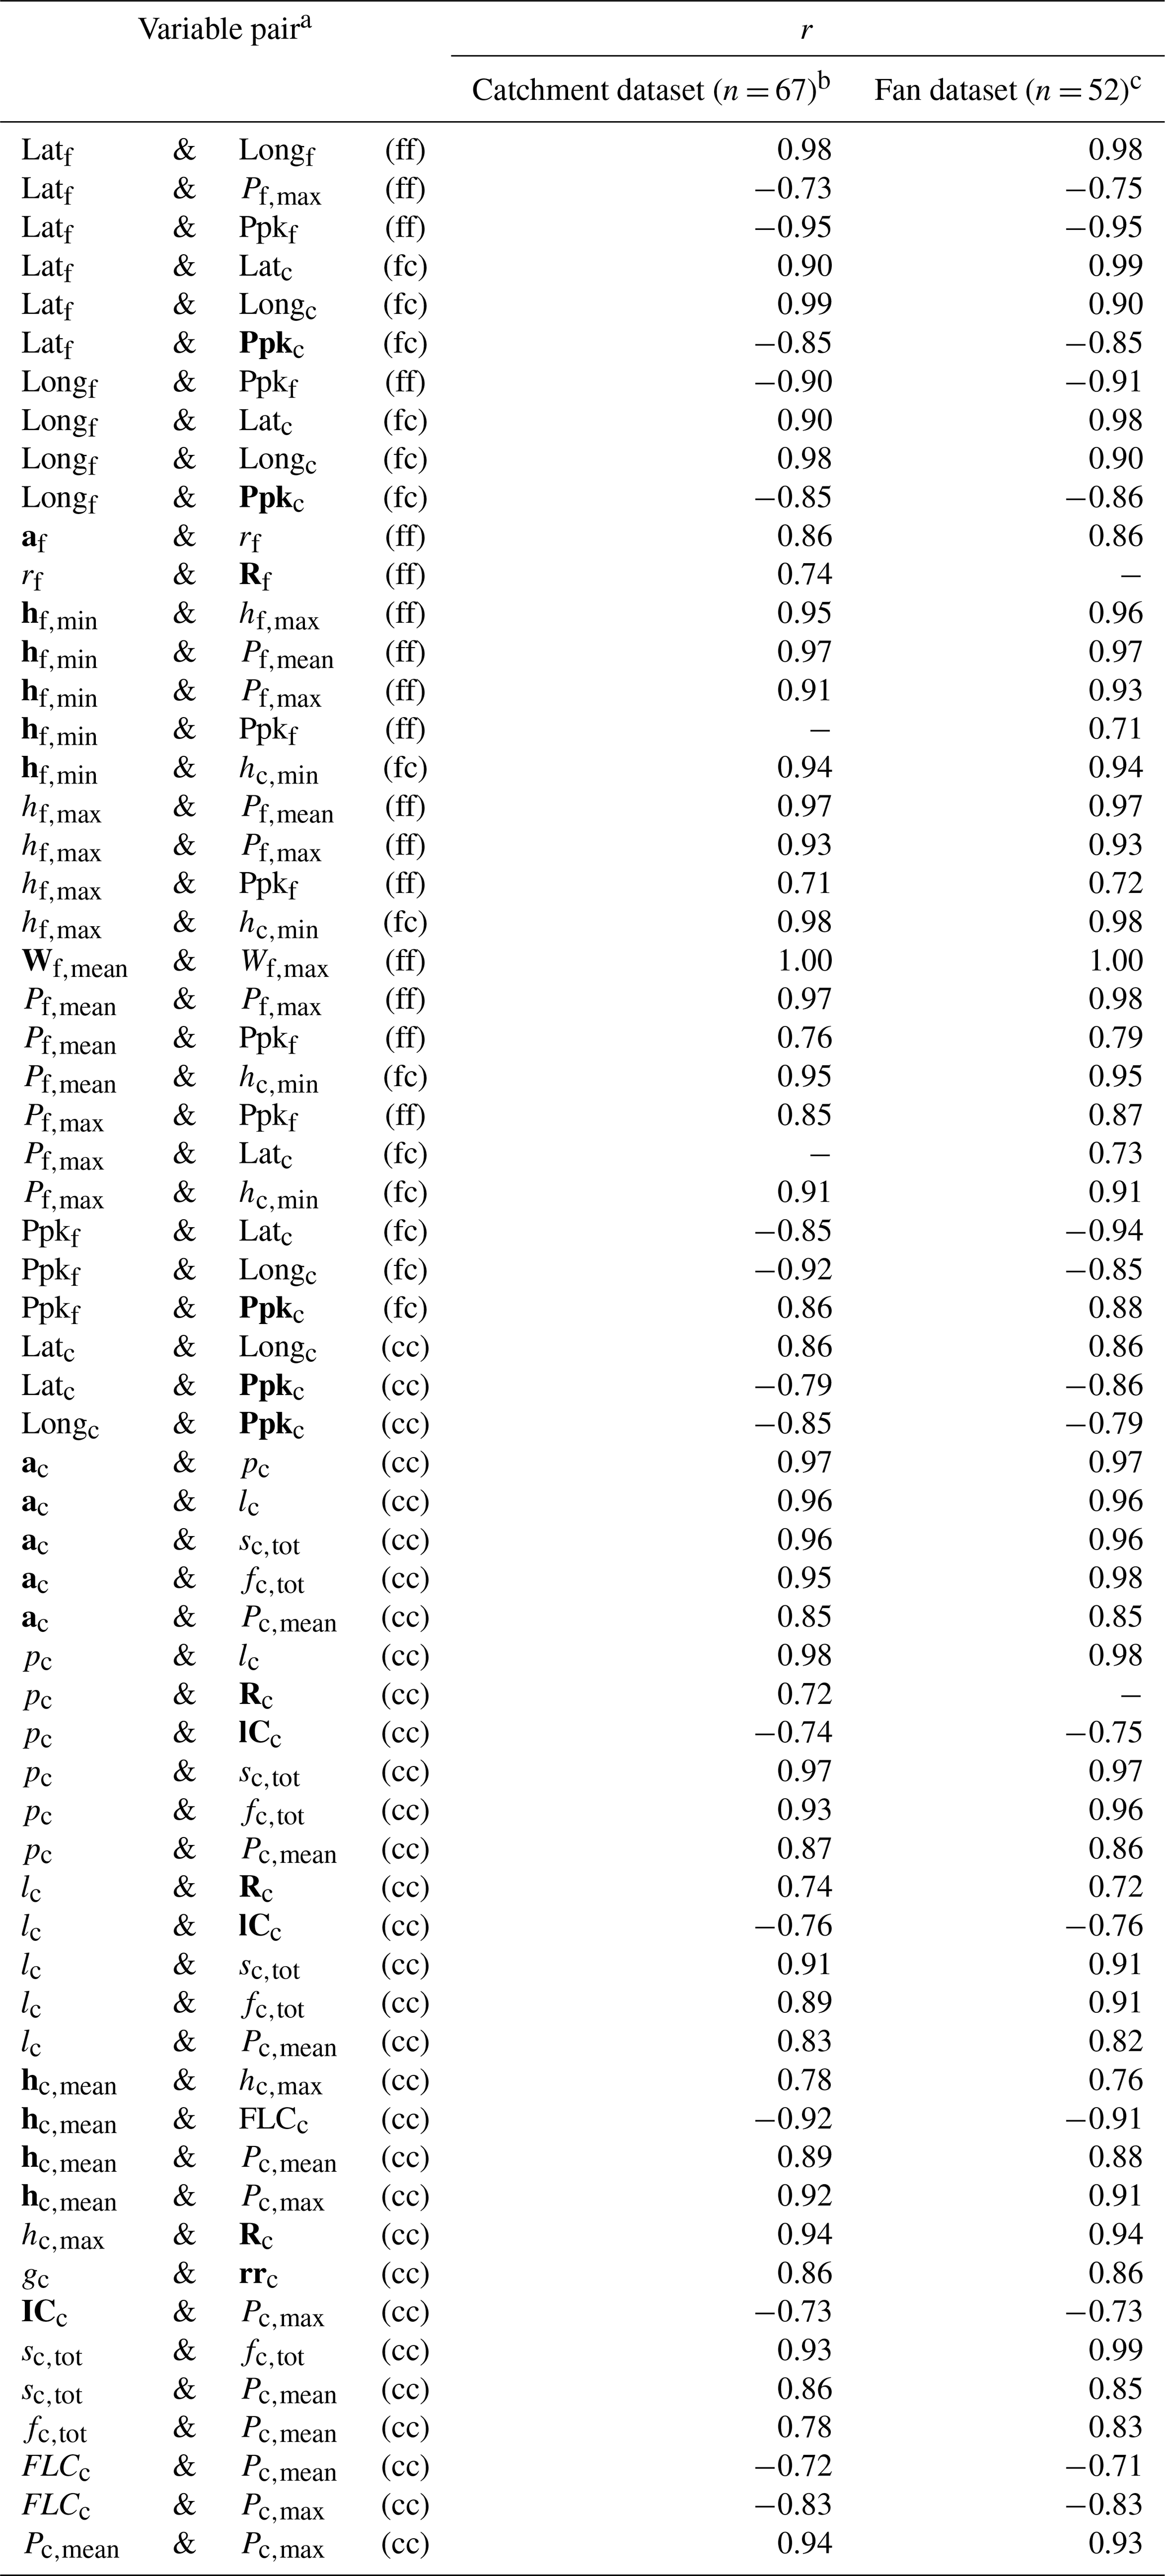
a Letters in brackets indicate variable belonging: c – catchment, f – fan.
b Including insufficiently mapped alluvial landforms.
c Sufficiently mapped alluvial landforms only.
Table B7Multivariate normality test results for the catchment dataset (n = 67 cases). Cases representing possible outliers are highlighted in bold (p < 0.001).
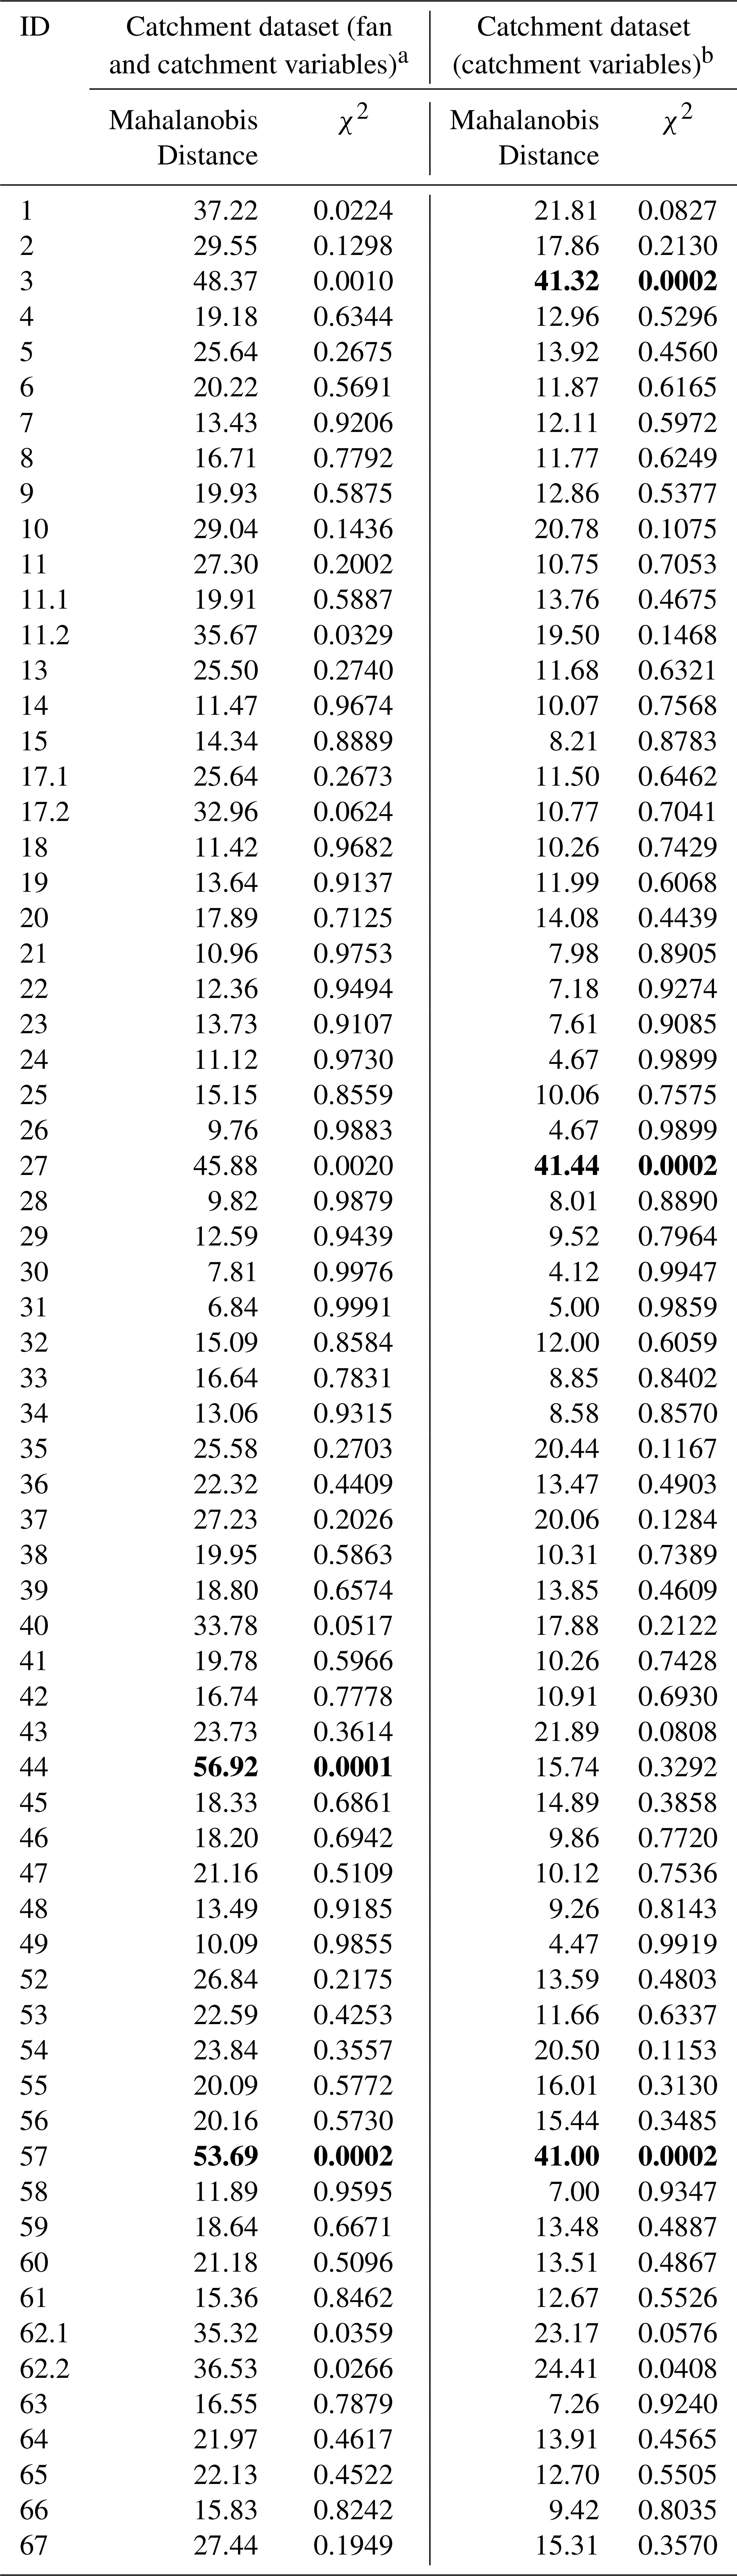
a n = 22 variables. b n = 14 variables.
Table B8Multivariate normality test results for the fan dataset (n = 52 cases).
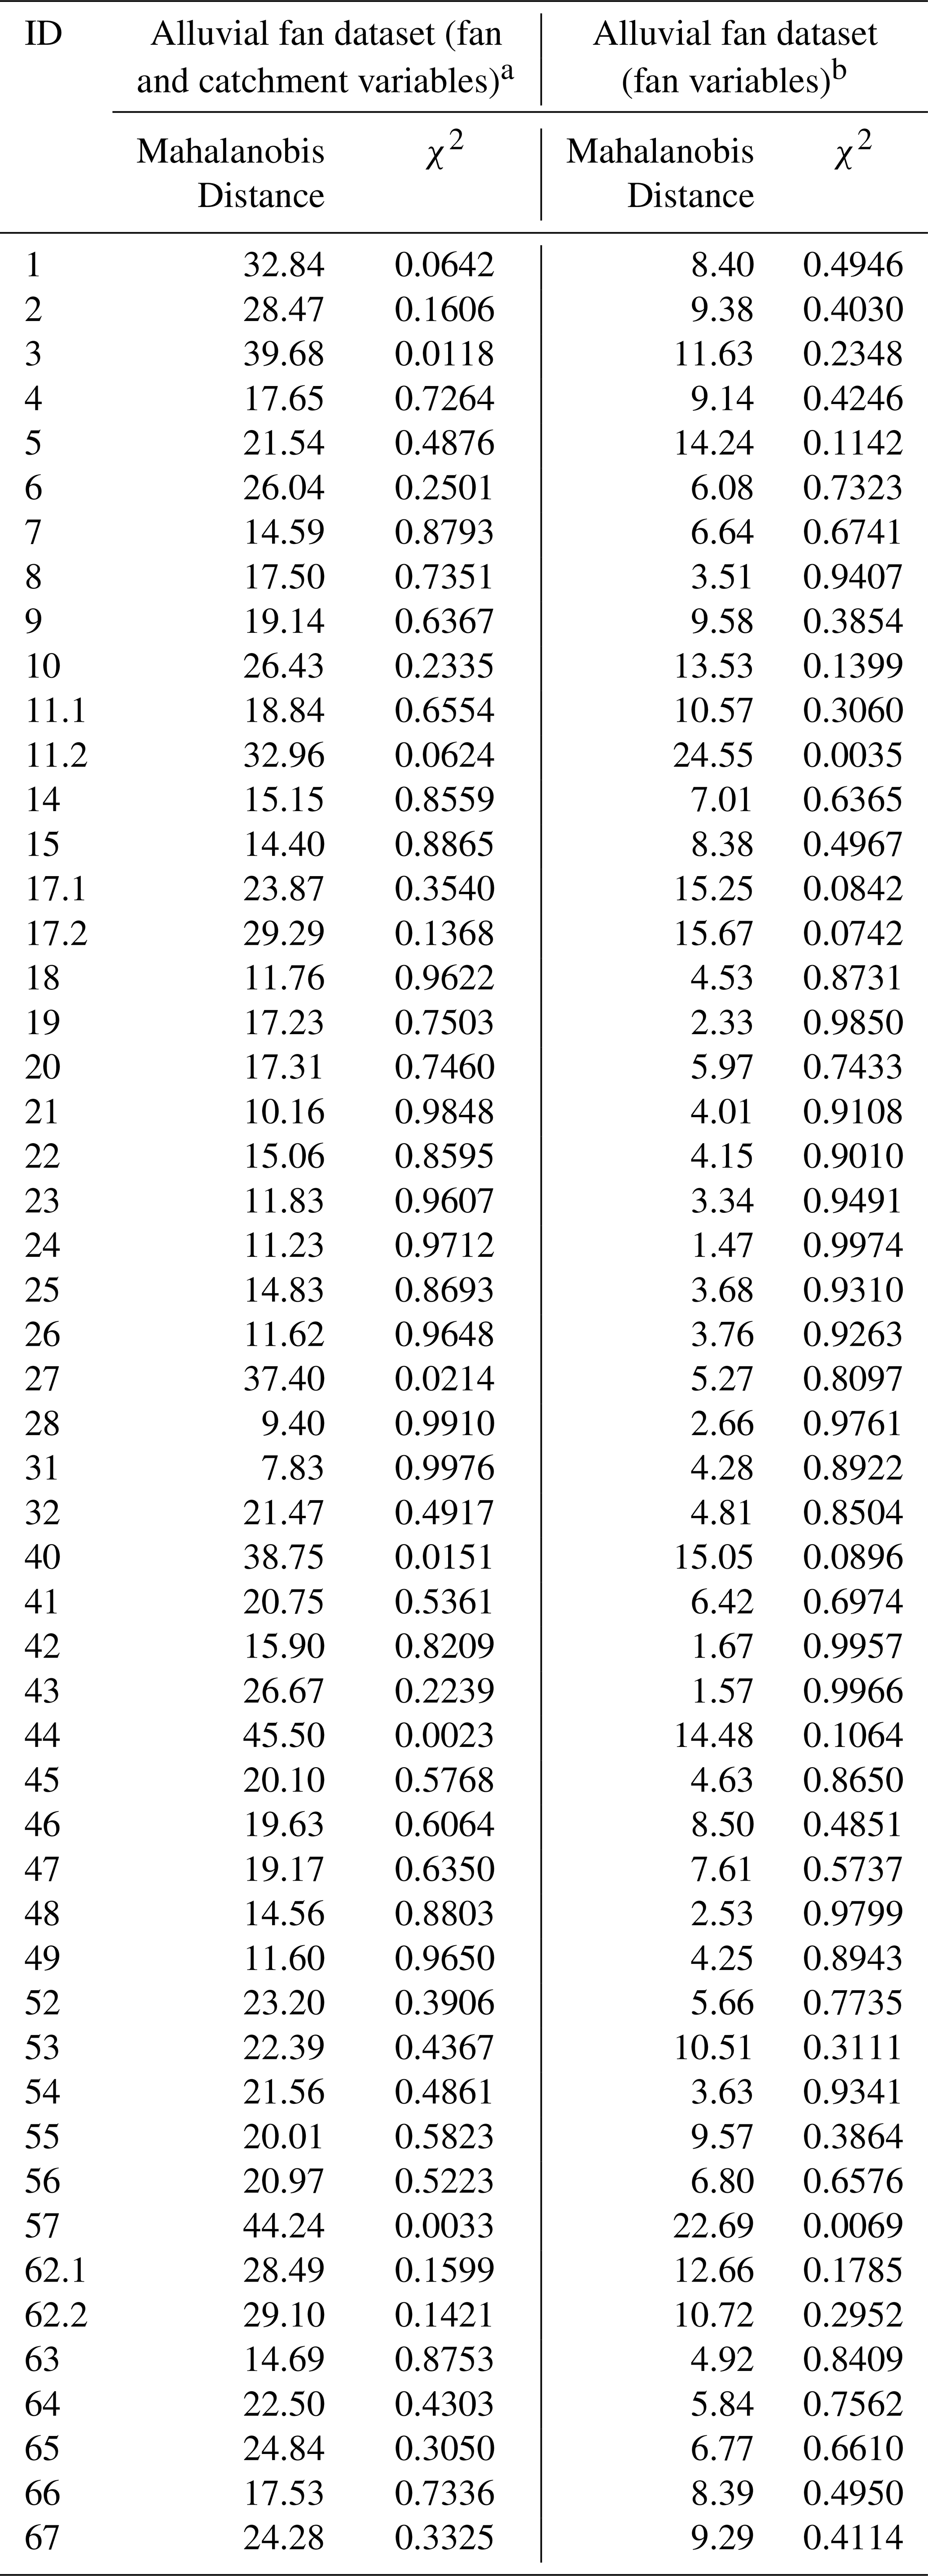
a n = 22 variables. b n = 8 variables.
Table B9Cophenetic coefficients obtained for different combinations of fusion algorithms and distances (four cluster solution) for the catchment dataset. Coefficients in italics represent solutions where an outlier group could be identified and the minimum cluster sizes were reached. The chosen combination and coefficient is indicated by the bold value.
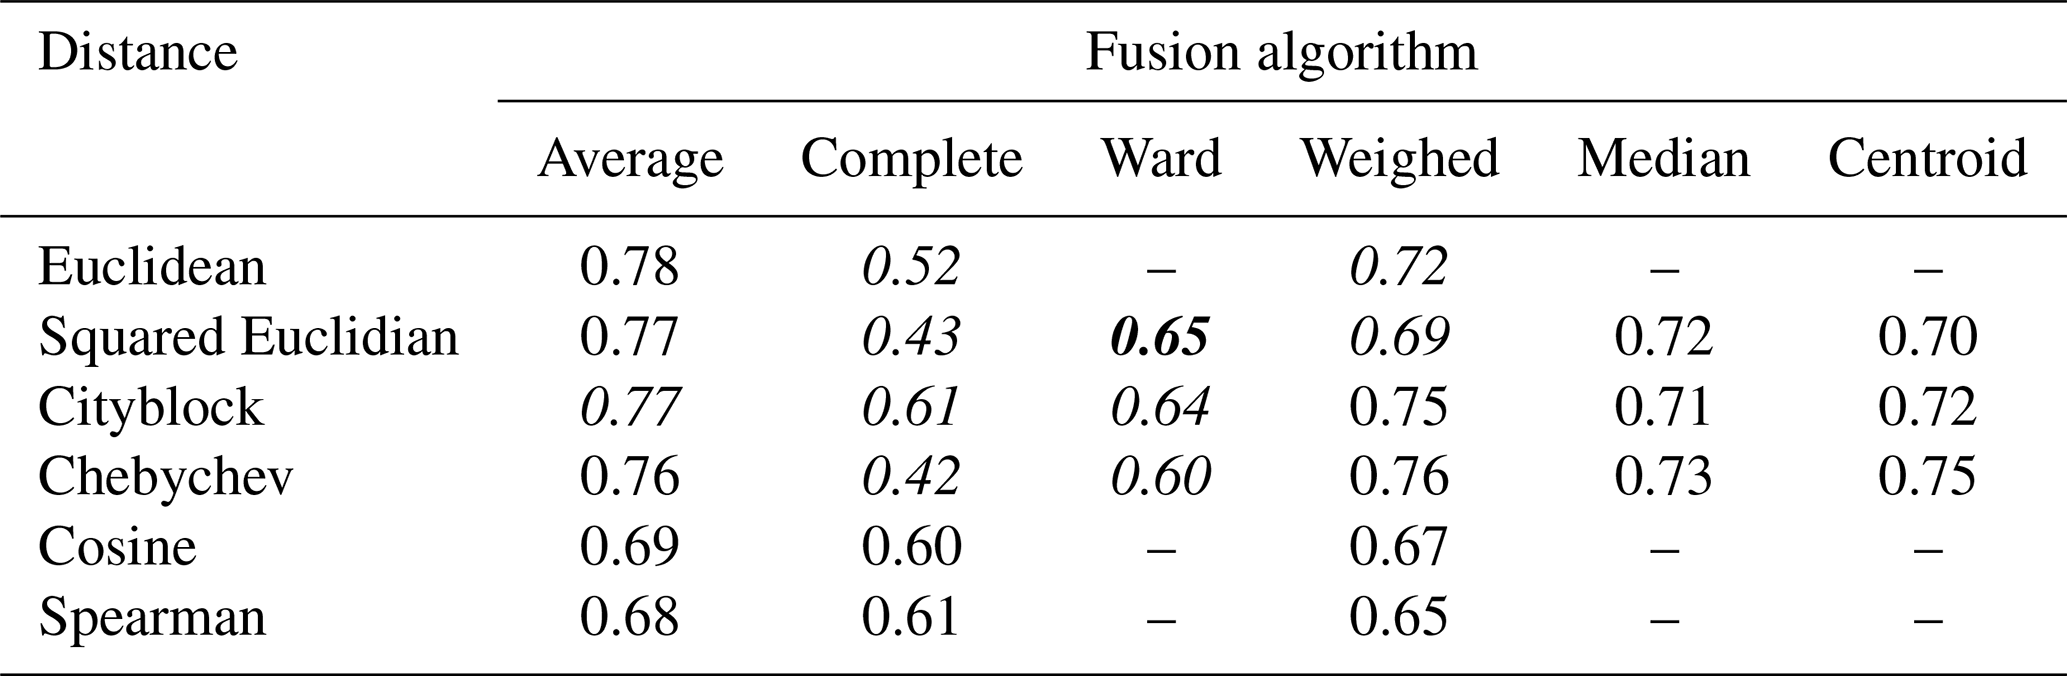
Table B10Cophenetic coefficients obtained for different combinations of fusion algorithms and distances (three cluster solution) for the fan dataset. Coefficients in italics represent solutions where the minimum cluster sizes were reached. The chosen combination and coefficient is indicated by the bold value.
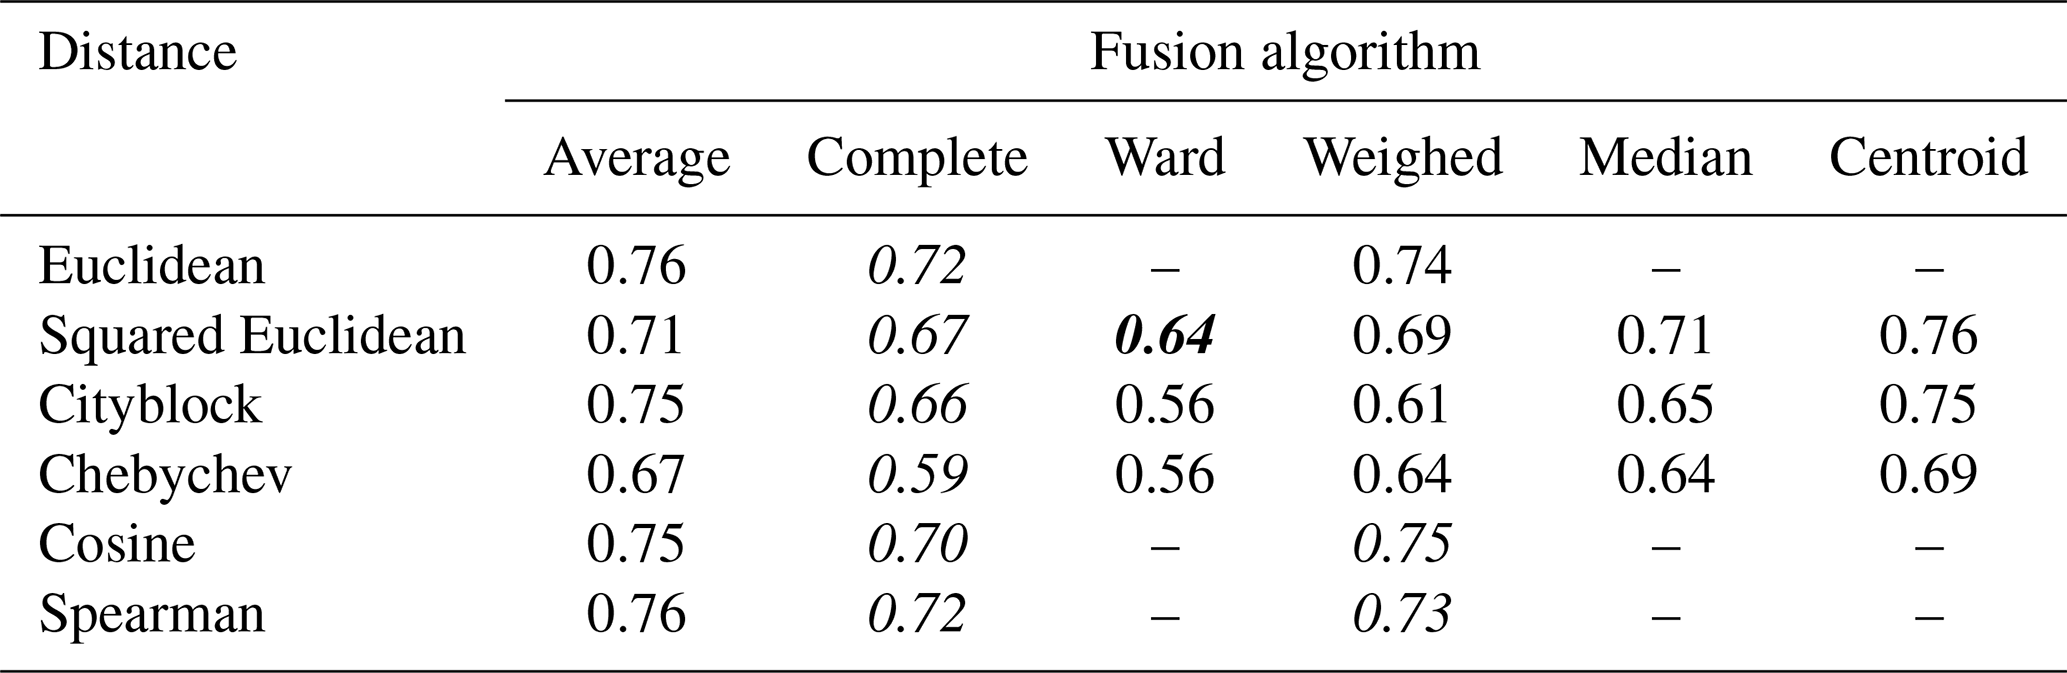
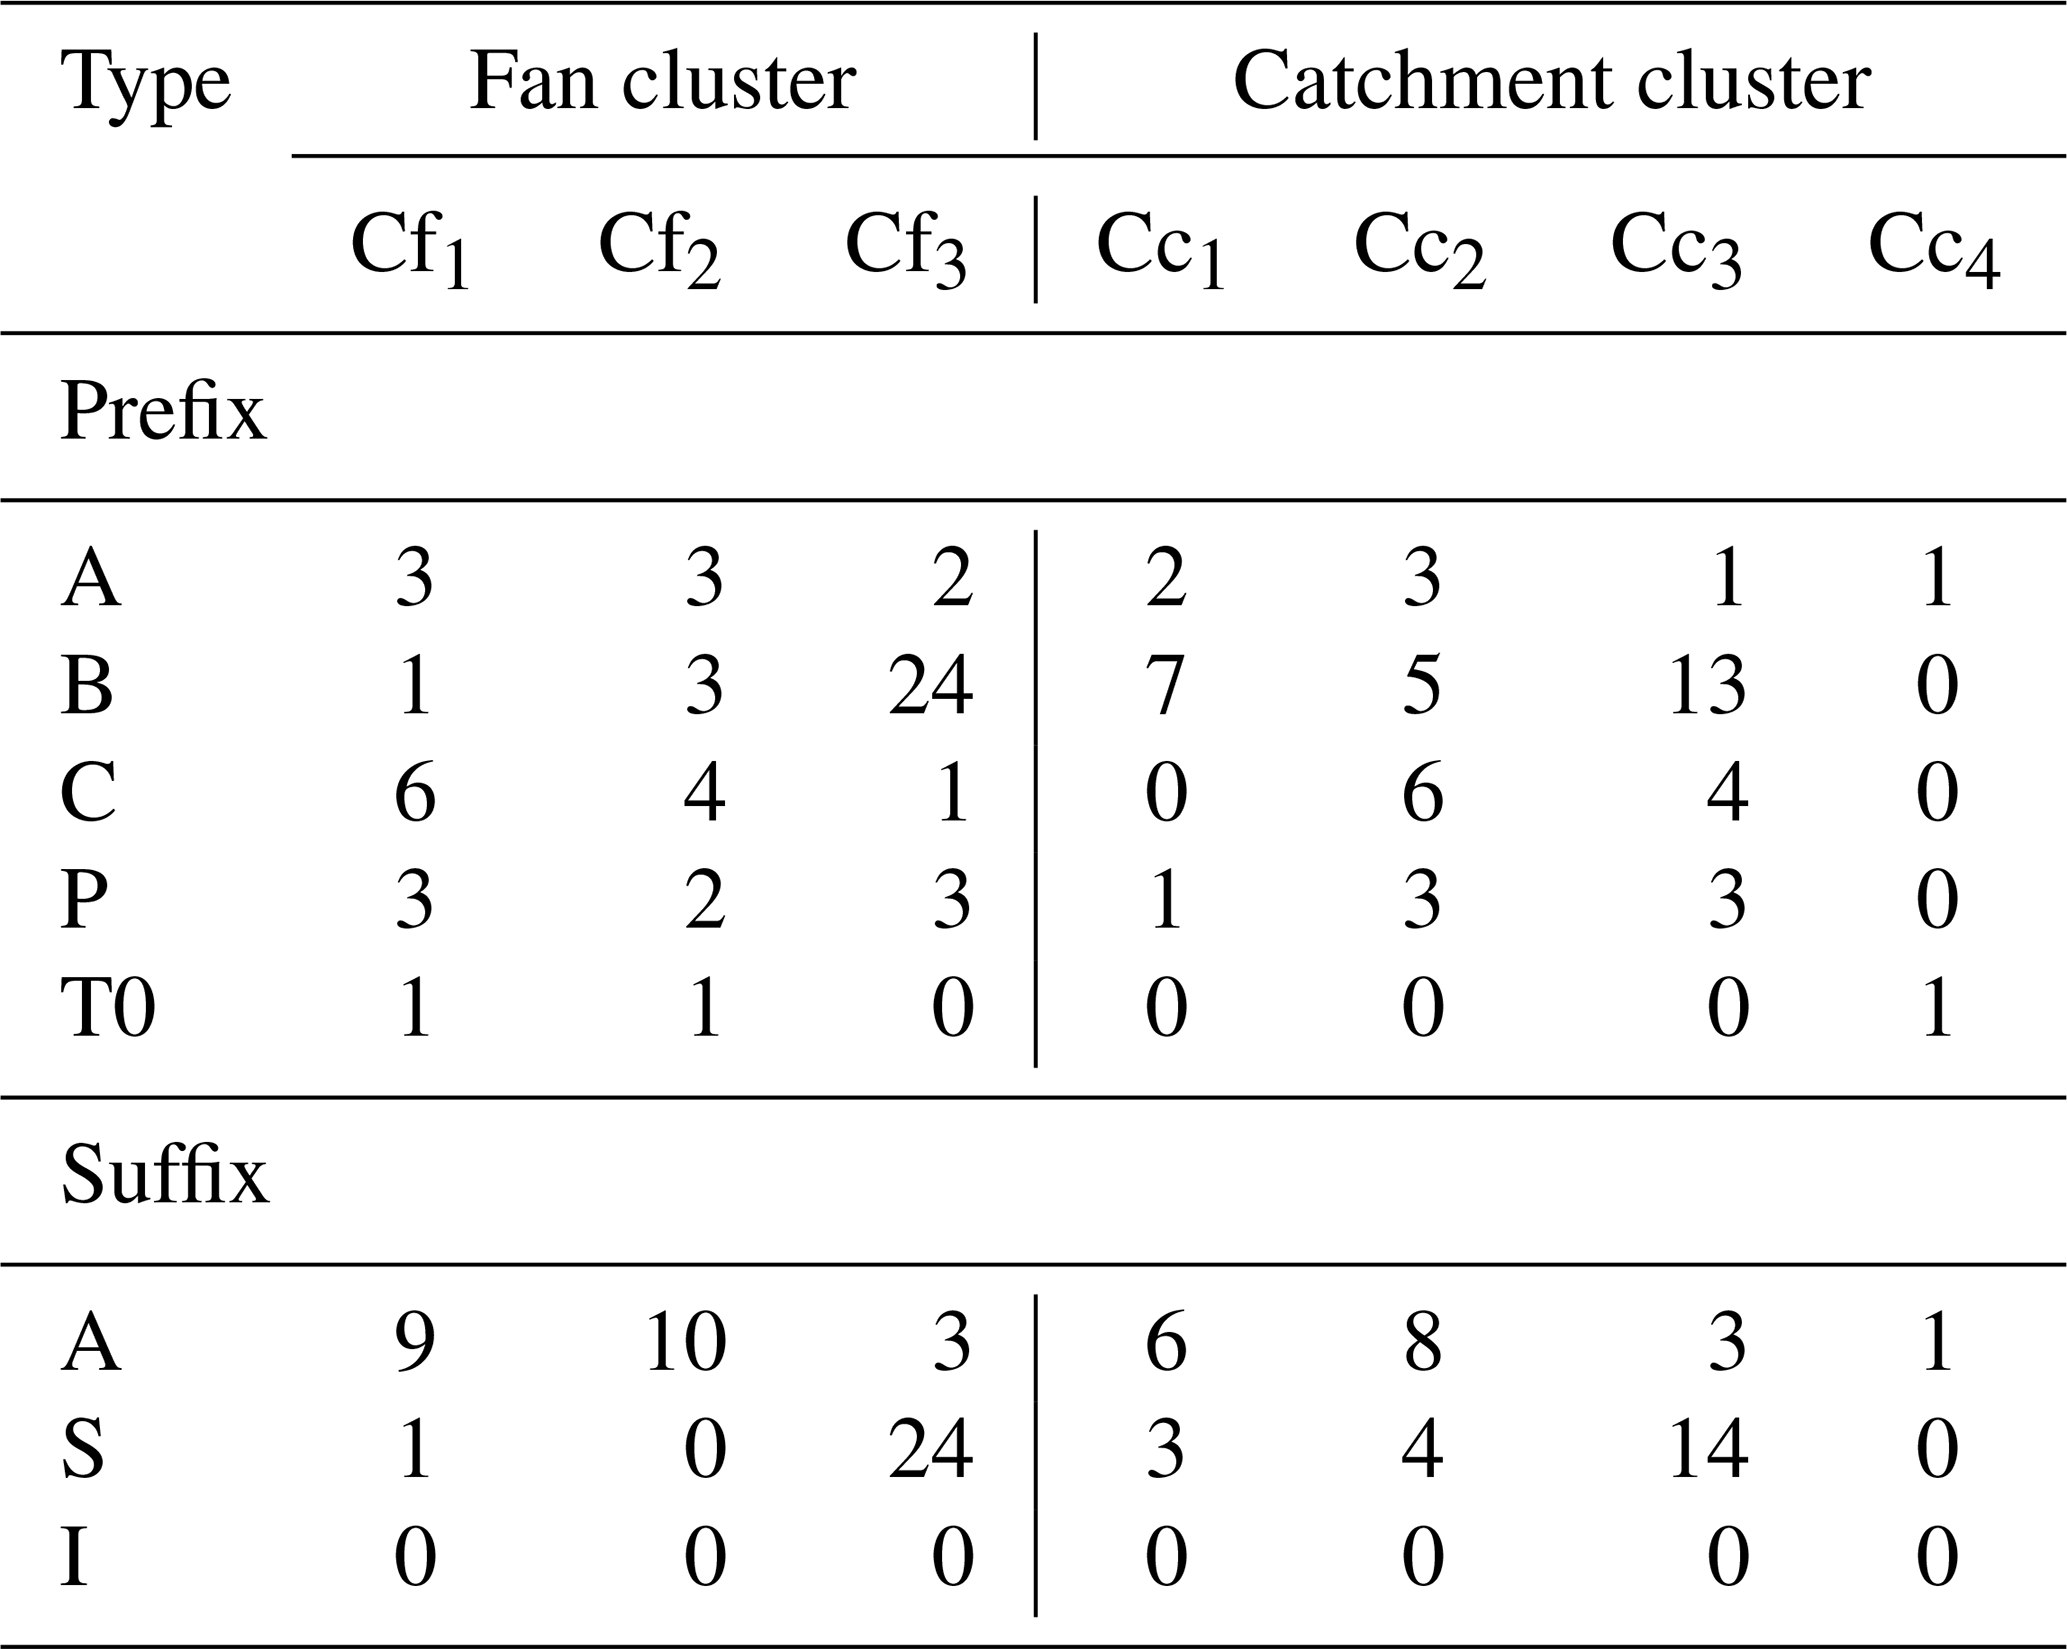
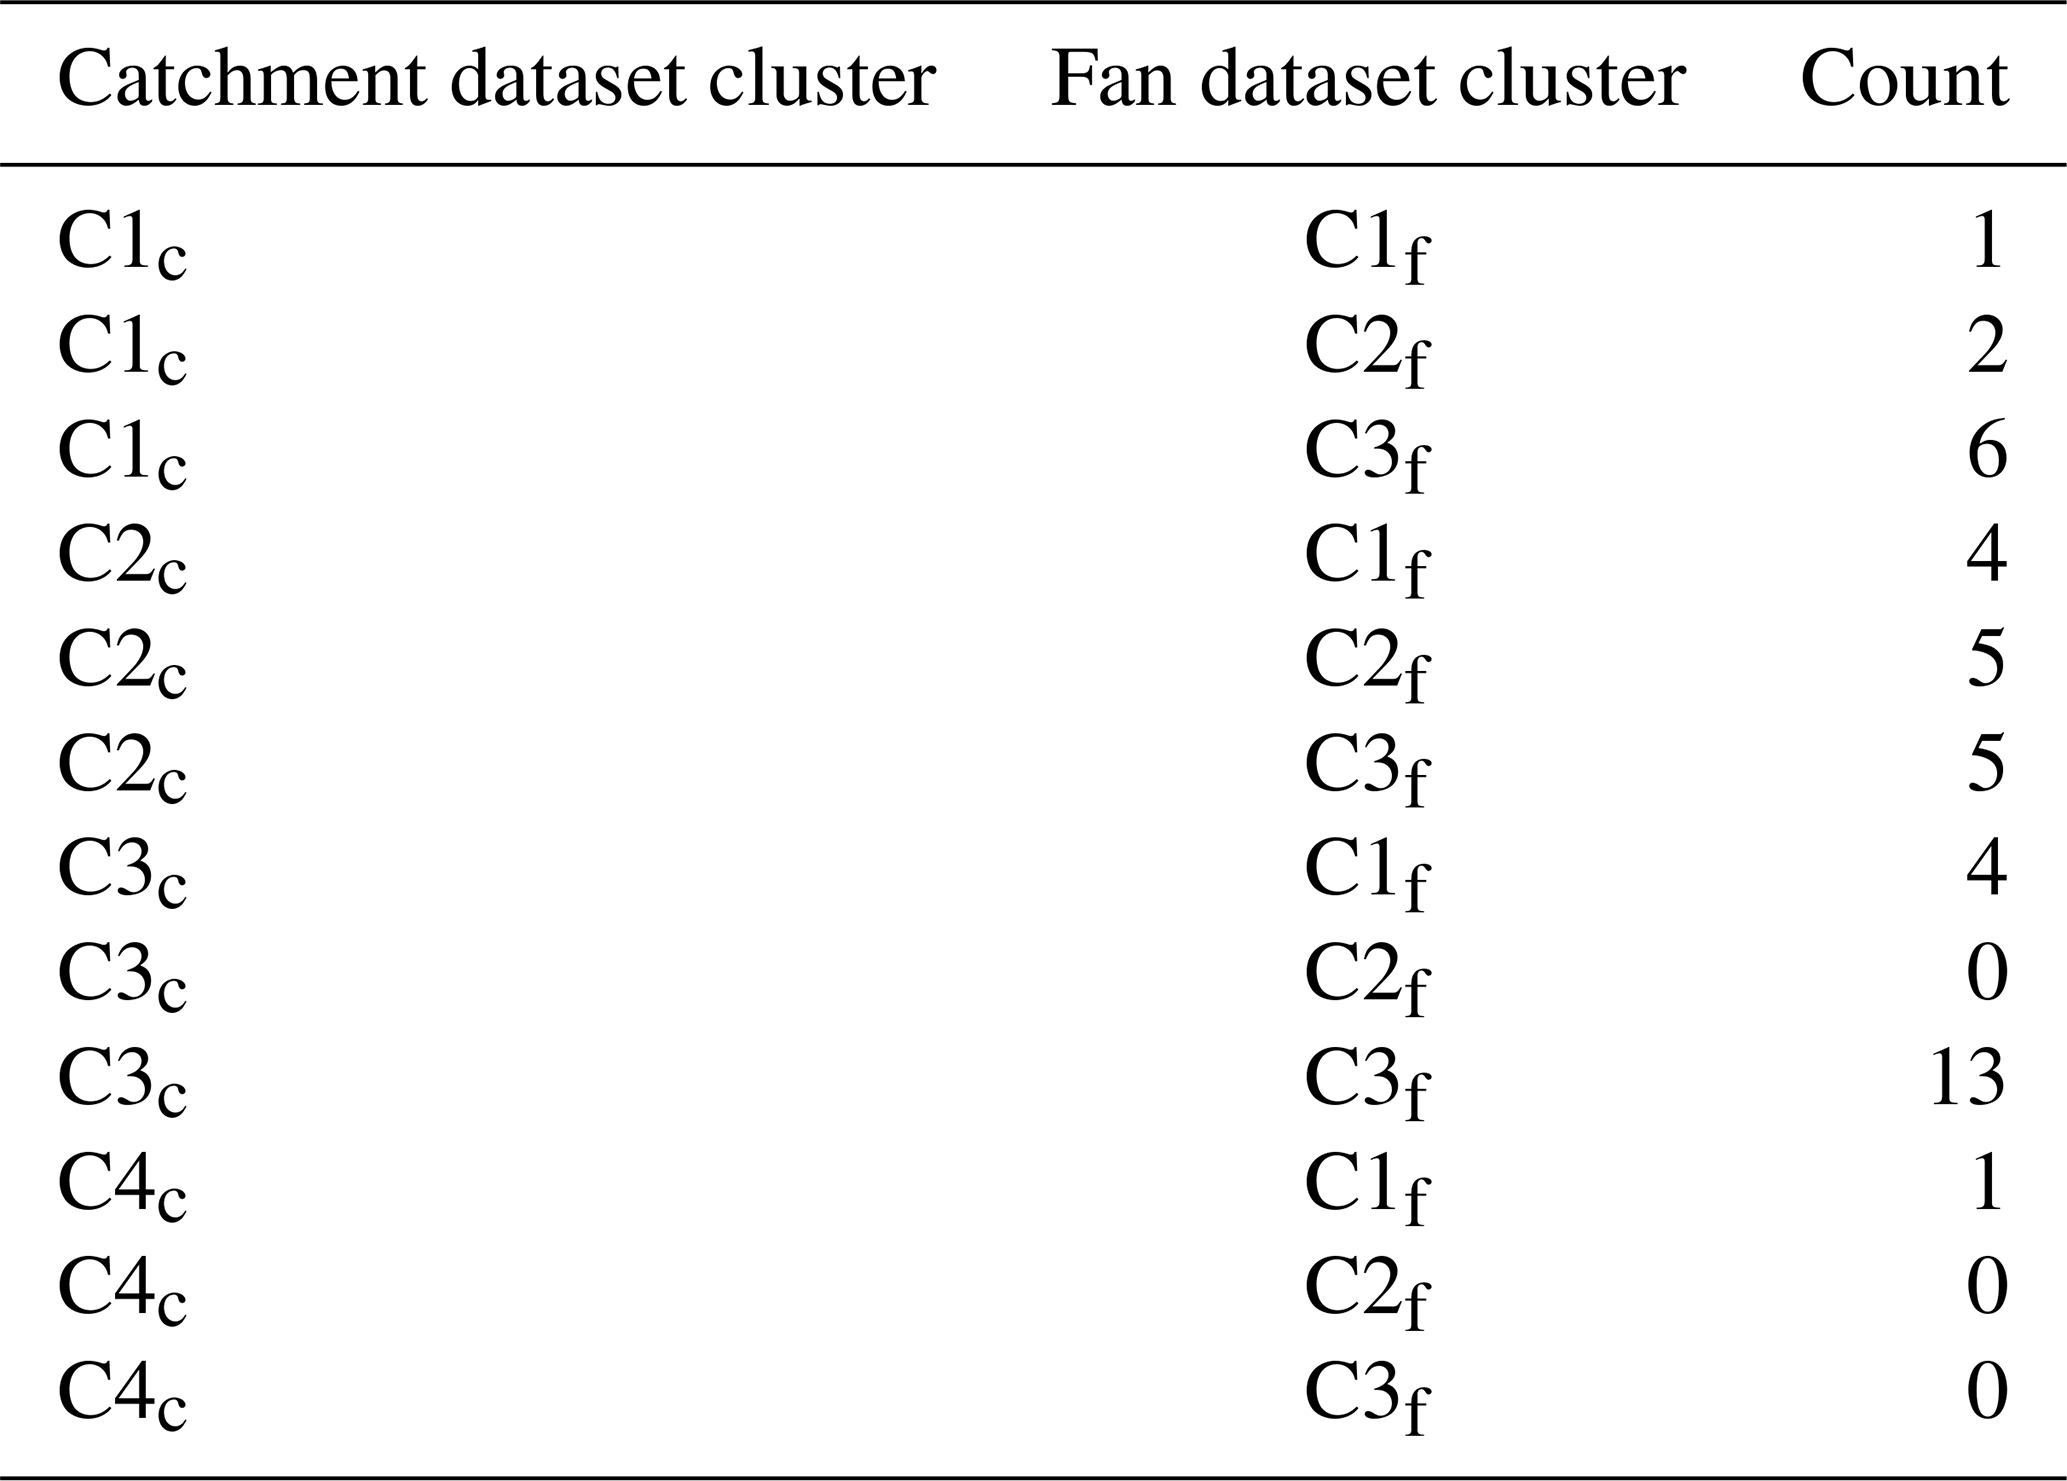
Table B13Supportive strong and significantly correlated variable relationships.
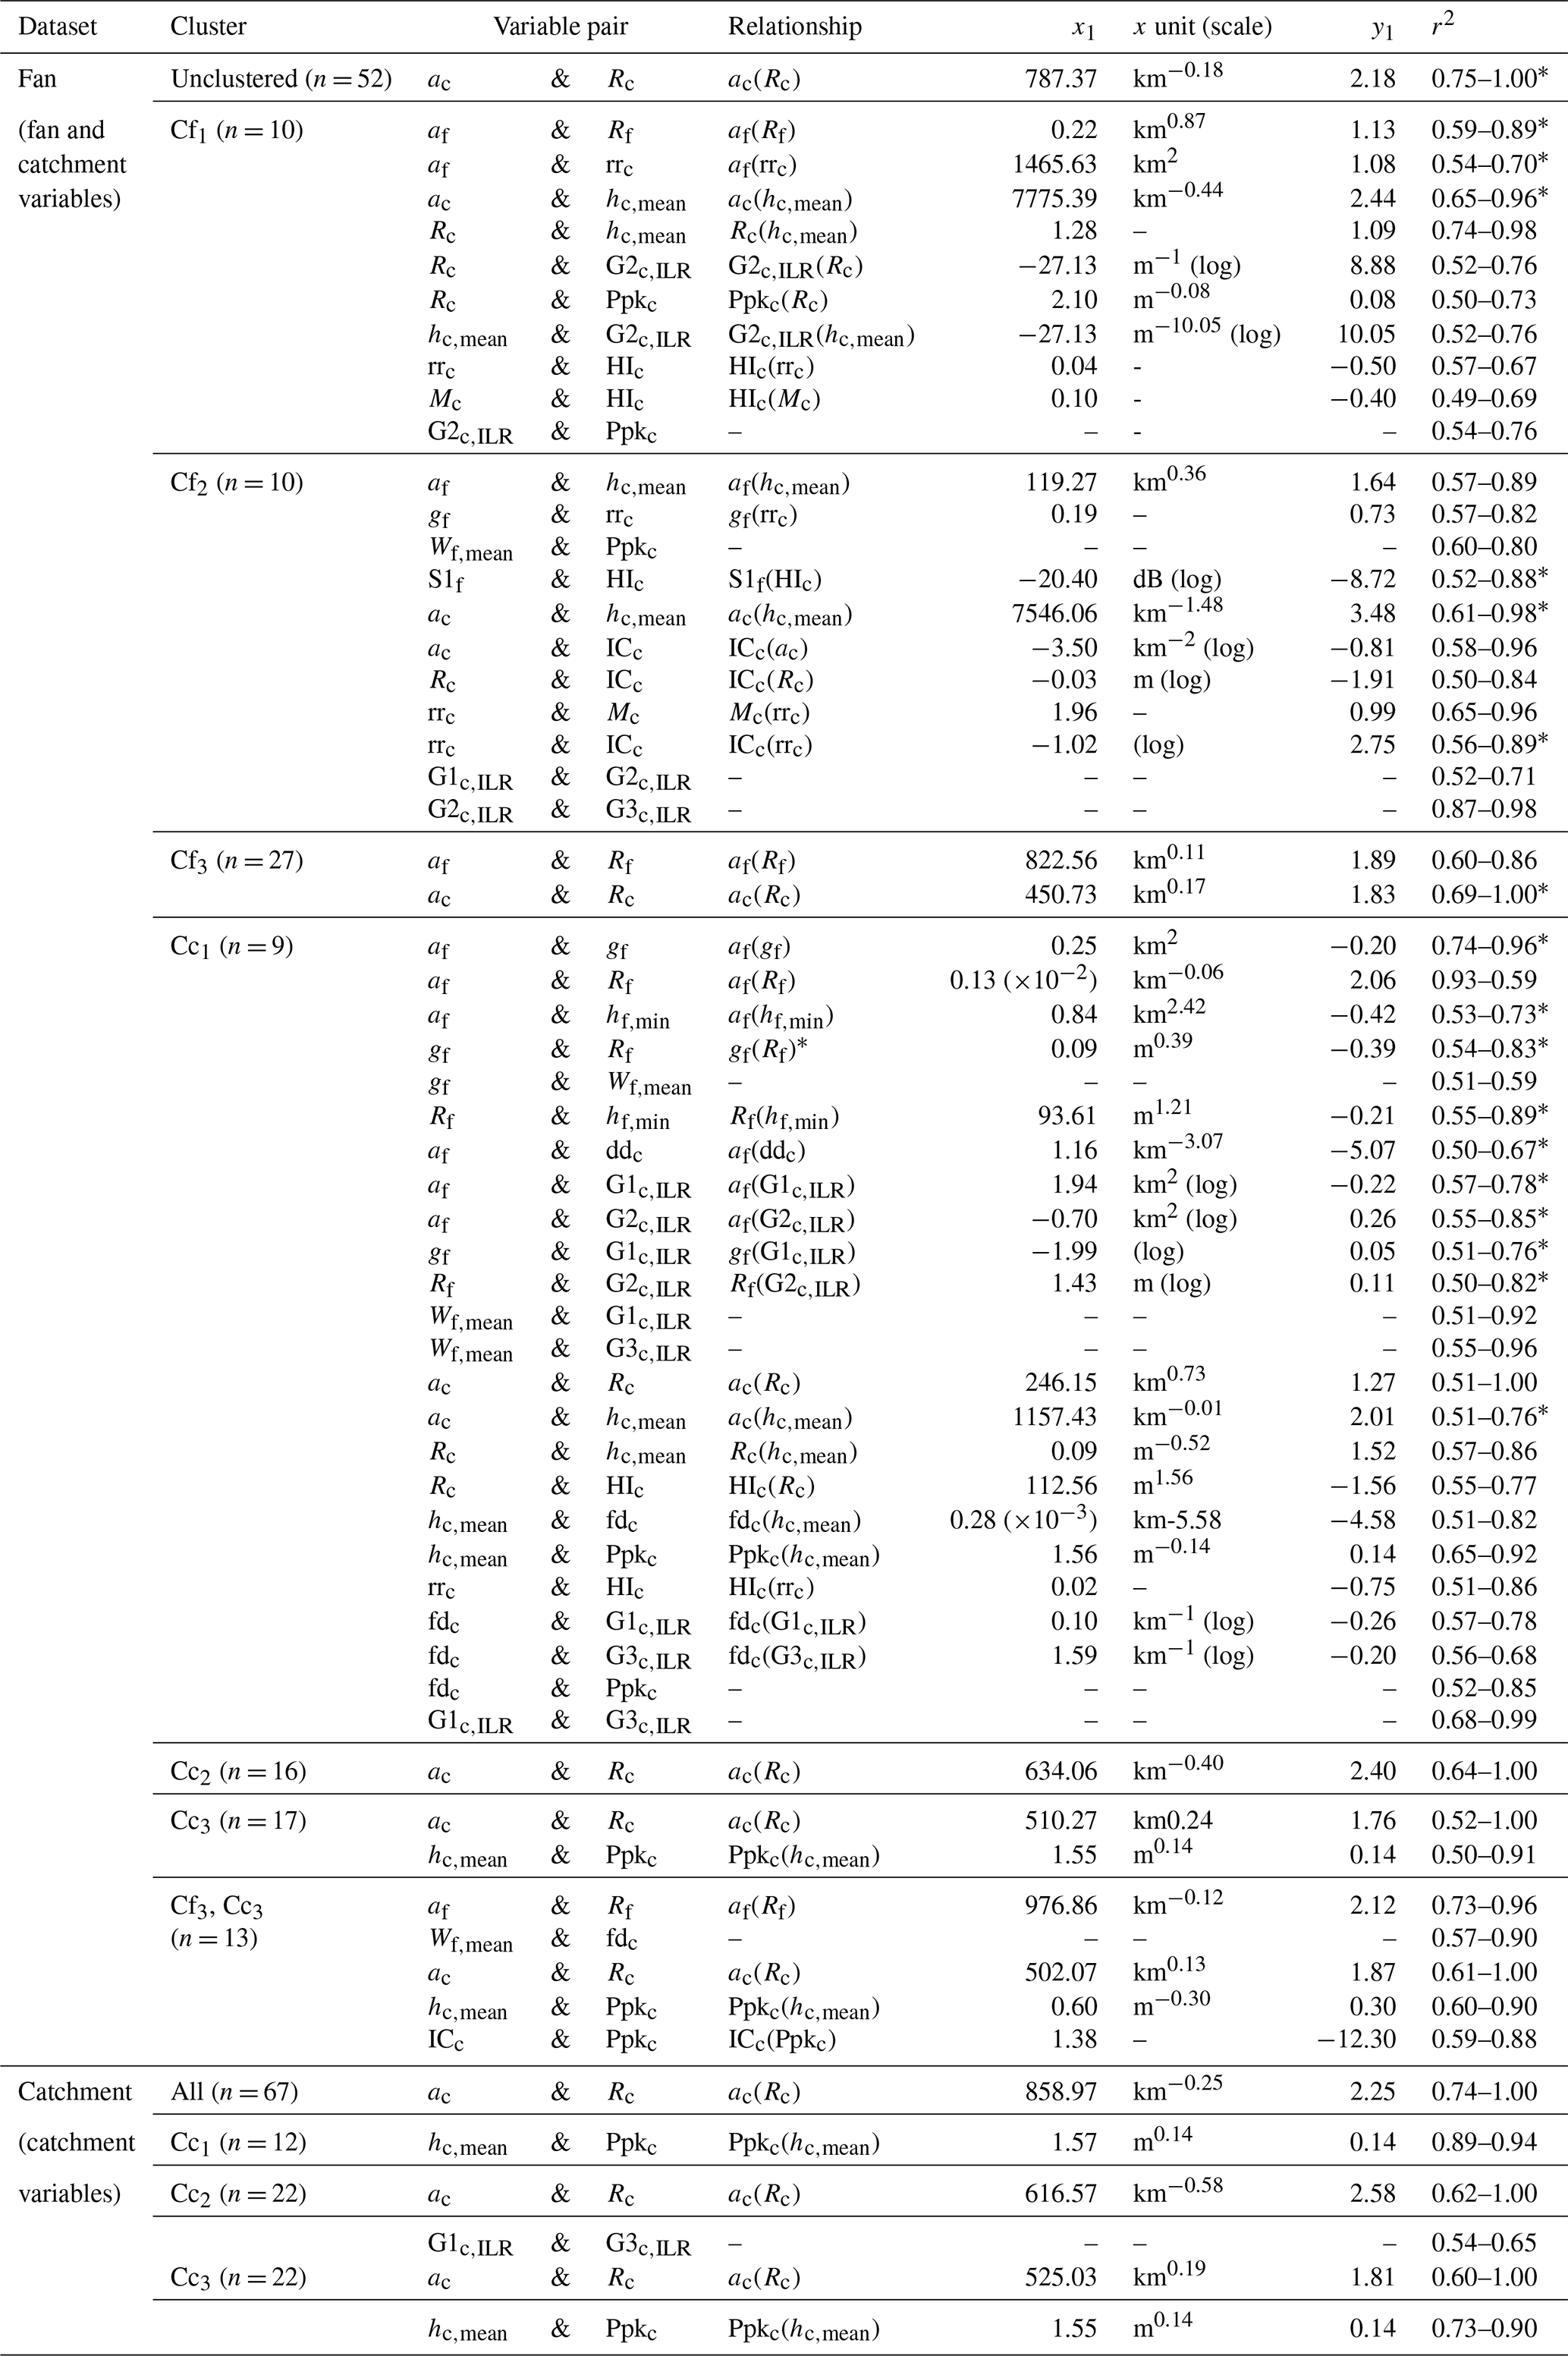
* Strongly outlier-driven.
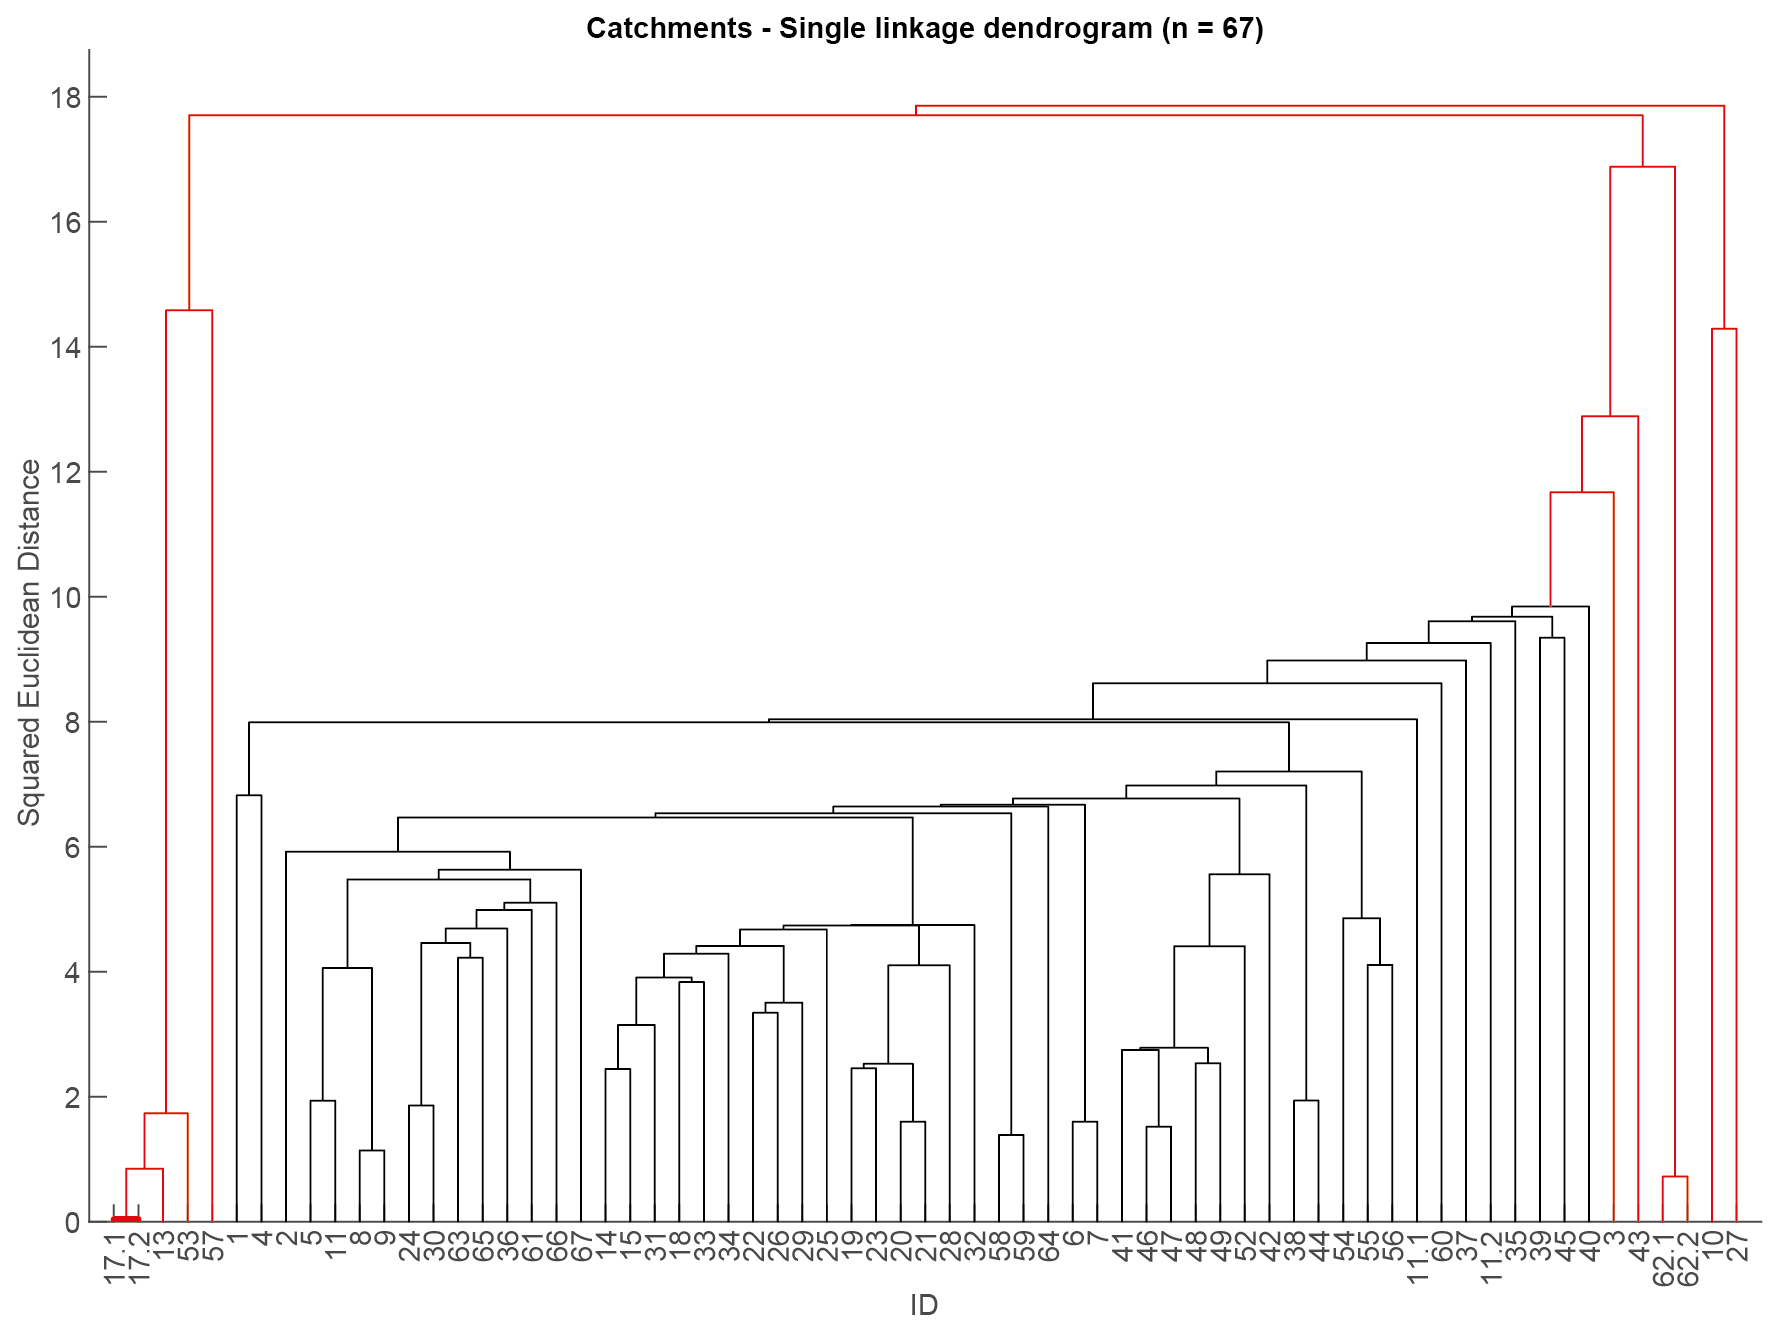
Figure C1Single linkage cluster dendrogram of the catchment dataset. Outliers are highlighted in red colour.
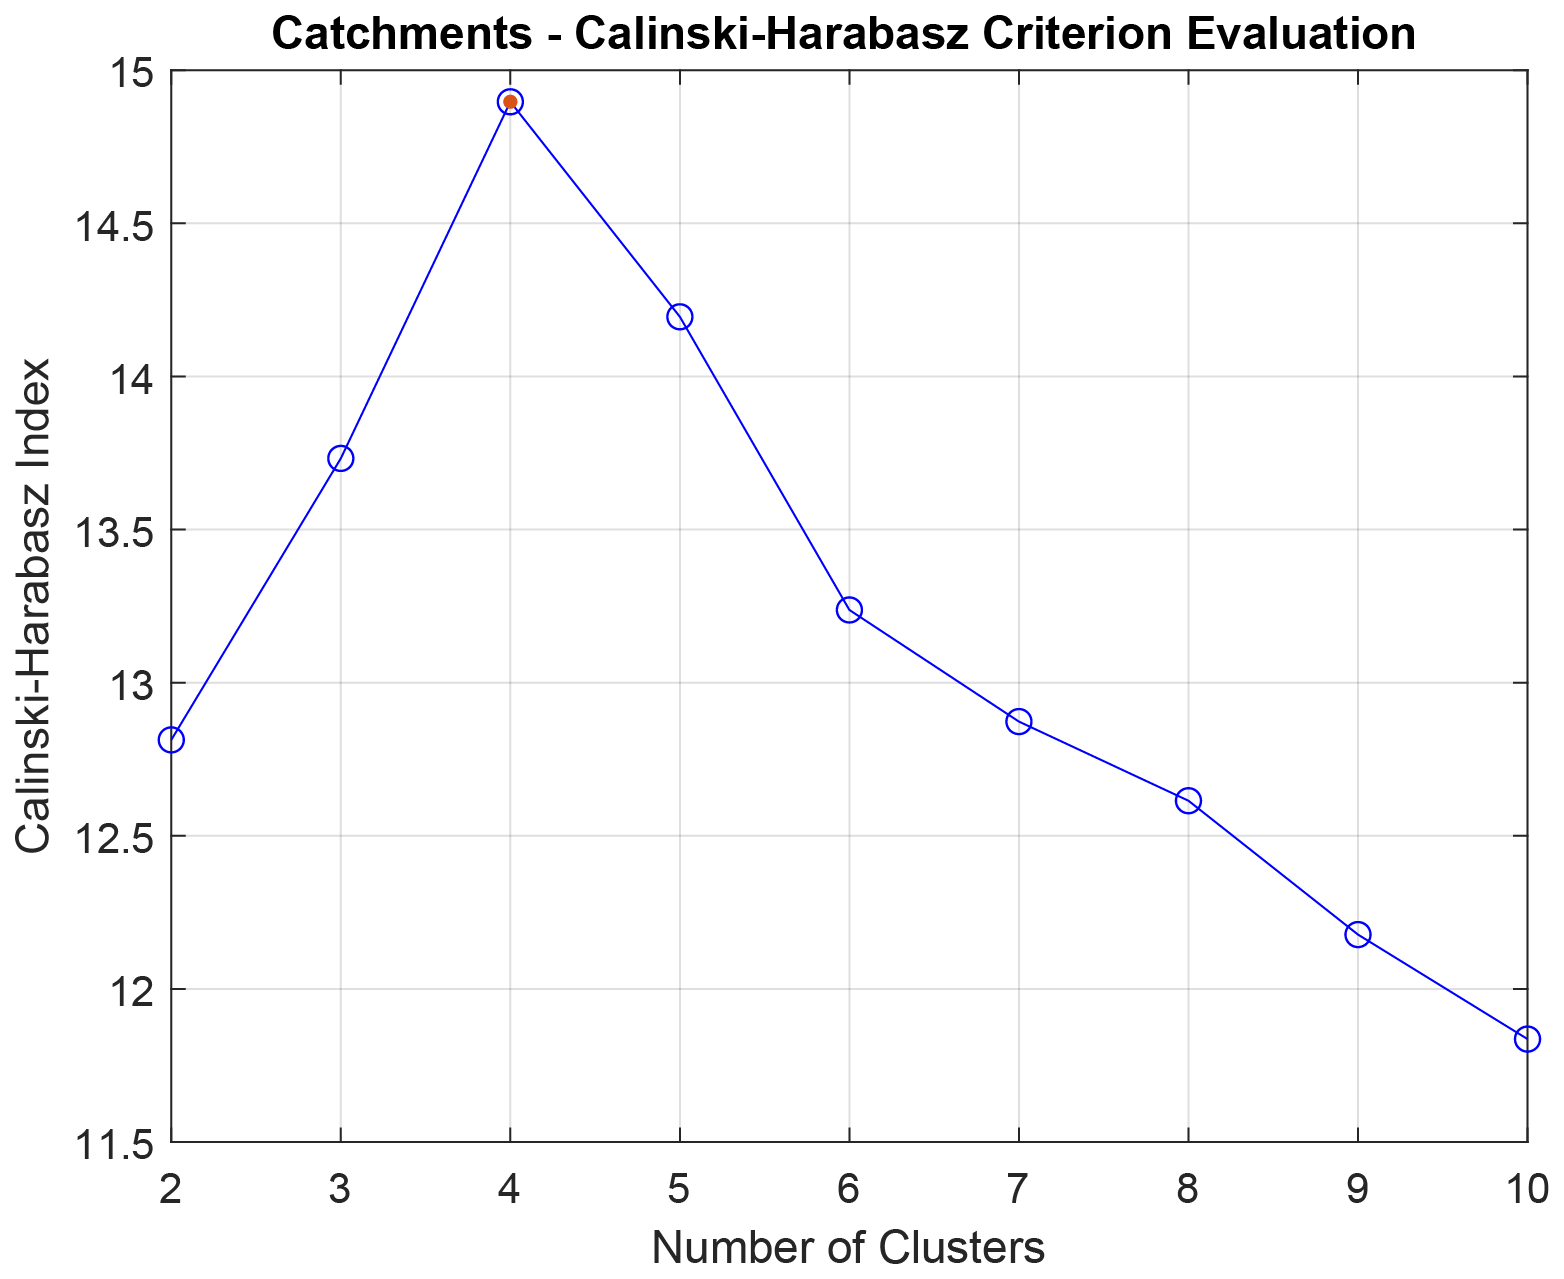
Figure C2Cluster number determination for the catchment dataset based on the Caliński and Harabasz criterion (Caliński and Harabasz, 1974).
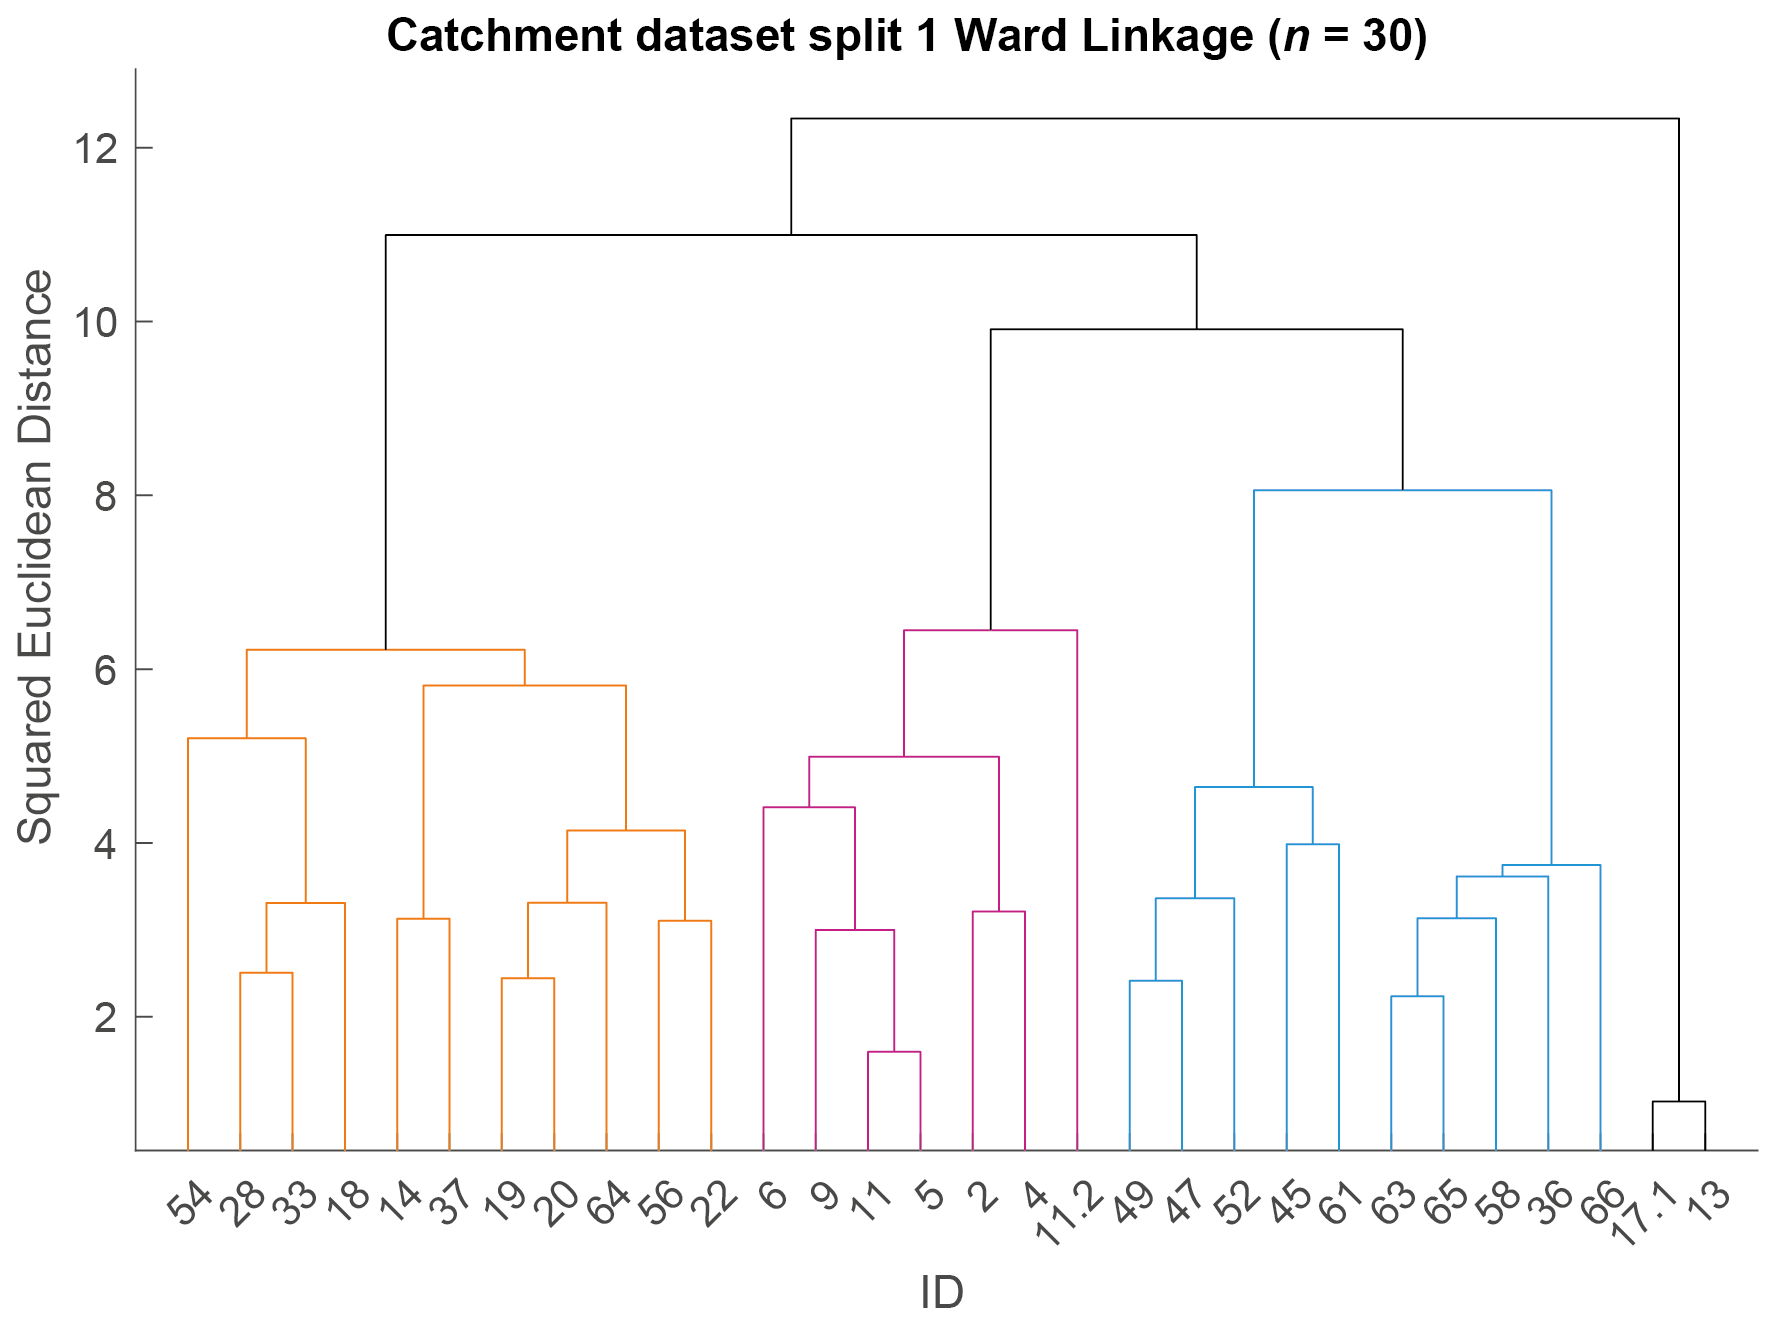
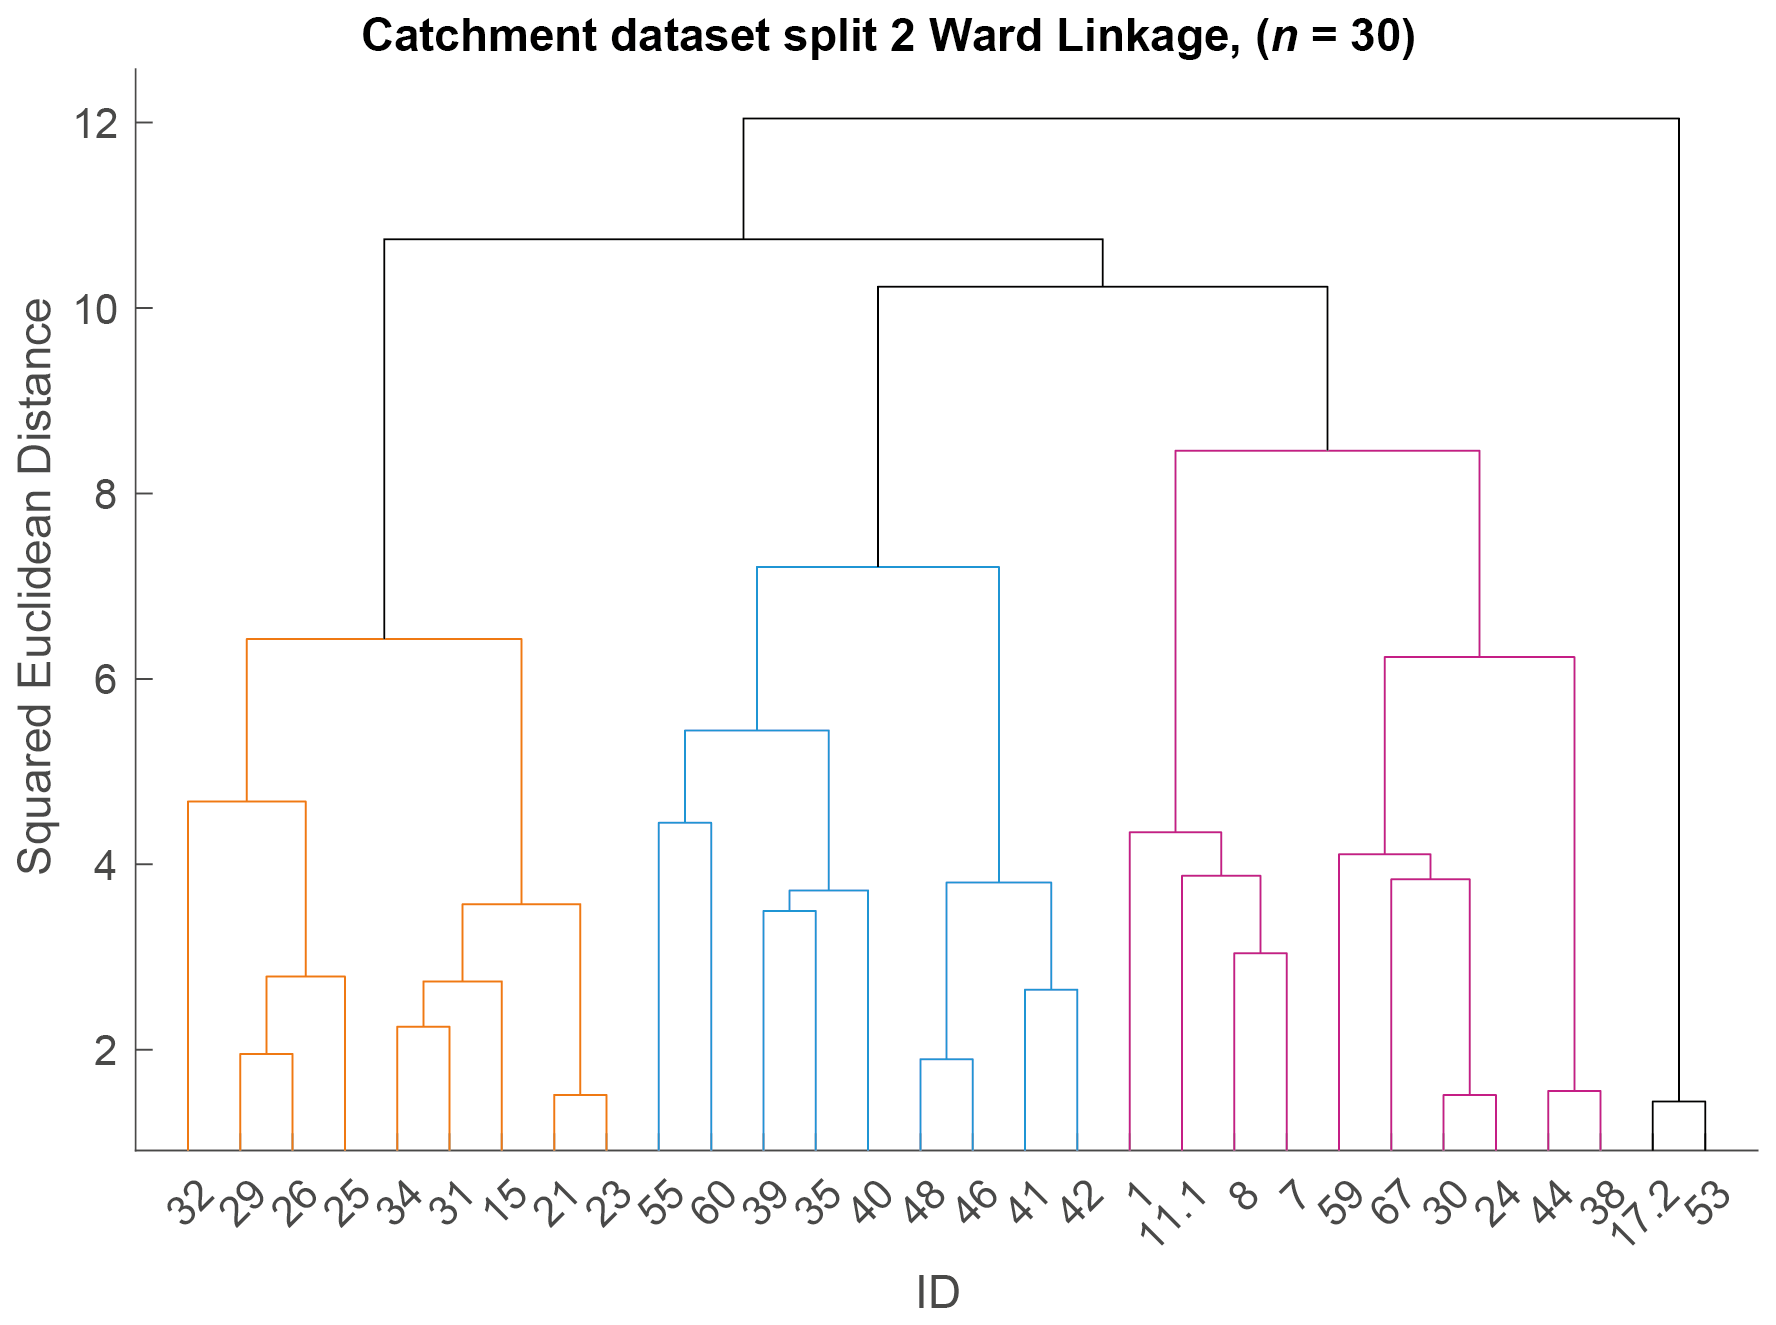
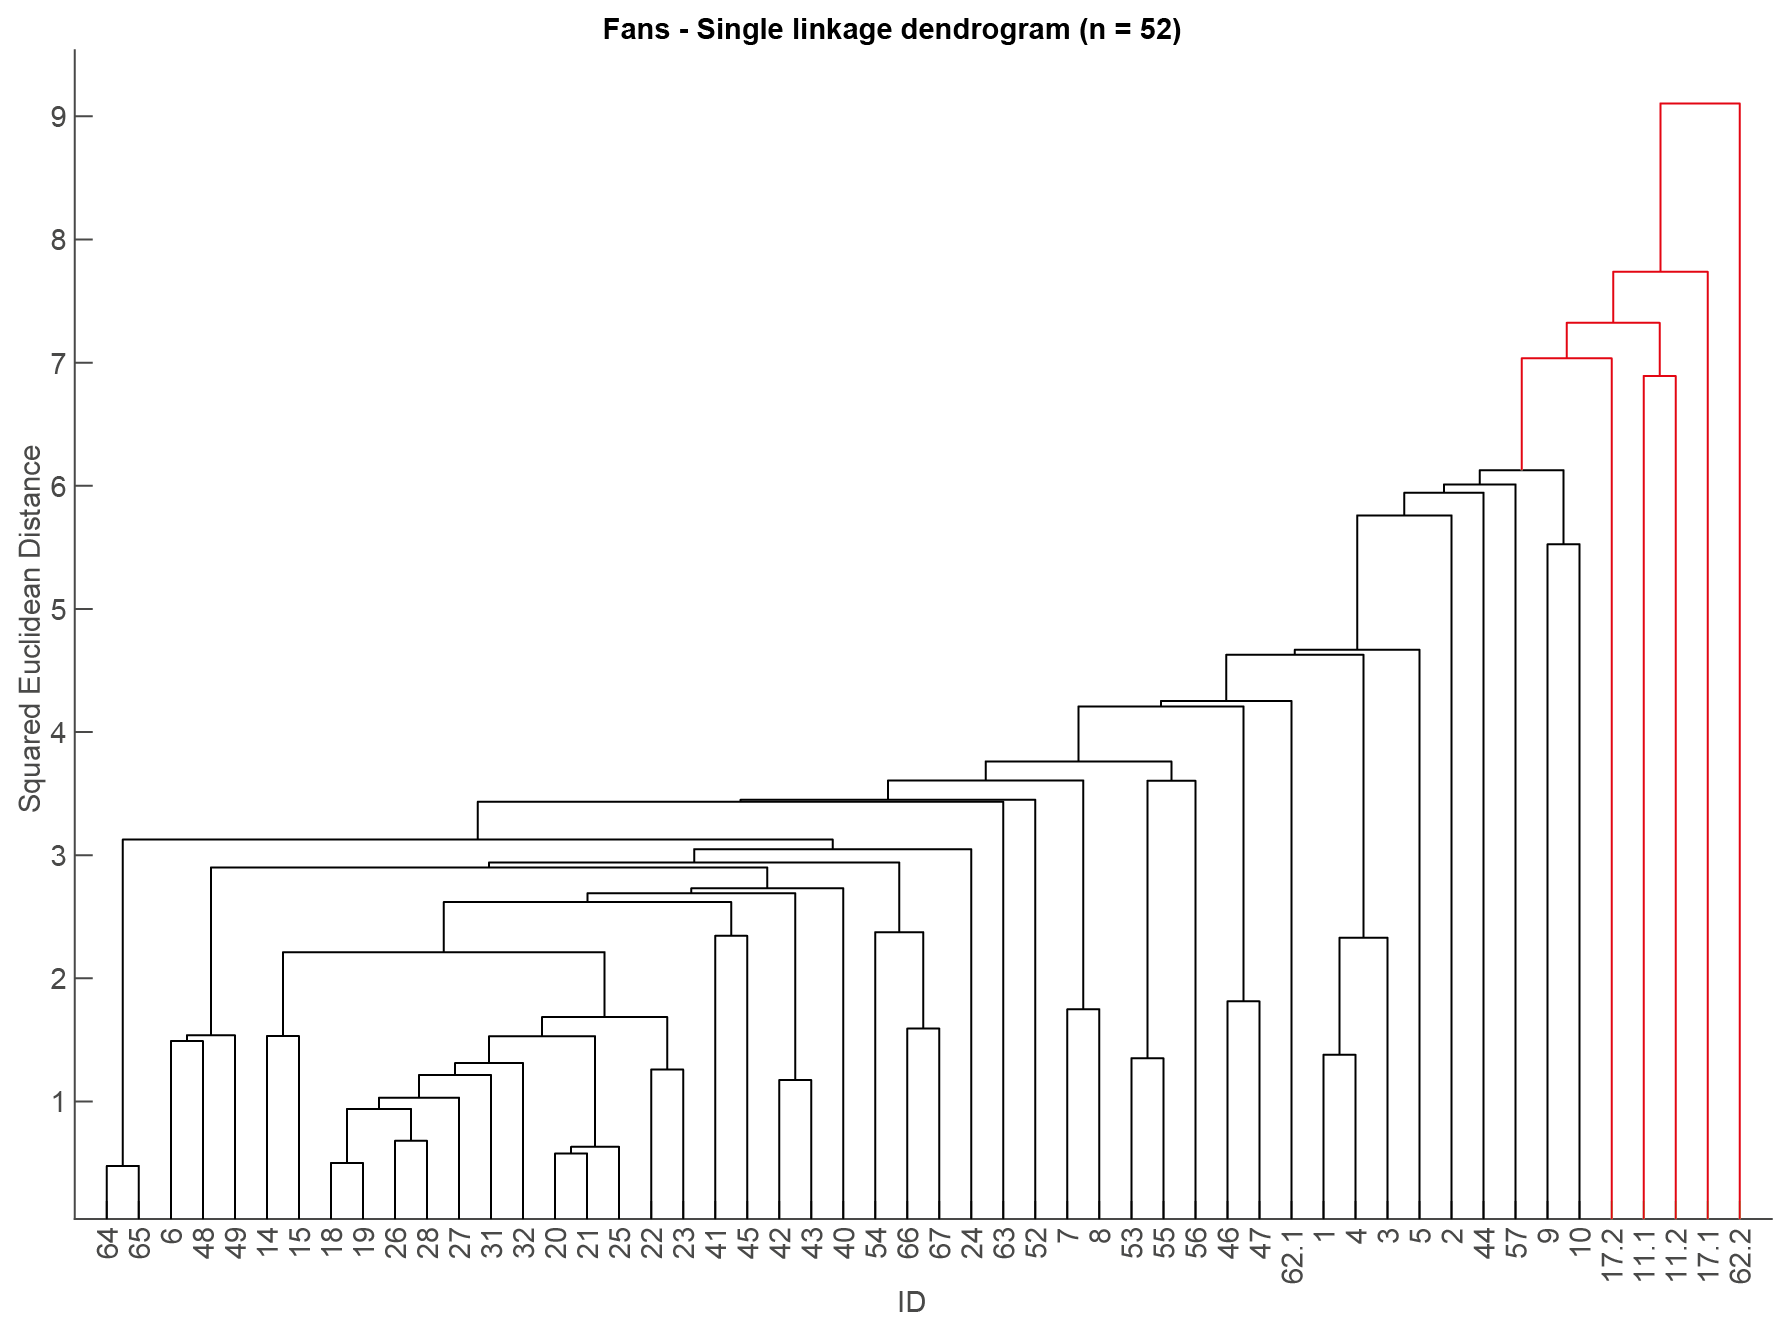
Figure C5Single linkage cluster dendrogram of the fan dataset. Outliers are highlighted in red color.
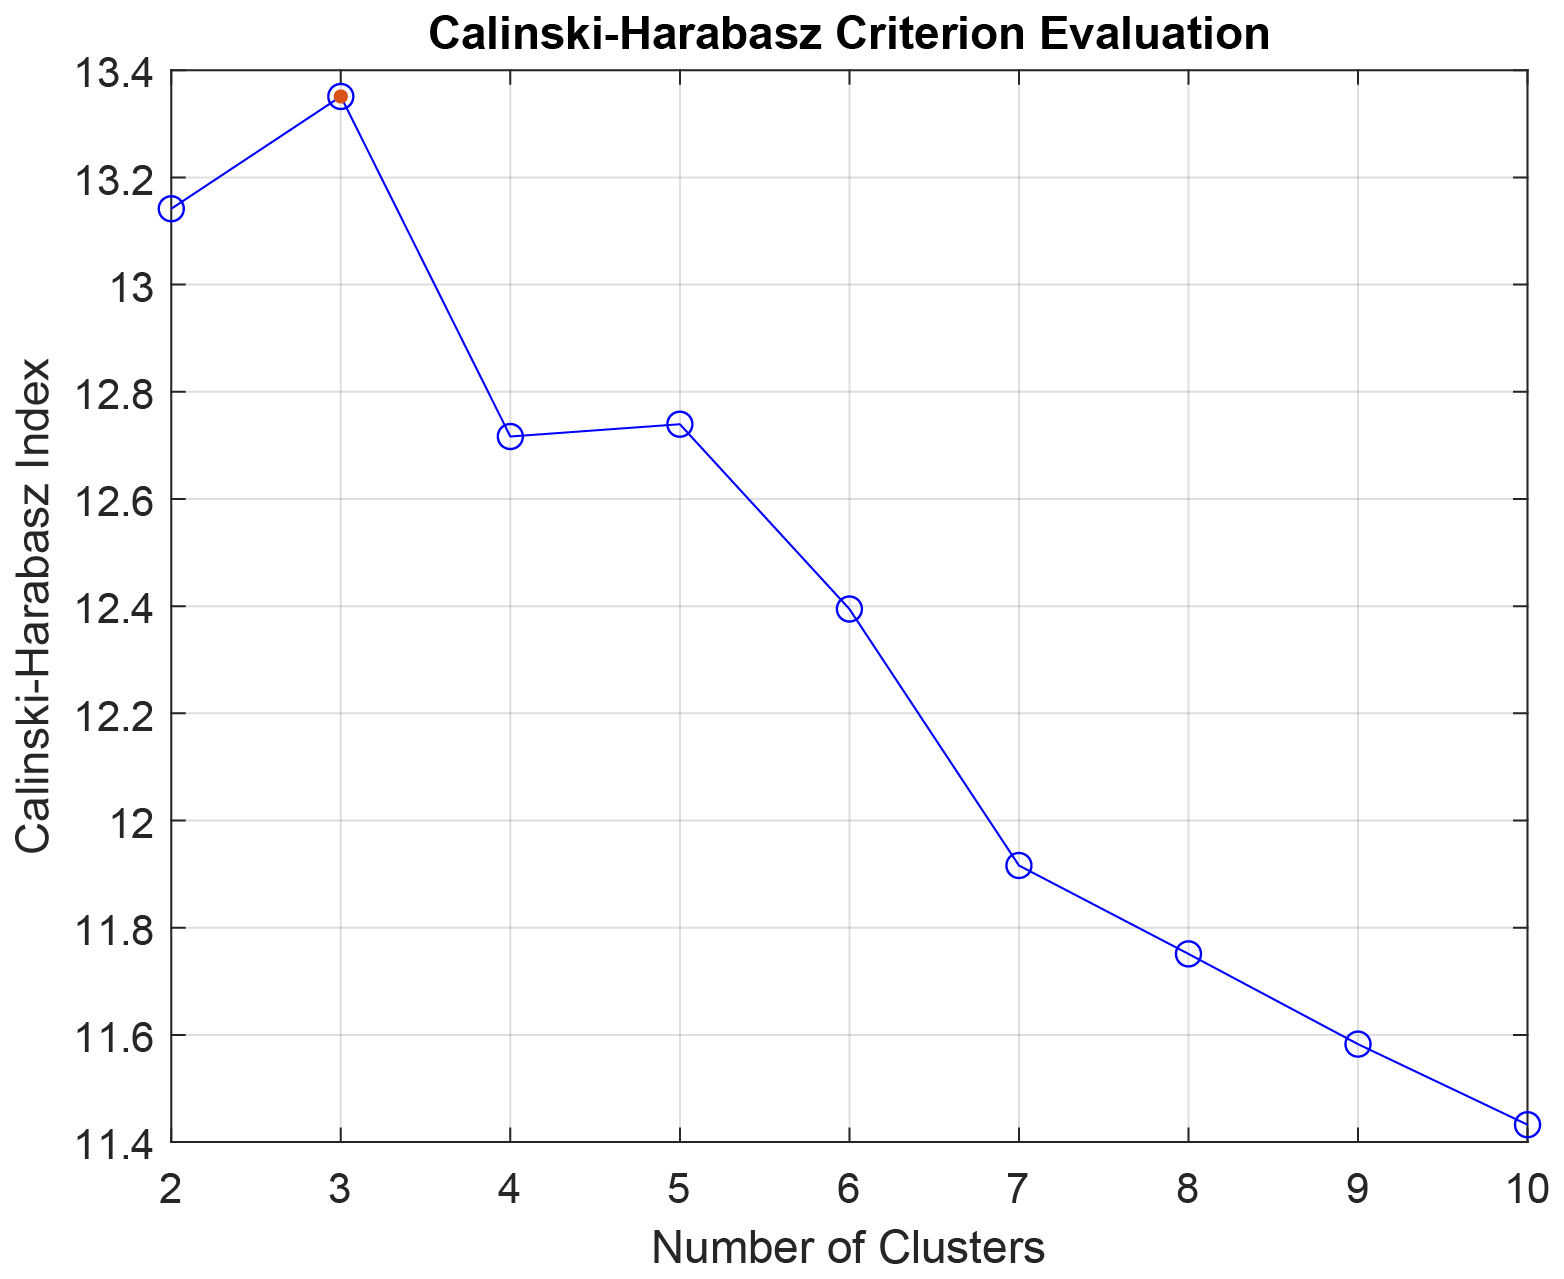
Figure C6Cluster number determination for the fan dataset based on the Caliński and Harabasz criterion (Caliński and Harabasz, 1974).
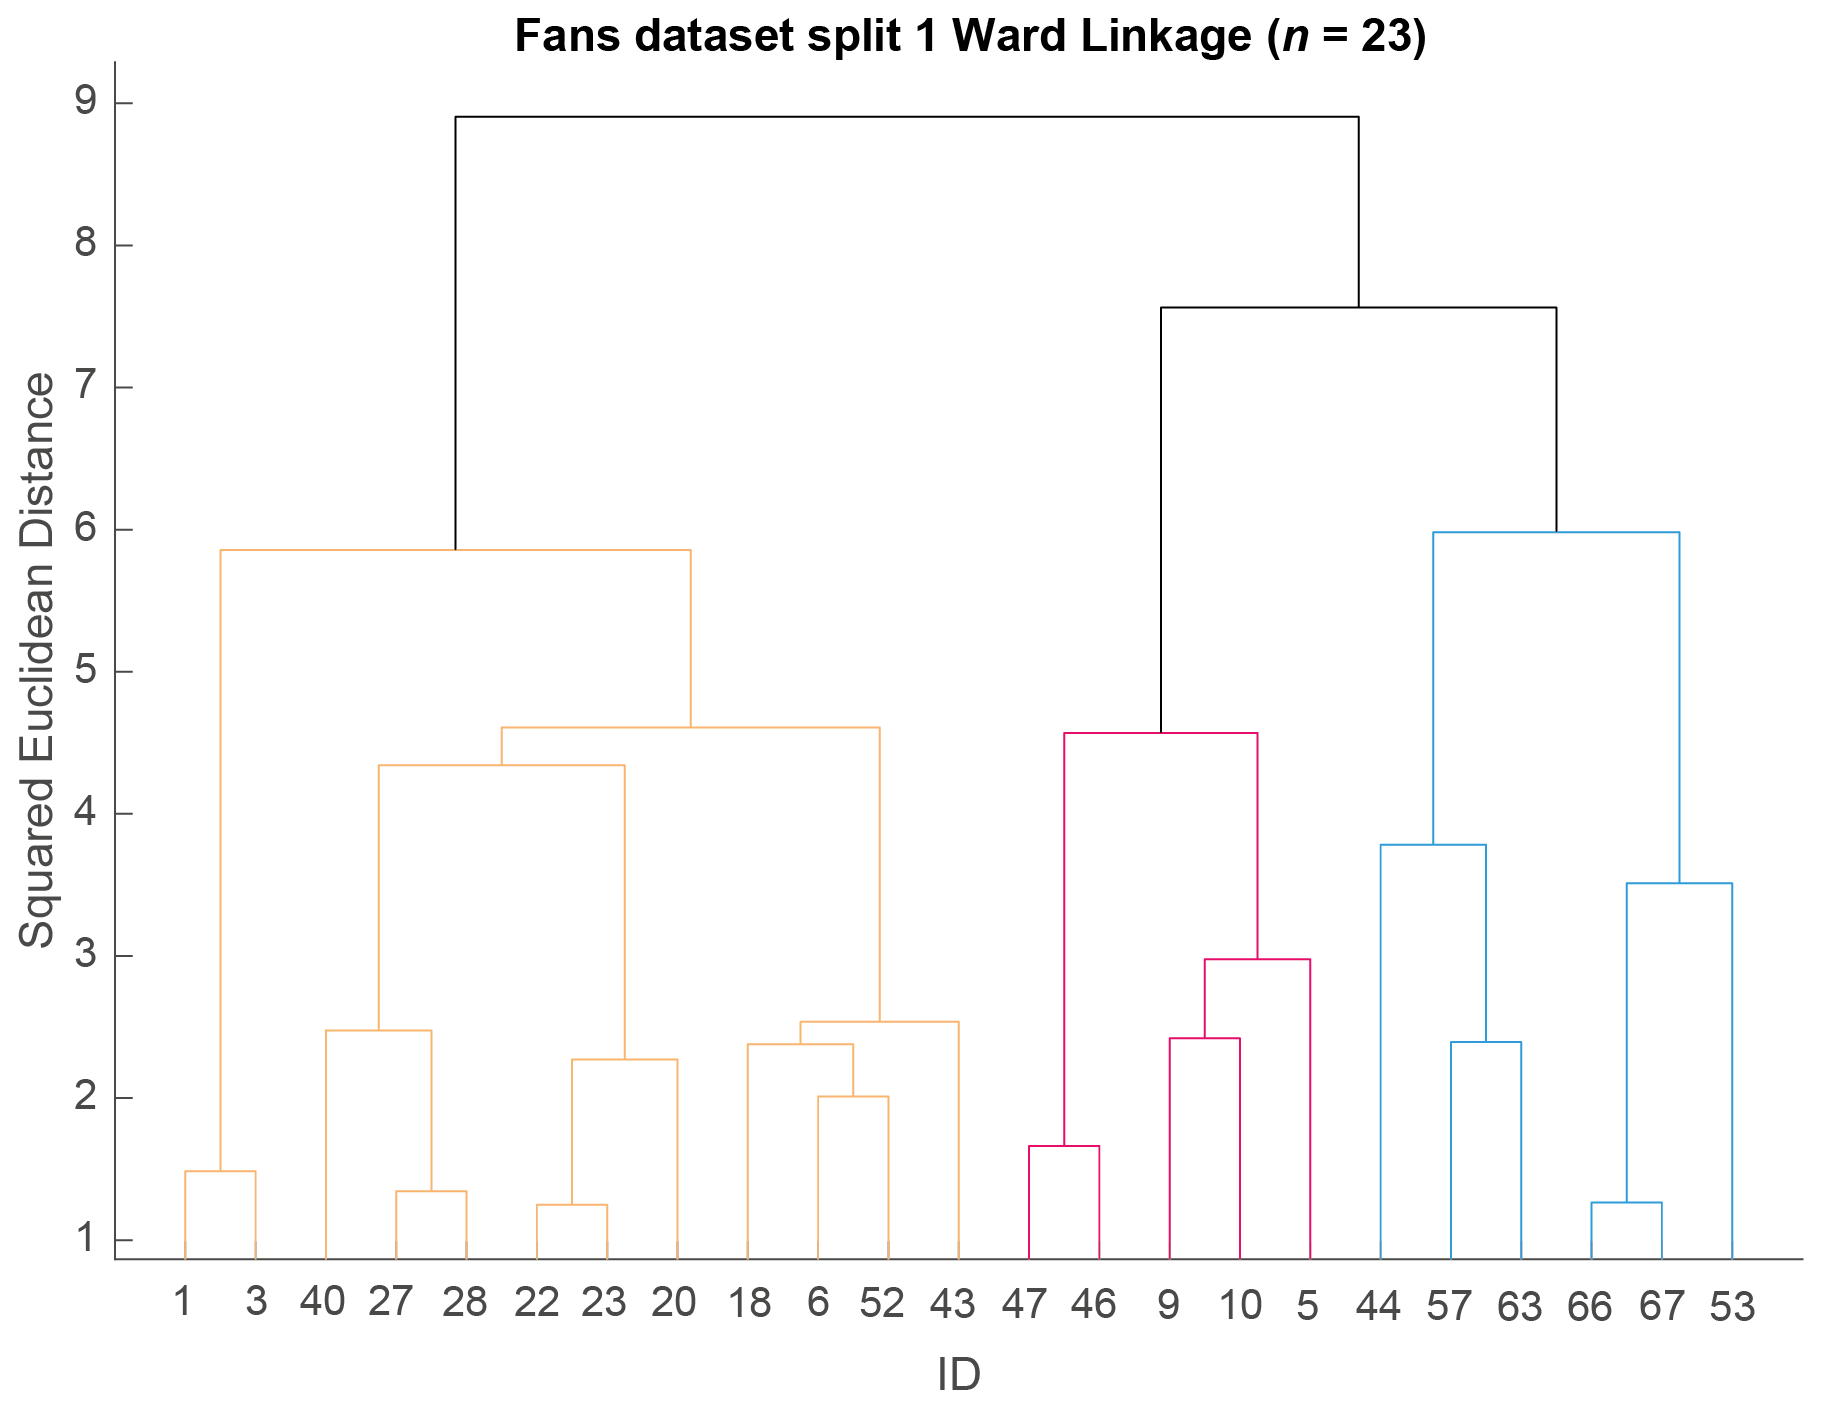
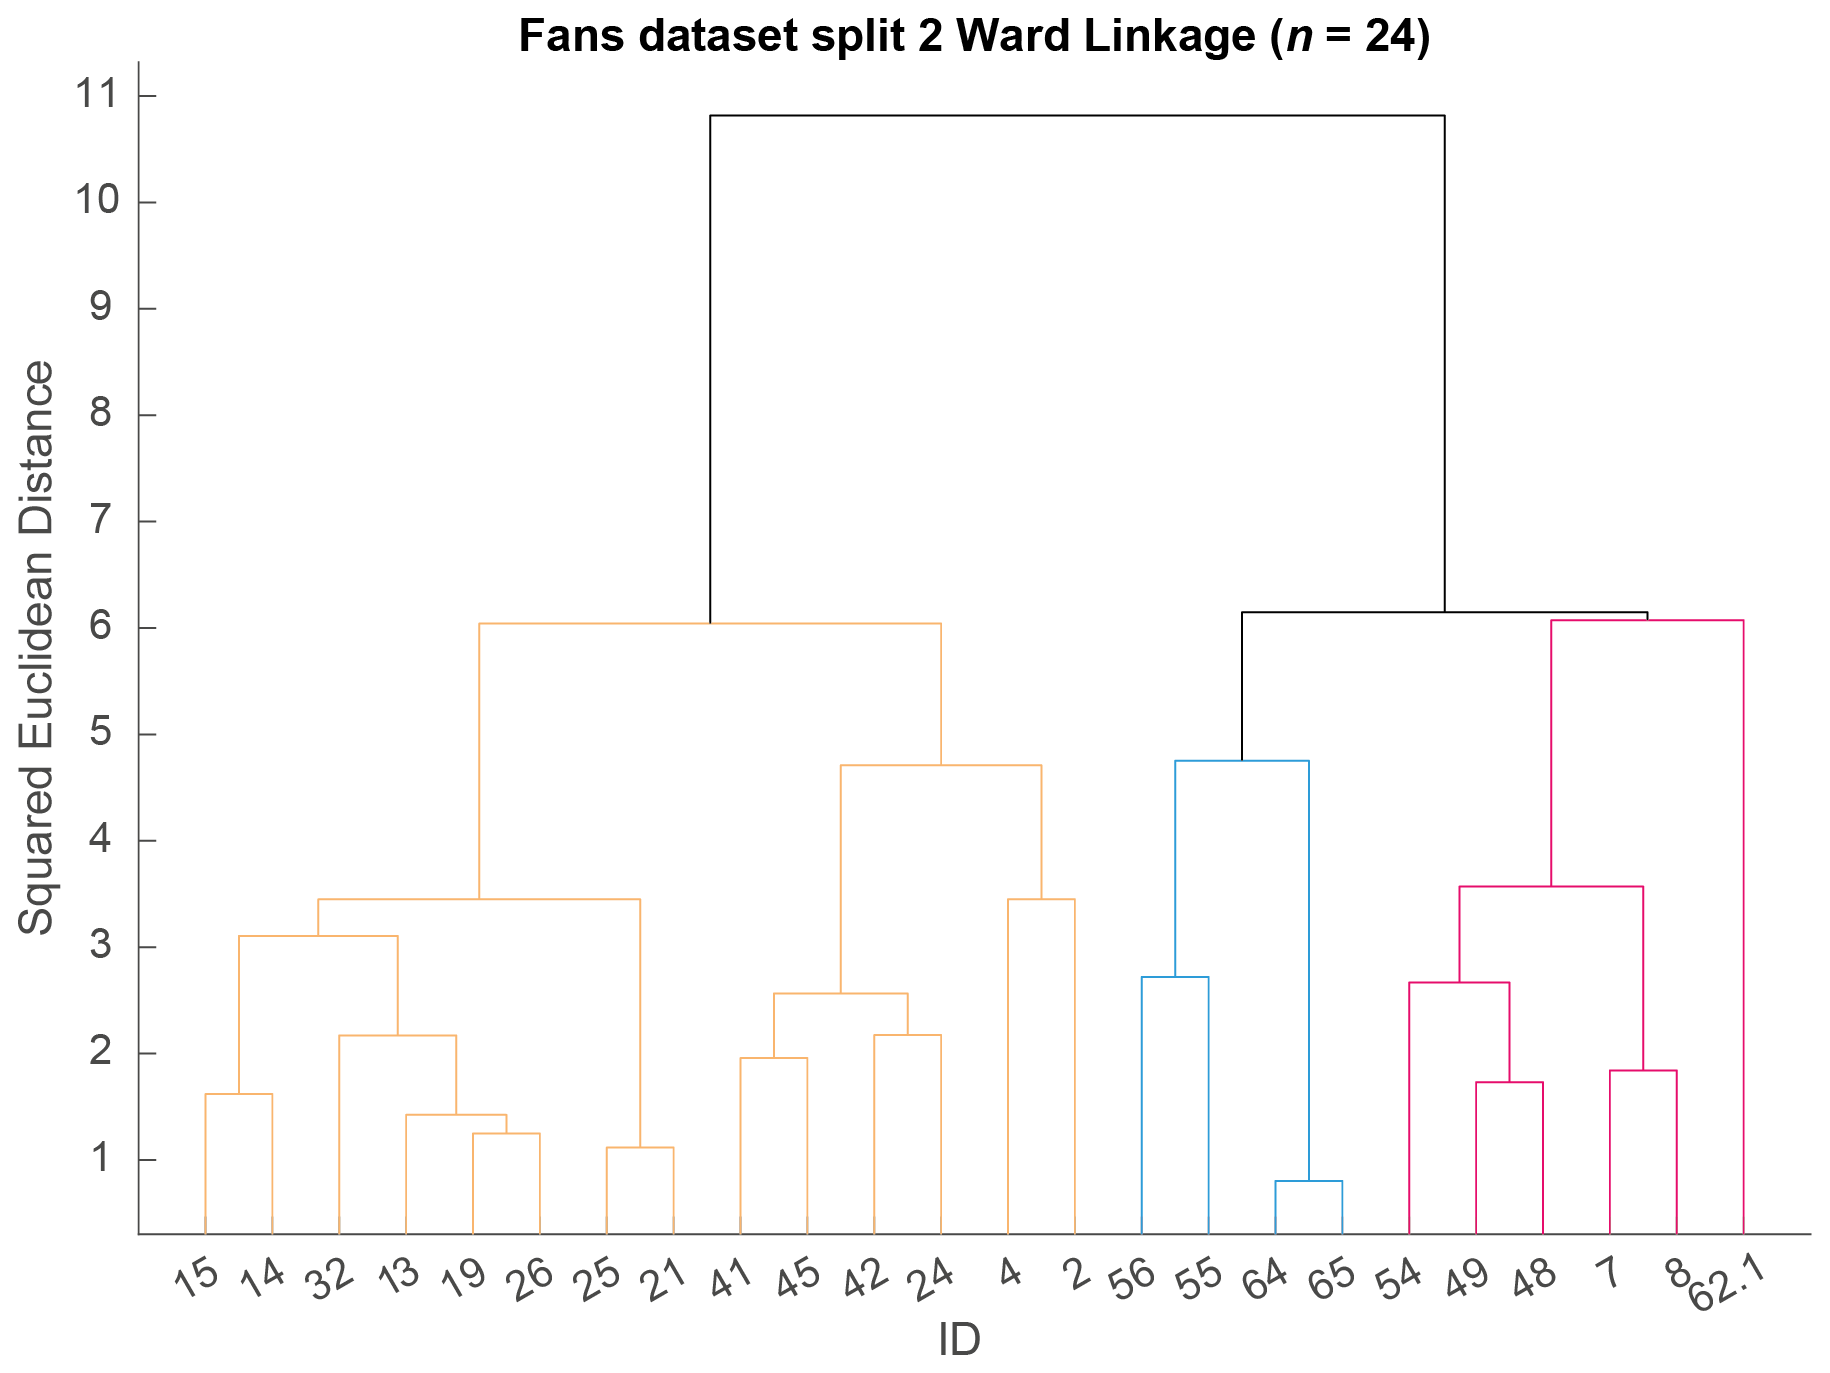
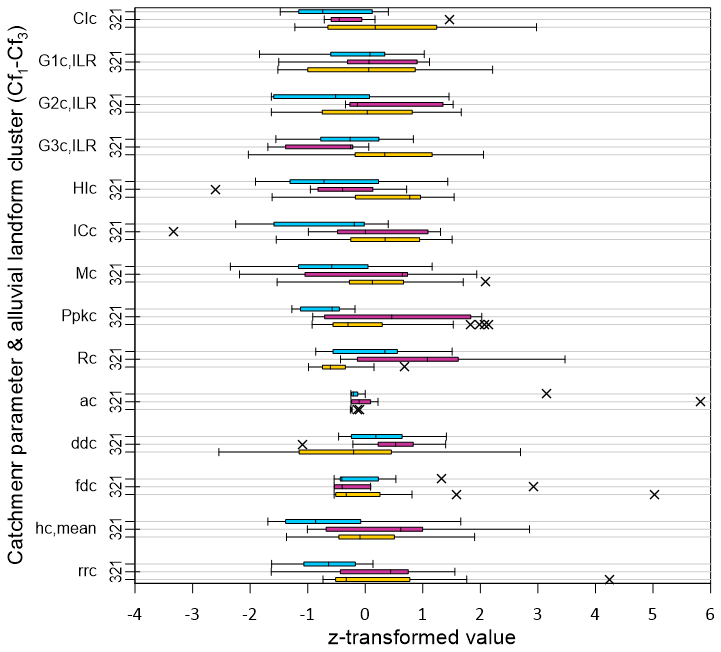
Figure C9Boxplots showing the median, 25 % and 75 % quartiles, 1.54× interquartile range and outliers (indicated by crosses) for the catchment variables, grouped by fan variable clustering. Z-transformed data as used for the clustering is shown to account for the different scales of the individual variables.
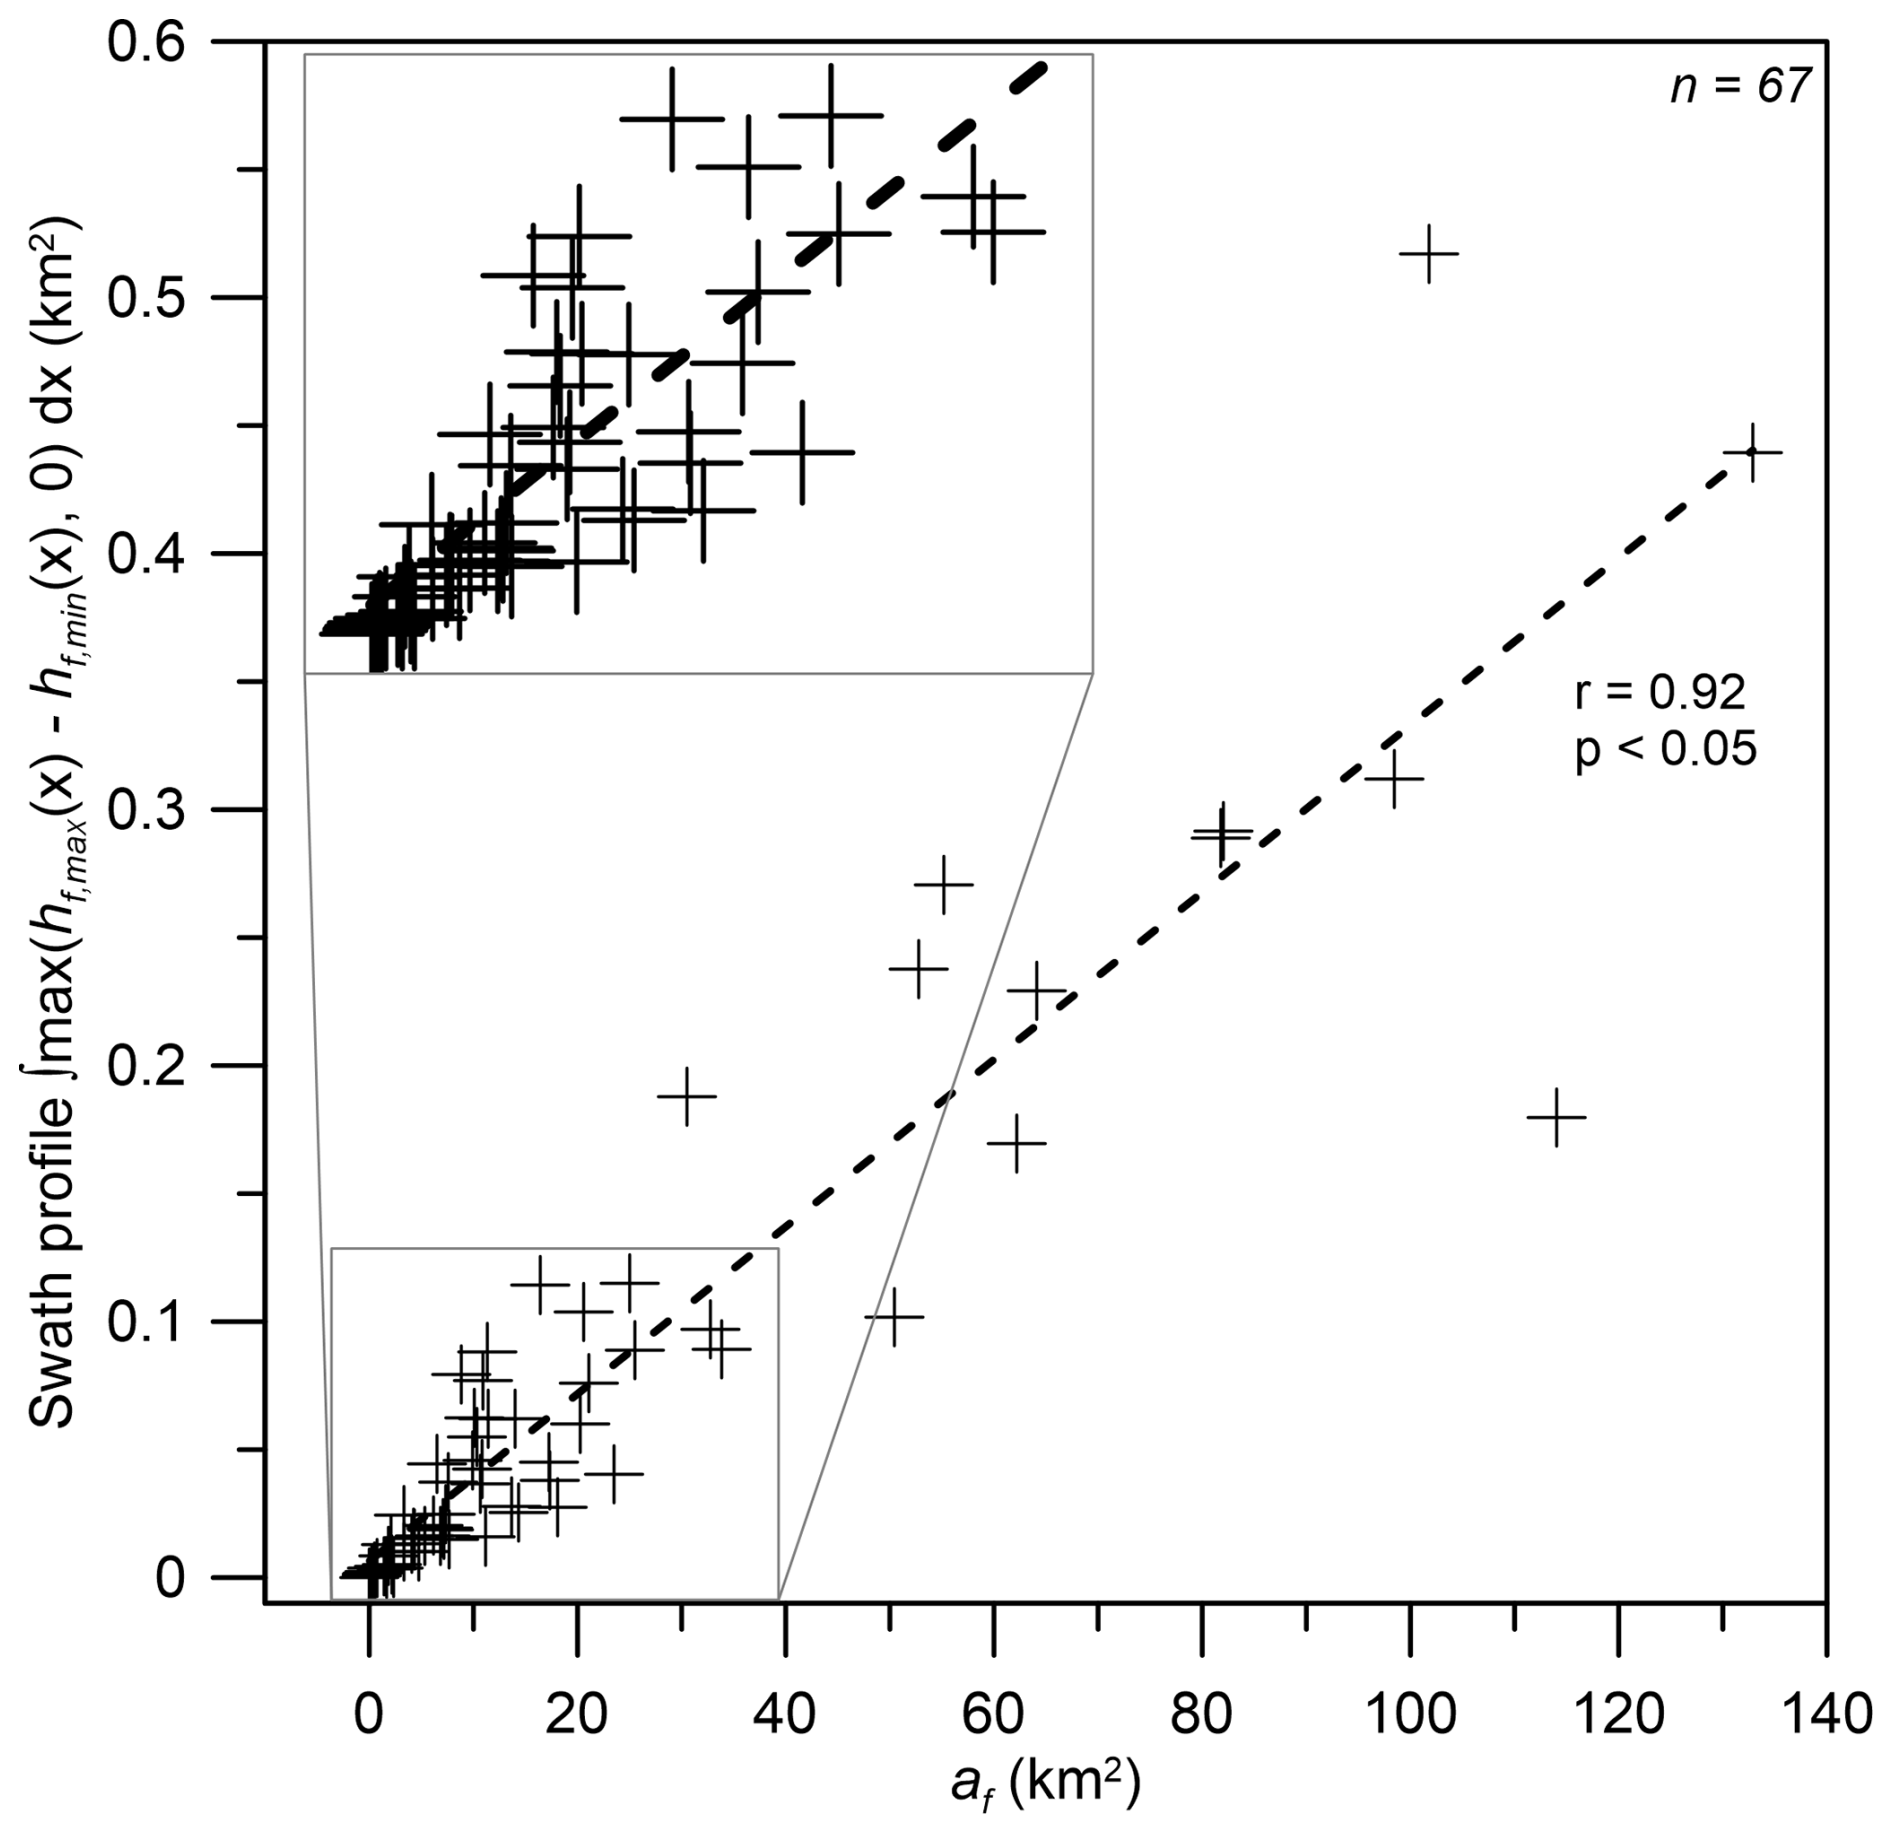
Figure C10Relationship between fan area af and the area between the minimum and maximum (90th percentile) swath profile line. The area represents the integral of the positive part of the elevation difference (calculated in Matlab ver. R2024a using the trapz function on densely gridded, interpolated data points). A similar linear relationship is obtained for the fan dataset (n = 52, r = 0.91).
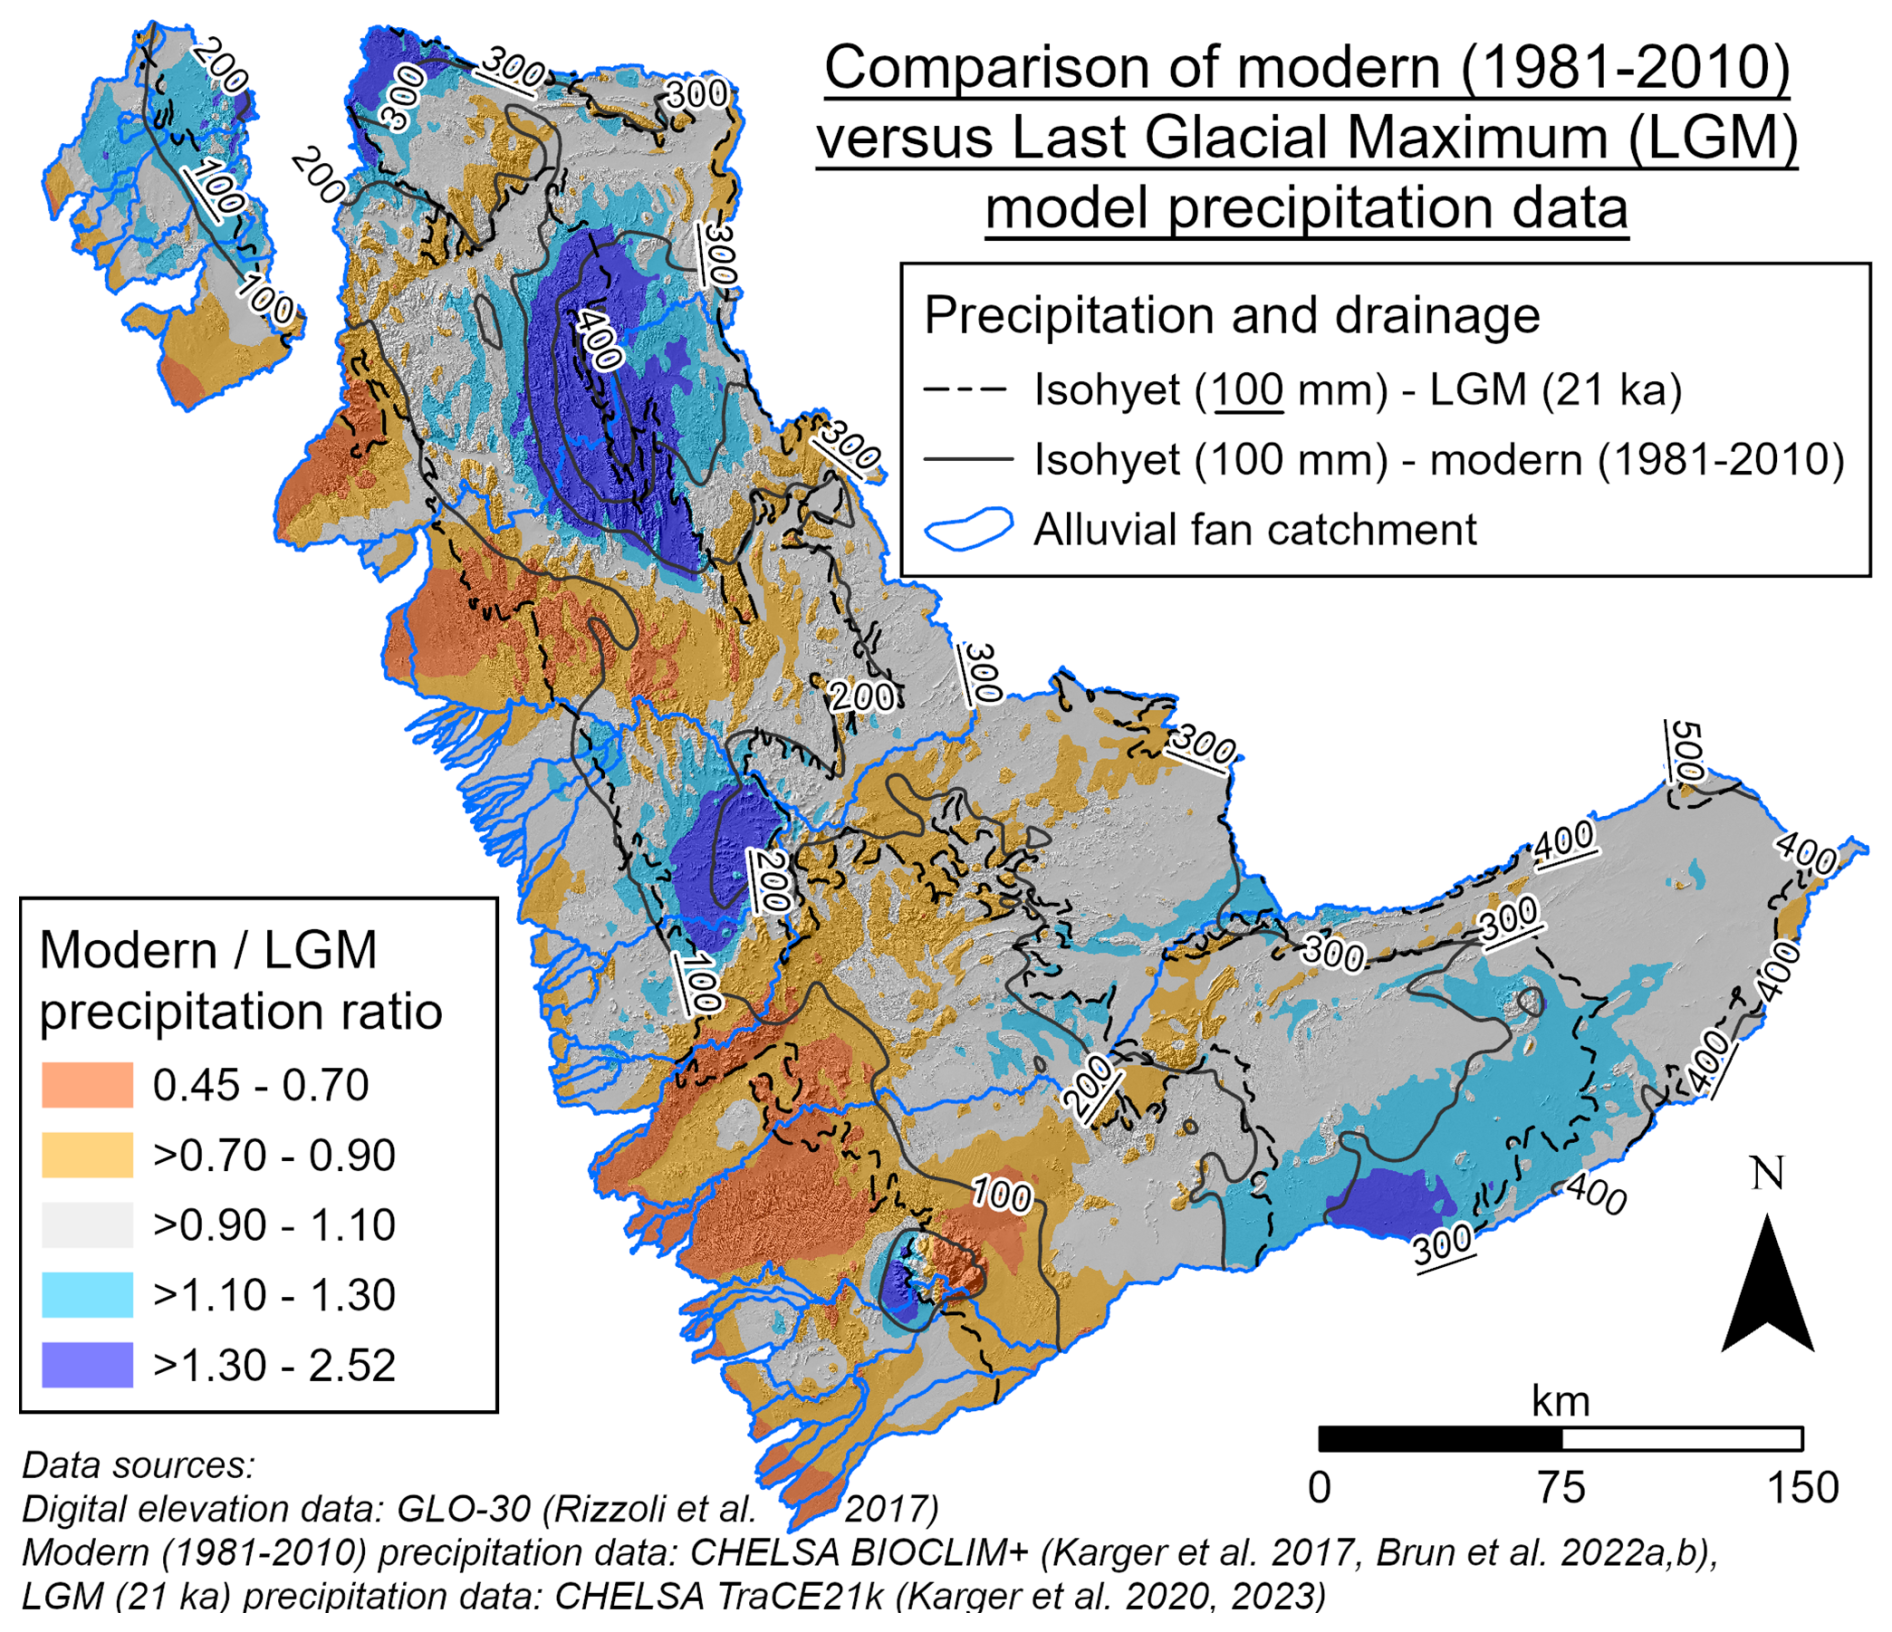
Figure C11Comparison of modern (1981-2010) versus LGM model precipitation data (Brun et al., 2022b, a; Karger et al., 2017, 2023, 2020). Ratios calculated from the datasets indicate drier modern conditions close to the present-day coastline, while more humid present-day conditions are predominantly located in elevated and hinterland areas. The coast-parallel precipitation gradient appears in both model datasets. The bundle of 21 ka 100 mm isohyet contours was thinned out by removing isolated and closed contours related to topographical noise.
All relevant data generated in this study are accessible through the tables provided in the manuscript and Appendix B. Matlab, Python and/or Excel workflows can be made available upon request.
Conceptualisation – FL, JW; Formal analysis – JM, WR; Funding acquisition – FL, JW; Investigation – JM, JW, JK, WR; Methodology – JM, WR, JW, FL; Project administration – FL, JM, JW; Resources – FL, AN; Validation – WR, AN; Visualisation – JM; Writing (original draft preparation) – JM, JK; Writing (review and editing) – JM, JW, WR, JK, AN.
The contact author has declared that none of the authors has any competing interests.
Publisher's note: Copernicus Publications remains neutral with regard to jurisdictional claims made in the text, published maps, institutional affiliations, or any other geographical representation in this paper. The authors bear the ultimate responsibility for providing appropriate place names. Views expressed in the text are those of the authors and do not necessarily reflect the views of the publisher.
We gratefully thank Hendrik Andersen from the Karlsruhe Institute of Technology for providing low cloud cover data of the Skeleton Coast in raw format. Viktor Schaubert and Antonia Gärtner from the RWTH Aachen University are thanked for their help in GIS-related work. Paulina Pokolo, Andreas Nduutepo, Sam-Peter Shuuya from the GSN and Skeleton Coast Ranger Gift provided invaluable support during our fieldwork in Namibia. Georg Stauch contributed important guidance on using Sentinel-2 data for fan surface analysis. We further thank Amanda Wild for noting some typos in the preprint version of this publication. This research was conducted as part of CRC 1211 “Earth – Evolution at the Dry Limit”, subproject C2 “Transport and deposition: Deciphering the evolution of the alluvial fans between 21° S and 25° S – the interplay between climatic and tectonic control”, funded by the Deutsche Forschungsgemeinschaft (DFG, German Research Foundation).
This research has been supported by the Deutsche Forschungsgemeinschaft (grant no. 268236062 – SFB 1211).
This open-access publication was funded by the RWTH Aachen University.
This paper was edited by Kieran Dunne and reviewed by two anonymous referees.
Abrams, M., Crippen, R., and Fujisada, H.: ASTER Global Digital Elevation Model (GDEM) and ASTER Global Water Body Dataset (ASTWBD), Remote Sensing, 12, https://doi.org/10.3390/rs12071156, 2020.
Allen, P. A.: Time scales of tectonic landscapes and their sediment routing systems, Geological Society, London, Special Publications, 296, 7–28, https://doi.org/10.1144/sp296.2, 2008.
Andersen, H. and Cermak, J.: First fully diurnal fog and low cloud satellite detection reveals life cycle in the Namib, Atmos. Meas. Tech., 11, 5461–5470, https://doi.org/10.5194/amt-11-5461-2018, 2018.
Andersen, H., Cermak, J., Solodovnik, I., Lelli, L., and Vogt, R.: Spatiotemporal dynamics of fog and low clouds in the Namib unveiled with ground- and space-based observations, Atmos. Chem. Phys., 19, 4383–4392, https://doi.org/10.5194/acp-19-4383-2019, 2019.
Arboleda-Zapata, M., Guillemoteau, J., Lucía, A., Eberle, J., Tronicke, J., and Korup, O.: Tracing past extreme floods on an alluvial fan using geophysical surveying, Earth Surf. Proc. Land., 48, 3273–3286, https://doi.org/10.1002/esp.5695, 2023.
Backhaus, K., Erichson, B., Gensler, S., Weiber, R., and Weiber, T.: Clusteranalyse, in: Multivariate Analysemethoden: Eine anwendungsorientierte Einführung, Springer Fachmedien Wiesbaden, Wiesbaden, 495–581, https://doi.org/10.1007/978-3-658-47929-9_8, 2025a.
Backhaus, K., Erichson, B., Gensler, S., Weiber, R., and Weiber, T.: Einführung in die empirische Datenanalyse, in: Multivariate Analysemethoden: Eine anwendungsorientierte Einführung, Springer Fachmedien Wiesbaden, Wiesbaden, 1–61, https://doi.org/10.1007/978-3-658-47929-9_1, 2025b.
Bahrami, S.: Tectonic controls on the morphometry of alluvial fans around Danehkhoshk anticline, Zagros, Iran, Geomorphology, 180–181, 217–230, https://doi.org/10.1016/j.geomorph.2012.10.012, 2013a.
Bahrami, S.: Analyzing the drainage system anomaly of Zagros basins: Implications for active tectonics, Tectonophysics, 608, 914–928, https://doi.org/10.1016/j.tecto.2013.07.026, 2013b.
Bartz, M., Walk, J., Binnie, S., Brill, D., Stauch, G., Lehmkuhl, F., Hoffmeister, D., and Brückner, H.: Late Pleistocene alluvial fan evolution along the coastal Atacama Desert (N Chile), Global Planet. Change, 190, 103091, https://doi.org/10.1016/j.gloplacha.2019.103091, 2020a.
Bartz, M., Duval, M., Brill, D., Zander, A., King, G. E., Rhein, A., Walk, J., Stauch, G., Lehmkuhl, F., and Brückner, H.: Testing the potential of K-feldspar pIR-IRSL and quartz ESR for dating coastal alluvial fan complexes in arid environments, Quatern. Int., 556, https://doi.org/10.1016/j.quaint.2020.03.037, 2020b.
Bierman, P. R. and Caffee, M.: Slow Rates of Rock Surface Erosion and Sediment Production across the Namib Desert and Escarpment, Southern Africa, Am. J. Sci., 301, 326–358, https://doi.org/10.2475/ajs.301.4-5.326, 2001.
Blümel, W. D.: Wüsten, Wüsten, Ulmer, Stuttgart, Deutschland, 327 pp., https://doi.org/10.36198/9783838538822, 2013.
Blümel, W. D., Hüser, K., and Eitel, B.: Uniab-Schwemmfächer und Skelettküsten-Erg : Zusammenspiel von äolischer und fluvialer Dynamik in der nördlichen Namib, in: Beiträge zur Quartärforschung, Regensburger Geographische Schriften, 37–55, ISBN: 3-88246-214-0, 2000.
Bowman, D.: Definitions and Setting, in: Principles of Alluvial Fan Morphology, Springer Netherlands, Dordrecht, 1–11, https://doi.org/10.1007/978-94-024-1558-2_1, 2019a.
Bowman, D.: Fan Morphometry, in: Principles of Alluvial Fan Morphology, Springer Netherlands, Dordrecht, 37–42, https://doi.org/10.1007/978-94-024-1558-2_4, 2019b.
Bowman, D.: The Climatic Control, in: Principles of Alluvial Fan Morphology, Springer Netherlands, Dordrecht, 91–96, https://doi.org/10.1007/978-94-024-1558-2_12, 2019c.
Bowman, D.: Slope Gradients, in: Principles of Alluvial Fan Morphology, Springer Netherlands, Dordrecht, 25–35, https://doi.org/10.1007/978-94-024-1558-2_3, 2019d.
Brun, P., Zimmermann, N. E., Hari, C., Pellissier, L., and Karger, D. N.: CHELSA-BIOCLIM+ A novel set of global climate-related predictors at kilometre-resolution, EnviDat [data set], https://doi.org/10.16904/envidat.332, 2022a.
Brun, P., Zimmermann, N. E., Hari, C., Pellissier, L., and Karger, D. N.: Global climate-related predictors at kilometer resolution for the past and future, Earth Syst. Sci. Data, 14, 5573–5603, https://doi.org/10.5194/essd-14-5573-2022, 2022b.
Bull, W. B.: Geomorphology of segmented alluvial fans in Western Fresno County, California, Geol. Surv. Prof. Pap., 352, 89–128, https://doi.org/10.3133/pp352E, 1964.
Bull, W. B.: The alluvial-fan environment, Prog. Phys. Geog., 1, 222–270, https://doi.org/10.1177/030913337700100202, 1977.
Caliński, T. and Harabasz, J.: A dendrite method for cluster analysis, Commun. Stat., 3, 1–27, https://doi.org/10.1080/03610927408827101, 1974.
Chen, D., Wei, J., Wang, W., Shi, W., Li, H., and Zhan, X.: Comparison of Methods for Determining the Thresholds of Geochemical Anomalies and the Prospecting Direction – A Case of Gold Deposits in the Gouli Exploration Area, Qinghai Province, Minerals, 9, https://doi.org/10.3390/min9060368, 2019.
Church, M. and Mark, D. M.: On size and scale in geomorphology, Progress in Physical Geography: Earth and Environment, 4, 342–390, 10.1177/030913338000400302, 1980.
Cleff, T.: Cluster Analysis, in: Applied Statistics and Multivariate Data Analysis for Business and Economics: A Modern Approach Using SPSS, Stata, and Excel, edited by: Cleff, T., Springer International Publishing, Cham, 407–431, https://doi.org/10.1007/978-3-030-17767-6_12, 2019.
Collins, D. B. G. and Bras, R. L.: Climatic and ecological controls of equilibrium drainage density, relief, and channel concavity in dry lands, Water Resour. Res., 46, https://doi.org/10.1029/2009wr008615, 2010.
Crema, S. and Cavalli, M.: SedInConnect: a stand-alone, free and open source tool for the assessment of sediment connectivity, Comput. Geosci., 111, 39–45, https://doi.org/10.1016/j.cageo.2017.10.009, 2018.
Crosta, G. B. and Frattini, P.: Controls on modern alluvial fan processes in the central Alps, northern Italy, Earth Surf. Proc. Land., 29, 267–293, https://doi.org/10.1002/esp.1009, 2004.
Crosta, G. B., Hermanns, R., Frattini, P., Valbuzzi, E., and Valagussa, A.: Large Slope Instabilities in Northern Chile: Inventory, Characterization and Possible Triggers, World Landslide Forum 3, Cham, 175–181, https://doi.org/10.1007/978-3-319-04996-0_28, 2014.
D'Arcy, M., Whittaker, A. C., Roda-Boluda, D. C., and Bristow, C.: Measuring alluvial fan sensitivity to past climate changes using a self-similarity approach to grain-size fining, Death Valley, California, Sedimentology, 64, 388–424, https://doi.org/10.1111/sed.12308, 2016.
D'Arcy, M., Mason, P. J., Roda-Boluda, D. C., Whittaker, A. C., Lewis, J. M. T., and Najorka, J.: Alluvial fan surface ages recorded by Landsat-8 imagery in Owens Valley, California, Remote Sens. Environ., 216, 401–414, https://doi.org/10.1016/j.rse.2018.07.013, 2018.
D'Arcy, M. K., Schildgen, T. F., Turowski, J. M., and DiNezio, P.: Inferring the timing of abandonment of aggraded alluvial surfaces dated with cosmogenic nuclides, Earth Surf. Dynam., 7, 755–771, https://doi.org/10.5194/esurf-7-755-2019, 2019.
D'Arcy, M. K., Schildgen, T. F., Bonnet, S., Duesing, W., Tofelde, S., Roda-Boluda, D. C., Wittmann, H., Mey, J., Murray, A. S., Alonso, R. N., and Strecker, M. R.: A 300 kyr record of past hydroclimate change from alluvial fans in the southern Central Andes, Earth Surf. Proc. Land., 50, https://doi.org/10.1002/esp.70006, 2025.
Dilts, T. E.: Flow Accumulation for Both Positive and Negative Values Toolbox for ArcGIS 10.1, University of Nevada Reno, http://www.arcgis.com/home/item.html?id=40d33968c44e4c9395c9c1ff1edd2bbe (last access: 31 July 2025), 2015.
Dupont, L. M., Donner, B., Vidal, L., Pérez, E. M., and Wefer, G.: Linking desert evolution and coastal upwelling: Pliocene climate change in Namibia, Geology, 33, 461–464, https://doi.org/10.1130/g21401.1, 2005.
Earls, J. and Dixon, B.: Spatial Interpolation of Rainfall Data Using ArcGIS: A Comparative Study, Proceedings of the 27th Annual ESRI International User Conference, 01/01, 1–9, https://proceedings.esri.com/library/userconf/proc07/papers/papers/pap_1451.pdf (last access: 7 April 2025), 2007.
Eckardt, F. D. and Spiro, B.: The origin of sulphur in gypsum and dissolved sulphate in the Central Namib Desert, Namibia, Sediment. Geol., 123, 255–273, https://doi.org/10.1016/S0037-0738(98)00137-7, 1999.
Egozcue, J. J., Pawlowsky-Glahn, V., Mateu-Figueras, G., and Barceló-Vidal, C.: Isometric Logratio Transformations for Compositional Data Analysis, Math. Geol., 35, 279–300, https://doi.org/10.1023/A:1023818214614, 2003.
Eitel, B., Kadereit, A., Blümel, W. D., Hüser, K., and Kromer, B.: The Amspoort Silts, northern Namib desert (Namibia): formation, age and palaeoclimatic evidence of river-end deposits, Geomorphology, 64, 299–314, https://doi.org/10.1016/j.geomorph.2004.07.006, 2005.
Erb, I.: Partial correlations in compositional data analysis, Applied Computing and Geosciences, 6, https://doi.org/10.1016/j.acags.2020.100026, 2020.
Farr, T. G., Rosen, P. A., Caro, E., Crippen, R., Duren, R., Hensley, S., Kobrick, M., Paller, M., Rodriguez, E., Roth, L., Seal, D., Shaffer, S., Shimada, J., Umland, J., Werner, M., Oskin, M., Burbank, D., and Alsdorf, D.: The Shuttle Radar Topography Mission, Rev. Geophys., 45, https://doi.org/10.1029/2005rg000183, 2007.
Franke, D., Hornung, J., Hinderer, M., and Mountney, N.: A combined study of radar facies, lithofacies and three-dimensional architecture of an alpine alluvial fan (Illgraben fan, Switzerland), Sedimentology, 62, 57–86, https://doi.org/10.1111/sed.12139, 2014.
Frankel, K. L. and Dolan, J. F.: Characterizing arid region alluvial fan surface roughness with airborne laser swath mapping digital topographic data, J. Geophys. Res.-Earth, 112, https://doi.org/10.1029/2006jf000644, 2007.
Fryirs, K. A. and Brierley, G. J.: Geomorphic Analysis of River Systems: An Approach to Reading the Landscape, John Wiley & Sons, Chichester, UK, https://doi.org/10.1002/9781118305454, 2012.
Gao, H., Liu, F., Yan, T., Qin, L., and Li, Z.: Drainage Density and Its Controlling Factors on the Eastern Margin of the Qinghai–Tibet Plateau, Frontiers in Earth Science, 9, https://doi.org/10.3389/feart.2021.755197, 2022.
Gay, A., Cerdan, O., Mardhel, V., and Desmet, M.: Application of an index of sediment connectivity in a lowland area, J. Soil. Sediment., 16, 280–293, https://doi.org/10.1007/s11368-015-1235-y, 2015.
Geological Survey of Namibia (GSN): Geological Map of Area 2114 Omaruru. Scale 1:250.000, Geological Survey of Namibia, Windhoek, OCLC 58696362, 1996.
Geological Survey of Namibia (GSN): Geological Map of Area 1912 Sesfontein. Scale 1:250.000, Geological Survey of Namibia, Windhoek, 1998.
Geological Survey of Namibia (GSN): Geological Map of Area 2016 Otjiwarongo. Scale 1:250.000, Geological Survey of Namibia, Windhoek, 2002a.
Geological Survey of Namibia (GSN): Geological Map of Area 1712 Swartbooisdrif. Scale 1:250.000, Geological Survey of Namibia, Windhoek, 2002b.
Geological Survey of Namibia (GSN): Geological Map of Area 2014 Fransfontein. Scale 1:250.000, Geological Survey of Namibia, Windhoek, 2006a.
Geological Survey of Namibia (GSN): Geological Map of Area 2116 Okahandja. Scale 1:250.000, Geological Survey of Namibia, Windhoek, 2006b.
Geological Survey of Namibia (GSN): Geological Map of Area 1914 Tsumeb. Scale 1:250.000, Geological Survey of Namibia, Windhoek, 2008.
Geological Survey of Namibia (GSN): Geological Map of Area 1914 Kamanjab. Scale 1:250.000, Geological Survey of Namibia, Windhoek, 2009.
Geological Survey of Namibia (GSN): Geological Map of Area 2013 Cape Cross. Scale 1:250.000, Geological Survey of Namibia, Windhoek, 2010a.
Geological Survey of Namibia (GSN): Geological Map of Area 1814 Etosha West. Scale 1:250.000, Geological Survey of Namibia, Windhoek, 2010b.
Geological Survey of Namibia (GSN): Geological Map of Area 1714 Oshakati. Scale 1:250.000, Geological Survey of Namibia, Windhoek, 2011a.
Geological Survey of Namibia (GSN): Geological Map of Area 1812 Opuwo. Scale 1:250.000, Geological Survey of Namibia, Windhoek, 2011b.
Geppert, M., Hartmann, K., Kirchner, I., Pfahl, S., Struck, U., and Riedel, F.: Precipitation Over Southern Africa: Moisture Sources and Isotopic Composition, J. Geophys. Res.-Atmos., 127, https://doi.org/10.1029/2022jd037005, 2022.
Gere, A.: Recommendations for validating hierarchical clustering in consumer sensory projects, Curr. Res. Food Sci., 6, 100522, https://doi.org/10.1016/j.crfs.2023.100522, 2023.
Ghahraman, K. and Nagy, B.: Tectonic controls on the morphometry of alluvial fans in an arid region, northeast Iran, Phys. Geogr., 45, 581–604, https://doi.org/10.1080/02723646.2024.2370653, 2024.
Gingele, F. X.: Holocene climatic optimum in Southwest Africa—evidence from the marine clay mineral record, Palaeogeogr. Palaeocl., 122, 77–87, https://doi.org/10.1016/0031-0182(96)00076-4, 1996.
Goudie, A. and Viles, H.: The Etendeka Plateau, in: Landscapes and Landforms of Namibia, Springer Netherlands, Dordrecht, 73–75, https://doi.org/10.1007/978-94-017-8020-9_9, 2015a.
Goudie, A. and Viles, H.: Climate, in: Landscapes and Landforms of Namibia, Springer Netherlands, Dordrecht, 37–46, https://doi.org/10.1007/978-94-017-8020-9_3, 2015b.
Goudie, A. and Viles, H.: Salt Weathering in the Namib: Soutrivier and the Coastal Salt Pans, in: Landscapes and Landforms of Namibia, Springer Netherlands, Dordrecht, 97–101, https://doi.org/10.1007/978-94-017-8020-9_13, 2015c.
Goudie, A. and Viles, H.: Geology, in: Landscapes and Landforms of Namibia, Springer Netherlands, Dordrecht, 27–35, https://doi.org/10.1007/978-94-017-8020-9_2, 2015d.
Goudie, A. and Viles, H.: Landscapes, in: Landscapes and Landforms of Namibia, Springer Netherlands, Dordrecht, 3–25, https://doi.org/10.1007/978-94-017-8020-9_1, 2015e.
Gupta, R. P.: Interpretation of SAR Imagery, in: Remote Sensing Geology, Springer Berlin Heidelberg, Berlin, Heidelberg, 235–252, https://doi.org/10.1007/978-3-662-55876-8_16, 2018.
Hack, J. T.: Studies of longitudinal stream profiles in Virginia and Maryland, U.S. Geological Survey Professional Paper, Report 294B, https://doi.org/10.3133/pp294B, 1957.
Harrison, M. S. J.: A generalized classification of South African summer rain-bearing synoptic systems, J. Climatol., 4, 547–560, https://doi.org/10.1002/joc.3370040510, 1984.
Hart, N. C. G., Reason, C. J. C., and Fauchereau, N.: Tropical–Extratropical Interactions over Southern Africa: Three Cases of Heavy Summer Season Rainfall, Mon. Weather Rev., 138, 2608–2623, https://doi.org/10.1175/2010mwr3070.1, 2010.
Harvey, A. M.: The Role of Alluvial Fans in the Mountain Fluvial Systems of Southeast Spain: Implications of Climatic Change, Earth Surf. Proc. Land., 21, 543–553, https://doi.org/10.1002/(SICI)1096-9837(199606)21:6<543::AID-ESP641>3.0.CO;2-F, 1996.
Harvey, A. M.: Differential effects of base-level, tectonic setting and climatic change on Quaternary alluvial fans in the northern Great Basin, Nevada, USA, in: Alluvial Fans: Geomorphology, Sedimentology, Dynamics, edited by: Harvey, A. M., Mather, A. E., and Stokes, M., Geological Society of London, https://doi.org/10.1144/gsl.Sp.2005.251.01.09, 2005.
Harvey, A. M.: The coupling status of alluvial fans and debris cones: a review and synthesis, Earth Surf. Proc. Land., 37, 64–76, https://doi.org/10.1002/esp.2213, 2011.
Harvey, A. M., Wigand, P. E., and Wells, S. G.: Response of alluvial fan systems to the late Pleistocene to Holocene climatic transition: contrasts between the margins of pluvial Lakes Lahontan and Mojave, Nevada and California, USA, CATENA, 36, 255–281, https://doi.org/10.1016/S0341-8162(99)00049-1, 1999a.
Harvey, A. M., Silva, P. G., Mather, A. E., Goy, J. L., Stokes, M., and Zazo, C.: The impact of Quaternary sea-level and climatic change on coastal alluvial fans in the Cabo de Gata ranges, southeast Spain, Geomorphology, 28, 1–22, https://doi.org/10.1016/S0169-555X(98)00100-7, 1999b.
Harvey, A. M., Foster, G., Hannam, J., and Mather, A. E.: The Tabernas alluvial fan and lake system, southeast Spain: applications of mineral magnetic and pedogenic iron oxide analyses towards clarifying the Quaternary sediment sequences, Geomorphology, 50, 151–171, https://doi.org/10.1016/S0169-555X(02)00212-X, 2003.
Heine, K.: Climate change over the past 135,000 years in the Namib Desert (Namibia) derived from proxy data, Palaeoeco. A., 25, 171–198, 1998.
Heine, K.: Flood reconstructions in the Namib Desert, Namibia and Little Ice Age climatic implications: Evidence from slackwater deposits and desert soil sequences, J. Geol. Soc. India, 64, 535–548, 2004.
Hemp, A. and Hemp, J.: Weather or not-Global climate databases: Reliable on tropical mountains?, PLoS One, 19, e0299363, https://doi.org/10.1371/journal.pone.0299363, 2024.
Höhle, J. and Höhle, M.: Accuracy assessment of digital elevation models by means of robust statistical methods, ISPRS J. Photogramm., 64, 398–406, https://doi.org/10.1016/j.isprsjprs.2009.02.003, 2009.
Horton, R. E.: Drainage-basin characteristics, Transactions, American Geophysical Union, 13, 350–361, 1932.”
Howard, A. D.: Badland Morphology and Evolution: Interpretation Using a Simulation Model, Earth Surf. Proc. Land., 22, 211–227, https://doi.org/10.1002/(sici)1096-9837(199703)22:3<211::aid-esp749>3.0.co;2-e, 1997.
Jackson Jr., L. E., Kostaschuk, R. A., and MacDonald, G. M.: Identification of debris flow hazard on alluvial fans in the Canadian Rocky Mountains, in: Debris Flows/Avalanches: Process, Recognition, and Mitigation, edited by: Costa, J. E. and Wieczorek, G. F., Geological Society of America, https://doi.org/10.1130/REG7-p115, 1987.
Jacobsen, P., Jacobsen, K., and Seely, M.: Ephemeral Rivers and their catchments, Desert Research Foundation of Namibia, Windhoek, Windhoek, ISBN 99916-709-4-7, 1995.
Karger, D. N., Nobis, M. P., Normand, S., Graham, C. H., and Zimmermann, N. E.: CHELSA-TraCE21k: Downscaled transient temperature and precipitation data since the last glacial maximum, EnviDat [data set], https://doi.org/10.16904/envidat.211, 2020.
Karger, D. N., Nobis, M. P., Normand, S., Graham, C. H., and Zimmermann, N. E.: CHELSA-TraCE21k – high-resolution (1 km) downscaled transient temperature and precipitation data since the Last Glacial Maximum, Clim. Past, 19, 439–456, https://doi.org/10.5194/cp-19-439-2023, 2023.
Karger, D. N., Conrad, O., Böhner, J., Kawohl, T., Kreft, H., Soria-Auza, R. W., Zimmermann, N. E., Linder, H. P., and Kessler, M.: Climatologies at high resolution for the earth's land surface areas, Scientific Data, 4, 170122, https://doi.org/10.1038/sdata.2017.122, 2017.
Karymbalis, E., Ferentinou, M., Giles, P. T., Ventra, D., and Clarke, L. E.: Use of morphometric variables and self-organizing maps to identify clusters of alluvial fans and catchments in the north Peloponnese, Greece, in: Geology and Geomorphology of Alluvial and Fluvial Fans: Terrestrial and Planetary Perspectives, Geological Society of London, https://doi.org/10.1144/sp440.7, 2016.
Karymbalis, E., Ferentinou, M., Fubelli, G., Giles, P., Tsanakas, K., Valkanou, K., Batzakis, D.-V., and Karalis, S.: Classification of Trichonis Lake graben (Western Greece) alluvial fans and catchments using geomorphometry and artificial intelligence, Z. Geomorphol., 63, 295–312, https://doi.org/10.1127/zfg/2022/0748, 2022.
Kempf, J.: Morphotectonics and denudation in the landform history of the Namibian Great Escarpment landscapes, Z. Geomorphol., 54, 347–375, 2010.
Klopper, D., Formenti, P., Namwoonde, A., Cazaunau, M., Chevaillier, S., Feron, A., Gaimoz, C., Hease, P., Lahmidi, F., Mirande-Bret, C., Triquet, S., Zeng, Z., and Piketh, S. J.: Chemical composition and source apportionment of atmospheric aerosols on the Namibian coast, Atmos. Chem. Phys., 20, 15811–15833, https://doi.org/10.5194/acp-20-15811-2020, 2020.
Kramm, T. and Hoffmeister, D.: A Relief Dependent Evaluation of Digital Elevation Models on Different Scales for Northern Chile, ISPRS Int. J. Geo-Inf., 8, https://doi.org/10.3390/ijgi8100430, 2019.
Krapf, C.: Ephemeral river systems at the Skeleton Coast, NW-Namibia: Sedimentological and geomorphological studies on the braided river dominated Koigab Fan, the Cenozoic succession in the Uniabmond area and comparative studies on fluvio-aeolian interaction between ephemeral rivers and the Skeleton Coast Erg, Dissertation, Bayerische Julius-Maximilian-Universität Würzburg, 200 pp., urn:nbn:de:bvb:20-opus-6013, 2003.
Krapf, C. B. E., Stollhofen, H., and Stanistreet, I. G.: Contrasting styles of ephemeral river systems and their interaction with dunes of the Skeleton Coast erg (Namibia), Quatern. Int., 104, 41–52, https://doi.org/10.1016/s1040-6182(02)00134-9, 2003.
Krapf, C. B. E., Stanistreet, I. G., and Stollhofen, H.: Morphology and Fluvio-Aeolian Interaction of the Tropical Latitude, Ephemeral Braided-River Dominated Koigab Fan, North-West Namibia, in: Fluvial Sedimentology VII, edited by: Jarvis, I., Blum, M. D., Marriott, S. B., and Leclair, S. F., John Wiley & Sons, Ltd, 99–120, https://doi.org/10.1002/9781444304350.ch6, 2005.
Lancaster, J., Lancaster, N., and Seely, M. K.: Climate of the central Namib Desert, Madoqua, 14, 5–61, 1984.
Lancaster, N.: Dunes on the skeleton coast, Namibia (South West Africa): Geomorphology and grain size relationships, Earth Surf. Proc. Land., 7, 575–587, https://doi.org/10.1002/esp.3290070606, 1982.
Lehmkuhl, F. and Owen, L. A.: Alluvial fan types, distribution, and formation: a global perspective, Z. Geomorphol., 64, 95–142, https://doi.org/10.1127/zfg/2024/0826, 2024.
Leier, A. L., DeCelles, P. G., and Pelletier, J. D.: Mountains, monsoons, and megafans, Geology, 33, https://doi.org/10.1130/g21228.1, 2005.
Li, B., Wang, L., Kaseke, K. F., Vogt, R., Li, L., and K. Seely, M.: The impact of fog on soil moisture dynamics in the Namib Desert, Adv. Water Resour., 113, 23–29, https://doi.org/10.1016/j.advwatres.2018.01.004, 2018.
Lustig, L. K.: Clastic sedimentation in deep springs valley, California, US Government Printing Office, Washington D.C., Geological Survey Professional Paper 352-F, 131–192, 1965.
Macron, C., Pohl, B., Richard, Y., and Bessafi, M.: How do Tropical Temperate Troughs Form and Develop over Southern Africa?, J. Climate, 27, 1633–1647, https://doi.org/10.1175/jcli-d-13-00175.1, 2014.
Melton, M. A.: The Geomorphic and Paleoclimatic Significance of Alluvial Deposits in Southern Arizona, J. Geol., 73, 1–38, https://doi.org/10.1086/627044, 1965.
Mendelsohn, J., Jarvis, A., Roberts, C., and Robertson, T.: Atlas of Namibia. A portrait of the land and its people, 2, David Philip Publishers, ISBN-10: 192028916X; ISBN-13: 978-1920289164, 2003.
Miller, R. M.: The geology of Namibia: Volume 3 – Palaeozoic to Cenozoic, Ministry of Mines and Energy, Geological Survey, Windhoek, ISBN: 978-0-86976-733-7, 2008.
Miller, R. M., Krapf, C., Hoey, T., Fitchett, J., Nguno, A. K., Muyambas, R., Ndeutepo, A., Medialdea, A., Whitehead, A., and Stengel, I.: A sedimentological record of fluvial-aeolian interactions and climate variability in the hyperarid northern Namib Desert, Namibia, S. Afr. J. Geol., 124, 575–610, https://doi.org/10.25131/sajg.124.0008, 2021.
Miller, V. C.: A quantitative geomorphic study of drainage basin characteristics in the Clinch Mountain Area, Virginia and Tennessee, Department of Geology, Columbia University, New York, Contract N6 ONR 271-30, Technical Report 3, 1–30, 1953.
Mohren, J., Binnie, S. A., Ritter, B., and Dunai, T. J.: Development of a steep erosional gradient over a short distance in the hyperarid core of the Atacama Desert, northern Chile, Global Planet. Change, 184, 103068, https://doi.org/10.1016/j.gloplacha.2019.103068, 2020.
Molloy, I. and Stepinski, T. F.: Automatic mapping of valley networks on Mars, Comput. Geosci., 33, 728–738, https://doi.org/10.1016/j.cageo.2006.09.009, 2007.
Montgomery, D. C., Peck, E. A., and Vining, G. G.: Introduction to linear regression analysis, John Wiley & Sons, ISBN-10: 0470542810, ISBN-13: 978-0470542811, 2021.
Neumann, T. A., Martino, A. J., Markus, T., Bae, S., Bock, M. R., Brenner, A. C., Brunt, K. M., Cavanaugh, J., Fernandes, S. T., Hancock, D. W., Harbeck, K., Lee, J., Kurtz, N. T., Luers, P. J., Luthcke, S. B., Magruder, L., Pennington, T. A., Ramos-Izquierdo, L., Rebold, T., Skoog, J., and Thomas, T. C.: The Ice, Cloud, and Land Elevation Satellite - 2 Mission: A Global Geolocated Photon Product Derived From the Advanced Topographic Laser Altimeter System, Remote Sens. Environ., 233, https://doi.org/10.1016/j.rse.2019.111325, 2019.
Olivier, J.: Spatial distribution of fog in the Namib, J. Arid Environ., 29, 129–138, https://doi.org/10.1016/S0140-1963(05)80084-9, 1995.
Owen, L. A., Kamp, U., Spencer, J. Q., and Haserodt, K.: Timing and style of Late Quaternary glaciation in the eastern Hindu Kush, Chitral, northern Pakistan: a review and revision of the glacial chronology based on new optically stimulated luminescence dating, Quatern. Int., 97–98, 41–55, https://doi.org/10.1016/S1040-6182(02)00050-2, 2002.
Owen, L. A., Finkel, R. C., Haizhou, M., and Barnard, P. L.: Late Quaternary landscape evolution in the Kunlun Mountains and Qaidam Basin, Northern Tibet: A framework for examining the links between glaciation, lake level changes and alluvial fan formation, Quatern. Int., 154–155, 73–86, https://doi.org/10.1016/j.quaint.2006.02.008, 2006.
Owen, L. A., Frankel, K. L., Knott, J. R., Reynhout, S., Finkel, R. C., Dolan, J. F., and Lee, J.: Beryllium-10 terrestrial cosmogenic nuclide surface exposure dating of Quaternary landforms in Death Valley, Geomorphology, 125, 541–557, https://doi.org/10.1016/j.geomorph.2010.10.024, 2011.
Owen, L. A., Clemmens, S. J., Finkel, R. C., and Gray, H.: Late Quaternary alluvial fans at the eastern end of the San Bernardino Mountains, Southern California, Quaternary Sci. Rev., 87, 114–134, https://doi.org/10.1016/j.quascirev.2014.01.003, 2014.
Patton, P. C. and Baker, V. R.: Morphometry and floods in small drainage basins subject to diverse hydrogeomorphic controls, Water Resour. Res., 12, 941–952, https://doi.org/10.1029/WR012i005p00941, 1976.
Pike, R. J. and Wilson, S. E.: Elevation-Relief Ratio, Hypsometric Integral, and Geomorphic Area-Altitude Analysis, GSA Bulletin, 82, 1079–1084, https://doi.org/10.1130/0016-7606(1971)82[1079:ERHIAG]2.0.CO;2, 1971.
Pipaud, I. and Lehmkuhl, F.: Object-based delineation and classification of alluvial fans by application of mean-shift segmentation and support vector machines, Geomorphology, 293, 178–200, https://doi.org/10.1016/j.geomorph.2017.05.013, 2017.
Rech, J. A., Quade, J., and Hart, W. S.: Isotopic evidence for the source of Ca and S in soil gypsum, anhydrite and calcite in the Atacama Desert, Chile, Geochim. Cosmochim. Ac., 67, 575–586, https://doi.org/10.1016/S0016-7037(02)01175-4, 2003.
Rizzoli, P., Martone, M., Gonzalez, C., Wecklich, C., Borla Tridon, D., Bräutigam, B., Bachmann, M., Schulze, D., Fritz, T., Huber, M., Wessel, B., Krieger, G., Zink, M., and Moreira, A.: Generation and performance assessment of the global TanDEM-X digital elevation model, ISPRS J. Photogramm., 132, 119–139, https://doi.org/10.1016/j.isprsjprs.2017.08.008, 2017.
Ryder, J. M.: Some Aspects of the Morphometry of Paraglacial Alluvial Fans in South-central British Columbia, Can. J. Earth Sci., 8, 1252–1264, https://doi.org/10.1139/e71-114, 1971.
Saito, K.: Classification of alluvial fans in Tohoku district based on cluster analysis, Geographical Review of Japan, 53, 721–729, https://doi.org/10.4157/grj.53.721, 1980.
Santi Malnis, P. and Rothis, L. M.: Relationship Between Lithological and Morphometric Aspects of Mascasín Saline Watershed and Its Feeder Depositional Systems, San Juan and La Rioja Provinces, Argentina, Geomatics, 5, https://doi.org/10.3390/geomatics5010001, 2024.
Scheepers, A. and Rust, I.: The Uniab River Fan: an unusual alluvial fan on the hyper-arid Skeleton Coast, Namibia, in: Varieties of Fluvial Form, edited by: Miller, A. and Gupta, A., John Wiley & Sons Ltd, 273–294, ISBN 978-0-471-97351-5, 1999.
Schumm, S. A.: Evolution of Drainage Systems and Slopes in Badlands at Perth Amboy, New Jersey, Geol. Soc. Am. Bull., 67, 597, https://doi.org/10.1130/0016-7606(1956)67[597:EODSAS]2.0.CO;2, 1956.
Sepúlveda, S. A. and Padilla, C.: Rain-induced debris and mudflow triggering factors assessment in the Santiago cordilleran foothills, Central Chile, Nat. Hazards, 47, 201–215, https://doi.org/10.1007/s11069-007-9210-6, 2008.
Silva, P., Harvey, A., Zazo, C., and Goy, J.: Geomorphology, depositional style and morphometric relationships of Quaternary alluvial fans in the Guadalentin depression (Murcia, southeast Spain), Z. Geomorphol., 36, 325–341, https://doi.org/10.1127/zfg/36/1992/325, 1992.
Smith, K. G.: Standards for grading texture of erosional topography, Am. J. Sci., 248, 655–668, https://doi.org/10.2475/ajs.248.9.655, 1950.
Sokal, R. R. and Rohlf, F. J.: The Comparison of Dendrograms by Objective Methods, Taxon, 11, 33–40, https://doi.org/10.2307/1217208, 1962.
Stanistreet, I. G. and Stollhofen, H.: Hoanib River flood deposits of Namib Desert interdunes asanalogues for thin permeability barrier mudstone layers inaeolianite reservoirs, Sedimentology, 49, 719–736, https://doi.org/10.1046/j.1365-3091.2002.00458.x, 2002.
Stokes, M. and Mather, A. E.: Controls on modern tributary-junction alluvial fan occurrence and morphology: High Atlas Mountains, Morocco, Geomorphology, 248, 344–362, https://doi.org/10.1016/j.geomorph.2015.08.003, 2015.
Stollhofen, H., Stanistreet, I. G., von Hagke, C., and Nguno, A.: Pliocene–Pleistocene climate change, sea level and uplift history recorded by the Horingbaai fan-delta, NW Namibia, Sediment. Geol., 309, 15–32, https://doi.org/10.1016/j.sedgeo.2014.05.008, 2014.
Strahler, A. N.: Hypsometric (area-altitude) analysis of erosional topography, GSA Bulletin, 63, 1117–1142, https://doi.org/10.1130/0016-7606(1952)63[923:DBOG]2.0.CO;2, 1952a.
Strahler, A. N.: Dynamic Basis of Geomorphology, GSA Bulletin, 63, 923-938, 10.1130/0016-7606(1952)63[923:Dbog]2.0.Co;2, 1952b.
Stuut, J.-B. W. and Lamy, F.: Climate variability at the southern boundaries of the Namib (southwestern Africa) and Atacama (northern Chile) coastal deserts during the last 120,000 yr, Quaternary Res., 62, 301–309, https://doi.org/10.1016/j.yqres.2004.08.001, 2004.
Stuut, J.-B. W., Prins, M. A., Schneider, R. R., Weltje, G. J., Jansen, J. H. F., and Postma, G.: A 300-kyr record of aridity and wind strength in southwestern Africa: inferences from grain-size distributions of sediments on Walvis Ridge, SE Atlantic, Mar. Geol., 180, 221–233, https://doi.org/10.1016/S0025-3227(01)00215-8, 2002.
Svendsen, J., Stollhofen, H., Krapf, C. B. E., and Stanistreet, I. G.: Mass and hyperconcentrated flow deposits record dune damming and catastrophic breakthrough of ephemeral rivers, Skeleton Coast Erg, Namibia, Sediment. Geol., 160, 7–31, https://doi.org/10.1016/s0037-0738(02)00334-2, 2003.
Tadono, T., Ishida, H., Oda, F., Naito, S., Minakawa, K., and Iwamoto, H.: Precise Global DEM Generation by ALOS PRISM, ISPRS Ann. Photogramm. Remote Sens. Spatial Inf. Sci., II-4, 71–76, https://doi.org/10.5194/isprsannals-II-4-71-2014, 2014.
Theilen-Willige, B.: Overview of Fault Zones Based on Remote Sensing Data as Contribution to the Safety of Infrastructure and Land Use in Southern Egypt, Prevention and Treatment of Natural Disasters, 3, 17–50, https://doi.org/10.54963/ptnd.v3i1.227, 2024.
Todd, M. and Washington, R.: Circulation anomalies associated with tropical-temperate troughs in southern Africa and the south west Indian Ocean, Clim. Dynam., 15, 937–951, https://doi.org/10.1007/s003820050323, 1999.
Träger-Chatterjee, C., Müller, R. W., Trentmann, J., and Bendix, J.: Evaluation of ERA-40 and ERA-interim re-analysis incoming surface shortwave radiation datasets with mesoscale remote sensing data, Meteorol. Z., 19, 631–640, https://doi.org/10.1127/0941-2948/2010/0466, 2010.
Ullmann, T. and Stauch, G.: Surface Roughness Estimation in the Orog Nuur Basin (Southern Mongolia) Using Sentinel-1 SAR Time Series and Ground-Based Photogrammetry, Remote Sensing, 12, 3200, https://doi.org/10.3390/rs12193200, 2020.
Ullmann, T., Sauerbrey, J., Hoffmeister, D., May, S. M., Baumhauer, R., and Bubenzer, O.: Assessing Spatiotemporal Variations of Sentinel-1 InSAR Coherence at Different Time Scales over the Atacama Desert (Chile) between 2015 and 2018, Remote Sensing, 11, https://doi.org/10.3390/rs11242960, 2019.
Valkanou, K., Karymbalis, E., Papanastassiou, D., Gaki-Papanastassiou, K., and Giles, P.: Analysis of relationships among coastal alluvial fans and their contributing catchments in North Evoikos Gulf (Central Greece), Bulletin of the Geological Society of Greece, 47, 344–355, https://doi.org/10.12681/bgsg.10961, 2013.
Vogel, J. C.: Evidence of past climatic change in the Namib Desert, Palaeogeogr. Palaeocl., 70, 355–366, https://doi.org/10.1016/0031-0182(89)90113-2, 1989.
Walk, J., Bartz, M., Stauch, G., Binnie, A., Brückner, H., and Lehmkuhl, F.: Weathering under coastal hyperaridity – Late Quaternary development of spectral, textural, and gravelometric alluvial fan surface characteristics, Quaternary Sci. Rev., 277, https://doi.org/10.1016/j.quascirev.2021.107339, 2022.
Walk, J., Stauch, G., Reyers, M., Vásquez, P., Sepúlveda, F. A., Bartz, M., Hoffmeister, D., Brückner, H., and Lehmkuhl, F.: Gradients in climate, geology, and topography affecting coastal alluvial fan morphodynamics in hyperarid regions – The Atacama perspective, Global Planet. Change, 185, https://doi.org/10.1016/j.gloplacha.2019.102994, 2020.
Walk, J., Schulte, P., Bartz, M., Binnie, A., Kehl, M., Mörchen, R., Sun, X., Stauch, G., Tittmann, C., Bol, R., Brückner, H., and Lehmkuhl, F.: Pedogenesis at the coastal arid-hyperarid transition deduced from a Late Quaternary chronosequence at Paposo, Atacama Desert, Catena, 228, https://doi.org/10.1016/j.catena.2023.107171, 2023.
Walling, D. E.: The sediment delivery problem, J. Hydrol., 65, 209–237, https://doi.org/10.1016/0022-1694(83)90217-2, 1983.
Walsh, E. V., Burrough, S. L., and Thomas, D. S. G.: A chronological database assessing the late Quaternary palaeoenvironmental record from fluvial sediments in southwestern Africa, Earth-Sci. Rev., 236, https://doi.org/10.1016/j.earscirev.2022.104288, 2023.
Watson, A.: Gypsum crusts in deserts, J. Arid Environ., 2, 3–20, https://doi.org/10.1016/S0140-1963(18)31700-2, 1979.
Whipple, K. X. and Trayler, C. R.: Tectonic control of fan size: the importance of spatially variable subsidence rates, Basin Res., 8, 351–366, https://doi.org/10.1046/j.1365-2117.1996.00129.x, 1996.
Wild, A. L., Braun, J., Whittaker, A. C., and Castelltort, S.: Grain size dynamics using a new planform model – Part 1: GravelScape description and validation, Earth Surf. Dynam., 13, 875–887, https://doi.org/10.5194/esurf-13-875-2025, 2025a.
Wild, A. L., Braun, J., Whittaker, A. C., and Castelltort, S.: Grain size dynamics using a new planform model – Part 3: Stratigraphy and flexural foreland evolution, Earth Surf. Dynam., 13, 907–922, https://doi.org/10.5194/esurf-13-907-2025, 2025b.
Wild, A. L., Braun, J., Whittaker, A. C., Prieur, M., and Castelltort, S.: Grain size dynamics using a new planform model – Part 2: Determining the relative control of autogenic processes and subsidence, Earth Surf. Dynam., 13, 889–905, https://doi.org/10.5194/esurf-13-889-2025, 2025c.
Wilkinson, M. J. and Currit, N.: A Global Megafans Map, in: Fluvial Megafans on Earth and Mars, edited by: Wilkinson, J. and Gunnell, Y., Cambridge University Press, 13–20, https://doi.org/10.1017/9781108525923.004, 2023.
Wilkinson, M. J., Salvatore, M., and Vilalta, R.: 16 - Megafans on Mars, in: Fluvial Megafans on Earth and Mars, edited by: Wilkinson, J. and Gunnell, Y., Cambridge University Press, 308–336, https://doi.org/10.1017/9781108525923.020, 2023.
Woor, S., Thomas, D. S. G., Parton, A., and Leenman, A.: Morphology and controls of the mountain-front fan systems of the Hajar Mountains, south-east Arabia, Earth-Sci. Rev., 237, https://doi.org/10.1016/j.earscirev.2023.104316, 2023a.
Woor, S., Thomas, D. S. G., Durcan, J. A., Burrough, S. L., and Parton, A.: The aggradation of alluvial fans in response to monsoon variability over the last 400 ka in the Hajar Mountains, south-east Arabia, Quaternary Sci. Rev., 322, https://doi.org/10.1016/j.quascirev.2023.108384, 2023b.
Yammani, S. R. and Nagabathula, S.: Assessing the level of river basin evolution, erosion susceptibility and its correlation with morphometric characteristics using Geoinformatics techniques, Discover Geoscience, 2, https://doi.org/10.1007/s44288-024-00029-x, 2024.
Zanandrea, F., Michel, G. P., Kobiyama, M., and Cardozo, G. L.: Evaluation of different DTMs in sediment connectivity determination in the Mascarada River Watershed, southern Brazil, Geomorphology, 332, 80–87, https://doi.org/10.1016/j.geomorph.2019.02.005, 2019.
- Abstract
- Introduction
- Study area
- Methods
- Results
- Discussion
- Conclusions
- Appendix A: Digital elevation model quality assessment
- Appendix B: Tables
- Appendix C: Figures
- Code and data availability
- Author contributions
- Competing interests
- Disclaimer
- Acknowledgements
- Financial support
- Review statement
- References
- Abstract
- Introduction
- Study area
- Methods
- Results
- Discussion
- Conclusions
- Appendix A: Digital elevation model quality assessment
- Appendix B: Tables
- Appendix C: Figures
- Code and data availability
- Author contributions
- Competing interests
- Disclaimer
- Acknowledgements
- Financial support
- Review statement
- References