
the Creative Commons Attribution 4.0 License.
the Creative Commons Attribution 4.0 License.
 | 05 Oct 2026
Long-term peat thickness from cosmogenic 26Al and 10Be, Hautes Fagnes, Belgian Ardennes
Angus Moore

Maud Henrion
Yanfei Li
Eléonore du Bois d'Aische
Philip Gautschi
Marcus Christl
François Jonard
Sébastien Lambot
Kristof Van Oost
Sophie Opfergelt
Veerle Vanacker
Upland peatlands are a major terrestrial carbon reservoir that may play an important role in the global carbon cycle. However, knowledge of upland peatlands before the Holocene remains speculative because of the poor long-term preservation potential of peat in upland environments. Here, we explore the use of paired 26Al and 10Be to simultaneously determine denudation rates and peat thicknesses averaged over multiple glacial-interglacial cycles. We report cosmogenic 26Al and 10Be concentrations in quartz from saprolite underlying the modern peat cover along a hillslope transect and from stream sediment in the Hautes Fagnes, an upland peatland in the Belgian Ardennes. The measured 26Al 10Be ratios are lower than expected for steady-state denudation under the modern peat cover, which we interpret as evidence of thicker peat in the past. To quantify long-term average peat thicknesses and denudation rates and identify secular changes in overburden, we inverse-model the measured 26Al and 10Be concentrations. Modelled denudation rates of the saprolite, reflecting landscape lowering rates, are exceptionally low (0.3–4.9 tons km−2 yr−1, equivalent to approximately 0.1–1.9 m Myr−1). The median probability long-term overburden thicknesses exceed modern overburden thicknesses by 190–350 g cm−2 along the hillslope transect, approximately equivalent to 1.8–3.4 m of saturated peat. Peat degradation from historical land use, including peat extraction, drainage, and afforestation, may explain much of the discrepancy. Inverse modeling of the sample with the slowest denudation rate, and thus the longest near-surface residence time of quartz and signal integration timescale, suggests that a secular increase in overburden thickness, potentially reflecting the onset of peat cover, coincided with mid-Pleistocene uplift of the Ardennes. These results demonstrate the utility of cosmogenic nuclides in inferring the long-term history of peat cover where geomorphic process rates are slow and differential radioactive decay is non-negligible.
- Article
(3535 KB) - Full-text XML
-
Supplement
(1755 KB) - BibTeX
- EndNote


Peatlands are among the largest terrestrial carbon reservoirs and are an important element of the global carbon cycle, both in the present and through geologic time (Gorham, 1991; Treat et al., 2019). Changes in climate and land use patterns may alter the fluxes of CO2 and CH4 from peatlands, affecting Earth's radiation budget and climate (Abdalla et al., 2016; Yu et al., 2011). For example, the expansion of northern peatlands after the Last Glacial Maximum (LGM) caused a rise in the concentration of atmospheric CH4 in the early Holocene, while simultaneously creating a sustained CO2 sink (MacDonald et al., 2006; Nichols and Peteet, 2019). Similarly, ongoing anthropogenic exploitation of peatlands and climatic warming and drying may release stored carbon and amplify climate change (Loisel et al., 2021). A more thorough understanding of how peatlands have responded to changing climate and land use pressures in the past is necessary for accurately modeling interconnections between Earth's land surface and climate system in the future.
The importance of peatlands to the global carbon cycle has motivated extensive work on peat accumulation histories (Yu et al., 2010). In northern peatlands, these studies typically use 14C to date peat in formerly glaciated landscapes that began accumulating following ice retreat. However, this approach is limited by the temporal range of 14C (< 50 kyr) and the inherent transience of peat deposits. Although climatic conditions were amenable to peat accumulation during previous interglacials, re-advance of ice has destroyed or buried most northern peatlands that existed before the LGM (Treat et al., 2019). Beyond the limit of Pleistocene glaciation, continuous loss of peat occurs through oxidation and anaerobic respiration such that peat mass in old peatlands tends towards steady state. In a steady-state bog, the modern peat archive does not record the full history of peat on the landscape (Clymo, 1984). This limits knowledge of peatlands before the LGM to the few locations where older peat deposits are well-preserved (e.g., Treat et al., 2019; Woillard, 1978) and to inferences drawn from land-surface modeling (Kleinen et al., 2016).
Sensing the presence of peat over longer timescales requires a proxy for past peat cover. The accumulation of cosmogenic nuclides in quartz depends on the amount of overlying mass shielding the quartz from cosmic radiation (Lal, 1991). Consequently, the cosmogenic nuclide concentration in a sample collected from beneath a peat layer carries information about the average thickness of the peat over the exposure history of the sample, which on a hillslope is controlled by the denudation rate (the sum of the physical erosion and chemical weathering rates). If two nuclides with differing half-lives are measured (e.g., 26Al and 10Be) and the exposure timescale is sufficient for differential radioactive decay between the two to be important, then the denudation rate and peat thickness can be determined concurrently. Because the half-lives of 26Al and 10Be are 0.717 and 1.39 Myr, respectively, differential decay becomes measurable only when the cosmogenic nuclide signal integrates over timescales greater than approximately 0.2 Myr. Knowledge of average peat thickness over such timescales may shed new light on long-standing questions concerning the magnitude of carbon storage in peatlands before the LGM (Treat et al., 2019) and the extent to which modern carbon storage differs from the long-term average because of anthropogenic impacts (Joosten and Couwenberg, 2008).
We test the use of paired 26Al and 10Be concentrations to infer long-term peat thicknesses in an upland peatland in the Belgian Ardennes. The study site is located on a low-relief surface above regional knickpoints on the Hautes Fagnes plateau, where geomorphic process rates are expected to be low and differential radioactive decay between 26Al and 10Be significant (Beckers et al., 2015; Sougnez and Vanacker, 2011). We report 26Al and 10Be concentrations in quartz isolated from saprolite underlying peat along a hillslope transect and from stream sediment collected at the base of the hillslope. We invert the nuclide concentrations using a Markov Chain Monte Carlo (MCMC) approach to constrain time-averaged overburden thicknesses, denudation rates of the saprolite, and secular changes in overburden thickness with time. To assess the inverse-model results, we compare the modeled denudation rates to an independent, order-of-magnitude estimate of the watershed-averaged denudation rate derived from solute fluxes and a geochemical mass-balance of the regolith. Likewise, we evaluate modeled overburden thicknesses against constraints from theoretical peatland models and the site's land-use history.
The study site comprises a hillslope transect in the upper reaches of the Hoëgne catchment on the Hautes Fagnes plateau (Fig. 1). The plateau encompasses the highest elevations in the Belgian Ardennes and has a cooler and more humid climate than found elsewhere in the region. Mean annual precipitation (MAP) from 1971–2000 recorded at the Mont Rigi weather station ca. 2 km northeast of the study transect was 1440 mm yr−1 and mean annual temperature (MAT) 6.7 °C (Mormal and Tricot, 2004). Cloud cover generated by adiabatic cooling during orographic uplift of air masses over the plateau is persistent and limits evapotranspiration (ET). Together, high MAP, low ET, and low MAT make the local environment conducive to peat accumulation.
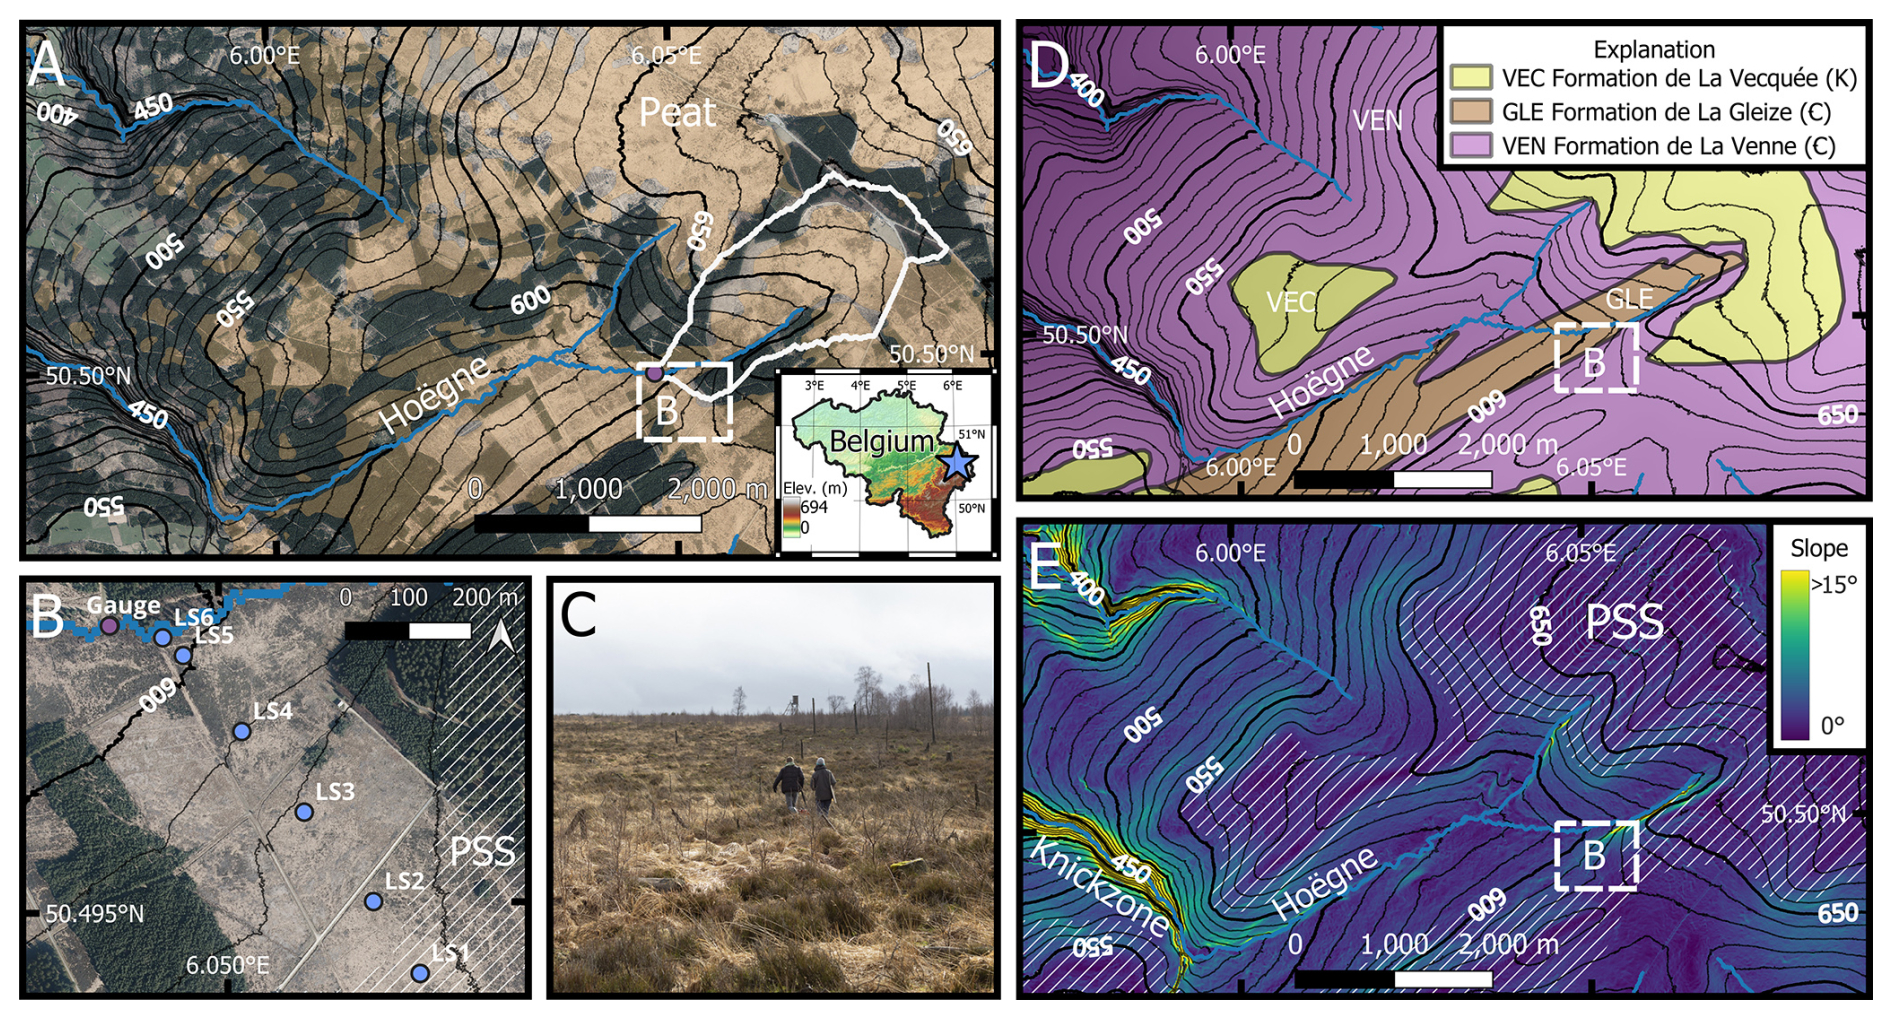
Figure 1(A) Regional map showing the locations of the study hillslope (dashed box labeled B) and study catchment (denoted by the white, solid polygon upstream of the purple marker) and the modern distribution of peat soils (orange shading) with reference to 2020 orthophotography (Source: Walloon Public Service, CC-BY 4.0 License). Contour elevations (m) are given by the white numbers. (B) Local map of the study hillslope showing the locations of samples LS1 to LS6, the stream gauge where LSR-1 was collected, and the pre-Senonian surface (PSS). (C) View of the study hillslope looking upslope. (D) Approximate bedrock geologic map adapted from Demoulin et al. (2018b) and the provisional geological map of Marion et al. (2018). (E) Regional slope map showing the knickzone on the Hoëgne. The local extent of the pre-Senonian surface (PSS) was calculated from a three point problem, assuming a planar geometry.
The bedrock at the site consists of low-grade quartzite and argillite of the mid-to-late Cambrian La Venne formation and the late Cambrian La Gelize formation of the Revin group. Structurally, these rocks belong to the Stavelot inlier. They were deformed by the Caledonian and Variscan orogenies into a north-east by south-west striking syncline in the vicinity of the study site and were exhumed before the late Mesozoic (Goemaere et al., 2016). A deformed, paleo-weathering surface, known as the pre-Senonian surface, has been identified across the Hautes Fagnes. A Cretaceous age for this surface is supported by K-Ar dates on supergene, K-bearing, Mn-oxide minerals (Demoulin et al., 2018b). Transgressions in the late Cretaceous and the Oligocene flooded the pre-Senonian surface and unconformable outliers of marine sediments are locally preserved.
The modern elevation of the Ardennes massif is primarily the result of Pleistocene uplift. Uplift has been attributed variously to the far-field effects of the Alpine Orogeny or a mantle plume under-plating the massif (Demoulin and Hallot, 2009; Meyer and Stets, 2002). Cosmogenic nuclide dating of fluvial terraces on the margin of the Ardennes massif indicates that river entrenchment accelerated in the early mid-Pleistocene (da Silva Guimarães et al., 2026; Rixhon et al., 2011) and uplift velocity is believed to have peaked at this time (Demoulin and Hallot, 2009; van Balen et al., 2000). The study site is located upstream of the mid-Pleistocene knickzone on the Hoëgne (Beckers et al., 2015; Sougnez and Vanacker, 2011; Fig. 1e) and is not yet affected by erosional adjustment to uplift. Consequently, the landscape is characterized by low-gradient hillslopes (the study hillslope falls ca. 30 m over 700 m, giving a mean gradient of 2.4 °C) and subdued topography.
Although the Ardennes were never glaciated, abundant evidence of periglacial conditions during the Pleistocene, such as lithalsa ramparts (remnants of ice-cored mounds), exist on the Hautes Fagnes plateau and in the surrounding region (Demoulin et al., 2018a; Rixhon and Juvigné, 2010). While the oldest 14C dates obtained from peat in the vicinity of the study site are from the latest Pleistocene (Bølling–Allerød; Pissart et al., 2011), peatland distribution modeling using the peatland-enabled CLIMBER2-LPJ model indicates that regional climate was broadly favorable to peat accumulation during most of the last 130 kyr (Treat et al., 2019). At present, the upper elevations of the Hautes Fagnes host a moorland ecosystem, with raised, ombrotrophic bogs on summit surfaces and hillslopes that are mantled by a peat blanket (Goemaere et al., 2016).
In recent centuries, the Hautes Fagnes peatlands have been affected by land use. Peat extraction for fuel is recorded in historical records since the 16th century and intensified in the 19th century (Paulissen et al., 2021), while extensive grazing, mowing and raking, and intermittent slash-and-burn cultivation of hardy cereals are also documented (Froment, 1968). Drainage ditches were excavated and the study site planted with spruce (Picea abies) in the early 20th century. However, the extent to which these activities impacted peat thickness is not known. Efforts to restore a moorland ecosystem have been ongoing since the 1990s and include removal of the spruce in the early 2000s and the introduction of hardwood species (Henrion et al., 2024). Modern vegetation at the study site is dominated by mosses (Sphagnum spp.) that are increasingly replaced by purple moor grass (Molina sp.) (Li et al., 2024).
3.1 Sampling
Samples were collected from a northwest-facing hillslope transect extending from the interfluve to the channel of the Hoëgne (LS1–LS6; Fig. 1; Table 1). Current peat depths along this transect (0.2–2.1 m) were previously characterized using ground penetrating radar imaging (Henrion et al., 2024) and are greatest at the footslope (LS5) and least at the topslope (LS2) (Table 1). Samples for determination of saprolite and bedrock geochemistry were collected in one or two soil pits excavated through the peat layer using a shovel at locations LS1–LS4 (Fig. 1B). Larger, quartz-bearing samples for cosmogenic nuclide analyses were later taken at 6 positions (LS1–LS6; Fig. 1B) along the transect by coring through the peat layer using a soil auger. At LS4, the saprolite yielded insufficient quartz, so a bedrock sample taken at the bottom of the soil pit was used in lieu of saprolite. The sample collected adjacent to the Hoëgne (LS6) we interpret as consisting of buried valley-bottom sediment. The thickness of the intervals sampled for quartz ranged between 5 cm (LS4) and 28 cm (LS6). Bulk stream sediment was collected from several locations spaced a few meters apart along the stream bed at the base of the study hillslope and amalgamated to obtain a well-mixed sediment sample (LSR-1). The stream's discharge was monitored between August 2023 and July 2024 using a water level gauge and the local stage-discharge relationship. Stream water samples were collected into acid-cleaned, low-density polyethylene bottles at the gauge at monthly intervals.
Table 1Sample data and cosmogenic nuclide concentrations.
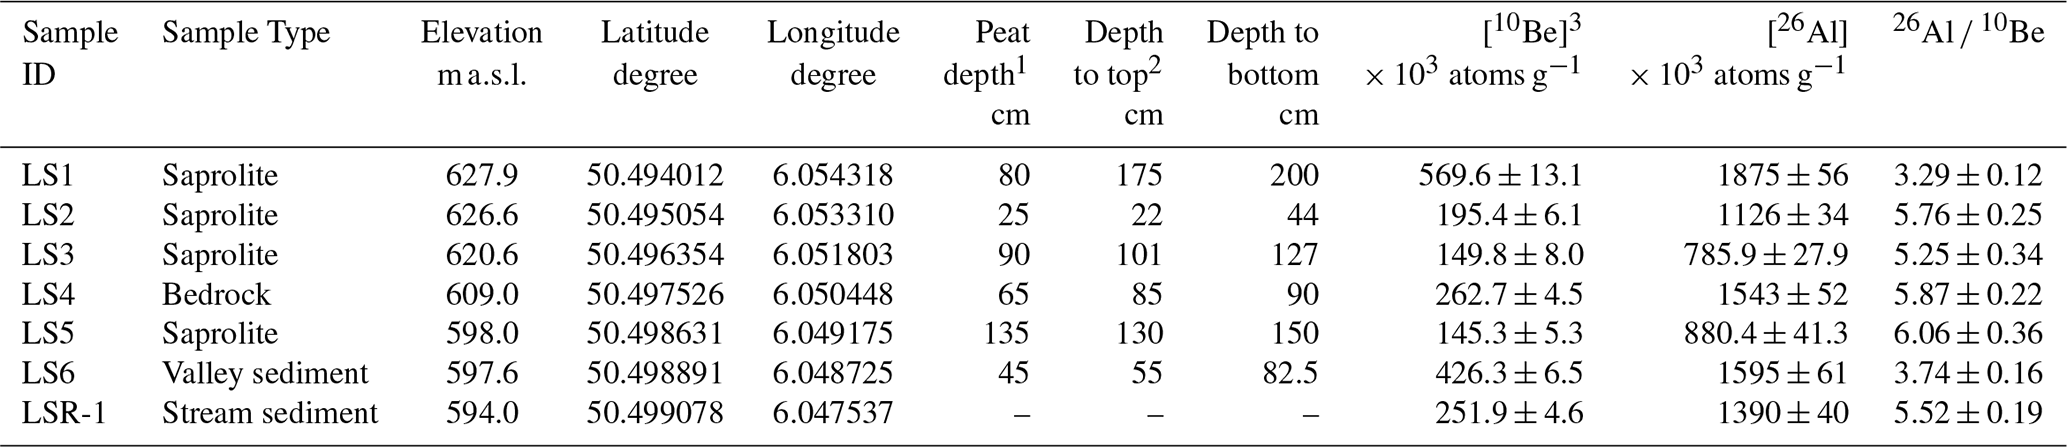
1 Mean peat depth of the 5 m surrounding the sampling point surveyed with ground-penetrating radar (Henrion et al., 2024).
2 Top and bottom of the sampled interval.
3 Full laboratory data and measured isotope ratios are given in the Zenodo repository (https://doi.org/10.5281/zenodo.21630161, Moore, 2026).
3.2 Water and soil geochemistry
Stream water chemistry and saprolite, rock, and stream and valley-bottom sediment geochemistry were measured by inductively coupled plasma-optical emission spectrometry (ICP-OES). Stream solutes are derived partly from atmospheric deposition and partly from bedrock weathering. To isolate the bedrock signal, we focus on Si, which is the major dissolved constituent that is least impacted by atmospheric inputs. Dissolved Si concentrations were measured in the stream water samples using an Agilent 5800 spectrometer. The bulk saprolite samples were wet sieved to isolate the fine earth fraction (< 2 mm). This was heated to 550 °C for 24 h in a glass crucible to remove organic matter and loss on ignition was determined. An aliquot of the ash was weighed and fused in a 2:1 mixture of lithium metaborate and lithium tetraborate at 1000 °C in a graphite crucible and the fusion cake was dissolved in 1.6 M HNO3. To determine bedrock composition, rocks embedded within the saprolite, the intact bedrock sampled at LS4, and the coarse fraction of the stream sediment (> 2 mm) were crushed in a ball mill, fused, and prepared for measurement in the same way as the saprolite samples. The concentrations of Si and the refractory elements Ti and Zr were determined using a ThermoFisher iCAP 6000 spectrometer.
3.3 Denudation rate from solute flux and regolith geochemistry
A watershed-scale denudation rate (D) can be estimated from stream solute fluxes and weathering intensity. To be comparable with denudation rates determined from cosmogenic nuclide concentrations in saprolite samples, we calculate D for the saprolite. To gauge the weathering intensity of Si in the saprolite, a Si-specific chemical depletion factor (CDFSi) was calculated following Riebe et al. (2004):
where [Si]sap is the concentration of Si in the saprolite, [Si]rock is the concentration in the bedrock from which the saprolite is derived, and [I]sap and [I]rock are the concentrations of a refractory element that is assumed to be immobile during weathering, such as Zr or Ti, in the saprolite and bedrock, respectively. In equilibrium, the denudation rate is proportional to the weathering flux of Si, which is equivalent to the product of specific discharge (Q, mL cm−2) and the Si concentration in stream water ([Si]w, µg mL−1), [Si]rock, and CDFSi (Riebe et al., 2004):
Significantly, Eq. (2) assumes that the dissolved flux of Si is constant over regolith residence timescales. Specific discharge was estimated by taking the mean of the discharge measurements on the 12 sampling days (1 per month), multiplying by the length of the year, and dividing by catchment area.
3.4 Cosmogenic nuclide analysis
To isolate quartz for cosmogenic nuclide measurements, the saprolite (LS1–LS3, LS5), bedrock (LS4), valley-bottom sediment (LS6), and stream sediment (LSR-1) samples were first washed and (except LS4) sieved. Vein quartz and quartzite pieces were hand-picked from the > 2 mm fraction of the saprolite and valley bottom sediment because of the small available sample sizes and, along with the rock sample from LS4, crushed and cleaned of meteoric 10Be by repeated leaching in 2 % HF/1 % HNO3. Quartz was separated from the 0.25–2 mm fraction of the stream sediment through treatment with H2O2 to remove organics, leaching in 2 % HF/1 % HNO3, and density separation in lithium heteropolytungstate.
The quartz separates were spiked with low-level 9Be carrier (1052 µg Be g−1) and dissolved in concentrated HF HNO3. After digestion was complete, volatile fluorides were removed by evaporation and the residues dissolved in HNO3. A liquid aliquot was taken for determination of total sample Al content by ICP-OES using an Agilent 5800 spectrometer. The Be and Al were then isolated and purified using a simplified separation scheme. In brief, non-amphoteric species were first precipitated at pH 14 and removed by centrifugation. The Be and Al were then precipitated at pH 8 and the precipitates dissolved in 0.4 M oxalic acid. The oxalic-acid solution was passed through a 2 mL anion exchange column (Dowex 1x8, 100–200 mesh). In 0.4 M oxalic acid, Be2+ forms a neutral oxalate complex and passes through the column, whereas negative oxalate complexes of Al3+, Fe3+, and Ti4+ are retained on the resin. The Al was then selectively eluted from the column in 0.4 M HCl. The Be and Al were precipitated as Be(OH)2 and Al(OH)3 with NH4(OH). The hydroxides were washed with 18.2 MΩ-cm water, transferred to quartz glass crucibles, dried, and oxidized at 900 and 1000 °C, respectively, in a muffle furnace. The BeO was mixed with Nb powder and the Al2O3 with Cu powder. The mixtures were loaded into Cu cathodes for measurement of 10Be 9Be and 26Al 27Al by accelerator mass spectrometry (AMS) at the Laboratory of Ion Beam Physics, ETH Zurich using the compact MILEA system (Gautschi, 2024). The AMS measurements were normalized to the in-house standards S2007N and S2010N (10Be) and ZAL94N (26Al) (Christl et al., 2013), which have been recalibrated against the KN standard series (Nishiizumi, 2022).
3.5 Cosmogenic nuclide models
3.5.1 Depth attenuation of cosmogenic nuclide production
Modeling cosmogenic nuclide concentrations under a peat blanket requires considering how cosmic radiation is attenuated during passage through peat. The intensity of cosmic radiation declines with depth below the surface following a negative exponential function:
where Pn,i(z) is the production rate of nuclide n by nuclear reaction i at depth z (atoms g−1 yr−1), Pn,i(0) is the production rate of nuclide n by reaction i at the ground surface (atoms g−1 yr−1), Λi is the absorption mean free path of the cosmic radiation responsible for production mechanism i (g cm−2), and z is the depth below the surface (g cm−2) (Lal, 1991).
Production of 26Al and 10Be in quartz near the Earth's surface occurs primarily through spallation reactions induced by cosmic ray nucleons. The mean free path of nucleonic radiation in the subsurface is inversely related to the nuclear cross-sectional area per unit mass of the ground, which is compositionally dependent. The cross-sectional area of a nucleus increases with , where A is the atomic mass, while the number of atoms per unit mass of the ground is inversely proportional to A. Thus, the cross sectional area per unit mass scales with and the mean free path with (Marrero et al., 2016). Peat at the study site has a porosity near 90 % and is typically at saturation below the upper 10–30 cm (Henrion et al., 2025). Therefore, the geochemical composition of peat is dominated by water, which has a mean atomic mass of 6 u, compared to ca. 20 u for silicate minerals. This suggests a peat to saprolite mean free path ratio of 0.67. Adopting the conventional mean free path in silicate rocks of 160 g cm−2 for saprolite and multiplying by this ratio gives a first-order estimate of the value in saturated peat of 110 g cm−2. This is in good agreement with the mean free path in water of 109 g cm−2 determined by Zweck et al. (2013) using Monte Carlo particle-transport modeling. The mean atomic mass of organic matter is broadly similar to that of water (e.g., cellulose is 8 u), suggesting that the attenuation length is not significantly affected by the position of the water table or the exact peat porosity.
We estimate the surface spallation 10Be production rate at the study site using the Lal/Stone time-invariant scaling model (Stone, 2000) and reference production rates from Borchers et al. (2016). A growing body of evidence indicates that the 26Al 10Be production ratio at low elevations and high latitudes exceeds the conventional value of 6.8 (Corbett et al., 2017; Halsted et al., 2021). To capture this effect, we adopt the 26Al 10Be spallation production ratio of 7.2 predicted for the study site by the reaction-specific scaling model of Lifton et al. (2014).
Cosmogenic nuclides are also produced through muon reactions. Although the surface production rates of 26Al and 10Be from muon reactions are < 1 % of that from spallation at the study site, muons penetrate more deeply into the subsurface than nucleons. This makes accurately modeling muon-induced production important for interpreting cosmogenic nuclide concentrations in samples under a thick peat layer. We parameterize muon production using a series of four negative exponential terms (Table S1 in the Supplement), identical in form to Eq. (3), fit to the full muon depth profile calculated from 102–104 g cm−2 at the elevation and cutoff rigidity of the study site (Moore and Granger, 2024). This gives a surface muon 26Al 10Be production ratio of 9.5. The multi-exponential approximation is used rather than the full muon-production depth profile because it is computationally efficient to implement with minimal loss of accuracy (Balco, 2017).
3.5.2 Hillslope model
To model accumulation of cosmogenic nuclides at the hillslope positions, we conceptualize the subsurface as consisting of a peat blanket overlying saprolite and assume that downslope transport occurs exclusively within the peat layer. The saprolite is shielded from cosmic radiation by the peat layer or other overburden and undergoes denudation through chemical weathering and physical incorporation into the overlying peat. In steady state, the concentration of a cosmogenic nuclide n in the saprolite, Nn,sap, under overburden depth z (g cm−2) is described by Lal (1991):
where Pn,i(z) is the production rate of nuclide n at the sample's depth (z) by production pathway i (atoms g−1 yr−1), λn is the decay constant of nuclide n (yr−1), D is the denudation rate of the saprolite (g cm−2 yr−1), Λi is the absorption mean free path in the saprolite of production pathway i (g cm−2). We use 160 g cm−2 for the spallation mean free path in saprolite. The summation is over all negative exponential production functions. Where denudation is rapid, will be much larger than λAl−26 and the measured 26Al 10Be ratio will be equivalent to the production ratio. In this case, a lower production rate from greater shielding by overburden cannot be distinguished from a faster denudation rate. However, where is similar in magnitude to λAl−26, the overburden (z) and denudation rate may be solved for simultaneously from measured 26Al and 10Be concentrations.
Equation (4) is applicable only to scenarios in which oscillations in overburden thickness occur over timescales that are much shorter than the integration timescale of the cosmogenic signal. If a step-change in peat thickness occurred at a discrete point in the past, but the denudation rate of the saprolite remained constant, Eq. (4) can be modified to reflect that in this case the nuclide concentration in the saprolite is the sum of a component accumulated under steady-state conditions for the original overburden thickness, less nuclide losses to radioactive decay and denudation, and another produced under the new thickness:
where z1 is the overburden thickness before the change (g cm−2), z2 is the new overburden thickness (g cm−2), and t (yr) is the time since the change in overburden thickness occurred.
Although a step change in the denudation rate of the saprolite is also possible, geomorphic constraints indicate that such a change is unlikely to be recorded in the cosmogenic nuclide signal of most of the samples at the study site. This is because the summit sample (LS1) is located on a mapped paleo-surface. If the paleo-surface interpretation is correct, then it cannot have experienced a recent acceleration in denudation rate. For the remaining hillslope positions (except LS2), the magnitude of incision below the paleo-surface is sufficient (> 5 m) to have removed nearly the entire cosmogenic nuclide inventory produced before the start of incision. For LS2, we acknowledge that a change in denudation rate is a potential source of bias in the model.
3.5.3 Sediment models
Obtaining a basin-averaged erosion rate from the stream sediment requires considering the impact of peat cover on cosmogenic nuclide accumulation in quartz as it is transported downslope in a mobile soil layer through the hillslope conveyor. Cosmogenic nuclide concentrations are conventionally inverted for basin-averaged erosion rates under the assumptions that enrichment or depletion of quartz across the mobile layer/saprolite interface and radioactive decay are negligible. However, at the study site quartz concentrations in the peat layer are low and radioactive decay is expected to be important. To account for these factors, we use the framework proposed by Riebe and Granger (2013), after modification to incorporate radioactive decay (Text S1 in the Supplement):
Equation (6) describes the nuclide concentration in the sediment (Nn,sed) as a function of the quartz concentration ratio between the mobile layer and the saprolite (R), the thickness of the mobile layer (z) (g cm−2), which we assume is equivalent to the peat layer, and the erosion rate of the saprolite underlying the peat (Esap). Significantly, Eq. (6) provides an estimate of the saprolite erosion rate rather than the denudation rate.
Modeling of the valley-bottom sediment sample (LS6) necessitates accounting for radioactive decay and cosmogenic nuclide production during storage in the valley-bottom. To do this, we assume that the sediment, when buried, had an inherited nuclide concentration governed by Eq. (6) and that this concentration has been diminished by radioactive decay and augmented by post-burial production:
where Nn,fp is the concentration of nuclide n in the valley-bottom fluvial sediment. In addition to the three variables governing Nn,sed, Eq. (7) also includes the burial time (tbur) and depth of burial (zbur) as free parameters.
3.5.4 Inverse methods
Equations (5)–(7) require solving for 3–5 parameters from two nuclide measurements and are thus under-determined. Therefore, we use a Markov Chain Monte Carlo (MCMC) inversion to estimate the posterior joint-distribution of the parameters (Andersen et al., 2023; Hippe et al., 2021). The joint-distribution describes the likelihood of different parameter combinations and allows the trade-offs between parameters that are inherent in under-determined problems to be assessed. We adopt the inversion method of Andersen et al. (2023), which uses the Metropolis-Hastings algorithm. In this approach, parameter combinations are iteratively proposed and nuclide concentrations forward modelled. Combinations that more closely match the measured nuclide concentrations than the previous combination are accepted, whereas those that do not are accepted or rejected based on the degree of misfit and a randomly varying acceptance threshold. Given a sufficient number of iterations, the distribution of accepted parameter combinations will reflect the posterior joint probability distribution, with more accepted samples coming from the higher probability regions in the parameter space than the lower probability regions. The prior ranges used (i.e., allowable parameter bounds) are given in Table 2. We invert the samples individually, allowing all parameters to vary, using 10 chains. We discard the initial 4 × 10⁴ accepted parameter combinations for each chain as a “burn-in” phase. Afterwards, the inversion is run until 105 accepted iterations per chain are achieved, for a total of 106 accepted parameter combinations.
Table 2Parameter bounds used in the Markov Chain Monte Carlo inversion.
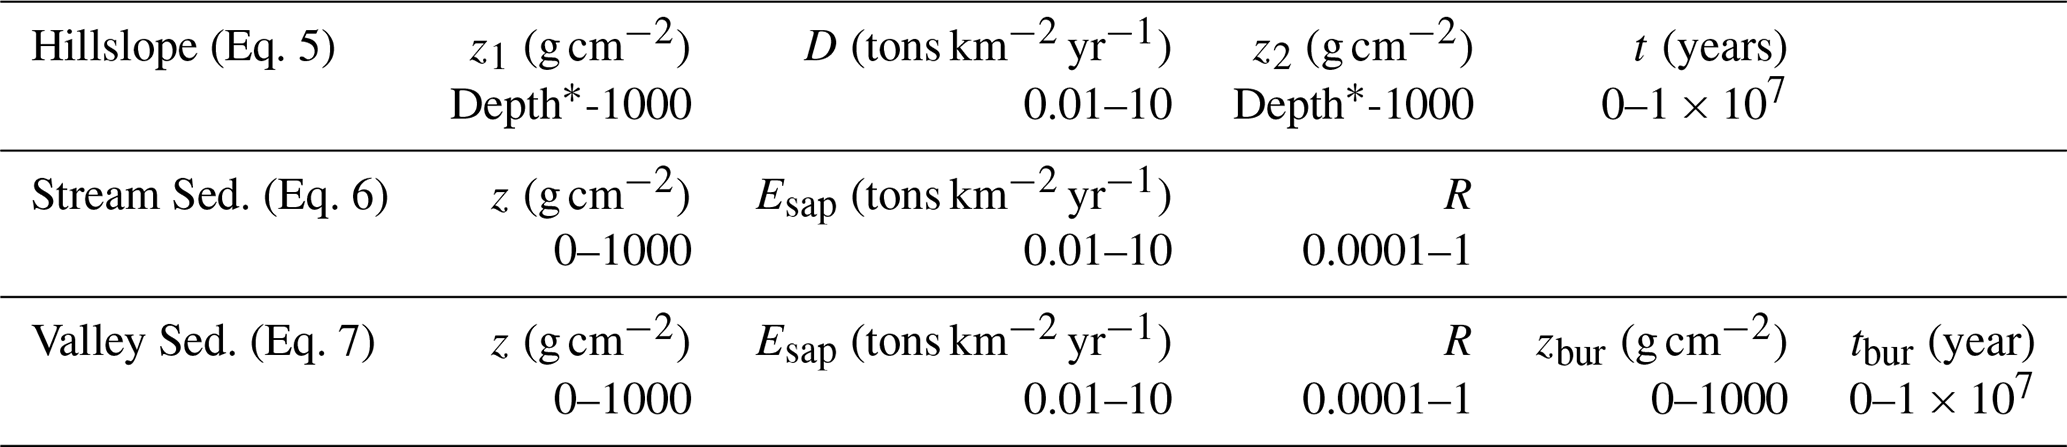
* Depth of sample below the peat/saprolite interface.
To demonstrate the suitability of the MCMC approach to this problem, we use Eq. (5) to calculate nuclide concentrations for an artificial parameter set and then invert for the parameter values. The algorithm successfully recovers the input parameters (Fig. S1). Furthermore, we use least-squares to invert a simplified version of Eq. (5) that assumes no change in peat thickness and thus has only two parameters: the peat thickness and denudation rate. This produces results that are broadly similar to the MCMC approach for LS2–LS5 (Table S2). The posterior probability distributions for the parameters obtained from the MCMC inversion are somewhat asymmetric, so we report the median, which is robust to skewness, and the 50 % credible interval as summary statistics.
4.1 Solute flux and regolith geochemistry
Despite a large water flux from the study catchment, the solute flux carried by the stream is low. The annual specific discharge was 1214 mm yr−1, which is equivalent to 70 % of precipitation (P) during the August 2023–July 2024 gauging period (1736 mm) measured at the Mont Rigi weather station. Given the water balance relationship for a watershed with no change in groundwater storage with time (Q = P − ET), this suggests that ET is 522 mm yr−1. To obtain a longer-term estimate of Q, we subtract this ET value from the 30-year normal MAP of 1440 mm yr−1 (Mormal and Tricot, 2004) giving a long-term specific discharge of 918 mm yr−1. Concentrations of Si measured in the stream water range from 0.84 to 1.59 µg mL−1 and do not vary with the stream discharge on the sampling days: the unweighted mean concentration is 1.20 µg mL−1, which is nearly identical to the flow-weighted mean of 1.22 µg mL−1 (Data Tables in the Supplement; Moore, 2026). The annual Si weathering flux from the study catchment calculated using the long-term specific discharge is 1.12 tons Si km−2 yr−1, equivalent to 2.39 tons SiO2 km−2 yr−1. That the gauging record misses high discharge events is unlikely to appreciably bias this estimate if overland flow becomes significant during these events and the excess discharge does not interact with the soil.
Calculating CDFSi (Eq. 1) for a unit of saprolite requires knowing the elemental concentrations in the parent material. Although concentrations were determined in rock samples embedded within the saprolite (Data Tables in the Supplement; Moore, 2026), these might not accurately reflect the parent material because the bedrock at the study site consists of interbedded argillite and quartzite, whereas the sampled rocks were exclusively quartzite, which more effectively resists weathering. The ratio between two immobile elements should not change between the parent material and saprolite. However, TiO2 Zr ratios in the analyzed rocks are, on average, lower than those in the saprolite (mean and standard deviation of 9.8 ± 3.6 vs. 19.3 ± 4.7), demonstrating that the rocks do not fully capture the parent material composition, assuming that Ti and Zr are equally refractory. Conversely, the coarse fraction of the stream sediment (> 2 mm), which consists of a mixture of argillite and quartzite gravel, has a TiO2 Zr ratio of 17.8. This is comparable to the mean ratio in the saprolite. Thus, we use the stream sediment elemental concentrations to approximate the average bedrock composition along the transect when calculating CDFSi. This approach introduces considerable uncertainty because of fluvial sorting and because the ratio of argillite to quartzite at each hillslope position may differ from the catchment average. This yields CDFSi ranging from 0.25 to 0.57 between all soil pits when using Ti as the immobile element and 0.23 to 0.54 when using Zr. The mean CDFSi along the hillslope is 0.43 (Moore, 2026). Using the mean CDFSi, the measured riverine flux of Si, and the stream sediment Si concentration in Eq. (2) yields a watershed-average denudation rate of 7.2 tons km−2 yr−1 (2.8 m Myr−1 at a rock density of 2.6 g cm−3). This estimate of the denudation rate has large, but poorly quantified, uncertainties arising from long-term temporal variability in runoff and the assumptions underpinning the calculation of CDFSi.
4.2 Cosmogenic nuclides
Concentrations of 26Al and 10Be vary with hillslope position (Table 1). Concentrations of both nuclides are highest at the summit (LS1), although this sample was collected from the greatest depth below the surface. Concentrations measured in the valley-bottom sediment sample (LS6) are intermediate between the summit (LS1) and the remaining hillslope positions (LS2–LS5). Neither 26Al nor 10Be concentrations are significantly correlated with the samples' depths below the modern surface (r2 = 0.05 for 26Al and r2 = 0.15 for 10Be). The concentrations of both nuclides in the stream sediment sample are broadly comparable with the mean concentrations in the hillslope samples (LS1–LS5) (252 × 103 atoms g−1 vs. 292 × 103 atoms g−1 for 10Be and 1.39 × 10⁶ atoms g−1 vs. 1.30 × 10⁶ atoms g−1 for 26Al).
Aluminum-26 and 10Be are produced together in quartz at a characteristic production ratio (7.2 at the surface at the study site). The measured 26Al 10Be ratios are lower than the surface production ratio and range from 3.29 ± 0.12 at the summit (LS1) to 6.06 ± 0.36 at the toe-slope (LS5). The 26Al 10Be ratio in the stream sediment is 5.52 ± 0.19, approximately equivalent to the hillslope positions LS2–LS5, but significantly higher than the ratio measured at the summit (LS1) and in the valley-bottom (LS6). All samples plot further below the steady-state denudation line on an 26Al 10Be two-nuclide plot than can be accounted for by the shielding provided by the modern peat cover (Fig. 2). Ratios below the steady-state denudation line are conventionally interpreted to result from deep burial and descent from the line along a decay trajectory. However, the geomorphic position of the study site on a hillslope near a local topographic maximum in a non-glaciated landscape precludes deep burial by sediment or ice during the Pleistocene. Instead, we interpret the depressed 26Al 10Be ratios to result from the average peat thickness across the exposure duration of the samples exceeding the modern thickness and apply the models described in Sect. 3.5.
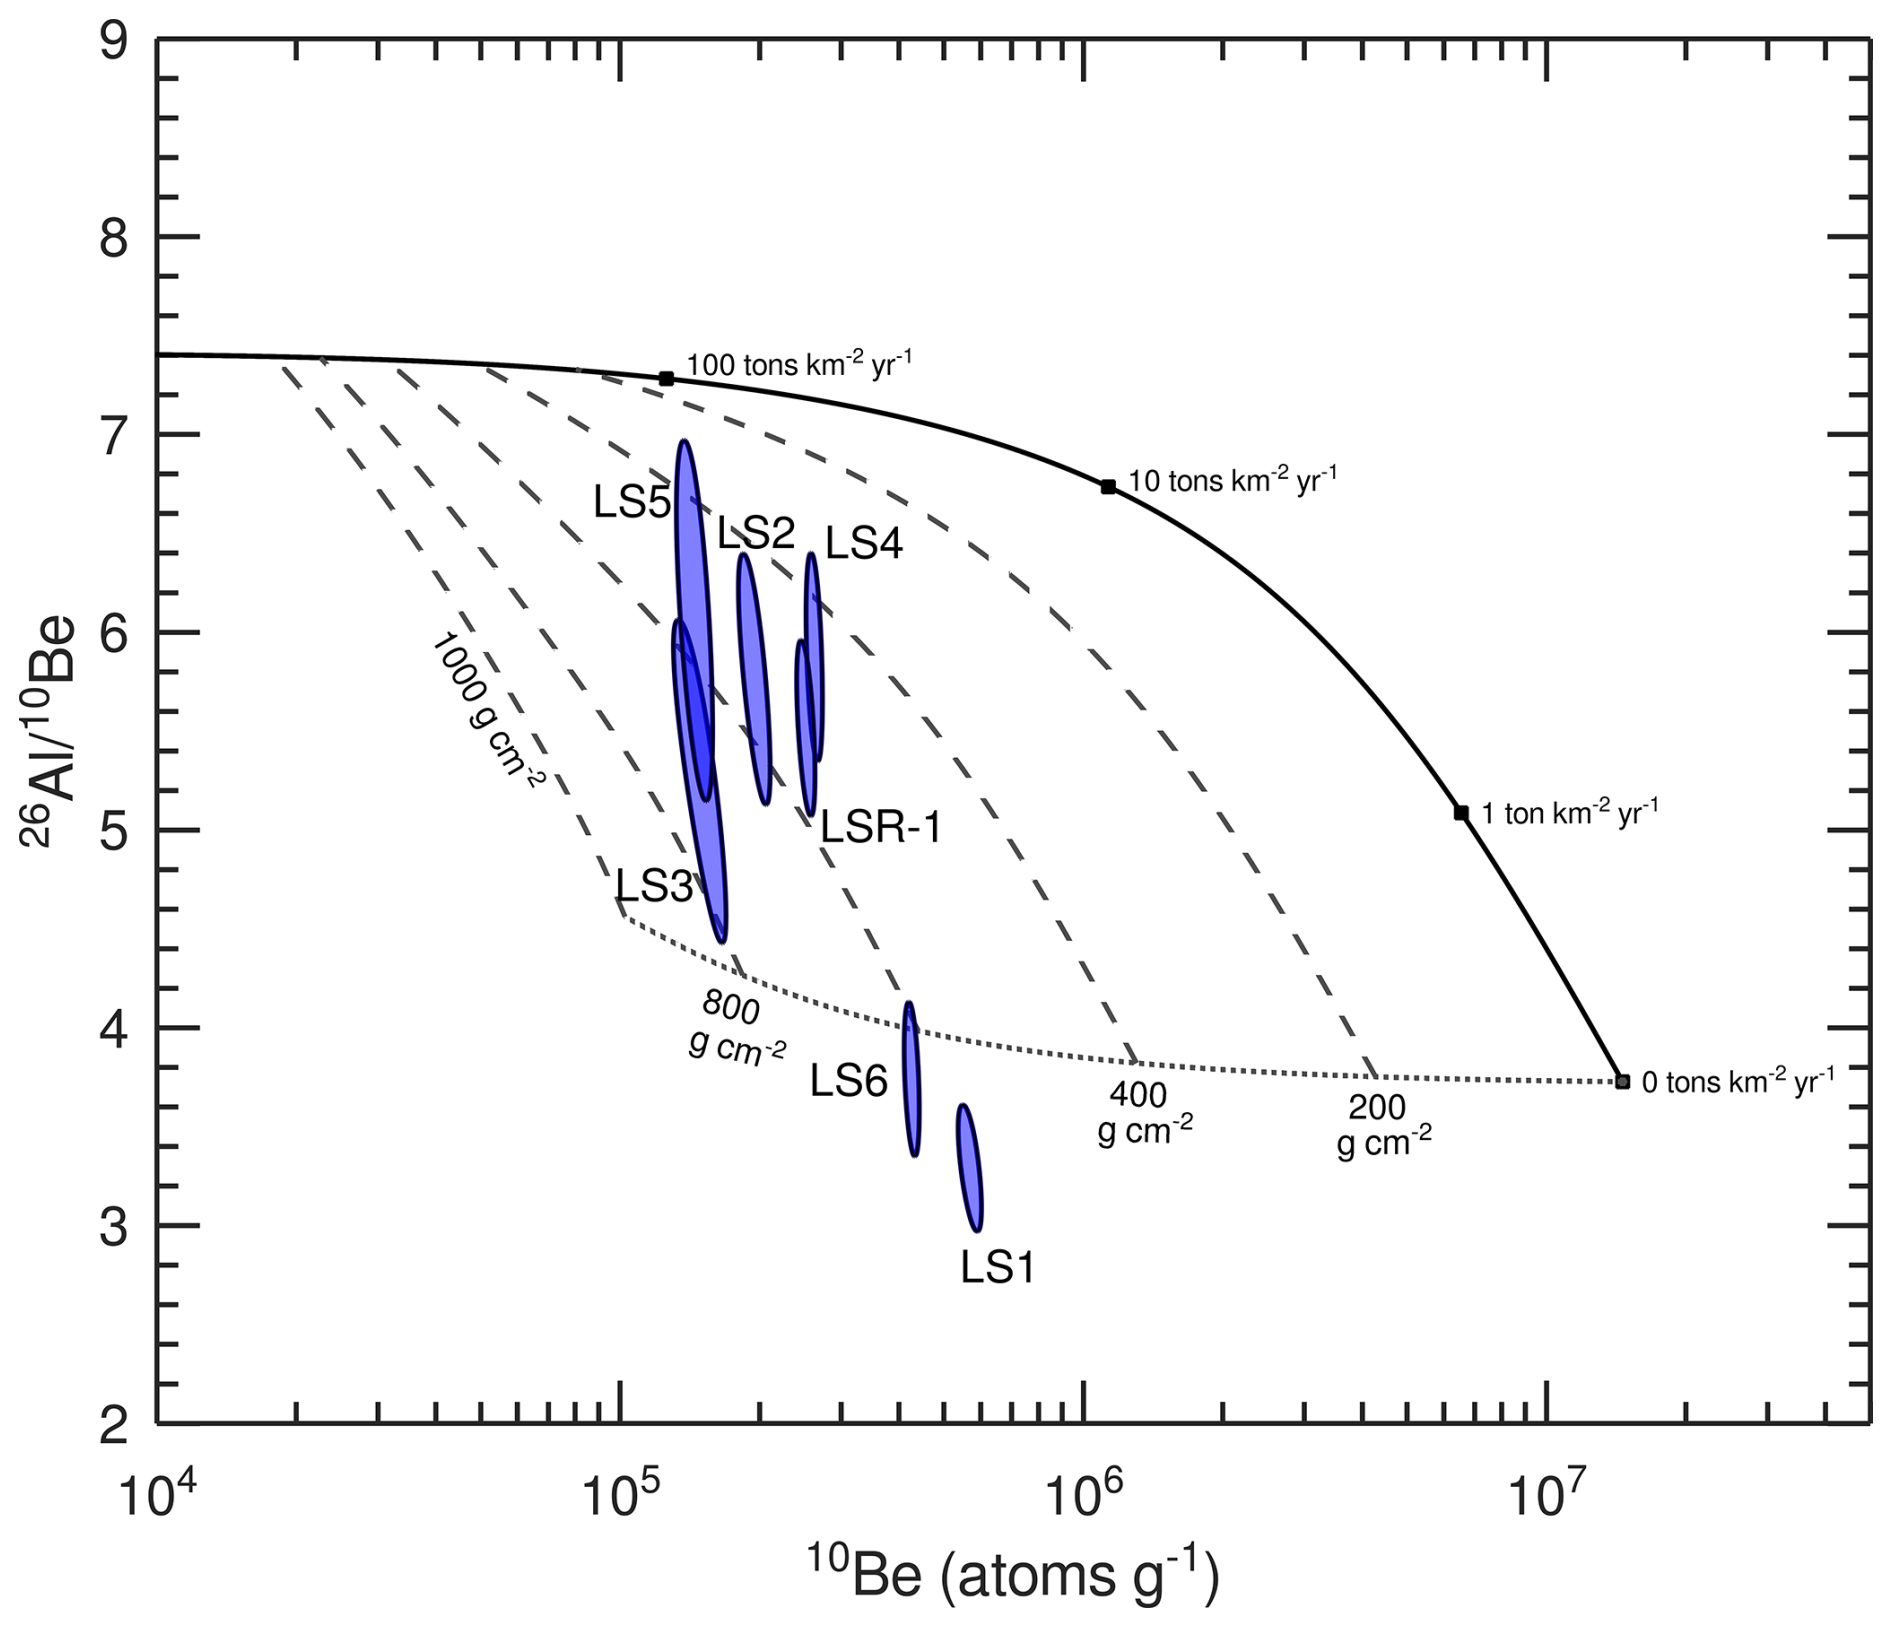
Figure 226Al 10Be two-nuclide plot for the six hillslope positions (LS1 to LS6) and the stream sediment (LSR-1). The black, solid line is the steady-state denudation line with no shielding by overburden. Dashed lines show the steady-state denudation line under shielding by different overburden mass-thicknesses (calculated using a spallation mean-free path of 160 g cm−2). The dotted line shows the secular equilibrium ratio, which curves upwards towards greater overburden thicknesses because of the increasing importance of muon-induced production that has a higher 26Al 10Be ratio. The error ellipses show the 95 % confidence interval and the data are plotted without normalization by shielding from the modern overburden.
4.3 Modelling results
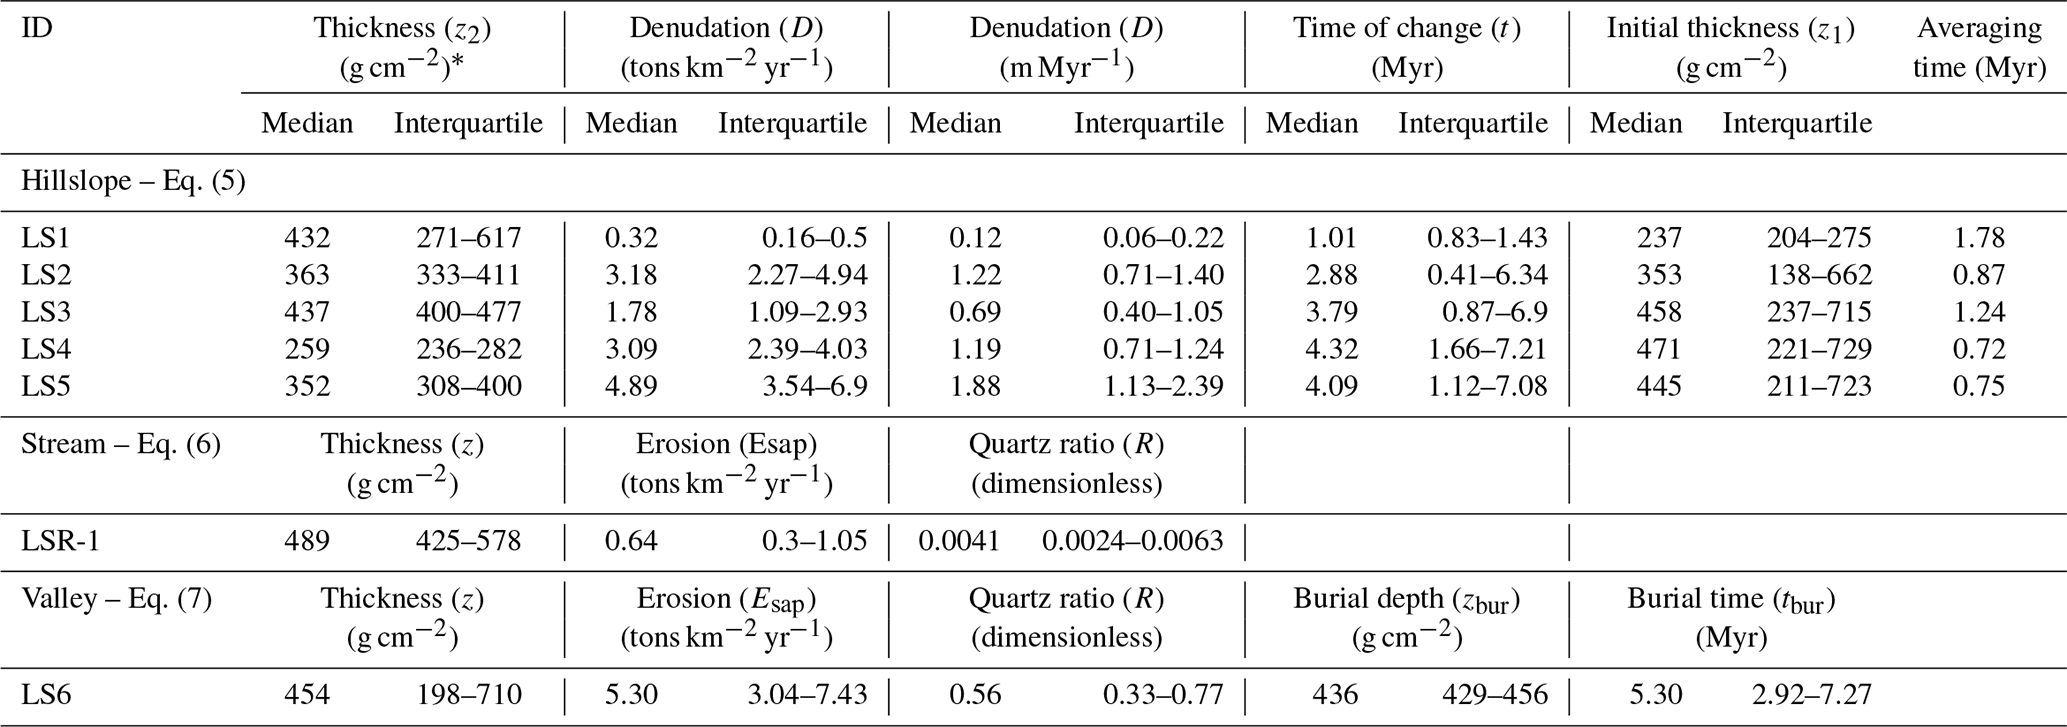
The results of the inverse-model for the hillslope transect are given in Table 3 and Figs. 3 and 4. The median modelled overburden thicknesses (z2) exceed modern overburden thicknesses by 190–350 g cm−2 along the hillslope transect. This is equivalent to ca. 1.8 to 3.4 m of peat at a saturated peat density of 1.04 g cm−3 (assuming 90 % porosity and a solids density of 1.4 g cm−3; Lal and Shukla, 2004). Inferred peat thickness is greatest at LS3, on the hill's shoulder, and least at LS4, where the hillslope is steepest. Under these thicknesses, spallation production is severely attenuated and muon reactions are proportionately more important to total production. Thus, the results are only weakly sensitive to the choice of spallation scaling model or reference production rate.
Table 3Best-fit parameter values from the Markov Chain Monte Carlo inversion.
* Corrected for mass of overburden between the sample and the contact between the saprolite and peat, assuming a density of saturated saprolite of 1.8 g cm−3.
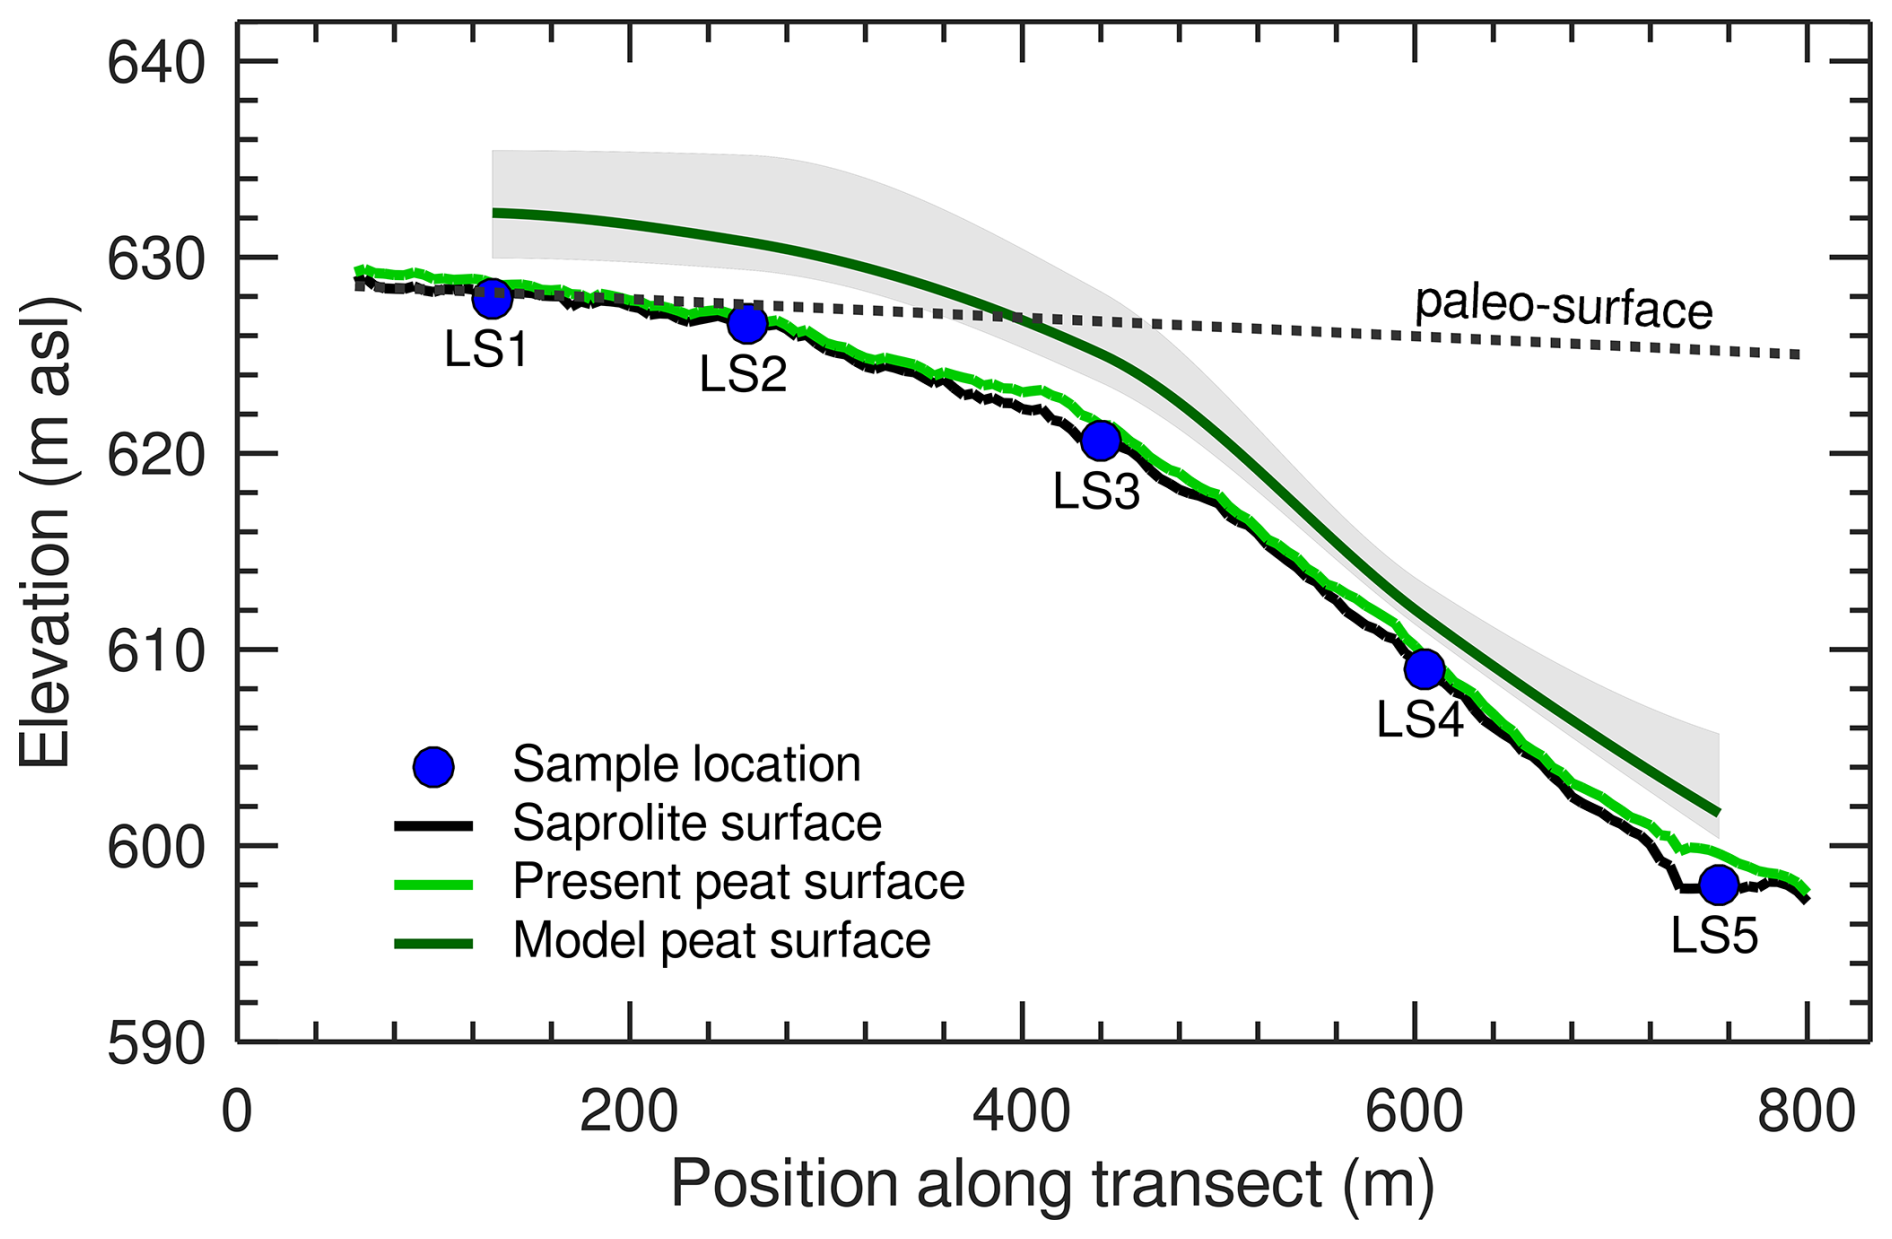
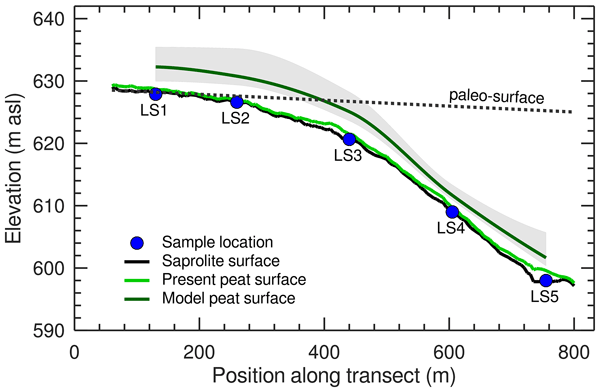
Figure 3Study hillslope cross section with 10× vertical exaggeration showing the five hillslope sample positions (LS1 to LS5). The black, solid line shows the elevation of the top of the saprolite surveyed with ground penetrating radar (Henrion et al., 2024). The light green line shows the elevation of the modern peat surface. The cosmogenic nuclide-based estimate of peat thickness, interpolated between measurement points, is shown by the dark green line and the 90 % confidence interval by the grey band. The dashed, black line shows the elevation and dip of the pre-Senonian surface (labeled paleo-surface).
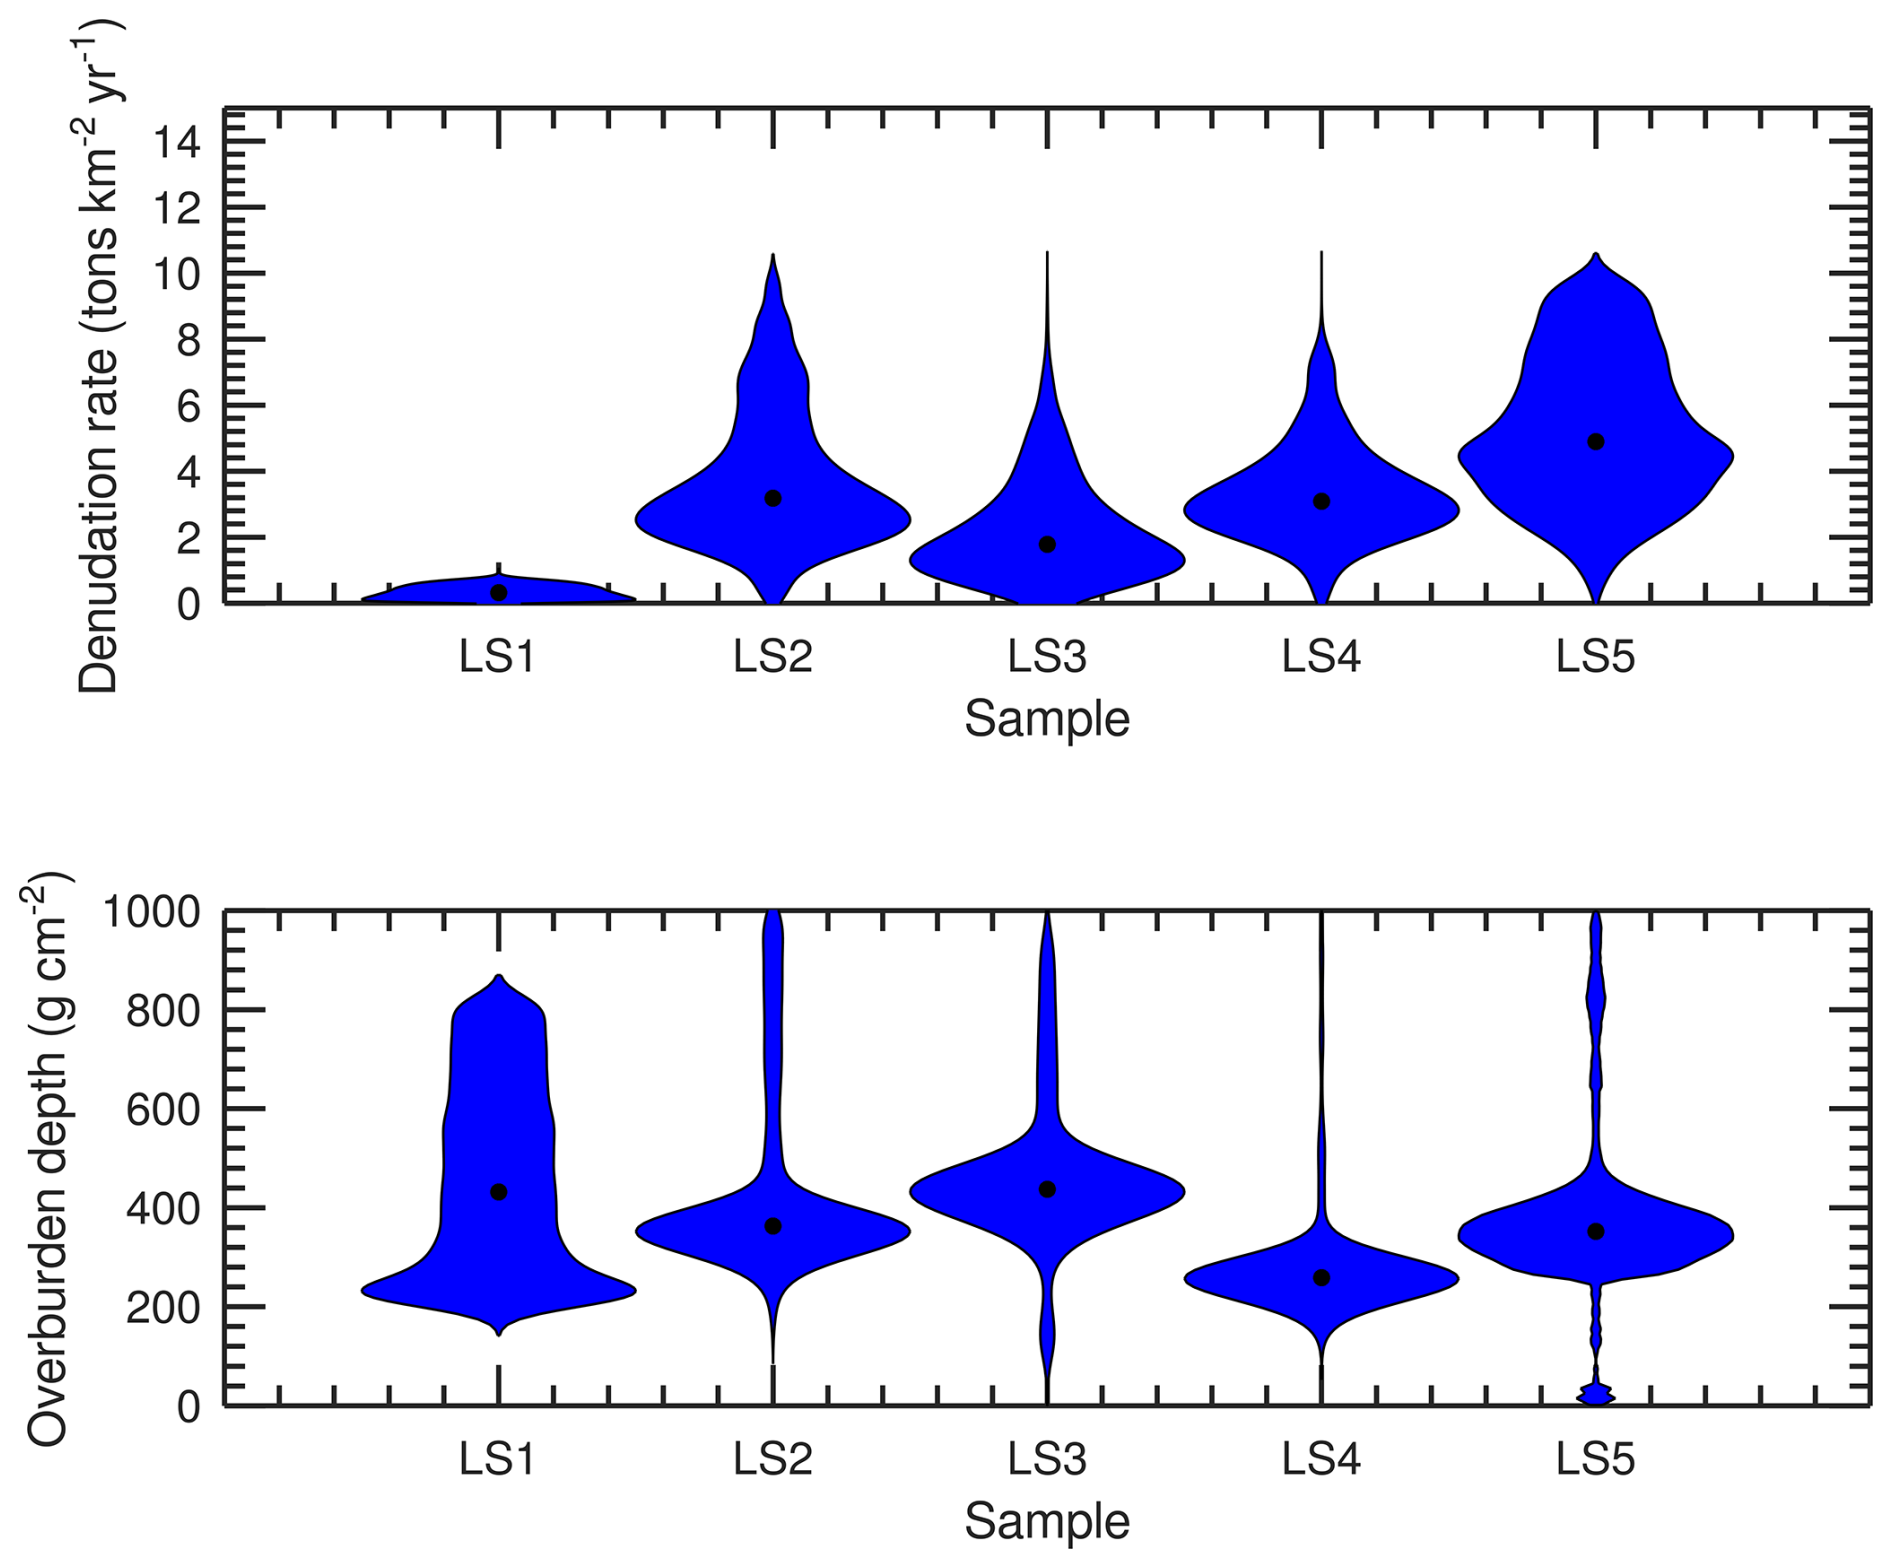
Figure 4Violin plots of the posterior distributions for the denudation rate of the saprolite and the overburden thickness, measured from the top of the saprolite, inferred from the Markov Chain Monte Carlo inversion for the five hillslope positions (LS1 to LS5). Black dots show the medians of the probability distributions.
Modelled denudation rates of the saprolite are low: a median rate of 0.32 tons km−2 yr−1 (equivalent to 0.12 m Myr−1 at a rock density of 2.6 g cm−3) was determined for the summit position (LS1) and median rates between 1.8 and 4.9 tons km−2 yr−1 (0.69 and 1.9 m Myr−1) for the four downslope positions. Integration timescales of the signal range between 0.72 and 1.8 Myr. The long integration timescales result from the slow denudation rates and the greater relative importance of muon-induced production under the peat layer (Table 3; Text S2). This implies that the denudation rates integrate over all glacial-interglacial cycles since the mid-Pleistocene and that any signal from climate-driven oscillations in denudation rate is highly damped. Denudation rate and overburden thickness covary negatively at LS2–LS5 (Fig. S2). Only the summit sample (LS1) clearly resolves a change in overburden thickness. The model for this sample indicates that overburden thickness increased at a median probability age of 1.0 Myr and a modal age of 0.93 Myr (Fig. 5). There is a trade-off between the time of the change and the overburden thickness after the change such that ages greater than ca. 1.4 Myr are allowable only at the lowest possible overburden thicknesses (Fig. S3). The signal integration timescales of LS2–LS5 are too short to fully capture this change.
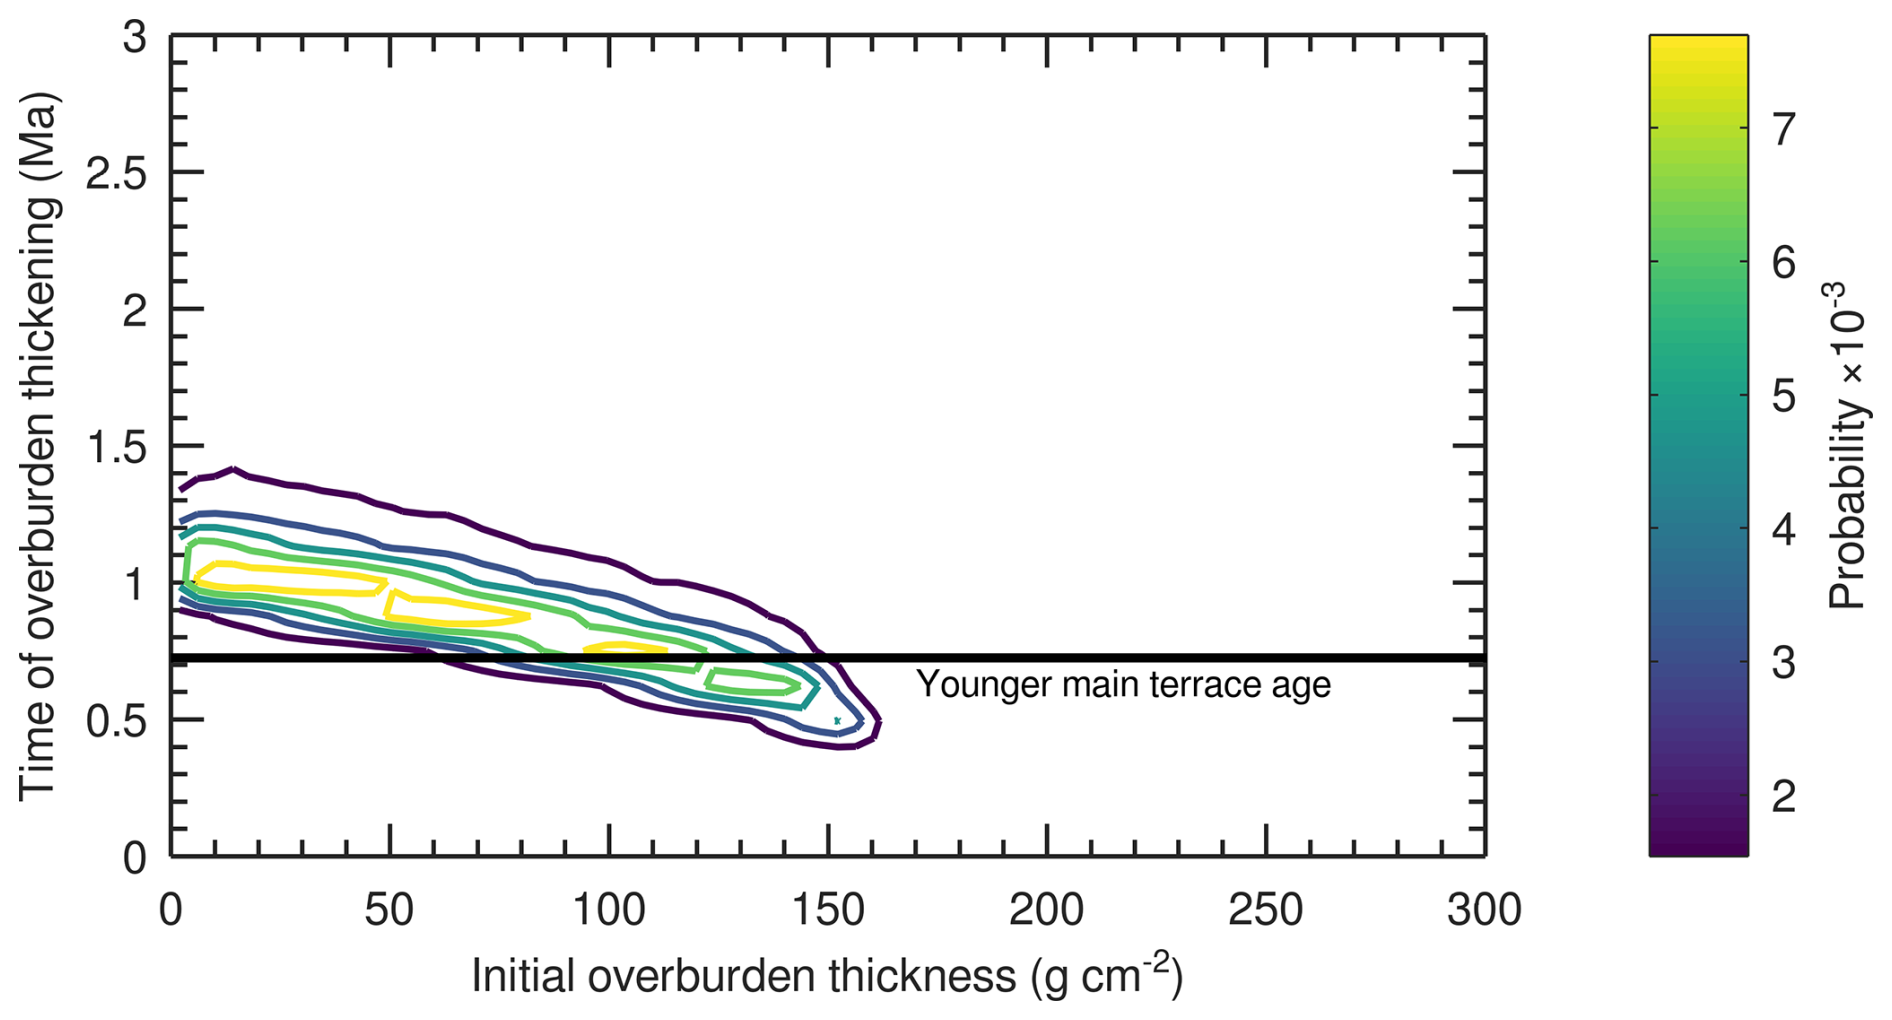
Figure 5Joint-distribution plot showing the original overburden thickness vs. timing of the overburden thickening event resolved by the Markov Chain Monte Carlo inversion for LS1. The initial overburden thickness has been corrected by the overburden mass between the sample and the contact between the saprolite and peat, assuming a density of saturated saprolite of 1.8 g cm−3. The thickening event may correspond to the onset of peat cover. The black line shows the younger main terrace age at Romont reported by Rixhon et al. (2011), a temporal marker of Ardennes uplift (Sect. 6.3).
Modeling of the stream sediment sample (LSR-1) is broadly consistent with a thick long-term peat layer and slow erosion rate at the watershed scale (Fig. 6). Inversion of the 26Al and 10Be concentrations using Eq. (6) gives a median catchment-averaged erosion rate of the saprolite of 0.64 tons km−2 yr−1 (equivalent to 0.49 m Myr−1 for a dry saprolite density of 1.3 g cm−3). The modelled median peat layer/saprolite quartz ratio is 4.1 × 10⁻³ and mixed layer depth 490 g cm−2 (equivalent to 4.7 m of saturated peat). The peat thickness and erosion rate covary negatively. Additionally, the posterior distribution is multi-modal and should be treated with caution (Sect. 5.4). For the valley-bottom sediment sample (LS6) modelled using Eq. (7), the erosion rate, quartz ratio, and mixed-layer thickness are essentially unconstrained, as is the burial age above 1 Ma (Table 3; Fig. S4). This indicates that the problem, which requires inverting for 5 parameters from two nuclide measurements, is non-identifiable. Measurement of additional nuclides would be required to constrain the model.
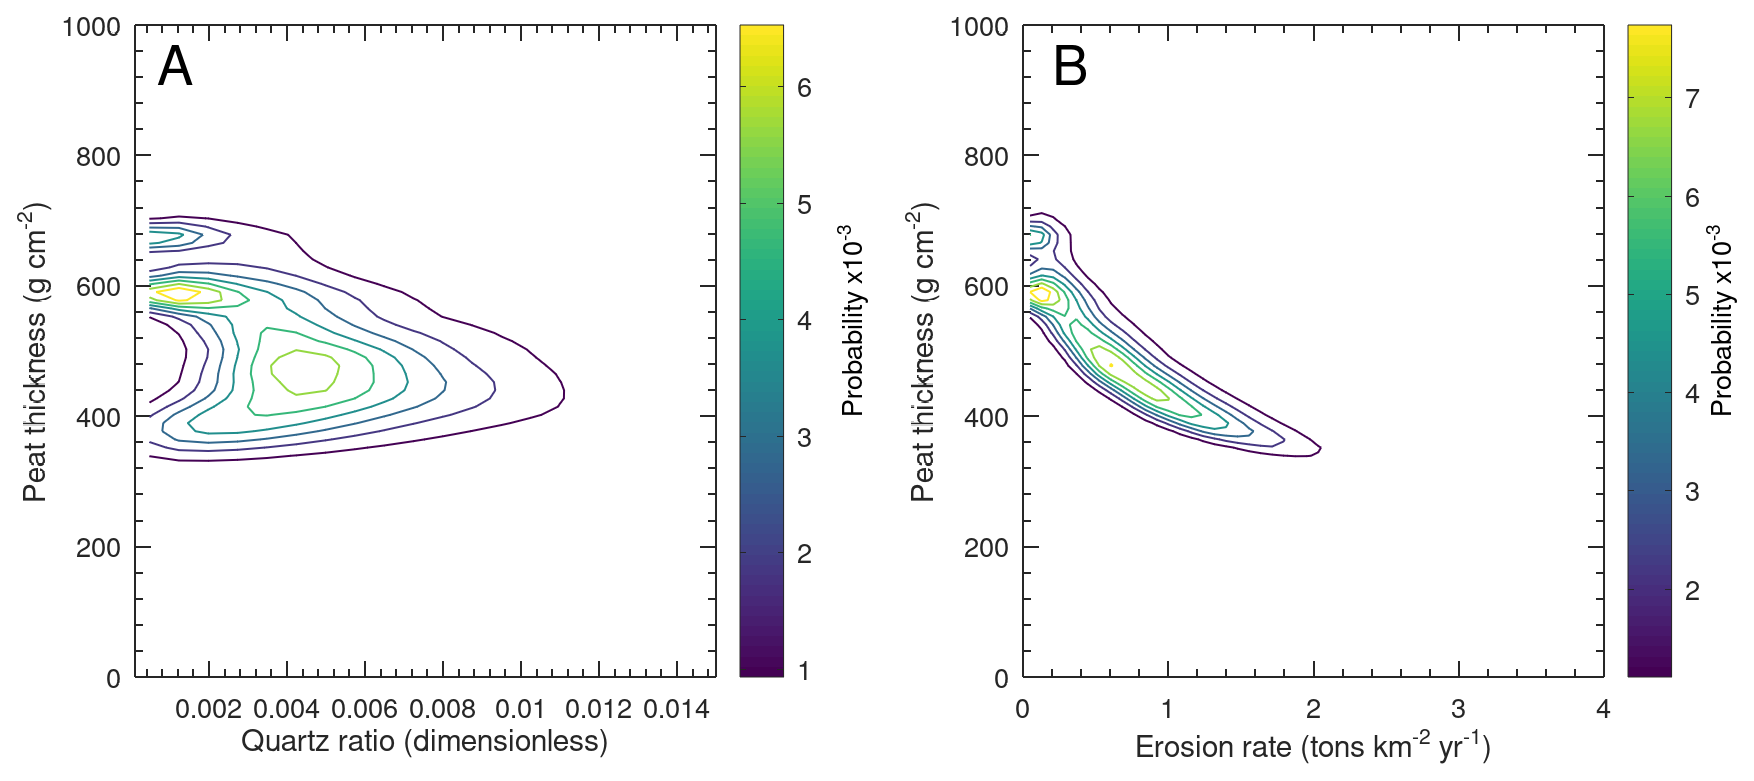
Figure 6Joint-distribution plots showing (A) the quartz ratio (saturated peat/saprolite) vs. the watershed-averaged saturated peat thickness (g cm−2) and (B) the saturated peat thickness vs. the erosion rate of the saprolite inferred from the Markov Chain Monte Carlo inversion of the stream sediment (LSR-1).
5.1 Evaluating modelled hillslope denudation rates
The modelled hillslope denudation rates are more than one order of magnitude below the global mean (Wittmann et al., 2020) and are similar to rates in extremely slowly denuding landscapes in the interior of Brazil (Shuster et al., 2012; Vasconcelos et al., 2019), Australia (Flatley et al., 2025; Struck et al., 2018), and South Africa (Richardson et al., 2025). Are such low rates consistent with independent evidence? The estimate of the watershed-averaged denudation rate from stream solute fluxes and regolith geochemistry is 7.2 tons km−2 yr−1 (2.8 m Myr−1) (Sect. 4.1), which agrees in order of magnitude with the mean of the median probability rates for the five hillslope positions (2.7 tons km−2 yr−1 or 1.0 m Myr−1). However, the climate of northwestern Europe during glacial periods was drier than modern climate (Kjellström et al., 2010; Strandberg et al., 2011). When considering that discharge over the timescales of regolith production and erosion, including glacial periods, was lower than modern discharge and that the solute-flux based denudation rate is therefore an upper estimate, the accordance between the two metrics may be even closer. Similarly, the cosmogenic nuclide denudation rate is likely a minimum bound, intermediate between the true denudation rate and the erosion rate. This is because some chemical weathering occurs below the depth of the sample (Riebe and Granger, 2013). If the solutes generated by this weathering are eventually discharged into the stream through groundwater flow, the weathering missed by the cosmogenic nuclide signal will be recorded in the solute flux. Thus, the denudation rates inferred from the hillslope cosmogenic nuclide model are broadly supported by the solute flux.
The magnitude and spatial patterns in denudation that emerge from the cosmogenic nuclide model also align with the geomorphic interpretation of the site as spanning a transition from a relict surface into a slowly incising valley. The lowest denudation rate (0.32 tons km−2 yr−1, 0.12 m Myr−1) was obtained at the summit position (LS1), which is located within the mapped extent of the pre-Senonian surface (Demoulin et al., 2018b). Preservation of supergene Mn-oxide minerals that yield Cretaceous K-Ar ages indicate that the down-wasting of this surface since the Cretaceous has been insufficient to completely strip the Mesozoic weathering profile (Demoulin et al., 2010). Although the surface's stability may be partly explained through burial by marine sedimentary cover for much of the Cenozoic, the denudation rate determined at the summit is consistent with minimal down-wasting during the Pleistocene. The downslope positions (LS2–LS5) have higher modelled denudation rates (3.2 tons km−2 yr−1, 1.2 m Myr−1), which supports the incision into the paleo-surface mapped in this area. This incision must have begun before Pleistocene uplift of the Ardennes because the Pleistocene knickzone on the Hoëgne is located downstream of the study area. This is consistent with the establishment of the Ardennian drainage network in the Late Miocene to Pliocene proposed by previous workers (Rixhon et al., 2020; Rixhon and Demoulin, 2018).
5.2 Long-term hillslope peat thickness
Given the low denudation rates, explaining the measured cosmogenic nuclide concentrations requires that the samples experienced greater shielding by overburden, averaged over their exposure histories, than is provided by the modern peat layer (Figs. 3 and 4). Across the transect, the difference between modeled and measured overburden thickness ranges from 190–350 g cm−2. Might snow or loess cover explain this signal, rather than a thicker peat blanket? On the Hautes Fagnes plateau, current snow thickness rarely exceeds 1 m (ca. 10 g cm−2 snow water equivalent). Even if maximum snow cover persisted for 3 months per year, mean annual snow shielding would amount to only 2.5 g cm−2, 2 orders of magnitude lower than the signal. The density of loess greatly exceeds that of snow, creating the potential for more substantial shielding. Accounting for the signal would require continuous cover of 1.1–2.0 m of loess over the integration timescale of the signal (assuming a saturated loess density of 1.8 g cm−3). In the central Belgian loess plain deposits exceed this depth (Haase et al., 2007), yet loess thicknesses diminish southwards towards the Ardennes (Rixhon et al., 2011) and, at present, no loess cover exists at the site (Lehmkuhl et al., 2021). Moreover, the peat layer contains a low ash (mineral) fraction, and the coarse bedload fraction (> 2 mm) of the stream sediment, which likely approximates watershed-averaged bedrock (Sect. 4.1), has TiO2 Zr ratios that are within the range of the saprolite's ratios (Data Tables in the Supplement; Moore, 2026), supporting that the saprolite originates from in situ weathering of bedrock. This implies that any loess cover deposited after the LGM on the study hillslope must have been sufficiently thin to be completely removed by Holocene erosion. Therefore, it is unlikely that snow or loess cover accounts for the bulk of the missing time-averaged overburden.
The Hautes Fagnes were under permafrost conditions at the LGM (Demoulin et al., 2018a; Lindgren et al., 2016; Pissart et al., 2011), and presumably during earlier glacial maxima. During these periods, segregation ice was likely present at the site and may have contributed to the overburden thickness. For example, the lithalsa ramparts preserved in the Hautes Fagnes are evidence for ice lenses several meters thick (Pissart et al., 2011). Still, the local nature of these lenses, which were ca. 10s of meters in diameter in the Hautes Fagnes area and widely spaced, makes them an unlikely source of the modeled signal, which is similar in magnitude across the hillslope. Furthermore, permafrost would have existed at the study site only near glacial maxima, limiting the time-averaged shielding effect. Thus, ground ice is also unlikely to fully account for the modeled overburden deficit.
The peat depths required to explain the signal are consistent with the limits to peat thickness predicted by theory. Climate in Belgium is modeled to have been broadly conducive to peat formation over most of the last glacial cycle (Marine Isotope Stages 5-2), and thus likely for most of the period since the mid-Pleistocene transition (Fig. S.5 in Treat et al., 2019). Over sufficiently long timescales peat thickness tends towards steady state, where inputs of organic matter are balanced by decomposition within the peat deposit (Clymo, 1984). The stability of peat is strongly controlled by the height of the water table, which is a function of net precipitation (P-ET) and the groundwater flow rate within the peat body. The latter depends on the hydraulic conductivity and head gradient. If peat is preserved in the long-term only below the water table, then a bog's surface topography will mimic the topography of the water table. This principle underlies the “groundwater-mound” model of bog morphology. In this model, the thickness and surface taper of a peat bog over a relatively impermeable substrate are explained by the need to accommodate a lateral water flux that increases with distance from the drainage divide, which requires a corresponding increase in the bog-surface (hydraulic head) gradient (Cobb et al., 2024; Ingram, 1982). The steady-state peat thickness at the center of a bog predicted by this model depends on the water balance, but is typically ca. 10 m.
The modeled long-term overburden thicknesses correspond to reasonable steady-state peat depths at the study site. Peat thicknesses greater than 8.5 m have been reported for raised bogs on plateau surfaces in the Hautes Fagnes (e.g., Misten Bog; Allan et al., 2013). These bogs must be at or below the modern steady-state peat thickness on a flat surface for the local climate. The median long-term peat thicknesses inferred from the cosmogenic nuclide model are below this threshold, reaching a maximum of 4.2 m at LS3 and a minimum of 2.5 m at LS4, consistent with the expectation of thinner peat on sloping landscapes. These thicknesses are broadly comparable to values reported for undisturbed blanket peat on similarly low-gradient slopes (< 3°) under comparable climatic conditions in, for example, the Wicklow Mountains of Ireland (Holden and Connolly, 2011). Additionally, the “groundwater mound” model requires that horizontal discharge increases linearly downslope from the drainage divide to accommodate water inputs across the bog's surface. The horizontal flux of water (Q) through a peat layer can be described using the Dupuit-Forchheimer approximation to Darcy's law (Belyea and Baird, 2006). In its simplest form, this gives Q = kDΔh, where k is hydraulic conductivity, D is peat thickness, and h is the hydraulic head (or surface) gradient. For spatially homogeneous hydraulic conductivity and net precipitation, the product of peat depth and the head/surface gradient must increase linearly downslope to accommodate the increasing discharge (Ingram, 1982). The product of the overburden thickness and surface gradient inferred from the cosmogenic nuclide model follows this trend (Fig. S5), indicating that the modeled long-term overburden thicknesses meet the physical constraints of a steady-state peatland.
The typical climate in northwestern Europe over the averaging timescale of the cosmogenic nuclide signal was colder and drier than the modern climate. How would cooler and drier conditions impact steady-state peat thickness? For example, modeling of European climate during a representative Marine Isotope Stage 3 stadial at 44 ka indicates that MAP was ca. 25 %–30 % lower and MAT ca. 5 °C lower than at present (Kjellström et al., 2010). If these relative differences are applicable at the scale of the Hautes Fagnes, then MAT was ca. 1.7 °C and MAP ca. 1050 mm yr−1. This places the site near the high-precipitation end of the distribution of peatlands in modern precipitation-temperature space (Cobb et al., 2024), and slightly above the temperature threshold for permafrost formation (MAT < 0 °C). Moreover, because ET at 44 ka would have been lower than modern ET (ca. 500 mm yr−1, Sect. 4.1) due to lower MAT, the precipitation to ET ratio would have exceeded 2.1, which is believed to be the threshold for blanket peat formation (Gallego-Sala and Prentice, 2013). In the “groundwater-mound” model, the steady-state peat thickness at the center of a bog is proportional to the square root of net precipitation (Ingram, 1982). Thus, a < 40 % reduction in net precipitation (> 550 mm yr−1 vs. 918 mm yr−1) during permafrost-free stadials would reduce the peat thickness by only ca. 20 % at the drainage divide. During even colder phases (e.g., the LGM) the site would have been under permafrost conditions. Under permafrost, peat stability ceases to be controlled by saturation and is instead maintained by low temperatures. This enables preservation of thick organic layers even under low precipitation rates. For example, in modern high-latitude permafrost, peat may extend to depths of greater than 3 m (Hugelius et al., 2013).
We suggest that the difference between the overburden thickness inferred from cosmogenic nuclides and the modern peat thicknesses measured by ground penetrating radar mostly reflects anthropogenic disturbance. The land use history of the Hautes Fagnes is well-documented in the historical and palynological records. Although cereal pollen is first detected in the Neolithic, evidence for human activity rises markedly in the High Middle Ages (the 13th century) and significant exploitation of the Hautes Fagnes peatlands began at this time (De Vleeschouwer et al., 2012). For example, extensive mowing and raking of litter and sphagnum for animal fodder and bedding, livestock grazing, slash-and-burn cultivation of rye on peat soils, and peat wildfires are documented in historical records and peat cores (Damblon, 1996; Froment, 1968). The net effect of these practices would have been to reduce the supply of fresh organic matter and shift the system to a negative mass balance, wherein peat decomposition exceeds litter inputs. The rate of anaerobic decay occurring below the water table is proportional to peat mass and a decay constant on the order of magnitude of 10−4 yr−1 (Clymo, 1984). For a peat layer with a thickness of 400 cm, this suggests loss of ca. 30 cm in 800 years, if the supply of fresh litter is shutoff. Peat extraction for fuel is also recorded in historical documents since the 16th century (Paulissen et al., 2021). Annual peat extraction from the Hautes Fagnes at the beginning of the 19th century is recorded as nearly 200 000 quintals (or ca. 200 000 m3 of peat at a density of 100 kg m−3) (Froment, 1968). As an illustrative calculation, if this rate of extraction was maintained from the beginning of the 16th to the end of the 19th century and distributed evenly across the 15 000 ha of peatland documented on the Hautes Fagnes plateau in the late 18th century (Froment, 1968), this would amount to 50 cm of peat loss. Because extraction likely targeted thick and accessible deposits, local losses could be significantly larger. Although no peat-cutting scars are evident in the study transect, it is possible that these were destroyed during drainage and afforestation in the early 20th century, which indisputably accelerated peat degradation. Peat subsidence rates in blanket and raised bogs after drainage and afforestation reported in the literature range from ca. 1 to 2 cm yr−1 (Adetsu et al., 2024; Oleszczuk et al., 2021; Shotbolt et al., 1998). If a similar rate were sustained since the early 20th century across the study transect, then this implies 1–2 m of peat subsidence. Thus, the combined effects of drainage, peat cutting, and other land-use practices may have driven > 2 m of peat loss. This likely explains most of the discrepancy between the modern measured and modeled long-term overburden thicknesses.
5.3 Onset of peat cover
The inverse-model for the summit position (LS1) indicates that this sample captures a secular thickening in the overburden. The greatest probability density for the timing of this change is between 1.4 and 0.8 Myr (inter-quartile range), with a median of 1.0, and a mode of 0.93 Myr (Table 3; Fig. 5). This may represent the initial development of a thick peat blanket at the study site. Interestingly, the timing of this event corresponds closely to the uplift of the Ardennes recorded by the fluvial terraces of the Meuse and Rhine rivers, which cross the Ardennes-Rhenish massif. Abandonment of the East Meuse valley and an increase in Meuse terrace gravel content indicate that gradual uplift began in the early Pleistocene (da Silva Guimaraes et al., 2024). An acceleration in uplift is recorded by the abandonment of the Younger main terrace, a prominent terrace at mid-elevation in the Meuse and Rhine valleys. This has been dated to 0.73 ± 0.12 Myr in the Meuse valley using cosmogenic nuclide depth-profile dating (Rixhon et al., 2011) and 0.52 ± 0.11 Myr in the Meuse valley and Myr in the Rhine valley using 26Al 10Be burial dating (da Silva Guimarães et al., 2026; Terraza et al., 2026). This uplift pulse, combined with the subsequent isostatic response to erosional unloading, amounted to ca. 100 m of total uplift in the vicinity of the Hautes Fagnes plateau (Demoulin and Hallot, 2009). The summit position (LS1) is presently at an elevation of 630 m above sea level and thus was at ca. 530 m immediately before the uplift pulse. Today, the cool, moist climate of the study area, which is conducive to peat accumulation, is a result of moist air from the Atlantic rising over the Hautes Fagnes plateau and the resulting orographic precipitation, persistent cloudiness, and low ET. These orographic effects become pronounced above ca. 500 m. This indicates that the site may have reached sufficient elevation for peat accumulation shortly preceding or during the uplift pulse recorded by the Younger main terrace. The modeled timing of the overburden thickening event is in good agreement with this interpretation. Although for simplicity the ca. 10 % increase in spallation production rates associated with 100 m of uplift has not been incorporated into the model, considering this change would modestly lower the initial overburden thickness estimate and not significantly impact the remaining parameters.
5.4 Stream sediment
The inversion of the stream sediment nuclide concentrations is roughly consistent with the inferences drawn from the hillslope samples. Converting the median probability catchment-averaged erosion rate of the saprolite (0.64 tons km−2 yr−1) to a denudation rate using the mean CDFSi on the study hillslope as an approximation of catchment-average bulk weathering intensity gives a denudation rate of 1.5 tons km−2 yr−1 (0.57 m Myr−1). This is intermediate between the denudation rate obtained at the summit position (0.32 tons km−2 yr−1/0.12 m Myr−1) and the mean of the downslope positions (3.2 tons km−2 yr−1/1.2 m Myr−1) and is of the same order of magnitude as the solute-flux based denudation rate (7.2 tons km−2 yr−1/2.8 m Myr−1). The median probability catchment-averaged peat thickness is 490 g cm−2 (4.7 m), greater than the mean of the modeled thicknesses along the hillslope of 370 g cm−2 (3.6 m) and consistent with thicker peat on the low-relief surface in the headwaters of the catchment (Fig. 1). The median quartz concentration ratio between the saturated peat layer and saprolite is low (4.1 × 10⁻³), which is expected for ombrotrophic peats with minimal input of mineral material from below.
Nevertheless, there are several problems with inferring catchment-scale process rates from detrital sediment at the study site that complicate the sediment model. Notably, the site violates the assumption that radioactive decay is negligible and that the nuclide concentration is a simple, inverse function of the denudation rate, which is required for basin averaging (Granger et al., 1996). Furthermore, the depressed 26Al 10Be ratio in the valley-bottom sediments indicates that storage times, at least locally, may be > 1 Myr (Fig. S4). Remobilization of fluvial sediments that experienced significant radioactive decay during storage has the potential to bias the results. Therefore, the results from the stream sediment should not be over-interpreted. Yet, they broadly caution against inferring bedrock erosion rates in peatland environments from the concentration of a single cosmogenic nuclide in fluvial sediment. At the study site, simple interpretation of the 10Be concentration in the stream sediment as an erosion rate gives 43.5 tons km−2 yr−1 (ca. 16.7 m Myr−1), which would overestimate the landscape lowering rate by an order of magnitude. Similarly depressed 26Al 10Be ratios in stream sediment and spuriously high single nuclide denudation rates have been reported in other European massifs, supporting this cautionary note (Jautzy et al., 2024).
To investigate long-term peat thickness and landscape evolution, we examined 26Al and 10Be concentrations in quartz from saprolite underlying a peat-mantled hillslope and from stream sediment in the Hautes Fagnes of the Belgian Ardennes. Measured 26Al 10Be ratios are below those expected for steady-state denudation under the modern peat cover. This is evidence of thicker peat in the past. Inverse modeling of the cosmogenic nuclide concentrations indicates that median probability overburden thicknesses over the last several glacial cycles exceeded modern thicknesses by 190 to 350 g cm−2 (ca. 1.8–3.4 m of peat). We suggest that peat degradation due to human land use since the medieval period, and especially drainage and afforestation during the 20th century, are the primary sources of this discrepancy. The modeled denudation rates show that the study site is experiencing a transient wave of incision into a stable, low-relief surface, but that incision rates since the mid-Pleistocene remain low. Low rates are consistent with qualitative geomorphological interpretations, K-Ar weathering-profile geochronology, and a catchment-averaged denudation rate inferred independently from stream-solute mass balance. Significantly, the modeled denudation/erosion rates on both the hillslope and catchment scale are an order of magnitude lower than would be inferred from 10Be concentrations alone, assuming that the modern peat cover represents the long-term, steady state overburden thickness. Finally, the inverse-modeling indicates that an overburden-thickening event occurred with peak probability density between 1.4 and 0.8 Ma. We attribute this to the onset of peat cover at the study site, which was likely associated with contemporaneous Ardennes uplift and local climate cooling and humidification.
This work demonstrates the potential for paired cosmogenic nuclides to constrain peat thickness averaged over multiple glacial-interglacial cycles. Key to this analysis, is that the process rates in the landscape are sufficiently slow for differential radioactive decay between 26Al and 10Be to be important (< 10 tons km−2 yr−1 or ca. 4 m Myr−1). Thus, this approach may be suitable for studying long-term peat thickness in other slowly denuding landscapes that were not affected by Pleistocene glaciation (e.g., the moorlands of southwestern Britain), or tropical peatlands in slowly eroding, cratonic environments (e.g., Amazonia or the Congo). In situ 14C paired with 10Be represents an especially promising direction for future studies of peatlands because the short half-life of 14C should allow long-term peat thicknesses to be resolved where process rates are faster and potentially in formerly glaciated landscapes.
All research data, including measured isotopic ratios, Al concentrations, cosmogenic nuclide laboratory data, regolith and solute geochemistry, and stream discharges, as well as the codes used for the inverse-modeling and to make the figures in this manuscript are archived in the Zenodo repository at https://doi.org/10.5281/zenodo.21630161 (Moore, 2026).
The supplement related to this article is available online at https://doi.org/10.5194/esurf-14-763-2026-supplement.
FJ, SL, KVO, SO, and VV acquired funding. AM and VV designed the study and AM, MH, YL, EdBdA, and VV conducted laboratory or field work. PG and MC provided the AMS measurements. AM developed the formal analysis and wrote the manuscript. All authors contributed to review and editing.
At least one of the (co-)authors is a member of the editorial board of Earth Surface Dynamics. The peer-review process was guided by an independent editor, and the authors also have no other competing interests to declare.
Publisher's note: Copernicus Publications remains neutral with regard to jurisdictional claims made in the text, published maps, institutional affiliations, or any other geographical representation in this paper. The authors bear the ultimate responsibility for providing appropriate place names. Views expressed in the text are those of the authors and do not necessarily reflect the views of the publisher.
The authors would like to thank the Département de la Nature et des Forêts (DNF), Joël Verdin, and Manuel Lemaire for giving access to the study site, Adil Thami and Sébastien François for assistance sampling, and Richard Ott, Gilles Rixhon, and an anonymous referee for reviews that helped improve this manuscript.
This work is part of LandSense, Action de Recherche Concertée no. 21/26–119, funded by the Communauté française de Belgique. Angus Moore was supported in part by a Belgian American Educational Foundation (BAEF) research fellowship. Kristof van Oost, Sophie Opfergelt, and Sébastien Lambot were supported by the Fonds de la Recherche Scientifique (FNRS).
This paper was edited by Dirk Scherler and reviewed by Richard Ott, Gilles Rixhon, and one anonymous referee.
Abdalla, M., Hastings, A., Truu, J., Espenberg, M., Mander, Ü., and Smith, P.: Emissions of methane from northern peatlands: a review of management impacts and implications for future management options, Ecol. Evol., 6, 7080–7102, https://doi.org/10.1002/ece3.2469, 2016.
Adetsu, D. V., Koganti, T., Petersen, R. J., Zak, D., Nilsson, I.-E. F., Hoffman, C. C., Beucher, A., and Greve, M. H.: Estimating the soil subsidence and carbon losses from long-term anthropogenic use of peatlands: a case study on a Danish raised bog, Mires Peat, 31, 10, https://doi.org/10.19189/MaP.2023.OMB.Sc.2328103, 2024.
Allan, M., Le Roux, G., Piotrowska, N., Beghin, J., Javaux, E., Court-Picon, M., Mattielli, N., Verheyden, S., and Fagel, N.: Mid- and late Holocene dust deposition in western Europe: the Misten peat bog (Hautes Fagnes – Belgium), Clim. Past, 9, 2285–2298, https://doi.org/10.5194/cp-9-2285-2013, 2013.
Andersen, J. L., Newall, J. C., Fredin, O., Glasser, N. F., Lifton, N. A., Stuart, F. M., Fabel, D., Caffee, M., Pedersen, V. K., Koester, A. J., Suganuma, Y., Harbor, J. M., and Stroeven, A. P.: A topographic hinge-zone divides coastal and inland ice dynamic regimes in East Antarctica, Communications Earth & Environment, 4, 1–12, https://doi.org/10.1038/s43247-022-00673-6, 2023.
Balco, G.: Production rate calculations for cosmic-ray-muon-produced 10Be and 26Al benchmarked against geological calibration data, Quat. Geochronol., 39, 150–173, https://doi.org/10.1016/j.quageo.2017.02.001, 2017.
Beckers, A., Bovy, B., Hallot, E., and Demoulin, A.: Controls on knickpoint migration in a drainage network of the moderately uplifted Ardennes Plateau, Western Europe, Earth Surf. Proc. Land., 40, 357–374, https://doi.org/10.1002/esp.3638, 2015.
Belyea, L. R. and Baird, A. J.: Beyond “the limits to peat bog growth”: cross-scale feedback in peatland development, Ecol. Monogr., 76, 299–322, https://doi.org/10.1890/0012-9615(2006)076[0299:BTLTPB]2.0.CO;2, 2006.
Borchers, B., Marrero, S., Balco, G., Caffee, M., Goehring, B., Lifton, N., Nishiizumi, K., Phillips, F., Schaefer, J., and Stone, J.: Geological calibration of spallation production rates in the CRONUS-Earth project, Quat. Geochronol., 31, 188–198, https://doi.org/10.1016/j.quageo.2015.01.009, 2016.
Christl, M., Vockenhuber, C., Kubik, P. W., Wacker, L., Lachner, J., Alfimov, V., and Synal, H.-A.: The ETH Zurich AMS facilities: performance parameters and reference materials, Nucl. Instrum. Meth. B, 294, 29–38, https://doi.org/10.1016/j.nimb.2012.03.004, 2013.
Clymo, R. S.: The limits to peat bog growth, Philos. T. Roy. Soc. Lon. B, 303, 605–654, 1984.
Cobb, A. R., Dommain, R., Yeap, K., Hannan, C., Dadap, N. C., Bookhagen, B., Glaser, P. H., and Harvey, C. F.: A unified explanation for the morphology of raised peatlands, Nature, 625, 79–84, https://doi.org/10.1038/s41586-023-06807-w, 2024.
Corbett, L. B., Bierman, P. R., Rood, D. H., Caffee, M. W., Lifton, N. A., and Woodruff, T. E.: Cosmogenic 26Al 10Be surface production ratio in Greenland, Geophys. Res. Lett., 44, 1350–1359, https://doi.org/10.1002/2016GL071276, 2017.
Damblon, F.: Les dépôts tourbeux et l'histoire de la végétation sur le plateau des Hautes-Fagnes (Belgique), Annals of the Geological Society of Belgium, 117, 259–276, 1996.
da Silva Guimarães, E., Busschers, F. S., Kasse, C., Van Haren, T., Menkovic, A., and Van Balen, R. T.: Quaternary tectonic and climatic forcing on the spatio-temporal evolution of the Meuse fluvial terrace staircase, Geomorphology, 459, 109270, https://doi.org/10.1016/j.geomorph.2024.109270, 2024.
da Silva Guimarães, E., Busschers, F., Roda-Boluda, D., Akçar, N., Schlunegger, F., Kasse, C., Demoulin, A., Vockenhuber, C., Christl, M., and Van Balen, R.: Mid-Pleistocene uplift-induced acceleration of incision in the lower Meuse valley constrained by cosmogenic burial ages, Quaternary Sci. Rev., 383, 109978, https://doi.org/10.1016/j.quascirev.2026.109978, 2026.
Demoulin, A. and Hallot, E.: Shape and amount of the Quaternary uplift of the western Rhenish shield and the Ardennes (western Europe), Tectonophysics, 474, 696–708, https://doi.org/10.1016/j.tecto.2009.05.015, 2009.
Demoulin, A., Quesnel, F., Dupuis, C., Gerrienne, P., and Yans, J.: Cenomanian sands and clays north of the Vesdre valley: the oldest known Cretaceous deposits in eastern Belgium, Geol. Belg., 13, 241–256, https://popups.uliege.be/1374-8505/index.php?id=3003 (last access: 2 January 2026), 2010.
Demoulin, A., Juvigné, E., and Houbrechts, G.: The periglacial ramparted depressions of the Hautes Fagnes Plateau: traces of Late Weichselian lithalsas, in: Landscapes and Landforms of Belgium and Luxembourg, edited by: Demoulin, A., Springer International Publishing, Cham, 101–113, https://doi.org/10.1007/978-3-319-58239-9_7, 2018a.
Demoulin, A., Barbier, F., Dekoninck, A., Verhaert, M., Ruffet, G., Dupuis, C., and Yans, J.: Erosion surfaces in the Ardenne–Oesling and their associated kaolinic weathering mantle, in: Landscapes and Landforms of Belgium and Luxembourg, edited by: Demoulin, A., Springer International Publishing, Cham, 63–84, https://doi.org/10.1007/978-3-319-58239-9_5, 2018b.
De Vleeschouwer, F., Pazdur, A., Luthers, C., Streel, M., Mauquoy, D., Wastiaux, C., Le Roux, G., Moschen, R., Blaauw, M., Pawlyta, J., Sikorski, J., and Piotrowska, N.: A millennial record of environmental change in peat deposits from the Misten bog (East Belgium), Quatern. Int., 268, 44–57, https://doi.org/10.1016/j.quaint.2011.12.010, 2012.
Flatley, A., May, J.-H., Fujioka, T., Rutherfurd, I., and Fink, D.: Investigating sediment dynamics and landscape change processes in the semi-arid Pilbara, Western Australia – insights using paired cosmogenic 26Al 10Be ratios, Earth Surf. Proc. Land., 50, e70144, https://doi.org/10.1002/esp.70144, 2025.
Froment, A.: L'ancienne économie rurale de l'Ardenne et son incidence sur la végétation des Hautes Fagnes, Bull. Soc. Géogr. Liège, 4, https://popups.uliege.be/0770-7576/index.php?id=4833 (last access: 26 August 2025), 1968.
Gallego-Sala, A. V. and Prentice, I.: Blanket peat biome endangered by climate change, Nat. Clim. Change, 3, 152–155, https://doi.org/10.1038/nclimate1672, 2013.
Gautschi, P.: Accelerator mass spectrometry below 300 kV, Doctoral thesis, ETH Zurich, https://doi.org/10.3929/ethz-b-000671466, 2024.
Goemaere, E., Demarque, S., Dreesen, R., and Declercq, P.-Y.: The geological and cultural heritage of the Caledonian Stavelot-Venn Massif, Belgium, Geoheritage, 8, 211–233, https://doi.org/10.1007/s12371-015-0155-y, 2016.
Gorham, E.: Northern peatlands: role in the carbon cycle and probable responses to climatic warming, Ecol. Appl., 1, 182–195, https://doi.org/10.2307/1941811, 1991.
Granger, D. E., Kirchner, J. W., and Finkel, R.: Spatially averaged long-term erosion rates measured from in situ-produced cosmogenic nuclides in alluvial sediment, J. Geol., 104, 249–257, https://doi.org/10.1086/629823, 1996.
Haase, D., Fink, J., Haase, G., Ruske, R., Pécsi, M., Richter, H., Altermann, M., and Jäger, K.-D.: Loess in Europe – its spatial distribution based on a European Loess Map, scale 1:2,500,000, Quaternary Sci. Rev., 26, 1301–1312, https://doi.org/10.1016/j.quascirev.2007.02.003, 2007.
Halsted, C. T., Bierman, P. R., and Balco, G.: Empirical evidence for latitude and altitude variation of the in situ cosmogenic 26Al 10Be production ratio, Geosciences, 11, 402, https://doi.org/10.3390/geosciences11100402, 2021.
Henrion, M., Li, Y., Koganti, T., Bechtold, M., Jonard, F., Opfergelt, S., Vanacker, V., Van Oost, K., and Lambot, S.: Mapping and monitoring peatlands in the Belgian Hautes Fagnes: insights from ground-penetrating radar and electromagnetic induction characterization, Geoderma Reg., 37, e00795, https://doi.org/10.1016/j.geodrs.2024.e00795, 2024.
Henrion, M., Li, Y., Wu, K., Jonard, F., Opfergelt, S., Vanacker, V., Van Oost, K., and Lambot, S.: Drone-borne ground-penetrating radar reveals spatiotemporal moisture dynamics in peatland root zones, Sci. Remote Sens., 12, 100311, https://doi.org/10.1016/j.srs.2025.100311, 2025.
Hippe, K., Jansen, J. D., Skov, D. S., Lupker, M., Ivy-Ochs, S., Kober, F., Zeilinger, G., Capriles, J. M., Christl, M., Maden, C., Vockenhuber, C., and Egholm, D. L.: Cosmogenic in situ 14C-10Be reveals abrupt Late Holocene soil loss in the Andean Altiplano, Nat. Commun., 12, 2546, https://doi.org/10.1038/s41467-021-22825-6, 2021.
Holden, N. M. and Connolly, J.: Estimating the carbon stock of a blanket peat region using a peat depth inference model, CATENA, 86, 75–85, https://doi.org/10.1016/j.catena.2011.02.002, 2011.
Hugelius, G., Bockheim, J. G., Camill, P., Elberling, B., Grosse, G., Harden, J. W., Johnson, K., Jorgenson, T., Koven, C. D., Kuhry, P., Michaelson, G., Mishra, U., Palmtag, J., Ping, C.-L., O'Donnell, J., Schirrmeister, L., Schuur, E. A. G., Sheng, Y., Smith, L. C., Strauss, J., and Yu, Z.: A new data set for estimating organic carbon storage to 3 m depth in soils of the northern circumpolar permafrost region, Earth Syst. Sci. Data, 5, 393–402, https://doi.org/10.5194/essd-5-393-2013, 2013.
Ingram, H.: Size and shape in raised mire ecosystems: a geophysical model, Nature, 297, 300–303, https://doi.org/10.1038/297300a0, 1982.
Jautzy, T., Rixhon, G., Braucher, R., Delunel, R., Valla, P. G., Schmitt, L., and ASTER Team: Cosmogenic (un-)steadiness revealed by paired-nuclide catchment-wide denudation rates in the formerly half-glaciated Vosges Mountains (NE France), Earth Planet. Sc. Lett., 625, 118490, https://doi.org/10.1016/j.epsl.2023.118490, 2024.
Joosten, H. and Couwenberg, J.: Peatlands and carbon, in: Assessment on Peatlands, Biodiversity and Climate Change, 99–117, ISBN 978-983-43751-0-2, 2008.
Kjellström, E., Brandefelt, J., Näslund, J.-O., Smith, B., Strandberg, G., Voelker, A. H. L., and Wohlfarth, B.: Simulated climate conditions in Europe during the Marine Isotope Stage 3 stadial, Boreas, 39, 436–456, https://doi.org/10.1111/j.1502-3885.2010.00143.x, 2010.
Kleinen, T., Brovkin, V., and Munhoven, G.: Modelled interglacial carbon cycle dynamics during the Holocene, the Eemian and Marine Isotope Stage (MIS) 11, Clim. Past, 12, 2145–2160, https://doi.org/10.5194/cp-12-2145-2016, 2016.
Lal, D.: Cosmic ray labeling of erosion surfaces: in situ nuclide production rates and erosion models, Earth Planet. Sc. Lett., 104, 424–439, https://doi.org/10.1016/0012-821X(91)90220-C, 1991.
Lal, R. and Shukla, M. K.: Principles of Soil Physics, CRC Press, https://doi.org/10.4324/9780203021231, 2004.
Lehmkuhl, F., Nett, J. J., Pötter, S., Schulte, P., Sprafke, T., Jary, Z., Antoine, P., Wacha, L., Wolf, D., Zerboni, A., Hošek, J., Marković, S. B., Obreht, I., Sümegi, P., Veres, D., Zeeden, C., Boemke, B., Schaubert, V., Viehweger, J., and Hambach, U.: Loess landscapes of Europe – mapping, geomorphology, and zonal differentiation, Earth Sci. Rev., 215, 103496, https://doi.org/10.1016/j.earscirev.2020.103496, 2021.
Li, Y., Henrion, M., Moore, A., Lambot, S., Opfergelt, S., Vanacker, V., Jonard, F., and Van Oost, K.: Factors controlling peat soil thickness and carbon storage in temperate peatlands based on UAV high-resolution remote sensing, Geoderma, 449, 117009, https://doi.org/10.1016/j.geoderma.2024.117009, 2024.
Lifton, N., Sato, T., and Dunai, T. J.: Scaling in situ cosmogenic nuclide production rates using analytical approximations to atmospheric cosmic-ray fluxes, Earth Planet. Sc. Lett., 386, 149–160, https://doi.org/10.1016/j.epsl.2013.10.052, 2014.
Lindgren, A., Hugelius, G., Kuhry, P., Christensen, T. R., and Vandenberghe, J.: GIS-based maps and area estimates of Northern Hemisphere permafrost extent during the Last Glacial Maximum, Permafrost Periglac., 27, 6–16, https://doi.org/10.1002/ppp.1851, 2016.
Loisel, J., Gallego-Sala, A. V., Amesbury, M. J., Magnan, G., Anshari, G., Beilman, D. W., Benavides, J. C., Blewett, J., Camill, P., Charman, D. J., Chawchai, S., Hedgpeth, A., Kleinen, T., Korhola, A., Large, D., Mansilla, C. A., Müller, J., van Bellen, S., West, J. B., Yu, Z., Bubier, J. L., Garneau, M., Moore, T., Sannel, A. B. K., Page, S., Väliranta, M., Bechtold, M., Brovkin, V., Cole, L. E. S., Chanton, J. P., Christensen, T. R., Davies, M. A., De Vleeschouwer, F., Finkelstein, S. A., Frolking, S., Gałka, M., Gandois, L., Girkin, N., Harris, L. I., Heinemeyer, A., Hoyt, A. M., Jones, M. C., Joos, F., Juutinen, S., Kaiser, K., Lacourse, T., Lamentowicz, M., Larmola, T., Leifeld, J., Lohila, A., Milner, A. M., Minkkinen, K., Moss, P., Naafs, B. D. A., Nichols, J., O'Donnell, J., Payne, R., Philben, M., Piilo, S., Quillet, A., Ratnayake, A. S., Roland, T. P., Sjögersten, S., Sonnentag, O., Swindles, G. T., Swinnen, W., Talbot, J., Treat, C., Valach, A. C., West, J. B., and Wu, J.: Expert assessment of future vulnerability of the global peatland carbon sink, Nat. Clim. Change, 11, 70–77, https://doi.org/10.1038/s41558-020-00944-0, 2021.
MacDonald, G. M., Beilman, D. W., Kremenetski, K. V., Sheng, Y., Smith, L. C., and Velichko, A. A.: Rapid early development of circumarctic peatlands and atmospheric CH4 and CO2 variations, Science, 314, 285–288, https://doi.org/10.1126/science.1131722, 2006.
Marion, J.-M., Geukens, F., and Lamberty, P.: Sart-Xhoffraix. Carte géologique de Wallonie. 50/1-2, Notice explicative, SPW/Editions, Jambes (Namur), Belgium, University of Liège repository, 93 pp., https://hdl.handle.net/2268/219313 (last access: 27 June 2026), 2018.
Marrero, S. M., Phillips, F. M., Borchers, B., Lifton, N., Aumer, R., and Balco, G.: Cosmogenic nuclide systematics and the CRONUScalc program, Quat. Geochronol., 31, 160–187, https://doi.org/10.1016/j.quageo.2015.09.005, 2016.
Meyer, W. and Stets, J.: Pleistocene to Recent tectonics in the Rhenish Massif (Germany), Neth. J. Geosci., 81, 217–221, https://doi.org/10.1017/S0016774600022460, 2002.
Moore, A.: Geochemistry data from the Hautes Fagnes, Belgian Ardennes (Version 1.3), Zenodo [data set] and [code], https://doi.org/10.5281/zenodo.21630161, 2026.
Moore, A. K. and Granger, D. E.: Technical note: Altitude scaling of 36Cl production from Fe, Geochronology, 6, 541–552, https://doi.org/10.5194/gchron-6-541-2024, 2024.
Mormal, P. and Tricot, C.: Aperçu climatique des Hautes-Fagnes, Publication scientifique et technique, no. 36, Institut Royal Météorologique de Belgique, https://www.sshf.uliege.be/upload/docs/application/pdf/2024-02/tricot_-_apercu_climatique_des_hautes_fagnes.pdf (last access: 10 October 2025), 2004.
Nichols, J. E. and Peteet, D. M.: Rapid expansion of northern peatlands and doubled estimate of carbon storage, Nat. Geosci., 12, 917–921, https://doi.org/10.1038/s41561-019-0454-z, 2019.
Nishiizumi, K.: Preparation of new 10Be and 26Al AMS standard reference materials, Nucl. Instrum. Meth. B, 530, 43–47, https://doi.org/10.1016/j.nimb.2022.09.014, 2022.
Oleszczuk, R., Zając, E., Urbański, J., and Jadczyszyn, J.: Rate of fen-peat soil subsidence near drainage ditches (central Poland), Land, 10, 1287, https://doi.org/10.3390/land10121287, 2021.
Paulissen, M., van Beek, R., Nekrassoff, S., Huijbens, E. H., and Spek, T.: Dire necessity or mere opportunity? Recurrent peat commercialisation from raised bog commons in the early modern Low Countries, Int. J. Commons, 15, 100–118, https://doi.org/10.5334/ijc.1054, 2021.
Pissart, A., Calmels, F., and Wastiaux, C.: The potential lateral growth of lithalsas, Quaternary Res., 75, 371–377, https://doi.org/10.1016/j.yqres.2011.01.001, 2011.
Richardson, J. C., Vanacker, V., Hodgson, D. M., Christl, M., and Lang, A.: Constraining the timing and processes of pediment formation and dissection: implications for long-term evolution in the Western Cape, South Africa, Earth Surf. Dynam., 13, 315–339, https://doi.org/10.5194/esurf-13-315-2025, 2025.
Riebe, C. S. and Granger, D. E.: Quantifying effects of deep and near-surface chemical erosion on cosmogenic nuclides in soils, saprolite, and sediment: effects of chemical erosion on cosmogenic nuclide buildup, Earth Surf. Proc. Land., 38, 523–533, https://doi.org/10.1002/esp.3339, 2013.
Riebe, C. S., Kirchner, J. W., and Finkel, R. C.: Erosional and climatic effects on long-term chemical weathering rates in granitic landscapes spanning diverse climate regimes, Earth Planet. Sc. Lett., 224, 547–562, https://doi.org/10.1016/j.epsl.2004.05.019, 2004.
Rixhon, G., Braucher, R., Bourlès, D. L., Peeters, A., Demoulin, A., and Leanni, L.: Plio-Quaternary landscape evolution in the uplifted Ardennes: new insights from 26Al 10Be data from cave-deposited alluvium (Meuse catchment, E. Belgium), Geomorphology, 371, 107424, https://doi.org/10.1016/j.geomorph.2020.107424, 2020.
Rixhon, G., Braucher, R., Bourlès, D., Siame, L., Bovy, B., and Demoulin, A.: Quaternary river incision in NE Ardennes (Belgium) – insights from 10Be/26Al dating of river terraces, Quat. Geochronol., 6, 273–284, https://doi.org/10.1016/j.quageo.2010.11.001, 2011.
Rixhon, G. and Demoulin, A.: The picturesque Ardennian valleys: Plio-Quaternary incision of the drainage system in the uplifting Ardenne, in: Landscapes and Landforms of Belgium and Luxembourg, edited by: Demoulin, A., Springer International Publishing, Cham, 159–175, https://doi.org/10.1007/978-3-319-58239-9_10, 2018.
Rixhon, G. and Juvigné, É.: Periglacial deposits and correlated processes in the Ninglinspo Valley (Ardenne massif, Belgium), Geol. Belg., 13, 49–60, https://popups.uliege.be/1374-8505/index.php?file=1&id=2860&pid=2853 (last access: 26 June 2026), 2010.
Shotbolt, L., Anderson, A. R., and Towned, J.: Changes to blanket bog adjoining forest plots at Bad a' Cheo, Rumster Forest, Caithness, Forestry, 71, 311–324, https://doi.org/10.1093/forestry/71.4.311, 1998.
Shuster, D. L., Farley, K. A., Vasconcelos, P. M., Balco, G., Monteiro, H. S., Waltenberg, K., and Stone, J. O.: Cosmogenic 3He in hematite and goethite from Brazilian “canga” duricrust demonstrates the extreme stability of these surfaces, Earth Planet. Sc. Lett., 329–330, 41–50, https://doi.org/10.1016/j.epsl.2012.02.017, 2012.
Sougnez, N. and Vanacker, V.: The topographic signature of Quaternary tectonic uplift in the Ardennes massif (Western Europe), Hydrol. Earth Syst. Sci., 15, 1095–1107, https://doi.org/10.5194/hess-15-1095-2011, 2011.
Stone, J. O.: Air pressure and cosmogenic isotope production, J. Geophys. Res., 105, 23753–23759, https://doi.org/10.1029/2000JB900181, 2000.
Strandberg, G., Brandefelt, J., Kjellström, E., and Smith, B.: High-resolution regional simulation of last glacial maximum climate in Europe, Tellus A, 63, 107–125, https://doi.org/10.1111/j.1600-0870.2010.00485.x, 2011.
Struck, M., Jansen, J. D., Fujioka, T., Codilean, A. T., Fink, D., Fülöp, R.-H., Wilcken, K. M., Price, D. M., Kotevski, S., Fifield, L. K., and Chappell, J.: Tracking the 10Be–26Al source-area signal in sediment-routing systems of arid central Australia, Earth Surf. Dynam., 6, 329–349, https://doi.org/10.5194/esurf-6-329-2018, 2018.
Terraza, M., Wolff, R., Hetzel, R., Ritter-Prinz, B., Binnie, S. A., Preuss, J., Hoselmann, C., Weidenfeller, M., and Heinze, S.: Accelerated uplift of the Rhenish Massif (central Europe) since 700–800 ka revealed by isochron-burial dating of strath terraces, Geomorphology, 110334, https://doi.org/10.1016/j.geomorph.2026.110334, 2026.
Treat, C. C., Kleinen, T., Broothaerts, N., Dalton, A. S., Dommain, R., Douglas, T. A., Drexler, J. Z., Finkelstein, S. A., Grosse, G., Hope, G., Hutchings, J., Jones, M. C., Kuhry, P., Lacourse, T., Lähteenoja, O., Loisel, J., Notebaert, B., Payne, R. J., Peteet, D. M., Sannel, A. B. K., Stelling, J. M., Strauss, J., Swindles, G. T., Talbot, J., Tarnocai, C., Verstraeten, G., Williams, C. J., Xia, Z., Yu, Z., Väliranta, M., Hättestrand, M., Alexanderson, H., and Brovkin, V.: Widespread global peatland establishment and persistence over the last 130,000 years, P. Natl. Acad. Sci. USA, 116, 4822–4827, https://doi.org/10.1073/pnas.1813305116, 2019.
van Balen, R. T., Houtgast, R. F., van der Wateren, F. M., Vandenberghe, J., and Bogaart, P. W.: Sediment budget and tectonic evolution of the Meuse catchment in the Ardennes and the Roer Valley Rift System, Global Planet. Change, 27, 113–129, https://doi.org/10.1016/S0921-8181(01)00062-5, 2000.
Vasconcelos, P. M., Farley, K. A., Stone, J., Piacentini, T., and Fifield, L. K.: Stranded landscapes in the humid tropics: Earth's oldest land surfaces, Earth Planet. Sc. Lett., 519, 152–164, https://doi.org/10.1016/j.epsl.2019.04.014, 2019.
Wittmann, H., Oelze, M., Gaillardet, J., Garzanti, E., and von Blanckenburg, F.: A global rate of denudation from cosmogenic nuclides in the Earth's largest rivers, Earth Sci. Rev., 204, 103147, https://doi.org/10.1016/j.earscirev.2020.103147, 2020.
Woillard, G. M.: Grande Pile peat bog: a continuous pollen record for the last 140,000 years, Quaternary Res., 9, 1–21, https://doi.org/10.1016/0033-5894(78)90079-0, 1978.
Yu, Z., Beilman, D. W., Frolking, S., MacDonald, G. M., Roulet, N. T., Camill, P., and Charman, D. J.: Peatlands and their role in the global carbon cycle, EOS T. Am. Geophys. Un., 92, 97–98, https://doi.org/10.1029/2011EO120001, 2011.
Yu, Z., Loisel, J., Brosseau, D. P., Beilman, D. W., and Hunt, S. J.: Global peatland dynamics since the Last Glacial Maximum, Geophys. Res. Lett., 37, L13402, https://doi.org/10.1029/2010GL043584, 2010.
Zweck, C., Zreda, M., and Desilets, D.: Snow shielding factors for cosmogenic nuclide dating inferred from Monte Carlo neutron transport simulations, Earth Planet. Sc. Lett., 379, 64–71, https://doi.org/10.1016/j.epsl.2013.07.023, 2013.