
the Creative Commons Attribution 4.0 License.
the Creative Commons Attribution 4.0 License.
 | 08 Oct 2026
Integrating smartrock and seismic monitoring to investigate bedload transport dynamics during rapid increase of stages in ephemeral streams
Matanya Hamawi

Joel P. L. Johnson
Susan L. Bilek
Jens M. Turowski
Jonathan B. Laronne
Bedload transport dynamics during rapid increases of stage remain poorly constrained, particularly in ephemeral streams where such conditions are common. We combined two cutting-edge monitoring techniques – smartrocks and seismic measurements – to investigate bedload transport patterns during rapid increase of stage in two ephemeral channels with different morphologies. The latter technique was used to characterize bedload activity through the Power Spectral Density (PSD) of recorded seismic signals. Our observations reveal three distinct stages of bedload response: (1) At shallow relative depth (), rapid increase of stage enhanced bed material activity compared to steady flow, with PSD ratios (PSDrapid stage rise PSDsteady flow) above unity and a higher prevalence of vibrational movement under rapid stage rise conditions relative to steady flow; (2) At intermediate relative depths (), the effect of rapid increase of stage on bedload activity diminished; (3) At greater relative depths (), bedload activity is once again enhanced during rapid increase of rise, with both seismic energy and particle motion exceeding values observed under steady flow conditions. The transitions between these stages occurred at similar relative depths in both channels despite their different morphologies, suggesting that channel roughness strongly influences how rapid stage rises affect bedload transport.
- Article
(5939 KB) - Full-text XML
-
Supplement
(2359 KB) - BibTeX
- EndNote


Bedload transport exerts a crucial control on the dynamics of streams. It influences the patterns of erosion and deposition, the spatio-temporal variations in bed topography and texture as well as the design and implementation of in-stream engineering projects and river restoration. Although bedload transport has been extensively studied and formulated under conditions of steady flow (e.g. Ancey, 2020; Luque and Van Beek, 1976; Meyer-Peter and Müller, 1948; Parker et al., 1982; Wilcock and Crowe, 2003), research addressing its dynamics under unsteady flow conditions remains limited. Such conditions occur across a wide range of systems, such as during tidal surges in coastal and estuarine environments (Chanson et al., 2011; Khezri and Chanson, 2012), tsunamis (Kihara et al., 2015; Shafiei et al., 2016), glacial dam outbursts (Clague, 2000) and reservoir breachs (Aureli et al., 2023; Castro-Orgaz and Chanson, 2020; Sky and Chaudhry, 1989). It is particularly common in ephemeral streams in semi-arid and arid regions, where flash floods generate abrupt increases in water depth over short time intervals.
During flash floods, rapid increases in water depth can enhance turbulent velocity fluctuations and shear stress (Halfi et al., 2023; Thappeta et al., 2023), resulting in higher bedload transport rates compared to steady flow conditions (Halfi et al., 2023; Khezri and Chanson, 2012). Flume experiments have demonstrated that bedload transport rates under turbulent, unsteady conditions can significantly exceed those observed under steady flow, with enhancement factors ranging from 1.4 to 4.4 (Lee et al., 2004; Sumer et al., 2003). Similarly, Meirovich et al. (1998) used measurements made in desert streams to demonstrate that accounting for variable water surface slopes can lead up to 1.6-fold increase in predicted bedload transport rates. Halfi et al. (2023) demonstrated that a rapid increase of stage can mobilize bedload even in flow conditions where the shear stress calculated using conventional equations is below the critical threshold for motion. In particular, this can happen when a bore propagates over a dry bed in unarmored channels, where bedload flux may vary linearly with shear stress (Cohen et al., 2010). However, the depth-dependent nature of bedload transport during rapid increases of stage remaines poorly constrained.
Rapid increases of stage are often unpredictable, infrequent, and short-lived, imposing substantial methodological constraints on quantitative bedload monitoring. Direct sampling by temporary bedload traps is impractical due to the hazards associated with manual deployment during sudden flow events and their inherently limited sampling capacity, which restricts their ability to capture rapid, high-frequency variations in bedload flux (Stark et al., 2021). In addition, permanent sampling systems are constrained by finite collection volumes and relatively coarse mass resolution, limiting their ability to resolve rapid changes in bedload flux during short-lived rapid increases of stage (Halfi et al., 2018). Furthermore, indirect acoustic approaches face additional limitations, as impact-based sensors exhibit reduced sensitivity to fine-grained particles (< 4 mm), are prone to burial or shielding by migrating gravel sheets that attenuate or mask the transport signal, and may record spurious signals originating from structural vibrations rather than true particle–bed interactions (Nicollier et al., 2022; Stark et al., 2021). This limitation highlights the need for innovative approaches capable of capturing the dynamics of bedload transport during rapid increases of stage.
In recent years, seismic methods have been developed to monitor fluvial environments (Burtin et al., 2016; Cook and Dietze, 2022). These advances have the potential to greatly inprove our ability to measure bedload transport in field settings, including during rapidly changing hydrographs. By capturing signals produced by particle interactions with the channel bed through collisions (Tsai et al., 2012) or rolling (Luong et al., 2024), seismic sensors placed along riverbanks can provide continuous high temporal resolution measurements of transport activity. The seismic energy generated by bedload transport scales robustly with the transported grain size (PSD∼d3), such that the recorded PSD is typically dominated by the coarsest moving fractions (Lagarde et al., 2021; Tsai et al., 2012), yet seismic monitoring has been shown to detect transport activity from particles smaller than ∼ 1 cm (Roth et al., 2016). Building on these developments, previous studies have employed seismic analyses to investigate bedload transport processes in various environments, particularly in perennial rivers across mountainous regions such as the Alps (Antoniazza et al., 2023; Bakker et al., 2020; Burtin et al., 2011; Roth et al., 2014, 2016), the Himalayas (Cook et al., 2018), Taiwan (Chao et al., 2015; Hsu et al., 2011; Nativ et al., 2025) and North America (Schmandt et al., 2017). However, applications in ephemeral rivers have been limited (e.g., Dietze et al., 2019; Lagarde et al., 2021; Luong et al., 2024), reflecting the short-lived and highly variable nature of flow events, which restrict data availability, limit temporal coverage, and complicate direct measurements of bedload transport. Importantly, the method has not been specifically evaluated during rapid increases of stage.
Given the developmental stage of seismic methods for bedload transport monitoring, their application in natural river systems requires validation through independent and in-stream methods. Previous studies have employed a variety of approaches to monitor bedload transport including bedload samplers (Bakker et al., 2020; Lagarde et al., 2021; Luong et al., 2024), pipe and plate impact sensors (Burtin et al., 2016; Lagarde et al., 2021; Roth et al., 2016) and hydrophones (Matthews et al., 2024). Yet, seismic observations have not yet been combined with “smartrocks” – artificial or natural pebbles embedded with Inertial Measurement Unit (IMU). IMUs are Micro-Electro-Mechanical Systems (MEMS) which generally contain three types of sensors: accelerometers, gyroscopes and magnetometers. Smartrocks allow direct investigation of bedload transport dynamics from the Lagrangian perspective of the tracer grain (Alhusban and Valyrakis, 2021; Al-Obaidi and Valyrakis, 2021a; Pretzlav et al., 2020, 2021). While it is challenging to use smartrocks to monitor grain trajectories or applied forces (Al-Obaidi and Valyrakis, 2021a; Maniatis et al., 2020), their utility for identifying transitions between motion and rest throughout flow events has been successfully demonstrated in previous studies (Olinde and Johnson, 2015; Pretzlav et al., 2020, 2021).
Here, we investigate bedload transport dynamics during rapidly rising stage (bores) in ephemeral streams using joint seismic monitoring and smartrock measurements. By applying both techniques in two streams with different morphologies, we examine how rapid stage rise influences bedload transport across water depths. This study adds new field-based observations of bedload transport during rapid stage-rise events to the limited number of documented cases in ephemeral channels (Halfi et al., 2023).
2.1 Study sites
We monitored two gravel-bed ephemeral channels, Nahal (Wadi) Anim and Nahal Yatir (Fig. 1) during the 2021–2022 and 2022–2023 winter seasons. Both catchments are situated within the semi-arid climate of the northern Negev Desert, Israel, and drain the southern Hebron hills into the eastern Beer Sheva Basin. These channels were chosen since they both feature rapid increase of stage during flow events, yet they have different grain sizes and morphological features. This allows us to examine whether bedload transport is influenced by morphological characteristics of the river bed under conditions of rapid stage increase. Nahal Anim has a catchment area of 35 km2, an average longitudinal slope of 0.4 %, and a mean channel width of 6 m within the monitored reach. The channel bed morphology of Nahal Anim is characterized by flats and bars, with a median grain size (d50) of 14 mm, based on Wolman counts (see Sect. S1 in the Supplement). The Yatir channel has a catchment area of 180 km2, an average longitudinal slope of 1.3 %, a mean channel width of 10 m within the monitored reach, and a median grain size (d50) of 76 mm (Fig. 1). Based on the Nevatim station of the Israel Meteorological Service, the closest meteorological station to the study sites, located 5 km east of the Yatir site and 10 km south of the Anim site, rainfall events occur mainly from October to April, with a mean annual rainfall of 130 mm and on average 35 d with rain.
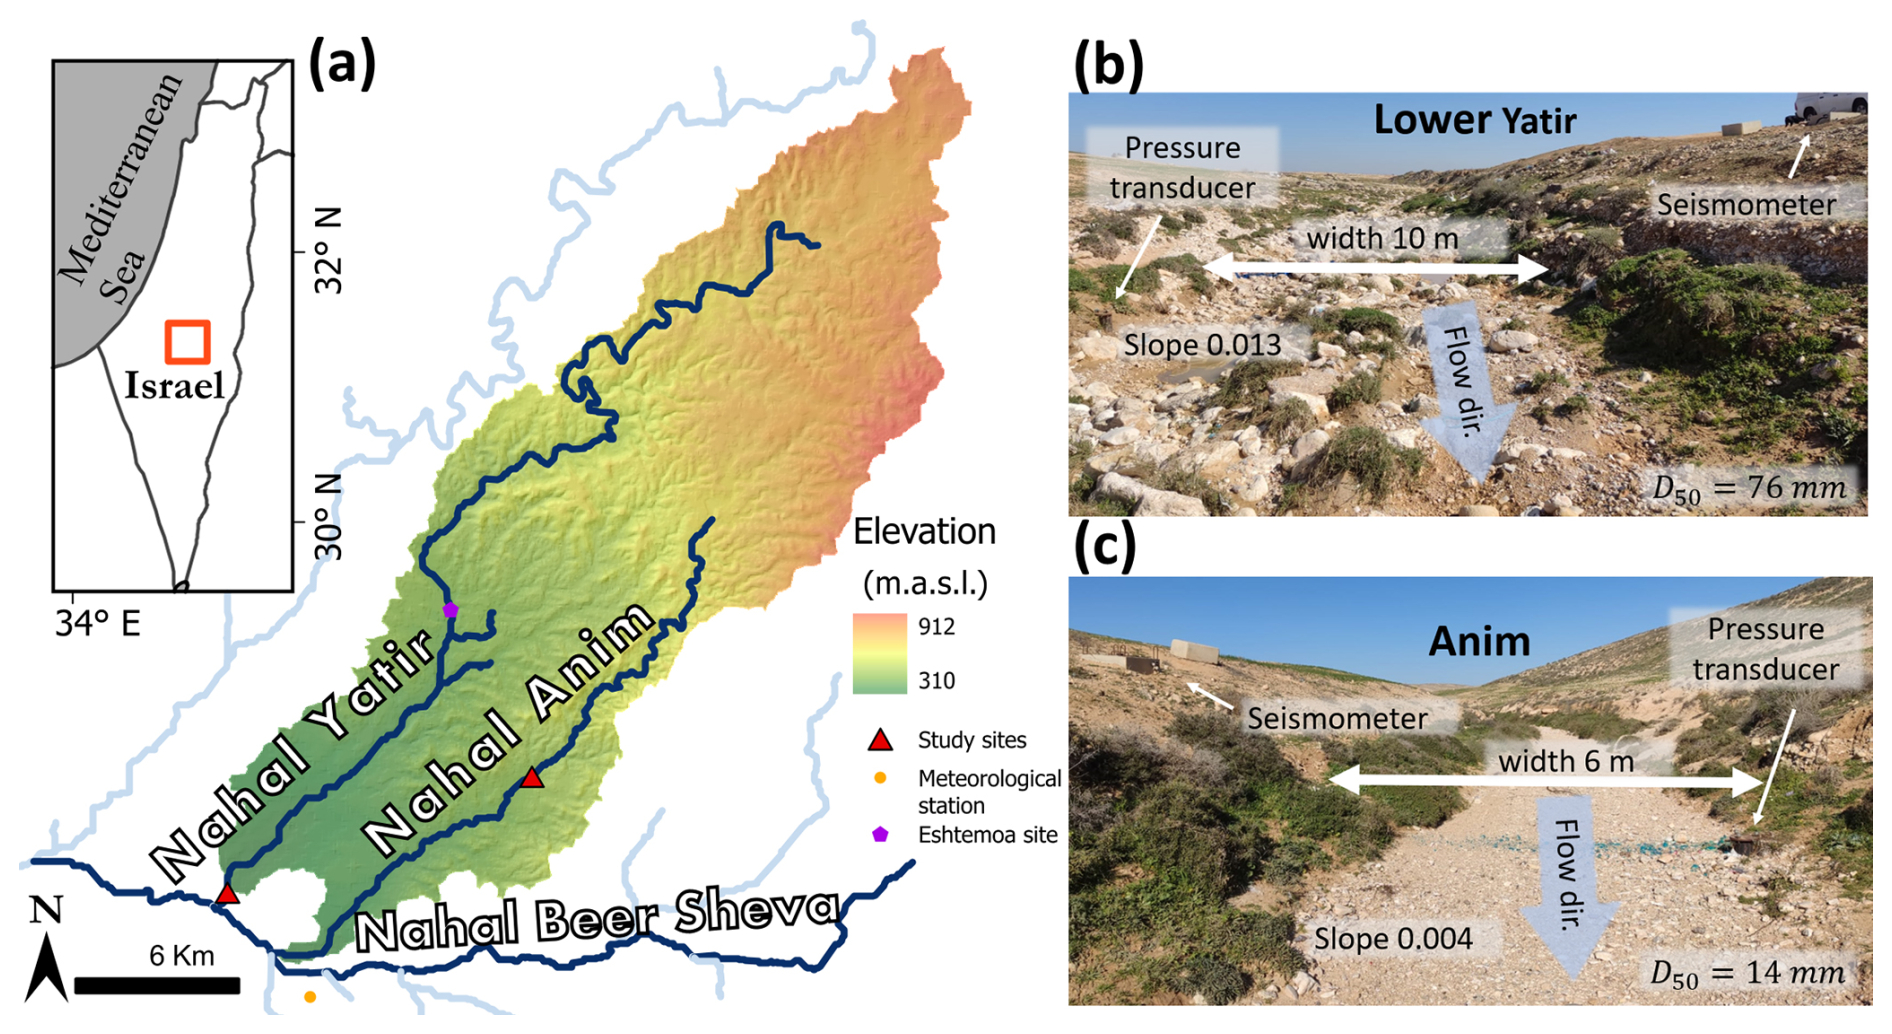
Figure 1Study Sites: (a) Northern basin of Nahal Beer-Sheva with spatial location indicated in the inset. Upstream view of (b) Nahal Yatir site and (c) Anim site.
Pressure transducers (Levelogger 5, Solinst, ±5 mm) were installed in a stilling well located in the ephemeral channel beds, operating at a sampling rate of one sample every 2 min during the 2021–2022 season and one sample every 30 s during the 2022–2023 season. Barometric pressure compensation for the transducer data was performed using a reference transducer (Barologger 5, Solinst, ±5 mm) located at the Eshtemoa station (e.g. Cohen et al., 2010), situated 6 and 12 km from Nahal Anim and Nahal Yatir, respectively. Using the compensated pressure data, we generated stage hydrographs for each event. A flow event was defined as the period during which surface runoff was present in the channel, beginning when measured water depth exceeded 0 m and ending when the channel returned to dry conditions. In Nahal Yatir, data analysis was limited to the rising limb and shallow part of the comparatively long recession. These hydrographs were analyzed to identify rapid stage-rise periods. The rate of rise was calculated for each segment of the hydrograph where stage rose ≥0.5 cm min−1 during at least 2 min (Sect. S2 in the Supplement), comparable to the minimal values (rate of 0.8 cm min−1 for at least 1.3 min) reported in Halfi et al. (2023). Additionally, we computed the maximum rate of rise within each rapid increase of stage (Sect. S2 in the Supplement).
2.2 Smartrocks
We used the same smartrocks as did Pretzlav et al. (2020) to continuously monitor bedload movements. Each smartrock was equipped with an lMU (InvenSense 9150), set to record gyroscope (hereafter referred to as “gyro”) velocities at a sample rate of 10 Hz, able to measure up to ±2000° s−1 at 16-bit resolution. The IMU was powered by a 3.7 V 5000 mAh battery that enabled the smartrocks to function continuously for up to 30 d. After this deployment duration, data were downloaded and batteries replaced. To locate and identify the pebbles, each was equipped with an RFID. All of the above components are housed in an artificial high-density plastic case, resulting into a bulk density of the smartrock of 2600 kg m−3. The pebble has a triaxial ellipsoid-like shape, with axes length of 6.4, 7.2, and 13.0 cm. The intermediate diameter of 7.2 cm corresponds to grain percentile of d95 and d48 (where the subscript denotes the percentile of the distribution) in the Anim and Yatir sites, respectively. We placed the smartrocks on the bed, some exposed on the surface and others within imbricated sedimentological structures, along a 50 m channel reach close to the seismometer (described in Sect. 2.2). Seven smartrocks were deployed at each site during the 2021–2022 season, and three were deployed during the 2022–2023 season. The reduced number of smartrocks used in the latter season was due to the loss of some of them during flow events and damage caused by water infiltration. All smartrocks were activated manually within a few seconds of one another prior to deployment, resulting in negligible timing offsets relative to the timescales analyzed in this study.
We focused on gyro velocity data (), because they are better indicators of movement than acceleration data (Al-Obaidi and Valyrakis, 2021b). While Al-Obaidi and Valyrakis (2021b) found that roll, pitch, and yaw obtained through IMU data fusion are the best indicators of motion, such calculations require high sampling frequencies that reduce the operational duration of the smartrock and are generally challenging to implement (Maniatis, 2021).
All measurements recorded along the three axes were converted into the magnitude of gyro velocity using
For each measurement timestep, we selected the maximum magnitude value among all active smartrocks in the stream. The resulting time series was used to represent bed material movement during the event. To examine the relationship between smartrock gyro velocity and water depth, we calculated the median gyro velocity value within a 30 s window centered on each water depth measurement, i.e. 15 before and 15 s after the water depth reading. The gyro velocity was then binned according to a 2 db logarithmic water depth interval.
Based on the gyro velocity data, we classified smartrock motion into three states: downstream displacement (hereafter referred to as displacement), vibration, and rest. The threshold value of 0.3 rad s−1 distinguishing vibration from displacement was based on the laboratory measurements of Pretzlav et al. (2020), conducted with the same type of smartrocks. To determine the threshold between rest and vibration, we analyzed the data recorded during the period preceding the flow events. During these periods, there was no water in the streams, and the smartrocks were expected to remain at rest unless disturbed by humans or animals. The starting point of these periods was defined as either the placement of the smartrocks in the stream or at the end of the previous flow event (when the channel was dry). For all data recorded during this time, we computed the envelope velocities based on maximum values for each minute. The threshold distinguishing rest from vibration was defined separately for each smartrock as the 99th percentile (≈2.3 standard deviations) of these envelope velocities. A representative threshold was then determined for each study site as the mean of the individual smartrock thresholds and applied to all flow events at that site.
2.3 Seismic monitoring and data processing
The study sites were equipped with 3-component broadband seismometers (Nanometrics Trillium Compact 120 s sensors, with flat amplitude response between 120 s to > 100 Hz) and a RefTek RT-130 datalogger sampling at 500 Hz and gain of 1, with an external GPS clock (GPS16X-HVS) attached for timing. The sensors were buried in the channel banks at a depth of 0.5 m, and at distances from the channel centerline of 10 m in Nahal Anim and 12 m in Nahal Yatir. The stations were powered using 12 V 100 Ah batteries and visited every three weeks to replace batteries and download data. Raw seismic data were archived with the EarthScope Data Management System under the network code 1F (Bilek, 2019).
We processed the raw seismic data (units of counts) first by removing the data mean and trend, then converted to velocity (units of m s−1) using the station metadata (available from EarthScope for the 1F(2019–2024) network) and the remove_response function contained within the ObsPy seismic analysis software (Beyreuther et al., 2010). Using the instrument corrected data, we calculated the Power Seismic Density (PSD) following the Welch (1967) method, with two-second time windows and a 50 % overlap, in the frequency window of 10–100 Hz.
To investigate the seismic frequency range associated with bedload activity, we conducted a comparative analysis between smartrock gyro velocity and PSD. During each flow event, we calculated the median values of the PSD and gyro data in 30 s intervals and then computed the Spearman's correlation coefficient between them. The gyro data used for this analysis were above the noise threshold, indicating motion (i.e., either displacement or vibration) and thus representing pebble-bed interactions that could generate seismic waves. This process was repeated multiple times, with each iteration selecting seismic energy within a 25 Hz frequency bin. For each successive iteration, the frequency window was shifted by 5 Hz relative to the previous one. For example, in one iteration, a frequency window of 10–35 Hz was selected, followed by a window of 15–40 Hz in the subsequent iteration.
Frequencies with the highest Spearman correlation coefficients were selected to represent bedload activity. To assess changes in seismic response between rapid stage-rise and steady flow conditions, we analysed both the relationship between seismic energy and water depth, as well as between seismic energy and gyro velocity, using these bedload-indicative frequency bands. To reduce scatter and clarify trends, median values were computed for 2 dB bins based on water level and gyro velocity.
3.1 Overview of flow events
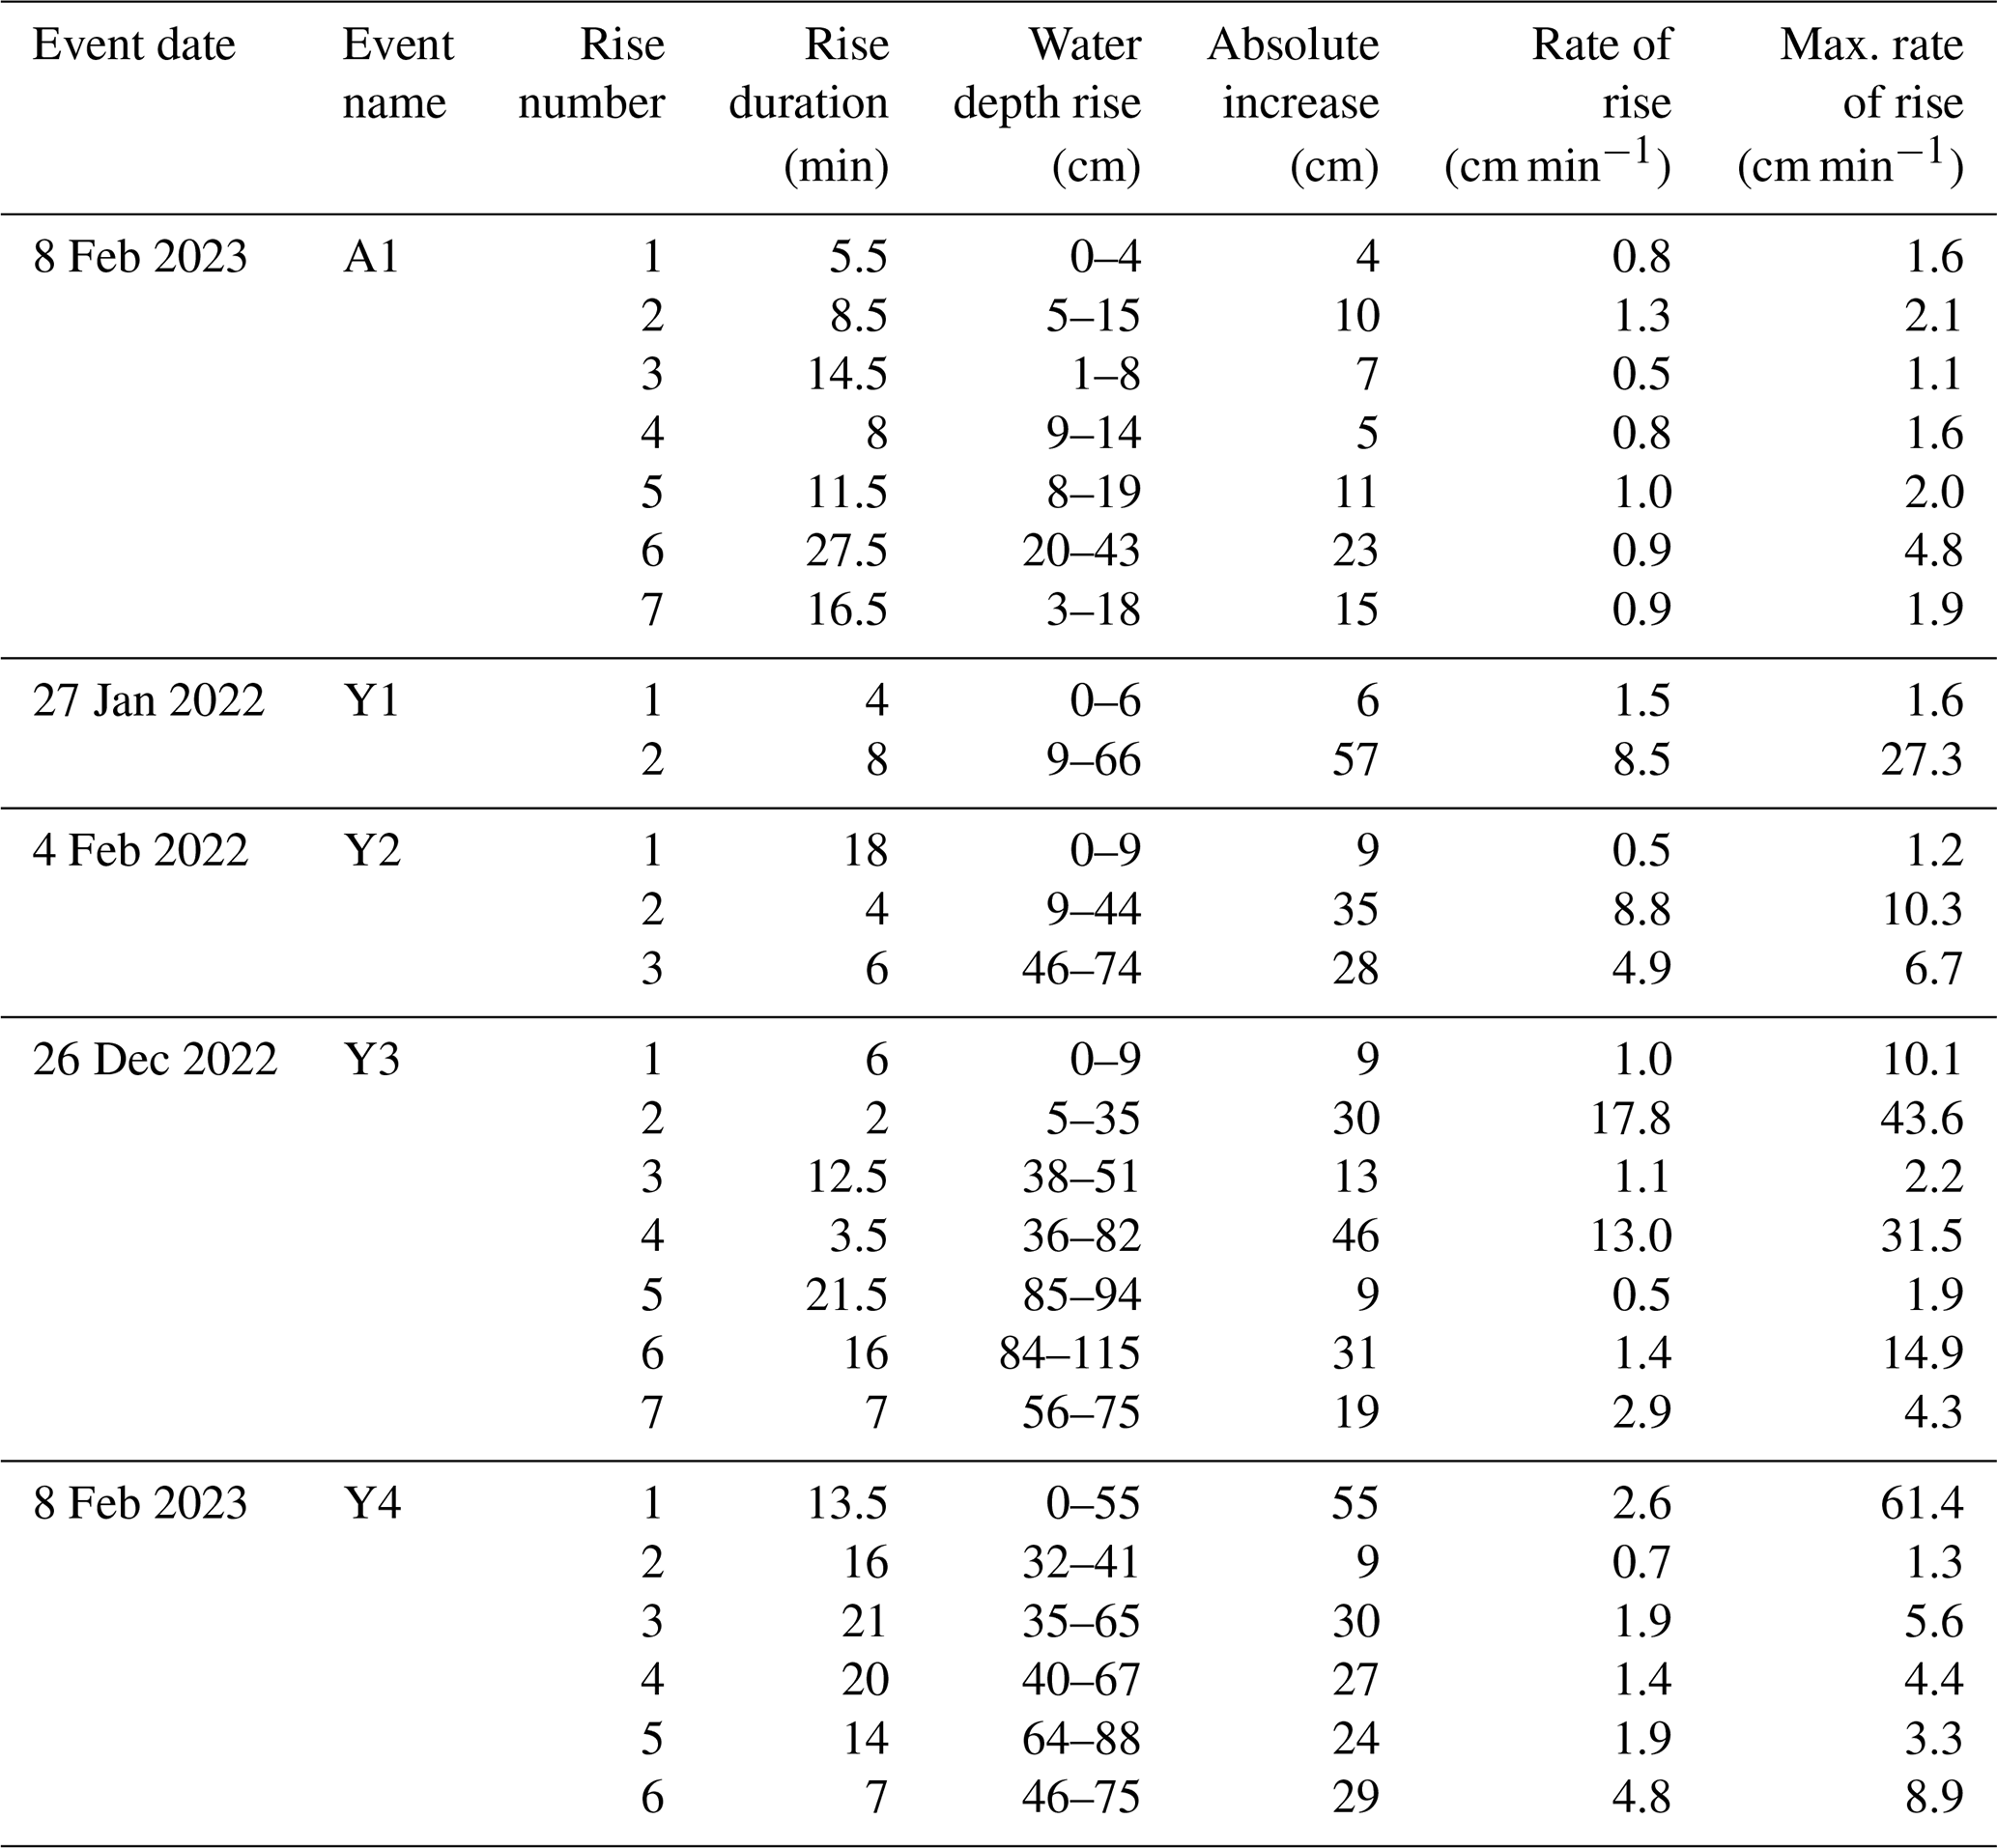
During the measurement period, the sites experienced between two and five flow events per winter, with altogether five events successfully recorded (Fig. 2), including one in Nahal Anim (hereafter termed A1) and four in Nahal Yatir (hereafter termed Y1–4). Each event included multiple rapid increase of stage (25 rapid increase of stages recorded in total), with notable variability in their duration, magnitude, and rate of rise (Table 1; Sect. S3 in the Supplement). In Nahal Anim, rise durations ranged from 5.5 to 27.5 min, with water depth increases of 4–23 cm. Average rates of rise varied between 0.5 and 1.3 cm min−1 and maximum rates of rise ranged from 1.1 to 4.8 cm min−1. In Nahal Yatir, durations of rapid increase of stage spanned 2–21.5 min, with water depth increases of 6–57 cm. The highest rate of rise for an entire rapid increase was 17.8 cm min−1; within individual rises maxima were 1.2–61.4 cm min−1.
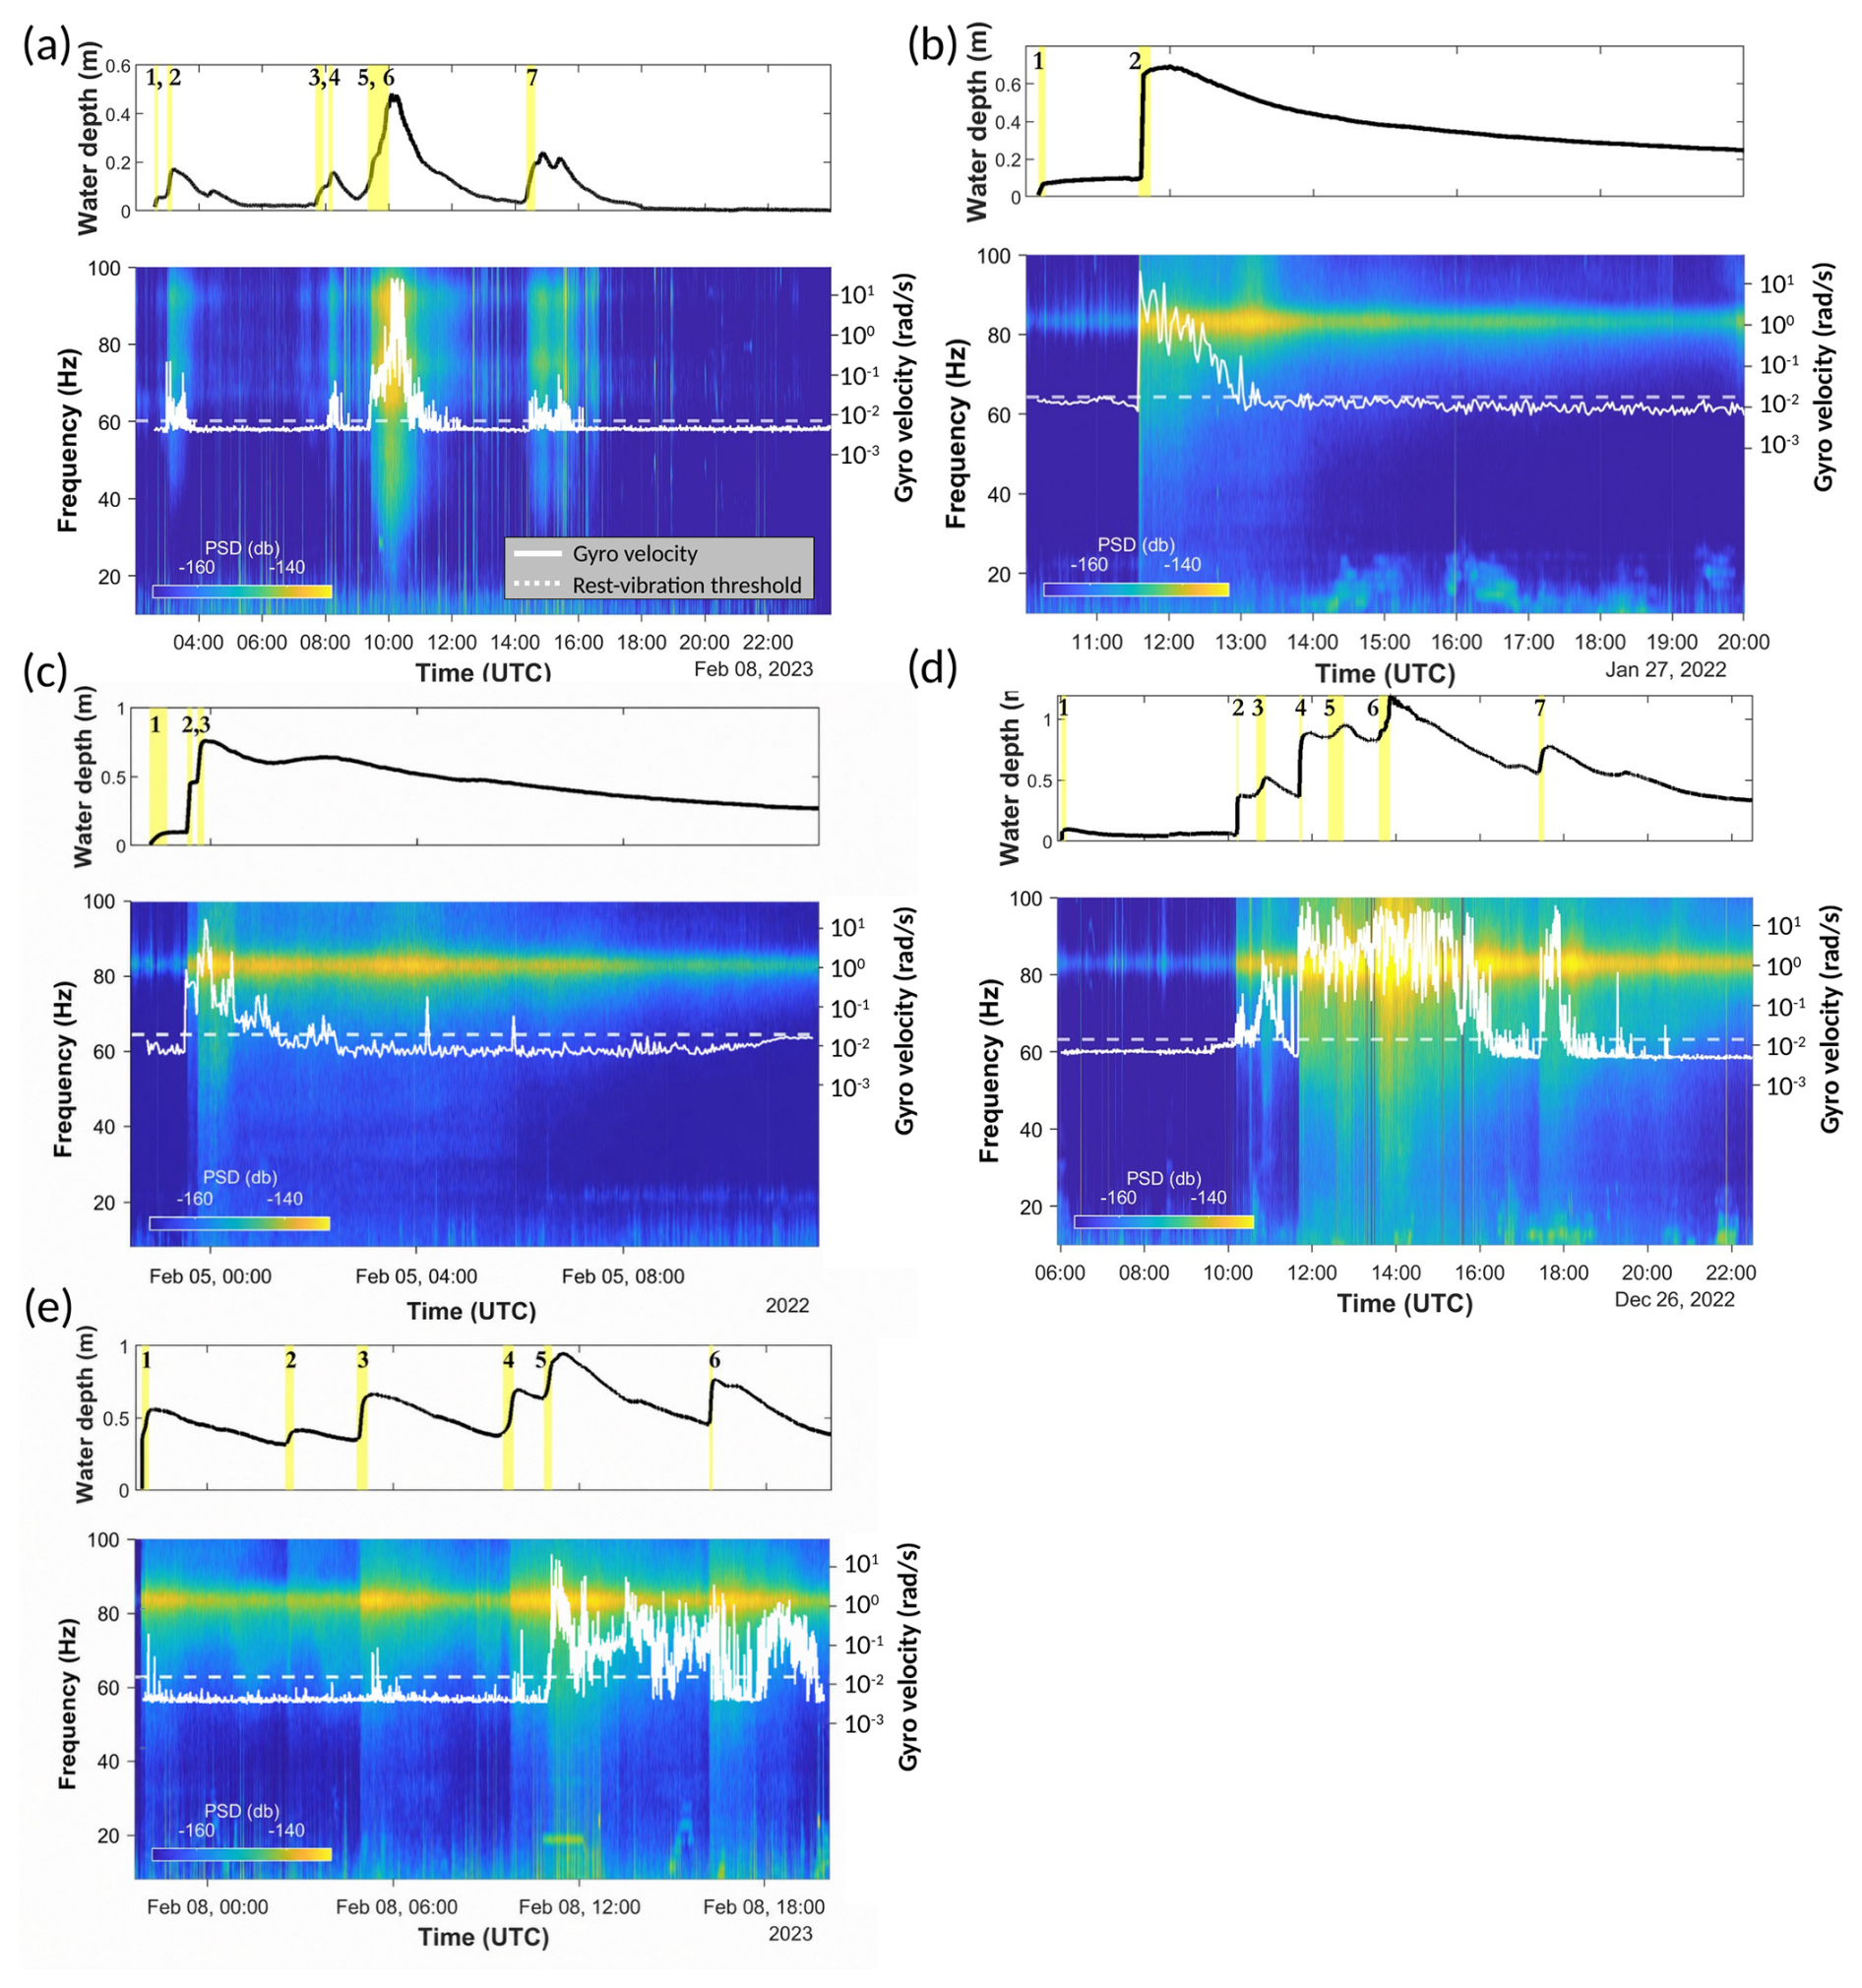
Figure 2Comprehensive data from the A1 (a) and the Y1–4 (b)–(e) flow events. The upper panels display water stage hydrographs, with yellow-shaded areas indicating intervals of rapid increase of stage. The lower panels present the spectrograms (left y-axis) alongside the gyro velocities of the smartrocks (right y-axis). The smartrock data are represented by a solid white line, with the rest-to-vibration threshold indicated by a dashed white line.
Table 1Summary of hydrological data for the 25 rapid water level rises observed across the five flow events in Nahal Anim (A1) and Nahal Yatir (Y1–4). The rise numbers correspond to those depicted in Fig. 2. Rate of rise is the slope of a linear fit encompassing the entire rise range. Maximum rate of rise is the maximum slope within individual rises.
3.2 Smartrock dynamics
3.2.1 Rest periods
During rest periods without active flow, the gyro velocities of the smartrocks exhibited variability, with differences observed in the velocity ranges recorded prior to each flow event (Fig. 3). The threshold velocity from rest to vibration (defined as the 99th percentile of measurements) ranged from 0.007 rad s−1 prior to A1 (Fig. 3a–b) to 0.019 rad s−1 prior to Y2 (Fig. 3e–f). Sporadic peaks exceeding 0.03 rad s−1 were observed during the pre-flood periods, likely caused by transient vibrations of the pebble resulting from animal bumps. The threshold value used to distinguish between rest and vibrational motion was set to 0.007 rad s−1 for Nahal Anim and to an event-average value of 0.014 rad s−1 for Nahal Yatir based on the 99th percentile of pre-event envelope velocities (see Sect. 2.2).
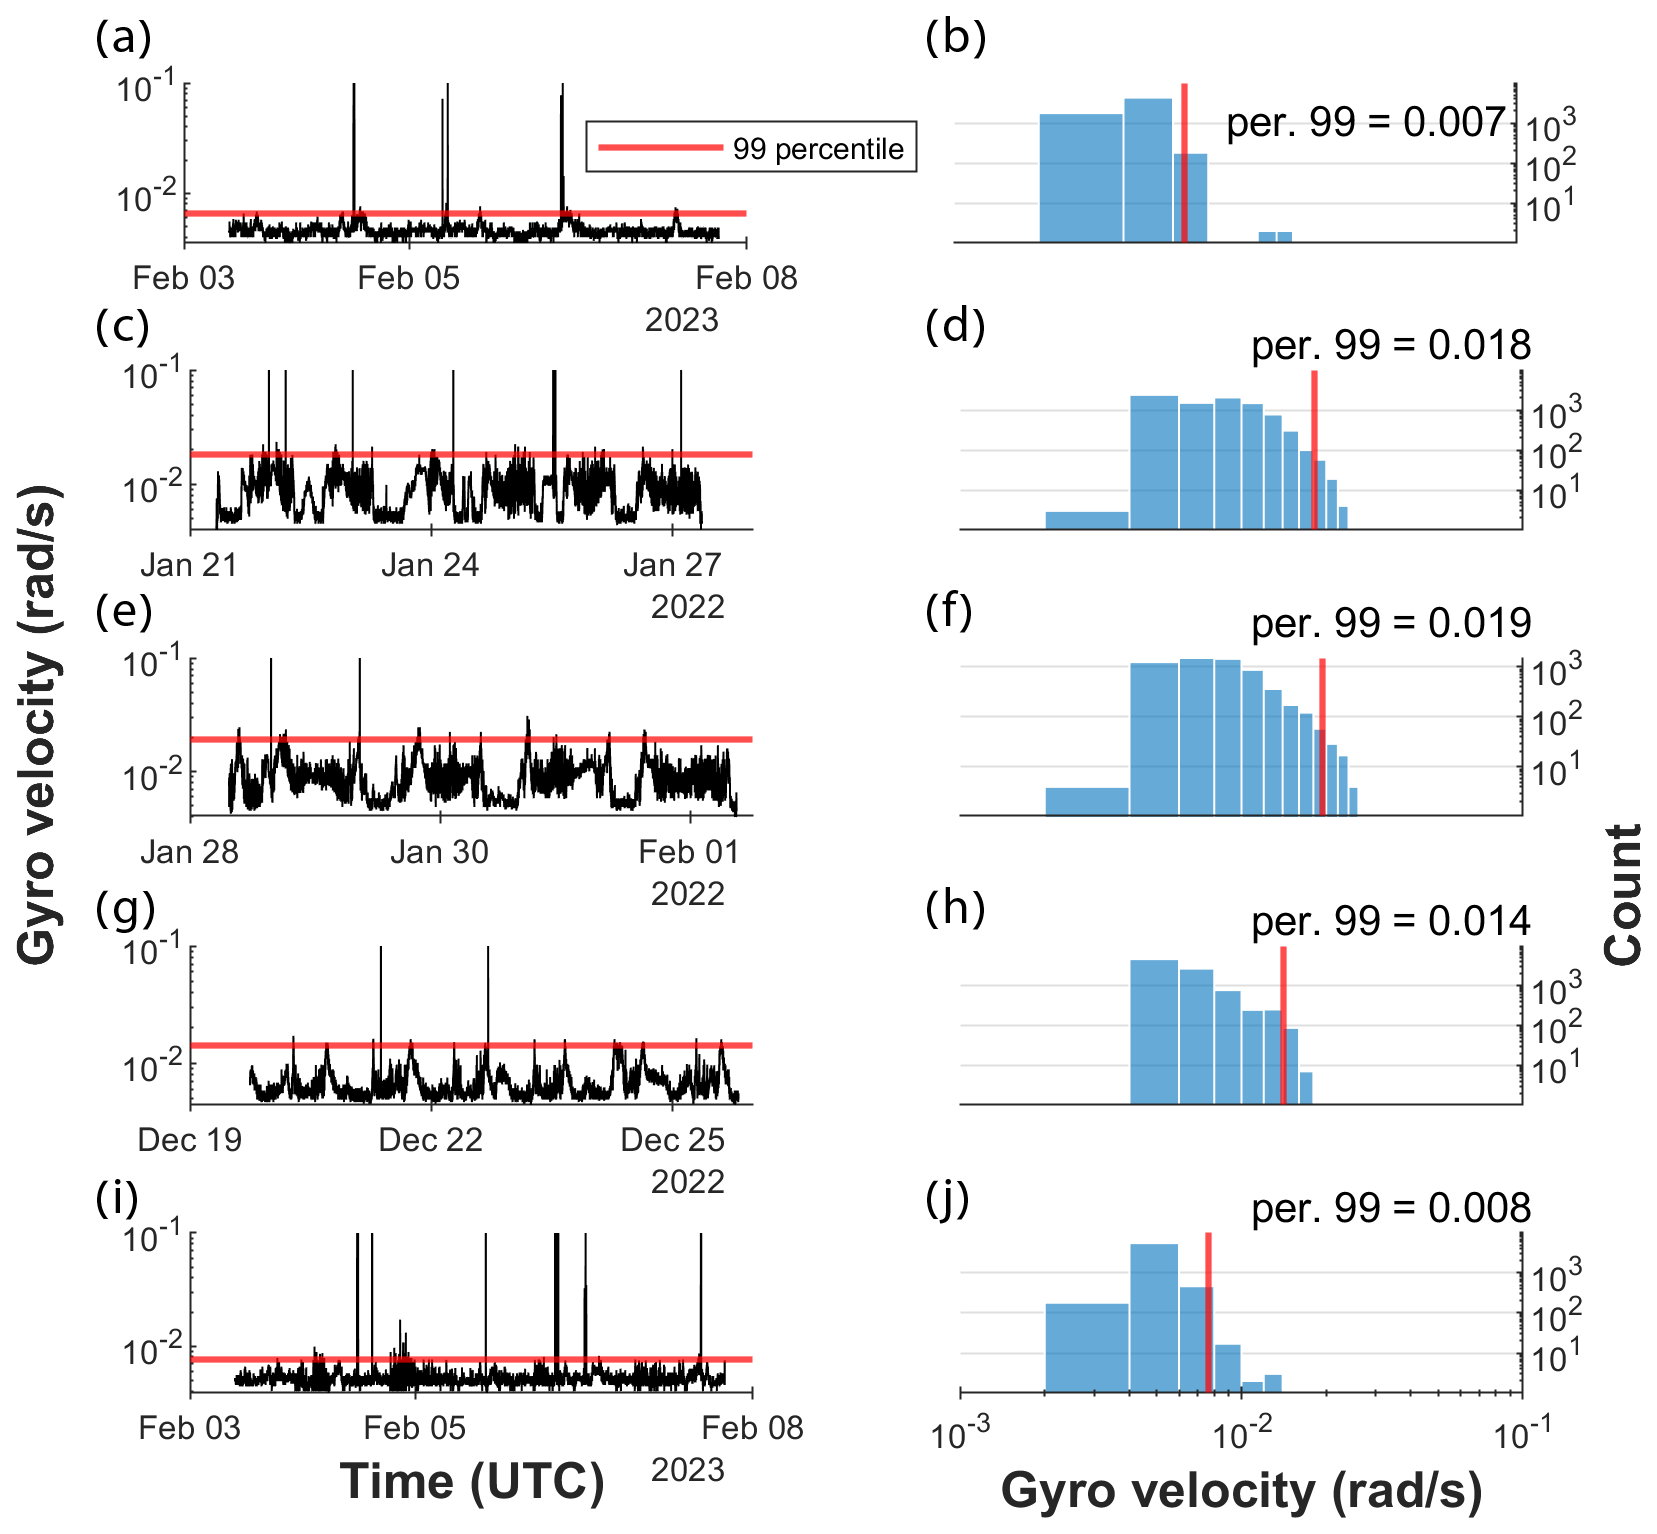
Figure 3Pre-flood gyro velocity time series (left side column) and the corresponding gyro velocity histogram (right side column). The red line represents the 99th percentile value for each pre-flood period. (a)–(b) Nahal Anim, event A1; (c)–(d) Nahal Yatir, event Y1; (e)–(f) Nahal Yatir, event Y2; (g)–(h) Nahal Yatir, event Y3 (i)–(j) Nahal Yatir, event Y4.
3.2.2 Gyro velocities during flow events
The smartrock gyro velocity time series recorded during flow events ranged from values below the rest-to-vibration (noise) threshold to peak rotation rates of 27 and 16–39 rad s−1 in A1 and Y1–4, respectively. The transition from velocities below the noise threshold to vibrational motion occurred at a water depth of 0.125 m in Nahal Anim and at depths of 0.25–0.40 m in event Y1–4 in (Fig. S4), based on all gyro data. However, when separating measurements taken during rapid increase of stage from those taken under stable flow conditions, a distinct pattern emerges. During rapid increase of stage in Nahal Anim, gyro velocities exceeded the noise threshold at a water depth of ≈0.1 m while in steady flow condition it occurred at water depth of ≈0.2 m (Fig. 4a). In 6 out of 7 depth bins ≥0.1 m the median gyro velocities recorded during rapid increase of stage were higher than those observed under steady flow conditions, with a mean ratio of 3.2. In Nahal Yatir, gyro velocities exceeded the noise threshold at depths in the range 0.10–0.30 m. When the gyro velocity exceeded the rest-vibration threshold in 13 among 14 depth bins, the median gyro velocities recorded during rapid increase of stage were higher than those observed under steady flow conditions, with differences reaching up to two orders of magnitude. In Nahal Yatir the ratio of gyro velocity during rapid increase of stage to that during steady flow varies with increase in water level (Fig. 5). At depths up to ∼ 0.09 m, this ratio exceeded unity; between ∼ 0.09 and 0.65 m the ratio approached unity, except for an outlier at 0.24 m, after which the ratio again increased to values above unity. Based on these gyro velocity ratios, the data can be categorized into three distinct stages (G1–3) according to water depth (Fig. 5), reflecting changes in the relationship between rapid stage-rise and steady flow conditions.
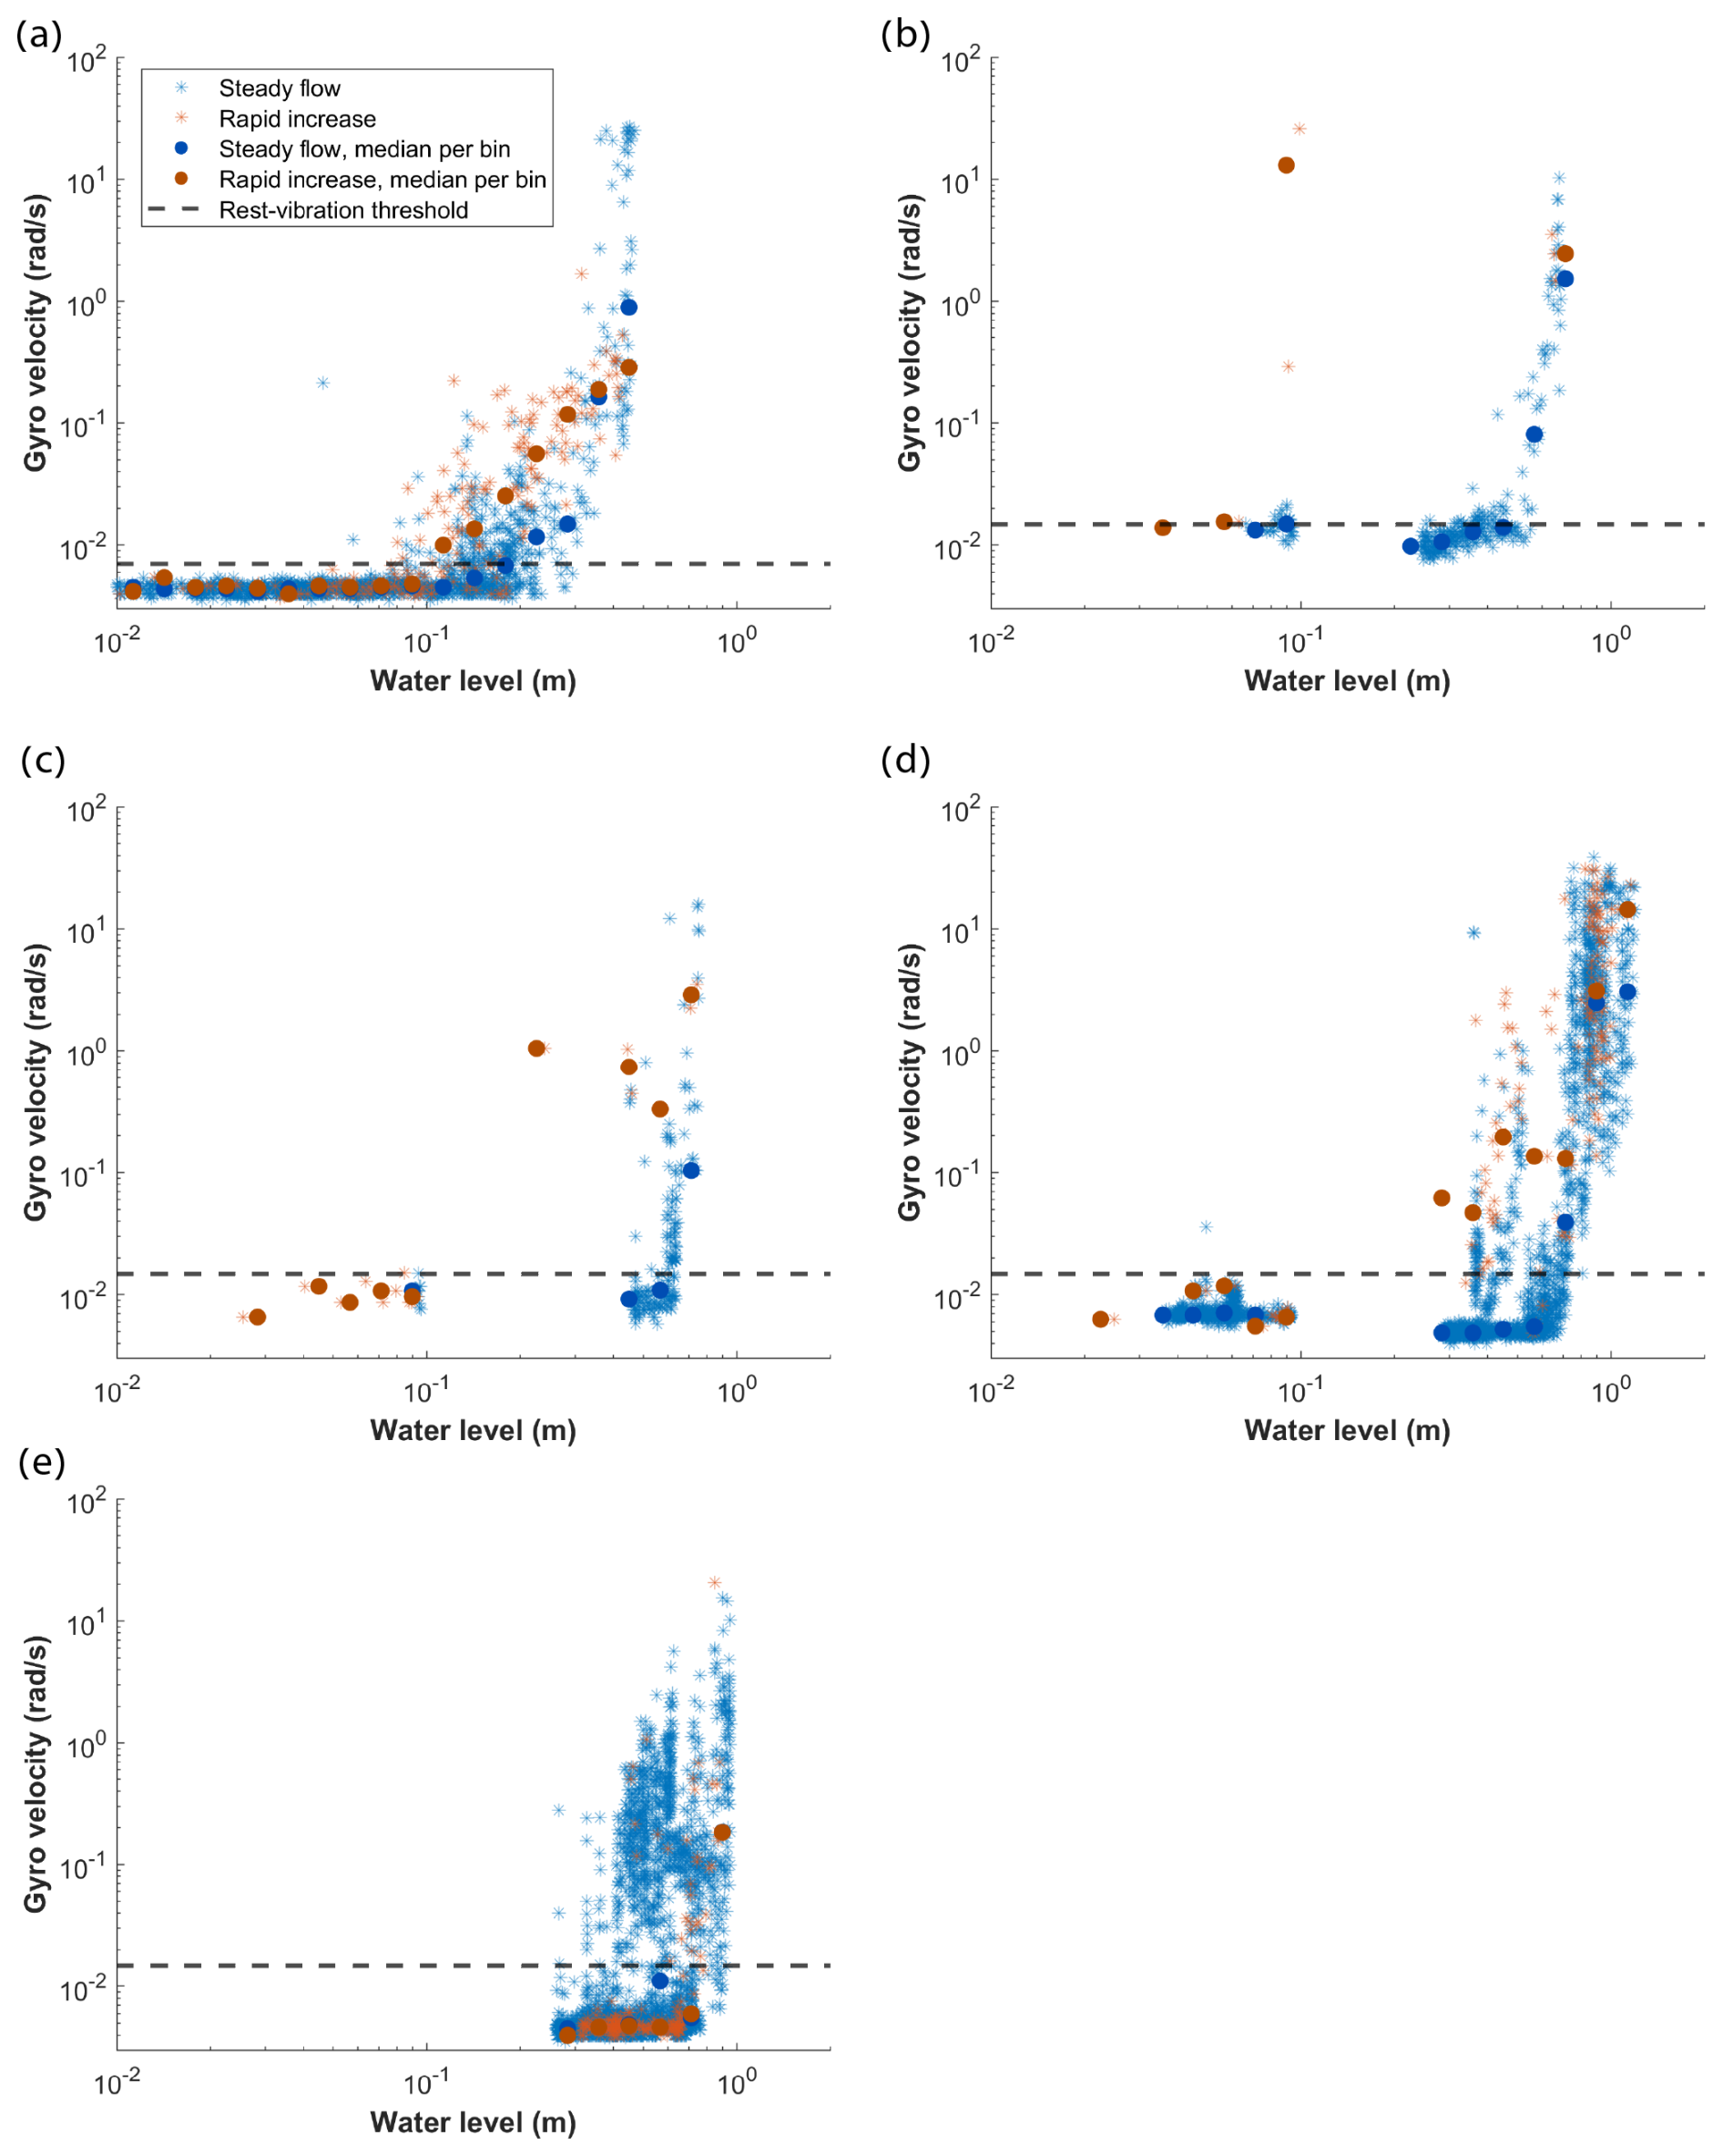
Figure 4The variation of smartrock gyro velocity with water level for rapid rise time windows (red) and steady time windows (blue). (a) Nahal Anim; (b)–(e) Nahal Yatir, events Y1–4. Dashed black line indicates the gyro threshold of average rest-vibration.
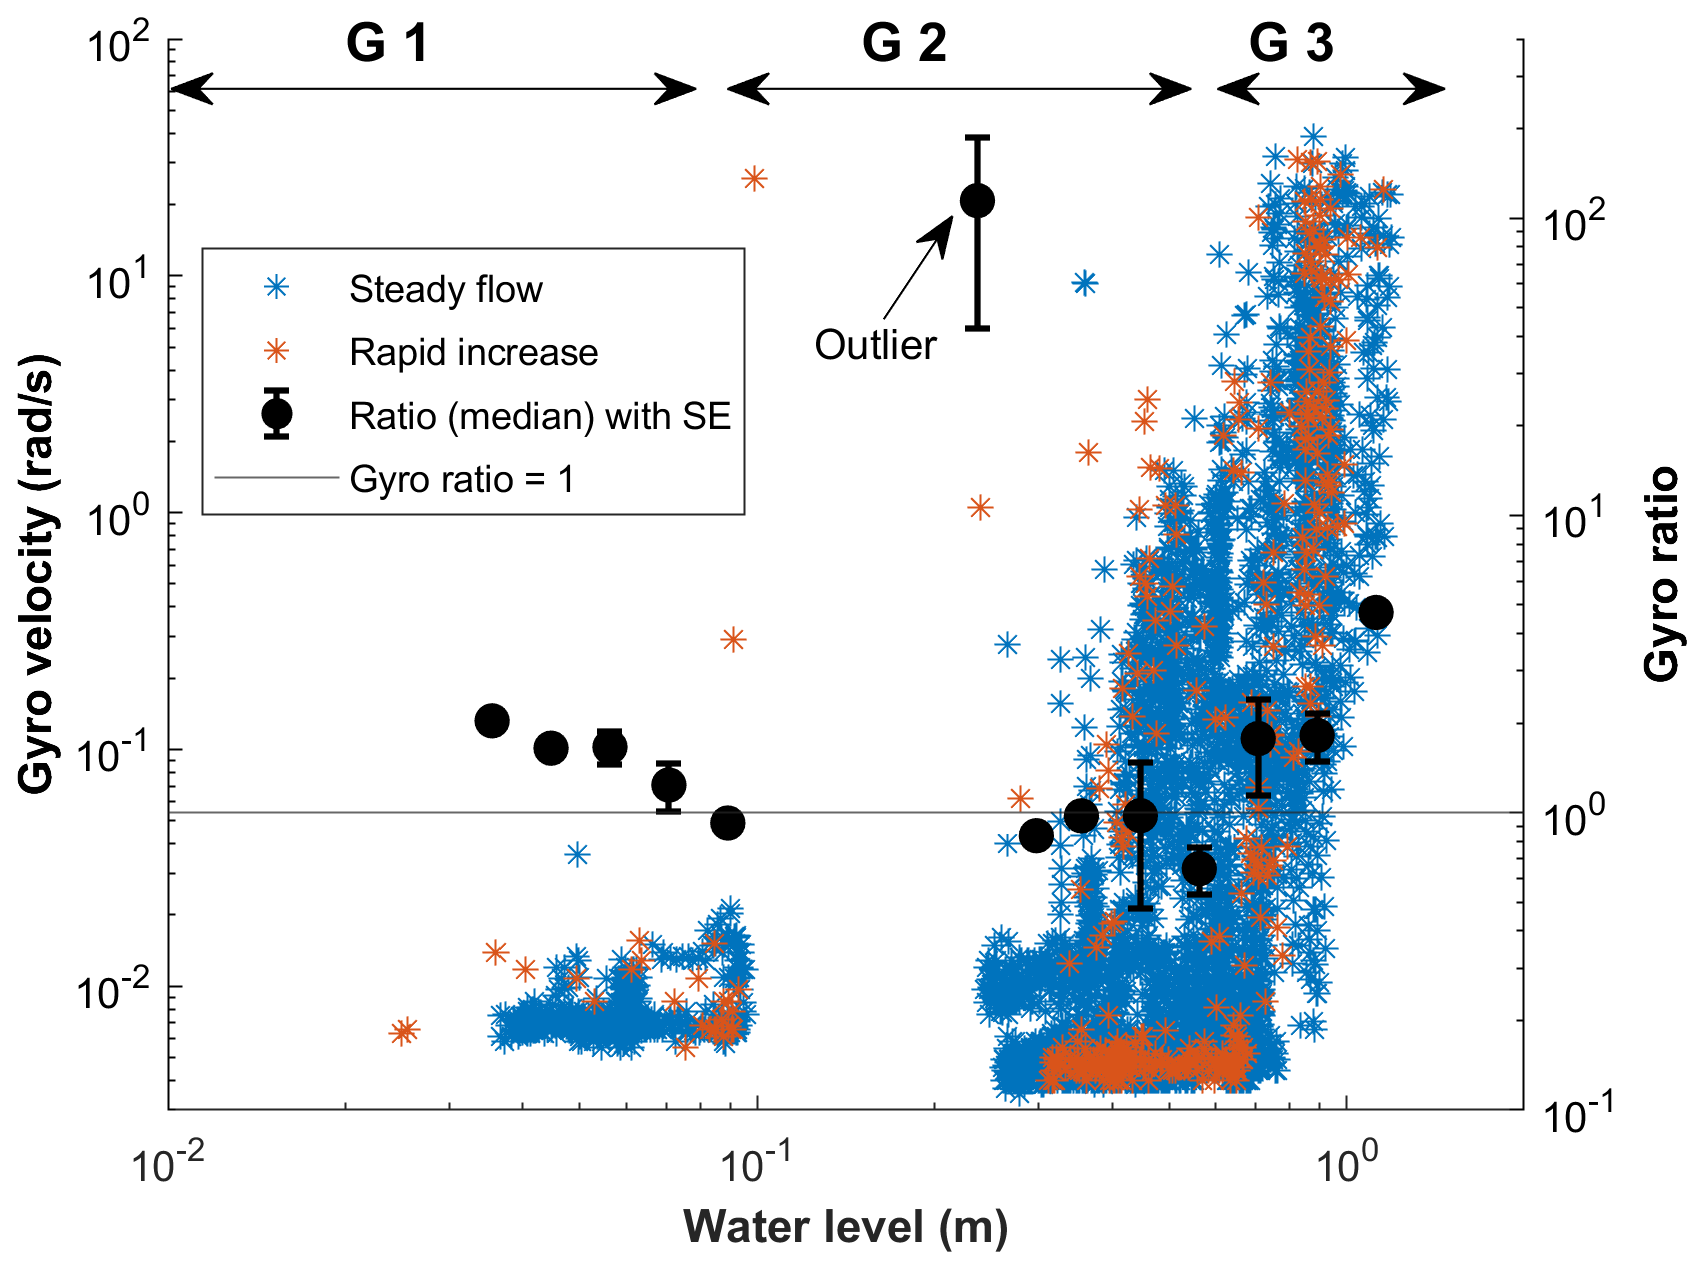
Figure 5Gyro velocity (left ordinate) and gyro velocity ratio (right ordinate) against water level from Nahal Yatir (events Y1–4). The ratio points represent the median gyro velocity between rapid increase of stage and steady flow conditions, calculated for each water level interval. Based on the ratio points the data is categorized into three distinct gyro-based stages (G1–3; black arrows). The horizontal line represents a gyro velocity ratio of 1, indicating equal median velocities during rapid rise and steady flow conditions. Gyro data for the water depth range of 0.10–0.25 m is not shown, as this range corresponds to the very slow recession phase, where no comparable rapid stage rise gyro data exist.
3.2.3 Distribution of smartrock movements
Figure 6 shows the distribution of smartrock movements relative to the total number of measurements, classified as either vibration or displacement, across the three gyro-based stages in Nahal Yatir. At this site the smartrock intermediate diameters are comparable to the median bed surface grain size (∼d50), making their movements representative of overall bedload transport. Smartrock motion during rapid increase of stage was considerably more frequent in G1 compared to steady flow conditions. Additionally, when displacement occurred (G2 and G3), it was greater during rapid increase of stage compared to steady flow conditions.
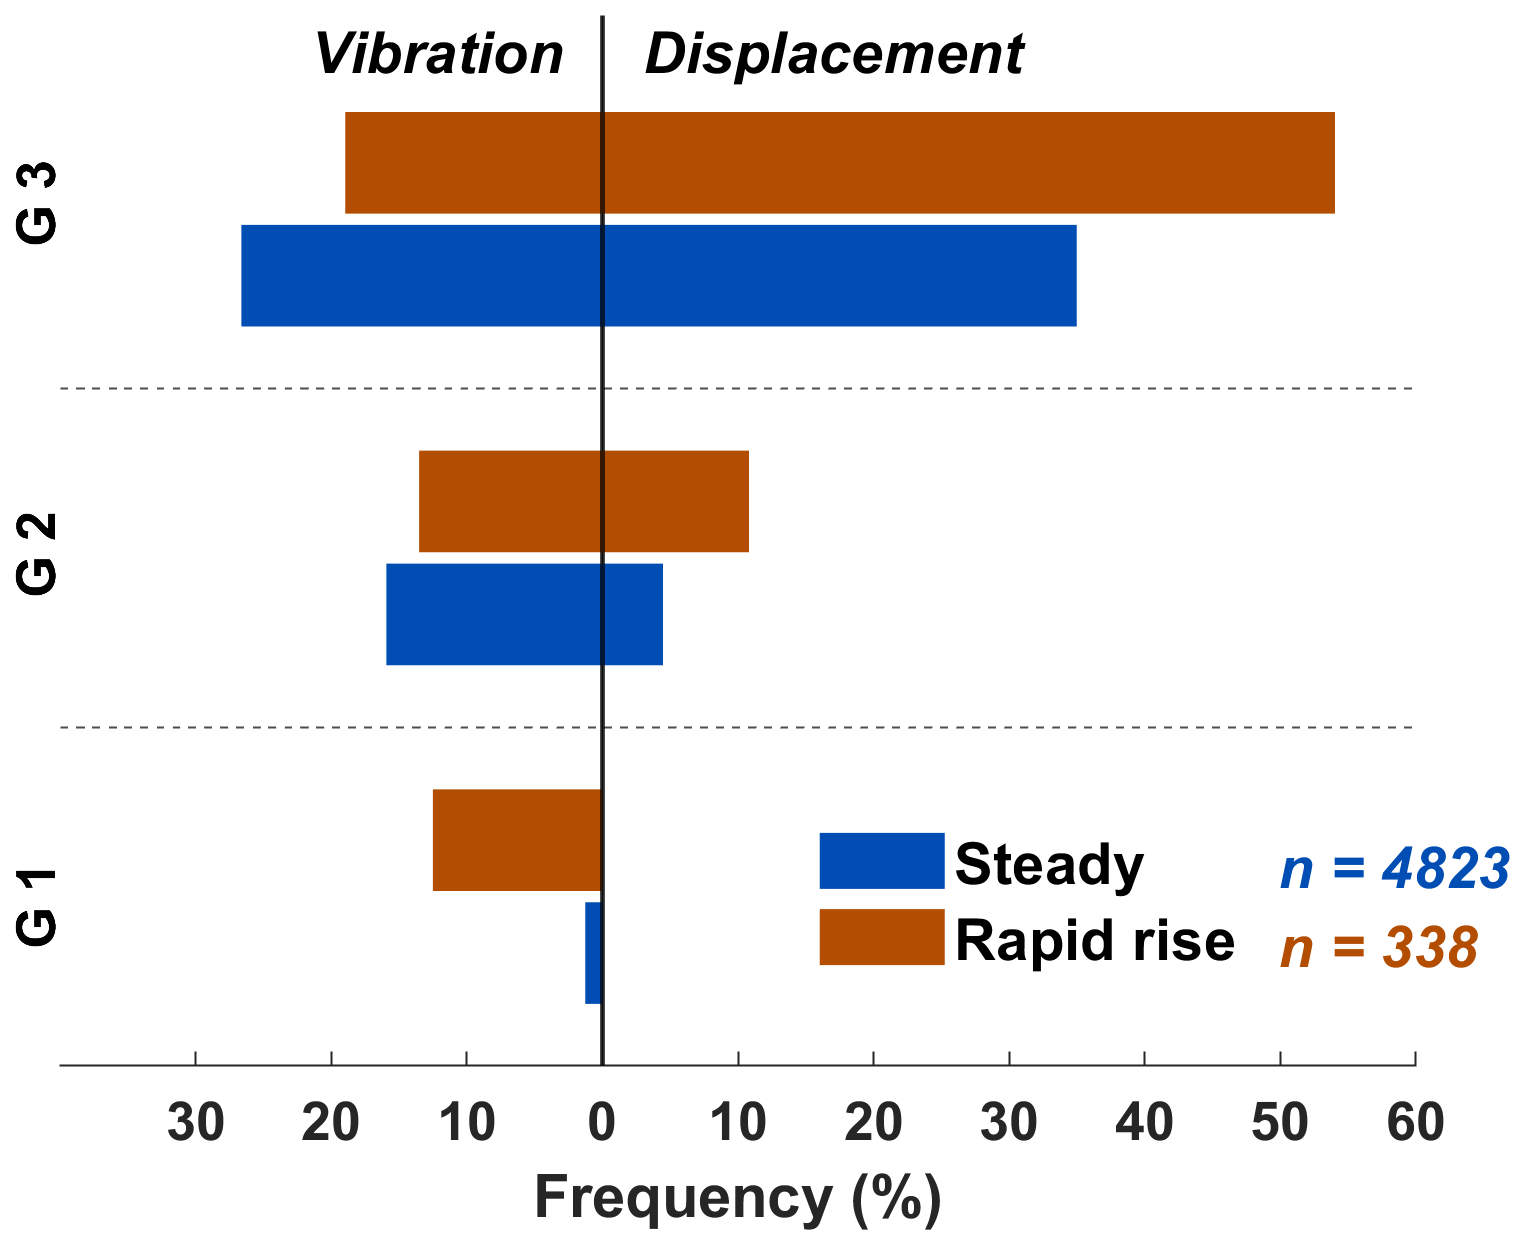
Figure 6Distribution of smartrock motion during rapid stage-rise and steady flow conditions in Nahal Yatir. Motion is classified by motion mode (vibration, left; displacement, right) and across the three gyro-based stages (G1–3). Frequencies represent the proportion of measurements within each combination relative to the total number of measurements, shown separately for rapid stage-rise (red) and steady flow (blue) conditions.
3.3 Characteristics of seismic energy
3.3.1 Seismic energy during flow events
Seismic energy within the 10–100 Hz frequency range increased significantly during flow events, rising from noise levels of up to db in Nahal Anim and Nahal Yatir to maximum values of −116 and −120 db, respectively (Fig. 2). A distinct frequency range with elevated energy was observed during flow events, spanning 30–80 Hz in Nahal Anim and 40–90 Hz in Nahal Yatir. The spectrograms did not reveal distinct or separate frequency bands that could be uniquely attributed to either turbulence or bedload transport. This observation suggests that these processes overlap and share common frequency ranges at these sites.
3.3.2 Correlation of PSD-smartrock gyro velocity
Figure 7 presents the Spearman's correlation coefficients between median gyro velocity and median seismic energy across frequency bands for each event. In Nahal Anim, the frequency band with the highest correlation (r=0.82) was 35–60 Hz (average frequency 47.5 Hz). In Nahal Yatir, the frequency band with the highest correlation varied across events: 40–65, 60–85, 50–75, and 30–55 Hz for Events Y1–4, with corresponding Spearman coefficients of 0.91, 0.86, 0.96, and 0.8, respectively.
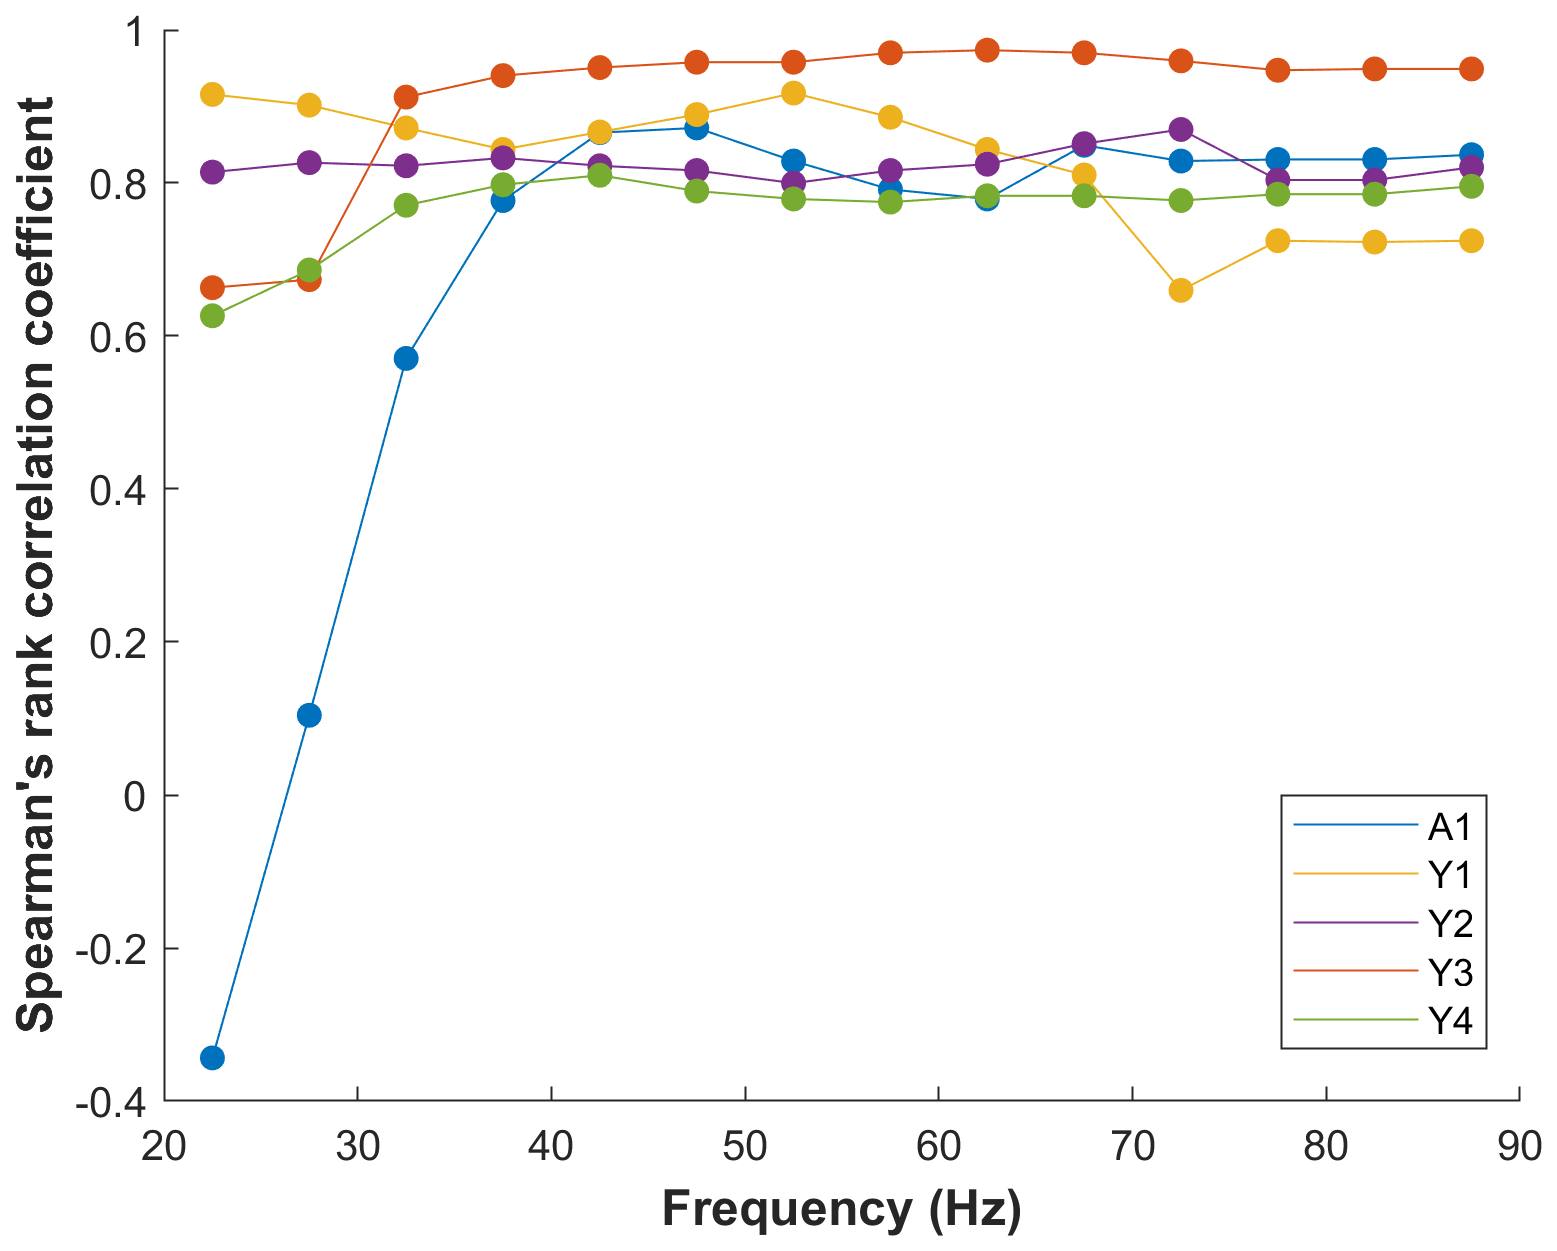
Figure 7The variation of Spearman's rank correlation coefficients for the correlation of PSD-gyro velocity with frequency. Each line represents an individual event; circles indicate the mid-point frequency within each 25 Hz range.
3.3.3 PSD trends with water depth
Seismic energy increased with water depth in Nahal Anim, exhibiting two distinct trends (Fig. 8). The first, a moderate increase, occurred up to a depth of approximately 0.10 m, with median PSD values (binned by water depth) ranging from −178 to −171 dB. The second, steeper increase extended to the maximum measured depth of 0.50 m, with median PSD values ranging from −170 to −145 dB in the second segment. In Nahal Yatir, PSD exhibited no significant trend with water depth up to 0.10 m, with bin median values ranging from −180 to −172 dB. At greater depths, seismic energy increased with water depth, ranging from −169 to −149 dB. Notably, the PSD values in Nahal Anim are more widely scattered than those in Nahal Yatir, particularly at water depths below ∼ 0.10 m.
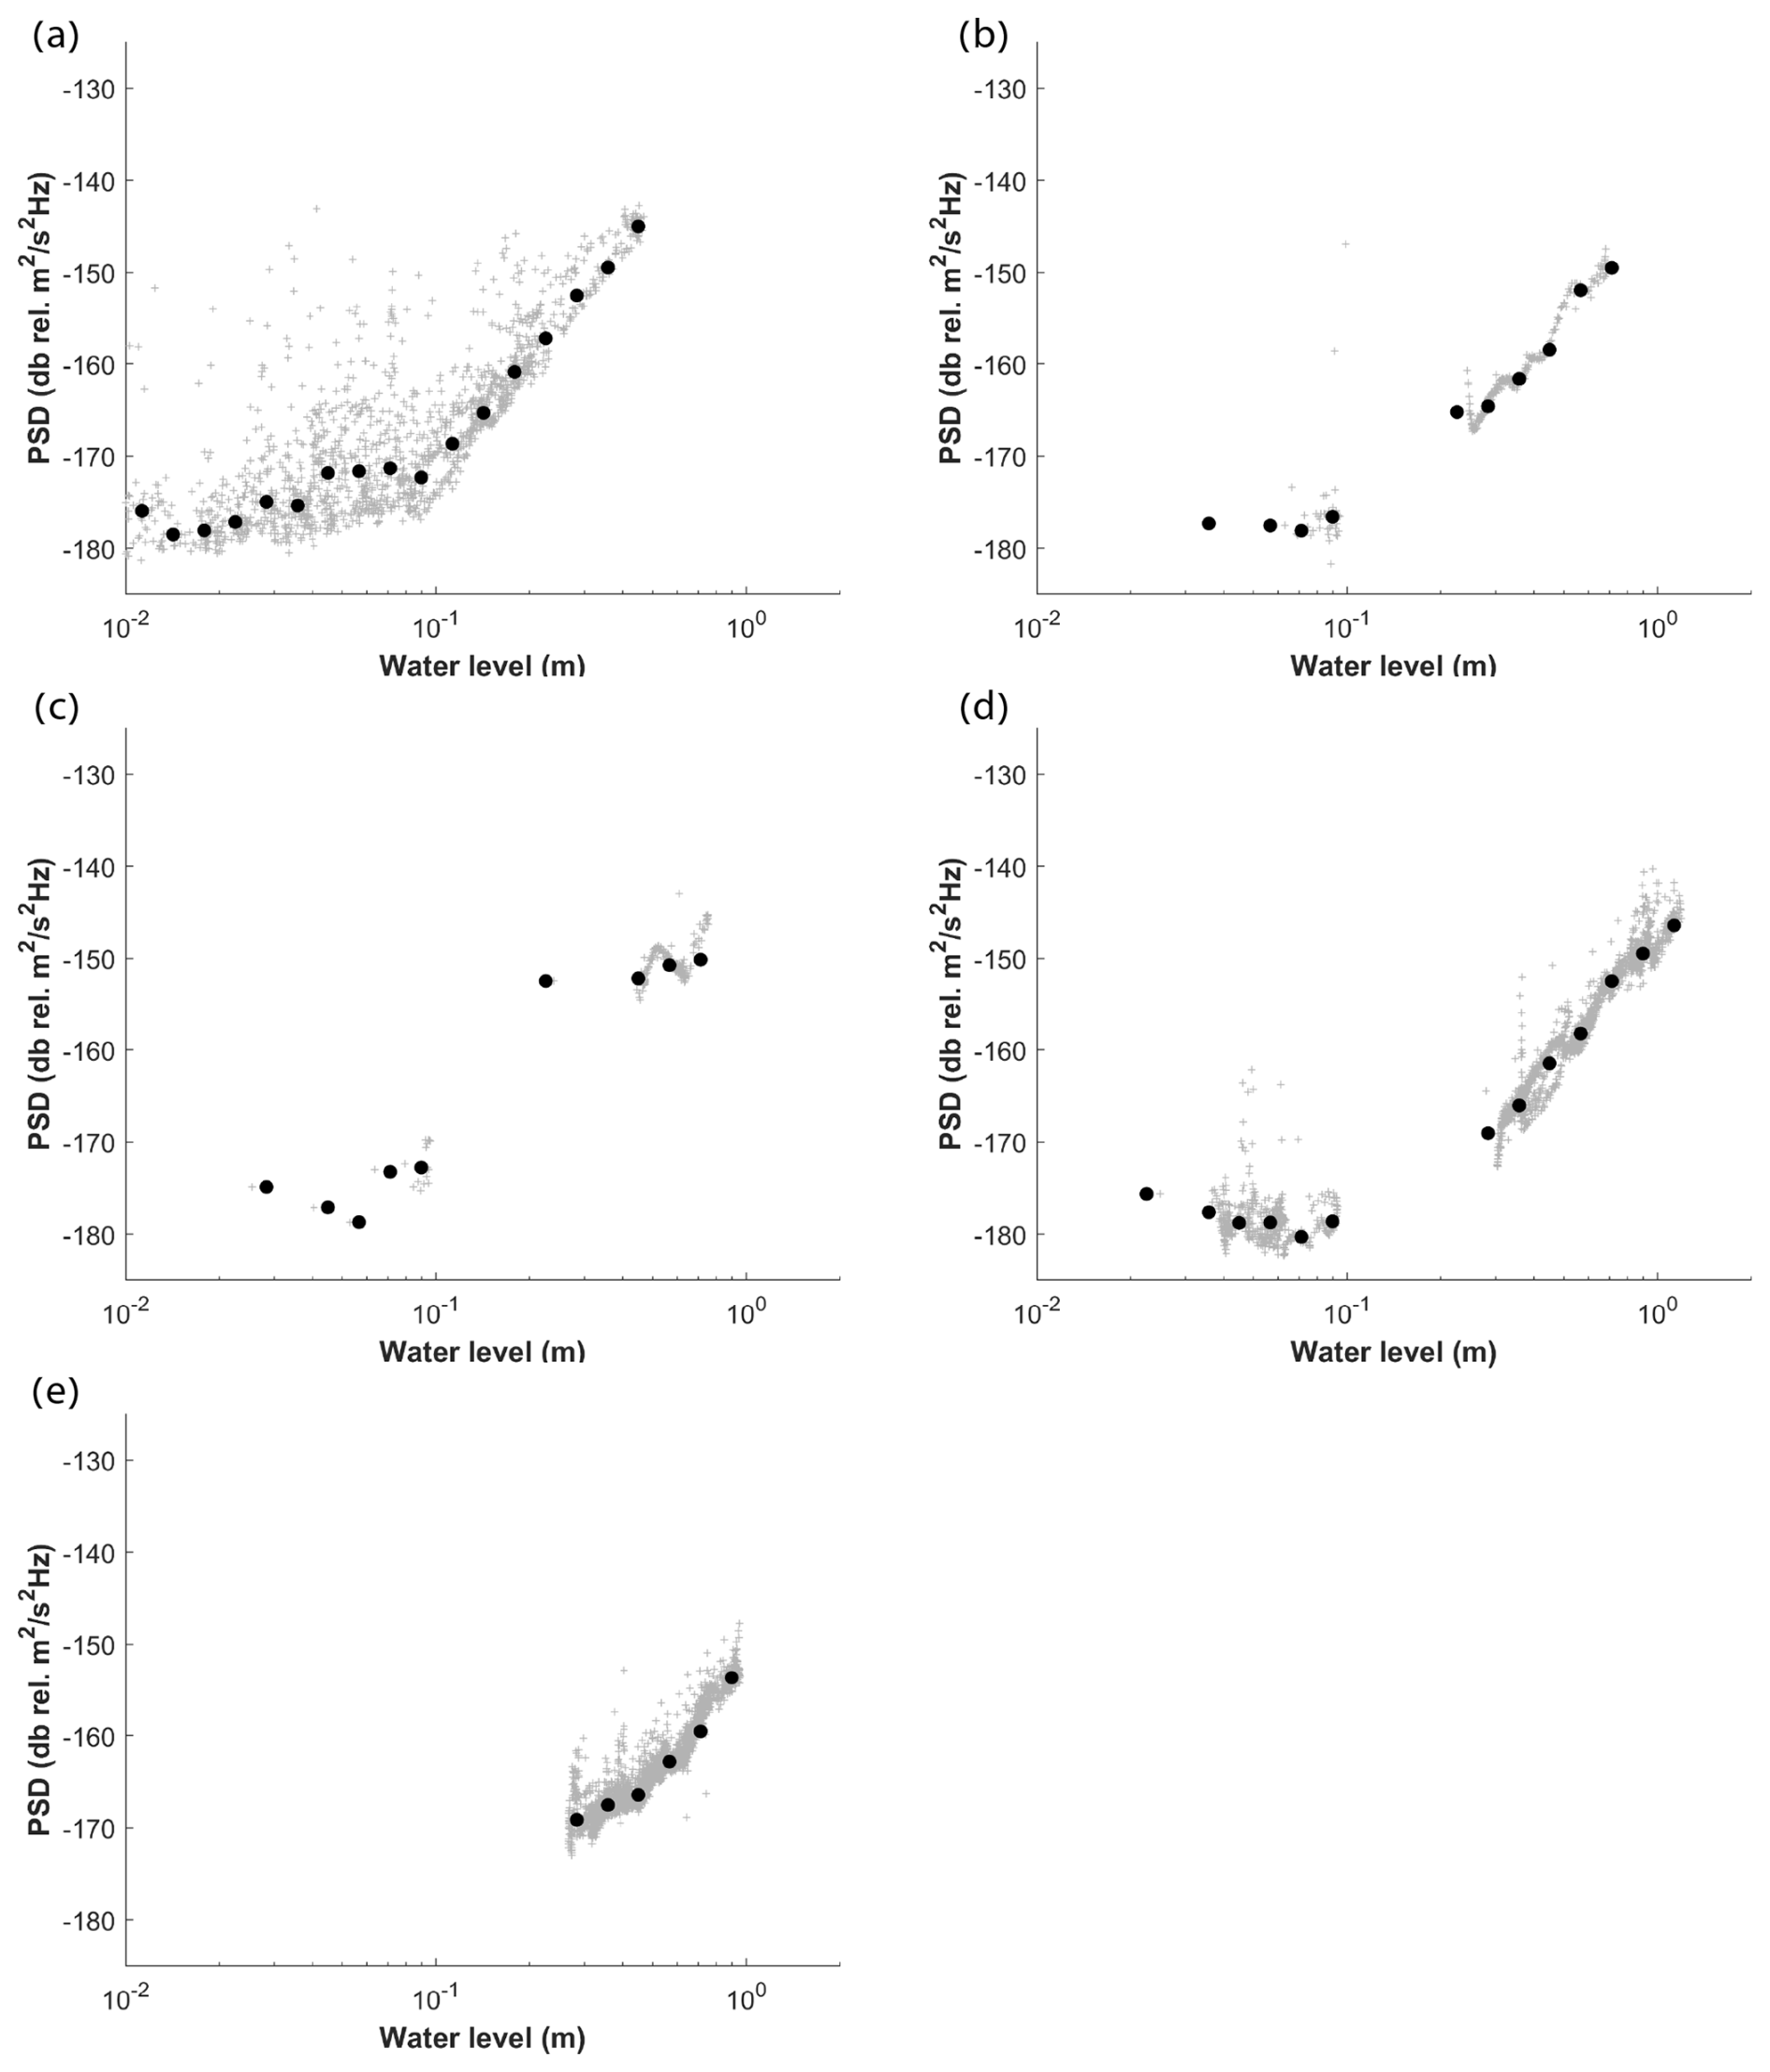
Figure 8PSD against water depth during event A1, using the 35–60 Hz frequency band (a); and Y 1–4, respectively using the 40–65, 60–85, 50–75, and 30–55 Hz frequency bands (b)–(e). Data points (grey crosses) are logarithmically binned (black circles) by water depth, with an interval of 2 dB relative to water level. PSD data for the water depth range of 0.10–0.25 m is not shown in (b)–(e), as it corresponds to the very slow recession phase of this flow event, and no comparable rapid rise gyro data exist for this range.
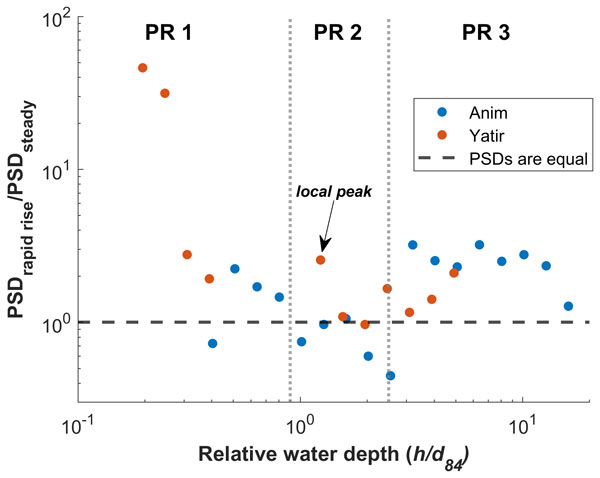
The ratio of seismic energy during rapid increase of stage to steady flow conditions varied with water depth (Fig. 9) at both sites. The PSD ratios exhibit a depth-dependent behaviour, enabling the data to be categorized into three distinct PSD-based stages (P1–3). While the general trends are consistent, the specific water depth ranges defining these stages differ between Nahal Yatir and Nahal Anim. In Nahal Yatir, P1 occurs below ∼ 0.1 m, where seismic energy ratios exceed unity. In Nahal Anim, this stage is observed at shallower depths, below ∼ 0.03 m. P2 spans ∼ 0.1 to 0.55 m in Nahal Yatir and ∼ 0.03 to 0.08 m in Nahal Anim, where seismic energy ratios approach or are slightly below unity. Stage P3 begins at depths greater than 0.55 m in Nahal Yatir and greater than 0.08 m in Nahal Anim, where seismic energy ratios increase once again, although in Nahal Yatir the increase is more moderate compared to Stage P1, where substantially higher ratios are observed. Despite these differences in absolute water depth, analysis of the combined dataset reveals a consistent pattern when examining the seismic energy ratio as a function of relative water depth (; where d84 represent one standard deviation above the mean roughness size) across both stations (Fig. 10). This unified analysis identified three distinct flow stages (PR1–3) common to both channels. PR1 () is characterized by PSD ratios exceeding unity, PR2 () has ratios approximately equal to or slightly below unity, and for PR3 () ratios consistently exceeded unity.
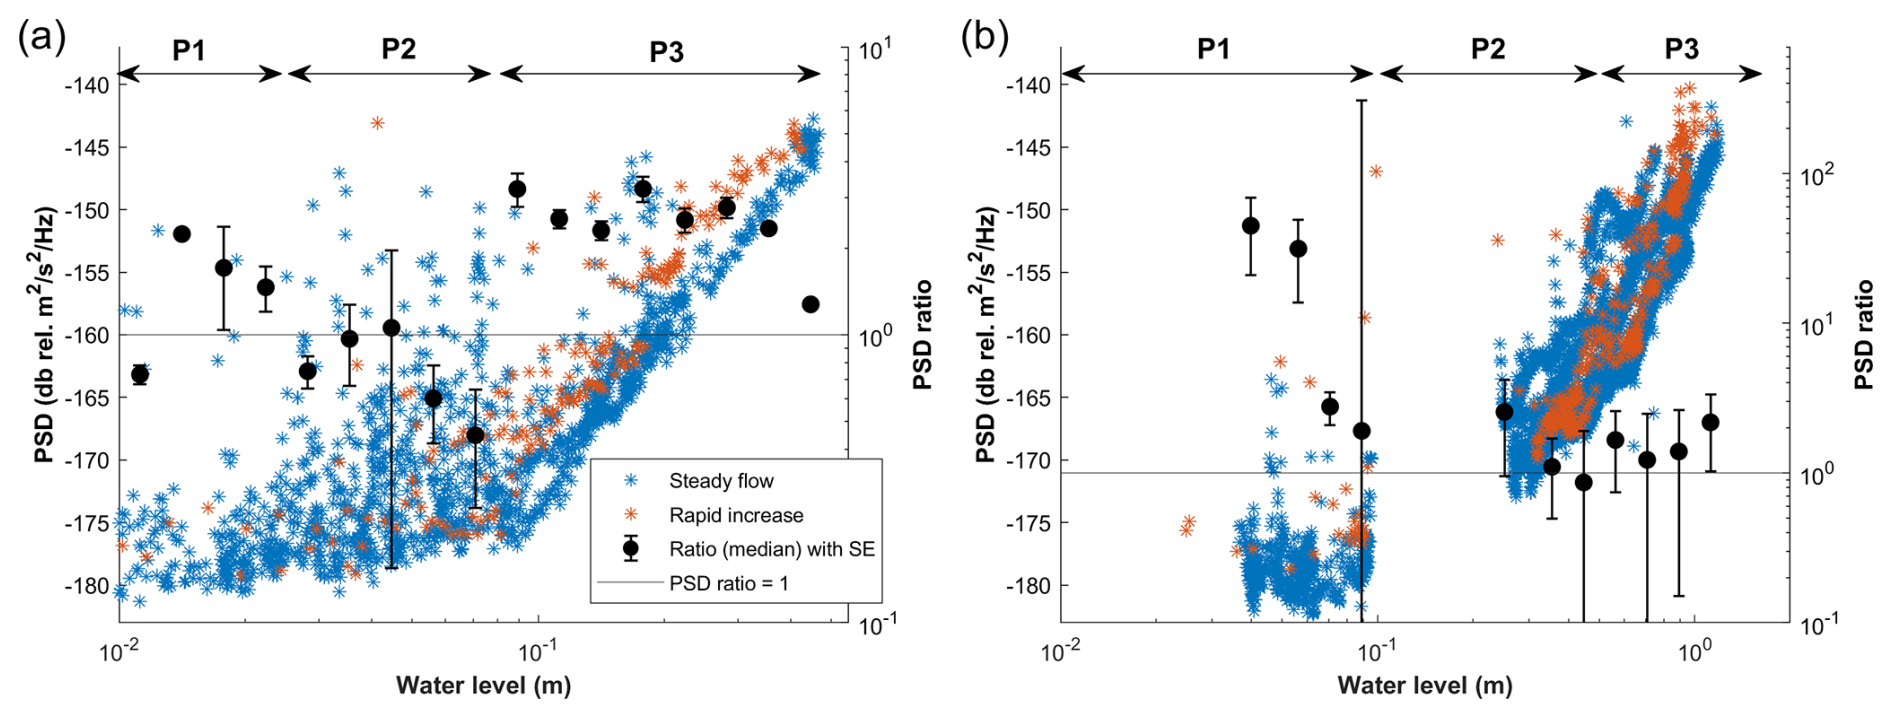
Figure 9The variation of PSD (left ordinate) and PSD ratio (right ordinate) with water level. The PSD ratio represent the median of PSD values between rapid increase of stage and steady flow conditions, calculated for each water level interval. (a) Nahal Anim, event A1 and (b) Nahal Yatir, events Y1–4. The horizontal line represents a PSD ratio of 1, indicating equal median PSD during rapid rise and steady flow conditions. Based on the ratio points the data are categorized into three PSD-based stages (P1–3; black arrows). These stages describe the depth-dependent variation in relative seismic energy and are defined independently of the gyro-based stages (G1–G3; Fig. 5). The seismic frequencies used here are those described in Sect. 3.3. PSD data within the 0.10–0.25 m water depth range are excluded, as it corresponds to the very slow recession phase of this flow event, with no comparable rapid rise PSD data existing for this range.
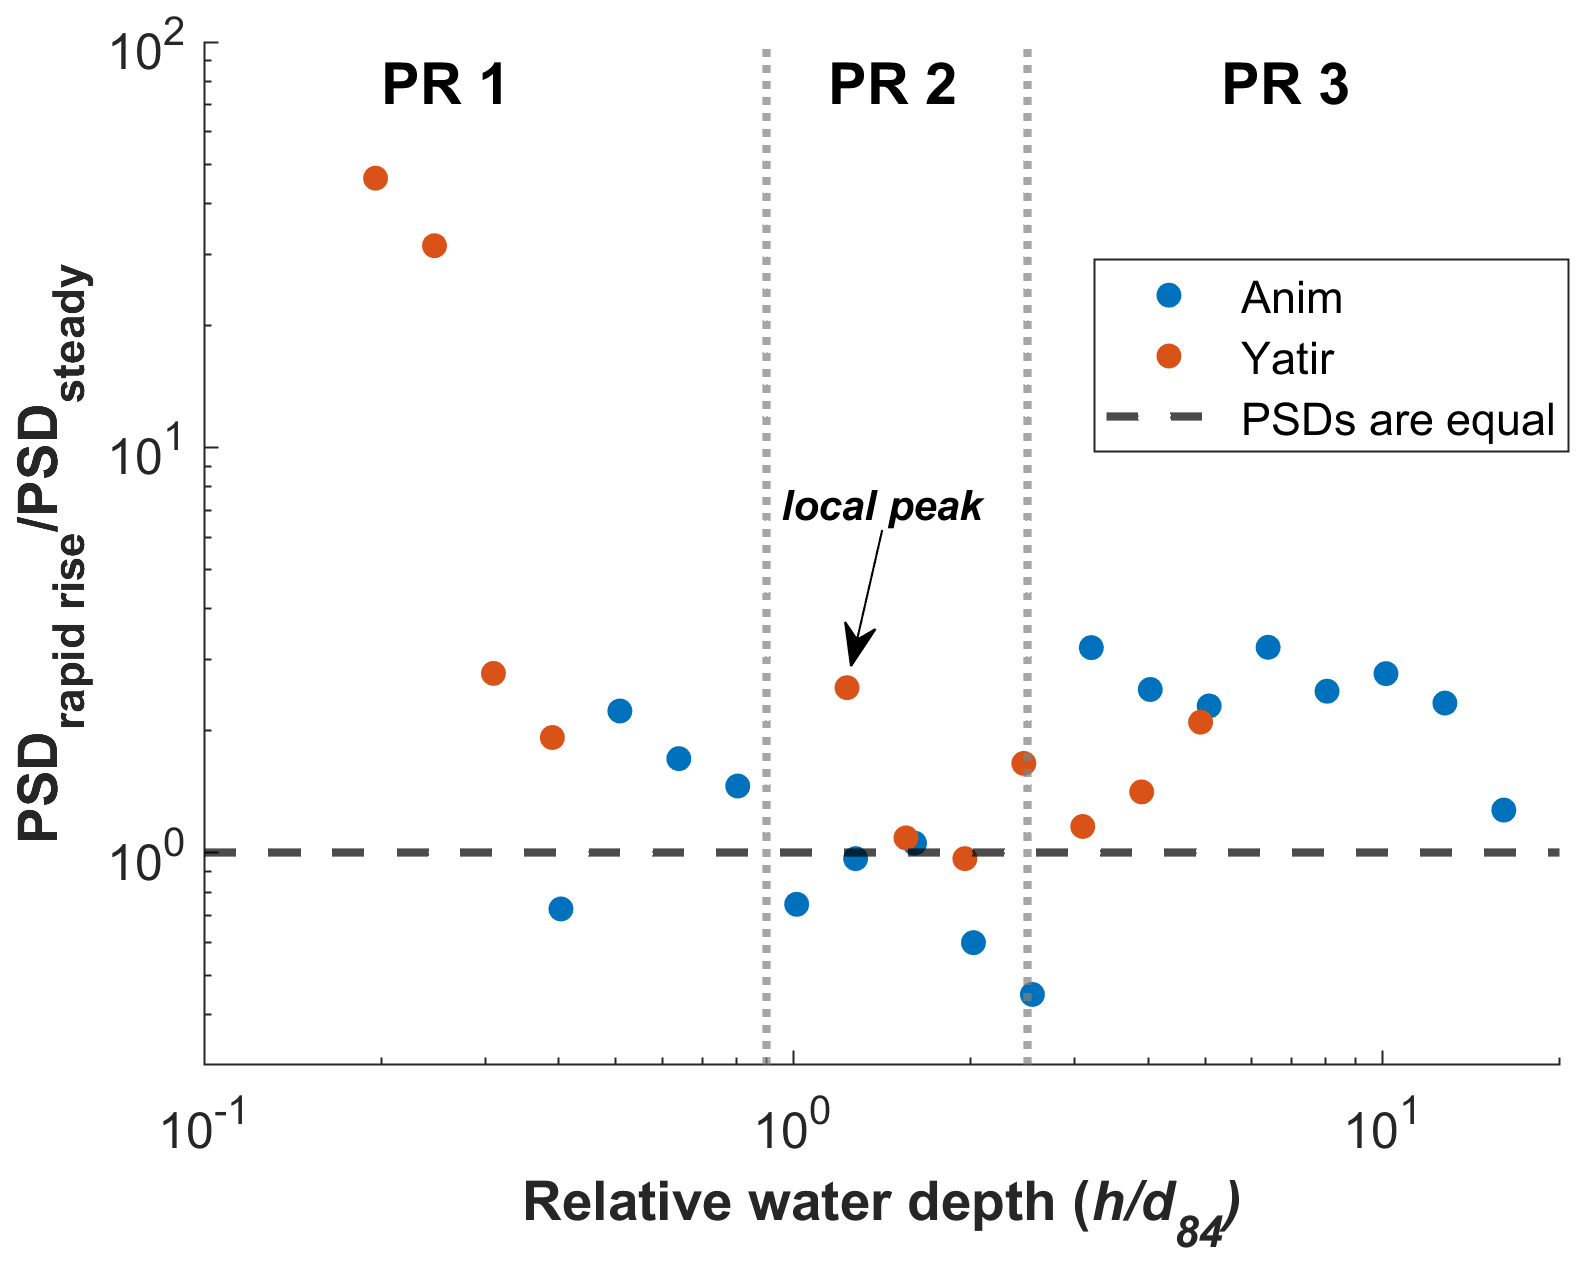
Figure 10PSD ratio against relative water depth () for the Nahal Anim event A1 (blue circles) and for Nahal Yatir, events Y1–4 (red circles). Dashed vertical lines indicate the transitions between stages.
3.4 Coupling smartrock and seismic data
The relationship between the gyro velocity of smartrocks and seismic energies shows significant scatter below the noise threshold for all events, with seismic energy values in the range −183 to −142 dB for Nahal Anim (Fig. S9) and −189 to −148 dB for Nahal Yatir (Figs. 11 and S9), respectively. The median ratio of seismic energies under rapid stage-rise conditions to those under steady-flow conditions with increase of gyro velocity in Nahal Yatir remained almost consistently greater than or equal to 1 across all velocities, but displayed two distinct PSD-gyro trends (PG1 and PG2; Fig. 11). For velocities below 0.2 rad s−1, the ratio decreases and varies between ≈1 and 3. At greater gyro velocities, the ratio increases in the same range.
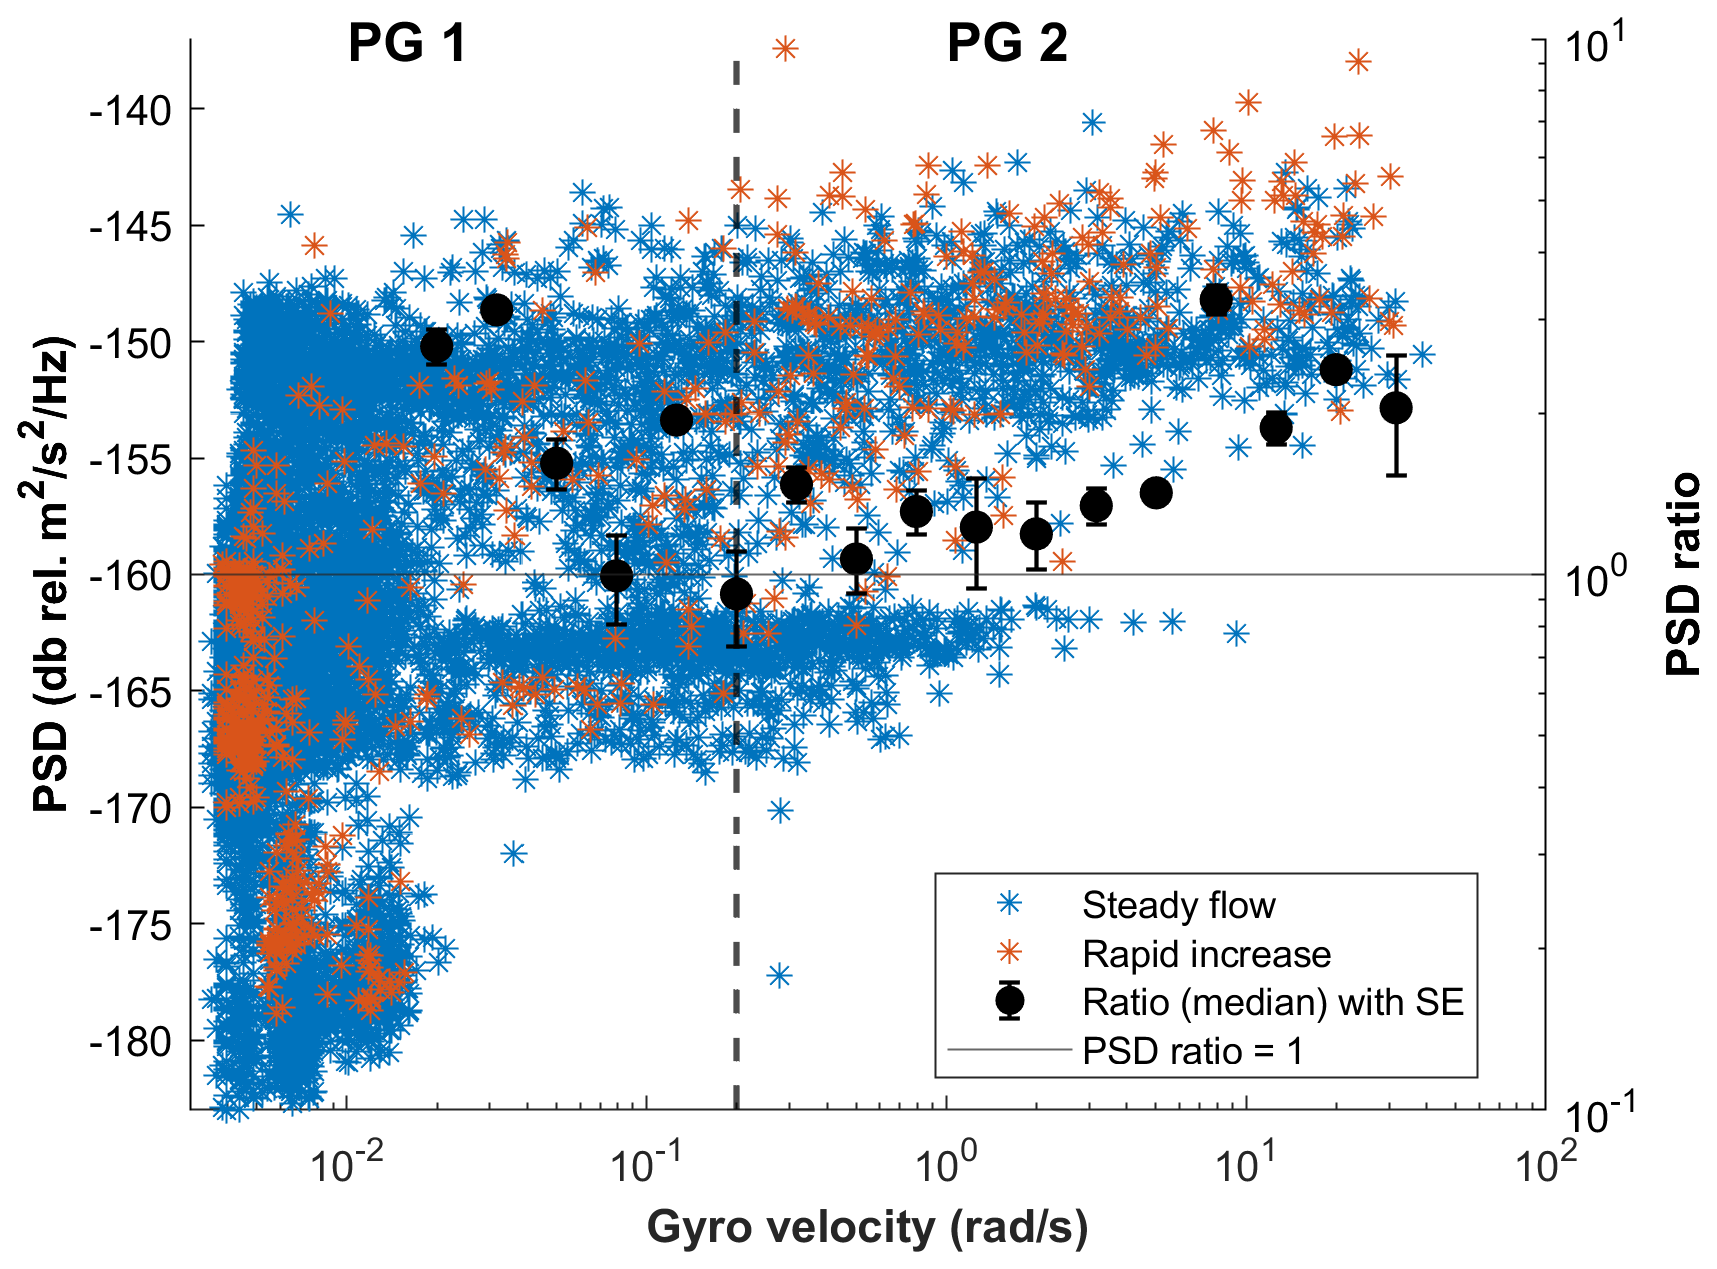
Figure 11The variation of PSD (left ordinate) and PSD ratio (right ordinate) with gyro velocity for Y1–4. The right ordinate represents the ratio of median PSD values between rapid increase of stage and steady flow conditions for each water level interval. Dashed line indicates transition between two PSD-gyro stages (PG1 and PG2). The horizontal line indicates a ratio of 1, denoting identical seismic energy for a given gyro velocity during rapid rise and steady flow conditions. The seismic frequencies used here are those described in Sect. 3.3.
To compare the bedload transport dynamics between rapid stage-rise and steady flow conditions, we collected seismic measurements and smartrock data in two ephemeral channels: Nahal Anim, characterized by finer bed material (d50=14 mm), and Nahal Yatir, with coarser bed material (d50=76 mm). We examined how gyro velocities varied with water depth, comparing rapid stage rise to steady flow conditions. Next, we analyzed seismic energy variations with water depth. Finally, we investigated the relationship between seismic energy and gyro velocities. The synthesis of these complementary measurement techniques revealed systematic patterns in how bed material responds to rapid increase of stage. In the following, we describe the stage characteristics in detail, followed by a brief discussion of the potential use in seismic data inversion for calculating bedload transport rates during bores.
4.1 Stage characteristics
Both the PSD-based stages (P1–3) and the gyro-based stages (G1–3) independently revealed the existence of three distinct stages in the response of bed material to rapid stage rises. These correspond to three stages in water level: (1) shallow, (2) transitional, and (3) deep. In the following sections, we describe in detail and interpret the observations associated with each stage.
4.1.1 Stage 1: shallow flow
At shallow relative depths (), seismic measurements reveal higher energies during rapid increase of stage compared to steady flow conditions (PR1; Fig. 10), extending to a flow depth of ∼ 0.10 m in Nahal Yatir and ∼ 0.03 m in Nahal Anim (P1; Fig. 9). This observation is also supported by the gyro velocity measurements in Nahal Yatir, where the gyro ratio between rapid increase of stage and steady flow conditions remains above unity up to a depth of 0.09 m (G1; Fig. 5). These findings indicate that sediment activity under rapid increase of stage at shallow depths is more pronounced than under steady conditions. Similar behavior has been reported in previous studies, which attribute enhanced bedload transport during unsteady flow to intensified near-bed turbulence and the resulting increase in instantaneous shear stresses acting on bed particles (Halfi et al., 2023; Sumer et al., 2003).
Smartrock data for this stage indicate that under conditions of both steady flow and rapid increase of stage, the pebbles exhibit no displacement, as gyro velocities remain predominantly below the motion threshold (G1; Fig. 6). However, the pebbles do exhibit vibrational motion, with substantially higher vibration occurrence during rapid increase of stage compared to steady flow conditions (Fig. 6). This vibration behaviour is consistent with findings reported by Wang et al. (2023) that particle vibrations are significantly influenced by high-energy turbulent events, which are crucial for particle entrainment. The elevated seismic energy ratios observed at this stage in Nahal Yatir events, therefore, likely reflect bedload vibrations (PG1; Fig. 11), as evidenced by gyro velocities being in the vibrational range ( rad s−1). However, the absence of smartrock displacement does not preclude the mobility of smaller bed material fractions. Finer particles may already be entrained at these shallow depths, and part of the observed seismic energy may, therefore, originate from their motion.
4.1.2 Stage 2: transitional flow
As relative depth increases (), the seismic energy ratio diminishes, converging towards unity (PR2; Fig. 10). This trend is evident at water depths of ∼ 0.10–0.55 m in coarser-grained Nahal Yatir and ∼ 0.03–0.080 m in finer-grained Nahal Anim (P2; Fig. 9). In the Nahal Yatir, where the smartrock intermediate diameter approximates the d50 of the bed material, gyro velocity measurements show corresponding stage transitions at depths of ∼ 0.09 and 0.65 m (G2; Fig. 5). The reduction of the seismic energy ratio suggests that the influence of rapid increase of stage on bedload transport weakens as water depth increases. The water-depth hydrographs (Fig. 2) show that many rapid stage increases within this depth range occurred when some water was already present in the channel, implying that the pre-existing water layer likely buffered near-bed turbulence. Consistent with this interpretation, Thappeta et al. (2023) found that hydraulic bores propagating over flowing water cause far lower bed shear stresses due to turbulent velocity fluctuations compared to bores over dry beds. A similar trend was reported by Halfi et al. (2023), finding that the impact of hydraulic bores on bedload transport rates is attenuated when they propagate over a bed already covered by flowing water and that this attenuation increases with water depth, with the relative contribution of intense flow diminishing even before the threshold for bedload motion is attained.
During this stage the amount of vibrational motion under rapid increase of stage becomes nearly equal to that under steady flow conditions, in contrast to the disparity observed in stage 1 (Fig. 6). The smartrocks still exhibit predominantly vibrational motion rather than displacement, with most gyro velocities generally remaining below the motion threshold. Notably, the rest-to-vibration threshold values found in this study (0.007–0.015 rad s−1) are identical to those we derived from analyzing data presented in Al-Obaidi and Valyrakis (2021b), who investigated motion threshold characterization using smartrocks (S6 in the Supplement). Although overall gyro velocity distributions are similar under the two flow conditions, gyro velocities indicative of downstream motion are more frequent under rapid increase of stage conditions than under steady flow conditions, while under steady flow such displacements remain relatively rare compared to vibrational motion (Fig. 6). In Nahal Yatir a notable peak in both gyro velocity and seismic energy ratios occurs at a depth of ca. 0.25 m (Figs. 5 and 9b), perhaps indicating the breakdown of some sedimentological structures before continuous movement begins.
Despite differences in absolute water depths between the two streams, the transitions between stages occur at similar relative depths (PR2; Fig. 10), suggesting that channel roughness may have a decisive influence on how rapid increases of stage affect bedload transport. This observation aligns with the relative influence of turbulence associated with channel roughness, independent of flow condition. As demonstrated by Lamb et al. (2008), turbulence fluctuations correlate with channel roughness and intensify with increasing relative water depth. At stage 1, when water depth is shallow, during steady flow, turbulence intensity is probably lower than when flows are deeper, causing turbulence from rapid increase of stage to be the dominant factor. As depth increases, roughness-induced turbulence becomes more significant, reducing the relative contribution of rapid increase of stage turbulence.
4.1.3 Stage 3: deep flow
At greater relative depths () (PR3; Fig. 10), both seismic energy and smartrock gyro velocity ratios increase yet again, suggesting renewed influence of rapid increase of stage on bedload transport. During this stage, the seismic energy ratio remains consistently above unity across the observed water depths (P3; Fig. 9). Similarly, the gyro velocity ratio also shows an increasing trend with water depth beyond 0.65 m in Nahal Yatir (G3; Fig. 5). During this higher stage, displacements are more frequent under rapid increase of stage conditions compared to steady flow (G3; Fig. 6). We suggest that this implies bedload enhanced mobility, which is further supported as the seismic energy ratio increases substantially at higher gyro velocities (above 1.2 rad s−1), ranging from 1.4 to 3.3 (Fig. 11). Variations in seismic energies for identical gyro velocities could indicate that bedload transport occurs at varying scales, with greater channel-wide transport observed during rapid increase of stage conditions compared to steady flow.
4.2 PSD ratios as a proxy for relative bedload flux
In this study, we utilized the ratio of seismic energies measured under two distinct flow conditions to investigate bedload transport dynamics in ephemeral streams. We propose that this parameter can serve as a proxy for the ratio of bedload fluxes under the following conditions: (1) seismic energy varies linearly with bedload flux within a specific frequency window (Luong et al., 2024; Tsai et al., 2012), and (2) the ratio is calculated using seismic energy within the frequency range associated with bedload transport. We used smartrocks to identify the bedload-related frequency range. However, since gyro velocity data capture both vibrational motion and downstream displacement, the selected frequency range includes contributions from these two mechanisms, representing an inherent limitation of the approach. Consequently, the seismic energy used in the ratio calculation possibly includes a vibrational seismic source, not directly related to bedload transport. Thus, ratio values represent the upper bound of the actual bedload flux ratio. This approach provides a practical tool for comparing bedload transport dynamics across flow conditions in natural systems, where direct flux measurements are often not feasible.
Using both seismic and smartrock measurements, we observed three distinct stages in how rapid stage increase influence bedload transport dynamics. In shallow relative depths (), rapid increase of stage significantly enhances bed material activity compared to steady flow conditions, with PSD ratios reaching 2–46 in Nahal Yatir and up to 2.2 in Nahal Anim, while gyro velocity ratios (gyro velocityrapid stage rise gyro velocitysteady flow) in Nahal Yatir range from 1.2 to 2. At intermediate depths, this effect diminishes as channel roughness-induced turbulence becomes dominant, with both seismic energy and gyro velocity ratios approaching unity. As water depth further increases, measurements show enhanced transport during rapid increase of stage, with seismic energy ratios of 1.2–2.1 in Nahal Yatir and 2.3–3.2 in Nahal Anim, accompanied by elevated gyro velocity ratios in Nahal Yatir. The correspondence between seismic and smartrock measurements validates these observations, providing a robust framework for understanding how flow conditions affect bedload transport.
The impact of rapid increase of stage on bedload transport highlights the importance of incorporating rapid increase of stage effects into bedload transport models. The elevated PSD ratios observed at low gyro velocities suggest that pebble vibrations significantly contribute to generation of seismic energy. This adds grain vibration as a source of bedload seismic energy to grain impact (Tsai et al., 2012) and rolling (Luong et al., 2024). Vibrating grains may contribute substantial seismic energy, without contributing to bedload flux. As such, inversion methods aiming to determine bedload transport rates from riverine seismic signals (e.g., Dietze et al., 2019) may need to be adjusted for seismic noise due to vibrating grains, especially at low flow stages close to the threshold of grains motion.
Seismic data collected is available through EarthScope under the 1F network code (2019–2024, https://doi.org/10.7914/SN/1F_2019, Bilek, 2019). These services are funded through the National Science Foundation's Seismological Facility for the Advancement of Geoscience (SAGE) Award under Cooperative Agreement EAR-1724509.
The supplement related to this article is available online at https://doi.org/10.5194/esurf-14-821-2026-supplement.
Writing original draft – MH Editing – MH, JPLJ, SLB, JMT, JBL Data analysis – MH, SLB, JPLJ Interpretation – MH, JPLJ, SLB, JMT, JBL Figures – MH
At least one of the (co-)authors is a member of the editorial board of Earth Surface Dynamics. The peer-review process was guided by an independent editor, and the authors also have no other competing interests to declare.
Publisher's note: Copernicus Publications remains neutral with regard to jurisdictional claims made in the text, published maps, institutional affiliations, or any other geographical representation in this paper. The authors bear the ultimate responsibility for providing appropriate place names. Views expressed in the text are those of the authors and do not necessarily reflect the views of the publisher.
We are grateful to Yehoshua Ratzon for technical assistance and to Eitan Shemesh, Gal Wolfson, Tali Mushkovitz, Noam Mizrahi, and Idan Libman for fieldwork. Special thanks to Ron Nativ for his valuable suggestions.
This project was funded by the NSF-BSF program (grant no. 2018619). The seismic instruments were provided by the NSF National Geophysical Facility operated by EarthScope Consortium through the EarthScope Primary Instrument Center at New Mexico Tech. MH was supported by the Kreitman School and the Department of Earth and Environmental Sciences at Ben-Gurion University of the Negev, as well as from the Fay and Rex Harbour Foundation.
This paper was edited by Orencio Duran Vinent and reviewed by three anonymous referees.
Al-Obaidi, K. and Valyrakis, M.: A Sensory Instrumented Particle for Environmental Monitoring Applications: Development and Calibration, IEEE Sens. J., 21, 10153–10166, https://doi.org/10.1109/JSEN.2021.3056041, 2021a.
Al-Obaidi, K. and Valyrakis, M.: Linking the explicit probability of entrainment of instrumented particles to flow hydrodynamics, Earth Surf. Proc. Land., 46, 2448–2465, https://doi.org/10.1002/esp.5188, 2021b.
Alhusban, Z. and Valyrakis, M.: Assessing and modelling the interactions of instrumented particles with bed surface at low transport conditions, Appl. Sci., 11, 7306, https://doi.org/10.3390/app11167306, 2021.
Ancey, C.: Bedload transport: a walk between randomness and determinism. Part 1. The state of the art, J. Hydraul. Res., 58, 1–17, https://doi.org/10.1080/00221686.2019.1702594, 2020.
Antoniazza, G., Dietze, M., Mancini, D., Turowski, J. M., Rickenmann, D., Nicollier, T., Boss, S., and Lane, S. N.: Anatomy of an alpine bedload transport event: a watershed-scale seismic-network perspective, J. Geophys. Res.-Earth, 128, e2022JF007000, https://doi.org/10.1029/2022JF007000, 2023.
Aureli, F., Maranzoni, A., Petaccia, G., and Soares-Frazão, S.: Review of experimental investigations of dam-break flows over fixed bottom, Water, 15, 1229, https://doi.org/10.3390/w15061229, 2023.
Bakker, M., Gimbert, F., Geay, T., Misset, C., Zanker, S., and Recking, A.: Field application and validation of a seismic bedload transport model, J. Geophys. Res.-Earth, 125, e2019JF005416, https://doi.org/10.1029/2019JF005416, 2020.
Beyreuther, M., Barsch, R., Krischer, L., Megies, T., Behr, Y., and Wassermann, J.: ObsPy: A Python toolbox for seismology, Seismol. Res. Lett., 81, 530–533, https://doi.org/10.1785/gssrl.81.3.530, 2010.
Bilek, S.: Bedload Monitoring – Israel component, EarthScope Data Center (IRISDMC) [data set], https://doi.org/10.7914/SN/1F_2019, 2019.
Burtin, A., Cattin, R., Bollinger, L., Vergne, J., Steer, P., Robert, A., Findling, N., and Tiberi, C.: Towards the hydrologic and bed load monitoring from high-frequency seismic noise in a braided river: The “torrent de St Pierre”, French Alps, J. Hydrol., 408, 43–53, https://doi.org/10.1016/j.jhydrol.2011.07.014, 2011.
Burtin, A., Hovius, N., and Turowski, J. M.: Seismic monitoring of torrential and fluvial processes, Earth Surf. Dynam., 4, 285–307, https://doi.org/10.5194/esurf-4-285-2016, 2016.
Castro-Orgaz, O. and Chanson, H.: Undular and broken surges in dam-break flows: a review of wave breaking strategies in a Boussinesq-type framework, Environ. Fluid. Mech., 20, 1383–1416, https://doi.org/10.1007/s10652-020-09749-3, 2020.
Chanson, H., Reungoat, D., Simon, B., and Lubin, P.: High-frequency turbulence and suspended sediment concentration measurements in the Garonne River tidal bore, Estuar. Coast. Shelf S., 95, 298–306, https://doi.org/10.1016/j.ecss.2011.09.012, 2011.
Chao, W.-A., Wu, Y.-M., Zhao, L., Tsai, V. C., and Chen, C.-H.: Seismologically determined bedload flux during the typhoon season, Sci. Rep., 5, 8261, https://doi.org/10.1038/srep08261, 2015.
Clague, J.: A review of catastrophic drainage of moraine-dammed lakes in British Columbia, Quaternary Sci. Rev., 19, 1763–1783, https://doi.org/10.1016/S0277-3791(00)00090-1, 2000.
Cohen, H., Laronne, J. B., and Reid, I.: Simplicity and complexity of bed load response during flash floods in a gravel bed ephemeral river: A 10 year field study, Water Resour. Res., 46, W11542, https://doi.org/10.1029/2010WR009160, 2010.
Cook, K. L. and Dietze, M.: Seismic advances in process geomorphology, Annu. Rev. Earth Planet. Sci., 50, 183–204, https://doi.org/10.1146/annurev-earth-032320-085133, 2022.
Cook, K. L., Andermann, C., Gimbert, F., Adhikari, B. R., and Hovius, N.: Glacial lake outburst floods as drivers of fluvial erosion in the Himalaya, Science, 362, 53–57, https://doi.org/10.1126/science.aat4981, 2018.
Dietze, M., Lagarde, S., Halfi, E., Laronne, J. B., and Turowski, J. M.: Joint sensing of bedload flux and water depth by seismic data inversion, Water Resour. Res., 55, 9892–9904, https://doi.org/10.1029/2019WR026072, 2019.
Halfi, E., Deshpande, V., Johnson, J. P. L., Katoshevski, D., Reid, I., Storz-Peretz, Y., and Laronne, J. B.: Characterization of bedload discharge in bores and very unsteady flows in an ephemeral channel, E3S Web Conf., 40, https://doi.org/10.1051/e3sconf/20184002036, 2018.
Halfi, E., Thappeta, S. K., Johnson, J. P. L., Reid, I., and Laronne, J. B.: Transient bedload transport during flashflood bores in a desert gravel-bed channel, Water Resour. Res., 59, e2022WR033754, https://doi.org/10.1029/2022WR033754, 2023.
Hsu, L., Finnegan, N. J., and Brodsky, E. E.: A seismic signature of river bedload transport during storm events, Geophys. Res. Lett., 38, L13407, https://doi.org/10.1029/2011GL047759, 2011.
Khezri, N. and Chanson, H.: Inception of bed load motion beneath a bore, Geomorphology, 153–154, 39–47, https://doi.org/10.1016/j.geomorph.2012.02.006, 2012.
Kihara, N., Niida, Y., Takabatake, D., Kaida, H., Shibayama, A., and Miyagawa, Y.: Large-scale experiments on tsunami-induced pressure on a vertical tide wall, Coast. Eng., 99, 46–63, https://doi.org/10.1016/j.coastaleng.2015.02.009, 2015.
Lagarde, S., Dietze, M., Gimbert, F., Laronne, J. B., Turowski, J. M., and Halfi, E.: Grain-size distribution and propagation effects on seismic signals generated by bedload transport, Water Resour. Res., 57, e2020WR028700, https://doi.org/10.1029/2020WR028700, 2021.
Lamb, M. P., Dietrich, W. E., and Venditti, J. G.: Is the critical Shields stress for incipient sediment motion dependent on channel-bed slope?, J. Geophys. Res.-Earth, 113, https://doi.org/10.1029/2007JF000831, 2008.
Lee, K. T., Liu, Y.-L., and Cheng, K.-H.: Experimental investigation of bedload transport processes under unsteady flow conditions, Hydrol. Process., 18, 2439–2454, https://doi.org/10.1002/hyp.1473, 2004.
Luong, L., Cadol, D., Bilek, S., McLaughlin, J. M., Laronne, J. B., and Turowski, J. M.: Seismic modeling of bedload transport in a gravel-bed alluvial channel, J. Geophys. Res.-Earth, 129, e2024JF007761, https://doi.org/10.1029/2024JF007761, 2024.
Fernandez Luque, R. and Van Beek, R.: Erosion and transport of bed-load sediment, J. Hydraul. Res., 14, 127–144, https://doi.org/10.1080/00221687609499677, 1976.
Maniatis, G.: On the use of IMU (inertial measurement unit) sensors in geomorphology, Earth Surf. Proc. Land., 46, 2136–2140, https://doi.org/10.1002/esp.5197, 2021.
Maniatis, G., Hoey, T., Hodge, R., Rickenmann, D., and Badoux, A.: Inertial drag and lift forces for coarse grains on rough alluvial beds measured using in-grain accelerometers, Earth Surf. Dynam., 8, 1067–1099, https://doi.org/10.5194/esurf-8-1067-2020, 2020.
Matthews, B., Naylor, M., Sinclair, H., Black, A., Williams, R., Cuthill, C., Gervais, M., Dietze, M., and Smith, A.: Sounding out the river: seismic and hydroacoustic monitoring of bedload transport, Earth Surf. Proc. Land., 49, 3840–3854, https://doi.org/10.1002/esp.5940, 2024.
Meirovich, L., Laronne, J. B., and Reid, I.: The variation of water-surface slope and its significance for bedload transport during floods in gravel-bed streams, J. Hydraul. Res., 36, 147–157, https://doi.org/10.1080/00221689809498630, 1998.
Meyer-Peter, E. and Müller, R.: Formulas for bed-load transport, in: IAHSR 2nd meeting, Stockholm, appendix 2, https://resolver.tudelft.nl/uuid:4fda9b61-be28-4703-ab06-43cdc2a21bd7 (17 September 2026), 1948.
Nativ, R., Turowski, J. M., Chang., J. M., Hovius, N., Yang, C. J., Chen, W. S., Chang, W. Y., and Laronne, J. B.: Stationary boulders increase river seismic frequency via turbulence, Geophys. Res. Lett., https://doi.org/10.1029/2024GL113784, 2025.
Nicollier, T., Antoniazza, G., Ammann, L., Rickenmann, D., and Kirchner, J. W.: Toward a general calibration of the Swiss plate geophone system for fractional bedload transport, Earth Surf. Dynam., 10, 929–951, https://doi.org/10.5194/esurf-10-929-2022, 2022.
Olinde, L. and Johnson, J. P. L.: Using RFID and accelerometer-embedded tracers to measure probabilities of bed load transport, step lengths, and rest times in a mountain stream, Water Resour. Res., 51, 7572–7589, https://doi.org/10.1002/2014WR016120, 2015.
Parker, G., Dhamotharan, S., and Stefan, H.: Model experiments on mobile, paved gravel bed streams, Water Resour. Res., 18, 1395–1408, https://doi.org/10.1029/WR018i005p01395, 1982.
Pretzlav, K. L. G., Johnson, J. P. L., and Bradley, D. N.: Smartrock transport in a mountain stream: bedload hysteresis and changing thresholds of motion, Water Resour. Res., 56, e2020WR028150, https://doi.org/10.1029/2020WR028150, 2020.
Pretzlav, K. L. G., Johnson, J. P. L., and Bradley, D. N.: Smartrock transport from seconds to seasons: shear stress controls on gravel diffusion inferred from hop and rest scaling, Geophys. Res. Lett., 48, e2020GL091991, https://doi.org/10.1029/2020GL091991, 2021.
Roth, D. L., Finnegan, N. J., Brodsky, E. E., Cook, K. L., Stark, C. P., and Wang, H. W.: Migration of a coarse fluvial sediment pulse detected by hysteresis in bedload generated seismic waves, Earth Planet. Sc. Lett., 404, 144–153, https://doi.org/10.1016/j.epsl.2014.07.019, 2014.
Roth, D. L., Brodsky, E. E., Finnegan, N. J., Rickenmann, D., Turowski, J. M., and Badoux, A.: Bed load sediment transport inferred from seismic signals near a river, J. Geophys. Res.-Earth, 121, 725–747, https://doi.org/10.1002/2015JF003782, 2016.
Schmandt, B., Gaeuman, D., Stewart, R., Hansen, S. M., Tsai, V. C., and Smith, J.: Seismic array constraints on reach-scale bedload transport, Geology, 45, 299–302, https://doi.org/10.1130/G38639.1, 2017.
Shafiei, S., Melville, B. W., and Shamseldin, A. Y.: Experimental investigation of tsunami bore impact force and pressure on a square prism, Coast. Eng., 110, 1–16, https://doi.org/10.1016/j.coastaleng.2015.12.006, 2016.
Sky, M. and Chaudhry, M. H.: Dam-break flows in curved channel, J. Hydraul. Eng., 115, 1465–1478, https://doi.org/10.1061/(ASCE)0733-9429(1989)115:11(1465), 1989.
Stark, K., Cadol, D., Varyu, D., and Laronne, J. B.: Direct, continuous measurements of ultra-high sediment fluxes in a sandy gravel-bed ephemeral river, Geomorphology, 382, 107682, https://doi.org/10.1016/j.geomorph.2021.107682, 2021.
Sumer, B. M., Chua, L. H. C., Cheng, N. S., and Fredsøe, J.: Influence of turbulence on bed load sediment transport, J. Hydraul. Eng., 129, 585–596, https://doi.org/10.1061/(ASCE)0733-9429(2003)129:8(585), 2003.
Thappeta, S. K., Johnson, J. P. L., Halfi, E., Storz-Peretz, Y., and Laronne, J. B.: Bed shear stress in experimental flash flood bores over dry beds and over flowing water: A comparison of methods, J. Hydraul. Eng., 149, 4023001, https://doi.org/10.1061/JHEND8.HYENG-13029, 2023.
Tsai, V. C., Minchew, B., Lamb, M. P., and Ampuero, J.-P.: A physical model for seismic noise generation from sediment transport in rivers, Geophys. Res. Lett., 39, L02404, https://doi.org/10.1029/2011GL050255, 2012.
Wang, P., Yuan, J., Wang, M., and Wang, M.: Sediment vibration characteristics based on accelerometer measurements, Sci. Rep., 13, 1205, https://doi.org/10.1038/s41598-023-28209-8, 2023.
Welch, P.: The use of fast Fourier transform for the estimation of power spectra: A method based on time averaging over short, modified periodograms, IEEE Trans. Audio Electroacoust., 15, 70–73, https://doi.org/10.1109/TAU.1967.1161901, 1967.
Wilcock, P. and Crowe., J.: Surface-based transport model for mixed-size sediment, J. Hydraul. Eng., 129, 120–128, https://doi.org/10.1061/(ASCE)0733-9429(2003)129:2(120), 2003.