the Creative Commons Attribution 4.0 License.
the Creative Commons Attribution 4.0 License.
 | 05 Feb 2026
Investigating controls on fluvial grain sizes in post-glacial landscapes using citizen science
Anya H. Towers
Mikael Attal
Simon M. Mudd
Fiona J. Clubb
The grain sizes of sediments in channels have been linked to landscape characteristics, such as flow distance from headwaters, topographic relief, lithology and climate, in landscapes with little past or present glacial influence. Few studies have explored the controls on sediment characteristics in formerly glaciated landscapes. In this study, we document river surface grain sizes at 279 localities across Scotland. We collect photographs of gravel bars through a citizen science survey, Scotland's Big Sediment Survey. Grain sizes distributions are extracted from the photographs using both manual and automated techniques. We investigate whether grain sizes can be correlated and predicted from environmental variables (e.g., basin slope, flow distance from headwaters) through Spearman's correlation statistics and random forest regression modelling. In contrast to other studies that have primarily focused on non-glaciated landscapes, we find no apparent controls on surface grain sizes in channels across Scotland. Specifically, we find no significant Spearman's relationships between d84 and environmental variables; the strongest relationship was found between d84 and average basin aridity with a weak r2 value of 0.34. We also find that the predictability of our random forest model is poor and only captures 20 % of the variance of d84. We find no correlation between grain size and flow competence, which suggests that sediment is both transport-limited and supply-limited. We propose that Scotland's post-glacial legacy drives the lack of sedimentological trends documented in this study, and that changes in landscape morphology and sediment sources caused by glacial processes lead to a complete decoupling between fluvial sediment grain size and environmental variables. This interpretation aligns with other studies that have highlighted the ongoing role of the post-glacial legacy on landscape evolution in tectonically quiescent terrains, both in Scotland and globally. Our results suggest that fluvial sediment grain size cannot be predicted by a global model based on environmental variables in post-glacial landscapes.
- Article
(10909 KB) - Full-text XML
-
Supplement
(2793 KB) - BibTeX
- EndNote


The delivery of sediments through river basins influences river morphology, hazards (e.g., flood risk), habitat value (e.g., spawning of salmonids) and landscape response to climatic and tectonic forcings. The characteristics of sediments delivered from hillslopes to fluvial systems influences the properties of sediments transported by rivers which are eventually exported to terminal sedimentary sinks (e.g., lacustrine and coastal environments, Attal and Lavé, 2006; Parker, 1991; Sklar et al., 2006; Whittaker et al., 2010). Bedload grain sizes, the focus of this study, are a key characteristic for understanding fluvial environments. For example, bedload grain sizes influence river transport conditions, provide information on sediment sources, control rates of bedrock incision (e.g., Sklar and Dietrich, 2004) and the width of channels (e.g., Baynes et al., 2020; Finnegan et al., 2005; Li et al., 2020a, b; Sklar, 2024). Initial grain size distributions delivered to rivers are controlled by fragmentation, weathering and rock mass structure (e.g., Sklar, 2001; Sklar et al., 2017; Wells et al., 2008). Once a sediment grain enters a river network, it reduces in size primarily through size-selective transport and abrasion (Sternberg, 1875). The distributions of fluvial grain sizes have therefore been correlated to the longitudinal flow distance along a channel (e.g., Gomez et al., 2001; Moussavi-Harami et al., 2004; Rice and Church, 1998; Sklar et al., 2006). Downstream fining trends can be offset by variations in the supply of sediment (e.g., sediment input from landslides) and the transport ability of a channel (e.g., Attal and Lavé, 2006; Attal et al., 2015; Sklar et al., 2006).
A handful of studies have further explored the effects of landscape characteristics, such as topography, lithology and climate, on the size distributions of channel sediments at the local scale. For example, hillslope gradient has been shown to be one of the most important topographic controls on grain sizes (Sklar et al., 2017), and several studies have shown fluvial grain sizes to increase with hillslope steepness (e.g., Attal et al., 2015; Purinton and Bookhagen, 2021; Whittaker et al., 2010). Attal et al. (2015) found hillslope grain sizes to increase with hillslope steepness and erosion rates in the Feather River basin, Northern California. They showed an increase in the channel sediment grain sizes to arise from an increase in the flow competence (i.e., ability of a river to transport sediment) and changes in hillslope sediment sources from soil-mantled to mass-wasting processes (e.g., landslides, debris flows). A similar trend was documented by Whittaker et al. (2010) in the Appenine Mountains of Italy, whereby coarser fluvial grain sizes were measured in landslide-dominated areas. Likewise, the importance of lithology in controlling bedload characteristics, including grain sizes, has been demonstrated by several studies (e.g., Mueller and Pitlick, 2013; Purinton and Bookhagen, 2021; Sklar et al., 2020). For example, Lai et al. (2021) showed that more resistant rock types, such as volcanic rocks, were associated with coarser bedload grain sizes in comparison to less resistance rocks, such as sedimentary mudstone and flysch lithologies, in the Coastal Range, Taiwan.
Studies have tested the predictability and controls of fluvial grain sizes and sediment substrate cover at large spatial scales by documenting sediment characteristics across multiple basins with gradients in topography, lithology, climate and hydrology (Abeshu et al., 2022; Haddadchi et al., 2018; Mugodo et al., 2006; Snelder et al., 2011). Given the large spatial extent of these studies, they have focused on applying data-driven machine learning techniques, such as a random forest regressor. These empirical models have used readily available environmental variables that broadly reflect the upstream network structure and sediment source characteristics of each locality, such as flow distance, basin slope, lithology and precipitation indices. Snelder et al. (2011) found that surface grain sizes could be reasonably well predicted from a random forest model for rivers across France which, outside high mountain environments, has largely not been glaciated. Their study found an r2 value of 0.52 between the observed and predicted values, and identified channel slope, basin averaged slope and rock hardness to be the most important variables controlling the modelled grain sizes.
Research into controls on bedload grain sizes has largely focused on landscapes with no past or present glacial influence. Formerly glaciated landscapes are typically more complex than landscapes with no glacial influence. Key challenges associated with understanding geomorphic processes in post-glacial landscapes originate from the glacial modification of hillslopes and channels, such as decoupling of hillslopes from channels due to the over-deepening and widening of valleys by glaciers, or extensive glacial sediment drapes (e.g., till, moraines, paraglacial terraces) which influence sediment supply and transport capacity (Attal and Lavé, 2006; Ballantyne, 2019; Mason and Polvi, 2023; Reid et al., 2022; Towers et al., 2025; Whitbread et al., 2015). Such areas represent a significant fraction of global land (e.g., most of the UK, Scandinavia, North America) and their extent will inevitably grow as a result of glacial retreat driven by climate change. A key research avenue therefore includes exploring the applicability of global predictive grain size models, such as that proposed by Snelder et al. (2011) which was tested in a largely non-glaciated landscape, to post-glacial landscapes.
In this study, we adopt a similar approach to Snelder et al. (2011) and test whether grain sizes can be predicted in Scottish river basins. Scotland was deglaciated around 12 kyr ago following the disappearance of the British-Irish Ice Sheet (Ballantyne, 2019; Clark et al., 2018; Firth and Stewart, 2000; Shennan et al., 2009). Scotland has subsequently been in a phase of glacial isostatic uplift, with average present-day rates varying between 0.5 and 1.2 m kyr−1 (Bradley et al., 2023). Many Scottish river basins exhibit typical features of post-glacial landscapes, such as U-shaped valleys and paraglacial sediment stores, many of which contribute large quantities of material to modern rivers (e.g., Ballantyne, 2008; Towers et al., 2025). We consider the hypothesis that grain sizes can be reasonably well predicted from environmental variables similar to those outlined by Snelder et al. (2011) in Scottish river basins. That is, we question if 12000 years is a sufficient period to allow a formerly glaciated landscape to adjust its sediment characteristics to reflect local fluvial conditions. The corresponding null hypothesis is that grain sizes cannot be predicted.
To test our hypotheses, we develop a photograph-based methodology for gathering a spatially extensive dataset of grain size distributions. After a description of our photograph-based methodology, we describe the predictive variables and the random forest regressor model. Subsequently, we present our model predictions and discuss the complexities associated with documenting large-scale trends and controls on fluvial grain sizes in post-glacial landscapes.
2.1 Grain size data collection
Sediment characteristics, including grain sizes, are poorly documented in Scotland. In light of the limited grain size data available and the time-consuming nature of traditional field sediment surveys (Bunte and Abt, 2001; Wolman, 1954), we gathered surface sediment size data through a citizen science project, Scotland's Big Sediment Survey (SBSS). SBSS was designed through ESRI's Survey123 platform (https://survey123.arcgis.com/, last access: 1 January 2023). Users were asked for two types of photographs: a context photograph of the sediment deposit, and a surface photograph of the sediment bar (see Fig. 1 for examples). Users were requested to include an object for scale in the surface photograph (e.g., penknife, plastic card) and to take the photograph parallel to the bar from a known height (e.g., person's height, chest-height). Both of these measurements were then recorded by the user on the Survey123 form. Users provided the location of the sediment bar through either dropping a pin on a map (which was provided on the survey platform), uploading a geographic position or enabling the camera's location feature. Prior to sediment grain size extraction, all photographs and corresponding survey information were pre-screened for quality assurance (e.g. photos with spurious locations were removed). A total of 275 locations were obtained across Scotland from SBSS over approximately 1 year (Fig. 1).
The SBSS dataset was complemented by data from four locations that were visited in 2021 along the Feshie River (see Fig. 1 for location of “field measurements”). Surface grain size data was collected by positioning a 30 m-long tape measure on the sediment bar parallel to the river's flow direction, and measuring the intermediate axis of the sediment grains found along the transect at 50 cm intervals. The tape measure was moved sideways by a couple of meters and the procedure repeated until 100 clasts had been measured (Bunte and Abt, 2001).
2.2 Grain size extraction methods: PebbleCountsAuto and manual counting
We examine trends in sediment sizes through photo-based measurements of the intermediate axis (b-axis) which we extract through automated and manual techniques. Automated and semi-automated techniques have received significant attention in recent years because they are typically less time-consuming and can be used to obtain a larger sample size (Harvey et al., 2022; Purinton and Bookhagen, 2019a). Automated algorithms include both image segmentation (e.g., Detert and Weitbrecht, 2013; Purinton and Bookhagen, 2019a) and texture-based approaches (e.g., Brasington et al., 2012; Westoby et al., 2015).
In this study, we apply PebbleCountsAuto which is an automated grain segmentation algorithm (Purinton and Bookhagen, 2019a). PebbleCountsAuto initiates the segmentation process from both the grain colour and interstices. The algorithm then fits an ellipse to the segmented area from which the pebbles axes values are extracted. Purinton and Bookhagen (2019a) compared PebbleCountsAuto to a manually measured control dataset at 12 sites in North-West Argentina and reported an average mean error of 0.15 ψ across several percentiles, where ψ represents the negation of the ϕ unit typically used to describe grain size data ( log2(mm)). In this study, we also compare PebbleCountsAuto results to a manually measured control dataset, the procedures of which are described below.
Images are scaled in PebbleCountsAuto from the camera resolution, R, which is calculated from the camera's sensor height or width, S, focal length, f, image height or width, I, and the camera height, h, the latter of which is recorded in the survey data. The camera resolution is given by:
In this study, the average and maximum resolution of images processed through PebbleCountsAuto were 0.54 and 1.05 mm per pixel respectively. The lower detection limit of a pebble's b-axis length in PebbleCountsAuto is 20 pixels which equates to a minimum b-axis length of 21 mm with our maximum camera resolution of 1.05 mm per pixel. We conservatively truncate the grain size distributions at 25 mm for all photographs.
A potential user-derived uncertainty associated with the camera resolution of the photographs and the final grain size measurements originates from the height at which the photographs were taken. We perform a sensitivity analysis to test the influence of camera height on camera resolution with a standard consumer-grade camera (e.g., sensor height = 4.55 mm, focal length = 4.3 mm, image height = 3024 pixels). For example, an increase in height of 15 cm increases the camera resolution by 0.05 mm per pixel. Thus, for our average camera resolution of 0.54 mm per pixel, an increase in camera height by 15 cm increases the final grain size measurements by ≈ 10 % (see Table S2 in the Supplement for full sensitivity analysis). We further discuss the overall influence of camera height-derived uncertainties in the sample comparison (Sect. 2.3).
Photos that could not be processed through PebbleCountsAuto due to issues with calculating camera resolutions (e.g., missing metadata) or significant segmentation faults were manually processed by overlaying a regular square grid with 100 line intersections (Kellerhals and Bray, 1971). Clasts were scaled according to the object placed in the image and the object's corresponding dimensions which were recorded on the survey platform. Ideally, the size of the grid applied to the photographs should be chosen so that no more than one grid intersection falls on one pebble. However, such a requirement is nearly impossible to fulfil where large grains span multiple intersections. Clasts that cover grid intersections n times were therefore counted n times following the voidless cube model presented by Kellerhals and Bray (1971). Overall, 37 % of the images obtained through SBSS were processed through PebbleCountsAuto and 63 % were processed manually.
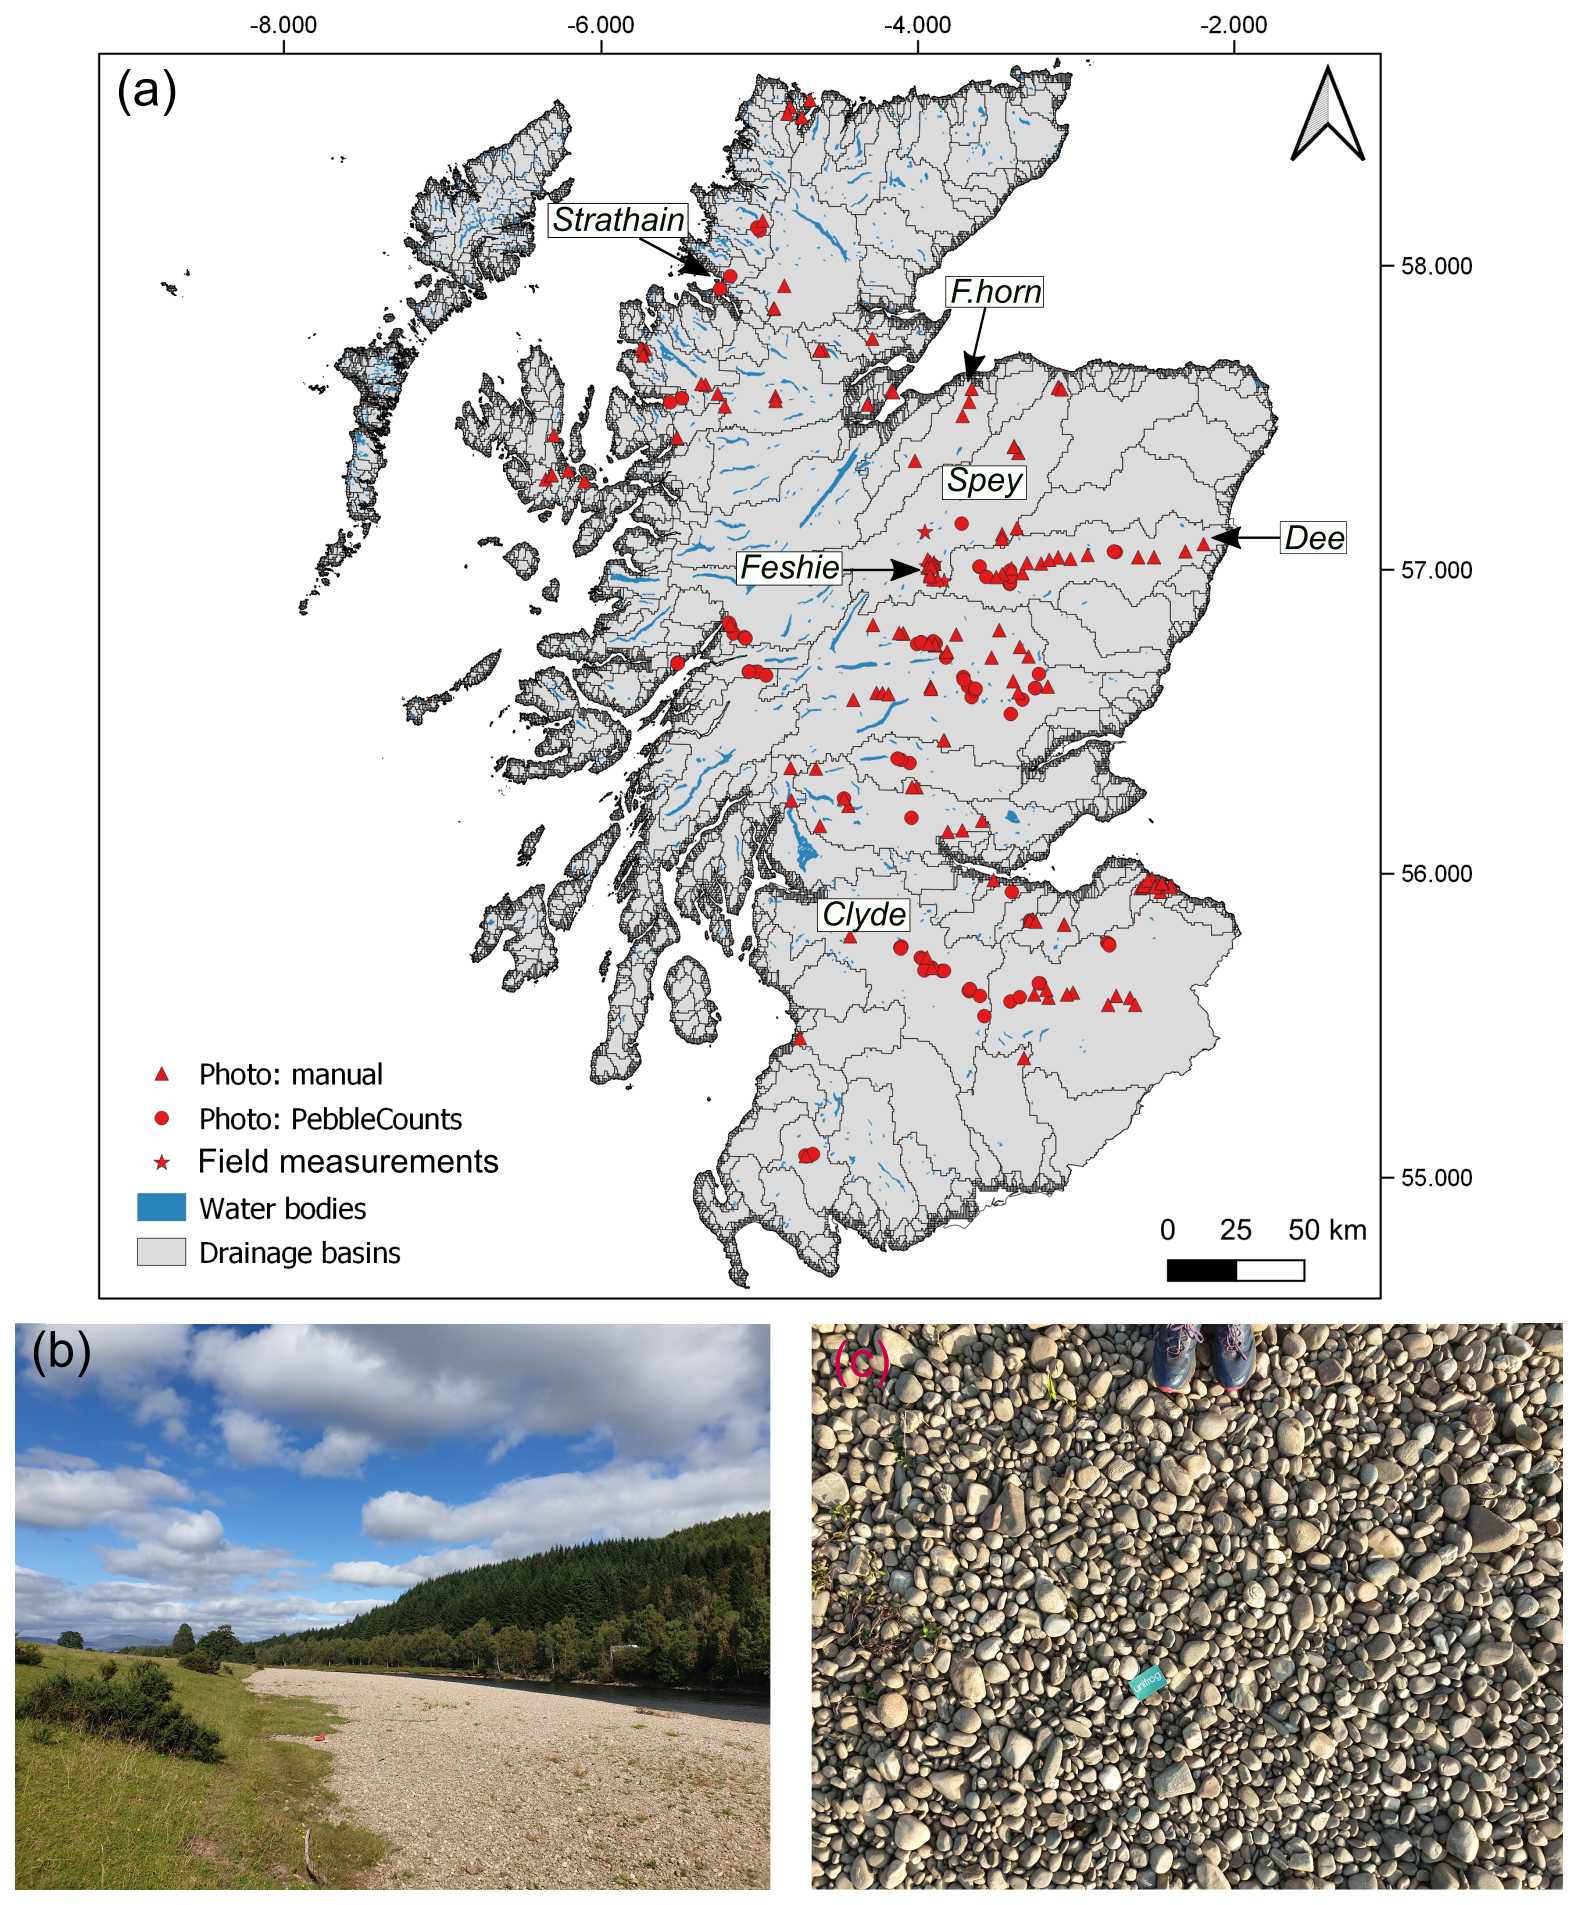
Figure 1(a) Map of Scotland (focused on the mainland) showing 279 surveyed locations. Circles represent samples processed with PebbleCountsAuto, triangles show manually clicked sites, and stars represent samples measured in the field. Water bodies are shown in dark blue and drainage basin outlines (15 arcsec resolution) in black (sourced from the HydroLAKES and HydroBASINS databases, Lehner and Grill, 2013; Messager et al., 2016). (b) Context photograph of gravel bar. (c) Top-down, surface photograph of sediment with a card that is 8.5 cm in length for scale.
2.3 Comparability of and comparison between grain sizing tools
A first consideration is that grain size distributions obtained via PebbleCountsAuto are not directly comparable to those obtained via applying a grid on a photo or measuring grains at set intervals along a transect in the field. The latter methods belong to the grid-by-number set of procedures, which have been shown to provide the most accurate representation of the true grain size distribution, with the results theoretically directly comparable to those obtained using volume-by-weight methods, providing the sediment is isotropic (Kellerhals and Bray, 1971). PebbleCountsAuto is an area-by-number procedure, whereby the algorithm attempts to measure all grains visible on the surface and then produces a distribution based on the number of grains; this type of procedure has been shown to be systematically biased towards the finest sediment and to therefore underestimate percentiles (Kellerhals and Bray, 1971). Kellerhals and Bray (1971) proposed, tested and validated a conversion procedure to correct for this bias: a conversion factor D2 needs to be applied to the area-by-number data, where D is the diameter of the sediment grain considered, approximated in our case by the grain's intermediate axis.
To correct the PebbleCountsAuto dataset, we proceeded as follows: for each dataset produced by PebbleCountsAuto, a frequency of 1 was given to each measured grain, which is what the software would have done when computing the grain size distribution. This frequency was then multiplied by D2 for each grain, giving a new value. The fraction that each grain represents in the grain size distribution was then computed as the ratio of this new weighed frequency divided by the sum of all new weighed frequencies for the entire measured population. These corrected data were used to produce cumulative grain size distributions and extract relevant percentiles in the following.
To test the performance of PebbleCountsAuto using both the corrected and uncorrected datasets, we compare the apparent 50th (d50) and 84th (d84) percentiles at nine sites in the Tay basin to a manually measured control dataset. These sites represent a range of pebble sizes and lithologies, spanning from the Tay's source in the Highlands to upstream of its estuary (see Table S1 in the Supplement for sample locations). All nine sites have an image resolution of 0.47 mm per pixel. We exclude grains with a b-axis below 25 mm which is consistent with the minimum truncation value that we apply to our Scotland-wide dataset (see Sect. 2.2). We compare the 50th and 84th percentiles in mm by the mean error (me), normalised root mean squared error (nrmse) and r-squared linear regression coefficient (r2). We also compare the 50th and 84th percentiles derived from PebbleCountsAuto and the manually measured dataset using t-tests.
Error bars are plotted on both the manual and PebbleCountsAuto measurements in Fig. 2. With regards to our manually measured samples, we assess the impact of the largest clast covering multiple grid nodes using the method presented by Attal et al. (2015). Firstly, the largest clast was removed from the grain size distribution to estimate d50 and d84 percentiles; secondly, a large clast of the same size as our largest clast was added, covering the same number of grid nodes. Error bars on manually measured grain size figures represent the range of values between these scenarios. For PebbleCountsAuto measurements, we plot error values of ±10 % to account for potential uncertainties associated with the height of the photograph. An uncertainty of ≈ 10 % represents a change in camera height by 15 cm for a camera resolution of 0.47 mm per pixel (see Sect. 2.2).
We find that the uncorrected PebbleCountsAuto data systematically underestimates the grain sizes compared to manual measurements of photos, as would be expected from an area-by-number type of method (Kellerhals and Bray, 1971), especially at the localities with larger grain sizes (sample sites 6–9, Fig. 2). The uncorrected PebbleCountsAuto d84 measurements are statistically similar (p-value from t-test > 0.05, r2=0.94) to the manual measurements, whereas the d50 percentiles are different (p-value < 0.05, r2=0.73). Likewise, the d84 comparison has a lower nrmse (0.28) than the d50 comparison (nrmse = 0.44, Fig. 2).
Interestingly, other studies that used comparable methods to PebbleCountsAuto also found that PebbleCountsAuto generally underestimates grain sizes (e.g., Chardon et al., 2022; Miazza et al., 2024). These studies attributed these trends to over-segmentation issues which arise from inter-granular textures (e.g., veins, fractures) and irregular shadowing (Fig. 2c). Visual inspection of our PebbleCountsAuto output images shows evidence of over-segmentation, in particular at locations with larger grain size distributions (sample sites 6–9, Fig. 2); we find that larger grains have more inter-granular textures (e.g., veins, fractures), which may explain this observation. In addition, pebble imbrication or orientation on a gravel bar (e.g., intermediate axis not perfectly visible in the horizontal plane) may also lead to an underestimation of grain sizes in photo counting compared to distributions obtained from tape measure lines (Attal and Lavé, 2006). The degree of underestimation in grain sizes associated with photo counting is likely to vary between localities and represents a limitation of our method.
The application of the correction factor described earlier in this section is a limited success: as expected, it leads to an increase in the PebbleCountsAuto grain sizes but also to a systematic overestimation of the grain sizes, and by various amounts (Fig. 2). We believe that this is likely due to the fact that PebbleCountsAuto is not a perfect area-by-number method, in that it does not measure all the grains on the surface but only a subset (Fig. 2c). Differences in grain shapes can also influence the effectiveness of the correction which assumes all grains are similarly shaped and uses the D2 multiplier to make the 1-D measurements three-dimensional (Kellerhals and Bray, 1971). In the absence of a clear relationship between the amount of overestimation and metrics such as grain size or the fraction of grains not measured, and because the actual grain size measured manually is systematically bracketed by the corrected and uncorrected PebbleCountsAuto values, we decided to retain the mean of the latter two values for the following analysis. We find that this mean value is on average within 7 % and 8 % of the manually measured value for d50 and d84, respectively, in comparison to the uncorrected grain sizes being within 27 % and 21 %, and the corrected grain sizes being within 42 % and 37 % of the measured value for d50 and d84, respectively. While this issue represents a significant limitation of our approach, we also believe this approach is the most pragmatic, as it is necessary and provides a corrected measurement that is the closest to the actual measured value. We ran the following analysis using both the corrected-uncorrected mean and the uncorrected PebbleCountsAuto grain sizes. The results presented in the main text are those obtained using the corrected-uncorrected mean grain sizes; those obtained using the uncorrected PebbleCountsAuto grain sizes are presented in the Supplement (see Supplement Fig. S4). Given the lower errors associated with the d84 percentile, we focus our analysis on this percentile.
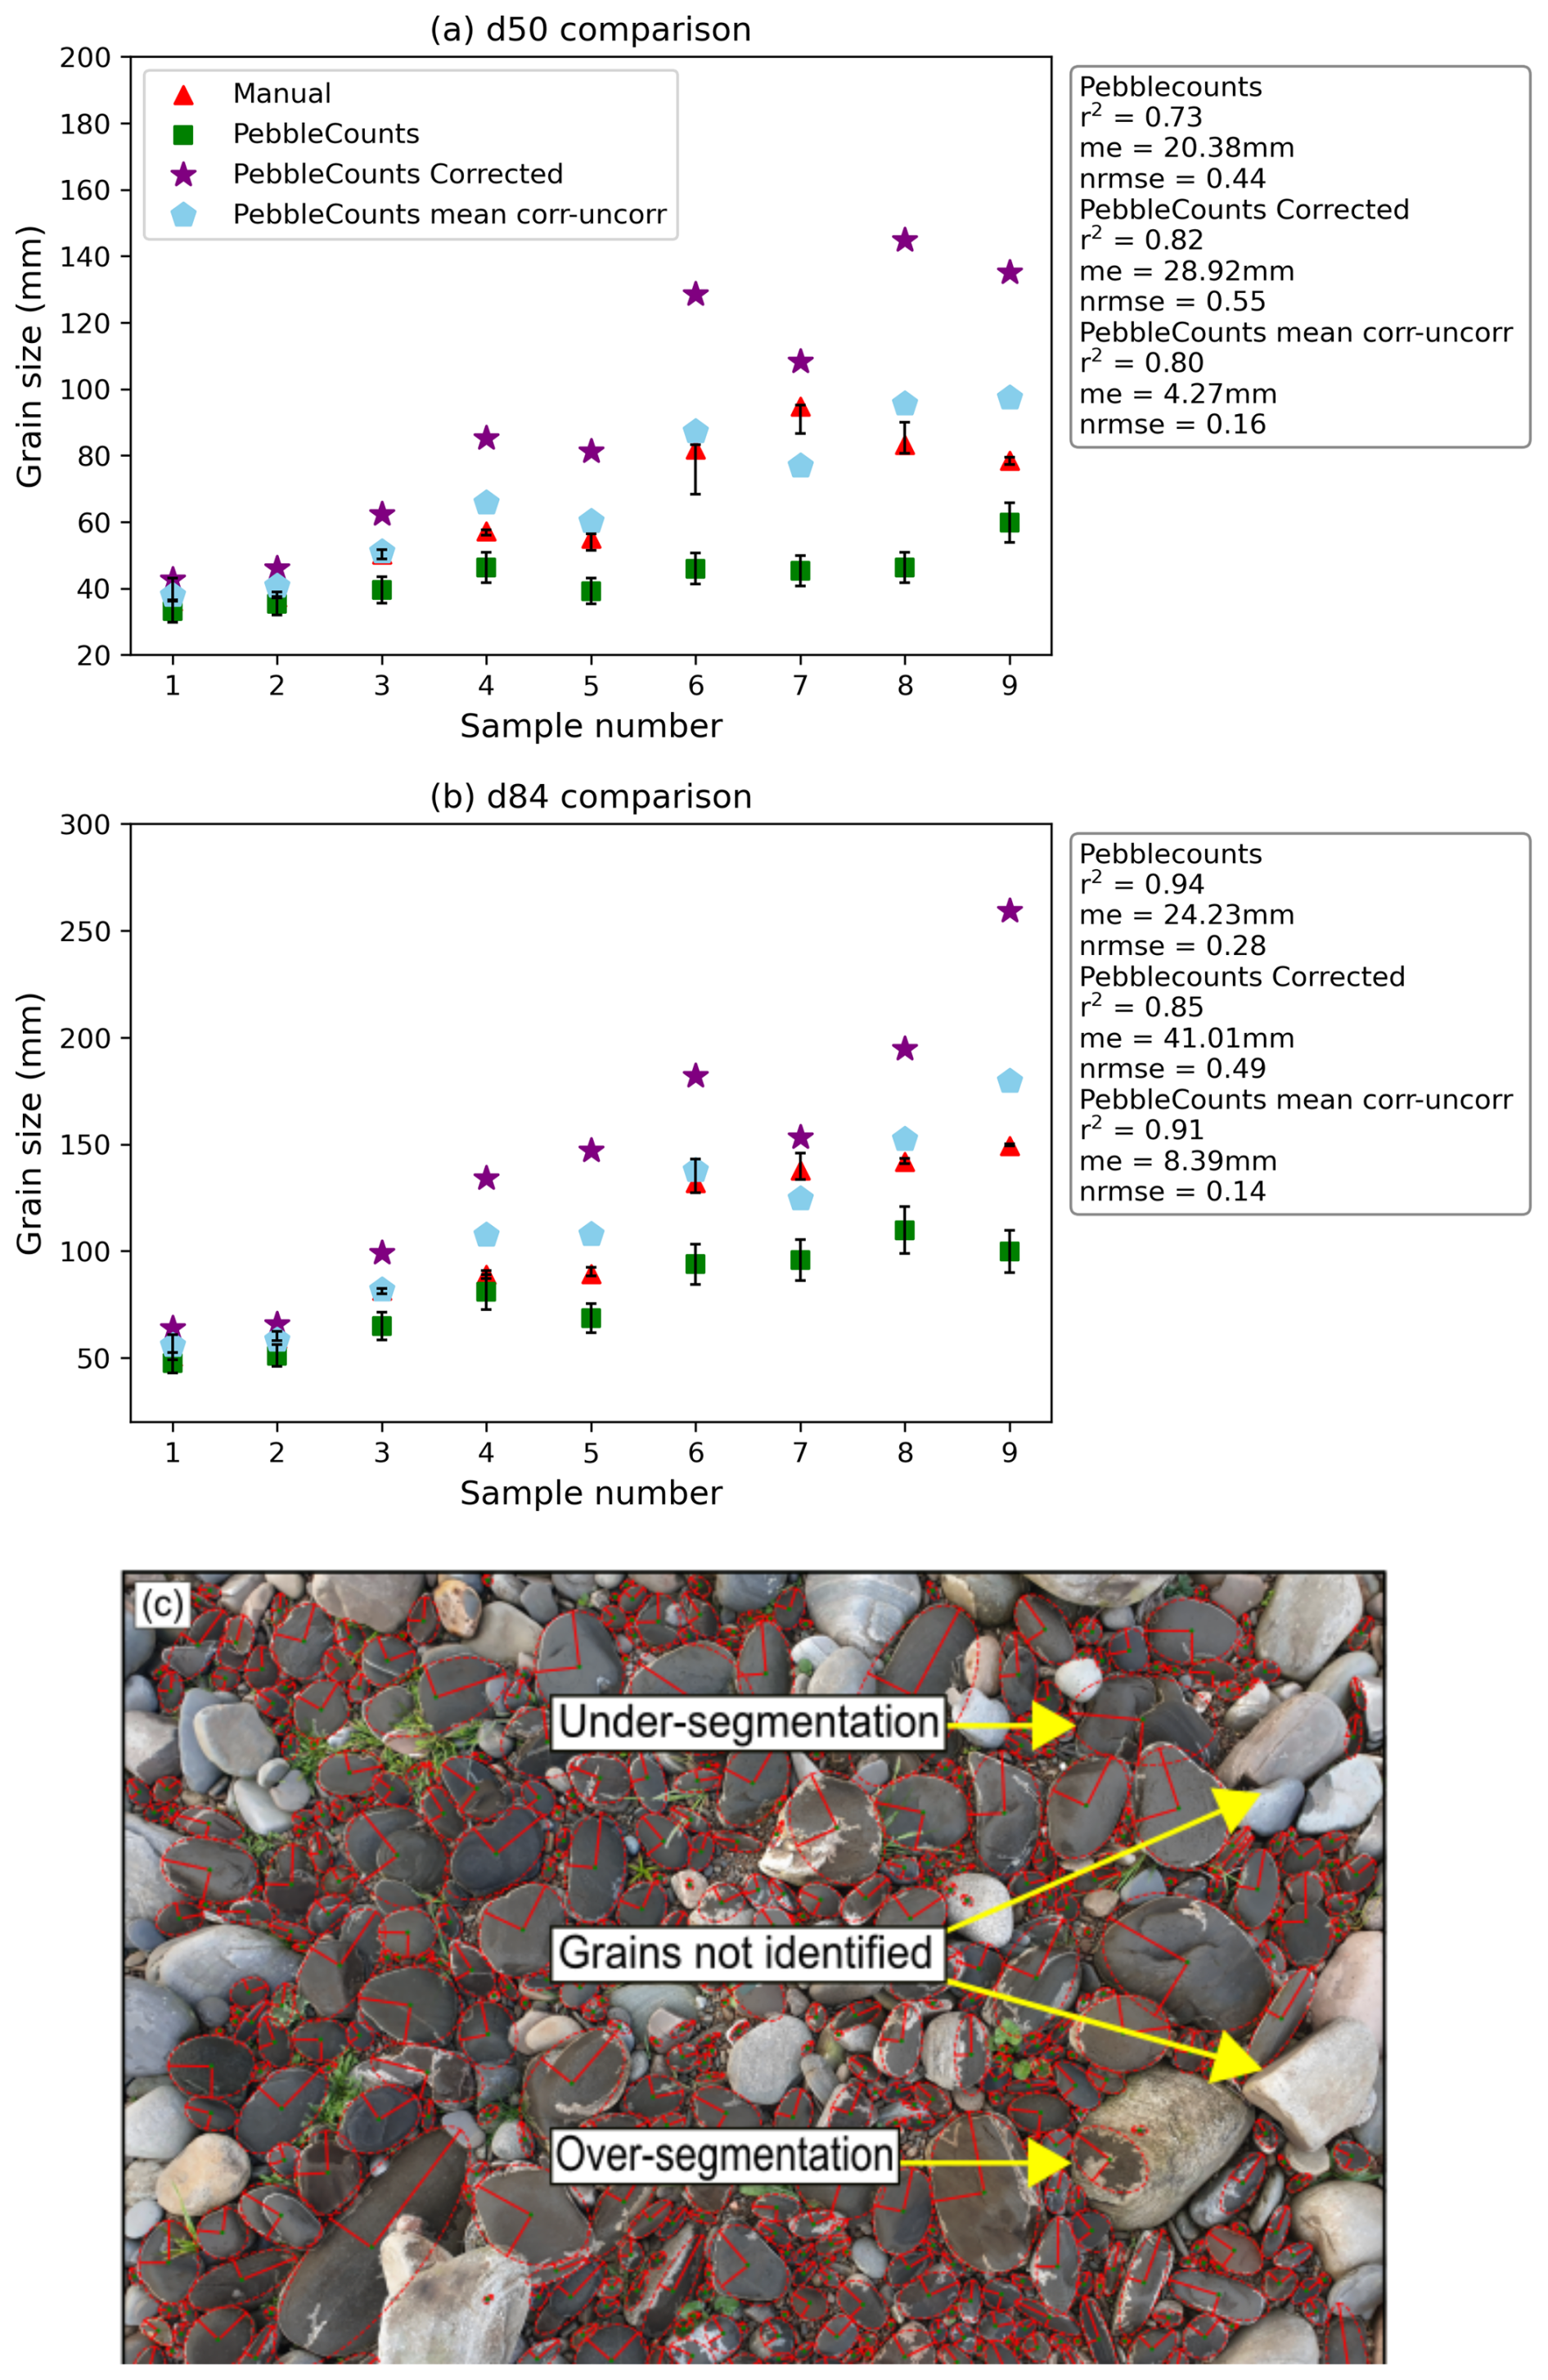
Figure 2Panels (a) and (b) show comparisons between PebbleCountsAuto and the manually measured control dataset at 9 sites in the Tay basin (see Table S1 in the Supplement for sample locations). The PebbleCounts data shown in panels (a) and (b) includes the uncorrected area-by-number data (green squares), the corrected data after a conversion factor has been applied (purple stars) to allow direct comparison with grid-by-number data, and the mean of the corrected-uncorrected data (blue pentagons). Error bars are plotted according to the procedure outlined in Sect. 2.3. The mean error (me), normalised root mean squared error (nrmse) and r-squared linear regression coefficient (r2) for the comparison between the manual method and PebbleCounts are shown in panels (a) and (b). Panel (c) shows an example of an output image from PebbleCounts. Common errors such as under-segmentation, over-segmentation and undetected grains are highlighted.
2.4 Selection of environmental variables
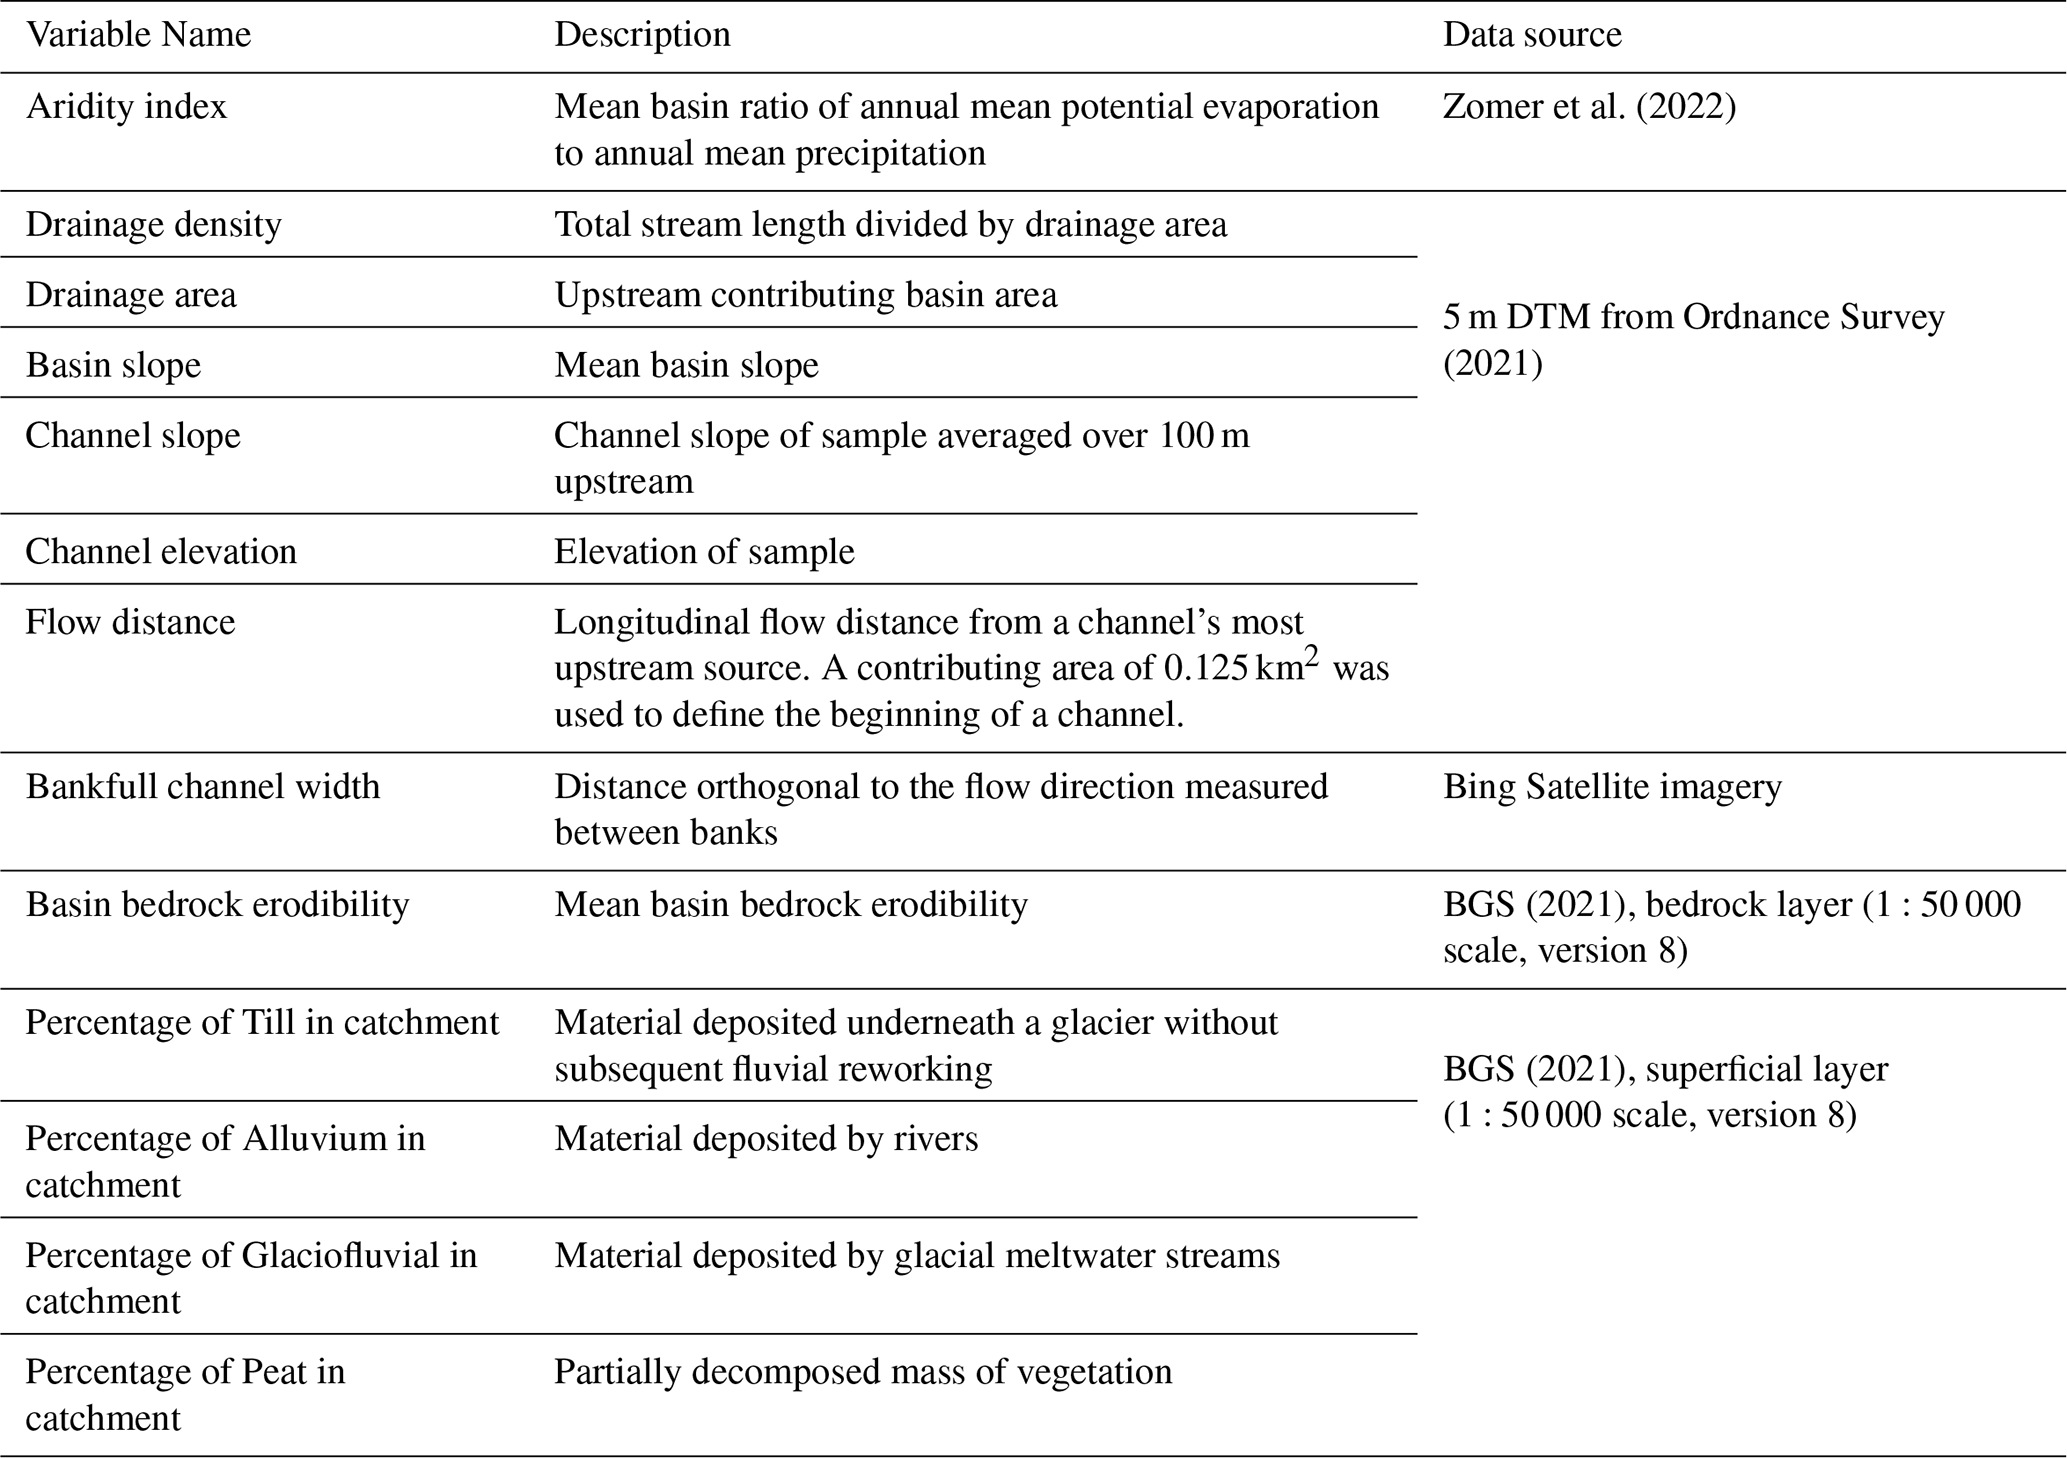
We test the applicability of global empirical grain size models (e.g., Abeshu et al., 2022; Snelder et al., 2011) to Scottish river basins by using similar environmental variables and Machine Learning techniques. We refer the reader to Sect. 1 for further background on the environmental variables outlined in this section. For each sample, we determine channel slope, elevation and flow distance in LSDTopoTools (Mudd et al., 2023) from a 5 m Digital Terrain Model (DTM) sourced from the Ordnance Survey (Ordnance Survey, 2021). Channel slope was averaged over 100 m. We delineate the upstream contributing basin area, and then calculate basin-averaged topographic metrics including basin area, slope and drainage density. We record basin-averaged aridity for each sample from a global aridity map by Zomer et al. (2022). For each of the sampled sites, we measure bankfull channel width from Bing Satellite Imagery. We define bankfull width as the distance orthogonal to the flow direction between either bedrock banks or the limit of vegetated bars on the edge of channels (e.g., Baynes et al., 2020).
Like other global empirical grain size studies, we calculate average bedrock erodibility of each sample's upstream basin. Broadly speaking, more resistant rocks produce clasts that fracture less and have lower abrasion rates (Attal and Lavé, 2009; Sklar, 2024). This means that coarser grain sizes would be expected in basins with more resistant lithologies, assuming all else equal. We attribute an erodibility value to every lithological unit present on a geological map of Scotland sourced from the British Geological Survey (BGS, 2021). We estimate each lithology's erodibility using an index developed by Campforts et al. (2020) and Clubb et al. (2023). The lithological erodibility index, LE, incorporates approximations of rock strength, LL, and the degree of metamorphism, LM, on the assumption that stronger and highly metamorphosed rocks are less erodible (Clubb et al., 2023). LE assumes that the erodibility of a unit is based on LL and LM for non-igneous rocks, and LL alone for igneous rocks. Our constraints on rock strength, LL, come from the Campforts et al. (2020) study (see Supplement Table 2 in Campforts et al., 2020). The corresponding spreadsheet associated with the erodibility index can be found in Supplement (Table S3). LL ranges from 2 (e.g., granite, gneiss) to 12 (e.g., unconsolidated deposits). Similarly, LM varies from 2 (highly metamorphosed) to 12 (unmetamorphosed); sedimentary rocks are classified as unmetamorphosed. The lithological erodibility, LE, is calculated as:
We refer the reader to Fig. S2 in the Supplement for the lithological erodibility map of Scotland.
Finally, we document the percentages of peat, alluvium, glacial till and glaciofluvial material in each sample's upstream basin (Haddadchi et al., 2018; Snelder et al., 2011). Superficial maps were downloaded from the British Geological Survey (BGS, 2021). A list of the environmental variables is provided in Table 1.
2.5 Random forest regressor model
To assess the relative importance of the environmental variables in controlling grain sizes, we apply the same methodology as Snelder et al. (2011) and use a random forest regression (RFR). RFR is a form of supervised Machine Learning which uses an ensemble of decision trees to predict a target variable (Breiman, 2001). Predictions are made by formulating unforeseen, multi-dimensional relationships between the input features. The model performance and apparent feature importance can then be evaluated by assessing the correlation between the observed and predicted grain sizes. In this study, we perform a leave-one-out-cross-validation (LOOCV) which trains the model on all but one sample and then evaluates the performance of the model on the excluded data point. This process is then repeated for each data point. We also perform a Spearman's rank correlation test between grain size and each environmental variable. Spearman's rank correlation measures the strength and direction of the relationship between two variables.
Zomer et al. (2022)Ordnance Survey (2021)BGS (2021)BGS (2021)Table 1Description of environmental variables and their data sources.
2.6 Flow Competence and sediment entrainment
In a scenario where all grain sizes are available for transport, the grain size of the sediment mobilized by a river is expected to increase with flow competence (Bathurst, 2013; Whitaker and Potts, 2007). In this case, the grain size can be considered “transport-limited”, that is, limited by the ability of the river to transport a given grain size. In some situations, rivers are only provided with fine grained sediment; in such systems where there is a lack of coarse grains available for transport, the grain size mobilized by the river will be “supply-limited” (Attal et al., 2015). Thus, the relationship between flow competence and grain size can provide information on sediment supply-limited and transport-limited conditions. Both scenarios may arise in our study area due to post-glacial processes affecting the distribution of sediment stores and the transport ability of channels. We therefore analyse this relationship to assess whether trends can be observed, that may reflect the dominance of one or the other of these conditions. We emphasise that, while the terms supply- and transport-limited are sometimes used in the literature with reference to sediment availability, our reference is to grain size (Attal et al., 2015).
Flow competence is typically expressed as a function of shear stress (e.g., Buffington and Montgomery, 1997; Mueller and Pitlick, 2014), which is calculated from the hydraulic radius of a channel and other parameters (Shields, 1936). However, the hydraulic radius can be challenging to measure due to access to sampling locations, identification of reference conditions (e.g., reference discharge) for comparison across all sites, and unmanageable sample sizes. An alternative approach consists of using the relationship between unit discharge and grain size that has been explored by researchers based on experimental work and field data (Attal et al., 2015; Bathurst, 2013; Whitaker and Potts, 2007). In its simplest form, the equation is:
where qci is the critical unit discharge required for the entrainment of sediment of grain size Di, a is a coefficient and b an exponent that should take the value of 1.5 for sediment of uniform grain size (Bathurst, 2013; Whitaker and Potts, 2007). The b exponent was found to vary between 0.15 and 1.3 based on a compilation of field data by Bathurst (2013) and Whitaker and Potts (2007), with the values being self-consistent within given datasets, and seemingly dependent on the flow regime (rainfall versus snowmelt-dominated; Bathurst, 2013), sampling method, and the definition of the grain size of interest Di (taken as Dmax in the study by Whitaker and Potts, 2007). Importantly, both studies showed a strong dependency of the relationship to the channel slope S. Considering that our dataset includes channel slopes spanning orders of magnitude, we believe that using a relationship that includes S as a controlling variable is essential.
Bathurst et al. (1987) proposed the following equation based on flume experiments using sediment of uniform grain size in the range 3–44 mm and slopes ranging between 0.0025 and 0.2 m m−1:
where qc is the critical unit discharge (i.e., the ratio of discharge to channel width) required for the entrainment of sediment of grain size D, g is the acceleration due to gravity and M is an exponent found to vary in a narrow range: Bathurst et al. (1987) found a value of 1.12 in their experiments, while Bathurst (2013) found a value of 1.15 based on a compilation of flume data, close to the value of 1.17 “derived by Schoklitsch (1962) from the Shields equation and Manning-Strickler flow resistance equation”.
Equation (5) can be rearranged as:
where is the ratio of discharge to channel width (or unit discharge) at which the sediment of grain size D is expected to be entrained. If sediment grain size is transport-limited, i.e., controlled by flow competence, a power relationship can therefore be expected between the grain size D and the quantity ωm (Attal et al., 2015), where
For the purpose of this Scotland-wide analysis, we assume that drainage area A can be used as a proxy for discharge and use the variable that substitutes Q for A:
Attal et al. (2015) had found a significant power relationship between the grain size of surface sediment and in tributaries of the Feather River, Sierra Nevada, California. The exponent derived from their dataset was 0.61, 0.53 and 0.4 for d50, d84 and d100, respectively, with an exponent closest to the expected value for the median grain size d50.
Here, we use a value of 1.15 for the exponent M (Attal et al., 2015). We use the measured bankfull width (described in Sect. 2.4) to calculate and make the assumption that the modelled percentiles (d50 and d84) are transported during the bankfull width's corresponding flow conditions, which is, by definition, the bankfull flow.
In this section, we present the following results: (1) national-scale map of grain sizes, (2) correlations between grain sizes and environmental variables outlined in Table 1, (3) RFR predictions and associated variable importances, and (4) flow competence analysis. We convert our grain size percentiles to the typical ψ scale for correlation statistics and RFR analysis. This allows direct comparison of statistical results with Snelder et al. (2011). The grain size dataset presented in the following text combines the grain size measurements made in the field at four locations along the Feshie River (Sect. 2.1, Fig. 1), and measurements on photos from SBSS, 63 % of which were processed manually (grid-by-number measurement of clasts) and 37 % of which were processed through PebbleCountsAuto. PebbleCountsAuto percentiles used in this dataset are the mean of the corrected-uncorrected PebbleCountsAuto values (Sect. 2.2); the whole analysis was also performed using the uncorrected PebbleCountsAuto values instead, with the results presented in the Supplement.
The d84 percentiles documented in this study range from 4.91 ψ to 8.64 ψ and the majority of the values fall between 6 ψ and 7.5 ψ (Fig. 3). A map of the d50 percentiles is shown in the Supplement (Fig. S1). There is generally no discernible spatial patterns of grain size. Rivers along which multiple samples were taken (Feshie, Dee and Tay) show no obvious fining trends. The coarsest sediment (d84 in excess of 175 mm) is found both in the headwaters (e.g., Spey), in the middle reaches (e.g., Dee) or near outlets (e.g., Findhorn) of river catchments. Likewise, the finest sediment is found in diverse regions of the various river systems.
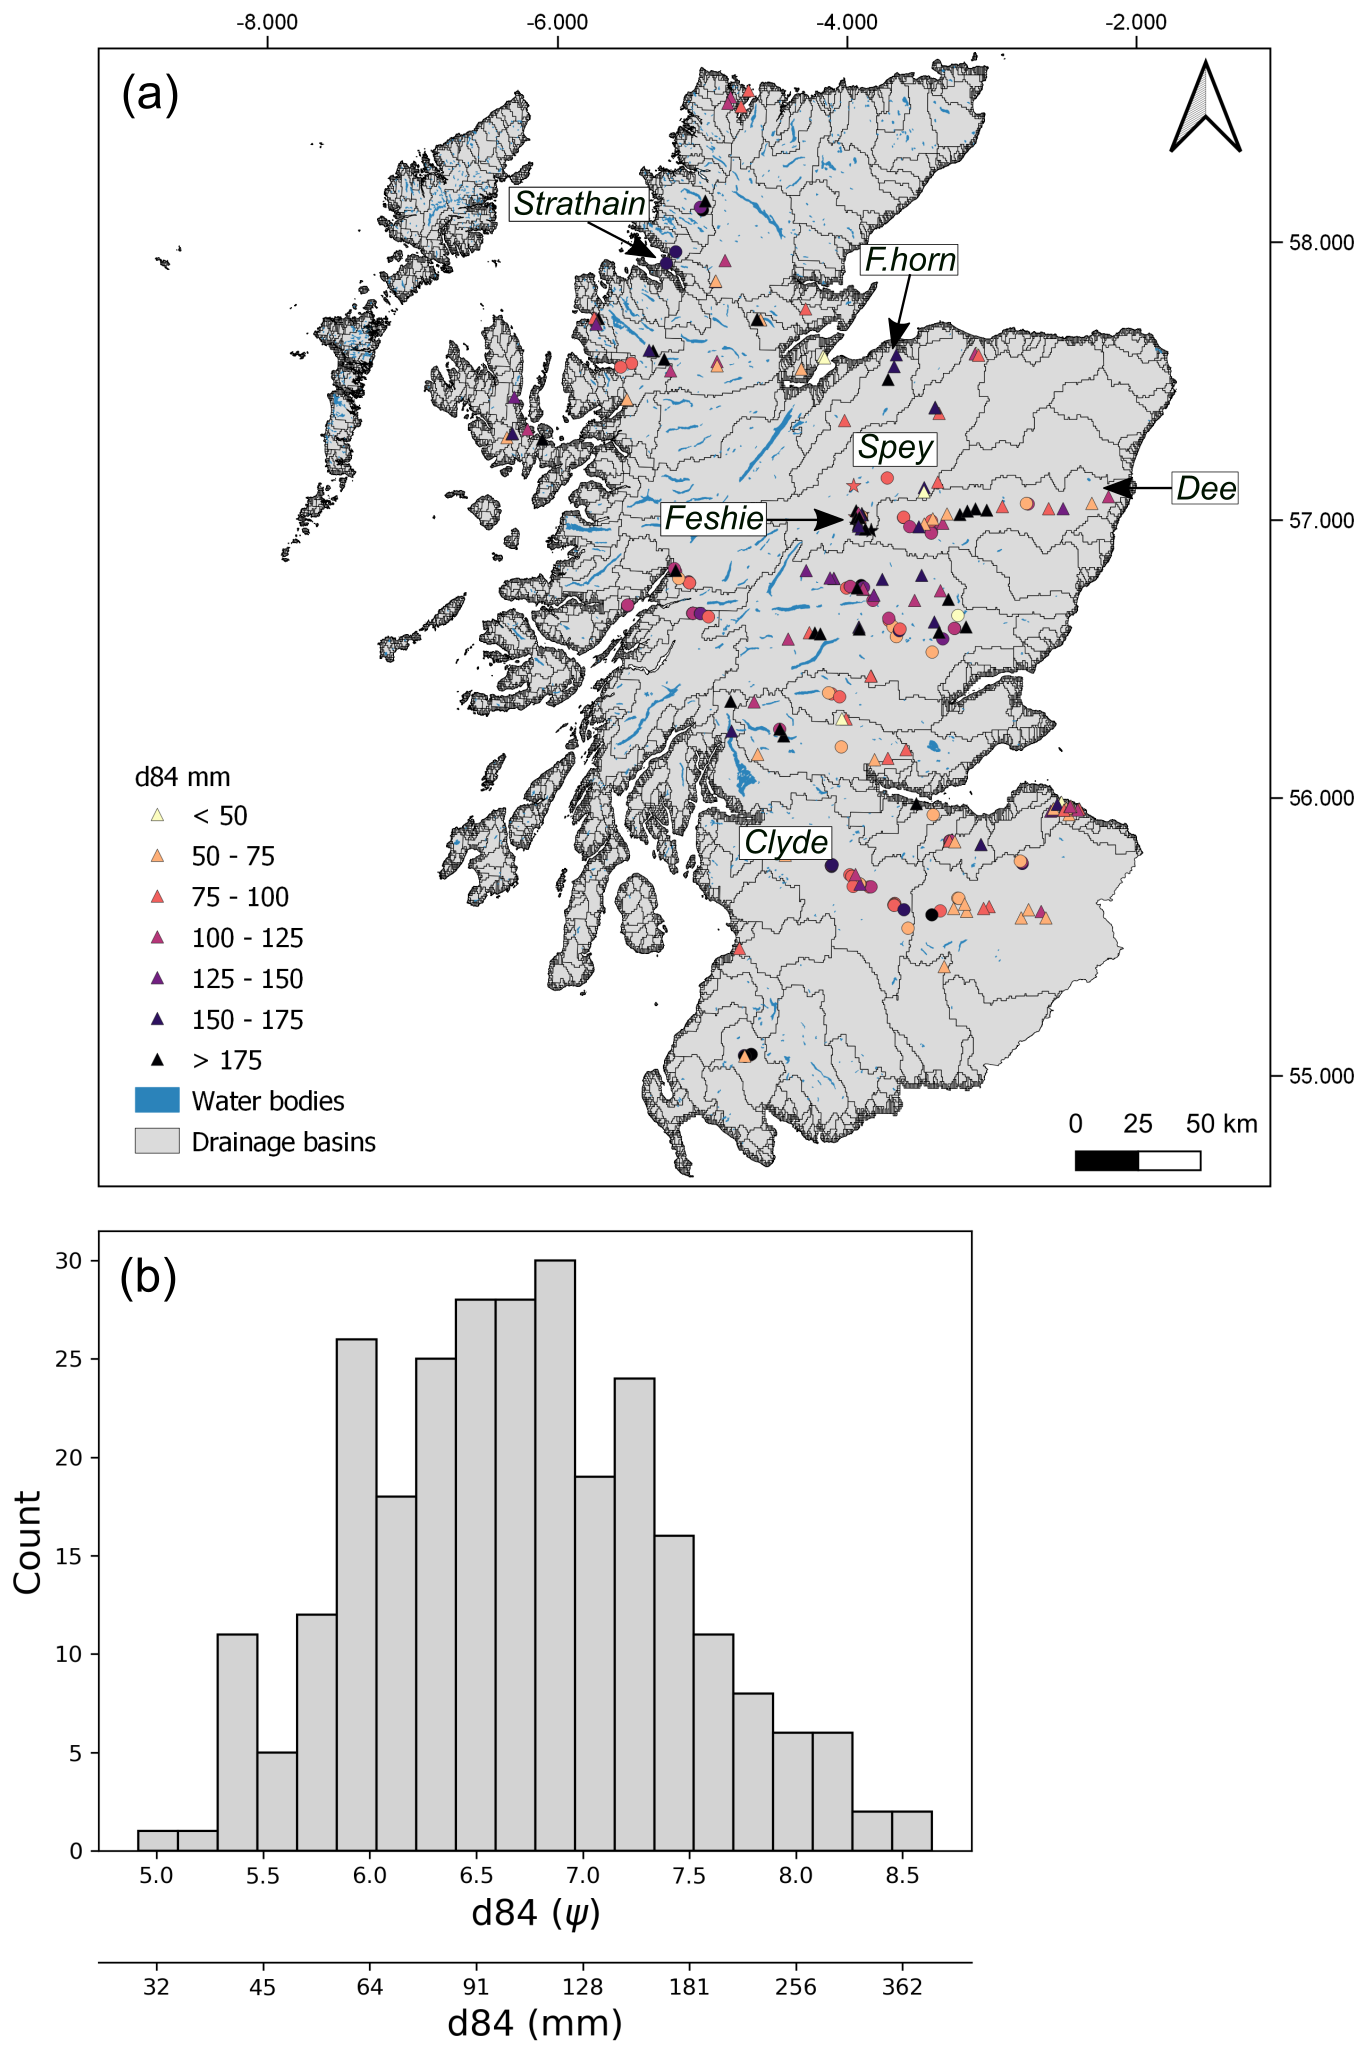
Figure 3(a) Map of Scotland (focused on the mainland) showing 279 surveyed locations coloured according to d84 (mm). Circles represent samples processed with PebbleCountsAuto, triangles show manually clicked sites, and stars represent samples measured in the field. Water bodies (< 10 ha) are shown in dark blue and drainage basin outlines (15 arcsec resolution) in black (sourced from the HydroLAKES and HydroBASINS databases (Lehner and Grill, 2013; Messager et al., 2016)). Drainage basins that are referred to in the main text are labelled. (b) Histogram of d84 grain sizes converted to the ψ scale.
Overall, grain size does not show any significant Spearman's correlations with the independent variables (Fig. 4). The strongest correlations observed for the d84 are with the average basin aridity (0.34) and average basin bedrock erodibility (−0.27). The percentages of alluvium, peat and glaciofluvial material also display similar correlation values of ≈ 0.2.
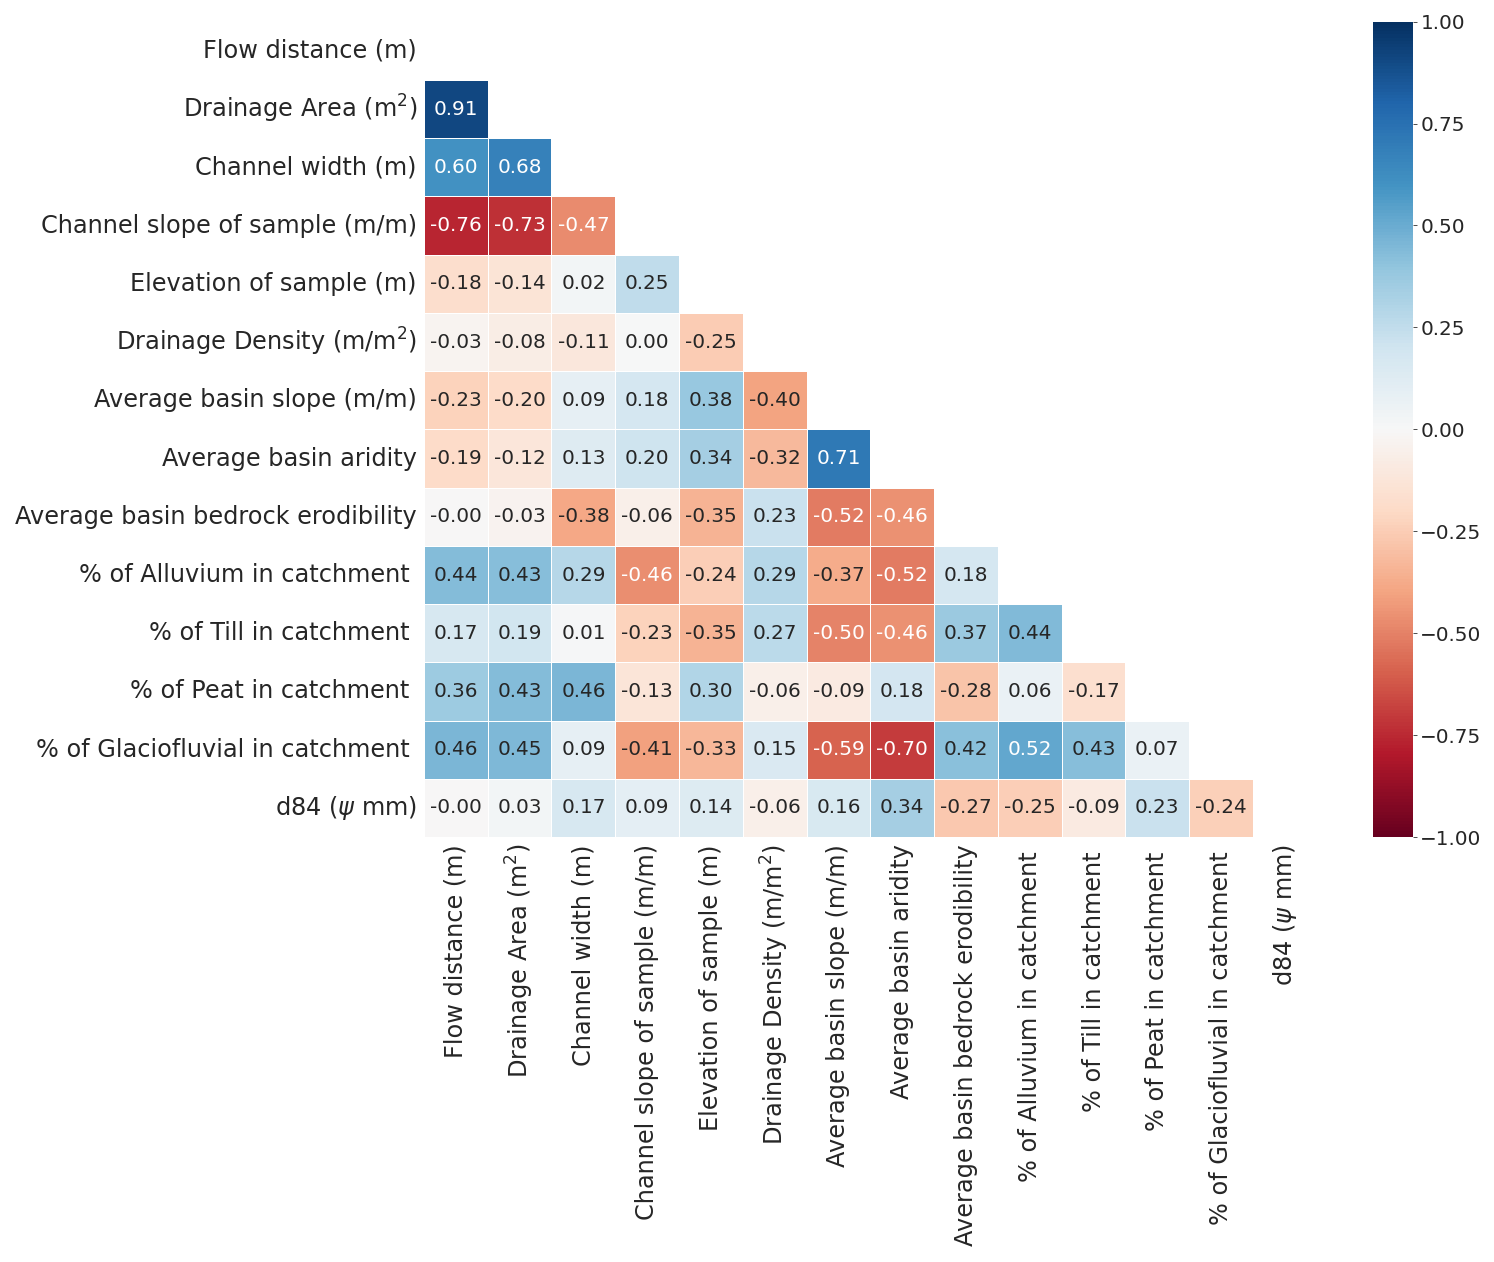
Figure 4Spearman's correlations between measured grain size (d84) and various hydrological, climatic and topographic variables.
Results from the Random Forest Regressor model show the normalised importance of each environmental variable using the impurity reduction method, and the model's predictive ability (Fig. 5). The most important variables modelled for the d84 are the average basin bedrock erodibility and basin aridity, which have normalised importance values of 0.15 and 0.10, respectively. These variables presents some of the strongest Spearman's correlations with grain size (Fig. 4). However, the predictive ability of the RFR model is poor, which raises caution to the interpretation of variable importance. When validated against the unseen testing data through the LOOCV method with all features included, the RFR presents a nrmse of 0.10 ψ and r2 of 0.20. Similar results are also observed for the d50 and samples that have been measured manually (see Fig. S3 in the Supplement).
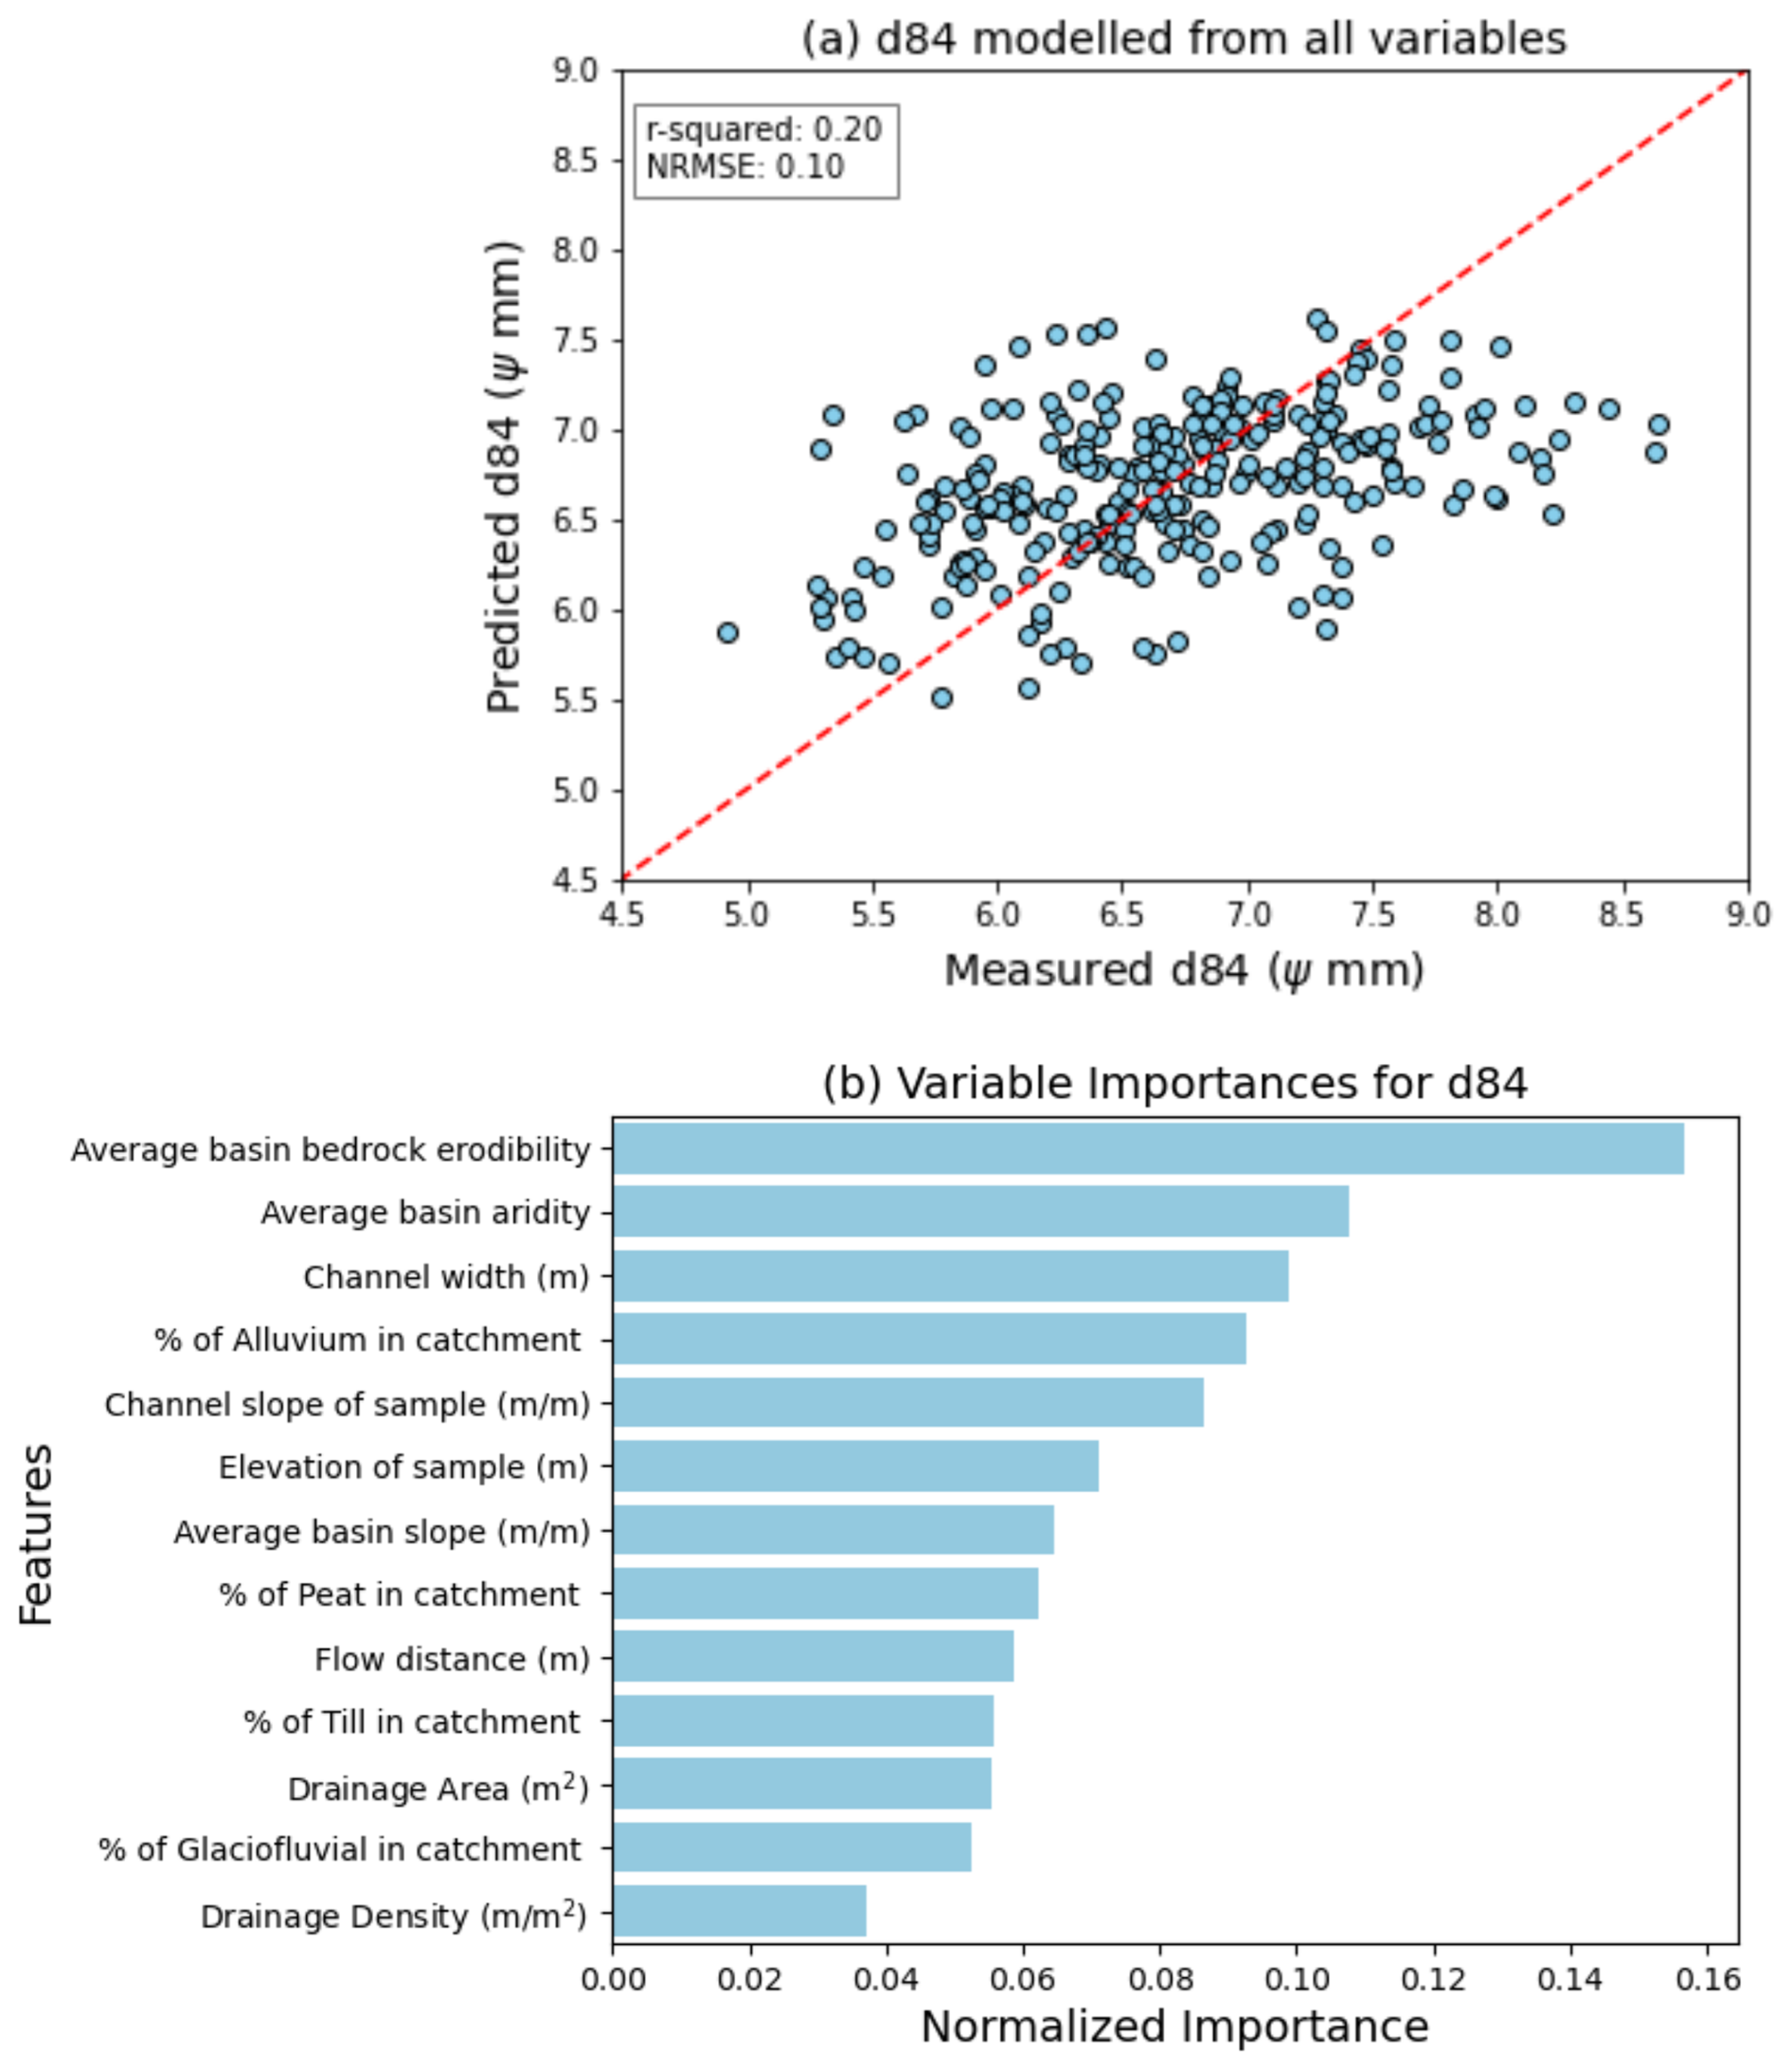
Figure 5Results from the random forest regressor analysis. Panel (a) shows the model's predictive ability, which is extremely poor. The dashed red line represents the 1:1 relationship. Panel (b) shows the normalised variables' importance for predicting the d84 percentile. Normalisation is performed by dividing each importance score by the sum of all importance scores.
As discussed in Sect. 2.6, the relationship between , which we use a proxy for flow competence, and grain size can provide information on supply-limited and transport-limited grain size conditions. In supply-limited systems, there would be an apparent grain size threshold that would not be exceeded, even at high flow competence. A power relationship between grain size and would be expected to reflect transport-limited grain size conditions. Neither of these is obvious in our Scotland-wide d84 dataset (Fig. 6a): a wide range of grain sizes is observed across a wide range of flow competences. Similar results are also observed for the d50 and samples that have been measured manually (see Fig. S5 in the Supplement). We note however that ≈ 50 % of the d84 data at high flow competence ( > 50 000 m) sits in the lower two quartiles of the entire d84 distribution, potentially reflecting supply-limited grain size conditions (i.e., the river has the potential to transport coarser sediment but coarse sediment is not available for transport). We acknowledge that actual trends may be obscured in the noise due to the dataset amalgamating data from a very wide range of geological and geomorphological settings across Scotland. We therefore isolate the Feshie River basin which is very dynamic (Towers et al., 2025), with evidence of frequent bedload transport (Matthews et al., 2024) and for which we have 18 data points (Fig. 6b). Similarly, we observe no apparent correlation between and d84, although we note again that three of the four data points with the highest flow competence sit at values close to the median of the entire Feshie dataset. We also observe no apparent downstream grain size fining trends along the Feshie river (Fig. 6c).
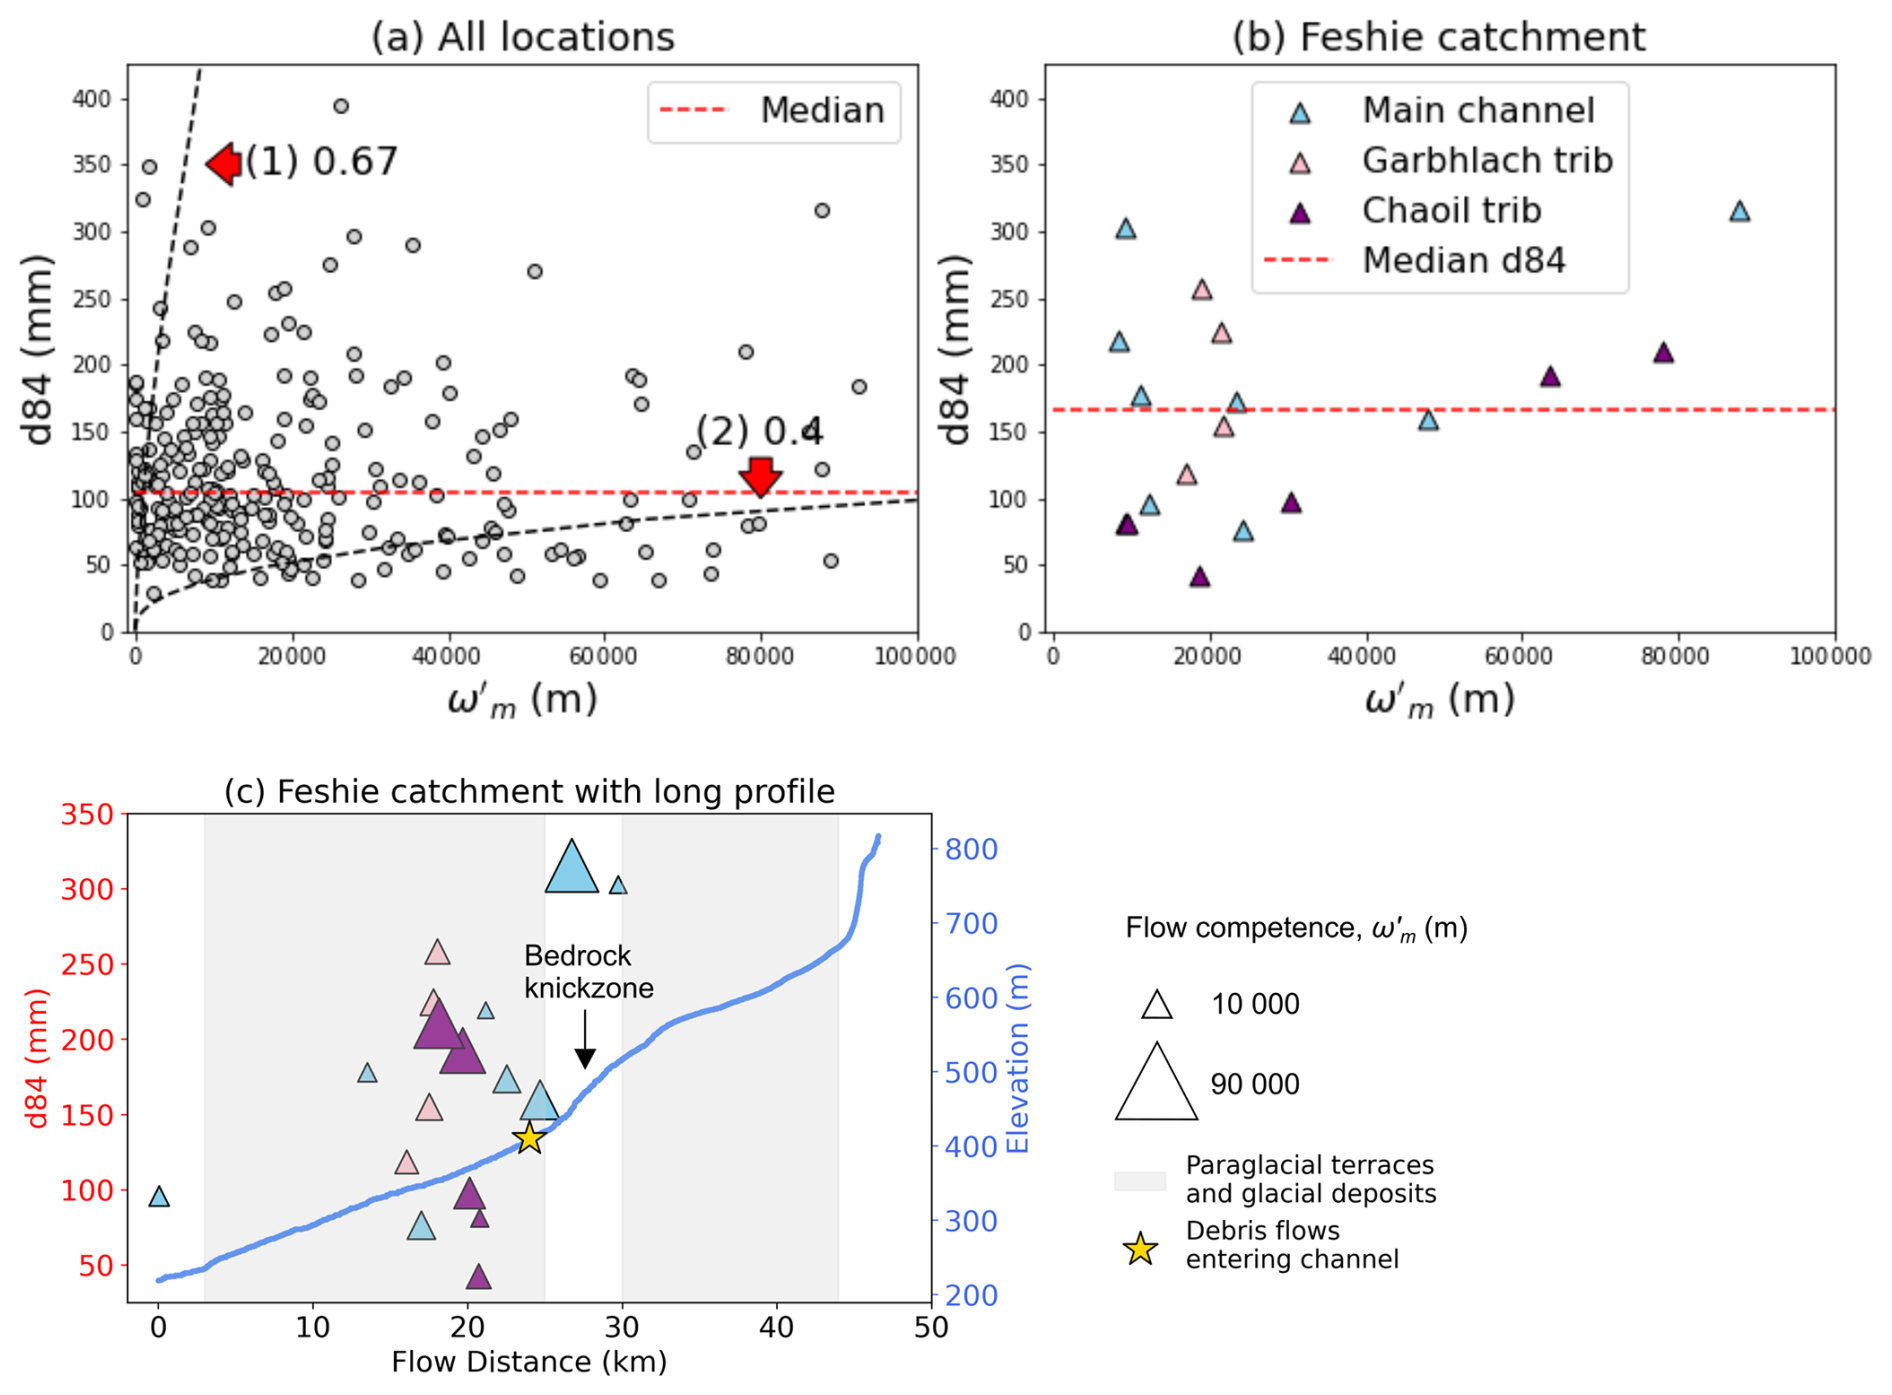
Figure 6d84 as a function of variable which is a proxy for flow competence (Eq. 8). Panel (a) shows the results for our Scotland-wide dataset. The median of the entire d84 distribution is shown by the red dashed line. Black dashed lines represent power law relationships between d84 and with exponents of and 0.4 (curves (1) and (2), respectively). These curves bracket the range of exponents found by Attal et al. (2015) in the Feather River basin, Sierra Nevada, California: they found exponents of 0.4, 0.53 and 0.61 best fit their data for the d100, d84 and d50 of their measured surface sediment, respectively. Median grain size d50 was fit with the exponent closest to the expected value from experimental work and compilation of field studies (Bathurst, 2013; Whitaker and Potts, 2007). In a scenario where sediment grain size is controlled by flow competence (“transport-limited”), a power relationship between grain size and would be expected. Panel (b) shows the relationship between and d84 for the Feshie basin which is a mountain river in the Spey catchment where 18 data points are available (see Fig. 3 for the Feshie's location). The median of the Feshie's d84 distribution is shown by the red dashed line. Blue triangles show points located along the main channel, and purple and pink triangles show points located along the Chaoil and Garbhlach tributaries. Panel (c) shows the long channel profile of the Feshie catchment with grain sizes and key geomorphic domains that influence sediment supply and transport (Towers et al., 2025). The size of the grain size markers are scaled according to the flow competence of each site. As shown in Fig. 6b, grain size markers are coloured according to the tributary name. The type and location of each geomorphic landform is taken from Towers et al. (2025).
In this study, we do not find any apparent control on surface grain sizes in channels across Scotland. Our results contrast with those of Snelder et al. (2011) and Mugodo et al. (2006) who found that grain sizes could be reasonably well predicted for rivers at large spatial scales. Snelder et al. (2011) found that grain sizes could be reasonably well predicted for rivers across France using a random forest model: in their study, the random forest predictor captured 52 % of the variance in the measured grain sizes (sample size >500), whereas in Scotland we find the random forest predictor only captures 20 % of the variance of d84. We also find no correlation between flow competence and grain size: d84 values ranging from 30–360 mm are observed across several orders of magnitude of the parameter (Fig. 6).
Scotland's post-glacial legacy may drive our inability to predict grain size based on a number of landscape properties that have been shown to control grain size elsewhere, such as gradient, underlying lithology and downstream flow distance (e.g., Attal and Lavé, 2006; Sklar et al., 2017; Snelder et al., 2011). As discussed in Sect. 1, past glaciations have modified the spatial locations and grain size distributions of sediment stores, and the drivers of flow competence (i.e., channel slope and width) (Attal and Lavé, 2006; Ballantyne, 2019; Johnson et al., 2022; Mason and Polvi, 2023; Reid et al., 2022; Whitbread et al., 2015). In many Scottish river basins, channel erosion has exposed paraglacial sediment stores that contribute large quantities of sediment to modern rivers (e.g., Ballantyne, 2019; Towers et al., 2025). The longitudinal profiles of rivers also shows a strong glacial control that can influence sediment transport; many profiles are highly irregular, with long stretches of low gradient reaches that are interspersed by shorter, steeper reaches (Jansen et al., 2010; Whitbread et al., 2015). The empirical modelling approach applied in this study uses, in some cases, catchment-averaged variables that do not reflect spatial variations in sediment supply and transport capacity along river profiles. Moreover, many of the environmental variables are defined at the landscape scale and are therefore relatively coarse; for example, the bedrock erodibility index may not capture local variations in erodibility and thus grain size (e.g., fracture spacing can vary substantially due to fault-related deformation at the local scale (Neely and DiBiase, 2020; Whitbread et al., 2024)). Studies have shown that spatial variations in the grain size of sediment supplied to rivers can significantly impact the grain size of sediments in rivers locally and further downstream (e.g., Attal and Lavé, 2006; Attal et al., 2015; Sklar et al., 2006; Whittaker, 2012). We therefore suggest that Scotland's post-glacial legacy and the modelling approach contributes to the absence of correlation between grain size and landscape properties.
Snelder et al. (2011) found average basin slope to be the most important control on fluvial grain sizes for rivers across France. In contrast, we did not find a significant relationship between grain size and basin slope at our sampled locations. In addition to the supply of material from glacial and paraglacial sediment stores and irregularities in channel profiles, we suggest that the general decoupling between hillslopes and channels in post-glacial landscapes also contributes to such observations. Many Scottish river valleys exhibit “U” shaped valleys with wide valley floors meaning that significant stretches of the channel network are disconnected from hillslope sediment sources (Ballantyne, 2008; Whitbread et al., 2015). Studies have suggested that in the absence of sustained tectonic uplift or base level lowering, valleys are likely to maintain their glacially inherited “U” shaped topography and remain in a state of transient dynamics that last for millions of years (Ballantyne, 2002; Egholm et al., 2013; Prasicek et al., 2015; Whitbread et al., 2015).
While we observe no apparent relationship between flow competence and grain size in Fig. 6, we find fine grain sizes across a wide range of flow competences, including high flow competences. This observation may indicate that sediment grain size is supply-limited in some rivers, that is, river stretches with high competence transport fine sediment because no coarse sediment is available for transport. Likewise, coarse grain sizes are found in rivers with relatively low flow competence. We propose that the heterogeneous nature of post-glacial sediment supply and post-glacial channel morphology contributes significantly to the supply-limited and transport-limited grain size conditions observed in the flow competence analysis. Steep, powerful rivers may source sediment from fine-grained glacial and paraglacial deposits. Likewise, rivers with a low flow competence, such as those that drain plateaus and low gradient valleys, may be locally supplied with sediment from coarse-grained glacial and paraglacial sediment sources (Fig. 7). For example, the Garry River (Spey basin) has a low apparent flow competence, but exhibits some of the coarsest sediment on our Scotland-wide map (d84 = 188 mm). A potential explanation for this could be that sediments are largely sourced from the abundant upstream paraglacial and glacial deposits. These coarse deposits are only likely to become mobile during the largest of flood events. Moreover, the Feshie River demonstrates large variations in grain size, with no apparent downstream fining trends, and flow competence (Fig. 6). We suggest that these trends may arise from the glacial modification of topography. We find areas with coarse grain sizes but relatively low flow competences (e.g., furthest upstream sample on Fig. 6c). It is likely that sediments are sourced from paraglacial and glacial sediment stores, which have been shown to dominate the sediment flux in the Feshie basin (Towers et al., 2025). Diagrams and photographs in Fig. 7 illustrate the post-glacial geomorphic processes discussed in this paragraph.
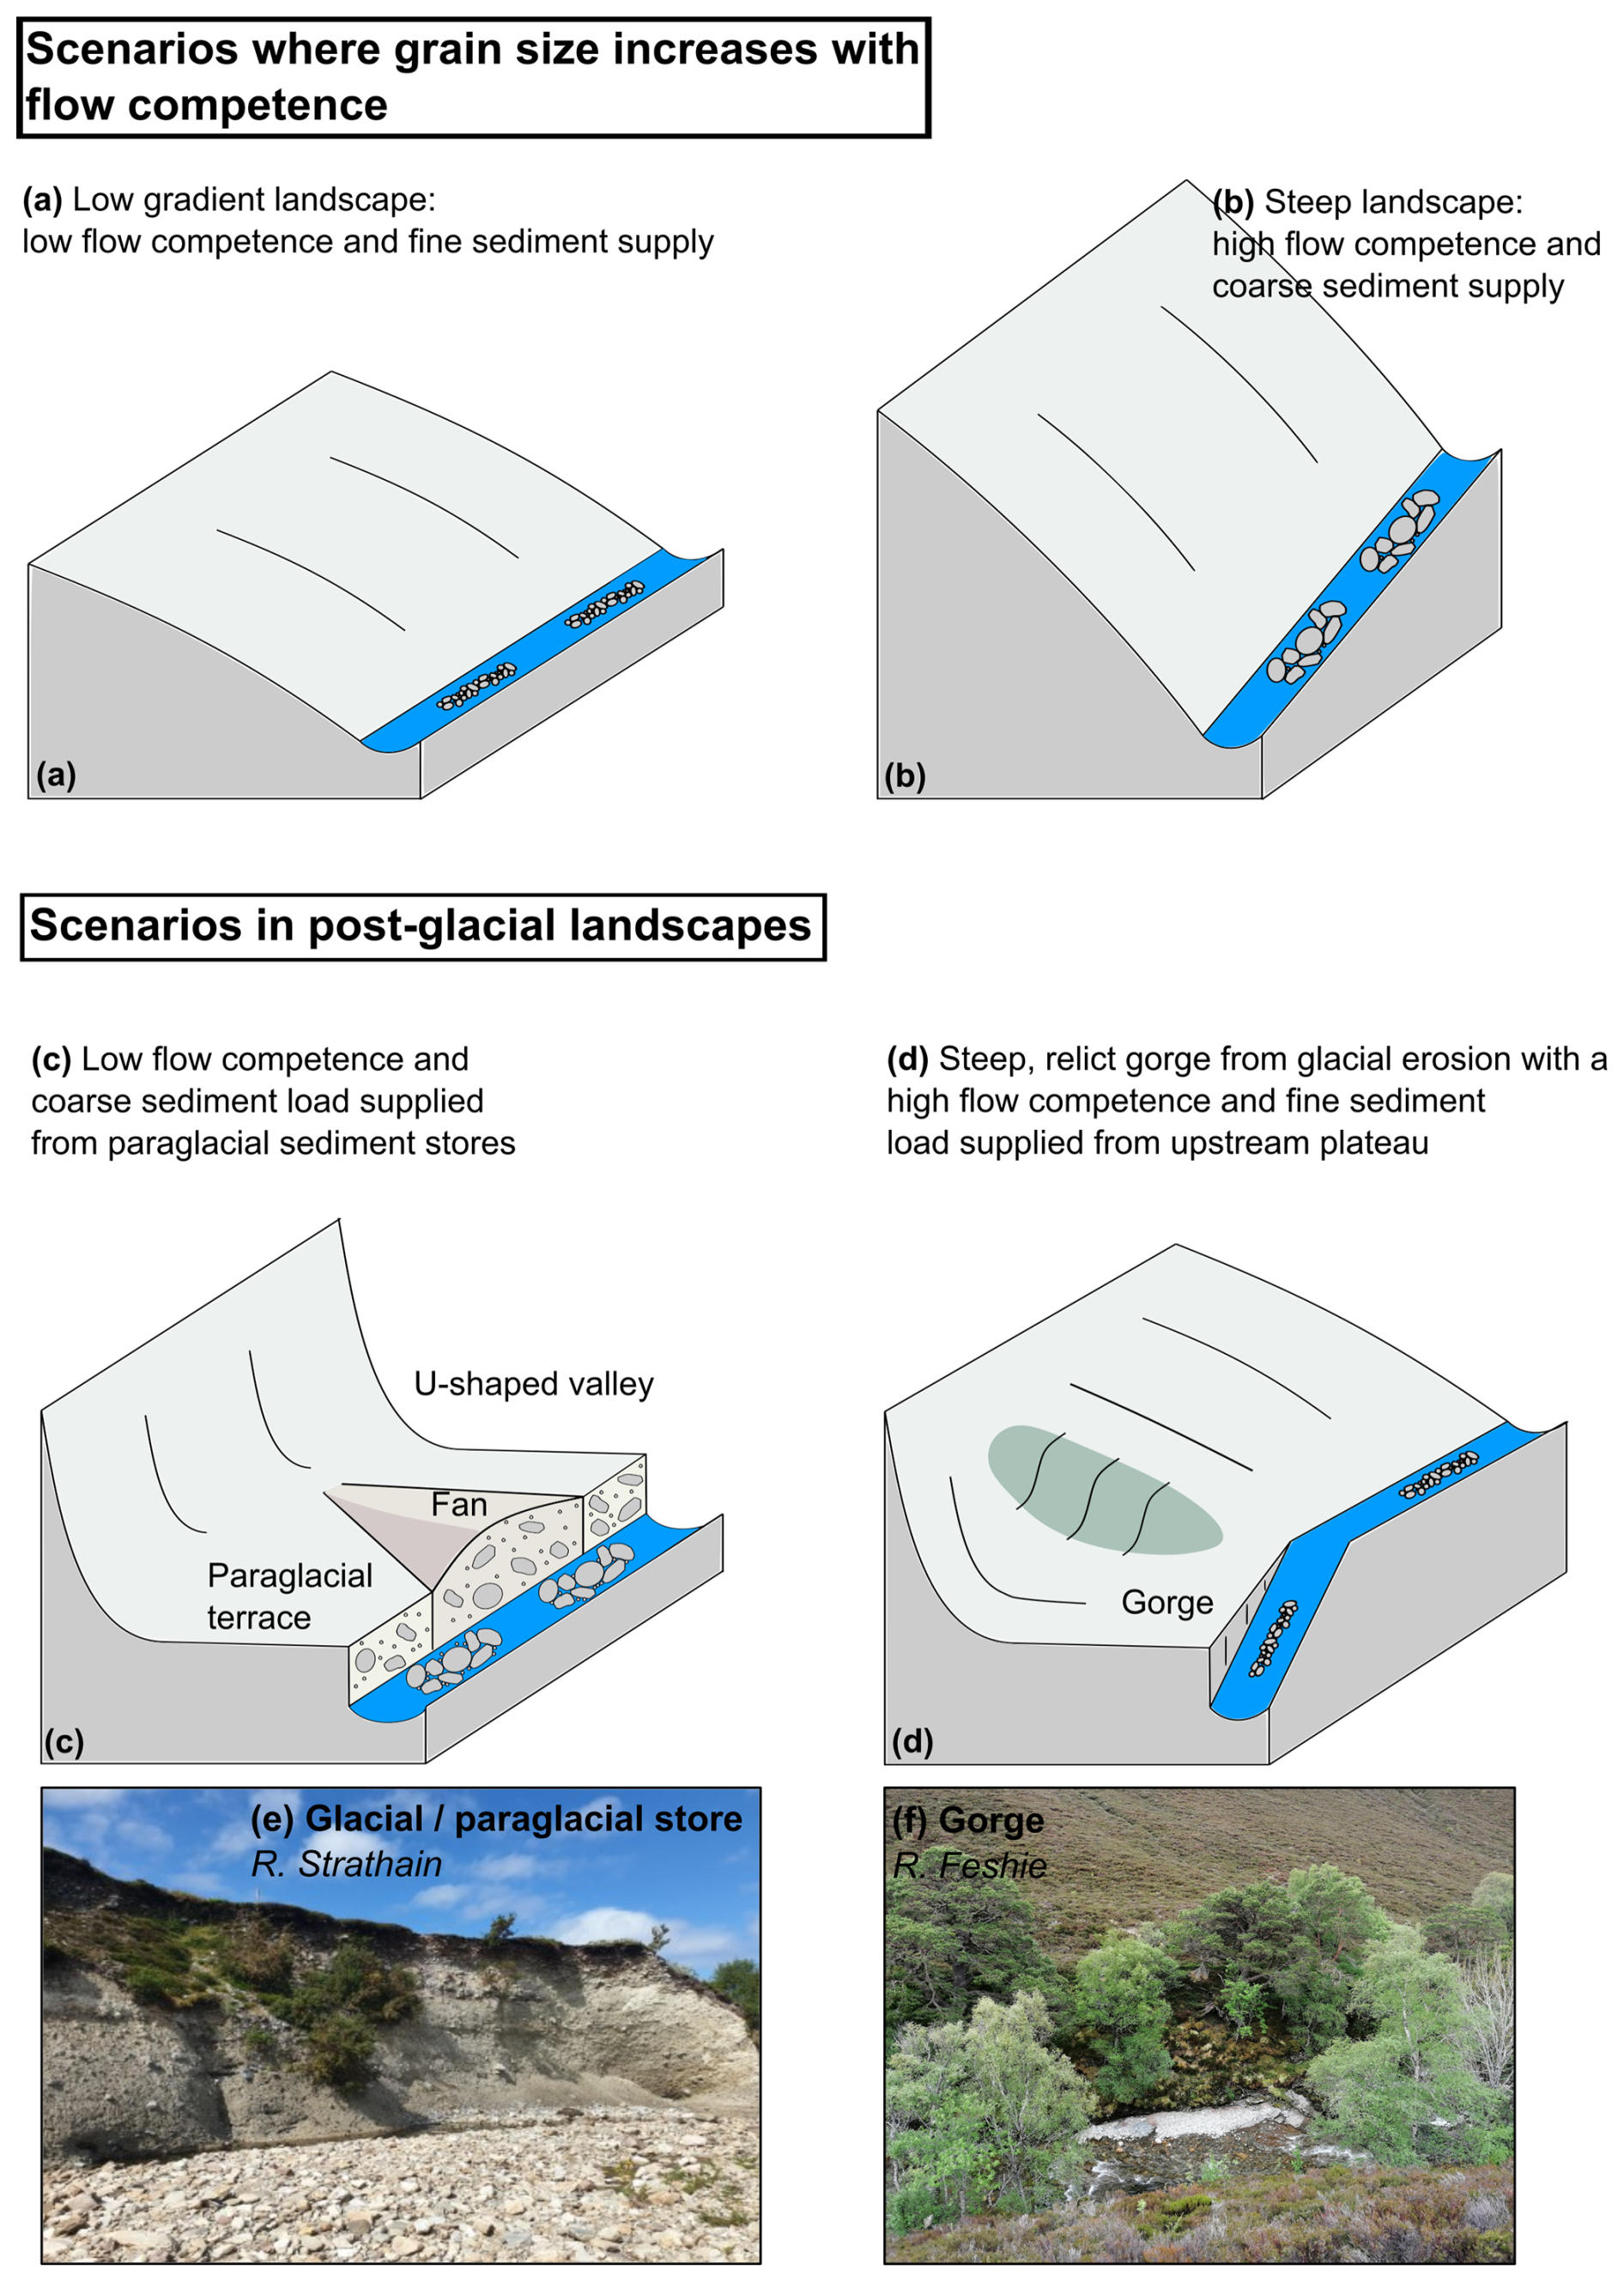
Figure 7Diagrams and photographs illustrating the contrast in sediment dynamics between non-glaciated landscapes and post-glacial landscapes. (a–b) In non-glaciated landscapes, feedbacks are expected between erosion rates, hillslope steepness, channel steepness, and the grain size of the sediment supplied to rivers (Attal et al., 2015). In slowly eroding, low relief landscapes, low competence rivers (low gradient) are supplied with and transport fine sediment (a). As relief increases, rivers become more powerful (steeper gradient, higher competence) and are supplied with a wider range of grain sizes (b). In a scenario where all grain sizes are available for transport, the grain size of the sediment mobilized by a river is expected to increase with flow competence. In this case, the grain size can be considered “transport-limited”. (c–f) In post-glacial landscapes, these feedbacks do not operate anymore. Panel (c) shows a channel with low flow competence (low gradient) but a coarse sediment load, which is supplied from glacial and paraglacial sediment stores. (d) shows a steep relict gorge from glacial erosion (e.g., gorge connecting a hanging valley) with a high flow competence (steep gradient) but a fine sediment load as no coarse sediment is available on the upstream plateau. These situations are illustrated by photographs (e) and (f), respectively. Panel (e) shows a glacial/paraglacial sediment store feeding large quantities of coarse sediment to the River Strathain (scarp is approximately 10 m high). Panel (f) shows a relatively fine-grained, well-sorted gravel bar along a steep bedrock reach of the River Feshie which is a tributary of the upper Spey basin (channel is approximately 5 m wide).
In this study, we used citizen science to gather grain size data on a national scale in a relatively data-sparse country. This extensive spatial coverage enabled us to explore controls on grain size across a range of landscapes. Documenting grain sizes at such a large spatial scale would not have been feasible using current remote sensing techniques, as these methods are labour-intensive, costly, and of limited spatial coverage. The survey was cost-effective and quick, and contributes to the growing body of research using citizen science to monitor river characteristics (e.g., Riverfly Monitoring Initiative; https://www.riverflies.org/, last access: 1 January 2023). Importantly, the survey fostered significant public engagement due to the importance of sediment on applied matters such as flood risk and habitat value. It is important to note that our sample sites are more spatially clustered than in the study of Snelder et al. (2011). This clustering likely reflects the preferences and accessibility of citizen scientists, in contrast to the more structured sampling design used by the French National Agency for Water and Aquatic Environments. Compared to more structured sampling approaches, clustering has both benefits, such as enabling the exploration of detailed trends in selected river basins, and also limitations, including a more skewed range of sampled environmental variables. Moreover, we highlight that many of the sampled sites were taken by citizens, who may not have selected gravel bars that were representative of the river reach, and as such represents a limitation to our methodology. However, as discussed in the Methods section, we examined the context photograph associated with each survey upload to only select gravel bars that were considered to be representative of the river reach.
In this study, we document river surface grain sizes across Scotland using photographs of gravel bars. Grain sizes are extracted from the photographs through a combination of manual and automated techniques. We investigate whether grain sizes can be correlated with and predicted from a series of environmental variables (such as upstream basin slope) that have been suggested to control grain sizes in previous studies. In contrast to other studies that have primarily focused on non-glaciated landscapes, we find no apparent controls on grain sizes. We find weak Spearman's rank correlations between grain size and environmental variables. We also find that grain sizes cannot be predicted from a random forest model, in contrast to Snelder et al. (2011) who found that grain sizes could be reasonably well predicted for rivers across France. We find no correlation between flow competence and grain size.
We propose that Scotland's post-glacial legacy drives the lack of sedimentological trends documented in this study. This interpretation aligns with other studies that have highlighted the ongoing role of the post-glacial legacy on landscape evolution in tectonically quiescent terrains, both in Scotland and globally. Key geomorphic processes in post-glacial landscapes that contribute to a decoupling between channel, catchment morphology and fluvial sediment grain size include the disconnection between hillslopes and channels in “U”-shaped valleys, presence of steep reaches at various locations along river long-profiles (and not just in the headwaters), presence of high-elevation low-relief plateaus and hanging valleys, and paraglacial and glacial sediment stores (e.g., till, fluvio-glacial terraces and fans) acting as sediment sources at many locations along rivers. Thus, steep reaches (high competence) may transport only fine sediment due to the absence of coarse sediment available for transport upstream (grain size is “supply-limited”). Meanwhile, low gradient (low competence) reaches may source sediment from coarse-grained glacial and paraglacial deposits, leading to anomalously coarse fluvial deposits that are mobilized only during the most extreme events. As a result, surface fluvial sediment grain size cannot be predicted by a global model based on environmental variables in post-glacial landscapes. Our results suggest that studies aiming to assess the controls and importance of sediment on hazards (e.g., flood risk), habitats, and river morphology in post-glacial landscapes need to rely on the careful characterisation of upstream grain size distributions and geomorphic processes.
The code for PebbleCountsAuto is available at https://doi.org/10.5880/fidgeo.2019.007 (Purinton and Bookhagen, 2019b, a). The LSDTopoTools software, which was used for the topographic analysis, can be found at https://doi.org/10.5281/ZENODO.7892465 (Mudd et al., 2023). The grain size data collected for this study can be found in the Supplement.
The supplement related to this article is available online at https://doi.org/10.5194/esurf-14-95-2026-supplement.
Funding and project design was by AHT, SMM, MA and FJC. AHT conducted the data analysis. AHT led the writing of the manuscript with contributions from MA, SMM and FJC.
At least one of the (co-)authors is a member of the editorial board of Earth Surface Dynamics. The peer-review process was guided by an independent editor, and the authors also have no other competing interests to declare.
Publisher's note: Copernicus Publications remains neutral with regard to jurisdictional claims made in the text, published maps, institutional affiliations, or any other geographical representation in this paper. The authors bear the ultimate responsibility for providing appropriate place names. Views expressed in the text are those of the authors and do not necessarily reflect the views of the publisher.
AHT was funded by a NERC Doctoral Training Partnership Grant (NE/S007407/1), with further support from the Scottish Environmental Protection Agency. We are extremely grateful to Ben Purinton for help with the PebbleCountsAuto software and technical support. We would like to thank Roberto Martinez and Rebecca Hodge for stimulating discussions. We thank everyone who contributed to SBSS. Katie Whitbread, Laure Guerit, Tom Coulthard and Wolfgang Schwanghart provided constructive reviews which significantly improved the manuscript.
This research has been supported by the Natural Environment Research Council (grant no. NE/S007407/1).
This paper was edited by Tom Coulthard and reviewed by Katie Whitbread and Laure Guerit.
Abeshu, G. W., Li, H.-Y., Zhu, Z., Tan, Z., and Leung, L. R.: Median bed-material sediment particle size across rivers in the contiguous US, Earth System Science Data, 14, 929–942, https://doi.org/10.5194/essd-14-929-2022, 2022. a, b
Attal, M. and Lavé, J.: Changes of bedload characteristics along the Marsyandi River (central Nepal): Implications for understanding hillslope sediment supply, sediment load evolution along fluvial networks, and denudation in active orogenic belts, Special Paper of the Geological Society of America, 398, 143–171, https://doi.org/10.1130/2006.2398(09), 2006. a, b, c, d, e, f, g
Attal, M. and Lavé, J.: Pebble abrasion during fluvial transport: Experimental results and implications for the evolution of the sediment load along rivers, Journal of Geophysical Research: Earth Surface, 114, https://doi.org/10.1029/2009JF001328, 2009. a
Attal, M., Mudd, S. M., Hurst, M. D., Weinman, B., Yoo, K., and Naylor, M.: Impact of change in erosion rate and landscape steepness on hillslope and fluvial sediments grain size in the Feather River basin (Sierra Nevada, California), Earth Surface Dynamics, 3, 201–222, https://doi.org/10.5194/esurf-3-201-2015, 2015. a, b, c, d, e, f, g, h, i, j, k, l, m
Ballantyne, C. K.: A general model of paraglacial landscape response, Holocene, 12, 371–376, https://doi.org/10.1191/0959683602hl553fa, 2002. a
Ballantyne, C. K.: After the ice: Holocene geomorphic activity in the Scottish Highlands, vol. 124, ISBN 1470254080230, https://doi.org/10.1080/14702540802300167, 2008. a, b
Ballantyne, C. K.: After the ice: Lateglacial and holocene landforms and landscape evolution in Scotland, Earth and Environmental Science Transactions of the Royal Society of Edinburgh, 110, 133–171, https://doi.org/10.1017/S175569101800004X, 2019. a, b, c, d
Bathurst, J. C.: Critical conditions for particle motion in coarse bed materials of nonuniform size distribution, Geomorphology, 197, 170–184, https://doi.org/10.1016/j.geomorph.2013.05.008, 2013. a, b, c, d, e, f, g
Bathurst, J. C., Graf, W. H., and Cao, H. H.: Sediment Transport in Gravel-bed Rivers, edited by: Thorne, C. R., Bathurst, J. C., and Hey, R. D., John Wiley & Sons Ltd., Sediment Transport in Gravel-Bed Rivers, p. 453, 1987. a, b
Baynes, E. R., Lague, D., Steer, P., Bonnet, S., and Illien, L.: Sediment flux-driven channel geometry adjustment of bedrock and mixed gravel–bedrock rivers, Earth Surface Processes and Landforms, 45, 3714–3731, https://doi.org/10.1002/esp.4996, 2020. a, b
BGS: British Geological Survey: Bedrock and Superficial Maps, https://digimap.edina.ac.uk/ (last access: June 2015), 2021. a, b, c, d
Bradley, S. A., Ely, J. E., Clark, C. H., Edwards, R. O., and Shennan, I.: Reconstruction of the palaeo-sea level of Britain and Ireland arising from empirical constraints of ice extent: implications for regional sea level forecasts and North American ice sheet volume, Journal of Quaternary Science, 38, 791–805, https://doi.org/10.1002/jqs.3523, 2023. a
Brasington, J., Vericat, D., and Rychkov, I.: Modeling river bed morphology, roughness, and surface sedimentology using high resolution terrestrial laser scanning, Water Resources Research, 48, 1–18, https://doi.org/10.1029/2012WR012223, 2012. a
Breiman, L.: Random Forests, Tech. rep., https://doi.org/10.1023/A:1010933404324, 2001. a
Buffington, J. M. and Montgomery, D. R.: A systematic analysis of eight decades of incipient motion studies, with special reference to gravel-bedded rivers, Water Resources Research, 33, 1993–2029, https://doi.org/10.1029/96WR03190, 1997. a
Bunte, K. and Abt, S. R.: Sampling surface and subsurface particle-size distributions in wadable gravel-and cobble-bed streams for analyses in sediment transport, hydraulics, and streambed monitoring, Gen. Tech. Rep. RMRS-GTR-74, US Department of Agriculture, Forest Service, p. 428, https://doi.org/10.2737/rmrs-gtr-74, 2001. a, b
Campforts, B., Vanacker, V., Herman, F., Vanmaercke, M., Schwanghart, W., Tenorio, G. E., Willems, P., and Govers, G.: Parameterization of river incision models requires accounting for environmental heterogeneity: insights from the tropical Andes, Earth Surface Dynamics, 8, 447–470, https://doi.org/10.5194/esurf-8-447-2020, 2020. a, b, c
Chardon, V., Piasny, G., and Schmitt, L.: Comparison of software accuracy to estimate the bed grain size distribution from digital images: A test performed along the Rhine River, River Research and Applications, 38, 358–367, https://doi.org/10.1002/rra.3910, 2022. a
Clark, C. D., Ely, J. C., Greenwood, S. L., Hughes, A. L., Meehan, R., Barr, I. D., Bateman, M. D., Bradwell, T., Doole, J., Evans, D. J., Jordan, C. J., Monteys, X., Pellicer, X. M., and Sheehy, M.: BRITICE Glacial Map, version 2: a map and GIS database of glacial landforms of the last British–Irish Ice Sheet, Boreas, 47, 11–e8, https://doi.org/10.1111/bor.12273, 2018. a
Clubb, F. J., Mudd, S. M., Schildgen, T. F., van der Beek, P. A., Devrani, R., and Sinclair, H. D.: Himalayan valley-floor widths controlled by tectonically driven exhumation, Nature Geoscience, 16, 739–746, https://doi.org/10.1038/s41561-023-01238-8, 2023. a, b
Detert, M. and Weitbrecht, V.: User guide to gravelometric image analysis by BASEGRAIN, Advances in Science and Research, 1789–1796, https://doi.org/10.5905/ethz-1007-347, 2013. a
Egholm, D. L., Knudsen, M. F., and Sandiford, M.: Lifespan of mountain ranges scaled by feedbacks between landsliding and erosion by rivers, Nature, 498, 475–478, https://doi.org/10.1038/nature12218, 2013. a
Finnegan, N. J., Roe, G., Montgomery, D. R., and Hallet, B.: Controls on the channel width of rivers: Implications for modeling fluvial incision of bedrock, Geology, 33, 229–232, https://doi.org/10.1130/G21171.1, 2005. a
Firth, C. R. and Stewart, I. S.: Postglacial tectonics of the Scottish glacio-isostatic uplift centre, Quaternary Science Reviews, 19, 1469–1493, https://doi.org/10.1016/S0277-3791(00)00074-3, 2000. a
Gomez, B., Rosser, B. J., Peacock, D. H., Hicks, D. M., and Palmer, J. A.: Downstream fining in a rapidly aggrading gravel bed river, Water Resources Research, 37, 1813–1823, https://doi.org/10.1029/2001WR900007, 2001. a
Haddadchi, A., Booker, D. J., and Measures, R. J.: Predicting river bed substrate cover proportions across New Zealand, Catena, 163, 130–146, https://doi.org/10.1016/j.catena.2017.12.014, 2018. a, b
Harvey, E. L., Hales, T. C., Hobley, D. E., Liu, J., and Fan, X.: Measuring the grain-size distributions of mass movement deposits, Earth Surface Processes and Landforms, 47, 1599–1614, https://doi.org/10.1002/esp.5337, 2022. a
Jansen, J. D., Codilean, A. T., Bishop, P., and Hoey, T. B.: Scale dependence of lithological control on topography: Bedrock channel geometry and catchment morphometry in western Scotland, Journal of Geology, 118, 223–246, https://doi.org/10.1086/651273, 2010. a
Johnson, S. E., Swallom, M. L., Thigpen, R., McGlue, M., Dortch, J. M., Gallen, S., Woolery, E., and Yeager, K. M.: The influence of glacial topography on fluvial efficiency in the Teton Range, Wyoming (USA), Earth and Planetary Science Letters, 592, https://doi.org/10.1016/j.epsl.2022.117643, 2022. a
Kellerhals, R. and Bray, D. I.: Sampling Procedures for Coarse Fluvial Sediments, Journal of the Hydraulics Division, 97, 1165–1180, https://doi.org/10.1061/JYCEAJ.0003044, 1971. a, b, c, d, e, f, g
Lai, L. S.-H., Roering, J. J., Finnegan, N. J., Dorsey, R. J., and Yen, J.-Y.: Coarse sediment supply sets the slope of bedrock channels in rapidly uplifting terrain: Field and topographic evidence from eastern Taiwan, Earth Surface Processes and Landforms, 46, 2671–2689, 2021. a
Lehner, B. and Grill, G.: Global river hydrography and network routing: Baseline data and new approaches to study the world's large river systems, Hydrological Processes, 27, 2171–2186, https://doi.org/10.1002/hyp.9740, 2013. a, b
Li, T., Fuller, T. K., Sklar, L. S., Gran, K. B., and Venditti, J. G.: A Mechanistic Model for Lateral Erosion of Bedrock Channel Banks by Bedload Particle Impacts, Journal of Geophysical Research: Earth Surface, 125, https://doi.org/10.1029/2019JF005509, 2020a. a
Li, T., Fuller, T. K., Sklar, L. S., Gran, K. B., and Venditti, J. G.: A Mechanistic Model for Lateral Erosion of Bedrock Channel Banks by Bedload Particle Impacts, Journal of Geophysical Research: Earth Surface, 125, https://doi.org/10.1029/2019JF005509, 2020b. a
Mason, R. J. and Polvi, L. E.: Unravelling fluvial versus glacial legacy controls on boulder-bed river geomorphology for semi-alluvial rivers in Fennoscandia, Earth Surface Processes and Landforms, 48, 2900–2919, https://doi.org/10.1002/esp.5666, 2023. a, b
Matthews, B., Naylor, M., Sinclair, H., Black, A., Williams, R., Cuthill, C., Gervais, M., Dietze, M., and Smith, A.: Sounding out the river: Seismic and hydroacoustic monitoring of bedload transport, Earth Surface Processes and Landforms, https://doi.org/10.1002/esp.5940, 2024. a
Messager, M. L., Lehner, B., Grill, G., Nedeva, I., and Schmitt, O.: Estimating the volume and age of water stored in global lakes using a geo-statistical approach, Nature Communications, 7, 1–11, https://doi.org/10.1038/ncomms13603, 2016. a, b
Miazza, R., Pascal, I., and Ancey, C.: Automated grain sizing from uncrewed aerial vehicles imagery of a gravel‐bed river: Benchmarking of three object‐based methods, Earth Surface Processes and Landforms, https://doi.org/10.1002/esp.5782, 2024. a
Moussavi-Harami, R., Mahboubi, A., and Khanehbad, M.: Analysis of controls on downstream fining along three gravel-bed rivers in the Band-e-Golestan drainage basin NE Iran, Geomorphology, 61, 143–153, https://doi.org/10.1016/j.geomorph.2003.12.005, 2004. a
Mudd, S., Clubb, F., Grieve, S., Milodowski, D., Gailleton, B., Hurst, M., Valters, D., Wickert, A., and Hutton, E.: LSDtopotools/LSDTopoTools2: LSDTopoTools2 v0.8, Zenodo [code], https://doi.org/10.5281/ZENODO.7892465, 2023. a, b
Mueller, E. R. and Pitlick, J.: Sediment supply and channel morphology in mountain river systems: 1. Relative importance of lithology, topography, and climate, Journal of Geophysical Research: Earth Surface, 118, 2325–2342, https://doi.org/10.1002/2013JF002843, 2013. a
Mueller, E. R. and Pitlick, J.: Sediment supply and channel morphology in mountain river systems: 2. Single thread to braided transitions, Journal of Geophysical Research: Earth Surface, 119, 1516–1541, https://doi.org/10.1002/2013JF003045, 2014. a
Mugodo, J., Kennard, M., Liston, P., Nichols, S., Linke, S., Norris, R. H., and Lintermans, M.: Local stream habitat variables predicted from catchment scale characteristics are useful for predicting fish distribution, Hydrobiologia, 572, 59–70, https://doi.org/10.1007/s10750-006-0252-7, 2006. a, b
Neely, A. B. and DiBiase, R. A.: Drainage area, bedrock fracture spacing, and weathering controls on landscape-scale patterns in surface sediment grain size, Earth and Space Science Open Archive [preprint], 1–22, https://doi.org/10.1002/essoar.10502617.1, 2020. a
Ordnance Survey: OS Terrain 5, https://digimap.edina.ac.uk (last access: 1 November 2021), 2021. a, b
Parker, G.: Selective Sorting and Abrasion of River Gravel. I: Theory, Journal of Hydraulic Engineering, 117, 131–147, 1991. a
Prasicek, G., Larsen, I. J., and Montgomery, D. R.: Tectonic control on the persistence of glacially sculpted topography, Nature Communications, 6, https://doi.org/10.1038/ncomms9028, 2015. a
Purinton, B. and Bookhagen, B.: Introducing PebbleCounts: a grain-sizing tool for photo surveys of dynamic gravel-bed rivers, Earth Surface Dynamics, 7, 859–877, https://doi.org/10.5194/esurf-7-859-2019, 2019a. a, b, c, d, e
Purinton, B. and Bookhagen, B.: PebbleCounts: a Python grain-sizing algorithm for gravel-bed river imagery. V. 1.0, GFZ Data Services, https://doi.org/10.5880/fidgeo.2019.007 (last access: 30 January 2024), 2019b. a
Purinton, B. and Bookhagen, B.: Tracking downstream variability in large grain‐size distributions in the south‐central Andes, Journal of Geophysical Research: Earth Surface, 1–29, https://doi.org/10.1029/2021jf006260, 2021. a, b
Reid, D. A., Hassan, M. A., and McCleary, R.: Glacial landscape configuration influences channel response to flooding, Earth Surface Processes and Landforms, 47, 209–227, https://doi.org/10.1002/esp.5240, 2022. a, b
Rice, S. and Church, M.: Grain size along two gravel-bed rivers: Statistical variation, spatial pattern and sedimentary links, Earth Surface Processes and Landforms, 23, 345–363, https://doi.org/10.1002/(SICI)1096-9837(199804)23:4<345::AID-ESP850>3.0.CO;2-B, 1998. a
Shennan, I., Milne, G., and Bradley, S.: Late Holocene relative land- and sea-level changes: Providing information for stakeholders, GSA Today, 19, 52–53, https://doi.org/10.1130/GSATG50GW.1, 2009. a
Shields, A.: Application of similarity principles and turbulence research for bed-load movement, Mitteilungen der preussischen Versuchsanstalt für Wasserbau und Schiffbuar, https://resolver.tudelft.nl/uuid:a66ea380-ffa3-449b-b59f-38a35b2c6658 (last access: 3 February 2026), 1936. a
Sklar, D. W.: Sediment and rock strength controls on river incision into bedrock, Geology, 29, 1087–1090, https://doi.org/10.1130/0091-7613(2001)029<1087:SARSCO>2.0.CO, 2001. a
Sklar, L. S.: Grain Size in Landscapes, Annu. Rev. Earth Planet. Sc., 52, https://doi.org/10.1146/annurev-earth-052623-075856, 2024. a, b
Sklar, L. S. and Dietrich, W. E.: A mechanistic model for river incision into bedrock by saltating bed load, Water Resources Research, 40, 1–22, https://doi.org/10.1029/2003WR002496, 2004. a
Sklar, L. S., Dietrich, W. E., Foufoula-Georgiou, E., Lashermes, B., and Bellugi, D.: Do gravel bed river size distributions record channel network structure?, Water Resources Research, 42, 1–22, https://doi.org/10.1029/2006WR005035, 2006. a, b, c, d
Sklar, L. S., Riebe, C. S., Marshall, J. A., Genetti, J., Leclere, S., Lukens, C. L., and Merces, V.: The problem of predicting the size distribution of sediment supplied by hillslopes to rivers, Geomorphology, 277, 31–49, https://doi.org/10.1016/j.geomorph.2016.05.005, 2017. a, b, c
Sklar, L. S., Riebe, C. S., Genetti, J., Leclere, S., and Lukens, C. E.: Downvalley fining of hillslope sediment in an alpine catchment: implications for downstream fining of sediment flux in mountain rivers, Earth Surface Processes and Landforms, 45, 1828–1845, https://doi.org/10.1002/esp.4849, 2020. a
Snelder, T. H., Lamouroux, N., and Pella, H.: Empirical modelling of large scale patterns in river bed surface grain size, Geomorphology, 127, 189–197, https://doi.org/10.1016/j.geomorph.2010.12.015, 2011. a, b, c, d, e, f, g, h, i, j, k, l, m, n, o
Sternberg, H.: Untersuchungen uber langen-und Querprofil geschiebefuhrender flusse, Zeitshrift fur Bauwesen, 25, 483–506, https://cir.nii.ac.jp/crid/1572824500838774016 (last access: 1 May 2025), 1875. a
Towers, A. H., Mudd, S. M., Attal, M., Clubb, F. J., Binnie, S. A., Dunai, T. J., and Haghipour, N.: Denudation rates and Holocene sediment storage dynamics inferred from in situ 14C concentrations in the Feshie basin, Scotland, Earth Surface Processes and Landforms, 50, e70043, https://doi.org/10.1002%2Fesp.70043, 2025. a, b, c, d, e, f, g
Wells, T., Hancock, G., and Fryer, J.: Weathering rates of sandstone in a semi-arid environment (Hunter Valley, Australia), Environmental Geology, 54, 1047–1057, https://doi.org/10.1007/s00254-007-0871-y, 2008. a
Westoby, M. J., Dunning, S. A., Woodward, J., Hein, A. S., Marrero, S. M., Winter, K., and Sugden, D. E.: Instruments and methods: Sedimentological characterization of Antarctic moraines using uavs and Structure-from-Motion photogrammetry, Journal of Glaciology, 61, 1088–1102, https://doi.org/10.3189/2015JoG15J086, 2015. a
Whitaker, A. C. and Potts, D. F.: Analysis of flow competence in an alluvial gravel bed stream, Dupuyer Creek, Montana, Water Resources Research, 43, 1–16, https://doi.org/10.1029/2006WR005289, 2007. a, b, c, d, e, f
Whitbread, K., Jansen, J., Bishop, P., and Attal, M.: Substrate, sediment, and slope controls on bedrock channel geometry in postglacial streams, Journal of Geophysical Research: Earth Surface, 120, 779–798, https://doi.org/10.1130/B35334.1, 2015. a, b, c, d, e
Whitbread, K., Thomas, C., and Finlayson, A.: The influence of bedrock faulting and fracturing on sediment availability and Quaternary slope systems, Talla, Southern Uplands, Scotland, UK, Proceedings of the Geologists' Association, 135, 61–77, https://doi.org/10.1016/j.pgeola.2023.11.003, 2024. a
Whittaker, A. C.: How do landscapes record tectonics and climate?, Lithosphere, 4, 160–164, https://doi.org/10.1130/RF.L003.1, 2012. a
Whittaker, A. C., Attal, M., and Allen, P. A.: Characterising the origin, nature and fate of sediment exported from catchments perturbed by active tectonics, Basin Research, 22, 809–828, https://doi.org/10.1111/j.1365-2117.2009.00447.x, 2010. a, b, c
Wolman, M. G.: A method of sampling coarse river‐bed material, Eos, Transactions American Geophysical Union, 35, 951–956, https://doi.org/10.1029/TR035i006p00951, 1954. a
Zomer, R. J., Xu, J., and Trabucco, A.: Version 3 of the Global Aridity Index and Potential Evapotranspiration Database, Scientific Data, 9, 1–15, https://doi.org/10.1038/s41597-022-01493-1, 2022. a, b