the Creative Commons Attribution 4.0 License.
the Creative Commons Attribution 4.0 License.
 | 23 Nov 2018
Impacts of a large flood along a mountain river basin: the importance of channel widening and estimating the large wood budget in the upper Emme River (Switzerland)
Virginia Ruiz-Villanueva
Alexandre Badoux
Dieter Rickenmann
Martin Böckli
Salome Schläfli
Nicolas Steeb
Markus Stoffel
Christian Rickli
On 24 July 2014, an exceptionally large flood (recurrence interval ca. 150 years) caused large-scale inundations, severe overbank sedimentation, and damage to infrastructure and buildings along the Emme River (central Switzerland). Widespread lateral bank erosion occurred along the river, thereby entraining sediment and large wood (LW) from alluvial forest stands. This work analyzes the catchment response to the flood in terms of channel widening and LW recruitment and deposition, but also identifies the factors controlling these processes. We found that hydraulic forces (e.g., stream power index) or geomorphic variables (e.g., channel width, gradient, valley confinement), if considered alone, are not sufficient to explain the flood response. Instead, the spatial variability of channel widening was first driven by precipitation and secondly by geomorphic variables (e.g., channel width, gradient, confinement, and forest length). LW recruitment was mainly caused by channel widening (lateral bank erosion) and thus indirectly driven by precipitation. In contrast, LW deposition was controlled by channel morphology (mainly channel gradient and width). However, we also observed that extending the analysis to the whole upper catchment of the Emme River by including all the tributaries and not only to the most affected zones resulted in a different set of significant explanatory or correlated variables. Our findings highlight the need to continue documenting and analyzing channel widening after floods at different locations and scales for a better process understanding. The identification of controlling factors can also contribute to the identification of critical reaches, which in turn is crucial for the forecasting and design of sound river basin management strategies.
- Article
(6281 KB) - Full-text XML
-
Supplement
(1314 KB) - BibTeX
- EndNote


Floods in mountain river basins are characterized by complex, intense meteorological events and equally complex process coupling between the hillslopes and channels (i.e., debris flows, debris floods, and floods), resulting in a high spatial variability of morphological responses (Harvey, 1986; Miller, 1990; Lapointe et al., 1998; Magilligan et al., 1998; Heritage et al., 2004; Arnaud-Fassetta, 2013; Savi et al., 2013; Thompson and Croke, 2013; Rickenmann et al., 2016). During high-intensity events, mass-movement processes (e.g., landslides, debris flows) may affect channel morphology and sediment supply, influencing the total sediment load during a flood (Lin et al., 2008). In forested areas, mass movements and bank erosion not only deliver large amounts of inorganic sediment, but also introduce large quantities of wood into the channel corridor. As a load component in forested rivers, large wood (defined as wood pieces exceeding 10 cm in diameter and 1 m in length; LW) can be placed in a similar framework to that used for sediment, whereby LW recruitment, transport, and deposition are the main processes to be understood as part of the LW budgeting (Gurnell, 2007). Large wood is a key component of stream ecosystems (Ruiz-Villanueva et al., 2016, and references within); however, LW and sediment in channels can also favor the creation of temporary dams and subsequently produce secondary flood pulses, thereby enhancing erosion and/or leading to the destruction of infrastructure along the channel (Cenderelli and Kite, 1998; Wohl et al., 2010; Ruiz-Villanueva et al., 2014). Flood damage and flood losses are intrinsic to the occurrence of major floods (Merritts, 2011). However, urbanization, an increase in impervious surfaces (Hollis, 1975), and river channelization or embankment constructions (Wyżga, 1997) are frequently invoked to explain the high economic losses caused by major flood events (Hajdukiewicz et al., 2015). Under such conditions, even frequent floods (i.e., lower-magnitude events) can lead to unexpectedly high damage.
Over the last decades, several major flood events occurred in different parts of Switzerland (e.g., August 1978, August 1987, September 1993, May 1999, October 2000, August 2005, and August 2007; Hilker et al., 2009; Badoux et al., 2014), thereby causing significant financial damage and costs. The August 2005 flood, which was by far the costliest natural disaster in Switzerland since the start of systematic records in 1972 (Hilker et al., 2009), claimed six lives and caused total financial damage exceeding CHF 3 billion. The dominant processes observed during this event were flooding, bank erosion, overbank sedimentation, landslides, and debris flows (Rickenmann and Koschni, 2010; Rickenmann et al., 2016). Moreover, the transport and deposition of more than 69 000 m3 of LW along alpine and pre-alpine rivers has been recorded (Steeb et al., 2017; Rickli et al., 2018). The consequences of events like the one in 2005 pose threats to important infrastructure such as roads and settlements, and therefore these processes need to be better understood and quantified to provide a process understanding and improved preparedness. However, predicting the impacts of major floods on the fluvial system is very challenging and requires a wide range of analyses (Rinaldi et al., 2016; Surian et al., 2016). Some of the most recent studies in the field have focused on the (i) reconstruction of the hydrological event (e.g., Gaume et al., 2004), an (ii) analysis of flood hydraulic variables (e.g., Howard and Dolan, 1981; Miller, 1990; Wohl et al., 1994; Benito, 1997; Heritage et al., 2004; Thompson and Croke, 2013), (iii) hillslope processes and channel connectivity (e.g., Bracken et al., 2015; Croke et al., 2013; Wohl, 2017), (iv) geomorphic and sedimentological analysis of flood deposits (e.g., Wells and Harvey, 1987; Macklin et al., 1992), (v) quantification of morphological changes (e.g., Arnaud-Fassetta et al., 2005; Krapesch et al., 2011; Thompson and Croke, 2013; Comiti et al., 2016; Surian et al., 2016; Righini et al., 2017), (vi) sediment budgeting (e.g., Milan, 2012; Thompson and Croke, 2013), or, more recently, (vii) the study of LW dynamics and budgeting (e.g., Lucía et al., 2015; Steeb et al., 2017).
Post-event surveys are invaluable when it comes to improving insights on flood-related processes (Gaume and Borga, 2008; Marchi et al., 2009; Rinaldi et al., 2016) such as LW recruitment and factors controlling LW deposition, which are both crucial for the proper management of river basins and flood hazard mitigation (Comiti et al., 2016). Despite this fact, analyses of LW dynamics after flood events remain quite rare (Comiti et al., 2016). We added this important component (i.e., LW dynamics) to the hydrometeorological and geomorphological post-event survey after the July 2014 flood in the Emme River. We focused on morphological changes (in terms of channel widening), the coupling between hillslopes and headwaters to the main channel, the supply of large quantities of LW, and its deposition through the river corridor. We analyzed the whole upper catchment of the Emme River, including all tributaries and not only the ones that were most affected in July 2014. By doing so we aimed at unraveling diverging responses among the different tributaries and river segments in terms of channel widening and LW dynamics. In terms of morphology, similar river sub-reaches may have responded differently to the flood, and we hypothesized that these differences could be explained by morphological and hydrometeorological parameters. To test this hypothesis we selected different morphological and hydrometeorological variables, such as channel gradient, channel sinuosity, drainage area, confinement index, forested channel length, and stream power, to identify the factors controlling channel widening, LW recruitment, and LW deposition. The geomorphic response of the catchment and the initiation of processes such as LW recruitment due to mass movements or bank erosion might be driven by precipitation, among other variables (e.g., discharge, channel width, depth, and gradient). However, the rainfall patterns and subsequent disturbance regimes that influence the temporal variation in LW export in a given watershed network are not yet fully understood (Seo et al., 2012, 2015). Therefore, we include the event precipitation as an explanatory variable in our analysis. We hypothesize that differences in the spatial precipitation pattern would have led to differences in channel widening, thereby regulating LW dynamics.
2.1 The Emme River basin
The Emme River has its origin in the Swiss pre-Alps (1400 m a.s.l.) and runs through the Emmental in the cantons of Lucerne and Bern in central Switzerland. The total drainage area at its mouth with the Aare River (near the city of Solothurn) is 963 km2, with a stream length of 80 km. This work focuses on the upper Emme River basin (Fig. 1), including the uppermost tributaries to the inlet of the Emme River into a gorge called Räbloch. At this point, the Emme River basin has a drainage area of 94 km2 and the network is formed by 19 streams (18 tributaries and the main branch of the Emme; Table 1). These 19 streams were further divided into 64 sub-reaches (lengths ranging between 36 and 5238 m, mean value 837 m) as explained in Sect. 2.3.2 (see also Fig. S1 in the Supplement). The only existing stream gauge in the area is located at Eggiwil station (Fig. 1; 745 m a.s.l. with a drainage area of 124 km2), which is several kilometers downstream of the Räbloch gorge.
The geology of the basin (Fig. 1c) is composed mainly of Helvetic marginal limestone, the Ultrahelvetian flysch (with marls and sandstones), and sub-alpine molasse composed of sandstone, molasse conglomerates, and marls (Lehmann, 2001). During the Pleistocene glaciation, a large part of the Emmental was covered by glaciers, and moraine remains are preserved in the areas of Eggiwil, Oberburg, and Burgdorf. The Emme basin is extensively occupied by agricultural lands (50 %, mostly downstream); 40 % of the surface remains forested today, and only about 10 % is urbanized (Fig. 1b). The climate is temperate with moderate warm summers (the mean temperature in July is 16 ∘C according to the Langnau data series from 1931–2015; Federal Office of Meteorology and Climatology MeteoSwiss) and cold winters (mean temperature −1 ∘C in January). Total annual precipitation averaged 1315 mm at the station of Langnau (1901–2015), with mean monthly peaks in June of 160 mm. The flow regime of the Emme River is characterized by a seasonally fluctuating flow due to snowmelt in spring and thunderstorms in summer.
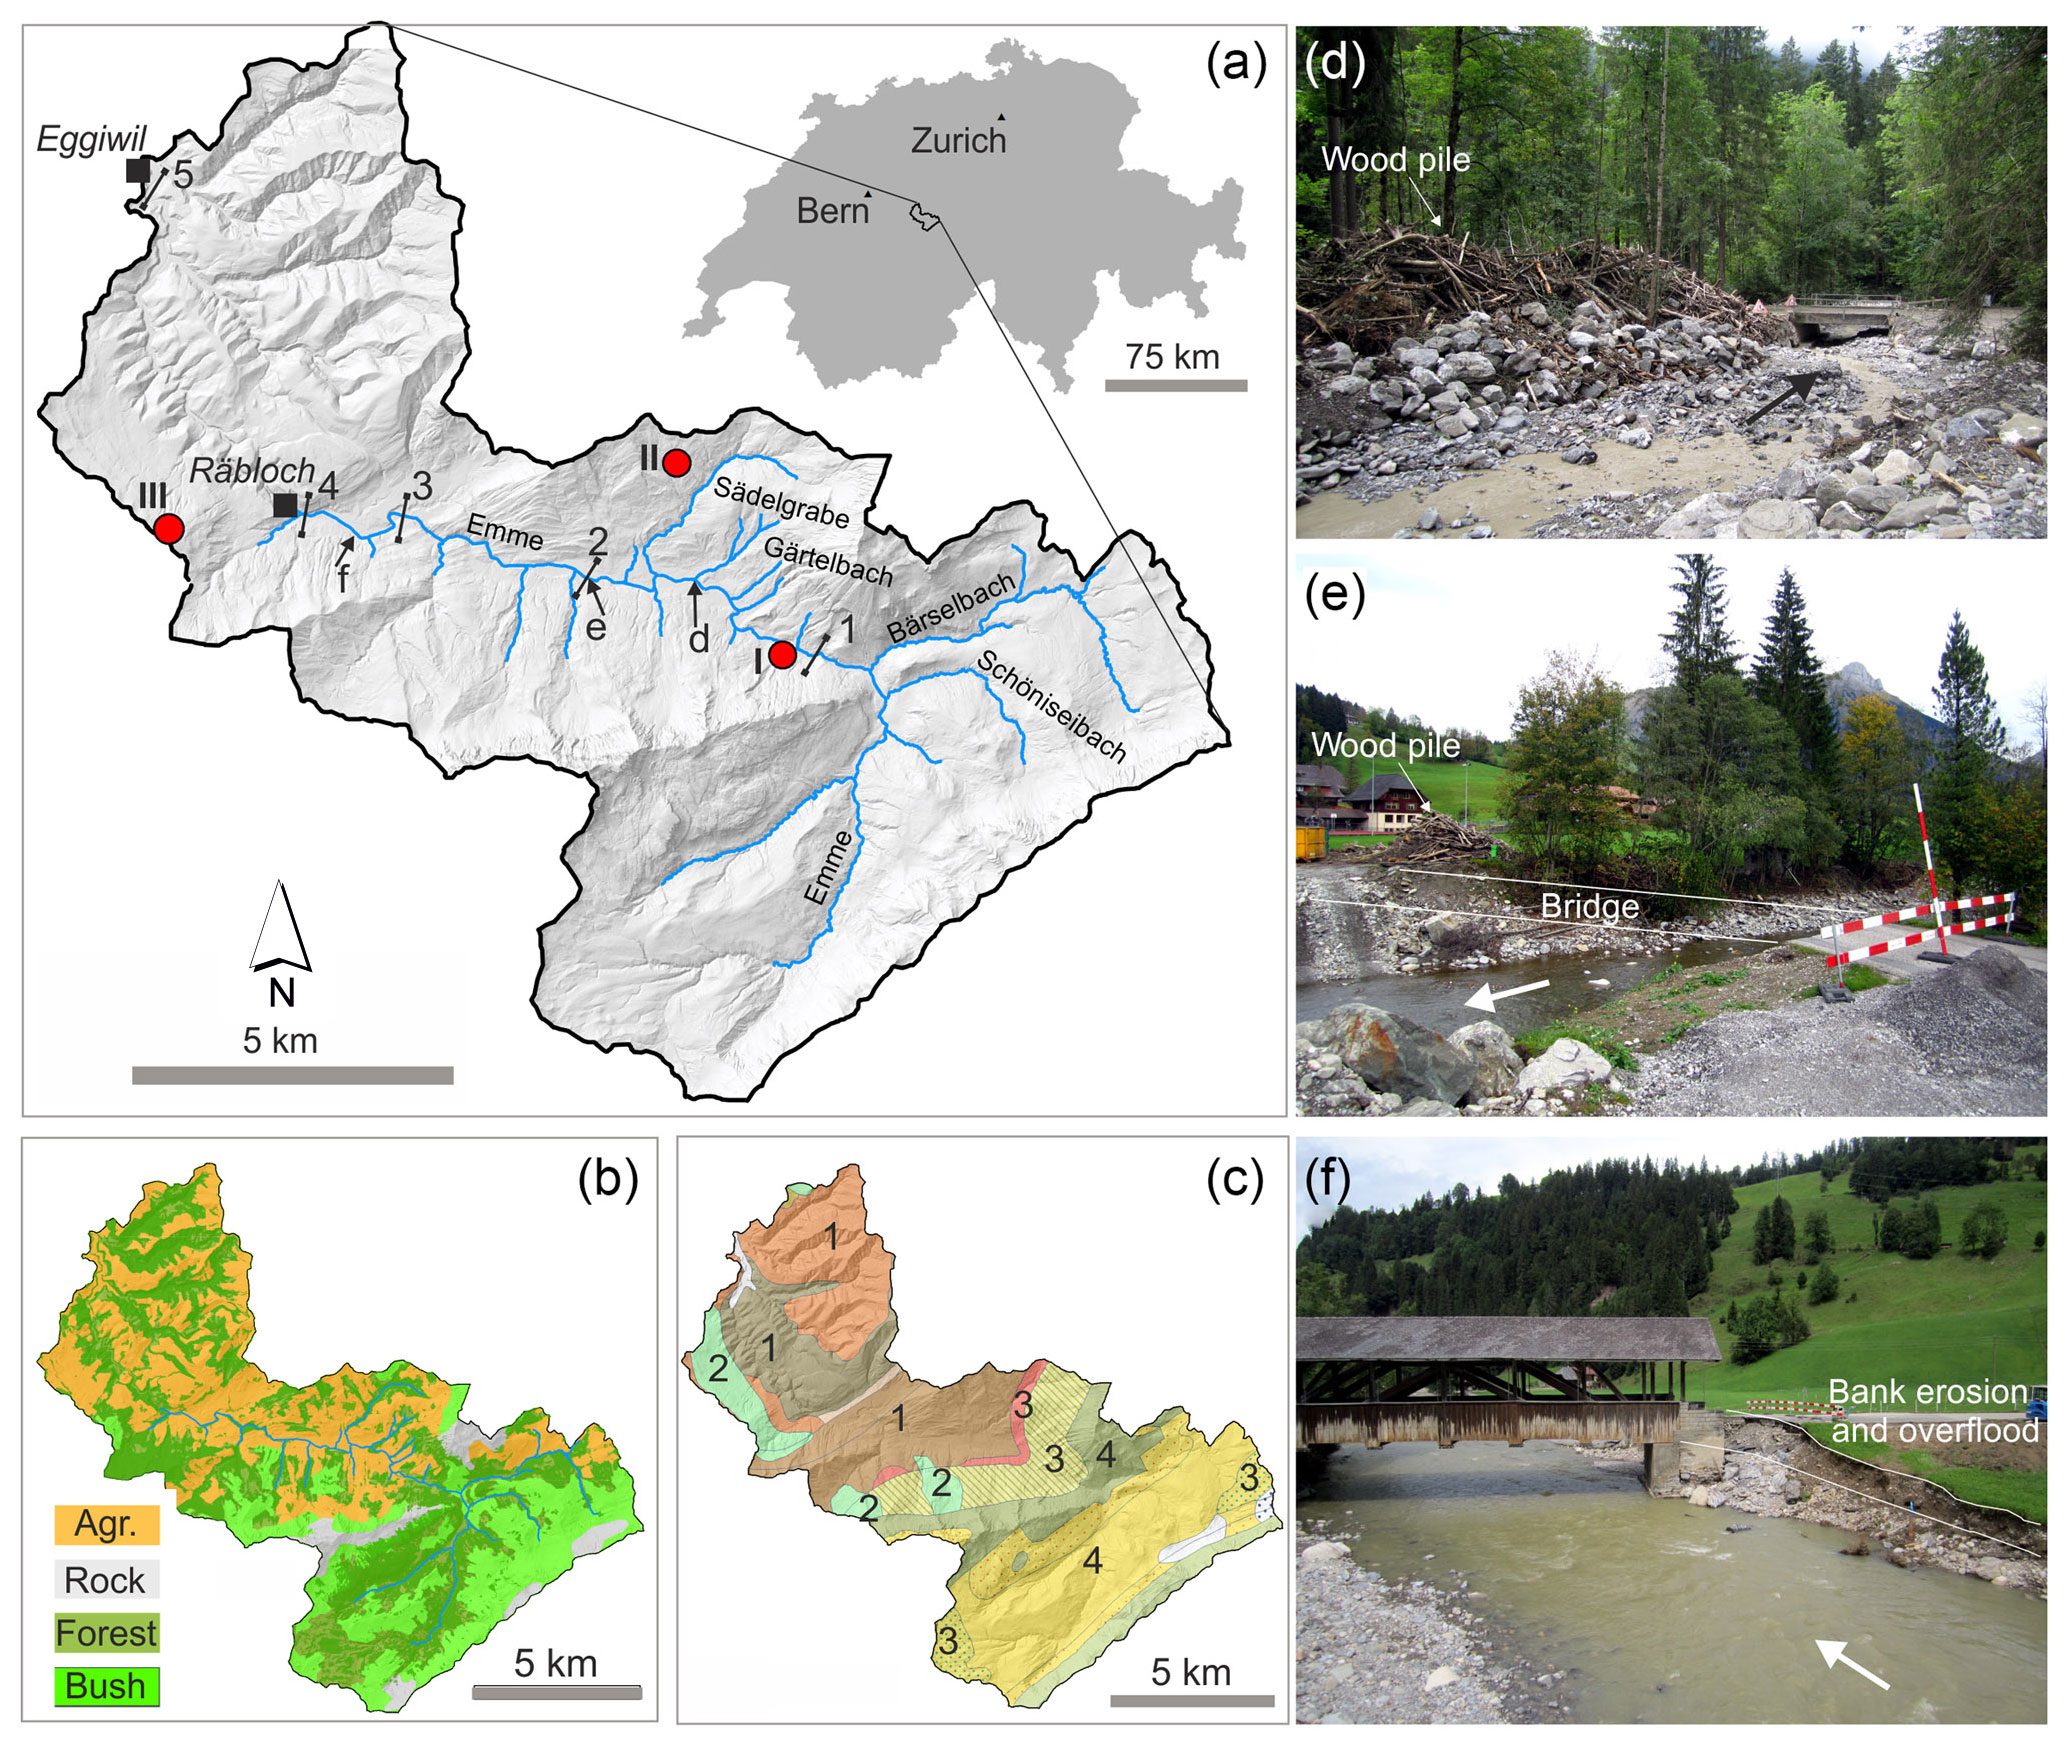
Figure 1Location of the basin in central Switzerland. The coordinate system used was CH1903 ∕ LV03. (a) Hill shade of the upper Emme River basin (up to Eggiwil); red dots show the location of the rain gauges (I: Kemmeriboden; II: Marbachegg; III: Schallenberg), and blue lines show the 19 streams analyzed (18 tributaries and the main river Emme). (b) Land use. Agr.: agriculture; rock: bare soil; forest; bush: shrubs and bushes. (c) Geology: 1 Quaternary and Neogene molasses; 2 moraines; 3 Paleogene flysch; 4 Cretaceous and Jurassic sedimentary rocks. (d) Debris flood and LW deposits in the lower part of the Sädelgrabe torrent upstream of the small road bridge and its confluence with the Emme River (photograph: Virginia Ruiz-Villanueva). (e) Road and bridge washed away during the flood in Bumbach (photograph: Virginia Ruiz-Villanueva). (f) Räbeli bridge damaged during the flood (photograph: Virginia Ruiz-Villanueva). Numbers from 1 to 5 (a) show the cross sections described in Table 2. Arrows (d, e, f) show the flow direction.
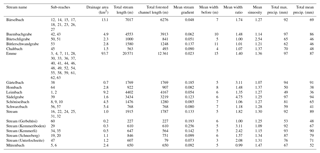
Table 1Overview of the 19 study streams, the sub-reaches in each stream, morphological characteristics (mean: averaged or total values), and total maximum and mean precipitation registered during the event in 2014 at each sub-catchment (explained in the text).
A history of severe flooding led to intensive river management activities in the 19th and 20th centuries with the construction of dams and weirs. These measures also resulted in the isolation of tributaries and low sediment transport (Fig. S2). Additionally, poor riparian conditions and water extractions for irrigation strongly influenced Emme River hydrology (Burkhardt-Holm and Scheurer, 2007).
2.2 The 24 July 2014 flood event
July 2014 was a very wet month in Switzerland, with frequent and extensive rainfall in the first 3 weeks, interrupted by a few dry intervals. Data from MeteoSwiss showed that the western half of Switzerland registered 2 to 3 times the long-term precipitation average for the month of July 2014 (FOEN, 2015). These wet episodes led to saturated soils, especially in the western and northeastern parts of Switzerland (FOEN, 2015; ARGE LLE Schangnau-Eggiwil, 2015). Between 24 and 28 July 2014, several thunderstorms occurred over different Swiss regions. Until 27 July, the storms were related to a weak pressure system over western Europe (MeteoSwiss, 2017). Generally, such relatively uniform pressure distributions result in light and variable winds at ground level, which allows for the formation of cumulonimbus clouds, typically over regions with rough topography such as the Swiss pre-Alps. On 24 July, an extremely violent stationary thunderstorm developed with a precipitation hotspot located over the upper Emmental. The storm cell caused intense rainfall in the headwater catchments of the upper Emme basin where it triggered very severe floods. According to hourly CombiPrecip data from MeteoSwiss (Sideris et al., 2014), the heavy precipitation yielded maximal hourly values of approximately 65 mm locally (with totals reaching 96 mm during the 7 h event; Fig. 2). Heavy rainfall was largely restricted to the upper Emme catchment with a local maximum just north of the Sädelgrabe catchment. The cantonal rain gauge Marbachegg (red dot II in Fig. 1) that recorded the highest event precipitation value of 76 mm is located roughly 2 km northwest of the confluence of the Sädelgrabe torrent with the Emme River. According to the study entitled ARGE LLE Schangnau-Eggiwil (2015), the rainfall event was associated with a recurrence interval between 100 and 200 years.
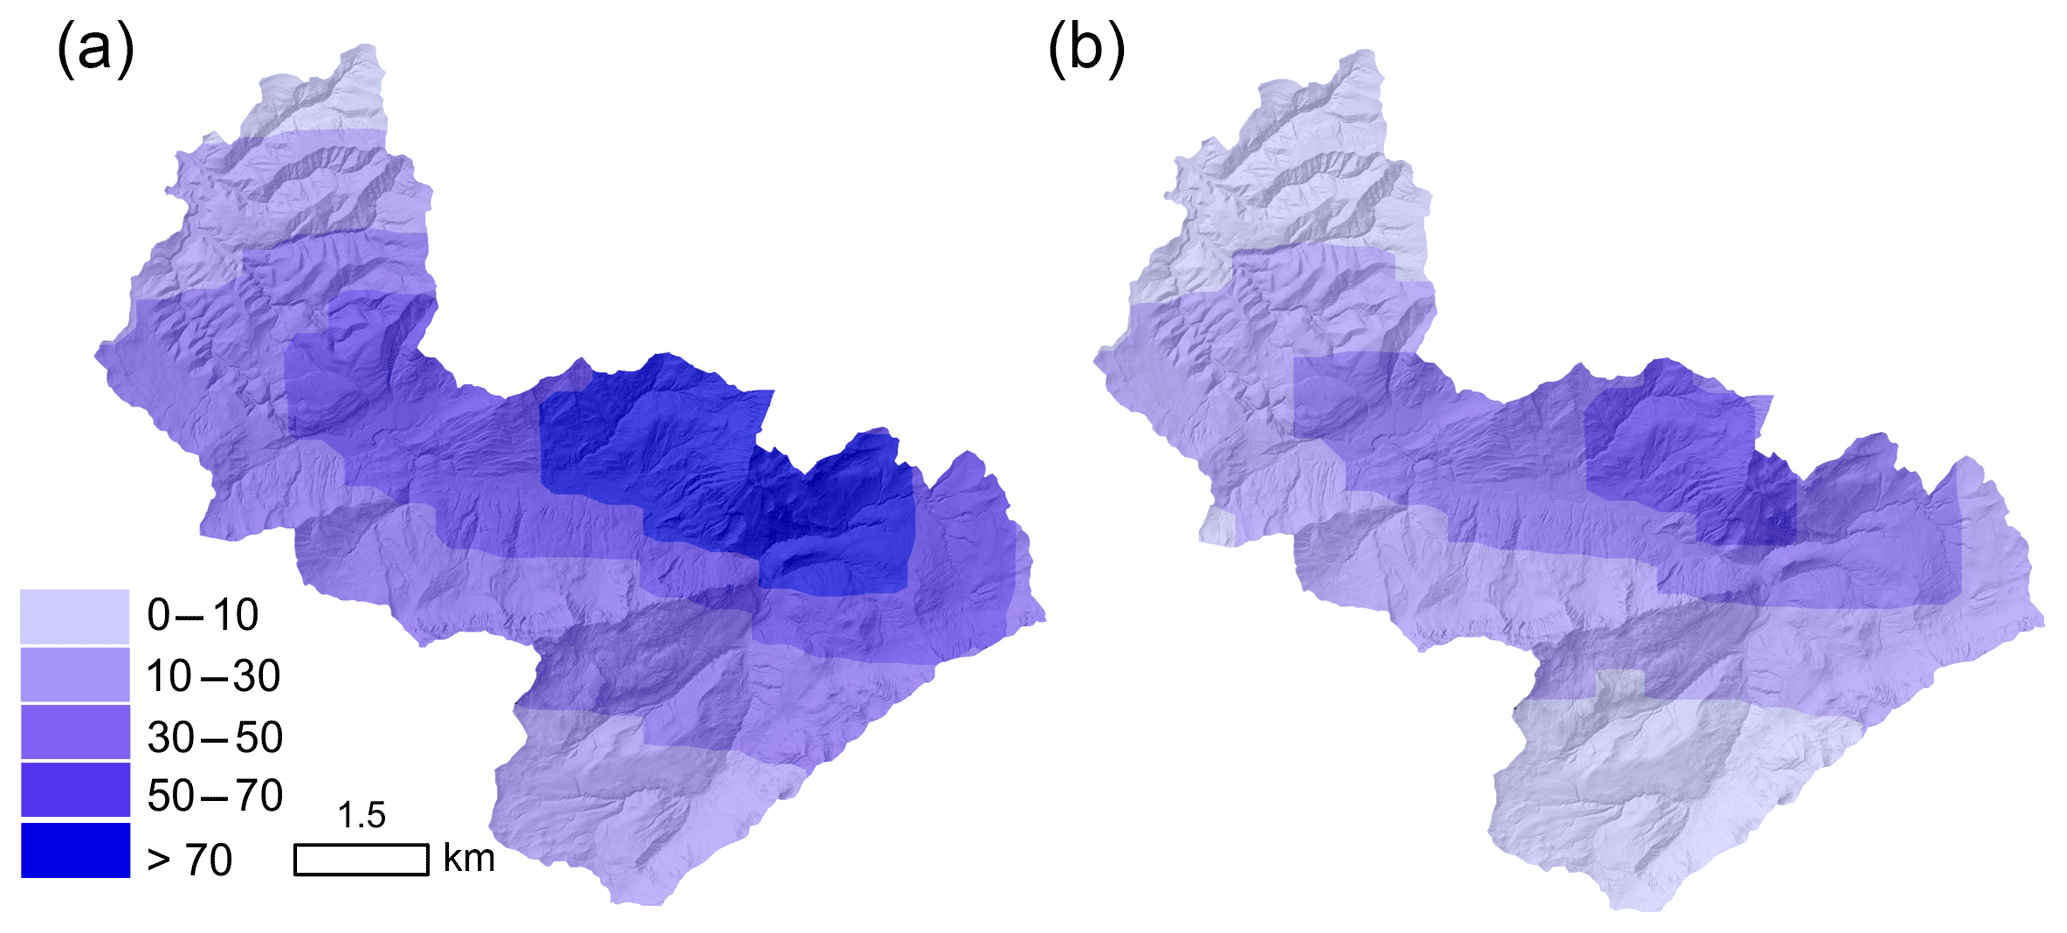
Figure 2Map of the spatial distribution of precipitation (mm) on 24 July 2014 in the upper Emme catchment: (a) total event precipitation (mm) from 04:00 to 17:00 LT; (b) maximum hourly precipitation recorded at 07:00 LT.
Due to the wet soil conditions caused by the antecedent rain, several of the small steep tributaries of the Emme River reacted very quickly to the 24 July 2014 rainstorm. The receiving Emme River produced an exceptionally large flood. The discharge station in Eggiwil (124 km2 catchment area, 38 years of records) registered a peak discharge of 338 m3 s−1, which corresponds to a recurrence interval of ∼150 years (FOEN, 2017). Runoff in Eggiwil rose very quickly and reached a maximum within only a few hours. In the framework of the local post-event analysis, peak values of the Emme runoff upstream of the gauging station Eggiwil were estimated for this flood based on downstream measurements and by using local flood marks (ARGE LLE Schangnau-Eggiwil, 2015; Table 2).
Table 2Peak discharges along the Emme during the 24 July 2014 flood, measured or estimated in the framework of the local event analysis for several sites along the Emme River (data source: ARGE LLE Schangnau-Eggiwil, 2015). Note that the drainage area given here does not precisely correspond to the data in Table 2 because estimates were carried out for which flood marks were available. The locations of these sites are shown in Fig. 1.
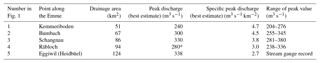
∗ The reduction in discharge at this section is due to the clogging of the Räbloch gorge and related backwater effects.
Hydrographs were reconstructed for Schangnau and Räbloch (ARGE LLE Schangnau-Eggiwil, 2015). Peak discharge amounted to approximately 240 m3 s−1 at Kemmeriboden (51 km2 catchment area). Along our study reach, peak values probably increased until Schangnau where they reached about 330 m3 s−1. In a natural gorge between the villages of Schangnau and Eggiwil (a place called Räbloch; 94 km2 catchment area), the Emme River was impounded due to clogging. A temporary lake formed and according to field surveys peak runoff was reduced to about 280 m3 s−1 (ARGE LLE Schangnau-Eggiwil, 2015).
At the Eggiwil gauging station, a first slight increase in discharge was recorded just after 06:00 LT and runoff reached 50 m3 s−1 (a discharge statistically reached during one day per year based on data from 1975–2016) at approximately 09:00 LT; 5.5 h later, at 14:30 LT, the runoff along the falling limb of the Emme hydrograph decreased below 50 m3 s−1. Peak discharge at Eggiwil was reached at approximately 10:30 LT, about half an hour after the peak occurred at Räbloch. Hence, the 24 July 2014 flood event in the Emme was short. Similarly short floods with a very steep rising hydrograph limb took place in June 1997 (245 m3 s−1) and July 2012 (178 m3 s−1), both caused by very intensive convective rainstorms as well. Further major floods that occurred in the 42 years of measurement were registered in 2005 and 2007 (both with peaks slightly above 175 m3 s−1). However, these events were much longer due to the long-lasting nature of the triggering precipitation event (Bezzola and Hegg, 2007; Bezzola and Ruf, 2009).
The Emme River overflowed at various points in the upper catchment and caused large-scale inundations and severe overbank sedimentation (Fig. 1). Infrastructure, flood protection structures, and buildings were damaged and, in some cases, even destroyed. Moreover, widespread bank erosion occurred all along the Emme River, thereby entraining sediments and wood from alluvial forest stands. The steep torrents produced considerable debris floods and debris flows and transported large amounts of sediment and LW. The two most active torrents (Sädelgrabe and Gärtelbach) overtopped their channels and deposited ample amounts of material on their fans. Near the confluence of the Sädelgrabe and the Emme River, the road was obstructed by several meters of coarse material from the torrents. Furthermore, shallow landslides and hillslope debris flows occurred in steep locations of the upper Emme catchment. The lower part of the Gärtelbach (from an elevation around 1300 m a.s.l.) delivered around 2000 m3 of sediment to the Emme River, most of it recruited in the fluvial corridor, with 5000–7000 m3 of sediment deposited on the fan. The other main sediment source into the Emme River was the Sädelgrabe, where around 2000 m3 of material was deposited in the channel, and around 15 000 m3 of material was deposited on the cone (according to ARGE LLE Schangnau-Eggiwil, 2015). However, more detailed sediment budgeting was outside the scope of our work. Financial damage to private property and infrastructure (e.g., roads, bridges, hydraulic structures) in the worst-affected municipalities of Schangnau and Eggiwil was estimated at approximately CHF 20 million (Andres et al., 2015).
2.3 Methods
2.3.1 Field survey
A post-event survey was carried out right after the flood and during the following weeks. The Swiss Federal Office for the Environment (FOEN) initiated a project to study the recruitment, transport, and deposition of large wood in the upper catchment of the Emme River (Badoux et al., 2015; Böckli et al., 2016; Rickli et al., 2016), in which the main geomorphic effects of the flood were analyzed as well (Zurbrügg, 2015). This project was carried out in close collaboration with the local authorities (ARGE LLE Schangnau-Eggiwil, 2015).
The field survey after the flood focused on the quantification of deposited wood, the identification of recruitment sources, and the identification of changes in planform geometry (i.e., channel widening). The survey was carried out along 9.5 km of the Emme River (the section between 1250 m downstream of the confluence with the Bärselbach stream and the Räbloch gorge) and two of its main tributaries (Sädelgrabe and Gärtelbach), although other tributaries were visited as well. Regarding large wood, source areas (including landslides or debris floods and bank erosion) were identified in the field and mapped using aerial images (see next subsection), and wood deposits were measured in the field (details explained below). Moreover, we noted whether LW from hillslope processes reached the streams, as most of the mass movements were shallow landslides not directly connected to the channel network. However, mass movements were not very common and the main process recruiting LW was bank erosion.
Each piece of LW (length >1 m and diameter >10 cm; Wohl et al., 2010) deposited during the flood along the studied reaches was assigned to a class relative to its mid-length diameter and length (Marcus et al., 2002; Daniels, 2006; Lucía et al., 2015; Rickli et al., 2016); i.e., seven classes were distinguished from <10 to >40 cm in diameter and nine classes from <2 to >16 m for length. Log volume was calculated as solid cylinders (Thévenet et al., 1998). Wood accumulations (i.e., wood jams) were also measured. The wood volume of each jam was calculated geometrically through its area and height (measured in the field), considering a 50–80 % range in porosity (Thévenet et al., 1998). In the tributary catchments where large quantities of wood were deposited, mainly along the Sädelgrabe fan, the extension of wood deposits and the size of accumulations prevented the measurement of individual pieces. Areas with a similar density of wood were identified and plots were measured to estimate total wood volume in the area (see Fig. S3). Most of the recruited wood from the Gärtelbach was deposited along the Emme floodplain. Civil protection services removed some of the wood deposits immediately after the flood, storing the material at two sites close to the river, one near the confluence between the Sädelgrabe and the Emme and another near the Bumbach bridge (Fig. 1). These piles (five in total) were analyzed as well and wood samples were measured to estimate the stored wood volume and wood size distribution (Rickli et al., 2016).
2.3.2 GIS analysis
The field survey was complemented with GIS analyses (using ArcGIS 10.1; ESRI©) with the aim of extending the study to the upper catchment and including all tributaries. The entire upper catchment was analyzed by splitting the stream network into 64 sub-reaches according to the tributary junctions and the location of bridges, as bridges may act as obstacles to the downstream transfer of wood (see Fig. S1, Table 1). A total of 54.5 km of stream network length was analyzed.
For all sub-reaches, we calculated key morphological and hydrological parameters, such as maximum and minimum elevation, channel gradient, channel sinuosity (determined as the ratio between the actual sub-reach length and the straight distance), and drainage area, by using the available DEM (SwissALTI3D, 2 m spatial resolution) for the catchment, the GIS spatial analysis, and GIS hydrological geoprocessing. Other morphological parameters such as valley bottom width were extracted from the DEM using the fluvial corridor tool (Alber and Piégay, 2011; Roux et al., 2014). Moreover, the available aerial orthoimages (Swisstopo) were used to map the active channel before (image from March 2014, resolution 25 cm) and after (image from May 2015, resolution 25 cm) the flood. The post-flood units were also mapped in the field, with a focus on bank erosion and on measurements of the length and width of eroded banks (mostly along the Emme River). GIS measurements were compared and validated with field observations. The width of the active channel before and after the flood and the valley bottom (i.e., alluvial plain) width were calculated at several transects within each sub-reach. The centerline to the pre-flood and post-flood active channel polygon was obtained using the polygon-to-centerline tool (Dilts, 2015) and perpendicular transects were obtained with the transect tool (Ferreira, 2014); width was measured based on these transects. Transects were delineated at approximately regular intervals ranging between 20 and 50 m in length, with a total of 980 transects along the stream network.
We calculated the confinement index (Ci) as the ratio between the valley bottom width (Wvalley) and the initial channel width (pre-flood; Wi),
and the width ratio (Wr) as the ratio between the width of the channel post-flood (Wf) and the pre-flood channel width (Wi), as proposed by Krapesch et al. (2011):
Discharge was not measured except at the outlet of the basin (Eggiwil stream gauge station; Fig. 1), but estimations at other river sections were available (Table 2). Using these data and the drainage area (A) we used a potential equation to estimate peak discharges at all sub-reaches.
Because the estimates using Eq. (3) were relatively uncertain, stream power was not calculated using the estimated peak discharge of the flood; instead, we used the stream power index (SPI) proposed by Marchi and Dalla Fontana (2005) calculated as the product of the channel slope (S) and the square root of the drainage area (A).
The spatial and temporal distribution of the precipitation was available from the CombiPrecip database recorded by MeteoSwiss, which is calculated using a geostatistical combination of rain gauge measurements and radar estimates with a regular grid of 1 km resolution (Sideris et al., 2014). For each sub-reach the drainage area was computed as explained above, and the hourly and cumulative total mean and total maximum values (i.e., the mean and maximum value of the total precipitation registered at each sub-catchment) were calculated.
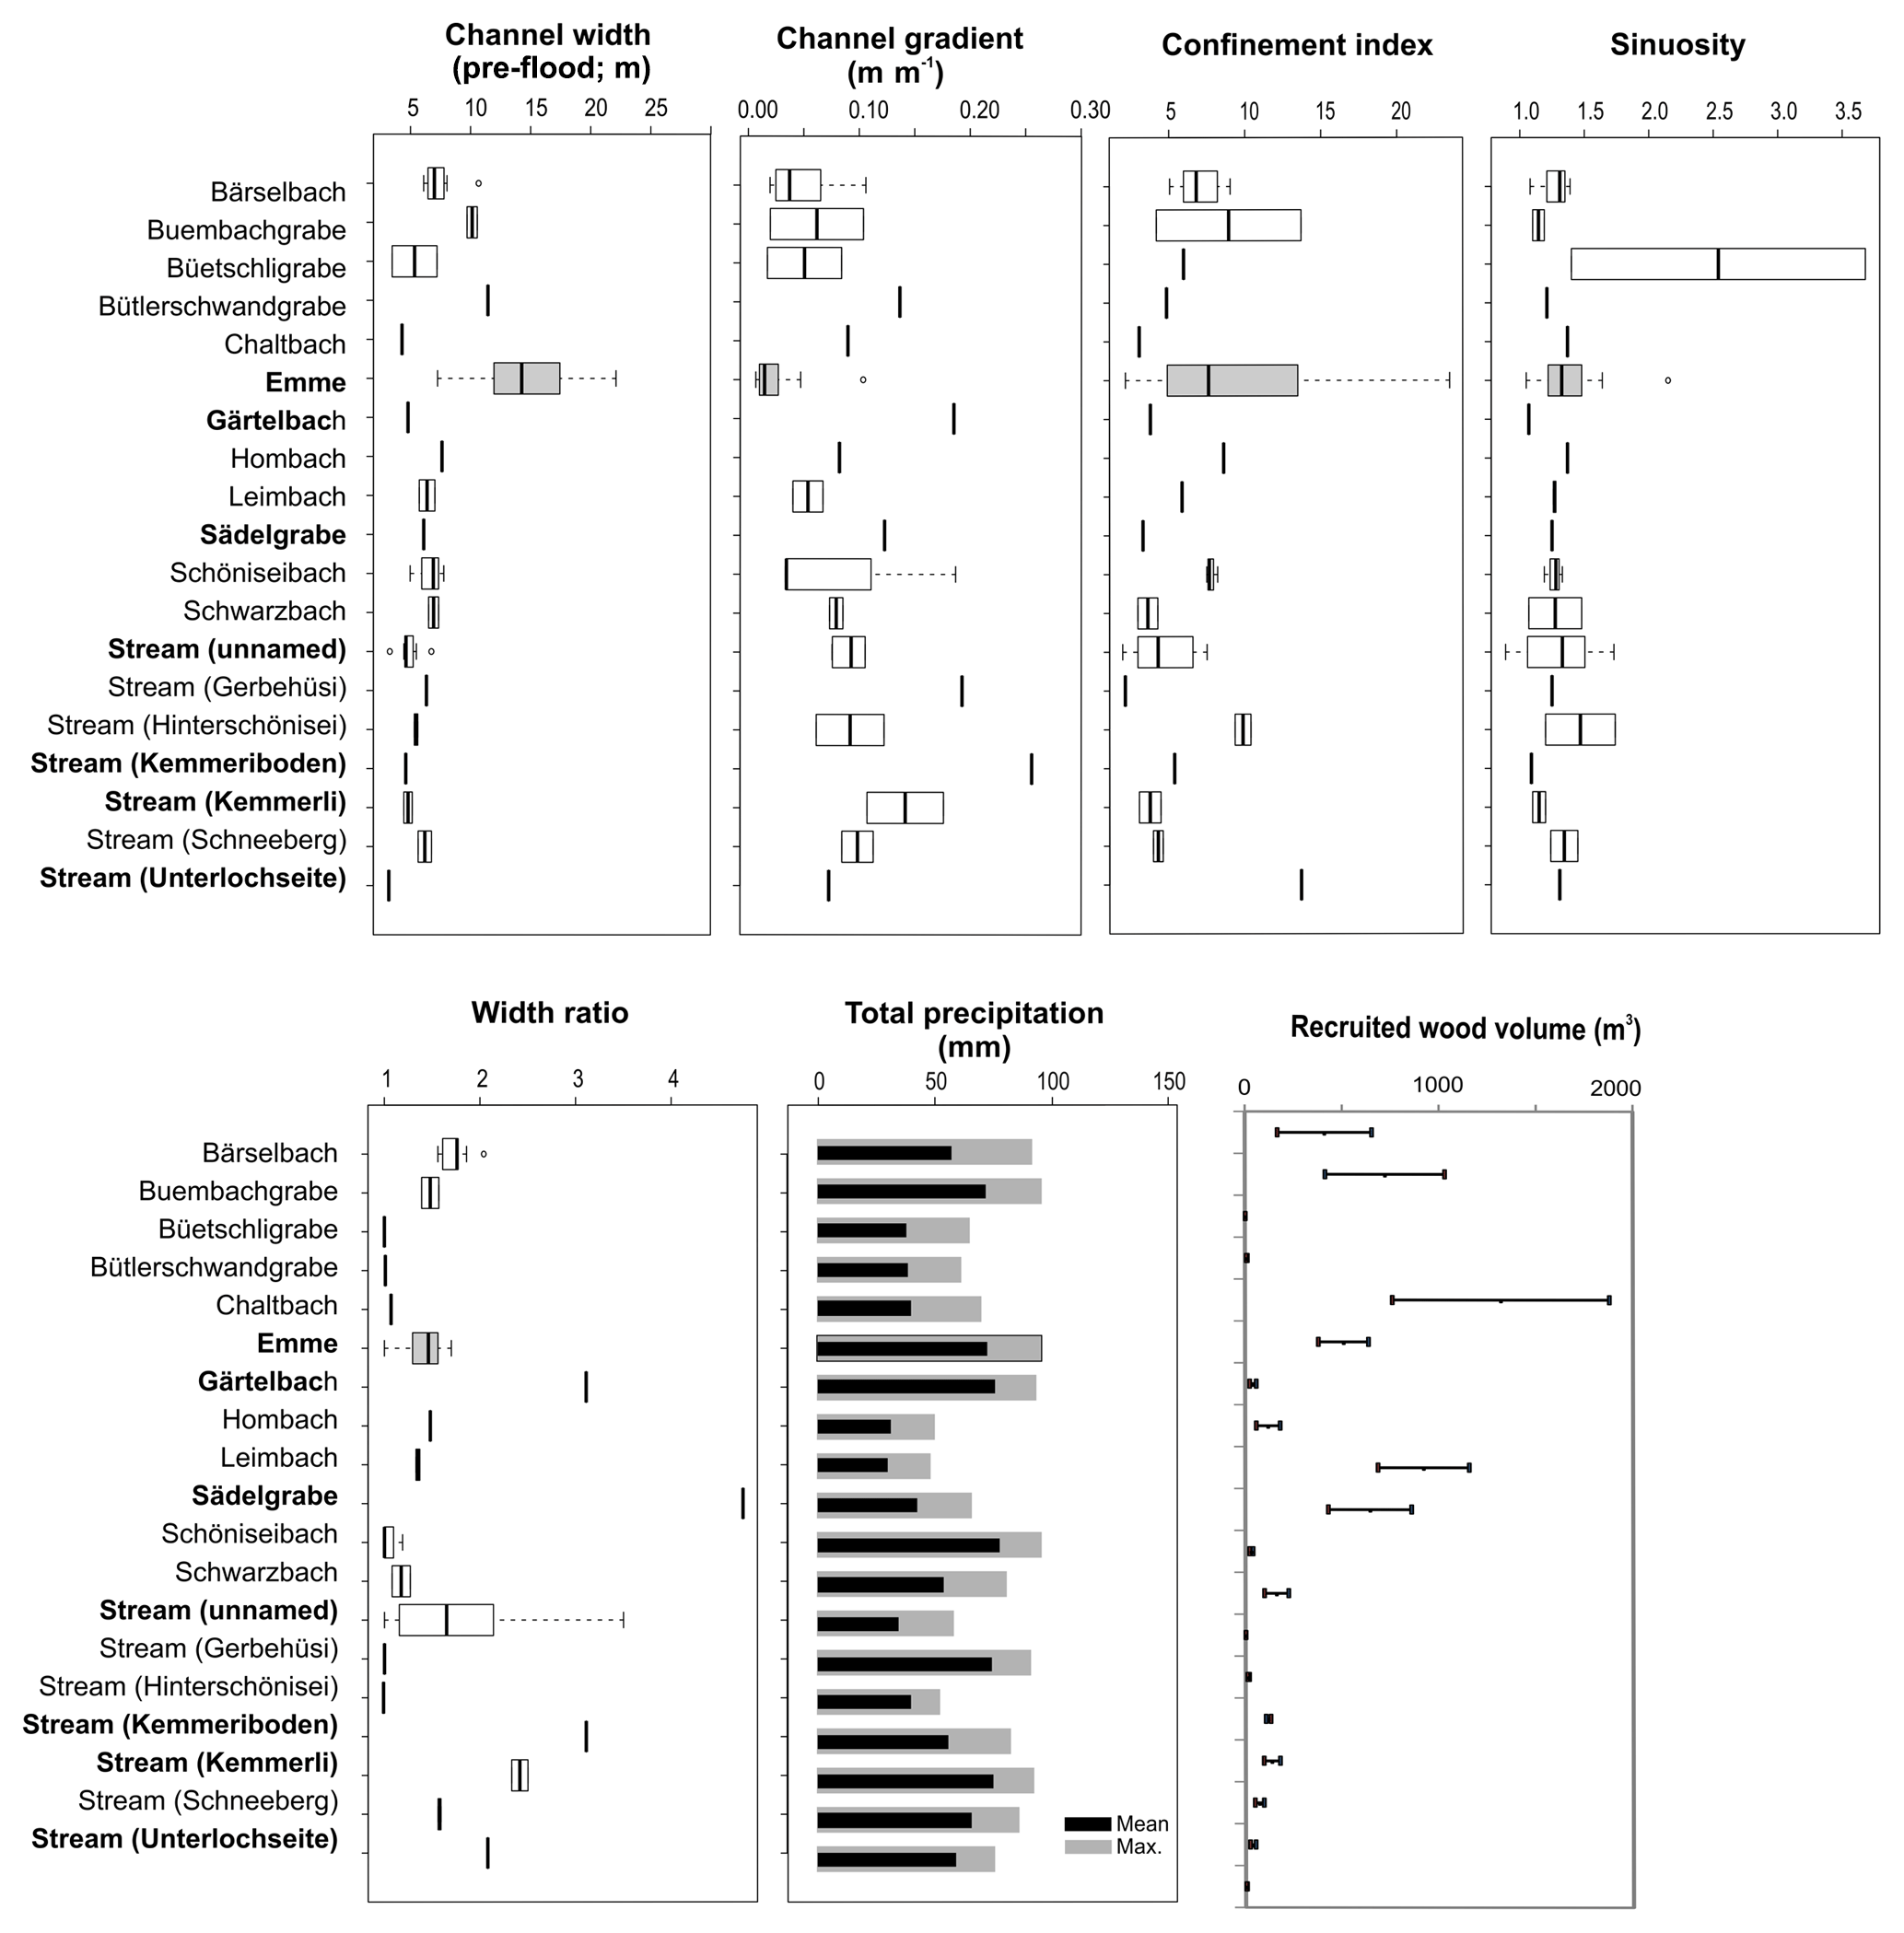
Figure 3Box plots of averaged initial channel width (before the flood), channel gradient, confinement ratio, sinuosity, width ratio, precipitation, and recruited wood volumes for the 19 studied streams. Total maximum and mean total precipitation are calculated based on the 1 km precipitation grid cells in the respective catchments (maximum shows the highest value, mean shows the mean value recorded in each sub-catchment). Recruited wood volumes are given in ranges based on forest density ranges (as explained in the Methods section). In bold are the streams highlighted in Fig. 4.
The forest stand volumes (m3 ha−1) before the event and eroded during the flood were assigned based on land use maps available for the study area and on information provided by the canton of Bern and the Swiss National Forest Inventory (NFI; Brassel and Lischke, 2001) to calculate recruited wood volume (in terms of eroded vegetation; see example in Fig. S4) and forested channel length. Forested channel length was determined by intersecting the forest cover with the river network. For this calculation, a wood buffer strip of 10 m was added to the forest boundary to account for potential LW recruitment due to tree fall. The width of the strip was chosen to be half of the average tree height. The corresponding area comprises all possible locations of the centers of gravity of recruited wood logs (Mazzorana et al., 2011). The dataset used for this calculation is based on the digitized topological landscape model of Switzerland 1:25 000 (source: Vector25 © 2007, Swisstopo, DV033594). Recruited wood volumes were normalized by initial channel area (i.e., m3 ha−1) and channel length (m3 km−1) to better compare sub-reaches and to compare our results with other studies in other regions. Detailed quantitative information about previously stored wood in the river channels was not available and we therefore had to assume that a value of 100 m3 ha−1 was reliable for this catchment based on previous studies (Rickli und Bucher, 2006).
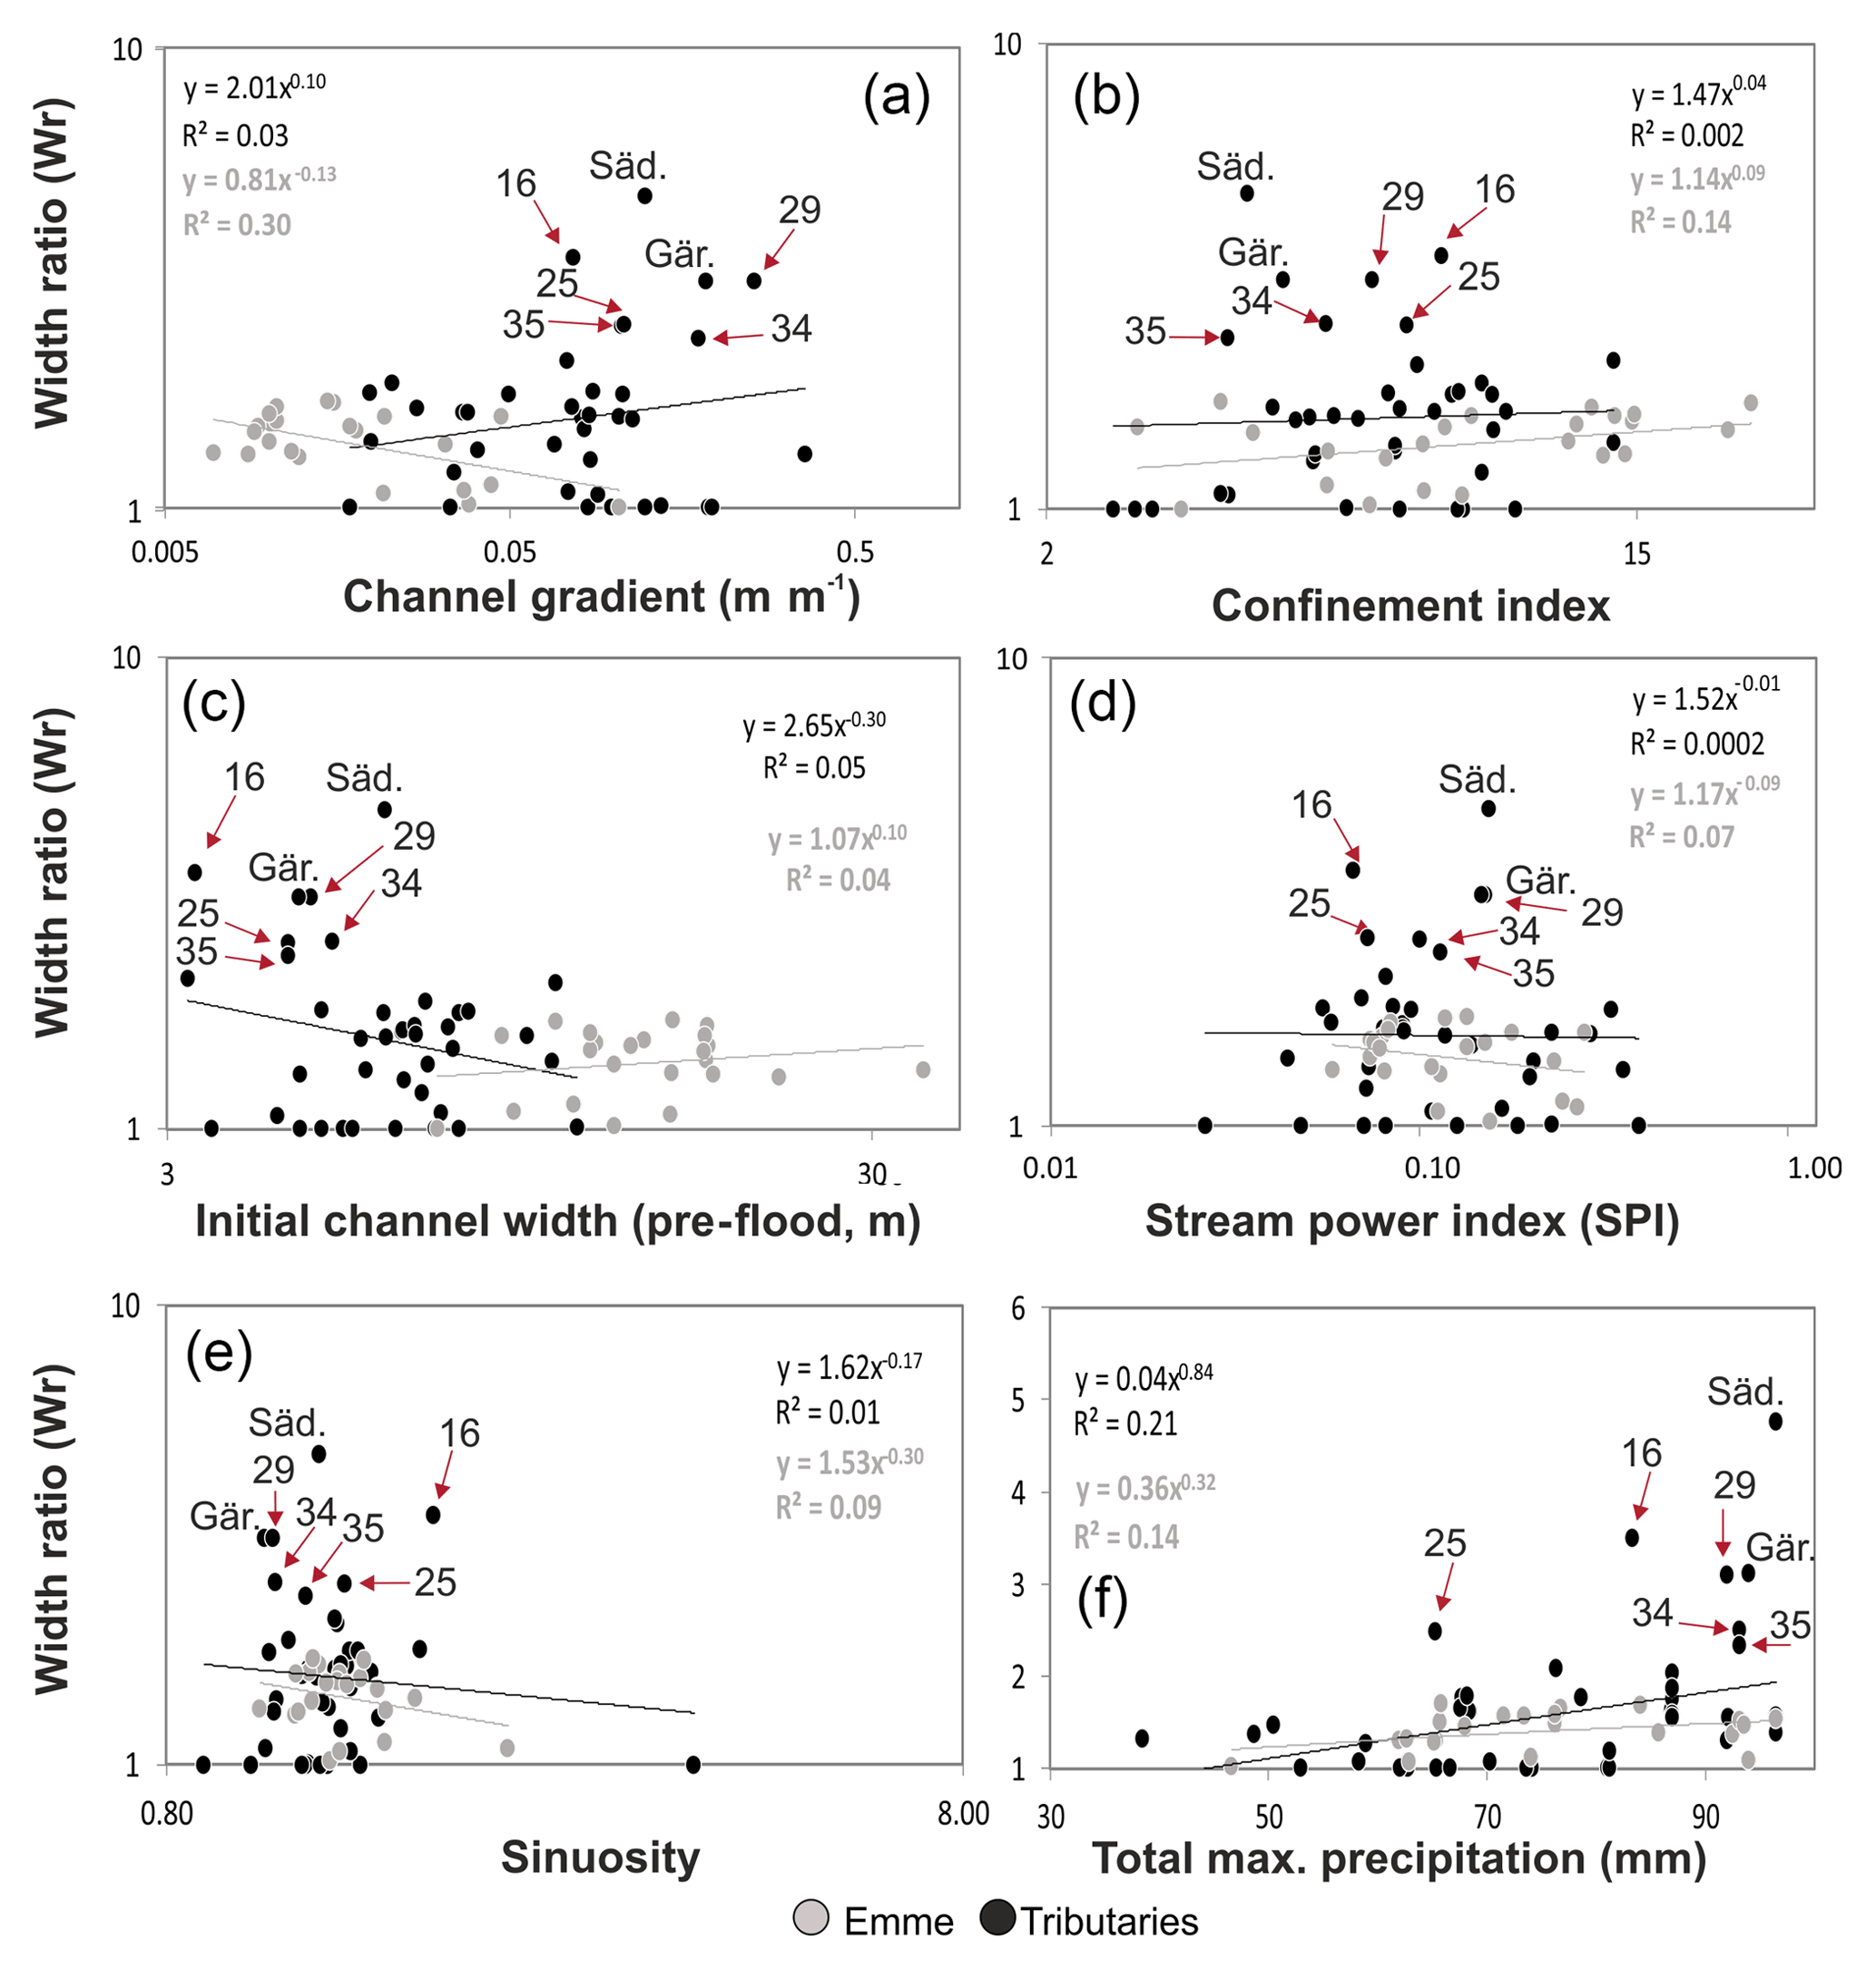
Figure 4Relationships between width ratio and (a) channel gradient; (b) confinement; (c) channel width (pre-flood); (d) stream power index (in m m−1 km−2); (e) sinuosity; (f) total maximum precipitation. Grey dots show sub-reaches along the Emme River, and black dots show sub-reaches along tributaries. Sub-reaches with the largest values are labeled. Säd.: Sädelgrabe; Gär.: Gärtelbach; numbers are sub-reaches as shown in Table 1. Grey and black lines show regression lines for the Emme River sub-reaches and tributary sub-reaches, respectively. Note that panel (f) has a linear x axis in contrast to the logarithmic x axis of panels (a)–(e).
Deposited wood was directly measured in the field as explained above and by Rickli et al. (2016). Besides the field survey and the GIS analysis, all available media data (see the Supplement), including a video recorded from a helicopter on the day of the flood (http://www.heliweb.ch, last access: 21 April 2015), were also investigated (Zurbrügg, 2015). This analysis allowed for the mapping of the original depositional sites of the removed wood right after the flood and complemented the wood budget calculations. Deposited wood volumes were also normalized by initial channel area (i.e., m3 ha−1) and channel length (m3 km−1) for comparisons.
2.3.3 Statistical analysis
First, an exploratory analysis of the potential factors at the sub-reach scale was done by applying simple linear regression and correlation (nonparametric Spearman rank test). The explanatory variables analyzed were width ratio, wood recruited volume (total volume, m3; volume per area, m3 ha−1; volume per stream length, m3 km−1), and wood deposit volume (total volume, m3; volume per area, m3 ha−1; volume per stream length, m3 km−1). The controlling factors included were initial channel width, width ratio (for wood recruitment and deposition), channel gradient, sinuosity, confinement index, SPI, forested channel length, and total maximum and mean precipitation.
Sub-reaches were grouped according to their morphological characteristics, channel widening (using a value of width ratio to characterize sub-reaches with important geomorphic changes in terms of channel widening), LW recruitment (sub-reaches with and without LW recruitment), and LW deposition (sub-reaches with and without LW deposition). Differences between groups of sub-reaches were tested using the nonparametric Mann–Whitney (i.e., Wilcoxon signed rank test for two groups) or Kruskal–Wallis (for more than two groups) tests. Significance of correlations and differences was set when p value <0.1.
We hypothesize that one single variable may not explain the channel widening or LW dynamics, but that the combination of multiple variables would. Thus, we applied multivariate analysis to estimate the probability and factors controlling channel widening, LW recruitment, and LW deposition. We applied multiple linear regression and multivariate binary logistic regression by using a stepwise approach in both cases to identify the best model based on the Akaike information criterion (AIC) and the determination coefficient. The multivariate binary logistic regression estimates the probability of a binary response (e.g., high channel widening and low channel widening, presence or absence of LW recruitment) based on different predictor (or independent) variables (e.g., morphological variables). As the variables analyzed have very different units and different orders of magnitudes, the dataset was standardized by mean-centering (the average value of each variable is calculated and then subtracted from the data, resulting in a transformed dataset such that the resulting variable has a zero mean; Becker et al., 1988) prior to computing (logistic and linear) multiple regressions. All analyses were done for all sub-reaches together, for sub-reaches along the Emme River only, and for sub-reaches along all tributaries. Variables were considered significant for p value <0.1. Statistical analyses were carried out using the statistical software R (R Core Team, 2017) and the packages xlsx (Dragulescu, 2014), Rcmdr (Fox, 2005, 2017; Fox and Bouchet-Valat, 2017), corrgram (Wright, 2017), corrplot (Wei and Simko, 2017), and Hmisc (Harrell Jr., 2016).
The morphology of the sub-reaches along the Emme River and tributaries is significantly different (see Fig. S5 in the Supplement); therefore, we analyzed their channel widening separately. Figure 3 shows the averaged values for different morphological variables, the calculated width ratio, and the precipitation for the 19 study streams including the Emme River reach (see Table 1). Looking at the different tributaries and the Emme River reach, we observe that the morphological response in terms of width ratio was very different and scatter in the data is very large (Fig. 3). The highest width ratio was observed in the Sädelgrabe, with nearly 5 times the initial channel width after the flood. The Gärtelbach and the tributary near Kemmeriboden also experienced significant channel widening. These streams were relatively narrow before the event, with initial channel widths smaller than 10 m, very steep (with channel gradients higher than 0.1), and highly confined (with confinement indices smaller than or near 5).
3.1 Morphological flood response: channel widening
The exploratory analysis of the morphological characteristics (Fig. 4) showed that the relationships between width ratio and channel gradient, confinement index, initial channel width, SPI, sinuosity, and total maximum precipitation vary substantially. A large scatter exists in the data, and in some cases, relationships are very different for the Emme sub-reaches and for the tributary sub-reaches.
According to the Spearman rank test for all sub-reaches together (Fig. 5) and for the tributary sub-reaches (Fig. S7), a significant positive correlation was found between width ratio and the total maximum and mean precipitation. Forested channel length was also significantly correlated with channel widening along the Emme sub-reaches (Fig. S8).
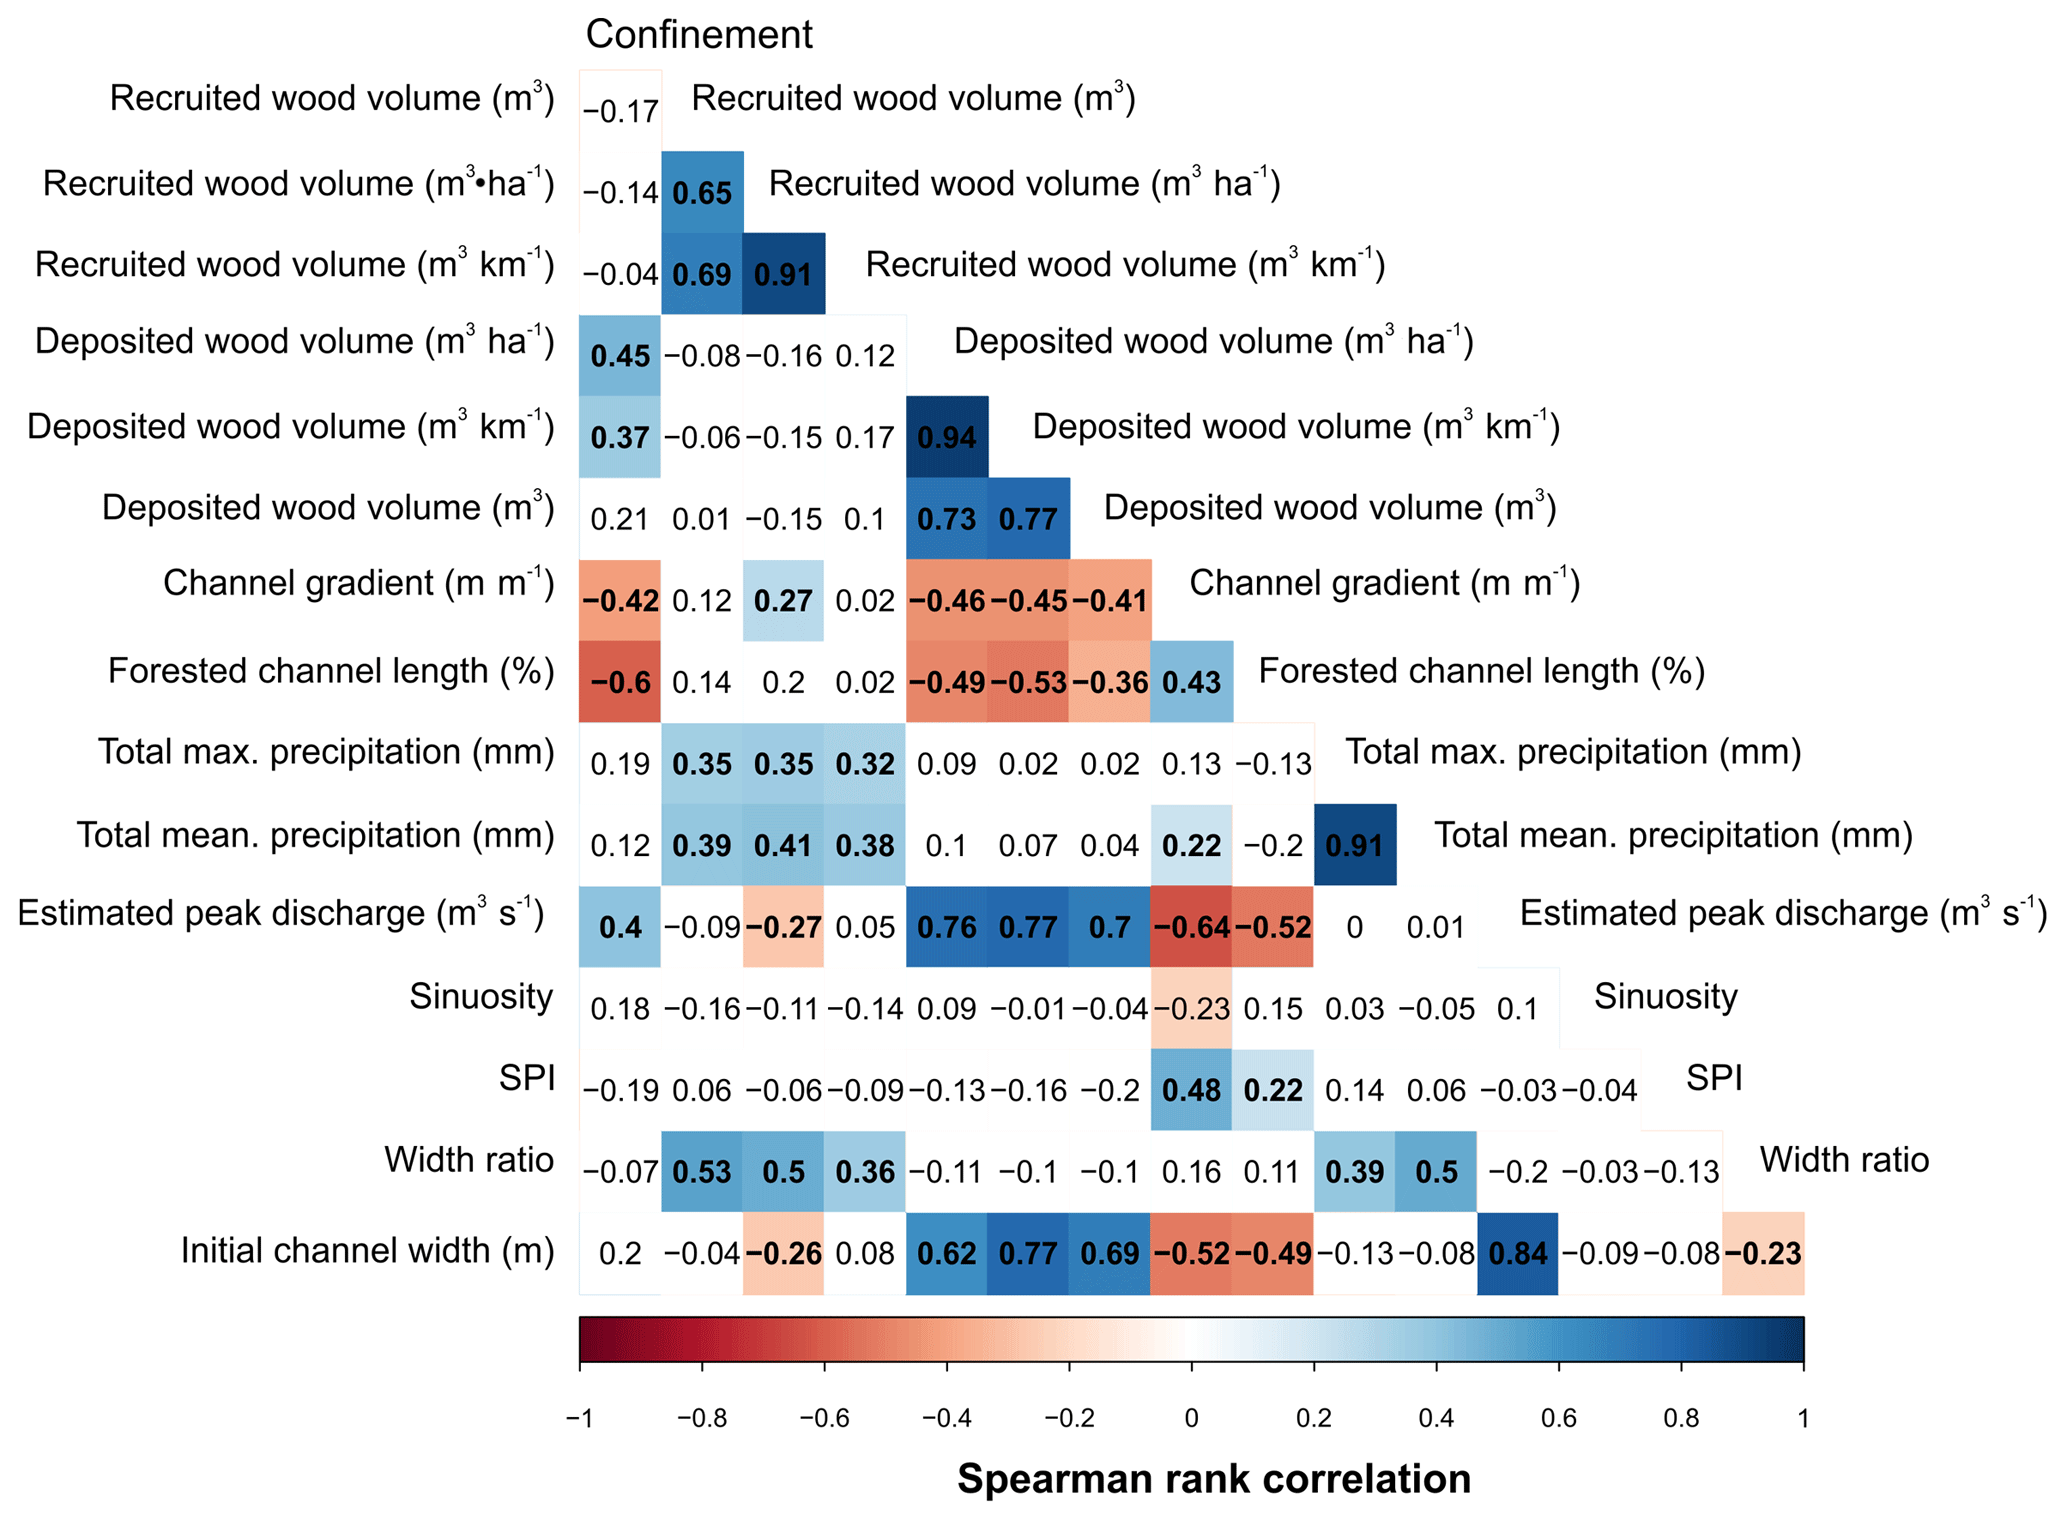
Figure 5Spearman rank correlation matrix of all variables included in the analyses and for all sub-reaches together. Values show the Spearman rank results (significant correlations are in bold). Red colors show significant negative correlations, blue shows significant positive correlation, and white shows insignificant correlations.
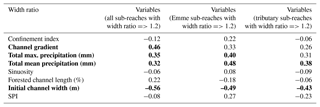
When sub-reaches without significant widening (i.e., width ratio <1.2; we consider a value larger than 20 % to be a reasonable threshold to distinguish significant widening) are removed from the correlation analysis, other significant correlations besides precipitation were observed (Table 3), such as channel gradient and initial channel width. Hence, the inclusion of sub-reaches that did not experience widening changed the results, a fact that is discussed further in Sect. 4.
Table 3Spearman rank correlation matrix for the width ratio versus different variables and for all sub-reaches, only Emme sub-reaches, and only tributary sub-reaches showing widening (i.e., width ratio >=1.2). Bold indicates significant correlation.
We compared the sub-reaches showing widening (i.e., width ratio >=1.2) with the sub-reaches not showing widening (i.e., width ratio <1.2), and results revealed significant differences between these two groups (see also Fig. S6) and between sub-reaches along the Emme and along tributaries (Fig. 6). We find that sub-reaches with a large width ratio were significantly less confined (high values of confinement index), less steep, and received much higher precipitation during the storm. By contrast, sub-reaches for which widening was important were also wider (channel width before the flood) and less forested; however, these differences were not significant. Interestingly, analysis of the sub-reaches along the Emme and along the tributaries independently showed similar trends (Fig. 6).

Figure 6Box plots of morphological variables (initial channel width, confinement index, channel gradient) and total maximum precipitation for all sub-reaches showing widening (i.e., width ratio ≥1.2; grey boxes) and sub-reaches not showing widening (i.e., width ratio <1.2). The bottom and top of the box indicate the first and third quartiles, respectively, the black line inside the box is the median, and circles are outliers. The Wilcoxon signed rank test result (p value) for the significance of differences is also shown; bold indicates significant differences.
The logistic regression points to an increase in the probability of widening occurrence with increasing precipitation and confinement index (Table S1). On the other hand, the probability of channel widening decreases with an increase in channel gradient, sinuosity, SPI, and forested channel length for all sub-reaches together. As with previous results, the sub-reaches along the Emme and along tributaries showed a contrasting behavior. Along the Emme, widening probability increased for wider, gentler, less sinuous, and less forested sub-reaches, whereas in the case of tributaries, the probability for the channels to widen was larger for narrower, steeper, sinuous forested sub-reaches.
The role of maximum precipitation is univocal in all cases, confirming our initial hypothesis about the role of the spatial distribution of precipitation. The logistic stepwise procedure revealed that the most significant variables explaining widening probability for all sub-reaches were total maximum precipitation, SPI, and estimated peak discharge (Table S1). Results obtained for sub-reaches along the Emme showed that forested channel length was also significant in explaining widening.
The multiple linear regression between width ratio values and the same explanatory variables for all sub-reaches identified precipitation, gradient, and SPI as significant variables. However, the obtained models explained only between 14 % and 19 % of the variability (Table S2). Separate multiple linear regression models for sub-reaches along the Emme and along tributaries further identify forested channel length, sinuosity, and initial channel width as significant variables; overall, models explained between 20 % and 50 % of widening variability.
3.2 Large wood recruitment and deposition
3.2.1 Factors controlling large wood recruitment
The most important sources of LW were the tributaries Bärselbach, Buembachgrabe, Gärtelbach, Sädelgrabe, and Schöniseibach together with the main river Emme (see Fig. 3). To understand the factors controlling LW recruitment at the sub-reach scale better, we explored correlations between different variables and the total LW volume, as well as the normalized recruited wood volume per stream hectare (Fig. 7) and per channel length. In these analyses, we also included sub-reaches without LW recruitment.
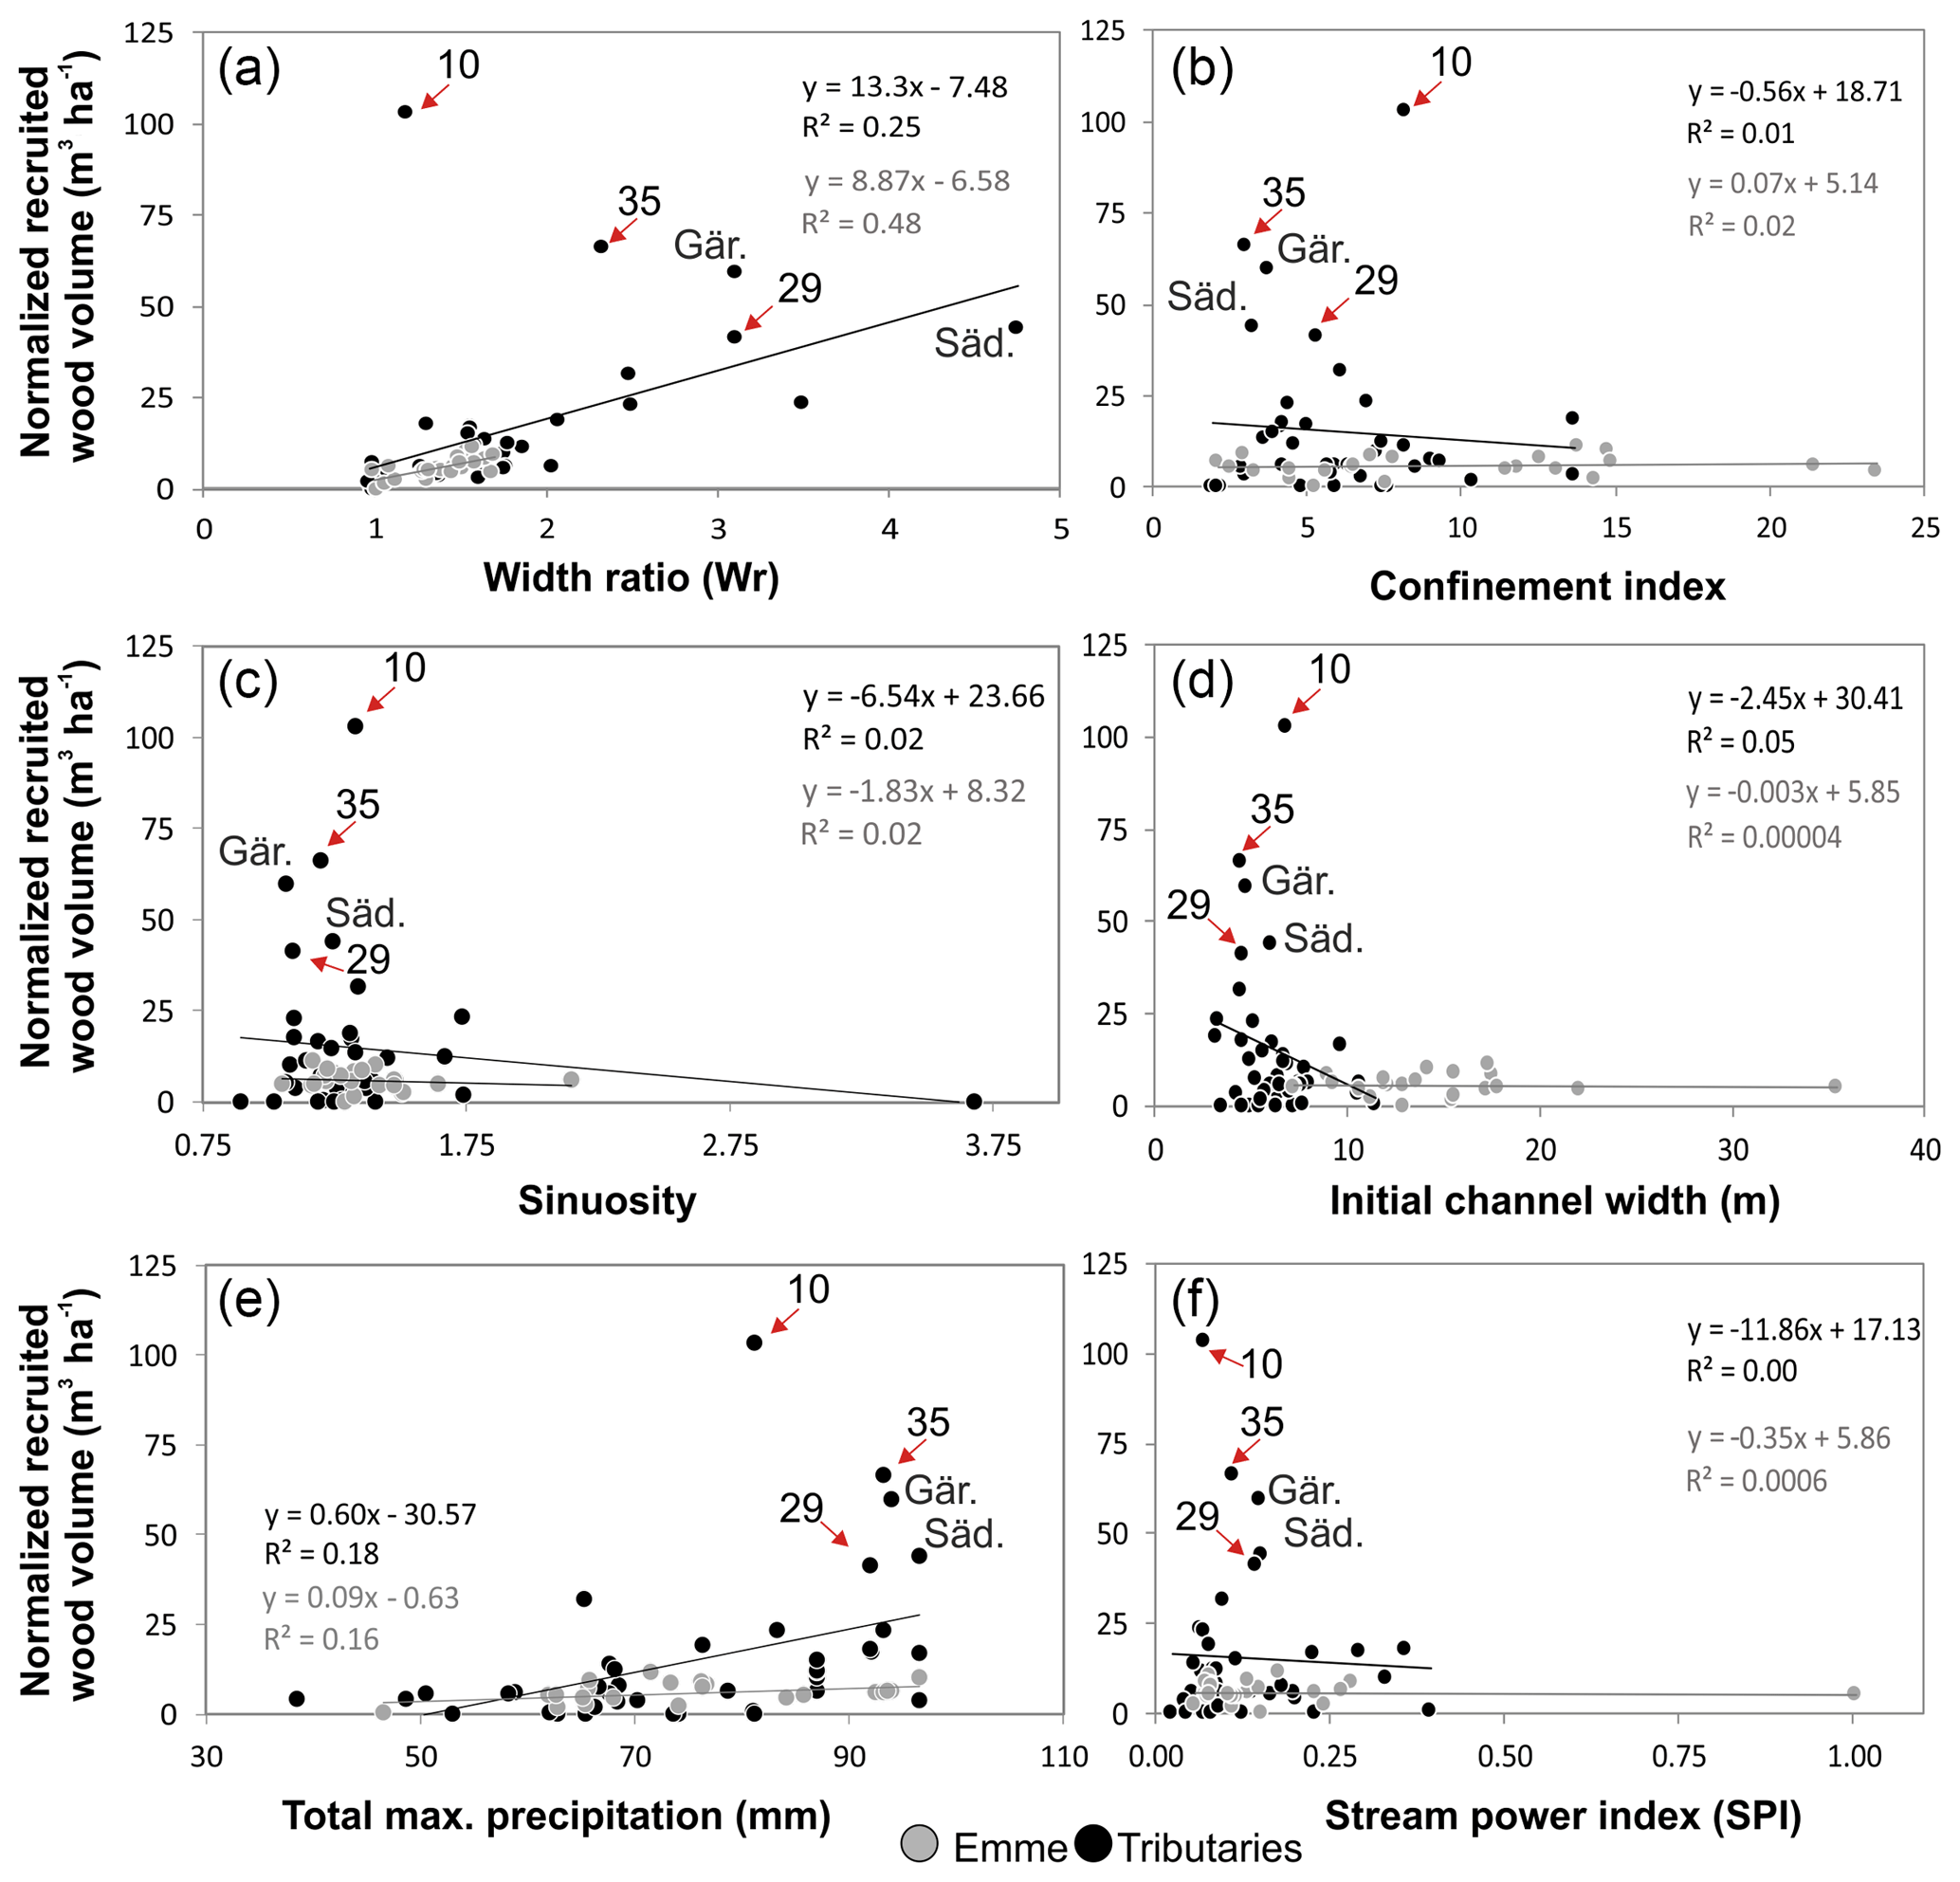
Figure 7Relationships between recruited wood volume normalized by stream hectare (m3 ha−1; mean value according to mean value of forest density) and (a) width ratio; (b) confinement index; (c) sinuosity; (d) initial channel width (m); (e) total maximum precipitation (mm); (f) SPI. Grey and black lines show regression lines for the Emme River and tributary sub-reaches, respectively. Säd.: Sädelgrabe; Gär.: Gärtelbach; numbers correspond to sub-reaches as shown in Table 1.
Even though the results showed a large scatter, some relationships can be identified. For instance, we found a positive significant correlation between recruited wood volume (m3, m3 ha−1, and m3 km−1) and width ratio (Fig. 5). This confirms that bank erosion (i.e., channel widening) was the main recruitment process. Again, sub-reaches receiving larger amounts of precipitation recruited higher quantities of LW and we observe a statistically significant positive correlation between total maximum and mean precipitation and recruited wood volume (for all three recruited wood volume variables). This is explained by the control of precipitation driving discharge and thus driving the widening of channels and the wood recruitment process. Channel morphology may play a role in wood recruitment as well; we observe a significant negative correlation between recruited LW volume and initial channel width and a significant positive correlation with channel gradient (Fig. 5). However, these significant correlations were found only for wood volume per stream hectare and not for total wood volume or wood volume per stream length (Fig. 5), and thus conclusions should be taken with caution.
Independent analyses for sub-reaches along the Emme or along tributaries showed similar results (correlation matrices shown in Figs. S7 and S8). We also performed the same analysis with sub-reaches showing LW recruitment (i.e., removing those in which no LW was recruited) and found similar results in terms of significant correlations with the different variables (results not shown here). However, the comparative analysis of sub-reaches with and without LW recruitment (Fig. 8) revealed that LW recruitment was observed primarily in sub-reaches characterized by a significantly greater confinement index (i.e., unconfined sub-reaches) and significantly smaller slope. The results of all sub-reaches together, without grouping sub-reaches along the Emme and along tributaries, are shown in Fig. S9.

Figure 8Box plots of morphological characteristics (width ratio, initial channel width, confinement index, channel gradient, and total max. precipitation of sub-reaches showing wood recruitment and not showing LW recruitment). The bottom and top of the box indicate the first and third quartiles, respectively, the black line inside the box is the median, and circles are outliers. The Wilcoxon signed rank test result (p value) for the significance of differences is also shown; bold indicates significant differences.
The logistic regression allowed for the calculation of the probability of LW recruitment occurrence; however, none of the analyzed variables were significant (Table S3), and the final stepwise logistic regression model selected just width ratio and confinement index as variables explaining LW recruitment probability. The multiple linear regression points to total maximum precipitation and width ratio as the most significant variables explaining total LW recruitment volume (total m3) variability, but forested channel length was also included in the final stepwise regression model for all sub-reaches. Between 10 % and 32 % of the variability was explained by these models (adjusted R2) (Table S4).
3.2.2 Large wood deposition along the Emme River
LW deposits were analyzed along the Emme River and its tributary Sädelgrabe. However, because LW was mostly deposited on the Sädelgrabe fan and piled up nearby, only results obtained along the Emme sub-reaches can be provided here. The exploratory analysis of LW deposit distribution showed a positive relationship between deposited wood volume (normalized by initial stream area; m3 ha−1) and width ratio, confinement index, initial channel width, and total precipitation; it showed a negative relationship with SPI (Fig. 9).
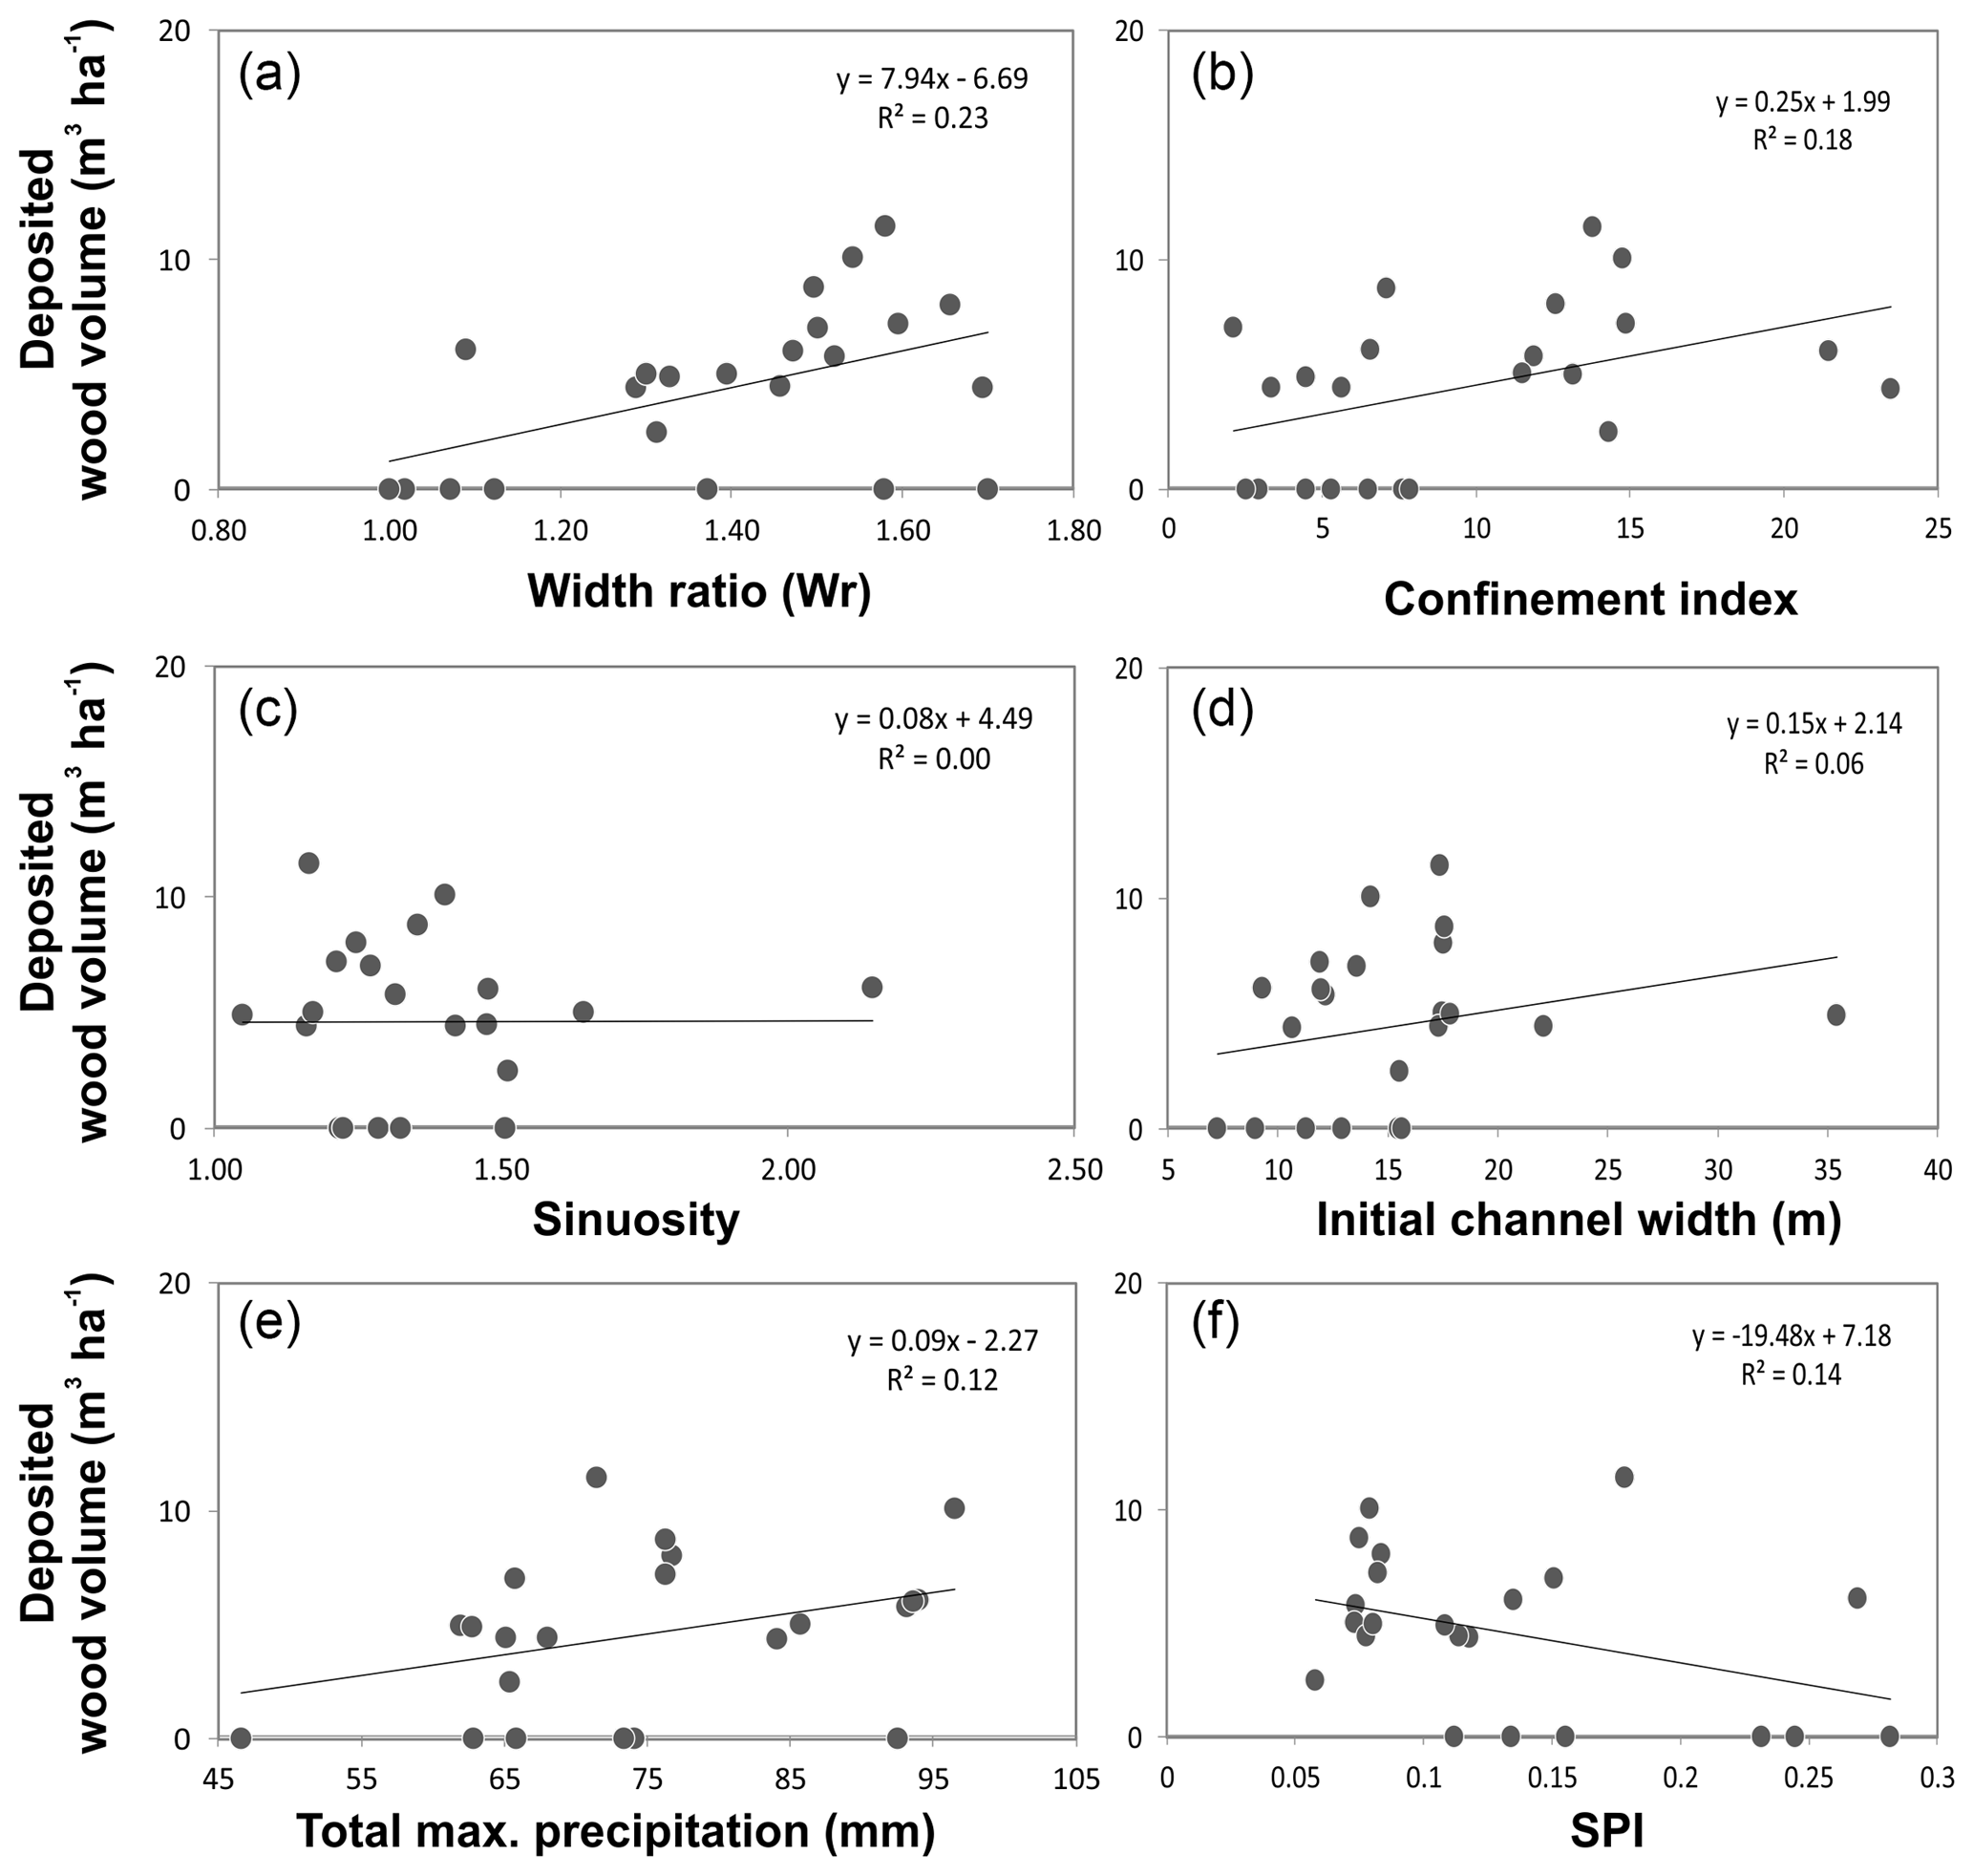
Figure 9Relationships between deposited wood volume per initial stream hectare (m3 ha−1) along the Emme River sub-reaches and (a) width ratio; (b) confinement index; (c) sinuosity; (d) channel width pre-flood; (e) total maximum precipitation (mm); and (f) SPI.
The Spearman test yielded a negative significant correlation of deposited LW with channel gradient and SPI and a positive correlation with estimated peak discharge (Fig. 5). By contrast, the confinement index and initial channel width were only significantly correlated with deposited LW volume per hectare and per kilometer, respectively.
The comparison between Emme sub-reaches where LW was deposited or not showed statistically significant differences in terms of confinement index, channel gradient, and SPI (Fig. 10).
The probability of LW deposition estimated by logistic regression confirmed that LW deposition probability increases with increasing width ratio, confinement index, and initial channel width, whereas it decreases with increasing channel gradient and SPI. The multivariate stepwise logistic regression model identified both the confinement index and estimated peak discharge as significant variables explaining LW deposition, but also included the width ratio in the final model (Table S5).
The multiple linear regression of LW deposited volume (i.e., total m3, m3 m3 ha−1, and m3 km−1) showed that the significant variables include channel gradient, estimated peak discharge, initial channel width, SPI, and confinement index (Table S6). The models explained between 51 % and 67 % of the variance. The largest variability (70 %) was explained for LW deposited volume per stream length (m3 km−1).
3.3 Large wood budget and size distribution
LW budget was fully analyzed along (i) the lower part of the surveyed Emme River, in the section between Kemmeriboden (1.25 km downstream of the confluence with the Bärselbach stream) and the Räbloch, and (ii) the Sädelgrabe tributary. This tributary delivered large quantities of LW by mass movements, debris floods, and debris flows, which was mostly deposited along its fan and the Emme River.
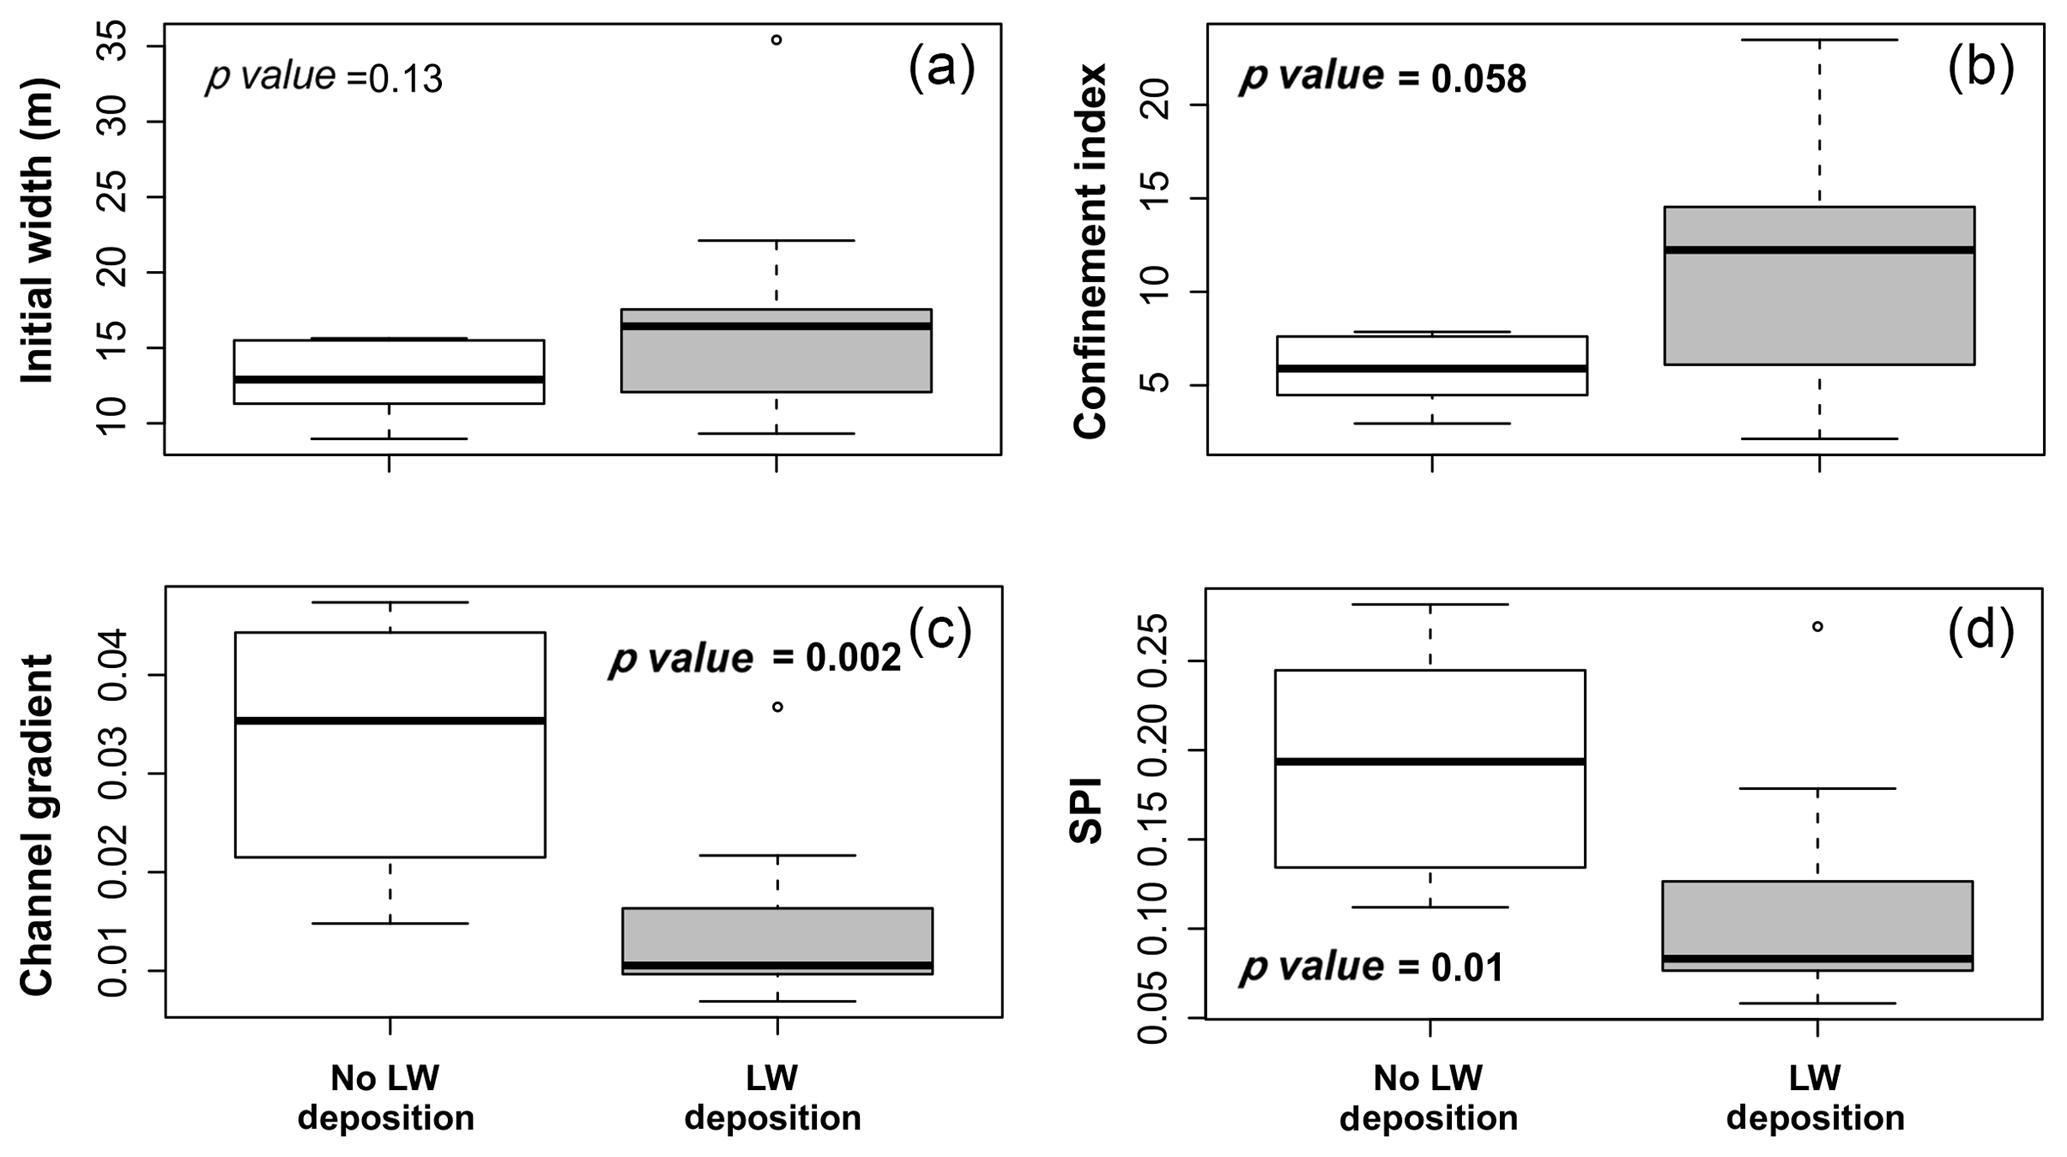
Figure 10Box plots of morphological characteristics (initial channel width, confinement index, channel gradient, and SPI) of sub-reaches showing and not showing LW deposition along the Emme River. The bottom and top of the box indicate the first and third quartiles, respectively, the black line inside the box is the median, and circles are outliers. The Wilcoxon signed rank test result (p value) for the significance of differences is also shown; bold indicates significant differences.
Table 4Wood budget along the Sädelgrabe. Uncertainties are included in the stated volumes.
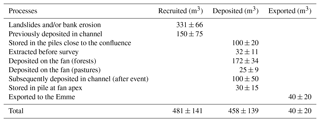
Recruited LW volumes in the Sädelgrabe were due to landslides and bank erosion; the LW volume was estimated to be 331 m3 (Table 4); together with the estimated volume of wood stored within the channel before the event (150 m3), we obtained 481 m3 of recruited and entrained wood. About 458 m3 of wood was deposited at various locations (172 m3 was deposited on the fan, 100 m3 was piled up along the streambed and the municipal road, and 100 m3 remained in the streambed of the Sädelgrabe after the event). Because the Sädelgrabe road bridge was completely blocked during the event (Fig. 1d), we estimated that only a small volume (about 40 m3) was exported from the Sädelgrabe to the Emme River. Another source of LW was the Gärtelbach, which delivered large quantities of LW directly to the Emme River, a large portion of which (around 250 m3) was deposited along the Emme floodplain in the vicinity of the bridge called Schwand downstream from the confluence.
Table 5 summarizes the partial wood budget computed along one segment of the Emme River.
Table 5Wood budget along the lower reach of the studied Emme River segment (reach between 1.25 km downstream of the Bärselbach stream and the Räbloch; Fig. 1). Uncertainties are included in the stated volumes.
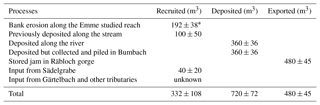
* This value is the estimated volume recruited by bank erosion along the surveyed Emme River reach only and does not include the LW recruitment upstream or in the tributaries, which is counted as input from Sädelgrabe (40 m3) and other tributaries (unknown). See the text for details.
As shown in Table 5 bank erosion along the surveyed Emme River segment recruited about 192 m3 of wood, which together with the estimated previously stored wood (100 m3) and the input from the Sädelgrabe was summed at 332 m3. Roughly 250 m3 was deposited in an area near Schwand and the rest along the Emme River (the sum of the deposited wood was approximately 360 m3). In addition, about 300 m3 of deposited LW from flooded areas was collected and transported to a landfill and 60 m3 of LW was processed into firewood as part of cleanup work and post-event measures. Another important element of the balance is a large jam that formed about 1.6 km downstream of the investigated Emme section at Räbloch. According to eyewitness reports, a substantial amount of LW was transported and clogged at this narrow canyon, creating a dam 8 to 10 m in height with approximately 480 m3 of wood. Unfortunately, it is not known how much wood was transported from the upper Emme reach (e.g., from the Schöniseibach) or from the tributaries along the surveyed Emme reach (e.g., the Gärtelbach) where wood recruitment was important as well (Fig. 3); therefore, a mismatch exists between the estimations of recruited, deposited, and exported LW volumes (Table 5).
Pieces of LW were surveyed and measured both along the Emme sub-reaches between Kemmeriboden (1.25 km downstream of the confluence with the Bärselbach) and Räbloch (Fig. 1) and along the Sädelgrabe tributary. In total, 1995 (i.e., 1658 along the Emme and 297 on the Sädelgrabe fan and nearby piles) pieces were measured and the size distribution was further analyzed (Fig. 11). For both the Sädelgrabe and Emme River, piece frequency generally decreases with increasing piece length and diameter. Regarding the relative diameter distribution, almost no differences exist between the two sites, and in both cases the range class of 10–15 cm is the most frequent with approximately 50 % of the total. The mean and median values of piece length and diameter are very similar in the Emme River (mean D: 16.6 cm, mean L: 4.04 m, median D: 15 cm, median L: 2.32 m) and Sädelgrabe torrent (mean D: 17.4 cm, mean L: 3.06 m; median D: 15 cm, median L: 2.5 m). Regarding the relative length distribution, short wood pieces (<2 m) were more frequently found along the Emme River (almost 60 %), whereas longer pieces (>2 m) were more prevalent along the Sädelgrabe (around 60 %). However, the longest piece was found in the Emme (20.7 m), while the longest piece measured in the Sädelgrabe was substantially shorter with a value of 12.0 m.
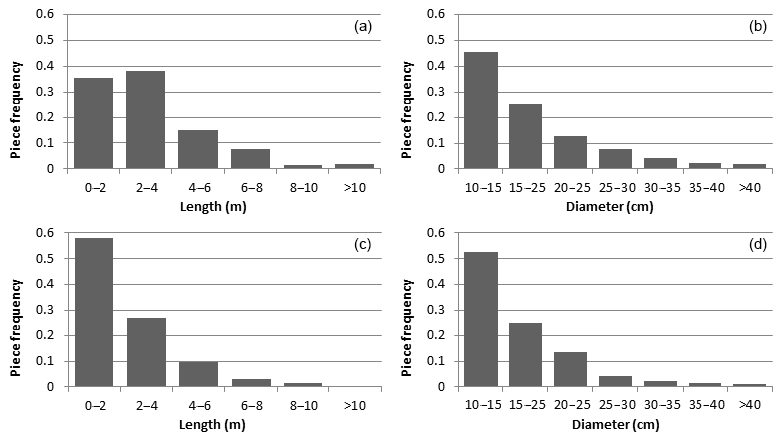
Figure 11Size distribution (piece diameter and length) of deposited LW pieces in the Sädelgrabe (a–b) and in the Emme River (c–d). In all panels the bars relate to the relative frequency of pieces.
4.1 Channel widening during the 2014 flood
In this study, we presented an integration of different approaches and data sources (i.e., field survey, GIS remotely sensed data, and statistical analysis) at different spatial scales to better understand flood response in terms of channel widening and LW dynamics. We demonstrated the importance of performing an overall analysis of the entire catchment, although the flood event and responses to it were restricted to some areas of the catchment only. This approach allowed for the identification of hydrometeorological and geomorphic thresholds for channel widening, LW recruitment, and deposition. The inclusion of sub-reaches without important widening or without LW recruitment and deposition in the analysis showed that sub-reaches with similar characteristics may exhibit significantly different responses during the same event, and variables explaining these responses may not be identified properly if only one part of the dataset is analyzed. The threshold taken to distinguish sub-reaches with important widening, a width ratio , was assumed to be reasonable considering that errors in the transect delineation, or in the delineation of the channel before and after the flood using the aerial images, could be up to 20 %.
Previous works have observed that hydraulic forces (e.g., stream power) are not sufficient to explain the geomorphic effects of floods (Nardi and Rinaldi, 2015), and other variables, such as initial channel width, confinement, and human interventions, should be included in assessments (Surian et al., 2016, and references therein). We confirmed with this study that the flood triggering precipitation is key in understanding the magnitude and spatial variability of catchment response (in terms of channel widening and LW dynamics) and that it should thus be included in future analyses. As hypothesized, differences in spatial precipitation patterns led to differences in the geomorphic response of the catchment, regulating channel widening, and thereby controlling LW dynamics. Although this observation may have been expected, it has rarely been addressed in post-event surveys (Rinaldi et al., 2016) even in cases for which data were available at the proper spatial scale (e.g., Surian et al., 2016).
In general, we observed a large scatter in our dataset. However, precipitation was the univocal variable to explain channel widening in statistically significant terms, provided that all sub-reaches were included, whenever only sub-reaches along the Emme River or along tributaries were analyzed. A threshold value of around 80 mm of precipitation was observed in sub-reaches with the most important widening (Fig. 4). When sub-reaches without significant widening (illustrated here by sub-reaches with a width ratio <1.2) were removed from analysis, channel morphology (in terms of initial channel width, confinement, and gradient) and hydraulic conditions (i.e., estimated peak discharge) were also significantly correlated with the width ratio. In fact, sub-reaches with a confinement index larger than 10 (i.e., unconfined channels) and wider than 10 m experienced less widening. This means that after intense precipitation events, channel morphology is a secondary driver for channel widening. Initial channel width was significantly negatively correlated with width ratio, as previously observed by Surian et al. (2016), Comiti et al. (2016), and Righini et al. (2017), who analyzed reaches that showed important widening in several streams in Italy. These authors also found the confinement index to be an important variable controlling channel widening. Regarding this variable, we observed contrasting behavior in the sub-reaches along the Emme River (where the width ratio was positively correlated with the confinement index) and along tributaries (where the width ratio was negatively correlated with the confinement index). This is because the largest widening was observed along tributary sub-reaches that are relatively more confined than the main river. In fact, only along the Emme River did we observe that sub-reaches showing channel widening were significantly less confined than sub-reaches not showing widening at all, as observed by Lucía et al. (2018). In contrast, differences were not significant along the tributaries. This apparently contradictory result might be explained by several factors. First, some large width ratios derived from aerial pictures (i.e., only on planimetric observations) may possibly include erosion of parts of the adjacent hillslopes, a process that also occurs during a flood. This was observed along the Sädelgrabe, where some highly confined transects showed widening ratios exceeding the confinement index (as also observed by Comiti et al., 2016). One may argue that these slope failures should not be considered as channel widening because the process here is more related to hillslope movements (e.g., falls, slips, slabs, slumps) than to channel processes. Second, some of the tributaries, especially the Sädelgrabe and Gärtelbach, received the highest amounts of precipitation, resulting in a more intensive response (e.g., large channel widening and debris flow triggering). Third, some uncertainties related to the use of the fluvial corridor tool to delineate the alluvial plain may affect the estimation of the confinement index. This tool uses the DEM and some predefined user parameters that may influence the final outcome (Roux et al., 2015). We carefully checked the results of this tool and adjusted the parameters to get a reliable valley bottom, which was verified using aerial imagery. However, small errors may remain, especially in steep and narrow sub-reaches. Besides channel confinement, lateral constraints, mainly artificial ripraps, artificial channelization, or natural bedrock, were present before the flood occurred, especially along the Emme River (see Fig. S2). These natural or artificial lateral constraints were not explicitly included in the analysis; however, they may have influenced results (Hajdukiewicz et al., 2015; Surian et al., 2016), therefore blurring factors controlling these processes and making their identification more difficult. In addition, major adjustments occurred during the last century, mostly channel narrowing and channel planform changes. These changes occurred at tributary confluences and along some of the Emme River sub-reaches, especially in unconfined sub-reaches where the stream changed from a braided to a single-thread pattern (Fig. S2). These anthropogenic changes may have an influence on current river response to floods and should thus be taken into account as well. Historical analyses were outside the scope of this study; however, they provided key information to assess whether and to what extent the response of a flood may involve channel segments that experienced significant changes in historical times (Rinaldi et al., 2016).
As shown in the results, sub-reaches along tributaries experiencing large channel widening were significantly steeper than those without widening, while along the Emme River channel, widening happened mostly along the gentler sub-reaches. This contrasting effect is explained by the same factors discussed above regarding widening and confinement. A negative correlation between width ratio and channel gradient, as found along the flatter Emme River reaches, was also observed by Lucía et al. (2015, 2018). The hydraulic conditions represented here by the estimated discharge and the SPI were not found to be significantly correlated with width ratio, although the multiple linear regression identified SPI as a significant variable explaining channel widening. Due to the large uncertainties related to the estimation of peak discharge at each transect and sub-reach, we preferred not to use total stream power or unit stream power for analysis, but selected SPI instead. The use of this index as a proxy for stream power is only based on the stream morphology and therefore also has some limitations (as shown by Lucía et al., 2018). The results should be treated cautiously. Additional hydrological modeling efforts could provide more robust estimates of discharge (Rinaldi et al., 2016) but are out of the scope of this study. Even when accurate discharge estimates are available, stream power has been shown to only partially explain channel changes, as other factors might be more relevant (Krapesch et al., 2011; Comiti et al., 2016; Surian et al., 2016; Righini et al., 2017; Lucía et al., 2018). Finally, another morphological variable included in our analysis was sinuosity. However, this variable was not significant and did not explain channel widening.
Besides channel morphology, the presence of vegetation also influenced channel widening. Forested channel length was negatively correlated with width ratio, and sub-reaches that experienced large widening were significantly less forested than those not experiencing channel widening. This illustrates the role of vegetation in protecting riverbanks from erosion (Abernethy and Rutherfurd, 1998). Other variables such as bank material (e.g., cohesive, non-cohesive, bedrock), type of vegetation, and vegetation density were not included in our analysis although they can be important factors affecting channel widening; they should therefore be considered in future analyses.
4.2 LW recruitment and deposition during the flood
LW recruitment was controlled primarily by bank erosion (i.e., channel widening), and thus factors controlling this process were identified as significant factors for LW recruitment. We observed a significant correlation between LW recruited volume and width ratio, precipitation, initial width, and channel gradient (i.e., the correlation with the last two variables was significant just for volume of wood recruited per initial channel hectare). The confinement index was also included in the final logistic regression model. During the Emme flood in 2014, we observed larger quantities of LW recruited in the smaller streams (i.e., the tributaries), which agrees with previous conceptual models (Seo and Nakamura, 2009). However, these models were defined for larger basins and longer times, not for single flood events. There are not many previous studies that analyzed LW recruitment after a single large flood. At the time of writing, the works of Lucía et al. (2015, 2018) and Steeb et al. (2017) were available, reporting results from northern Italy, the Swiss Alps, and southwestern Germany, respectively. The 2011 flood in the Magra River basin also recruited large amounts of LW, mostly by bank erosion. In their work, the authors did not find many significant correlations for total recruited wood volume, only a negative correlation with channel gradient (Lucía et al., 2015). In contrast, in the study of the 2016 flood in German streams, Lucía et al. (2018) observed significant correlations between recruited LW and drainage area and between stream power and confinement index. Our findings agree with these studies and previous observations in Switzerland (Steeb et al., 2017). They confirm the important role of bank erosion in recruiting wood material in mountain rivers, thereby highlighting the fact that hillslope processes were not the dominant LW supplier (contrary to what was proposed by Rigon et al., 2012).
This means that more attention should be paid to the understanding of bank erosion processes and the interactions with vegetation to predict or identify LW recruitment sources. Our findings also revealed that morphological variables alone may not explain or predict LW recruitment, and other factors should be considered as well, such as the triggering precipitation of the recruitment processes. As expected, the percentage of forested channel was also significant in the multiple linear regression model. However, other vegetation characteristics could play a role, such as the type and density of vegetation (Ruiz-Villanueva et al., 2014).
In our study, LW deposition was controlled mostly by channel morphology. We found significant correlations between LW deposited volume and initial channel width and between channel gradient and SPI. Sub-reaches where LW was deposited were significantly less confined (mainly in sub-reaches with confinement index higher than 7), wider (mainly in sub-reaches wider than 15 m, in agreement with the conceptual model proposed by Seo and Nakamura, 2009), and gentler than sub-reaches with no LW deposits. According to the multiple linear regression model, 67 % of the variance was explained by these variables. These results contrast with those found by Lucía et al. (2015), who did not find any statistically significant relationship with the controlling variables, although they observed that LW was more pronounced in the wider, gentle slope reaches typically located in the lower river sections. However, in their case, LW deposition was severely affected by the presence of several bridges and the formation of new in-channel islands due to bed aggradation. In two streams in Germany, Lucía et al. (2018) observed significant correlations between LW deposition and slope (negative correlation), drainage area, stream power, and confinement index. Our results partially agree with these observations.
Regarding the size of deposited logs, the median diameter observed in the field was 15 cm and the median length was 2.3 and 2.5 m in the Sädelgrabe and Emme River, respectively. These values were slightly smaller than values observed after the flood in August 2005 in central Switzerland (Steeb et al., 2017; Rickli et al., 2018) and after the flood in the Magra River (although only log length was reported by Lucía et al., 2015), but in line with logs deposited along several streams in the Italian Alps (Rigon et al., 2012). We found smaller pieces along the Emme River compared to the Sädelgrabe, indicating that pieces in the Emme may have traveled longer distances and that pieces may have been broken during transport.
We could compute wood budgets just for one tributary (Sädelgrabe) and one segment of the Emme River. Similarly to what is commonly done for sediment transport, a wood budget for a river basin should be a quantitative statement of the rates of recruited (delivered), deposited, and transported wood volumes (Benda and Sias, 2003). The budget for the Emme River segment is not balanced, as we could not compute all elements (e.g., previously stored wood, deposited wood during the flood) of the budget in all sub-catchments upstream. Therefore, there is a mismatch between recruited and deposited LW volumes. This highlights the fact that computing wood budgets is very challenging and should be done at the catchment scale and not for a river segment only. However, it might be crucial for the proper management of river basins and when it comes to wood–flood hazard mitigation (Comiti et al., 2016).
The flood event analyzed here was a large flood, and although the recruited and transported LW resulted in significant damage (i.e., clogging bridges and damaging buildings), the exported volume was not extremely high. According to our estimations, most LW recruited in the Sädelgrabe (480 m3) and along the lower reach in the Emme River (890 m3) was not transported long distances downstream but deposited near its source. Part of the material was clogged in the Räbloch gorge (between the villages of Schangnau and Eggiwil), including the woody material from the bridge destroyed at Bumbach. Still, LW was transported further downstream and stored in several hydropower dams and reservoirs along the Aare (downstream of its confluence with the Emme River). According to the dam managers' estimations, a total of 1500 m3 of wood was stored in five dams. However, it was not possible to compute precise budgets for the entire Emme catchment and its tributaries, and this value thus needs to be confirmed. Nevertheless, the exported LW volume in our study can be classified as very low when compared with volumes transported during the flood in August 2005 in Switzerland (Steeb et al., 2017) and with other events, as illustrated in the review by Ruiz-Villanueva et al. (2016).
Due to the complexity inherent to channel widening and LW dynamics, predictions on the location of major geomorphic changes and the magnitude of LW recruitment during large floods are very challenging (Buraas et al., 2014; Surian et al., 2016). Documenting events like the one reported here is fundamental for a better understanding of the processes involved and for the development of reliable and robust tools and approaches to facilitate the inclusion of such processes in flood hazard assessments (Comiti et al., 2016; Lucía et al., 2018). As such, a real need exists to complement current inundation mapping with a geomorphic approach (Rinaldi et al., 2015, 2016; Righini et al., 2017) and an integrative analysis of LW dynamics (Mazzorana et al., 2017).
Channel widening and LW dynamics are usually neglected in flood hazard mapping and river basin management. However, the present study clearly shows the importance of these processes during floods in mountain rivers. Still, the proper identification of factors controlling river basin response remains challenging. In that regard, our results also show that the identification of significant variables may be difficult, and depending on how the data are collected and analyzed (e.g., whether non-affected sub-reaches are included or not or which variables are considered), different outcomes are possible. However, we also showed that precipitation and variables such as forested channel length may play an important role in explaining channel widening, and they should thus be taken into consideration. Precipitation was the univocal statistically significant variable to explain channel widening, and only when sub-reaches without widening were removed from the analysis were channel morphology (i.e., initial channel width, confinement, and gradient) and hydraulic conditions (in terms of estimated peak discharge) also significantly correlated with width ratio. LW recruitment was controlled primarily by bank erosion and thus by the same variables controlling this process. This finding points to the need to better understand bank erosion processes and the interactions with vegetation to predict or identify LW recruitment sources. LW deposition was mostly controlled by channel morphology (i.e., initial channel width and gradient), and studies like this one are therefore crucial to identifying preferential reaches for wood deposition. This is an important component of the full wood budget, but not the only one. Further efforts in wood budgeting at the single event temporal scale are key to better understanding LW dynamics during floods in mountains rivers.
All datasets analyzed in this study are accessible by contacting the first author.
The supplement related to this article is available online at: https://doi.org/10.5194/esurf-6-1115-2018-supplement.
VRV, AB, DR, and CR contributed to the study conception and design. VRV, MB, SS, CR, and NS acquired the data. VRV, AB, DR, MB, SS, and CR analyzed and interpreted the data. VRV, AB, DR, and CR drafted the paper. NS and MS provided critical revisions.
The authors declare that they have no conflict of interest.
This study was funded by the Federal Office for the Environment (FOEN) in
the framework of the “Large Wood during the July 2014 Emme Flood Project”
(00.0157.PZ/N414-1285) and the “Research Project WoodFlow”
(15.0018.PJ/O192-3154). Part of the work presented here was carried out
within the scope of the local, solution-oriented event analysis of the 24 July 2014 Emme flood
event (Lokale, lösungsorientierte Ereignisanaylse
(LLE) Schangnau-Eggiwil) commissioned by the canton of Bern. We thank ARGE
GEOTEST AG and Geo7 AG for the good collaboration. The Forest Division of
the Canton of Bern (KAWA) provided the forest information for the canton of
Bern. Massimiliano Zappa helped with the precipitation data handling, and
Ramon Stalder and Karl Steiner assisted in the
field.
Edited by: Eric Lajeunesse
Reviewed by: Bruce MacVicar and one anonymous referee
Abernethy, B. and Rutherfurd, I. D.: Where along a river's length will vegetation most effectively stabilise stream banks?, Geomorphology, 23, 55–75, https://doi.org/10.1016/S0169-555X(97)00089-5, 1998.
Alber, A. and Piégay, H.: Spatial disaggregation and aggregation procedures for characterizing fluvial features at the network-scale: Application to the Rhone basin (France), Geomorphology, 125, 343–360, https://doi.org/10.1016/j.geomorph.2010.09.009, 2011.
Andres, N., Badoux, A., and Hegg, C.: Unwetterschäden in der Schweiz im Jahre 2014, Wasser Energie Luft, 107, 47–54, 2015.
ARGE LLE Schangnau-Eggiwil: Lokale, lösungsorientierte Ereignisanalyse (LLE) Schangnau-Eggiwil, Unwetter 24 Juli 2014, Report no. 1414 126.1, 2015.
Arnaud-Fassetta, G.: Dyke breaching and crevasse-splay sedimentary sequences of the Rhône Delta, France, caused by extreme river- flood of December 2003, Geogr. Fis. Din. Quat., 36, 7–26, 2013.
Arnaud-Fassetta, G., Cossart, E., and Fort, M.: Hydro-geomorphic hazards and impact of man-made structures during the catastrophic flood of June 2000 in the Upper Guil catchment (Queyras, Southern French Alps), Geomorphology, 66, 41–67, https://doi.org/10.1016/j.geomorph.2004.03.014, 2005.
Badoux, A., Andres, N., and Turowski, J. M.: Damage costs due to bedload transport processes in Switzerland, Nat. Hazards Earth Syst. Sci., 14, 279–294, https://doi.org/10.5194/nhess-14-279-2014, 2014.
Badoux, A., Böckli, M., Rickenmann, D., Rickli, C., Ruiz-Villanueva, V., Zurbrügg, S., and Stoffel, M.: Large wood transported during the exceptional flood event of 24 July 2014 in the Emme catchment (Switzerland), In: Proceedings of the 3rd International Conference Wood in World Rivers, Padova, Italy, July, 2015.
Becker, R. A., Chambers, J. M., and Wilks, A. R.: The New S Language. Wadsworth & Brooks/Cole, 1988.
Benda, L. E. and Sias, J. C.: A quantitative framework for evaluating the mass balance of in-stream organic debris, Forest Ecol. Manag., 172, 1–16, https://doi.org/10.1016/S0378-1127(01)00576-X, 2003.
Benito, G.: Energy expenditure and geomorphic work of the cataclysmic Missoula flooding in the Columbia river Gorge, USA, Earth Surf. Proc. Land., 22, 457–472, 1997.
Bezzola, G. R. and Hegg, C. (Eds.): Ereignisanalyse Hochwasser 2005, Teil 1 – Prozesse, Schäden und erste Einordnung, Umwelt-Wissen Nr. 0707, Bundesamt für Umwelt BAFU, Bern), Eidg. Forschungsanstalt WSL, Birmensdorf, Switzerland, 215 pp., 2007 (in German).
Bezzola, G. R. and Ruf, W.: Ereignisanalyse Hochwasser August 2007, Umwelt-Wissen Nr. 0927, Bundesamt für Umwelt BAFU, Bern, Switzerland, 209 pp., 2009 (in German).
Böckli, M., Badoux, A., Rickli, C., Forsting, D., Rickenmann, D., Ruiz-villanueva, V., Zurbrügg, S., and Stoffel, M.: Large wood-related hazards during the extreme flood of 24 July 2014 in the Emme catchment (Switzerland), in: Interpraevent 2016, 190–191, 2016.
Bracken, L. J., Turnbull, L., Wainwright, J., and Bogaart, P.: Sediment connectivity: a framework for understanding sediment transfer at multiple scales, Earth Surf. Proc. Land., 188, 177–188, https://doi.org/10.1002/esp.3635, 2015.
Brassel, P. and Lischke, H.: Swiss National Forest Inventory: Methods and models of the second assessment, Swiss Federal Research Institute WSL, Birmensdorf, Switzerland, 336 pp., 2001.
Buraas, E. M., Renshaw, C. E., Magilligan, F. J., and Dade, W. B.: Impact of reach geometry on stream channel sensitivity to extreme floods, Earth Surf. Proc. Land., 1789, 1778–1789, https://doi.org/10.1002/esp.3562, 2014.
Burkhardt-Holm, P. and Scheurer, K.: Application of the weight-of-evidence approach to assess the decline of brown trout (Salmo trutta) in Swiss rivers, Aquat. Sci., 69, 51–70, https://doi.org/10.1007/s00027-006-0841-6, 2007.
Cenderelli, D. A. and Kite, J. S.: Geomorphic effects of large debris flows on channel morphology at North Fork Mountain, eastern West Virginia, USA, Earth Surf. Proc. Land., 23, 1–19, 1998.
Comiti, F., Lucía, A., and Rickenmann, D.: Large wood recruitment and transport during large floods: a review, Geomorphology, 23–39, https://doi.org/10.1016/j.geomorph.2016.06.016, in press, 2016.
Croke, J., Fryirs, K., and Thompson, C.: Channel-floodplain connectivity during an extreme flood event: Implications for sediment erosion, deposition, and delivery, Earth Surf. Proc. Land., 38, 1444–1456, https://doi.org/10.1002/esp.3430, 2013
Daniels, M. D.: Distribution and dynamics of large woody debris and organic matter in a low-energy meandering stream, Geomorphology, 77, 286–298, https://doi.org/10.1016/j.geomorph.2006.01.011, 2006.
Dilts, T. E.: Polygon to Centerline Tool for ArcGIS, University of Nevada Reno, available at: http://www.arcgis.com/home/item.html?id=bc642731870740aabf48134f90aa6165 (last access: 29 January 2018), 2015.
Dragulescu, A. A.: xlsx: Read, write, format Excel 2007 and Excel 97/2000/XP/2003 files, R package version 0.5.7, available at: https://CRAN.R-project.org/package=xlsx (last access: 21 July 2018), 2014.
Ferreira, M.: Perpendicular Transects, GIS 4 Geomorphology, available at: http://gis4geomorphology.com/stream-transects-partial/ (last access: 29 January 2018), 2014.
FOEN: Hydrological Yearbook of Switzerland 2014, Federal Office for the Environment, Bern, Environmental Status no. UZ-1511-E, 36 pp., 2015.
FOEN: Hochwasserwahrscheinlichkeiten (Jahreshochwasser) Emme – Eggiwil, Heidbüel (EDV: 2409), Federal Office for the Environment, Bern, available at: https://www.hydrodaten.admin.ch/lhg/sdi/hq_studien/hq_statistics/2409hq.pdf (last access: 9 February 2018), 2017.
Fox, J.: The R Commander: A Basic Statistics Graphical User Interface to R, J. Stat. Softw., 14, 1–42, 2005.
Fox, J.: Using the R Commander: A Point-and-Click Interface or R, Boca Raton FL, Chapman and Hall/CRC Press, 2017.
Fox, J. and Bouchet-Valat, M.: Rcmdr: R Commander, R package version 2.3-2, 2017.
Gaume, E. and Borga, M.: Post-flood field investigations in upland catchments after major flash floods: proposal of a methodology and illustrations, J. Flood Risk Manag., 1, 175–189, https://doi.org/10.1111/j.1753-318X.2008.00023.x, 2008.
Gaume, E., Livet, M., Desbordes, M., and Villeneuve, J. P.: Hydrological analysis of the river Aude, France, flash flood on 12 and 13 November 1999, J. Hydrol., 286, 135–154, https://doi.org/10.1016/j.jhydrol.2003.09.015, 2004.
Gurnell, A. M.: Analogies between mineral sediment and vegetative particle dynamics in fluvial systems, Geomorphology, 89, 9–22, https://doi.org/10.1016/j.geomorph.2006.07.012, 2007.
Hajdukiewicz, H., Wyżga, B., Mikuś, P., Zawiejska, J., and Radecki-Pawlik, A.: Impact of a large flood on mountain river habitats, channel morphology, and valley infrastructure, Geomorphology, 272, 55–67, https://doi.org/10.1016/j.geomorph.2015.09.003, 2015.
Harrell Jr., F. E.: Hmisc: Harrell Miscellaneous, R package version 4.0-2, available at: https://CRAN.R-project.org/package=Hmisc (last access: 21 July 2018), 2016.
Harvey, A. M.: Geomorphic effects of a 100-year storm in the Howgill Fells, northwest England, Z. Geomorphol., 30, 71–91, 1986.
Heritage, G. L., Large, A. R. G., Moon, B. P., and Jewitt, G.: Channel hydraulics and geomorphic effects of an extreme flood event on the Sabie River, South Africa, Catena, 58, 151–181, 2004.
Hilker, N., Badoux, A., and Hegg, C.: The Swiss flood and landslide damage database 1972–2007, Nat. Hazards Earth Syst. Sci., 9, 913–925, https://doi.org/10.5194/nhess-9-913-2009, 2009.
Hollis, G. E.: The effect of urbanization on floods of different recurrence interval, Water Resour. Res., 11, 431–435, 1975.
Howard, A. and Dolan, R.: Geomorphology of the Colorado River in the Grand Canyon, J. Geol., 89, 269–298, 1981.
Krapesch, G., Hauer, C., and Habersack, H.: Scale orientated analysis of river width changes due to extreme flood hazards, Nat. Hazards Earth Syst. Sci., 11, 2137–2147, https://doi.org/10.5194/nhess-11-2137-2011, 2011.
Lapointe, M. F., Secretan, Y., Driscoll, S. N., Bergeron, N., and Leclerc, M.: Response of the River to the flood of July 1996 in the Saguenay Region of Quebec: large-scale avulsion in a glaciated valley, Water Resour. Res., 349, 2383–2392, 1998.
Lehmann, C.: Geschiebestudie hinteres Lauterbrunnental. Unveröffentlicht, Bericht, TBA-OIK-II, Thun, 2001.
Lin, G. W., Chen, H., Hovius, N., Horng, M. J., Dadson, S., Meunier, P., and Lines, M.: Effects of earthquake and cyclone sequencing on landsliding and fluvial sediment transfer in a mountain catchment, Earth Surf. Proc. Land., 33, 1354–1373, 2008.
Lucía, A., Comiti, F., Borga, M., Cavalli, M., and Marchi, L.: Dynamics of large wood during a flash flood in two mountain catchments, Nat. Hazards Earth Syst. Sci., 15, 1741–1755, https://doi.org/10.5194/nhess-15-1741-2015, 2015.
Lucía, A., Schwientek, M., Eberle, J., and Zarfl, C.: Planform changes and large wood dynamics in two torrents during a severe flash flood in Braunsbach, Germany 2016, Sci. Total Environ., 640–641, 315–326, https://doi.org/10.1016/j.scitotenv.2018.05.186, 2018.
Macklin, M. G., Rumsby, B. T., and Heap, T.: Flood alluviation and entrenchment: Holocene valley floor development and transformation in the British uplands, Geol. Soc. Am. Bull., 104, 631–643, 1992.
Magilligan, F. J., Phillips, J. D., James, L. A., and Gomez, B.: Geomorphic and Sedimentological Controls on the Effectiveness of an Extreme Flood, J. Geol., 106, 87–96, https://doi.org/10.1086/516009, 1998.
Marchi, L. and Dalla Fontana, G.: GIS morphometric indicators for the analysis of sediment dynamics in mountain basins, Environ. Geol., 48, 218–228, 2005.
Marchi, L., Borga, M., Preciso, E., Sangati, M., Gaume, E., Bain, V., Delrieu, G., Bonnifait, L., and Pogačnik, N.: Comprehensive post-event survey of a flash flood in Western Slovenia: Observation strategy and lessons learned, Hydrol. Process., 23, 3761–3770, https://doi.org/10.1002/hyp.7542, 2009.
Marcus, W. A., Marston, R. A., Colvard, C. R., and Gray, R. D.: Mapping the spatial and temporal distributions of woody debris in streams of the Greater Yellowstone Ecosystem, USA, Geomorphology, 44, 323–335, https://doi.org/10.1016/S0169-555X(01)00181-7, 2002.
Mazzorana, B., Hübl, J., Zischg, A., and Largiader, A.: Modelling woody material transport and deposition in alpine rivers, Nat. Hazards, 56, 425–449, https://doi.org/10.1007/s11069-009-9492-y, 2011.
Mazzorana, B., Ruiz-Villanueva, V., Marchi, L., Cavalli, M., Gems, B., Gschnitzer, T., and Valdebenito, G.: Assessing and mitigating large wood-related hazards in mountain streams: recent approaches, J. Flood Risk Manag., https://doi.org/10.1111/jfr3.12316, in press, 2017.
Merritts, D.: The effects of variable river flow on human communities, in: Inland Flood Hazards: Human, Riparian, and Aquatic Communities, edited by: Wohl, E. E., Cambridge Univ. Press, New York, 271–290, 2011.
MeteoSwiss: 24–28 July 2014 Weather situation, available at: http://www.meteoswiss.admin.ch/home/climate/past/climate-extremes/extreme-value-analyses/high-impact-precipitation-events/24-28-july-2014.html, last access: 20 April 2017.
Milan, D.: Geomorphic impact and system recovery following an extreme flood in an upland stream, Thinhope Burn, northern England, UK, Geomorphology, 138, 319–328, 2012.
Miller, A. J.: Flood hydrology and geomorphic effectiveness in the central Appalachians, Earth Surf. Proc. Land., 15, 119–134, 1990.
Nardi, L. and Rinaldi, M.: Spatio-temporal patterns of channel changes in response to a major flood event: The case of the Magra River (central-northern Italy), Earth Surf. Proc. Land., 40, 326–339, https://doi.org/10.1002/esp.3636, 2015.
R Core Team: R: A language and environment for statistical computing, R Foundation for Statistical Computing, Vienna, Austria, available at: https://www.R-project.org/ (last access: 21 July 2018), 2017.
Rickenmann, D. and Koschni, A.: Sediment loads due to fluvial transport and debris flows during the 2005 flood events in Switzerland, Hydrol. Process., 24, 993–1007, https://doi.org/10.1002/hyp.7536, 2010.
Rickenmann, D., Badoux, A., and Hunzinger, L.: Significance of sediment transport processes during piedmont floods: The 2005 flood events in Switzerland, Earth Surf. Proc. Land., 230, 224–230, https://doi.org/10.1002/esp.3835, 2016.
Rickli, C. and Bucher, H.: Einfluss ufernaher Bestockungen auf das Schwemmholzvorkommen in Wildbächen, Projektbericht Dezember, 2006.
Rickli, C., Böckli, M., Badoux, A., Rickenmann, D., Zurbrügg, S., Ruiz-Villanueva, V., and Stoffel, M.: Schwemmholztransport während des Hochwasserereignisses vom 24 Juli 2014 im Einzugsgebiet der Emme, Wasser Energie Luft, 108, 225–231, 2016 (in German).
Rickli, C., Badoux, A., Rickenmann, D., Steeb, N., and Waldner, P.: Large wood potential, piece characteristics, and flood effects in Swiss mountain streams, Phys. Geogr., 39, 542–564, https://doi.org/10.1080/02723646.2018.1456310, 2018.
Righini, M., Surian, N., Wohl, E., Marchi, L., Comiti, F., Amponsah, W., and Borga, M.: Geomorphic response to an extreme flood in two Mediterranean rivers (northeastern Sardinia, Italy): Analysis of controlling factors, Geomorphology, 290, 184–199, https://doi.org/10.1016/j.geomorph.2017.04.014, 2017.
Rigon, E., Comiti, F., and Lenzi, M. A.: Large wood storage in streams of the Eastern Italian Alps and the relevance of hillslope processes, Water Resour. Res., 48, W01518, https://doi.org/10.1029/2010WR009854, 2012.
Rinaldi, M., Surian, N., Comiti, F., and Bussettini, M.: A methodological framework for hydromorphological assessment, analysis and monitoring (IDRAIM) aimed at promoting integrated river management, Geomorphology, 251, 122–136, https://doi.org/10.1016/j.geomorph.2015.05.010, 2015.
Rinaldi, M., Amponsah, W., Benvenuti, M., Borga, M., Comiti, F., Lucía, A., Marchi, L., Nardi, L., Righini, M., and Surian, N.: An integrated approach for investigating geomorphic response to extreme events: methodological framework and application to the October 2011 flood in the Magra River catchment, Italy, Earth Surf. Proc. Land., 41, 835–846, https://doi.org/10.1002/esp.3902, 2016.
Roux, C., Alber, A., Bertrand, M., Vaudor, L., and Piégay, H.: “FluvialCorridor”: A new ArcGIS toolbox package for multiscale riverscape exploration, Geomorphology, 242, 29–37, https://doi.org/10.1016/j.geomorph.2014.04.018, 2014.
Ruiz-Villanueva, V., Díez-Herrero, A., Ballesteros-Canovas, J. A., and Bodoque, J. M.: Potential large woody debris recruitment due to landslides, bank erosion and floods in mountain basins: a quantitative estimation approach, River Res. Appl., 30, 81–97, https://doi.org/10.1002/rra.2614, 2014.
Ruiz-Villanueva, V., Piégay, H., Gurnell, A. A., Marston, R. A., and Stoffel, M.: Recent advances quantifying the large wood dynamics in river basins: New methods and remaining challenges, Rev. Geophys., 54, 611–652, https://doi.org/10.1002/2015RG000514, 2016.
Savi, S., Schneuwly-Bollschweiler, M., Bommer-Denns, B., Stoffel, M., and Schlunegger, F.: Geomorphic coupling between hillslopes and channels in the Swiss Alps, Earth Surf. Proc. Land., 38, 959–969, https://doi.org/10.1002/esp.3342, 2013.
Seo, J. I. and Nakamura, F.: Scale-dependent controls upon the fluvial export of large wood from river catchments, Earth Surf. Proc. Land., 34, 16–25, https://doi.org/10.1002/esp.1765, 2009.
Seo, J. I., Nakamura, F., Akasaka, T., Ichiyanagi, H., and Chun, K. W.: Large wood export regulated by the pattern and intensity of precipitation along a latitudinal gradient in the Japanese archipelago, Water Resour. Res., 48, W03510, https://doi.org/10.1029/2011WR010880, 2012.
Sideris, I. V., Gabella, M., Sassi, M., and Germann, U.: The CombiPrecip experience: development and operation of a real-time radar-raingauge combination scheme in Switzerland, Int. Symp. Weather Radar Hydrol., 2014.
Steeb, N., Rickenmann, D., Badoux, A., Rickli, C., and Waldner, P.: Large wood recruitment processes and transported volumes in Swiss mountain streams during the extreme flood of August 2005, Geomorphology, 279, 112–127, https://doi.org/10.1016/j.geomorph.2016.10.011, 2017.
Surian, N., Righini, M., Lucía, A., Nardi, L., Amponsah, W., Benvenuti, M., and Viero, A.: Channel response to extreme floods: Insights on controlling factors from six mountain rivers in northern Apennines, Italy, Geomorphology, 272, 78–91, https://doi.org/10.1016/j.geomorph.2016.02.002, 2016.
Thévenet, A., Citterio, A., and Piégay, H.: A new methodology for the assessment of large woody debris accumulations on highly modified rivers (example of two French piedmont rivers), Regulated Riv., 14, 467–483, https://doi.org/10.1002/(SICI)1099-1646(1998110)14:6<467::AID-RRR514>3.0.CO;2-X, 1998.
Thompson, C. and Croke, J.: Geomorphic effects, flood power and channel competence of a catastrophic flood in confined and unconfined reaches of the upper Lockyer valley, south east Queensland, Australia, Geomorphology, 197, 156–169, https://doi.org/10.1016/j.geomorph.2013.05.006, 2013.
Wei, T. and Simko V.: R package “corrplot”: Visualization of a Correlation Matrix (Version 0.84), available at: https://github.com/taiyun/corrplot (last access: 21 July 2018), 2017.
Wells, S. G. and Harvey, A.: Sedimentologic and geomorphic variations in storm-generated alluvial fans, Howgill Fells, northwest England, Geol. Soc. Am. Bull., 98, 182–198, 1987.
Wohl, E.: Connectivity in rivers, Prog. Phys. Geog., 41, 345–362, https://doi.org/10.1177/0309133317714972, 2017.
Wohl, E., Cenderelli, D. A., Dwire, K. A., Ryan-Burkett, S. E., Young, M. K., and Fausch, K. D.: Large in-stream wood studies: a call for common metrics, Earth Surf. Proc. Land., 625, 618–625, https://doi.org/10.1002/esp.1966, 2010.
Wohl, E. E., Greenbaum, N., Schick, A. P., and Baker, V. R.: Controls on bedrock channel incision along Nahal Paran, Israel, Earth Surf. Proc. Land., 19, 1–13, 1994.
Wright, K.: corrgram: Plot a Correlogram, R package version 1.12, available at: https://CRAN.R-project.org/package=corrgram (last access: 21 July 2018), 2017.
Wyżga, B.: Methods for studying the response of flood flows to channel change, J. Hydrol., 198, 271–288, 1997.
Zurbrügg, S.: Hochwasseruntersuchung und Feldstudie zur Quantifizierung des Transports und der Ablagerung von Schwemmholz während einem extremen Ereignis: Die Überschwemmung vom Juli 2014 in der Emme (Schweiz), Bsc Thesis, University of Bern, Switzerland, 2015 (in German).