the Creative Commons Attribution 4.0 License.
the Creative Commons Attribution 4.0 License.
 | 03 Aug 2018
Mechanical state of gravel soil in mobilization of rainfall-induced landslides in the Wenchuan seismic area, Sichuan province, China
Liping Liao
Yunchuan Yang
Zhiquan Yang
Yingyan Zhu
Jin Hu
D. H. Steve Zou
Gravel soils generated by the Wenchuan earthquake have undergone natural consolidation for the past decade. However, geological hazards, such as slope failures with ensuing landslides, have continued to pose great threats to the region. In this paper, artificial model tests were used to observe the changes of soil moisture content and pore water pressure, as well as macroscopic and microscopic phenomena of gravel soil. In addition, a mathematical formula of the critical state was derived from the triaxial test data. Finally, the mechanical states of gravel soil were determined. The results had five aspects. (1) The time and mode of the occurrence of landslides were closely related to the initial dry density. The process of initiation was accompanied by changes in density and void ratio. (2) The migration of fine particles and the rearrangement of coarse–fine particles contributed to the reorganization of the microscopic structure, which might be the main reason for the variation of dry density and void ratio. (3) If the confining pressure were the same, the void ratios of soils with constant particle composition would approach approximately critical values. (4) Mechanical state of gravel soil can be determined by the relative position between state parameter (e, p′) and ec–p′ planar critical state line, where e is the void ratio, ec is the critical void ratio and p′ is the mean effective stress. (5) In the process of landslide initiation, dilatation and contraction were two types of gravel soil state, but dilatation was dominant. This paper provided insight into interpreting landslide initiation from the perspective of critical state soil mechanics.
- Article
(7763 KB) - Full-text XML
- BibTeX
- EndNote


In 2008, the gravel soil generated by the Wenchuan earthquake produced a large amount of loose deposits (Tang and Liang, 2008; Xie et al., 2009). These deposits had features such as wide grading, weak consolidation and low density. They were located on both sides of roads and gullies and led to the formation of soil slopes (Cui et al., 2010; Qu et al., 2012; Zhu et al., 2011). Although gravel soils have been subjected to natural consolidation processes for nearly a decade, geological hazards, such as slope failures with ensuing landslides, are readily motivated in rainy season. At present, geo-hazards still pose the great threats to the region (Chen et al., 2017; Cui et al., 2013; Yin et al., 2016).
The variation of mechanical state, such as the transformation from a relatively stable state to a critical state, has been commonly used to analyze the initiation of landslides (Iverson et al., 2010, 2000; Liang et al., 2017; Sassa, 1984; Schulz et al., 2009). Therefore, a deep understanding of the soil state is the scientific basis for the study of landslide occurrence (Chen et al., 2017). Generally, the critical void ratio is an important parameter to determine the state of soil quantitatively (Been and Jefferies, 1985; Schofield and Wroth, 1968). The theoretical research has its origins in Reynold's work in 1885. He defined the characteristic of the volumetric deformation of granular materials due to shear strain as dilatation (Reynolds, 1885). Casagrande (1936) pointed out that loose soil contracted, and dense soil dilated to the same critical void ratio in the drained shearing test. He drew the F line to distinguish the dilative zone and the contractive zone. The F line's horizontal and vertical coordinate is effective normal stress and void ratio. Since the 1980s, critical state soil mechanics has received extensive attention (Fleming et al., 1989; Gabet and Mudd, 2006; Iverson et al., 2000). Some of the observed landslides, such as the Salmon Creek landslide in Marin County (Fleming et al., 1989), Slumgullion landslide in Colorado (Schulz et al., 2009), and Guangming New Distinct landslide in Shenzhen (Liang et al., 2017), could be approximately explained by this theory. Based on the F line drawn by Casagrande (1936), Fleming et al. (1989) found that the increase in pore water pressure contributed to the dilation and caused the debris flow characterized by the intermittent movement. Iverson et al. (1997, 2000) pointed out that porosity played an important role in the occurrence of landslides; in the soil shearing process, the density of loose sand increased, and the density of dense sand decreased to the same critical density. The formula of the void ratio was derived, which was the function of the mean effective stress (Gabet and Mudd 2006). Schulz et al. (2009) found out that the dilative strengthening might control the velocity of a moving landslide through the hourly continuous measurement of displacement of landslides. Liang et al. (2017) found that the initial solid volume fraction affected the soil state of the granular–fluid mixture. Other scholars also found that, in the shearing process, dilation or contraction was existing in residual soil, loess and coarse-grained soil (Dai et al., 2000, 1999a, b; Liu et al., 2012; Zhang et al., 2010).
The above researchers provided the meaningful insights in order to explain the occurrence of landslides and drew the instructive conclusion that the initial density or porosity can affect the mechanical state of soil (Iverson et al., 2000) and the formation of landslides (McKenna et al., 2011). However, most of them focused on qualitative results and lacked mutual verification between indoor tests and model tests. In addition, for the gravel soil generated by seismic activity, the study on its mechanical state is lacking. Some scientific issues need to be resolved. For example, what are the differences and similarities of landslide occurrence? Why does the void ratio or the density change? Is the mechanical state a contraction or dilation? The purpose of this paper is to resolve the above issues through artificial flume model tests and triaxial tests. Firstly, the macroscopic phenomena were observed and summarized. Secondly, the variations of soil moisture content and pore water pressure were analyzed. Thirdly, the microscopic property of soil was obtained. Fourthly, the mathematical expression of critical state of soil was proposed. Finally, the mechanical state of gravel soil was determined by the relative position between state parameter (e, p′) and ec–p′ planar critical state line.
2.1 Field site
Niujuan valley is located in Yingxiu, Wenchuan County, Sichuan province, which was the epicenter of the 12 May 2008 Wenchuan earthquake in China (Fig. 1). The main valley of the basin has an area of 10.46 km2 and a length of 5.8 km. The highest elevation is 2693 m, and the largest relative elevation is 1833 m. The gradient ratio of the valley bed is 32.7 %–52.5 % (Tang and Liang, 2008; Xie et al., 2009). Six small ditches are distributed in the basin. Most of the valley is covered with the abundant gravel soil. Extremely complex terrain and adequate rainfall triggers the frequent landslides and the large-scale debris flows. Thus, this valley is the most typical basin in the seismic area. Its excellent landslide-formative environment can provide comprehensive reference models and abundant soil samples for artificial flume model tests.

2.2 Soil tests and quantitative analysis
2.2.1 Artificial flume model test
Based on the field surveys along Duwen highway, Niujuan valley and the literature review (Chen et al., 2010; Fang et al., 2012; Tang et al., 2011; Yu et al., 2010), most of the rainfall-induced landslides are shallow. The range of the slope angle is 25–40∘, and its average value is 27∘. The rainfall intensity triggering the landslide is 10–70 mm h−1. As shown in Fig. 2a, the length, width and height of the flume model are 300, 100 and 100 cm.
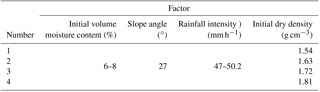
The gravel soil samples are from Niujuan valley. The specific gravity is 2.69. The range of dry density is 1.48–2.36 g cm−3; in addition, the minimum and the maximum void ratios are 0.14 and 0.82. Figure 2b shows that the cumulative content of gravel (diameter <2 mm), and silt and clay (diameter <0.075 mm) are 30.74 % and 2.78 %. The content of silt and clay plays an important role in the mobilization of landslides and debris flows (Chen et al., 2010). Four initial dry densities are designed as 1.50, 1.60, 1.70 and 1.80 g cm−3. According to previous investigations, the water content mainly changes within a depth of less than 50 cm, and its average value varies from 6 % to 8 %, while water content below 50 cm basically keeps stable. Therefore, the total thickness of the soil model is 60 cm. In order to achieve a predetermined initial dry density, the soils of the models are divided into four layers, and each layer is compacted. The thickness of each layer is 20, 15, 15 and 10 cm (Fig. 2a). Due to the experimental error, the actual initial dry density (IDD) is 1.54, 1.63, 1.72 and 1.81 g cm−3 (Table 1).
Artificial rainfall system, designed by the Institute of Soil and Water Conservation, Chinese Academy of Sciences, is comprised of two spray nozzles, a submersible pump, water box and a bracket. The range of nozzle sizes is 5–12 mm; thus, the different rainfall intensity can be simulated. The rain intensity triggering the large-scale debris flow on 21 August 2011 was 56.5 mm h−1, which is the designed rainfall for the test. The real rainfall intensity was 47–50.2 mm h−1 because the model test was disturbed by the direction of wind. Three groups of sensors, including the micro-pore pressure sensors (the model is TS-HM91) and moisture sensors (the model is SM300), are placed between two layers of the soil to measure the volume water content and the pore water pressure (Fig. 2a). A data-acquisition system (the model is DL2e) is used to collect the data; it can scan 30 channels within the same second. A camera is used to record the macroscopic process of the entire experiment.
2.2.2 Triaxial test
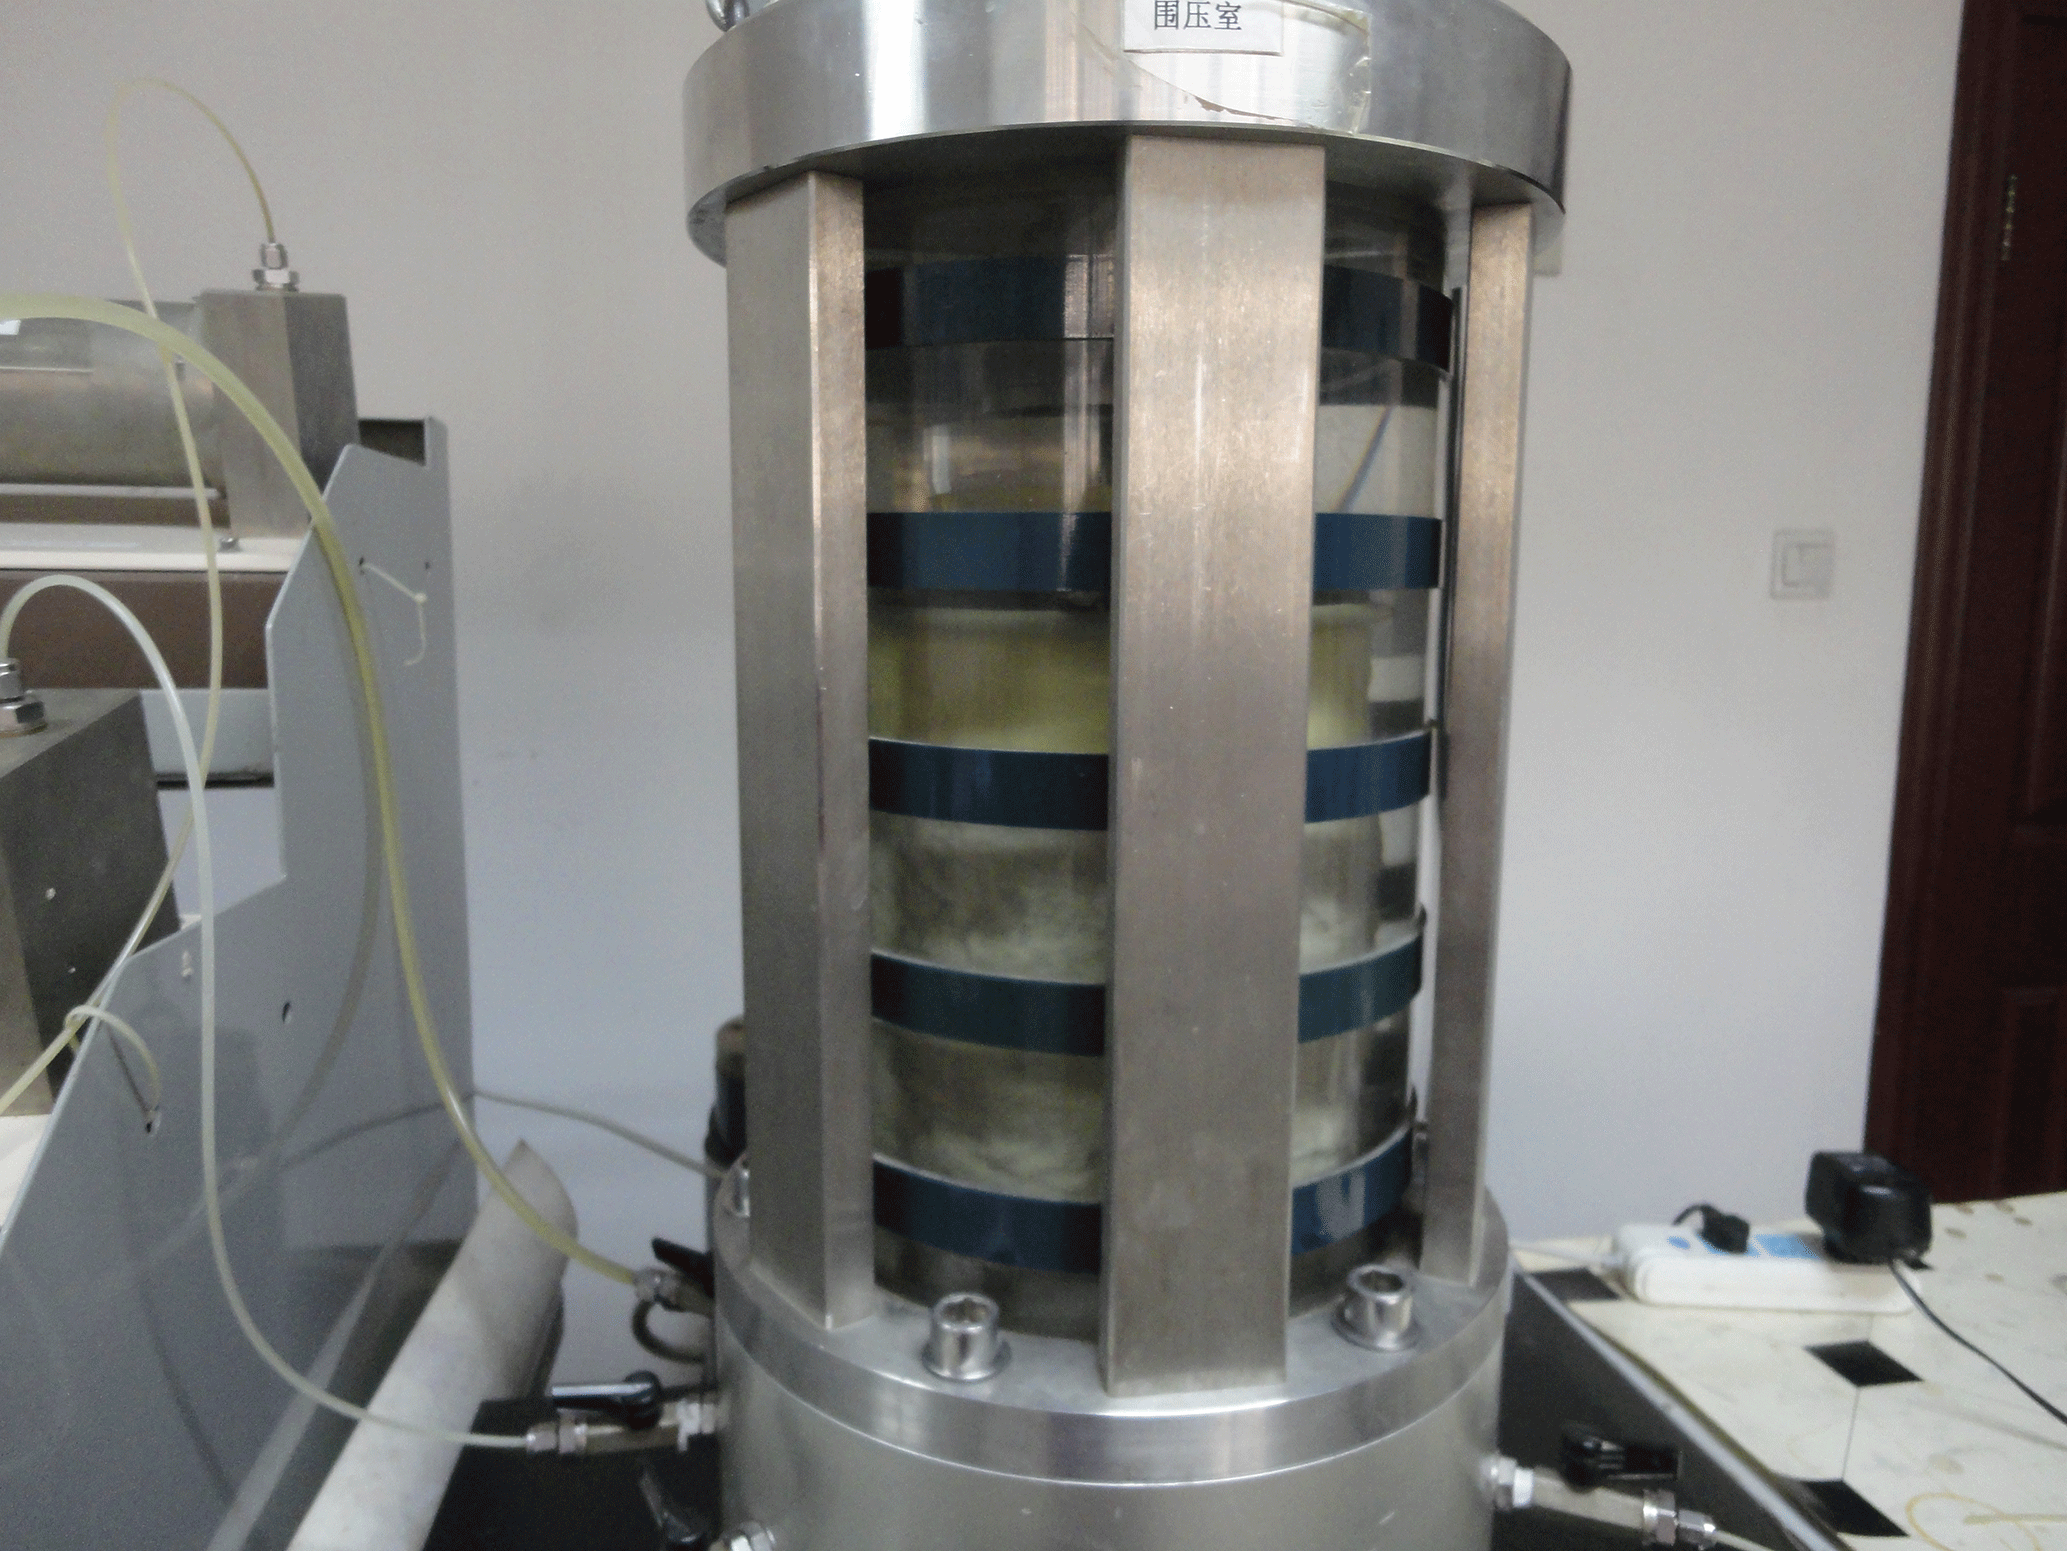
Tests are performed by using a dynamic apparatus at the Institute of Mountain Hazards and Environment, Chinese Academy of Sciences. The diameter and the height of sample are 15 and 30 cm (Fig. 3). The test is the saturated and consolidated drainage shear test at a shear rate of 0.8 mm min−1, which is comprised of two sets: the initial dry density of 1.94 and 2.00 g cm−3. The confining pressure σ3 is 50, 100 and 150 Kpa.
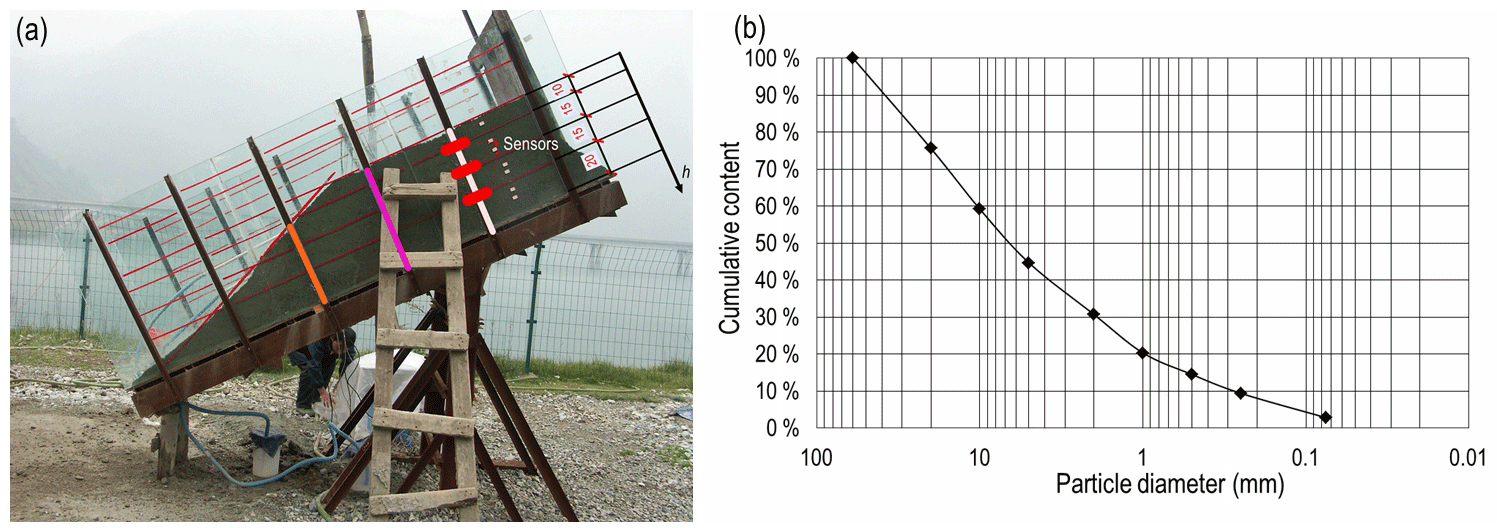
Figure 2Test model and grain composition of gravel soil. (a) Artificial flume model (the position of sampling: red line – 1, pink line – 2, white line – 3). (b) Grain composition of gravel soil.
2.2.3 Quantitative analysis method
Quantitative analysis is mainly based on artificial flume model test and triaxial test. Firstly, the state parameters of soil are represented by the void ratio e and the mean effective stress p′, which are from the model test. In the model test, at least three soil samples are collected by a soil sampler at the same depth of lines 1, 2 and 3 and are used to calculate their natural density ρ, mass moisture content ω and dry density ρd. Later, e can be calculated by the following formula: (where Gs is the specific gravity). The cumulative content of coarse P5 (particle diameter >5 mm), gravel (particle diameter <2 mm) P2, and silt and clay (particle diameter <0.075 mm) P0.075 is obtained from the particle grading tests. p′ can be calculated by the following formula: , where σz=γh and . h is the vertical distance between a certain point inside the slope and the surface of the slope; β is the slope angle. γ is the unit weight of soil. Ka is the lateral pressure coefficient, which can be calculated by formula (1) (Chen et al., 2012). ϕ is the internal friction angle of soil. In this paper, , .
Secondly, the critical state line (CSL) is derived from the triaxial test. Finally, based on the critical state soil mechanics, according to the relative position of the state parameter (e, p′) at the CSL, the mechanical state of the soil can be estimated. When the soil state (e, p′) is located at the upper right of the CSL, the soil is contracted. When the soil state (e, p′) is located at the lower left of the CSL, the soil is dilated (Casagrande, 1936; Schofield and Wroth, 1968).
3.1 Macroscopic phenomena of experiment
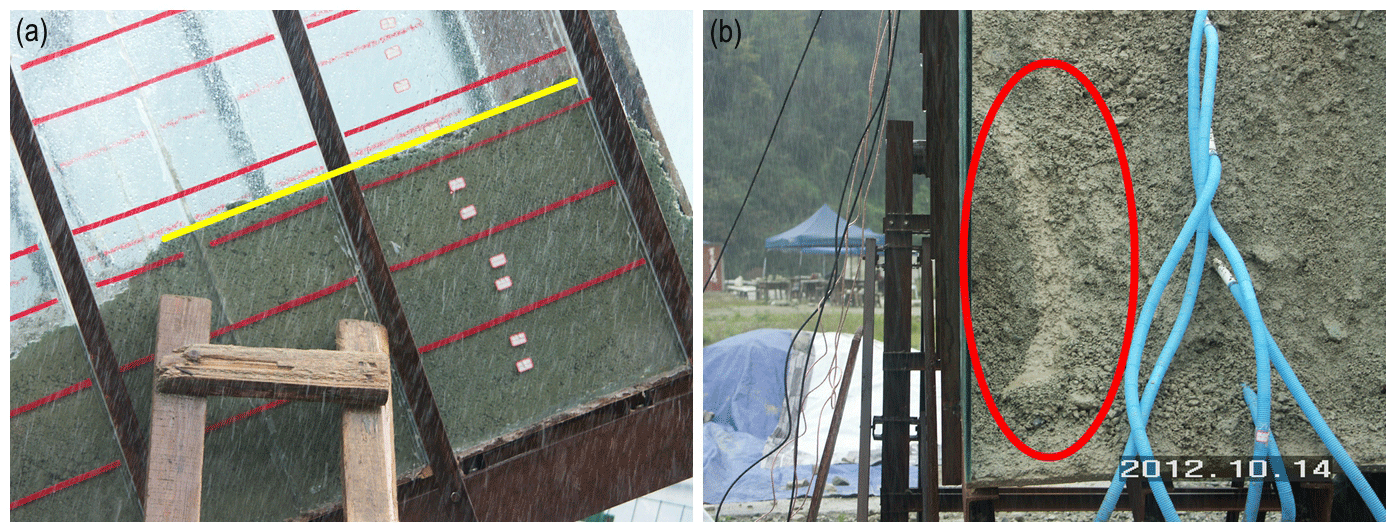
Figure 4Similarity of process of landslide initiation. (a) Shallow soil is compacted. (b) Muddy water is generated.

Figure 5Process of landslide initiation (IDD of 1.54–1.63 g cm−3). (a) Soil of the superficial layer slowly slides. (b) A small-scale slip occurs. (c) The overall slide is motivated.
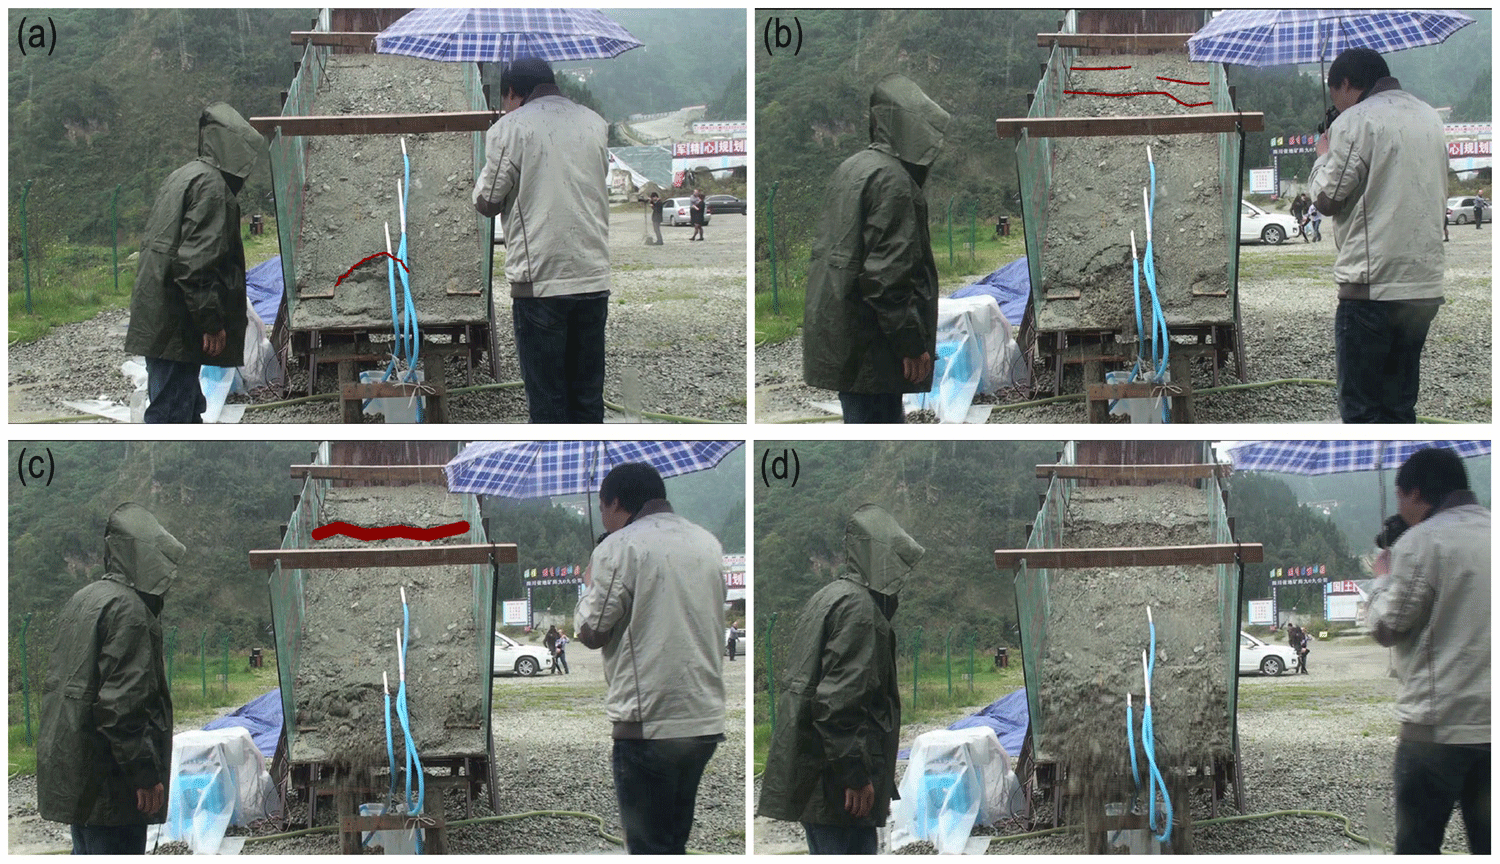
Figure 6 Process of landslide initiation (IDD of 1.72 g cm−3). (a) Shearing opening appears in slope foot. (b) Cracks develop on the slope top. (c) Crack propagation. (d) Landslide is triggered.
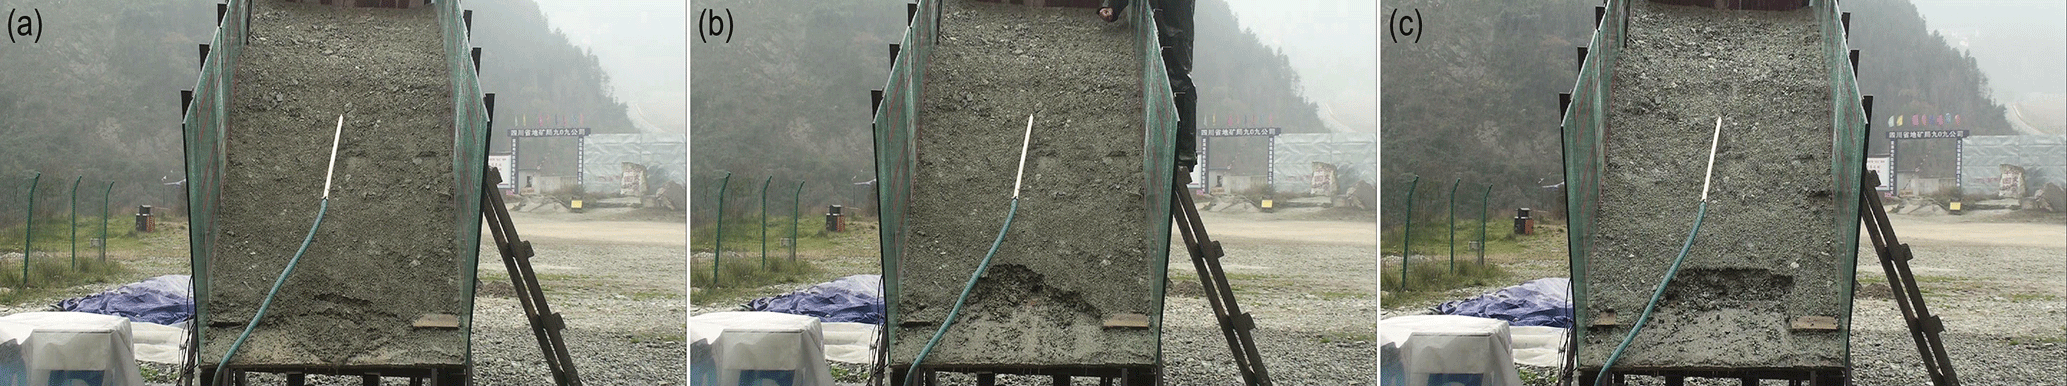
Figure 7Process of experiment (IDD of 1.81 g cm−3). (a) Shearing opening appears at the slope foot. (b) Muddy water flows. (c) Fine particles disappear and coarse particles are exposed.
According to the camera recording, when IDD is 1.54–1.72 g cm−3 except 1.81 g cm−3, the landslide can be triggered by rainfall. The processes of the occurrences of landslides have their similarities and differences. The similarity is that at the beginning of rainfall, the shallow soil is compacted by seepage force and soil weight (Fig. 4a). In addition, during the rainfall duration, surface runoff cannot be observed, whereas muddy water appears and overflows the slope foot (Fig. 4b). This phenomenon indicates that the entire rainfall can seep into the internal soil, followed by the formation of subsurface flow. At this moment, the fine particles along the percolation paths begin to move in translation and rotation under the action of gravity (Gao et al., 2011; Igwe, 2015) and cause a re-distribution of the microstructure of soil (Chen et al., 2004; Zhuang et al., 2015). These moving fine particles will fill the interval space of porosity, even block the downstream channels of the seepage path (Fang et al., 2012; McKenna et al., 2011), which can lead to a decrease in void ratio and an increase in the pore water pressure (Gao et al., 2011).
The difference in experiments is time and mode of the occurrence of landslides. When IDD is 1.54–1.63 g cm−3, the total time of landslide occurrence is 30–40 min, including the time of partial sliding and overall sliding. The processes of landslide occurrence involve three steps. Firstly, the partial soil of the superficial layer slowly slides in the shape of mudflow when rainfall duration is about 8 min (Fig. 5a). Secondly, small-scale slips occur in a layered manner (Fig. 5b). Thirdly, the overall sliding is motivated when the rainfall duration is about 33 min (Fig. 5c). The above processes represent the mode of landslide is the progressive failure. This mode reflects four mechanisms. Firstly, in the early stage of rainfall, the shearing strength of shallow soil decreases and partial sliding occurs due to the rapid infiltration of rainfall. Secondly, partial sliding takes away the saturated soil, which causes the internal soil exposed on the surface. Thirdly, the exposed soil slides again, which can change the geometrical shape of the slope and prompt the shearing force increase. Fourthly, when the increase in the shearing force destroys the balance of the slope, overall sliding will occur.
When IDD is 1.72 g cm−3, the total time of landslide occurrence is 18 min. Landslide formation process is divided into three steps. Firstly, the shear opening gradually occurs accompanied by the visible cracks developing in the slope foot (Fig. 6a). Secondly, surface cracks begin to develop on the slope top (Fig. 6b). Finally, the landslide is initiated and is accompanied by the instantaneous propagation of cracks (Fig. 6c–d), which takes 5 s. The above steps imply the mode of landslide is the tractive failure. The mechanism includes three aspects. Firstly, an increase in soil weight causes an increase in shearing force, which breaks the equilibrium state of slope, so cracks can develop in the slope foot and cause the shear opening. Secondly, the instability of the slope continues to deteriorate, which leads to new cracks located at the top of the slope. Thirdly, the overall sliding is triggered by crack extension.
When IDD is 1.81 g cm−3, the shearing opening appears at the slope foot (Fig. 7a). Next, the muddy water can flow from the slope foot (Fig. 7b). Even though on the slope surface fine particles disappear and coarse particles are exposed, rainfall could not trigger a landslide (Fig. 7c). One reason is that the fine particles within the surface soil move with the water seepage. After the fine particles of the shallow soil are all migrated, the soil skeleton begins to consist of coarse particles. This skeleton can provide some smooth paths for the subsurface runoff. The other reason is that when the soil is in a dense state, the change of volume moisture content is limited due to the low permeability. Even if the soil shows a small shearing strain, the loss of pore water pressure is difficult to recover in time due to the lack of rainfall infiltration. Therefore, the shearing strength can remain unchanged.
Macroscopic phenomena of experiments imply that the initial dry density can influence the time and mode of landslide occurrence. It coincides with the existing research (Iverson et al., 2000). As the IDD increases from 1.54 to 1.72 g cm−3, the failure mode of soil changes from progressive sliding to traction sliding. When IDD is less than 1.63 g cm−3, partial sliding is a dominant phenomenon that affects the entire deformation failure. When IDD is 1.72 g cm−3, shear opening and cracks are responsible for deformation failure. Although the total time of overall sliding of loose soil is longer than that of relatively dense soil, the time of partial sliding is shorter. This difference may be associated with failure modes, relative timescales of shearing strength loss and changes of pore water pressure.
3.2 Volume moisture content (VMC) and pore water pressure (PWP)
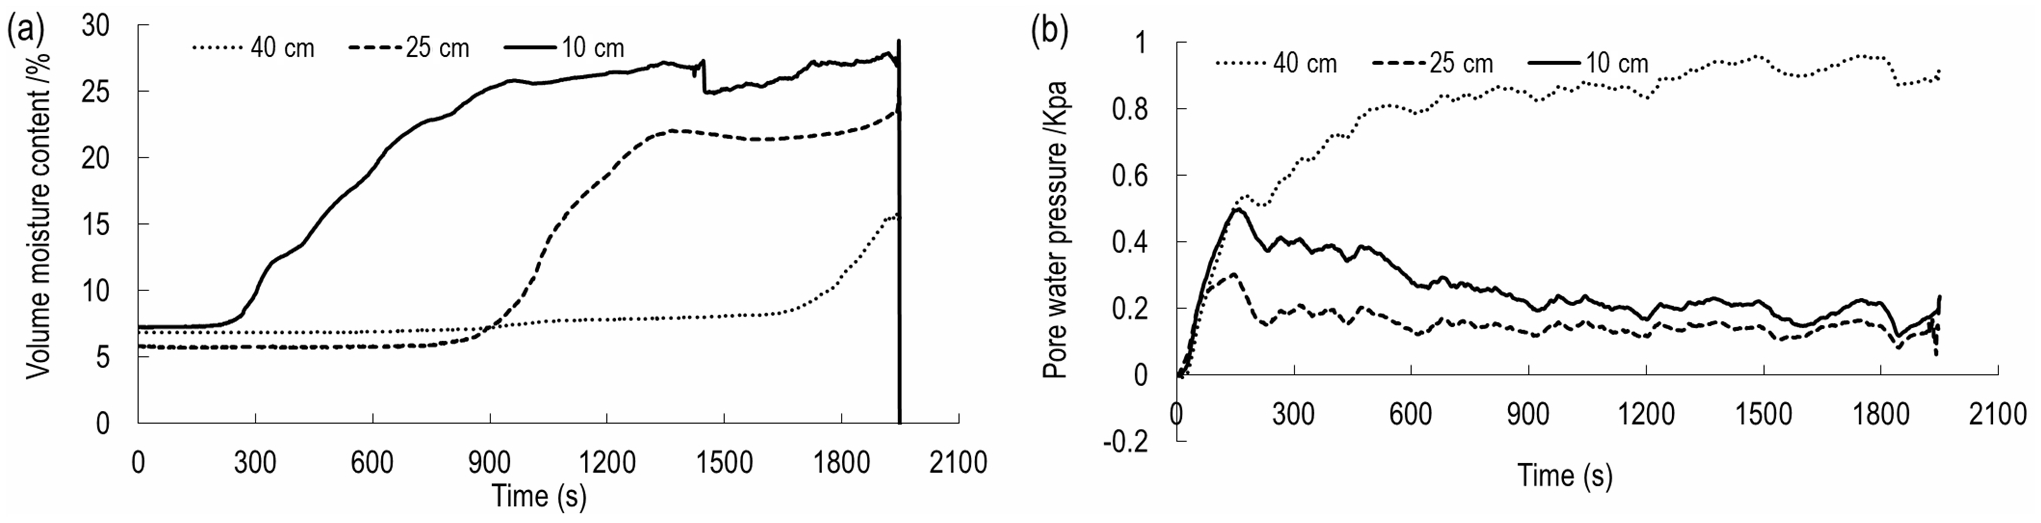
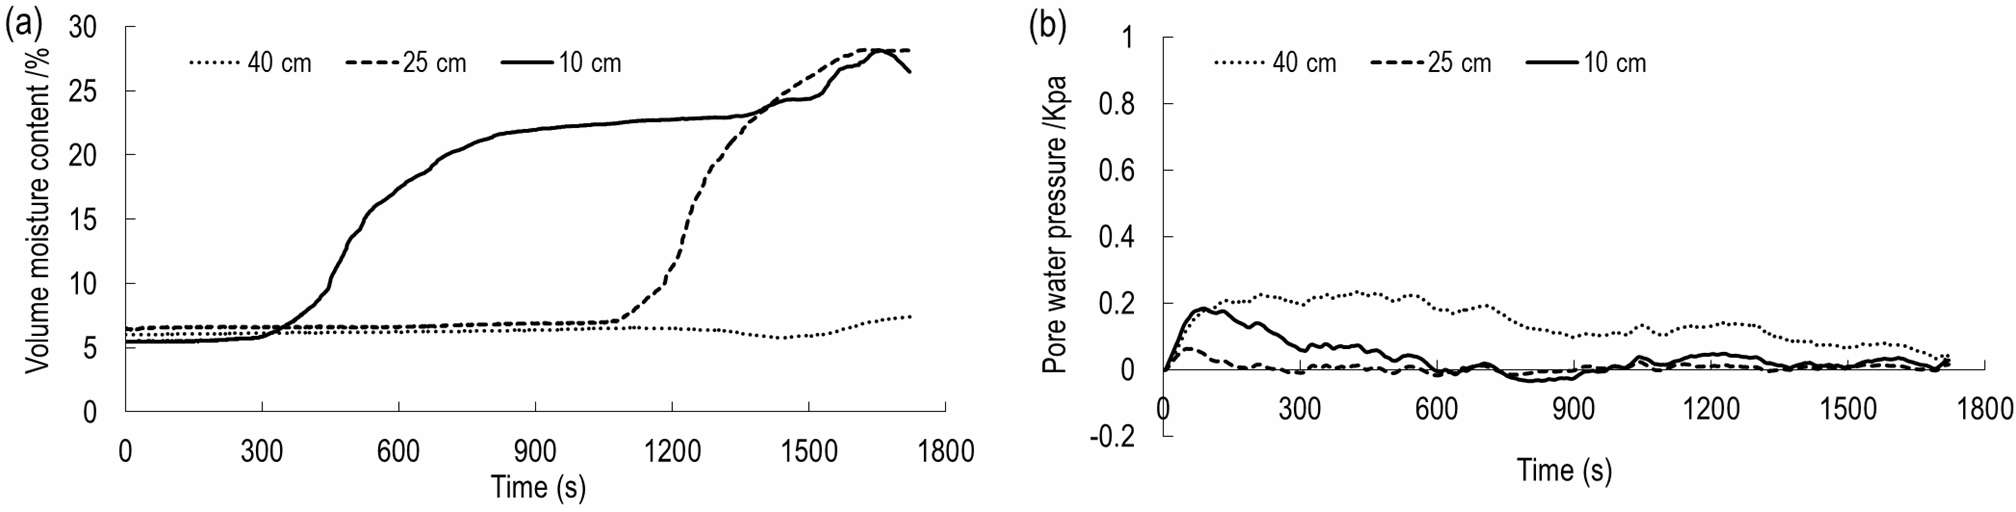
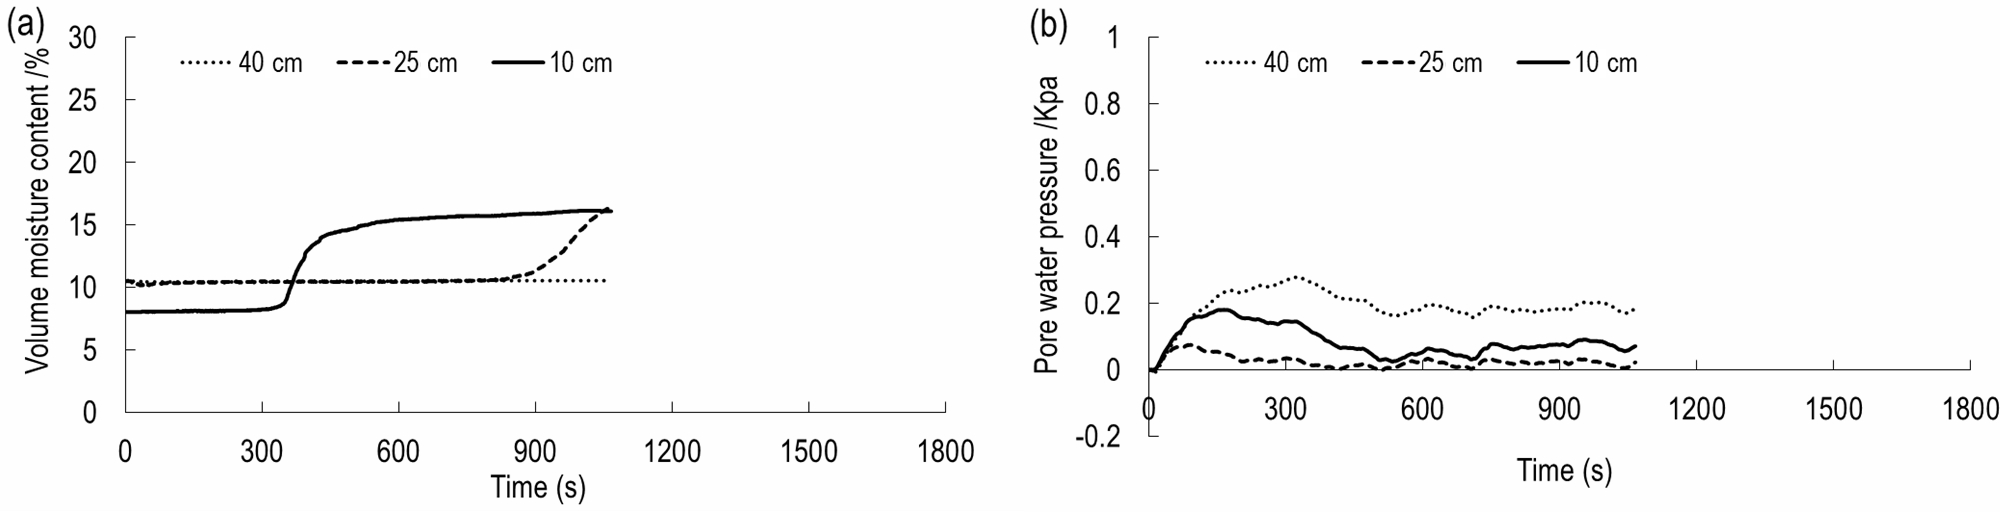
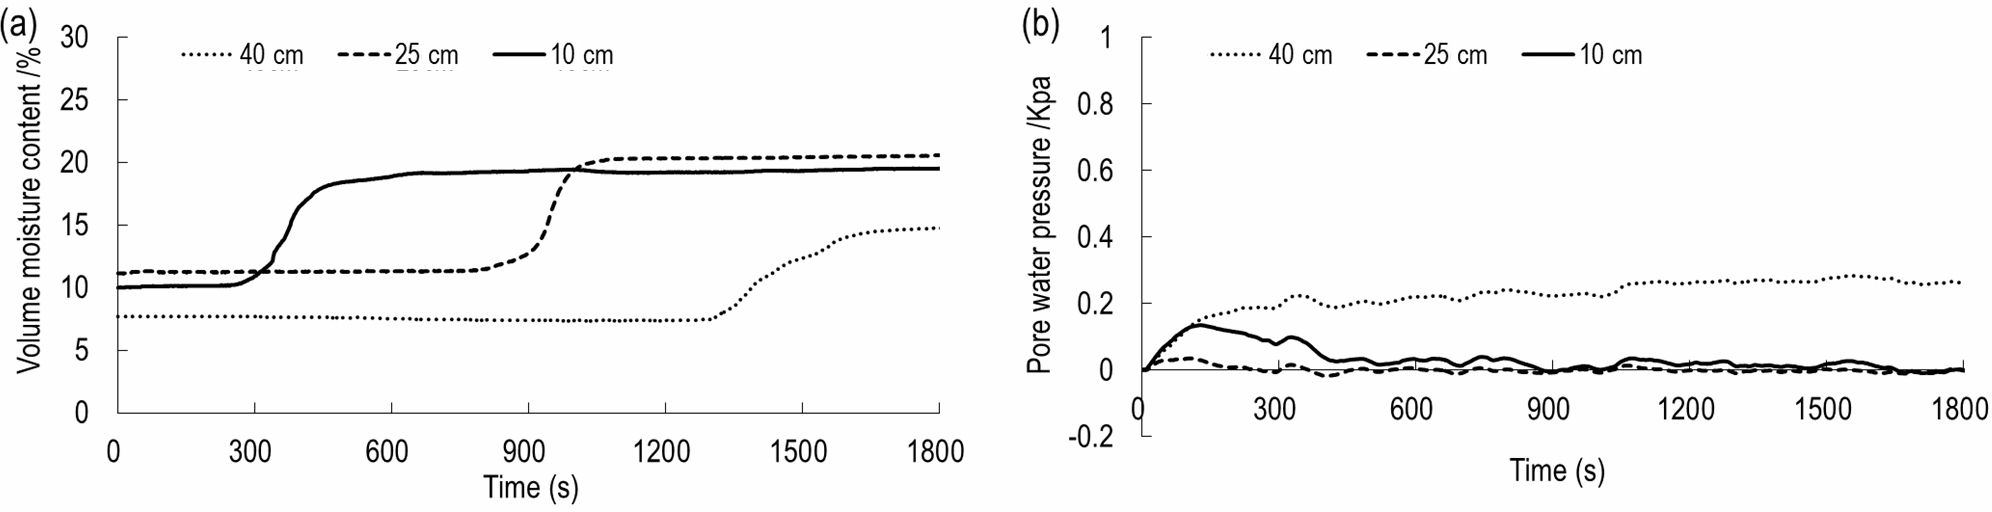
The maximum x label in Figs. 8–10 represents the total time for the occurrence of the landslide. This value is also the rainfall duration. In order to compare with Figs. 8–10, the maximum x label in Fig. 11 is 1800 s. As shown in Figs. 8 to 11, the first change is VMC of the depth of 10 cm, followed by VMC of the depth of 25 and 40 cm. This change order of VMC is related to the process of rainfall penetration. Specifically, rainfall penetration is from shallow soil to deep soil. Therefore, the VMC of 10 cm can increase first. The variation of VMC at the depth of 10–25 cm exhibits a similar tendency. The tendency consists of three phases. Since the beginning of rainfall, VMC has been in a constant state. When the rainfall seeps into soil, VMC increases rapidly and eventually grows steadily. The time when VMC of the depth of 10 cm begins to increase is 203, 292, 313 s for 1.54–1.72 g cm−3. This result indicates these three densities have different permeability, the higher density, the lower hydraulic conductivity and the longer time of penetration. The time when VMC of the depth of 25 cm begins to increase is about 900 s for 1.54–1.72 g cm−3.
When IDD is 1.54 and 1.63 g cm−3, VMC at a depth of 40 cm initially remains stable and eventually shows an increasing trend. Change trend of 1.54 g cm−3 is more obvious than that of 1.63 g cm−3. When IDD is 1.72 g cm−3, VMC at a depth of 40 cm is almost constant. The reason is that when a landslide occurs, rain stops; at this time, no abundant water can penetrate to this depth. When IDD is 1.81 g cm−3, if the rainfall duration is less than 1300 s, VMC of 40 cm remains stable. When the duration is about 1300 s, compared to Figs. 8–10, VMC of 40 cm starts to increase. This difference between Fig. 11 and other three figures may be attributed to the following aspect. As mentioned in Sect. 3.1, the landslide cannot be triggered by rainfall. Therefore, there is sufficient time for rainfall to penetrate to a depth of 40 cm, although the hydraulic conductivity is low. However, when the rainfall time is greater than 1800 s, VMC of 10–40 cm keeps constant. This means, due to the accumulation of fine particles, there may be an impermeable layer in the depth of 0–10 cm. This layer can prevent the rain from penetrating to depths deeper than 10 cm. When rainfall continues, rainfall can be converted into the subsurface runoff, flowing out of the soil skeleton that consists of coarse particles.
As shown in Figs. 8 to 11, PWP at a depth of 10–25 cm has a similar tendency. This tendency consists of a sharp increase at first, a rapid decrease and a continuous dynamic fluctuation. However, the variation of PWP is inconsistent with the variation of VMC. Before VMC increases, PWP with the depth of 10–25 cm has experienced the sharp increase and decrease. Soil inhomogeneity may contribute to this inconsistency. As mentioned in Sect. 3.1, at the beginning of experiment, the surface layer less than 10 cm is compacted by seepage force and soil weight. The compaction and penetration process leads to the increase in the force acting on the subsoil, which causes the increase in PWP. During the saturation process of the surface layer, the fine particles of this layer are taken away and fill the porosity of the subsoil, which prompt PWP to the peak value quickly. When the surface soil slowly moves or cracks begin to develop in the slope foot, the internal deformation due to dilation will occur, which causes PWP releases. When VMC increases, PWP has a dynamic fluctuation. This fluctuation may be attributed to the rearrangement of the soil skeleton.
The curve of PWP with a depth of 40 cm is drawn above that of 10–25 cm. The variation has no significant increase or decrease but exhibits a smooth fluctuation. During the whole rainfall duration, the corresponding VMC shows that the soil is not saturated. Therefore, the pore pressure of 40 cm is dominated by air pressure.
3.3 Microscopic property of gravel soil
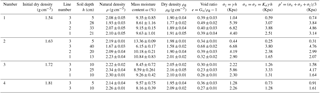
As shown in Table 2, when IDD is from 1.54 to 1.72 g cm−3, the natural density and the dry density with the depth of 5–20 cm are larger than those before the tests, and the void ratio is less than that before the tests. Of these three lines, the line 1 has the greatest change rate in density. When IDD is 1.63 cm3, the density of 40 cm is less than the value before the test. When IDD is 1.81 g cm−3, the densities with the depth of 5–10 cm are increased compared to those before the test.
Table 2Density and void ratio of gravel soil with initial dry density 1.54–1.81 g cm−3.
As shown in Sect. 2.2.1, P5 before the test is 55.32 %. Therefore, coarse particles and fine particles interact to form the soil skeleton, which affects changes in dry density (Guo, 1998) and landslide characteristics (Li et al., 2014). In this paper, the particle content before and after the test is compared to understand the change in the void ratio. As shown in Table 3, when IDD is 1.54 and 1.63 g cm−3, the loss of P0.075 of the shallow soil of line 3 is the largest, followed by that of line 1. The result indicates that the fine particles of surface soil at the slope top begin to move along the direction of gravity firstly. When subsurface runoff occurs, these particles begin to move to the slope foot. This process causes two results. One is that the porosity of the position related to particle migration increases. The other is that the porosity filled by fine particles decreases (Fang et al., 2012; McKenna et al., 2011), which is the seepage-compacting effect (Jiang et al., 2013). As a result, the shallow soil of the slope top is looser than that of the slope foot. The loss of P0.075 (ΔP0.075, which is negative) at the slope top decreases significantly with depth. Specifically, it is about −1.26 % at the depth of 40 cm. It implies that the depth of rainfall infiltration is about 40 cm. In the case of IDD of 1.72–1.81 g cm−3, the variation of P0.075 of the slope top changes from negative to positive accompanied by an increase in depth. This trend indicates that the fine particles may concentrate at the depth of 5–25 cm. The depth range of particle concentration is 10–25, 5–10 cm for 1.72 and 1.81 g cm−3.
Table 3Variation of coarse- and fine-particle contents.
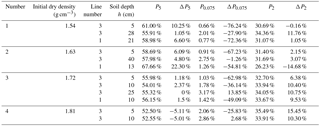
Note: the positive value of the change represents an increase while the negative value represents a decrease.
On the slope top, P5 at a depth of 5 cm changes from positive to negative with an increase IDD, whose range is from −5.11 % to 10.25 %. The reason is that the loss of fine particles contributes to the relative increase in the content of coarse particles. Both P0.075 on the slope top and P0.075 on the slope foot decrease. The range of ΔP0.075 is from −25.83 % to −76.24 % and from −49.09 % to −72.36 % accordingly. The relationship between ΔP0.075 and ρd is shown in Fig. 12. The regression equation is as follows: , , and R2 is 0.8827 and 0.8199, respectively. The result indicates that ΔP0.075 has a significant correlation with ρd. Specifically, the greater initial dry density causes the smaller loss of P0.075. When IDD is 1.53 g cm−3, P2 decreases and its change value is −0.16 %. When IDD is 1.63–1.81 g cm−3, P2 increases, and the range of the change is 2.15 %–15.45 %. The reason for the loss of P0.075 and P2 is that the fine particles are taken away by subsurface runoff. The reason for the increase in P2 may be that the particles larger than 2 mm roll downward, which causes a relative increase in P2.

3.4 Critical state of gravel soil
3.4.1 Definition of critical state and calculation of critical void ratio
Under the action of continuous shear load, the state of soil is critical when principal stress q and volume strain εv tends to be stable (Casagrande, 1936; Liu et al., 2011; Roscoe et al., 1963; Schofield and Wroth, 1968). In the triaxial shear tests, when the axial strain reaches 16 %, the deviation stress is stable, and the absolute value of the ratio of εv to the present εv is less than 0.01; at this time, the soil enters the critical state (Liu et al., 2012). Formula (2) indicates that there is a certain relationship between the current void ratio e and εv, wherein e0 is the initial void ratio (Xu et al., 2009). Thus, the critical void ratio ec also can be calculated by formula (2).
3.4.2 The critical state line in the ec–p′ plane
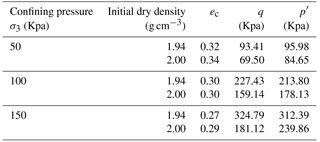
Table 4 shows ec, q and p′ for two initial dry densities: 1.94 and 2.00 g cm−3. As shown in Table 4, when the confining pressure is same, two densities have approximately similar ec value. This result has the consistent principle with existing research (Gabet and Mudd, 2006; Iverson et al., 2000). The principle is that the soil with the same granular composition can obtain the approximate critical void ratio under uniform stress conditions (Casagrande, 1936; Roscoe et al., 1963; Schofield and Wroth, 1968).
The fitting curve of ec and lnp′ is shown in Fig. 13a. The correlation coefficient is 0.8566, which indicates a statistically significant relationship between ec and p′. According to the normalized residual probability, the P value of 0.964 is greater than the selected significance level, which indicates that the residuals follow a normal distribution. Therefore, the mathematical expression of ec–lnp′ of gravel soil is as follows:
The fitting cure of ec and lnp′ represents the critical state of soil. It can divide the graphical space into two states. The space above this curve is the contractive zone, and the space below this curve is the dilative zone. If the state parameter (e, p′) is determined, the soil state can be judged by this line (Gabet and Mudd, 2006; Iverson et al., 2000).
3.4.3 The critical state line in the q–p′ plane
The fitting curve of q and the p′ is shown in Fig. 13b. The correlation coefficient is 0.9465, which indicates a statistically significant relationship between q and p′. The mathematical expression of q–p′ is as follows:

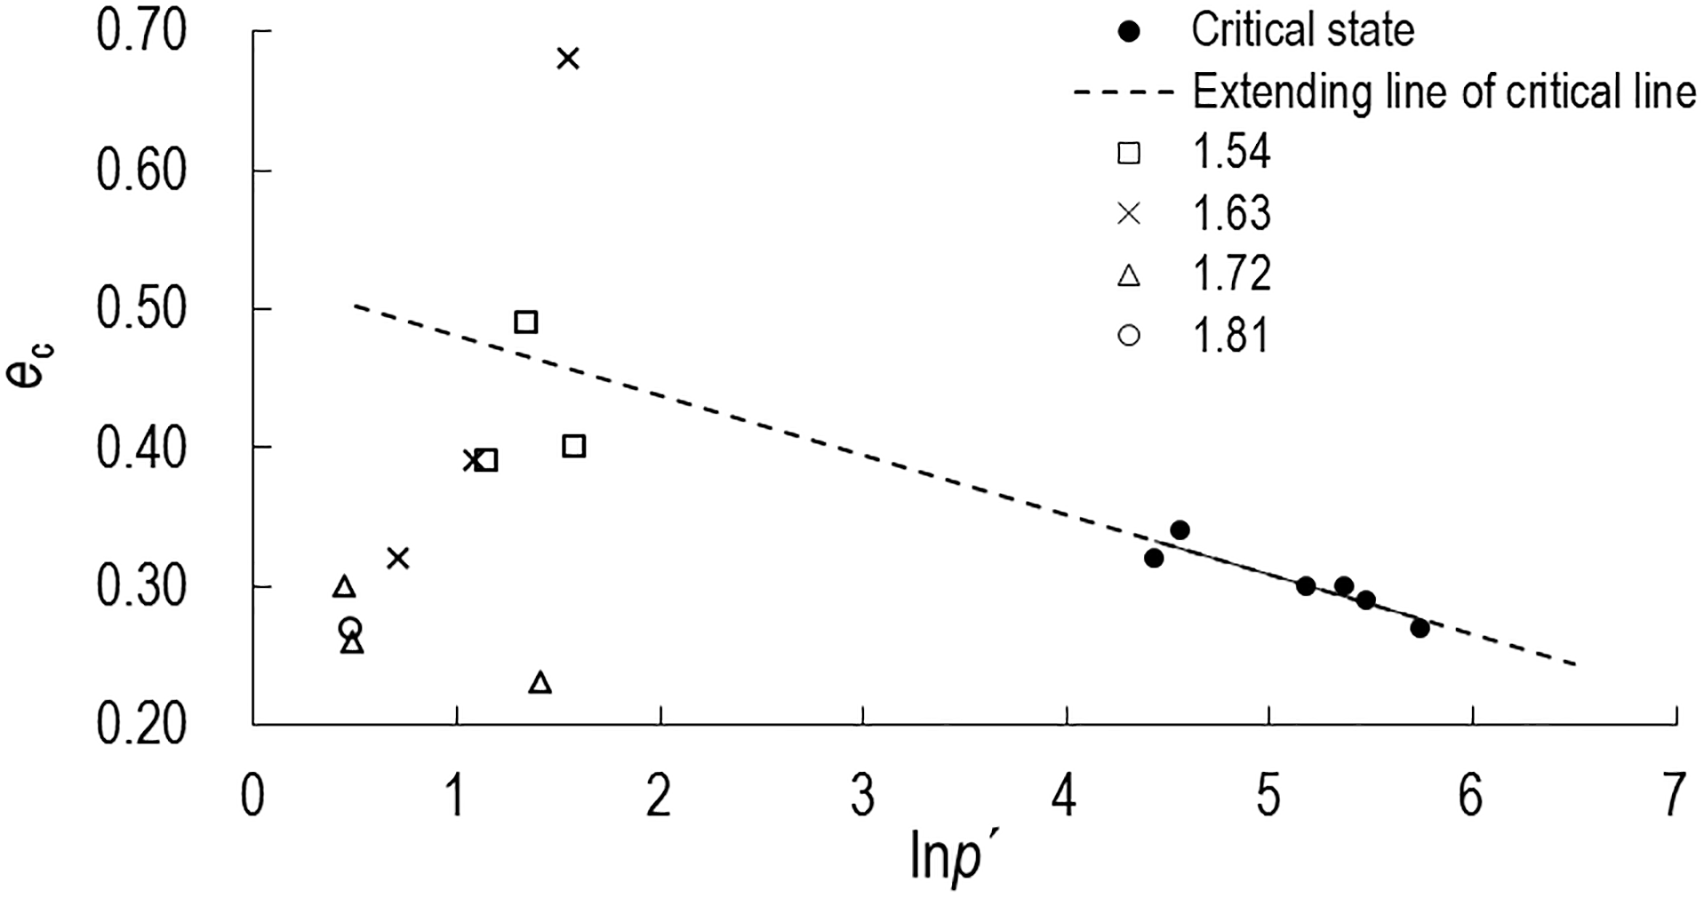
The relative position of the state parameter (e, p′) at the critical state line is shown in Fig. 14. The critical states are from Table 4 and represented by filled circles, and the state parameters of four densities are from Table 2 and represented by the hollow rectangle, cross-shape, hollow triangle and circle. Figure 14 shows that when IDD is 1.54 and 1.63 g cm−3, contraction occurs at 28 and 40 cm of line 3. In addition, dilation appears in the remaining positions. These positions include the surface layer of line 3 with the depth of 5–10 cm, the depth of 20–33 cm of line 2 and the depth of 10–21 cm of line 1. The results show that dilation and contraction are two types of the mechanical state of gravel soil when the landslide initiates. Dilation is the primary type.
In this research, at the beginning of rainfall, the shallow soil is compacted by seepage force and soil weight. The consequent contraction causes the increase in pore water pressure. However, the process of the rapid rise of PWP is short. After PWP reaches the peak, PWP begins to release. The reason is that the surface soil slowly moves or cracks begin to develop in the slope foot, which causes the sliding force increase. Subsequently, the effective stress decreases and the shearing deformation occurs. At this moment, the loss of shearing strength because of strain softening can be restored due to the decrease in PWP. Soil deformation will stop eventually. If there is the sufficient water penetration, pore water pressure can recover, and the soil deformation can continue. It can be seen that the loss and recovery of PWP are the reasons for the dynamic fluctuations of PWP. When soil is dense (relative density ) and the infiltration rate is less than the rainfall intensity, the soil will not reach the critical state. At this point, the slope can remain stable. The macroscopic phenomenon of soil deformation is mainly local deformation, such as circumferential cracks and partial collapse. If the infiltration rate is greater than the rainfall intensity, the abundant rainfall can break the mechanical balance of slope. However, its process still takes a long time. Therefore, the macroscopic deformation is progressive, such as frequent sliding. When the soil is in a medium dense state (), the loss of the pore water pressure due to dilation will be recovered, and the shearing deformation will continue. At this moment, the macroscopic deformation will be a sudden failure (Dai et al., 2000, 1999b).
The initial dry density can influence the time and mode of landslide occurrence. When IDD is 1.54–1.72 g cm−3, the failure mode of soil changes from progressive sliding to traction sliding. When IDD is less than 1.63 g cm−3, partial sliding is a dominant phenomenon that affects the entire deformation failure. When IDD is 1.72 g cm−3, shear opening and cracks are responsible for deformation failure. Although the total time of overall sliding of loose soil is longer than that of relatively dense soil, the time of partial sliding is shorter.
During the experiments, the first change is VMC of the depth of 10 cm, followed by VMC of the depth of 25 and 40 cm. The variation of PWP is inconsistent with the variation of VMC.
The occurrence of landslides is accompanied by change in density and void ratio. The slope foot has the greatest change rate in density. The migration of fine particle and the rearrangement of coarse–fine particle contributed to the reorganization of the microscopic structure, which might be the main reason for the variation of density and void ratio.
The mathematical expression of the critical state line of gravel soil is ec=0.5241–0.04304lnp′. Mechanical state of gravel soil can be determined by the relative position between the state parameter (e, p′) and the critical state line. Dilation and contraction are two types of soil state when the landslide initiates. Dilation is the primary type.
All data in this study are available by contacting the first author: 01llp@163.com.
LL carried out the artificial model tests and the triaxial tests, analyzed the experimental data and wrote the manuscript. YY participated in the implementation of the triaxial tests. ZY and JH participated in the implementation of the tests and analyzed part of data. YZ provided the guidance on the tests as well as the content and the structure of the manuscript. DHSZ proposed the suggestions on the tests.
The authors declare that they have no conflict of interest.
This study was funded by the National Natural Science Foundation of China
(nos. 41071058, 41402272, 51609041), Disaster Prevention and Mitigation and
Engineering Safety Key Laboratory Project of Guangxi Province (no.
2016ZDX09) and the Natural Scientific Project of Guangxi Zhuang Autonomous Region (no. 2018GXNSFAA138187).
Edited by: Orencio Duran Vinent
Reviewed by: two anonymous referees
Been, K. and Jefferies, M. G.: A state parameter for sands, Geotechnique, 35, 99–112, 1985.
Casagrande, A: Characteristics of cohesionless soils affecting the stability of slopes and earth fills, Journal of the Boston Society of Civil Engineers, 23, 13–32, 1936.
Chen, N. S., Cui, P., Wang, X. Y., and Di, B. F.: Testing study on strength reduction of gravelly soil in triggering area of debris flow under earthquake, Chinese Journal of Rock Mechanics and Engineering, 23, 2743–2747, 2004 (in Chinese).
Chen, N. S., Zhou, W., Yang, C. L., Hu, G. S., Gao, Y. C., and Han, D.: The processes and mechanism of failure and debris flow initiation for gravel soil with different clay content, Geomorphology, 121, 222–230, https://doi.org/10.1016/j.geomorph.2010.04.017, 2010.
Chen, N. S., Zhu, Y. H., Huang, Q., Lqbal, J., Deng, M. F., and He, N.: Mechanisms involved in triggering debris flows within a cohesive gravel soil mass on a slope: a case in SW China, J. Mt. Sci., 14, 611–620, https://doi.org/10.1007/s11629-016-3882-x, 2017.
Chen, Z. Y., Zhou, J. X., and Wang, H. J.: Soil Mechanics, 19th Edn., Tsinghua University Press, Beijing, 2012.
Cui, P., Zhuang, J. Q., Chen, X. C., Zhang, J. Q., and Zhou, X. J.: Characteristics and countermeasures of debris flow in Wenchuan area after the earthquake, Journal of Sichuan University (Engineering Science Edition), 42, 10–19, 2010 (in Chinese).
Cui, P., Xiang, L. Z., and Zou, Q.: Risk assessment of highways affected by debris flows in Wenchuan earthquake area, J. Mt. Sci., 10, 173–189, https://doi.org/10.1007/s11629-013-2575-y, 2013.
Dai, F. C., Lee, C. F., and Wang, S. J.: Analysis of rainstorm-induced slide-debris flows on natural terrain of Lantau Island, Hong Kong, Eng. Geol., 51, 279–290, https://doi.org/10.1016/s0013-7952(98)00047-7, 1999a.
Dai, F. C., Lee, C. F., Wang, S. J., and Feng, Y. Y.: Stress-strain behaviour of a loosely compacted voleanic-derived soil and its significance to rainfall-induced fill slope failures, Eng. Geol., 53, 359–370, https://doi.org/10.1016/s0013-7952(99)00016-2, 1999b.
Dai, F. C., Chen, S. Y., and Li, Z. F.: Analysis of landslide initiative mechanism based on stress-strain behavior of soil, Chinese Journal of Geotechnical Engineering, 22, 127–130, 2000 (in Chinese).
Fang, H., Cui, P., Pei, L. Z., and Zhou, X. J.: Model testing on rainfall-induced landslide of loose soil in Wenchuan earthquake region, Nat. Hazards Earth Syst. Sci., 12, 527–533, https://doi.org/10.5194/nhess-12-527-2012, 2012.
Fleming, R. W., Ellen, S. D., and Algus, M. A.: Transformation of dilative and contractive landslide debris into debris flows-An example from marin County, California, Eng. Geol., 27, 201–223, 1989.
Gabet, E. J. and Mudd, S. M.: The mobilization of debris flows from shallow landslides, Geomorphology, 74, 207–218, https://doi.org/10.1016/j.geomorph.2005.08.013, 2006.
Gao, B., Zhou, J., and Zhang, J.: Macro-meso analysis of water-soil interaction mechanism of debris flow starting process, Chinese Journal of Rock Mechanics and Engineering, 30, 2567–2573, 2011 (in Chinese).
Guo, Q. Q.: Engineering features and utilization of coarse-grained soil, 1st Edn., The Yellow River Water Conservancy Press, Zhengzhou, 1998 (in Chinese).
Igwe, O.: The compressibility and shear characteristics of soils associated with landslides in geologically different localities – case examples from Nigeria, Arab. J. Geosci., 8, 6075–6084, https://doi.org/10.1007/s12517-014-1616-3, 2015.
Iverson, N. R., Mann, J. E., and Iverson, R. M.: Effects of soil aggregates on debris-flow mobilization: Results from ring-shear experiments, Eng. Geol., 114, 84–92, https://doi.org/10.1016/j.enggeo.2010.04.006, 2010.
Iverson, R. M., Reid, M. E., and Lahusen, R. G.: Debris-flow mobilization from landslides, Annu. Rev. Earth Pl. Sc., 25, 85–138, 1997.
Iverson, R. M., Reid, M. E., Iverson, N. R., LaHusen, R. G., and Logan, M.: Acute sensitivity of landslide rates to initial soil porosity, Science, 290, 513–516, https://doi.org/10.1126/science.290.5491.513, 2000.
Jiang, Z. M., Wang, W., Feng, S. R., and Zhong, H. Y.: Experimental of study on the relevance between stress state and seepage failure of sandy-gravel soil, Shuili Xuebao, 44, 1498–1505, 2013 (in Chinese).
Li, Y., Liu, J. J., Su, F. H., Xie, J., and Wang, B. L.: Relationship between grain composition and debris flow characteristics: a case study of the Jiangjia Gully in China, Landslides, 12, 19–28, https://doi.org/10.1007/s10346-014-0475-z, 2014.
Liang, H., He, S. M., Lei, X. Q., Bi, Y. Z., Liu, W., and Ouyang, C. J.: Dynamic process simulation of construction solid waste (CSW) landfill landslide based on SPH considering dilatancy effects, B. Eng. Geol. Environ., 2, 1–15, https://doi.org/10.1007/s10064-017-1129-x, 2017.
Liu, E. L., Chen, S. S., Li, G. Y., and Zhong, Q. M.: Critical state of rockfill materials and a constitutive model considering grain crushing, Rock and Soil Mechanics, 32, 148–154, 2011 (in Chinese).
Liu, E. L., Qin, Y. L., Chen, S. S., and Li, G. Y.: Investigation on critical state of rockfill materials, Shuili Xuebao, 43, 505–511, 2012 (in Chinese).
McKenna, J. P., Santi, P. M., Amblard, X., and Negri, J.: Effects of soil-engineering properties on the failure mode of shallow landslides, Landslides, 9, 215–228, https://doi.org/10.1007/s10346-011-0295-3, 2011.
Qu, Y. P., Tang, C., Wang, J. L., Tang, H. X., Liu, Y., Chen, H. L., and Huang, W.: Debris flow initiation mechanisms in strong earthquake area, Mountain Research, 30, 336–341, 2012 (in Chinese).
Reynolds, O.: On the dilatancy of media composed of rigid particles in contact, with experimental illustrations, Philos. Mag., 20, 469–481, 1885.
Roscoe, K. H., Schofield, A. N., and Thuraijajah, A.: Yielding of clays in states wetter than critical, Geotechnique, 13, 211–240, 1963.
Sassa, K.: The mechanism to initiate debris flows as undrained shear of loose sediments, Internationales Symposium Interpraevent, 73–87, 1984.
Schofield, A. N. and Wroth, C. P.: Critical state soil mechanics, University of Cambridge, 1968.
Schulz, W. H., McKenna, J. P., Kibler, J. D., and Biavati, G.: Relations between hydrology and velocity of a continuously moving landslide – evidence of pore-pressure feedback regulating landslide motion?, Landslides, 6, 181–190, https://doi.org/10.1007/s10346-009-0157-4, 2009.
Tang, C. and Liang, J. T.: Characteristics of debris flows in Beichuan epicenter of the Wenchuan earthquake triggered by rainstorm on september 24, 2008, Journal of Engineering Geology, 16, 751–758, 2008 (in Chinese).
Tang, C., Li, W. L., Ding, J., and Huang, X. C.: Field Investigation and Research on Giant Debris Flow on August 14, 2010 in Yingxiu Town, Epicenter of Wenchuan Earthquake, Earthscience-Journal of China University of Geosciences, 36, 172–180, 2011 (in Chinese).
Xie, H., Zhong, D. L., Jiao, Z., and Zhang, J. S.: Debris flow in Wenchuan quake-hit area in 2008, Mountain Research, 27, 501–509, 2009 (in Chinese).
Xu, S. H., Zheng, G., and Xu, G. L.: Critical state constitutive model of sand with shear hardening, Chinese Journal of Geotechnical Engineering, 31, 953–958, 2009 (in Chinese).
Yin, Y. P., Cheng, Y. L., Liang, J. T., and Wang, W. P.: Heavy-rainfall-induced catastrophic rockslide-debris flow at Sanxicun, Dujiangyan, after the Wenchuan Ms 8.0 earthquake, Landslides, 13, 9–23, https://doi.org/10.1007/s10346-015-0554-9, 2016.
Yu, B., Ma, Y., and Wu, Y. F.: Investigation of serve debris flow hazards in Wenjia gully of Sichuan province after the Wenchuan earthquake, Journal of Engineering Geology, 18, 827–836, 2010 (in Chinese).
Zhang, M., Hu, R. L., and Yin, Y. P.: Study of transform mechanism of landslide-debris flow with ring shear test, Chinese Journal of Rock Mechanics and Engineering, 29, 822–832, 2010 (in Chinese).
Zhu, J., Ding, J., and Liang, J. T.: Influences of the Wenchuan Earthquake on sediment supply of debris flows, J. Mt. Sci., 8, 270–277, https://doi.org/10.1007/s11629-011-2114-7, 2011.
Zhuang, J. Q., Cui, P., Hu, K. H., and Chen, X. Q.: Fine particle size moving and its effective on debris flow initiation, Mountain Research, 33, 713–720, 2015 (in Chinese).