the Creative Commons Attribution 4.0 License.
the Creative Commons Attribution 4.0 License.
 | 17 Jul 2020
The role of frost cracking in local denudation of steep Alpine rockwalls over millennia (Eiger, Switzerland)
Alessandro Lechmann
Romain Delunel
Serdar Yeşilyurt
Dmitry Tikhomirov
Christof Vockenhuber
Marcus Christl
Naki Akçar
Fritz Schlunegger
Denudation of steep rockwalls is driven by rock fall processes of various sizes and magnitudes. Rockwalls are sensitive to temperature changes mainly because thermo-cryogenic processes weaken bedrock through fracturing, which can precondition the occurrence of rock fall. However, it is still unclear how the fracturing of rock together with cryogenic processes impacts the denudation processes operating on steep rockwalls. In this study, we link data on long-term rockwall denudation rates at the Eiger (Central Swiss Alps) with the local bedrock fabric and the reconstructed temperature conditions at these sites, which depend on the insolation pattern. We then estimate the probability of bedrock for failure through the employment of a theoretical frost cracking model. The results show that the denudation rates are low in the upper part of the NW rockwall, but they are high both in the lower part of the NW rockwall and on the SE face, despite similar bedrock fabric conditions. The frost cracking model predicts a large difference in cracking intensity from ice segregation where the inferred efficiency is low in the upper part of the NW rockwall but relatively large on the lower section of the NW wall and on the SE rock face of the Eiger. We explain this pattern by the differences in insolation and temperature conditions at these sites. Throughout the last millennium, temperatures in bedrock have been very similar to the present. These data thus suggest the occurrence of large contrasts in microclimate between the NW and SE walls of the Eiger, conditioned by differences in insolation. We use these contrasts to explain the relatively low denudation rates in the upper part of the NW rockwall and the rapid denudation in the SW face and in the lower part of the NW rock face where frost cracking is more efficient.
- Article
(29547 KB) - Full-text XML
-
Supplement
(14537 KB) - BibTeX
- EndNote


Steep bare bedrock faces are a common feature of Alpine landscapes. They are situated at various elevations but are especially prominent in high-altitude environments. These rock surfaces experience a variety of physical and chemical processes, which result in the formation of new fractures and in the enlargement of existing weakness zones (Krautblatter and Moore, 2014; and references therein), which promote the denudation of these rockwalls. Previous research has resulted in the generally accepted notion that among the various mechanisms leading to rockwall denudation, rock fall and rockslide processes are the most important agents (e.g., Krautblatter et al., 2012; Moore et al., 2009), mainly because all loosened material is eventually removed by gravitational processes. In this context, laboratory experiments disclosed a close relationship between rock fracturing and temperature variations (e.g., Draebing and Krautblatter, 2019; Murton et al., 2016). In cold and permafrost areas, a set of three different but closely related physical processes have been proposed to cause rock to fracture (e.g., Haeberli et al., 1997; Walder and Hallet, 1985; Draebing et al., 2014). These include (i) thermal processes resulting in permafrost degradation by increased thawing (Haeberli et al., 1997; Harris et al., 2001; Krautblatter et al., 2013), (ii) thermal stresses (Collins and Stock, 2016; Eppes et al., 2016), and (iii) cryogenic processes including frost shattering by volumetric expansion during freezing (Matsuoka, 1990; Matsuoka and Murton, 2008) and frost cracking by ice segregation (Murton et al., 2006; Walder and Hallet, 1985). The effectiveness of cryogenic processes is governed by volumetric expansion in response to diurnal and seasonal temperature variations (Matsuoka, 2008) and ice segregation (Anderson, 1998) and by temperature gradients in the bedrock (Hales and Roering, 2009; Matsuoka and Murton, 2008). Additionally the effectiveness particularly of cryogenic processes is strongly influenced by local water availability (Andersen et al., 2015; Anderson et al., 2013; Draebing et al., 2014; Sass, 2005), which conditions the formation of ice and thus the occurrence of rock falls mainly through the increase in local stresses as ice grows (Draebing and Krautblatter, 2019; Matsuoka, 2008). This, however, requires the cooling of water and the formation of ice to occur rapidly and the pore space to be saturated with water (Walder and Hallet, 1986). These conditions limit the effective expansion to a short time window (Davidson and Nye, 1985; Draebing and Krautblatter, 2019), which rarely occurs under natural conditions as recent studies have shown (Draebing et al., 2017b). Frost cracking from ice segregation is caused by the progressive ice growth in fractures at the freezing front (Hallet et al., 1991; Matsuoka and Murton, 2008; Walder and Hallet, 1985). This process requires the supply and thus the circulation of unfrozen water in bedrock (Andersen et al., 2015; Hales and Roering, 2009; Walder and Hallet, 1985). Fracturing processes are additionally dependent on the variations in rock type and strength (Draebing and Krautblatter, 2012, 2019; Murton et al., 2016; Sanders et al., 2012), and they are influenced by discontinuities in the bedrock fabric (Draebing et al., 2014; Matsuoka, 2001). In this context, it has been documented that the fabric of rock exerts a strong control on rock falls where a higher fracture density in bedrock promotes the occurrence of rock falls and rock slides (e.g., Amitrano et al., 2012; Anderson, 1998; Draebing et al., 2017b; Matsuoka, 1990). Thus, in addition to climatic conditions, bedrock preconditioning through faulting and folding exerts a significant control on the efficiency and scale of rock fall activity (Draebing et al., 2017b; Krautblatter and Moore, 2014; Sass and Wollny, 2001). As a final, closely related mechanism, it has been shown that paraglacial adjustment of the stress field in the local bedrock can induce rock fracturing and, as a consequence, increase rock fall activity (McColl, 2012; McColl and Draebing, 2019), even up to millennia after ice degradation (Grämiger et al., 2017). Although these relationships are well understood, little is known on how rapid denudation of bedrock rockwalls has proceeded and how denudation in these settings has responded to climatic changes particularly if longer timescales spanning millennia are considered (e.g., Gruber et al., 2004a; Krautblatter et al., 2013; Krautblatter and Moore, 2014).
Here, we study the millennial-scale denudation in vertical rockwalls at the Eiger in the Swiss Alps (Fig. 1) in an effort to explore the mechanisms of denudation of these vertical headwalls and the underlying controls. To achieve these goals, we collect data about the bedrock fabric of this mountain, to illustrate how the high fracture density has preconditioned the headwall for rockfall processes to occur. We then present temperature and paleoclimate data to document that the NW and SE faces of the Eiger have experienced differences in insolation and thus contrasting microclimatic conditions. We complement this dataset with published information on in situ rockwall denudation rates on both sites of the Eiger. Denudation rates at these sites have been derived from terrestrial cosmogenic nuclide (TCN) concentrations in bedrock depth profiles. Finally, we combine this information with a simplified frost cracking model to explore how the local bedrock fabric and temperature conditions have driven the erosion of the headwalls of the Eiger.
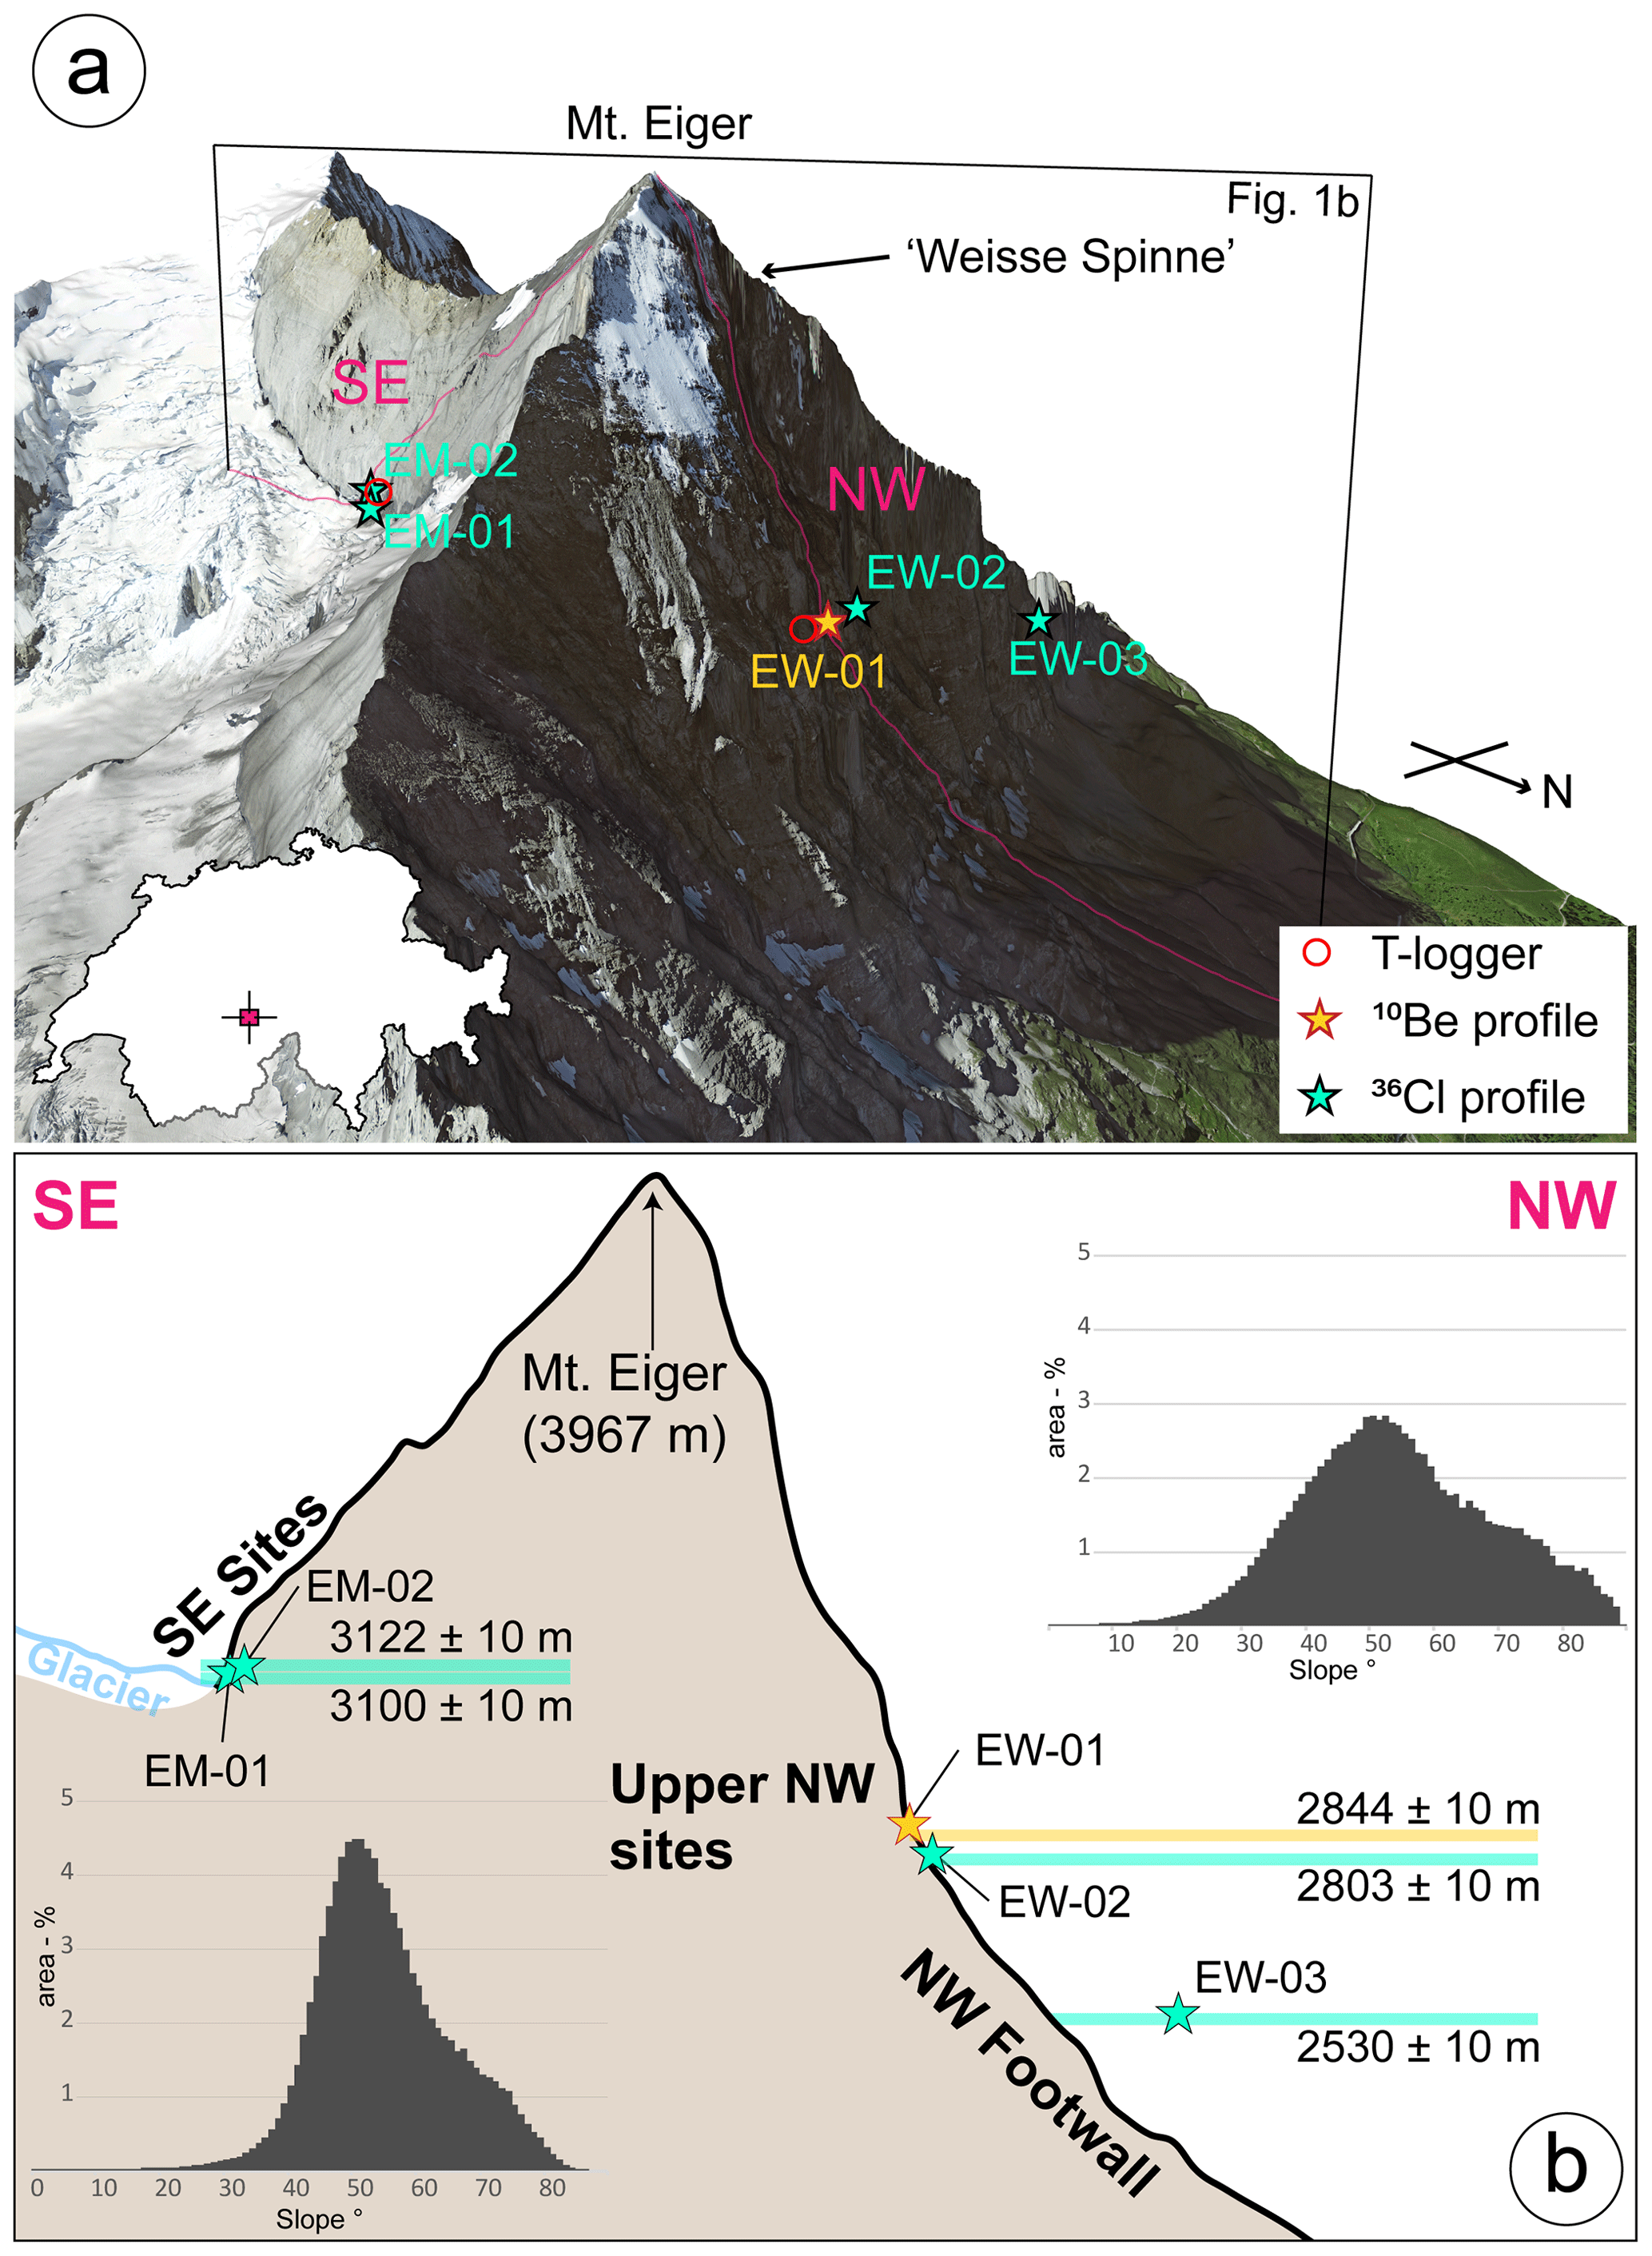
Figure 1The Eiger in the Central Swiss Alps (insert) is characterized by steep SE and NW rockwalls (a); sites for denudation rate estimations with cosmogenic nuclides and temperature loggers from Gruber et al. (2004b) are indicated. (b) Schematic section along trace highlighted in panel (a); cosmogenic sampling sites (36Cl sites from Mair et al., 2019) are projected into the section, and the elevation of sample sites is also indicated. The area used for slope angle distribution is indicated in Fig. 2b.
The Eiger mountain (Fig. 1) is characterized by a steep, approximately 1800 m high NW face. This NW rock face can be subdivided into an upper part that ranges in elevation between ca. 3950 and 2800 m a.s.l., where the wall is > 50∘ steep and nearly vertical in some locations (Figs. 1b, 2) and into a flatter base segment (lower part), which continuously grades into grassland beneath an elevation of 2200 m a.s.l. On the opposite side, the SE rock face is a several hundred meters high and equally steep rockwall (> 60∘ slope angle), and two small cirque glaciers feeding into a larger active glacier further downslope (Fig. 1a, b) border the rockwall foot.
The morphology of the Alps largely records the response of glacial erosion during the Last Glacial Maximum (LGM) and previous glaciations (Schlunegger and Norton, 2013). For the region surrounding the Eiger, the history of glacial coverage and erosion can only be inferred indirectly from reconstructions of previous ice extents, accomplished, e.g., through the dating of moraines or the mapping of ice trim lines, since there are no geomorphic data available for the Eiger itself that could be used to identify the glacial imprint on this mountain. However, a reconstruction of the glacial coverage of the Alps during the LGM (Bini et al., 2009; Kelly et al., 2004) shows that the Alpine glaciers were large enough to cover the NW rock face even above 2800 m a.s.l. These glaciers disappeared shortly before ca. 18 ka (Wirsig et al., 2016a, b), and the NW rock face of the Eiger has been largely ice-free since then. Exceptions are the small ice bodies on the uppermost part of the rockwall itself, e.g., the so-called “white spider” (Weisse Spinne; Fig. 1). These small ice fields are reminiscent of cirque glaciers. On the SE side, the upper part of the rock face situated above 3000 m a.s.l. has not been covered by ice since at least the glacial advance during the Egesen Stadial of the Younger Dryas, approximately 12–11 kyr ago (Ivy-Ochs et al., 2009). This was thus the last time when local glaciers could have covered the rockwall above 3000 m elevation.
The denudation processes and rates operating on the Eiger have already been analyzed in a previous study, where concentrations of in situ cosmogenic 36Cl were measured in rock samples collected for five depth profiles, of which four were diagnostic enough for estimating denudation rates (Mair et al., 2019). The sites were situated on the SE (sites EM-01 and EM-02, Fig. 1) and on the NW bedrock rock faces of the Eiger (sites EW-02 and EW-03; Fig. 1). On the NW rock face, site EW-03 is located in the base segment at an elevation of 2530 m a.s.l., whereas site EW-02 is situated near the base of the upper, nearly vertical part at an elevation of 2803 m a.s.l. On the SE rock face, both depth profiles are located at ca. 3100 m a.s.l. The results yielded generally high denudation rates, ranging between ca. 0.5 and ca. 3.5 mm a−1 over the last centuries to millennia (Table 1; Mair et al., 2019). On the NW rock face, denudation rates are ca. 3.5 mm a−1 at the base of the Eiger (site EW-03) and ca. 0.5 mm a−1 and thus substantially lower in the upper part of the rockwall (site EW-02). In the SE face, denudation rates range between 1.7 and 2.6 mm a−1 (sites EM-01 and EM-02). We complement this denudation rate dataset with cosmogenic nuclide data of a further depth profile, EW-01. This fifth section is situated at 2844 m a.s.l. (Swiss coordinates 643168/158980), near the base of the upper part of the NW face and thus close to site EW-02 (Table 1), for which Mair et al. (2019) reported the lowest denudation rates of ca. 0.5 mm a−1 (Fig. 1a, b). The bedrock at sites EM-01, EM-02, EW-02, and EW-03 mainly comprises limestone, and this was also the reason why Mair et al. (2019) modeled denudation rates based on 36Cl concentrations in depth profiles. Similar to Mair et al. (2019), cosmogenic samples were taken from a tunnel that connects the Jungfraubahnen railway tunnel with the rockwall surface of the Eiger. These tunnels were used to deposit material during tunnel construction between 1896 and 1905 CE.
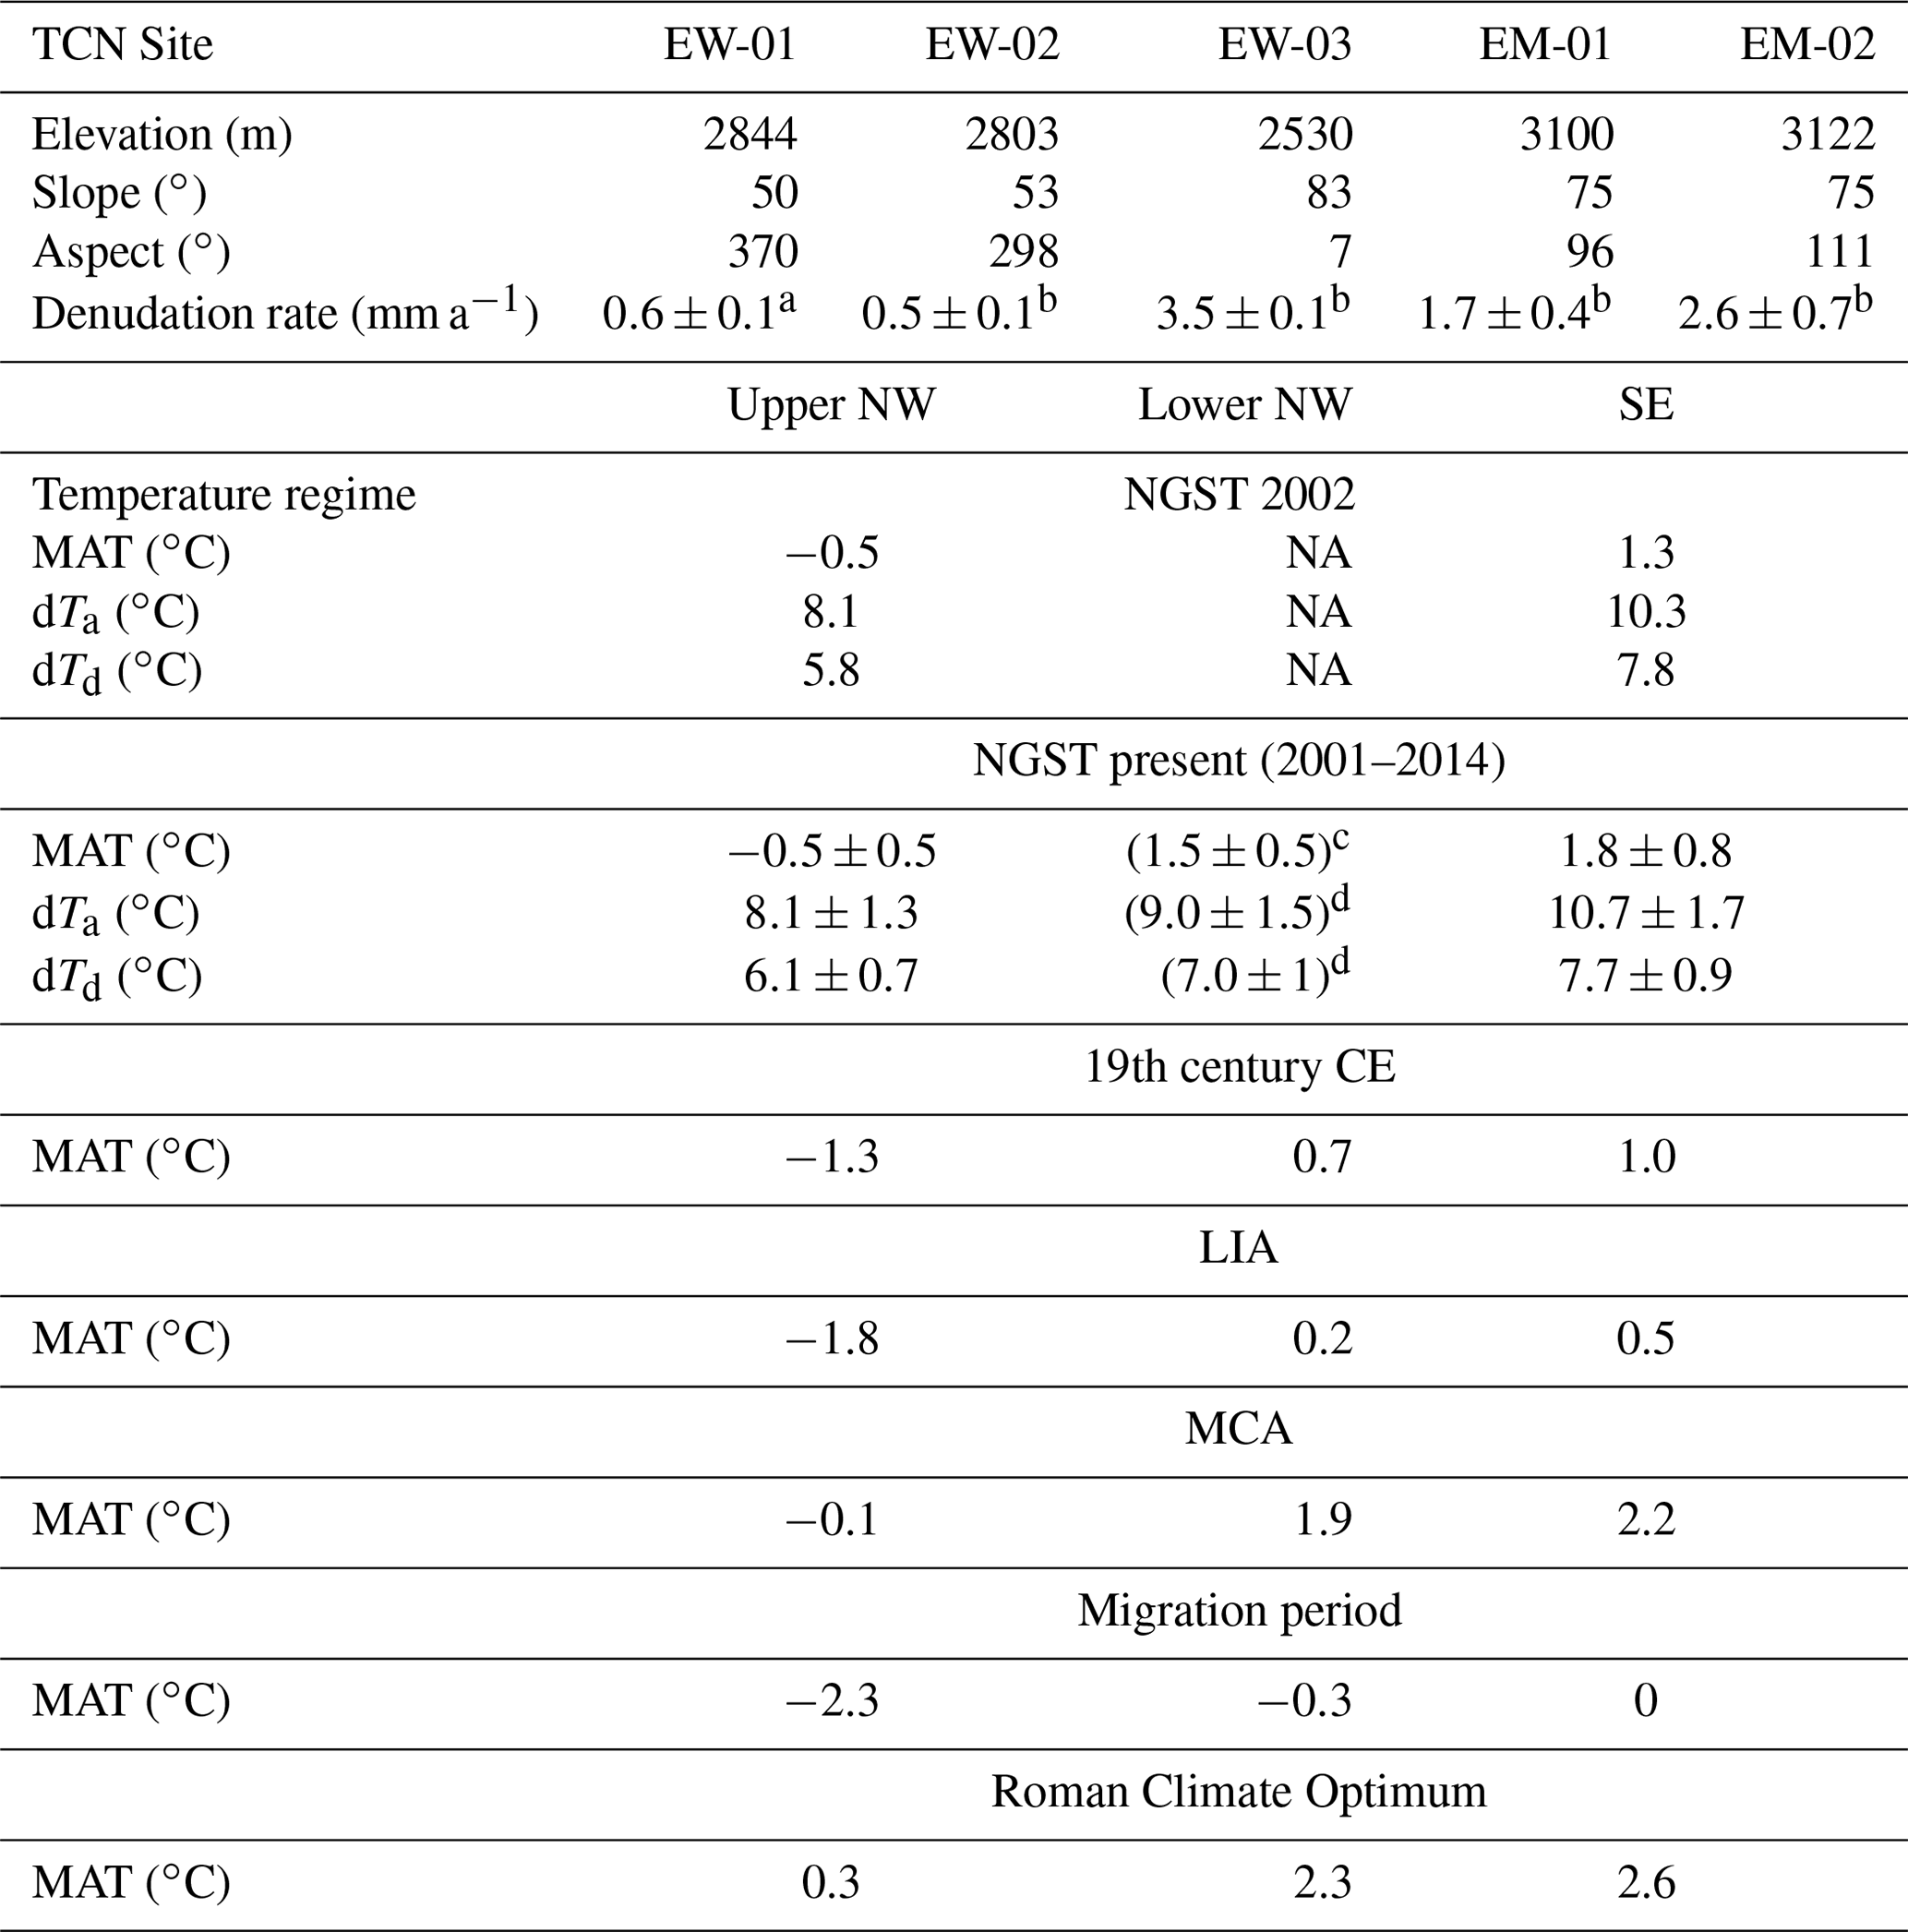
Table 1Study site parameters and reconstructed temperature values. NGST sites from Gruber et al. (2004b); temperature data available at http://www.permos.ch/data.html (last access: 7 May 2020, PERMOS, 2019). For the record used, see the “Methods” section. a Rate dependent on 10Be blank correction (see Appendix A); b data from Mair et al. (2019); c MAT scaled from the Eigerfenster site (Gruber et al., 2004b); d values assumed (see Sect. 3.2 for details). TCN: terrestrial cosmogenic nuclide; NGST: near-ground surface temperatures at a depth of 10 cm; LIA: Little Ice Age; MCA: Medieval Climate Optimum; MAT: mean annual temperature; dTa: amplitude of annual temperature variation; dTd: mean amplitude of diurnal variation; NA: not available.
We aim to link the results of the cosmogenic nuclide analysis to the observations on the bedrock fabric, and we employ a frost cracking efficiency model to explore a potential dependency of denudation on bedrock and climate conditions. The range of methods thus includes field work to map the bedrock fabric and to determine the spacing between fractures and joints. We complemented the Mair et al. (2019) denudation rate estimates with additional cosmogenic data but analyzed the bedrock for in situ 10Be instead because the bedrock at EW-01 is a siliceous limestone and thus contains sufficient quartz minerals. We present all methodological details and the results for site EW-01 in Appendix A since we employed an approach similar to Mair et al. (2019). We additionally compiled temperature data and combined these into a modeling framework on frost cracking processes, where the model outputs will be constrained by previously published 36Cl-based denudation rates on the Eiger north and south faces.
3.1 Investigations of bedrock fabric
Fieldwork, including bedrock sampling for TCN analysis (see Appendix A), took place in the winter of 2016 and in summer 2017. Bedrock fabric data were collected using a geological compass. We mapped lithological contacts, the orientation of bedding and foliation planes and the geometries of faults using routine techniques in structural geology. Upon mapping, we particularly focused on investigating crosscutting relationships between the structural fabrics and on completing the inventory of structures at the outcrop scale (Mair et al., 2018). We determined mean values from orientation data using a spherical mean. These values were separately determined for the various structure categories that we identified in the field upon mapping (Vollmer, 1995). Data visualization and stereo plot generation were done using the Orient 3.4.2 software (Vollmer, 2015). A handheld GPS was used to geo-reference the collected data. Digital and analog topographic maps were based on the 2 m digital elevation model (SwissAlti3D, provided by the Federal Office of Topopgraphy, swisstopo) for surface outcrops and on a high-resolution elevation map of the Jungfraubahnen railway tunnel for subsurface data.
3.2 Temperature data and insolation
Fracturing of rock from frost damage and permafrost occurrence are both dependent on in situ bedrock temperatures, where the mean annual temperature (MAT), the amplitude of the annual temperature variation (dTa), and the mean amplitude of the diurnal temperature variation (dTd) constitute the main parameters of interest. We collected and constrained these temperature variables from various sources to construct times series of temperature data. We then used these data as input for the frost cracking modeling, representing the conditions at sites EW-03, EW-01,-02, and EM-01,-02 (Table 1). In particular, present temperature values for the sites EW-01 and EW-02 are based on near-ground surface temperature (NGST) data at 10 cm depth that were measured at the train stop Eigerfenster (643307/159034; 2860 m; Gruber et al., 2004b). Data on near-ground surface temperatures are also available for the train station at Eismeer (643 830, 158 049; 3150 m) close to the cosmogenic nuclide sampling sites EM-01 and EM-02 on the SW rock face of the Eiger (Gruber et al., 2004b). We extracted information for constraining MAT, dTa, and dTd from a dataset comprising almost 15 years of daily averaged temperature data, available through the Swiss Permafrost Monitoring Network (PERMOS, 2019; http://www.permos.ch/data.html). The MAT and dTdvalues were then determined from the daily averaged temperature data, whereas dTa was calculated from the monthly averaged values (Gruber et al., 2004b). We calculated MAT, dTa, and dTd for the record between 2001 and 2014 and for the hydrological year 2002 separately. We used 7 complete years of record for both the NW (Eigerfenster) and SE (Eismeer) rock faces (Fig. 3). However, the data did not cover the same years for both sites. For the northwest we therefore used the available data covering the hydrological years 2002, 2004–2008, and 2010. For the southeast, data for the hydrological years 2002, 2005–2007, and 2012–2014 were available, which we accordingly considered in this work (temperature data provided in the Supplement). For site EW-03 no such data were available. We therefore scaled the available temperature data from the Eigerfenster train station to site EW-03 using an atmospheric temperature lapse rate of −6 ∘C km−1, which is commonly used for Alpine environments (e.g., Gruber et al., 2004b). In addition, also for site EW-03, we applied values of 9.0±1.5 for dTa and 7.0±1 for dTd. The values are higher than those we assigned for the higher locations EW-01,-02, mainly because EW03 receives more isolation. These estimated temperatures, which we consider representative of the current temperature regimes, were finally used to generate temperature curves (Andersen et al., 2015) as input for the frost cracking modeling (Fig. 3).
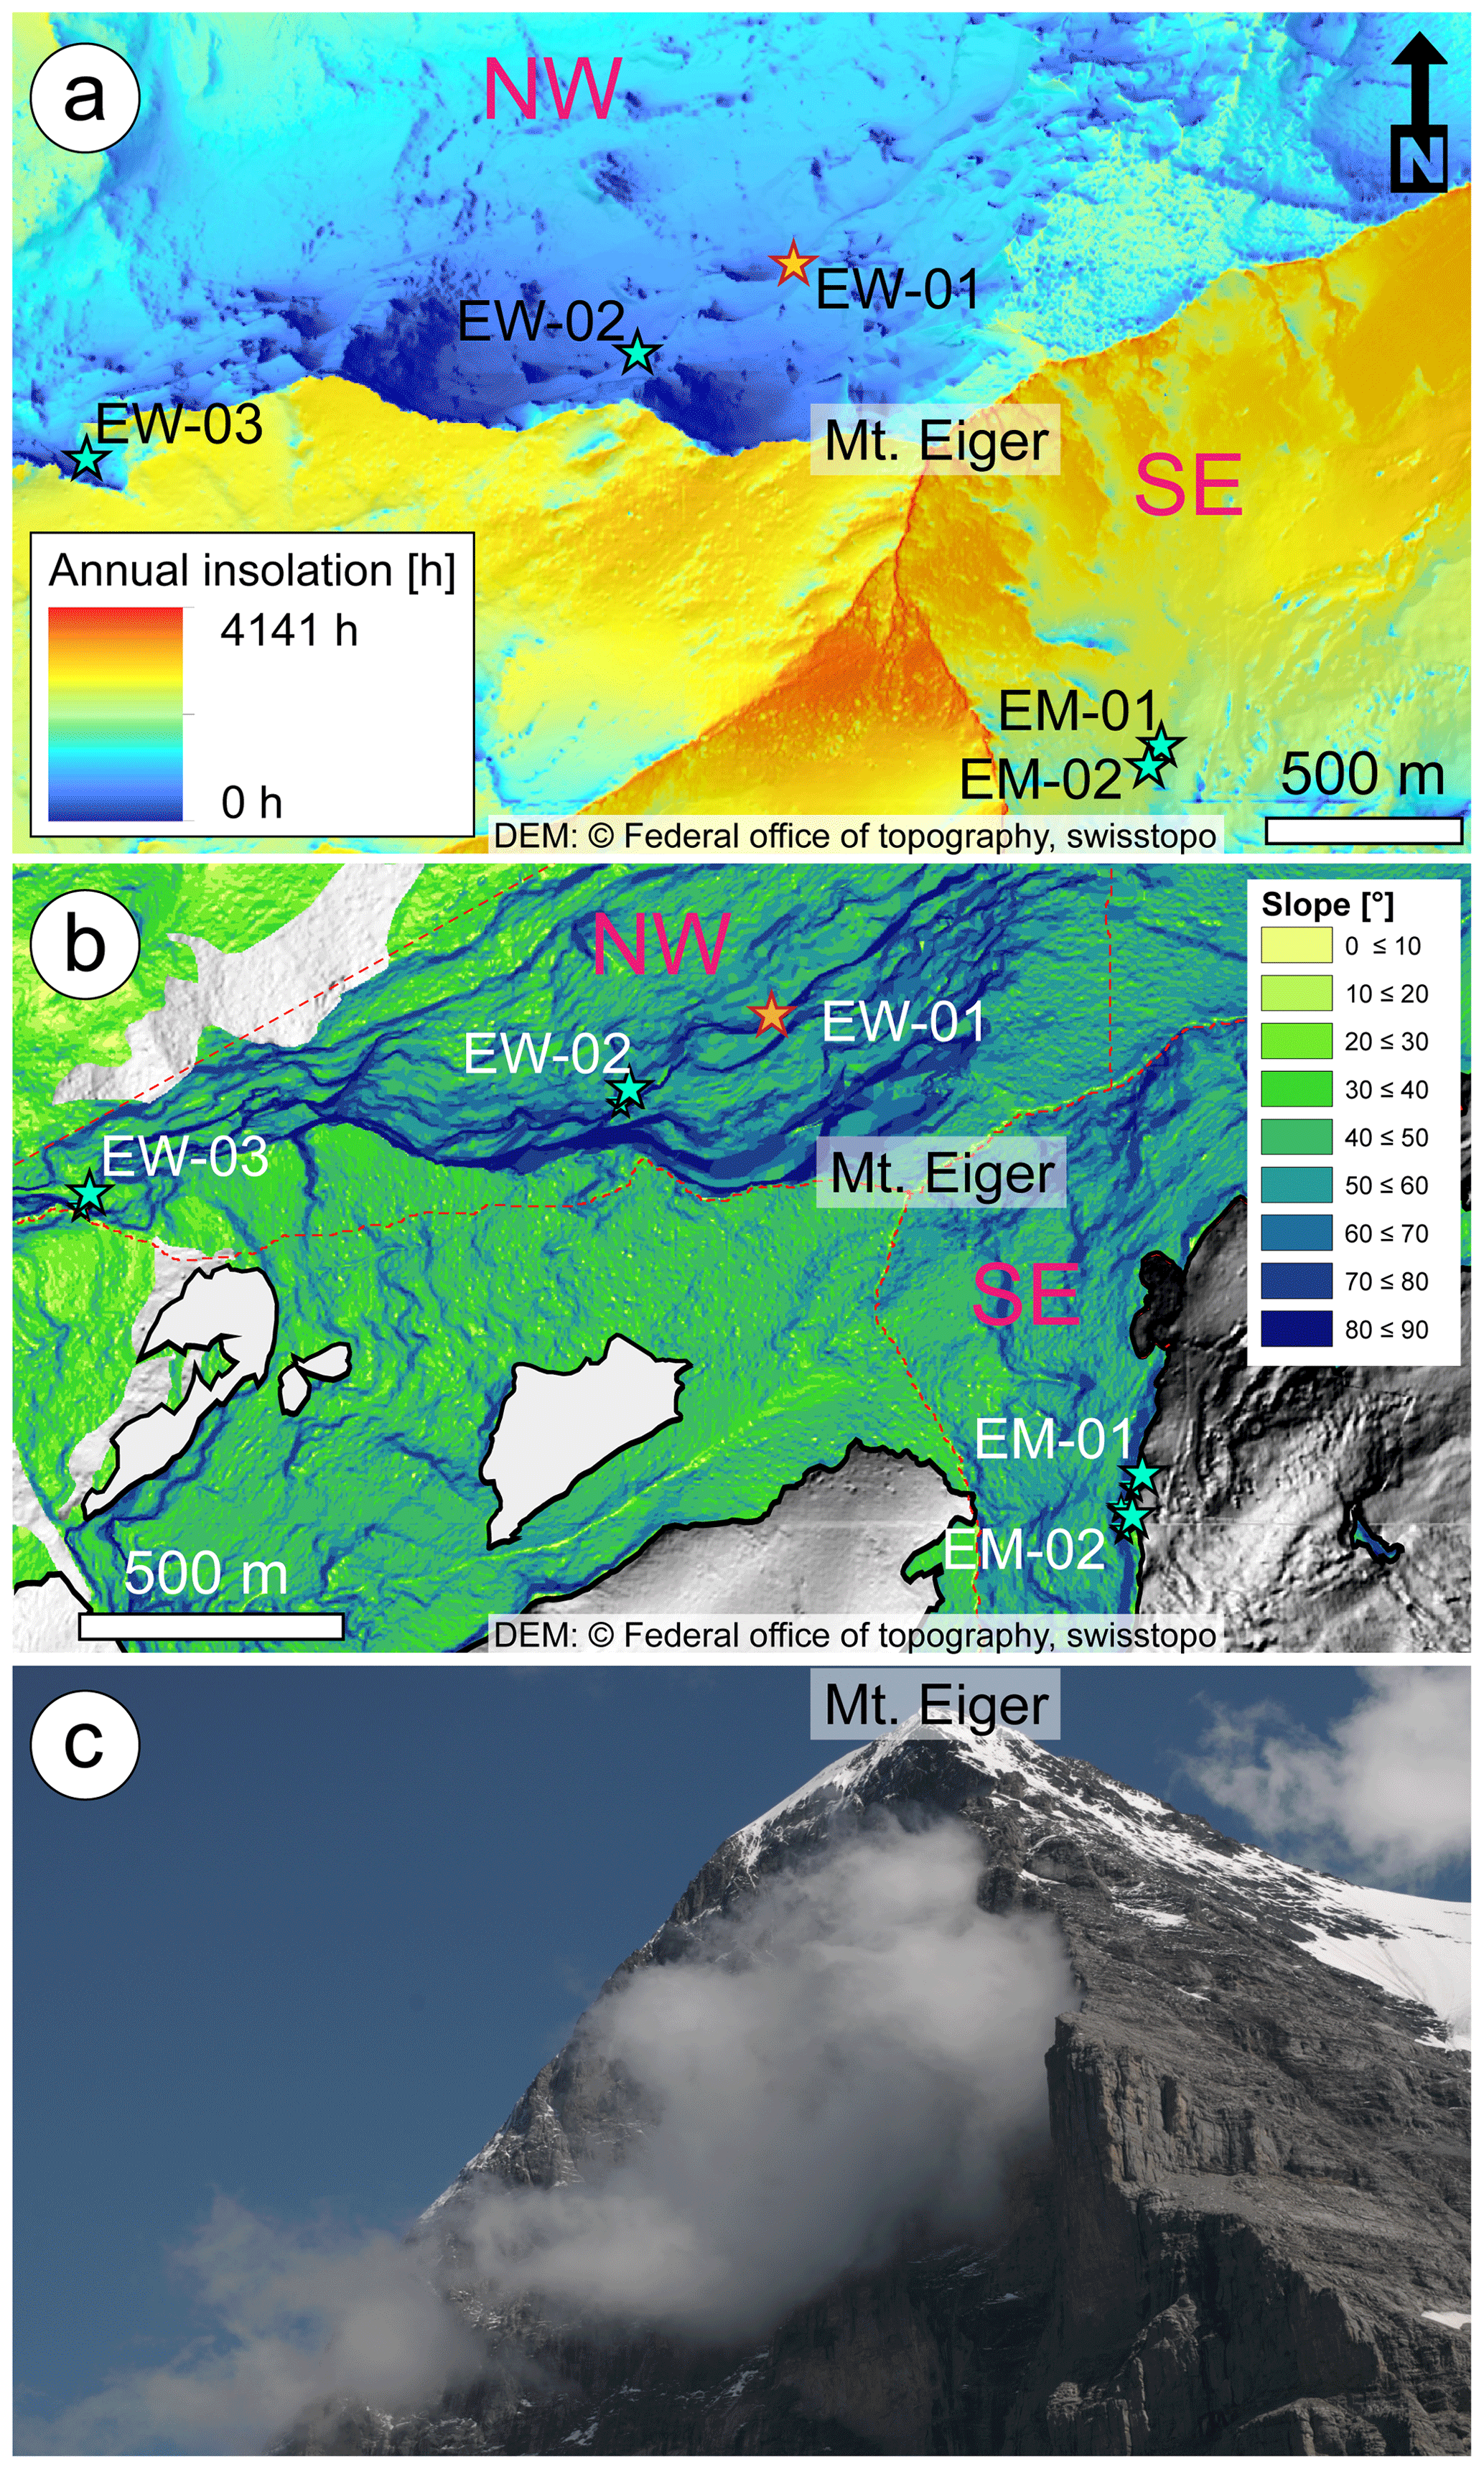
Figure 2Differences in local temperature conditions between the NW and the SE face. (a) Potential annual solar insolation in hours over a year (2015), calculated using the hemispherical viewshed algorithm included in ESRIs ArcGIS™ (Fu and Rich, 2002). (b) Slope angle map calculated from a high-resolution digital elevation model (Swiss Alti3D 2 m, 2015; provided by the Federal Office of Topography, swisstopo) for the northwest and southeast of the Eiger. (c) Field photograph of the NW wall, taken in the summer of 2017, with local clouds illustrating the potential difference in microclimatic conditions.
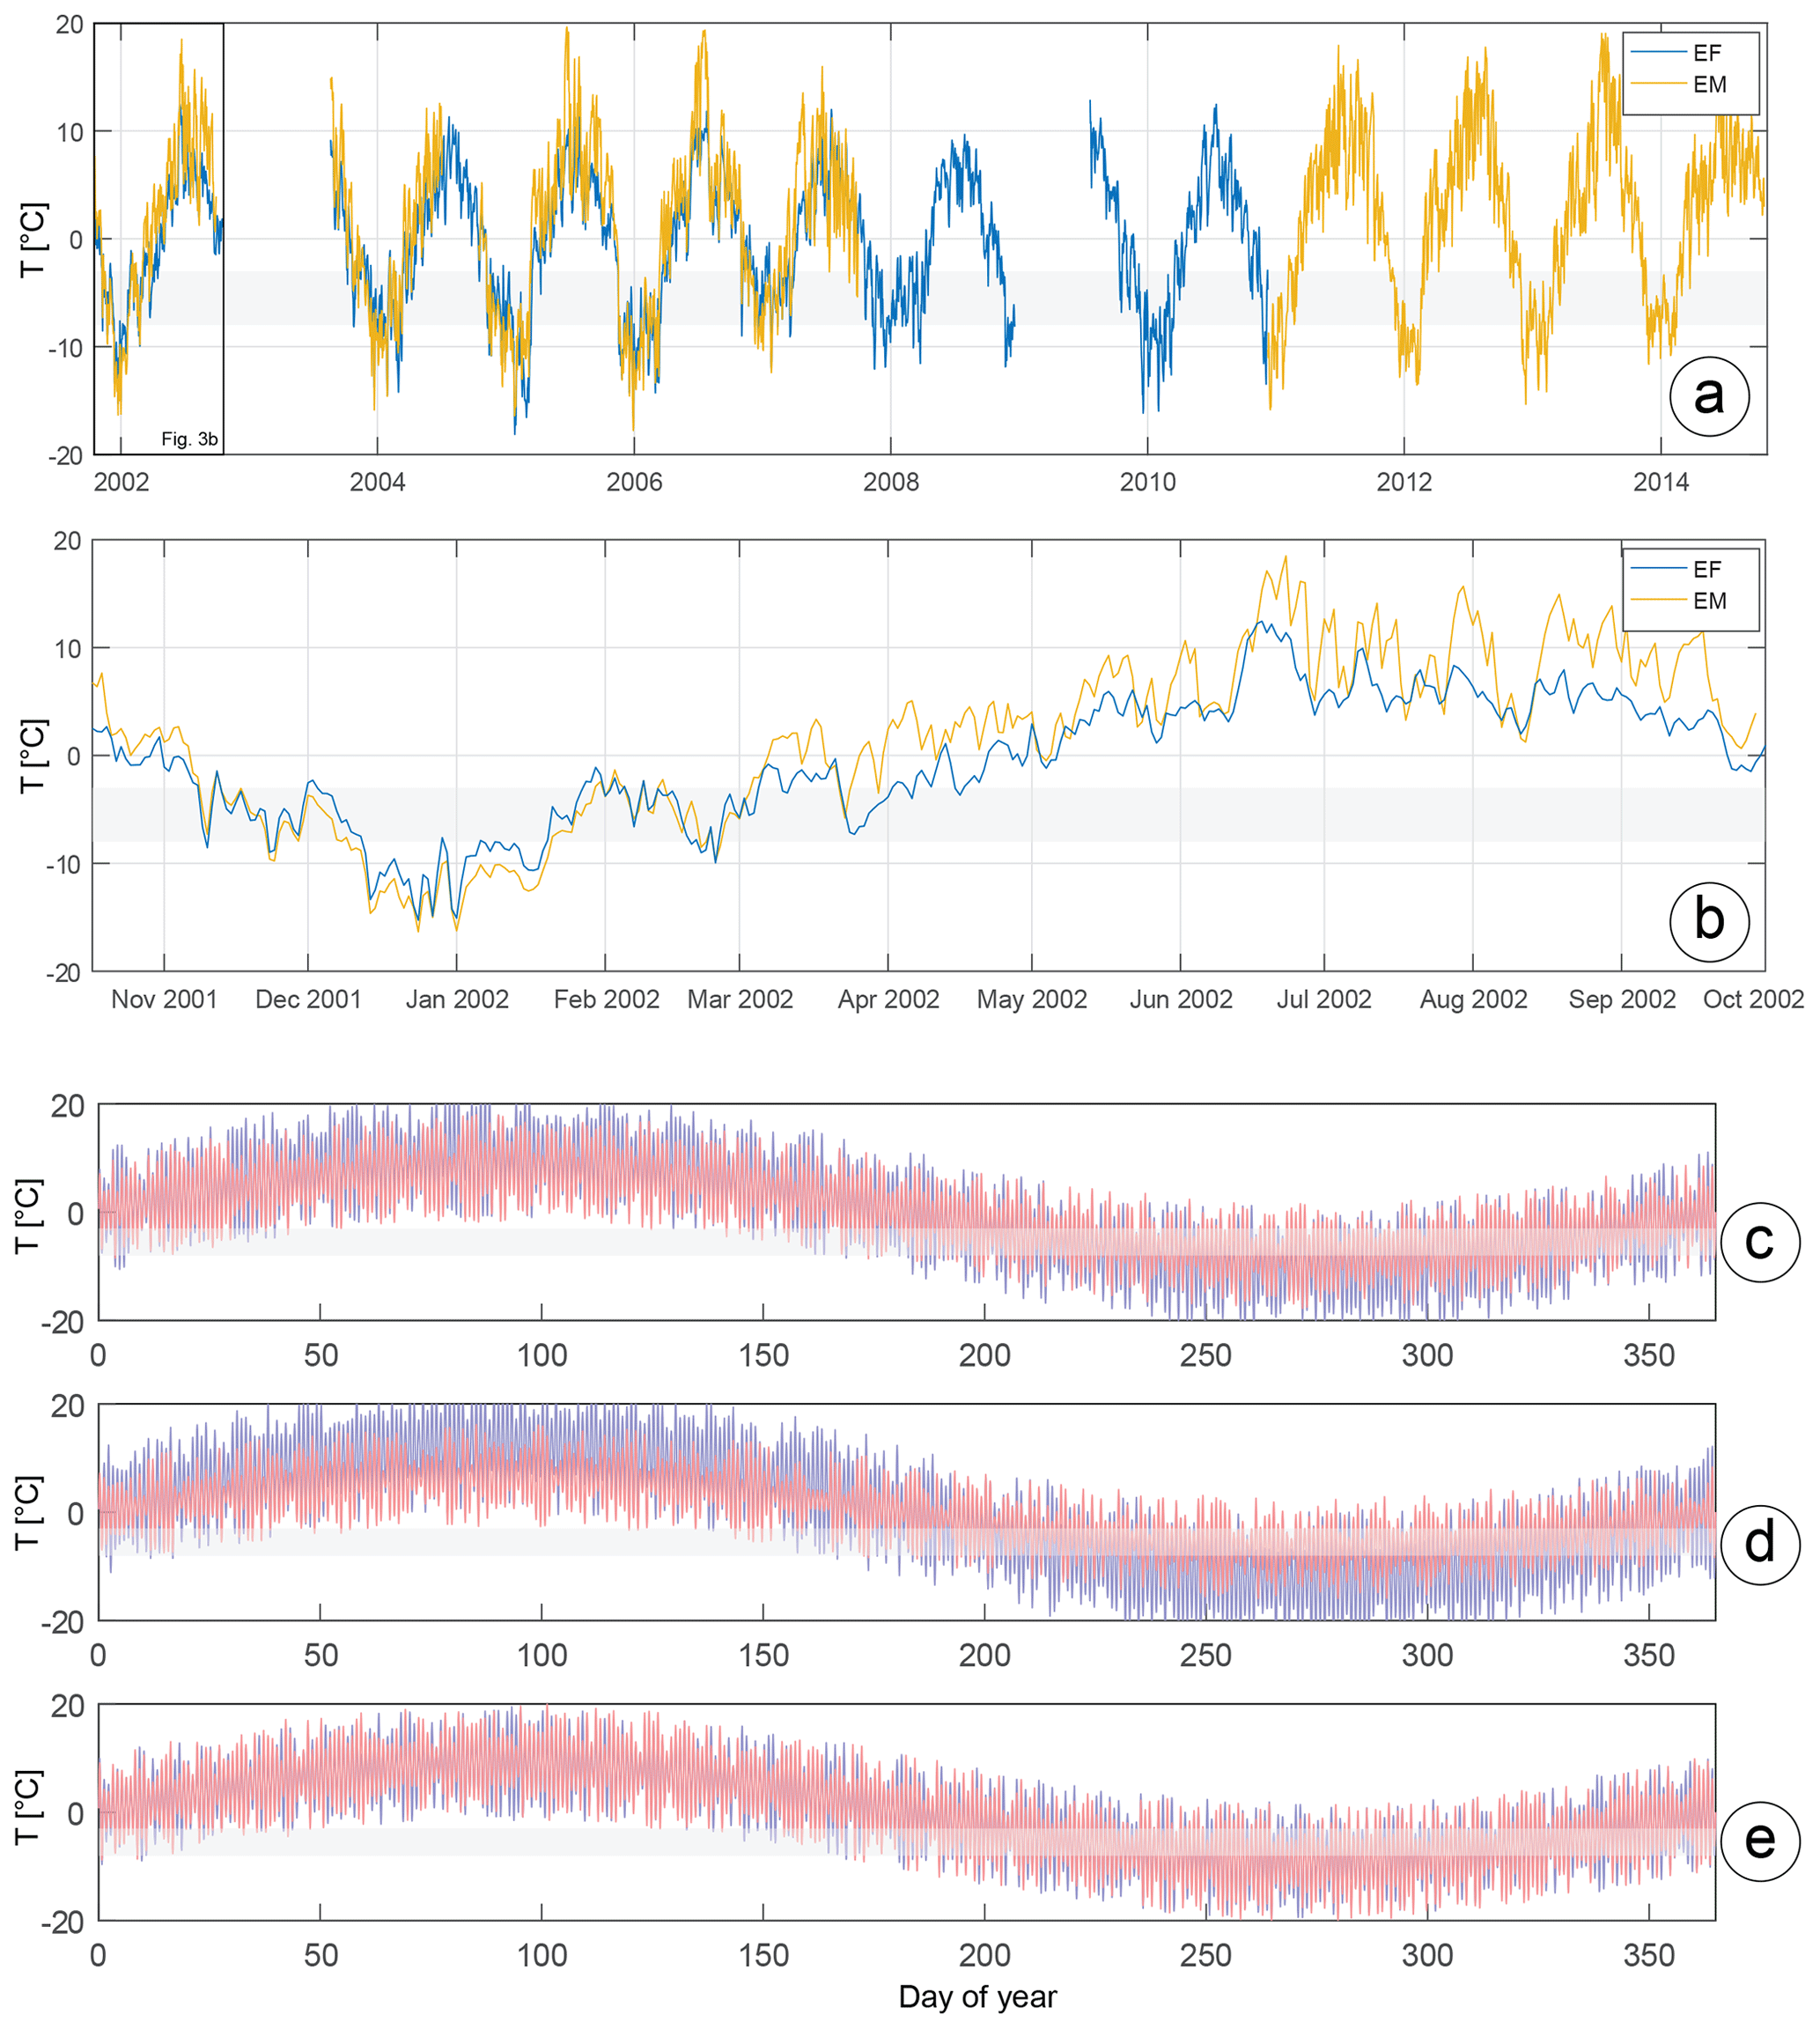
Figure 3(a) Complete daily averaged PERMOS (2019) temperature data for the upper NW (EF) and the SE sites (EM). (b) Daily averaged temperature data for the hydrological year 2002. Data displayed in panels (a) and (b) were used in this study to estimate dTa and dTd. For modern min, mean, and max estimations only complete years were used. Synthetic temperature curves which were used for the frost cracking model for the upper NW (blue) and SE (red) sites for modern mean (c), modern minimum (d), and modern maximum conditions (e). Shaded area corresponds to a frost cracking window of −3 to −8 ∘C. See text for discussion.
Temperatures for the last millennium were estimated using a lake record ca. 45 km farther to the west (Seebergsee, 46∘370 N, 7∘280 E). For this lake, Larocque-Tobler et al. (2012) used chironomid taxa embedded within the sediments to reconstruct a temperature history for the most recent past. These provide estimates of how the mean annual air temperatures during a distinct period in the past deviated from the modern ones representing the time span between 1961 and 1990 CE. The resulting differences are 0 ∘C for the 19th century CE, −0.5 ∘C for the Little Ice Age, and +1.2 ∘C for the Medieval Climate Optimum. We additionally resorted to tree-ring-based temperature reconstructions for central Europe (Büntgen et al., 2011) and used these data as further constraint for the temperatures in the past. The tree ring data infer temperatures for the Central Alps which are in good agreement with those from the lake record (Larocque-Tobler et al., 2012), at least for a shorter period of a few centuries (Büntgen et al., 2006). We therefore extracted temperature anomalies of −1 ∘C for the Migration Period and +0.5 ∘C for the period during the Roman Climate Optimum. We adjusted all values to the 20th-century CE warming (+0.8 ∘C) and calculated MATs for the corresponding periods under the assumption of a constant diurnal and annual temperature fluctuation, identical to modern values. We inferred no lag between the increase of mean air temperatures and the temperature adjustments on the rock surface (Table 1).
Maximum direct annual insolation was calculated using the “Area Solar Radiation” tool of ESRI's ArcGIS Desktop 10.1 suite, which employs a hemispherical viewshed algorithm (Fu and Rich, 2002; and references therein). The calculation was done for 1 d and hourly intervals for a sky size of 512 cells for the whole year of 2015.
3.3 Frost cracking modeling
The annual efficiency of frost cracking processes was computed using the numerical model of Andersen et al. (2015), which builds on the approach of Anderson et al. (2013), Hales and Roering (2007), and Anderson (1998). The model propagates temperature changes into the ground by solving a one-dimensional heat flow equation (Hales and Roering, 2007). It regards annual surface temperature as a sinusoidal function around the MAT and dTa and a randomly superimposed sinusoidal function with an amplitude between 0 and dTd (Anderson et al., 2013; Andersen et al., 2015). Whereas the Andersen et al. (2015) model is capable of incorporating a regolith layer of various thicknesses atop the bedrock, we used a setup without such a layer because field inspections have shown that the local slope is too steep to host a regolith layer (Table 1). The model calculates a frost cracking intensity (FCI) related to ice segregation, which is most effective where temperatures range within the so-called frost cracking window (FCW; Anderson, 1998; Walder and Hallet, 1985) and where water is available for ice to form (Anderson et al., 2013; Andersen et al., 2015; and references therein). The flow of water is influenced by the thermal gradient in the subsurface (Hales and Roering, 2007) and the distance to the freezing front (Anderson et al., 2013). The Andersen et al. (2015) model scales the FCI with both the thermal gradient and the occurrence of water along the path to the point of ice segregation. Here, we employed the “standard model” of Andersen et al. (2015), which follows the concept where cracking in the bedrock is limited, and thus controlled, by the distance to the water source and the water availability up to a critical threshold. This is accomplished by a penalty function that integrates the flow resistance (Anderson et al., 2013) for a mixture of frozen and unfrozen bedrock (Andersen et al., 2015). Aside from the water availability, the model builds on a set of input variables and assumptions, where different assignments of values and constraints might influence the results. The selected input variables (see Appendix B) do indeed have the potential to influence the outcome of the model results particularly for an FCW between −8 and −3 ∘C and for the consideration of a thermal conductivity for bedrock. We therefore ran sensitivity tests and varied the aforementioned quantities in order to explore how the results depend on the choice of input parameters. Because of the lithology dependency of the FCW (Draebing and Krautblatter, 2019), we ran test models with FCWs between −9.3 and −1.4 and between −4.5 and −1.8 ∘C. These values have been derived for paragneisses with a high schistosity (Draebing et al., 2017b). We additionally tested the model for a possible sensitivity to the thermal conductivity. We started with a standard conductivity of 3.0 W m−1 K−1 (Andersen et al., 2015) and then considered upper and lower bounds compiled from various sources (see Appendix B for details and references). We also applied the material-specific standard model parameters of Andersen et al. (2015), which includes a general rock porosity of 2 %. This value is in excellent agreement with the average porosity of 1.8±0.5 % for the Eiger limestone, calculated from density measurements (Supplement Notes S4 of Mair et al., 2019). The model assumes full water saturation for the bedrock. However, for simplicity purposes, the model considers heat transport as occurring through conduction only. Accordingly, it fails to capture bedrock anisotropies, i.e., cracks and foliations, which might facilitate the transport of heat by advection. Finally, the resulting diurnal depth-integrated values are integrated over an entire year. We ran a series of models to account for variations in local temperature. We set the starting temperature (T0) to the site-specific MAT and the dTa and dTd to the mean, minimum, maximum, and the average values of 2002, and we changed these conditions upon modeling. This setup does not necessarily provide an envelope, as it is based on the assumption that changes in the MAT and daily temperature amplitude also affect changes in the annual temperature amplitude in the same way; i.e., lower MATs are likewise associated with damped changes in daily and annual temperatures.
4.1 Bedrock fabric
The Eiger itself consists of a suite of heavily fractured and re-crystallized micritic Jurassic and bioclastic Cretaceous limestones, with local chert layers and nodules. The foliation that formed during a first deformation phase is oriented parallel to the sedimentary bedding and is associated with tight and isoclinal folds at the decimeter scale. The formation of this fabric was conditioned by micrometer-scale changes in sheet-silicate content during sedimentation. The second foliation is characterized by slip planes in microshear zones, which display large variation in the spacing between individual planes. All studied sites expose bedrock with a strongly developed network of faults, fractures, and foliations, especially close to the surface. The bedrock fabric at the SE rock face (sites EM-01, -02) is dominated by small joints that developed along the NW-dipping foliation planes of both foliation generations, here referred to as S1 and S3 following Mair et al. (2018) (Fig. 4). Note that S2 foliations are only visibly close to the basement cover contact (Mair et al., 2018) and have thus not been mapped here. The joints are generally ≪1 mm wide but open and occasionally contain circulating water in summer, as was the case during sampling in summer of 2017. The spacing between these joints varies but generally measures between 2 and 10 cm. A second set of joints with a decimeter-wide spacing and 1 to 10 mm wide cracks steeply dip to the southeast. These joints are sometimes associated with pre-existing calcite veins (Fig. 4b). The joints are generally open, but some calcite infill is also present. At the scale of an outcrop, both sets of joints are connected and regularly spaced. A third set of fractures, albeit with an irregular spacing, is found along brittle fault zones up to several meters broad (Fig. 4c). These faults display open cracks at a sub-millimeter scale. The spacing varies and some voids are filled with fault gauge.
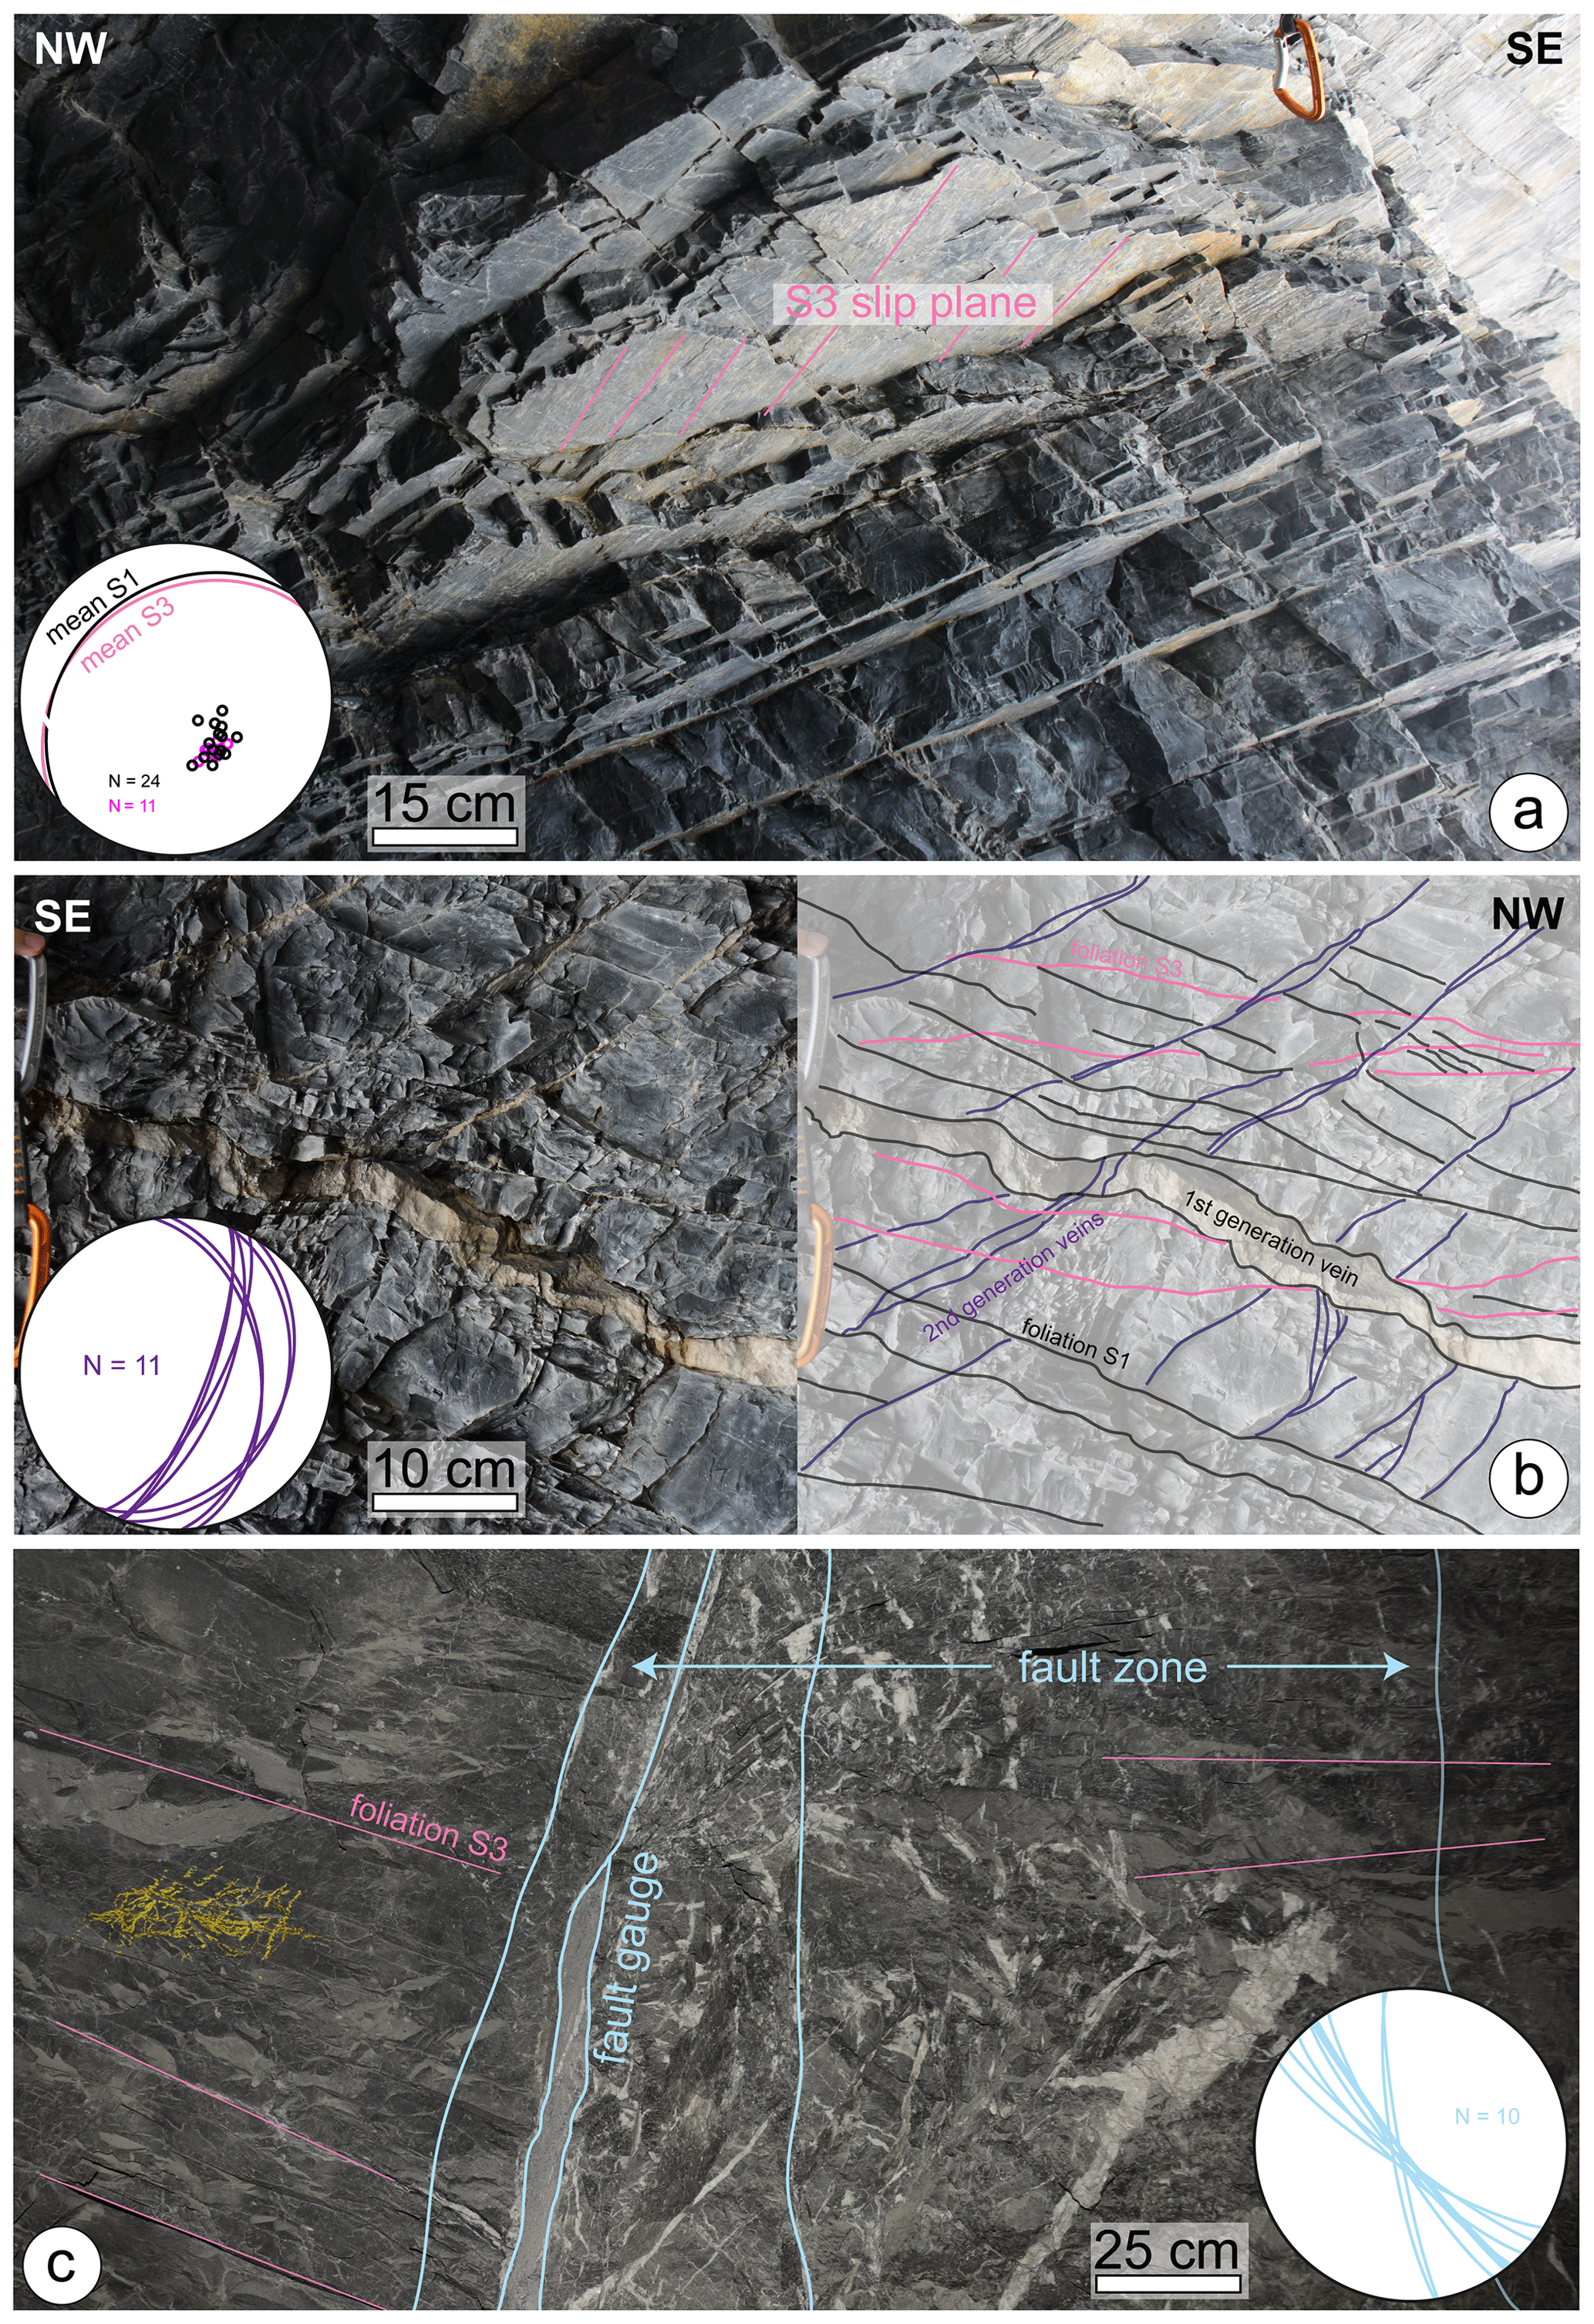
Figure 4Bedrock fabric and discontinuity network at sample sites EM-01 and EM-02 at the SE sides. (a) Bedrock at current surface close to EM-01 highlighting the weathering paths along pre-existing weaknesses. (b) Details of the bedrock fabric at site EM-02 with structural interpretation in the right panel. (c) Fault zone near the sampling sites that deeply penetrate the Eiger (based on Appendix image from Mair et al., 2018). Structural orientation data partly based on Mair et al. (2018).
A similar network of joints characterizes the sites within the NW rockwall at sites EW-01, -02, and -03. Joints with openings between ≪1 and 1 mm are oriented parallel to the two generations of foliations (Fig. 5), which are gently SE dipping to flat lying. A set of SE-dipping open joints with widths of up to 10 mm and a spacing of 10 cm is present at all sites (Fig. 5a). We additionally found steep and rockwall-parallel cracks with openings that are up to several centimeters wide (C2; Fig. 5d). We note that during sampling on 1 December 2016, ice was present in these fractures (Fig. 5b, c).
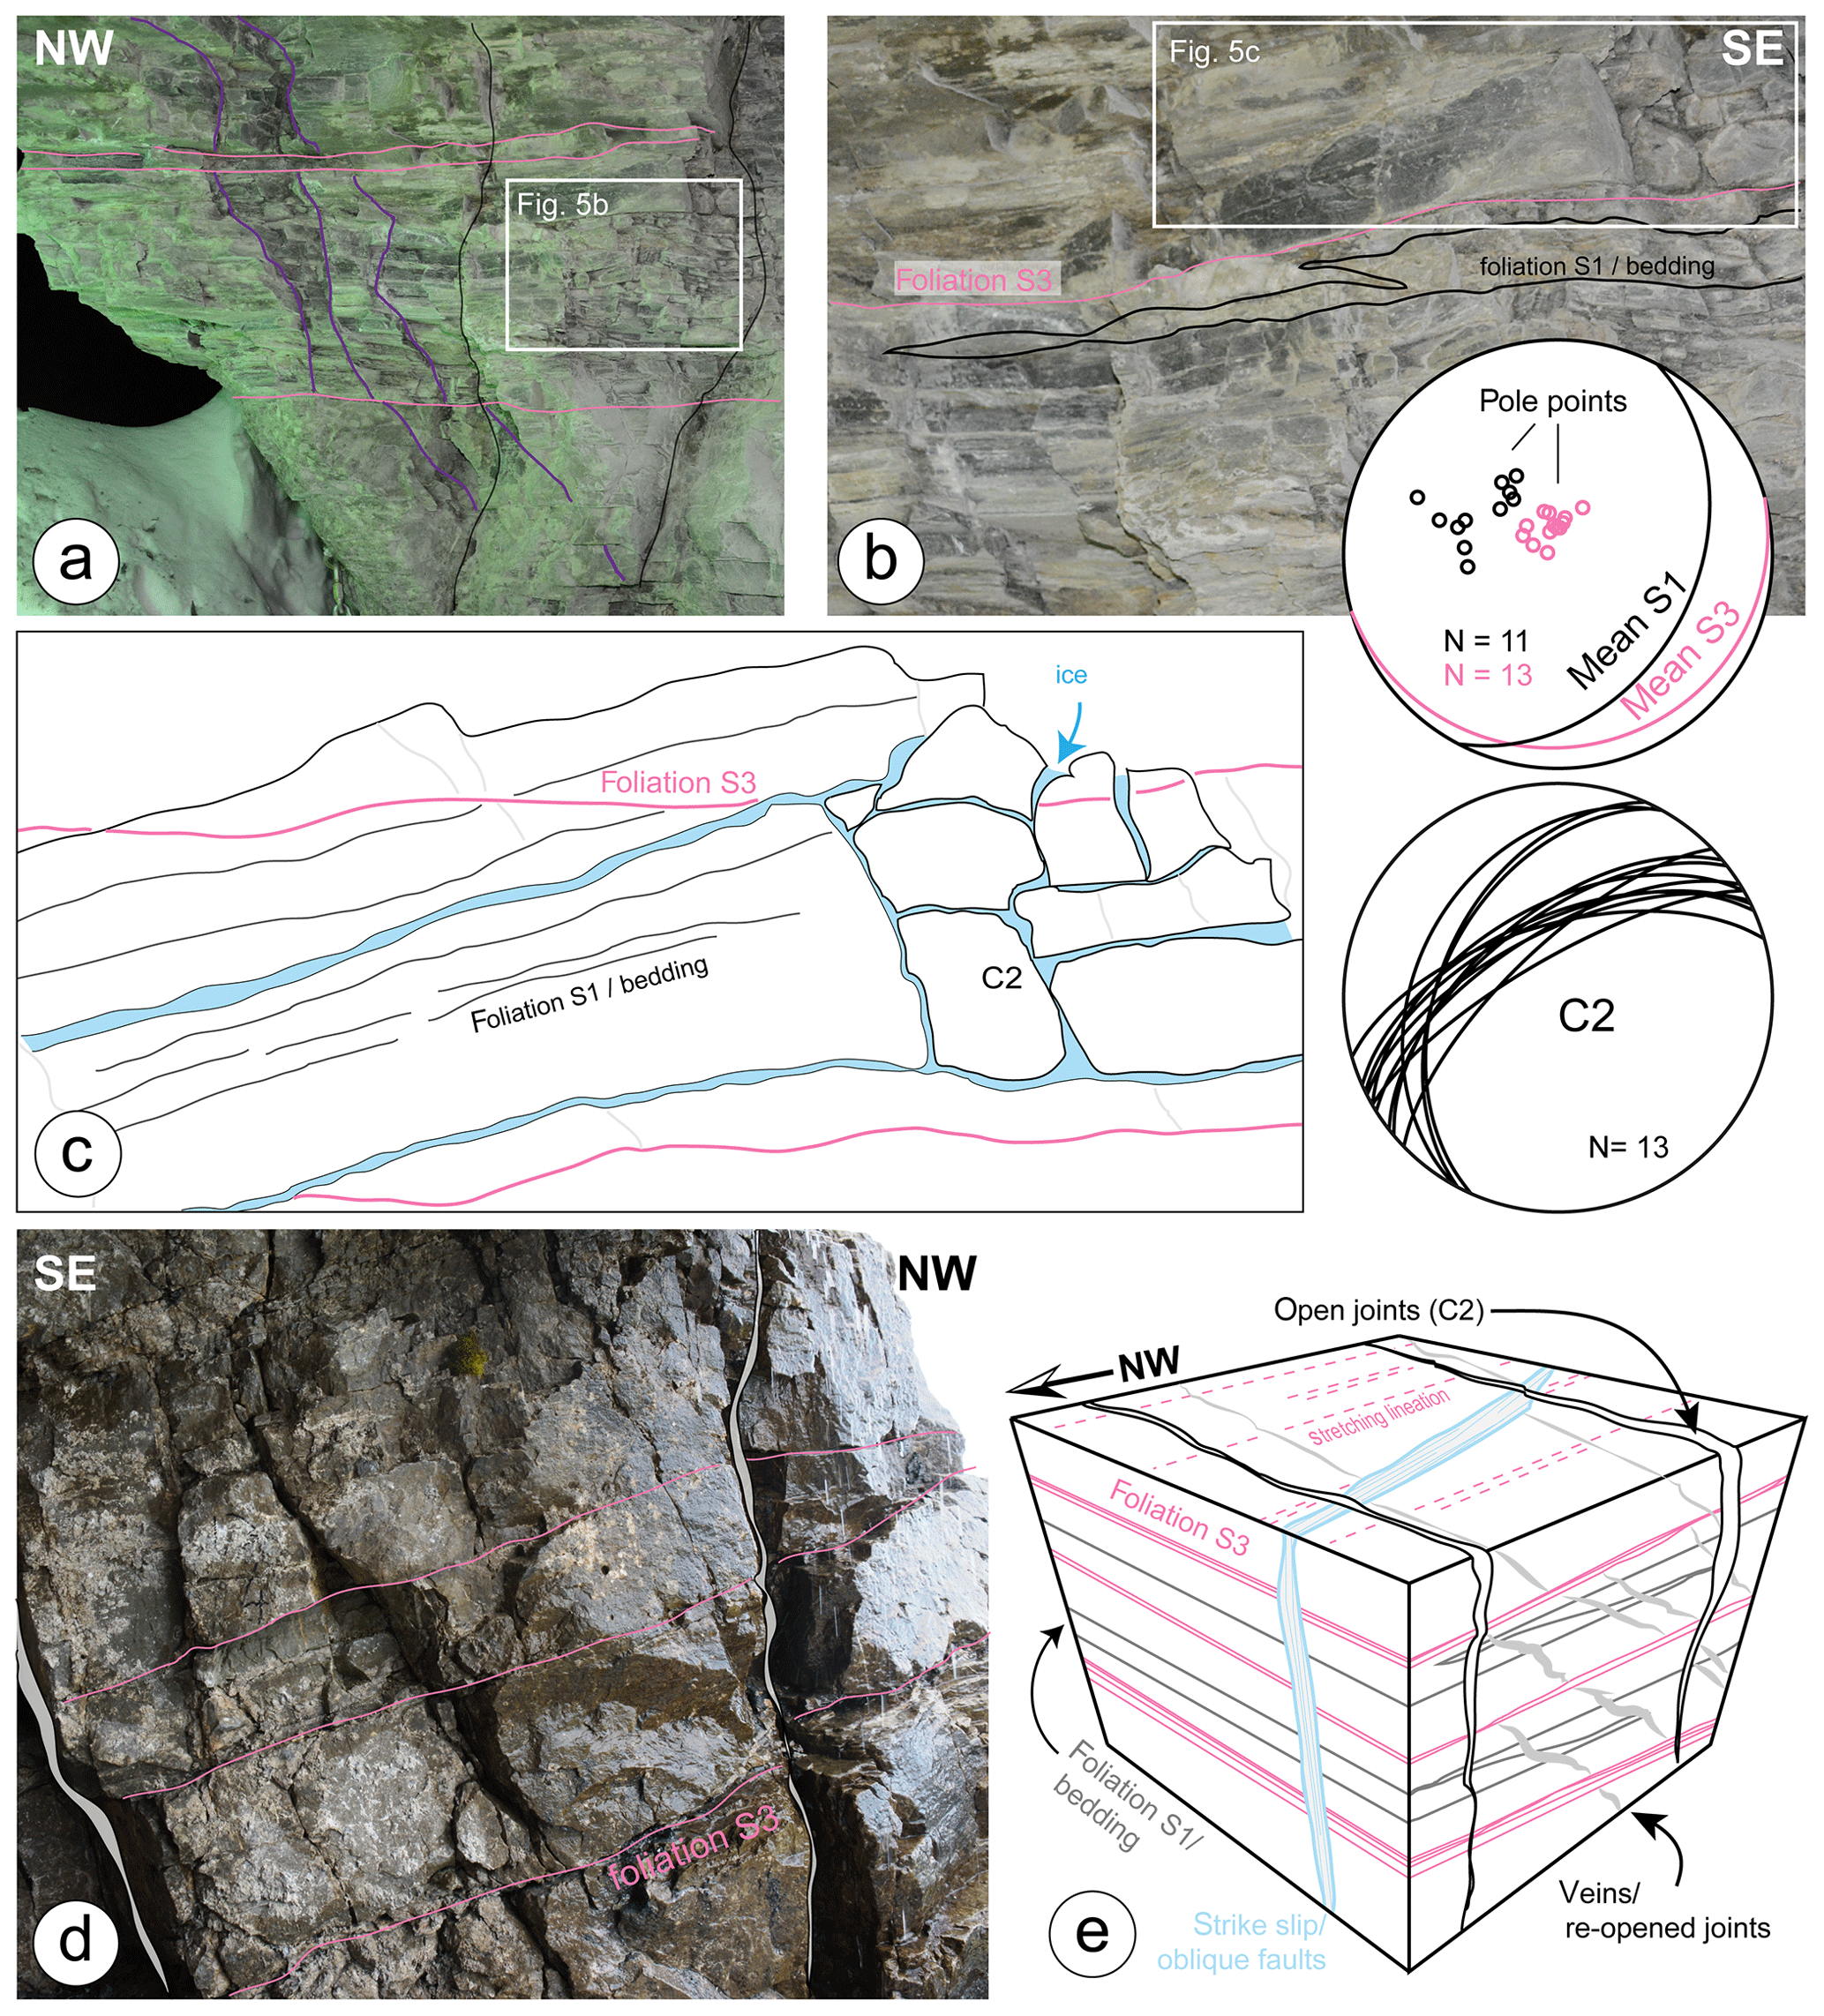
Figure 5Bedrock fabric from cosmogenic sites within the NW face, at site EW-02 (a). (b, c) Details with ice lenses present during sampling on 1 December 2016 CE, highlighting the relation of fractures with the pre-existing structures. (d) Structures at sampling sites EW-01. (e) Bedrock discontinuities relevant for bedrock fracturing, synthesized for the NW rockwall.
4.2 Temperature estimates and frost cracking modeling
The near-surface ground temperatures (Table 1) reconstructed from the available daily averaged records show that the sites EW-01 and EW-02 have experienced an average MAT of ∘C for the full year records between 2001 and 2014 CE. This is lower than the MAT average for the SE sites (EM-01, EM-02), where temperature values are 1.8±0.8 ∘C for the same period, albeit not for the exact same years (see Sect. 3.2). On the NW rock face, at sites EW-01 and EW-02, the annual temperature amplitude of ∘C is smaller compared to the ∘C in the other SE face of the Eiger. A similar situation is observed for the mean diurnal temperature amplitude dTd where the corresponding values are 6.1±0.7 ∘C for the NW sites and 7.7±0.9 ∘C for the SE sites. The temperature estimates for the hydrological year 2002 are similar to the mean values of the longer time period (Table 1). Temperatures for the lower NW site (EW-03) were estimated with a MAT of 1.5±0.5 ∘C (using a constant lapse rate of −6 ∘C km−1), while values for dTa of 9.0 ∘C and dTd of 7.0 ∘C were considered to be slightly higher than in the upper NW site. Based on the recent temperature data and the reconstructed historical temperatures, we exclude the occurrence of local permafrost conditions at the SE rockwall for all scenarios. For the upper NW headwall of the Eiger, permafrost might occur at current conditions and during the past when MATs were lower.
For the SE sites, the modeling of the annual frost cracking intensity ( returns values that range from 0.12 ∘C m for minimum conditions for modern dTa, dTd, and MAT to 0.25 ∘C m for the respective maximum conditions (Fig. 6, Table 2). The consideration of mean values for temperature variations and MAT returns an of 0.2 ∘C m, which is similar to the value of 0.17 ∘C m that results from the model where the 2002 temperatures are considered.
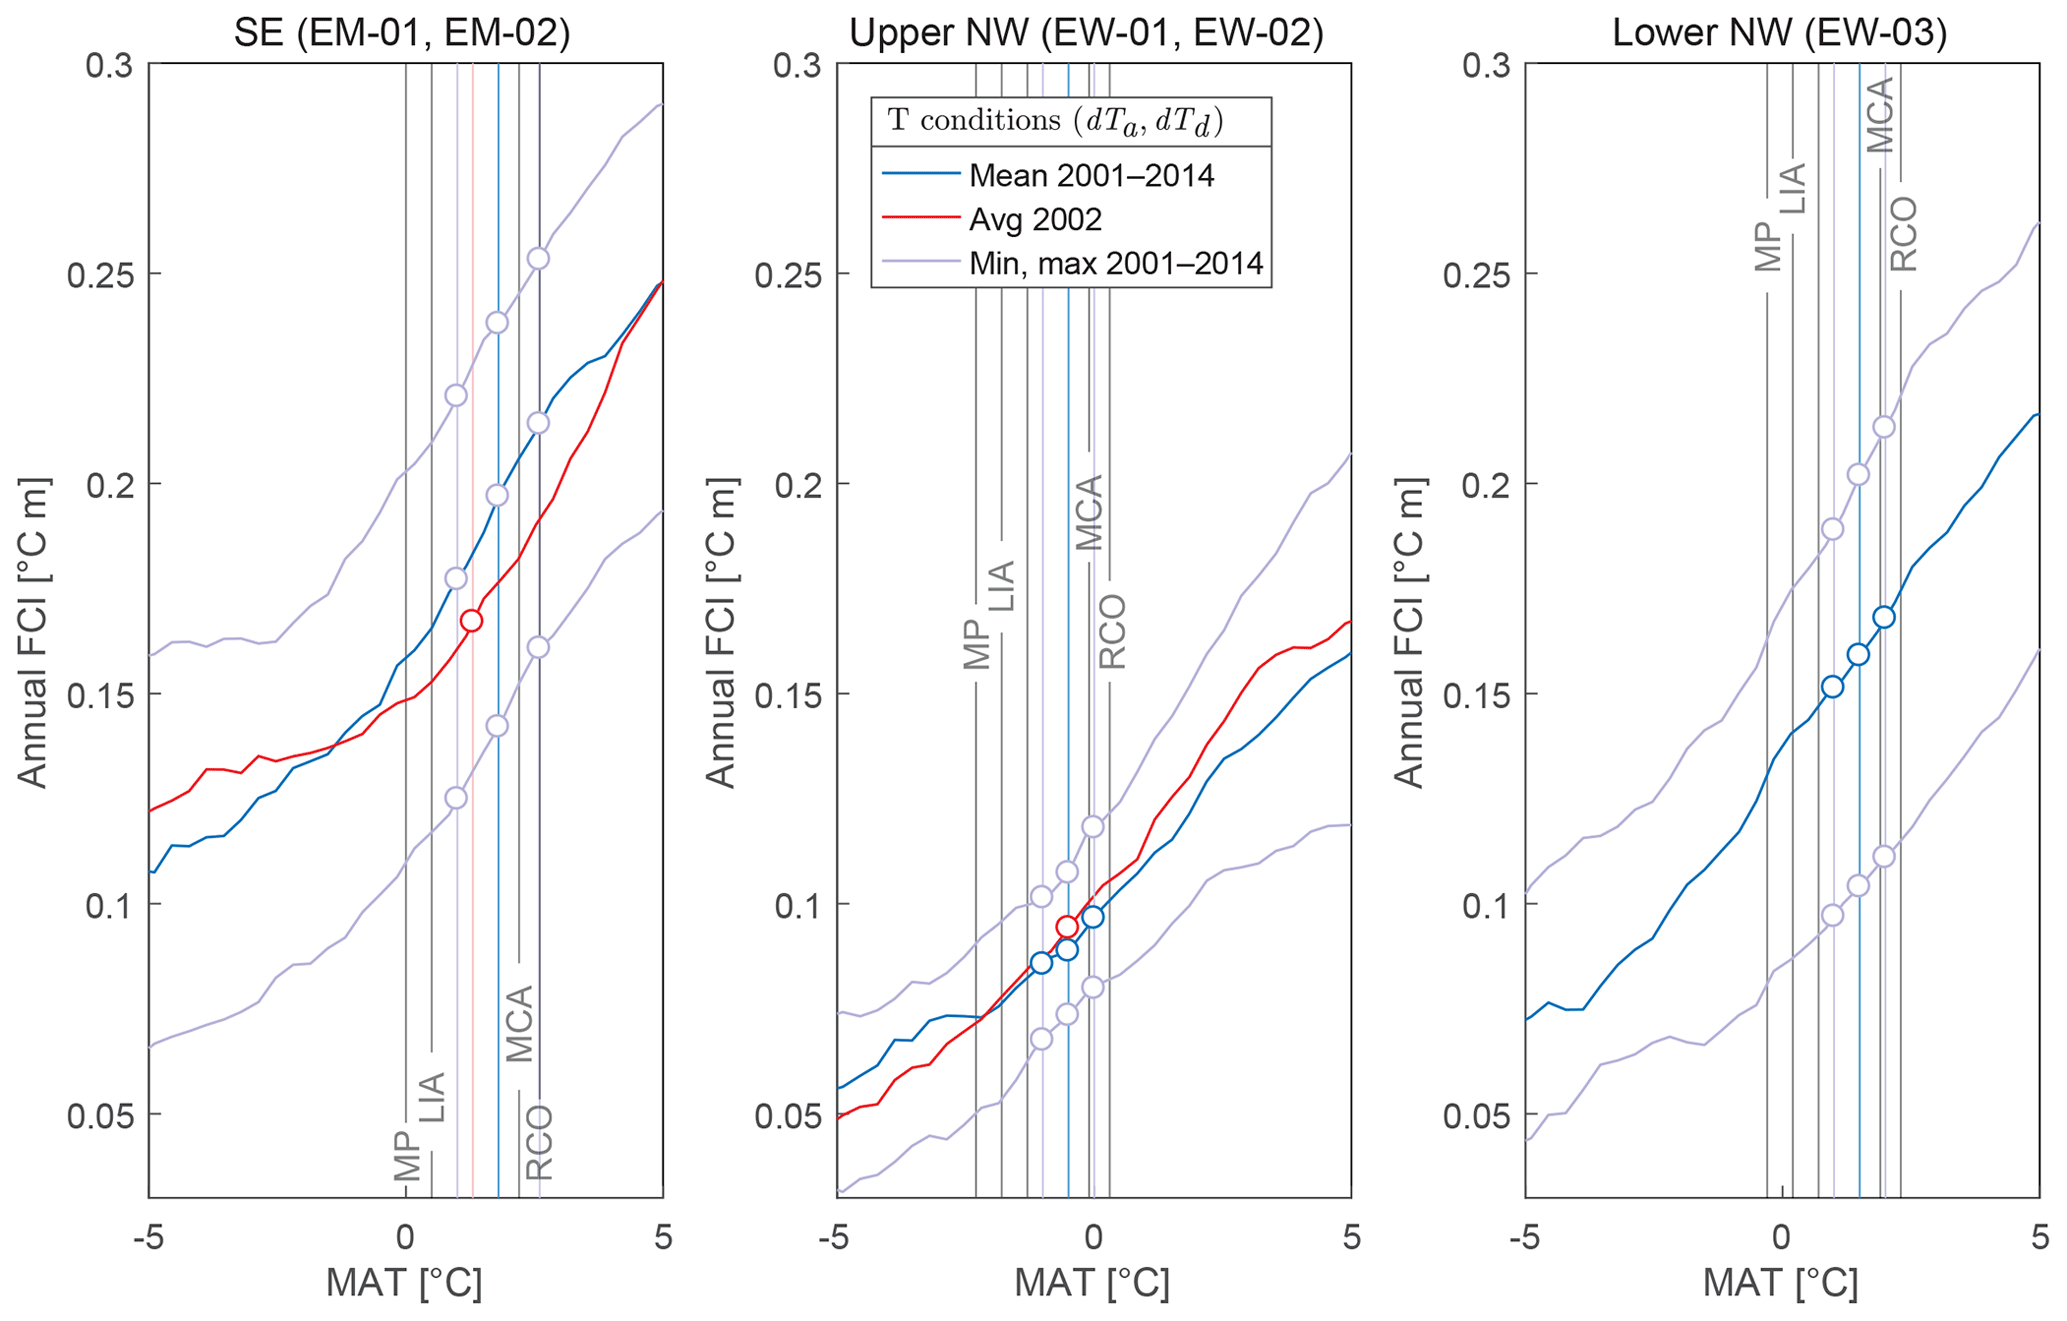
Figure 6Modeled annual frost cracking intensity () for the individual sites and the different thermal regimes. For the site-specific model run conditions (min, max, mean and 2002) see Table 1 and Sect. 3.2. Resulting values for the indicated circles are presented in Table 4. MAT: mean annual temperature; LIA: Little Ice Age; MCA: Medieval Climate Optimum; MP: Migration Period; RCO: Roman Climatic Optimum.
Table 2Selected annually integrated frost cracking efficiencies () for the studied temperature regimes and the different model runs with the respective mean annual temperatures (MAT). T: temperature; NA: not available.
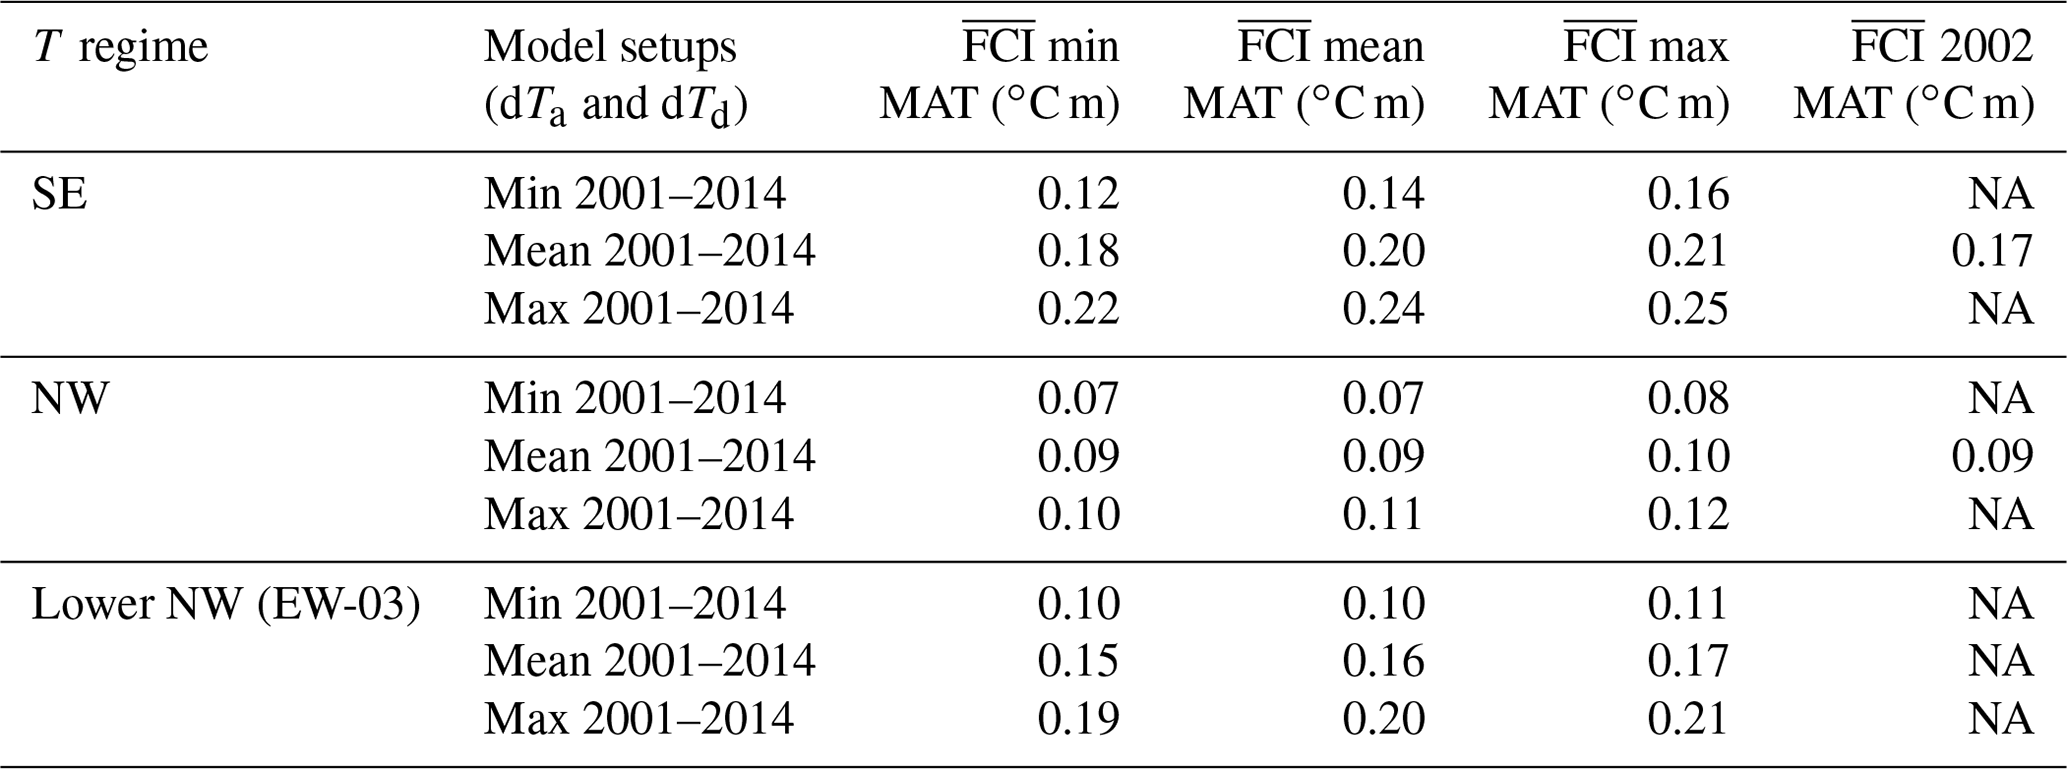
For site EW-03, situated at a relatively low elevation within the NW rockwall, the modeling yields similar results as for the sites in the opposite SE face of the Eiger (Fig. 6), with intensities ranging from 0.10 to 0.21 ∘C m. The mean MAT and mean temperature amplitude model run predicts an annual frost cracking intensity of 0.16 ∘C m. For the sites EW-01 and EW-02, also situated on the NW rockwall but at higher elevations, the modeled minimum and maximum values are lower and range from 0.07 to 0.12 ∘C m. Also at these sites, the mean MAT and mean temperature amplitude model run returns a value of 0.094 ∘C m, which is very close to 0.089 ∘C m derived for the 2002 conditions. Accordingly, the model predicts a scenario where frost cracking processes at the upper NW sites (EW-02 and EW-01) are up to 50 % less effective compared to the inferred frost cracking intensities at the rockwall foot of the NW face (site EW-03; Fig. 6) and in the SE locations (EM-01, -02).
5.1 Rockwall denudation from cosmogenic nuclide analysis
Denudation rates can be estimated from in situ cosmogenic nuclide depth profile modeling (e.g, Hidy et al., 2010; Braucher et al., 2009). This method has been applied for estimating the local denudation rates in steep Alpine rockwalls, and it has been very useful for extracting information on the mechanisms of denudation, as shown in a recent study where denudation rates were measured with concentrations of cosmogenic 36Cl in bedrock depth profiles at the Eiger (Mair et al., 2019). We complemented the Mair et al. (2019) denudation rate dataset by measuring concentrations of cosmogenic 10Be for five samples in a bedrock depth profile at site EW-01 (Fig. 1), and we modeled the local denudation rate over millennia (see Appendix A for details). The resulting rates are 0.6±0.1 mm a−1 (1 standard deviation) They are thus in good agreement with the results obtained for the nearby site EW-02, where the rates are 0.5±0.1 mm a−1 (1σ standard deviation; Mair et al., 2019). However, we note here that the 10Be concentrations are close to the blank background value and that the measurement uncertainties are high in some samples (up to 69 % for 1σ). Therefore, sample and measurement-specific blank corrections could render the EW-01 samples non-interpretable (see Appendix A).
Mair et al. (2019) measured relatively high concentrations of cosmogenic 36Cl at depth relative to the surface. These authors used this pattern to preclude the occurrence of large rock fall events during the cosmogenic timescale, which in this case was several thousands of years. Instead, Mair et al. (2019) developed a scenario where surface denudation has been accomplished through multiple small-scale rock fall processes, where centimeter-sized bedrock particles have been removed at a high frequency from the rockwall surface. The episodic events have to occur on spatial and temporal scales that are small (< 1 to < 10 cm) and short enough (< 1 a) to be regarded as a continuous erosional mechanism over timescales (> 10 a) relevant for cosmogenic nuclide production. We follow this interpretation and think that the small size of the particles involved in the rock fall processes are conditioned by the high density of fractures and faults with a spacing of 2 to 10 cm (see next section). However, whereas the inferred mechanisms of denudation are likely to be the same across the entire the Eiger, the erosional velocities are different. In particular, the denudation rates at sites EW-03 situated on the lower part of the NW flank and at sites EM01,-02 on the SE rock face are > 1.7 mm a−1 and thus more than 3 times higher than the denudation rates at sites EW-02 (0.5±0.1 mm a−1, Table 1) and EW-01, situated within the upper segment of the Eiger north face. As will be discussed in Sect. 5.3, we explain the spatial pattern of denudation rates by differences in frost shattering processes driven by the contrasts in insolation and temperature conditions. Please note that the modeled denudation rate estimates represent long-term, time-integrated values (e.g., Gosse and Phillips, 2001; Lal, 1991), most likely representative of the last millennium and possibly longer.
5.2 Preconditioning related to bedrock fabric
The rate of rock face denudation could be influenced by the bedrock fabric that affects rock failure in a complex and non-linear way (Krautblatter and Moore, 2014; Viles, 2013). Among these, fracture density and orientation are regarded as the most important variables as they positively correlate with rockwall denudation (Moore et al., 2009; Rapp, 1960; Terzaghi, 1962). In the context of rock fracturing by frost weathering processes, permeability and porosity related to faults and fractures have been identified as significantly affecting the boundaries of the frost cracking window (Draebing et al., 2017b; Matsuoka, 2001) and as limiting water supply within the active layer of the bedrock (Anderson et al., 2013; Andersen et al., 2015; Rode et al., 2016; Sass, 2005). At the Eiger, the bedrock fabric, in both the NW and SE wall, is highly fractured along pre-existing structural weaknesses, which record the combined effect of stress and strain during Alpine orogenesis, and the differential responses of various bedrock lithologies to these conditions. In particular, the region surrounding the Eiger is located at the geological contact between the crystalline rocks of the Aar massif, its sedimentary cover rocks, and the Helvetic thrust nappes (Berger et al., 2017). During Alpine orogenesis, the bedrock was heavily deformed through multiple phases of folding and thrusting, which are recorded by a complex fabric in the exposed rock (Herwegh et al., 2017; Wehrens et al., 2017). At the cosmogenic sampling sites, the bedrock fabric is dominated by two generations of foliation and two sets of joints (Mair et al., 2018). Both foliations are considered to have formed at temperature conditions that were high enough for calcite minerals to deform in a ductile way (Mair et al., 2018). These structures are crosscut by two sets of brittle fault networks with steeply dipping fault planes, yielding a complex patter of fractures and foliations. Age assignments on the formation of these structures are still a matter of debate (Mair et al., 2018).
We find that fractures are developed along foliation planes (S1, S3: Figs. 3 and 4) and are thus oriented parallel to weaknesses inherited from a tectonic stress field (e.g., Fig. 4b). Beside slight differences in the orientation of the foliations, there is little difference in the bedrock fabric between the SE and NW sides. These fractures effectively allow for the disintegration of bedrock into centimeter-sized chips (e.g., Figs. 3a and 4a), which provides an explanation why there is no evidence in the cosmogenic dataset for the occurrence of large-scale rock fall processes (e.g., Mair et al., 2019). Instead, the production of small chips is most likely achieved by frost cracking and ice segregation growth as evidenced by the ice in the bedrock cracks during sampling in December 2016 (Fig. 4b, c). The rockwall-parallel open joints (C2 in Fig. 5) in the northwest and the large shear zones that dissect the mountain in NE–SW and SE–NW directions are suitable water pathways within the bedrock over large distances. Accordingly, the local bedrock fabric at all sites has the potential to allow for efficient bedrock weathering, and the large faults and shear zones are regarded as suitable pathways for water to deeply penetrate through the mountain (Fig. 5e). However, while the high density of fractures and faults provides a suitable condition for the high-frequency occurrence of small-scale rock fall processes on both sites of the mountain, this variable alone is not capable of explaining the contrasts in denudation rates between the upper steep segment of the Eiger north face and the other sites for which cosmogenic data are available.
Another possible driver for rock fall activity could be the formation of sheeting joints in response to paraglacial stress field adjustment after deglaciation (Grämiger et al., 2017; McColl, 2012; McColl and Draebing, 2019). However, we regard this mechanism as unlikely to explain the differences in the denudation pattern because (1) suitable rockwall-parallel joints are only present in the northwest (C2; Fig. 5), where they show a spacing of meters to tens of meters. (2) The last possible glaciation was the LGM deglaciation period in the northwest and the Younger Dryas in the southwest, which would imply a response time of 9 kyr or longer for sheeting joints to form. (3) Furthermore, the response time of stress release through sheeting depends on the rock quality (McColl, 2012). In highly fractured rock, as is the case for the limestones at the Eiger, stress release should occur shortly after or during the deglaciation (McColl 2012; McColl and Draebing, 2019). The general likeliness of sheeting joints to form also depends on the pre-existing fracture density, where a high fracture density (as is the case at the Eiger) better accommodates stresses during glaciation and deglaciation, which in turn hinders sheeting joints to form (McColl, 2012). In summary, a reconfiguration of paraglacial stress might have been an important factor during the deglaciation and shortly thereafter, but we consider it unlikely as driving condition for the high-frequency release of centimeter- to decimeter-sized pieces of bedrock that we currently observe. As will be elaborated in the next sections, we instead relate the differences in denudation rates across the Eiger to the spatial pattern of frost cracking processes, which appears to be controlled by local insolation and temperature conditions.
5.3 Rockwall temperature conditions and rock fracturing process efficiency
Variations in surface temperatures have been regarded as one of the key variables driving mechanical disintegration of rock (e.g., Amitrano et al., 2012; Girard et al., 2013; Matsuoka, 2008). The instrumental records (Gruber et al., 2004b) of NGSTs (recorded at 10 cm bedrock depth) are a good proxy for the temperature conditions at the upper NW wall (sites EW-01,-02) and for the SE wall (sites EM-01,-02), as they have recorded in situ rock temperatures (Allen et al., 2009), which vary from air temperatures (Anderson, 1998). The individual sampling sites are close to the temperature logger sites, with differences in elevation of 16 to 57 m for the sites in the NW wall and 28 to 50 m for the sites in the SE wall. In addition, the logger sites are characterized by a similar local aspect and slope as the cosmogenic sampling sites. A potential difference in local temperature variability of up to ∼6 ∘C (Draebing et al., 2017a; Haberkorn et al., 2015) might arise from extended periods of sufficient snow cover. We cannot rule out the occurrence of snow cover for the cosmogenic sampling sites as snow might also accumulate on steep rockwalls, such as the Eiger (Draebing et al., 2017a; Haberkorn et al., 2015). However, due to the similar position, aspect, and slope we do not think that the logger sites experienced different conditions than the cosmogenic sampling sites. The calculated averages of temperatures, based on 7 full hydrological years between 2001 and 2014 each, are in good agreement with the temperature values for the hydrological year 2002 (Table 1). They show a large difference in MAT (∼2 ∘C) and mean annual and mean diurnal amplitude (∼1.6 ∘C) between the NW rockwall and the SE face, with the SE face experiencing higher and more variable temperatures, despite being at ∼300 m higher elevation. We relate this difference to the effect of the mountain and rockwall geometry (Noetzli et al., 2007), which results in a strong insolation difference between the NW and SE walls (Fig. 2). The processes that could be affected by this variable include permafrost degradation, thermal stresses, volumetric expansion of ice from freezing and thawing, or frost cracking from ice segregation. All of these processes have the potential to weaken the bedrock through fracturing, thereby preconditioning the occurrence of rock fall processes. We first assess the general probability and potential effect of each process for the Eiger sites before we discuss potential controls on the denudation efficiency.
Permafrost degradation has been shown to significantly reduce rockwall stability (Gruber et al., 2004a; Haeberli et al., 1997). For the cosmogenic sampling sites, the relatively high temperatures (MAT =1.8 ∘C; Table 1) rule out the occurrence of permafrost (Gruber et al., 2004b; Noetzli et al., 2007) particularly at the cosmogenic sites in the SE face, while lower MATs (< 0∘C) potentially allow for permafrost occurrence in the upper NW rockwall, at least in the past. Thus, degradation through permafrost alone seems an unlikely mechanism to explain the difference in denudation across the Eiger because it would affect the upper NW wall in an opposite way, which is not the case. However, despite the general increase in the number and the size of cracks at the freezing front under permafrost conditions (Murton et al., 2006), the occurrence of permanently frozen rock might limit the supply of water within the rock itself, especially at colder temperatures where water reservoirs might be absent (e.g., Anderson et al., 2013; Andersen et al., 2015; Draebing et al., 2017b).
Thermal stresses and subsequent expansion and contraction from daily solar temperature fluctuations can weaken the bedrock and cause the growth of subcritical fractures (Aldred et al., 2016; Eppes et al., 2016). The occurrence of cycles where cracks open and close on a daily basis has indeed been observed in rock slopes (Draebing et al., 2017b; Rode et al., 2016). This mechanism has been shown to lead to a progressive growth of cracks (Collins and Stock, 2016). Thermo-mechanical rock fracturing would especially affect the SE wall, as this flank experiences significantly more direct insolation throughout a year (Fig. 2). In a similar sense, volumetric expansion from freezing and thawing can also occur (Matsuoka, 2008), but these processes are limited by ice extrusion and require a high degree of water saturation and fast freezing (Davidson and Nye, 1985; Matsuoka and Murton, 2008). However, recent field (Draebing et al., 2017b) and laboratory experiments (Draebing and Krautblatter, 2019) disclosed little evidence for significant frost cracking from volumetric expansion. Therefore, we do not think that this mechanism exerts a significant control on the denudation rates at the cosmogenic nuclide sampling sites.
Instead, we regard frost cracking from ice segregation and progressive growth of ice lenses (Walder and Hallet, 1985) as a suitable mechanism that explains the denudation pattern we observe at the Eiger. Hallet et al. (1991) showed that these processes have the potential to generate large stresses of up to 30 MPa in bedrock. However, recent experiments revealed much lower stresses, which only allow for subcritical cracking (Draebing and Krautblatter, 2019). Frost cracking has often been associated with a frost cracking temperature window (FCW) between −3 and −8 ∘C within the rock (Hales and Roering, 2007; Walder and Hallet, 1985), but this temperature window is affected by the mechanical properties of the bedrock itself (Draebing et al., 2017b; Draebing and Krautblatter, 2019; Matsuoka, 2001; Walder and Hallet, 1985). Theoretical modeling shows that the lower boundary of this window has no significant effect on the cracking efficiency. While an upper FCW boundary of −3 ∘C was suggested by Hallet et al. (1991) and Matsuoka (2001), Draebing and Krautblatter (2019) found that experimental results were more consistent with an upper FCW boundary of up to −0.64 ∘C. Furthermore, these authors also suggested a strong dependency of the FCW on lithology, crack geometry, and fracture toughness (Rempel et al., 2016; Walder and Hallet, 1985). We tested the dependency of the frost cracking intensity on the FCW by applying values that were determined by Draebing et al. (2017b) for slaty gneiss (instead of limestone). The model runs disclose two observations: first, the general pattern of the annual cracking intensity in relation to the MAT remains the same for various FCWs. Second and most important, the differences in intensities between the upper NW and the lower NW and SE sites also remain the same (see Appendix B). However, the models also predict that the total fracture intensity increases with the size and the upper boundary of the FCW (Fig. B1). Thus, further studies on the lithology dependency of the FCW are needed to compare our predicted cracking intensity with the results of other studies.
The selection of values for the thermal conductivity of bedrock might also affect the predicted fracture intensity. In particular, while lower conductivities (i.e., 1.2 W m−1 K−1) tend to promote the cracking processes, higher conductivities (i.e., ≥6.5 W m−1 K−1) mitigate the occurrence of cracking to the point where any frost cracking differences between the various sites at the Eiger become undetectable (Fig. B2). However, the selected standard value of 3 W m−1 K−1 is in good agreement with values reported for limestone or sandstone where temperatures are close to 0 ∘C (Schön, 2015). Therefore, we do not think that our assigned values to the conductivity introduce a bias in the model.
In general, water needs to be available for continued and efficient cracking from ice segregation, and the model employed in this study scales cracking intensity with the availability of liquid water. For steep and bare bedrock this has been related to two distinct temperature conditions: (i) cold regions with negative MATs and (ii) warm regions with positive MATs, where temperatures occasionally reach the frost cracking window (Anderson et al., 2013; Andersen et al., 2015; Delunel et al., 2010; Hales and Roering, 2007; Savi et al., 2015). Accordingly, in the absence of a regolith cover as a reservoir, bare bedrock might stay frozen over longer periods and therefore permafrost might reduce the water availability (Andersen et al., 2015; Draebing et al., 2017b). For positive MATs, frost cracking is predicted to only occur in winter when the surface is frozen and water is available from within the bedrock (Anderson et al., 2013; Andersen et al., 2015). Extended snow cover could increase the frost cracking activity, since it has been shown to maintain the temperatures in the frost cracking window for a longer time interval, which facilitates the opening of fractures (Draebing et al., 2017b). For our sites at the Eiger, the lower NW and the SE sites fall within the second temperature conditions favorable for frost cracking (Table 1), and water should be available through the network of faults within the bedrock (see Sect. 4.2). For the upper part of the north face, estimations of MATs return values of −0.5 ∘ C for the present (Table 1). For these conditions, all models predict a limited cracking efficiency from ice segregation (Anderson et al., 2013; Andersen et al., 2015; Hales and Roering, 2007). In addition, the predicted frost cracking occurs only at shallow depths, as the deeper rock is frozen without any water circulation particularly in winter. In summer, however, pore water is likely to be available, but bedrock temperatures do not reach the FCI window. As a result, all models predict that in the SE wall and in the lower part of the NW flank, frost cracking processes are likely twice as efficient as in the upper part of the NW face (Figs. 6 and 7; Table 2). In summary, we regard frost cracking from ice segregation, potentially affected by permafrost, and thermal stress as the most important mechanisms for the erosion of the Eiger. The effectiveness of these processes is additionally enhanced by mechanical weaknesses in the bedrock due to faults and foliations.
5.4 Past and future conditions
The modeled absolute minimum exposure ages are 0.7 ka for EW-01 and 0.9 ka for EW-02, and the apparent minimum exposure age, which is calculated from the surface samples only and under the assumption of a constant denudation rate of 0.12 mm a−1, is 1.7 ka for EW-02 (Mair et al., 2019). These ages represent robust minima for the local rockwall exposure, and they suggest that the denudation rates represent integrated averages for at least these time periods and possibly even longer. Thus, conditions during these times might have changed. Modifications in local exposure geometry and insolation could have only been achieved through the occurrence of bergsturz events (> 1 M m3 rockfall volume). We do not think that this was the case because geological maps show that there is no depositional evidence for a past bergsturz at the Eiger (e.g., Günzler-Seifert and Wyss, 1938; Mair et al., 2018). Therefore, and because of the dependency of rock fracturing on temperatures, we consider variations in temperatures over the last 2 millennia as the only potential variable. However, calculated for mean current temperatures do not exceed the estimated for maximum temperature excursions in the past. This is even the case for the Medieval and Roman Climate Optimum, which was the warmest period with the largest temperature difference to modern times (Fig. 6). In contrast, colder conditions, which could have prevailed during the Little Ice Age and the Migration Period, would have resulted in a lower efficiency of frost cracking at all cosmogenic sites (Table 1). This reduction would have been caused by a lower water availability in the SE wall and by temperatures that were potentially too low to promote frost cracking in the NW flank. However, we note that the calculated differences in between a warmer or a colder paleo-climate are lower than the contrasts in modern between the upper sites in the NW rockwall and the lower location on the same face of the Eiger. They are also lower than the modern contrasts between the upper NW and SE rockwall sites.

Figure 7Schematic section (for trace see Fig. 1) with main findings. MAT: mean annual temperature; : annual frost cracking intensity index; ε: denudation rate. symbols represent mean modern temperature conditions (Table 4). MAT symbols represent mean modern temperature conditions color-coded with symbol size representing mean annual and diurnal amplitude (Table 1); see text for discussion.
Temperatures are predicted to increase during the 21st century by up to 0.36 ∘C per decade for the European Alps (emission scenario A1B; Gobiet et al., 2014). Mean annual air temperatures for Switzerland in 2100 CE could increase by 1.9 ∘C and even 5.4 ∘C compared with the period 1981-2010 (emission scenarios RCP2.6 and RCP 8.5, respectively; CH2018, 2018). These inferred differences in temperatures are larger than all reconstructed excursions for the past (Table 1). Such an increase in temperature could enhance the efficiency of frost cracking under similar diurnal and annual temperature amplitudes, especially in combination with permafrost degradation (Gruber and Haeberli, 2007), e.g., in the upper part of the NW rockwall. However, changes in precipitation and a reduction in time spent in the frost cracking window might shift the overall controls on fracturing to amplified thermal stresses, especially boosting rock fracturing on the SE face (Draebing et al., 2017b).
Published cosmogenic nuclide inventories along depth profiles at the Eiger indicate that denudation on the SE wall and at the base of the NW rock face (Fig. 7) is up to 4 times higher than the rates determined for the upper part of the NW rockwall. Local bedrock fabric discloses centimeter- to decimeter-spaced fractures, which follow pre-existing structural weaknesses, as the main precondition for the occurrence of small-scale rock fall as the main driver for denudation. These conditions might have prevailed for several centuries to millennia. The difference in the long-term average denudation rates particularly between the upper rockwall of the Eiger north face and the base and the SE face of this mountain can be related to different efficiencies of rock fracturing processes, which strongly depend on temperature conditions (Fig. 7). Modeling indicates a strong contrast in frost cracking efficiency from ice segregation between the upper (relatively low) and lower sites on the NW wall (relatively high efficiency) but also between the upper site on the NW rock face of the Eiger and the SE sites (also relatively high efficiency), which is caused by local temperature conditions. The contrast might be enhanced by permafrost in the upper NW wall. This could potentially reduce the availability of water and decrease the cracking efficiency. Furthermore, thermal stresses from differences in insolation might additionally enhance rock fracturing in the SE rock faces. Throughout the last millennium, conditions have been very similar to the present temperatures in bedrock, yet colder temperatures during the Little Ice Age might have slightly reduced frost cracking efficiency.
We measured concentrations of cosmogenic 10Be along a depth profile at site EW-01 (Fig. 1) to extract information on local bedrock denudation rate and exposure age. These variables were derived through Monte Carlo (MC) depth profile modeling techniques (Hidy et al., 2010).
A1 Sampling and 10Be measurement
We collected five bedrock samples within a depth profile at site EW-01 (Fig. 1; Table 1) from quartz-bearing recrystallized chert layers, from the wall of a tunnel that connects the Jungfraubahnen railway tunnel with the rockwall surface. The samples were collected from the intact, bare bedrock wall, while the surface sample was taken from the current bedrock face next to the tunnel opening. The bedrock material was quarried with a battery saw and chisel, thereby following standard sampling protocols (Dunai and Stuart, 2009). Each sample was 5 to 10 cm thick and consisted of 1 to 1.5 kg of rock material. Concentrations of cosmogenic 10Be were measured on quartz grains that were extracted from these samples. Sample preparation followed the procedure of Akçar et al. (2012) and took place at the Institute of Geological Sciences, University of Bern. 10Be∕9Be ratios were measured by accelerator mass spectrometry (AMS) at the AMS facility at ETH Zurich, and were normalized to internal standard S2007N (Christl et al., 2013). The measured ratios were corrected using a long-term, variance-weighted average, full-process blank ratio of with a relative standard error of the weighted mean of and a weighted variance of 18.8 % (from 28 in-batch measured blanks from the same 9Be spike preparation over several months' time). This amounted to a relative correction between 3 and < 19 %. We used the long-term average, as we regard the spike as the main source of contamination of the blank and samples and thus as being stochastic in nature. However, we note that the measured in-batch blank showed a ratio of (4.81±1.12) . Using this value for correction would amount to relative blank corrections between 29 % and 36 % for samples EW-01-4, -5, and -6, which would render them uninterpretable, as concentrations would be too low to be regarded as reliably detected. Thus, all subsequent steps in processing and interpretation on the 10Be data rely on the validity of the long-term, variance-weighted average blank correction.
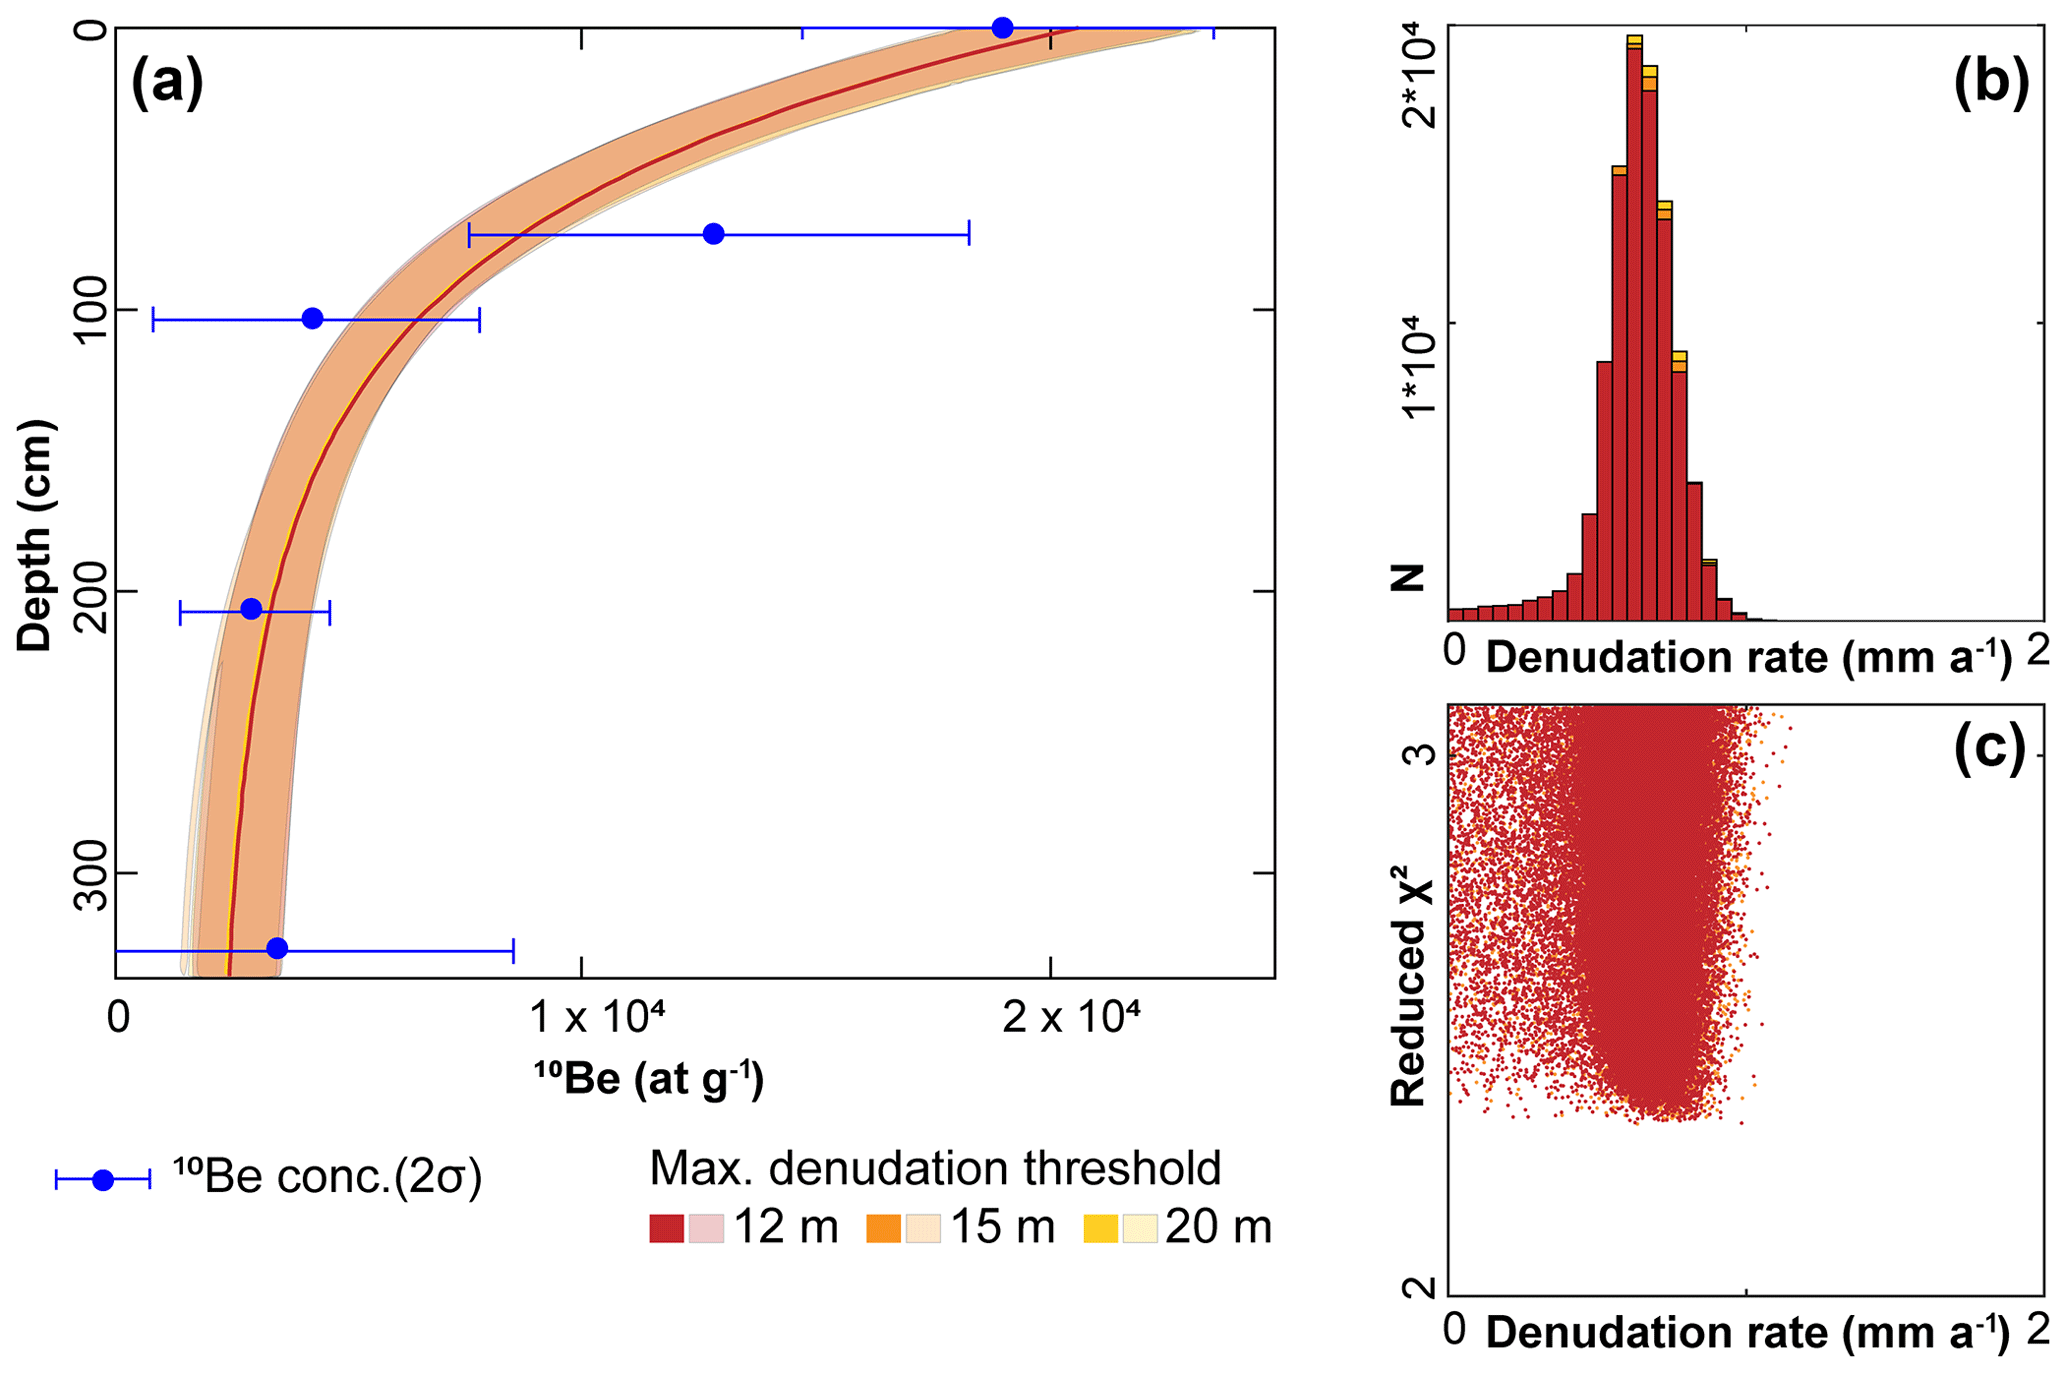
Figure A1Analysis of cosmogenic 10Be at site EW-01. (a) Measured 10Be concentrations plotted against the Monte Carlo (MC) solution space (light colors) and the best-fit profiles. (b) Denudation rate histogram from the MC modeling for 105 model profiles and (c) corresponding reduced chi-square (χ2) values. Different model setup results are superimposed (for discussion see text).
Nevertheless, the rock samples show 10Be concentrations (Fig. A1) that range from 1.9×10⁴ at g−1 to 0.35×10⁴ at g−1 (Table A1) and that decrease with depth. The standard 1σ error (ranging from 0.07×10⁴ at g−1 to 0.24×10⁴ at g−1; Table A1), which accounts for AMS reproducibility and counting statistics, shows relative uncertainties ranging from 11 % to 69 %. These uncertainties are high. However, despite the low concentrations they still allow for a meaningful profile modeling.
A2 Depth profile modeling
In situ cosmogenic 10Be is mainly produced through spallation and muon reactions on O and Si (Gosse and Phillips, 2001). Accordingly, the production needs a scaling to geographic position and elevation, and it needs a correction for shielding from secondary cosmic ray particles (Gosse and Phillips, 2001; Lal, 1991). Production rate scaling for spallation production was done using the method of Stone (2000), which is based on the work of Lal (1991). We updated these approaches using the recalibrated reference dataset of Borchers et al. (2016) for our scaling framework. For the consideration of muogenic production, we used the parametrization scheme by Balco et al. (2008), which is based on muogenic production systematics presented by Heisinger et al. (2002a, b). The experimental fit for muogenic production of these authors, however, is known to yield an up to ∼40 % overestimation of muogenic 10Be production (Borchers et al., 2016; Braucher et al., 2003, 2013). To account for this effect, an uncertainty of 40 % was assigned on the muogenic production during the MC modeling, which is described below. We finally computed an open-sky visibility over 1∘ azimuthal increments to account for rockwall and bedrock specific geometry and shielding. This was done using a high-resolution (2 m) digital elevation model provided by the Swiss Federal Office of Topography (swisstopo) as a basis. We used the combination of these constraints to calculate a total site-specific shielding factor (ST) and apparent attenuation length (Λf,e) for spallogenic production with the CRONUS Earth online Topographic Shielding Calculator v2.0 (Marrero et al., 2016). The shielding factor (ST) was used to correct for both spallogenic and muogenic production, which is necessary due to the large height of the rockwall (Mair et al., 2019). The site-specific apparent attenuation length for spallogenic production (Λf,e) was used to correct for geometric effects (Dunne et al., 1999; Gosse and Phillips, 2001). A detailed discussion of the approach can be found in the Supplement of Mair et al. (2019).
The modeling of TCN profiles in bedrock requires the consideration of possible excess nuclides, similar to inheritance, from previous exposure. For bedrock profiles, we explain the occurrence of such excess nuclides with a history where bedrock was previously exposed to cosmic rays. This could have been achieved in a scenario where the current exposure started with an erosion event that was too small to completely reset the TCN clock. Alternatively, the excess nuclides can build up through a prolonged period during which the exposed surface has experienced a low denudation rate. Such a mechanism would allow for the accumulation of “excess nuclides at depth”. However, since such an exposure can only occur through a removal of bedrock material, such a concentration of excess nuclides would have been produced by muons only (due to the position of the sample at significant depth) and would follow an exponential decrease with depth (Mair et al., 2019). To account for excess nuclides, we modeled an excess nuclide concentration for the surface sample (Cinh), which we used to parametrize potential excess nuclides at depth, similar to inheritance (Cinh,z), following
We used the value of a fitted muon attenuation length of 4852 g cm−2 for Λinh, which is in good agreement with published reconstructed muon attenuation lengths (Braucher et al., 2013).
In general, a MC approach for depth profile modeling requires initial boundaries for the modeled quantities, i.e., exposure age, potentially inherited nuclides, and denudation rate (Hidy et al., 2010). We selected a broad range for these values in an effort not to predetermine the solution space and thus not to bias the interpretation. We thus set a constraint of (i) 75 ka on the exposure age (which is an uppermost limit given the 20 kyr since the LGM), (ii) the 10Be concentration of the surface sample (i.e., 1.9×10⁴ at g−1) for excess nuclides at depth, and (iii) a maximum rate of 15 mm a−1 on the denudation variable and thus a maximum of 12, 15, and 20 m for the cumulative amount of denudation for up to 75 ka. These estimates are regarded as conservative values because they represent uppermost bounds for a possible exposure age, denudation rate and an excess TCN concentration, similar to inheritance (for a full justification, see the method section of Mair et al., 2019). We used these three values because the deepest samples were taken at depths close to or exceeding 7 m, and consequently, the production of TCN has almost exclusively occurred by muon pathways. Muon attenuation scales exponentially, with reported muon attenuation lengths between ∼4000 and 5300±950 g cm−2 for 2.7 g cm−3 rock density (e.g., Braucher et al., 2013). This translates into muon attenuation depths of ∼15 and ∼19 m for one attenuation length and ∼30 to ∼38 m for two attenuation lengths, which accounts for a reduction in muogenic production by ∼63 % and ∼87 %, respectively. This means that independent of the attenuation length, our deepest samples would have to be located at a depth of > 23 m at the start of the exposure to allow for more than 20 m of total denudation to occur. Any potential nuclides inherited from before would then have accumulated at this depth or even deeper (Mair et al., 2019). The main purpose of running three setups for the cumulative amount of denudation is to test whether the model results depend on the initial constraints on denudation, which is not the case here (see Appendix A3). We note that this approach is not applicable to extract exposure ages without independent denudation constraints (Anderson et al., 1996; Hidy et al., 2010).
For rock density, we employed a uniform value of 2.68±0.04 g cm−3 to account for the full density range between pure quartz (2.65 g cm−3), the local limestone (2.68±0.02 g cm−3 measured by Mair et al., 2019), and pure limestone (2.71 g cm−3). This also includes density effects related to the occurrence of nodular chert, which was sampled for the purpose of this study. We ran the MC model until we obtained 105 profiles where the modeled concentrations fall within a 2σ-confidence interval of the measured 10Be concentrations (which corresponds to reduced χ2 value < 3.09). All input parameters for the MC modeling are reported in Table A2. The documentation and raw results are provided in the Supplement.
Table A1Measured 10Be∕9Be ratios and 10Be concentrations for samples of depth profile EW-01. 10Be concentrations were adjusted using a weighted long-term average blank ratio of , amounting to corrections of between 3 and < 19 % (see discussion in text).
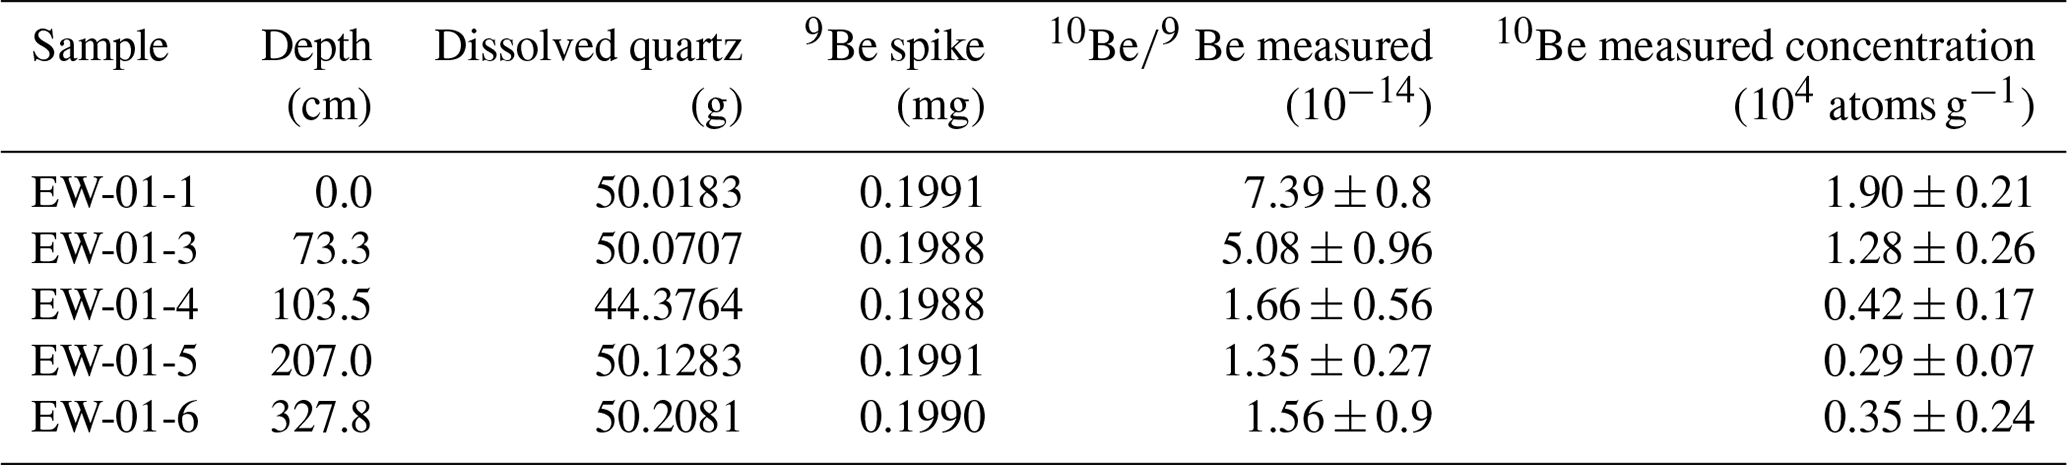
Table A2Input parameters for the modified Monte Carlo (MC) simulation code of Hidy et al. (2010).
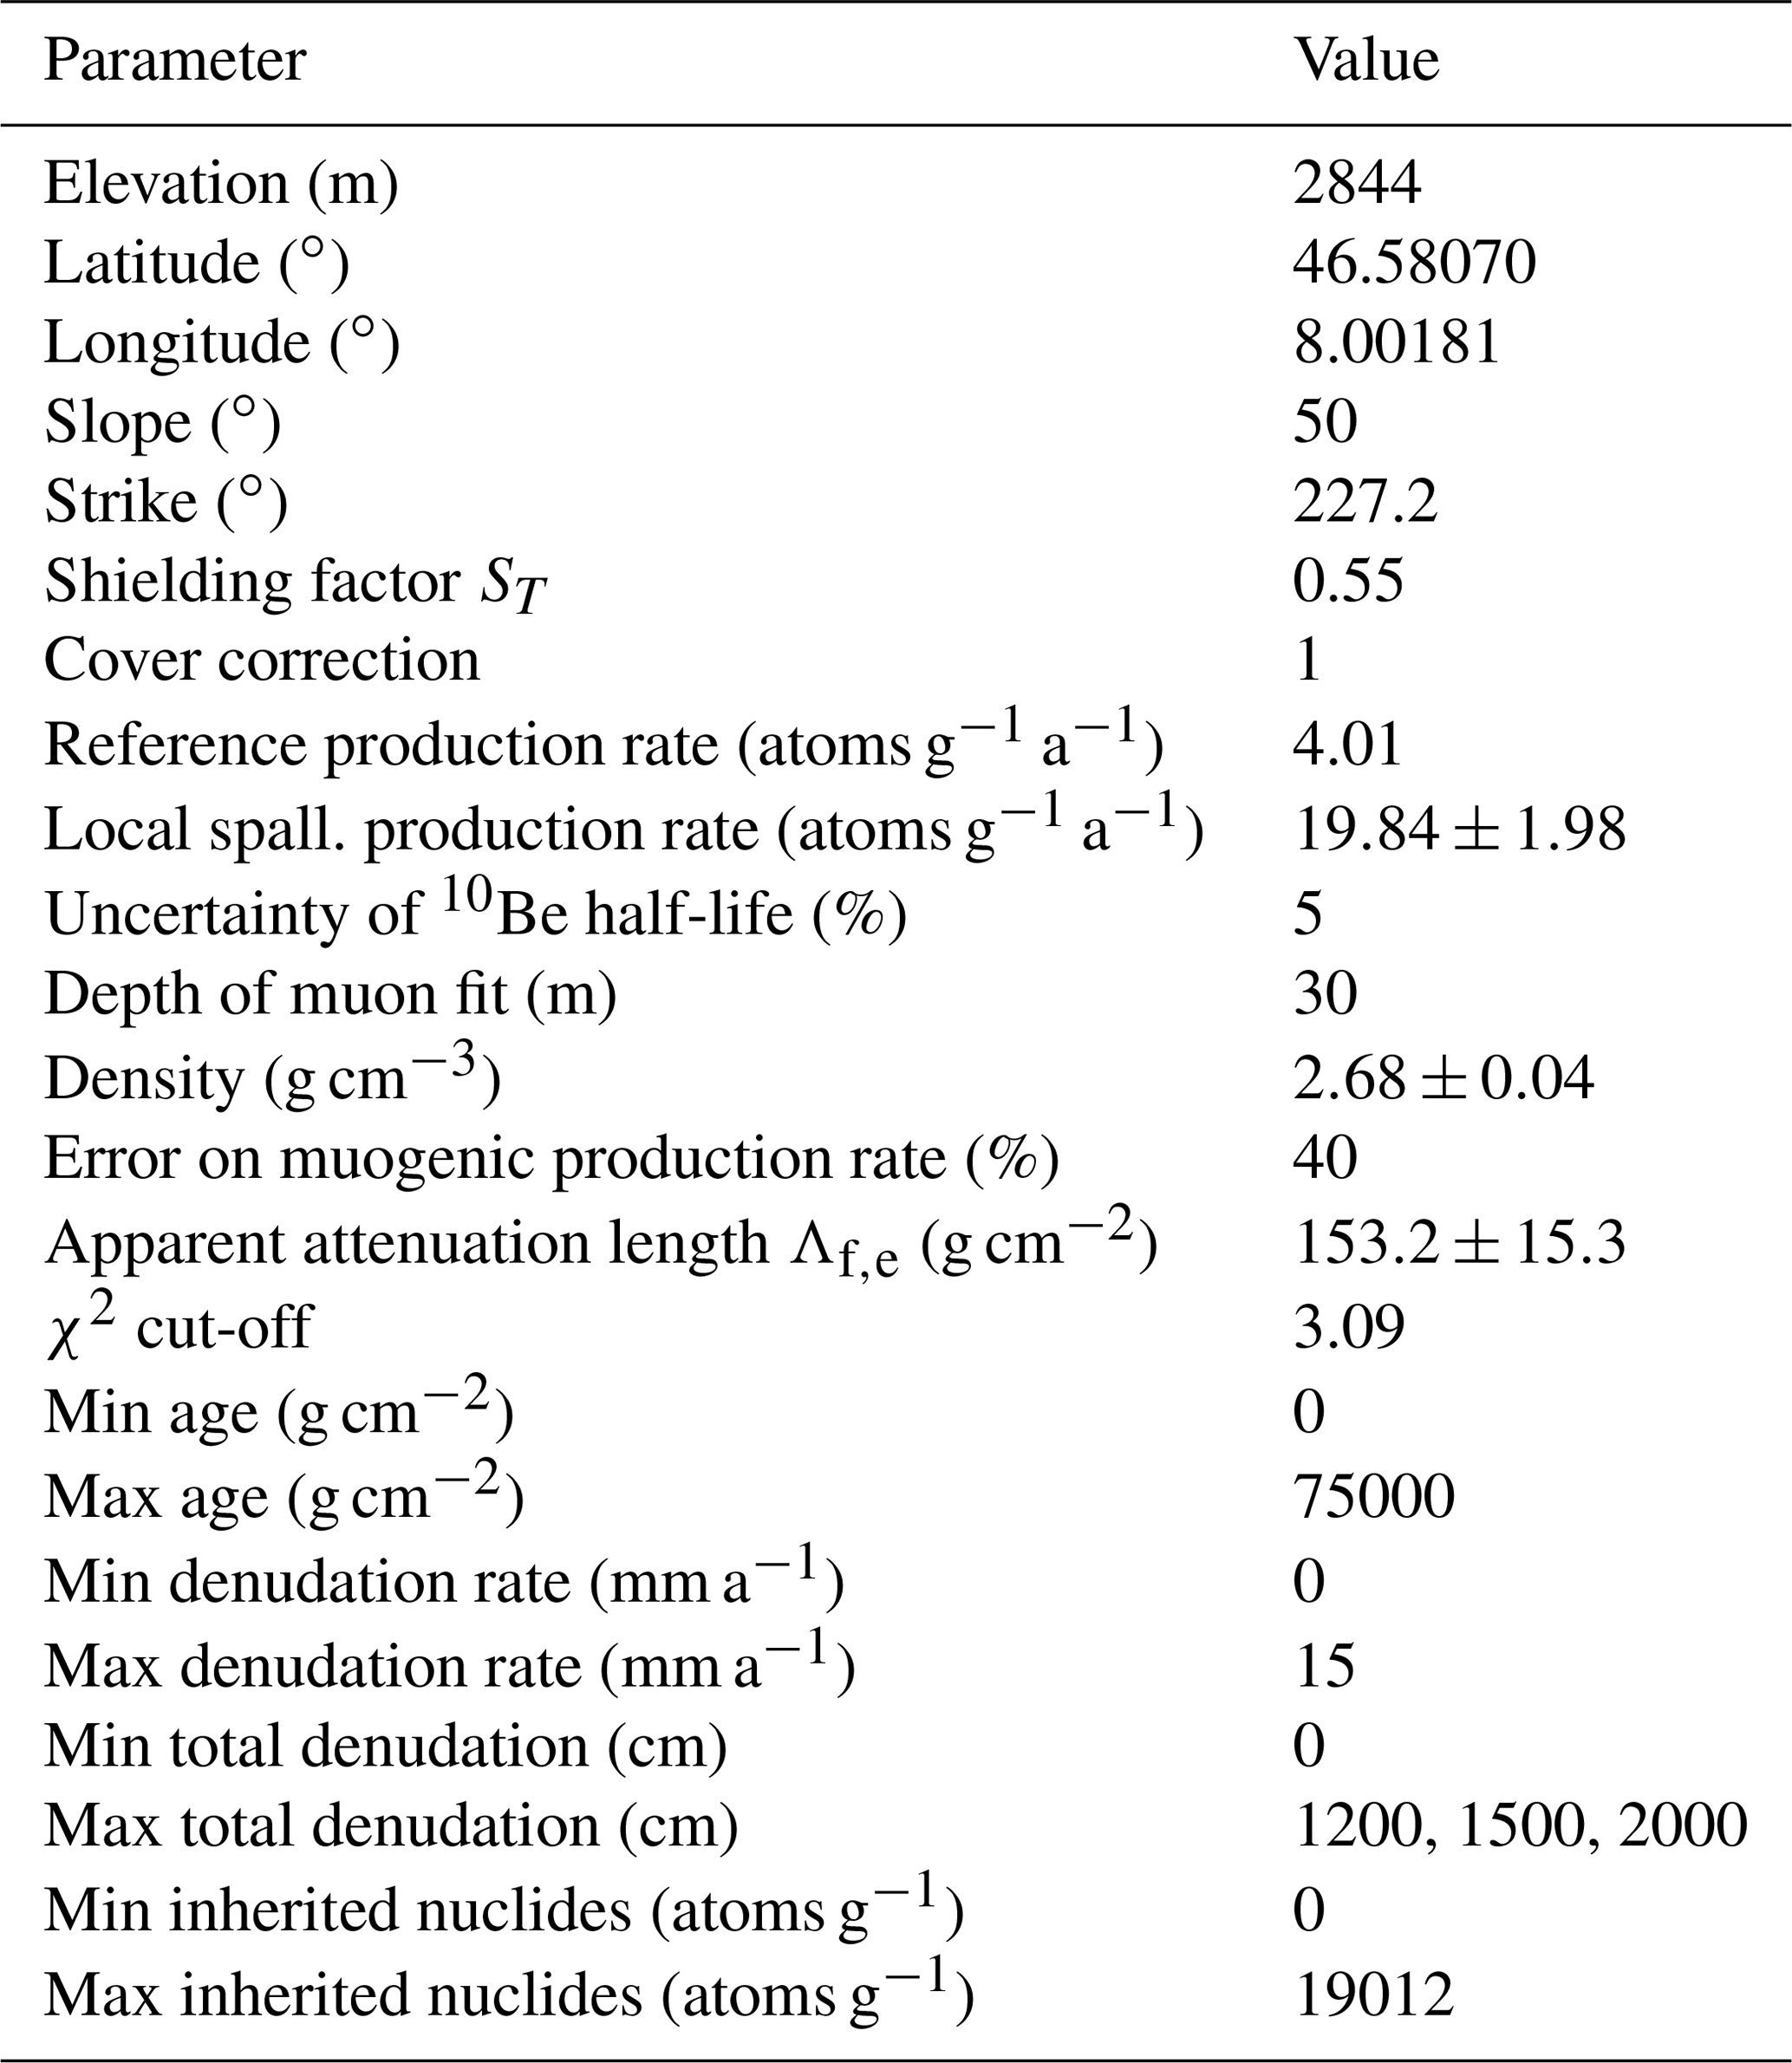
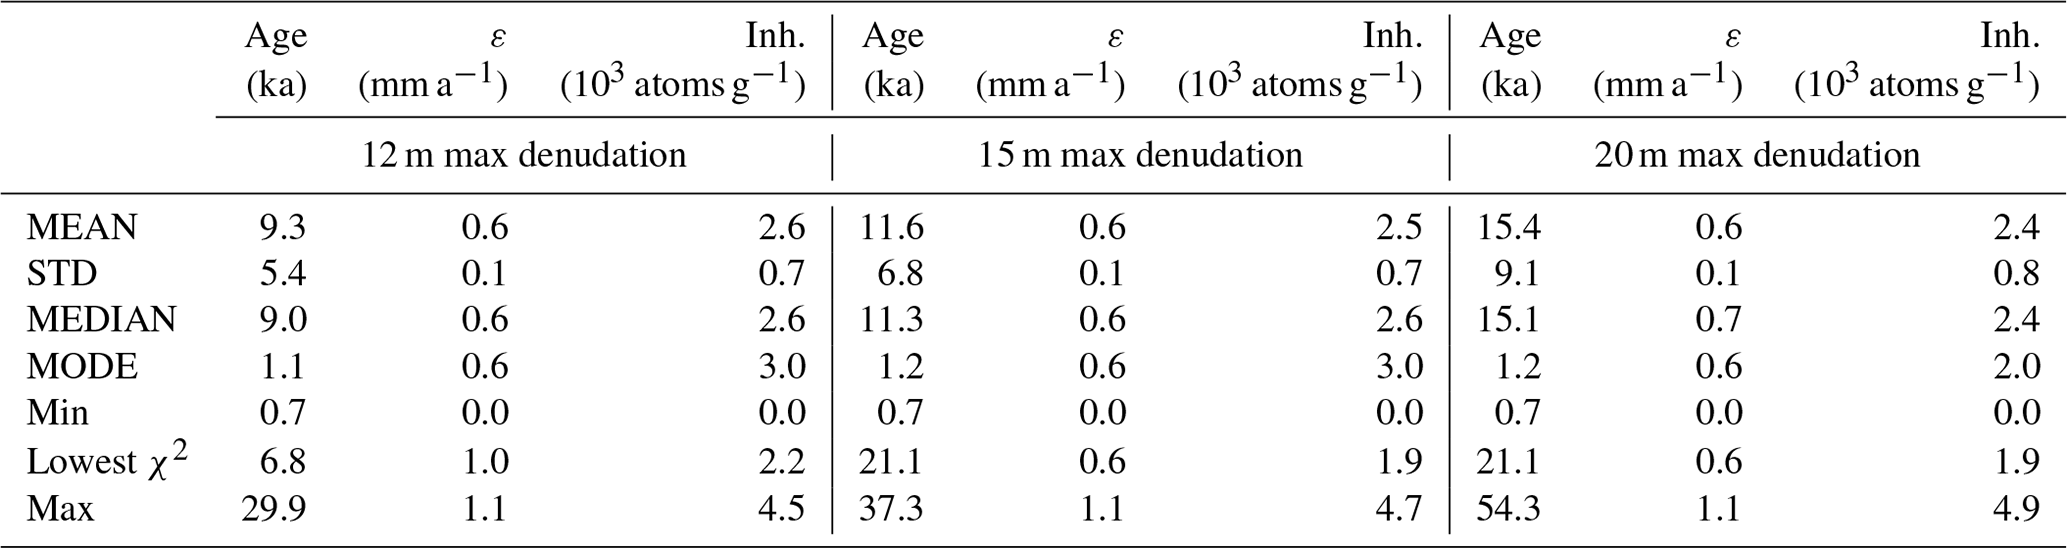
Table A3Result statistics for Monte Carlo (MC) depth profile modeling of profile EW-01.
A3 Model results
The MC simulation returned 105 profiles where the model concentrations are within a 2σ measurement confidence interval with a minimum of reduced χ2=2.32, while χ2 are lowest close to the mean and the median estimates of denudation rates. The MC simulation returns consistent values for inherited nuclides and denudation rate, where mean and median values are in good agreement and follow a well-defined Gaussian distribution (Fig. A1; complete modeling results are provided in the Supplement). Thus, the MC simulation results are independent of the initial constraint on total denudation (Table A3). In detail, mean modeled inherited concentrations range from (2.4±0.6) ×103 at g−1 to (2.6±0.7) ×103 at g−1 10Be, accounting for 13 %–14 % of the measured concentration for the surface sample. Mean denudation rate values range between (0.6±0.1) mm a−1 and (0.7±0.1) mm a−1. Surface exposure ages cannot be estimated from the model run results. However, the MC simulations yield agreeing minimum ages of 0.7 ka.
The frost cracking model of Andersen et al. (2015), which was employed in this paper, was run with the authors' standard setup, using the input values given in Table B1. The resulting annual predictions are the most sensitive to flow restrictions for water and to different FCW windows (Andersen et al., 2015). The former are discussed in detail by Andersen et al. (2015). These authors concluded that in cases where no restrictions are set to water supply and water flow, the cracking intensity is predicted to increase for positive MATs, but the relationships between MATs and the predicted s will remain. In contrast, in cases where water supply is substantially restricted, values will increase for negative MATs (Andersen et al., 2015; see their Fig. 11). According to Andersen et al. (2015), the predicted pattern and intensity will only change significantly for the case where the FCW is lowered to the window between −15 and −4 ∘C. However, the sensitivity analysis of these authors did not incorporate the range of recently reported FCW values for slaty gneisses (Draebing et al., 2017b), which are characterized by a significantly higher upper temperature threshold (i.e., −9.3 to −1.4 ∘C) and a smaller temperature range (i.e., −4.5 to −1.8 ∘C). We used these values together with an FCW between −8 and −3 ∘C, which has been proposed for limestones (Matsuoka, 2001). With this setup, we aim to test the sensitivity of the model on the FCW. While the model predicts higher absolute intensities for higher upper threshold temperatures, the relative relation with the MAT remains the same for all our settings and temperature regimes (Fig. B1). We further tested the sensitivity of the model for the thermal conductivity values that we employed in this paper because thermal conductivities vary with bedrock type (e.g., Schön, 2015; and references therein). We did so by running the model with standard settings and bedrock thermal conductivity values of 1.2 and 6.5 W m−1 K−1. This corresponds to the upper and lower bounds for gneisses and to the mean values for mono-mineralic quartz (Schön, 2015; and references therein). The results predict an absolute and relative increase in predicted for positive MATs and for lower thermal conductivities. In contrast, very high thermal conductivities would reduce to a point where no significant dependence on the MAT is present (Fig. B2). We note here that reported values for limestone at temperatures close to 0∘ C are close to the standard model value of 3.0 W m−1 K−1.
Table B1Model parameters for the frost cracking model of Andersen et al. (2015) used and not already given in Sect. 3 of the main text.
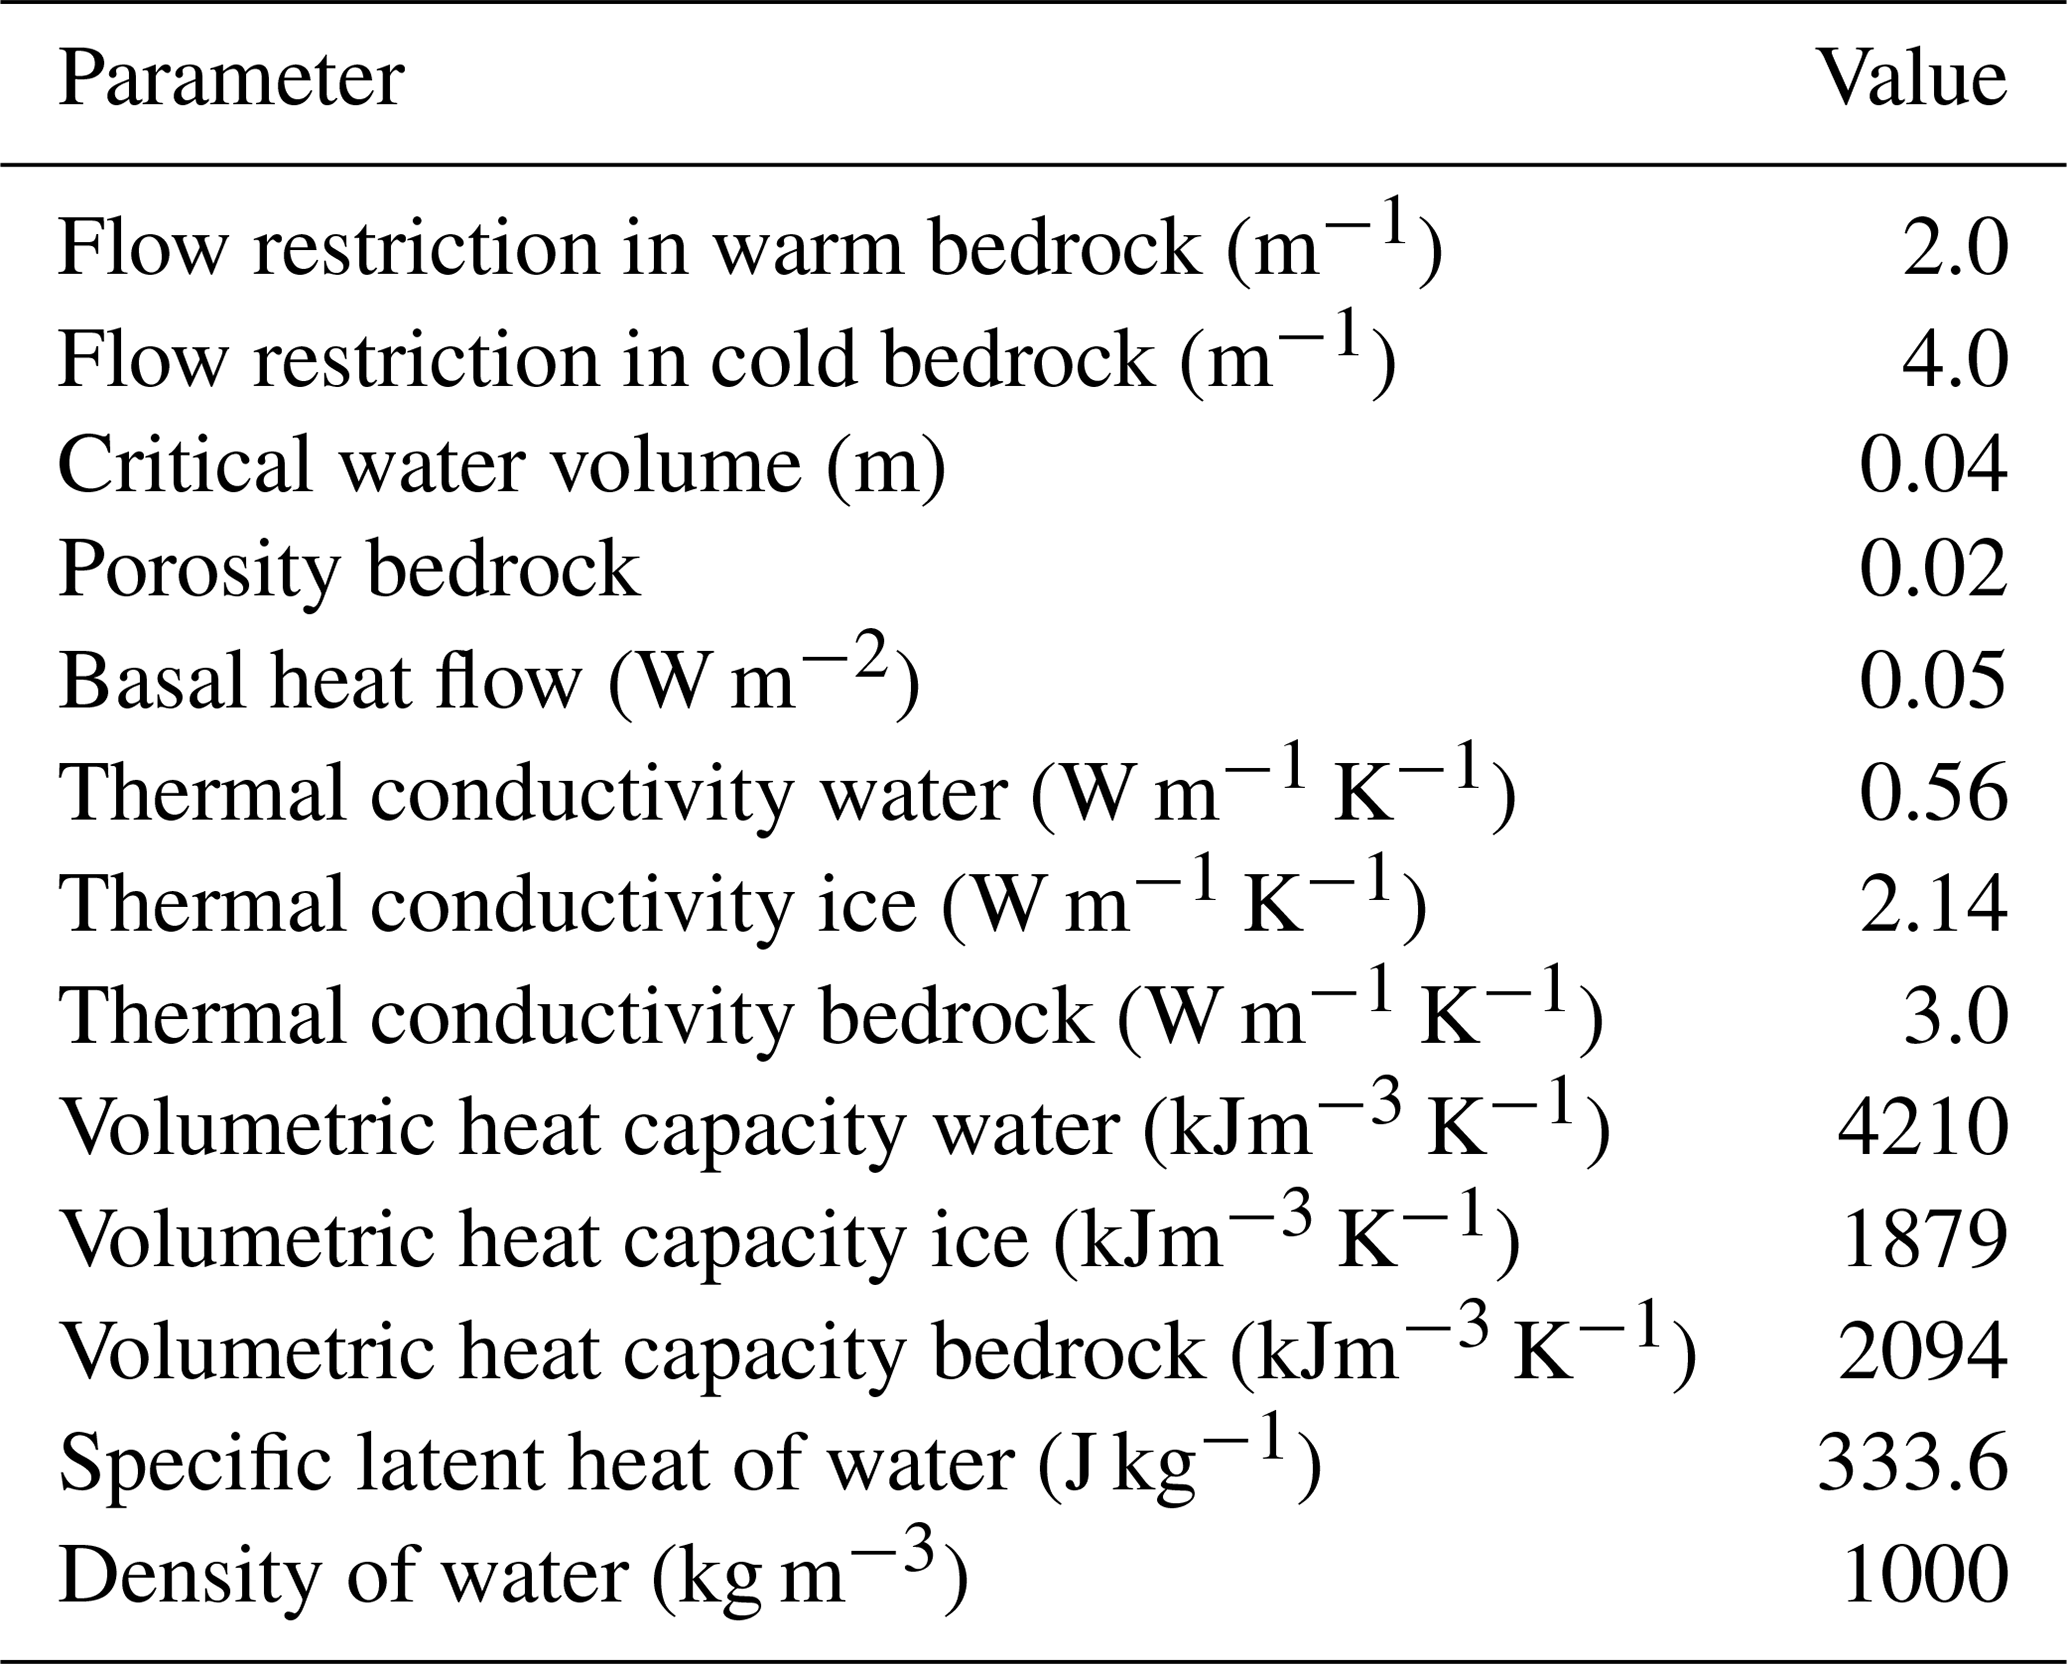

Figure B1 sensitivity to different frost cracking windows (FCW) for the frost cracking model, with standard model inputs from Andersen et al. (2015) in the upper row and two windows from Draebing et al. (2017b) in the middle and lower row. These are dependent on the mechanical bedrock properties and were originally calculated for anisotropic slaty paragneisses. Shaded area corresponds to reconstructed historical temperature range; vertical bars indicate modern mean, min, and max MAT conditions, and curves represent the corresponding dTa and dTd conditions. Note the different y-axis scale for the of each row.
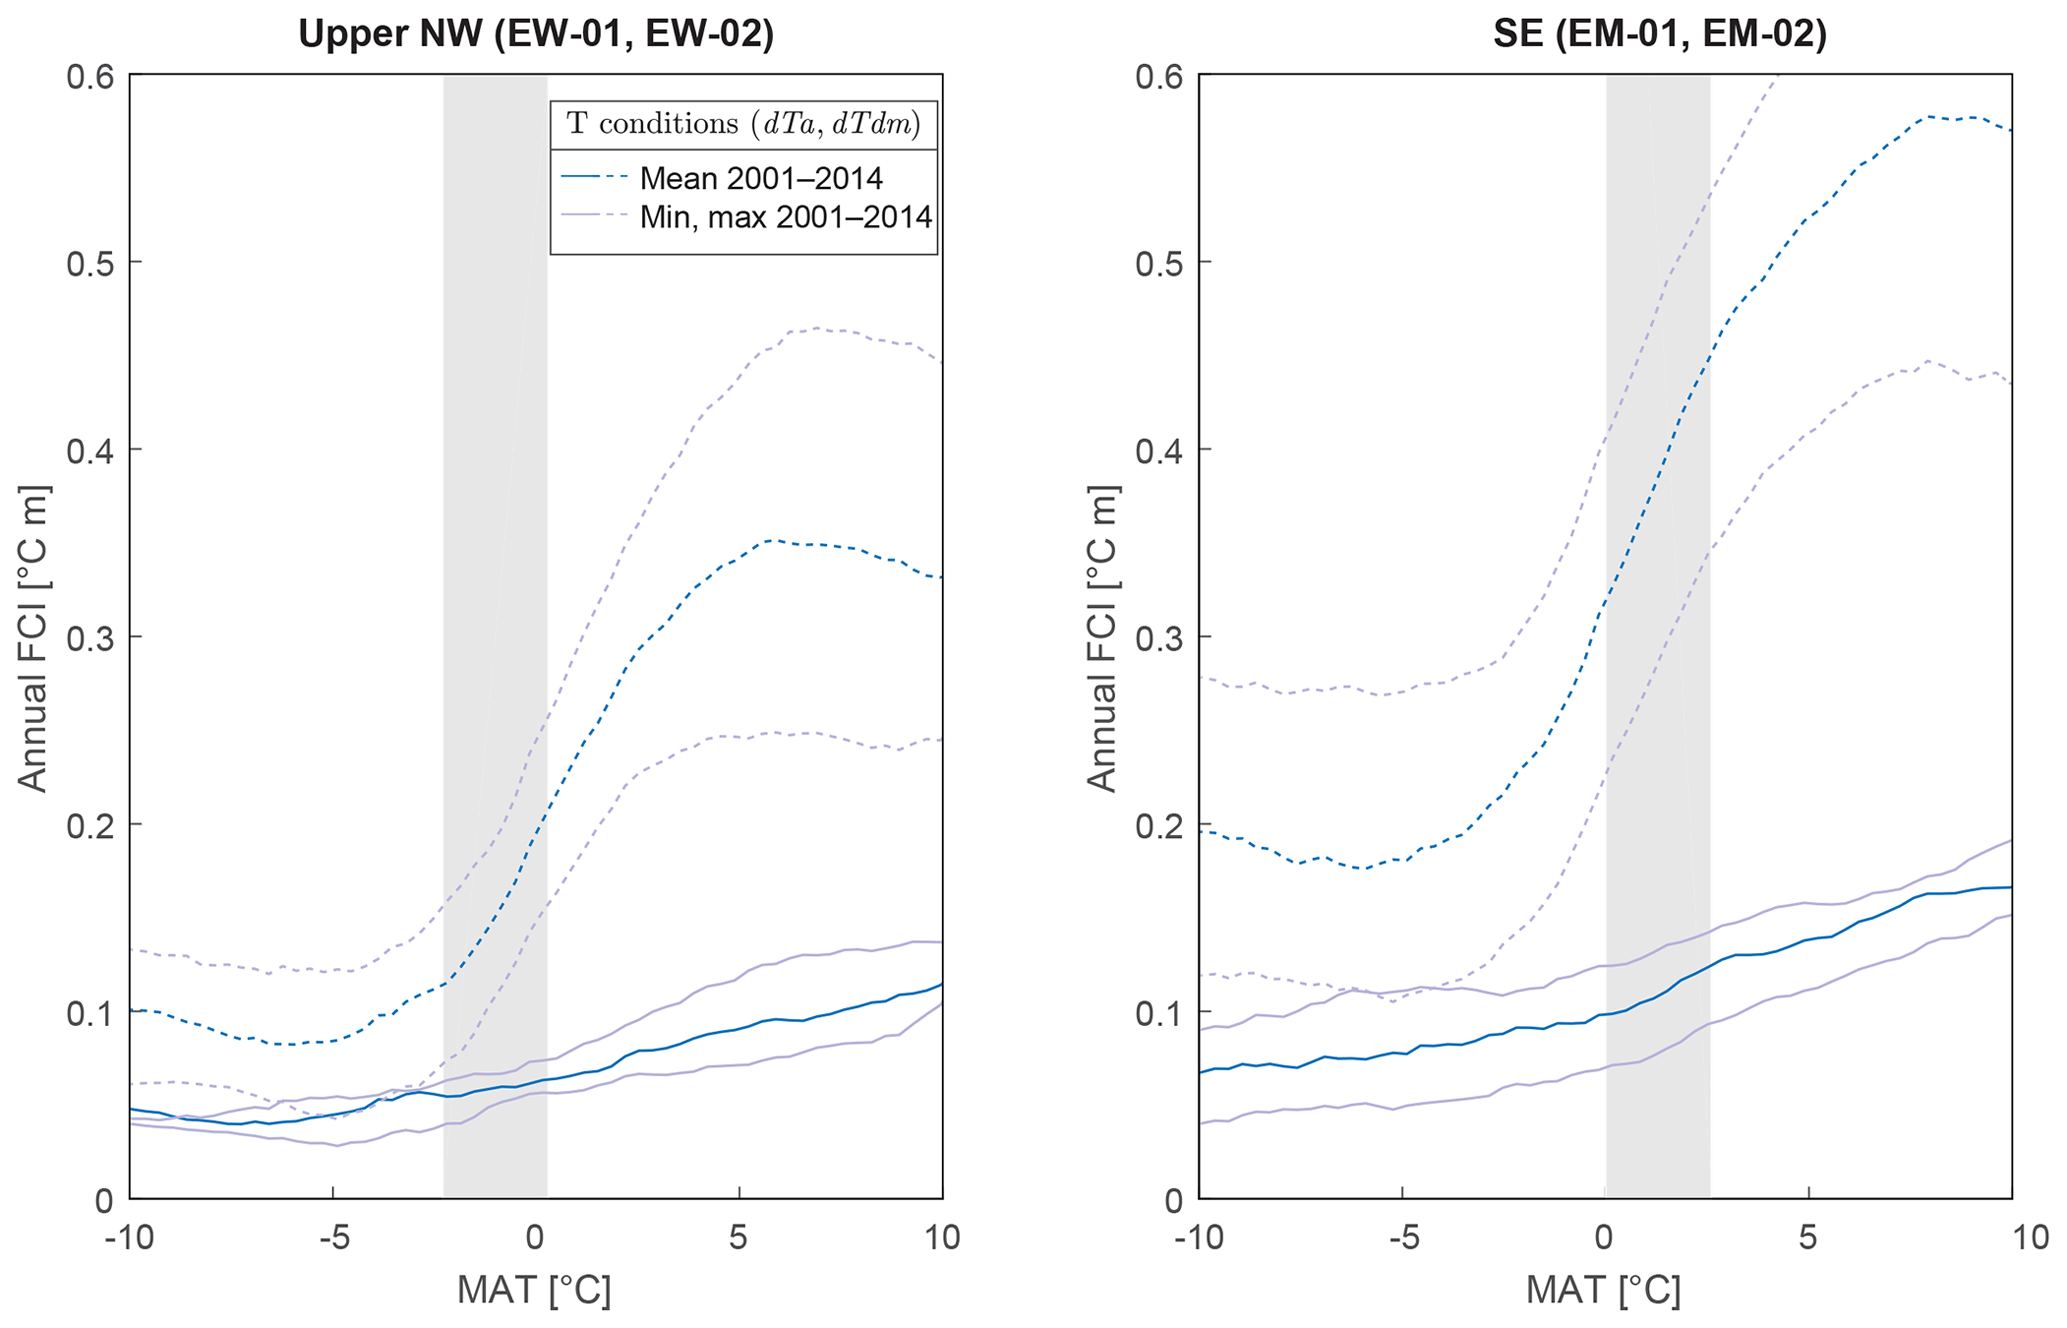
Figure B2 sensitivity to thermal conductivity of bedrock (kr). Modeled results for results with kr = 1.2 W m−1 K−1 (dashed lines) and kr = 6.5 W m−1 K−1 (solid lines), representing upper and lower thresholds for thermal conductivities compiled for various lithologies (Schön, 2015). Model set up to standard conditions of Andersen et al. (2015) for all other input variables. The shaded area corresponds to the reconstructed historic temperature range.
The code for the MC simulations is a modified version of the Mathcad™ file of Hidy et al. (2010) and is provided in the Supplement file. The code for the frost cracking model is available in the supplement of Andersen et al. (2015).
Temperature data are available online through the Swiss Permafrost Monitoring Network, PERMOS (https://doi.org/10.13093/permos-2016-01, PERMOS, 2019), and the spreadsheet used for extraction can be found in the Supplement. Raw MC output is provided in the Supplement.
The supplement related to this article is available online at: https://doi.org/10.5194/esurf-8-637-2020-supplement.
DM, FS, and NA designed the study; DM and AL conducted the fieldwork. DM and SY processed the samples, whereas CV and MC were responsible for the AMS measurement. DM employed the frost cracking modeling and interpreted all data with additional scientific input from DT, RD, and NA and used the Monte Carlo code updated by DT. DM prepared the paper and figures with contributions from all co-authors.
The authors declare that they have no conflict of interest.
We thankfully acknowledge the logistic support and access to the railway tunnel from the “Jungfraubahnen” Railway Company and the High Altitude Research Stations Jungfraujoch and Gornergrat (HFSJG). We thank Daniel Draebing and Steven Binnie for constructive comments that helped improve the paper.
This research has been supported by the Swiss National Science Foundation through grant no. 159299 awarded to Fritz Schlunegger.
This paper was edited by Andreas Lang and reviewed by Steven Binnie and Daniel Draebing.
Akçar, N., Deline, P., Ivy-Ochs, S., Alfimov, V., Hajdas, I., Kubik, P. W., Christl, M., and Schlüchter, C.: The AD 1717 rock avalanche deposits in the upper Ferret Valley (Italy): A dating approach with cosmogenic 10Be, J. Quaternary Sci., 27, 383–392, https://doi.org/10.1002/jqs.1558, 2012.
Aldred, J., Eppes, M. C., Aquino, K., Deal, R., Garbini, J., Swami, S., Tuttle, A., and Xanthos, G.: The influence of solar-induced thermal stresses on the mechanical weathering of rocks in humid mid-latitudes, Earth Surf. Proc. Land., 41, 603–614, https://doi.org/10.1002/esp.3849, 2016.
Allen, S. K., Gruber, S., and Owens, I. F.: Exploring steep bedrock permafrost and its relationship with recent slope failures in the Southern Alps of New Zealand, Permafr. Periglac., 20, 345–356, https://doi.org/10.1002/ppp.658, 2009.
Amitrano, D., Gruber, S., and Girard, L.: Evidence of frost-cracking inferred from acoustic emissions in a high-alpine rock-wall, Earth Planet. Sc. Lett., 341–344, 86–93, https://doi.org/10.1016/j.epsl.2012.06.014, 2012.
Andersen, J. L., Egholm, D. L., Knudsen, M. F., Jansen, J. D., and Nielsen, S. B.: The periglacial engine of mountain erosion – Part 1: Rates of frost cracking and frost creep, Earth Surf. Dynam., 3, 447–462, https://doi.org/10.5194/esurf-3-447-2015, 2015.
Anderson, R. S.: Near-Surface Thermal Profiles in Alpine Bedrock: Implications for the Frost Weathering of Rock, Arct. Antartct. Alp. Res., 30, 362–372, https://doi.org/10.2307/1552008, 1998.
Anderson, R. S., Repka, J. L., and Dick, G. S.: Explicit treatment of inheritance in dating depositional surfaces using in situ 10Be and 26Al, Geology, 24, , 47–51, https://doi.org/10.1130/0091-7613(1996)024<0047:ETOIID>2.3.CO;2, 1996.
Anderson, R. S., Anderson, S. P., and Tucker, G. E.: Rock damage and regolith transport by frost: An example of climate modulation of the geomorphology of the critical zone, Earth Surf. Proc. Land,, 38, 299–316, https://doi.org/10.1002/esp.3330, 2013.
Balco, G., Stone, J. O., Lifton, N. A., and Dunai, T. J.: A complete and easily accessible means of calculating surface exposure ages or erosion rates from 10Be and 26Al measurements, Quat. Geochronol., 3, 174–195, https://doi.org/10.1016/j.quageo.2007.12.001, 2008.
Bini, A., Buoncristiani, J. F., Couterrand, S., Ellwanger, D., Felber, M., Florineth, D., Graf, H. R., Keller, O., Kelly, M., Schlüchter, C., and Schöneich, P.: Die Schweiz während des letzteiszeitlichen Maximums (LGM), karte 1:500 000, Federal Office of Topography swisstopo, Wabern, Switzerland, 2009.
Berger, A., Mercolli, I., Herwegh, M., and Gnos E.: Geological Map of the Aar Massif, Tavetsch and Gotthard Nappes 1:100 000, Federal Office of Topography Swisstopo, Wabern, 2017.
Borchers, B., Marrero, S., Balco, G., Caffee, M., Goehring, B., Lifton, N., Nishiizumi, K., Phillips, F., Schaefer, J., and Stone, J.: Geological calibration of spallation production rates in the CRONUS-Earth project, Quat. Geochronol., 31, 188–198, https://doi.org/10.1016/j.quageo.2015.01.009, 2016.
Braucher, R., Brown, E. T., Bourlès, D. L., and Colin, F.: In situ produced 10Be measurements at great depths: Implications for production rates by fast muons, Earth Planet. Sc. Lett., 211, 251–258, https://doi.org/10.1016/S0012-821X(03)00205-X, 2003.
Braucher, R., Bourlès, D., Merchel, S., Vidal Romani, J., Fernadez-Mosquera, D., Marti, K., Léanni, L., Chauvet, F., Arnold, M., Aumaître, G., and Keddadouche, K.: Determination of muon attenuation lengths in depth profiles from in situ produced cosmogenic nuclides, Nucl. Instrum. Meth. B, 294, 484–490, https://doi.org/10.1016/j.nimb.2012.05.023, 2013.
Braucher, R., Del Castillo, P., Siame, L., Hidy, A. J., and Bourlés, D. L.: Determination of both exposure time and denudation rate from an in situ-produced 10Be depth profile: A mathematical proof of uniqueness. Model sensitivity and applications to natural cases, Quat. Geochronol., 4, 56–67, https://doi.org/10.1016/j.quageo.2008.06.001, 2009.
Büntgen, U., Frank, D. C., Nievergelt, D., and Esper, J.: Summer Temperature Variations in the European Alps, < scp >a.d.< /scp > 755–2004, J. Climate, 19, 5606–5623, https://doi.org/10.1175/JCLI3917.1, 2006.
Büntgen, U., Tegel, W., Nicolussi, K., McCormick, M., Frank, D., Trouet, V., Kaplan, J. O., Herzig, F., Heussner, K.-U., Wanner, H., Luterbacher, J., and Esper, J.: 2500 Years of European Climate Variability and Human Susceptibility, Science, 331, 578–582, https://doi.org/10.1126/science.1197175, 2011.
Christl, M., Vockenhuber, C., Kubik, P. W., Wacker, L., Lachner, J., Alfimov, V., and Synal, H. A.: The ETH Zurich AMS facilities: Performance parameters and reference materials, Nucl. Instrum. Meth. B, 294, 29–38, https://doi.org/10.1016/j.nimb.2012.03.004, 2013.
CH2018: Climate Scenarios for Switzerland, Technical Report, National Centre for Climate Services, Zurich, 2018.
Collins, B. D. and Stock, G. M.: Rockfall triggering by cyclic thermal stressing of exfoliation fractures, Nat. Geosci., 9, 395–400, https://doi.org/10.1038/ngeo2686, 2016.
Davidson, G. P. and Nye, J. F.: A photoelastic study of ice pressure in rock cracks, Cold Reg. Sci. Technol., 11, 141–153, https://doi.org/10.1016/0165-232X(85)90013-8, 1985.
Delunel, R., van der Beek, P. A., Carcaillet, J., Bourlès, D. L., and Valla, P. G.: Frost-cracking control on catchment denudation rates: Insights from in situ produced 10Be concentrations in stream sediments (Ecrins-Pelvoux massif, French Western Alps), Earth Planet. Sc. Lett., 293, 72–83, https://doi.org/10.1016/j.epsl.2010.02.020, 2010.
Draebing, D. and Krautblatter, M.: P-wave velocity changes in freezing hard low-porosity rocks: a laboratory-based time-average model, The Cryosphere, 6, 1163–1174, https://doi.org/10.5194/tc-6-1163-2012, 2012.
Draebing, D. and Krautblatter, M.: The Efficacy of Frost Weathering Processes in Alpine Rockwalls, Geophys. Res. Lett., 46, 6516–6524, https://doi.org/10.1029/2019GL081981, 2019.
Draebing, D., Krautblatter, M., and Dikau, R.: Interaction of thermal and mechanical processes in steep permafrost rock walls: A conceptual approach, Geomorphology, 226, 226–235, https://doi.org/10.1016/j.geomorph.2014.08.009, 2014.
Draebing, D., Haberkorn, A., Krautblatter, M., Kenner, R., and Phillips, M.: Thermal and Mechanical Responses Resulting From Spatial and Temporal Snow Cover Variability in Permafrost Rock Slopes, Steintaelli, Swiss Alps, Permafr. Periglac., 28, 140–157, https://doi.org/10.1002/ppp.1921, 2017a.
Draebing, D., Krautblatter, M., and Hoffmann, T.: Thermo-cryogenic controls of fracture kinematics in permafrost rockwalls, Geophys. Res. Lett., 44, 3535–3544, https://doi.org/10.1002/2016GL072050, 2017b.
Dunai, T. J. and Stuart, F. M.: Reporting of cosmogenic nuclide data for exposure age and erosion rate determinations, Quat. Geochronol., 4, 437–440, https://doi.org/10.1016/j.quageo.2009.04.003, 2009.
Dunne, J., Elmore, D., and Muzikar, P.: Scaling factors for the rates of production of cosmogenic nuclides for geometric shielding and attenuation at depth on sloped surfaces, Geomorphology, 27, 3–11, https://doi.org/10.1016/S0169-555X(98)00086-5, 1999.
Eppes, M. C., Magi, B., Hallet, B., Delmelle, E., Mackenzie-Helnwein, P., Warren, K., and Swami, S.: Deciphering the role of solar-induced thermal stresses in rock weathering, B. Geol. Soc. Am., 128, 1315–1338, https://doi.org/10.1130/B31422.1, 2016.
Fu, P. and Rich, P. M.: A geometric solar radiation model with applications in agriculture and forestry, Comput. Electron. Agr., 37, 25–35, https://doi.org/10.1016/S0168-1699(02)00115-1, 2002.
Girard, L., Gruber, S., Weber, S., and Beutel, J.: Environmental controls of frost cracking revealed through in situ acoustic emission measurements in steep bedrock, Geophys. Res. Lett., 40, 1748–1753, https://doi.org/10.1002/grl.50384, 2013.
Gobiet, A., Kotlarski, S., Beniston, M., Heinrich, G., Rajczak, J., and Stoffel, M.: 21st century climate change in the European Alps-A review, Sci. Total Environ., 493, 1138–1151, https://doi.org/10.1016/j.scitotenv.2013.07.050, 2014.
Gosse, J. C. and Phillips, F. M.: Terrestrial in situ cosmogenic nuclides: Theory and application, Quaternary Sci. Rev., 20, 1475–1560, https://doi.org/10.1111/j.1755-0998.2010.02842.x, 2001.
Grämiger, L. M., Moore, J. R., Gischig, V. S., Ivy-Ochs, S., and Loew, S.: Beyond debuttressing: Mechanics of paraglacial rock slope damage during repeat glacial cycles, J. Geophys. Res.-Earth, 122, 1004–1036, https://doi.org/10.1002/2016JF003967, 2017.
Gruber, S. and Haeberli, W.: Permafrost in steep bedrock slopes and its temperatures-related destabilization following climate change, J. Geophys. Res.-Earth, 112, 1–10, https://doi.org/10.1029/2006JF000547, 2007.
Gruber, S., Hoelzle, M., and Haeberli, W.: Permafrost thaw and destabilization of Alpine rock walls in the hot summer of 2003, Geophys. Res. Lett., 31, L13504, https://doi.org/10.1029/2004GL020051, 2004a.
Gruber, S., Hoelzle, M., and Haeberli, W.: Rock-wall temperatures in the Alps: Modelling their topographic distribution and regional differences, Permafr. Periglac., 15, 299–307, https://doi.org/10.1002/ppp.501, 2004b.
Günzler-Seifert, H. and Wyss, R.: Erläuterungen zum Kartenblatt Grindelwald, Geol. Kommision der schweiz. Naturforsch. Gesellschaft, Bern, 1938.
Haberkorn, A., Hoelzle, M., Phillips, M., and Kenner, R.: Snow as a driving factor of rock surface temperatures in steep rough rock walls, Cold Reg. Sci. Technol., 118, 64–75, https://doi.org/10.1016/j.coldregions.2015.06.013, 2015.
Haeberli, W., Wegmann, M., and Mühll, D. V.: Slope stability problems related to glacier shrinkage and permafrost degradation in the Alps, Eclogae Geol. Helv., 90, 407–414, 1997.
Hales, T. C. and Roering, J. J.: Climatic controls on frost cracking and implications for the evolution of bedrock landscapes, J. Geophys. Res.-Earth, 112, 1–14, https://doi.org/10.1029/2006JF000616, 2007.
Hales, T. C. and Roering, J. J.: A frost “buzzsaw” mechanism for erosion of the eastern Southern Alps, New Zealand, Geomorphology, 107, 241–253, https://doi.org/10.1016/j.geomorph.2008.12.012, 2009.
Hallet, B., Walder, J. S., and Stubbs, C. W.: Weathering by segregation ice growth in microcracks at sustained subzero temperatures: Verification from an experimental study using acoustic emissions, Permafr. Periglac., 2, 283–300, https://doi.org/10.1002/ppp.3430020404, 1991.
Harris, C., Haeberli, W., Vonder Mühll, D., and King, L.: Permafrost monitoring in the high mountains of Europe: the PACE Project in its global context, Permafr. Periglac., 12, 3–11, https://doi.org/10.1002/ppp.377, 2001.
Heisinger, B., Lal, D., Jull, A. J. T., Kubik, P., Ivy-Ochs, S., Neumaier, S., Knie, K., Lazarev, V., and Nolte, E.: Production of selected cosmogenic radionuclides by muons: 1. Fast muons, Earth Planet. Sc. Lett., 200, 345–355, https://doi.org/10.1016/S0012-821X(02)00640-4, 2002a.
Heisinger, B., Lal, D., Jull, A. J. T., Kubik, P., Ivy-Ochs, S., Knie, K., and Nolte, E.: Production of selected cosmogenic radionuclides by muons: 2. Capture of negative muons, Earth Planet. Sc. Lett., 200, 357–369, https://doi.org/10.1016/S0012-821X(02)00641-6, 2002b.
Herwegh, M., Berger, A., Baumberger, R., Wehrens, P., and Kissling, E.: Large-Scale Crustal-Block-Extrusion During Late Alpine Collision, Sci. Rep.-UK, 7, 1–10, https://doi.org/10.1038/s41598-017-00440-0, 2017.
Hidy, A. J., Gosse, J. C., Pederson, J. L., Mattern, J. P., and Finkel, R. C.: A geologically constrained Monte Carlo approach to modeling exposure ages from profiles of cosmogenic nuclides: An example from Lees Ferry, Arizona, Geochem. Geophy. Geosy., 11, Q0AA10, https://doi.org/10.1029/2010GC003084, 2010.
Ivy-Ochs, S., Kerschner, H., Maisch, M., Christl, M., Kubik, P. W., and Schlüchter, C.: Latest Pleistocene and Holocene glacier variations in the European Alps, Quaternary Sci. Rev., 28, 2137–2149, https://doi.org/10.1016/j.quascirev.2009.03.009, 2009.
Kelly, M. A., Buoncristiani, J. F., and Schlüchter, C.: A reconstruction of the last glacial maximum (LGM) ice-surface geometry in the western Swiss Alps and contiguous Alpine regions in Italy and France, Eclogae Geol. Helv., 97, 57–75, https://doi.org/10.1007/s00015-004-1109-6, 2004.
Krautblatter, M. and Moore, J. R.: Rock slope instability and erosion: Toward improved process understanding, Earth Surf. Proc. Land., 39, 1273–1278, https://doi.org/10.1002/esp.3578, 2014.
Krautblatter, M., Moser, M., Schrott, L., Wolf, J., and Morche, D.: Significance of rockfall magnitude and carbonate dissolution for rock slope erosion and geomorphic work on Alpine limestone cliffs (Reintal, German Alps), Geomorphology, 167–168, 21–34, https://doi.org/10.1016/j.geomorph.2012.04.007, 2012.
Krautblatter, M., Funk, D., and Günzel, F. K.: Why permafrost rocks become unstable: A rock-ice-mechanical model in time and space, Earth Surf. Proc. Land., 38, 876–887, https://doi.org/10.1002/esp.3374, 2013.
Lal, D.: Cosmic ray labeling of erosion surfaces: in situ nuclide production rates and erosion models, Earth Planet. Sc. Lett., 104, 424–439, https://doi.org/10.1016/0012-821X(91)90220-C, 1991.
Larocque-Tobler, I., Stewart, M. M., Quinlan, R., Trachsel, M., Kamenik, C., and Grosjean, M.: A last millennium temperature reconstruction using chironomids preserved in sediments of anoxic Seebergsee (Switzerland): Consensus at local, regional and Central European scales, Quaternary Sci. Rev., 41, 49–56, https://doi.org/10.1016/j.quascirev.2012.03.010, 2012.
Mair, D., Lechmann, A., Herwegh, M., Nibourel, L., and Schlunegger, F.: Linking Alpine deformation in the Aar Massif basement and its cover units – the case of the Jungfrau–Eiger mountains (Central Alps, Switzerland), Solid Earth, 9, 1099–1122, https://doi.org/10.5194/se-9-1099-2018, 2018.
Mair, D., Lechmann, A., Yesilyurt, S., Tikhomirov, D., Delunel, R., Vockenhuber, C., Akçar, N., and Schlunegger, F.: Fast long-term denudation rate of steep alpine headwalls inferred from cosmogenic 36Cl depth profiles, Sci. Rep.-UK, 9, 11023, https://doi.org/10.1038/s41598-019-46969-0, 2019.
Marrero, S. M., Phillips, F. M., Borchers, B., Lifton, N., Aumer, R., and Balco, G.: Cosmogenic nuclide systematics and the CRONUScalc program, Quat. Geochronol., 31, 160–187, https://doi.org/10.1016/j.quageo.2015.09.005, 2016.
Matsuoka, N.: The rate of bedrock weathering by frost action: Field measurements and a predictive model, Earth Surf. Proc. Land., 15, 73–90, https://doi.org/10.1002/esp.3290150108, 1990.
Matsuoka, N.: Microgelivation versus macrogelivation: towards bridging the gap between laboratory and field frost weathering, Permafr. Periglac., 12, 299–313, https://doi.org/10.1002/ppp.393, 2001.
Matsuoka, N.: Frost weathering and rockwall erosion in the southeastern Swiss Alps: Long-term (1994–2006) observations, Geomorphology, 99, 353–368, https://doi.org/10.1016/j.geomorph.2007.11.013, 2008.
Matsuoka, N. and Murton, J.: Frost weathering: recent advances and future directions, Permafr. Periglac., 19, 195–210, https://doi.org/10.1002/ppp.620, 2008.
McColl, S. T.: Paraglacial rock-slope stability, Geomorphology, 153–154, 1–16, https://doi.org/10.1016/j.geomorph.2012.02.015, 2012.
McColl, S. T. and Draebing, D.: Rock Slope Instability in the Proglacial Zone: State of the Art, in: Geomorphology of Proglacial Systems, Geography of the Physical Environment, edited by: Heckmann, T. and Morche, D., Springer, 119–141, https://doi.org/10.1007/978-3-319-94184-4_8, 2019.
Moore, J. R., Sanders, J. W., Dietrich, W. E., and Glaser, S. D.: Influence of rock mass strength on the erosion rate of alpine cliffs, Earth Surf. Proc. Land., 34, 1339–1352, https://doi.org/10.1002/esp.1821, 2009.
Murton, J. B., Peterson, R., and Ozouf, J. C.: Bedrock fracture by ice segregation in cold regions, Science, 314, 1127–1129, https://doi.org/10.1126/science.1132127, 2006.
Murton, J. B., Ozouf, J. C., and Peterson, R.: Heave, settlement and fracture of chalk during physical modelling experiments with temperature cycling above and below 0 ∘C, Geomorphology, 270, 71–87, https://doi.org/10.1016/j.geomorph.2016.07.016, 2016.
Noetzli, J., Gruber, S., Kohl, T., Salzmann, N., and Haeberli, W.: Three-dimensional distribution and evolution of permafrost temperatures in idealized high-mountain topography, J. Geophys. Res., 112, F02S13, https://doi.org/10.1029/2006JF000545, 2007.
PERMOS: PERMOS Database, Swiss Permafrost Monitoring Network, Fribourg and Davos, Switzerland, https://doi.org/10.13093/permos-2019-01, 2019.
Rapp, A.: Recent Development of Mountain Slopes in Kärkevagge and Surroundings, Northern Scandinavia, Geogr. Ann., 42, 65–200, https://doi.org/10.2307/520126, 1960.
Rempel, A. W., Marshall, J. A., and Roering, J. J.: Modeling relative frost weathering rates at geomorphic scales, Earth Planet. Sc. Lett., 453, 87–95, https://doi.org/10.1016/j.epsl.2016.08.019, 2016.
Rode, M., Schnepfleitner, H., and Sass, O.: Simulation of moisture content in alpine rockwalls during freeze–thaw events, Earth Surf. Proc. Land., 41, 1937–1950, https://doi.org/10.1002/esp.3961, 2016.
Sanders, J. W., Cuffey, K. M., Moore, J. R., MacGregor, K. R., and Kavanaugh, J. L.: Periglacial weathering and headwall erosion in cirque glacier bergschrunds, Geology, 40, 779–782, https://doi.org/10.1130/G33330.1, 2012.
Sass, O.: Rock moisture measurements: Techniques, results, and implications for weathering, Earth Surf. Proc. Land., 30, 359–374, https://doi.org/10.1002/esp.1214, 2005.
Sass, O. and Wollny, K.: Investigations regarding Alpine talus slopes using ground-penetrating radar (GPR) in the Bavarian Alps, Germany, Earth Surf. Proc. Land., 26, 1071–1086, https://doi.org/10.1002/esp.254, 2001.
Savi, S., Delunel, R., and Schlunegger, F.: Efficiency of frost-cracking processes through space and time: An example from the eastern Italian Alps, Geomorphology, 232, 248–260, https://doi.org/10.1016/j.geomorph.2015.01.009, 2015.
Schlunegger, F. and Norton, K. P.: Water versus ice: The competing roles of modern climate and Pleistocene glacial erosion in the Central Alps of Switzerland, Tectonophysics, 602, 370–381, https://doi.org/10.1016/j.tecto.2013.03.027, 2013. Schön, J. H.: Chapter 9 – Thermal Properties, in Physical Properties of Rocks, edited by: Schön, J. H., Developments in Petroleum Science, 65, 369–414, https://doi.org/10.1016/B978-0-08-100404-3.00009-3, 2015.
Stone, J. O.: Air pressure and cosmogenic isotope production, J. Geophys. Res.-Sol. Ea., 105, 23753–23759, https://doi.org/10.1029/2000JB900181, 2000.
Terzaghi, K.: Stability of Steep Slopes on Hard Unweathered Rock, Géotechnique, 12, 251–270, https://doi.org/10.1680/geot.1962.12.4.251, 1962.
Viles, H. A.: Linking weathering and rock slope instability: Non-linear perspectives, Earth Surf. Proc. Land., 38, 62–70, https://doi.org/10.1002/esp.3294, 2013.
Vollmer, F. W.: C program for automatic contouring of spherical orientation data using a modified Kamb method, Comput. Geosci., 21, 31–49, https://doi.org/10.1016/0098-3004(94)00058-3, 1995.
Vollmer, F. W.: Orient 3: A new integrated software program for orientation data analysis, kinematic analysis, spherical projections, and Schmidt plots, Abstr. with Programs – Geol. Soc. Am., GSA Annual Meeting in Baltimore, Maryland, USA, 47, 2015.
Walder, J. S. and Hallet, B.: Geological Society of America Bulletin A theoretical model of the fracture of rock during freezin, GSA Bull., 96, 336–346, https://doi.org/10.1130/0016-7606(1985)96<336, 1985.
Walder, J. S. and Hallet, B.: The Physical Basis of Frost Weathering: Toward a More Fundamental and Unified Perspective, Arct. Alp. Res., 18, 27–32, https://doi.org/10.2307/1551211, 1986.
Wehrens, P., Baumberger, R., Berger, A., and Herwegh, M.: How is strain localized in a meta-granitoid, mid-crustal basement section? Spatial distribution of deformation in the central Aar massif (Switzerland), J. Struct. Geol., 94, 47–67, https://doi.org/10.1016/j.jsg.2016.11.004, 2017.
Wirsig, C., Zasadni, J., Ivy-Ochs, S., Christl, M., Kober, F., and Schlüchter, C.: A deglaciation model of the Oberhasli, Switzerland, J. Quaternary Sci., 31, 46–59, https://doi.org/10.1002/jqs.2831, 2016a.
Wirsig, C., Zasadni, J., Christl, M., Akçar, N., and Ivy-Ochs, S.: Dating the onset of LGM ice surface lowering in the High Alps, Quaternary Sci. Rev., 143, 37–50, https://doi.org/10.1016/j.quascirev.2016.05.001, 2016b.
- Abstract
- Introduction
- Setting
- Methods
- Results
- Discussion
- Conclusions
- Appendix A: Denudation rate from in situ cosmogenic 10Be depth profile
- Appendix B: Sensitivity of the frost cracking model
- Code availability
- Data availability
- Author contributions
- Competing interests
- Acknowledgements
- Financial support
- Review statement
- References
- Supplement