the Creative Commons Attribution 4.0 License.
the Creative Commons Attribution 4.0 License.
 | 19 Mar 2021
Evaluating optically stimulated luminescence rock surface exposure dating as a novel approach for reconstructing coastal boulder movement on decadal to centennial timescales
Simon Matthias May
Nadia Mhammdi
Georgina King
Benjamin Lehmann
Christoph Burow
Dennis Wolf
Anja Zander
Helmut Brückner
Wave-transported boulders represent important records of storm and tsunami impact over geological timescales. Their use for hazard assessment requires chronological information on their displacement that in many cases cannot be achieved by established dating approaches. To fill this gap, this study investigated, for the first time, the potential of optically stimulated luminescence rock surface exposure dating (OSL-RSED) for estimating cliff-detachment ages of wave-transported coastal boulders. The approach was tested on calcarenite clasts at the Rabat coast, Morocco. Calibration of the OSL-RSED model was based on samples with rock surfaces exposed to sunlight for ∼ 2 years, and OSL exposure ages were evaluated against age control deduced from satellite images. Our results show that the dating precision is limited for all targeted boulders due to the local source rock lithology which has low amounts of quartz and feldspar. The dating accuracy may be affected by erosion rates on boulder surfaces of 0.02–0.18 mm yr−1. Nevertheless, we propose a robust relative chronology for boulders that are not affected by significant post-depositional erosion and that share surface angles of inclination with the calibration samples. The relative chronology indicates that (i) most boulders were detached from the cliff by storm waves; (ii) these storms lifted boulders with masses of up to ∼ 24 t; and (iii) the role of storms in the formation of boulder deposits along the Rabat coast is more significant than previously assumed. Although OSL-RSED cannot provide reliable absolute exposure ages for the coastal boulders in this study, the approach has large potential for boulder deposits composed of rocks with larger amounts of quartz or feldspar and less susceptibility to erosion.
- Article
(38332 KB) - Full-text XML
- BibTeX
- EndNote


Coastal boulders with masses of up to tens or hundreds of tons, located well above high tide level or far inland from the shoreline, are impressive evidence for the occurrence and impact of tsunamis and extreme storms (e.g. Engel and May, 2012; May et al., 2015; Cox et al., 2019). Such geological imprints may be preserved over periods that significantly exceed instrumental and historical records (Yu et al., 2009; Ramalho et al., 2015), making them valuable records for long-term hazard assessment. Compared to sandy tsunami and storm deposits, which are used more commonly for this purpose, wave-transported boulders are abundant along rocky coastlines and can be preserved over geological timescales even in settings dominated by erosion (Paris et al., 2011). Furthermore, boulders may provide information on the magnitude of prehistoric tsunamis and storms that is challenging to deduce from sandy sediments (Nandasena et al., 2011).
For coastal boulders to be valuable for hazard assessment, they have to provide information on the frequency of the associated flooding events, which in turn requires chronological information on boulder displacement. Since boulders, unlike sandy storm and tsunami deposits, typically lack a stratigraphic context, dating approaches rely on chronometers related to the boulder rock itself or on constructive features attached to the boulder, such as marine organisms or flow stones. Established dating approaches are based on radiocarbon (14C) and U-series (230Th 234U) dating of organic carbonates (e.g. Zhao et al., 2009; Araoka et al., 2013) and thus require coral boulders or the presence of attached marine organisms, as well as coincidence between the death of these organisms and the onshore transport of the boulder. Direct ages for the transport of coastal boulders were achieved by using terrestrial cosmogenic nuclide surface exposure dating (Ramalho et al., 2015; Rixhon et al., 2017) and palaeomagnetic dating (Sato et al., 2014). However, palaeomagnetic dating still suffers from a number of intrinsic methodological limitations, and cosmogenic nuclide dating cannot provide sufficient resolution on Late Holocene timescales and is therefore of limited benefit for the vast majority of coastal boulders.
The recently developed optically stimulated luminescence (OSL) rock surface dating technique (see review by King et al., 2019) offers completely new opportunities for directly dating the cliff detachment of coastal boulders. While the application of the more routinely used OSL rock surface burial dating technique (e.g. Simms et al., 2011; Sohbati et al., 2015; Jenkins et al., 2018; Rades et al., 2018) is typically impeded for coastal boulders due to logistical problems with sampling the (inaccessible) light-shielded bottom surfaces of clasts weighing several tons, the OSL rock surface exposure dating (OSL-RSED) technique introduced by Sohbati et al. (2011) can be applied to the light-exposed top surfaces of such clasts. For boulders that were overturned during wave-driven cliff detachment and that experienced no subsequent overturning events as well as negligible erosion and shielding of their top surfaces after deposition on the onshore platform, post-transport exposure periods may be estimated based on the time-dependent progression of OSL signal resetting, the so-called bleaching front, into the uppermost millimetres to centimetres of the rock (Sohbati et al., 2012; Freiesleben et al., 2015; Lehmann et al., 2018; Gliganic et al., 2019). OSL-RSED is applicable to a wide spectrum of lithologies, as long as they contain quartz and/or feldspar, and to timescales of decades, centuries and up to a few millennia. While it thus cannot be applied to pure limestone boulders, the approach may provide ages for coastal boulders that are so far not datable by any other technique.
Here, we present the first attempt to use OSL-RSED to reconstruct storm and/or tsunami frequency patterns from wave-displaced boulders. All analyses were conducted on carbonatic sandstone boulders from the Atlantic coast of Morocco, south of Rabat, that were previously documented by Mhammdi et al. (2008) and Medina et al. (2011). These boulders were selected, because they offer all indispensable prerequisites for the application of OSL-RSED, including a lithology containing sensitive quartz and feldspar (Barton et al., 2009), unambiguous signs of boulder overturning in their taphonomy and age control at least for some of the boulders. Boulder sites with potentially more appropriate lithologies for OSL-RSED typically lack clear indication of boulder movement and age control, and coastal boulders with better independent chronologies are typically composed of pure limestone that cannot be used for OSL dating. Primarily, this study aims at evaluating the novel OSL-RSED technique for coastal boulders, which was achieved by using artificially exposed rock surfaces for calibration of the bleaching model and by testing its performance against age control deduced from satellite images and eyewitness accounts. The successfully validated model was then applied to boulders of unknown age. While some of the dated boulders had previously been tentatively attributed to the 1755 Lisbon tsunami (Mhammdi et al., 2008; Medina et al., 2011), they lack robust chronological data. Besides discussing limitations of the dating approach due to local OSL signal properties and erosion of boulder surfaces exposed after transportation, we also discuss the future potential of this method and the implications of the new relative OSL-RSED boulder ages for the long-term storm and tsunami hazard at the Atlantic coast of Morocco.
Conventional OSL dating relies on the accumulation of an energy dose (palaeodose) due to the impact of ionizing radiation over time (dose rate) on sand or silt grains shielded from sunlight. The palaeodose is proportional to the burial age of the sediment and can be quantified by measuring the light emission (OSL signal) of quartz or feldspar grains during stimulation with laboratory light. In natural settings, resetting of OSL signals takes place by sunlight exposure during sediment transport, so that buried sediment grains can provide information about the time that passed since the last sunlight exposure (burial age).
The uppermost millimetres to centimetres of rock surfaces exposed to sunlight experience bleaching and accumulation of OSL signals at the same time. However, OSL signal resetting or bleaching is by far the dominant process in rocks with low environmental dose rates and Holocene exposure histories (Sohbati et al., 2012). For coastal boulders with dose rates of less than 1 Gy kyr−1 and ages post-dating the stabilization of Holocene eustatic sea level around its present position about six millennia ago (e.g. Khan et al., 2015), as investigated in this study, OSL signal accumulation can be neglected. The time-dependent evolution of OSL signals in exposed boulder surfaces can therefore be reduced to the term for OSL signal resetting, which following Sohbati et al. (2012) is expressed by
where L0 is the initial OSL signal intensity prior to exposure, L the remaining OSL signal at depth x (mm) after exposure, te (s) the exposure time, (s−1) the effective bleaching rate of the OSL signal at the rock surface (i.e. the product of the photo-ionization cross section σ, and the light flux at the rock surface φ0) and μ (mm−1) the light attenuation coefficient of the rock.
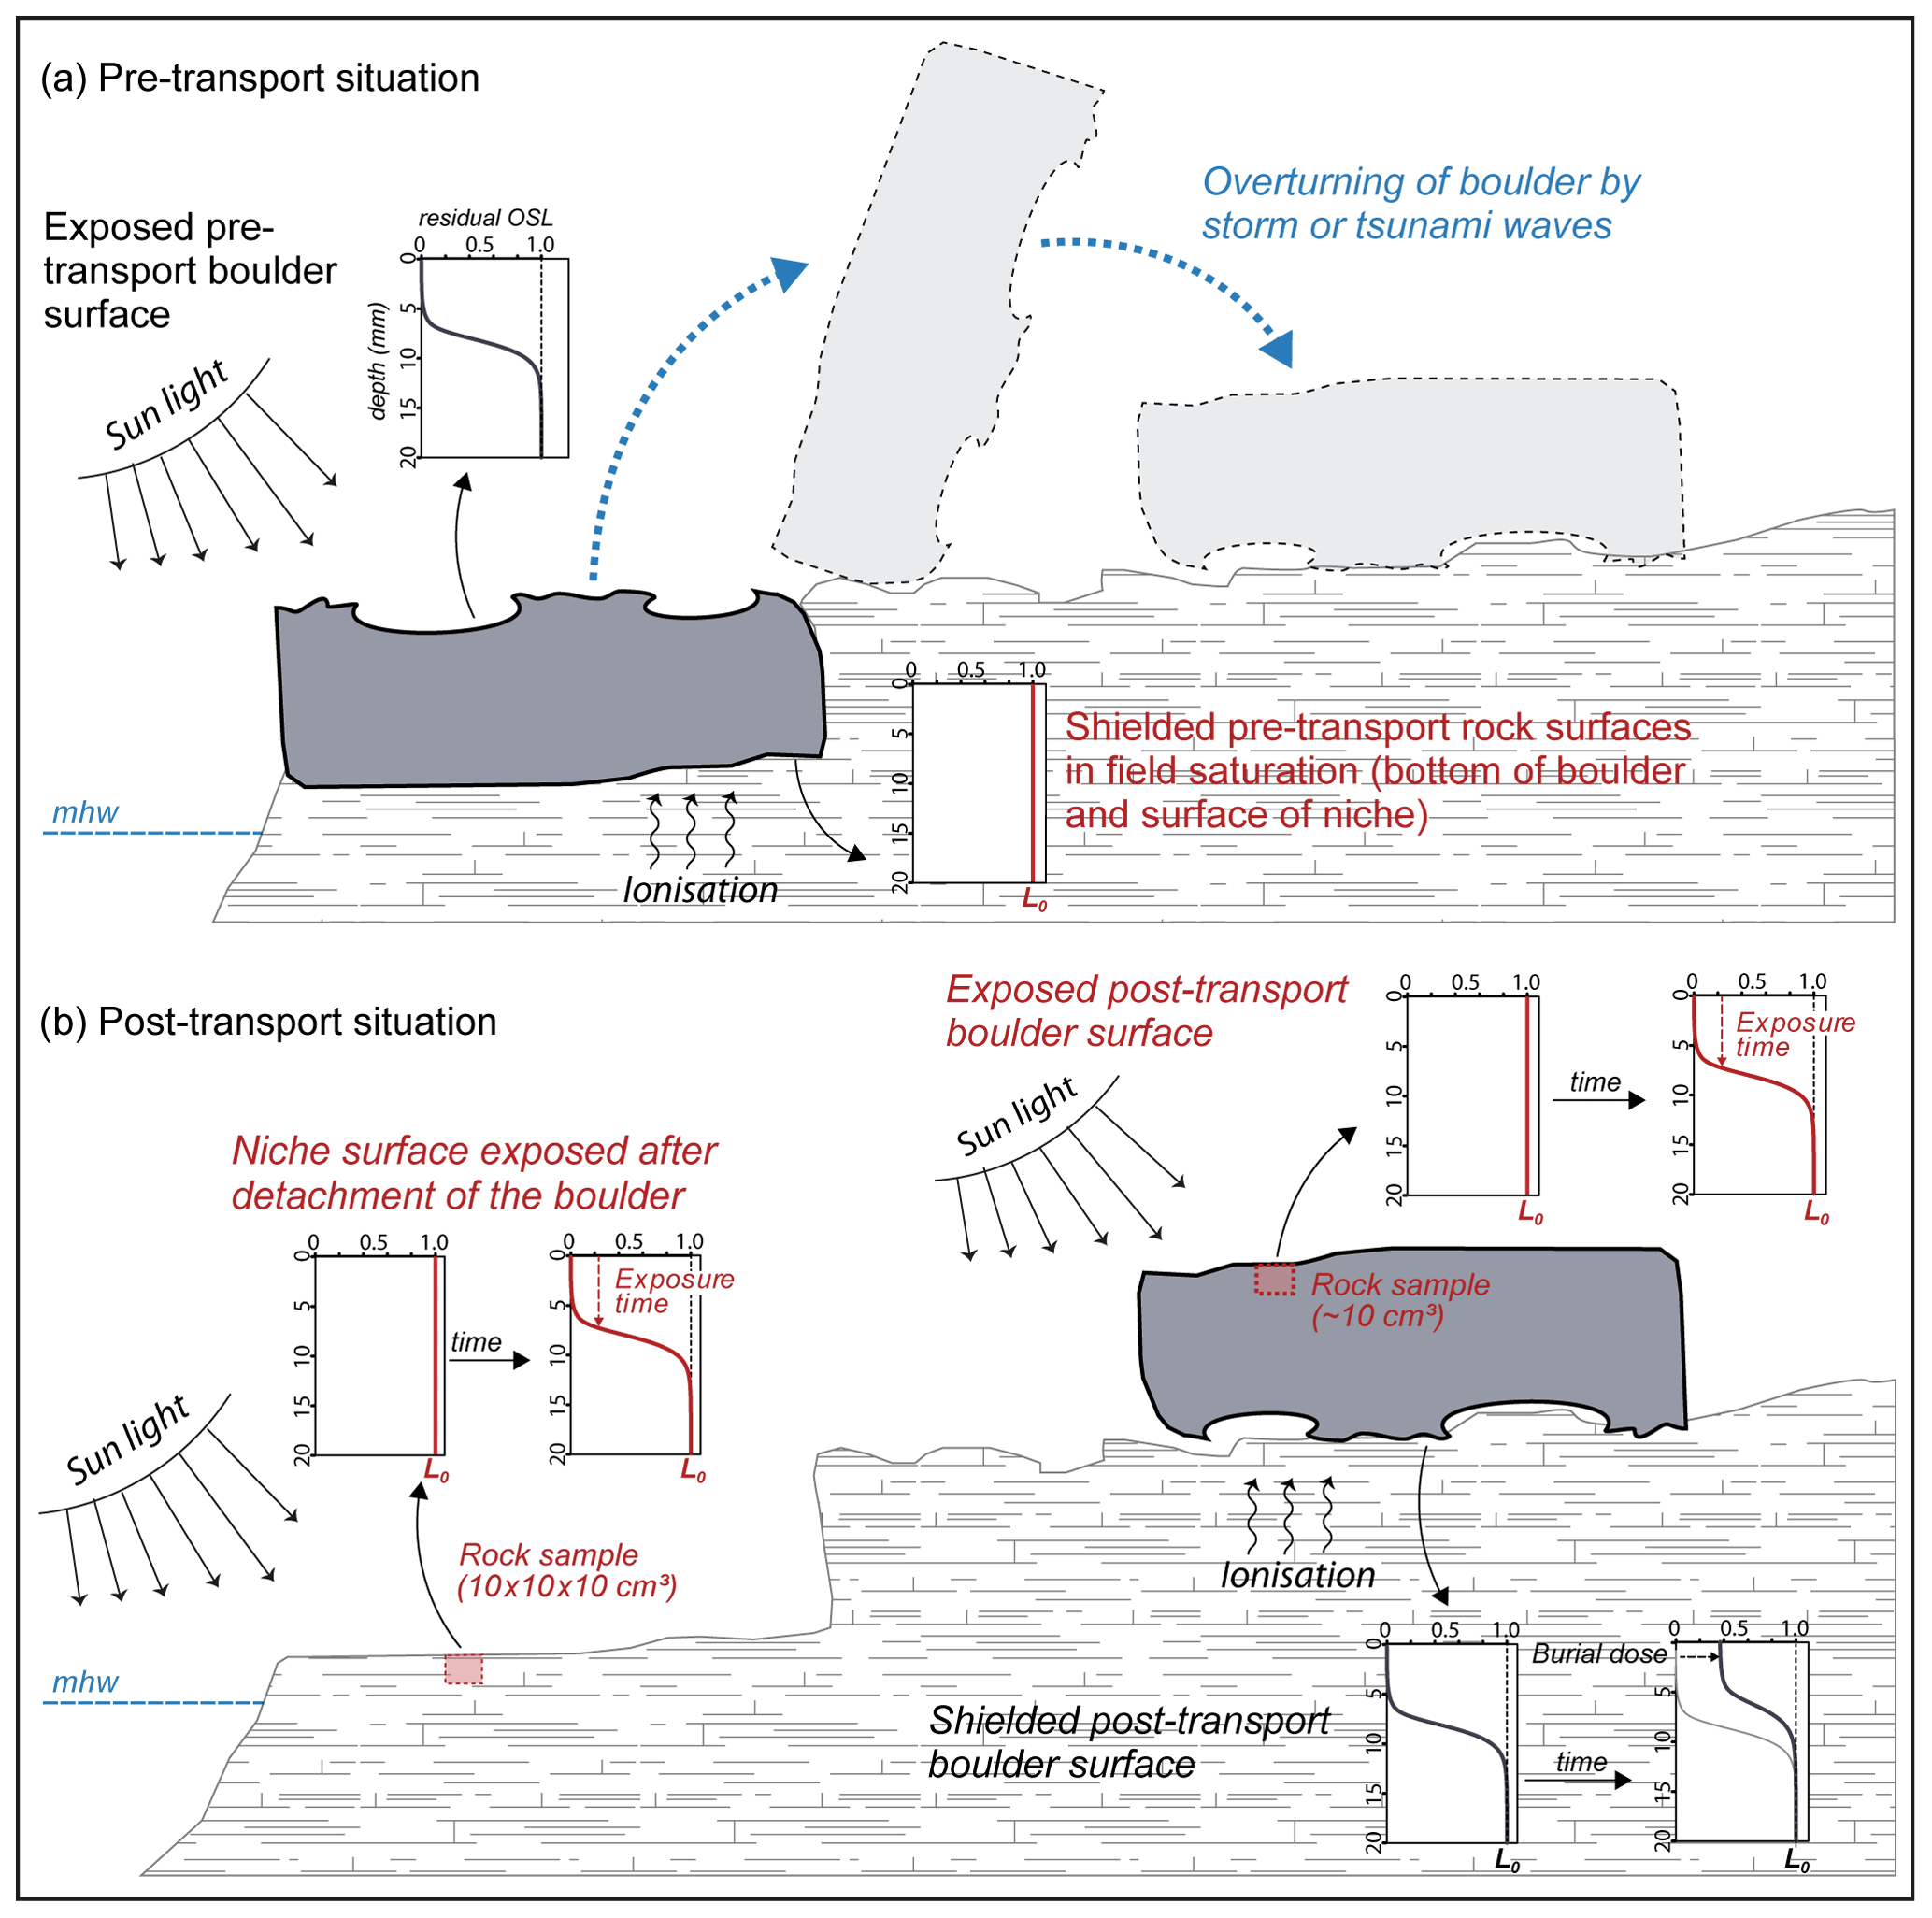
Figure 1 illustrates how Eq. (1) can be used to estimate the timing of wave-driven boulder detachment from the coastal cliff if this event was associated by overturning of the clast. When attached to the cliff, only the (usually bio-eroded) upper surface of a typical boulder in the pre-transport position is exposed to sunlight and experiences OSL signal resetting (Fig. 1a). Its shielded bottom side is only exposed to ionizing radiation from radioactive elements in the surrounding rock and cosmic rays that, after a prolonged time, cause OSL signals to be in or close to field saturation (Fig. 1a). When overturned during cliff detachment, the new upper surface of the boulder in post-transport position on the cliff platform is suddenly exposed to sunlight and the bleaching front starts to move into the rock (Fig. 1b); boulders with a platy shape may be repeatedly pushed landwards by waves afterwards, while a second overturning is very unlikely. The same is true for the surfaces of quarrying niches that are formed by boulder detachment (Fig. 1b). In both cases, the exposure time can be estimated by fitting Eq. (1) to the depth-dependent OSL signals measured in rock samples collected from these surfaces. The shielded bottom side of the boulder in the post-transport position is generally suitable for rock surface burial dating by making use of the time-dependent dose accumulation in the previously bleached surface; due to inaccessibility of shielded surfaces for sample collection, this was not tried in this study.
3.1 Marine flooding hazard along the Atlantic coast of Morocco
The Moroccan Atlantic coast is exposed to swell waves, north Atlantic winter storms and rare tsunamis that cause erosion and/or flooding of low-lying areas. The energy of swell waves is strongest along the central section of the Moroccan coast, between Agadir and Rabat, since it is not sheltered by the Canary Islands or the Iberian Peninsula; waves approach from the northwest to west and are significantly stronger during winter (Medina et al., 2011). The influence of Atlantic hurricanes is comparatively small (Fig. A1a), with only two former tropical storms recorded to have made landfall as tropical depressions (core pressure 988–1000 hPa) at the coast of Morocco and the southern Iberian Peninsula between 1851 and 2016 (Fig. 2a). Instead, maximum wave heights are associated with winter storms that typically cross France or the UK (Fig. A1b) but may have tracks as far south as Morocco (Fig. 2a). During recent winter storms within the last century, wave heights of up to 7 m (compared to regular swell heights of 0.5–1.5 m) have been observed at the Rabat coast (Mhammdi et al., 2020), associated with flooding of back-beach areas and waves overtopping the coastal cliffs (Fig. A2).
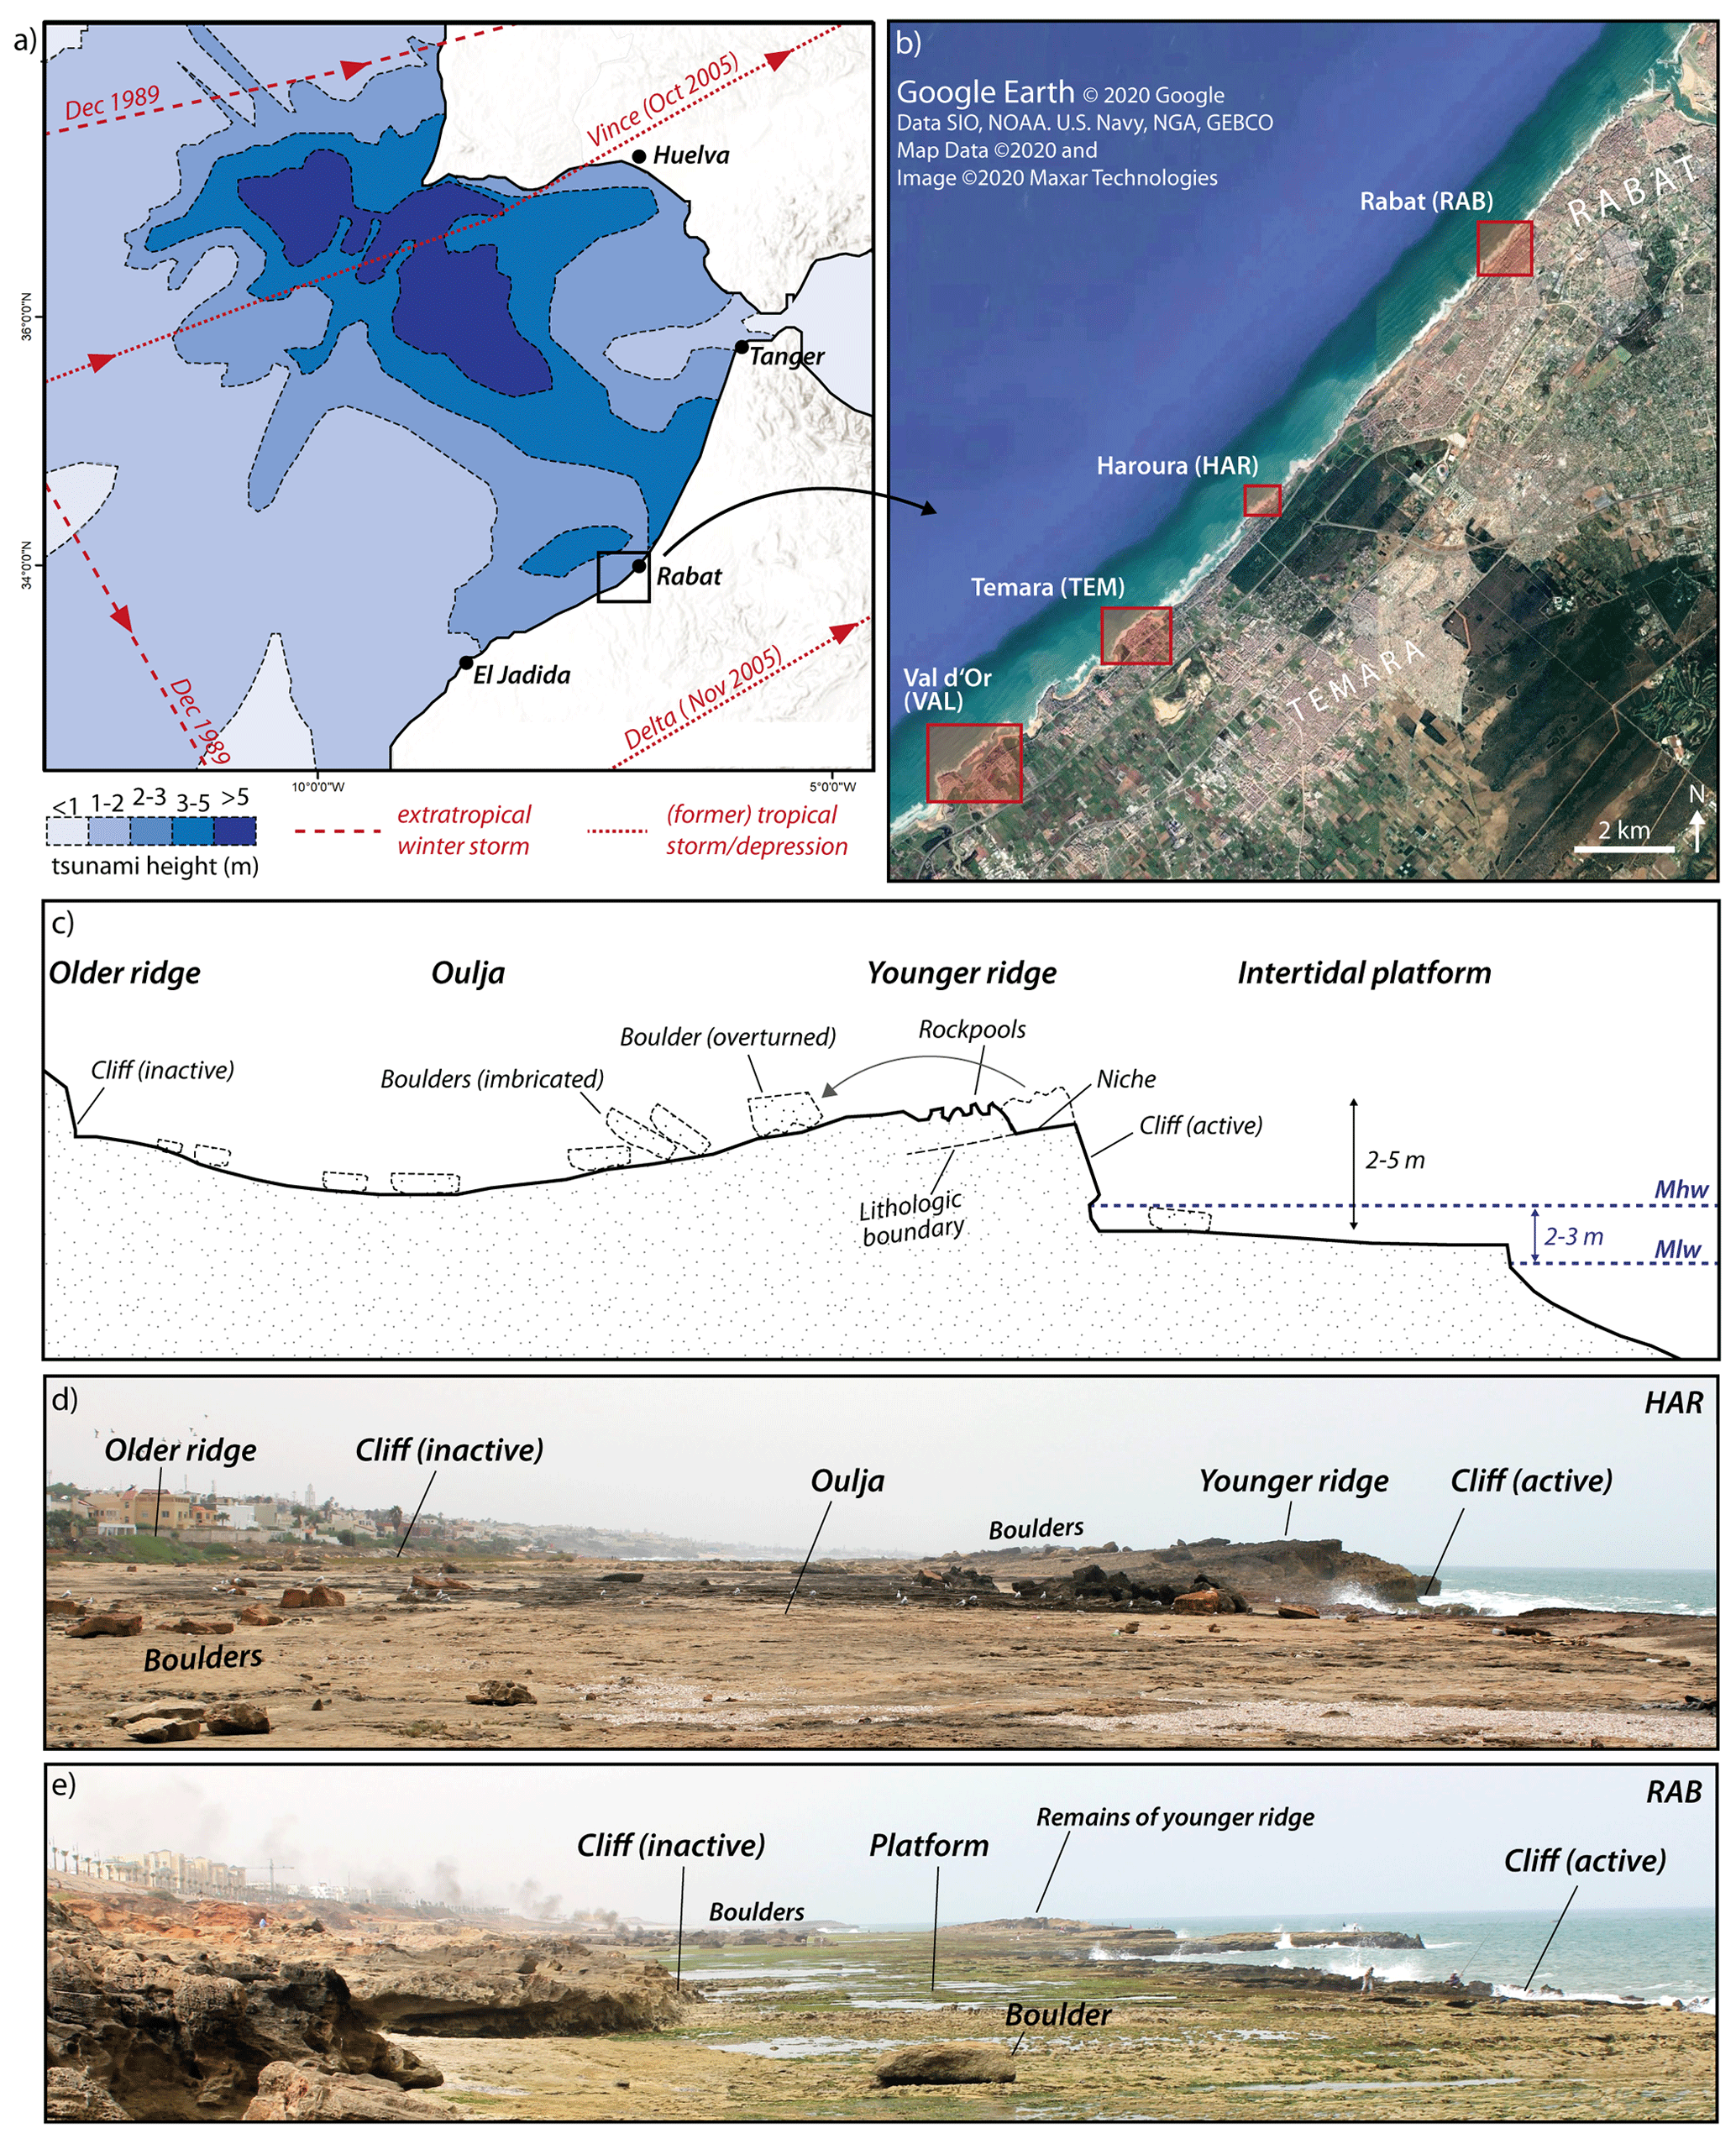
Figure 2Flooding hazard and geomorphological setting of the Rabat coast. (a) Exposure of the Moroccan Atlantic coast to tsunamis and storms, including modelled wave heights for the 1755 Lisbon tsunami (Renou et al., 2011), tracks of former tropical storms crossing the area between 1851 and 2016 (NOAA, 2019) and extratropical winter storms in the period 1989–2009 (Reading University, 2019). (b) The Rabat coast with the four study sites (based on © Google Earth images). (c) Schematic geomorphological cross section through the Rabat coast at Harhoura (HAR, modified from Mhammdi et al., 2008). (d) The coastal platform at Harhoura as shown in panel (c) (view towards southwest). (e) The coastal platform at Rabat (RAB, view towards southwest).
An additional flooding hazard emanates from tsunamis triggered by earthquakes offshore of Portugal, between the Azores triple junction and the Strait of Gibraltar, where the African and Eurasian plates converge at a rate of ∼ 4 mm yr−1 (Zitellini et al., 1999). After earthquakes in 1941, 1969 and 1975, Moroccan tide gauges recorded moderate tsunamis with waves < 1 m. Further earthquakes, likely accompanied by tsunamis with impact in Morocco, are listed in historical catalogues (e.g. in 382 CE and 881 CE), but unambiguous reports of flooding only exist for the 1 November 1755 Lisbon tsunami (Kaabouben et al., 2009). Triggered by a Mw 8.5 earthquake, probably due to the rare event of a combined rupture of different seismic structures (Baptista et al., 2003), the associated tsunami is the only known destructive flooding event at the Moroccan coast. Historical sources from Rabat describe the inundation of streets as far as 2 km inland, wreckage of ships in the harbour and drowned people and camels (Blanc, 2009). Although numerical models indicate that the wave heights of 15 m mentioned in historical reports from Tanger and Safi are most likely exaggerated and that values of 2.5–5.0 m are more realistic (Fig. 2a; Blanc, 2009; Renou et al., 2011), the effects of the 1755 tsunami on the coastal landscape of Morocco were nevertheless significant (e.g. Ramalho et al., 2018).
3.2 Exploiting geological evidence for hazard assessment – the Rabat boulder fields
While instrumental and historical records demonstrate the flooding hazard at the Moroccan coast due to both storms and tsunamis, all documented events except the 1755 Lisbon tsunami were restricted to the last decades. This does not allow for robust estimates of long-term tsunami and storm occurrence or of all possible magnitudes of storm surges and tsunami inundation. Most published regional geological tsunami and storm evidence for the pre-instrumental era is restricted to Spain and Portugal (e.g. Dawson et al., 1995; Hindson and Andrade, 1999; Lario et al., 2011; Costa et al., 2011; Feist et al., 2019), but fields of wave-displaced boulders offer records of past storms and/or tsunamis for Morocco (Mhammdi et al., 2008; Medina et al., 2011) that could inform about the regional long-term hazard if robust chronological data were available.
The most prominent boulder fields are reported from a 30 km long NE–SW-oriented coastal section between Rabat and Skhirat (Fig. 2a, b), consisting of hundreds of boulders with estimated masses between a few and more than 100 t (Mhammdi et al., 2008; Medina et al., 2011). The geomorphology and geology of this area is characterized by a succession of coast-parallel, Pleistocene calcarenite ridges that are related to sea-level highstands and rest on a Palaeozoic basement (Chakroun et al., 2017). A typical cross section (Fig. 2c, d) is composed of (i) the intertidal platform with an active coastal cliff; (ii) the youngest lithified calcarenite ridge, formed during Marine Isotope Stage (MIS) 5; (iii) an inter-ridge depression, called Oulja, which may be flooded at high tide (the spring tide range is 2–3 m) and which is covered by recent and/or Holocene beach deposits; and (iv) an older calcarenite ridge, probably formed during MIS 7, including an inactive cliff (Medina et al., 2011; Chakroun et al., 2017; Chahid et al., 2017). Towards Rabat, the younger calcarenite ridge is replaced by a simple sandstone platform (Fig. 2e).
As described by Mhammdi et al. (2008) and Medina et al. (2011), most of the calcarenite boulders were sourced from the active cliff (Fig. 2c). Since detachment is guided by lithological boundaries between the calcarenite and interbedded clay units, most of the boulders have platy shapes; only occasionally were boulders derived from subtidal positions and lifted up to 5 m vertically to the top of the first calcarenite ridge, as indicated by vermetids, or sourced from younger sandstones covering the Oulja. The boulders are deposited as single clasts, clusters, or imbricated stacks that rest on top or at the backward slope of the first calcarenite ridge, in the Oulja, or rarely at the seaward slope of the older calcarenite ridge up to 300 m inland (Fig. 2c). The position and orientation of bio-erosive rock pools formed on the surface of the youngest ridge (i.e. the pre-transport surface of most boulders) offer insights into transport modes. While some boulders moved by sliding only, others were overturned during transport as indicated by down-facing rock pools on the pre-transport surface (Mhammdi et al., 2008; Medina et al., 2011). For some of the larger boulders, sliding movement by storm waves after their initial detachment from the cliff is documented on satellite images (Fig. A3). Movement of smaller boulders with up to 1 m3 (∼ 2.5 t) was frequently observed after recent winter storms such as Hercules/Christina in January 2014 (Mhammdi et al., 2020). At some places along the coast between Rabat and Casablanca, even boulders exceeding 10 t have been pushed landward during recent winter storms (Mhammdi et al., 2020).
Boulders sampled for dating were characterized in the field with regard to their position, orientation, dimension and surface taphonomy. Distance from the active cliff and elevation above mean high tide level were measured using a laser range finder. Boulder volume estimates (V) are based on tape measurements of a (length), b (width) and c axes (height) and an empirical correction factor of 0.5 (Engel and May, 2012) using
To calculate boulder weights, volumes are multiplied with boulder densities (ρB) determined individually for each sample using the Archimedean principle of buoyancy in water following
with wa the weight of the sample in air, ww the weight of the sample in water and ρW the density of seawater (1.02 g cm−3). Surface orientation and inclination of sampled boulders were measured with a compass.
For OSL-RSED, samples of approximately 10 cm3 were collected from selected boulder surfaces using a combination of a battery-driven rock drill, hammer and chisel. Rock samples were wrapped in black plastic bags and brought to the Cologne Luminescence Laboratory (CLL) for further processing under dimmed red-light conditions. First, a circular rock saw was used to cut ∼ 5 cm thick surface slabs, from which cores of ∼ 1 cm diameter and ∼ 4 cm length were extracted using a bench drill (Proxxon Professional) with water-cooled diamond core bits. After immersion in resin (Crystalbond 509, the resin was tested to have no OSL emission) and subsequent oven drying to stabilize fragile parts of the sandstone cores, they were cut into ∼ 0.7 mm thick slices using a water-cooled low-speed diamond saw (Bühler Isomet 1000) with 0.3 mm blade thickness. Slices were gently crushed with a mortar to obtain polymineralic sand grains that were fixed on aluminium cups using silicon grease in monolayer. Separation of pure quartz and/or potassium feldspar for the grains of each slice, standard practice in conventional OSL dating, was not feasible due to the large number of slices and the small amount of polymineralic grains per slice.
To guide the selection of a measurement protocol for the polymineralic aliquots used for dating in this study, pure quartz and potassium feldspar extracts in the 150–200 µm grain-size fraction were prepared from the light-shielded parts (i.e. > 5 cm below surface) of the 10 cm3 sample blocks of HAR 1-1 and Temara (TEM) 3-1. Sample preparation followed standard coarse grain procedures including dry sieving, treatment with 10 % HCl and 10 % H2O2, density separation (potassium feldspar < 2.58 g cm−3 < 2.62 g cm−3 < quartz < 2.68 g cm−3) and 40 % hydrofluoric acid (HF) etching in the case of quartz. Dose recovery experiments with signal resetting in a solar simulator for 24 h and administering of a ∼ 12 Gy laboratory beta dose, as well as continuous wave fitting of quartz blue stimulated luminescence (BSL) components using the R package “Luminescence” version 0.9.0.88 (Kreutzer et al., 2019) were performed for both the pure quartz and the polymineralic fraction. Preheat-plateau tests were performed on the quartz extracts to establish an appropriate measurement temperature. Quartz extracts of two samples (HAR 1-1 and TEM 3-1) were also used for palaeodose determinations following a conventional single-aliquot regenerative (SAR) protocol according to Murray and Wintle (2003) (Table A3). Combined with dose rates based on high-resolution gamma spectrometry and the conversion factors of Guerin et al. (2011), conventional OSL ages for the formation of the sandstone were calculated from palaeodoses using Dose Rate and Age Calculator (DRAC) software version 1.2 (Durcan et al., 2015).
All luminescence measurements of polymineralic aliquots for OSL-RSED followed a post-infrared stimulated luminescence (IRSL)-BSL protocol (e.g. Banerjee et al., 2001). After preheating at 220 ∘C for 10 s, the protocol records an IRSL signal at 50 ∘C for 160 s, followed by a BSL signal at 125 ∘C for 40 s (Table A2). Measurements were performed on a Risø TL/OSL DA20 reader equipped with an U340 filter for signal detection. All thermal treatments were performed with heating rates of 2 ∘C s−1. In the post-IRSL-BSL protocol, stimulation with infrared LEDs specifically bleached luminescence signals originating from feldspar (feldspar IRSL). This reduced the contribution of feldspar signals to the BSL signal of quartz (quartz BSL), which unlike feldspar is insensitive to infrared stimulation (Bailey, 2010).
For OSL-RSED, the natural OSL signals (Ln) and the OSL signals in response to a ∼ 12 Gy test dose (Tn) of the post-IRSL-BSL protocol were measured for the polymineralic grains of all crushed slices to generate plots of OSL signal versus depth below the boulder surface. The depth-dependent data of each core (mean of two aliquots) were normalized to the core's individual plateau signal calculated from the average of the deepest 5–10 slices. The normalized data of all cores of a sample were then averaged (arithmetic mean and standard error) to receive a mean signal–depth curve for each rock sample; we only excluded cores without any signal–depth trends and data points that deviated more than 2 standard deviations from the mean. The mean signal–depth curves were fitted with Eq. (1) using the rock surface exposure dating function in the R package “Luminescence” (Burow, 2019) and the software OriginPro (version 8.5). μ and values shared between several samples were determined using the “global fit” function that allows the fitting of multiple signal–depth curves at the same time. Post-depositional erosion has recently been shown to exercise a strong effect on the depth of the bleaching front, and thus the apparent age, of exposed rock surfaces (Sohbati et al., 2018; Lehmann et al., 2019, 2020; Brown and Moon, 2019). Their potential effects were therefore modelled using the approach of Lehmann et al. (2019).
5.1 Boulders selected for OSL surface exposure dating
Samples for OSL-RSED were collected from nine boulders at four different sites along the Rabat coast in July 2016, including Rabat (RAB), Harhoura (HAR), Temara (TEM) and Val d'Or (VAL) (Fig. 2b). Boulders selected for dating were composed of carbonate-cemented sandstone (calcarenite) with clear signs of overturning during cliff detachment, indicated by down-facing rock pools and/or fresh-looking post-transport surfaces (Fig. 3d). Due to the platy shape of the boulders, repeated overturning on the coastal platform after cliff detachment can be excluded. To ensure comparable conditions for sunlight exposure, only surfaces without significant shielding by vegetation, other boulders or water, and wherever possible without significant inclination of their top surfaces were sampled. Most sampled boulders thus rested in supratidal positions and had relatively smooth post-transport surfaces (RAB 1, HAR 1, HAR 2, TEM 3, VAL 4, VAL 6). However, boulders from the intertidal platform with post-transport rock pools (VAL 1, Fig. 3h) or boulders with higher surface roughness probably due to increased sea spray influence (TEM 2 and RAB 5, Fig. 3g) were also sampled for assessing the effects of post-depositional erosion on dating accuracy. In addition, surfaces of niches in the active cliff, exposed after detachment of the associated boulders, were sampled at Harhoura (HAR 3, Fig. 3e) and Temara (TEM 4).
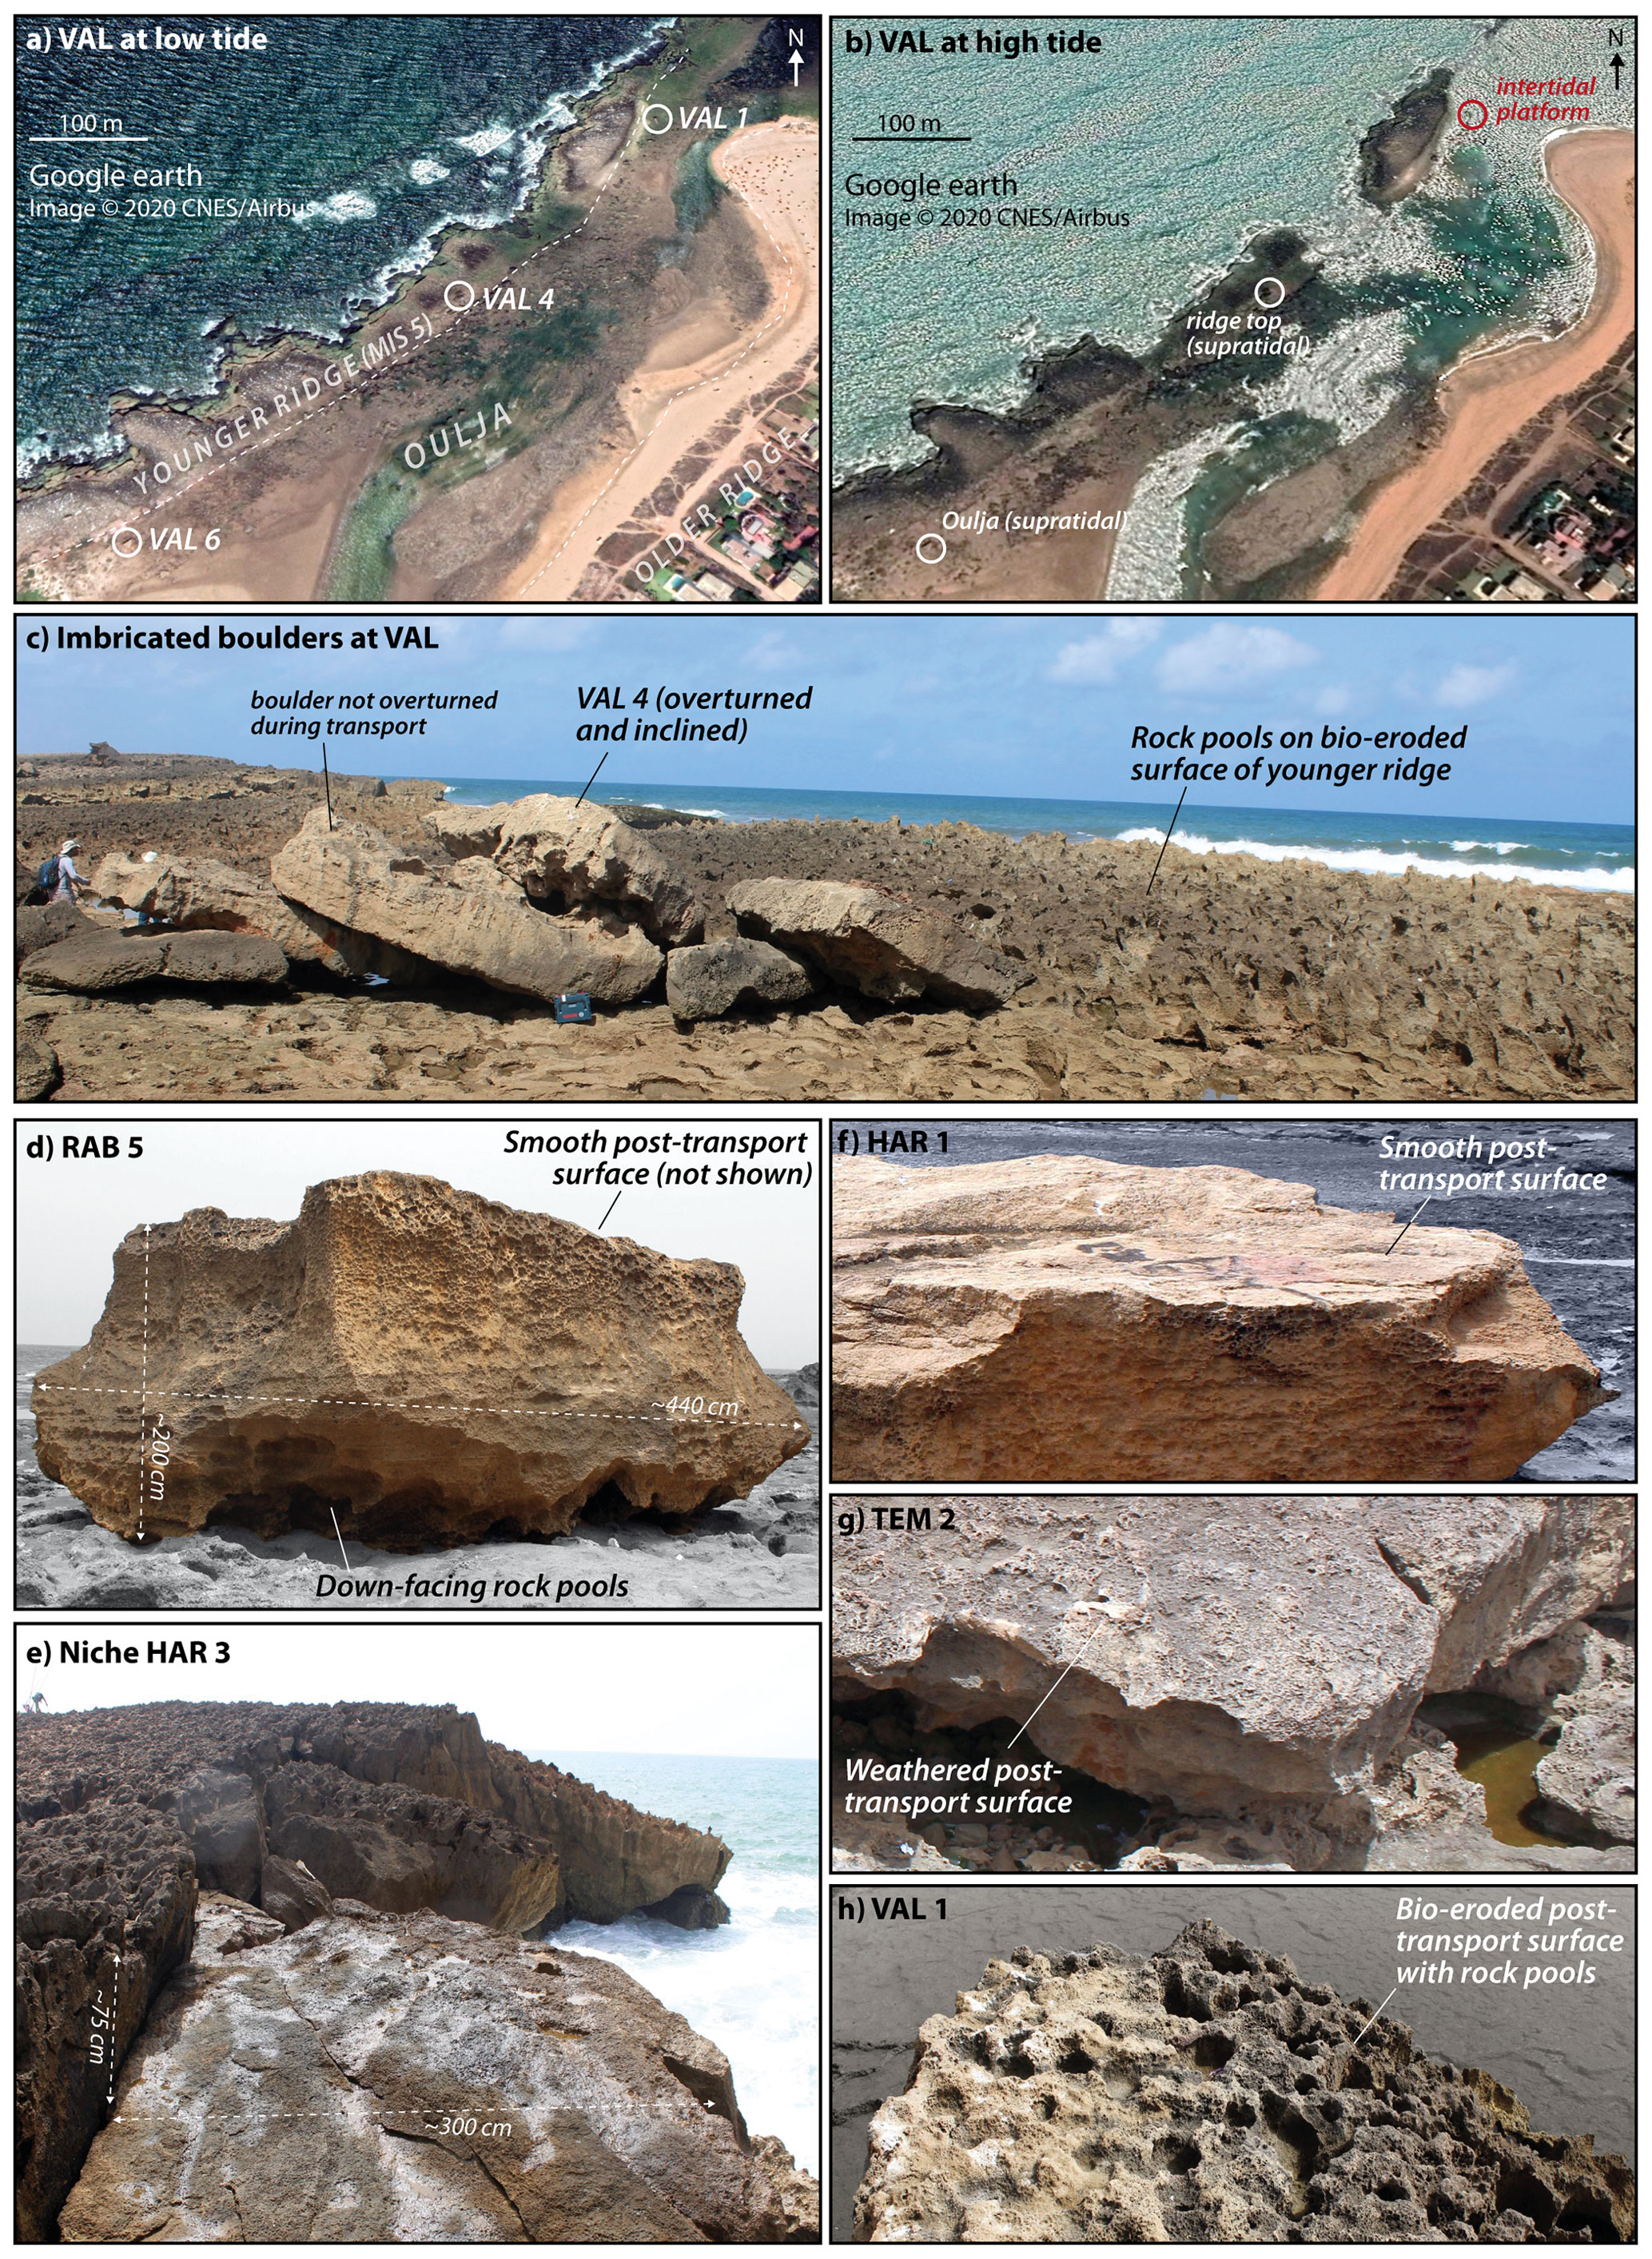
Figure 3Coastal boulders at the Rabat coast. Satellite images of Val d'Or taken at low tide (a) and high tide (b) illustrate different boulder settings on top of the younger ridge, within the Oulja and on the intertidal platform (© Google Earth images from July 2018 and February 2016). (c) Boulder VAL 4 as part of a stack of imbricated boulders in ridge-top position. (d) Down-facing rock pools of the former cliff surface at the bottom surface of RAB 5. (e) Niche HAR 3 formed by detachment of the associated boulder. (f–h) Surface roughness of the sampled boulders varies from smooth (HAR 1), over slightly weathered (TEM 2), to rock-pool covered (VAL 1).
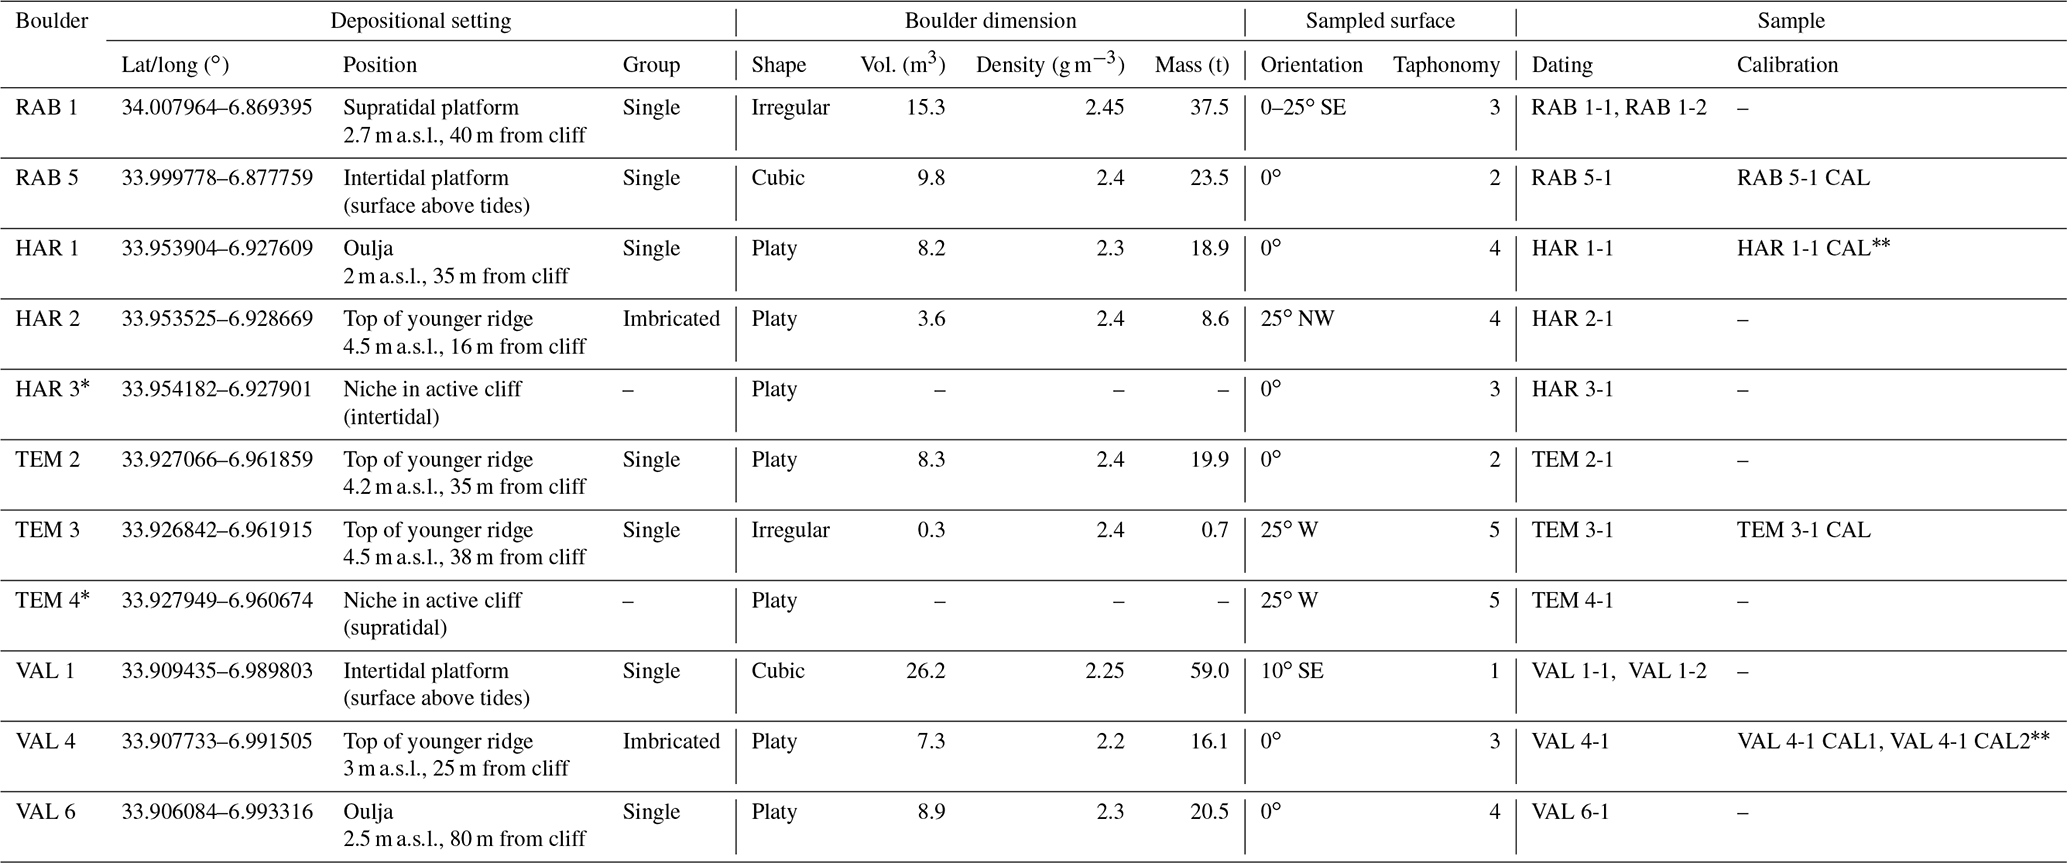
The characteristic features of all sampled boulders – including post-transport position, arrangement, shape, dimension, orientation of the sampled surface and taphonomy of boulder surfaces – are summarized in Table 1. Satellite images covering the last 50 years (Google Earth images from 2001 to 2019, Corona images from 1966), field observations for very young features, and, in the case of VAL 1, the depth of post-depositional rock pools helped to roughly constrain when the boulders and niches were deposited or formed (see Table A1 for a summary). Precise age control by observations of local residents confirmed the movement of boulder TEM 3 during winter storm Hercules/Christina in January 2014 (te= 2.5 years) and the formation of the niche TEM 4 (sampled in September 2018) between the 2016 and 2018 field surveys, most likely during the unnamed winter storm in February 2017 (te= 1.5 years) (Fig. A4). Corona satellite images provide minimum ages of 50 years for boulders RAB 1, RAB 5, VAL 1, VAL 4 and HAR 2, since all of them were identified at their present position on images from April 1966 (Figs. A5, A6, A7, A8, A9). However, considering the up to 45 cm deep post-depositional rock pools on the surface of VAL 1 and assuming typical rates of bio-erosion in the range of up to 1 mm yr−1 (Kelletat, 2013), boulder VAL 1 is probably much older than 50 years, at least by a few centuries. All other boulders and niches could not be identified on the 1966 satellite images due to their limited resolution. However, these clasts did not change their position between 2001/2004 and 2019 (Figs. A9, A10, A11), equalling minimum ages of 12–15 years (Table A1).
Table 1Characteristics of dated boulders. Lat/long is the latitude/longitude, * indicates the niche at coastal cliff, indicates the calibration sample on a nearby rooftop, taphonomy classes 1 to 5 with 1 – post-transport rock pools, 2 – rough post-transport surface covered with lichens/algae, 3 – smooth post-transport surface with scarce lichens/algae cover, 4 – smooth post-transport surface without/hardly any lichens/algae and fresh fractures, and 5 – fresh post-transport surfaces and fractures.
5.2 Luminescence properties of the target sandstone
Comparative measurements on polymineralic grains and potassium feldspar extracts on sample HAR 1-1 show that post-IRSL-BSL signals from the polymineralic aliquots of all four sites are (i) the dominant emission compared to IRSL signals and (ii) relatively unaffected by a feldspar signal contribution (Fig. A12). Therefore, OSL-RSED in this study was based on the mainly quartz-derived post-IRSL-BSL signal of polymineralic aliquots. Experiments on pure quartz extracts of sample HAR 1-1 revealed adequate OSL properties in terms of rapidly decaying signals dominated by the fast component (Fig. A12a, b), independence of thermal treatment for the selected preheat temperature (Fig. A13) and good reproducibility of laboratory doses (dose recovery ratios of 1.02–1.08). Similarly, suitable OSL properties, i.e. signals dominated by the quartz fast component (Fig. A12c) and successful dose recovery experiments, are also documented for post-IRSL-BSL signals of polymineralic aliquots.
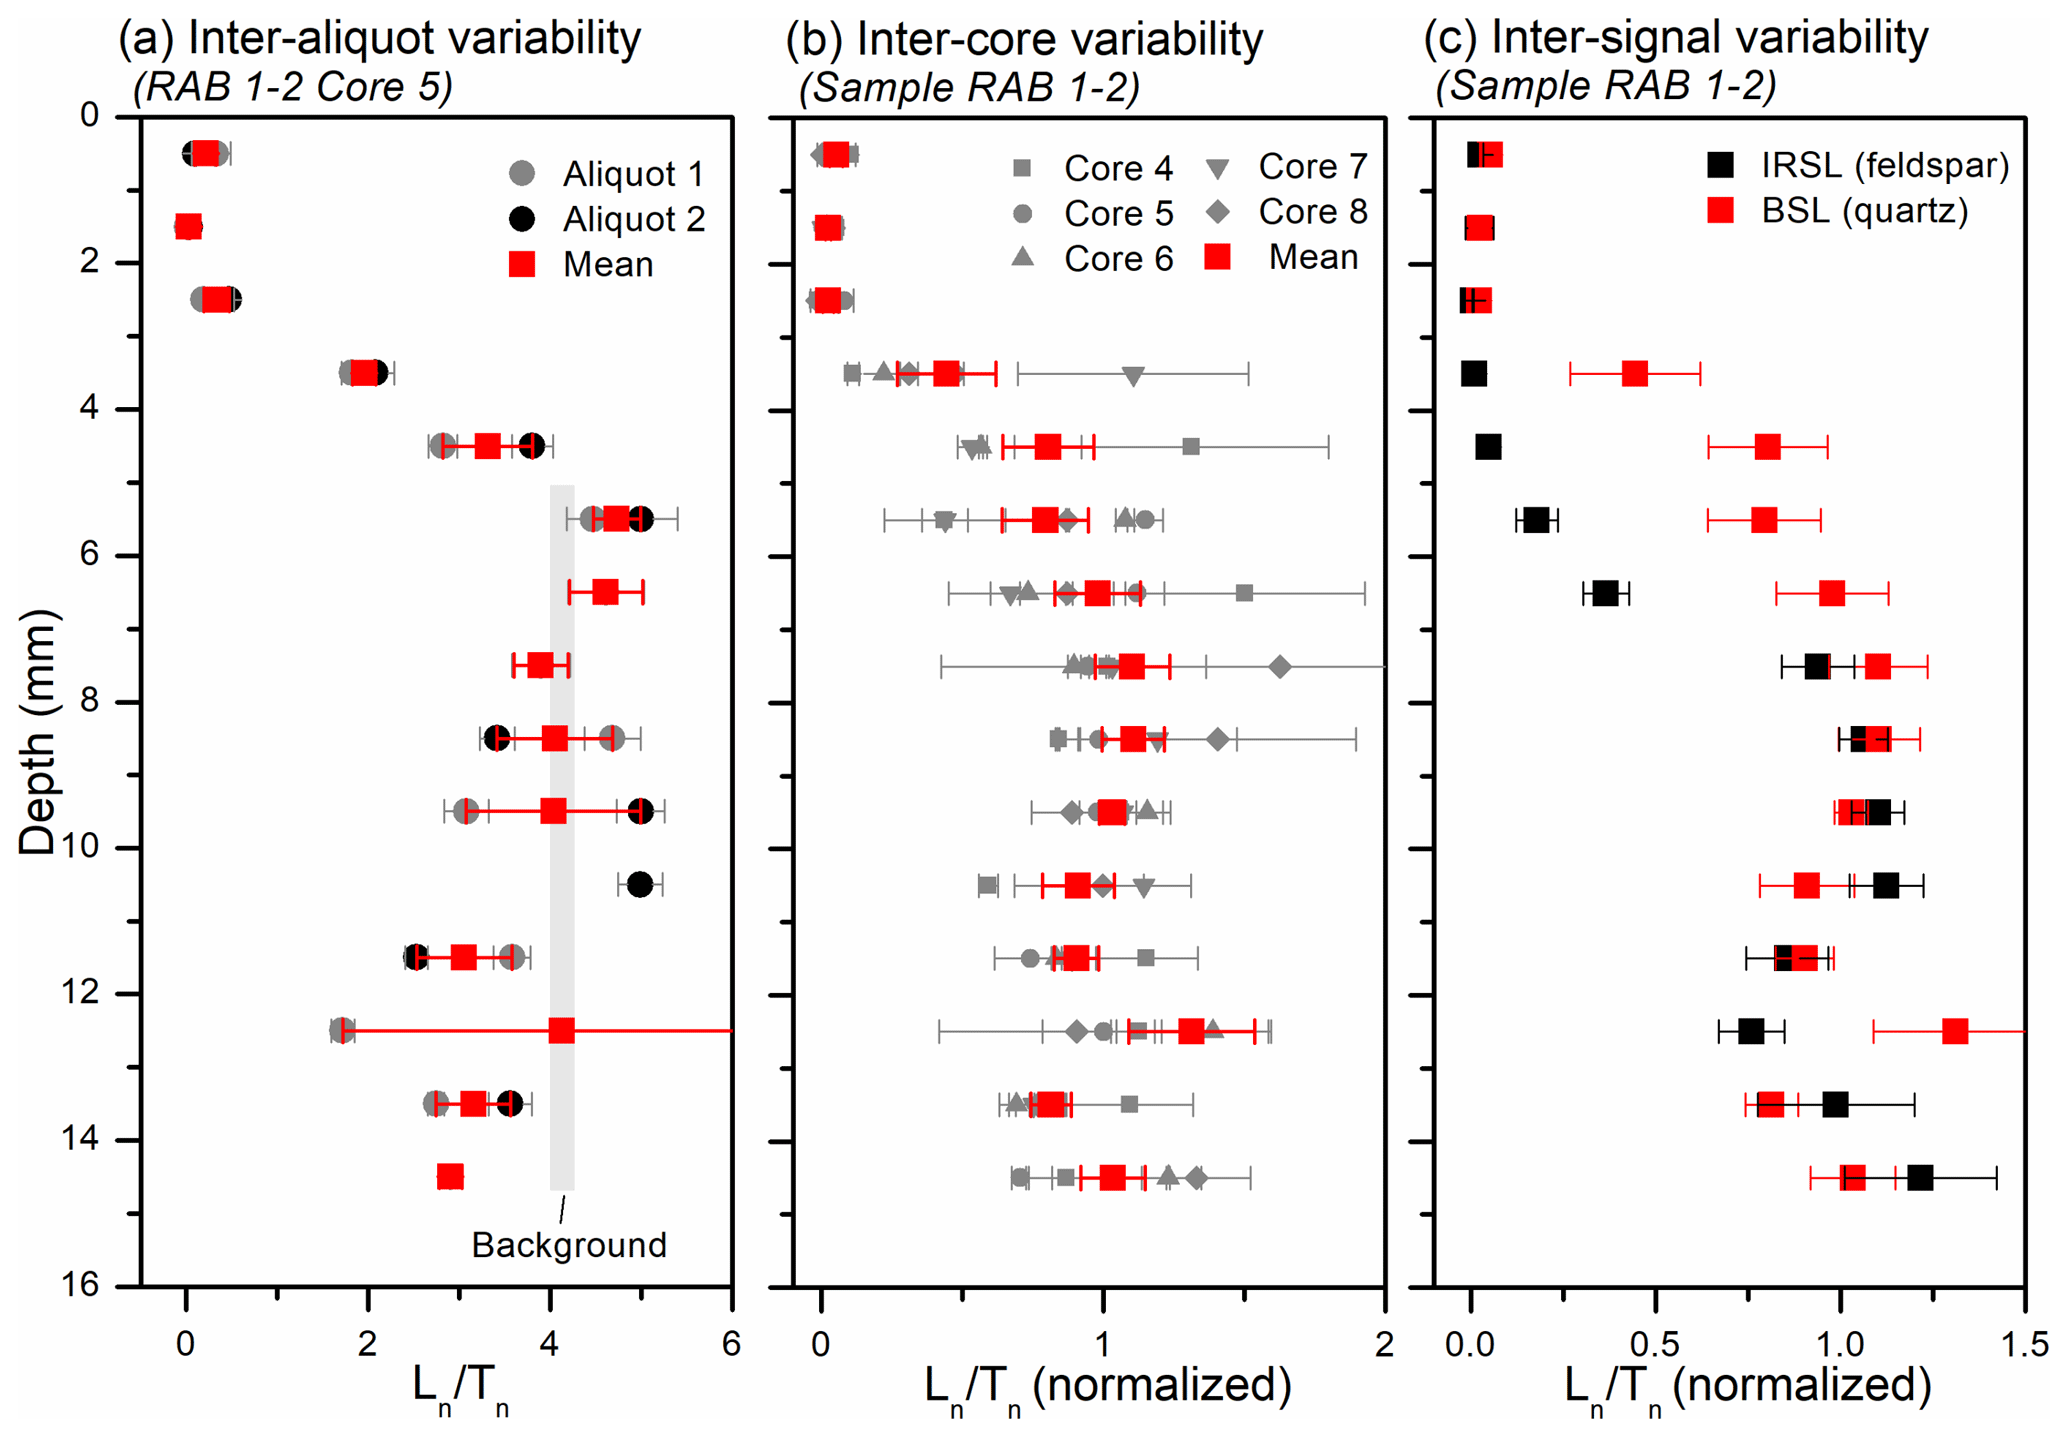
Figure 4Exemplary OSL signal–depth data for boulders from the Rabat coast (RAB 1-2). (a) Inter-aliquot variations of post-IRSL-BSL signals in core 5 of sample RAB 1-2. (b) Variability of post-IRSL-BSL signals from different cores of the same sample. (c) Comparison of quartz post-IRSL-BSL and feldspar IRSL signals measured in the same post-IRSL-BSL protocol (mean values based on five cores each).
When plotted against their depth below the boulder surface, test dose-corrected and normalized mean post-IRSL-BSL signals from the uppermost 15 mm of each sample (note that signal–depth curves of each sample are based on two to five cores with two aliquots per slice) showed a general increase from completely reset signals at the rock surface towards a constant plateau level deeper in the rock (Figs. 4, A14, A15). These plateaus reflected a quartz palaeodose of ∼ 40–50 Gy or a rock formation age of ∼ 80–100 ka (measured on HAR 1-1 and TEM 3-1, Table A4), which is below the sample-specific saturation level of 50–120 Gy. The robustness of the average post-IRSL-BSL depth trends used for dating is supported by good reproducibility of signals derived from different aliquots of the same slice (Fig. 4a) and reasonable correlation of different cores from the same sample (Figs. 4b, A14, A15). Where signal-to-noise ratios also allowed feldspar IRSL signals to be analysed (i.e. at TEM and RAB), these showed bleaching fronts that intruded deeper into the rock compared to the post-IRSL-BSL signal (Figs. 4c, A14, A15).
5.3 Calibration of the OSL rock surface exposure dating model using artificially exposed surfaces
To estimate boulder ages with OSL-RSED, measured post-IRSL-BSL signal–depth data must be fitted with the bleaching model described in Eq. (1). Besides the exposure time (te), the bleaching model contains two further a priori unknown parameters: the effective OSL signal bleaching rate at the rock surface () and the light attenuation in the rock (μ). These vary with geographical location and rock type, respectively, and have to be determined individually for each location and lithology prior to dating. Since determination on the basis of first-order principles was not successful in earlier studies (Sohbati et al., 2011), for the Rabat site, these parameters were obtained empirically by fitting Eq. (1) to calibration samples with known exposure ages (e.g. Sohbati et al., 2012; Lehmann et al., 2018).
For this, fresh rock surfaces were exposed during the first field survey in July 2016 and sampled during the second survey in September 2018, equivalent to an exposure time of ∼ 2.15 years. A total of five calibration (CAL) samples, at least one rock sample from each site, were collected (Table 1). Exposures were created directly on the top surfaces of boulders RAB 5, TEM 3 and VAL 4 (Fig. A16b, d), as well as by placing previously unexposed rock samples collected from boulders HAR 1 and VAL 4 on the rooftop of a nearby house (Fig. A16a, c). Since the effective luminescence decay rate ( is sensitive to the inclination and orientation of the dated rock surfaces (Gliganic et al., 2019), all exposure surfaces except from TEM 3 CAL, which had the same inclination as the associated dating sample, were oriented approximately horizontally.
The first step was the estimation of a rock-specific μ value. Light attenuation in the rock may be influenced by small-scale variations in lithology, and therefore μ should have sample-dependent values (Gliganic et al., 2019). However, individual best-fit μ values that were achieved by fitting Eq. (1) to the post-IRSL-BSL signal–depth data of individual samples while treating the product of age and as a single parameter (e.g. Sohbati et al., 2015) revealed huge uncertainties. Sample-specific best-fit μ values ranged between 0.5 and 3.4 mm−1 for the boulder samples in this study (Table 2), while literature values for the BSL signal of quartz sandstone and quartzite are in the range of 0.9–1.3 mm−1 (Sohbati et al., 2012; Gliganic et al., 2019). This indicates that sample-specific values in this study may not only be imprecise but, due to large measurement uncertainties, may also be incorrect for some samples. Since the estimation of shared μ values for several rock samples can improve the accuracy of the estimate significantly (Lehmann et al., 2018), the use of a shared μ value for all samples was chosen as a reasonable and necessary compromise. The assumption of a common μ value for all boulders targeted in this study is supported by their very similar lithology, since all of the boulders are derived from the same local calcarenite facies. This mutual μ value was obtained by simultaneously fitting Eq. (1) to the signal–depth data of all samples (n= 16) except from VAL 4-1 CAL 2 and RAB 5-1 CAL, which revealed extremely scattered data and were therefore excluded from all further analyses (Fig. 5). While μ was defined as a free parameter shared between all samples, the product of exposure time and was kept a free parameter with individual values for each sample. The mutual μ value of 1.39±0.15 mm−1 (Table 2) seems to be much more realistic when compared to the literature values for BSL signal attenuation in quartz sandstone and quartzite of 0.9–1.3 mm−1 (cf. Sohbati et al., 2012; Gliganic et al., 2019).
Table 2Summary of model parameters for all calibration and dating samples. Bold numbers indicate values that were eventually used for calibration and dating. Cat. is the sample category, Indiv. is the individual, texp mean is the exposure ages based on fixed μ and values without their uncertainties, texp min–max is the exposure age range with consideration of μ and uncertainties, * ages estimated on the basis of rock-pool depth.
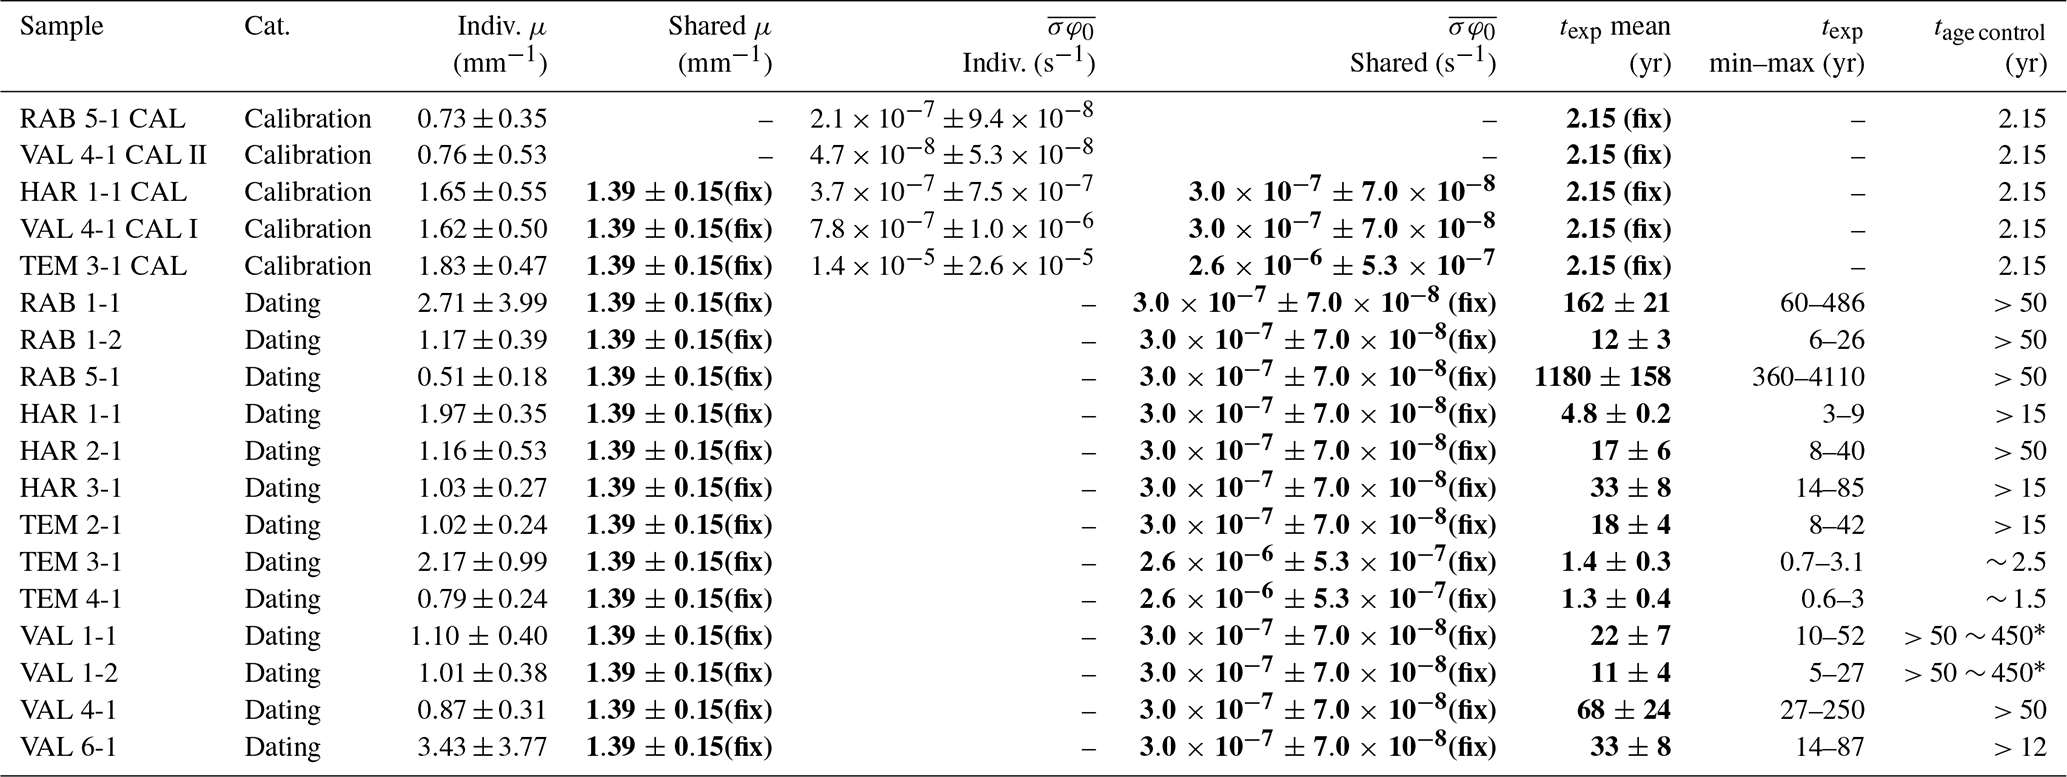
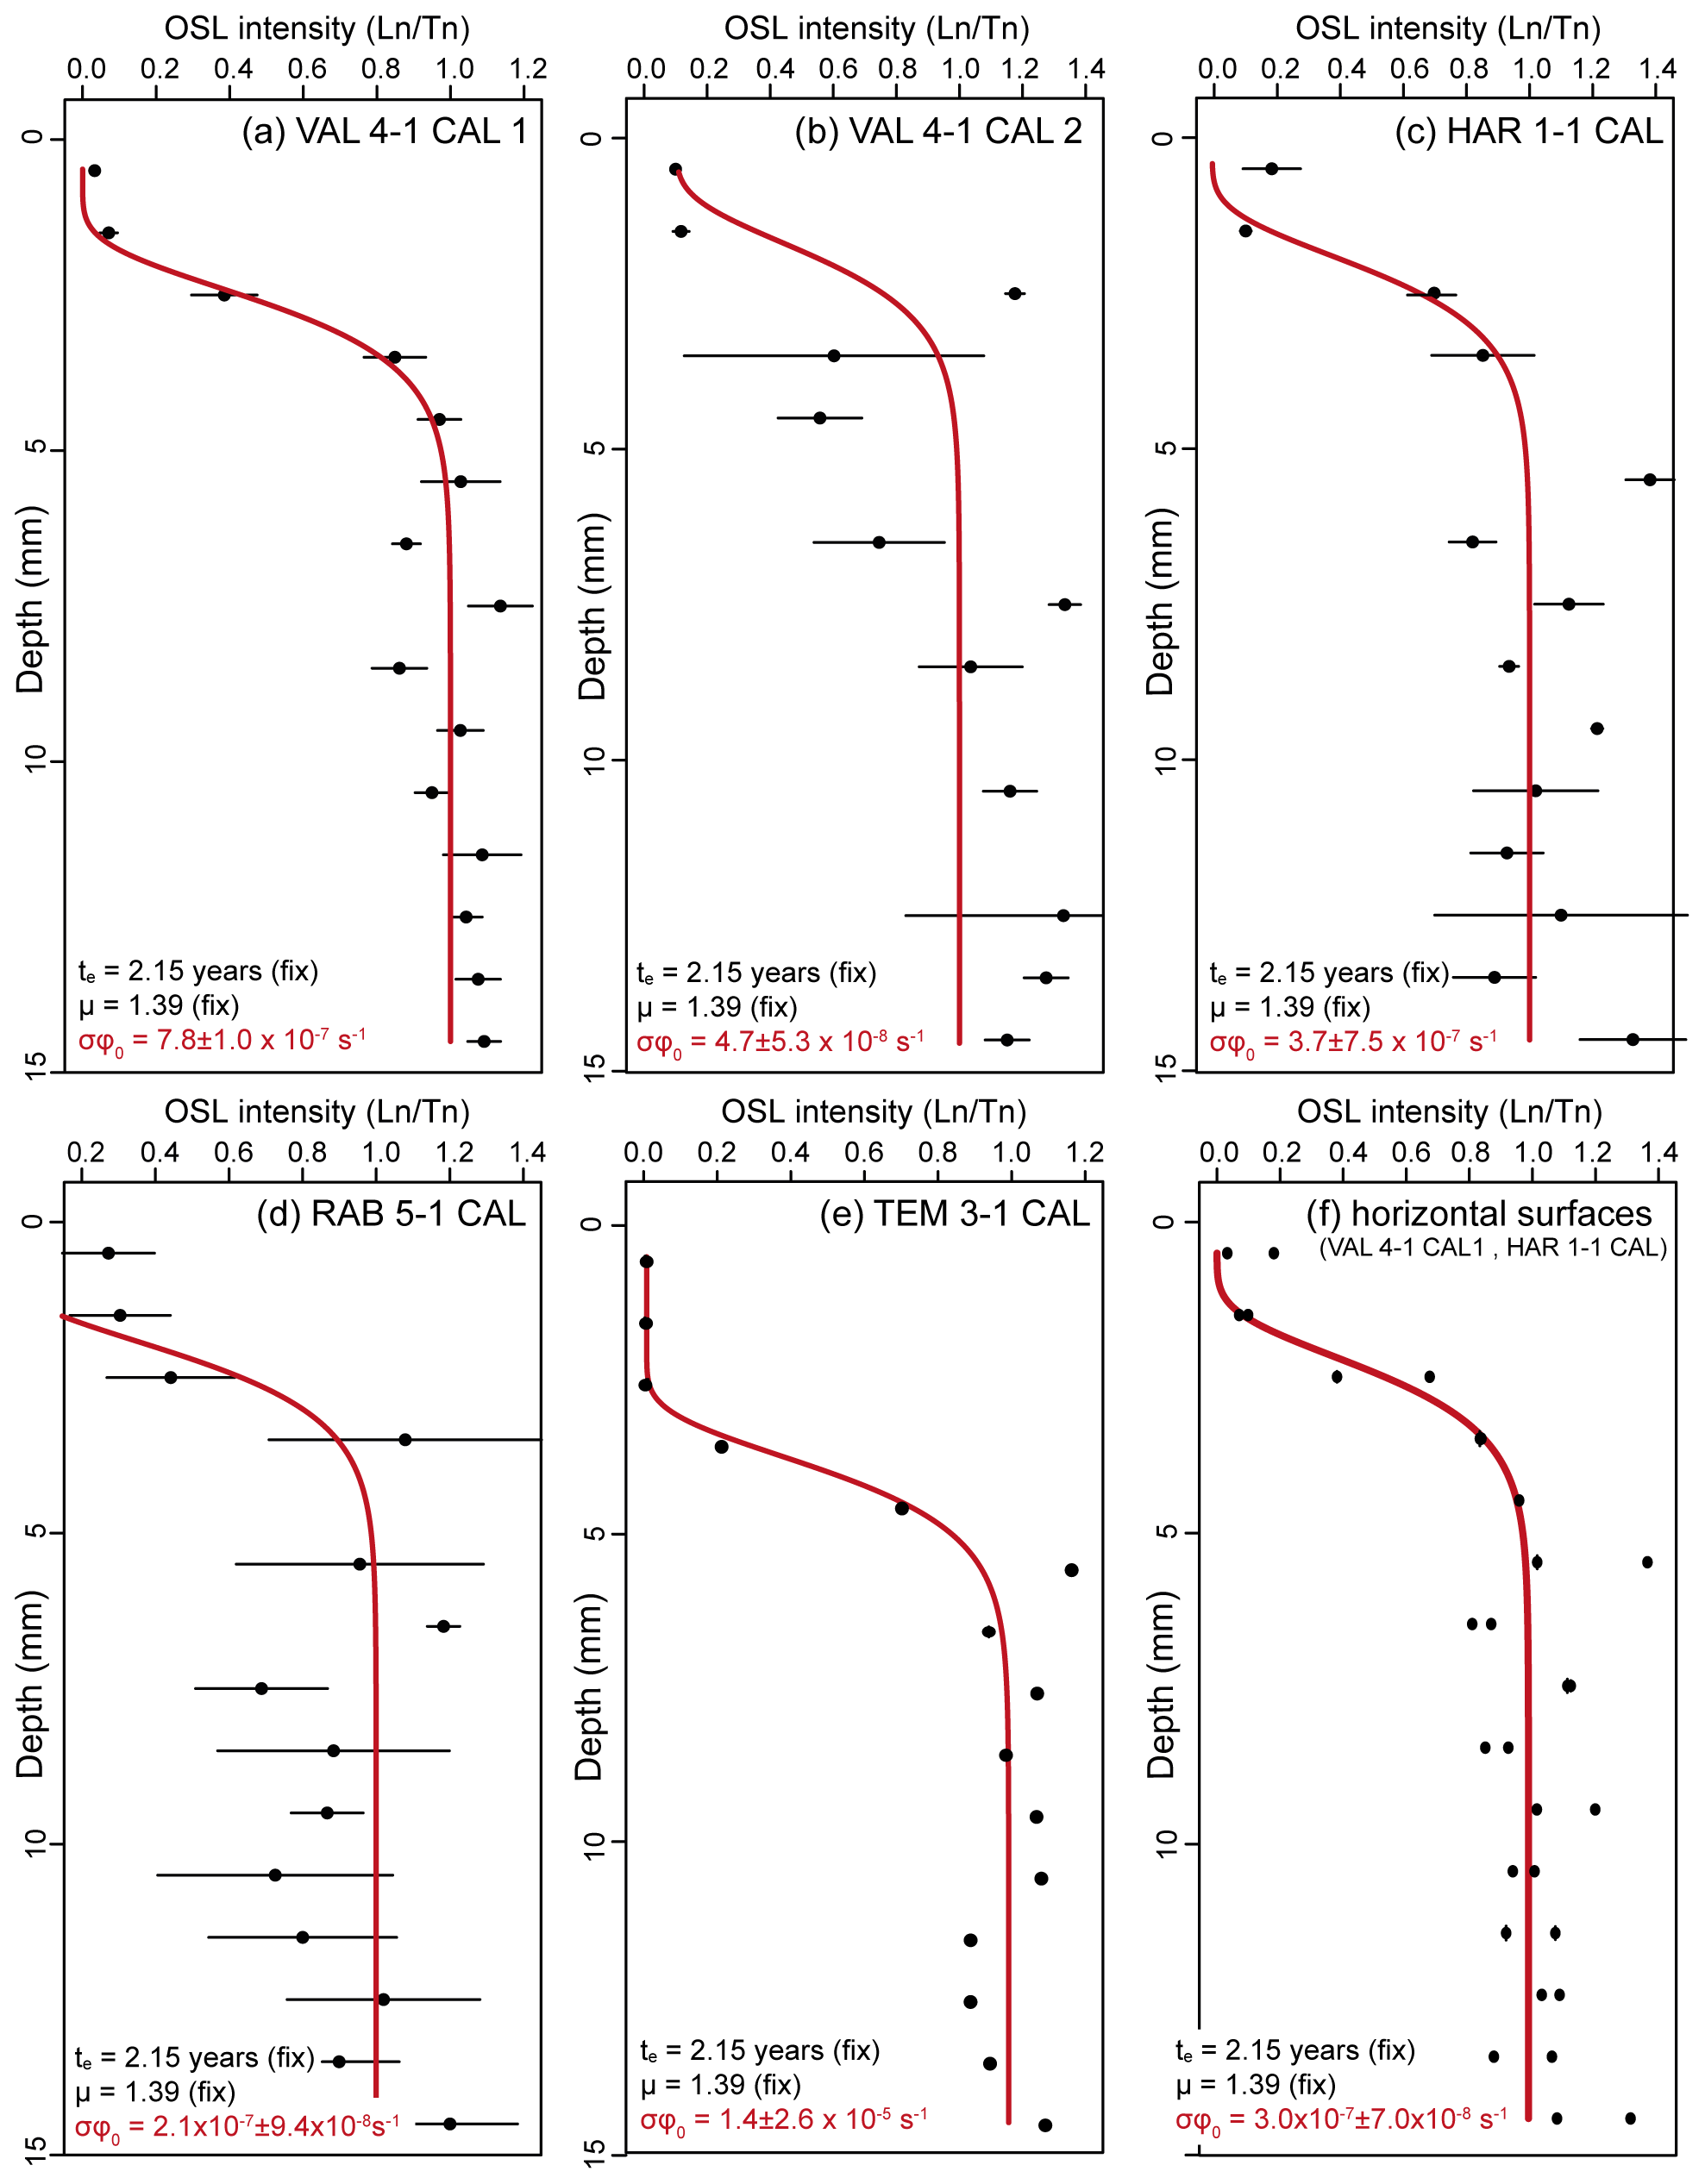
Figure 5Fitting of post-IRSL-BSL signal–depth data of calibration samples. Individual fitting of the five calibration samples (a–e) and joint fitting of calibration samples VAL 4-1 CAL 1 and HAR 1-1 CAL (VAL 4-1 CAL 2 and RAB 5-1 CAL are excluded due to the poor quality of their signal–depth data) to estimate a mutual value for all samples with flat surfaces (f). Fixed parameters are shown in black; calculated parameters are in red (lower left corner of panels a–f).
In a second step, local values for were determined. Since all samples in this study were collected within a radius of less than 20 km, the local light flux should be similar for all surfaces with comparable inclination and orientation. This was supported when fitting each calibration sample individually with fixed values for μ (1.39 mm−1) and exposure age (2.15 years) (Fig. 5, Table 2), reflecting systematic differences of between the inclined calibration surface of TEM 3-1 CAL (1.4 × 10⁻⁵ s−1) and the horizontal calibration surfaces of all other calibration samples (2.1 × 10⁻⁷ to 4.7 × 10⁻⁸ s−1). We therefore determined a shared value for horizontal surfaces by simultaneously fitting calibration samples VAL 4-1 CAL 1 and HAR 1-1 CAL (i.e. again excluding VAL 4-1 CAL 2 and RAB 5-1 CAL), using (shared) as a free variable and the mutual μ value of 1.39 mm−1 and an exposure age of 2.15 years as fixed parameters. This resulted in shared values of 2.6 × 10⁻⁶ ± 5.3 × 10⁻⁷ s−1 for the inclined surface and 3.0 × 10⁻⁷ ± 7.0 × 10⁻⁸ s−1 for horizontal surfaces (Fig. 5, Table 2).
5.4 Model validation and dating of boulders with unknown transport ages
OSL exposure ages for all non-calibration boulder and niche samples were derived by fitting their post-IRSL-BSL signal–depth profiles with Eq. (1) using the mutual μ value and the shared value for horizontal surfaces (the value for inclined surfaces was only used for TEM 3-1 and TEM 4-1) as fixed parameters (Table 2). Complete incorporation of both μ and uncertainties resulted in relatively large fitting uncertainties (Fig. 6a) that were finally reflected in the error margins of the OSL surface exposure ages. The fitted post-IRSL-BSL signal–depth curves of all dating samples and the associated exposure ages are summarized in Fig. 6b and Table 2, respectively. To evaluate the accuracy of model-derived exposure ages, they were compared with minimum transport ages deduced from satellite images, eyewitness observations and the depth of bio-erosive rock pools (Fig. 6c). The OSL surface exposure ages of most samples agree with the control ages; i.e. ages either post-dated the minimum age or showed overlap within their dating uncertainties. However, the exposure ages of samples RAB 1-2, VAL 1-1, VAL 1-2, HAR 1-1 and HAR 2-1 were too young; i.e. they pre-dated the minimum control ages.
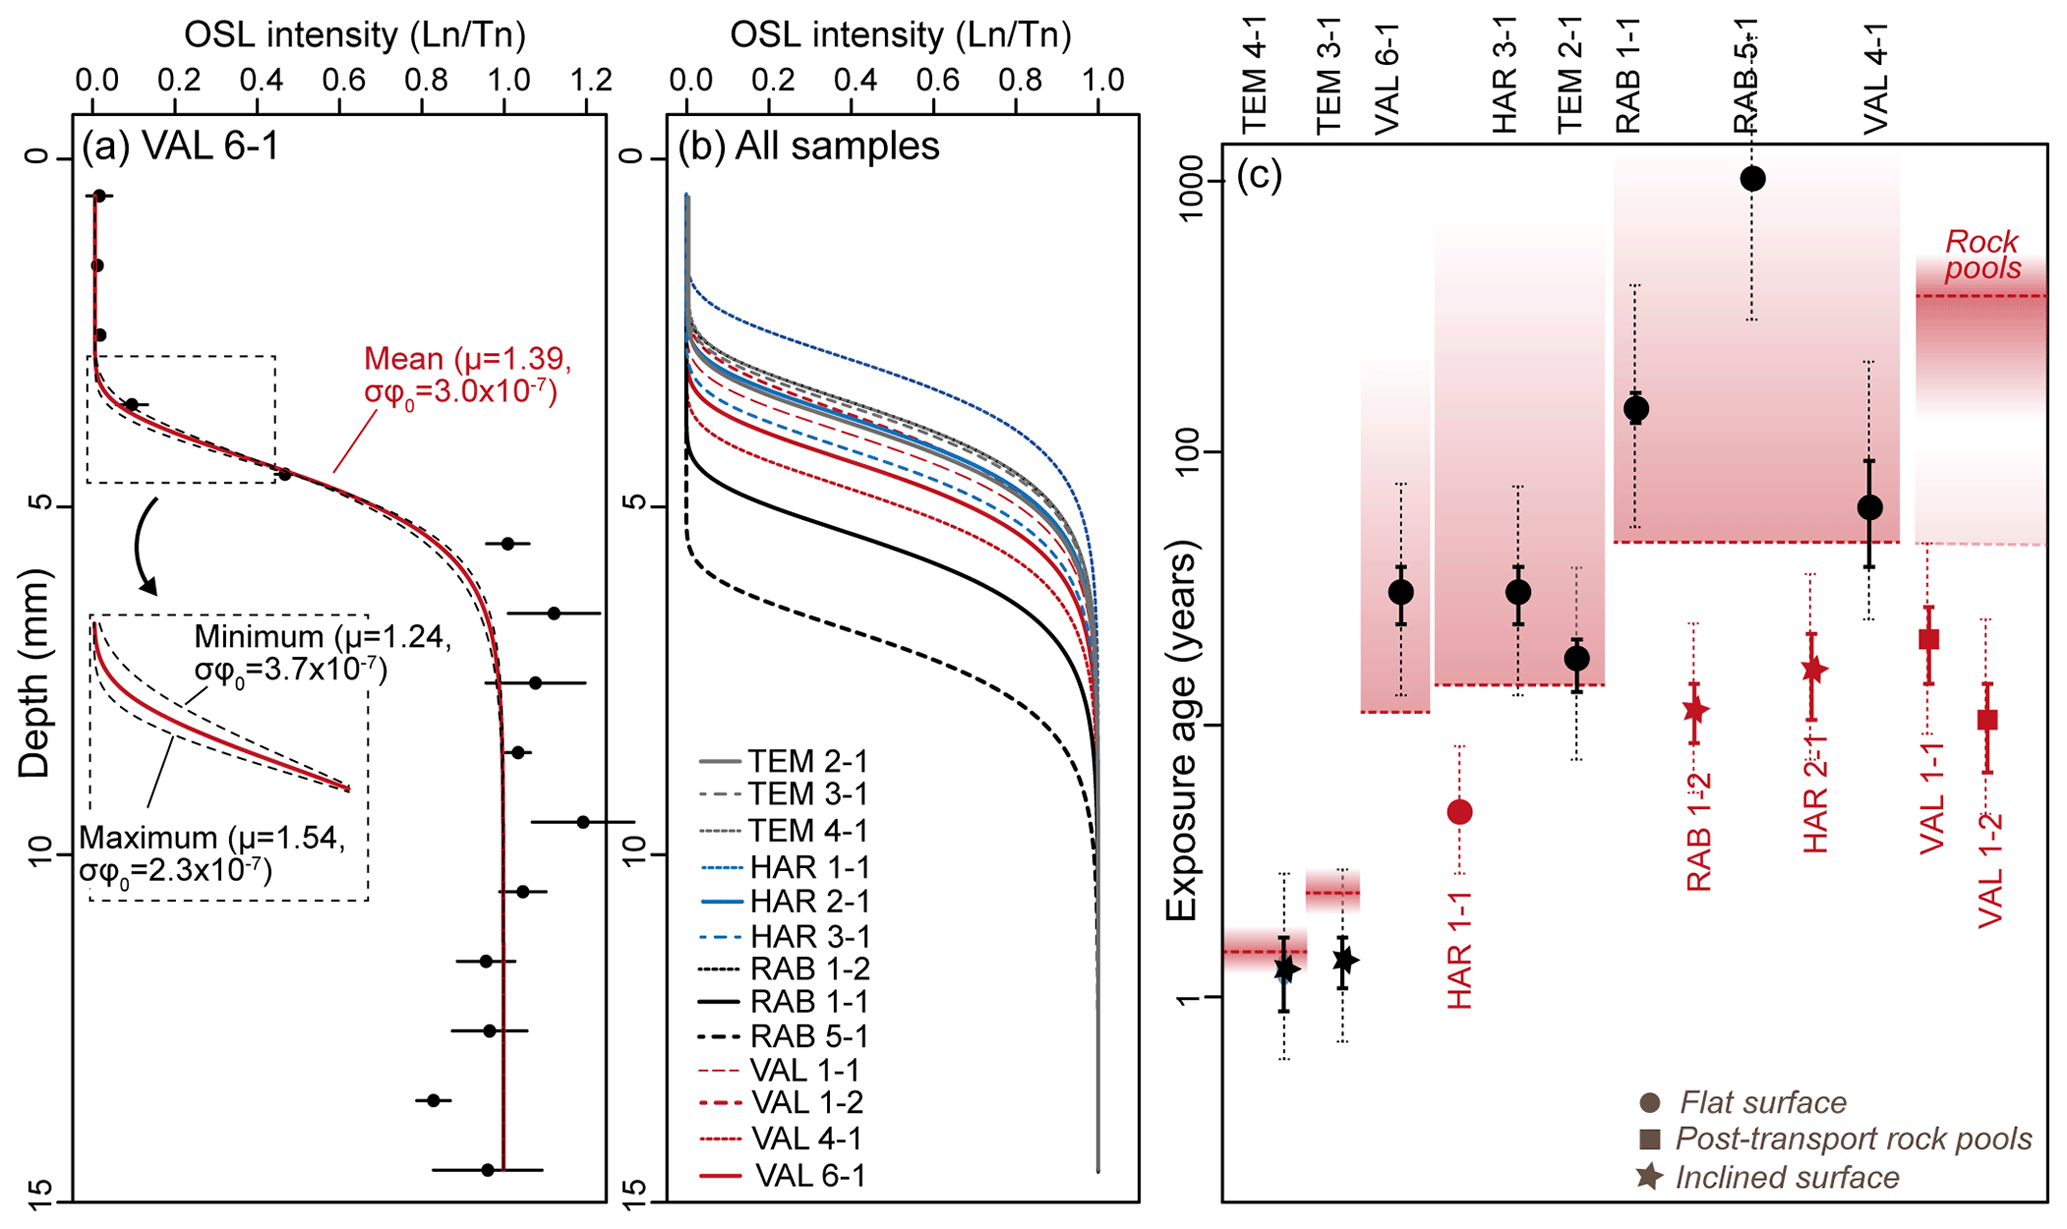
Figure 6Fitting of post-IRSL-BSL signal–depth data and comparison of OSL exposure ages with age control. (a) Fitting of sample VAL 6-1 with fixed μ (mutual value for all calcarenite samples in this study) and (mutual value for horizontal surfaces). Fitting uncertainties due to the uncertainties of μ and are highlighted in the close-up. (b) Model fits for all targeted samples (based on mutual values for μ and . (c) Comparison of modelled exposure ages (symbols with error bars) and age control from satellite images, eyewitness observations and depth of post-transport rock pools (indicated by shaded red areas). Exposure ages in agreement with control ages are shown in black; those too young for the control ages are in red.
5.5 Modelling post-depositional erosion of boulder surfaces
In order to explore whether erosion offers a plausible explanation of the age underestimations recorded for samples RAB 1-2, HAR 1-1, HAR 1-2, VAL 1-1 and VAL 1-2, the potential effect of erosion on the luminescence bleaching profiles was modelled using the numerical approach of Lehmann et al. (2019). The modelled sample ages (texp mean) and minimum independent ages (tage control) were used as model inputs, together with the shared values of μ and (Table 2). In total, 50 different erosion rates from 0.001 to 1 mm yr−1 were tested together with 50 different times for the onset of erosion (ts) ranging from 1 year to the independent sample age (both variables were sampled equidistantly in log space). The misfits between modelled and measured values were determined and paths with normalized misfit > 0.99 were retained. The sensitivity of the calculated erosion rates to the independent age was also evaluated by contrasting the results calculated for sample VAL 1-1 for independent ages of 50 years, 450 years and 6000 years, which reflect the minimum exposure age based on satellite images, a plausible estimate of the boulder turning age based on the depth of post-depositional rock pools (assuming bio-erosion of 1 mm yr−1; cf. Kelletat, 2013) and finally the time when Holocene sea level reached approximately its present position. The calculated erosion rates vary based on ts (Fig. 7); thus, to facilitate comparison, erosion rates for ts equal to the respective expected age (i.e. assuming constant erosion during exposure) are contrasted between samples (Table A5). The modelled erosion rates tend to increase with increasing surface age, from 0.02 mm yr−1 assuming an age of 50 years, to 0.03 mm yr−1 assuming ages of 450 and 6000 years in the case of sample VAL 1-1. Thus, erosion rate estimates based on minimum control ages should be regarded as minimum values. Minimum erosion rates varied from 0.18 mm yr−1 (HAR 1-1) to 0.02 mm yr−1 (VAL 1-1), maximum values (based on maximum ages) may be slightly higher as indicated for VAL 1-1. In agreement with expectation, the model did not identify any significant erosion (i.e. erosion rates < 0.01 mm yr−1) for samples that do not underestimate the minimum control ages.
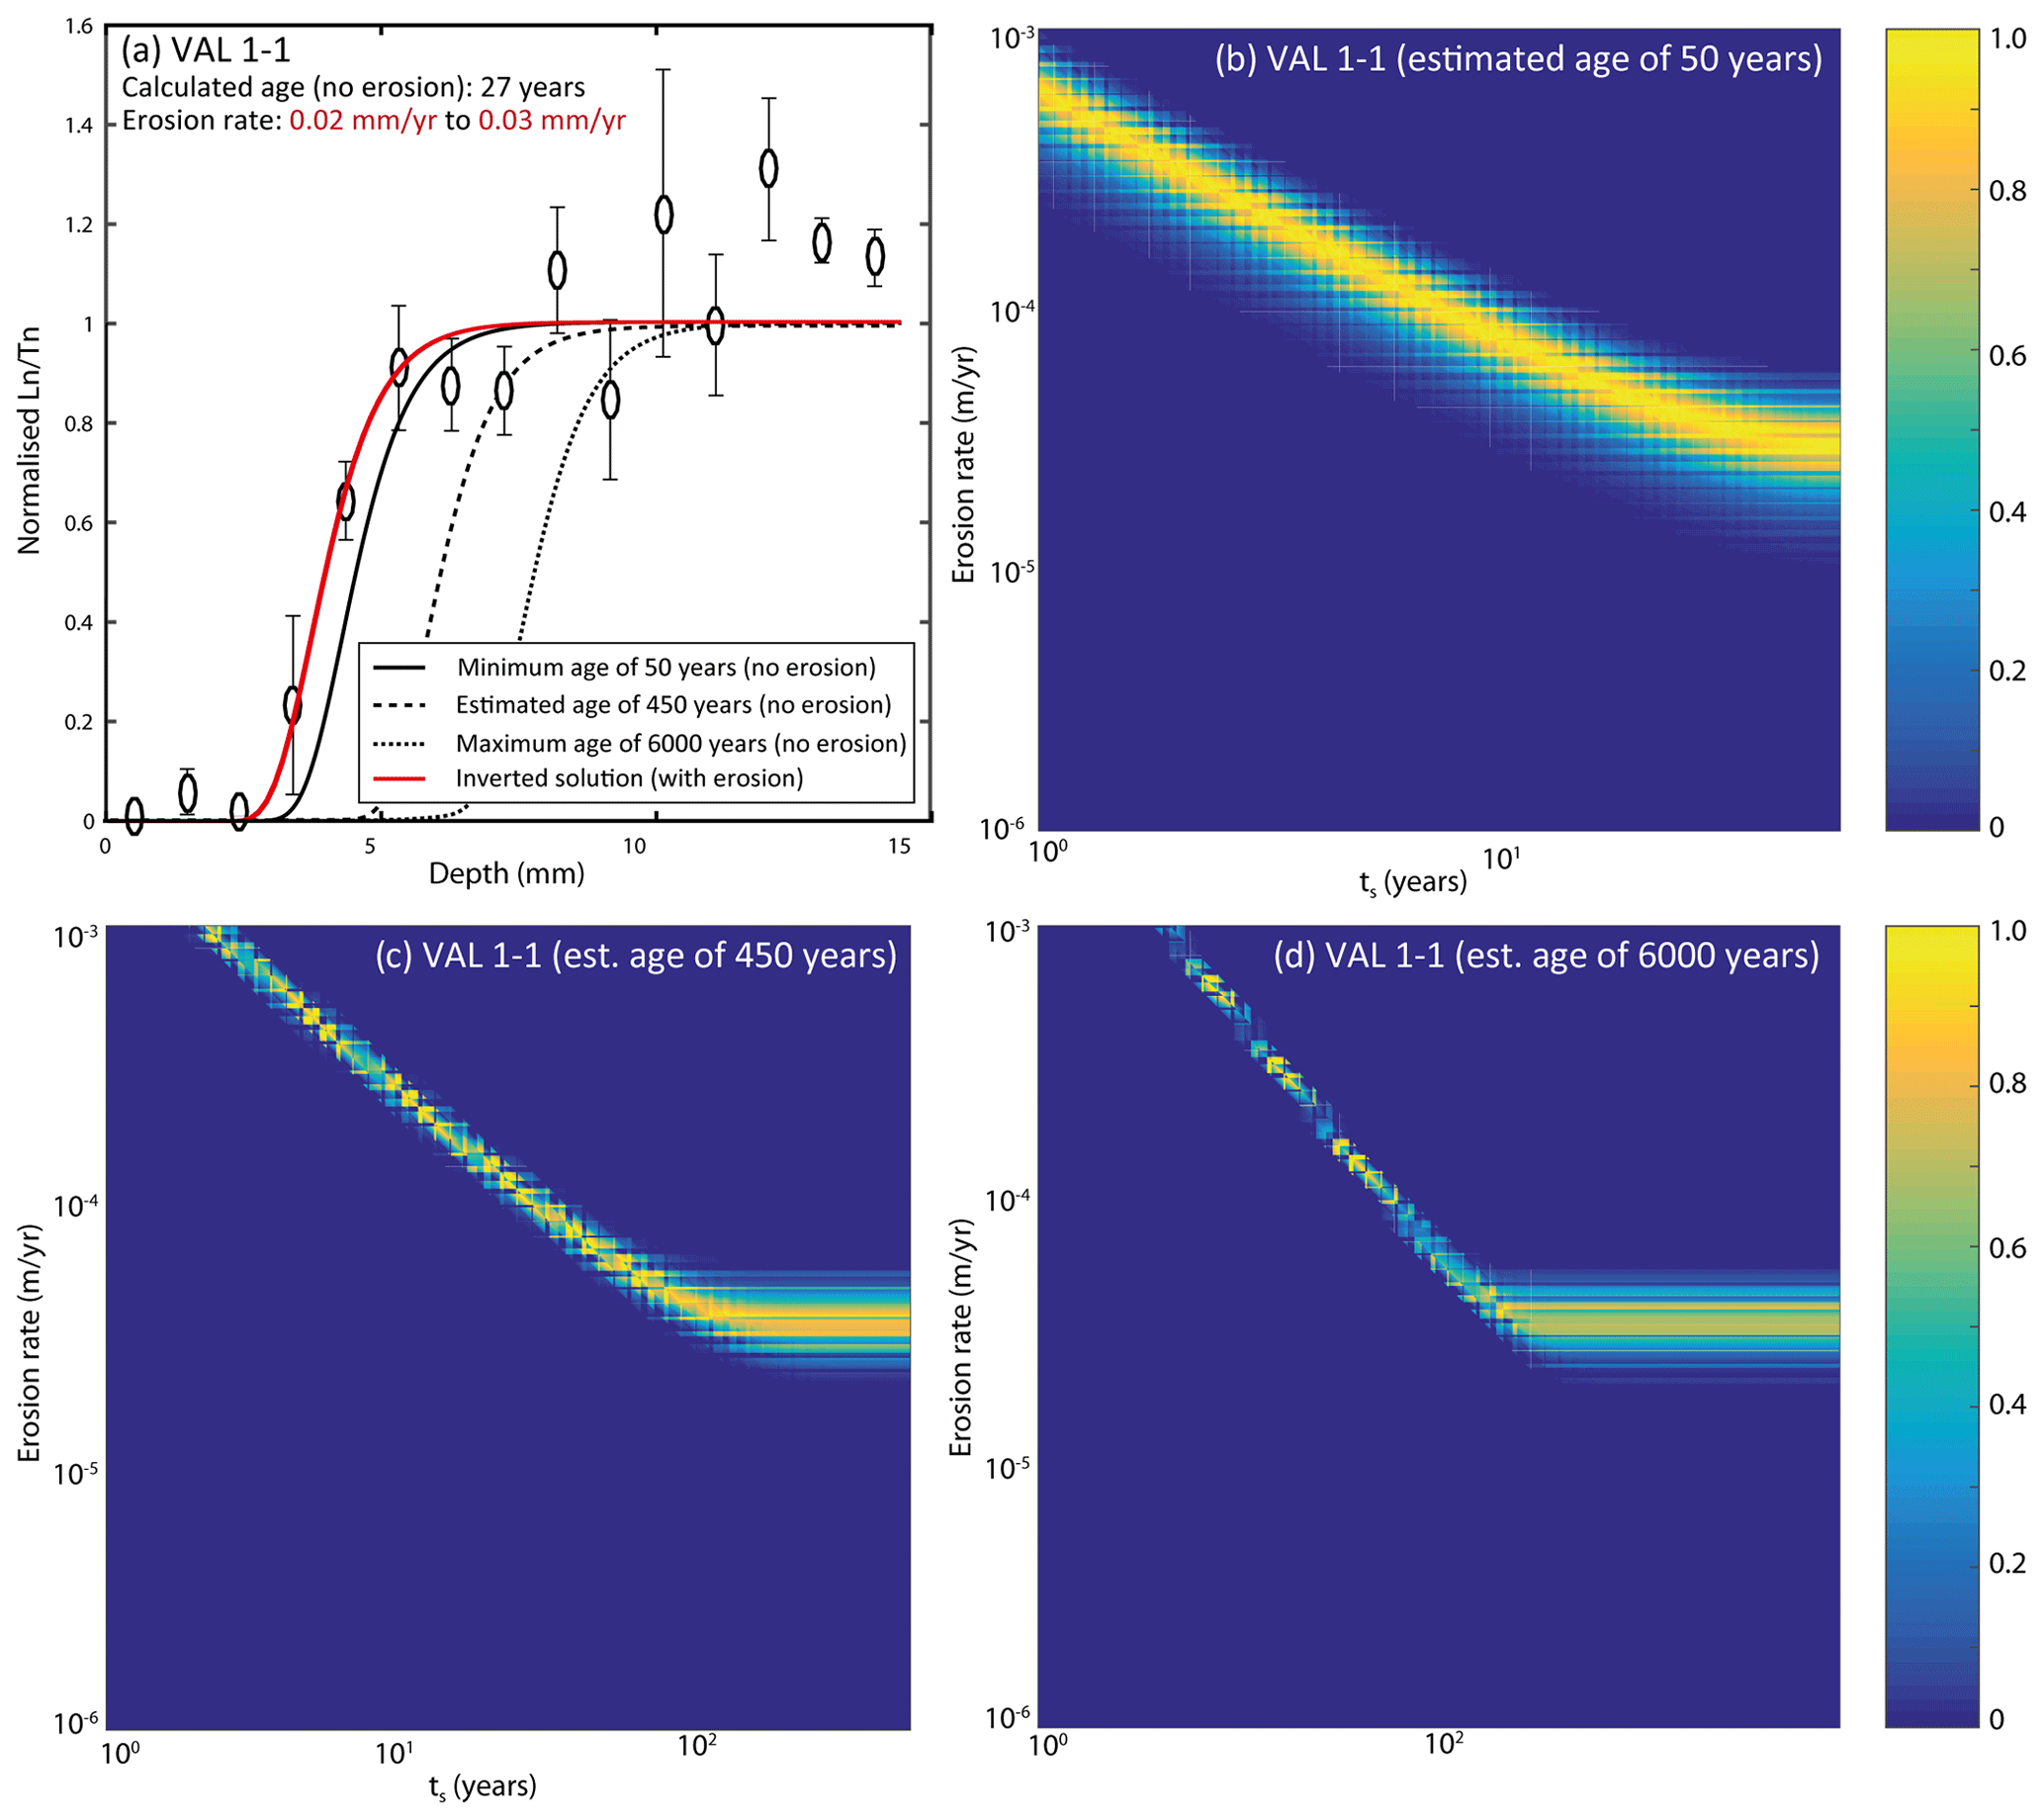
Figure 7Inverse modelling of post-deposition erosion rates using the approach of Lehmann et al. (2019). The effect of erosion on the OSL signal–depth profiles of sample VAL 1-1 was evaluated using the shared μ and from Table 2 as model input. (a) Erosion rates were estimated for assumed exposure ages equal to the minimum age (50 years, b), a realistic age estimate based on rock-pool depth (450 years, c) and the maximum age (6000 years, d). Since erosion rates are sensitive to changes of ts, the erosion rates reported in panel (a) are based on ts values equal to the assumed exposure time (i.e. constant erosion rates during exposure).
6.1 Performance of OSL surface exposure dating on calcarenite boulders
The OSL surface exposure ages derived for boulders and niches from the Rabat coast show two striking characteristics: (1) all exposure ages are associated with relatively large dating uncertainties compared to previous applications of OSL-RSED (e.g. Sohbati et al., 2012; Lehmann et al., 2018); and (2) 5 of the 13 dated boulder samples yield OSL exposure ages that underestimate minimum ages deduced from satellite imagery and rock-pool depth, even when their uncertainties are considered (Fig. 6c).
The low dating precision observed in this study is mainly the result of the boulder source rock, a late Pleistocene calcarenite. All rock samples dated in this study display strongly scattered post-IRSL-BSL signal–depth data (e.g. Figs. 4 and 5) that entail large fitting uncertainties, imprecisely constrained μ and parameters and, eventually, large dating uncertainties. OSL signal scatter is primarily due to dim post-IRSL-BSL signals with not more than a few hundred photon counts in the analysed signal interval. Since pure quartz extracts of the same samples proved to be rather sensitive (Fig. A12), dim post-IRSL-BSL signals must be the result of low percentages of quartz on the carbonate-rich polymineralic aliquots used for dating. Additional signal scatter for our samples may be introduced by spatial variations of light penetration that is caused by heterogeneities in the rock mineralogy (Meyer et al., 2018) and core-to-core variations of OSL signal resetting (Sellwood et al., 2019). Previous studies demonstrated that lithologies with brighter quartz signals in polymineralic samples (e.g. quartzite or quartz-dominated sandstone) or stronger feldspar signals to avoid using quartz OSL for dating (e.g. granite or gneiss) can provide much higher dating precision than achieved for the Rabat boulders (Sohbati et al., 2012; Freiesleben et al., 2015; Lehmann et al., 2018; Gliganic et al., 2019).
Although large post-IRSL-BSL signal scatter may also affect dating accuracy, since it prevents using individual μ values for each sample, as suggested, e.g. by Gliganic et al. (2019), the unambiguous disagreement between exposure ages and age control for five of the boulder samples (Fig. 6c) is interpreted to result from unreliable values and post-depositional erosion. In the constrained geographical area visited in this study, should be comparable for all boulder surfaces as long as they share the same aspect and inclination (e.g. Sohbati et al., 2018). However, if calibration and dating samples do not share surface inclination and aspect, the use of a shared value is inappropriate, as observed in controlled bleaching experiments (Gliganic et al., 2019) and indicated by the systematic differences of between calibration samples with inclined and flat surfaces in this study. The clearly too-young OSL exposure ages of samples HAR 2-1 and RAB 1-2, i.e. 17 ± 6 and 12 ± 3 years, although both boulders were overturned at least 50 years ago (Fig. 6c), could reflect the mismatch between their inclined surfaces and fitting with a that was determined on flat calibration surfaces. Future boulder dating studies should ensure calibration samples with comparable inclination and orientation to the dating samples.
Besides inadequate model calibration, OSL rock surface exposure ages become inaccurate when their OSL signal–depth curves are affected by environmental factors different than exposure time. Since OSL-RSED is restricted to the uppermost few millimetres or centimetres of rock surfaces, the position and shape of the bleaching front is very susceptible to erosion (Sohbati et al., 2018; Lehmann et al., 2019, 2020; Brown and Moon, 2019). For soft sandstone boulders in the coastal zone as targeted here, the combination of sea-spray-induced and rain-induced weathering and strong winds is likely to cause erosion of grains at the exposed post-transport surfaces (e.g. Mottershead, 1989). By yielding erosion rates from 0.02 to 0.18 mm yr−1, inversion of the rock surface exposure data for boulder samples that clearly underestimate age control (i.e. RAB 1-2, HAR 1-1, HAR 1-2, VAL 1-1 and VAL 1-2) supports the assumption of significant erosion for some of the boulders dated in this study (Fig. 7).
The erosion processes of interest in this study are affecting the surface of the boulders at the spatial scale of the individual mineral grains and timescales of centuries to millennia. Empirical approaches such as micro-erosion meters (Stephenson and Finlayson, 2009) and remote sensing methods (Moses et al., 2014), allow accurate erosion rate quantification but only on subdecadal timescales. On the other hand, terrestrial cosmogenic nuclide concentrations provide erosion rate estimates from exposed bedrock (Small et al., 1997; Portenga and Bierman, 2011) but only on timescales of > 104–106 years and over spatial scales of several decimetres to several metres. Besides being an emerging method and still in development, the OSL-RSED method allows us to quantify surface erosion stories according to linear, non-linear and stochastic temporal functions at the subcentimetre scale and over timescales of centuries to millennia (Sohbati et al., 2018; Lehmann et al., 2019, 2020; Brown and Moon, 2019). The impact of erosion inferred from luminescence signal–depth data in this study agrees with expectations based on geomorphological evidence for boulders with post-transport surfaces covered by bio-erosive rock pools, such as boulder VAL 1. Since the lower part of this boulders is lying in the intertidal zone, modelled erosion rates of 0.02 to 0.07 mm yr−1 can be explained by weathering due to sea spray and overtopping waves. These data also illustrate the spatial heterogeneity in erosion rates for some of the coastal boulders sampled and the importance of careful sample location selection. Comparable erosion rates of 0.04–0.06 mm yr−1 were inferred for boulders in supratidal positions despite their apparently smooth surfaces (HAR 2-1, RAB 1-2). Thus, our data suggest that some influence of erosion cannot unambiguously be ruled out even for calcarenite boulders with apparently smooth surfaces, and all OSL-RSED ages for boulders in this study should be interpreted with caution. While these erosion rates are based on the assumption of constant erosion, the comparatively large erosion rate of 0.18 mm yr−1 for the smooth and fresh-looking surface HAR 1-1 may indicate accelerated erosion in the first few years after exposure of fresh boulder surfaces.
Other environmental factors that might affect OSL exposure ages are assumed to be negligible for all dated boulders. The post-transport surfaces of all boulders are bare of vegetation and not shielded by topography or houses. The surfaces of boulders in the intertidal zone (i.e. VAL 1) may be overtopped by waves during stronger storms (particularly contemporaneous with high-tide conditions), but periods with submersion are insignificantly short compared to the total exposure time. Likewise, the exposure duration of the calibration surfaces, i.e. another important parameter for model calibration, had no negative effect on dating accuracy. The exposure time of ∼ 2 years used in this study was more than sufficient to generate pronounced bleaching fronts in all calcarenite samples. Although model calibration generally benefits from calibration samples with long, and in the best case several different, exposure durations, even shorter exposure intervals than 2 years would have sufficed. In boulder samples with bright IRSL signals, these were even better bleached than the associated post-IRSL-BSL signals (Fig. 4c), potentially because the longer wavelengths that feldspar signals are sensitive to are less attenuated by the rock than the shorter wavelengths (Ou et al., 2018) that bleach quartz signals (Wallinga, 2002). Thus, the application of IRSL instead of post-IRSL-BSL signals may reduce the time required for calibration to durations as short as a few months (Freiesleben et al., 2015; Ou et al., 2018). While IRSL signals were not used in this study due to insufficiently bright signals for most samples, in retrospect their use might be advantageous to post-IRSL-BSL signals at least for some of the investigated boulders.
6.2 New information on storm and tsunami hazards at the Atlantic coast of Morocco
Knowing the chronology of boulder transport can help to better assess the local flooding hazard at the Rabat coast. Energetic waves during storms and tsunamis will generally exacerbate the effects of coastal flooding in the course of climate-induced sea-level rise (Nicholls et al., 2018). It is therefore of paramount interest whether coastal inundation strong enough to lift boulders at the Rabat coast only occurred during the very rare tsunami events, such as the 1755 Lisbon tsunami, or also during much more frequent winter storms. While the discrimination between storm and tsunami transport based on boulder features is hardly possible, with the exception of extreme cases that disregard storm transport due to exceptional boulder masses or elevations (Lau and Autret, 2020 and references therein), chronological patterns of boulder detachment may provide useful information for the recognition of storm and tsunami boulders.
Comparison with satellite images showed that apparent OSL-RSED ages definitely do not reflect the timing of cliff detachment for boulders affected by severe post-depositional erosion (VAL 1-1 and VAL 1-2, squares in Fig. 6c) and for boulder samples with significantly inclined surfaces (HAR 2-1 and RAB 1-2, stars in Fig. 6c); the associated OSL exposure ages cannot be considered for any further interpretation. All other boulder samples, including those with apparently smooth surfaces, were likely affected to some extent by erosion as well. Slight age underestimation thus cannot be excluded and their exposure ages should be interpreted carefully. We nevertheless are confident that the latter provide valuable relative chronological information for the cliff detachment of boulders that is shown in Fig. 8a and allow differentiation between boulder ages.
The reliability of this relative chronology is supported by correlation between OSL exposure ages and the surface taphonomy of the associated boulders and niches (Fig. 8a, b). Exposure ages younger than ∼ 10 years were achieved for boulders and niches with smooth surfaces and fresh fractures, i.e. taphonomy classes 4 and 5 (TEM 4, TEM 3, HAR 1; Fig. 8b1). Boulders with exposure ages between ∼ 10 and ∼ 100 years are characterized by smooth surfaces with very scarce lichen or algae cover, i.e. taphonomy classes 3 and 4 (HAR 3, VAL 4, VAL 6, TEM 2; Fig. 8b2). Finally, boulders with exposure ages older than ∼ 100 years are characterized by weathered fractures and rougher surfaces, i.e. taphonomy classes 2 and 3 (RAB 1, RAB 5; Fig. 8b3, b4). According to the chronology presented here, with OSL exposure ages of 30–250 years (VAL 4) and 60–490 years (RAB 1), only two boulders may have been moved by the 1755 Lisbon tsunami. However, with masses of 16–37 t and positions on the intertidal platform (RAB 1) or on top of cliffs 3–4 m above sea level (VAL 4), they do not systematically differ from the other dated boulders in terms of wave power required for transportation.
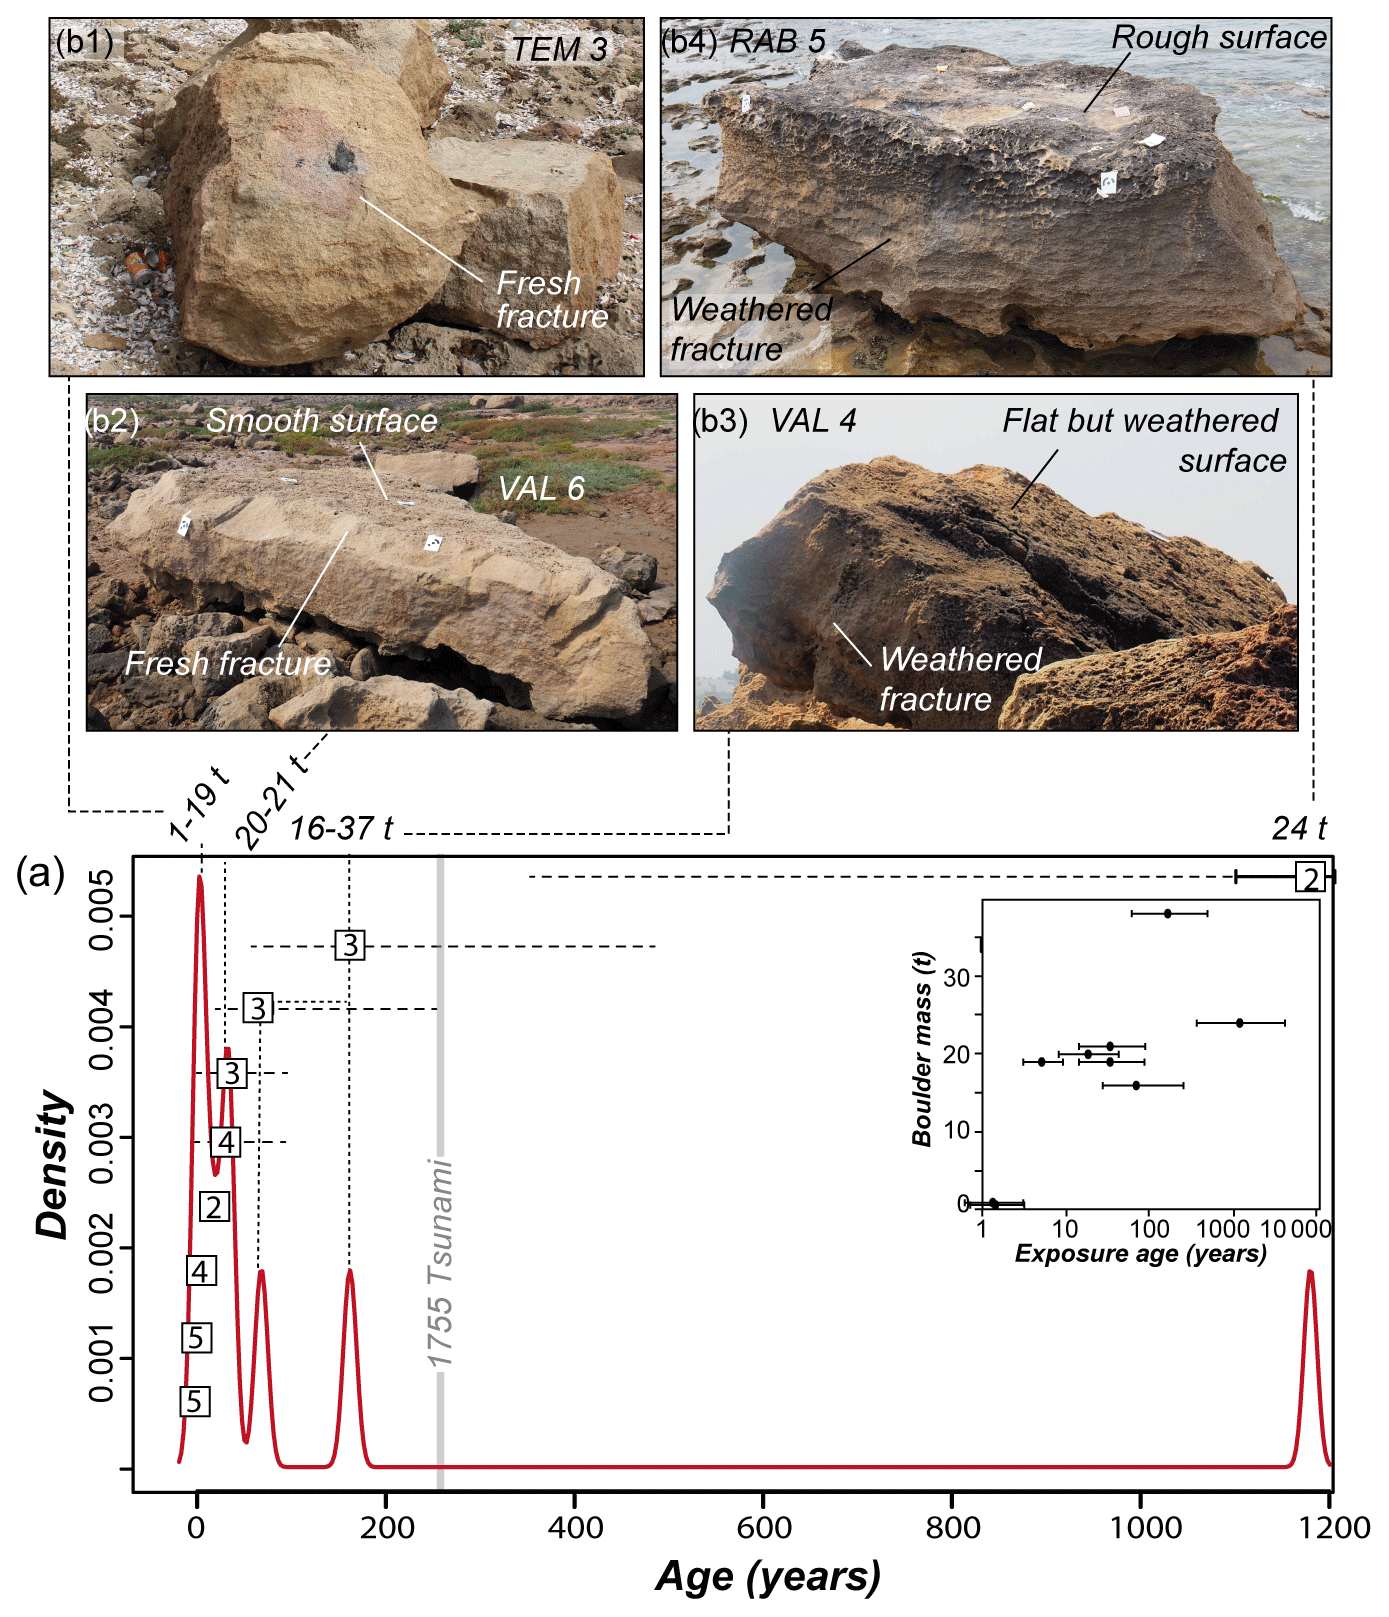
Figure 8Relative chronology of boulder transport. (a) Exposure ages of all boulders that do not clearly underestimate the control ages presented as a kernel density estimate (KDE) plot (dotted error bars with consideration of μ and uncertainties). The numbers in squares refer to the taphonomy classes described in the text and the caption of Table 1. Inset: correlation between boulder mass and OSL rock surface exposure ages. (b) Photographs documenting the taphonomy of boulders with different OSL rock surface exposure ages. Each photograph is correlated with a KDE peak in panel (a) and associated boulder masses by dashed lines.
Although the relative chronology does not unambiguously allow for correlating individual boulders with specific historical storms or tsunamis, two important conclusions with regard to the local flooding hazard can be drawn from the dataset. Firstly, the relative chronology in Fig. 8a implies that most boulders at the Rabat coast were detached from the cliff and overturned by storm waves. The large spread of OSL exposure ages between a few years and several centuries indicates that numerous transport events were responsible for the formation of the dated boulders. Since the 1755 Lisbon tsunami was the only tsunami with significant flooding at the Moroccan Atlantic coast during the last 1000 years (Kaabouben et al., 2009), boulder transport dominated by tsunamis should have resulted in more significant clustering of ages around ∼ 260 years ago.
Secondly, correlation of exposure ages and masses of the associated boulders shows that storm waves were capable of lifting much larger boulders than observed during recent winter storms. At the Rabat coast, observations from the last decade are restricted to the lifting of smaller boulders (Mhammdi et al., 2020), while boulders larger than ∼ 5 t were only observed to move by sliding (Fig. A3). However, boulders with OSL exposure ages that clearly postdate the 1755 Lisbon tsunami and therefore must have been lifted by storms reach up to 21–24 t (VAL 6, RAB 5). These storm boulders yield comparable masses as boulders that, based on their exposure ages, might have been transported and overturned during the 1755 Lisbon tsunami (i.e. VAL 4 and RAB 1 with masses of 16–37 t). Of course, we cannot exclude that the largest boulders at the Rabat coast, such as VAL 1 with ∼ 65 t that could not be dated with OSL-RSED due to strong erosion of its post-transport surface in the intertidal zone, can exclusively be overturned by tsunamis. Nevertheless, in agreement with hydrodynamic experiments (Cox et al., 2019), observations after recent tropical cyclones or winter storms (e.g. May et al., 2015; Cox et al., 2018) and other boulder studies from the North Atlantic (e.g. Oliveira et al., 2020), our results support the perception that storm waves significantly contribute to boulder quarrying along cliffs and may be considered the most important driver for the evolution of wave-emplaced coarse-clast deposits in storm-prone areas worldwide. This includes boulders with masses of several tens of tons that occasionally have been associated with tsunamis previously. It is therefore likely that also most other boulders documented along the Atlantic coasts of Morocco and the Iberian Peninsula, for some of which the 1755 Lisbon tsunami and potential predecessors have tentatively been discussed as an alternative explanation to storm waves (Whelan and Kelletat, 2005; Scheffers and Kelletat, 2005; Mhammdi et al., 2008; Medina et al., 2011), in fact represent storm boulders. Interpretation of tsunami boulders at the storm-prone coast of the North Atlantic should be restricted to the very rare cases, where chronological information is precise enough to relate them to a specific event such as the 1755 Lisbon tsunami (e.g. Costa et al., 2011; Oliveira et al., 2020).
OSL rock surface exposure dating was for the first time tested on coastal boulders overturned during wave transport to evaluate its reliability as a dating approach in this setting. Successful calibration of the bleaching model using surfaces exposed for ∼ 2 years and evaluation of OSL exposure ages based on satellite images indicate the potential of the approach for boulders with limited post-depositional erosion and with surface inclination in agreement with that of the calibration samples. Although fitting uncertainties as a consequence of low amounts of quartz and potassium feldspar in the source rock introduced relatively large dating uncertainties, and although a bias due to post-depositional erosion cannot be excluded even for boulders with smooth surfaces, OSL rock surface exposure dating provides a relative chronology for boulders that could not be dated with any other approach so far. This relative chronology indicates a large variability of boulder ages, most of them different from the only tsunami event at the Rabat coast within the last 2000 years. Thus, OSL exposure ages suggest that even boulders weighing > 24 t were moved and overturned by storm waves. This supports the conclusion of previous studies that storms rather than tsunamis are the most important driver for the formation of coastal boulder deposits in general.
While OSL-RSED offered important relative chronological information for the Rabat coastal boulders but could not provide robust ages, the approach may be a powerful tool for dating boulder deposits with more favourable lithologies. Magmatic rocks, such as granites, are not only significantly less susceptible to erosion, typically they also allow measurement of the luminescence signal of potassium feldspar. Different from the quartz signals of the calcarenite used in this study, IRSL signals of potassium feldspar measured on polymineralic aliquots do not suffer from contamination by other minerals and are typically much brighter than those of quartz. Such lithological properties promise to reduce the uncertainties and inaccuracies related to OSL surface exposure dating of coastal boulders in this study significantly. While OSL-RSED will not be able to date boulder sites with pure limestone lithologies, our results demonstrate its potential for providing unique chronological information for non-carbonate boulders that today cannot be dated by any other technique.
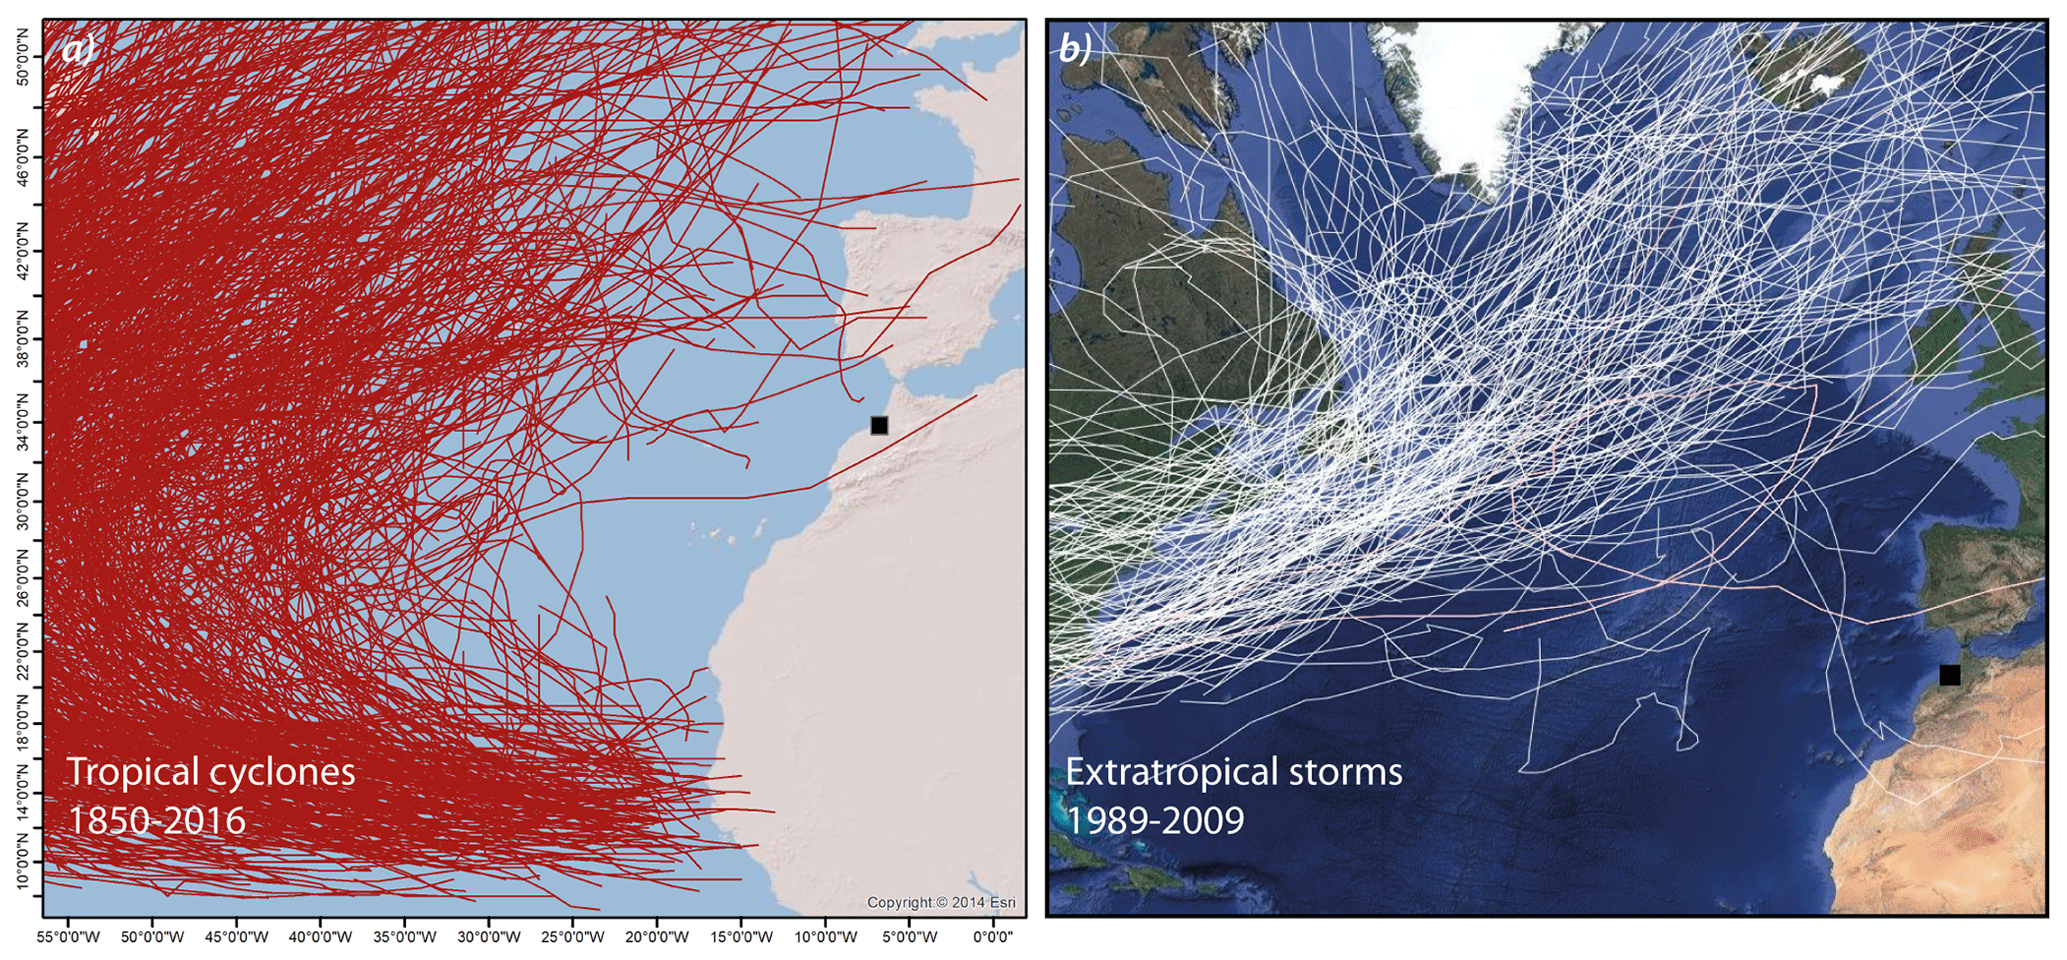
Figure A1Storm hazard at the Rabat coast. (a) Tracks of historical (1850–2016) tropical storms in the North Atlantic (NOAA, 2019); even aged tropical cyclones (tropical depressions) rarely strike the coastlines of the eastern Atlantic as far south as Spain or Morocco. (b) Tracks of the 200 strongest extratropical storms in the North Atlantic (1989–2009) (Atlas of Extratropical Storms, University of Reading, 2019); most winter storms cross northern Europe; storm tracks as far south as Spain or Morocco are very rare.
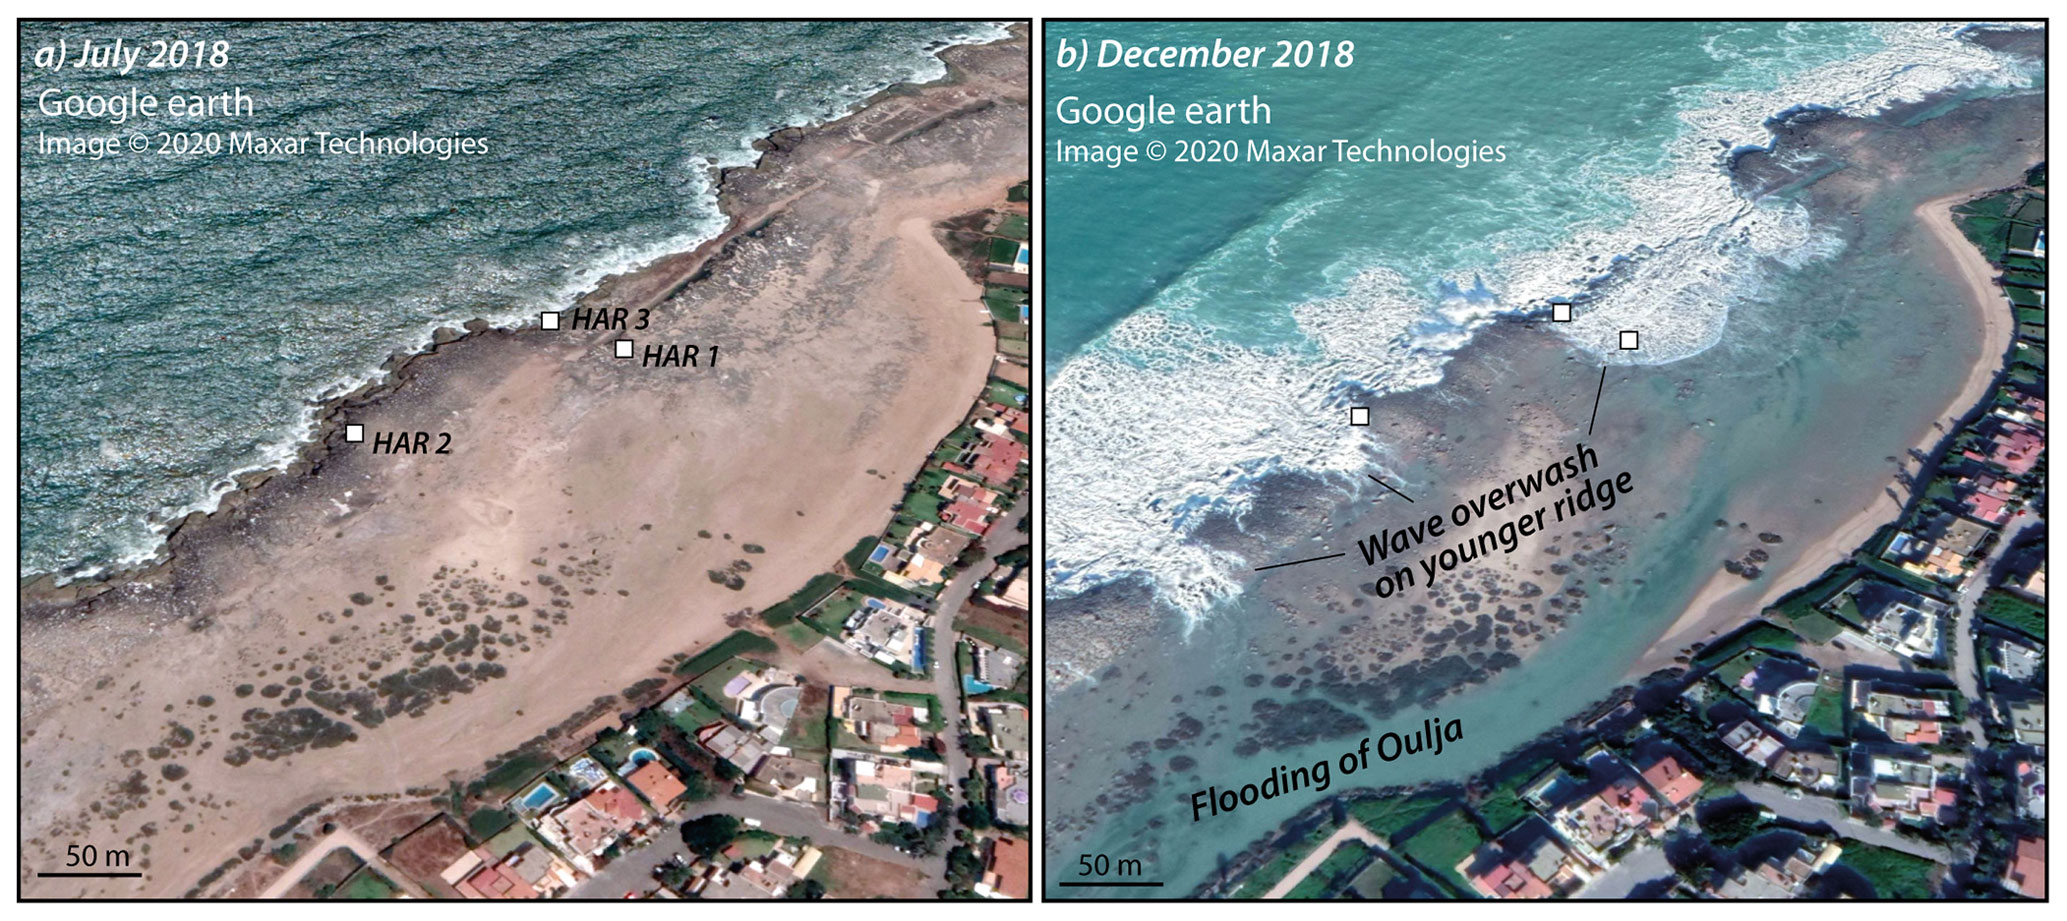
Figure A2Storm waves and coastal flooding at Harhoura. (a) During normal wave conditions, all sampled boulders are located above tide level. (b) Flooding of the Oulja and local wave overwash reaching up to 50 m landward of the shoreline during a winter storm in December 2018. Both scenes are based on © Google Earth images.
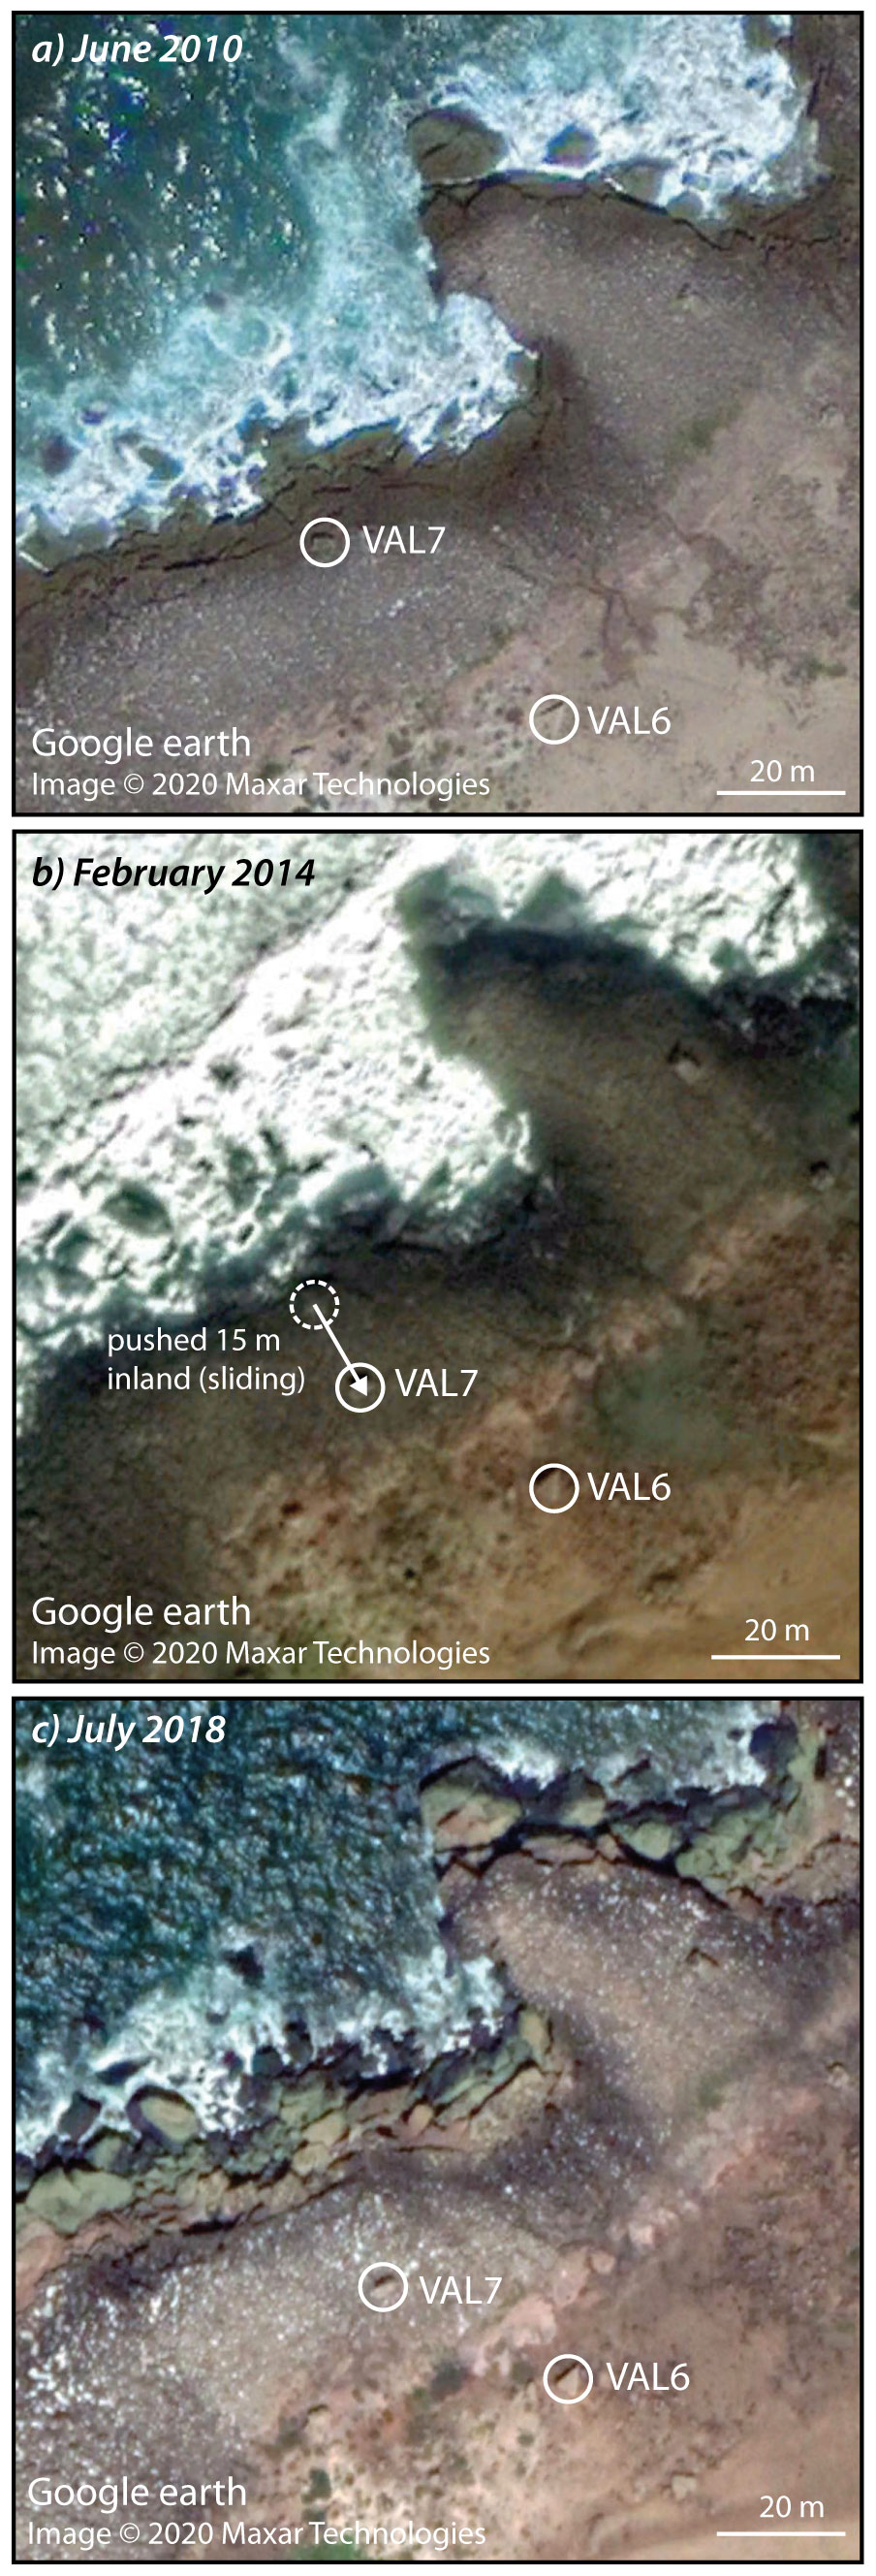
Figure A3Storm transport of boulders recorded on satellite images (Google Earth). (a) Positions of boulders VAL 6 and 7 in June 2010. (b) Positions of the same boulders in February 2014. While VAL 6 remains stable, pushed by storm waves VAL 7 has moved for about 15 m perpendicular to the shoreline. (c) After relocation in February 2014, both boulders remained in stable positions until July 2018. All scenes are based on © Google Earth images.

Figure A4Boulder TEM 3 (a) was transported to its onshore location during winter storm Hercules/Christina in February 2014 as reported by local residents. Niche TEM 4 was formed between the field surveys in July 2016 and September 2018, most likely by a winter storm in 2017.
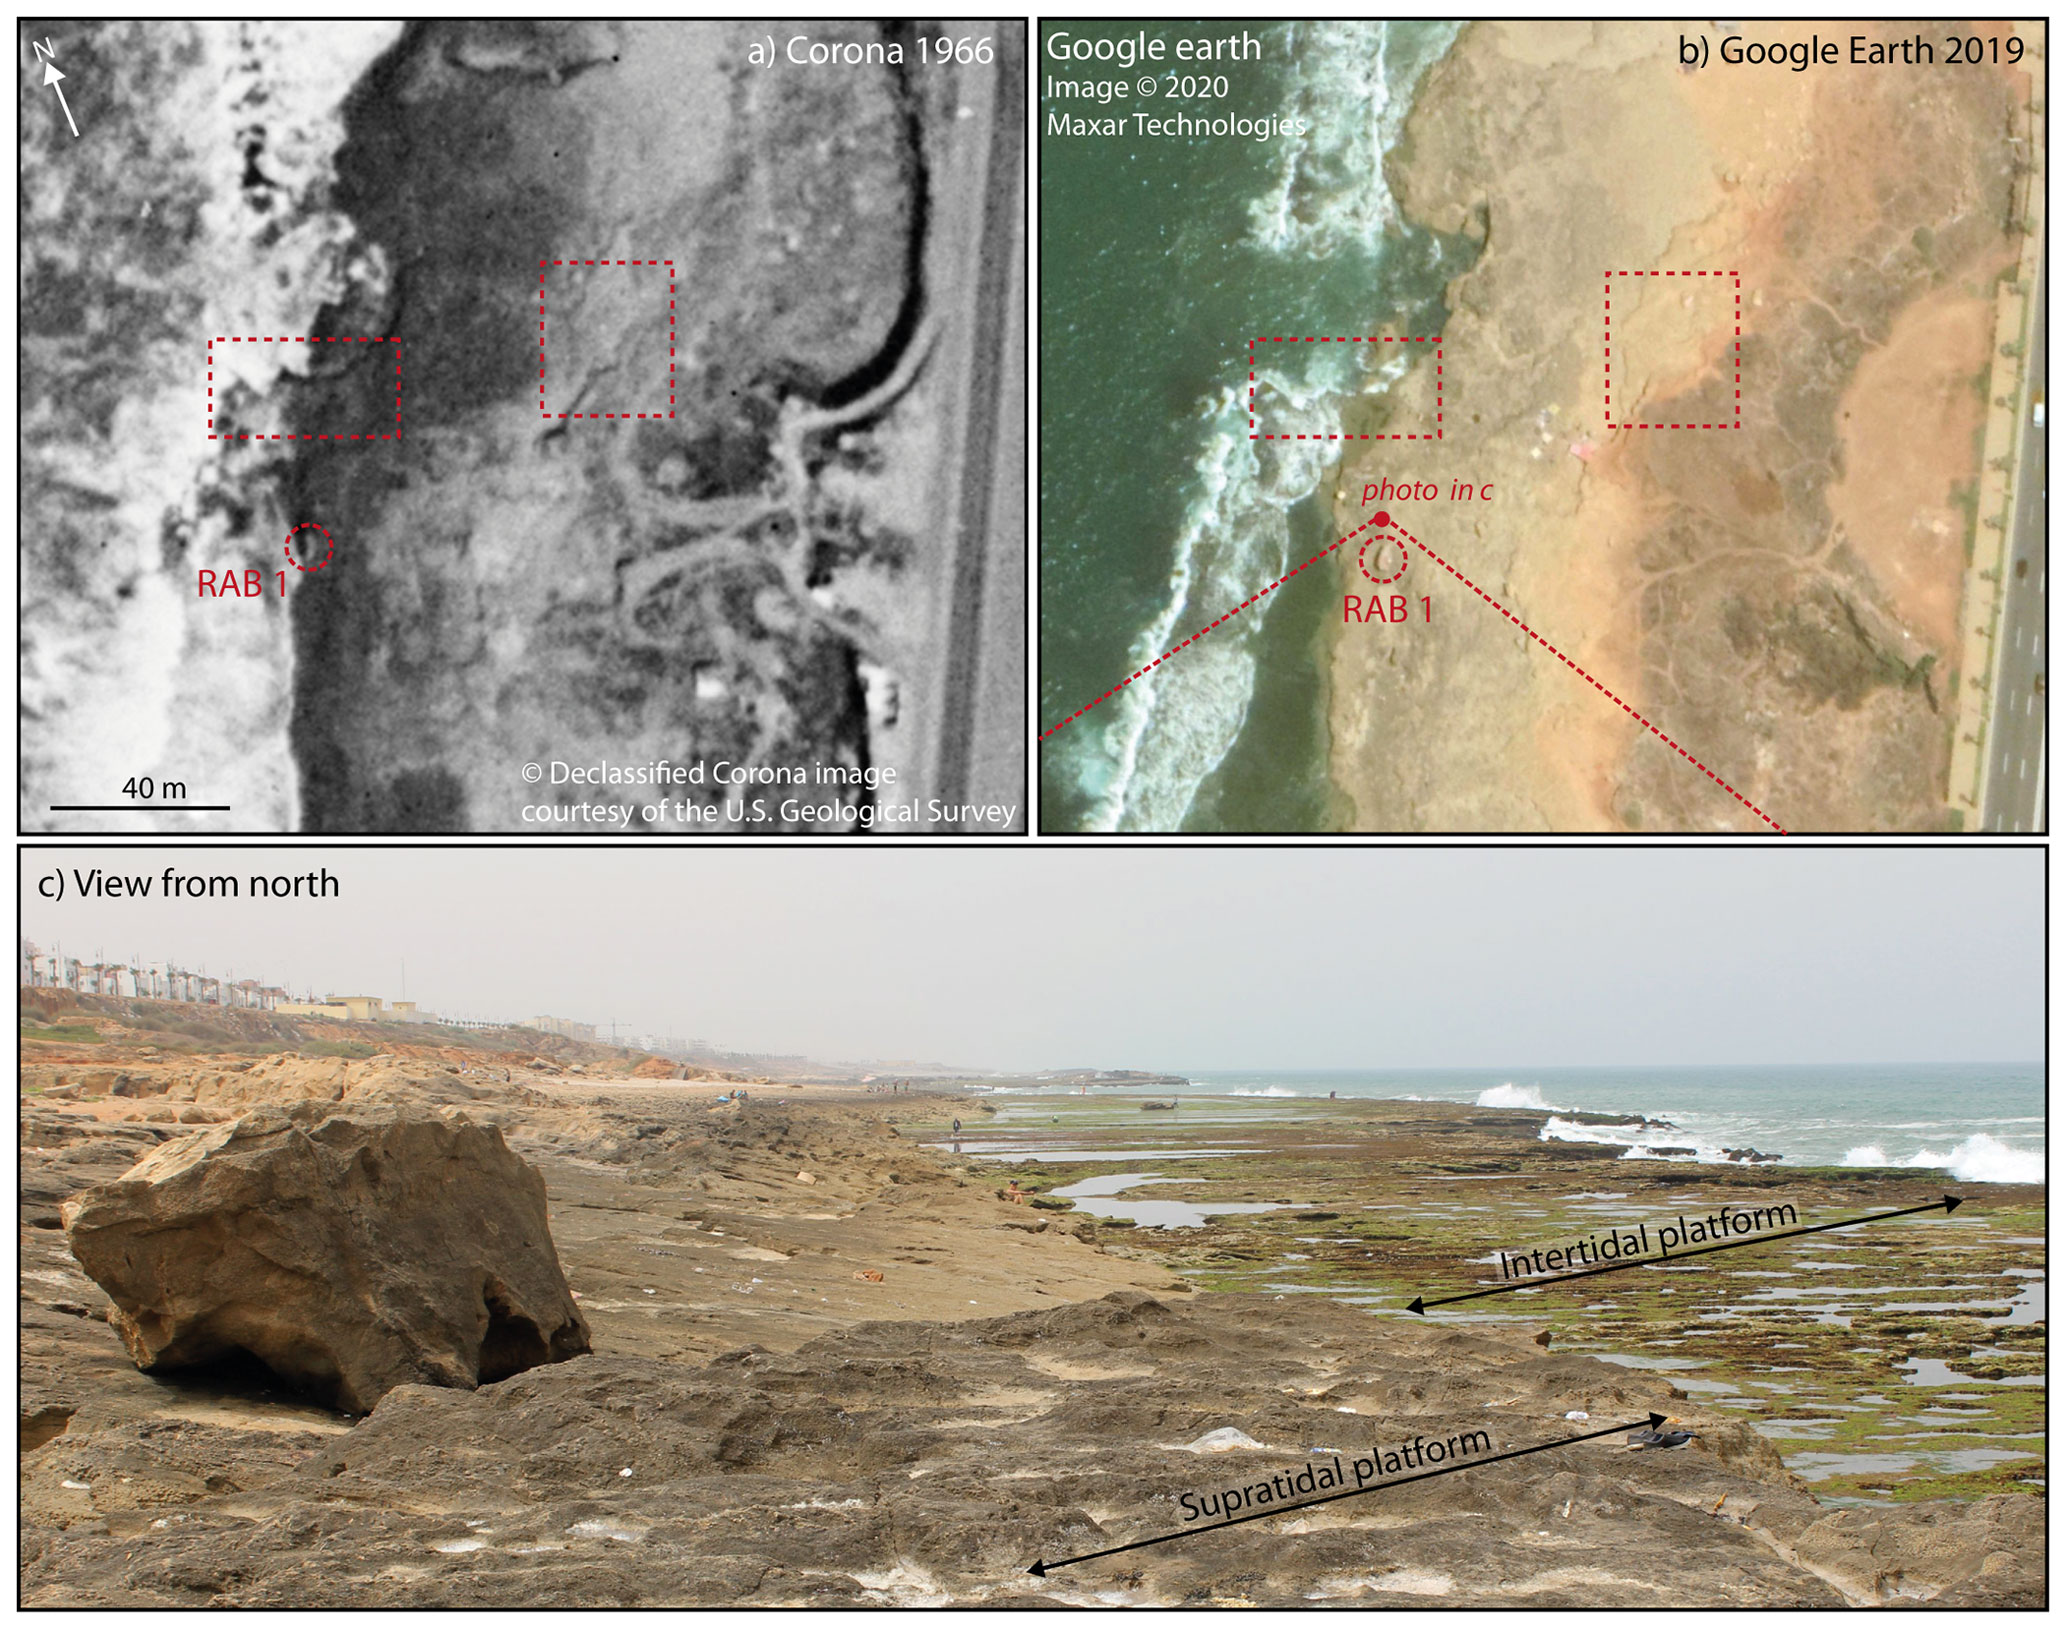
Figure A5Boulder RAB 1. (a) RAB 1 (red circle) can be located on the 1966 Corona satellite image. Compared to its present position on the © 2019 Google Earth image (b), it might have been pushed a few metres landward but there is no indication of overturning (red rectangles mark features clearly identified on both images for better orientation). (c) View towards south with boulder RAB 1 lying on the slope of the supratidal platform (photography July 2016).

Figure A6Boulder RAB 5. (a) RAB 5 (white/red circle) can be located on the 1966 Corona satellite image. It has not changed compared to its present position on the © 2019 Google Earth image (b).
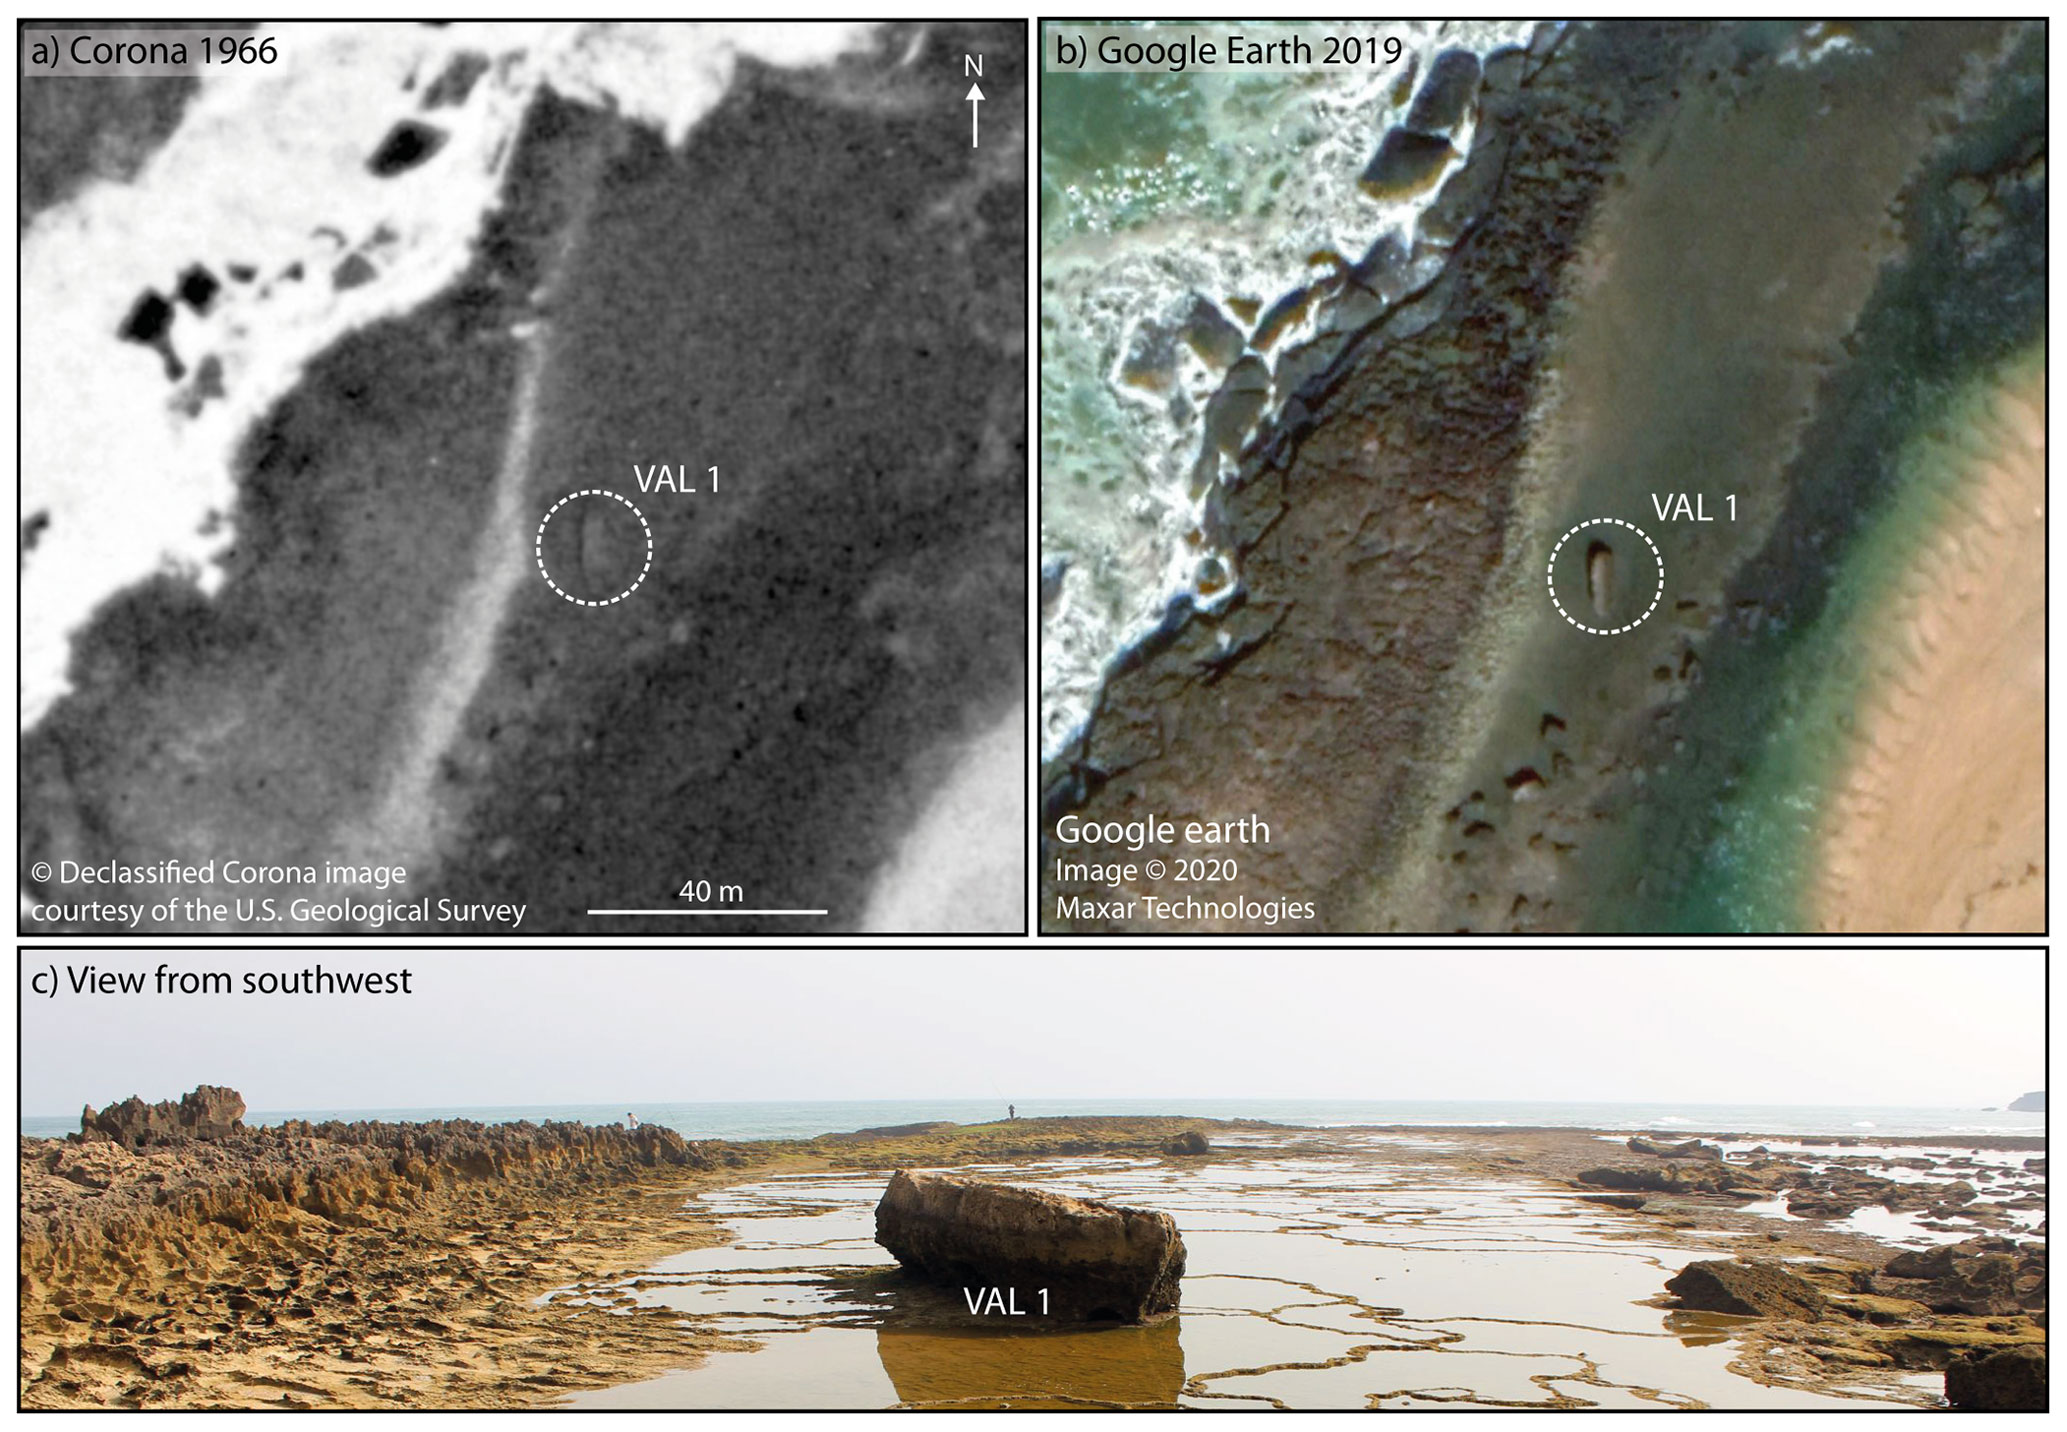
Figure A7Boulder VAL 1. (a) VAL 1 (white circle) can be located on the 1966 Corona satellite image. It has not changed compared to its present position on the © 2019 Google Earth image (b). (c) View towards northeast with boulder VAL 1 lying on the intertidal platform behind the youngest ridge (photography July 2016).
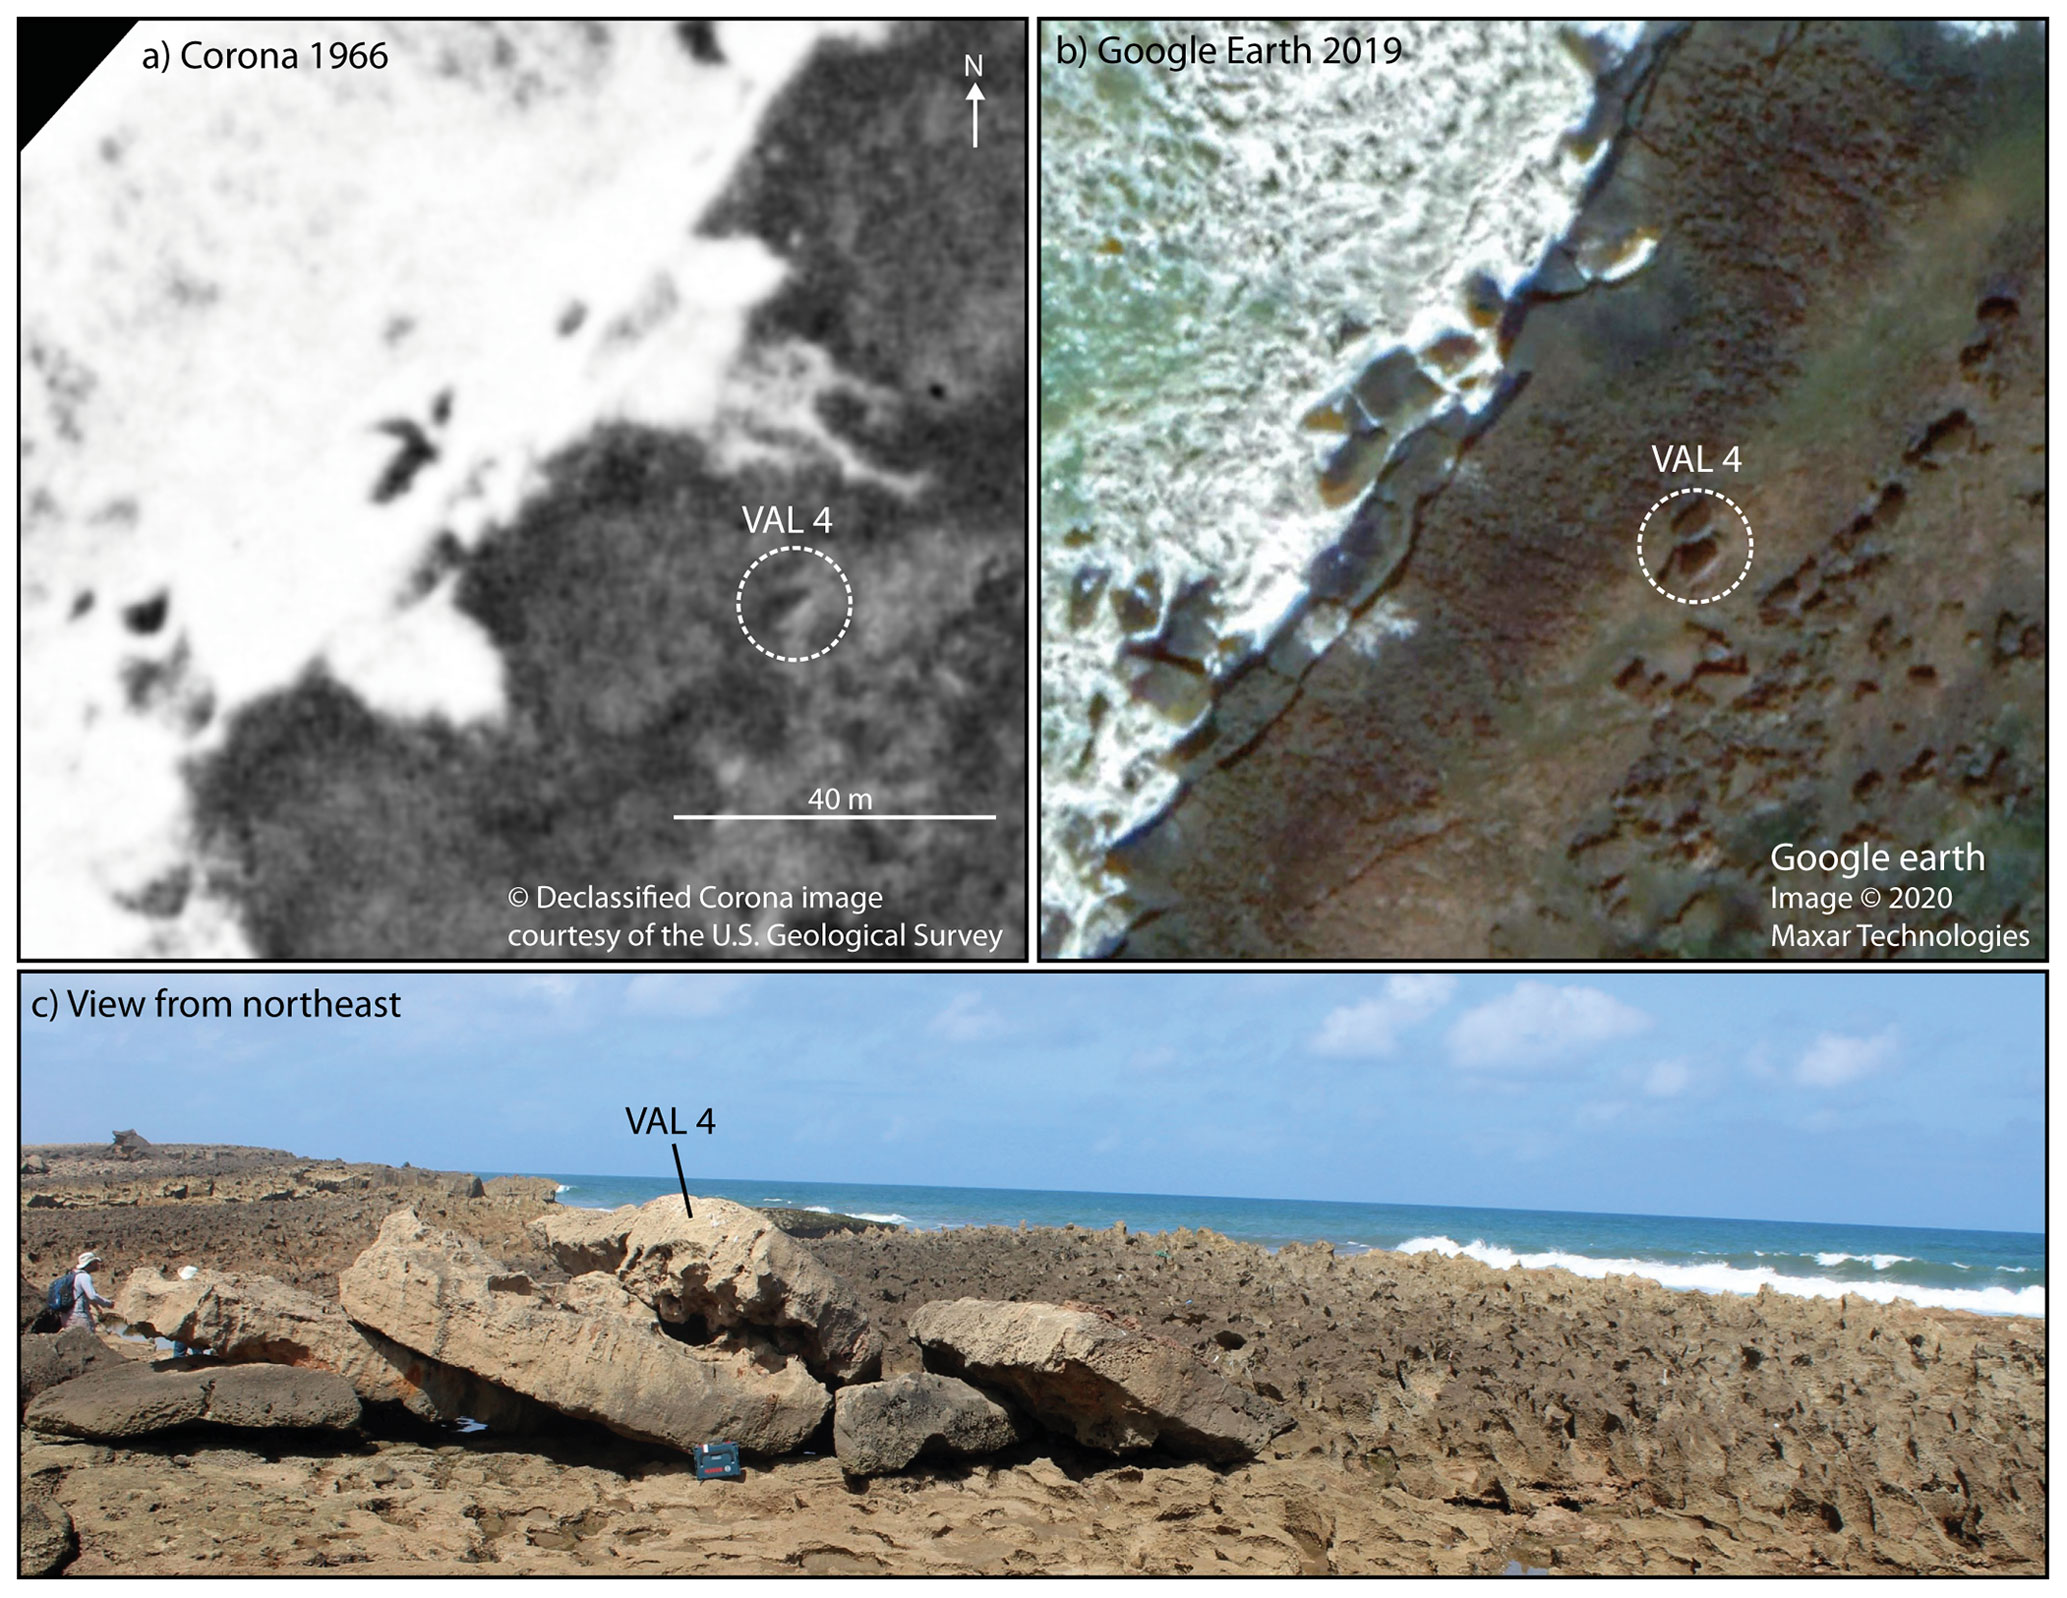
Figure A8Boulder VAL 4. (a) VAL 4 (white circle) can be located on the 1966 Corona satellite image. It has not changed compared to its present position on the © 2019 Google Earth image (b). (c) View towards southwest with boulder VAL 4 lying on the youngest ridge (photography July 2016).

Figure A9Boulders at site HAR. (a) Boulder HAR 2 (white circle) can be located on the 1966 Corona satellite image. It slightly rotated along its a axis but has not changed its position compared to the © 2019 Google Earth image (b). Boulder HAR 1 and niche HAR 3 cannot be identified on the 1966 image; this may be due to poor quality of the image or since they were formed afterwards. (c) View towards the north with boulder HAR 1 lying in the depression behind the youngest ridge (photography September 2018).
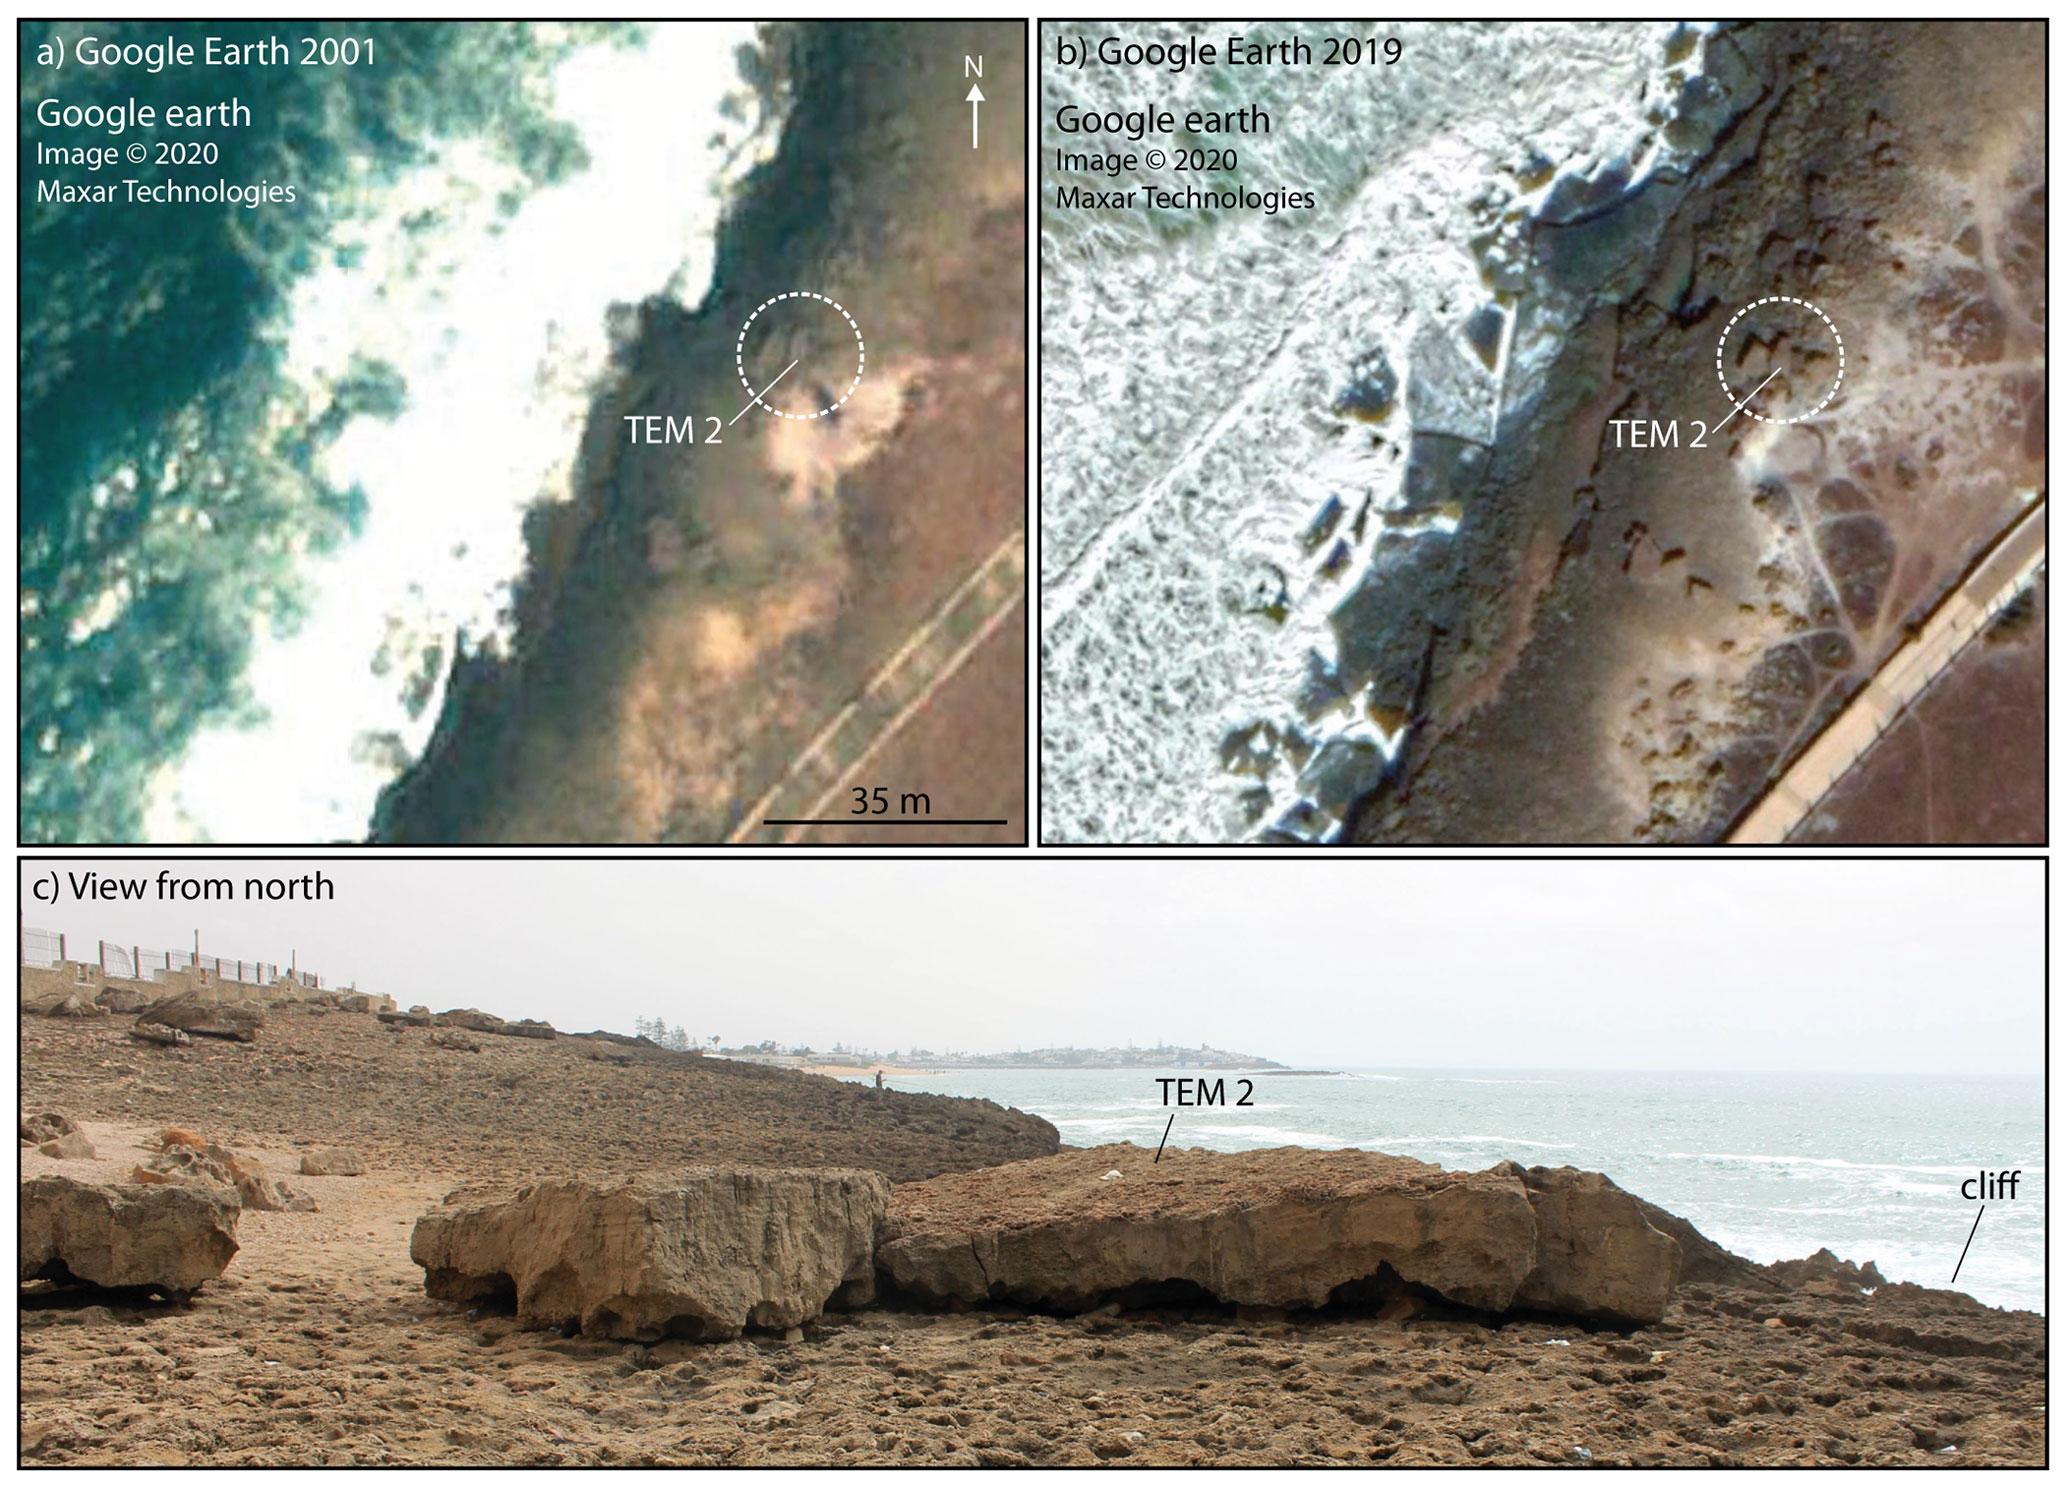
Figure A10Boulder TEM 2 at Temara. (a) Boulder TEM 2 (white circle) can be located on © 2001 Google Earth satellite images. It has not changed compared to its present position on the © 2019 Google Earth image (b). It cannot be identified on the 1966 image; this may be due to poor quality of the image, or since it was deposited afterwards. (c) View towards south with boulder TEM 2 lying on the supratidal cliff-top platform formed by the youngest ridge (photography July 2016).
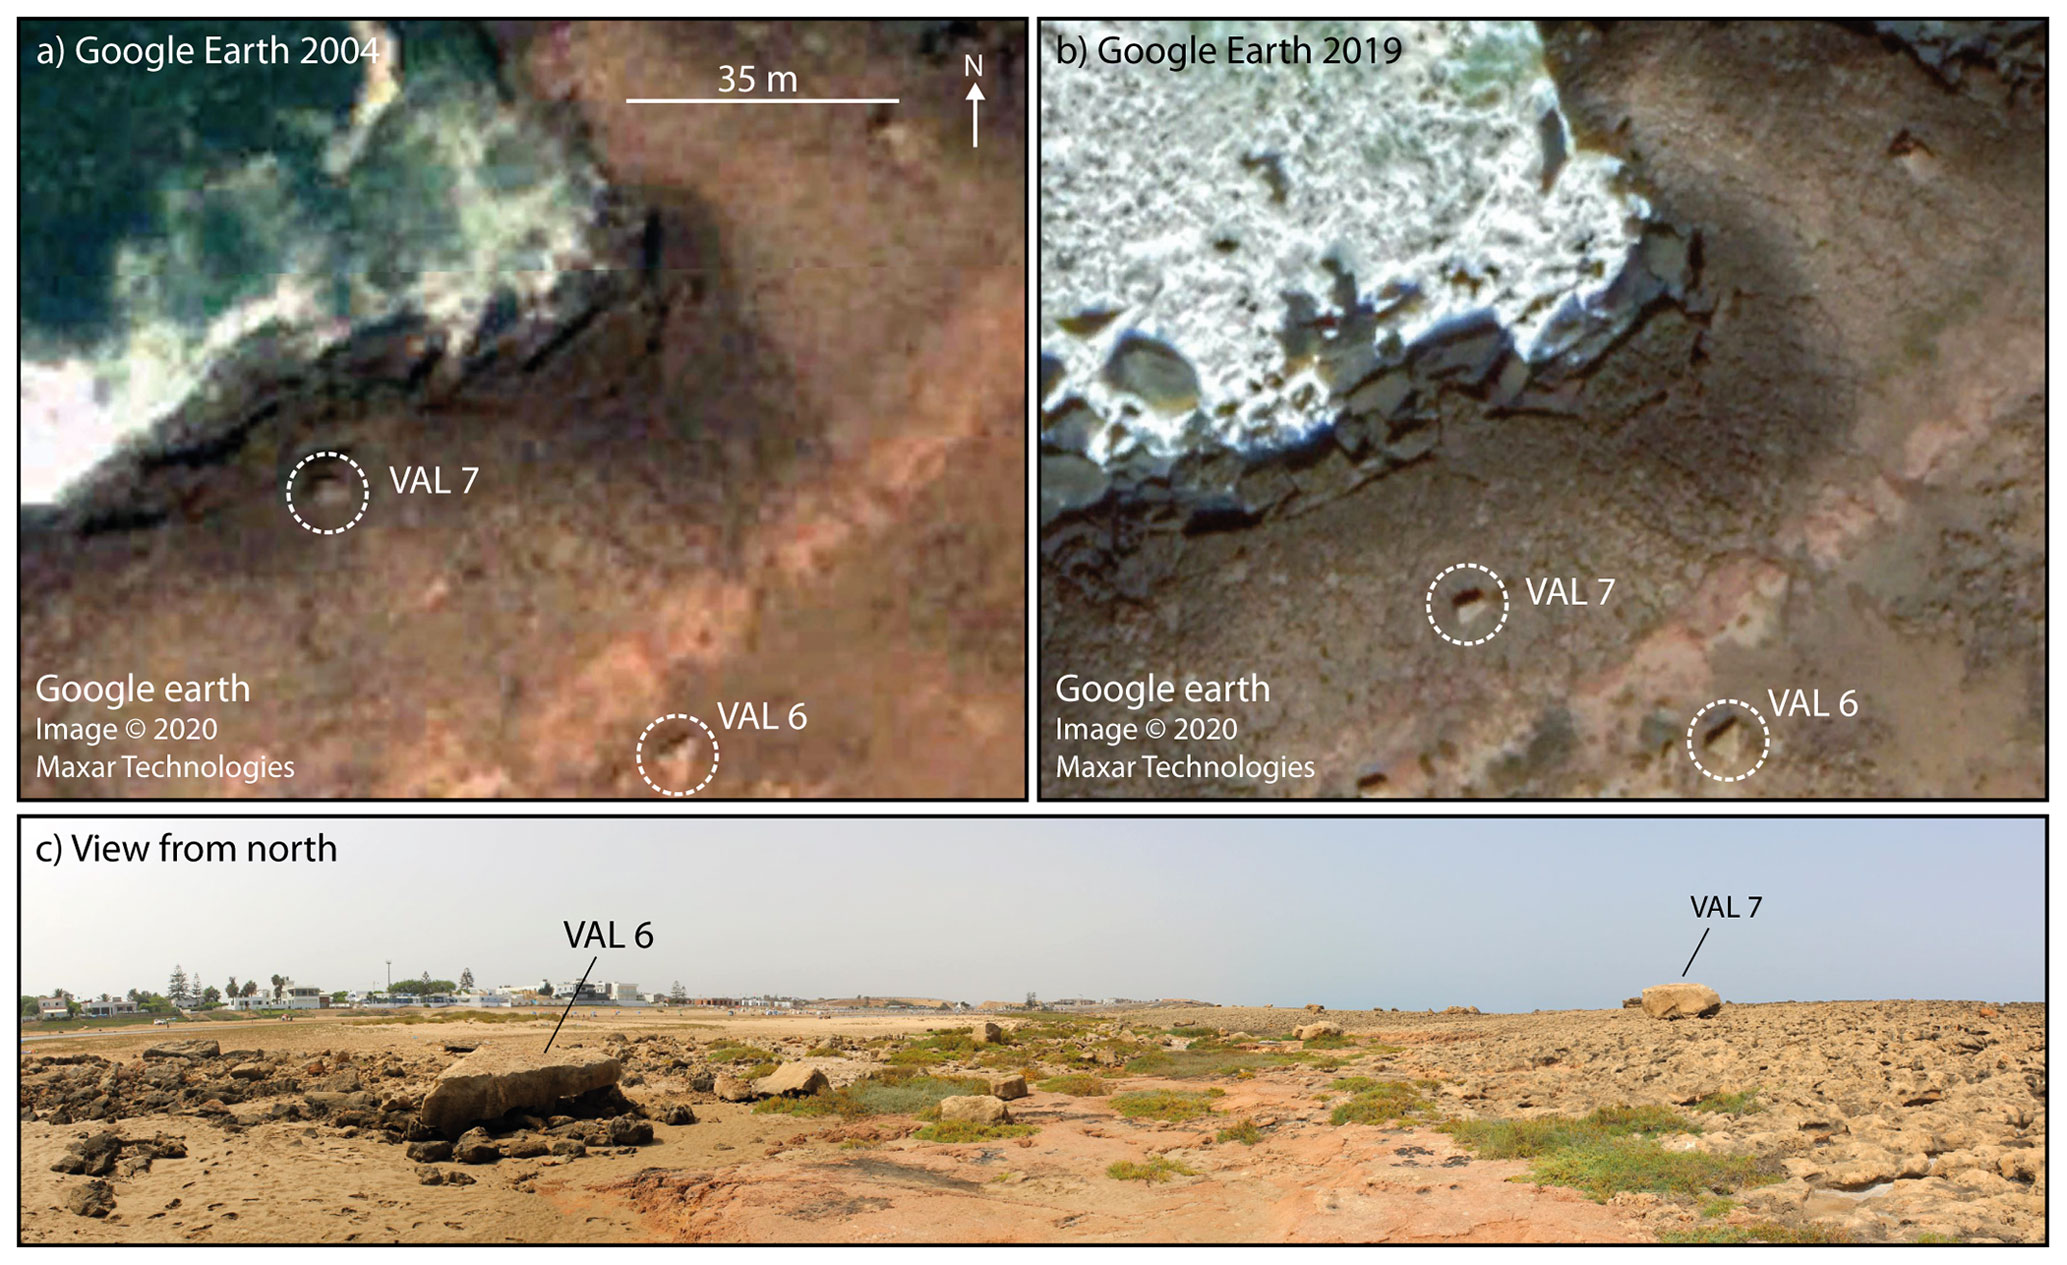
Figure A11Boulder VAL 6. (a) Boulder VAL 6 (white circle) can be located on © 2004 Google Earth satellite images. It has not changed compared to its present position on the © 2019 Google Earth image (b). It cannot be identified on the 1966 Corona image; this may be due to poor quality of the image, or since it was deposited afterwards. (c) View towards south with boulder VAL 6 lying in the depression behind the youngest ridge (photography July 2016).

Figure A12Luminescence signal properties in the dated sandstone. (a) Decay curves of post-IRSL-BSL and IRSL signals of polymineralic aliquots. The post-IRSL-BSL signals are significantly more intensive than the associated IRSL signals (intensities sum up to only 12 %–24 % of those of the associated post-IRSL-BSL signals). Inset: comparison of post-IRSL-BSL and IRSL decay curves of polymineralic aliquots and a pure quartz extract of sample HAR 1-1. (b) Quartz BSL signal components achieved by fitting the BSL decay curve of pure quartz of HAR 1-1. The signal in the selected integration limits is dominated by a stable and easily bleachable fast component (σ= 2.4–2.5 × 10⁻¹⁷; cf. Jain et al., 2003), accounting for 98 % of the analysed net signal. (c) Although less pronounced, post-IRSL-BSL signals of polymineralic samples are still dominated by the fast component (σ= 2.4–2.5 × 10⁻¹⁷, 72 % of net signal). (d) Comparison of IRSL and post-IRSL-BSL signals measured on potassium feldspar extracts of HAR 1-1. The counts of the background-corrected post-IRSL-BSL signal equal ∼ 60 % of the background-corrected IRSL signal. This indicates that post-IRSL-BSL signals on our polymineralic aliquots are relatively unaffected by a feldspar signal contribution: IRSL signals amount to 12 %–24 % of the post-IRSL-BSL signals in polymineralic aliquots; 60 % of this IRSL emission still contributes to the post-IRSL-BSL signals, which equals 7.5 %–15 % of the net post-IRSL-BSL signal in polymineralic aliquots.
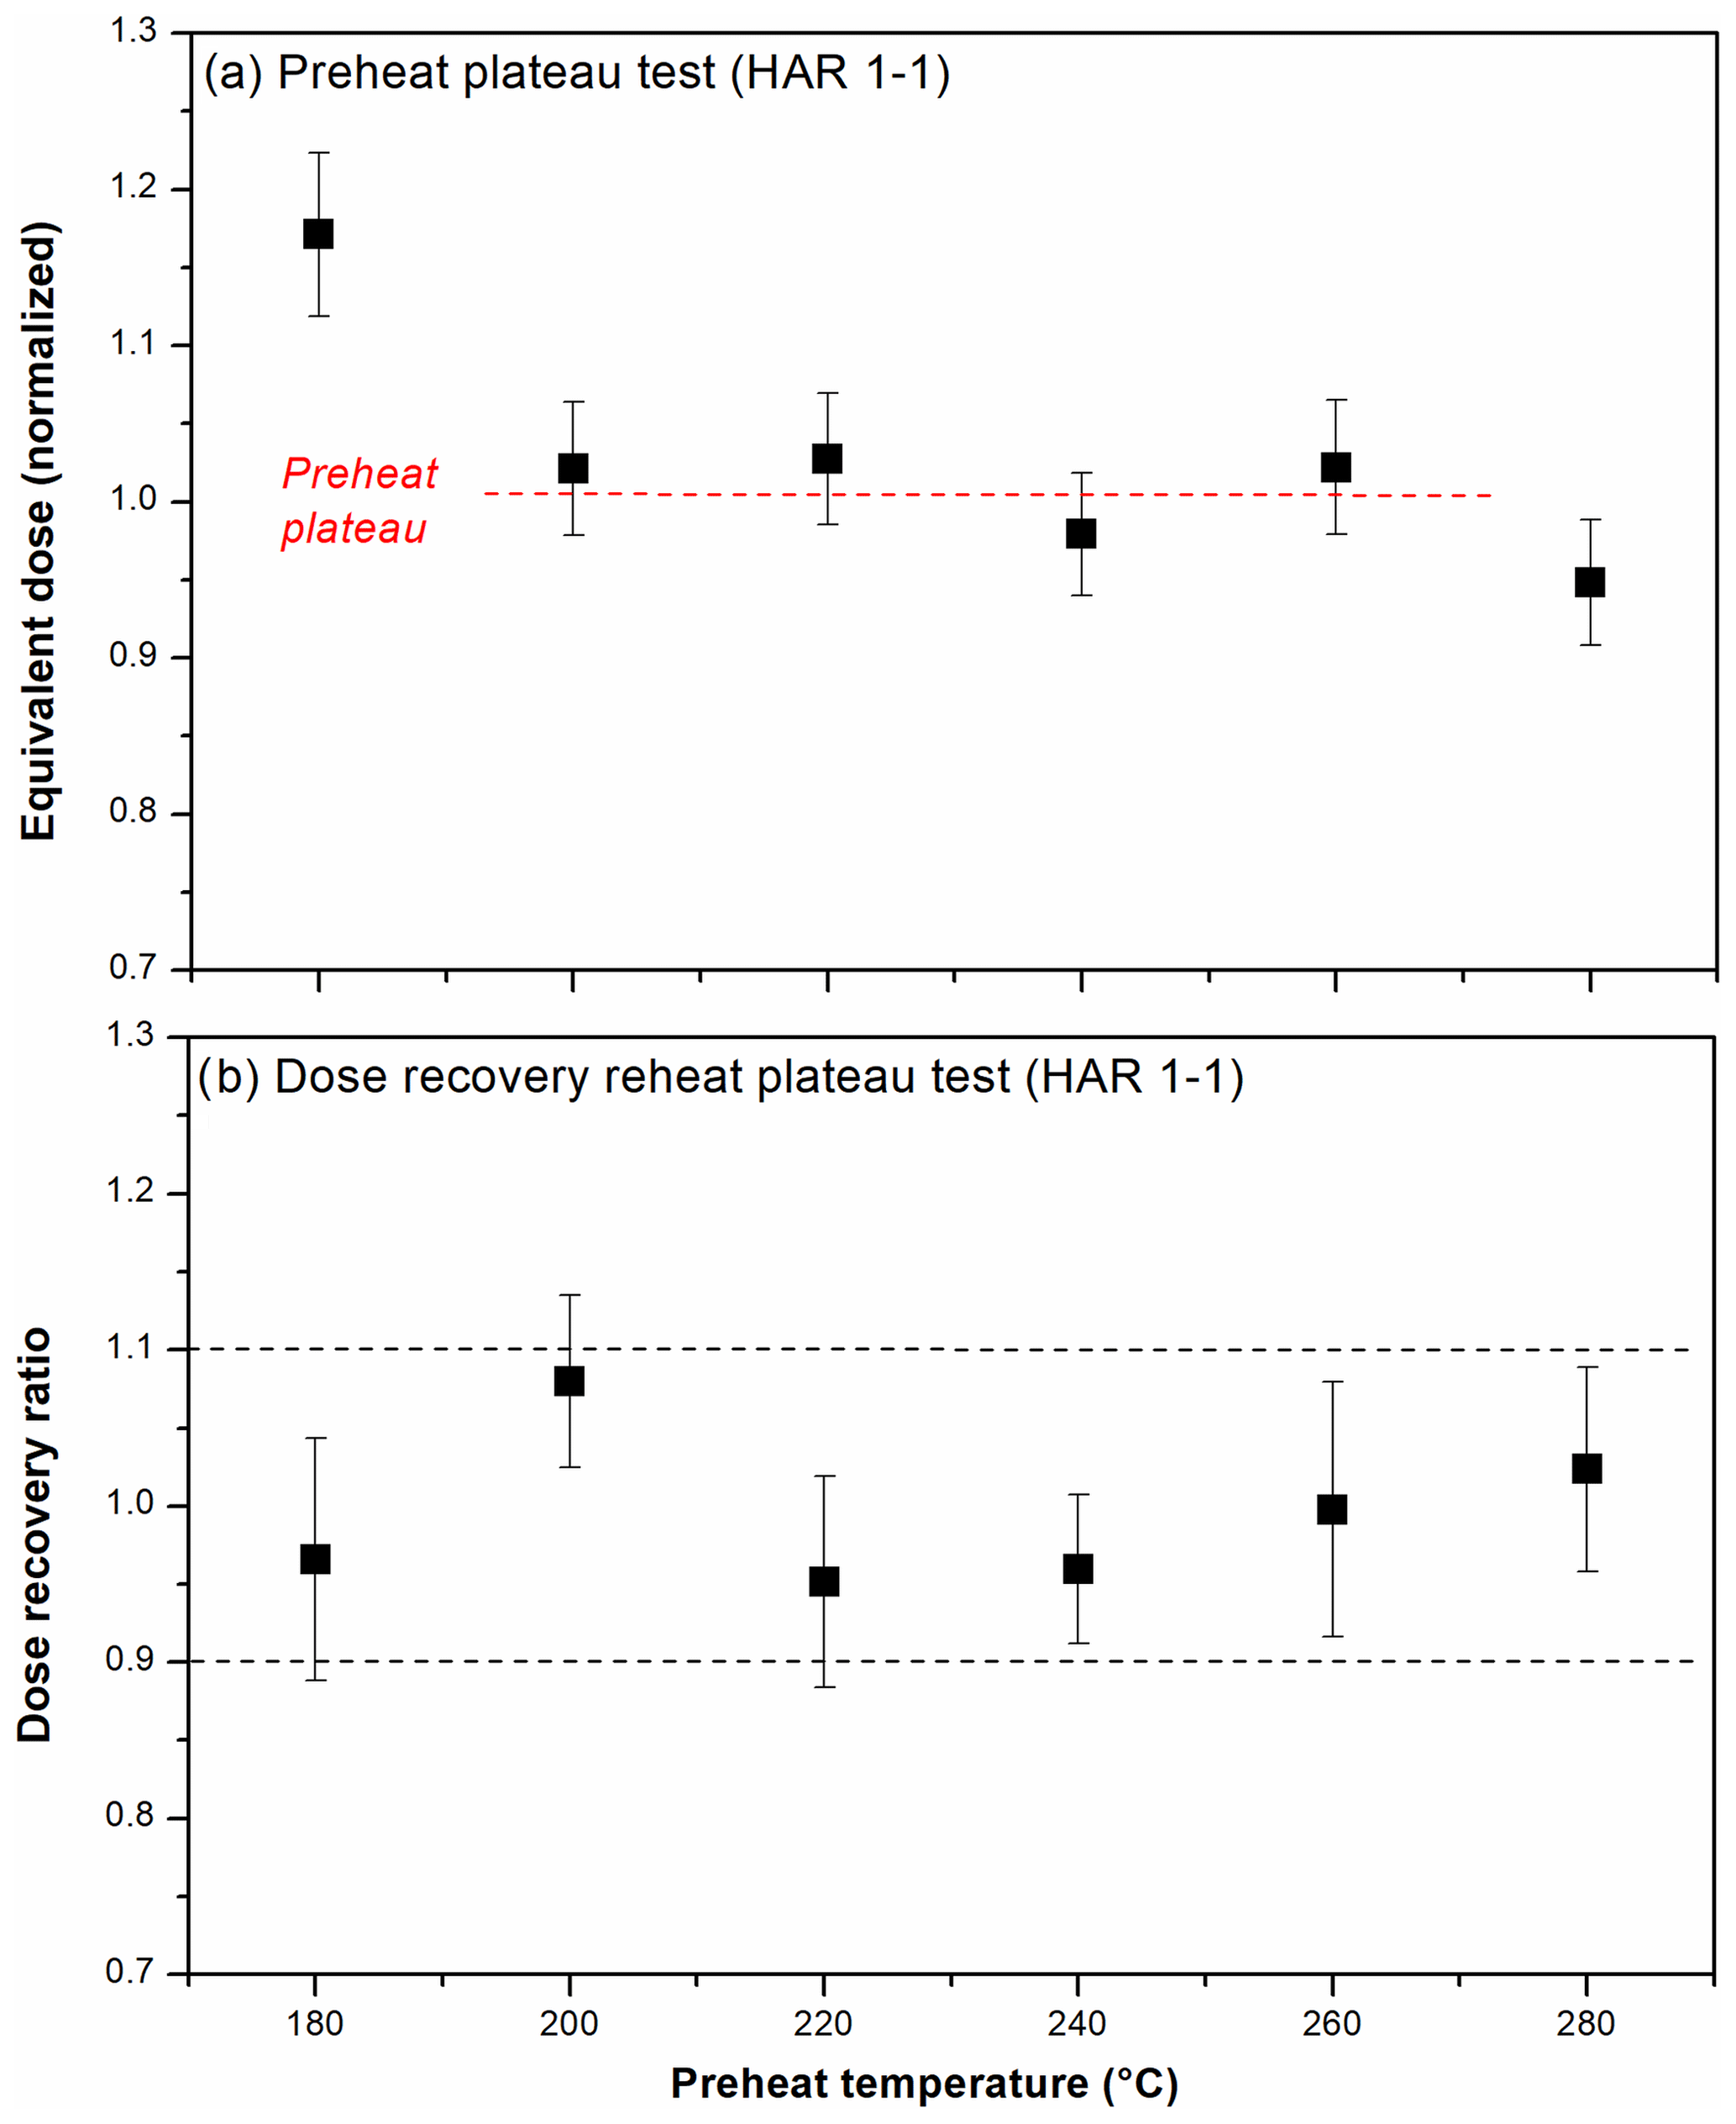
Figure A13Preheat plateau test (a) and dose recovery preheat plateau test with laboratory doses of ∼ 5 Gy (b) performed on quartz extracts of sample HAR 1-1. Both experiments indicate a preheat plateau for temperatures between 200 and 260 ∘C.
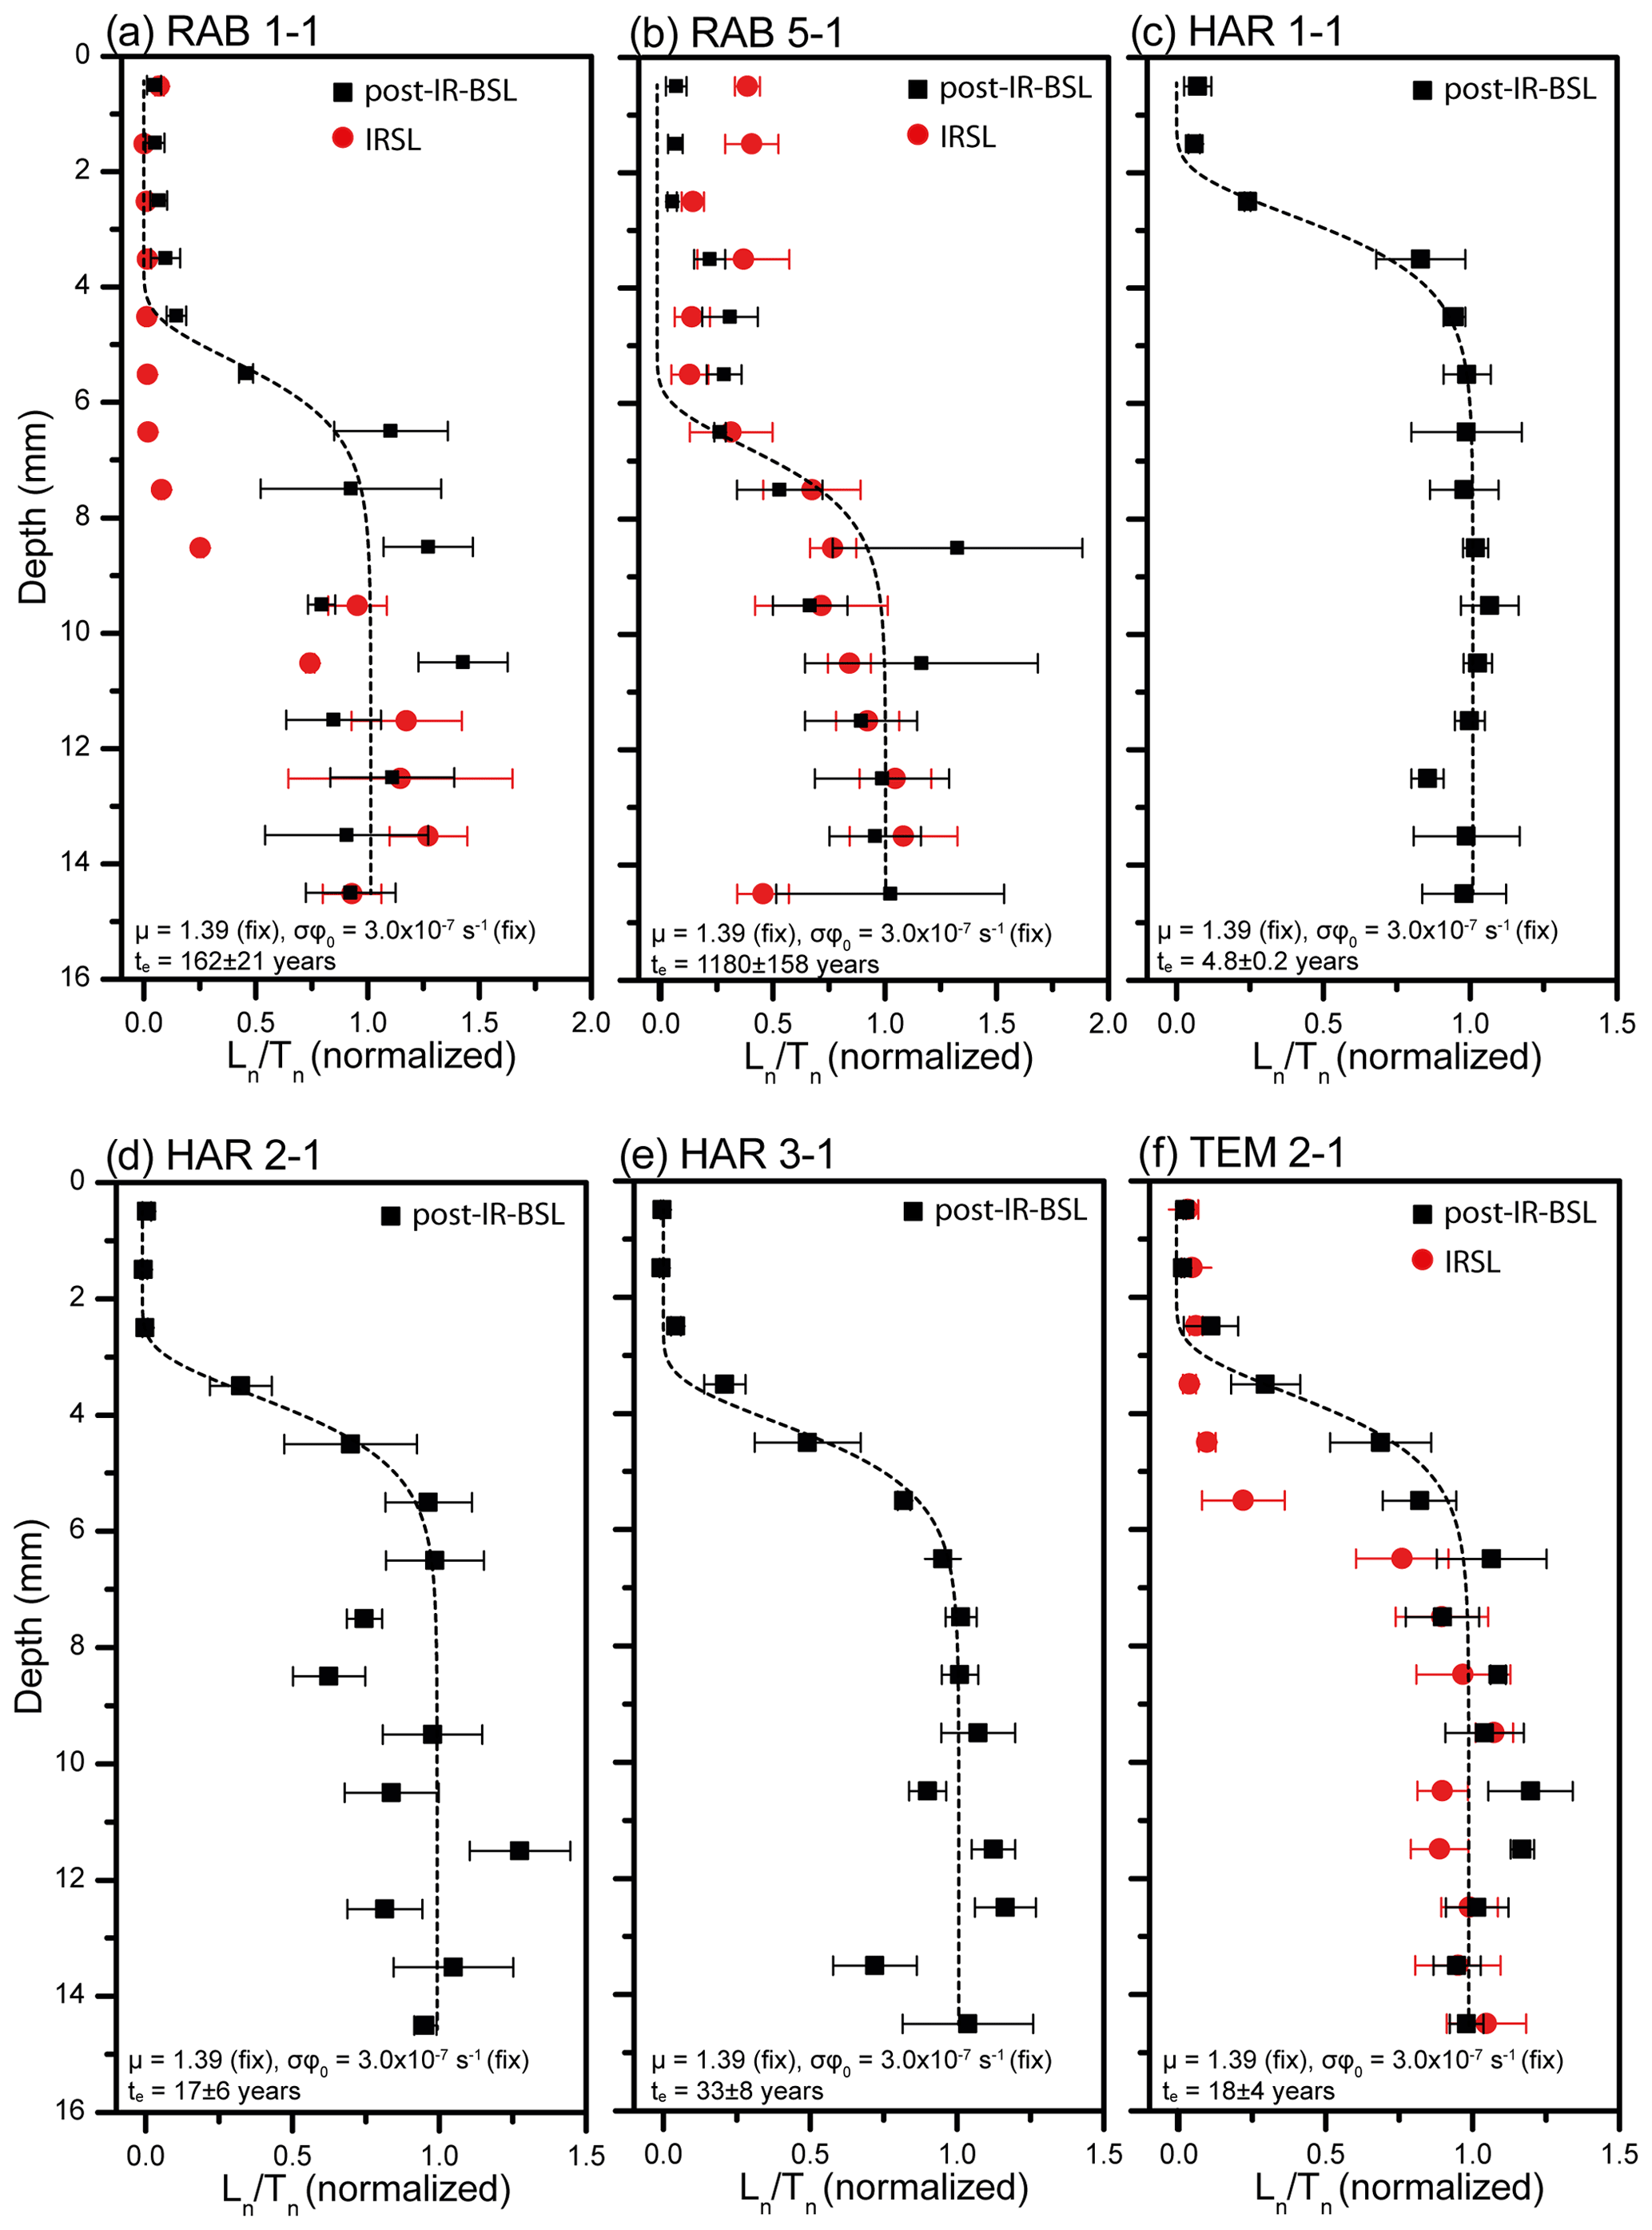
Figure A14Fitted post-IRSL-BSL signal–depth curves for boulder samples RAB 1-1, RAB 5-1, HAR 1-1, HAR 2-1, HAR 3-1 and TEM 2-1. All data points represent mean values plus standard error of three to five cores. For samples with sensitive IRSL signals, these were plotted for comparison.
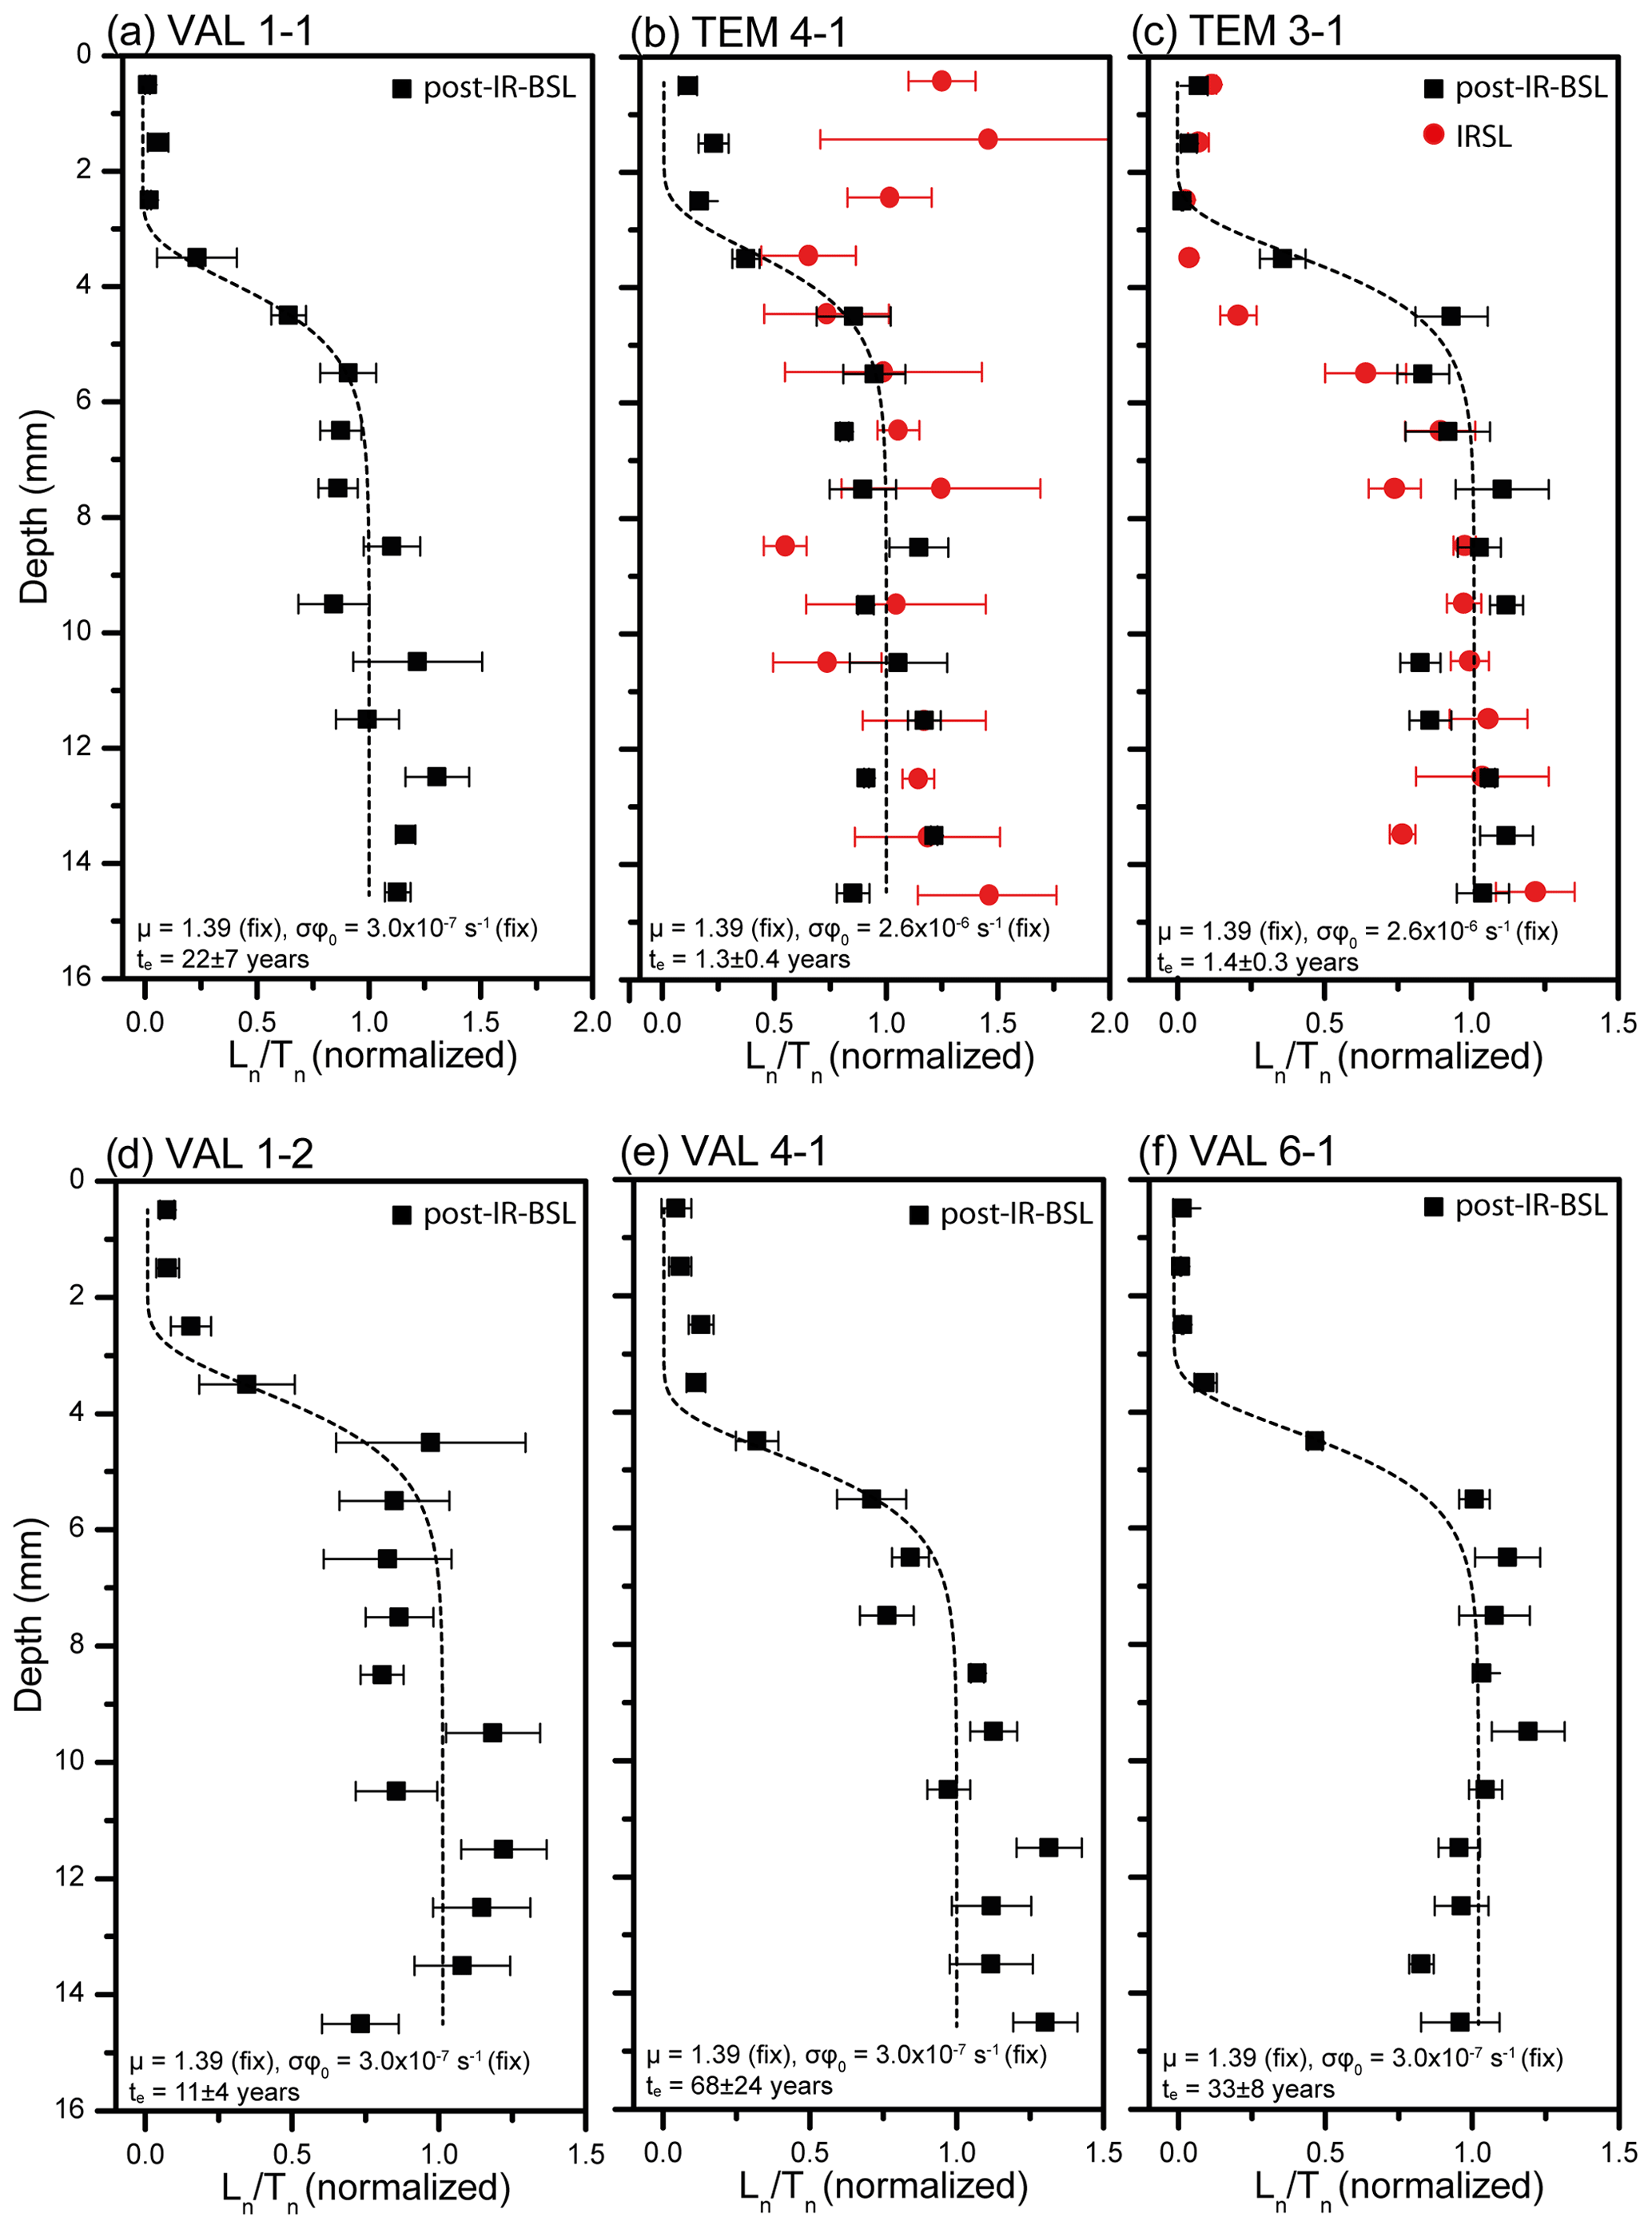
Figure A15Fitted post-IRSL-BSL signal–depth curves for boulder samples TEM 3-1, TEM 4-1, VAL 1-1, VAL 1-2, VAL 4-1 and VAL 6-1. All data points represent mean values plus standard error of three to five cores. For samples with sensitive IRSL signals, these were plotted for comparison.

Figure A16Calibration samples. (a) Rooftop sample VAL 4-1 CAL I. (b) Surface on boulder VAL 4 exposed during first field survey in July 2016 by removing at least 10 cm of rock. (c) Roof of the house used for artificially exposing rock samples; samples VAL 4-1 CAL I and HAR 1-1 CAL were placed on top of the highest roof shown in the photo. (d) Surface of boulder TEM 3 exposed during the first field survey in July 2016; at least 10 cm of rock were removed.

Figure A17Equivalent dose distributions determined on quartz extracts of samples HAR 1-1 and TEM 3-1 (presented as Abanico plots).
Table A1Summary of age control for boulder movement and niche formation in the form of satellite images and own observations: pos. is the position; – indicates no clear evidence. * Minimum age estimate based on the depth of post-depositional rock pools and empirical rates of bio-erosion on the order of 1 mm yr−1 (Kelletat, 2013).
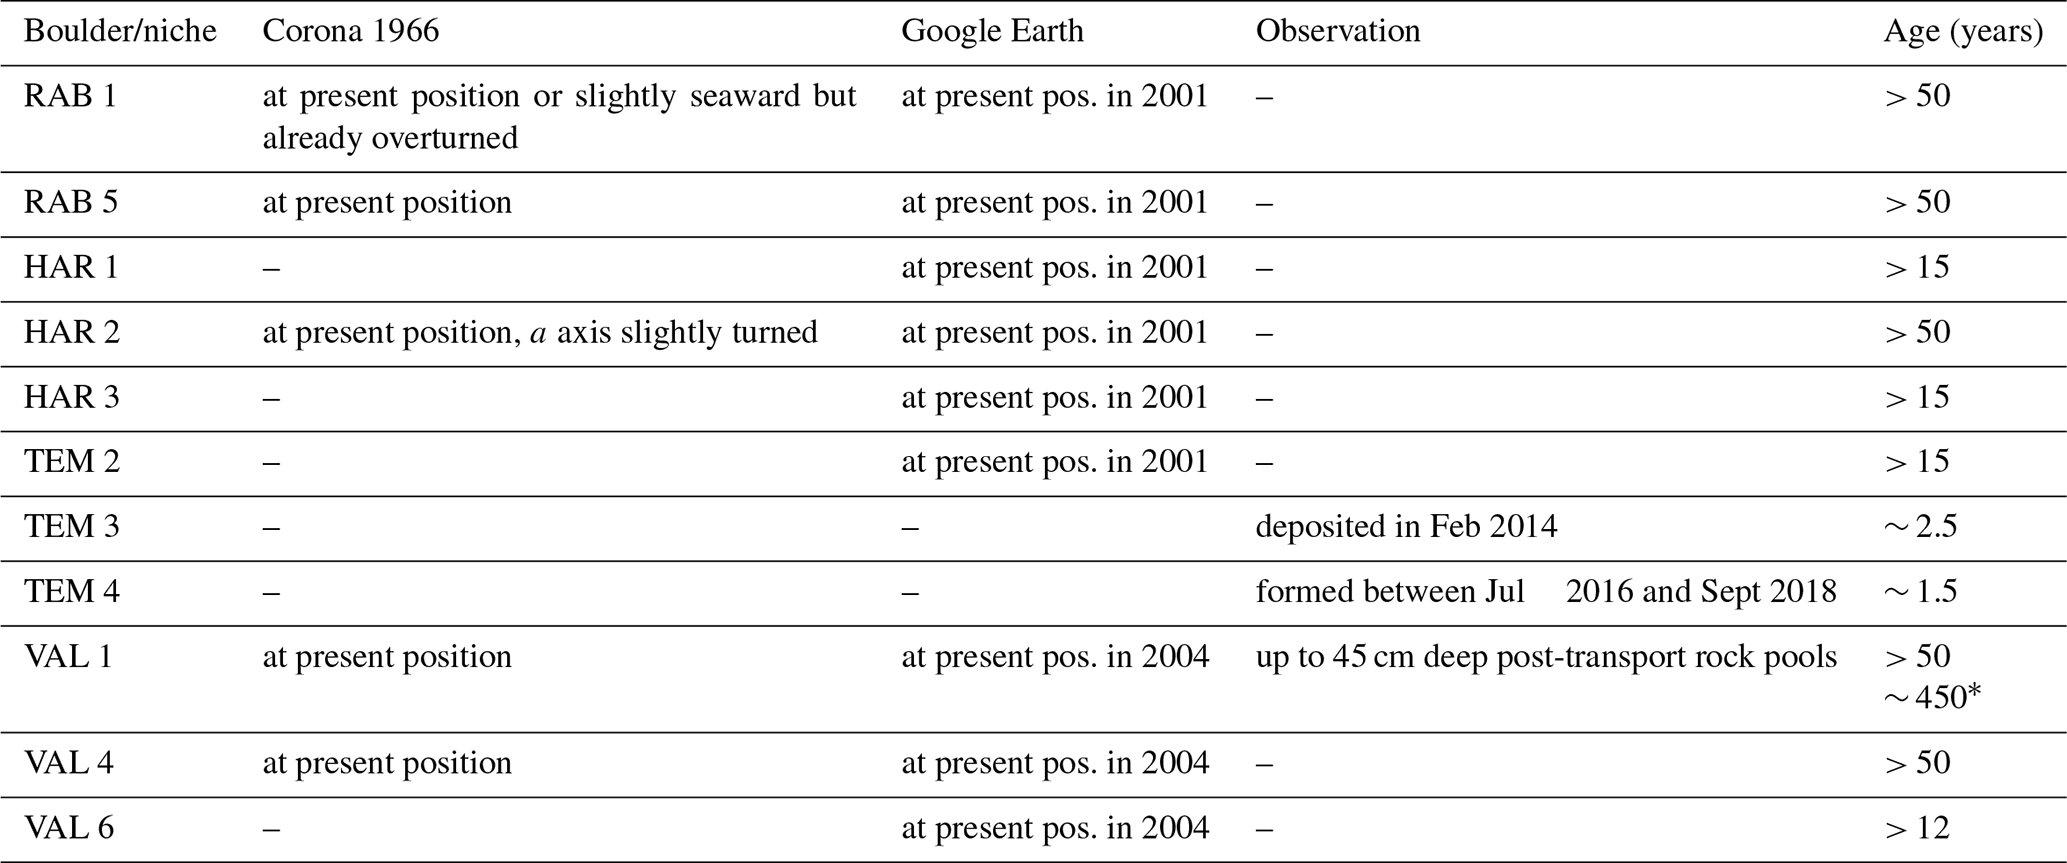
Table A2Double SAR protocol used for measurement of data from polymineralic aliquots of crushed slices.

Table A3SAR protocol used for equivalent dose measurement of quartz extracts.
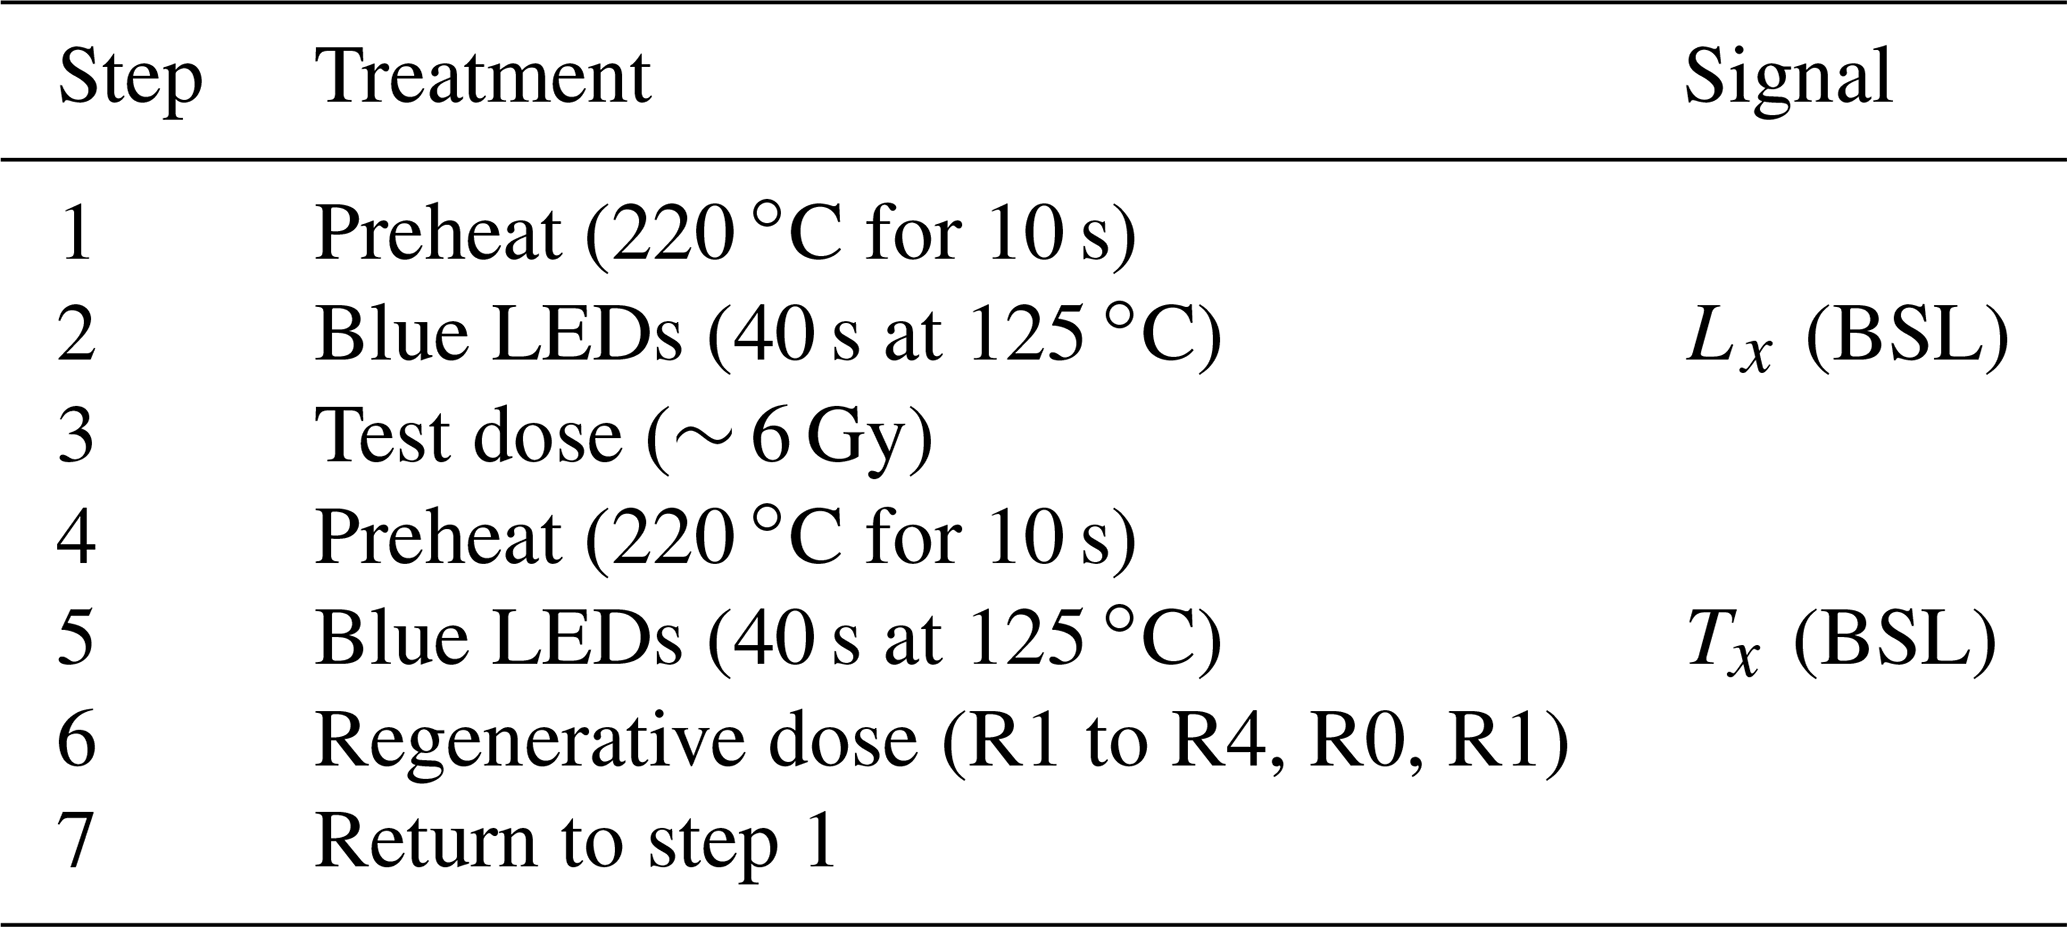
Table A4Dose rates, equivalent doses and conventional burial ages for samples HAR 1-1 and TEM 3-1. N is number of aliquots, OD is over-dispersion, and CAM De is central age-model-derived palaeodose.
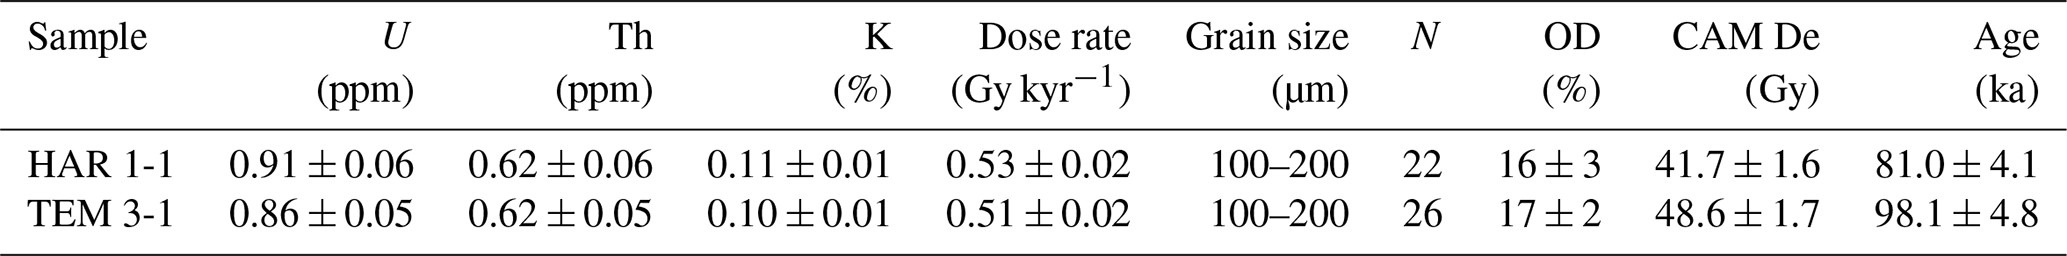
Table A5Modelling of post-transport erosion for samples with exposure ages that underestimate the minimum control ages (VAL 1-1, VAL 1-2, RAB 1-2, HAR 1-1 and HAR 1-2) and ts equal to the control age (i.e. constant erosion rates for the entire exposure duration).

The complete dataset of values of all samples that were used for the fitting of luminescence depth data in this study is available on PANGAEA (https://doi.org/10.1594/PANGAEA.919187; Brill et al., 2020).
DB and SMM conceived the study and obtained funding. DB, SMM, NM and GK conducted fieldwork. NM provided site information and eyewitness accounts. DB, SMM, DW and AZ established the equipment for sample preparation at the CLL. DB conducted the measurements and evaluated the data. CB provided the R scripts for data analyses and helped with data fitting. SMM, GK and BL helped with analysing and interpreting the data. HB along with all other authors commented on the manuscript at all stages.
The authors declare that they have no conflict of interest.
The authors are grateful to Malika Ait and Adil Chiguer for their support during the first field survey in Morocco in July 2016. We would also like to thank the Moroccan Association of Geosciences and its president, Medina Fida, for their support.
This research has been supported by the Deutsche Forschungsgemeinschaft (grant nos. BR 5023/3-1 and MA 5768/2-1).
This paper was edited by Orencio Duran Vinent and reviewed by Pedro Costa and one anonymous referee.
Araoka, D., Yokoyama, Y., Suzuki, A., Goto K., Miyagi, K., Miyazawa, K., Matsuzaki, H., and Kawahata H.: Tsunami recurrence revealed by Porites coral boulders in the southern Ryukyu Islands, Japan, Geology, 41, 919–922, https://doi.org/10.1130/G34415.1, 2013.
Bailey, R. M.: Direct measurement of the fast component of quartz optically stimulated luminescence and implications for the accuracy of optical dating, Quat. Geochronol., 5, 559–568, 2010.
Banerjee, D., Murray, A. S., Bötter-Jensen, L., and Lang, A.: Equivalent dose estimation using a single aliquot of polymineral fine grains, Radiat. Meas., 33, 73–94, 2001.
Baptista, M. A., Miranda, J. M., Chierici, F., and Zitellini, N.: New study of the 1755 earthquake source based on multi-channel seismic survey data and tsunami modeling, Nat. Hazards Earth Syst. Sci., 3, 333–340, https://doi.org/10.5194/nhess-3-333-2003, 2003.
Barton, R. N. E., Bouzouggar, A., Collcutt, S. N., Schwenninger, J.-L., and Clark-Balzan, L.: OSL dating of the Aterian levels at Dar es-Soltan I (Rabat, Morocco) and implications for the dispersal of modern Homo sapiens, Quaternary Sci. Rev., 28, 1914–1931, 2009.
Blanc, P.-L.: Earthquakes and tsunami in November 1755 in Morocco: a different reading of contemporaneous documentary sources, Nat. Hazards Earth Syst. Sci., 9, 725–738, https://doi.org/10.5194/nhess-9-725-2009, 2009.
Brill, D., May, S. M., Mhammdi, N., King, G., Lehmann, B., Burow, C., Wolf, D., Zander, A., and Brückner, H.: OSL rock surface exposure dating data for wave-emplaced boulders from the Rabat coast (Morocco), PANGAEA, https://doi.org/10.1594/PANGAEA.919187, 2020.
Brown, N. D. and Moon, S.: Revisiting erosion rate estimates from luminescence profiles in exposed bedrock surfaces using stochastic erosion simulations, Earth Planet. Sci. Lett., 528, 115842, https://doi.org/10.1016/j.epsl.2019.115842, 2019.
Burow, C.: fit_SurfaceExposure(): Nonlinear Least Squares Fit for OSL surface exposure data. Function version 0.1.0. In: Luminescence: Comprehensive Luminescence Dating Data Analysis, R package version 0.9.0.87, edited by: Kreutzer, S., Burow, C., Dietze, M., Fuchs, M. C., Schmidt, C., Fischer, M., and Friedrich, J., available at: https://CRAN.R-project.org/package=Luminescence (last access: 1 November 2020), 2019.
Chahid, D., Boudad, L., Lenoble, A., Lamothe, M., Chakroun, A., Falguères, C., and Nespoulet, R.: Les paléo-rivages des formations littorales atlantiques du Pléistocène moyen–supérieur de Rabat-Témara (Maroc), L'Anthropologie, 121, 122–132, 2017.
Chakroun, A., Chahid, D., Boudad, L., Campmas, E., Lenoble, A., Nespoulet, R., and El Hajraoui, M. A.: The Pleistocene of Rabat (Morocco): Mollusks, coastal environments and human behavior, Afr. Archaeol. Rev., 34, 493–510, 2017.
Costa, P., Andrade, C., Freitas, M., Oliveira, M., da Silva, C. M., Omira, R., Taborda, R., Baptista, M. A., and Dawson, A. G.: Boulder deposition during major tsunami events, Earth Surf. Proc. Land., 36, 2054–2068, 2011.
Cox, R., O'Boyle, L., and Cytrynbaum, J.: Imbricated coastal boulder deposits are formed by storm waves, and can preserve long-term storminess record, Sci. Rep.-UK, 9, 10784, https://doi.org/10.1038/s41598-019-47254-w5, 2019.
Cox, R., Jahn, K. L., Watkins, O. G., and Cox, P.: Extraordinary boulder transport by storm waves (west of Ireland, winter 2013–2014), and criteria for analysing coastal boulder deposits, Earth-Sci. Rev., 177, 623–636, 2018.
Dawson, A. G., Hindson, R., Andrade, C., Freitas, C., Parish, R., and Bateman, M.: Tsunami sedimentation associated with the Lisbon earthquake of 1 November AD 1755: Boca do Rio, Algarve, Portugal, Holocene 5, 209–215, 1995.
Durcan, J. A., King, G. E., and Duller, G. A. T.: DRAC: Dose rate and age calculator for trapped charge dating, Quat. Geochronol., 28, 54–61, 2015.
Engel, M. and May, S. M.: Bonaire's boulder fields revisited: evidence for Holocene tsunami impact on the Leeward Antilles, Quaternary Sci. Rev., 54, 126–141, 2012.
Feist, L., Frank, S., Bellanova, P., Laermanns, H., Cämmerer, C., Mathes-Schmidt, M., Biermanns, P., Brill, D., Costa, P., Teichner, F., Brückner, H., Schwarzbauer, J., and Reicherter, K.: The sedimentological and environmental footprint of extreme wave events in Boca do Rio, Algarve coast, Portugal, Sedimentary Geol., 389, 147–160, 2019.
Freiesleben, T., Sohbati, R., Murray, A., Jain, M., al Khasawneh, S., Hvidt, S., and Jakobsen, B.: Mathematical model quantifies multiple daylight exposure and burial events for rock surfaces using luminescence dating, Rad. Meas., 81, 16–22, 2015.
Gliganic, L. A., Meyer, M., Sohbati, R., Jain, M., and Barrett, S.: OSL surface exposure dating of a lithic quarry in Tibet: Laboratory validation and application, Quat. Geochronol., 49, 199–204, 2019.
Guerin, G., Mercier, N., and Adamiec, G.: Dose-rate conversion factors: update, Ancient TL, 29, 5–8, 2011.
Hindson, R. A. and Andrade, C.: Sedimentation and hydrodynamic processes associated with the tsunami generated by the 1755 Lisbon earthquake, Quaternary Int., 56, 27–38, 1999.
Jenkins, G. T. H, Duller, G. A. T., Roberts, H. M., Chiverrell, R. C., and Glasser, N. F.: A new approach for luminescence dating glaciofluvial deposits – High precision optical dating of cobbles, Quaternary Sci. Rev., 192, 263–273, 2018.
Kaabouben, F., Baptista, M. A., Iben Brahim, A., El Mouraouah, A., and Toto, A.: On the moroccan tsunami catalogue, Nat. Hazards Earth Syst. Sci., 9, 1227–1236, https://doi.org/10.5194/nhess-9-1227-2009, 2009.
Kelletat, D.: Physische Geographie der Meere und Küsten. Eine Einführung, 3rd edition, Borntraeger, Stuttgart, 290 pp., 2013 (in German).
Khan, N. S., Ashe, E., Shaw, T., Vacchi, M., Walker, J., Peltier, W. R., Kopp, R. E., and Horton, B. P.: Holocene relative sea-level changes from near-, intermediate- and far-field locations, Curr. Clim. Change, 1, 247–262, 2015.
King, G. E., Valla, P. G., and Lehmann, B.: Rock surface burial and exposure dating, in: Handbook of Luminescence Dating, edited by: Bateman, M., Whittles Publishing, Dunbeath, 350–372, 2019.
Kreutzer, S., Burow, C., Dietze, M., Fuchs, M. C., Schmidt, C., Fischer, M., and Friedrich, J.: Luminescence: Comprehensive Luminescence Dating Data Analysis, R package version 0.9.0.87, available at: https://CRAN.R-project.org/package=Luminescence (last access: 1 November 2020), 2019.
Lario, J., Zazo, C., Goy, J. L., Silva, P. G., Bardaji, T., Cabero, A., and Dabrio, C. J.: Holocene palaeotsunami catalogue of SW Iberia, Quaternary Int., 242, 196–200, 2011.
Lau, A. and Autret, R.: Spatial patterns of subaerial coarse clasts, in: Geological Records of Tsunamis and Other Extreme Waves, edited by: Engel, M., Pilarczyk, J., May, S. M., Brill, D., and Garrett, E., Elsevier, Amsterdam, 513–546, https://doi.org/10.1016/B978-0-12-815686-5.00024-9, 2020.
Lehmann, B., Valla, P. G., King, G. E., and Herman, F.: Investigation of OSL surface exposure dating to reconstruct post-LIA glacier fluctuations in the French Alps (Mer de Glace, Mont Blanc massif), Quat. Geochronol., 44, 63–74, 2018.
Lehmann, B., Herman, F., Valla, P. G., King, G. E., and Biswas, R. H.: Evaluating post-glacial bedrock erosion and surface exposure duration by coupling in situ optically stimulated luminescence and 10Be dating, Earth Surf. Dynam., 7, 633–662, https://doi.org/10.5194/esurf-7-633-2019, 2019.
Lehmann, B., Herman, F., Valla, P. G., King, G. E., Biswas, R. H., Ivy-Ochs, S., Steinemann, O., and Christl, M.: Postglacial erosion of bedrock surfaces and deglaciation timing: New insights from the Mont Blanc massif (western Alps), Geology, 48, 139–144, 2020.
May, S. M., Engel, M., Brill, D., Cuadra, C., Lagmay, A. M. F., Santiago, J., Suarez, J. K., Reyes, M., and Brückner, H.: Block and boulder transport in Eastern Samar (Philippines) during Supertyphoon Haiyan, Earth Surf. Dynam., 3, 543–558, https://doi.org/10.5194/esurf-3-543-2015, 2015.
Medina, F., Mhammdi, N., Chiguer, A., Akil, M., and Jaaidi, E. B.: The Rabat and Larache boulder fields; new examples of high-energy deposits related to storms and tsunami waves in north-western Morocco, Nat. Hazards, 59, 725–747, 2011.
Meyer, M. C., Gliganic, L. A., Jain, M., Sohbati, R., and Schmidmair, D.: Lithological controls on light penetration into rock surfaces – Implications for OSL and IRSL surface exposure dating, Rad. Meas., 120, 298–304, 2018.
Mhammdi, N., Medina, F., Kelletat, D., Ahmamou, M., and Aloussi, L.: Large boulders along the Rabat coast (Morocco); possible emplacement by the November 1st, 1755 A.D. tsunami, Science of Tsunami Hazards, 27, 17–30, 2008.
Mhammdi, N., Medina, F., Belkhayat, Z., El Aoula, R., Geawahri, M., and Chiguer, A.: Marine storms along the Moroccan Atlantic coast: An underrated natural hazard? J. Afr. Earth Sci., 163, 103730, https://doi.org/10.1016/j.jafrearsci.2019.103730, 2020.
Moses, C., Robinson, D., and Barlow, J.: Methods for measuring rock surface weathering and erosion: A critical review, Earth-Sci. Rev., 135, 141–161, 2014.
Mottershead, D.: Rates and patterns of bedrock denudation by coastal salt spray weathering: A seven-year record, Earth Surf. Proc. Land., 14, 383–398, 1989.
Murray, A. S. and Wintle, A. G.: The single aliquot regenerative dose protocol: potential for improvements in reliability, Rad. Meas., 37, 377–381, 2003.
Nandasena, N. A. K., Paris, R., and Tanaka, N.: Reassessment of hydrodynamic equations: Minimum flow velocity to initiate boulder transport by high energy events (storms, tsunamis), Mar. Geol., 281, 70–84, 2011.
Nicholls, R. J., Brown, S., Goodwin, P., Wahl, T., Lowe, J., Solan, M., Godbold, J. A., Haigh, I. D., Lincke, D., Hinkel, J., Wolff, C., and Merkens, J.: Stabilization of global temperature at 1.5 ∘C and 2.0 ∘C: implications for coastal areas, Philos. T. Roy. Soc. A, 376, 20160448, https://doi.org/10.1098/rsta.2016.0448, 2018.
NOAA: Historical Hurricane Tracks, available at: https://coast.noaa.gov/hurricanes/, last access: 1 September 2019.
Oliveira, M. A., Llop, E., Andrade, C., Branquinho, C., Goble, R., Queiroz, S., Freitas, M. C., and Pinho, P.: Estimating the age and mechanism of boulder transport related with extreme waves using lichenometry, Prog. Phys. Geogr., 44, 870–897, https://doi.org/10.1177/0309133320927629, 2020.
Ou, X. J., Roberts, H. M., Duller, G. A. T., Dunn, M. D., and Perkins, W. T.: Attenuation of light in different rock types and implications for rock surface luminescence dating, Rad. Meas., 120, 305–311, 2018.
Paris, R., Naylor, L. A., and Stephenson, W.: Boulders as a signature of storms on rock coasts, Mar. Geol., 283, 1–11, 2011.
Portenga, E. W. and Bierman, P. R.: Understanding Earth's eroding surface with 10Be, Geol. Soc. Am. Today, 21, 4–10, 2011.
Rades, E., Sohbati, R., Lüthgens, C., Jain, M., and Murray, A. S.: First luminescence-depth profiles from boulders from moraine deposits: Insights into glaciation chronology and transport dynamics in Malta valley, Austria, Rad. Meas., 120, 281–289, 2018.
Ramalho, R., Winckler, G., Madeira, J., Helfrich, G., Hipolito, A., Quartau, R., Adena, K., and Schaefer, J. M.: Hazard potential of volcanic flank collapses raised by new megatsunami evidence, Sci. Adv., 1, e1500456, https://doi.org/10.1126/sciadv.1500456, 2015.
Ramalho, R., Omira, R., El Moussaoui, S., Baptista, M. A., and Zaghloul, M. N.: Tsunami-induced morphological change – A model-based impact assessment of the 1755 tsunami in NE Atlantic from the Morocco coast, Geomorphology, 319, 78–91, 2018.
Reading University: Extratropical Cyclone Atlas, available at: http://www.met.rdg.ac.uk/~storms/cgi-bin/storms/storms.cgi, last access: 1 September 2019.
Renou, C., Lesne, O., Mangin, A., Rouffi, F., Atillah, A., El Hadani, D., and Moudni, H.: Tsunami hazard assessment in the coastal area of Rabat and Salé, Morocco, Nat. Hazards Earth Syst. Sci., 11, 2181–2191, https://doi.org/10.5194/nhess-11-2181-2011, 2011.
Rixhon, G., May, S. M., Engel, M., Mechernich, S., Schroeder-Ritzrau, A., Frank, N., Fohlmeister, J., Boulvain, F., Dunai, T., and Brückner, H.: Multiple dating approach (14C, 230Th U and 36Cl) of tsunami-transported reef-top boulders on Bonaire (Leeward Antilles) – current achievements and challenges, Mar. Geol., 396, 100–113, https://doi.org/10.1016/j.margeo.2017.03.007, 2017.
Sato, T., Nakamura, N., Goto, K., Kumagai, Y., Nagahama, H., and Minoura, K.: Paleomagnetism reveals the emplacement age of tsunamigenic coral boulders on Ishigaki Island, Japan, Geology, 42, 603–606, https://doi.org/10.1130/G35366.1, 2014.
Scheffers, A. and Kelletat, D.: Tsunami relics on the coastal landscape west of Lisbon, Portugal, Science of Tsunami Hazards, 23, 3–16, 2005.
Sellwood, E. L., Guralnik, B., Kook, M., Prasad, A. K., Sohbati, R., Hippe, K., Wallinga, J., and Jain, M.: Optical bleaching front in bedrock revealed by spatially-resolved infrared photoluminescence, Sci. Rep.-UK, 9, 2611, https://doi.org/10.1038/s41598-019-38815-0, 2019.
Simms, A. R., DeWitt, R., Kouremenos, P., and Drewry, A. M.: A new approach to reconstructing sea levels in Antarctica using optically stimulated luminescence of cobble surfaces, Quat. Geochronol., 6, 50–60, 2011.
Small, E. E., Anderson, R. S., Repka, J., and Finkel, R.: Erosion rates of alpine bedrock summit surfaces deduced from in situ 10Be and 26Al, Earth Planet. Sci. Lett., 150, 413–425, 1997.
Sohbati, R., Murray, A. S., Jain, M., Buylaert, J. P., and Thomsen, K.: Investigating the resetting of OSL signals in rock surfaces, Geochronometria, 38, 249–258, 2011.
Sohbati, R., Murray, A. S., Chapot, M. S., Jain, M., and Pederson, J.: Optically stimulated luminescence (OSL) as a chronometer for surface exposure dating, J. Geophys. Res., 117, 1–7, 2012.
Sohbati, R., Murray, A. S., Porat, N., Jain, M., and Avner, U.: Age of a prehistoric “Rodedian” cult site constrained by sediment and rock surface luminescence dating techniques, Quat. Geochronol., 30, 90–99, 2015.
Sohbati, R., Liu, J., Jain, M., Murray, A. S., Egholm, D., Paris, R., and Guralnik, B.: Centennial- to millennial-scale hard rock erosion rates deduced from luminescence-depth profiles, Earth Planet. Sci. Lett., 493, 218–230, 2018.
Stephenson, W. J. and Finlayson, B. L.: Measuring erosion with the micro-erosion meter–Contributions to understanding landform evolution, Earth-Sci. Rev., 95, 53–62, 2009.
Wallinga, J.: Optically stimulated luminescence dating of fluvial deposits: a review, Boreas, 31, 303–322, 2002.
Whelan, F. and Kelletat, D.: Boulder deposits on the southern Spanish Atlantic Coast: Possible evidence for the 1755 AD Lisbon Tsunami? Science of Tsunami Hazards, 23, 25–38, 2005.
Yu, K. F., Zhao, J. X., Shi, Q., and Meng, Q. S.: Reconstruction of storm/tsunami records over the last 4000 years using transported coral blocks and lagoon sediments in the southern South China Sea, Quaternary Int., 195, 128–137, 2009.
Zhao, J. X., Neil, D., Feng, Y. X., Yu, K. F., and Pandolfi, J. M.: High-precision U-series dating of very young cyclone-transported coral reef blocks from Heron and Wistari reefs, southern Great Barrier Reef, Australia, Quaternary Int., 195, 122–127, 2009.
Zitellini, N., Chierici, F., Sartori, R., and Torelli, L.: The tectonic source of the 1755 Lisbon earthquake and tsunami, Ann. Geophys., 42, 49–55, 1999.