the Creative Commons Attribution 4.0 License.
the Creative Commons Attribution 4.0 License.
 | 02 Feb 2021
Impacts of grazing on vegetation dynamics in a sediment transport complex model
Phillipe Gauvin-Bourdon
James King
Liliana Perez
Arid environments are characterized by the complex interaction between vegetation cover, surface soil properties, and the climate. The dynamic balance between these components makes arid environments highly susceptible to swift changes in vegetation cover and surface morphology in response to climate change. Furthermore, arid environments often support grazing activities, which influence other ecogeomorphic processes and alter the stability of vegetation cover in these environments. Despite growing knowledge and the parallel modeling advances to simulate the sediment transport, vegetation distribution, and grazing, in arid environments, relatively little progress has been accomplished on the interaction between all these components. Here we present an adaptation of an already established sediment transport–vegetation cellular automata model (Vegetation and Sediment TrAnsport or ViSTA) that represents landscape dynamics with an agent-based model (GrAM) representing the activity of grazers on the landscape. In this study, our resulting model, ViSTA_GrAM, is subjected to a series of 100-year-long tests that aim to highlight the capacity of the model to represent ecogeomorphic processes linked to vegetation composition, rainfall, wind speed, and grazing pressure. While these simulations do not allow us to evaluate the performance of the new model to reproduce realistic semi-arid environments, they present the capacity of the model to reproduce and explain major feedback complexities between grazers and the vegetation, in addition to providing insight on the vegetation and wind shear sensitivity of the original model. The simulations reinforce our current knowledge of the resilience of grass-based landscapes to foraging activities and highlight the need to identify growth response rates at the species level to fully understand the complexity of the interactions between individual components within arid environments. Overall, the ViSTA_GrAM model presents the foundation for a better assessment of semi-arid environment response to landscape management measures and a better understanding of the complex interactions shaping semi-arid landscapes.
- Article
(5581 KB) - Full-text XML
- BibTeX
- EndNote


Ecosystems in arid and semi-arid environments are defined by complex interactions between anthropogenic land uses, climatic variability, and, in many cases, persistent wind erosion (Nicholson, 1978, 2000; Okin et al., 2006; Peters et al., 2006). Persistent transport of sediment can act to modify a landscape by redistributing resources, such as soil nutrients that are necessary for vegetation growth (Okin and Gillette, 2001) and that lead to landform adjustments (e.g., dune building or dune reactivation; D'Odorico et al., 2013). In turn, the increasing presence of vegetation in these environments non-linearly influences the transport of sediment by modifying the wind flow at the surface and providing cover to the surface sediments (Okin, 2008; Okin et al., 2006). The constant feedback between sediment transport and vegetation growth creates dynamically stable states for the environments supporting them and can quickly provoke major shifts in the composition or distribution of both the sediments and the vegetation (Bestelmeyer et al., 2015, 2018). In arid regions where grazing is an active use of the land, failure to adapt the land use strategy to rainfall variability and the wind regime can accelerate a shift in the composition and spatial organization of vegetation, leading to a reduction of the grazing capacity of the land and possibly an increase in the wind erosion (Bhattachan et al., 2014; Thomas et al., 2005; Webb and Pierre, 2018). In this context, the onset and severity of wind erosion induced by changes in climatic variables in addition to grazing pressures are an important source of dust emissions and present significant challenges in the context of climate change (Chappell et al., 2018). Although sediment transport by wind can be modeled using empirical approaches, the synergistic impact of grazing pressure on vegetation growth, combined with a climatic shift in aridity or wind regime, demands a more integrative assessment. Additionally, the intrinsic generalization of the spatial and temporal variability of empirical wind transport studies contradicts the heterogenic nature of the wind transport itself (Ziegler et al., 2020). The wide array of spatial scales at which these interactions between sediment transport, vegetation, and grazing are observable (Ravi et al., 2011) is another source of complexity in the study of those interactions. It is therefore advantageous to take a complex modeling approach to help elucidate the spatial and temporal connectivity within these interactions to increase the understanding of how a semi-arid landscape may respond to a changing climate. This approach can provide a better understanding of the landscape dynamics in semi-arid environments, enabling improved management of those environments.
Studies looking at the impacts of grazing on vegetation (i.e., species proportions and spatial distribution) within arid environments have taken various approaches including remote sensing (Ares et al., 2003), empirical modeling (Aubault et al., 2015), and complex modeling (Jeltsch et al., 1997a; Yu et al., 2019). However, few studies have combined a complex modeling approach to analyze the interaction between grazing and wind erosion at the scale of individual grazers or dunes (e.g., Bo et al., 2013; Yan and Baas, 2018). Remote sensing studies of vegetation cover in arid environments (e.g., Patagonia Monte, Colorado Plateau) were developed to track the changes in grazed landscapes and effectively analyze the results of landscape management, but the functions and processes that shape the resulting landscape are more difficult to extract (Ares et al., 2003; Yuhas and Goetz, 1994). Aubault et al. (2015) implemented a coupled approach using an empirical model representing pasture growth (GRASP) and a spatiotemporal land erodibility model (AUSLEM) to evaluate the impact of land management strategies on the erodibility of the environments in western Queensland, Australia. The study highlighted the importance of adapting the grazing strategy and stocking rate to the land type and climate variabilities of an environment in order to limit the wind erosion and land degradation (Aubault et al., 2015). A combined agent-based model (ABM) approach and real-time remotely sensed vegetation leaf area index by Yu et al. (2019) were used to evaluate the consequences of different grazing management strategies on vegetation cover in the region of Zeku, China. Nevertheless, this combined approach was based at a landscape scale and focused on the management strategies rather than the description of the dynamics between the landscape and the grazers (Yu et al., 2019). The cellular automata (CA) model of Jeltsch et al. (1997a) represented the effect on vegetation cover from preferential grazing around a borehole in the Kalahari Desert. The Jeltsch et al. (1997a) model provided a good representation of the preferential grazing gradient around a borehole; however, it did not simulate sediment transport and was implemented only at a herd level. The approaches summarized here suggest the possible advantages of combining a CA model with an ABM to represent a dynamic and synergistic vegetation–sediment–grazing interaction at appropriate spatial and temporal scales within a semi-arid environment.
The increasing interest in shear stress partitioning approaches developed for sparsely vegetated arid environments (King et al., 2005; Okin, 2008) encouraged the development of CA models to simulate the interaction of vegetation with sediment transport. From this development, those representing the vegetation–wind dynamics and the wind-fluvial dynamics in parabolic and barchan dune fields are DECAL (Baas and Nield, 2007; Yan and Baas, 2017) and DECAL-CAESAR (Liu and Coulthard, 2017), respectively. Mayaud et al. (2017a) presented a CA model called the Vegetation and Sediment TrAnsport (ViSTA) model (hereafter ViSTA_M17), with a similar methodology as the DECAL model and the Bailey (2011) vegetation model, to create a more integrative model to simulate a wind-erosion-driven landscape. The ViSTA_M17 model has included a stochastic representation of grazing whose approach, which overlooks some important dynamics like the heterogenic distribution of the grazing (important when representing larger regions), limits field study comparisons. Therefore, the objective of this research is to model the response of a semi-arid landscape to climatic and grazing variabilities with an improved representation of herbivory. To achieve this, we have added an herbivory agent-based model (ABM) to the ViSTA_M17 model and updated several key modules to improve its representation of the semi-arid environment at larger spatial scales, demonstrated through a series of plausible scenarios. The results from one of these scenarios combined with the herbivory ABM are discussed in the context of southern African environments.
The proposed and implemented model used to represent the arid environment in this research study is called the ViSTA_GrAM model, which integrates the new Grazing Agent Module (GrAM), an ABM representing grazer disturbance, into the ViSTA_M17 CA model. The ViSTA_M17 is a coupled CA model representing the interactions between sediment transport and vegetation in a spatially explicit way to investigate the development of arid and semi-arid environments (Mayaud et al., 2017a). The ViSTA_M17 model uses a similar approach to Bailey's (2011) CA model to represent the spatial interaction of vegetation among its different types and the vegetation interaction with sediments. The ViSTA_M17 model considers three types of vegetation (loosely defined as grasses, shrubs, and trees) that populate the simulation grid while recording the age and biomass of the vegetation on each cell. The change in vegetation biomass present on cells is determined by a “growth pathway” relative to the age of that vegetation (Mayaud et al., 2017a). The growth pathway is a function defining the optimal gain of plant biomass in relation to its age that can be modified according to the amount of precipitation received by the vegetation. The biomass of the vegetation is then used to determine the strength of the interactions of vegetation with its neighbors (e.g., competition or facilitation) and with the sediments (e.g., by transforming the biomass to a height value). On the other hand, the survival or death of the vegetation is based on a probability for the neighborhood competition, the response of the vegetation to precipitation, the vegetation biomass, the vegetation age, and the sediment balance (i.e., plant response to sediment erosion and/or deposition) (Mayaud et al., 2017a).
Alongside the representation of the vegetation, the model ViSTA_M17 also simulates the transport of sediment, similarly to the Werner (1995) and Baas and Nield (2007) models, by moving sediment slabs of fixed height across cells (Mayaud et al., 2017a). A summary of the ViSTA_M17 treatment of erosion of sediment can be given in two steps. Firstly, a volumetric flux of sediment transport is calculated in relation to the wind speed with deterministic functions. Secondly, a probability of erosion is evaluated for each cell based on the humidity of the surface and the position of the cell in a shadow zone (i.e., zone downwind of a topographic element forming more than a 15∘ opposite angle between the apex of the element and the surface). The transport of sediment on a cell is the product of the volumetric flux and the probability of erosion on that cell. The sediment deposition is a function of a probability of deposition based on the position of the cell in a shadow zone, the nature of the surface (e.g., wet or dry sediment, bare rock, etc.), and the presence of vegetation for each cell downwind of the emission source. The slabs of eroded sediment are then deposited along a downwind “corridor” based on the probability of deposition. The ViSTA_M17 sediment model also considers the presence of avalanching processes in its simulations based on the angle of repose. In the case of two adjacent cells that present an angle of the surface greater than 30∘, sediments are transferred from the higher cell to the lower one until the angle of the sediment surface is lowered below 30∘ as in an avalanche event. By using this methodology, the model ViSTA_M17 can represent the mutual feedbacks between vegetation and sediment transport to specifically model the landscape forms produced in arid and semi-arid environments like the Skeleton Coast (Namibia) and the Kalahari (Botswana) (Mayaud et al., 2017a, b). Changes to the ViSTA_M17 model structure have been made in the ViSTA_GrAM to improve the representation and integration of the new GrAM. The first modification provided by ViSTA_GrAM concerns the way sediment transport is processed, and the second has to do with the way grazing disturbance is incorporated, as explained in the following two sections. The third section outlines the various scenarios simulated for this application.
2.1 Vegetation–sediment interactions
Changes to the sediment transport function were introduced to improve the oversensitivity of the model to sediment transport in the presence of vegetation (see Appendix A). To enhance the representativeness of sediment transport in the presence of significant vegetation coverage, a new condition was introduced in the erosion processing function of the model. Since the model considers all vegetated cells to be fully covered by closely spaced vegetation, it is reasonable to assume that a skimming flow will be created under vegetation of a significant height (Hesp et al., 2019; Wolfe and Nickling, 1993). This condition states that if there is vegetation of a significant height on a cell, erosion is not possible on that cell, keeping all other interactions possible (Burri et al., 2011; King et al., 2005, 2006; Lancaster and Baas, 1998; Okin, 2008; Raupach et al., 1993). The significant height at which the vegetation suppresses erosion was equivalent to the height at which sediment deposition begins. This addition relates the capacity of vegetation tall enough to trap sediment equally to its capacity to suppress the wind flow and consolidate the substrate, keeping sediment under it from moving (Burri et al., 2011; Dupont et al., 2014; Mayaud and Webb, 2017).
2.2 GrAM description
The second improvement made with the ViSTA_GrAM model was the addition of a new module simulating a spatially explicit impact of grazing. GrAM was implemented using an ABM that allows the representation of grazers as agents that can move on the grid and forage on available grasses. Each grazing event is characterized in the model by a frequency, a duration, and the number of agents introduced on the grid. The ViSTA_M17 model already included a frequency of occurrence variable for grazing events (Mayaud et al., 2017a), which was used to define when GrAM is called in sequence within the main portion of the ViSTA_M17 model. This frequency variable allows the model to represent different types of grazing strategies (e.g., continuous grazing or rotational grazing) like grazing-management-specific models (Yu et al., 2019). A new user-defined variable was introduced to define the discrete timescale (GrAM_event_duration) for adding grazing agents compared to the stochastic approach used originally in the ViSTA_M17 (Mayaud et al., 2017a). This new GrAM_event_duration variable represents the number of days the grazers stay on the grid for each grazing event and is necessary for any model with explicit representation of grazing activities (Jeltsch et al., 1997a; Marion et al., 2005, 2008). In terms of the model function, the number of iterations executed by GrAM at each grazing event is equal to double the grazing event length (in days). The days are divided into two to represent the tendency of bovine grazers to concentrate their wandering and eating periods at specific morning and afternoon sessions centered around solar noon (Chacon et al., 1976; Hodgson et al., 1991; Orr et al., 2001). The number of agents on the grid, which influences the grazing function, is determined by the combination of the grid size and the stocking rate (in livestock units per hectare; LSU ha−1) implemented in the setup of a model simulation. For example, if there is a grid of 1000 m by 1000 m and a stocking rate of 0.06 LSU ha−1, GrAM will place six grazing agents on the grid at the beginning of each grazing event.
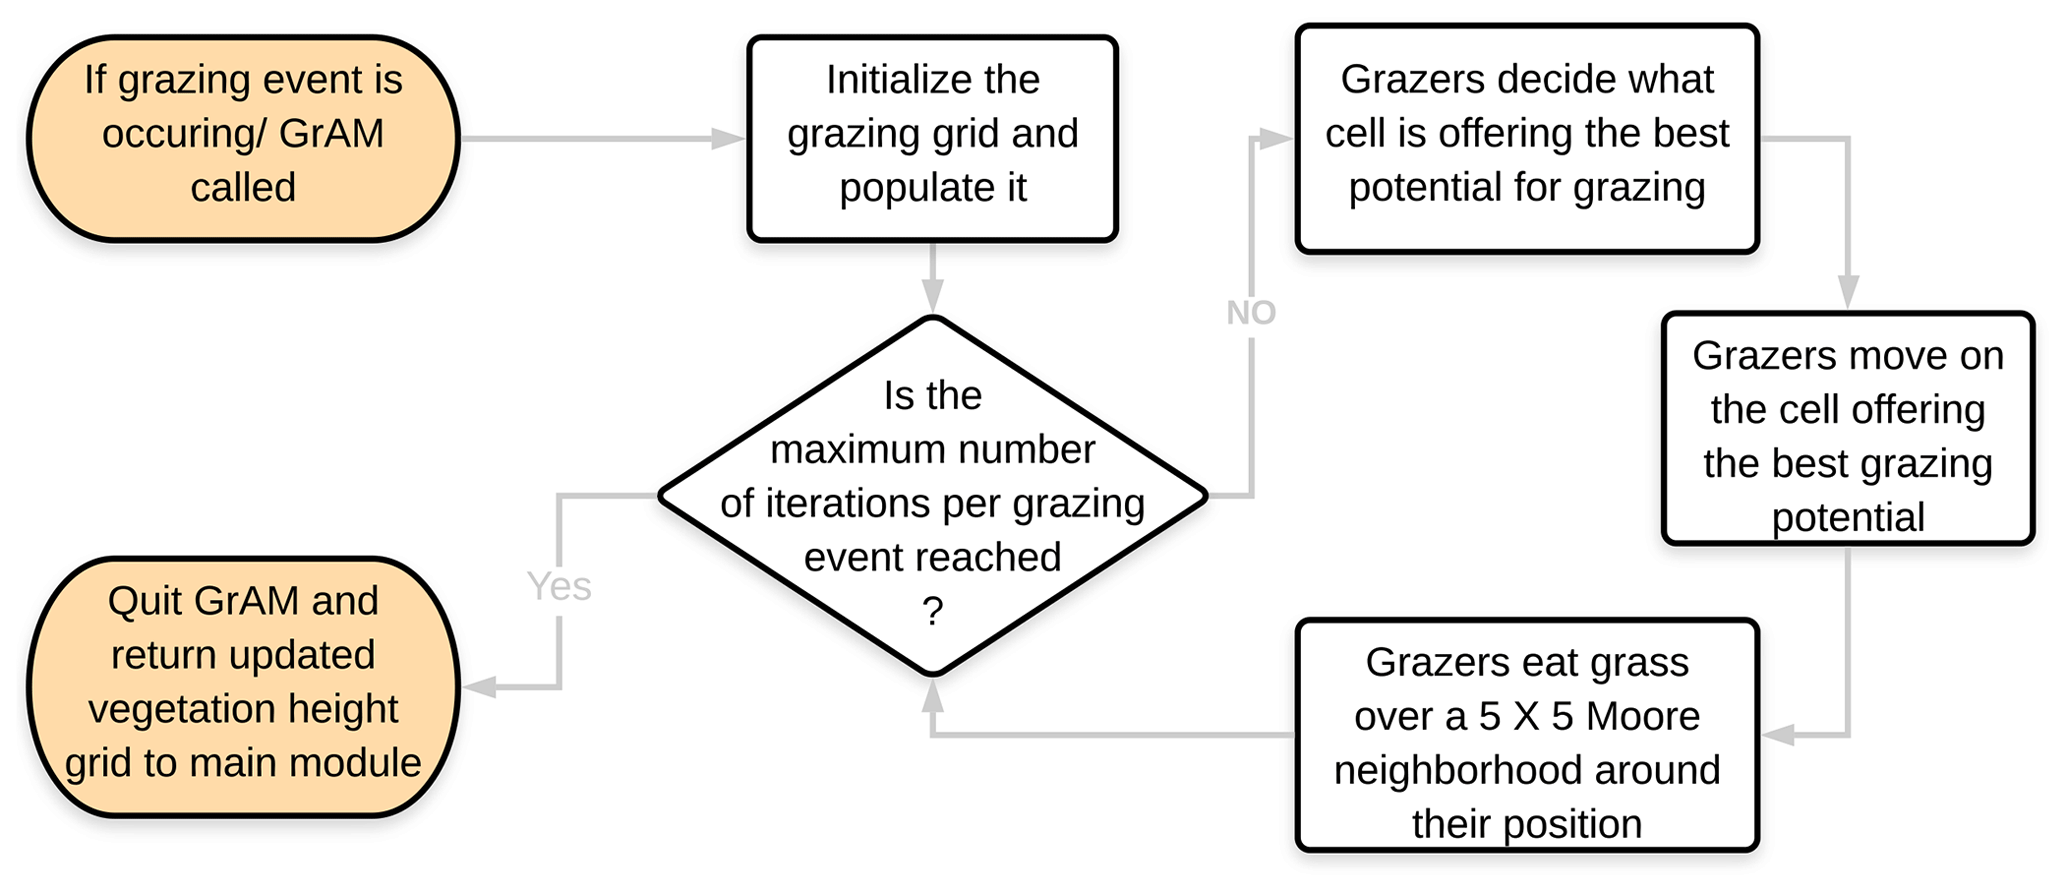
Once the grazing agents have been introduced on the grid, they all follow the same rules to guide their movement throughout the simulation space, moving to a cell with grass and then subsequently eating the grass on the surrounding cells at each iteration of the grazing event. Figure 1 illustrates each logical step of the grazing agents' cycle when GrAM is called. The grazing agents created in the initial step of each grazing event are randomly distributed on the simulation grid. A new set of agents with new random starting positions is created at the beginning of each subsequent grazing event. The simulation grid does not necessarily represent an enclosed pasture in its entirety, and each grazing agent does not have any unique attributes except its position. This approach of the grazing agents in the module corresponds to natural environments, whereby domestic grazers roam through a bigger pasture or whereby wildlife ranges in fully open environments (Burgess, 2006; Ludwig et al., 2017).
Grazing agents have three behaviors that determine how they act on the model grid: (1) choosing what cell is the best to move to next; (2) moving to the next cell; and (3) eating the grass that is in those cells. For choosing which cell to move to next, a function operating on a scoring system was established to decide the best next move for the agent (similar to Jeltsch et al., 1997a, b; and Marion et al., 2008). A score is attributed for each cell on the grid, and the next destination of the grazer is randomly chosen among the highest scoring cells. This decision function takes into consideration five factors to determine what the best cell would be, with each factor having a positive or negative influence on the total score of the cell and with a total score calculated for each cell on the grid before the grazing agent chooses its next destination. The five factors in order of their importance are (1) the presence of grazers in the cell, (2) the presence of walls (e.g., rock formation) in the cell, (3) the height of the grass in the cell, (4) the slope of sediment surface, and (5) a previous visit (or not) of grazers in that cell.
The presence of a wall or a grazing agent in a cell has a highly negative impact on the total score of that cell because it is unrealistic to have a grazer on a wall and because they cannot be physically on top of each other. The height of the grass is the second most important factor in the decision-making process; it was used as an indicator of the amount of forage available for a grazer at this specific location. Cells, wherein no grass is present above the ground, were automatically attributed a score of zero since they do not hold any forage for the grazer to eat. For cells containing aboveground grass, the highest score (0.8) was attributed to cells with a medium height (30 %–75 % of the maximum height), since they would strike the perfect balance between forage amount and forage quality (Jeltsch et al., 1997b). The least desirable grass cells would be the ones which have a very low amount and suboptimal quality of forage (heights less than 20 % of the maximum height), resulting in a minimal score (0.4), and all other heights of grass in a cell would correspond to a score of 0.6. The sediment surface slope of a cell is another factor having a negative influence on the score of a cell. It is recognized that grazers are less mobile in steep slope terrains compared to terrains with small slopes (Kaufmann et al., 2013; Sharpe and Kenny, 2019). A decrease in the score of 0.4 was therefore applied to cells having a sediment surface slope greater than 25∘ to represent the preference of cattle for more horizontal terrains.
These exact values were determined through a series of qualitative sensitivity tests and in relation to the height of grass score. The main criterion is that the score attributed to each cell should not lead to a deterministic decision-making process but create an array of cells with the same high score, from which a destination is chosen randomly. The last factor that can influence the decision of a grazing agent in this model is its memory. To represent the observation that grazers have a slight preference for locations they have already visited and where they have found good forage in the past (Jeltsch et al., 1997a, b; Sharpe and Kenny, 2019), the score of a cell is increased by 0.2 when the grazer has already visited the cell. This increase is not enough to make a bare cell more attractive than one with minimal grass but can make a familiar cell with medium forage quality as attractive as an unfamiliar cell with high forage quality. The memory of each grazer is short-term and still limited to the present grazing event because at each new grazing event new agents are created. While other factors, like the distance to the nearest water hole and the presence of faeces, have been identified as potential influences on grazing ranging patterns (Jeltsch et al., 1997b; Marion et al., 2005, 2008; Sharpe and Kenny, 2019; Weber and Jeltsch, 1997), the limited size of the grid and its openness significantly limit the impact of these factors, minimizing their necessity in the present experimental design.
The second behavior of grazing agents is their movement based on the result of the abovementioned decision function. The third behavior is responsible for the grazing agents eating the grass around them once they have moved to a new position. Once agents have chosen their new position and have moved to it, each grazing agent will then eat the vegetation around that chosen cell in a 625 m2 Moore neighborhood centered on the chosen cell. For each grass cell in the 625 m2 area around the grazer, 0.03 m of the vegetation height is removed to simulate the grazing. The grazed surface and the amount of grass removed at each iteration were determined based on a daily intake of foraging cattle weighing ∼ 450 kg and subsequent sensitivity tests. Depending on their weight and the quality of forage, cattle need between 8 and 18 kg of forage per day to be in good health (Aubault et al., 2015; Burgess, 2006; Chacon et al., 1976; Hodgson et al., 1991; Orr et al., 2001). By eating the equivalent to 0.03 m of grass over an area of 625 m2 twice a day, the grazing agents of the model eat a maximum of 15 kg per day given simulated grass of a 400 g m−3 volumetric mass (Dougill and Thomas, 2004; Hodgson et al., 1991; Jeltsch et al., 1997a; Ludwig et al., 2017; Meyer et al., 2014; Scholes et al., 2002; Wang et al., 2012). Considering that not all cells around the grazing agent will be covered by grass, the amount of grass eaten by the agent in the simulations typically varies between 7 and 15 kg, which corresponds to realistic values from semi-arid regions and those specifically identified from southern Africa (Aubault et al., 2015; Burgess, 2006; Chacon et al., 1976; Hodgson, 1985; Orr et al., 2001), allowing the agents to sustain themselves solely on the grid. For the case in which an agent eats an amount of grass significantly lower than this recommended quantity, it is assumed that the missing balance of food is found outside the grid (due to its openness) or it is supplemented. In conclusion, the new GrAM takes an open and relative approach to the grazer's behavior on the grid, to limit the number of user inputs and calibration necessary to its application.
2.3 Model applications: simulation scenarios
To assess the applicability of the new ViSTA_GrAM model, six groups of scenarios were created to compare the model response to variations in its major components, with results published in peer-reviewed literature. The scenarios all took place on a grid of 200×200 cells of 5 m resolution each and therefore represented 100 ha, over 100 years, to allow the simulated environment to display a recognizable evolution trend. Each simulation was initiated with 90 % vegetation grid coverage and a sediment bed thickness between 1.0 and 1.5 m in height depending on the cell. Each vegetated cell began at a randomly determined height between 0 m and the maximum height for that type of vegetation (1 m for grass, 1.5 m for shrubs, and 6 m for trees). The first components tested were the sediment balance stress applied to vegetation by sand burial and vegetation recolonization. The sediment balance stress is a probability of survival for each vegetation type determined as a function of the amount of sediment accumulation and/or erosion occurring on the vegetated cell. The functions of sediment balance stress were parameterized to represent pioneer grasses like Stipagrostis amabalis and marram grass (Ammophila), woody shrubs like Rhigozum trichotomum, and trees of the Acacia species, taking inspiration from the DECAL model (Mayaud et al., 2017a; Nield and Baas, 2008; Yan and Baas, 2017). The vegetation recolonization process allowed vegetation to re-establish itself onto bare cells at the end of each vegetation update. The vegetation type recolonizing a cell was either determined dynamically and influenced by current vegetation proportions or it was non-dynamic and determined by static probabilities at the initial proportion of each vegetation type. The initial distribution of the vegetation type was 80 % grass, 10 % shrubs, and 10 % trees for the FD, SDa1, SDb, and ND simulations, but it was 85 % grass, 10 % shrubs, and 5 % trees for the SDa2 and SDa3 simulations. The combination of sediment balance stress and vegetation recolonization dynamics was used to create a matrix of four different types of simulations ranging from fully dynamic to non-dynamic (Table 1). A fully dynamic simulation (FD) represented an environment where a sediment balance stress was applied to the vegetation and the vegetation recolonization is dynamic, while a non-dynamic simulation (ND) represented neither of these processes. The semi-dynamic simulations were used to assess either a dynamic vegetation recolonization (SDa) or a sediment balance stress applied to the vegetation (SDb).
Table 1Description of the parameterization of simulations testing the impact of vegetation dynamics and rainfall influence on resulting arid environments.

Rainfall was the second major factor studied (Table 2). Simulated annual rainfall regimes at 150, 270, and 450 mm yr−1 all correspond to natural rainfall regimes in southern African semi-arid environments (Jeltsch et al., 1996, 1997b; Ludwig et al., 2017; Meyer et al., 2014; Thomas and Twyman, 2004; Weber et al., 1998). The applied rainfall regime of 1000 mm yr−1 is not characteristic of semi-arid environments but offered a good comparison for the other three rainfall regimes. These rainfall regimes were applied as a constant and uniform source of humidity in our representation of theoretical environments of semi-arid grasslands and savannas. No wind speed was applied to simulations testing the sediment balance stress, the vegetation recolonization, or the rainfall regime to help isolate the effect of these components. It was later introduced in the simulations testing sediment transport (Table 2) since the transported sediment of an arid environment is linked to the capacity of the wind to initiate transport (Bagnold, 1941; Hsu, 1971; Kawamura, 1951; Lettau and Lettau, 1978; Owen, 1964; Zingg, 1953) and the response of an environment to different sediment balances is a function of wind speed. With all other parameters kept constant (SDa2 simulations with 270 mm yr−1) and a surface wind speed threshold of 5 m s−1, four simulations were made at 5, 7.5, 10, and 12.5 m s−1. All simulations testing the four components above were executed with a 6-month vegetation update to maximize efficiency and accommodate the growth period of all three vegetation types.
Table 2Summary of the parameterization of simulations made with the ViSTA_GrAM model.
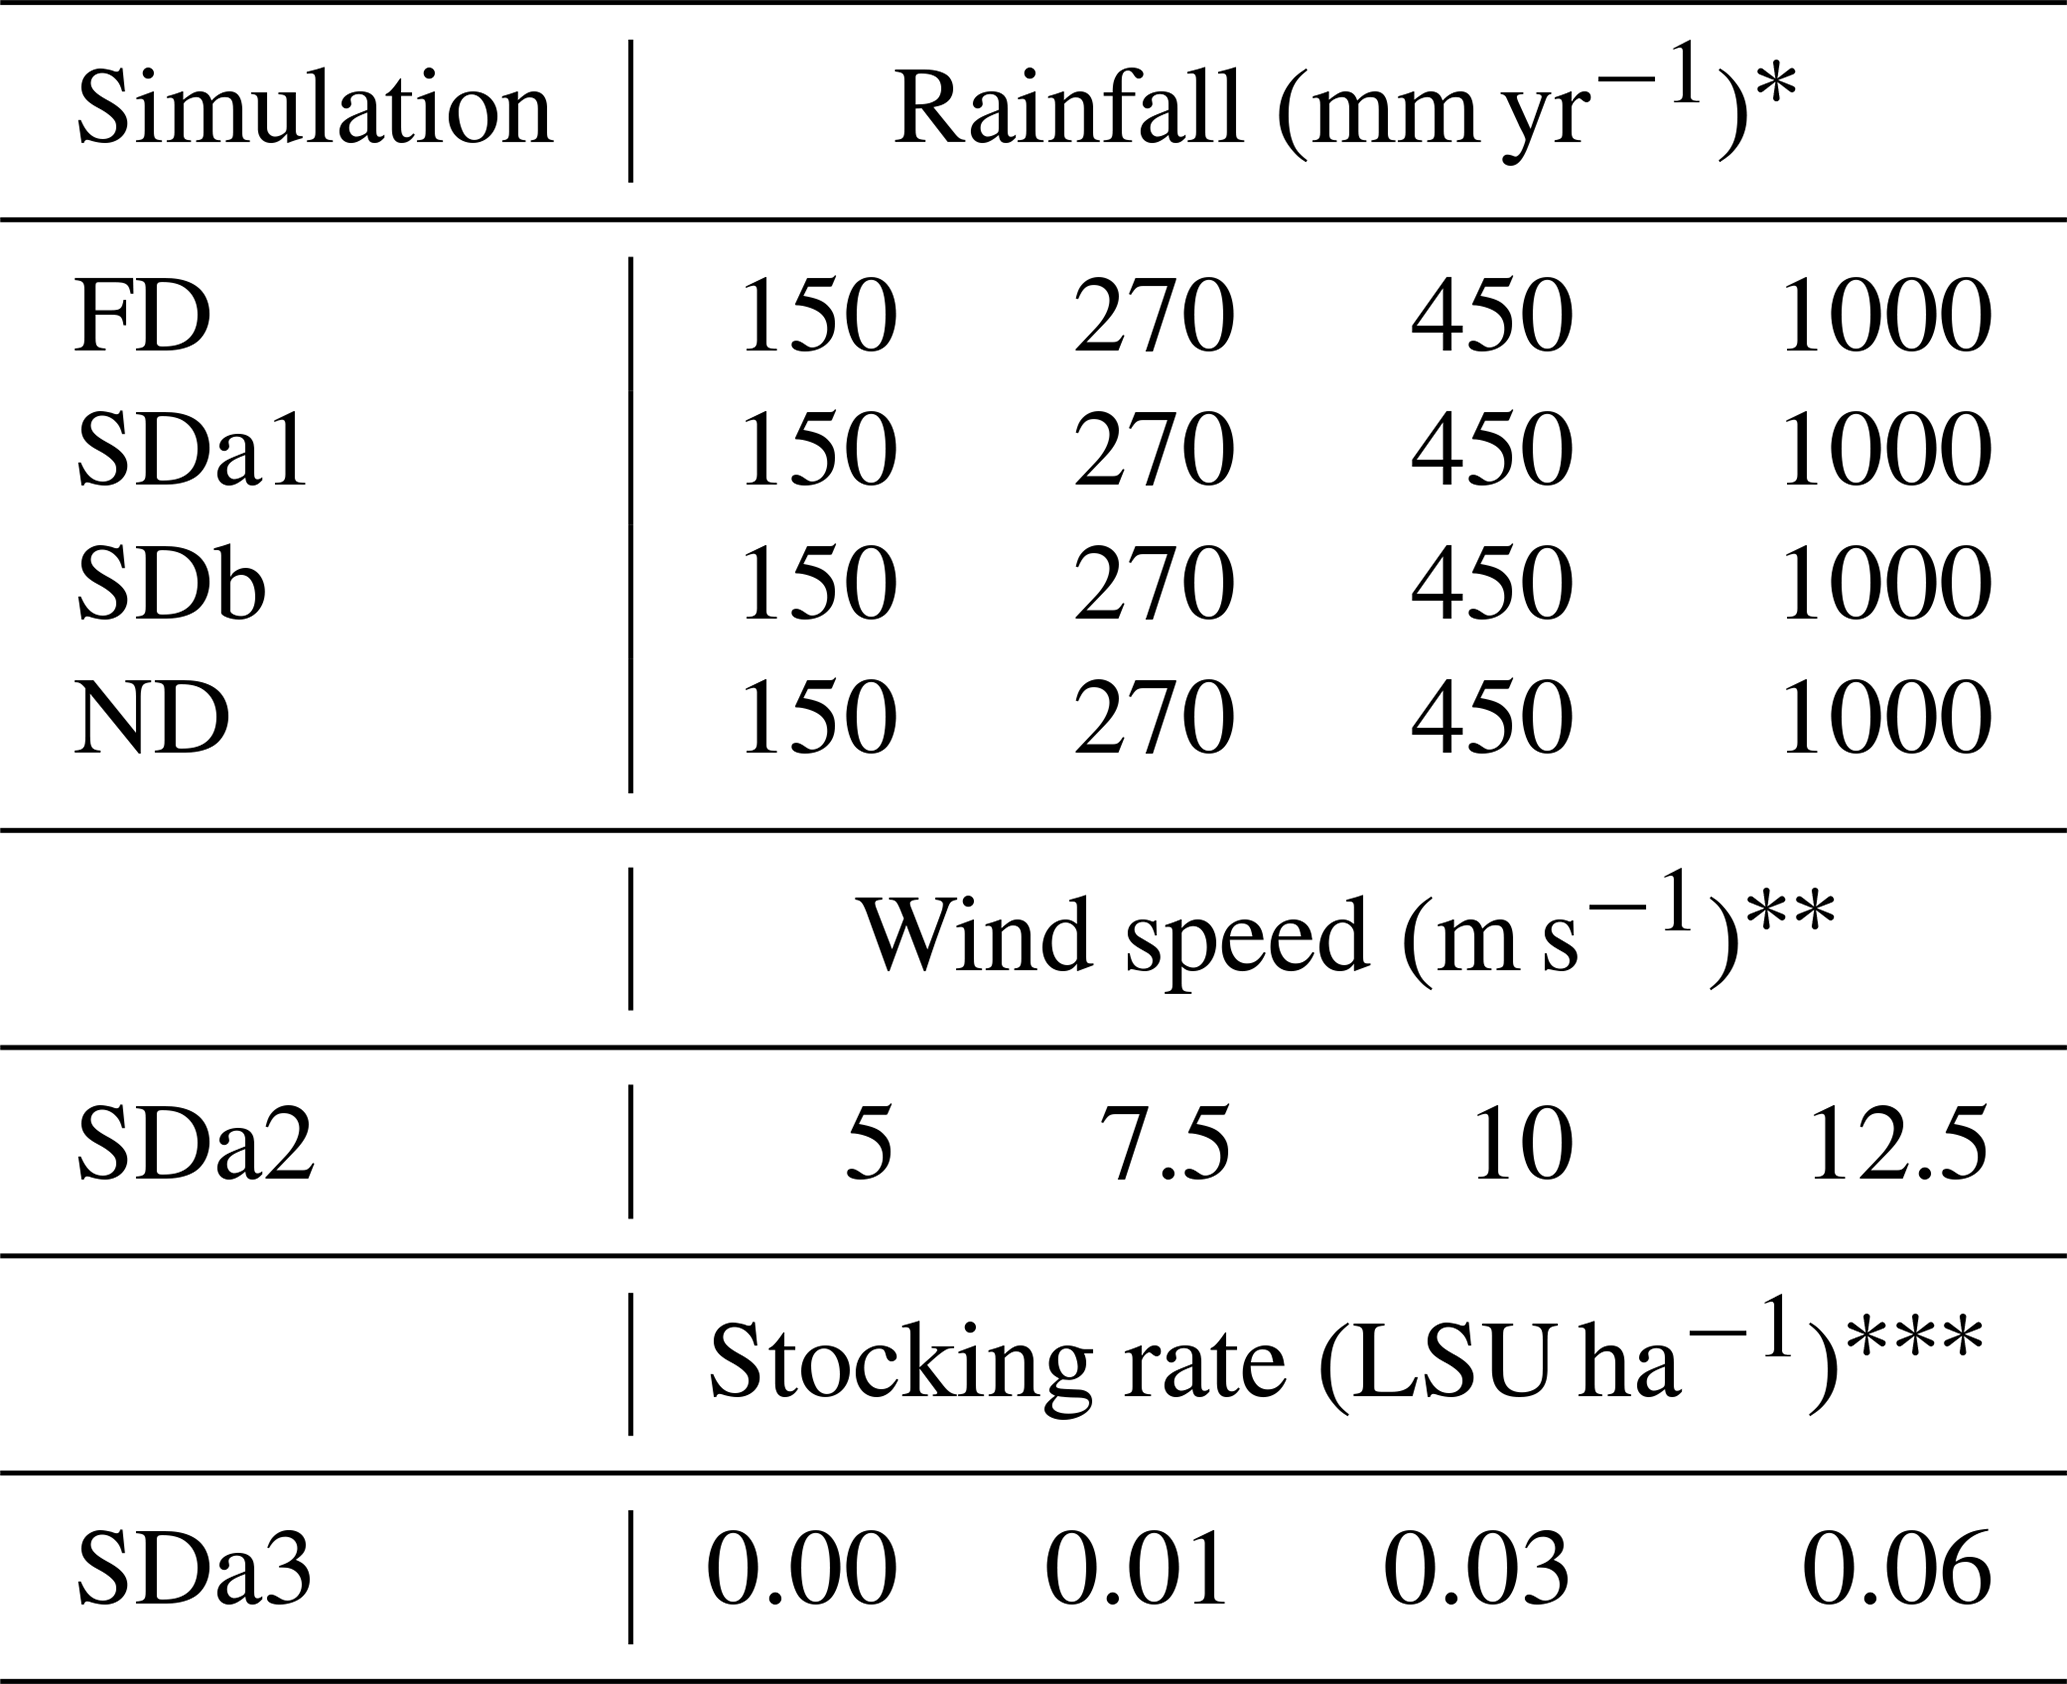
* All simulations executed with wind speeds of 0.0 m s−1. ** All simulations were executed with 270 mm yr−1 of rainfall. *** All simulations executed with wind speeds of 7.5 m s−1 and rainfall of 270 mm yr−1.
Finally, the last component of the model tested was the response of an environment to different stocking rates of grazers (Table 2). The stocking rates of 0.01, 0.03, and 0.06 LSU ha−1, along with a control simulation in which no grazers were introduced, were applied. The grazing pressure was applied continuously throughout the 100 years of simulation in open pastures with evenly distributed boreholes. While this approach to grazing in a semi-arid environment is loosely applicable to real scenarios, it provides a baseline appreciation of the impacts of grazing at an appropriate scale for the chosen scenario. To highlight the impact of the stocking rate, the other parameters were kept at their median levels, including wind speed (7.5 m s−1) and yearly rainfall (270 mm yr−1), across all SDa3 simulations with sediment stress turned off. A 3-month vegetation update was used in this last series of simulations to minimize the timescale difference between the wind, the grazing, and the vegetation processes. Additionally, a vegetation health index was also calculated at the end of each simulation, representing the relative well-being of each type of vegetation. This index is representative of the ratio between the mean height of given vegetation and the potential maximum height of this type of vegetation based on the parameterization of the simulation. Therefore, a vegetation health index near 1 represents optimal growth of the vegetation when most cells are near their maximum height.
In parallel to the development of the new GrAM, the scenarios outlined above functioned as tests to assess the capacity of the ViSTA_GrAM model to create simulations supporting the presence of grazers. The resulting tests of pre-grazing (vegetation dynamics, rainfall, wind speed) and grazing are presented in a progressive construction of the final simulations to inform the representation of a grazed semi-arid environment.
3.1 Pre-grazing simulations
The sediment balance stress and vegetation recolonization heavily influenced the vegetation composition (Fig. 2). All four simulations (FD, SDa1, SDb, and ND) presented their unique evolution of vegetation composition, but they also presented many similarities. The vegetation composition time series identifies similarities among each type of simulation (Fig. 2) while isolating the respective impacts of sediment balance stress and dynamic vegetation recolonization in the model.
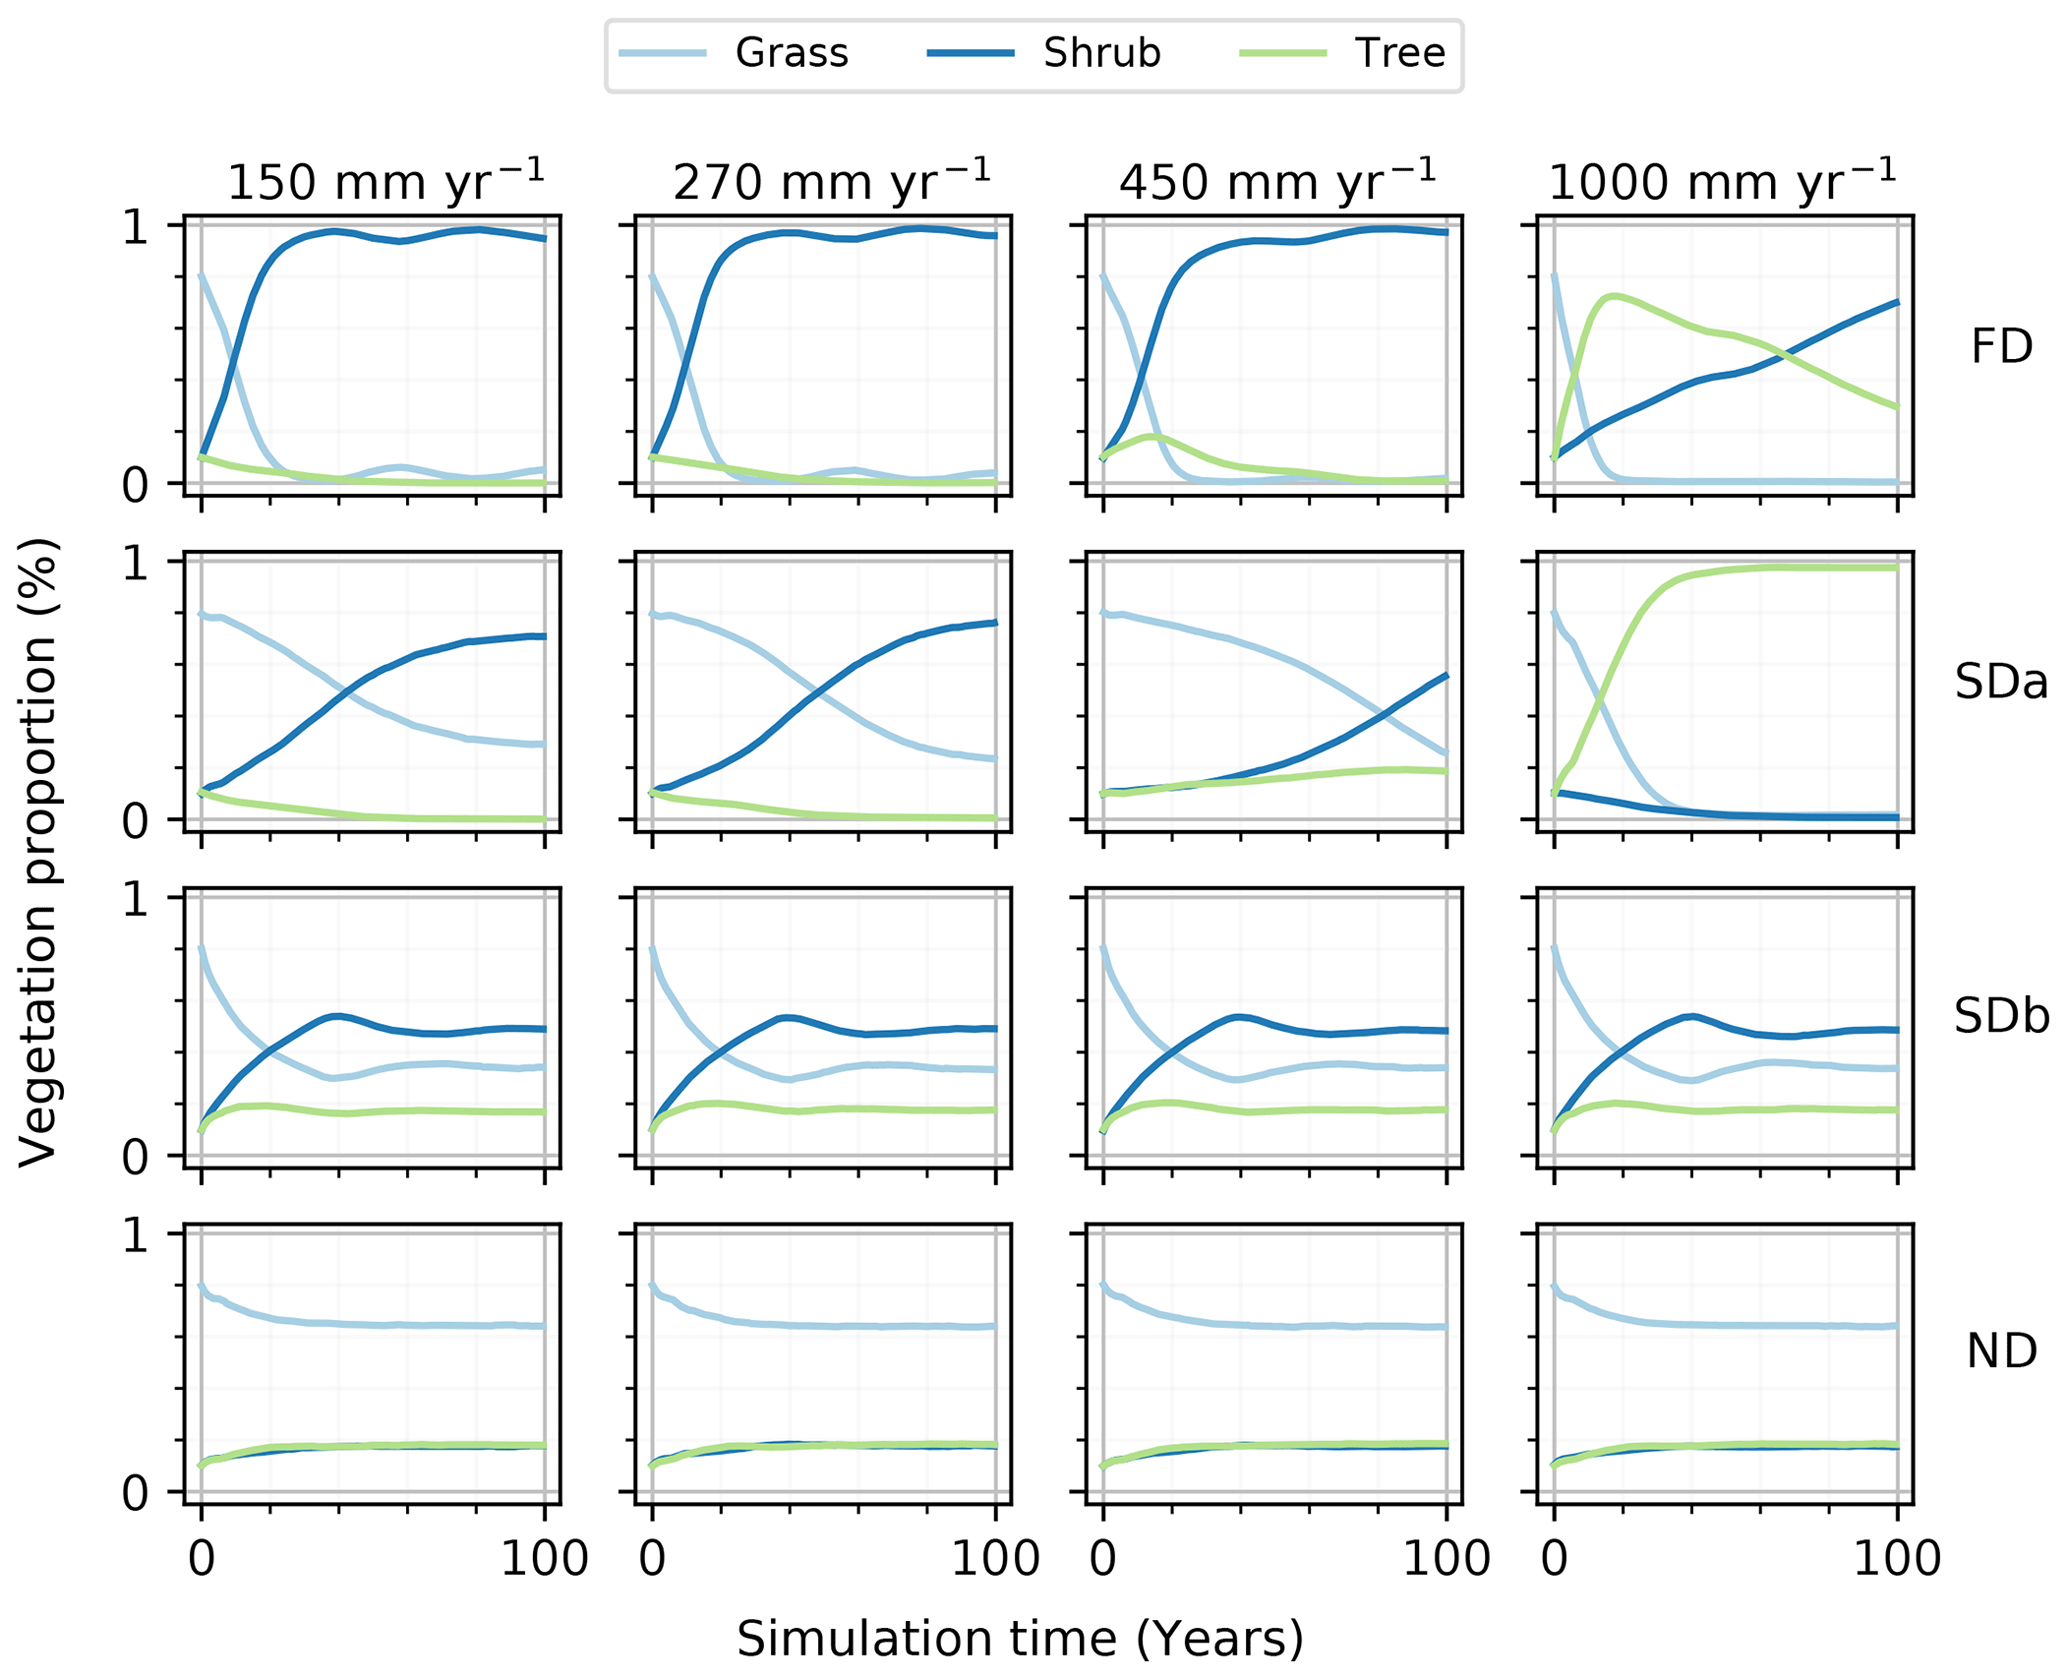
Figure 2Time series of the proportion of the simulation grid occupied by each vegetation type during simulations. The fully dynamic simulations (FD) represent environments where the vegetation is sensitive to a sediment balance stress and have a dynamic recolonization process. The first semi-dynamic simulations (SDa) represent environments where the vegetation recolonization is dynamic, but no sediment balance stress is applied. The second semi-dynamic simulations (SDb) represent environments where the vegetation is sensitive to a sediment balance stress, but the vegetation recolonization is static. The non-dynamic simulations (ND) represent environments where the vegetation is not sensitive to a sediment balance stress and the vegetation recolonization is static.
Beginning with the least dynamic simulation type, the ND simulations presented virtually no variations of the vegetation proportions, staying near the initial proportions of grass, shrubs, and trees of 65 %, 17 %, and 17 %, respectively. The SDb simulations, introducing a stress function relating vegetation growth to the sediment balance, also presented similar proportions of vegetation type regardless of the rainfall regime applied, but with a bigger variation in the vegetation proportions in every single simulation. The SDb simulations showed a quick decrease in the grass proportion from 80 % to 30 % in the first 40 years, mirrored by a shrub increase from 10 % to 56 % over the same period. The SDa1 simulations presented a more defined difference and a more gradual modification of the final vegetation proportions across the rainfall regimes in comparison. The SDa1 simulations presented a general decrease in grass proportion coupled with a general increase in shrub proportion. The tree proportion stayed below 20 % for all simulations except 1000 mm yr−1 of rainfall. The FD simulations all had a rapid reduction of the grass proportion from 80 % to nearly 1 % in the first 30 years. In response to this grass proportion decrease, the proportion of shrubs increased toward 100 %. With higher annual rainfall, a decrease in the rate at which the shrubs approach a proportion of 100 % was observed. Trees filled the proportion gap between grasses and shrubs, representing under 20 % of the total vegetation in all simulations except in the rainfall regime with 1000 mm yr−1, with a peak proportion at the beginning of the simulation that gradually diminished towards 30 %.
The effect of rainfall on vegetation is best observed through the SDa1 simulations. The SDa1 simulations showed a different temporal evolution of the vegetation proportions and a different composition of the final state of the environment with each rainfall level (Fig. 2). Without the important influence of the sediment balance stress on vegetation growth, the impact of each rainfall level on the grid is more easily distinguished. Most SDa1 simulations tended to favor the encroachment of shrubs on the grid. As the rainfall regimes increased from 150 to 450 mm yr−1, the proportion of trees on the final grid became more important (going from 0 % to 19 %), while the grass and shrub composition fluctuated around their initial values. This increase in the tree proportion continued with the highest rainfall regime of 1000 mm yr−1 to 97 %, with only 2 % and 1 % coverage by shrubs and grass, respectively. Additionally, an increase in rainfall from 150 to 450 mm yr−1 induced prolongation of the period of grass prevalence on the grid. The change between a grass-dominated environment and a shrub-dominated one occurred after 42, 48, and 82 years of simulation for the 150, 270, and 450 mm yr−1 simulations, respectively. The 1000 mm yr−1 simulation was the only simulation not following this trend, with the grass proportion initially decreasing quickly and being replaced by trees instead of shrubs.
The health index calculated for each of these simulations was not very sensitive to rainfall. For example, the SDa1 simulations had a grass health index of 0.8 ± 0.01, a shrub health index of 0.54 ± 0.02, and a tree health index of 0.46 ± 0.02 across all rainfall regimes. This contrast in the vegetation health trend with the large trends in observed vegetation proportion demonstrated that a higher proportion of a given vegetation type does not directly imply a healthier development. This difference also suggested that vegetation growth was not limited by rainfall.
Sediment transport was expected to scale with wind speed if no modifications were made to the surface (Martin and Kok, 2017). The SDa2 simulations effectively showed a proportional increase in the mean sediment transport with each increase in the wind speed level above the 5 m s−1 sediment transport threshold (Fig. 3). Compared to the base erosion rate of 5.48×10⁻⁴ g m−2 s−1 in the 5 m s−1 simulation, there was a large increase to 8.99×10⁻², 2.43×10⁻¹, and 3.28×10⁻¹ g m−2 s−1 with wind speeds of 7.5, 10, and 12.5 m s−1, respectively. The ratios between the volume of sediment eroded during each iteration and the maximum volume eroded over the entire simulation suggests a general decrease in the erosion rate over the length of the simulations. More specifically, the simulations above the erosion threshold observed average eroded volumes representing ≈ 40 % of the maximum eroded volumes (coefficient of variation 1.01, 0.13, 0.15, and 0.18 for 5, 7.5, 10, and 12.5 m s−1, respectively). This decrease in transport occurred along a smoothing and an organization of the sediment surface (which was initialized with random height). While the total amount of sediment eroded increased with the wind speed applied to the grid, the ratio to the maximum volume of erosion decreased with increasing wind speed. At 7.5 m s−1, the transport represented 60 % to 90 % of its maximum volume eroded, while at 10 m s−1 the ratio was 50 % to 75 %, and at the 12.5 m s−1 wind speed it was between 40 % and 70 % of its maximum volume eroded.
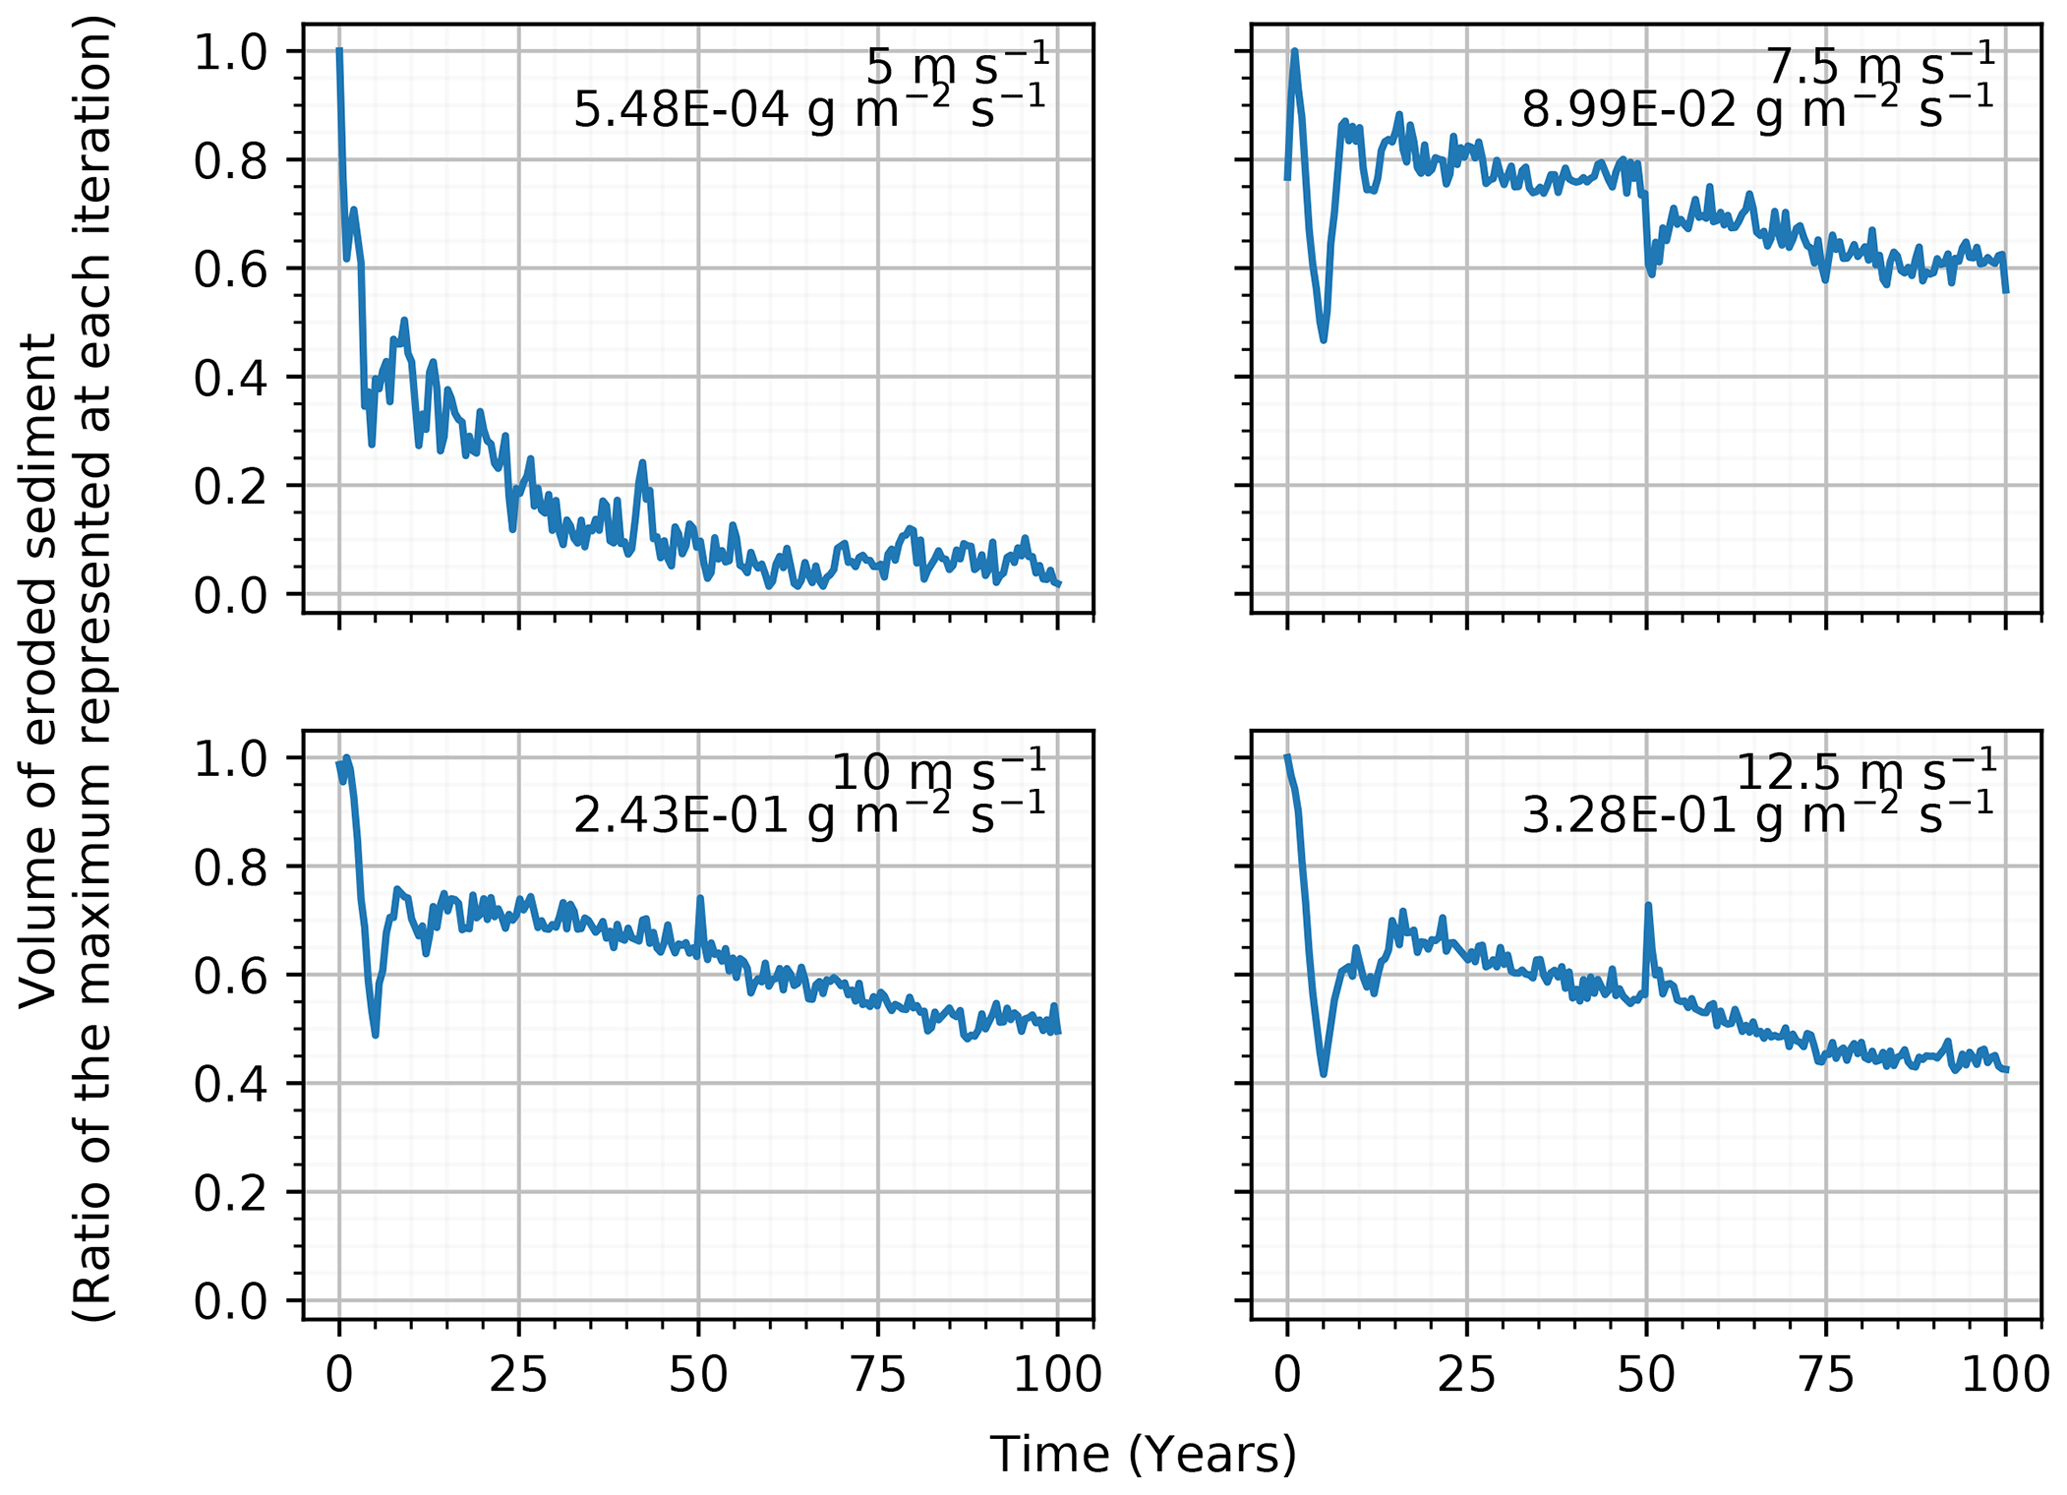
Figure 3Time series of eroded sediment volume and the mean erosion rate of 5-year simulations with different wind speeds.
3.2 Grazing simulations
The stocking rate was tested with the SDa3 simulations (7.5 m s−1 wind speed and 270 mm yr−1 rainfall regime), resulting in an environment with a continuous majority of grass during the 100 years of simulation. Without grazing, the grass proportion decreased from ≈ 85 % to ≈ 68 % of the grid through the simulation, mirrored by a proportional increase in shrubs, while the trees disappeared after the 55th year of simulation. The grass was also in good health with a final health index of ≈ 0.72, while the shrubs were significantly well developed with a final health index of ≈ 0.40. Since the grass was in good health and represented more than 68 % of the vegetation on the grid, the environment of reference with no grazing showed it could sustain a good quality of forage for the entirety of the simulation. Therefore, any significant degradation of the grass that would have prevented the grazers from sustaining themselves can then be confidently attributed to the grazers themselves and not to the natural degradation of the environment. With the addition of grazing agents in the SDa3 simulation, no large effect on the vegetation proportions or the vegetation health was observed. The final grass proportion, regardless of the stocking rate applied, was around 68 % with a final shrub proportion around 32 %. The health of the vegetation was invariant among each simulation, equal to ≈ 0.72 for the grass, ≈ 0.40 for the shrubs, and ≈ 0.22 for the trees. The final vegetation health index of trees was more variable than the other vegetation types, but they also represented less than 1 % of the vegetation on the grid, so their index was appreciably more sensitive.
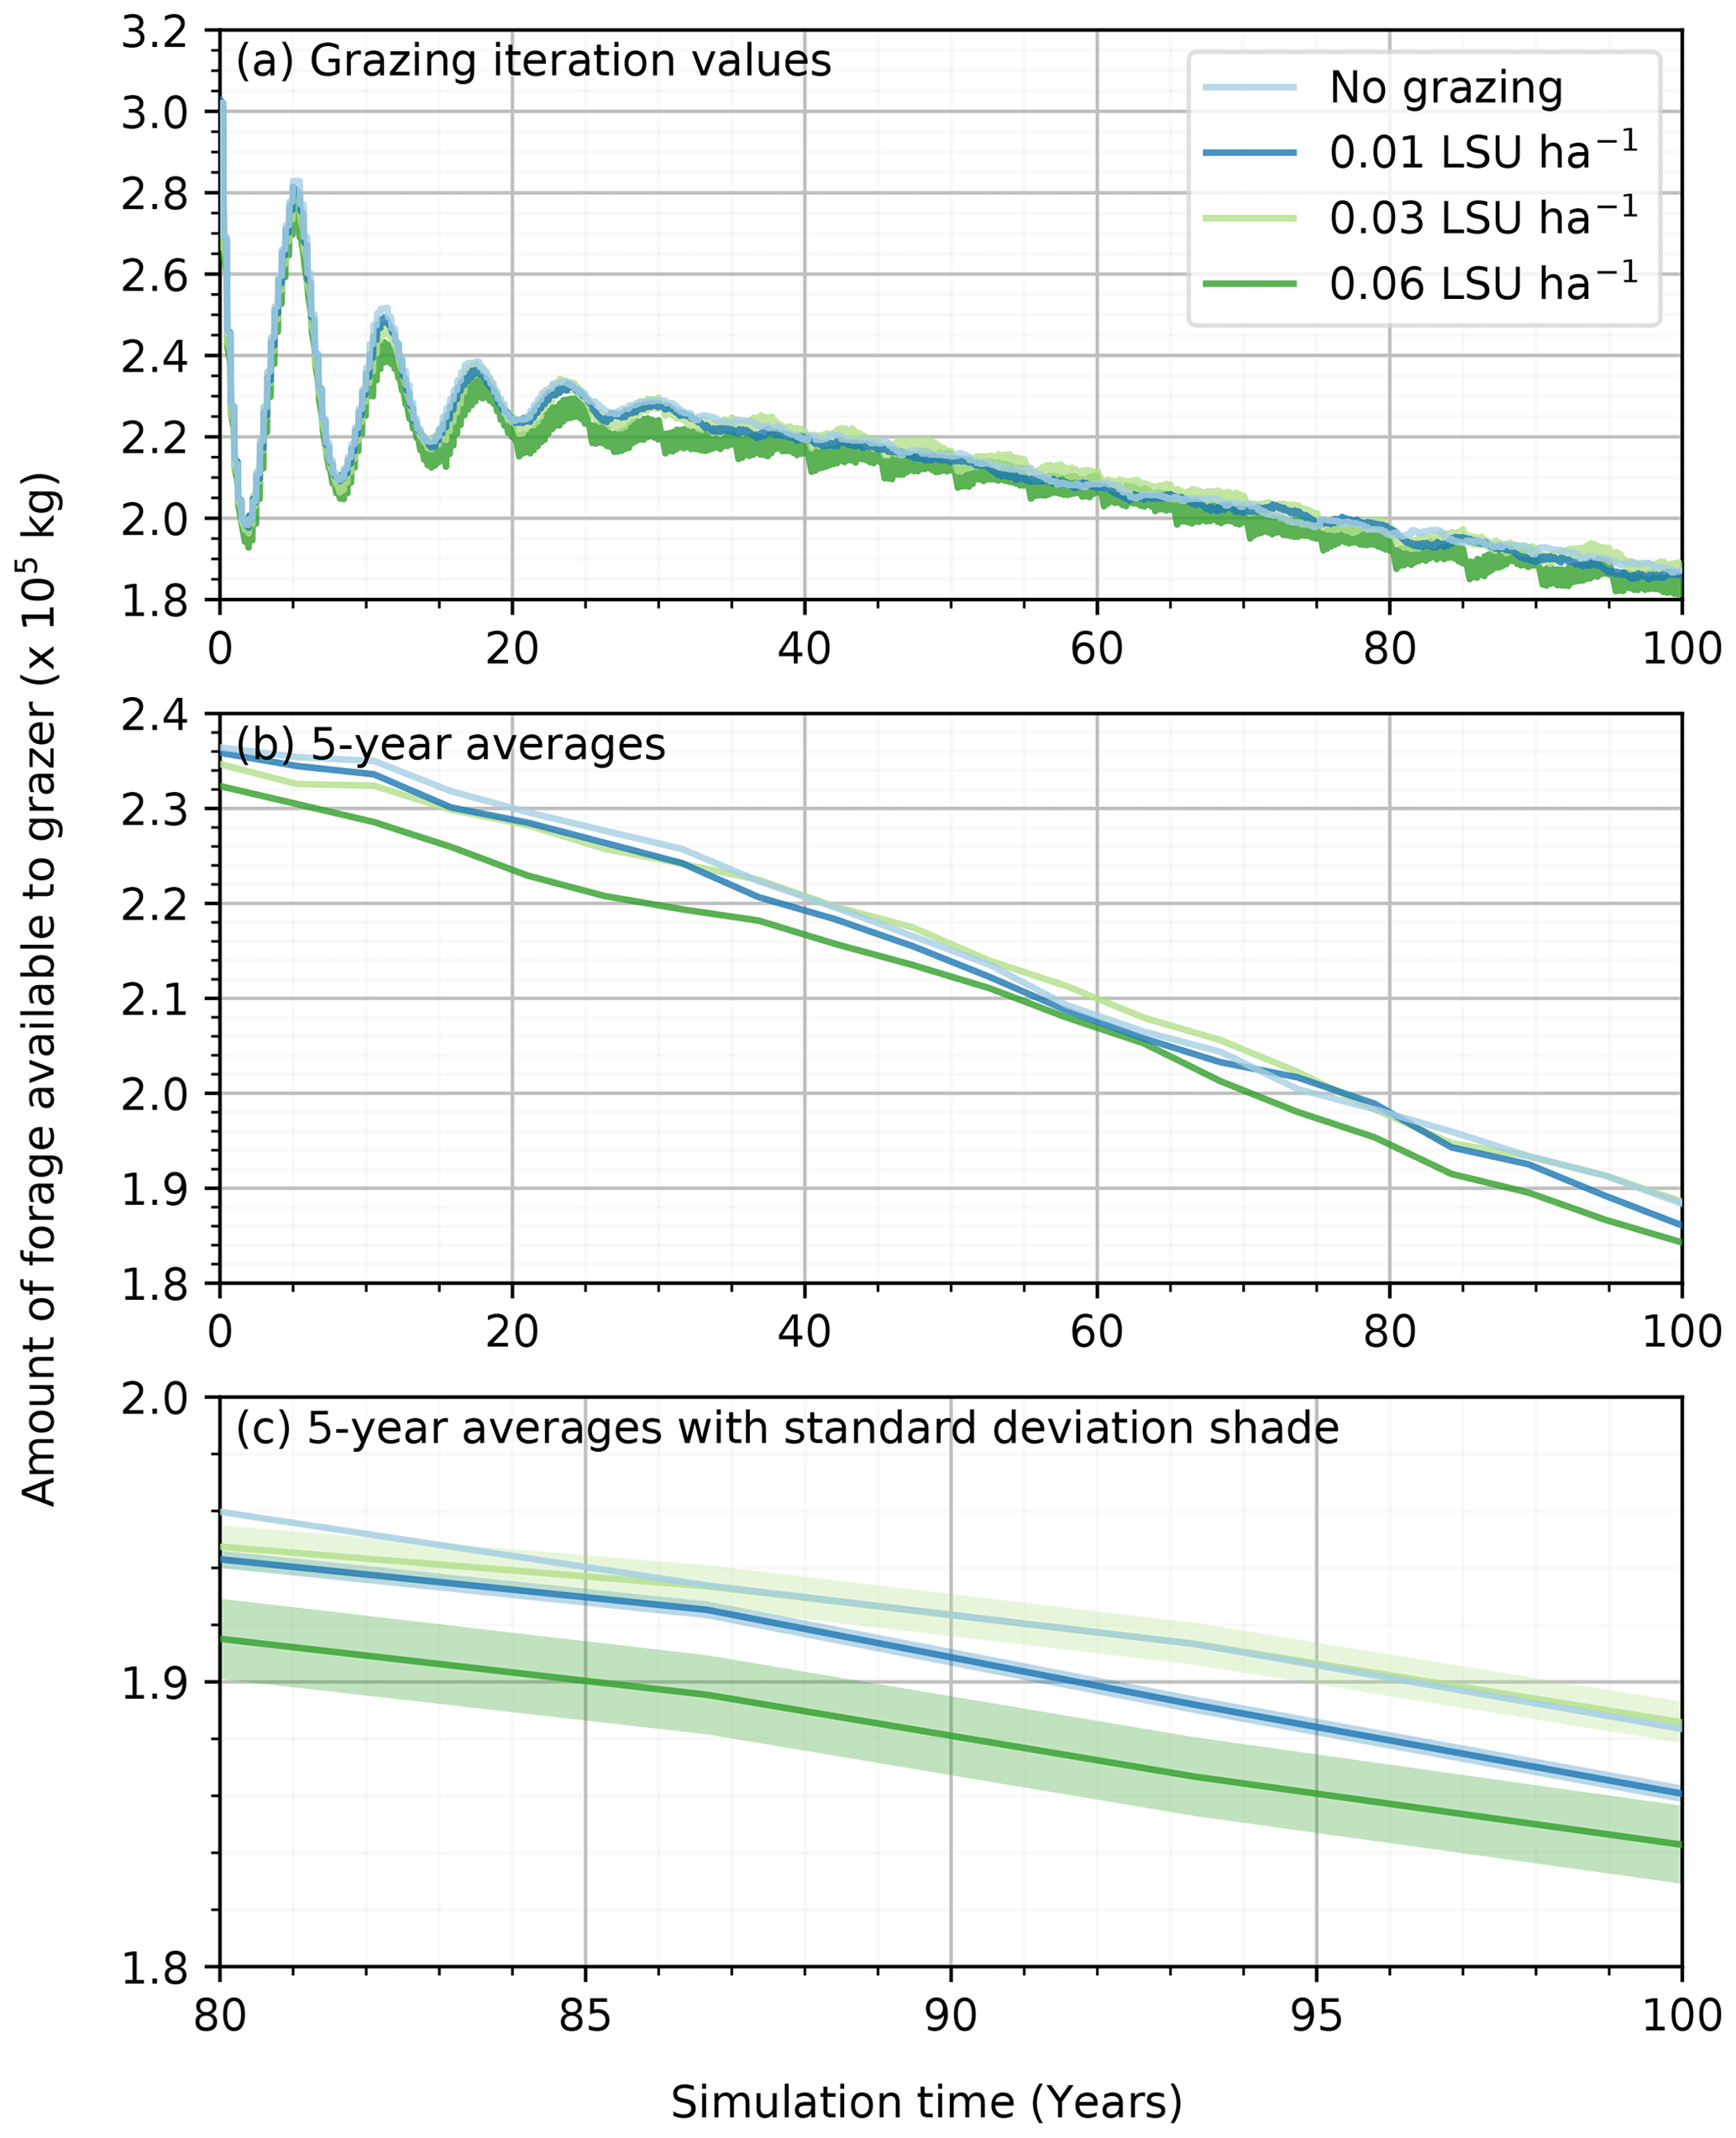
Even if the presence of grazing agents did not translate to a significant modification of the vegetation on the simulation grid, we cannot conclude that the grazers do not affect the landscape in the simulations. One of the outputs of the ViSTA_GrAM model illustrating the impact of stocking rate on the vegetation was the total amount of forage available to grazers at each iteration (Fig. 4a). The total amount of forage on the grid represents the sum of the volume of grass on each cell multiplied by its volumetric mass. While the forage availability was similar at the seasonal scale (Fig. 4b), there was an increasingly large variation in the amount of forage available between each seasonal vegetation update with an increase in the stocking rate (Fig. 4c). The removal of grass in the short term by the grazers was therefore mitigated by considerable regrowth of the grass with each new vegetation (seasonal) iteration, which increased with stocking rate and compensated for the action of the grazers (Fig. 4a). The mean natural (no grazing) regrowth rate of 43 mm per season in the simulation increased to 46, 52, and 60 mm for the simulations with 0.01, 0.03, and 0.06 LSU ha−1, respectively. Therefore, the amount of available forage over the long term was similar in all simulations, with the final amount of foraging approaching 1.85×10⁵ kg regardless of the stocking rate applied and despite the mean daily foraging being kept at ≈ 9.5 kg d−1 per grazer. The grazers were therefore eating enough daily to sustain themselves on the grid without external supplementing (e.g., roaming off grid or feed), with the grass regrowing the biomass required to conserve sufficient grazing efficiency.
The muted effect of grazing on the vegetation also limited its impact on sediment transport. Temporal removal of vegetation on the grid surface between each vegetation update could have released patches of sediments previously trapped by vegetation. The mean saltation rate of the simulations with no grazing was 1.37×10⁻⁴ kg m1 s−1 and increased slightly to 1.43×10⁻⁴ kg m−1 s−1, with the highest stocking rate of 0.06 LSU ha−1. In contrast, both the 0.01 LSU ha−1 and 0.03 LSU ha−1 simulations observed slight increases in mean saltation rates of 1.38 × 10⁻⁴ and 1.39 × 10⁻⁴ kg m−1 s−1 relative to the no grazing simulation. These differences in sediment transport between the diverse stocking rate simulations were not pronounced enough to be significant but suggested the possible effect of greater vegetation degradation on simulations.
The components of arid environments (e.g., vegetation, rainfall, sediment transport, and grazing) studied in the simulations of the ViSTA_GrAM model are all fundamental factors that influence the organization and composition of their respective environment, and any modification to their associated processes should then yield different states of the environment. The outputs obtained from the ViSTA_GrAM simulations demonstrated general agreement between published results of other studies and the model response to variations in the rainfall, wind speed, and stocking rate. The impacts of each component on the final state of the model were not only interesting for their ability to inform future scenarios but also because they provided the opportunity to compare the level of influence of each change in the environment in conjunction with one another.
4.1 Vegetation dynamics
Low proportions of grass on the FD and SDb simulation grids were observed since there was no transport of sediment in these simulations, significantly hindering the survival of grass. In comparison, the shrubs observed optimal growth with a sediment balance of 0 m. This made it the favored vegetation type, even over the trees, which had a stress index of zero with a sediment balance of 0 m. In the absence of sediment transport, the vegetation composition of the grids was heavily influenced towards one dominated by shrubs. The original model was parameterized to represent the sediment balance stress effect on pioneer grasses (e.g., Stipagrostis amabalis or Ammophila grass) that optimally grew when buried by sediments (Mayaud et al., 2017c). These results are not representative of all types of semi-arid environments but are mainly characteristics of coastal dune fields (e.g., in Canada). Most of the humid and stabilized sandy environments of southern Africa, for example, demonstrate a greater proportion of trees as opposed to shrubs (Bond et al., 2003; Staver et al., 2011). Even in lower rainfall regimes, the quickly increasing proportion of shrubs in the FD simulations, compared to the results of the SDa1 simulations, was indicative of the model being sensitive to the sediment balance stress. While wind-borne sediment transport was expected to be an important factor for the vegetation organization in environments where moisture availability is low, it was also expected to decrease with increasing moisture availability (Ravi et al., 2010). The effect of sediment transport on the growth curve of vegetation is also difficult to generalize to a wide variety of species considering that the growth function of each species will have a unique response to sediment burial or erosion (Brown, 1997; Dech and Maun, 2006; Maun, 1998; Maun and Perumal, 1999; Moore, 1996; Van der Putten et al., 1993). For example, the parameterization of a sediment balance stress for coastal dunes would not apply to inland stabilized desert dunes. Even if it allowed for the observation of an important dynamic in some specific arid environments, the sediment balance stress was not applied to vegetation in subsequent tests. Heavy reliance on the parameterization and subsequent sensitivity of the model to sediment transport would have made it difficult to obtain a balanced coexistence of the multiple vegetation types.
The dynamism of the vegetation recolonization was another important component of the model that significantly influenced the simulations through environmental conditions (e.g., rainfall regimes) to significantly influence the vegetation proportions on the grid. This dynamism is normally observed in a natural environment where water availability and established vegetation will influence the type of vegetation that is the most likely to prosper in that environment (Baudena et al., 2010; Higgins et al., 2000; Scholes et al., 2002; Scholes and Archer, 1997; Van Langevelde et al., 2003). A non-dynamic vegetation recolonization in arid environments, in comparison, represented an actively managed landscape. The ND simulations represented environments where similar proportions of each vegetation type were maintained by an external force each year regardless of the water availability or established vegetation (e.g., cultivated fields). While this did not prevent the vegetation from dying, it ultimately balanced the vegetation proportions between the mortality rate and the recolonization rate of each vegetation type. If the effort to keep the vegetation cover stable in these environments stops, the environment often undergoes a significant modification of its present vegetation cover (Abella et al., 2009; Carpenter et al., 1986). The importance of changes in the vegetation composition, once any external influences stop, can give an appreciation of the amount of energy necessary to keep their composition stable. Since the model did not explicitly calculate the amount of energy necessary to maintain a stable environment, the ND simulations were difficult to use as realistic prevision models for future scenarios. Nevertheless, non-dynamic simulations like ND and SDb are good examples to highlight the dynamic nature of SDa1 and FD simulations.
The FD and SDa1 simulations have demonstrated their capacity to realistically represent fundamental processes within arid environments. While the FD simulations explicitly considered more interactions between components, the hypersensitivity of the vegetation to sediment stress limited the viability of this type of simulation to evaluate the impact of other landscape dynamics. The more reasonable sensitivity to environmental changes in the SDa1 simulations made it more realistic for observing the impact of rainfall, wind speed, or grazing regimes on the model.
4.2 Rainfall
The rainfall regime of an environment was one of the most influential components of the vegetation state of a simulation when the vegetation recolonization was dynamic. Since climate classification systems are based on rainfall amounts to classify types of environments around the globe (Lehmann et al., 2011; Middleton and Thomas, 1997), it was expected that this component of the model would have a significant impact on the evolution of the environments simulated. The reduction of rainfall in some arid environments could lead to dune remobilization to completely change the dynamic states of these environments (Bhattachan et al., 2014). In the context of climate change, the study of rainfall regime impacts on arid environment composition is of key interest.
The model ViSTA_M17 calibration tests already demonstrated that the response of the vegetation to multiple rainfall regimes with similar conditions as the SDa1 simulations corresponded to real vegetation patterns and temporal evolution (Mayaud et al., 2017a). The dominance of shrubs over grass in all SDa1 simulations with 450 mm yr−1 or less did not correspond to what was initially expected, but it was also not outside what is realistically observed in African semi-arid and savanna environments (Bond et al., 2003; Hassler et al., 2010; Lehmann et al., 2011; Ludwig et al., 2017; Sankaran et al., 2005). In reality, African semi-arid environments with less than 650 mm yr−1 of rainfall tend to present higher proportions of grass (Hassler et al., 2010; Ludwig et al., 2017; Sankaran et al., 2005) but will also have a lesser vegetation composition reliance on rainfall regime (Bond et al., 2003; Lehmann et al., 2011). Under low rainfall regimes (<650 mm yr−1), if there is no secondary factor encouraging the growth of grass, a significant proportion of shrubs emerges alongside grasses (Burgess, 2006; Kraaij and Milton, 2006; Oñatibia and Aguiar, 2016). The simulation in which grass persisted the longest (rainfall regime of 450 mm yr−1) was also that in which rainfall had the most influence on the vegetation proportions and therefore encouraged grass-dominated vegetal cover. Tree populations thrived at rainfall amounts of over 650 mm yr−1, and in the absence of recurring fires, this influence of the rainfall is expected to ultimately lead to a closed woodland (Bond et al., 2003; Burgess, 2006; Lehmann et al., 2011; Sankaran et al., 2005; Scanlon et al., 2007; Staver et al., 2011). The resulting landscape observed with the SDa1 simulation at 1000 mm yr−1 was a prime example of this situation (Fig. 2). The ViSTA_GrAM model demonstrated the major impact a rainfall regime can have on the vegetation composition of an environment but also highlighted the need to consider other factors to represent the entirety of vegetation diversity within arid environments.
The relatively high and constant health index of the grasses observed in the SDa1 simulations regardless of the rainfall regime and grass proportion was another indicator of the complexity involved in the growth of vegetation in arid environments. Even if the final proportion of grass was often lower than the proportion of shrubs and trees, the grasses had more rapid growth than the other two types of vegetation. This optimization also explains why an increased grass proportion was observed in simulations with vegetation updates every 3 months compared to updates every 6 months. This change in vegetation composition represents the importance of the seasonality of disturbances in environments with limited moisture availability (Lehmann et al., 2011; Staver et al., 2011). The resulting landscape of the SDa3 simulations with an update in vegetation every seasonal change (3 months) was very similar to what is observed in the ranging land of Namibia (Hassler et al., 2010; Ludwig et al., 2017) and why the SDa3 simulation (with the 3-month vegetation update) was used in the simulations testing stocking rate effects in the ViSTA_GrAM model.
4.3 Sediment transport
The effect of climate change on wind speed is regionally variable and uncertain, with some regions demonstrating increases in the magnitude and frequency of the wind, resulting in an overall increase in the mean wind regime (McInnes et al., 2011). Therefore, regional studies of the response of wind-driven environments to wind climatology changes are needed to help manage arid and semi-arid environments in the future. For example, an increase in wind speed would increase the erosion rate even if there is no modification of the other surface variables. Furthermore, with an increase in wind speed coupled to the remobilization of sediment due to a decrease in vegetation, the resulting transport would exponentially increase (Bhattachan et al., 2014). The SDa2 simulations presented similar surfaces to interact with varying wind speeds, resulting in a linear increase in saltation rate with wind speed (Fig. 5), corresponding to the findings of Martin and Kok (2017). To allow a better comparison of the results between the two studies, wind speeds of 5.0, 7.5, 10, and 12.5 m s−1 were transformed to equivalent shear stresses of 0.09, 0.14, 0.18, and 0.23 N m−2, respectively. From Fig. 5, it is possible to identify significant similarities between the results of the SDa2 simulations in the ViSTA_GrAM and the Martin and Kok (2017) Jericoacoara and Rancho Guadalupe sites (their Fig. 2). The increase in sediment transport between each shear stress level is nearly identical between the model and the field studies, despite the different values of sediment transport since the landscapes of the SDa2 simulations were highly vegetated and the Jericoacoara and Rancho Guadalupe sites were bare. The rate of eroded sediment emissions in the ViSTA_GrAM model was difficult to directly compare to empirical data because the model is presently not able to return a horizontal saltation flux. The sediment interactions were not less realistic in the model because of this, but the addition of the saltation flux as a module-level output would certainly help the model to study future landscape management scenarios.
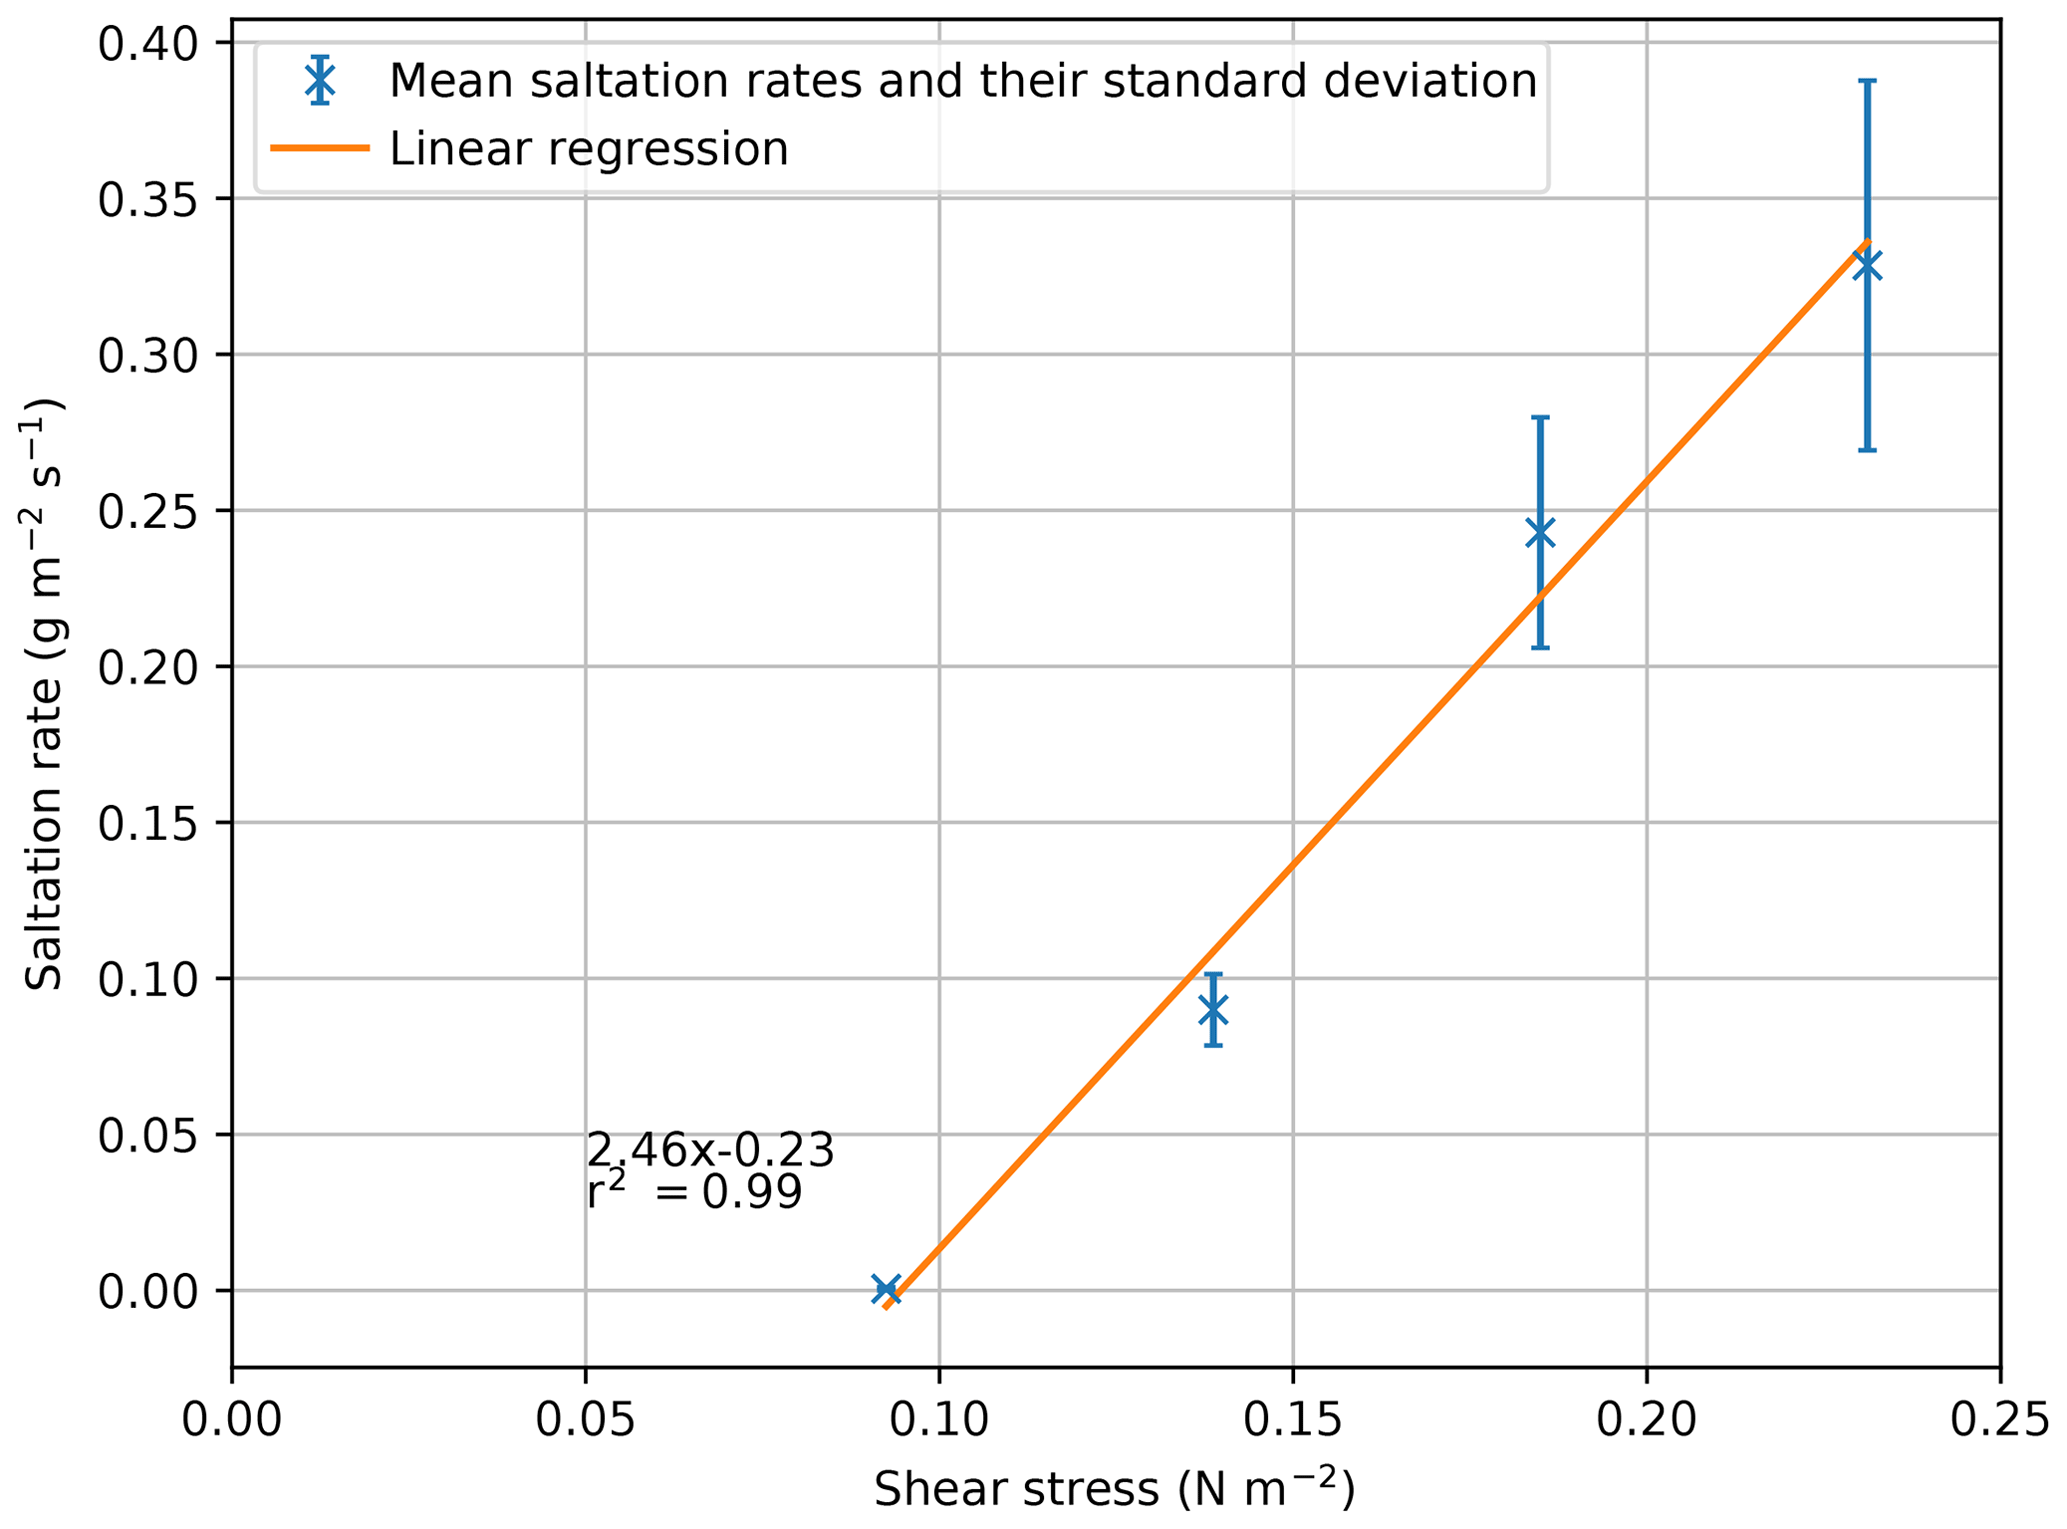
Figure 5Relation of the mean saltation rates and their standard deviations to shear stress (p value = ).
4.4 Grazing
Grazing is a type of disturbance that can harm vegetation, leading to a degradation of the vegetation cover over time under unsuitable grazing strategies. The SDa3 simulations, testing the impact of grazers with the model ViSTA_GrAM (Table 2), showed little influence of grazing on vegetation final states. Even if these results are not very different from those obtained by the original model ViSTA_M17 (Mayaud et al., 2017a), the ViSTA_GrAM model simulations presented additional insights on the interaction between grazers and vegetation in southern African semi-arid environments. While the vegetation was not altered by the grazing enough to produce a change in its spatial organization or coverage, the impact of the grazing was noticeable when looking at the evolution of the total biomass of grasses between the update of vegetation and the response in the mean growth of the grasses. The combination of a decrease in the available grass biomass and an increase in the mean growth of the grass under an increasing stocking rate applied in the simulations suggests that the environment can compensate for the action of the grazer. The grasses experienced an increasing growth rate under grazing, allowing the environment to recuperate the foraged biomass. This compensation mechanism has already been recognized in previous studies (Hickman and Hartnett, 2002; Leriche et al., 2001; McNaughton, 1983) to highly limit the degradation of vegetation under a low to moderate stocking regime. Under an intensive stocking regime, the regrowth rate of vegetation does not equate to grazing degradation and results in a change in the vegetation spatial reorganization and a decrease in the grass proportion (Aubault et al., 2015; Hickman and Hartnett, 2002; Jeltsch et al., 1997a). The maximum stocking rate an environment can sustainably carry is highly variable based on the vegetation species, the nutrient availability, and the water availability (Hickman and Hartnett, 2002; McNaughton, 1983; Rietkerk et al., 1997, 2002). Therefore, the environmental conditions of a landscape influence the impact of grazers and concurrently influence the vegetation repartition, making their impacts in shaping landscapes less apparent than other variables (e.g., rainfall) because the impact is muted by other environmental dynamics. Multiple studies in arid and semi-arid grasslands, with environmental conditions similar to the ones represented in the SDa3 simulations, showed the same increase in vegetation biomass production in response to the presence of grazers (Aubault et al., 2015; Ludwig et al., 2017; Yu et al., 2019). The lack of sensitivity to varying stocking rates in the results presented in this study is therefore attributed to the sensitivity of the environment to grazing and not to the sensitivity of the model itself.
The results from this study demonstrated that the changes in the amount of sediment eroded were influenced more by the vegetation organization than the stocking rates applied. Knowing that no significant changes in the transport rate will be observed without significant changes in the long-term vegetation cover, the small intermittent increases in sediment erosion in the SDa3 simulations can be associated with the degradation in vegetation cover by foraging even though it is not reflected in the mean amount of sediment eroded. The increase in stocking rate suggests that there is potential for increased sediment transport, but it is not translated into long-term increased transport because of the lack of change in the vegetation cover. Again, while the present simulation configuration does not result in a significant difference in sediment transport amounts, it demonstrates the capability to exhibit variation in transport under different environmental conditions.
The ViSTA_GrAM model demonstrated its capacity to represent the multiple processes defining arid environments and that a deeper representation of the dynamics of grazing is possible with the help of an agent-based model. The similar outcomes of the simulations with different stocking rates suggest that the influence of each modeled process on the resulting landscape returned by the model is not well known. While the presentation order of each process in this paper provides information on the general hierarchy between the processes, the sensitivity tests presented are not complete enough to compare the effect of each of these processes on a normalized scale. Further work on a normalized sensitivity classification of each process would allow for a quantifiable comparison of their importance and help guide impact studies of environmental change in arid environments.
This study proposed and implemented a model to represent realistic vegetation and aeolian process dynamics in a semi-arid environment. This ViSTA_GrAM model extended the modeling capacities of the ViSTA_M17 model by representing grazing interaction via an ABM module. The rescaling of the simulation grid to 200 by 200 cells of 5 m resolution allowed for the representation of a larger landscape without diminishing the pertinence of the interactions between the model components. Series of simulations, representing hypothetical semi-arid environments, were compared to published results in peer-reviewed literature and have demonstrated the capacity of the ViSTA_GrAM model to effectively represent the interaction between vegetation, the rainfall regime, sediment transport, and grazing in a theoretical context. The integration of GrAM within the ViSTA_GrAM model showed the results of the vegetation interactions with grazers at a finer scale than the original ViSTA_M17 model, highlighting the complex nature of those interactions and reaffirming the need for an integrative approach to study these processes.
The model in its current state still has some limitations, notably concerning the representation of sediment transport and the sensitivity of the model vegetation growth to this transport. To address these limitations and offer a better evaluation of the model application to real semi-arid environments, future work should include adding the horizontal saltation flux as an output, introducing several grass species growth response curves, and calibrating the model against other available empirical data. With further development of the model and with an application of the model made in direct comparison to empirical data, we think it can offer an invaluable tool to help extend our understanding of arid environments and to help improve landscape management in such environments.
This Appendix describes some inconsistencies between the ViSTA_M17 representation of sediment transport and the ViSTA_GrAM aims that led to the modification of some processes within the former model. Two aspects of the sediment transport processes posing a problem with the implementation of the new GrAM were the timescale at which recognizable dunes were formed and the impact of wind angles on the resulting landforms. The identification of these processes during the development of the ViSTA_GrAM model led to the modification of the ViSTA_M17 to address these issues, but due to some limitations in the resources available, they could not be entirely addressed and resolved. Future users of the model should be aware of these limitations (detailed below) and use the model accordingly.
The timescale at which recognizable dunes were formed in ViSTA_M17 simulations was found to be abnormally quick for vegetated environments following a review of the original documentation (Mayaud et al., 2017a) and subsequent testing of the ViSTA_M17 model. Even with vegetation coverage on 90 % of the grid and low wind speeds of 5.625 m s−1 (considering a threshold of 5.0 m s−1), the model was observing increases in sediment heights of 1.5 m in 5 years (Fig. A1). With a wind speed of 10 m s−1 or more, dune ridges of ≈ 10 m height were formed in 5 years, while similar landforms are normally formed over 100 to 1000 years in a natural environment (Hugenholtz et al., 2012; Lima et al., 2002; Yan and Baas, 2018). This level of mobility of the sediments, despite the generalized vegetation coverage, highlighted a clear underestimation of the vegetation's influence on sediment mobilization. Therefore, an updated module, limiting the erosion of sediment under vegetation cover, was introduced in the ViSTA_GrAM model. By inhibiting erosion on cells with vegetation high enough to favor deposition, the accumulation of sediment was limited (e.g., to a maximum of 1 m in 5 years at a high wind speed of 12.5 m s−1). The resulting landforms of these simulations with the new module that inhibited erosion became more aligned with those observed in a semi-arid environment and where grazing occurs (Lima et al., 2002; Yan and Baas, 2018).
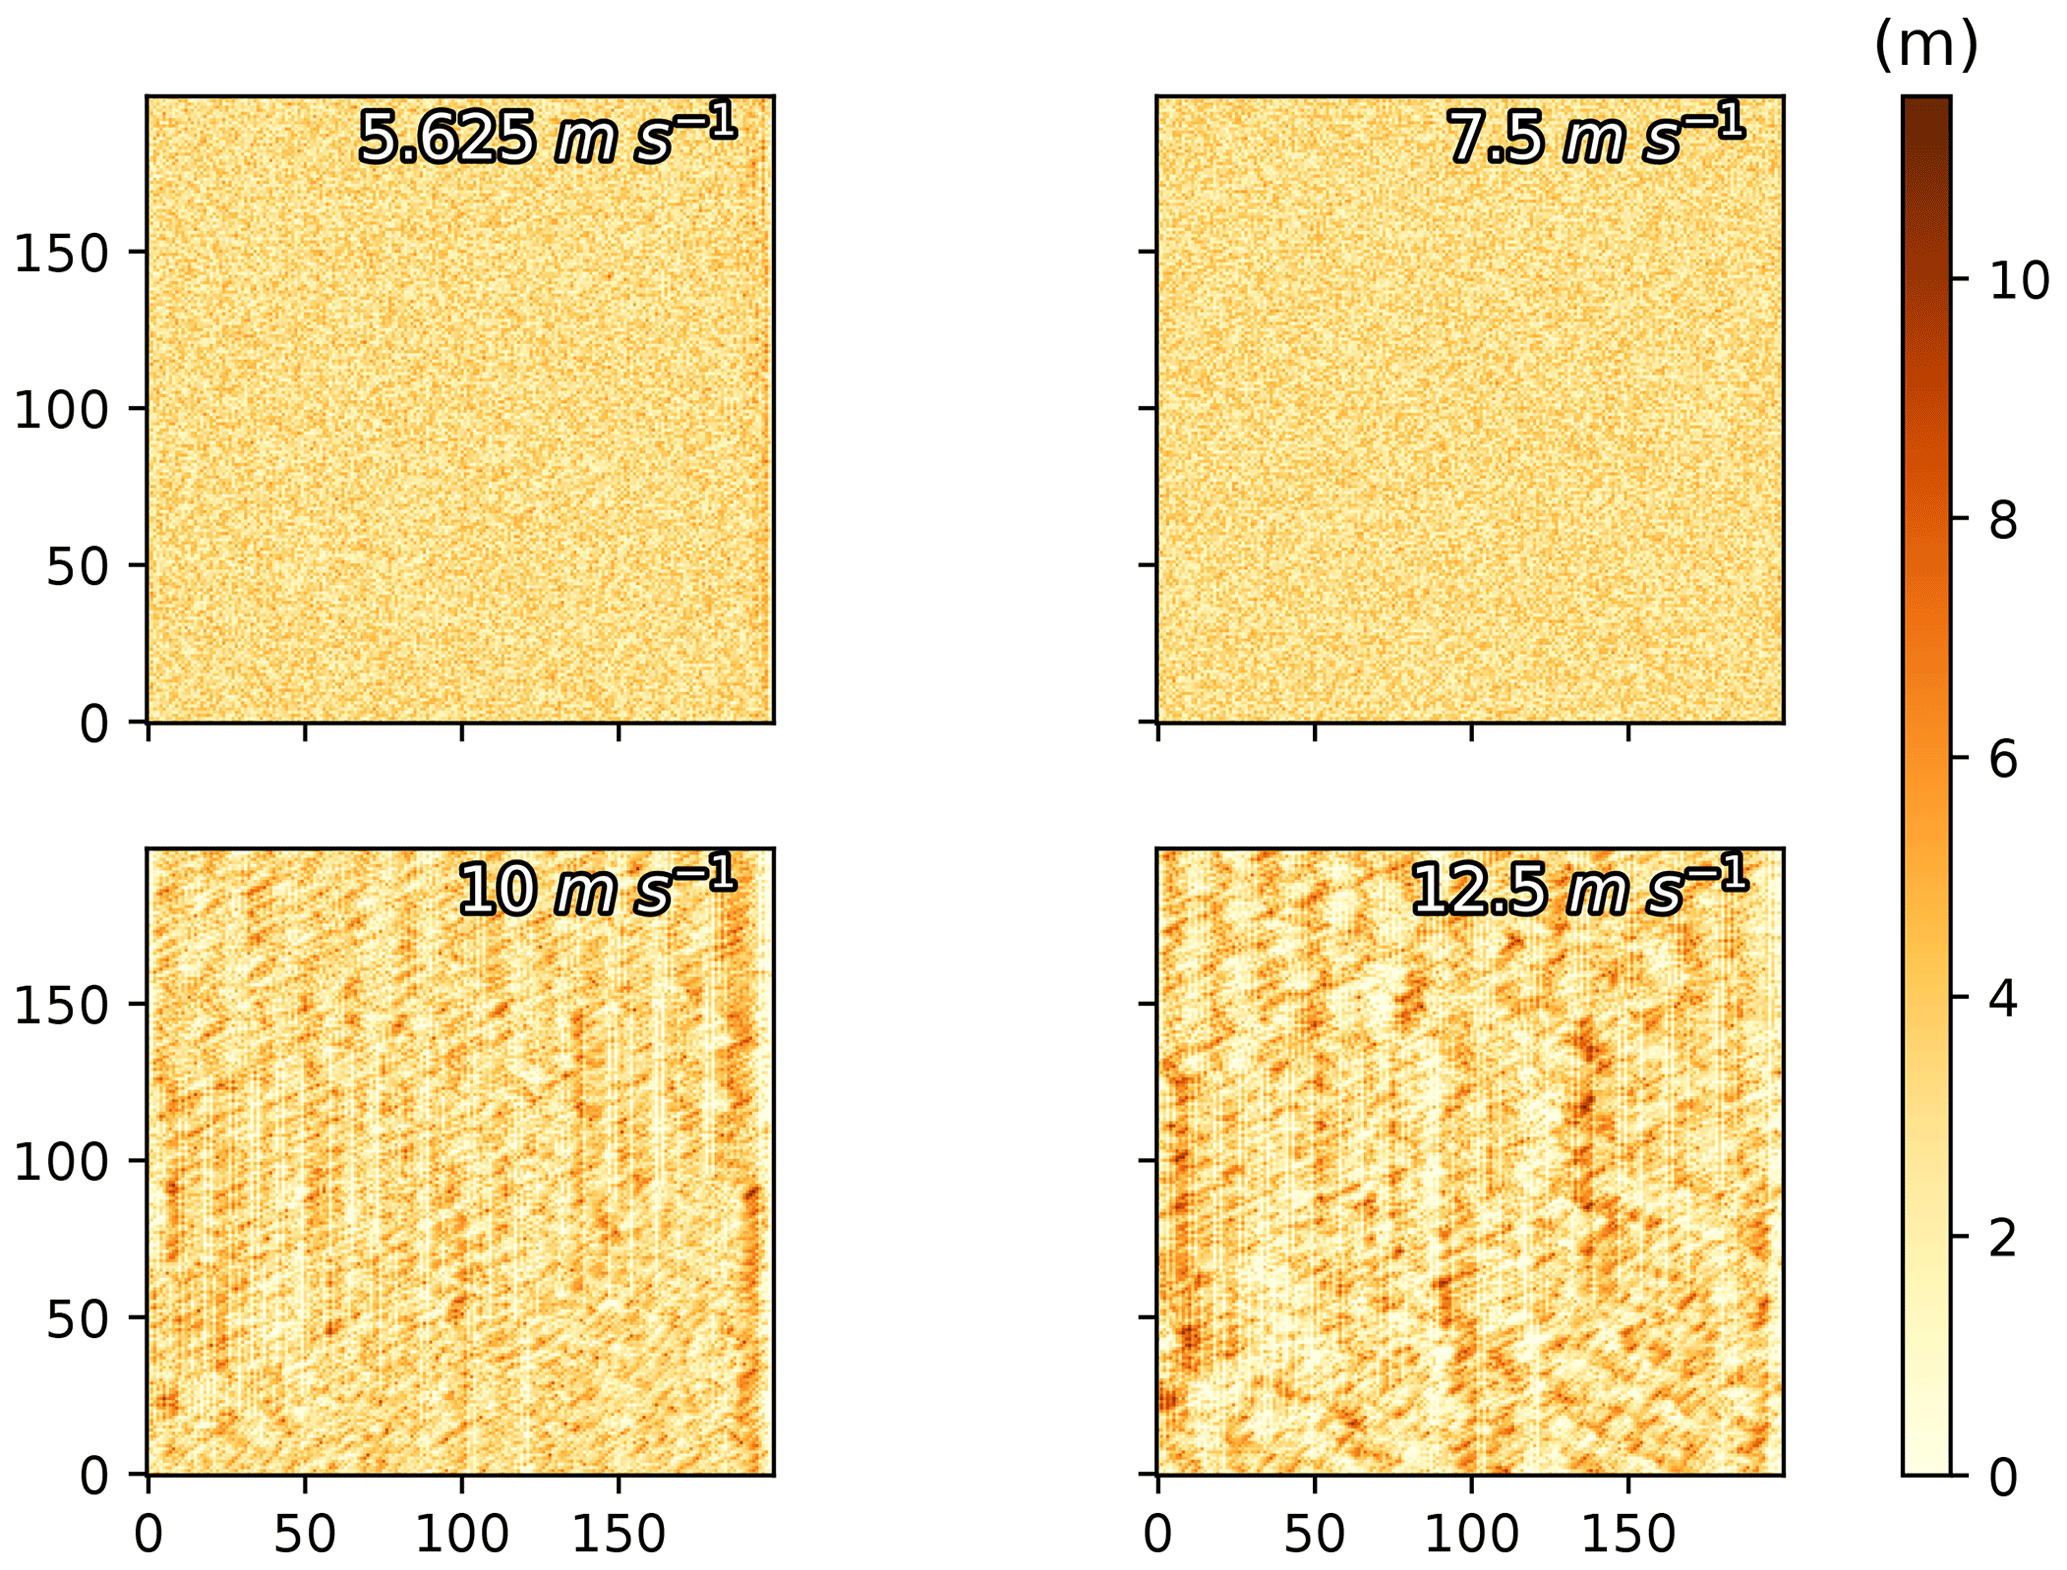
Figure A1Final sediment height representation of 5-year simulations with different wind speeds.
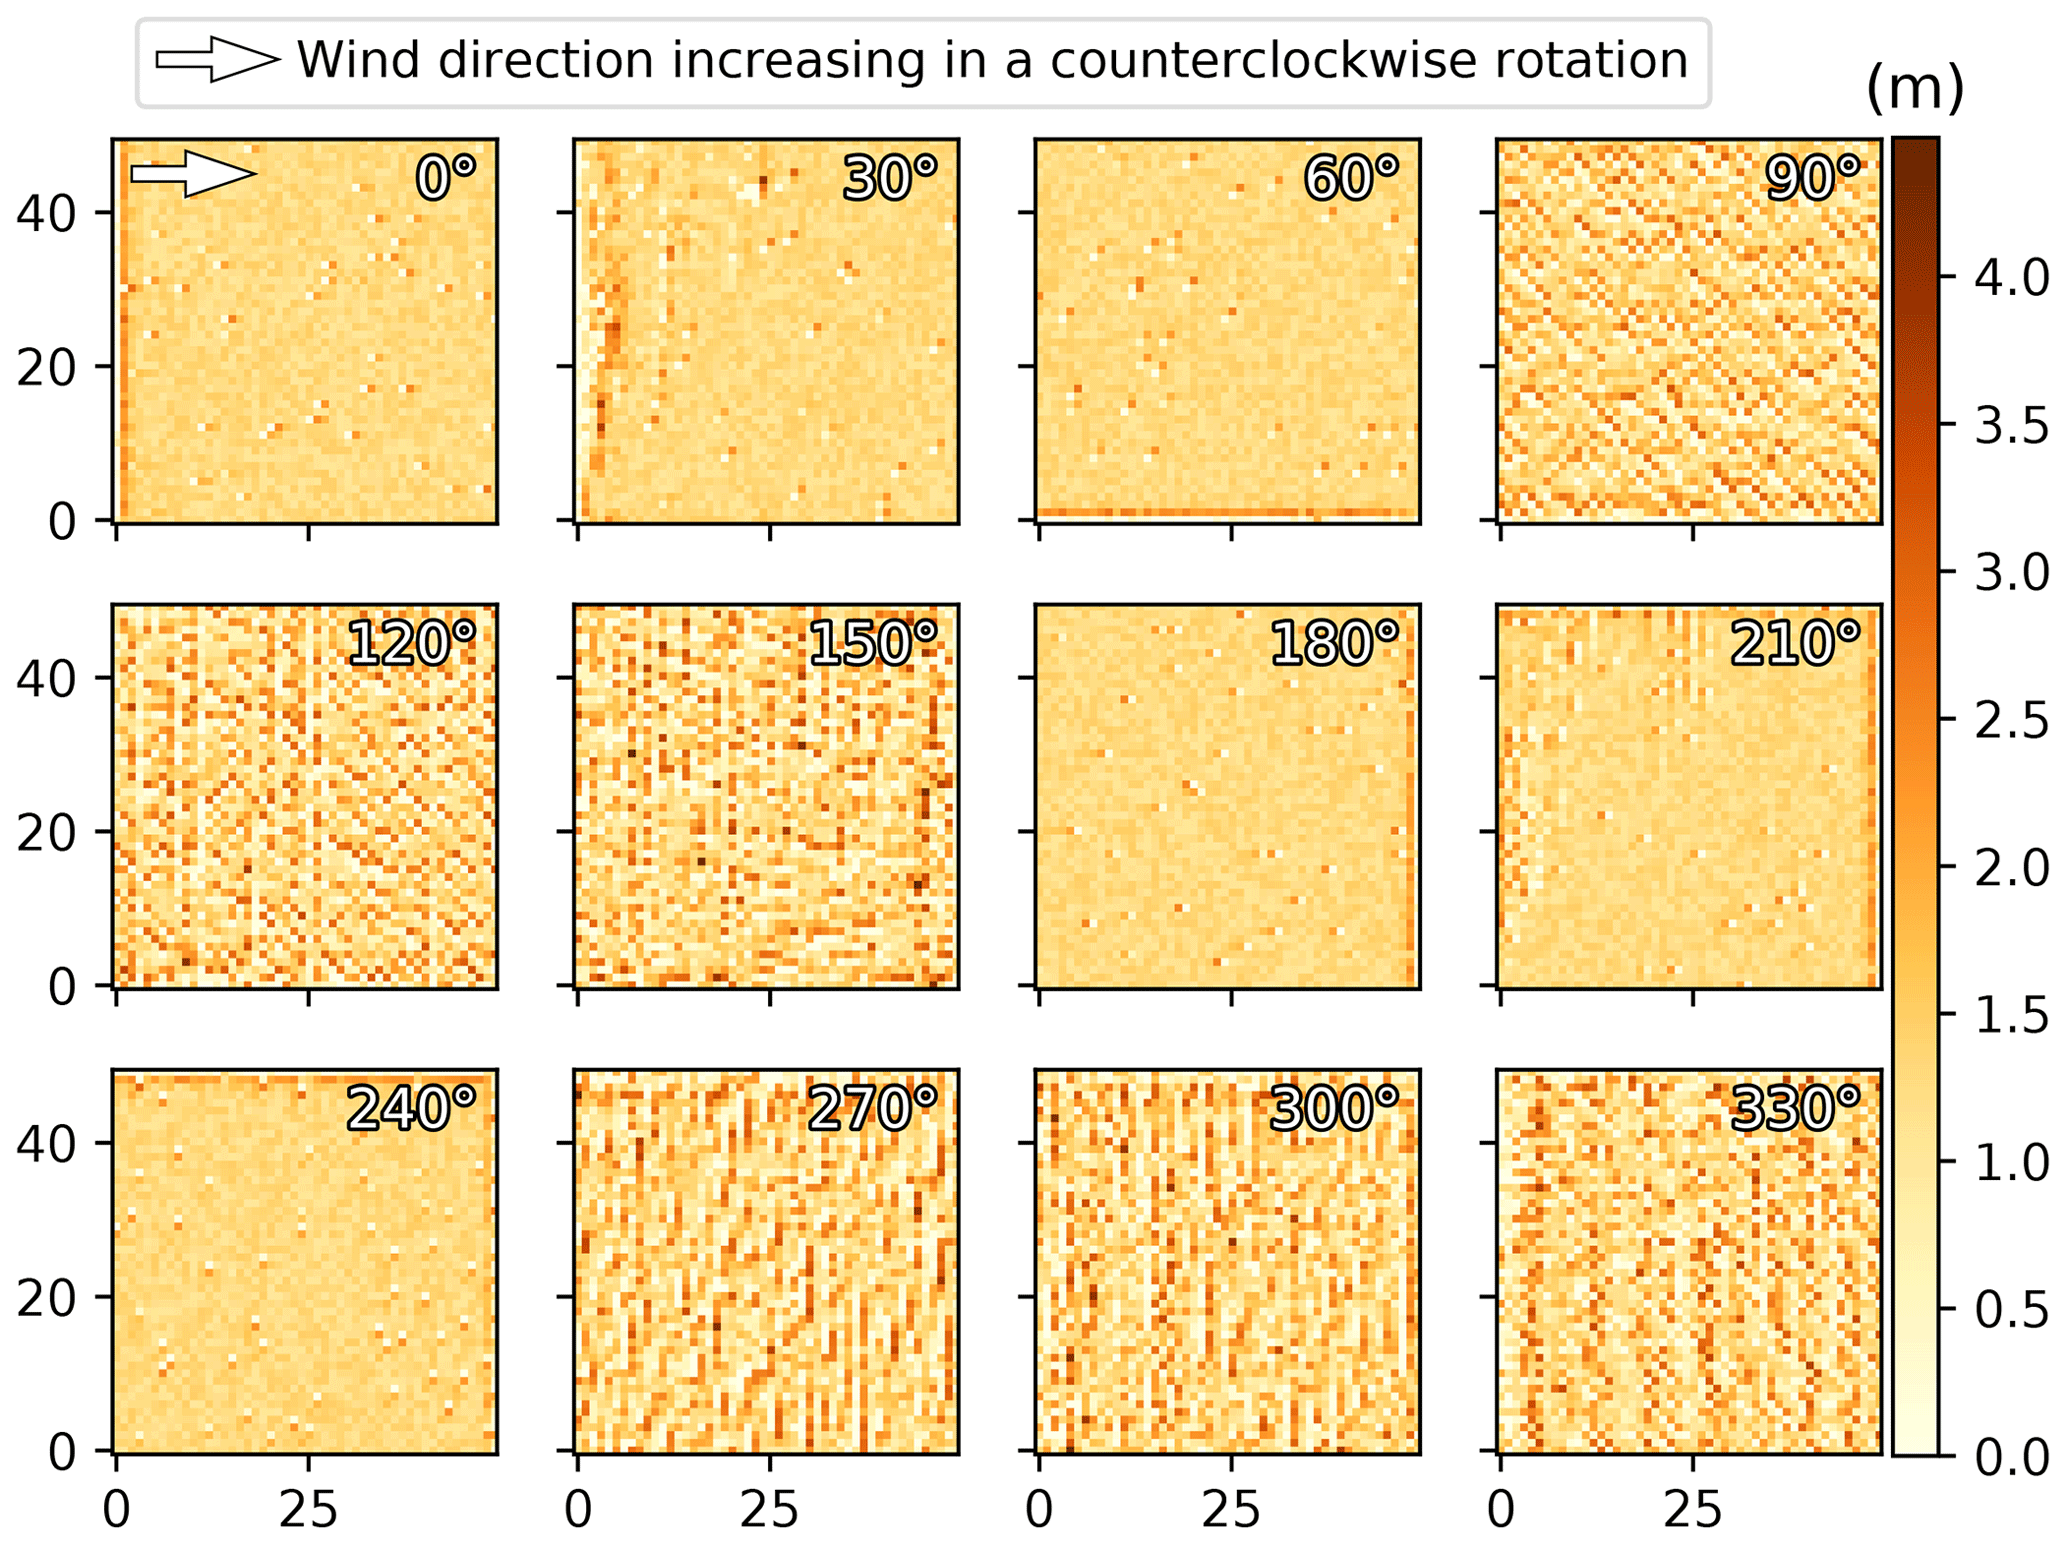
Figure A2Final sediment height representation of 5-year simulations with different wind angles.
The wind angle was another parameter of the model having an unexpected impact on the resulting landscape development in the ViSTA_M17 model. While it is known that certain landforms can only be reproduced in models by multidirectional winds (e.g., star dunes; Courrech du Pont, 2015), the wind direction should have little influence on the sediment transport rate with all other things equal. However, the wind direction was observed in the ViSTA_GrAM model to influence the sediment transport rate, whereby winds from the east or west (0––240∘ in the model) produced less sediment transport than winds from the north or south (90––330∘), as indicated in the elevation models shown in Fig. A2. Both of these wind orientations returned widely different distributions of sediment after only a 5-year simulation (Fig. A2). East–west winds produced isolated dunes of 5 m width and had an accumulation of sediments along the borders where the wind enters the grid, while north–south winds produced evenly distributed ridges across the grid. Since all simulations had the same wind speed and starting surface characteristics (7.5 m s−1 wind speed and a 5 m s−1 threshold with an initially random sediment height), it was surprising to observe the difference in sediment transport and sediment distribution. A solution to this resulting problem in the model has yet to be found, but we speculate that the problem comes from the wind partitioning and subsequent calculation of the sediment deposition pathway. To permit a comparison of the tested simulations in this study, the wind angle was kept constant at 120∘ to limit the border effects on the sediment distribution.
The GrAM code and the modifications to the original ViSTA_M17 model code (https://github.com/jeromemayaud/ViSTA, Mayaud, 2017) were written by Phillipe Gauvin-Bourdon in the Python® programming language (Python 3.7.7, 64 bits) with the permission of Jerome Mayaud. A full version of the ViSTA_GrAM model code is freely available on GitHub (https://doi.org/10.5281/zenodo.3909749, Gauvin-Bourdon, 2020) along with the simulation files used in the present paper.
PGB conceived and developed GrAM and integrated it into the ViSTA model, carried out the simulations and analyses of the model, and wrote the paper with the support of JK and LP. JK helped design the study and helped write the paper. LP helped design the study. All authors discussed the results and contributed to the final paper.
The authors declare that they have no conflict of interest.
We would like to thank Jerome Mayaud for his permission to access the original model and Calcul Québec for access to their computing resources. We would like to acknowledge comments made by two anonymous reviewers and the editor that greatly improved the paper.
The research has been supported by the Natural Sciences and Engineering Research Council (NSERC) of Canada Discovery Grants awarded to the second and third authors (grant nos. RGPIN/05396-2016 and RGPIN/05417-2016).
This paper was edited by Andreas Baas and reviewed by two anonymous referees.
Abella, S. R., Engel, E. C., Lund, C. L., and Spencer, J. E.: Early Post-Fire Plant Establishment on a Mojave Desert Burn, Madroño, 56, 137–148, https://doi.org/10.3120/0024-9637-56.3.137, 2009.
Ares, J., Bertiller, M., and Bisigato, A.: Modeling and Measurement of Structural Changes at a Landscape Scale in Dryland Areas, Environ. Model. Assess., 1–13, 2003.
Aubault, H., Webb, N. P., Strong, C. L., McTainsh, G. H., Leys, J. F., and Scanlan, J. C.: Grazing impacts on the susceptibility of rangelands to wind erosion: The effects of stocking rate, stocking strategy and land condition, Aeolian Res., 17, 89–99, https://doi.org/10.1016/j.aeolia.2014.12.005, 2015.
Baas, A. C. W. and Nield, J. M.: Modelling vegetated dune landscapes, Geophys. Res. Lett., 34, 1–5, https://doi.org/10.1029/2006GL029152, 2007.
Bagnold, R. A.: The physics of blown sand and desert dunes, Dover Publications inc., Mineola, 1941.
Bailey, R. M.: Spatial and temporal signatures of fragility and threshold proximity in modelled semi-arid vegetation, Proc. R. Soc. B Biol. Sci., 278, 1064–1071, https://doi.org/10.1098/rspb.2010.1750, 2011.
Baas, A. C. W. and Nield, J. M.: Modelling vegetated dune landscapes, Geophys. Res. Lett., 34, 1–5, https://doi.org/10.1029/2006GL029152, 2007.
Baudena, M., D'Andrea, F., and Provenzale, A.: An idealized model for tree–grass coexistence in savannas: the role of life stage structure and fire disturbances: A model for tree–grass coexistence, J. Ecol., 98, 74–80, https://doi.org/10.1111/j.1365-2745.2009.01588.x, 2010.
Bestelmeyer, B. T., Okin, G. S., Duniway, M. C., Archer, S. R., Sayre, N. F., Williamson, J. C., and Herrick, J. E.: Desertification, land use, and the transformation of global drylands, Front. Ecol. Environ., 13, 28–36, https://doi.org/10.1890/140162, 2015.
Bestelmeyer, B. T., Peters, D. P. C., Archer, S. R., Browning, D. M., Okin, G. S., Schooley, R. L., and Webb, N. P.: The Grassland–Shrubland Regime Shift in the Southwestern United States: Misconceptions and Their Implications for Management, BioScience, 68, 678–690, https://doi.org/10.1093/biosci/biy065, 2018.
Bhattachan, A., D'odorico, P., Dintwe, K., Okin, G. S., and Collins, S. L.: Resilience and recovery potential of duneland vegetation in the southern Kalahari, Ecosphere, 5, 1–14, https://doi.org/10.1890/ES13-00268.1, 2014.
Bo, T. L., Fu, L. T., and Zheng, X. J.: Modeling the impact of overgrazing on evolution process of grassland desertification, Aeolian Res., 9, 183–189, https://doi.org/10.1016/j.aeolia.2013.01.001, 2013.
Bond, W. J., Midgley, G. F., and Woodward, F. I.: What controls South African vegetation – climate or fire?, South Afr. J. Bot., 69, 79–91, https://doi.org/10.1016/S0254-6299(15)30362-8, 2003.
Brown, J. F.: Effects of Experimental Burial on Survival, Growth, and Resource Allocation of Three Species of Dune Plants, J. Ecol., 85, 151, https://doi.org/10.2307/2960647, 1997.
Burgess, J.: Country pasture/forage resource profiles: Botswana, Food and Agriculture Organization of the United Nations (FAO), Rome, Italy, 46 pp., 2006.
Burri, K., Gromke, C., Lehning, M., and Graf, F.: Aeolian sediment transport over vegetation canopies: A wind tunnel study with live plants, Aeolian Res., 3, 205–213, https://doi.org/10.1016/j.aeolia.2011.01.003, 2011.
Carpenter, D. E., Barbour, M. G., and Bahre, C. J.: Old Field Succession in Mojave Dessert Scrub, Madroño, 33, 111–122, 1986.
Chacon, E., Stobbs, T. H., and Sandland, R. L.: Estimation of herbage consumption by grazing cattle using measurements of eating behaviour, Grass Forage Sci., 31, 81–87, https://doi.org/10.1111/j.1365-2494.1976.tb01122.x, 1976.
Chappell, A., Lee, J. A., Baddock, M., Gill, T. E., Herrick, J. E., Leys, J. F., Marticorena, B., Petherick, L., Schepanski, K., Tatarko, J., Telfer, M., and Webb, N. P.: A clarion call for aeolian research to engage with global land degradation and climate change, Aeolian Res., 32, A1–A3, https://doi.org/10.1016/j.aeolia.2018.02.007, 2018.
Courrech du Pont, S.: Dune morphodynamics, Comptes Rendus Phys., 16, 118–138, https://doi.org/10.1016/j.crhy.2015.02.002, 2015.
Dech, J. P. and Maun, M. A.: Adventitious Root Production and Plastic Resource Allocation to Biomass Determine Burial Tolerance in Woody Plants from Central Canadian Coastal Dunes, Ann. Bot., 98, 1095–1105, https://doi.org/10.1093/aob/mcl196, 2006.
D'Odorico, P., Bhattachan, A., Davis, K. F., Ravi, S., and Runyan, C. W.: Global desertification: Drivers and feedbacks, Adv. Water Resour., 51, 326–344, https://doi.org/10.1016/j.advwatres.2012.01.013, 2013.
Dougill, A. J. and Thomas, A. D.: Kalahari sand soils: spatial heterogeneity, biological soil crusts and land degradation, Land Degrad. Dev., 15, 233–242, https://doi.org/10.1002/ldr.611, 2004.
Dupont, S., Bergametti, G., and Simoëns, S.: Modeling aeolian erosion in presence of vegetation, J. Geophys. Res. Earth Surf., 119, 168–187, https://doi.org/10.1002/2013JF002875, 2014.
Gauvin-Bourdon, P.: ViSTA_GrAM source code, Zenodo, https://doi.org/10.5281/zenodo.3909749 (last access: 7 January 2021), 2020.
Hassler, S. K., Kreyling, J., Beierkuhnlein, C., Eisold, J., Samimi, C., Wagenseil, H., and Jentsch, A.: Vegetation pattern divergence between dry and wet season in a semiarid savanna – Spatio-temporal dynamics of plant diversity in northwest Namibia, J. Arid Environ., 74, 1516–1524, https://doi.org/10.1016/j.jaridenv.2010.05.021, 2010.
Hesp, P. A., Dong, Y., Cheng, H., and Booth, J. L.: Wind flow and sedimentation in artificial vegetation: Field and wind tunnel experiments, Geomorphology, 337, 165–182, https://doi.org/10.1016/j.geomorph.2019.03.020, 2019.
Hickman, K. R. and Hartnett, D. C.: Effects of grazing intensity on growth, reproduction, and abundance of three palatable forbs in 25 Kansas tallgrass prairie, Plant Ecol., 159, 23–33, 2002.
Higgins, S. I., Bond, W. J., and Trollope, W. S. W.: Fire, resprouting and variability: a recipe for grass-tree coexistence in savanna, J. Ecol., 88, 213–229, https://doi.org/10.1046/j.1365-2745.2000.00435.x, 2000.
Hodgson, J.: The control of herbage intake in the grazing ruminant, Proc. Nutr. Soc., 44, 339–346, https://doi.org/10.1079/PNS19850054, 1985.
Hodgson, J., Forbes, T. D. A., Armstrong, R. H., Beatie, M. M., and Hunter, E. A.: Comparative Studies of the Ingestive Behaviour and Herbage Intake of Sheep and Cattle Grazing Indigenous Hill Plant Communities, Br. Ecol. Soc., 28, 205–227, https://doi.org/10.2307/2404126, 1991.
Hsu, S.-A.: Wind stress criteria in eolian sand transport, J. Geophys. Res., 76, 8684–8686, https://doi.org/10.1029/JC076i036p08684, 1971.
Hugenholtz, C. H., Levin, N., Barchyn, T. E., and Baddock, M. C.: Remote sensing and spatial analysis of aeolian sand dunes: A review and outlook, Earth-Sci. Rev., 111, 319–334, https://doi.org/10.1016/j.earscirev.2011.11.006, 2012.
Jeltsch, F., Milton, S. J., Dean, W. R. J., and van Rooyen, N.: Tree Spacing and Coexistence in Semiarid Savannas, J. Ecol., 84, 583, https://doi.org/10.2307/2261480, 1996.
Jeltsch, F., Milton, S. J., Dean, W. R. J., and van Rooyen, N.: Analysing Shrub Encroachment in the Southern Kalahari: A Grid-Based Modelling Approach, J. Appl. Ecol., 34, 1497–1508, https://doi.org/10.2307/2405265, 1997a.
Jeltsch, F., Milton, S. J., Dean, W. R. J., and van Rooyen, N.: Simulated pattern formation around artificial waterholes in the semi-arid Kalahari, J. Veg. Sci., 8, 177–188, https://doi.org/10.2307/3237346, 1997b.
Kaufmann, J., Bork, E. W., Blenis, P. V., and Alexander, M. J.: Cattle habitat selection and associated habitat characteristics under free-range grazing within heterogeneous Montane rangelands of Alberta, Appl. Anim. Behav. Sci., 146, 1–10, https://doi.org/10.1016/j.applanim.2013.03.014, 2013.
Kawamura, R.: Study on Sand Movement by Wind, Rep. Phys. Sci. Res. Inst. Tokyo Univ., 5, 95–112, 1951.
King, J., Nickling, W. G., and Gillies, J. A.: Representation of vegetation and other nonerodible elements in aeolian shear stress partitioning models for predicting transport threshold, J. Geophys. Res.-Ea. Surf., 110, 1–15, https://doi.org/10.1029/2004JF000281, 2005.
King, J., Nickling, W. G., and Gillies, J. A.: Aeolian shear stress ratio measurements within mesquite-dominated landscapes of the Chihuahuan Desert, New Mexico, USA, Geomorphology, 82, 229–244, https://doi.org/10.1016/j.geomorph.2006.05.004, 2006.
Kraaij, T. and Milton, S. J.: Vegetation changes (1995–2004) in semi-arid Karoo shrubland, South Africa: Effects of rainfall, wild herbivores and change in land use, J. Arid Environ., 64, 174–192, doi10.1016/j.jaridenv.2005.04.009, 2006.
Lancaster, N. and Baas, A.: Influence of vegetation cover on sand transport by wind: field studies at Owens Lake, California, Earth Surf. Process. Landf., 23, 69–82, 1998.
Lehmann, C. E. R., Archibald, S. A., Hoffmann, W. A., and Bond, W. J.: Deciphering the distribution of the savanna biome, New Phytol., 191, 197–209, https://doi.org/10.1111/j.1469-8137.2011.03689.x, 2011.
Leriche, H., LeRoux, X., Gignoux, J., Tuzet, A., Fritz, H., Abbadie, L., and Loreau, M.: Which functional processes control the short-term effect of grazing on net primary production in grasslands?, Oecologia, 129, 114–124, https://doi.org/10.1007/s004420100697, 2001.
Lettau, K. and Lettau, H. H.: Experimental and Micrometeorological field studies of dune migration, in Exploring the world's driest climate, pp. 110–147, Madison., 1978.
Lima, A. R., Sauermann, G., Herrmann, H. J., and Kroy, K.: Modelling a dune field, Phys. Stat. Mech. Its Appl., 310, 487–500, https://doi.org/10.1016/S0378-4371(02)00546-0, 2002.
Liu, B. and Coulthard, T. J.: Modelling the interaction of aeolian and fluvial processes with a combined cellular model of sand dunes and river systems, Comput. Geosci., 106, 1–9, https://doi.org/10.1016/j.cageo.2017.05.003, 2017.
Ludwig, L., Isele, J., Rahmann, G., Idel, A., and Hülsebush, C.: Rangeland forage biomass production and composition under different grazing regimes on a Namibian oraganic livestock farm, in Innovative Research for Organic 3.0, vol. 2, pp. 558–563, Thünen Report 54, New Delhi, India., 2017.
Marion, G., Swain, D. L., and Hutchings, M. R.: Understanding foraging behaviour in spatially heterogeneous environments, J. Theor. Biol., 232, 127–142, https://doi.org/10.1016/j.jtbi.2004.08.005, 2005.
Marion, G., Smith, L. A., Swain, D. L., Davidson, R. S., and Hutchings, M. R.: Agent-based modelling of foraging behaviour: the impact of spatial heterogeneity on disease risks from faeces in grazing systems, J. Agric. Sci., 146, 507–520, https://doi.org/10.1017/S0021859608008022, 2008.
Martin, R. L. and Kok, J. F.: Wind-invariant saltation heights imply linear scaling of aeolian saltation flux with shear stress, Sci. Adv., 3, e1602569, https://doi.org/10.1126/sciadv.1602569, 2017.
Maun, M. A.: Adaptations of plants to burial in coastal sand dunes, Can. J. Bot., 76, 713–738, 1998.
Maun, M. A. and Perumal, J.: Zonation of vegetation on lacustrine coastal dunes: effects of burial by sand, Ecol. Lett., 2, 14–18, https://doi.org/10.1046/j.1461-0248.1999.21048.x, 1999.
Mayaud, J.: ViSTA_M17 source code, GitHub, available at: https://github.com/jeromemayaud/ViSTA (last access: 7 January 2021) 2017.
Mayaud, J. R. and Webb, N.: Vegetation in Drylands: Effects on Wind Flow and Aeolian Sediment Transport, Land, 6, 64, https://doi.org/10.3390/land6030064, 2017.
Mayaud, J. R., Bailey, R. M., and Wiggs, G. F. S.: A coupled vegetation/sediment transport model for dryland environments, J. Geophys. Res.-Ea. Surf., 122, 875–900, https://doi.org/10.1002/2016JF004096, 2017a.
Mayaud, J. R., Bailey, R. M., and Wiggs, G. F. S.: Modelled responses of the Kalahari Desert to 21st century climate and land use change, Sci. Rep., 7, 3887, https://doi.org/10.1038/s41598-017-04341-0, 2017b.
McInnes, K. L., Erwin, T. A., and Bathols, J. M.: Global Climate Model projected changes in 10 m wind speed and direction due to anthropogenic climate change, Atmos. Sci. Lett., 12, 325–333, https://doi.org/10.1002/asl.341, 2011.
McNaughton, S. J.: Compensatory Plant Growth as a Response to Herbivory, Oikos, 40, 329, https://doi.org/10.2307/3544305, 1983.
Meyer, T., D'Odorico, P., Okin, G. S., Shugart, H. H., Caylor, K. K., O'Donnell, F. C., Bhattachan, A., and Dintwe, K.: An analysis of structure: biomass structure relationships for characteristic species of the western Kalahari, Botswana, Afr. J. Ecol., 52, 20–29, https://doi.org/10.1111/aje.12086, 2014.
Middleton, N. and Thomas, D. S. G.: World atlas of desertification, 2nd edn., London, Arnold, London, 1997.
Moore, P. D.: Mystery of moribund marram, Nature, 380, 285–286, https://doi.org/10.1038/380285a0, 1996.
Nicholson, S. E.: Climatic variations in the Sahel and other African regions during the past five centuries, J. Arid Environ., 1, 3–24, https://doi.org/10.1016/S0140-1963(18)31750-6, 1978.
Nicholson, S. E.: Land surface processes and Sahel climate, Rev. Geophys., 38, 117–139, https://doi.org/10.1029/1999RG900014, 2000.
Nield, J. M. and Baas, A. C. W.: Investigating parabolic and nebkha dune formation using a cellular automaton modelling approach, Earth Surf. Process. Landf., 33, 724–740, https://doi.org/10.1002/esp.1571, 2008.
Okin, G. S.: A new model of wind erosion in the presence of vegetation, J. Geophys. Res.-Ea. Surf., 113, 1–11, https://doi.org/10.1029/2007JF000758, 2008.
Okin, G. S. and Gillette, D. A.: Distribution of vegetation in wind-dominated landscapes: Implications for wind erosion modeling and landscape processes, J. Geophys. Res.-Atmos., 106, 9673–9683, https://doi.org/10.1029/2001JD900052, 2001.
Okin, G. S., Gillette, D. A., and Herrick, J. E.: Multi-scale controls on and consequences of aeolian processes in landscape change in arid and semi-arid environments, J. Arid Environ., 65, 253–275, https://doi.org/10.1016/j.jaridenv.2005.06.029, 2006.
Oñatibia, G. R. and Aguiar, M. R.: Continuous moderate grazing management promotes biomass production in Patagonian arid rangelands, J. Arid Environ., 125, 73–79, https://doi.org/10.1016/j.jaridenv.2015.10.005, 2016.
Orr, R. J., Rutter, S. M., Penning, P. D., and Rook, A. J.: Matching grass supply to grazing patterns for dairy cows, Grass Forage Sci., 56, 352–361, https://doi.org/10.1046/j.1365-2494.2001.00284.x, 2001.
Owen, P. R.: Saltation of uniform grains in air, J. Fluid Mech., 20, 225–242, https://doi.org/10.1017/S0022112064001173, 1964.
Peters, D. P. C., Bestelmeyer, B. T., Herrick, J. E., Fredrickson, Ed. L., Monger, H. C., and Havstad, K. M.: Disentangling Complex Landscapes: New Insights into Arid and Semiarid System Dynamics, BioScience, 56, 491, https://doi.org/10.1641/0006-3568(2006)56[491:DCLNII]2.0.CO;2, 2006.
Raupach, M. R., Gillette, D. A., and Leys, J. F.: The effect of roughness elements on wind erosion threshold, J. Geophys. Res., 98, 3023, https://doi.org/10.1029/92JD01922, 1993.
Ravi, S., Breshears, D. D., Huxman, T. E., and D'Odorico, P.: Land degradation in drylands: Interactions among hydrologic–aeolian erosion and vegetation dynamics, Geomorphology, 116, 236–245, https://doi.org/10.1016/j.geomorph.2009.11.023, 2010.
Ravi, S., D'Odorico, P., Breshears, D. D., Field, J. P., Goudie, A. S., Huxman, T. E., Li, J., Okin, G. S., Swap, R. J., Thomas, A. D., Van Pelt, S., Whicker, J. J., and Zobeck, T. M.: Aeolian processes and the biosphere, Rev. Geophys., 49, RG3001, https://doi.org/10.1029/2010RG000328, 2011.
Rietkerk, M., van den Bosch, F., and van de Koppel, J.: Site-Specific Properties and Irreversible Vegetation Changes in Semi-Arid Grazing Systems, Oikos, 80, 241, https://doi.org/10.2307/3546592, 1997.
Rietkerk, M., Boerlijst, M. C., van Langevelde, F., HilleRisLambers, R., van de Koppel, J., Kumar, L., Prins, H. H. T., and de Roos, A. M.: Self-Organization of Vegetation in Arid Ecosystems, Am. Nat., 160, 524–530, https://doi.org/10.1086/342078, 2002.
Sankaran, M., Hanan, N. P., Scholes, R. J., Ratnam, J., Augustine, D. J., Cade, B. S., Gignoux, J., Higgins, S. I., Le Roux, X., Ludwig, F., Ardo, J., Banyikwa, F., Bronn, A., Bucini, G., Caylor, K. K., Coughenour, M. B., Diouf, A., Ekaya, W., Feral, C. J., February, E. C., Frost, P. G. H., Hiernaux, P., Hrabar, H., Metzger, K. L., Prins, H. H. T., Ringrose, S., Sea, W., Tews, J., Worden, J., and Zambatis, N.: Determinants of woody cover in African savannas, Nature, 438, 846–849, https://doi.org/10.1038/nature04070, 2005.
Scanlon, T. M., Caylor, K. K., Levin, S. A., and Rodriguez-Iturbe, I.: Positive feedbacks promote power-law clustering of Kalahari vegetation, Nature, 449, 209–212, https://doi.org/10.1038/nature06060, 2007.
Scholes, R. J. and Archer, S. R.: Tree-Grass Interactions in Savannas, Annu. Rev. Eco. Syst., 28, 517–544, 1997.
Scholes, R. J., Dowty, P. R., Caylor, K., Parsons, D. A. B., Frost, P. G. H., and Shugart, H. H.: Trends in savanna structure and composition along an aridity gradient in the Kalahari, J. Veg. Sci., 13, 419–428, https://doi.org/10.1111/j.1654-1103.2002.tb02066.x, 2002.
Sharpe, P. and Kenny, L. B.: Chapter 8 – Grazing Behavior, Feed Intake, and Feed Choices, in: Horse Pasture Management, edited by: Sharpe, P., 121–139, Academic Press, https://doi.org/10.1016/B978-0-12-812919-7.00008-1, 2019.
Staver, A. C., Archibald, S., and Levin, S. A.: The Global Extent and Determinants of Savanna and Forest as Alternative Biome States, Science, 334, 230–232, https://doi.org/10.1126/science.1210465, 2011.
Thomas, D. S. G. and Twyman, C.: Good or bad rangeland? Hybrid knowledge, science, and local understandings of vegetation dynamics in the Kalahari, Land Degrad. Dev., 15, 215–231, https://doi.org/10.1002/ldr.610, 2004.
Thomas, D. S. G., Knight, M., and Wiggs, G. F. S.: Remobilization of southern African desert dune systems by twenty-first century global warming, Nature, 435, 1218–1221, https://doi.org/10.1038/nature03717, 2005.
Van der Putten, W. H., Van Dijk, C., and Peters, B. A. M.: Plant-specific soil-borne diseases contribute to succession in foredune vegetation, Nature, 362, 53–56, https://doi.org/10.1038/362053a0, 1993.
Van Langevelde, F., Van De Vijver, C. A. D. M., Kumar, L., Van De Koppel, J., De Ridder, N., Van Andel, J., Skidmore, A. K., Hearne, J. W., Stroosnijder, L., Bond, W. J., Prins, H. H. T., and Rietkerk, M.: Effects of Fire and Herbivory on the Stability of Savanna Ecosystems, Ecology, 84, 337–350, https://doi.org/10.1890/0012-9658(2003)084[0337:EOFAHO]2.0.CO;2, 2003.
Wang, L., Katjiua, M., D'Odorico, P., and Okin, G. S.: The interactive nutrient and water effects on vegetation biomass at two African savannah sites with different mean annual precipitation, Afr. J. Ecol., 50, 446–454, https://doi.org/10.1111/j.1365-2028.2012.01339.x, 2012.
Webb, N. P. and Pierre, C.: Quantifying Anthropogenic Dust Emissions, Earths Future, 6, 286–295, https://doi.org/10.1002/2017EF000766, 2018.
Weber, G. E. and Jeltsch, F.: Spatial aspects of grazing in savanna rangelands: a modelling study of vegetation dynamics, Ecosyst. Sustain. Dev., 16, 427–436, 1997.
Weber, G. E., Jeltsch, F., van Rooyen, N., and Milton, S. J.: Simulated long-term vegetation response to grazing heterogeneity in semi-arid rangelands, J. Appl. Ecol., 35, 687–699, 1998.
Werner, B. T.: Eolian dunes: computer simulations and attractor interpretations, Geology, 23, 1107–1110, https://doi.org/10.1130/0091-7613(1995)023<1107:edcsaa>2.3.co;2, 1995.
Wolfe, S. A. and Nickling, W. G.: The protective role of sparse vegetation in wind erosion, Prog. Phys. Geogr. Earth Environ., 17, 50–68, https://doi.org/10.1177/030913339301700104, 1993.
Yan, N. and Baas, A. C. W.: Environmental controls, morphodynamic processes, and ecogeomorphic interactions of barchan to parabolic dune transformations, Geomorphology, 278, 209–237, https://doi.org/10.1016/j.geomorph.2016.10.033, 2017.
Yan, N. and Baas, A. C. W.: Transformation of parabolic dunes into mobile barchans triggered by environmental change and anthropogenic disturbance: Transformation of parabolic dunes into mobile barchans, Earth Surf. Process. Landf., 43, 1001–1018, https://doi.org/10.1002/esp.4299, 2018.
Yu, R., Evans, A. J., and Malleson, N.: An agent-based model for assessing grazing strategies and institutional arrangements in Zeku, China, Agric. Syst., 171, 135–142, https://doi.org/10.1016/j.agsy.2019.02.004, 2019.
Yuhas, R. H. and Goetz, A. F. H.: Monitoring and modeling semi-arid landscape response to climate change, in Proceedings of IGARSS '94 – 1994 IEEE International Geoscience and Remote Sensing Symposium, vol. 2, 1036–1038, IEEE, Pasadena, CA, USA., 1994.
Ziegler, N. P., Webb, N. P., Chappell, A., and LeGrand, S. L.: Scale Invariance of Albedo-Based Wind Friction Velocity, J. Geophys. Res.-Atmos., 125, 1–15, https://doi.org/10.1029/2019JD031978, 2020.
Zingg, A. W.: Wind tunnel studies of the movement of sedimentary material, in Proceedings of the 5th Hydraulic Conference, vol. 34, 111–135, State university of Iowa, Iowa city, available at: http://ir.uiowa.edu/uisie/34 (last access: 7 January 2021), 1953.