the Creative Commons Attribution 4.0 License.
the Creative Commons Attribution 4.0 License.
 | 27 May 2021
Relevance of acoustic methods to quantify bedload transport and bedform dynamics in a large sandy-gravel-bed river
Jules Le Guern
Stéphane Rodrigues
Thomas Geay
Sébastien Zanker
Alexandre Hauet
Pablo Tassi
Nicolas Claude
Philippe Jugé
Antoine Duperray
Louis Vervynck
Despite the inherent difficulties in quantifying its value, bedload transport is essential for understanding fluvial systems. In this study, we assessed different indirect bedload measurement techniques with a reference direct bedload measurement in a reach of a large sandy-gravel-bed river. An acoustic Doppler current profiler (aDcp), the dune tracking method (DTM) and hydrophone measurement techniques were used to determine bedload transport rates by using calibration with the reference method or by using empirical formulas. This study is the first work which attempted to use a hydrophone to quantify bedload rates in a large sandy-gravel-bed river. Results show that the hydrophone is the most efficient and accurate method for determining bedload fluxes in the Loire River. Although further work is needed to identify the parameters controlling self-generated sediment noise, the calibration procedure adopted in this study allows a satisfactory estimation of bedload transport rates. Moreover, aDcp and hydrophone measurement techniques are accurate enough to quantify bedload variations associated with dune migration.
- Article
(4259 KB) - Full-text XML
- BibTeX
- EndNote


Worldwide, rivers are in crisis (Vörösmarty et al., 2010). While changes in flow characteristics and fragmentation are well known (Grill et al., 2019), the impacts of human activities on the sediment budgets are as yet underrepresented (Kondolf et al., 2018). The quantification of bedload transport is a key element to understand, manage and restore the physical and ecological functioning of fluvial systems. It is a prerequisite to an accurate estimation of global sediment budgets delivered by rivers to oceans (Syvitski and Milliman, 2007), to better understand bedform dynamics in river channels (Best, 1988; Bertoldi et al., 2009; Rodrigues et al., 2015; Claude et al., 2014) and to reproduce satisfactorily morphodynamic processes with numerical modelling (Mendoza et al., 2017; Cordier et al., 2020).
However, in large rivers, this parameter remains difficult to estimate, mainly due to human and material resources required to collect accurate measurements. Among the available tools, indirect measurement techniques are promising alternatives to direct measurements that are often cumbersome to implement and can be time-consuming and perilous (Gray et al., 2010). Since the 2000s, numerous studies have been carried out to process the signal captured by an acoustic Doppler current profiler (aDcp) as a tool for determining the apparent bedload velocity (Rennie et al., 2002; Rennie and Villard, 2004; Rennie and Millar, 2004; Kostaschuk et al., 2005; Villard et al., 2005; Gaeuman and Jacobson, 2006, 2007; Holmes, 2010; Ramooz and Rennie, 2010; Latosinski et al., 2017; Conevski et al., 2019, 2020a). The use of passive acoustic instruments has also been widely used to quantify bedload transport. Even though these latter techniques have been developed through the application of measurement tools such as geophones or hydrophones, their domain of applicability is restricted to the study of rivers with coarse sediments (Barton et al., 2010; Hilldale et al., 2014; Marineau et al., 2016; Geay et al., 2017). This study aims to develop the use of passive acoustic technique in large sandy-gravel-bed rivers for quantifying bedload rates and bedform dynamics.
In sandy-gravel-bed rivers, the presence of bedforms is generally used to indirectly estimate bedload transport (Simons et al., 1965). Single-beam (Peters, 1978; Engel and Lau, 1980) or multibeam echosounders (Nittrouer et al., 2008; Leary and Buscombe, 2020) are tools usually adopted to determine morphological parameters (such as bedform height, wavelength and celerity) or to estimate sediment budget (Frings et al., 2014). These bathymetrical surveys are often carried out simultaneously with sediment sampler measurements (Gaeuman and Jacobson, 2007; Claude et al., 2012) to calibrate the signal with a direct reference although the latter are intrusive and characterized by a low spatial representativeness. These drawbacks can therefore limit the applicability of these measurement techniques, in particular for large lowland rivers.
In this work, we compare the efficiency of active and passive acoustic techniques to quantify bedload transport. The investigation took place in a reach of the Loire River (France), which is characterized by a sandy-gravel bed evolving through bars and superimposed dune migration (Le Guern et al., 2019b).
The main objectives of this study were (1) to compare indirect methods for estimating bedload with bedload estimates based on physical samples; (2) to estimate the accuracy of acoustic methods to measure cross-sectional variations of bedload fluxes for various discharge conditions; and (3) to investigate the capabilities of hydrophones and aDcps at capturing bedload variations along bedforms.
The study site is located near Saint-Mathurin-sur-Loire, in the lower reach of the Loire River (France), approximately 150 km upstream of the mouth of the Loire River. The study reach is 2.5 km long, 500 m wide and nearly straight, with a bed slope of 0.02 % (Fig. 1). During this work we measured the grain size distribution and flow characteristics at different locations along a cross section (Fig. 1). The riverbed is composed of a mixture of siliceous sands and gravels with a median diameter (D50) of 0.9 mm. The D50 varies between 0.3 and 3.1 mm with a standard deviation of 0.4 mm. The 90th percentile of the sediment grain size distribution (D90) is variable with a median value of 3.3 mm varying from 0.5 to 15.7 mm. Hydraulic conditions varied according to discharge between 0.5 and 5.4 m for the water depth, and between 0.2 and 1.4 m s−1 for the water velocity (median water depth and water velocity are 1.9 m and 0.9 m s−1, respectively). The width-to-depth ratio ranges from 120 to 550 depending on discharge variations. The mean annual discharge at the Saumur gauging station (approx. 30 km upstream) is 680 m3 s−1, with a 2-year flood of 2700 m3 s−1. Surveys were conducted during various hydrological conditions, with flow discharges ranging from 200 to 2400 m3 s−1 (Fig. 2a).
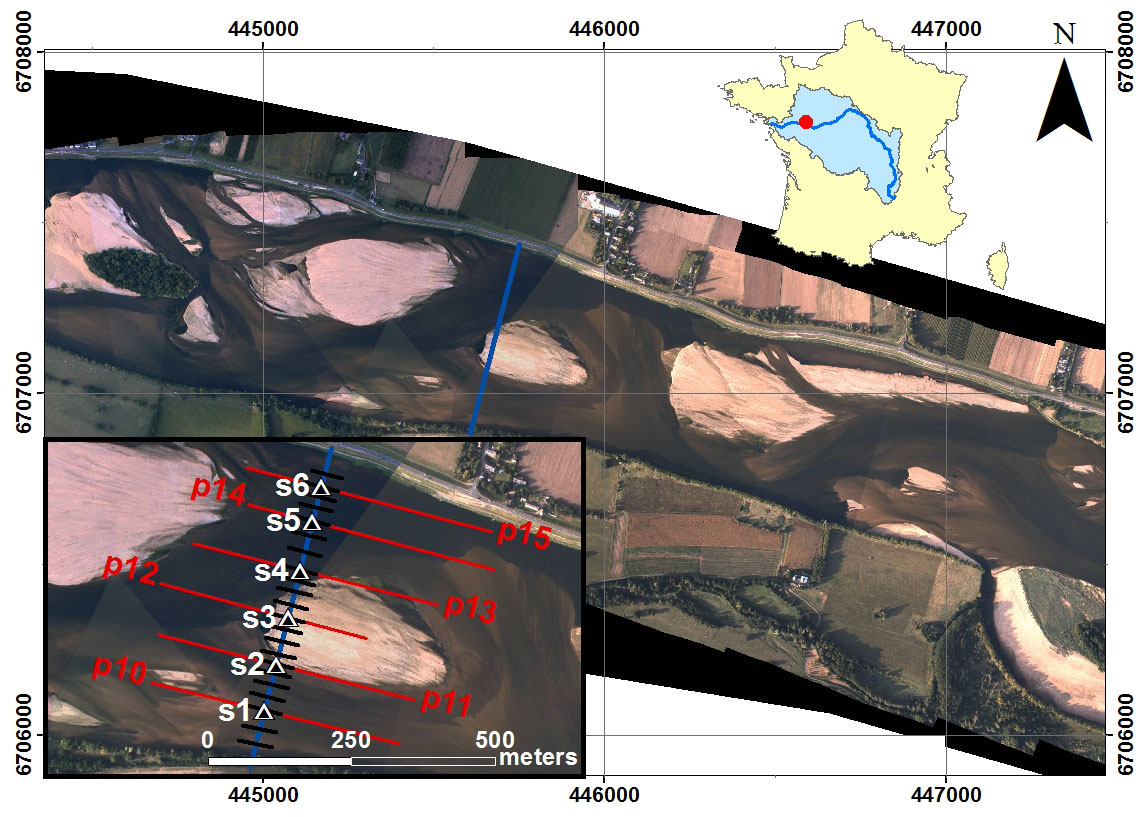
Figure 1Aerial photographs of the study site in 2017 (courtesy of Dimitri Lague, University of Rennes, France) with location of sampling points (white triangles) on the sediment transport gauging cross section (blue line), bathymetric profiles (red lines) and hydrophone drifts (black lines).
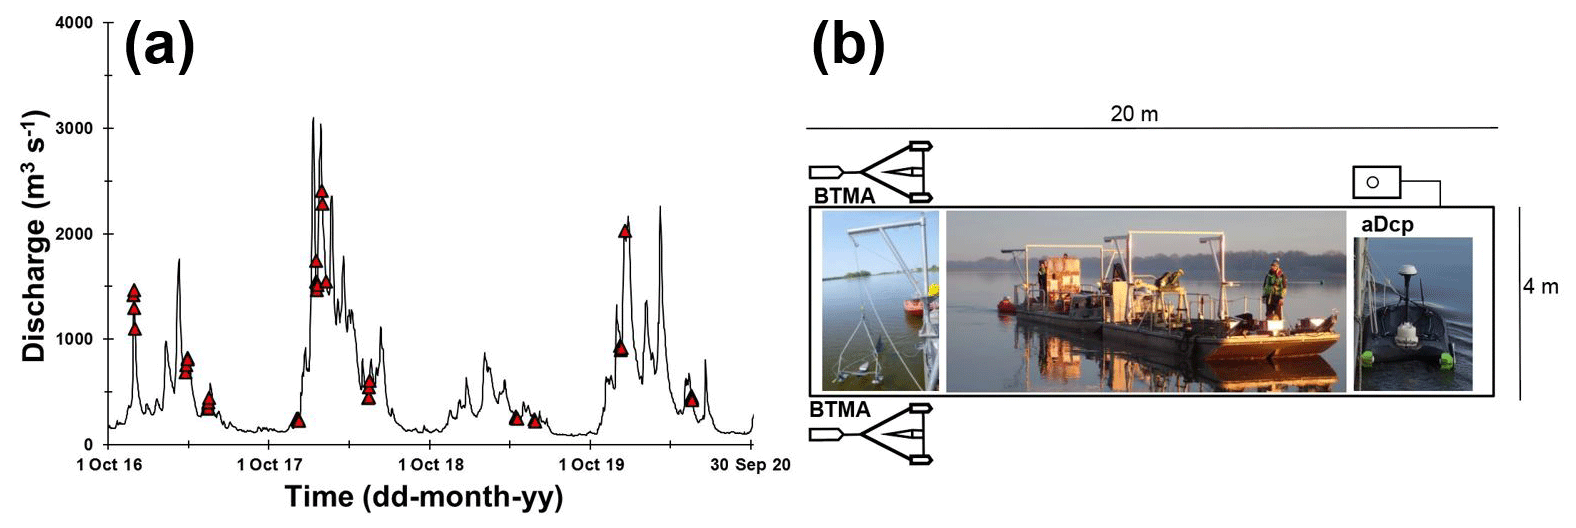
Figure 2(a) Distribution of bedload sampling surveys along the hydrograph of Saumur gauging station located about 30 km upstream from the study site. (b) Scheme of the main boat and disposition of monitoring facilities. Bedload transport meter Arnheim (BTMA) samplers; acoustic Doppler current profiler (aDcp).
Bars are characterized by an average wavelength of 1300 m, corresponding to approximately 3 times the channel width. The mean bar height is 1.5 m. At submerged conditions, bars can migrate with a celerity of 0.5 to 2 m d−1. During floods, the bar celerity can increase up to 4 m d−1 (Le Guern et al., 2019a). During floods, dunes are superimposed on bars, whose height, wavelength and mean celerity are approximately 0.3, 4.4 and 32 m d−1, respectively.
Direct measurements of bedload sediment transport rates were performed using pressure-difference samplers. This conventional approach was used to evaluate three indirect acoustic methods: the apparent bedload velocity assessed from aDcp measurements, the dune tracking method (DTM) inferred using single-beam echosounding and the self-generated noise (SGN) of sediments measured using a hydrophone. A total of 72 surveys were performed from October 2016 to May 2020 (discharge ranging between 210 and 2290 m3 s−1) including 43 surveys with bedload samplers presented in Fig. 2a (Appendix A).
3.1 Bedload rates obtained using pressure-difference samplers
Bedload transport rates were measured using two synchronized bedload transport meter Arnheim (BTMA) samplers, consisting of a sampling basket mounted on a frame. The sampling baskets have a rectangular mouth 0.05 m high and 0.085 m wide. A complete description of the sampler can be found in de Vries (1979) or in Eijkelkamp (2003). Devices were mounted on a 20 m long boat stabilized using two anchors (Fig. 2b). These two samplers were deployed on six sampling points (S1 to S6) distributed along a cross section (Fig. 1). At each sampling point, 10 samples were collected with each BTMA (20 in total), and volumes of each samples were measured in situ with a graduated cone (Imhoff cone). Collected volumes were integrated over at least 2 min. All sample volumes from each BTMA were merged for sieving analysis (leading to two sediment samples per sampling point; one for each BTMA). Then, the average volume of caught sediments from the two BTMAs was computed and converted into instantaneous unit bedload rates as follows:
where qs BTMA is the unit bedload transport rate (g s−1 m−1), α is the trap efficiency factor based on calibration (α=2), V is the mean volume of the instantaneous sediment catch (m3 s−1), b is instrument's mouth width (b=0.085 m), ρs is the sediment density (2650 kg m−3) and ε is the volumetric sediment concentration (assumed to be equal to 0.65). Suggested values of α and b were adopted from Boiten (2003), who mentioned that the trap efficiency factor does not include the possible losses of sediment finer than 0.3 mm (mesh size opening). Sampler positions and sampling quality were controlled by using two cameras mounted on the BTMAs, but records during flood events were unusable. The increase in the water depth limits the light at the bottom of the water column and the addition of a mounted light did not improve the visibility because of particles in suspension. Sediment samples were analysed using the standard sieving technique (Folk and Ward, 1957) to determine the grain size distribution (GSD) using the tool “GRADISTAT” developed by Blott and Pye (2001). Uncertainties associated with the estimation of the unit bedload were calculated following Frings and Vollmer (2017).
3.2 Apparent bedload velocity from aDcp
Simultaneously with the BTMA measurements, an aDcp was installed on the boat (Fig. 2b). Measurements were performed using a SonTek RiverSurveyor M9 (bi-frequency, 1 and 3 MHz) or a Teledyne RD Instruments Rio Grande (1.2 MHz). The sampling time needed to get a stable apparent velocity is in the range of 3 min for the case without bedforms (Conevski et al., 2019) and 25 min (Rennie et al., 2002). In our study the sampling time was between 5 and 190 min. The aDcp was coupled with a RTK GPS Magellan ProFlex 500 receiving position corrections via the Teria network (centimetre level accuracy). The aDcp measurement allowed the use of both an empirical approach and calibration approach for comparison with sediment sampler measurements. The apparent bedload velocity Va was estimated from the bottom tracking signal, allowing the identification and the position of the river bed. In the case of a mobile bed, the Doppler shift of the backscattered acoustic pulse of the bottom track depends on the boat velocity and on the bed velocity. According to Rennie et al. (2002), the apparent bedload velocity can be estimated using
where VGPS and VBT are the boat velocity according to GPS reference and bottom track respectively. Even if the boat was anchored, the GPS signal was used in Eq. (2) to correct apparent bedload velocity from small lateral displacements observed. When the GPS signal was poor or missing, VGPS was considered as null, and Va resulted only from the bottom track signal VBT (representing 15 % of the dataset). Following Jamieson et al. (2011), the apparent velocity Va was calculated for the north and east velocity components (VaE and VaN, respectively), limiting the overestimation especially in areas where inconsistent directions and low magnitudes of bedload velocity were found: .
To avoid compass and GPS issues, and to eliminate the effect of residual lateral displacement of the anchored boat, the apparent bedload velocity was projected onto the flow direction using
with wdir BT the flow direction with bottom track reference and bdir BT the boat direction with the bottom track reference (in degree). Equation (3) gives a value of apparent bedload transport velocity for each time step (approximately equal to 1 s) that was averaged to obtain a value for each sampling point. This method assumes that bedload is orientated in the same direction as the main flow. According to Rennie et al. (2002), the bedload transport rate per unit width (qs ADCP, g s−1 m−1) can be computed from two different kinematic models, the first of which is
where is the particle radius, D50 is the median sediment diameter (m) and ρs is the sediment density (2650 kg m−3). In this model, it is assumed the maximum bedload thickness is a single particle. The second model is
where cb is the concentration of the active transport layer considered as the saltation height (van Rijn, 1984), and the van Rijn (1984) formulation was adopted to compute the active layer thickness (ds) as a function of the hydraulic condition and sediment grain size:
where c0 is the maximum bedload concentration (0.65), T is the transport stage parameter that reflects the sediment mobility, is the bed shear velocity related to the grain (m s−1), d is the mean water depth (m), is the mean flow velocity measured from the aDcp (m s−1), and u*cr is the critical bed shear velocity (m s−1) calculated from the Shields curve (Van Rijn, 1984) and function of grain size through the scaled particle parameter D*:
where g is the acceleration of the gravity (m s−2), ν is the kinematic viscosity (m2 s−1) and s is the sediment density ratio. For the range of grain size of this study, u*cr is computed as follows:
In order to evaluate the sensibility of the apparent bedload post-processing, the two kinematic models (Eqs. 4 and 5) were tested using raw apparent bedload velocity (Va) and projected apparent bedload velocity (Va proj).
To assess the capability of the aDcp to detect bedforms through the evolution of apparent bedload velocity, three surveys were conducted by positioning the aDcp 0.6 m above the river bed. This experimental scheme was adopted to avoid lateral movements of the boat, to be as close as possible to the river bed and to reduce the space between beams. This configuration permitted us to fix the footprint for each beam to about 0.0046 m2 and a distance of 0.56 m between opposed beams. This allowed us to describe the apparent bedload velocity with a finer accuracy, especially in the presence of bedforms of 0.2 m height and 3.9 m length (on average). These surveys were performed for several hours (from 2.1 to 4.7 h) to capture the migration of more than one dune passing under the device. The value of apparent bedload velocity was smoothed by using a moving window with an average of 500 points (approximately 500 s) to remove the outliers from the raw dataset. In the present study, all negative values were excluded from the comparison with BTMA measurements (16 % of apparent velocity values).
3.3 Bathymetrical echosounding and dune tracking method
A single beam echosounder Tritech PA500 (0.5 kHz) coupled with a RTK GPS LEICA Viva GS25 was used for high-frequency bathymetric surveys to determine bar and dune morphodynamics along six longitudinal profiles (about 400 m long) centred on sampling points indicated in Fig. 1. Dune height (HD) and wavelength (λD) were estimated using the bedform tracking tool (BTT) based on the zero-crossing method (Van der Mark and Blom, 2007). Dune celerity (CD) was estimated with the dune tracking method (DTM, Simons et al., 1965; Engel and Lau, 1980) following the dune crests between two subsequent bathymetric surveys for a mean interval time equal to 40 min. The interval time needs to be adjusted with discharge because of the dune celerity variation from one survey to another. The determination of a proxy to evaluate sediment transport directly from DTM measurements is difficult because dune migration is a function of several parameters. A semi-empirical equation that accounts for these parameters was used to compare bedload transport rates with the reference measurement. The computed dune parameters were used to calculate the unit bedload transport rate (qs DTM, g s−1 m−1) using the formula by Simons et al. (1965):
where HD is the mean dune height along the profile (m), CD is the median dune celerity (m s−1) and β is the bedload discharge coefficient equal to 0.5 for a perfect triangular dune shape. The β coefficient neglects the volume of bypassing material from previous dunes or exchanges between bedload and suspended load (Wilbers, 2004). Due to its large variability (Van den Berg, 1987; Ten Brinke et al., 1999; Wilbers, 2004), the sensibility of the bedload transport rate was assessed for , as proposed by Engel and Lau (1980) and Wilbers (2004). Considering the accuracy of the bathymetrical echosounding relative to the dune size, the sinuosity of dune crests and the representativeness of dune celerity, only profiles with a mean dune height greater than 0.1 m and more than 10 dunes were considered.
3.4 Hydrophone and acoustic power
Passive acoustic monitoring was performed with a Teledyne RESON Hydrophone TC4014-5 (sensitivity of −180 dB) plugged into an EA-SDA14 card from RTSYS. This device has a large frequency range from 0.015 to 480 kHz, with a linear response until 250 kHz (±3 dB). The beam pattern of the hydrophone is omnidirectional. The hydrophone has been deployed following the protocol proposed by Geay et al. (2020). Longitudinal profiles were defined on the sediment transport sampling section (22 profiles; see Fig. 1). The boat was positioned upstream of the sediment transport gauging section and left adrift at flow velocity. Depending on the water depth, the hydrophone was installed at a constant depth between 0.4 and 0.7 m below the water surface. Data acquisition was stopped after the boat crossed the sediment transport gauging section. The drift duration ranged between 15 and 140 s, depending on the flow velocity (mean time of 31 s). For each drift, a spectral probability density (SPD) was computed (Merchant et al., 2013). Then, a median power spectral density (PSD) was computed as proposed by Geay et al. (2017). Median PSD is preferred to mean PSD as it filters out anomalous acoustic events such as the hydrophone impinging the riverbed. The acoustic power (P) for each drift was computed by integrating the median PSD over a range of frequency comprised between fmin (15 kHz) and fmax (350 kHz) (Geay et al., 2020):
The minimum frequency was chosen to avoid hydrodynamic and engine noises, while the maximum frequency was set by the upper limit frequency of the device and was adjusted relative to PSD. Finally, the nearest hydrophone drift for each BTMA sampling point was selected. Hydrophone drifts and sampler measurements were not synchronized. Several tests were carried out to ensure that these acoustic power variations were not related to the distance between the hydrophone and the river bed. As no theoretical expression has been developed to estimate bedload rates from hydrophone measurements, only the calibration approach was implemented.
4.1 Comparison between acoustics and direct bedload transport rate measurements
The BTMA dataset is composed of 135 unit bedload rates calculated from 2628 individual sediment samples. This dataset represents an average of 19 samples on each sampling point to compute unit bedload rates (minimum of 5 and maximum of 57 samples). Bedload rates measured using the BTMAs ranged between 0.01 and 268 g s−1 m−1. The standard deviation of unit bedload rates increased with discharge with a mean value of 33 g s−1 m−1. This illustrates the spatio-temporal variability of sediment transport induced by bedform migration.
The aDcp dataset is composed of 96 simultaneous measurements of apparent bedload velocity and BTMA samplings (Fig. 3 and Appendix B). The mean apparent bedload velocity is 0.02 m s−1, and the maximum value was 0.11 m s−1. A reduced major axis (RMA) regression has been computed between these two variables with a coefficient of determination (COD) R2 equal to 0.51:
As shown in Fig. 3, this site-specific calibration procedure at a reach of the Loire River is consistent with the dataset already published on several world large rivers (Rennie et al., 2017).
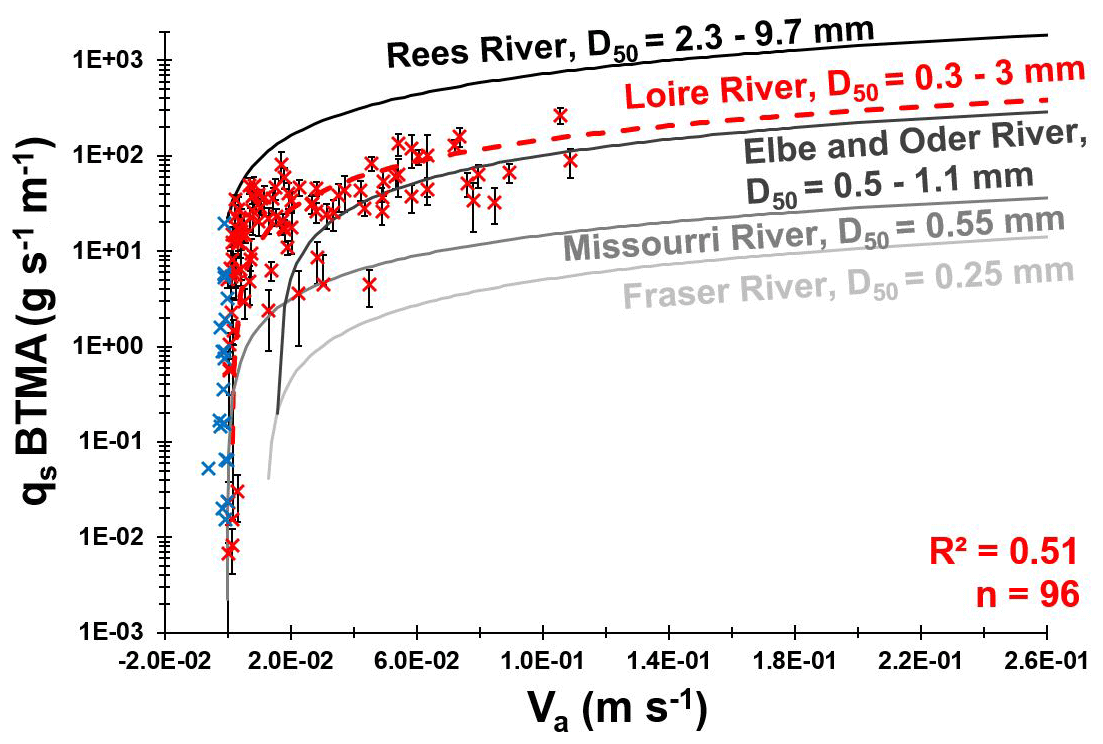
Figure 3Unit bedload transport rates measured with BTMA samplers as a function of the apparent bedload velocity measured with aDcp. The red dashed line represents the RMA regression of the Loire River. Compare with other site-specific calibration curves (Conevski et al., 2020a; Rennie et al., 2017). Blue marks represent negative apparent bedload velocity values excluded from this regression.
To evaluate the accuracy of a method against a reference, the discrepancy ratio is classically employed in the literature (Van Rijn, 1984; Van den Berg, 1987; Batalla, 1997) and is defined as the ratio between the bedload rate estimated with the indirect method and the bedload rate using BTMA. Computed bedload layer volume concentration (Eq. 7) varies between 0.005 and 0.1 (0.03 on average). Bedload layer thickness (ds) (Eq. 6) ranges between 1D50 and 7D50 (5D50 on average). Bedload rates computed using Eq. (5) underestimate BTMA bedload rates with only 24 % of the dataset with a discrepancy ratio between 0.5 and 2 (Fig. 4b). By considering apparent bedload velocity without projection onto the flow direction, the kinematic model (Eq. 5) satisfactorily estimates BTMA bedload rates with 41 % of the dataset with a discrepancy ratio between 0.5 and 2. Conversely, using raw apparent bedload velocity in Eq. (4) leads to only 33 % of the dataset varying with a factor of 2 against 54 % with projected Va (Fig. 4a). According to these results, Eq. (4) better describes the sampler bedload rates with projected apparent bedload velocity, whereas raw apparent bedload velocity is preferred with Eq. (5). Some outlier data are observed for BTMA bedload discharge lower than 0.1 g s−1 m−1. These points correspond to low-flow conditions for which bedload samplers could underestimate bedload fluxes (gap between the sampler mouth and the riverbed).
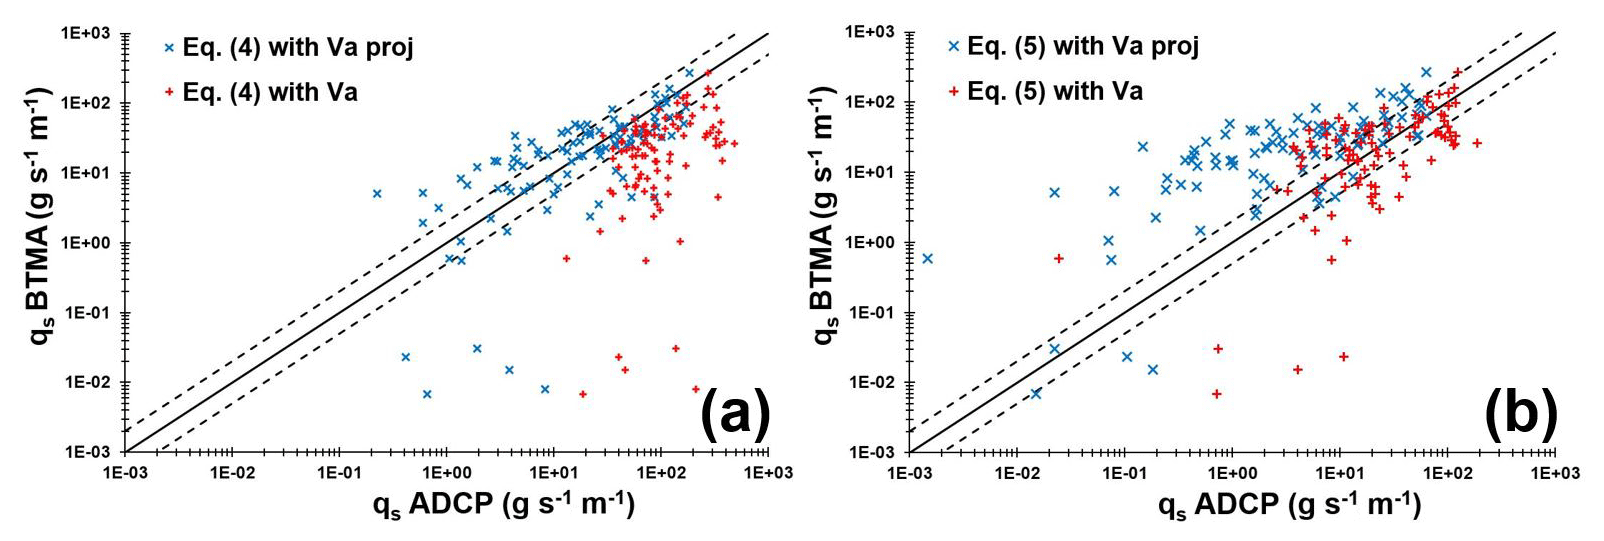
Figure 4The log–log correlation between bedload rates measured with BTMA sampler and calculated using (a) Eq. (4) and (b) Eq. (5). The solid black line represents the perfect correlation and dashed black lines represent a factor of 2 above and below the perfect correlation.
It appears difficult to estimate bedload rates only from dune celerity by assuming a direct relation between dune celerity and bedload transport rates measured with BTMA. Estimation of bedload transport rates from dune morphology has been performed by using the empirical formula of Simons et al. (1965) (Eq. 13). The dataset is composed of 49 DTM profiles with associated BTMA samples (Appendix C). The mean dune height and length vary from 0.1 to 0.5 m and 1.3 to 12 m, respectively. The median dune celerity varies between 13 and 61 m d−1. According to Fig. 5a, bedload rates estimated with a discharge coefficient β=0.33 are in agreement with BTMA bedload rates with 67 % of values in a factor of 2 of the perfect correlation compared with 49 % of values for a discharge coefficient of 0.57 (Fig. 5a). The definition of the discharge coefficient proposed by Engel and Lau (1980) is better adapted for the observed dune shapes found in the Loire River which are characterized by mean steepness () approximately equal to 0.05 (in line with other observations on the Loire River; Claude et al., 2012; Rodrigues et al., 2015; Wintenberger et al., 2015).
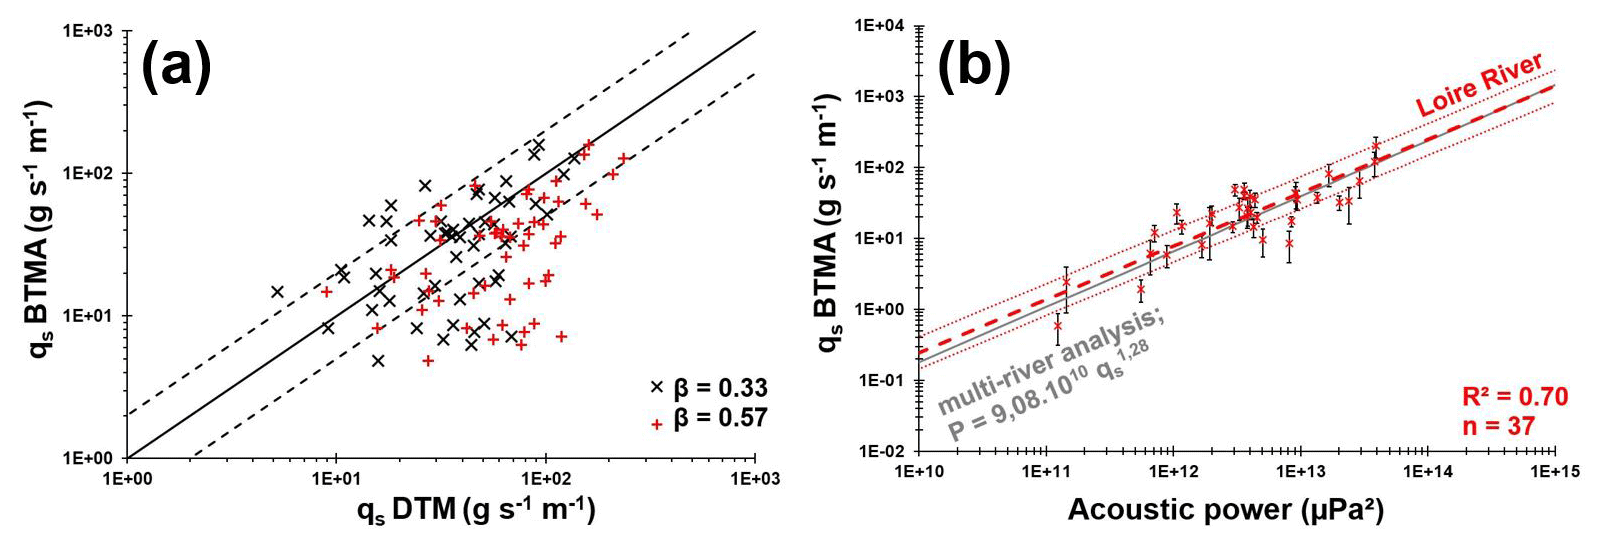
Figure 5(a) The log–log correlation between bedload rates measured with BTMA samplers and bedload rates calculated using Eq. (13). The solid black line represents the perfect correlation and dashed black lines represents a factor of 2 of the perfect correlation. (b) Unit bedload rates measured with BTMA samplers as a function of acoustic power measured with hydrophone. Dashed red lines represent the RMA regression with envelopes curves of a factor of 2 of the bedload rates. Compare with Geay et al. (2020).
Even if the statistical representativeness is lower than other methods (n=37, Appendix D), the RMA regression between the acoustic power and BTMA sampling is better (R2=0.70), and 60 % of values vary between a factor of 2 (Fig. 5b). As a consequence, a new equation to estimate sediment transport from acoustic power is proposed:
This calibration curve is similar to observations performed by Geay et al. (2020) on 14 study sites distributed on 11 different rivers despite the use of different instruments (sampler and hydrophone) and the integration of median PSD over a wider range of frequency in the present study. Moreover, the median PSD differ from the Isère River (Petrut et al., 2018) and from Drau River (Geay et al., 2017). These rivers are characterized by coarser sediments (see Fig. 6a) and the central frequency of the PSD decrease with an increasing D50. These observations are in line with Thorne's (1986) theory. The central frequency of the median spectrum of the Loire River is approximately equal to 140 kHz. The frequency band of the bedload is shifted towards high frequencies due to finer grain size.
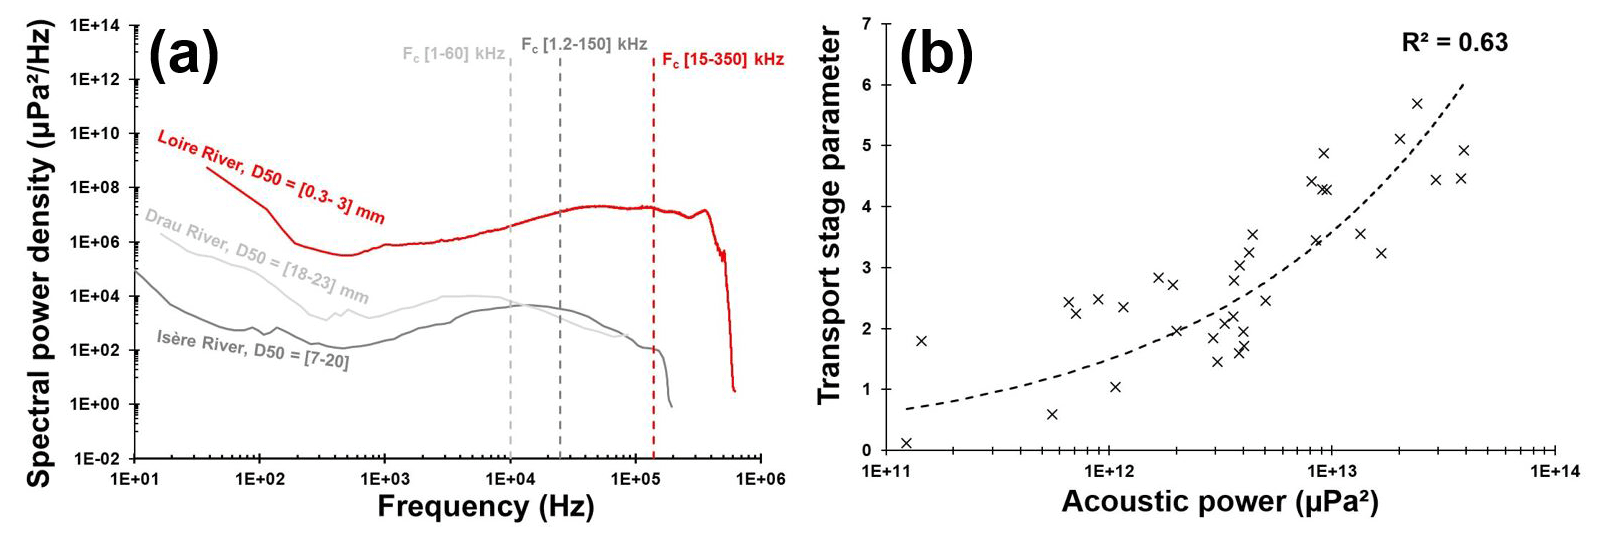
Figure 6(a) Comparison of PSD from three rivers with varying D50 (PSD of the Drau River and the Isère River are extracted from a single measurement, PSD of the Loire River is the median PSD from 450 measurements). (b) Transport stage parameter (from Van Rijn, 1984) as a function of acoustic power.
The acoustic power corresponding to the integration of the spectrum over a range of frequency is related to the grain size (Thorne, 1985) and sediment kinematics (Gimbert et al., 2019). To analyse the effect of sediment mobility on the acoustic power, the transport stage parameter (Van Rijn, 1984) is calculated. The power law adjusted between these two parameters provides evidence for a positive evolution of the acoustic power with sediment mobility (Fig. 6b).
The comparison can be performed between indirect methods to discuss the acceptability of the BTMA reference. The apparent bedload velocity and the acoustic power are poorly correlated with mean dune morphological parameters (Table 1).
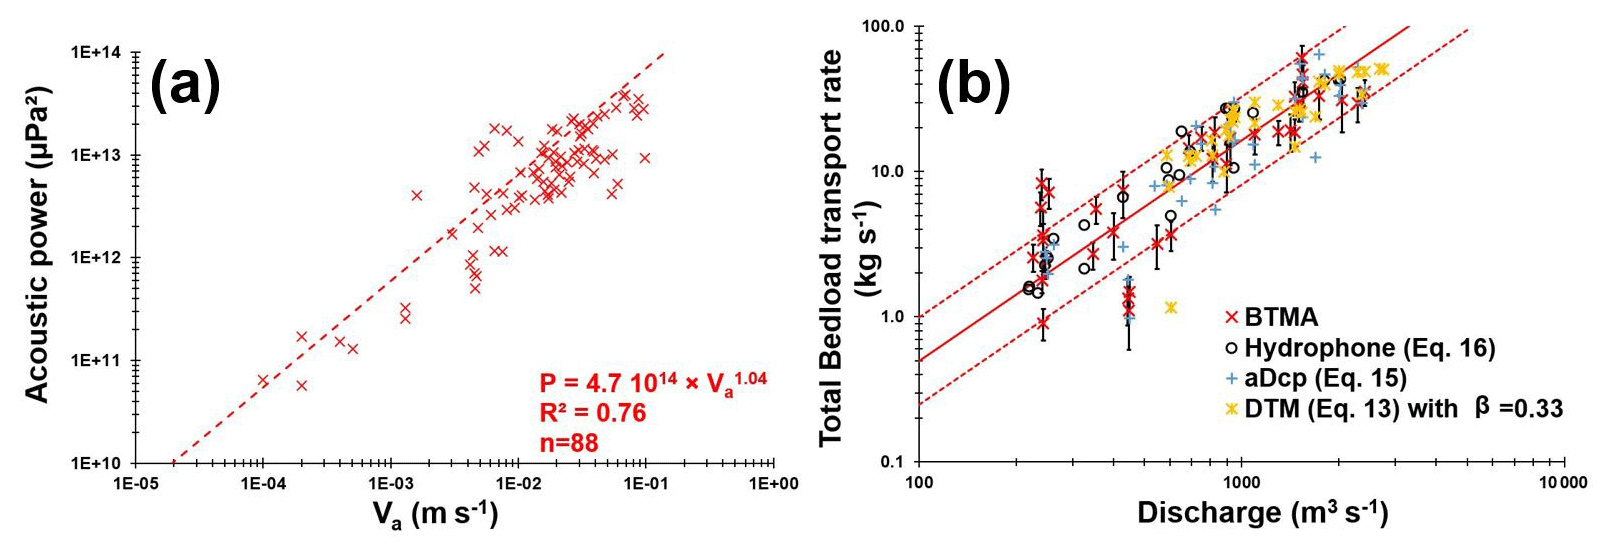
Figure 7(a) Acoustic power as a function of apparent bedload velocity. (b) Cross-section-integrated bedload transport rates as a function of discharge.
Table 1Coefficient of determination (COD) between dune parameters and acoustic methods (log values).
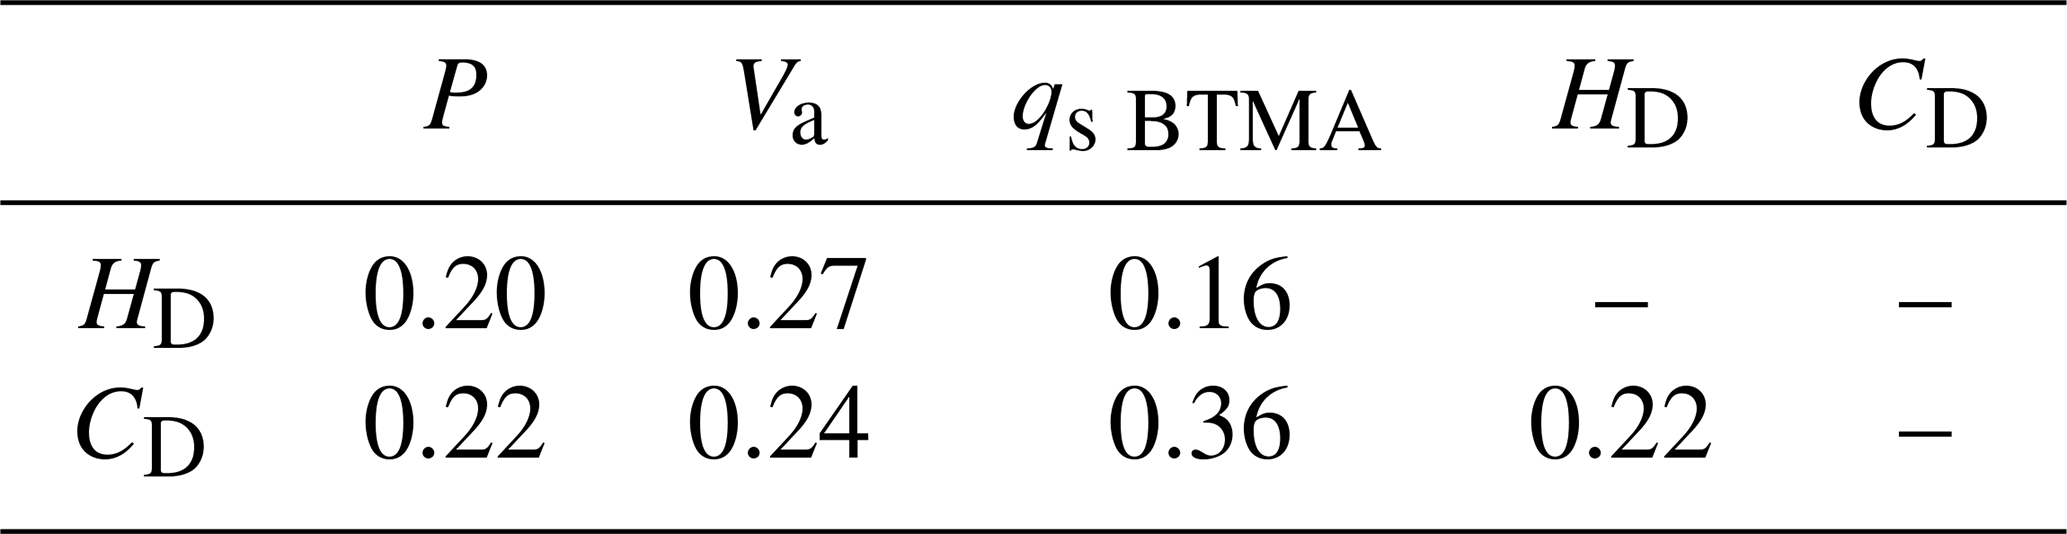
The apparent bedload velocity estimated by aDcp is the velocity of the top layer velocity or dynamical active layer (sediment being transported over a dune), whereas the dune celerity is the mobility of the exchange event active layer, according to Church and Haschenburger (2017). It must be noted that apparent bedload velocity is higher than dune celerity by a factor approximately equal to 100. On the other hand, the apparent bedload velocity is positively correlated with the acoustic power. The COD of the RMA regression is equal to 0.76 (Fig. 7a).
Before focusing on the spatial distribution of unit bedload rates, total bedload rates are calculated by interpolating unit bedload rates between sampling points on the cross section for each method. The COD of the RMA regression established between BTMA bedload rates and water discharge is 0.71 (Fig. 7b) with 77 % of the values varying within a factor of 2. The dispersion of bedload rates is higher for low water discharge (less than the mean annual discharge of 680 m3 s−1). Bedload rates are estimated from Eqs. (3), (15) and (16), for the DTM, the aDcp and the hydrophone, respectively. Both the hydrophone and DTM bedload rates are less scattered with 96 % of values with a discrepancy ratio between 0.5 and 2, compared with 82 % for the aDcp.
4.2 Spatial distribution of bedload in a sandy-gravel-bed river with migrating bedforms
4.2.1 Determination of bedload transport on a cross section using acoustics methods
To compare the spatio-temporal distribution of bedload transport rates, sediment transport sampling was performed on the same cross section for all surveys and for various discharge conditions. Two surveys with contrasting discharge conditions and different bed configurations are presented (Fig. 8) to illustrate the capability of acoustic methods to determine bedload active width in a river reach characterized by the presence of macroforms and superimposed mesoforms (sensu lato, Jackson, 1975).
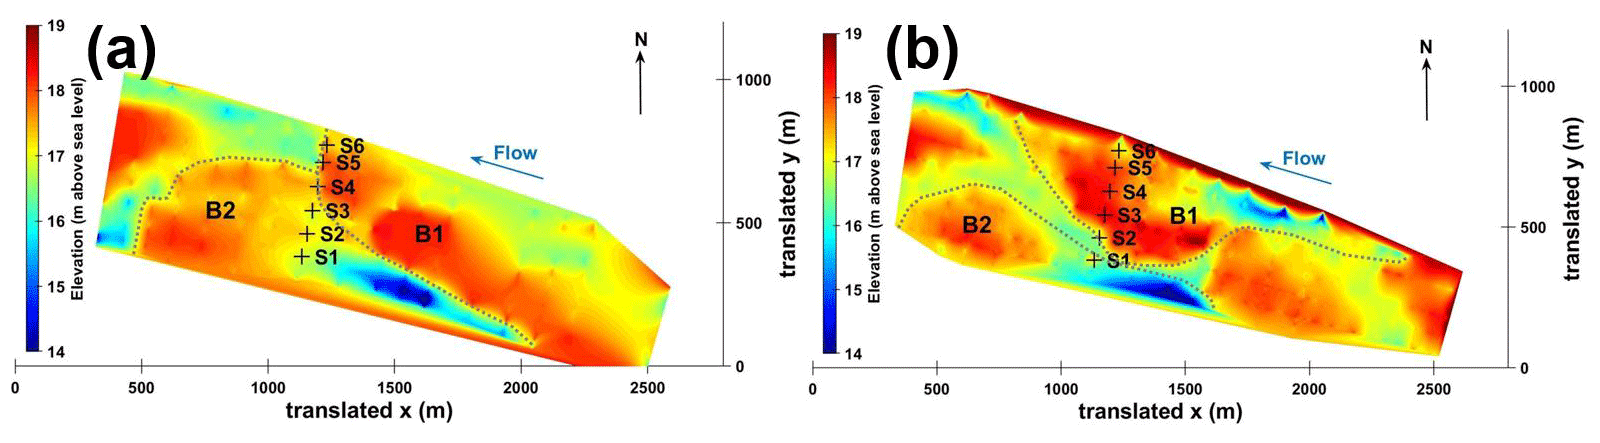
Figure 8Digital elevation models (obtained using natural-neighbour interpolation of single beam bathymetrical surveys) showing location of sampling points with respect to bar location during (a) the survey of 17 May 2018 (Q=604 m3 s−1) and (b) the survey of 19 December 2019 (Q=2050 m3 s−1).
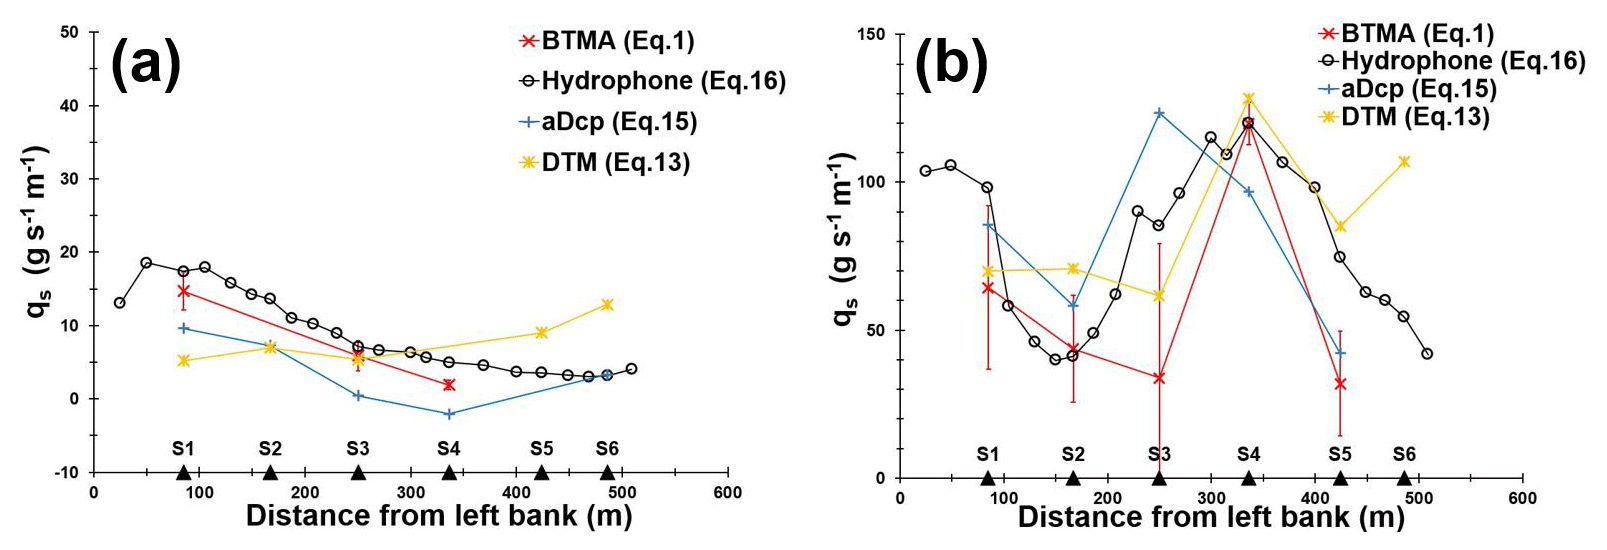
Figure 9Lateral distribution of unit bedload rates assessed from different methods for two surveys performed: (a) 17 May 2018 (Q=604 m3 s−1) and (b) 19 December 2019 (Q=2050 m3 s−1), respectively.
In May 2018, a bar (B1, Fig. 8a) was located just upstream of the sediment gauging section from the centre to the right part of the channel. In the left part of the channel, BTMA sampling was performed on the stoss side of another bar (B2, Fig. 8a). Consequently, bedload rates gradually rose from the centre of the channel (2 g s−1 m−1, S4) to the left part of the channel (15 g s−1 m−1, S1) except for the DTM (Fig. 9a). The intensity of bedload transport rates was evaluated for each acoustic signal from regression equations established above (Eqs. 13, 15 and 16, for DTM, aDcp and hydrophone, respectively). The linear equation of aDcp calibration allow the calculation of negative bedload flux for apparent bedload velocity below 0.0016 m s−1 (Fig. 9a, S4). ADcp and hydrophone signals followed the same trend as the BTMA measurement. In the right part of the channel, no reference measurements were available (S5 and S6), but all acoustic signals followed the same trend (increasing bedload transport rates). The bedload rates estimated with the DTM were lower than the reference in the left part of the channel. This can be explained by the reduced number of dunes in this area that caused a higher uncertainty in dune celerity determination. In the right part, the proximity of the bar-front-induced lower bedload transport rates measured with aDcp and hydrophone. DTM integrates sediment dynamics over a longitudinal profile that does not necessarily reflect the bedload transport conditions at a local scale. Due to the lee effect provided by the proximity of the bar front, dunes were not present downstream of the bar, and only dunes located on the stoss side of the bar were used to calculate the mean dune celerity. ADcp underestimates whereas the hydrophone method overestimates the unit bedload rate compared with BTMA measurements.
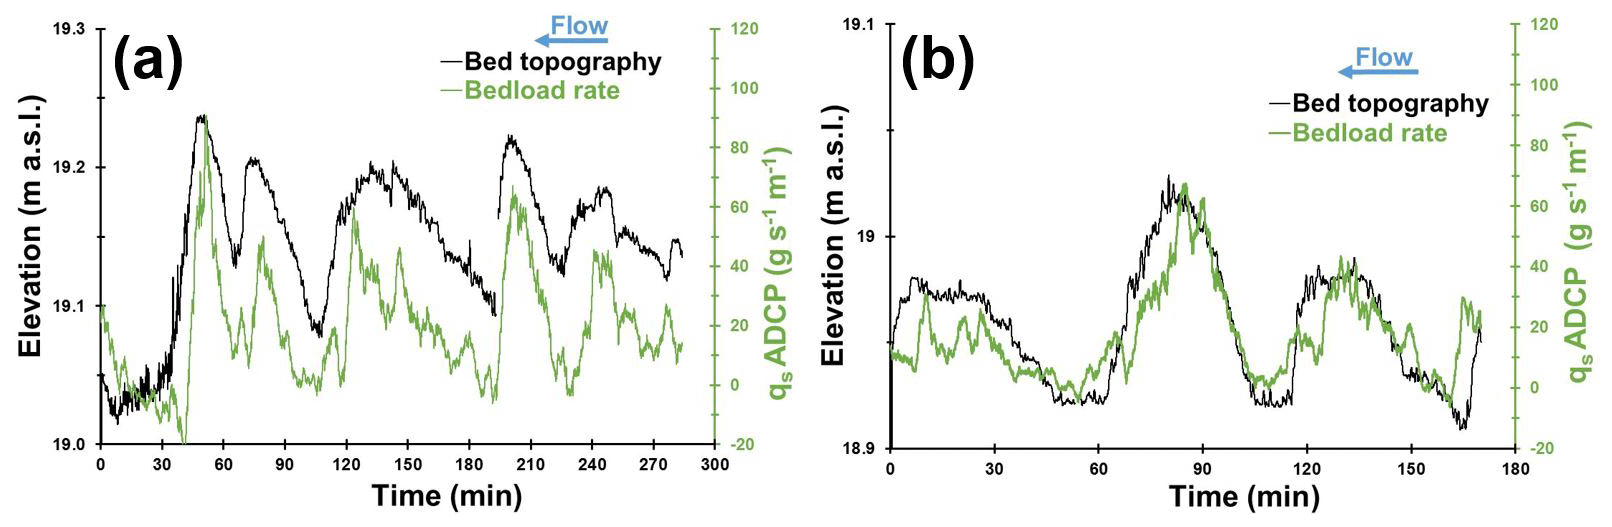
Figure 10Bedload rates calculated using Eq. (15) and bed topography obtained during a static measurement performed using an aDcp: (a) survey done on 20 May 2020 (Q=470 m3 s−1; mean water depth = 1.04 m) and (b) survey done on 29 May 2019 (Q=210 m3 s−1; mean water depth = 0.85 m).
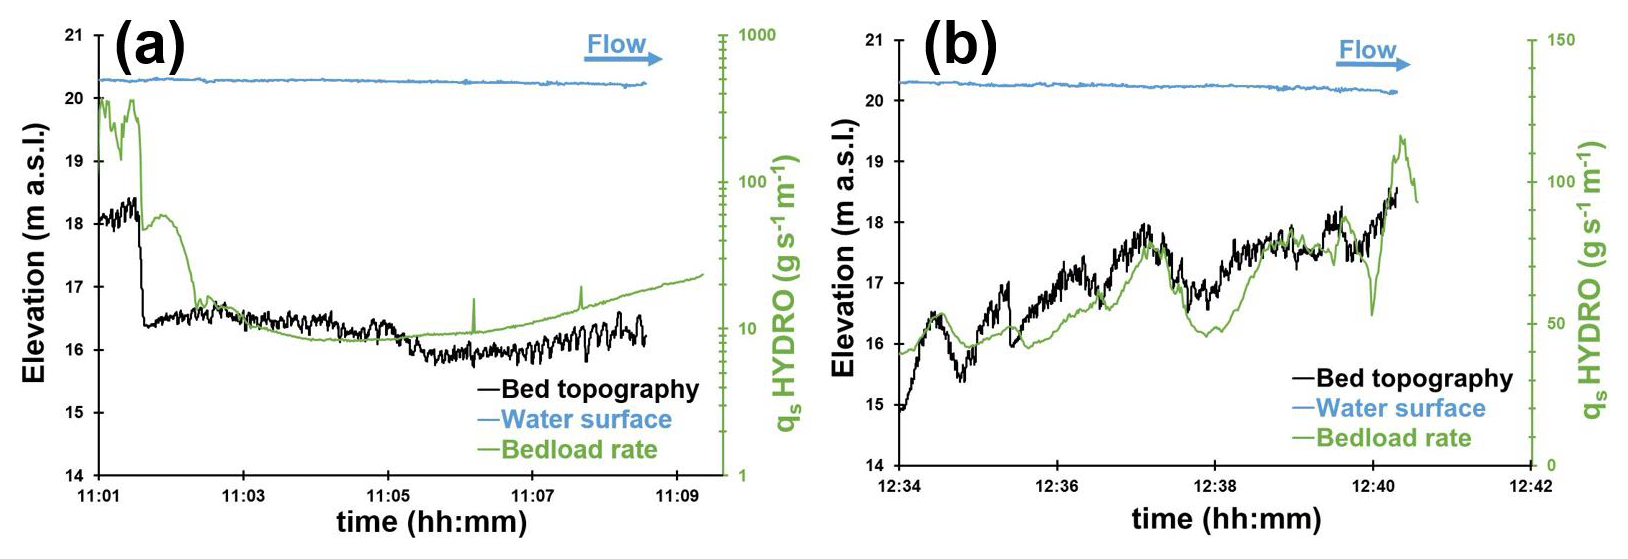
Figure 11Bedload rates calculated on bedforms using the hydrophone and Eq. (16) near a bar front (a) and on a dune field (b). Bed topography and water surface along two longitudinal bathymetric profiles for the 8 February 2018 survey, Q=1550 m3 s−1: (a) P10, mean water depth = 3.8 m. The profile length from 11:01 to 11:09 LT corresponds to 400 m; (b) P12, mean water depth = 3.4 m. The profile length from 12:34 to 12:41 LT corresponds to 518 m.
In December 2019 (Fig. 9b), the flow discharge was higher (2050 m3 s−1) than the value observed in May 2018 (Q=604 m3 s−1), and measured bedload rates ranged between 32 and 120 g s−1 m−1. Due to the bar migration, the bed configuration was different. Bar B1 reached the sediment gauging cross section. As a consequence, sampling points S3 to S6 were located on the stoss side of bar B1 (Fig. 8b). The sampling point S2 was located just downstream of the bar front where the velocity and sediment transport rates were lower (Fig. 8b). The high spatial resolution of the hydrophone measurements confirmed that the preferential bedload active width was located between 250 and 450 m from the left bank (Fig. 9b). For this survey, acoustic signals (i.e. acoustic power, apparent bedload velocity) followed the same evolution pattern as samplers along the cross section except for S3. Bedload transport rates determined with the DTM did not follow the trend of bedload rates determined with aDcp and hydrophone at the proximity of bar front and near the bank as in the previous survey (S2 and S6). The hydrophone model overestimated the sediment transport in comparison with the BTMAs for S1, S3 and S5.
4.2.2 Sediment transport processes on bedforms analysed from aDcp and hydrophone
The aDcp computed bedload rates evolved according to bedform location for fixed measurements performed on dunes of height ranging between 0.05 and 0.2 m (Fig. 10a and b). Higher bedload rates were found on the crest of the dune and lower values in the trough. The amplitude of bedload rates between crest and trough for low-flow conditions (Fig. 10b) ranged between 42 and 67 g s−1 m−1. For higher-flow conditions, it varied between 45 and 91 g s−1 m−1 (Fig. 10a). These values were extracted considering bedload rates in the trough as equal to zero (not negative). The aDcp linear regression (Eq. 15) did not allow the calculation of bedload transport rates due to negative apparent bedload velocity. This is the case downstream from the lee face of the dunes (Fig. 10a, between 8 and 42 min, 96 and 107 min, 185 and 193 min, and 227 and 230 min; Fig. 10b, between 48 and 55 min and 153 and 162 min). The mean time recorded between two successive dune crests was 1 h.
Hydrophone drifts showed that the longitudinal evolution of acoustic power can be correlated with changes in elevation of the riverbed due to dune and bar presence. For instance, in the presence of a 2 m high bar front, the bedload rate significantly decreased, illustrating the lee effect that is characterized by a decrease in bedload sediment transport (Fig. 11a). This shows that the hydrophone is sensitive enough to detect this local phenomenon induced by the presence of a bar front immediately upstream. The bedload rates range from about 8 g s−1 m−1 on the bar crest to 376 g s−1 m−1 in the bar trough (1×10¹² to 1.7×10¹⁴ µPa2 of acoustic power, respectively). According to flow velocity measurements, it appears that a 2 m high bar front can influence flow velocity and bedload transport rates up to the reattachment point located approximately 100 m downstream. Downstream of the bar front, the bedload transport rate increased at 11 h 6 min (Fig. 11a), which would be in coincidence with the flow reattachment point. Further downstream, the bedload transport rate increased from 8.5 to 23.4 g s−1 m−1 (representing respectively an acoustic power of 1.2×10¹² to 4.1×10¹² µPa2), where dunes exhibit a more regular shape increasing their amplitudes from 0.02 to 0.4 m, approximately. On the left part of the channel (Fig. 11b), the drift was located at the stoss side of a bar where larger dunes were observed (about 1 m in height) with superimposed small dunes (height approximately equal to 0.3 m). The bedload transport rate calculated above these bedforms increased near the crests of the large dunes (about 80 g s−1 m−1) and decreased in the troughs (about 50 g s−1 m−1) where superimposed bedforms were smaller (Fig. 11b).
5.1 Relevance of acoustics for computing bedload transport rates
Despite their lack of accuracy and their low spatial representativeness, samplers allow a direct measurement of bedload and represent the only reference measurement of bedload in the field. The presence of bars affect sediment transport locally and make the sampling method very sensitive to the location of the sampling point. For low water discharge (below mean annual discharge, 800 m3 s−1), bars are above the water line and considerably reduce the width where sediment transport occurs. The number of sampling points decreases with discharge (because bars were not flooded) leading to a higher bedload rate variability (Fig. 7b). Moreover, in weak bedload transport conditions, the BTMA sampler most likely performed with reduced efficiency initially calibrated to 50 % (Van Rijn and Gaweesh, 1992; Gaweesh and van Rijn, 1994; Banhold et al., 2016). The presence of dunes influences the performance of the sampler by preventing the exact positioning of sampler mouth on the river bed. These deficiencies lead to a large uncertainty in bedload estimation which set the limits of the comparison with other methods.
The use of hydrophones to estimate bedload transport in a lowland sandy-gravel-bed river constitutes a new research topic. As discussed by several authors, the use of hydrophones was so far restrained to gravel-bed rivers (Bedeus and Ivicsics, 1963; Barton et al., 2010; Hilldale et al., 2014; Thorne, 2014; Marineau et al., 2016; Geay et al., 2017) or marine environments (Thorne et al., 1984; Thorne, 1986; Blanpain et al., 2015). More recently, Geay et al. (2020) highlighted that the acoustic power measured with a hydrophone can be correlated to the sampler measurements of bedload in fluvial environments characterized by bed slopes varying between 0.05 % and 2.5 % and channel width ranging between 8 and 60 m. In these mountainous environments, the median grain size ranged between 0.9 and 62 mm (n=582 samples). In our study, the downstream reach of the Loire River shows smaller slope (S=0.02 %), a wider channel (W=500 m), and a median grain size ranging between 0.3 and 3.1 mm (n=450 samples). The hydrophone is therefore an efficient tool for sediment transport gauging, allowing the measurement of numerous sampling points (average of 17 sampling points) during a relatively shorter time period (1 h). This high spatial discretization makes the hydrophone functional over a wide range of discharges (even for low water discharge; Fig. 5b) by catching the high spatial variability of bedload transport. It should be pointed that the regression calculated in the present study (Eq. 16) is obtained from unit bedload rates (from several samples) and the acoustic power resulting in a unique acoustical drift, whereas Geay et al. (2020) compared averaged cross-section bedload rates and acoustic power. Despite these differences, the data presented above corroborate the results by Geay et al. (2020) and support their conclusions concerning the determination of a global calibration curve between acoustic power and bedload rates by extending its application to the lowland sandy-gravel-bed rivers. Although this needs to be confirmed by further investigations to better understand parameters that control the acoustic power measured (such as the propagation of sound waves in water (Geay et al., 2019), their attenuation, the saltation length, associated impact celerity or sediment grain size), results presented in this study suggest that the hydrophone method could be an efficient way to measure and to map bedload transport rates on a wider range of fluvial systems.
Several laboratory studies have been carried out (Ramooz and Rennie, 2010; Conevski et al., 2019, 2020b) and rivers instrumented with aDcp to determine bedload rates (Rennie et al., 2002; Rennie and Millar, 2004; Gaeuman and Jacobson, 2006; Gaeuman and Pittman, 2010; Brasington et al., 2011; Conevski et al., 2020a). Recent works have been carried out on two rivers (Elbe, Oder) similar to the Loire River in term of grain size characteristics, flow and shear velocity, and water depth (Conevski et al., 2020a). Even if the correlation between apparent bedload velocity and bedload rates is significant, this calibration equation (Eq. 15) was obtained from two very similar rivers. Despite these observations, there is no general agreement between bedload rates and apparent velocity (Rennie and Villard, 2004; Rennie et al., 2017). The response of aDcp to bedload transport depends on several parameters. The variation of the impulse frequency, the pulse length, beam focusing or associated internal signal processing (broadband or narrowband) can lead to different estimation of the apparent bedload velocity for the same sediment transport conditions (Conevski et al., 2020a). These parameters vary from one device to another (RDI/SonTek; Conevski et al., 2020b). The aDcp pulse samples a volume of the riverbed (Rennie et al., 2002), which can lead to a biased estimation of Va: (i) an underestimation in the case of high roughness of the riverbed with most of the reflected pulse scattered by the immobile particles below the active layer (Conevski et al., 2019) or (ii) an overestimation in the case of high concentration of the bedload layer (Rennie et al., 2017) or sand particles in suspension near to the riverbed (water bias; Rennie and Millar, 2004). Even if a general trend seems to be highlighted by the river comparison (Fig. 3) with an increasing bedload rate as grain size increases for a constant Va, the relationship between grain size and Va cannot be easily determined in response to all variables mentioned above. One explanation of this trend could be that suspended sands could contribute to the bottom tracking signal without being caught by the sampler (Rennie et al., 2017). Moreover, the accuracy of the measurement on a single cross section depends on the water depth heterogeneity that in turn influences the aDcp footprint and makes the aDcp method location sensitive when bedforms are present (Fig. 9b). Estimation of bedload rates using empirical equations is limited by the number of variables that are difficult to measure in the field (e.g. thickness and concentration of active layer; Kostaschuck et al., 2005; Villard et al., 2005; Holmes, 2010; Latosinski et al., 2017; Conevski, 2018). The results shown in Fig. 4a suggest that Eq. (4) estimates sampler bedload rates if the projected bedload velocity is used. This kinematic model does not account for the thickness or the sediment concentration of the bedload layer and assumes that bedload transport never exceeds the size of a single particle assessed as uniform in terms of grain size (Rennie et al., 2002). These assumptions seem not to be appropriate for a sandy-gravel-bed river. The active layer thickness should increase as suspended bed material load increases. Nevertheless, results are in agreement with BTMA bedload rates (Fig. 4a). This can be explained by an underestimation of the apparent bedload velocity when it is projected in the flow direction. On the other hand, Van Rijn (1984) defined the bedload layer thickness equal to the saltation height. The computed values of bedload layer thickness are coherent with other estimations performed on comparable rivers (Conevski et al., 2020a). Equation (5) better estimates sampler bedload rates using the raw bedload velocity (Fig. 4b). If we consider that cb and ds are well estimated by van Rijn equations (Eqs. 6 and 7), these results confirm that the projection of the apparent bedload velocity decreases the bedload velocity magnitude when the bedload direction differs from flow direction (e.g. bed slope effects). The influence of bedload velocity projection appears to be important when bedload is computed using kinematic models. Nevertheless, the calibration curve seems to be in agreement with other studies. Although the application domain of Eq. (4) does not correspond to the conditions in the Loire River, the decrease in projected Va seems to compensate for the overestimation of bedload rates when the raw apparent bedload velocity is used. This is the opposite for Eq. (5), which accounts for bedload layer thickness and sediment concentration. In this case, the projection of Va leads to an underestimate of bedload rates. Further works need to be done to improve the post-processing of Va by recently published filtering procedures (Conevski et al., 2019, 2020a) and to estimate its effect on calibration curve and kinematic models.
Contrarily to the aDcp, the DTM allows the investigation of the “event active layer” (Church and Haschenburger, 2017). The DTM is not a punctual measurement of bedload. Consequently, in the presence of macroforms such as bars, it is difficult to compare with BTMA samples because it takes into account dunes that are not necessarily present at the BTMA sampling point (typically downstream of a bar on the lee side). To some extent, the DTM and BTMA methods integrate bedload longitudinally at different scales. The presence of a local disturbance (or migrating bedform at low celerity) will affect the measurement. The determination of dune celerity by post-processing is time-consuming compared with the determination of dune morphology and the existing open-access post-processing tools. In order to determine bedload rates with empirical equations, this method needs a calibration coefficient that is difficult to measure in field studies (Ten Brinke et al., 1999; Wilbers, 2004). Moreover, physical samplers sample the dynamical active layer and thus are more comparable to the hydrophones and aDcps. Nevertheless, DTM remains an accurate method to estimate bedload transport in the Loire River (Fig. 5a) where dunes are present and high enough (over the mean annual discharge).
As suggested by previous authors, both an aDcp (Kenney, 2006) and a hydrophone (Bedeus and Ivicsics, 1963) allow a reliable representation of bedload fluxes on a cross section through the regressions with bedload rates obtained using samplers. Figure 9a and b highlight the benefits of the use of acoustic devices for the determination of bedload transport rates in large sandy-gravel-bed rivers. In the present study, the time needed in the field to complete the BTMA, DTM, aDcp and hydrophone methods (the red, yellow, blue and black lines of Fig. 9b, respectively) are about 1 d, 4 h, 1.5 h and 45 min, respectively. These times were estimated including the time needed to position and anchor the boat at each sampling point. This underlines the high potential of hydrophones to quantify bedload in large rivers with high spatial variability of sediment transport and map bedload sediment fluxes at a large scale as proposed by Williams et al. (2015) using the aDcp. Moreover, all indirect methods tested here seem to be able to quantify total bedload transport as efficiently as the direct method (Fig. 7b), but special care should be taken with local estimation of bedload rates (Fig. 9a and b).
Finally, regarding the correlation of aDcp and hydrophone with BTMA (Figs. 3 and 5b), we can raise the question of the reference method. Indeed, the regression between an aDcp and a hydrophone is more significant (R2=0.76), and it could be the quality and the accuracy of BTMA sampling that reduce the quality of indirect measurement regressions.
5.2 Hydrophone and aDcp sensitivity to bedform observations
Passive (hydrophone) and active (aDcp) acoustic devices are rarely used to analyse the bedload transport rates associated with bedforms in relatively large lowland rivers. Several studies mention differences in apparent bedload velocity according to the location on bedforms (Rennie and Millar, 2004; Villard and Church, 2005; Gaeuman and Jacobson, 2006; Holmes, 2010; Latosinski et al., 2017). These authors have shown that apparent bedload velocity increases from trough to crest of the dune and confirmed previous observations made with samplers (Kostachuck and Villard, 1996; Carling et al., 2000). These observations were made on large dunes that migrate too slowly to allow a continuous measurement along bedforms. Our study complements these observations by providing a fixed and continuous measurement of apparent bedload velocity and providing bedload transport rate estimation based on a calibration curve. The mean time between two subsequent crests (1 h) shows that even for small bedforms (HD=0.05 to 0.2 m; Fig. 10a and b), the aDcp location significantly influences the bedload rates calculated over a dune field (0.03 to 0.08 m s−1 of difference between crest and trough). This suggests that care should be taken using this method on river beds where large dunes are present but also when small dunes are migrating. According to Rennie and Millar (2004), the sampling area diameter increases with the water depth and is approximately equal to flow depth. Our protocol minimizes the water depth by submerging the aDcp and therefore minimizes the beams sampling diameter, hence minimizing the probability of sampling on the stoss or lee sides of the same dune simultaneously.
In our study context, the acoustic power recorded by the hydrophone was not affected by the distance between the hydrophone and the river bed. To our knowledge, there are no references mentioning investigations on bedload transport rates associated with bedforms using a hydrophone. At a large time step (mean aDcp and hydrophone samples), the apparent bedload velocity and the acoustic power did not follow the observed trend of mean bedform characteristics derived from DTM measurement (dune celerity and dune height). This could be explained by the difference of spatial scales between DTM and other methods. For a smaller time step, our results showed that acoustic power is able to describe the influence of bars on bedload sediment transport (Fig. 11a). Moreover, as for the aDcp, the hydrophone also detects the theoretical pattern of bedload transport rates associated with bedform migration. As shown by Reesink et al. (2014), the lee effect generated by bar fronts influences the development of dunes downstream. Specifically, the hydrophone is able to record the decrease in the acoustic power immediately downstream of the bar front and its progressive increase downstream (translated by the development of dunes at about 11:06 LT, Fig. 11a). In the present study, dunes smaller than 0.4 m (Fig. 11a) were not high enough to allow the observation of changes in the acoustic power along the bedform stoss sides. On the contrary, for higher dunes (HD=1 m, Fig. 11b) the bedload-generated noise can be well recorded by the hydrophone. A hydrophone senses all noises that are propagating in the water column. Therefore, the hydrophone can record noises that are far away from its location. Noises are more and more attenuated with increasing distance (Geay et al., 2019). Particularly, when there is little bedload noise close to the hydrophone, the hydrophone can sense the bedload noise that is generated far away. This behaviour could explain why the hydrophone tends to overestimate bedload fluxes when bedload fluxes are weak especially immediately downstream of a bar front (Fig. 9b).
Hydrophone lower detection limit was not reached during our study whereas the dispersion of bedload rates measured with samplers for low apparent bedload velocity (Fig. 3) suggests that the lower detection limit of the apparent bedload velocity by the aDcp seems to be about 1 cm s−1 (Rennie et al., 2017). This lower detection limit of the apparent bedload velocity should be reduced to the bottom track uncertainty by using our protocol with a submerged and fixed aDcp device.
In this work, direct (BTMA samplers), active (aDcp and DTM) and passive (hydrophone) acoustic measurements of bedload transport rates were compared in a large, sandy-gravel-bed river characterized by the presence of bars and superimposed dunes. Calibration curves between apparent bedload velocity measured using aDcp and bedload rates measured using BTMA samplers were established but remain site-specific and dependent on grain size. DTM seemed to be inappropriate where macroforms are present, as it influences the location and the size of superimposed mesoforms. The calculation of bedload rates with empirical formulas is sensitive to the bedload discharge coefficient for DTM and to the thickness and concentration of the active layer for aDcp. These parameters remain difficult to measure in the field. Results presented in this study highlight the potential of the hydrophone for the quantification and mapping of bedload transport rates in relatively large river channels where migrating bedforms are present. Previously hydrophones have mainly been used to monitor bedload transport rates in gravel-bed rivers. This study consolidates a recent study (Geay at al., 2020) by extending a general calibration curve to large sandy-gravel-bed rivers. The hydrophone global calibration curve allows a good representation of the bedload flux evolution through a cross section. The method is more affordable to implement and more efficient than the reference method. This might allow mapping bedload transport rates by interpolating acoustic power along several cross sections performed on a large sandy-gravel-bed river. Moreover, acoustic devices (aDcp and hydrophone) are able to capture the evolution of bedload signal along bedform stoss and lee sides with some limitation of bedform size for the hydrophone and signal noise for the aDcp. Regarding results of the comparison between bedload velocity and acoustic power, the association of aDcp and hydrophone could be an efficient way to control the quality of both devices. However, additional measurements and post-processing tasks are needed (Conevski et al., 2019) to explore the quality of the regression in other river environments (different grain sizes, river-bed slope or propagation effect).
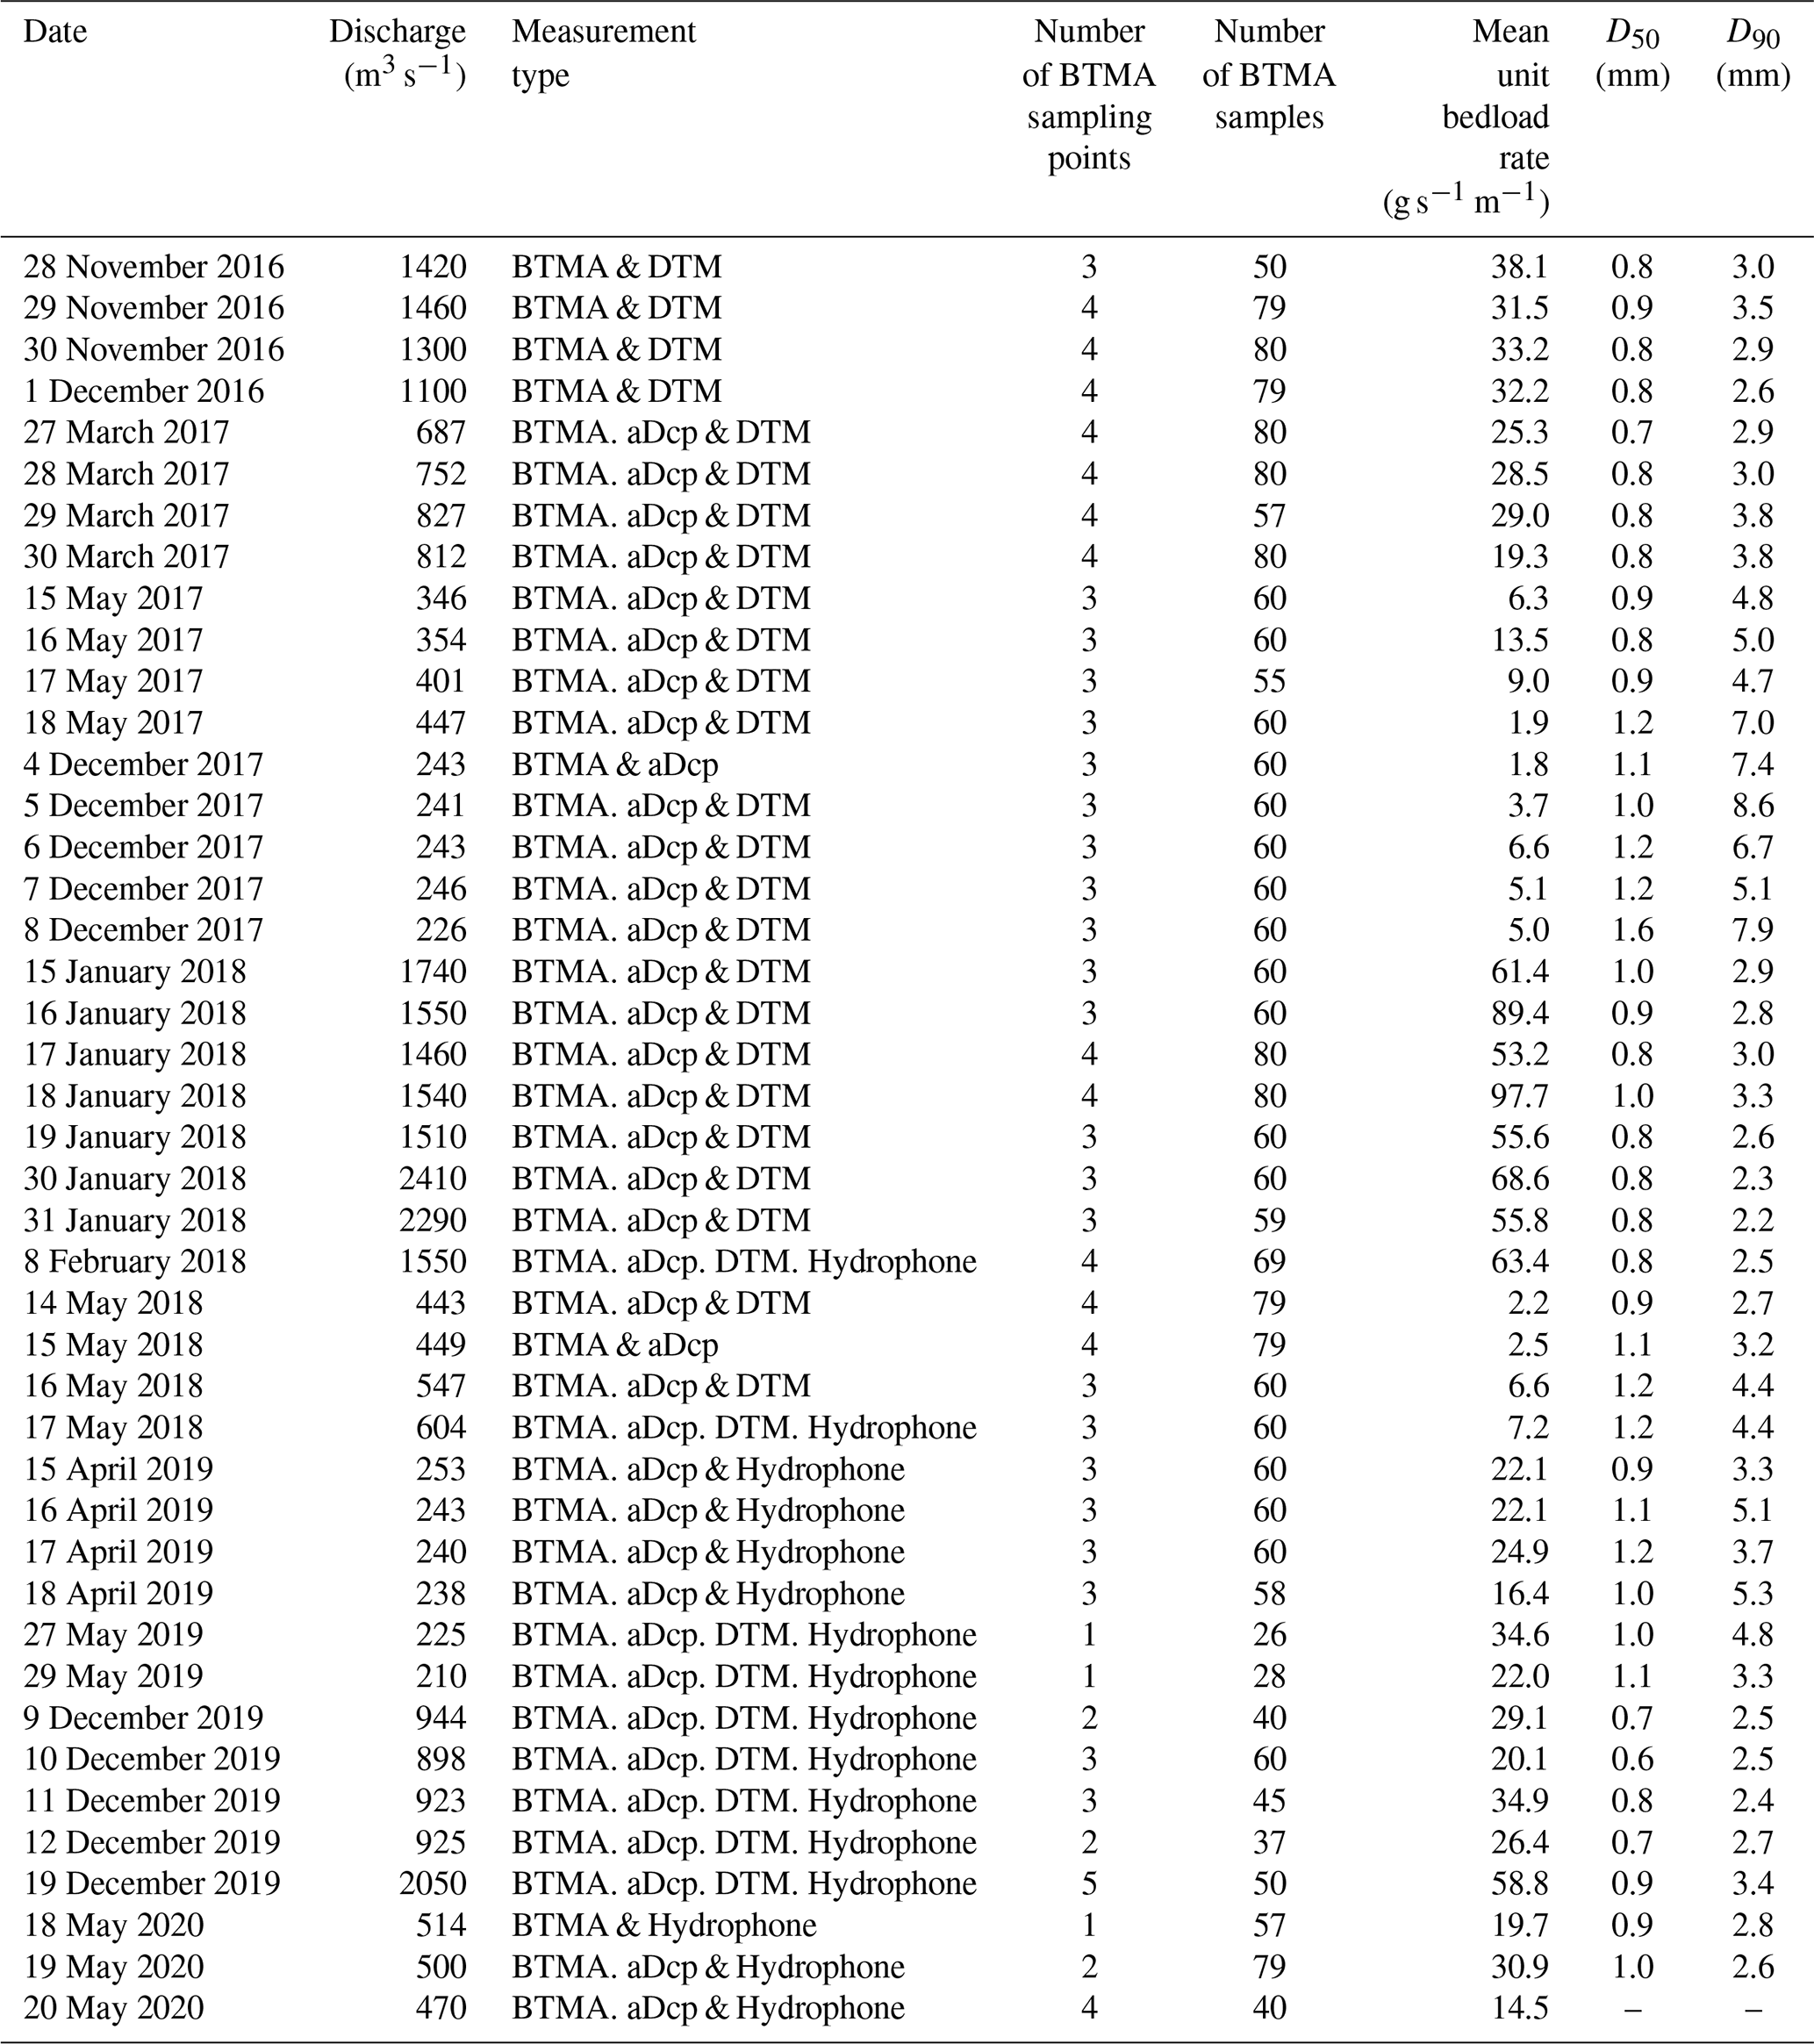
Table B1ADcp dataset.
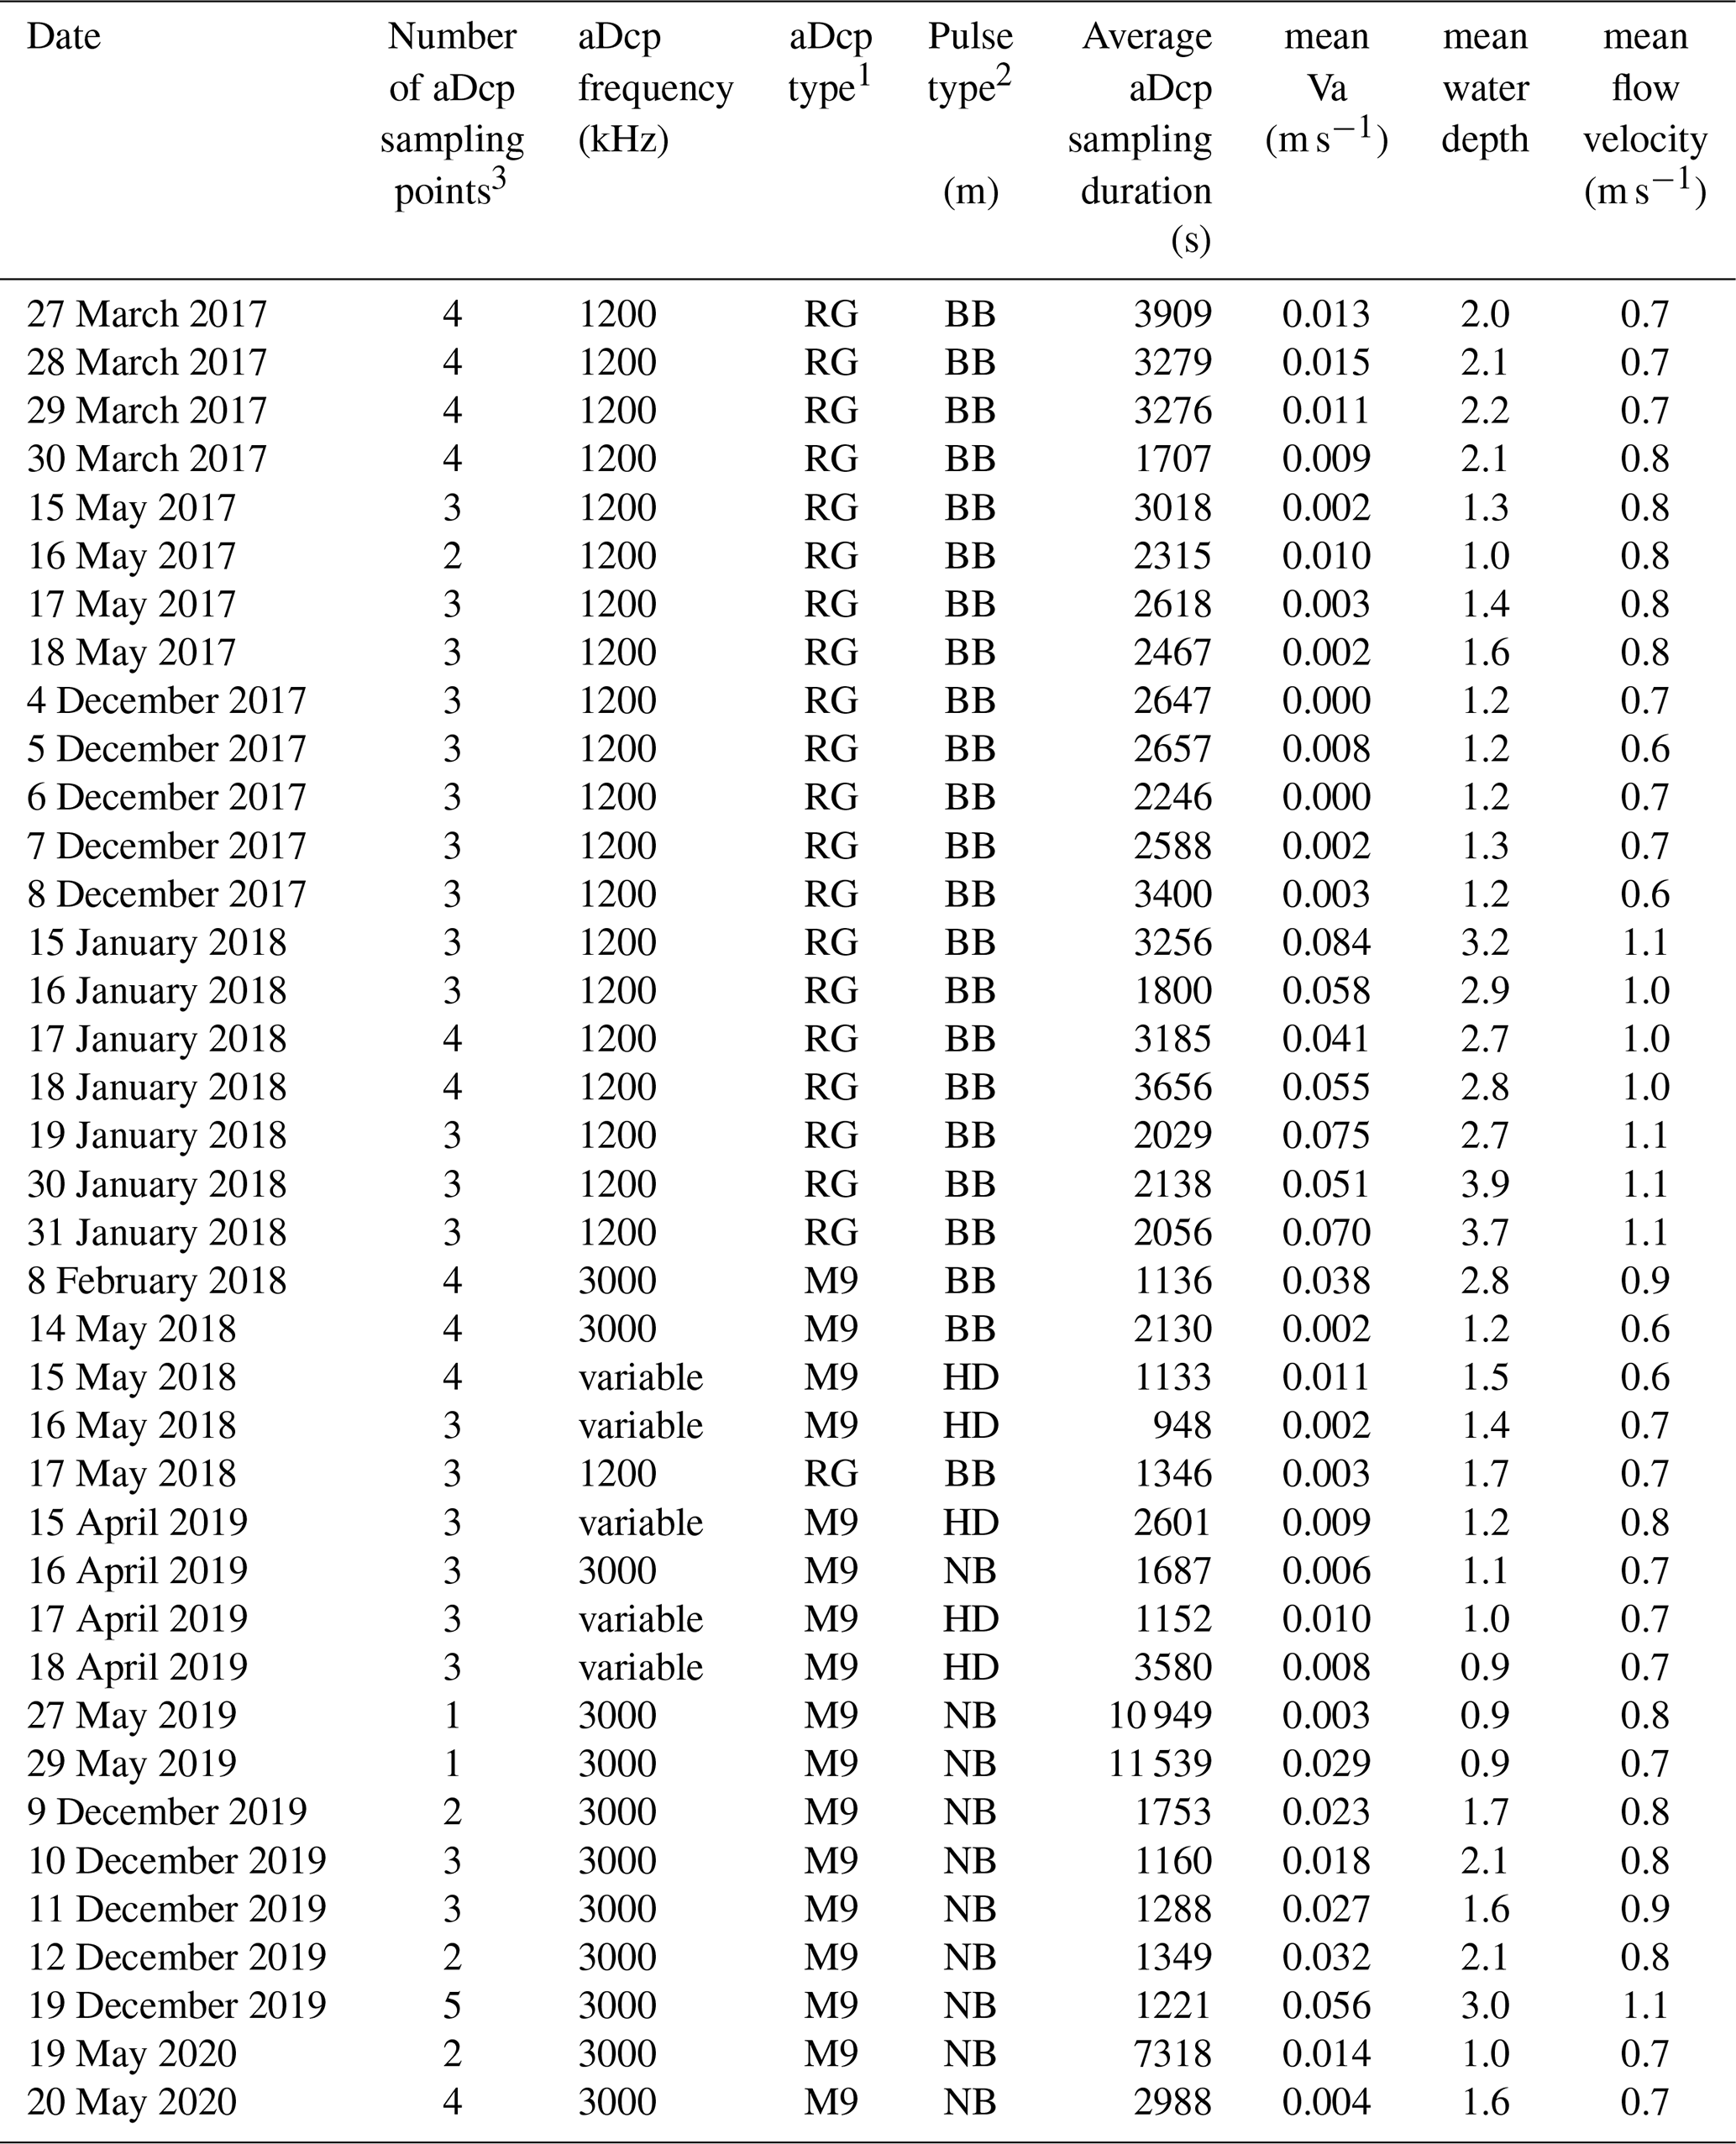
1: RG = aDcp Rio Grande RDI; M9 = aDcp M9 SonTek. 2 BB = broadband (coherent Pulse); NB = narrowband (incoherent pulse); HD = Smartpulse HD. 3 including sampling points with negative values.
Table C1DTM dataset.

* Including profiles with less than 10 dunes or mean dune celerity which could not be calculated.
Table D1Hydrophone dataset.
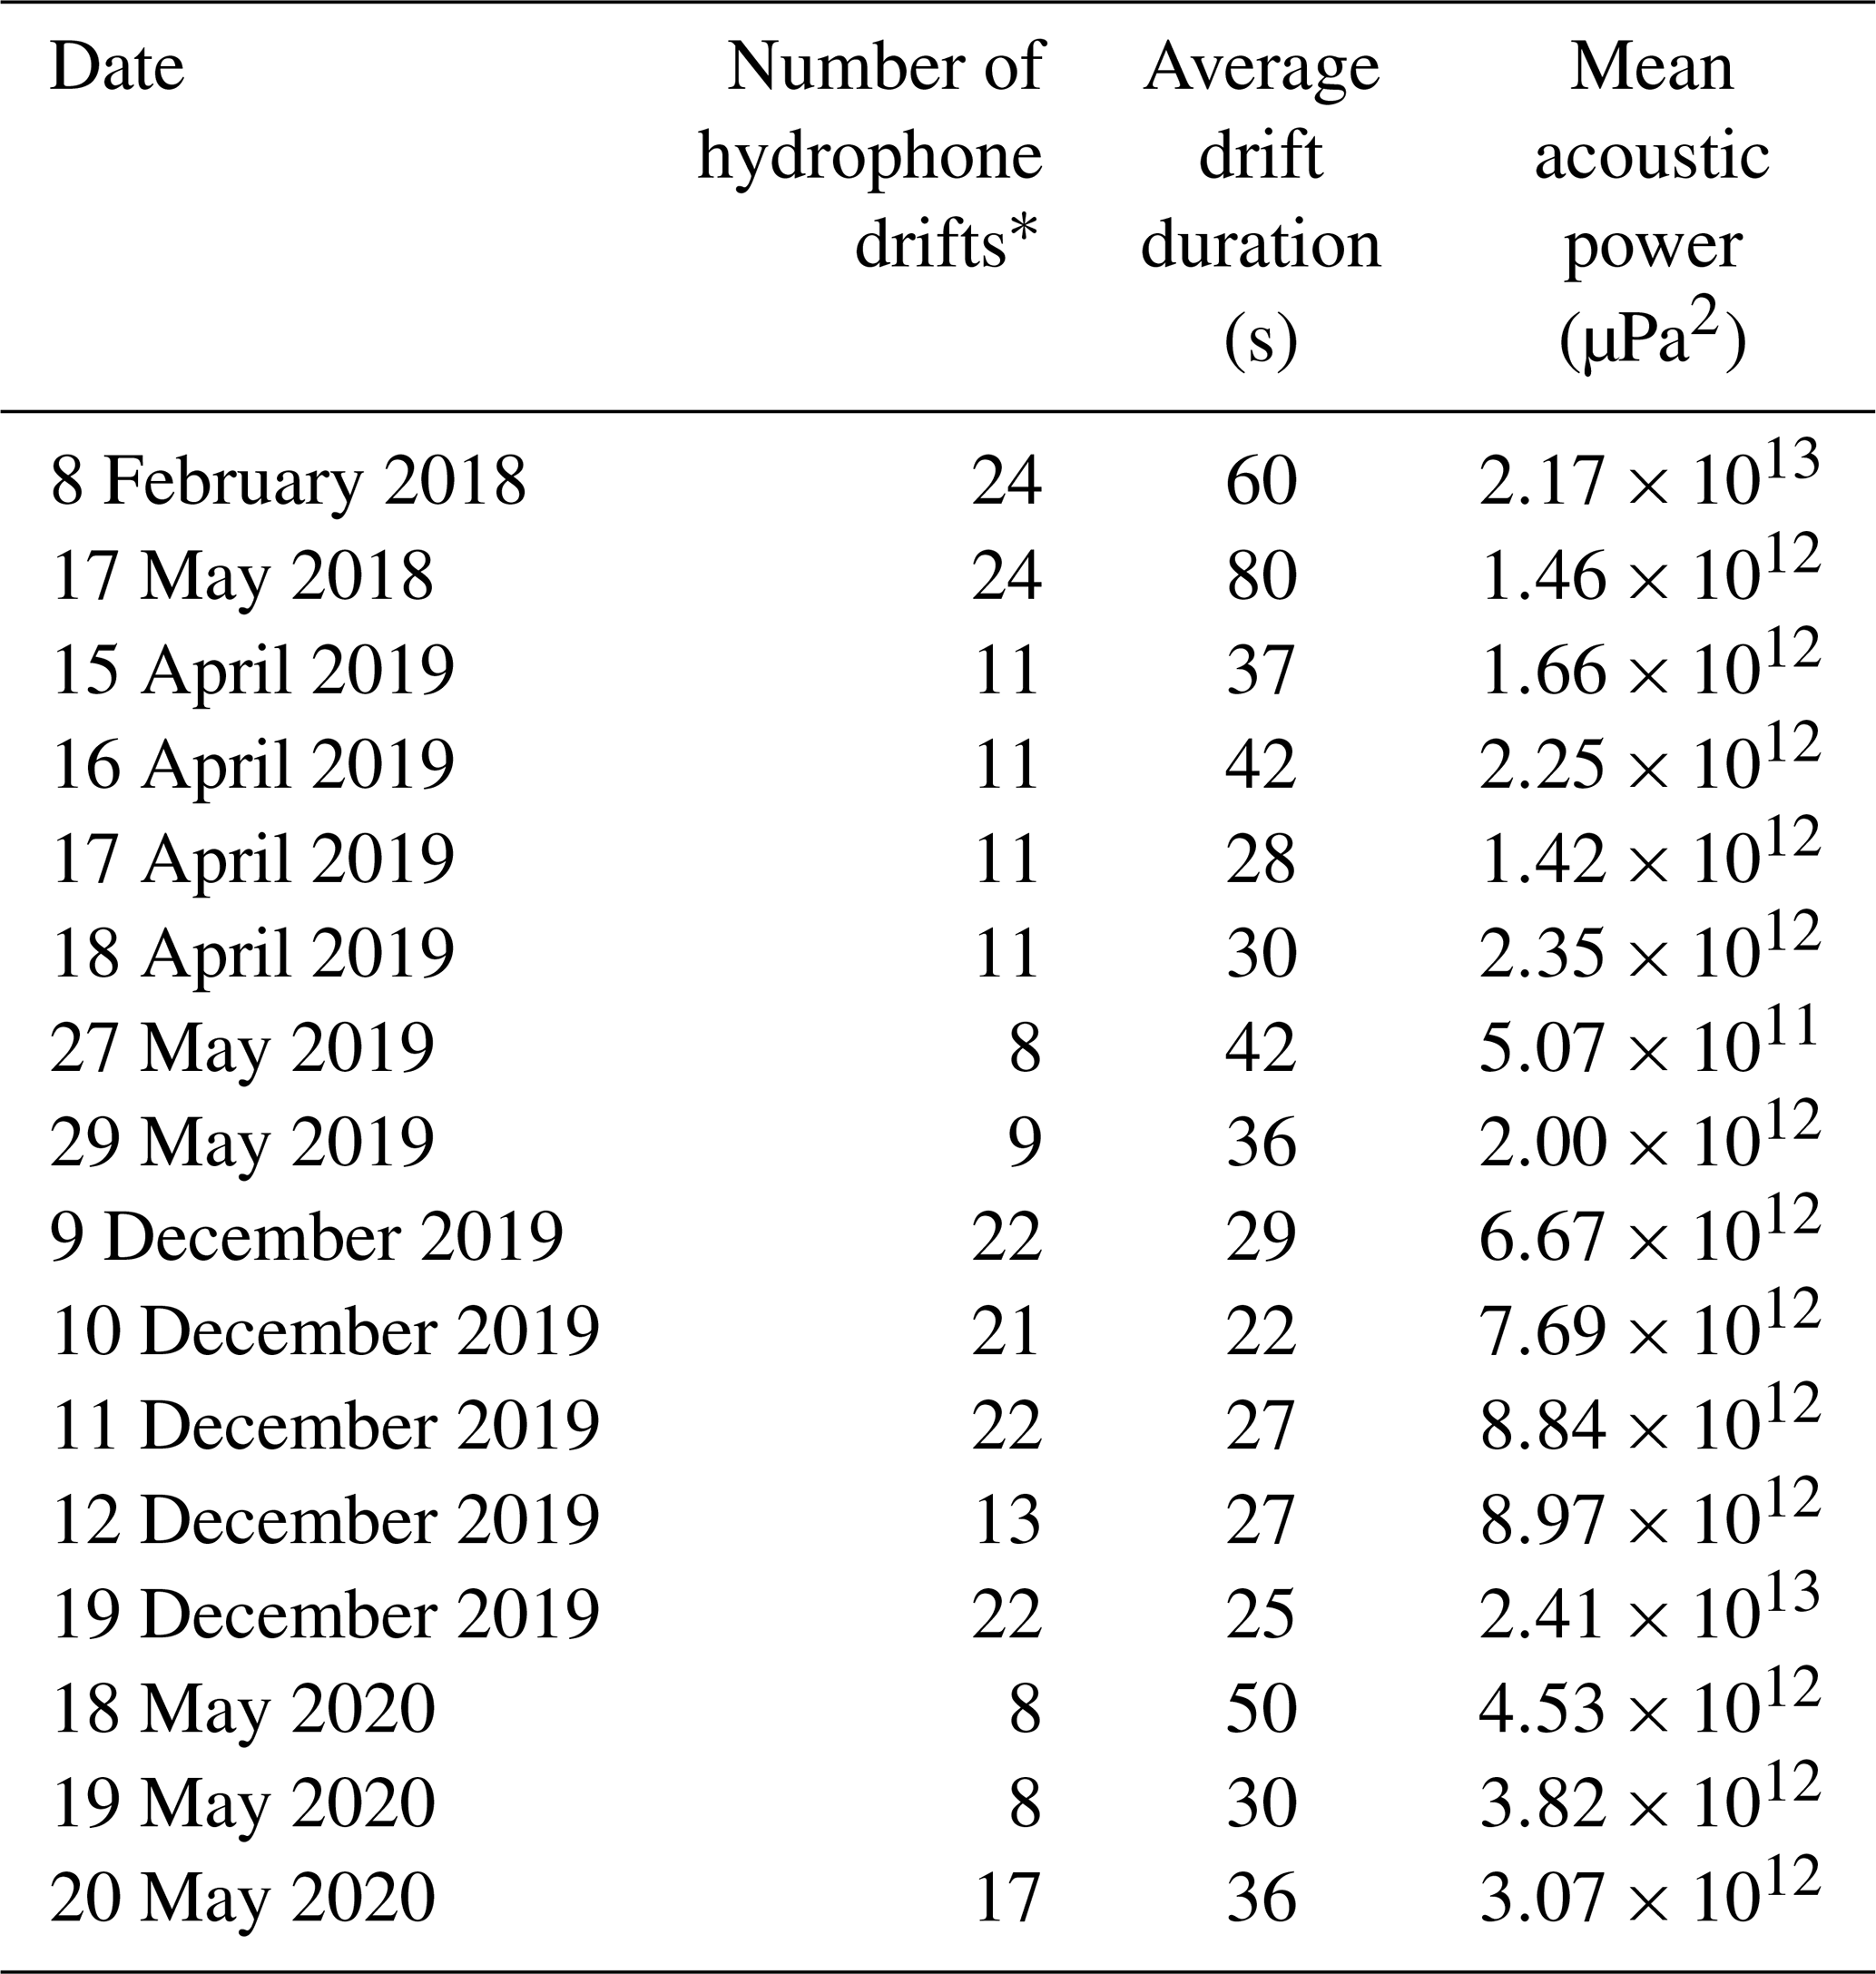
* Including drifts which are not at the same location of BTMA sampling points.
The software codes used to post-process the hydrophone and aDcp datasets are not the propriety of the first author and so are not publicly available.
The datasets of each method are presented in the Appendix section with mean parameters. More detailed datasets can be shared on request to the first author.
Videos of BTMA sampling were added in the Supplement to this paper to show the variability of bedload in the Loire River: https://doi.org/10.5446/51563 (Le Guern, 2021a), https://doi.org/10.5446/51562 (Le Guern, 2021b), https://doi.org/10.5446/51561 (Le Guern, 2021c) and https://doi.org/10.5446/51560 (Le Guern, 2021d).
JLG prepared the paper with contributions from all co-authors. JLG, TG, AH, SZ and SR elaborated on the experimental protocol. TG developed the hydrophone signal processing tools. AD, PJ, LV, AH, SZ, TG, SR and JLG conducted the field surveys. AD, PJ and LV performed the bathymetry post-processing. SR and PT supervised this study. NC helped in the analysis of BTMA and aDcp measurements.
The authors declare that they have no conflict of interest.
This study is a part of the PhD thesis of the first author and the research program R-TEMUS (Restauration du lit et Trajectoires Ecologiques, Morphologiques et d'USages en basse Loire). This program is conducted in the framework of the Masterplan Plan Loire Grandeur Nature and associated with the CLA (Contrat pour la Loire et ses Annexes). We thank EDF DTG and ARD Intelligence des Patrimoines (Phase 2) for lending us acquisition equipment. Exagone Company is acknowledged for providing us data from Teria network, Voie Navigable de France (VNF) for their logistical support during field surveys and Polytech Tours. Jean-Paul Bakyono, Patrick Berault, Théo Bulteau, Benoit Deleplancouille, Yann Guerez, Timothée Handfus, Isabelle Pene and Coraline Wintenberger, are acknowledged for their help during field investigations and grain size analyses. We are grateful to Thomas Geay and Jonathan Hugueny for the hydrophone treatment and aDcp data post-processing tools, respectively. The authors wish to thank Karl Matthias Wantzen for checking the English quality of the paper.
This research has been supported by the European Union (grant no. 2017-EX002207) and the Agence de l'Eau Loire-Bretagne (grant no. 2017C005). Europe is committed to the Loire basin with the European Regional Development Fund.
This paper was edited by Rebecca Hodge and reviewed by Paul Grams and two anonymous referees.
Banhold, K., Schüttrumpf, H., Hillebrand, G., and Frings, R.: Underestimation of sand loads during bed-load measurements- a laboratory examination, in: Proceedings of the international conference on Fluvial Hydraulics (River Flow 2016), 11–14 July 2016, Saint Louis, USA, 2406 pp., 2016.
Barton, J., Slingerland, R. R. L., Pittman, S., and Gabrielson, T. B.: Monitoring coarse bedload transport with passive acoustic instrumentation: A field study, in: Bedload-surrogate monitoring technologies:, edited by: Gray, J. R., Laronne, J. B., and Marr, J. D. G., US Geol. Surv. Sci. Investig. Rep., 38–51, available at: https://pubs.usgs.gov/sir/2010/5091/papers/Barton.pdf (last access: 25 May 2021), 2010.
Batalla, R. J.: Evaluation bed-material transport equations using field measurements in a sandy gravel-bed stream, Arbùcies River, NE Spain, Earth Surf. Proc. Land., 22, 121–130, https://doi.org/10.1002/(SICI)1096-9837(199702)22:2<121::AID-ESP671>3.0.CO;2-7, 1997.
Bedeus, K. and Ivicsics, L.: Observation of the noise of bed load, in: Gen. Assem. Comm. Hydrom. Int. Assoc. Hydrol. Sci., Berkeley, CA, USA, 19–31, 1963.
Bertoldi, W., Ashmore, P., and Tubino, M.: A method for estimating the mean bed load flux in braided rivers, Geomorphology, 103, 330–340, https://doi.org/10.1016/j.geomorph.2008.06.014, 2009.
Best, J. L.: Sediment transport and bed morphology at river channel confluences, Sedimentology, 35, 481–498, https://doi.org/10.1111/j.1365-3091.1988.tb00999.x, 1988.
Blanpain, O., Demoulin, X., Waeles, B., Ravilly, M., Garlan, T., and Guyomard, P.: Passive acoustic measurement of bedload discharge features on a sandy seafloor, in: Proceedings of Seabed and Sediment Acoustics Volume 37 Part 1, 7–9 September 2015 Bath, UK, 2015.
Blott, S. J. and Pye, K.: GRADISTAT: A grain size distribution and statistics package for the analysis of unconsolidated sediments, Earth Surf. Proc. Land., 26, 1237–1248, https://doi.org/10.1002/esp.261, 2001.
Boiten, W.: Hydrometry, IHE Delft Lecture Note Series, A. A. Balkema Publishers, the Netherlands, 256 pp., https://doi.org/10.1201/9780203971093, 2003.
Brasington, J., Rennie, C. D., Vericat, D., Williams, R., Goodsell, B., Hicks, M., and Batalla, R.: Monitoring braided river morphodynamics with an acoustic Dopler current profiler, in: Proceedings of the 34th World Congress of the International Association for Hydro-Environment Research and Engineering: 33rd Hydrology and Water Resources Symposium and 10th Conference on Hydraulics in Water Engineering, Brisbane, 3396–3403, 2011.
Carling, P. A., Williams, J. J., Gölz, E., and Kelsey, A. D.: The morphodynamics of fluvial sand dunes in the River Rhine, near Mainz, Germany. II. Hydrodynamics and sediment transport, Sedimentology, 47, 253–278, https://doi.org/10.1046/j.1365-3091.2000.00291.x, 2000.
Church, M. and Haschenburger, J. K.: What is the “active layer”?, Water Resour. Res., 53, 5–10, https://doi.org/10.1002/2016WR019675, 2017.
Claude, N., Rodrigues, S., Bustillo, V., Bréhéret, J. G., Macaire, J. J., and Jugé, P.: Estimating bedload transport in a large sand-gravel bed river from direct sampling, dune tracking and empirical formulas, Geomorphology, 179, 40–57, https://doi.org/10.1016/j.geomorph.2012.07.030, 2012.
Claude, N., Rodrigues, S., Bustillo, V., Bréhéret, J. G., Tassi, P., and Jugé, P.: Interactions between flow structure and morphodynamic of bars in a channel expansion/contraction, Loire River, France, Water Resour. Res., 50, 2850–2873, https://doi.org/10.1002/2013WR015182, 2014.
Conevski, S.: Bedload Monitoring by means of Hydro-Acoustic Techniques, PhD thesis, Norwegian University of Science and Technology, Norway, 200 pp., 2018.
Conevski, S., Guerrero, M., Ruther, N., and Rennie, C. D.: Laboratory investigation of apparent bedload velocity measured by ADCPs under different transport conditions, J. Hydraul. Eng., 145, 04019036, https://doi.org/10.1061/(ASCE)HY.1943-7900.0001632, 2019.
Conevski, S., Guerrero, M., Winterscheid, A., Rennie, C. D., and Ruther N.: Acoustic sampling effects on bedload quantification using acoustic Doppler current profilers, J. Hydraul. Res., 58, 982–1000, https://doi.org/10.1080/00221686.2019.1703047, 2020a.
Conevski, S., Guerrero, M., Rennie, C. D., and Ruther, N.: Towards an evaluation of bedload transport characteristics by using Doppler and backscatter outputs from ADCPs, J. Hydraul. Res., https://doi.org/10.1080/00221686.2020.1818311, in press, 2020b.
Cordier, F., Tassi, P., Claude, N., Crosato, A., Rodrigues, S., and Pham Van Bang, D.: Bar pattern and sediment sorting in channel contraction/expansion area: Application to the Loire River at Bréhémont (France), Adv. Water Resour., 140, 103580, https://doi.org/10.1016/j.advwatres.2020.103580, 2020.
de Vries, M.: Information on the Arnhem Sampler (BTMA), Internal Report no. 3-79, Delft University of Technology, Department of Civil Engineering, Fluid Mechanics Group, Delft, 1979.
Eijkelkamp: Operating instructions: Bedload Transport Meter Arnhem, Giesbeek, the Netherlands, 8 pp., 2003.
Engel, P. and Lau, Y. L.: Computation of Bed Load Using Bathymetric Data, J. Hydraul. Div., 106, 369–380, 1980.
Folk, R. L. and Ward, W. C.: Brazos River bar (Texas); a study in the significance of grain size parameters, J. Sediment. Res., 27, 3–26, https://doi.org/10.1306/74D70646-2B21-11D7-8648000102C1865D, 1957.
Frings, R. M. and Vollmer, S.: Guidelines for sampling bed-load transport with minimum uncertainty, Sedimentology, 64, 1630–1645, https://doi.org/10.1111/sed.12366, 2017.
Frings, R. M., Gehres, N., Promny, M., Middelkoop, H., Schüttrumpf, H., and Vollmer, S.: Today's sediment budget of the Rhine River channel, focusing on the Upper Rhine Graben and Rhenish Massif, Geomorphology, 204, 573–587, https://doi.org/10.1016/j.geomorph.2013.08.035, 2014.
Gaeuman, D. and Jacobson, R. B.: Acoustic bed velocity and bed load dynamics in a large sand bed river, J. Geophys. Res., 111, F02005, https://doi.org/10.1029/2005JF000411, 2006.
Gaeuman, D. and Jacobson, R. B.: Field Assessment of Alternative Bed-Load Transport Estimators, J. Hydraul. Eng., 133, 1319–1328, https://doi.org/10.1061/(ASCE)0733-9429(2007)133:12(1319), 2007.
Gaeuman, D. and Pittman, S.: Relative Contributions of Sand and Gravel Bedload Transport to Acoustic Doppler Bed-Velocity Magnitudes in the Trinity River, California, in: Bedload-surrogate monitoring technologies, edited by: Gray, J. R., Laronne, J. B., and Marr, J. D. G., US Geol. Surv. Sci. Investig. Rep., 195–207, available at: https://pubs.usgs.gov/sir/2010/5091/papers/Gaeuman_Pittman.pdf (last access: 25 May 2021), 2010.
Gaweesh, M. T. K. and van Rijn, L. C.: Bed-load sampling in sand-bed rivers, J. Hydraul. Eng., 120, 1364–1384, https://doi.org/10.1061/(ASCE)0733-9429(1994)120:12(1364), 1994.
Geay, T., Belleudy, P., Gervaise, C., Habersack, H., Aigner, J., Kreisler, A., Seitz, H., and Laronne, J. B.: Passive acoustic monitoring of bed load discharge in a large gravel bed river, J. Geophys. Res.-Earth, 122, 528–545, https://doi.org/10.1002/2016JF004112, 2017.
Geay, T., Michel, L., Zanker, S., and Rigby, J. R.: Acoustic wave propagation in rivers: an experimental study, Earth Surf. Dynam., 7, 537–548, https://doi.org/10.5194/esurf-7-537-2019, 2019.
Geay, T., Zanker, S., Misset, C., and Recking, A.: Passive Acoustic Measurement of Bedload Transport: Toward a Global Calibration Curve?, J. Geophys. Res.-Earth, 125, e2019JF005242, https://doi.org/10.1029/2019JF005242, 2020.
Gimbert, F., Fuller, B. M., Lamb, M. P., Tsai, V. C., and Johnson, J. P. L.: Particle transport mechanics and induced seismic noise in steep flume experiments with accelerometer-embedded tracers, Earth Surf. Proc. Land., 44, 219–241, https://doi.org/10.1002/esp.4495, 2019.
Gray, J. R., Gartner, J. W., Barton, J. S., Gaskin, J., Pittman, S. A., and Rennie, C. D.: Surrogate Technologies for Monitoring Bed-Load Transport in Rivers, in: Sedimentology of Aqueous Systems, edited by: Poleto, C. and Charlesworth, S., Wiley-Blackwell, London, 46–79, https://doi.org/10.1002/9781444317114.ch2, 2010.
Grill, G., Lehner, B., Thieme, M., Geenen, B., Tickner, D., Antonelli, F., Babu, S., Borrelli, P., Cheng, L., Crochetiere, H., Ehalt Macedo, H., Filgueiras, R., Goichot, M., Higgins, J., Hogan, Z., Lip, B., McClain, M. E., Meng, J., Mulligan, M., Nilsson, C., Olden, J. D., Opperman, J. J., Petry, P., Reidy Liermann, C., Sáenz, L., Salinas-Rodríguez, S., Schelle, P., Schmitt, R. J. P., Snider, J., Tan, F., Tockner, K., Valdujo, P. H., van Soesbergen, A., and Zarfl, C.: Mapping the world's free-flowing rivers, Nature, 569, 215–221, https://doi.org/10.1038/s41586-019-1111-9, 2019.
Hilldale, R. C., Goodwiller, B. T., Carpenter, W. O., and Chambers, J. P.: Measuring Coarse Bed Load Using Hydrophones, Closeout report, Reclamation Managing Water in the West, available at: https://www.usbr.gov/research/projects/detail.cfm?id=3253 (last access: 25 May 2021), 2014.
Holmes Jr., R. R.: Measurement of Bedload Transport in Sand-Bed Rivers: A Look at Two Indirect Sampling Methods, in: Bedload-surrogate monitoring technologies, edited by: Gray, J. R., Laronne, J. B., and Marr, J. D. G., US Geol. Surv. Sci. Investig. Rep., 236–252, available at: https://pubs.usgs.gov/sir/2010/5091/papers/Holmes.pdf (last access: 25 May 2021), 2010.
Jackson, R. G.: Hierarchical attributes and a unifying model of bed forms composed of cohesionless material and produced by shearing flow, Geol. Soc. Am. Bull., 86, 1523–1533, 1975.
Jamieson, E. C., Rennie, C. D., Jacobson, R. B., and Townsend, R. D.: Evaluation of ADCP Apparent Bed Load Velocity in a large Sand-Bed River: Moving versus Stationary Boat Conditions, J. Hydraul. Eng., 137, 1064–1071, https://doi.org/10.1061/(ASCE)HY.1943-7900.0000373, 2011.
Kenney, T. A.: Cross-sectional progression of apparent bedload velocities, in: Proceedings of the Eighth Federal Interagency Sedimentation Conference (8th FISC), 2–6 April 2006, Reno, Nevada, USA, 8 pp., 2006.
Kondolf, G. M., Schimitt, R. J. P., Carling, P., Darby, S., Arias, M., Bizzi, S., Castelletti, A., Cochrane, T. A., Gibson, S., Kummu, M., Oeurng, C., Rubin, Z., and Wild, T.: Changing sediment budget of the Mekong: Cumulative threats and management strategies for a large river basin, Sci. Total Environ., 625, 114–134, https://doi.org/10.1016/j.scitotenv.2017.11.361, 2018.
Kostaschuk, R. and Villard, P.: Flow and sediment transport over large subaqueous dunes: Fraser River, Canada, Sedimentology, 43, 849–863, https://doi.org/10.1111/j.1365-3091.1996.tb01506.x, 1996.
Kostaschuk, R., Best, J., Villard, P., Peakall, J., and Franklin, M.: Measuring flow velocity and sediment transport with an acoustic Doppler current profiler, Geomorphology, 68, 25–37, https://doi.org/10.1016/j.geomorph.2004.07.012, 2005.
Latosinski, F. G., Szupiany, R. N., Guerrero, M., Amsler, M. L., and Vionnet, C.: The ADCP's bottom track capability for bedload prediction: Evidence on method reliability from sandy river applications, Flow Meas. Instrument., 54, 124–135, https://doi.org/10.1016/j.flowmeasinst.2017.01.005, 2017.
Leary, K. C. P. and Buscombe, D.: Estimating sand bed load in rivers by tracking dunes: a comparison of methods based on bed elevation time series, Earth Surf. Dynam., 8, 161–172, https://doi.org/10.5194/esurf-8-161-2020, 2020.
Le Guern, J.: Unit bedload rate = 39 g/s with dunes, TIB AV-PORTAL, https://doi.org/10.5446/51563, 2021a.
Le Guern, J.: Unit bedload rate = 39 g/s, TIB AV-PORTAL, https://doi.org/10.5446/51562, 2021b.
Le Guern, J.: Unit bedload rate = 53 g/s, TIB AV-PORTAL, https://doi.org/10.5446/51561, 2021c.
Le Guern, J.: Downstream of a bar front, TIB AV-PORTAL, https://doi.org/10.5446/51560, 2021d.
Le Guern, J., Rodrigues, S., Tassi, P., Jugé, P., Handfus, T., Duperray, A., and Berrault, P.: Influence of migrating bars on dune geometry, in: Book of Abstracts of the 6th Marine and River Dune Dynamics conference, 1–3 April 2019, Bremen, Germany, 157–160, 2019a.
Le Guern, J., Rodrigues, S., Tassi, P., Jugé, P., Handfus, T., and Duperray, A.: Initiation, growth and interactions of bars in a sandy-gravel bed river, in: Book of Abstracts of the 11th Symposium on River, Costal and Estuarine Morphodynamics, 16–21 November 2019, Auckland, New-Zealand, 226 pp., 2019b.
Marineau, M. D., Wright, S. A., and Gaeuman, D.: Calibration of sediment-generated noise measured using hydrophones to bedload transport in the Trinity River, California, USA, in: Proceeding of River Flow 2016 – eighth International Conference on Fluvial Hydraulics, 12–15 July 2016, Saint Louis, USA, 1519–1526, 2016.
Mendoza, A., Abad, J. D., Langendoen, E. J., Wang, D., Tassi, P., and El Kadi Abderrezzak, K.: Effect of Sediment Transport Boundary conditions on the Numerical Modeling of Bed Morphodynamics, J. Hydraul. Eng., 143, https://doi.org/10.1061/(ASCE)HY.1943-7900.0001208, 2017.
Merchant, N. D., Barton, T. R., Thompson, P. M., Pirotta, E., Dakin, D. T., and Dorocicz, J.: Spectral probability density as a tool for ambient noise analysis, J. Acoust. Soc. Am., 133, EL262–EL267, https://doi.org/10.1121/1.4794934, 2013.
Nittrouer, J. A., Allison, M. A., and Campanella, R.: Bedform transport rates for the lowermost Mississippi River, J. Geophys. Res., 113, F03004, https://doi.org/10.1029/2007JF000795, 2008.
Peters, J. J.: Discharge and Sand Transport in the Braided Zone of the Zaire Estuary, Neth. J. Sea Res., 12, 273–292, https://doi.org/10.1016/0077-7579(78)90031-5, 1978.
Petrut, T., Geay, T., Gervaise, C., Belleudy, P., and Zanker, S.: Passive acoustic measurement of bedload grain size distribution using self-generated noise, Hydrol. Earth Syst. Sci., 22, 767–787, https://doi.org/10.5194/hess-22-767-2018, 2018.
Ramooz, R. and Rennie, C. D.: Laboratory Measurement of Bedload with an ADCP, in: Bedload-surrogate monitoring technologies, edited by: Gray, J. R., Laronne, J. B., and Marr, J. D. G., US Geol. Surv. Sci. Investig. Rep., 367–386, available at: https://pubs.usgs.gov/sir/2010/5091/papers/Ramooz.pdf (last access: 25 May 2021), 2010.
Reesink, A. J. H., Parsons, D. R., and Thomas, R. E.: Sediment transport and bedform development in the lee of bars: Evidence from fixed- and partially-fixed bed experiments, in: Proceeding of River Flow 2014 – seventh International Conference on Fluvial Hydraulics, 3–5 September 2014, Lausanne, Switzerland, 8 pp., 2014.
Rennie, C. D. and Millar, R. G.: Measurement of the spatial distribution of fluvial bedload transport velocity in both sand and gravel, Earth Surf. Proc. Land., 29, 1173–1193, https://doi.org/10.1002/esp.1074, 2004.
Rennie, C. D. and Villard, P. V.: Site specificity of bed load measurement using an acoustic Doppler current profiler, J. Geophys. Res., 109, F03003, https://doi.org/10.1029/2003JF000106, 2004.
Rennie, C. D., Millar, R. G., and Church, M. A.: Measurement of Bed Load Velocity using an Acoustic Doppler Current Profiler, J. Hydraul. Eng., 128, 473–483, https://doi.org/10.1061/(ASCE)0733-9429(2002)128:5(473), 2002.
Rennie, C. D., Vericat, D., Williams, R. D., Brasington, J., and Hicks, M.: Calibration of acoustic doppler current profiler apparent bedload velocity to bedload transport rate, in: Gravel-Bed Rivers: Processes and Disasters, Wiley, Blackwell, Oxford, UK, 209–233, https://doi.org/10.1002/9781118971437.ch8, 2017.
Rodrigues, S., Mosselman, E., Claude, N., Wintenberger, C. L., and Jugé, P.: Alternate bars in a sandy gravel bed river: generation, migration and interactions with superimposed dunes, Earth Surf. Proc. Land., 40, 610–628, https://doi.org/10.1002/esp.3657, 2015.
Simons, D. B., Richardson, E. V., and Nordin, C. F. Jr.: Bedload Equation for Ripples and Dunes, US Geol. Survey Prof. Paper 462-H, US Geological Survey, Washington, DC, https://doi.org/10.3133/pp462H, 1965.
Syvitski, J. P. M. and Milliman, J. D.: Geology, Geography, and Humans Battle for Dominance over the Delvery of Fluvial Sediment to the Coastal Ocean, J. Geol., 15, 1–19, https://doi.org/10.1086/509246, 2007.
Ten Brinke, W. B. M., Wilbers, A. W. E., and Wesseling, C.: Dune growth, decay and migration rates during a large-magnitude flood at a sand and mixed sand-gravel bed in the Dutch Rhine river system, in: Fluvial Sedimentology VI, Vol. 28 of Special Publications, International Association of Sedimentologists, Blackwell Publishing, Oxford, 15–32, https://doi.org/10.1002/9781444304213.ch2, 1999.
Thorne, P. D.: The measurement of acoustic noise generated by moving artificial sediments, J. Acoust. Soc. Am., 78, 1013–1023, https://doi.org/10.1121/1.393018, 1985.
Thorne, P. D.: Laboratory and marine measurements on the acoustic detection of sediment transport, J. Acoust. Soc. Am., 80, 899–910, https://doi.org/10.1121/1.393913, 1986.
Thorne, P. D.: An overview of underwater sound generated by interparticle collisions and its application to the measurements of coarse sediment bedload transport, Earth Surf. Dynam., 2, 531–543, https://doi.org/10.5194/esurf-2-531-2014, 2014.
Thorne, P. D., Heathershaw, A. D., and Troiano, L.: Acoustic Detection of Seabed Gravel Movement in Turbulent Tidal Currents, Mar. Geol., 54, M43–M48, https://doi.org/10.1016/0025-3227(84)90035-5, 1984.
Van den Berg, J. H.: Bedform migration and bed-load transport in some rivers and tidal environments, Sedimentology, 34, 681–698, https://doi.org/10.1111/j.1365-3091.1987.tb00794.x, 1987.
Van der Mark, C. F. and Blom, A.: A new and widely applicable tool for determining the geometric properties of bedforms, Civil Engineering & Manageement Research Report 2007R-003/WEM-002, University of Twente, Enschede, the Netherlands, 57 pp., ISSN 1568-4652, 2007.
Van Rijn, L. C.: Sediment Transport. Part I: Bed Load Transport, J. Hydraul. Eng., 110, 1431–1456, https://doi.org/10.1061/(ASCE)0733-9429(1984)110:10(1431), 1984.
Van Rijn, L. C. and Gaweesh, M. T. K.: New Total Sediment-Load Sampler, J. Hydraul. Eng., 118, 1686–1691, https://doi.org/10.1061/(ASCE)0733-9429(1992)118:12(1686), 1992.
Villard, P., Church, M., and Kostaschuk, R.: Estimating bedload in sand-bed channels using bottom tracking from an acoustic Doppler profiler, in: Fluvial sedimentology VII, Vol. 35 of Special Publications, International Association of Sedimentologists, Blackwell Publishing, Oxford, 197–209, https://doi.org/10.1002/9781444304350.ch12, 2005.
Villard, P. V. and Church, M.: Bar and dune development during a freshet: Fraser River Estuary, British Colombia, Canada, Sedimentology, 52, 737–756, https://doi.org/10.1111/j.1365-3091.2005.00721.x, 2005.
Vörösmarty, C., McIntyre, P., Gessner, M., Dudgeon, D., Prusevich, A., Green, P., Glidden, S., Bunn, S. E., Sullivan, C. A., Reidy Liermann, C., and Davies, P. M.: Global threats to human water security and river biodiversity, Nature, 467, 555–561, https://doi.org/10.1038/nature09440, 2010.
Wilbers, A.: The development and hydraulic roughness of subaqueous dunes, Neth. Geogr. Stud, Fac. of Geosci., Utrecht Univ., Utrecht, the Netherlands, 224 pp., 2004.
Williams, R. D., Rennie, C. D., Brasington, J., Hicks, D. M., and Vericat, D.: Linking the spatial distribution of bed load transport to morphological change during high-flow events in shallow braided river, J. Geophys. Res.-Earth, 120, 604–622, https://doi.org/10.1002/2014JF003346, 2015.
Wintenberger, C. L., Rodrigues, S., Claude, N., Jugé, P., Bréhéret, J.-G., and Villar, M.: Dynamics of nonmigrating mid-channel bar and superimposed dunes in a sandy- gravelly river (Loire River, France), Geomorphology, 248, 185–204, https://doi.org/10.1016/j.geomorph.2015.07.032, 2015.