the Creative Commons Attribution 4.0 License.
the Creative Commons Attribution 4.0 License.
 | 02 Jun 2021
Implications of the ongoing rock uplift in NW Himalayan interiors
Rasmus C. Thiede
Arindam Biswas
Naveen Chauhan
Pritha Chakravarti
Vikrant Jain
The Lesser Himalaya exposed in the Kishtwar Window (KW) of the Kashmir Himalaya exhibits rapid rock uplift and exhumation (∼3 mm yr−1) at least since the late Miocene. However, it has remained unclear if it is still actively deforming. Here, we combine new field, morphometric and structural analyses with dating of geomorphic markers to discuss the spatial pattern of deformation across the window. We found two steep stream segments, one at the core and the other along the western margin of the KW, which strongly suggest ongoing differential uplift and may possibly be linked to either crustal ramps on the Main Himalayan Thrust (MHT) or active surface-breaking faults. High bedrock incision rates (>3 mm yr−1) on Holocene–Pleistocene timescales are deduced from dated strath terraces along the deeply incised Chenab River valley. In contrast, farther downstream on the hanging wall of the MCT, fluvial bedrock incision rates are lower (<0.8 mm yr−1) and are in the range of long-term exhumation rates. Bedrock incision rates largely correlate with previously published thermochronologic data. In summary, our study highlights a structural and tectonic control on landscape evolution over millennial timescales in the Himalaya.
- Article
(15009 KB) - Full-text XML
-
Supplement
(1072 KB) - BibTeX
- EndNote


Protracted convergence between the Indian and the Eurasian Plate resulted in the growth and evolution of the Himalayan orogen and temporal in-sequence formation of the Southern Tibetan Detachment System (STDS), the Main Central Thrust (MCT), the Main Boundary Thrust (MBT) and the Himalayan Frontal Thrust (HFT) towards the south (e.g., Yin and Harrison, 2000; DiPietro and Pogue, 2004) (Fig. S1 in the Supplement Sect. S1). The HFT defines the southern termination of the Himalayan orogenic wedge and separates the orogen from the undeformed foreland basin known as the Indo-Gangetic Plain. Seismic reflection profiles reveal that all these fault zones emerge from a low-angle basal decollement, the Main Himalayan Thrust (MHT), forming the base of the Himalayan orogenic wedge (e.g., Ni and Barazangi, 1984; Nábělek et al., 2009) that was established in the late Miocene (Vannay et al., 2004). Existence of the MHT has been further elaborated in Himalayan cross sections (e.g., Powers et al., 1998; DeCelles et al., 2001; Webb et al., 2011; Gavillot et al., 2018).
Lavé and Avouac (2000) studied the late Pleistocene–Holocene shortening history of the central Nepal Himalaya where they showed that Holocene shortening is accommodated only across the HFT. However, a large body of literature in the eastern, central and western Himalaya favors the idea that the majority of the late Pleistocene–Holocene shortening is rather partitioned throughout the sub-Himalayan domain (morphotectonic segment between the MBT and the MFT) and not solely accommodated by the HFT (e.g., Wesnousky et al., 1999; Burgess et al., 2012; Thakur et al., 2014; Mukherjee, 2015; Vassallo et al., 2015; Dey et al., 2016a, 2018). The statement above implies that the northerly thrusts, i.e., the MBT and the brittle faults exposed in the vicinity of the southern margin of the Higher Himalaya, are considered inactive over millennial timescales. However, in recent years, several studies focused on low-temperature thermochronologic data and thermal modeling of the interiors of the NW Himalaya have raised questions about the statement above. Recent studies have suggested that 1–3 mm yr−1 of the total Quaternary shortening has been accommodated in the north of the MBT as out-of-sequence deformation (Thiede et al., 2004; Deeken et al., 2011; Thiede et al., 2017) or in the form of growth of the Lesser Himalayan Duplex (Gavillot et al., 2018) (Fig. S2). For faults within the hinterland of the central Himalaya, the out-of-sequence deformation has been explained by two end-member models. One of them favors the reactivation of the MCT (Wobus et al., 2003), while the other tries to explain all changes along the southern margin of the Higher Himalaya as driven by enhanced rock uplift over a major ramp on the MHT (Bollinger et al., 2006; Herman et al., 2010; Robert et al., 2009). Landscape evolution models, structural analysis and thermochronologic data from the interior of the Himalaya favor the idea that the Lesser Himalaya has formed a duplex at the base of the southern Himalayan front through sustained internal deformation since the late Miocene (Decelles et al., 2001; Mitra et al., 2010; Robinson and Martin, 2014; Gavillot et al., 2016). The growth of the duplex resulted in the uplift of the Higher Himalaya, forming the major orographic barrier of the orogen. The Kishtwar Window (KW) in the NW Himalaya represents the northwestern termination of the Lesser Himalayan Duplex (LHD). While most of the published cross sections of the Himalayan orogen today recognize the duplex structures within the Lesser Himalaya (Webb et al., 2011; Mitra et al., 2010; DeCelles et al., 2001; Gavillot et al., 2018), little to no data are available on how the deformation is spatially and temporally distributed or, most importantly, whether a duplex is active over millennial timescales.
The low-temperature thermochronology study by Kumar et al. (1995) portrayed the first orogen-perpendicular sampling traverse extending from the Kishtwar tectonic window over the Zanskar Range. More recent studies link the evolution of the KW to the growth of the Lesser Himalayan Duplex structure (Gavillot et al., 2018), surrounded by the Miocene MCT shear zone along the base of the High Himalayan Crystalline Sequence, locally called the Kishtwar Thrust (KT) (Ul Haq et al., 2019). Thermochronological constraints suggest higher rates of exhumation within the window (3.2–3.6 mm yr−1) with respect to the surroundings (∼0.2 mm yr−1) (Gavillot et al., 2018), corroborating similar thermochronology-based findings from the of the Kullu–Rampur window along the Beas (Stübner et al., 2018) and Sutlej valley (Jain et al., 2000; Vannay et al., 2004; Thiede et al., 2004) over Quaternary timescales. No evidence exists to distinguish whether the hinterland of the Kashmir Himalaya is tectonically active over intermediate timescales. Therefore, to understand the 103–104-year timescale of neotectonic evolution, we combined geological field evidence, chronologically constrained geomorphic markers and morphometric analysis of the KW. The detailed structural information of the window and its surroundings, previously published thermochron data, accessibility, well-preserved sediment archives, and recognizable geomorphic markers across the Kishtwar Window make it an attractive location for our study.
In this study, we use the KW to focus on the following long-standing questions on Himalayan neotectonic evolution, which are the following.
-
Is there any ongoing neotectonic deformation in the interiors of the Kashmir Himalaya?
-
Can we determine subsurface structural variations and existence of surface-breaking faults by analyzing terrain morphology?
-
Can we obtain new constraints on deformation over geomorphic timescales? Do millennial-scale fluvial incision rates support long-term exhumation rates?
To address these questions, we adopted a combination of methods including morphometric analysis using high-resolution digital elevation models, field observations on rock type, structural variations and rock strength data, and analysis of satellite images to assess the spatial distribution of the late Quaternary deformation of the KW and surroundings (Fig. 1). We aimed to evaluate the role of active tectonics and geometric variations in the basal decollement in shaping the topography (Fig. 1). We used basin-wide steepness indices and specific stream power as a proxy for fluvial incision. Lastly, but most importantly, we calculated the fluvial bedrock incision rates by using depositional ages of aggraded sediments along the Chenab River. In this study, we show that the regional distribution of topographic growth is concentrated in the core of the window and along the western margin of the window. Our new estimates of the bedrock incision rate agree with Quaternary exhumation rates from the KW, which could mean consistent active growth of the Kishtwar Window over million-year to millennial timescales. Although the observed topographic and morphometric patterns indicate a structural and/or tectonic control on topographic evolution, with the available data we are not able to resolve whether it is caused by passive translation on the MHT or by active surface-breaking faulting within the duplex.
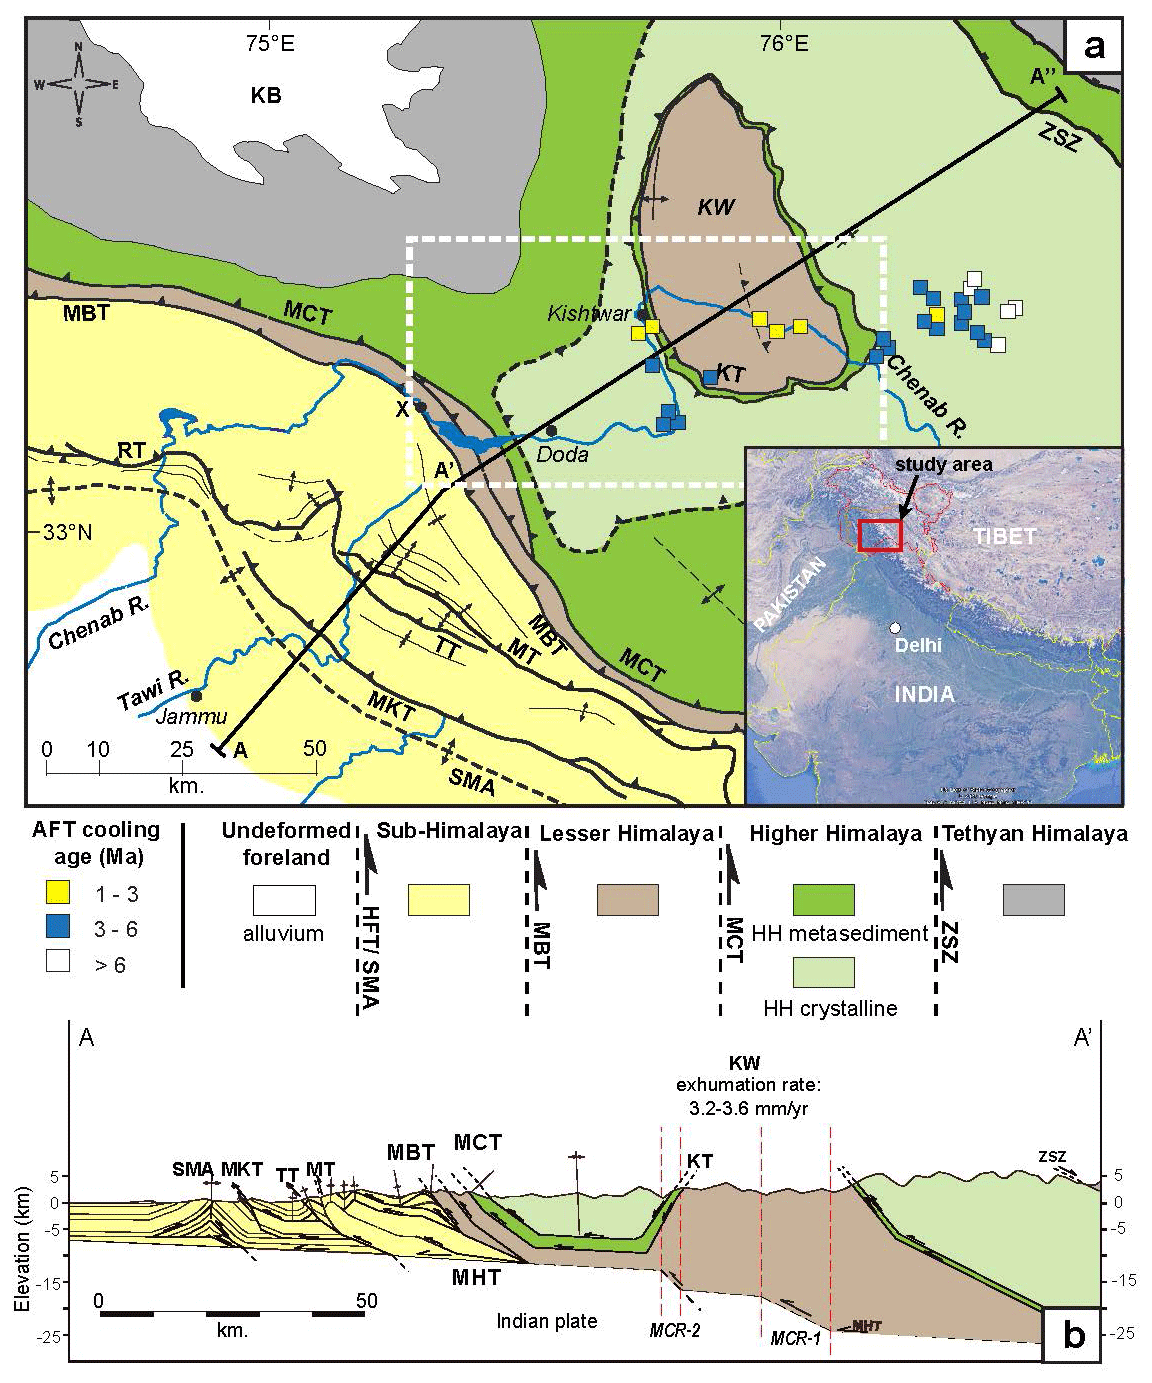
Figure 1(a) An overview geological map of the western sector of the Indian Himalaya showing major lithology (simplified after Steck, 2003, and Gavillot et al., 2018) and existing structures (Vassalo et al., 2015; Gavillot et al., 2018). The tectonic Kishtwar Window (KW) is surrounded by exposure of the MCT, locally known as the Kishtwar Thrust (KT), and exposes the Lesser Himalayan nappes. The Lesser Himalaya forms a west-verging asymmetric anticline. Apatite fission-track (AFT) ages are adapted from Kumar et al. (1995). (b) A balanced cross section of the NW Himalaya showing the general architecture of the Himalayan orogenic wedge (simplified from Gavillot et al., 2018). Note that, beneath the KW, Gavillot et al. (2018) proposed the existence of at least two crustal ramps (MCR-1 and MCR-2) on the MHT, translation on which may have resulted in 3.2–3.6 mm yr−1 Quaternary exhumation rates across the KW.
Regionally balanced cross sections (DiPietro and Pogue, 2004; Searle et al., 2007; Gavillot et al., 2018) suggest that the Himalayan wedge is bounded at the base by a decollement called the MHT. All regionally extensive surface-breaking thrust systems are thought to be rooted to the MHT. The orogenic growth of the Himalaya resulted in an overall in-sequence development of the orogen-scale fault systems which broadly define the morphotectonic sectors of the orogen (Fig. 1b). Notable among those sectors, the Higher Himalaya is bordered by the MCT in the south and is comprised of high-grade metasediments, the High Himalayan Crystalline Sequence (HHCS) and Ordovician granite intrusives (Fuchs, 1981; Steck, 2003; DiPietro and Pogue, 2004; Gavillot et al., 2018). The low-grade metasediments (quartzites, phyllites, schists, slates) of the Proterozoic Lesser Himalayan sequence are exposed between the MCT in the north and MBT in the south. The Lesser Himalayan domain is narrow (4–15 km) in the NW Himalaya except where it is exposed in the form of tectonic windows (Kishtwar Window, Kullu–Rampur window, etc.) in the western Himalaya (Steck, 2003). The sub-Himalayan fold-and-thrust belt lying to the south of the MBT has been the most tectonically active sector since the late Quaternary (Gavillot, 2014; Vassallo et al., 2015; Gavillot et al., 2018).
Near the southwest corner of our study area, Proterozoic low-grade Lesser Himalayan metasediments are thrust over the Tertiary sub-Himalayan sediments along the MBT (Wadia, 1934; Thakur, 1992). Near the Chenab region in the Kashmir Himalaya, apatite U–Th He ages suggest that cooling and exhumation related to faulting along the MBT thrust sheet initiated before Ma (Gavillot et al., 2018). Geomorphic data obtained across the MBT in Kashmir Himalaya suggest that the MBT has not been reactivated for the last 14–17 kyr (Vassallo et al., 2015). In the Kashmir Himalaya, the Lesser Himalayan sequence (LHS) exposed between the MBT and the MCT is characterized by a <10 km wide zone of sheared schists, slates, quartzites, phyllites and Proterozoic intrusive granite bodies (Bhatia and Bhatia, 1973; Thakur, 1992; Steck, 2003). The LHS is bounded by the MCT shear zone in the hanging wall. The MCT hanging wall forms highly deformed nappe exposing lower and higher Haimanta, which are related to the High Himalayan Crystalline Sequence (HHCS) (Bhatia and Bhatia, 1973; Thakur, 1992; Yin and Harrison, 2000; Searle et al., 2007; Gavillot et al., 2018). Nearly 40 km NE of the frontal MCT shear zone, the MCT fault zone is re-exposed as a klippe in the vicinity of the KW and is called the Kishtwar Thrust (KT) (Ul Haq et al., 2019) (Fig. 1). Within the KW, Lesser Himalayan quartzites, low-grade mica schists and phyllites along with the granite intrusives are exposed (Fuchs, 1975; Steck, 2003; DiPietro and Pogue, 2004; Yin and Harrison, 2000; Gavillot et al., 2018).
2.1 Structural architecture of the Kishtwar Window
The subsurface structural formation beneath the KW is not well-constrained. A recent study by Gavillot et al. (2018) proposes that the KW exposes a stack of LHS nappes in the form of the commonly known Lesser Himalayan Duplex (LH duplex), which is characteristic of the central Himalaya (Decelles et al., 2001). They also propose the existence of two mid-crustal ramps beneath the KW, namely MCR-1 and MCR-2 (Fig. 1b). Based on thermochronological constraints from Kumar et al. (1995), Gavillot et al. (2018) proposed that the core of the window was exhumed at rates of 3.2–3.6 mm yr−1 during the Quaternary at a higher rate when compared to the surroundings (∼0.2–0.4 mm yr−1). However, earlier studies by Fuchs (1975) and Frank et al. (1995) provide different interpretations of the formation of the KW. Fuchs (1975) proposed the existence of two nappes: the Chail nappe and the Lower Crystalline Nappe. The Lower Crystalline Nappe is partially or completely included in the MCT (KT) shear zone, and the Chail nappe encompasses the core of the window (Stephenson et al., 2000). According to these studies, the Chail nappe was internally deformed by crustal buckling, with tight isoclinal folding causing repetition and thickening of the LH crust.
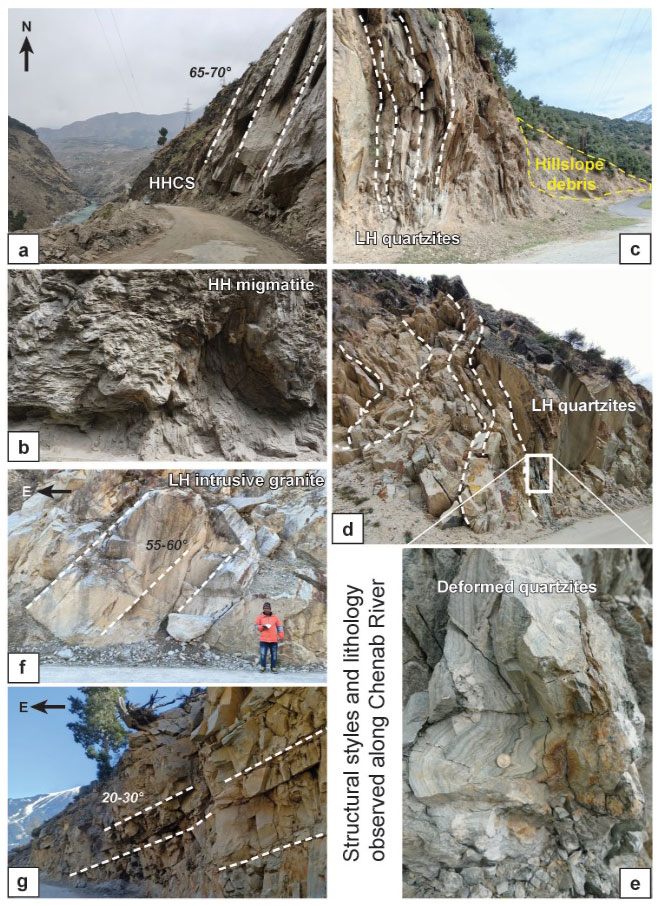
Figure 2Lithological units and structural orientations observed in the Chenab valley. (a) Steeply dipping HHCS units near the western margin of the KW. (b) Highly deformed migmatites at the base of the KT. (c) Sub-vertical quartzite slabs of Chail Formation exposed in the frontal horses of the LH duplex (or anticline). (d) Highly deformed, sub-vertical, and pervasively folded and compressed quartzite layers within the core of the KW, with the base of stacked LH nappes forming the hanging wall of the proposed surface-breaking fault (Fig. 8d). (e) A close-up view of the folded quartzite units. (f) Steeply dipping units of granite, which formed new penetrative foliation outcropping upstream from the fault zone. (g) Further upstream from the fault zone, the bedrocks are gentler in the eastern edge of the KW.
The Higher Himalayan sequence dips steeply away from the duplex (∼65∘ towards the west) (Figs. 1, 2a). The frontal horses of the LH duplex expose internally folded greenschist facies rocks. Although at the western margin of the duplex, the quartzites stand sub-vertically (Fig. 2c), the general dip amount is reduced as we move from west to east for the next ∼10–15 km up to the core of the KW. Near the core of the KW, we observed highly deformed (folded and multiply fractured) quartzite at the core of the KW (Fig. 2d, e). We also observed deformed quartz veins of at least two generations, as well as macroscopic white mica. Here, the Chenab River is also very steep and narrow; the rock units also steeply dip towards the east (∼55–65∘) and are nearly isoclinal and strongly deformed in places (Fig. 2f). Towards the eastern edge of the window, however, the quartzites dip much more gently towards the east (∼20–30∘) (Fig. 1b), and much less folding and faulting have been recognized in the field (Fig. 2g).
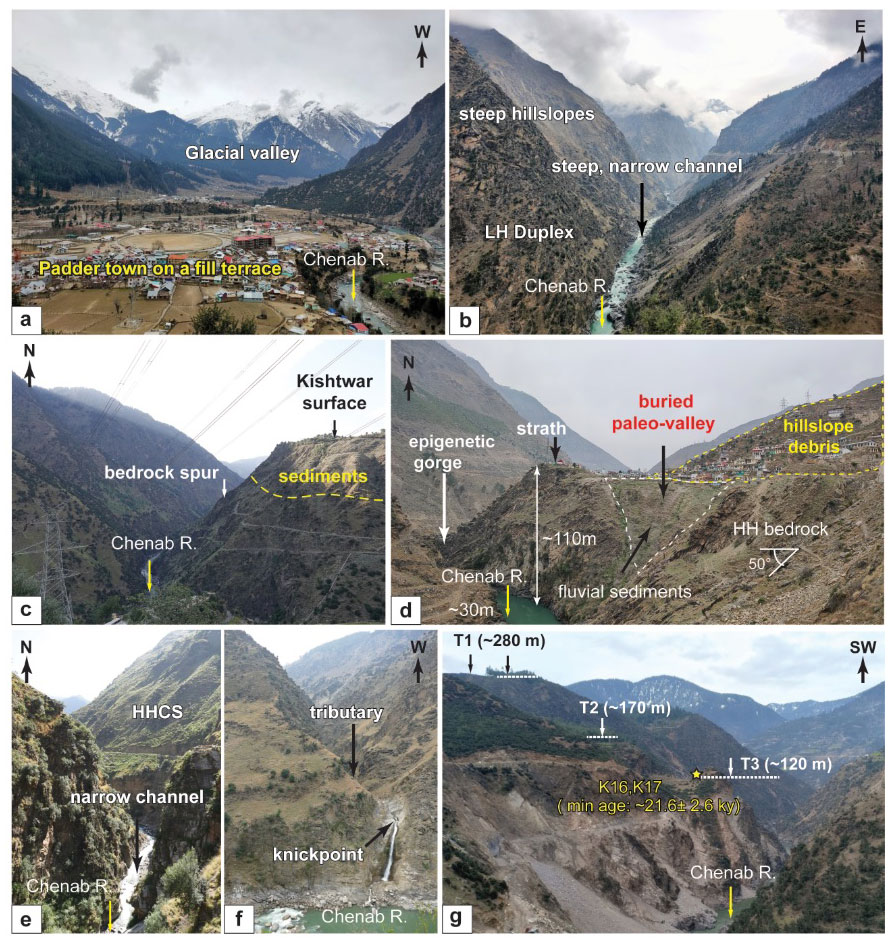
Figure 3Geomorphic features observed along the Chenab River across the KW. (a) Where the Chenab River enters the KW, the major tributaries coming from the Zanskar Range in the north are characterized by a “U-shaped” valley, suggesting repeated glacial occupancy during the Quaternary. The Chenab valley is unusually wide here, providing space for transient storage of glacial outwash sediments. The present-day river re-incises these sedimentary fills. The photograph was taken near the town of Padder (see Fig. 1a). (b) At the core of the KW, the Chenab valley is V-shaped. The Chenab River is steep and maintains a narrow channel width. (c) Highly elevated fluvial strath surfaces are preserved in the vicinity of the town of Kishtwar, and fluvial incision is observed along the N–S traverse of the Chenab River. The photograph was taken from the south of Kishtwar. The Kishtwar surface (∼400 m high from the river) is underlain by ∼150–170 m thick sediment cover overlying the tilted Higher Himalayan bedrock. The river has incised another ∼240 m of bedrock in this section. (d) Epigenetic gorge formed along the Chenab River in its N–S traverse through the HHCS. The town of Drabshalla is built on the hillslope deposits. (e) The Chenab River has maintained a very narrow channel (width: ∼20–25 m) through moderately strong HHCS rocks, suggesting a tectonic imprint on topography. (f) Formation of a knickpoint at the confluence of the tributary with the trunk stream, implying rapid fluvial incision of the trunk stream. (g) Three levels of strath surfaces observed below the Kishtwar surface. The strath levels are marked as T1 (∼280 m), T2 (∼170 m) and T3 (∼120 m). OSL dating of fluvial sediments lying above the T3 surface yield a minimum depositional age of kyr.

Figure 4(a) Lithological distribution near the western margin of the KW (see Fig. 8 for location). Luminescence sample (OSL and IRSL) locations and respective depositional ages (kyr) are shown. Every sample except K16 and K17 was taken above strath level T1. K16 and K17 were taken from above the T3 level. Note that the ages reported in italics are minimum age estimates. (b) A field photograph from the village of Janwas, south of the town of Kishtwar, showing the aggraded sediments lying above the Higher Himalayan tilted bedrock units. (c) IRSL ages (kyr) from the fluvioglacial sediments and OSL ages (kyr) from the hillslope debris units suggest that valley aggradation probably started at the transition of the glacial to interglacial phase (∼120–130 ka) and continued until ∼80 kyr ago. (d) A close-up view (red rectangle in Fig. 4c) of the tilted fluvioglacial sediment layers showing alternate conglomerate and medium–coarse sand layers. (e) A ∼3 m thick fine sand layer within the hillslope debris yielded a depositional age of kyr. The photograph was taken near the village of Pochal, northwest of the town of Kishtwar.
2.2 Valley morphology
The broad “U-shaped” valley profile near the town of Padder at the eastern margin of the KW is in contrast with the interior of the window (Fig. 3a). At the core of the KW, the Chenab River maintains a narrow channel width and a steep gradient (Fig. 3b). The E–W traverse of the Chenab River through the KW is devoid of any significant sediment storage. However, along the N–S traverse parallel to the western margin of the KW beneath the Kishtwar surface, ∼150–170 m thick sedimentary deposits are transiently stored over the steeply dipping Higher Himalayan bedrock (Fig. 3c). The height of the Kishtwar surface from the Chenab River is ∼450 m, which means ∼280 m of bedrock incision by the river since the formation of the Kishtwar surface. Along the N–S traverse of the river, epigenetic gorges are formed as a result of the damming of a paleo-channel by the hillslope debris flow, followed by the establishment of a newer channel path (Ouimet et al., 2008; Kothyari and Juyal, 2013). One example of such epigenetic gorge formation near the town of Drabshalla is shown in Fig. 3d. Downstream from the town of Drabshalla, the river maintains a narrow channel width (<25 m) and flows through a gorge having sub-vertical valley walls (Fig. 3e). The tributaries originating from the Higher Himalayan domain form one major knickpoint close to the confluence with the trunk stream (Fig. 3f). We have identified at least three strath surface levels above the present-day river channel: T1 (280±5 m), T2 (170–175 m) and T3 ( m) (Fig. 3g). The first study on sediment aggradation in the middle Chenab valley (transect from Kishtwar to Doda) was published by Norin (1926). He argued the sediment aggradation in and around Kishtwar is largely contributed by fluvioglacial sediments, and the U-shaped valley morphology is a marker of past glacial occupancy. In general, we agree with the findings of Norin (1926) and Ul Haq et al. (2019) as we observe ∼100 m thick late Pleistocene fluvioglacial sediment cover unconformably overlying the Higher Himalayan bedrock, which is most likely to be the paleo-strath surface (Fig. 4b). At the same time, we do not agree with the interpretation of surface-breaking faults near Kishtwar by Ul Haq et al. (2019). We inspected the proposed fault locations in detail and did not observe any evidence of large-scale fault movement, including offset, broken and rotated clasts, or fault gouges, on the proposed fault planes. There is evidence of only one deformed sand layer, which shows tilting and offset (<1 m). Therefore, we conclude that there is no strong evidence of any large-scale surface-breaking faults. The fluvioglacial sediments included alternate layers of pebble conglomerate and coarse–medium sand (Fig. 4c). The pebbles are moderately rounded and polished, suggesting significant fluvial transport. Our field observations suggest that the fluvioglacial sediments were succeeded by a significant volume of hillslope debris flow and paleo-landslide deposit (Fig. 4c). The thickness of the debris flow deposits is variable. The hillslope debris units and landslide deposits contain mostly massive, highly angular, poorly sorted quartzite clasts from the steep western margin of the KW. The hillslope debris units also contain a few fine-grained sediment layers trapped between two coarse-grained debris layers (Fig. 4e). The town of Kishtwar is situated on this debris flow deposit.
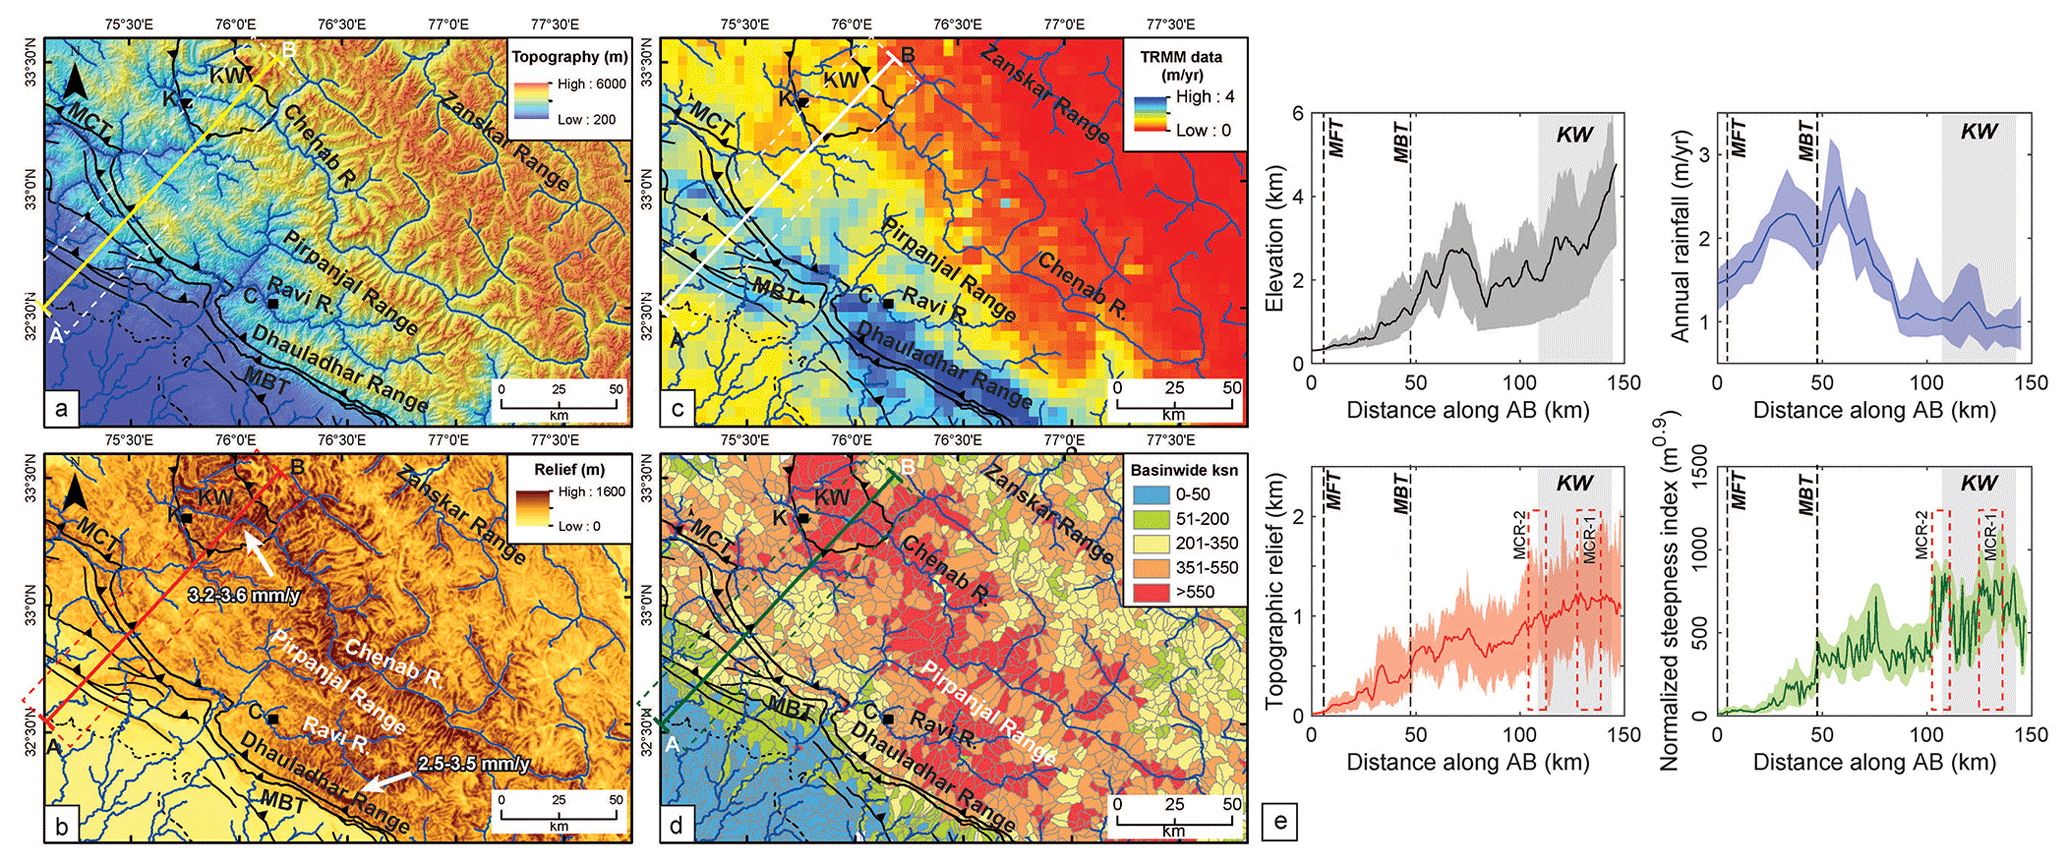
Figure 5Regional variations in (a) topography, (b) topographic relief (moving window of ∼4 km) (c) TRMM-derived rainfall (after Bookhagen and Burbank, 2006) and (d) basin-wide normalized steepness indices (ksn value) of the region shown in the dashed box in Fig. 1a. The 12.5 m ALOS PALSAR DEM, downloaded from https://asf.alaska.edu/ (last access: 18 December 2018), was used as the topography data. (e) Swath profiles (swath window: 50 km) along the line AB (see Fig. 5a) demonstrate the orogen-perpendicular variations in elevation, rainfall and ksn value. The KW is characterized by high elevation, high relief and high steepness, but low rainfall.
3.1 Morphometry
To conduct the morphometric analysis, we have used 12.5 m ALOS PALSAR digital elevation model (DEM) data (high-resolution terrain-corrected) (Fig. 5a). These DEM data have fewer issues with artifacts and noise than 30 m SRTM (Shuttle Radar Topographic Mission) data, which fail to capture the drainage network properly in areas populated by narrow channel gorges. Topographic relief has been calculated using a 4 km moving window (Fig. 5b), and the rainfall distribution pattern has been adapted from 12-year averaged annual rainfall data (Tropical Rainfall Measurement Mission, TRMM, data: Bookhagen and Burbank, 2006) (Fig. 5c).
3.1.1 Drainage network extraction
The drainage network and the longitudinal stream profiles were extracted using the Topographic Analysis Kit (Forte and Whipple, 2019). An equivalent of 10-pixel smoothing of the raw DEM data has been applied to remove noise from the DEM. The longitudinal stream profile of the Chenab trunk stream was processed with the TopoToolbox “knickpointfinder” tool (Schwanghart and Scherler, 2014). Several jumps and kinks in the longitudinal profile are seen, and those are marked as knickpoints (Fig. 6). A 30 m tolerance threshold was applied to extract only the major knickpoints.

Figure 6Longitudinal profile of the Chenab River showing major changes in channel gradient associated with knickpoints upstream. It illustrates that the major changes in the channel gradient extend over the full length of the KW, and the strongest changes are located in the core and not at the margins of the window. We classified knickpoints on the basis of their genesis. The substrate lithology along the river is shown. Knickpoints caused by glacial occupancy (G1, G2 and G3) are adapted from Eugster et al. (2016), who reconstructed the timing of maximum glaciation and extent of glacial cover in the source region of the upper Chenab River basin during the Last Glacial Maximum. These knickpoints highlight the importance of glacial erosion in the high-elevation sectors, especially in the northern tributaries of the Chenab River. Further in this study, we focus on the area marked by the red rectangle.
3.1.2 Basin-wide normalized steepness indices
Global observations across a broad spectrum of tectonic and climatic regimes have revealed a power-law scaling between the local river gradient and upstream contributing area:
where S is the stream gradient (m/m), ks is the steepness index (m2θ), A is the upstream drainage area (m2) and θ is the concavity index (Flint, 1974; Whipple and Tucker, 1999). Normalized steepness index values (ksn) are steepness indices calculated using a reference concavity value (θref), which is useful to compare the steepness indices of different river systems (Wobus et al., 2006). We extracted the ksn values in the study area using the ArcGIS- and MATLAB-supported Topographic Analysis Kit (Forte and Whipple, 2019) following the procedure of Wobus et al. (2006). We performed an automated ksn extraction using a critical area of 106 m2 to assign the channel head, a smoothing window of 500 m, a θref of 0.45 and an auto-ksn window of 250 m to calculate ksn values. The slope breaks, known as the knickpoints (sometimes referred to as knickzones if manifested by a series of rapids instead of a single sharp break in the profile), were allocated by comparing the change in slope along the distance–elevation plot (Figs. 6, 7a). The threshold “dz” value (projected stream offset across a knickpoint) for this study is 30 m. Basin-wide mean ksn values are plotted using a 1000 km2 threshold catchment area (Fig. 5d).
Identification of the knickpoints and knickzones as well as their relationship with the rock types and with existing structures is necessary to understand the causal mechanism of the respective knickpoints and knickzones. Knickpoints and knickzones can be generated by lithological, tectonic and structural control. Lithological knickpoints are stationary and anchored at the transition from the soft-to-hard substrate. The tectonic knickpoints originate at the active tectonic boundary and migrate upstream with time. Structural variations, such as thrust fault ramp–flat geometry, may cause a quasistatic knickpoint at the flat-to-ramp transition of the fault. In such cases, the ramp segment is characterized by higher steepness than the flat segment, and at times the ramp may be characterized by a sequence of rapids, forming a wide knickzone instead of a single knickpoint.
3.1.3 Channel width
Channel width is a parameter of assessment of lateral erosion and incision through bedrocks of equivalent strength (Turowski, 2009; Finnegan et al., 2005). The channel width of the Chenab trunk stream from just downstream of the MBT up to the eastern margin of the KW was derived by manual selection and digitization of the channel banks using Google Earth Digital Globe imagery (Google earth, 2020) (http://www.digitalglobe.com/, last access: 27 January 2020) of minimum 3.2 m spatial resolution. We used the shortest distance between the two banks as the channel width. We rejected areas having unparallel channel banks as that would bias the result. We used a 50 m step between two consecutive points for channel width determination. A total of 20 point-averaged channel width data along with the elevation of the riverbed are shown in Fig. 7b.
Table 1Calculations of change in specific stream power (SSP) values across the ramp and the flat segments beneath the LH duplex. We used a uniform discharge for SSP calculation.
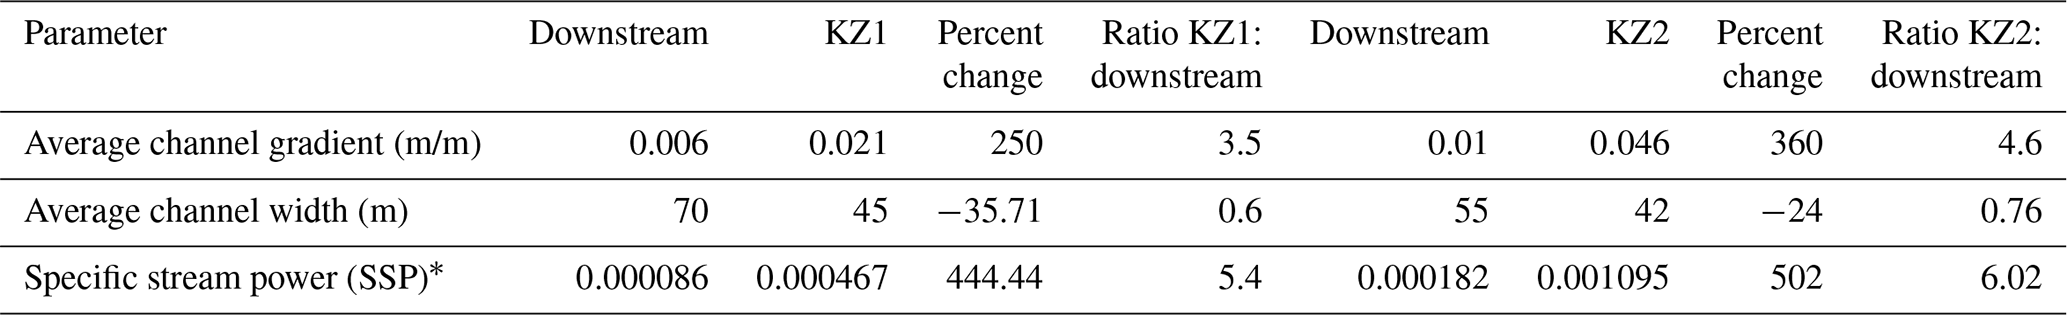
* SSP calculated by assuming equal discharge (Q).
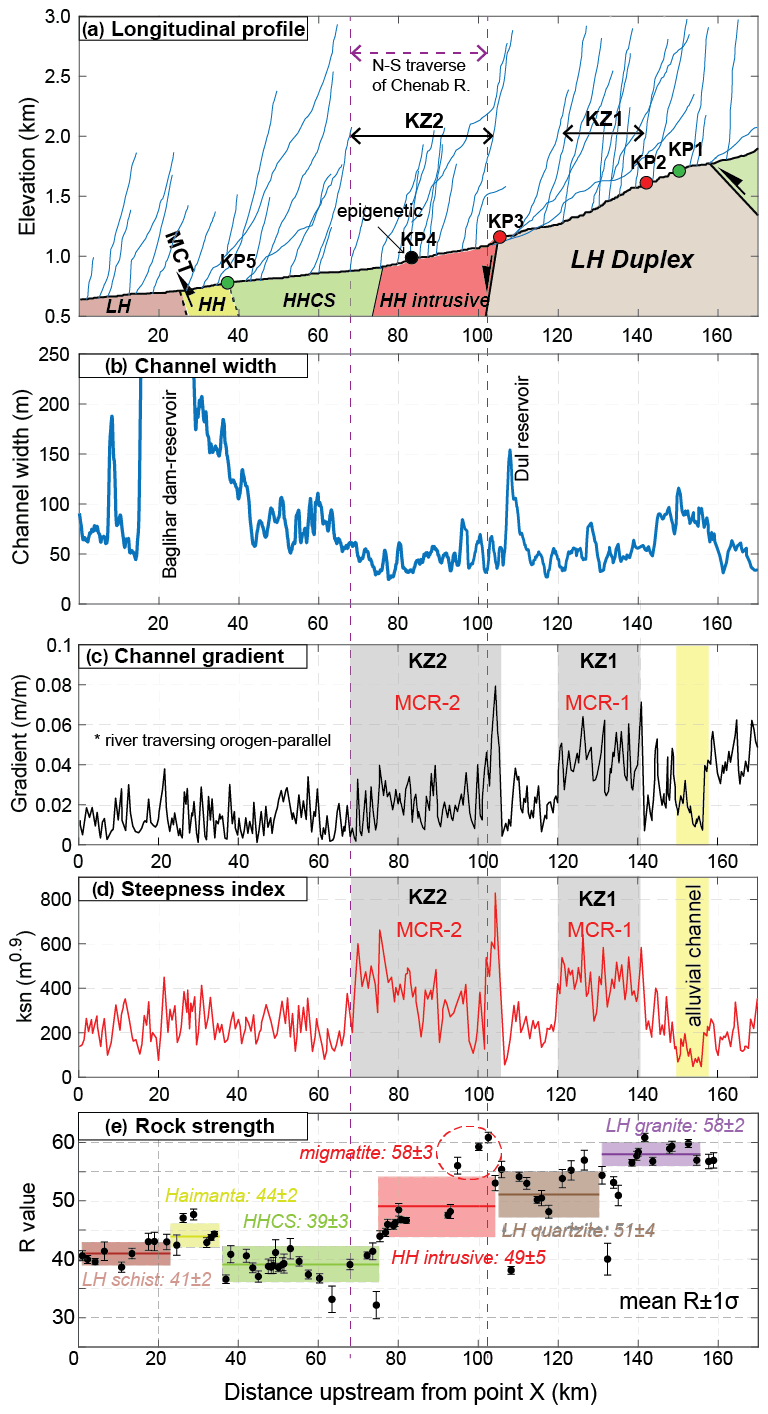
Figure 7Along-river variations in (a) channel elevation, (b) channel width, (c) channel gradient, (d) normalized steepness index and (e) rock strength of non-fractured bedrock units (R value taken by rebound hammer) until 165 km upstream from the MBT (point X; see Fig. 1a). The mean R value ±σ for each rock type has been plotted against their spatial extent. We identified two distinct zones (K1 and K2) with a high channel gradient and steepness index, which maintain a low channel width despite the variable rock strength of the substrate. Knickpoint KP4 may have been generated by the formation of the epigenetic gorge along the N–S traverse of the Chenab River (see Fig. 3c). Knickpoints KP1 and KP5 mark the transition of a soft-to-hard bedrock substrate.
3.1.4 Specific stream power (SSP) calculation
Specific stream power has often been used as a proxy for fluvial incision or differential uplift along the channel (Royden and Perron, 2013; Whipple and Tucker, 1999). Areas of higher uplift and incision are characterized by a transient increase in the specific stream power. Channel slope and channel width data were used to analyze the corresponding changes in the specific stream power (SSP) from upstream of the gorge area to the gorge reaches (Bagnold, 1966). The SSP (ω) was estimated using the following equation:
where γ is the unit weight of water, Q the water discharge, s the energy slope considered equivalent to the channel slope and w the channel width. SSP data from selected stretches are shown in Table 1. Channel width has been adapted from the method described in Sect. 3.1.3. We assumed a uniform discharge throughout the study area, as the TRMM data show insignificant variations in mean annual rainfall (Bookhagen and Burbank, 2006) (Fig. 5c, e). We also assume a runoff ratio of 1 as we lack any independent measure or supportive data for runoff vs. water percolation through the bedrock and sediment archive.
3.2 Field data collection
3.2.1 Structural data
We measured the strike and dip of the foliations and bedding planes of the Lesser and Higher Himalayan rocks using the Freiberg clinometer compass. At least five measurements are taken at every location, and the average is reported in Fig. 8a. Field photos in Fig. 2 support observed variations in the structural styles.
3.2.2 Rock strength data
Recording rock strength data in the field is important to understand the role of variable rock type and rock strength in changes in morphology. It provides us with important insights on the genesis of knickpoints and whether they are lithologically controlled or not. It also helps us to understand the variations in channel steepness across rocks of similar lithological strength. We systematically measured the rock strength of the main geologic units using a handheld rebound hammer. Repeated measurements (8–10 measurements at each of the 75 locations throughout the study area) were conducted to measure the variability of rock strength within the main lithologic units (Fig. 7e). All the measurements were taken perpendicular to the bedding–foliation plane, and no measurements are from wet surfaces or surfaces showing fractures. Each reading was taken at least 0.5 m away from the previous one. To our benefit, most of the roadcut sections had bedrock exposures. Except restricted locations, e.g., dam sites and military bases and outposts, we were able to cover all of the study area. However, data taken from Higher Himalayan intrusives close to the western margin of the KT are positively biased as they represent readings only from the leucosomatic layers. Our data from individual sites are smaller in number than what is preferred for checking the statistical robustness of Schmidt hammer data (Niedzielski et al., 2009). Therefore, we combined the data from all sites representing similar lithology and portrayed the mean ± standard deviation for each rock type. Field data from rock strength measurements are provided in Table S1 in the Supplement.
3.3 Luminescence dating of transiently stored sediments in and around Kishtwar
Luminescence dating of Quaternary sediments is a globally accepted method for constraining the timing of sediment deposition across different depositional environments of aeolian (Singhvi et al., 2010), fluvial (Olley et al., 1998; Cunningham and Wallinga, 2012) and glacial origin (Owen et al., 2002; Pant et al., 2006). In this study, we used luminescence dating to constrain depositional ages of several fluvioglacial and fluvial sand layers exposed near the western margin of the KW and further downstream. Although there are a few persistent problems in luminescence dating of Himalayan sediments (including poor sensitivity of quartz and numerous cases of heterogeneous bleaching of the luminescence signal), studies over the past couple of decades have also provided a good control on Himalayan sedimentary chronology by using luminescence dating with quartz (optically stimulated luminescence, OSL) and feldspar (infrared stimulated luminescence, IRSL).
Samples K-07, K-08 and K-09 were collected from the medium–coarse sand beds of fluvioglacial origin and have been dated with the IRSL technique (Preusser, 2003). The standard IR protocol was used because the OSL signal was saturated and post-IR showed instances of heterogeneous bleaching. Samples K-02 and K-11 were taken from the fine sand–silt layers lying above the debris flow deposits and have been treated for OSL dating using the double-SAR (single aliquot regenerative) protocol (Roberts, 2007). The double-SAR protocol was used to surpass the luminescence signal from tiny feldspar inclusions within individual quartz grains. Samples K-16 and K-17, taken above the T3 strath level, as well as sample K-18, taken above the T1 strath level, were treated and measured following the OSL double-SAR protocol. Samples K-01 and K-06, taken above the bedrock strath near the town of Doda, were also measured following the OSL double-SAR protocol. The aliquots were considered for equivalent dose (ED) estimation only if (i) the recycling ratio was within 1±0.1, (ii) ED error was less than 20 %, (iii) test dose error was less than 10 % and (iv) recuperation was below 5 % of the natural rate. Fading corrections of the IRSL samples K-07 and K-09 were done using conventional methods (Huntley and Lamothe, 2001). For samples showing over-dispersion (OD) ≤20 %, the central age model (CAM) was used for estimation of the equivalent dose (De) (Bailey and Arnold, 2006) instead of the De estimation protocol prescribed by Chauhan and Singhvi (2011), which is useful for samples having higher over-dispersion (Table 2). For samples K-16 and K-17 with a high OD value, the minimum age model (MAM) was used. Details of sample preparation are provided in Sect S2.
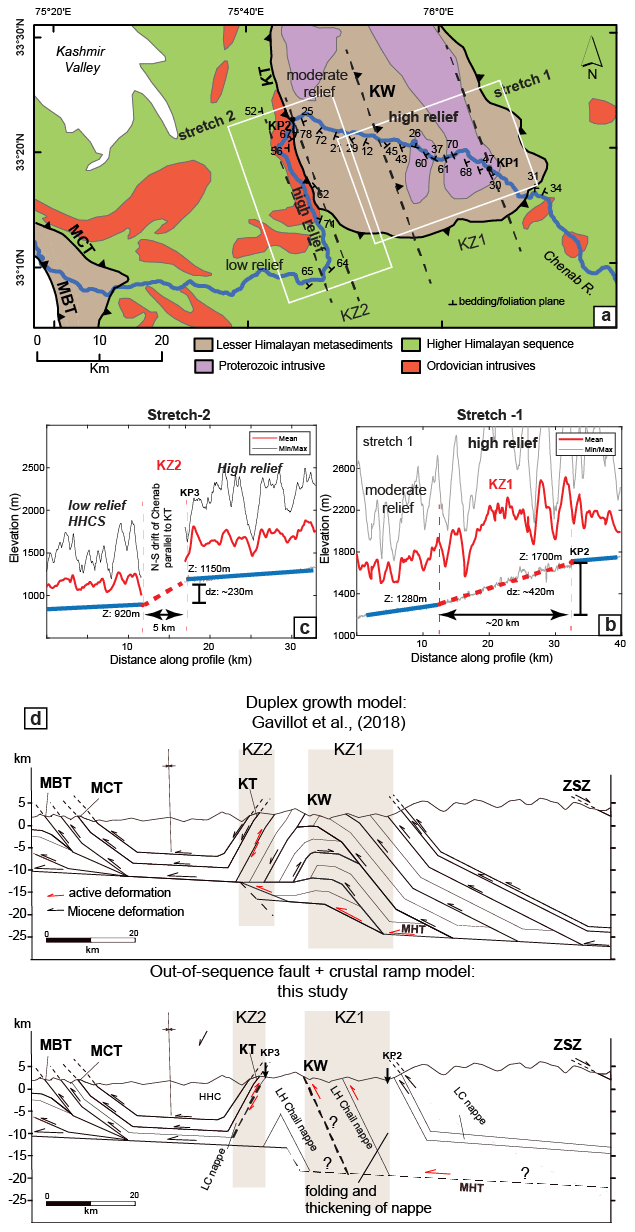
Figure 8(a) Detailed structural data from the study area showing structural and lithological variations (modified after Steck, 2003; Gavillot et al., 2018). (b, c) Orogen-perpendicular drop of the Chenab trunk stream across stretch 1 and stretch 2, respectively, showing a transient increase in steepness over the K1 and K2 knickzone. The orthogonal profile projection method has been used in the case of K2 (see Fig. 7) to identify the width of the steep segment. (d) Comparison between two deformation models explaining the observed morphometric variations across the KW: (a) duplex growth model (adapted from Gavillot et al., 2018) and (b) active out-of-sequence fault model.
Table 2Sample locations, elemental concentrations, dose rates, equivalent doses and age estimations for OSL and IRSL analyses of sand samples from Kishtwar valley.
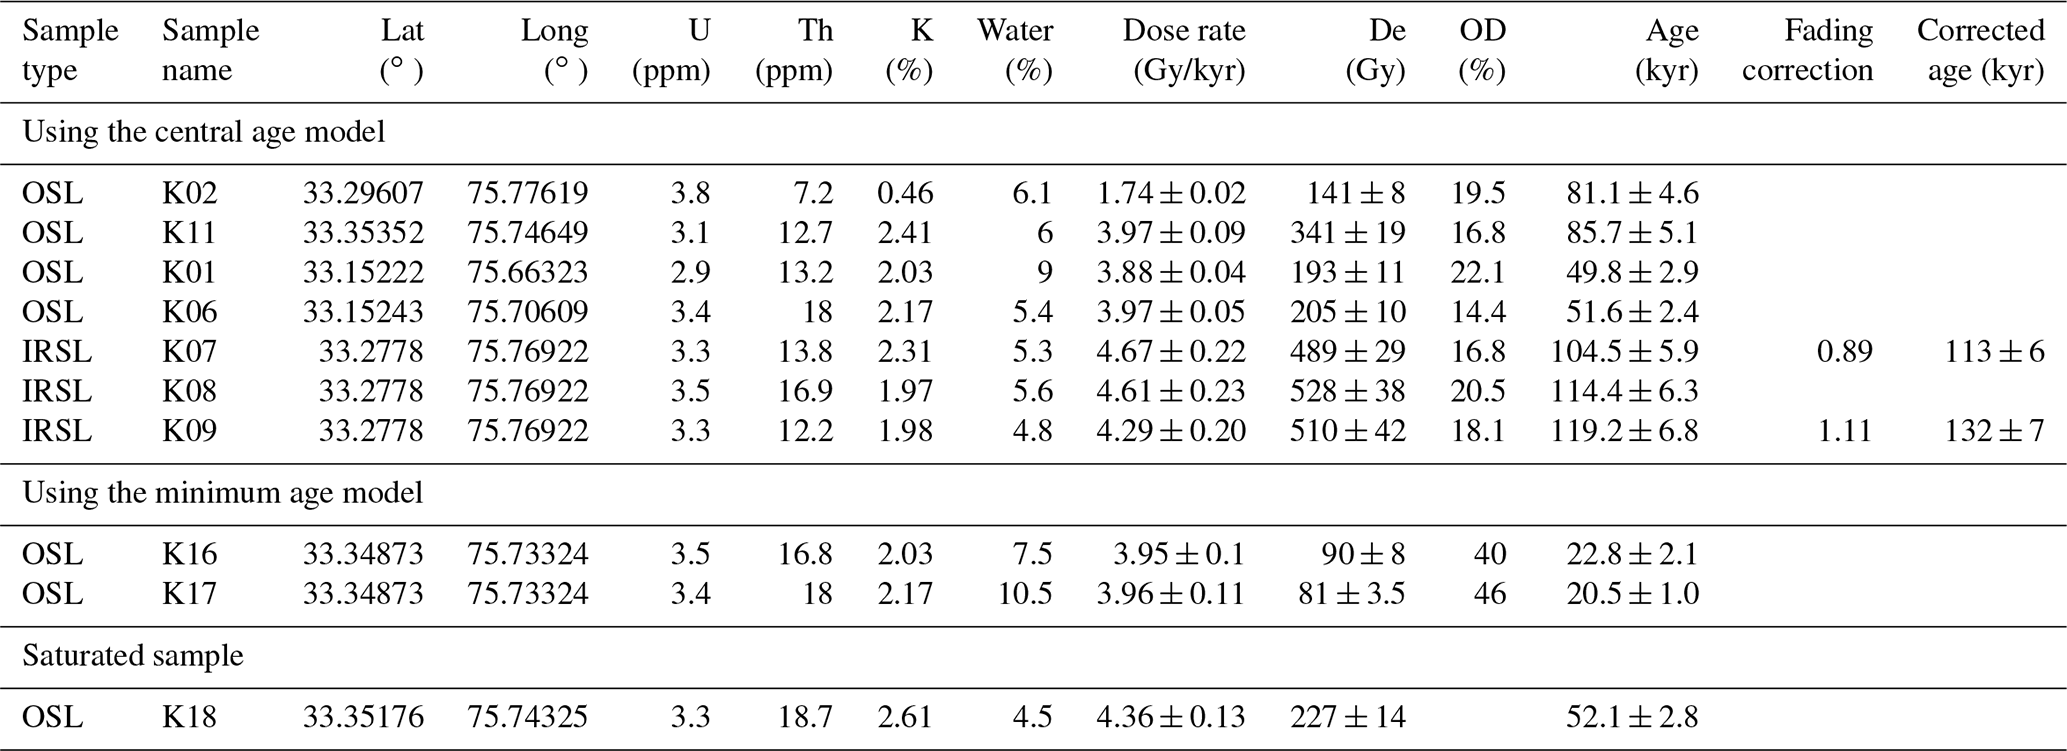
The dose rate was estimated using the online software DRAC (Durcan et al., 2015) with data for uranium (U), thorium (Th) and potassium (K) measured using ICP-MS (inductively coupled plasma mass spectrometry) and XRF (X-Ray fluorescence) (Table 2) at IISER Kolkata. The estimation of moisture content was done by using the fractional difference of saturated vs. unsaturated sample weight (Table 2).
4.1 Field observations and measurements
The Chenab River has deeply incised the KW (Fig. 3b and e). The LHS rock units exposed within the KW are mainly composed of fine-grained quartzites and phyllites with occasional schists in between (Steck, 2003; Gavillot et al. 2018). The Lesser Himalaya has been suggested to be an asymmetric antiformal stack with a steeper western flank (dip: 70∘ toward the west) (Fig. 2c). The KW is surrounded by rock units related to the Higher Himalayan high-grade metasedimentary sequence, mainly garnet-bearing mica schists and gneisses. Higher Himalayan rocks close to the western edge of the KW form a klippe with a southwest-verging MCT at its base. The KT, which is the southern structural boundary of the window margin accommodating the differential exhumation between the internal window and its surroundings, is expressed as highly deformed sub-vertical shear bands.
Along the traverse of the Chenab River through the KW and further downstream, two prominent stretches along the Chenab River of ∼20 and ∼25–30 km in length are characterized by steep channel gradient associated with a large number of rapids (Fig. 3b). These steep segments are also characterized by a very narrow channel width (<30 m) (Fig. 3b, e). The steepened segments define knickzones (KZs) rather than a single knickpoint (KP). The knickzone KZ1 in the trunk stream as well as in the tributaries is hosted over the bedrock gorge. Although the knickzone KZ2 passes through a series of old landslides (around Kishtwar), the rapids have all formed in a bedrock channel. Therefore, neither KZ1 nor KZ2 appears to be related to damming by recent landslides or other mass movements. The eastern margin of the KW is characterized by a wide U-shaped valley filled with thick sand layers and coarser fluvioglacial sediments (Fig. 3a) where the Chenab River incises through this late Pleistocene fill at present.
The rock strength data taken along the Chenab trunk stream portray large variations (R value ranging from 28 to 62) across different morphotectonic segments (Fig. 7e). Within the KW, Lesser Himalayan phyllites and schists have low R values (30–35); however, the low-strength schists and phyllites are sparsely present and are therefore ignored when plotting the regional rock strength values in Fig. 7e. The dominant Lesser Himalayan quartzites in the KW, as well as the granitic intrusives in the eastern part of the KW, show very high R values of 55–62 and 51–56, respectively (Fig. 7e). Compared to the high R values in the KW, the Higher Himalayan metasediments show low strength (R: 35–45) until the point KP5 (Fig. 3b). However, near the western margin of the KW, the migmatites of the Higher Himalayan domain show high rock strength (R value: 58±3) (Fig. 7e). The rock strength increases within the Haimanta Formation (R: 44±2) further downstream until it reaches the MCT shear zone at the southern boundary of the main Himalayan orogen. The R value in the frontal Lesser Himalaya is moderate (R: 41±2).
The Higher Himalayan sequence dips steeply away from the duplex (∼65∘ towards the west) (Figs. 2a, 8a). The frontal nappes of the Lesser Himalaya expose internally folded greenschist facies rocks. Although at the western margin of the duplex, the quartzites stand sub-vertically, the general dip amount is reduced as we move from west to east for the next ∼10–15 km (Fig. 8). Near the core of the KW, we observed deformed quartz veins of at least two generations, as well as macroscopic white mica. Near the core of the window, where the river is also very steep and narrow, the rock units also steeply dip towards the east (∼60–65∘) and are nearly isoclinal and vigorously deformed in places (Fig. 2d, e). Towards the eastern edge of the window, however, the quartzites dip much more gently towards the east (∼25–30∘), and much less folding and faulting have been recognized in the field.
The E–W traverse of the Chenab River is completely devoid of any sediment storage. However, along the N–S traverse parallel to the western margin of the KW, ∼150–170 m thick sedimentary deposits are transiently stored over the steeply dipping Higher Himalayan bedrock. Norin (1926) argued that sediment aggradation in and around Kishtwar is largely contributed by fluvioglacial sediments, and the U-shaped valley morphology is a marker of past glacial occupancy. We partially agree with the findings of Norin (1926) and Ul Haq et al. (2019) as we observe >100 m thick fluvioglacial sediment cover unconformably overlying the Higher Himalayan bedrock along the N–S traverse of the Chenab River. The fluvioglacial sediments included alternate layers of pebble conglomerate and coarse–medium sand. The pebbles are moderately rounded and polished, suggesting significant fluvial transport. Our field observations suggest that the fluvioglacial sediments were succeeded by a significant volume of hillslope debris. The thickness of the debris flow deposits is variable. The hillslope debris units contain mostly coarse-grained, highly angular, poorly sorted quartzite clasts from the frontal horses of the Lesser Himalayan Duplex. The town of Kishtwar is situated on this debris flow deposit (Fig. 9). Along the N–S traverse of the Chenab, we have observed at least two epigenetic gorges lying along the main channel (Fig. 3d). The active channel has incised the Higher Himalayan bedrock and formed strath surfaces. We have identified at least three strath surface levels above the present-day river channel: T1 (280±5 m), T2 (170–175 m) and T3 ( m) (Figs. 3g, 10a).
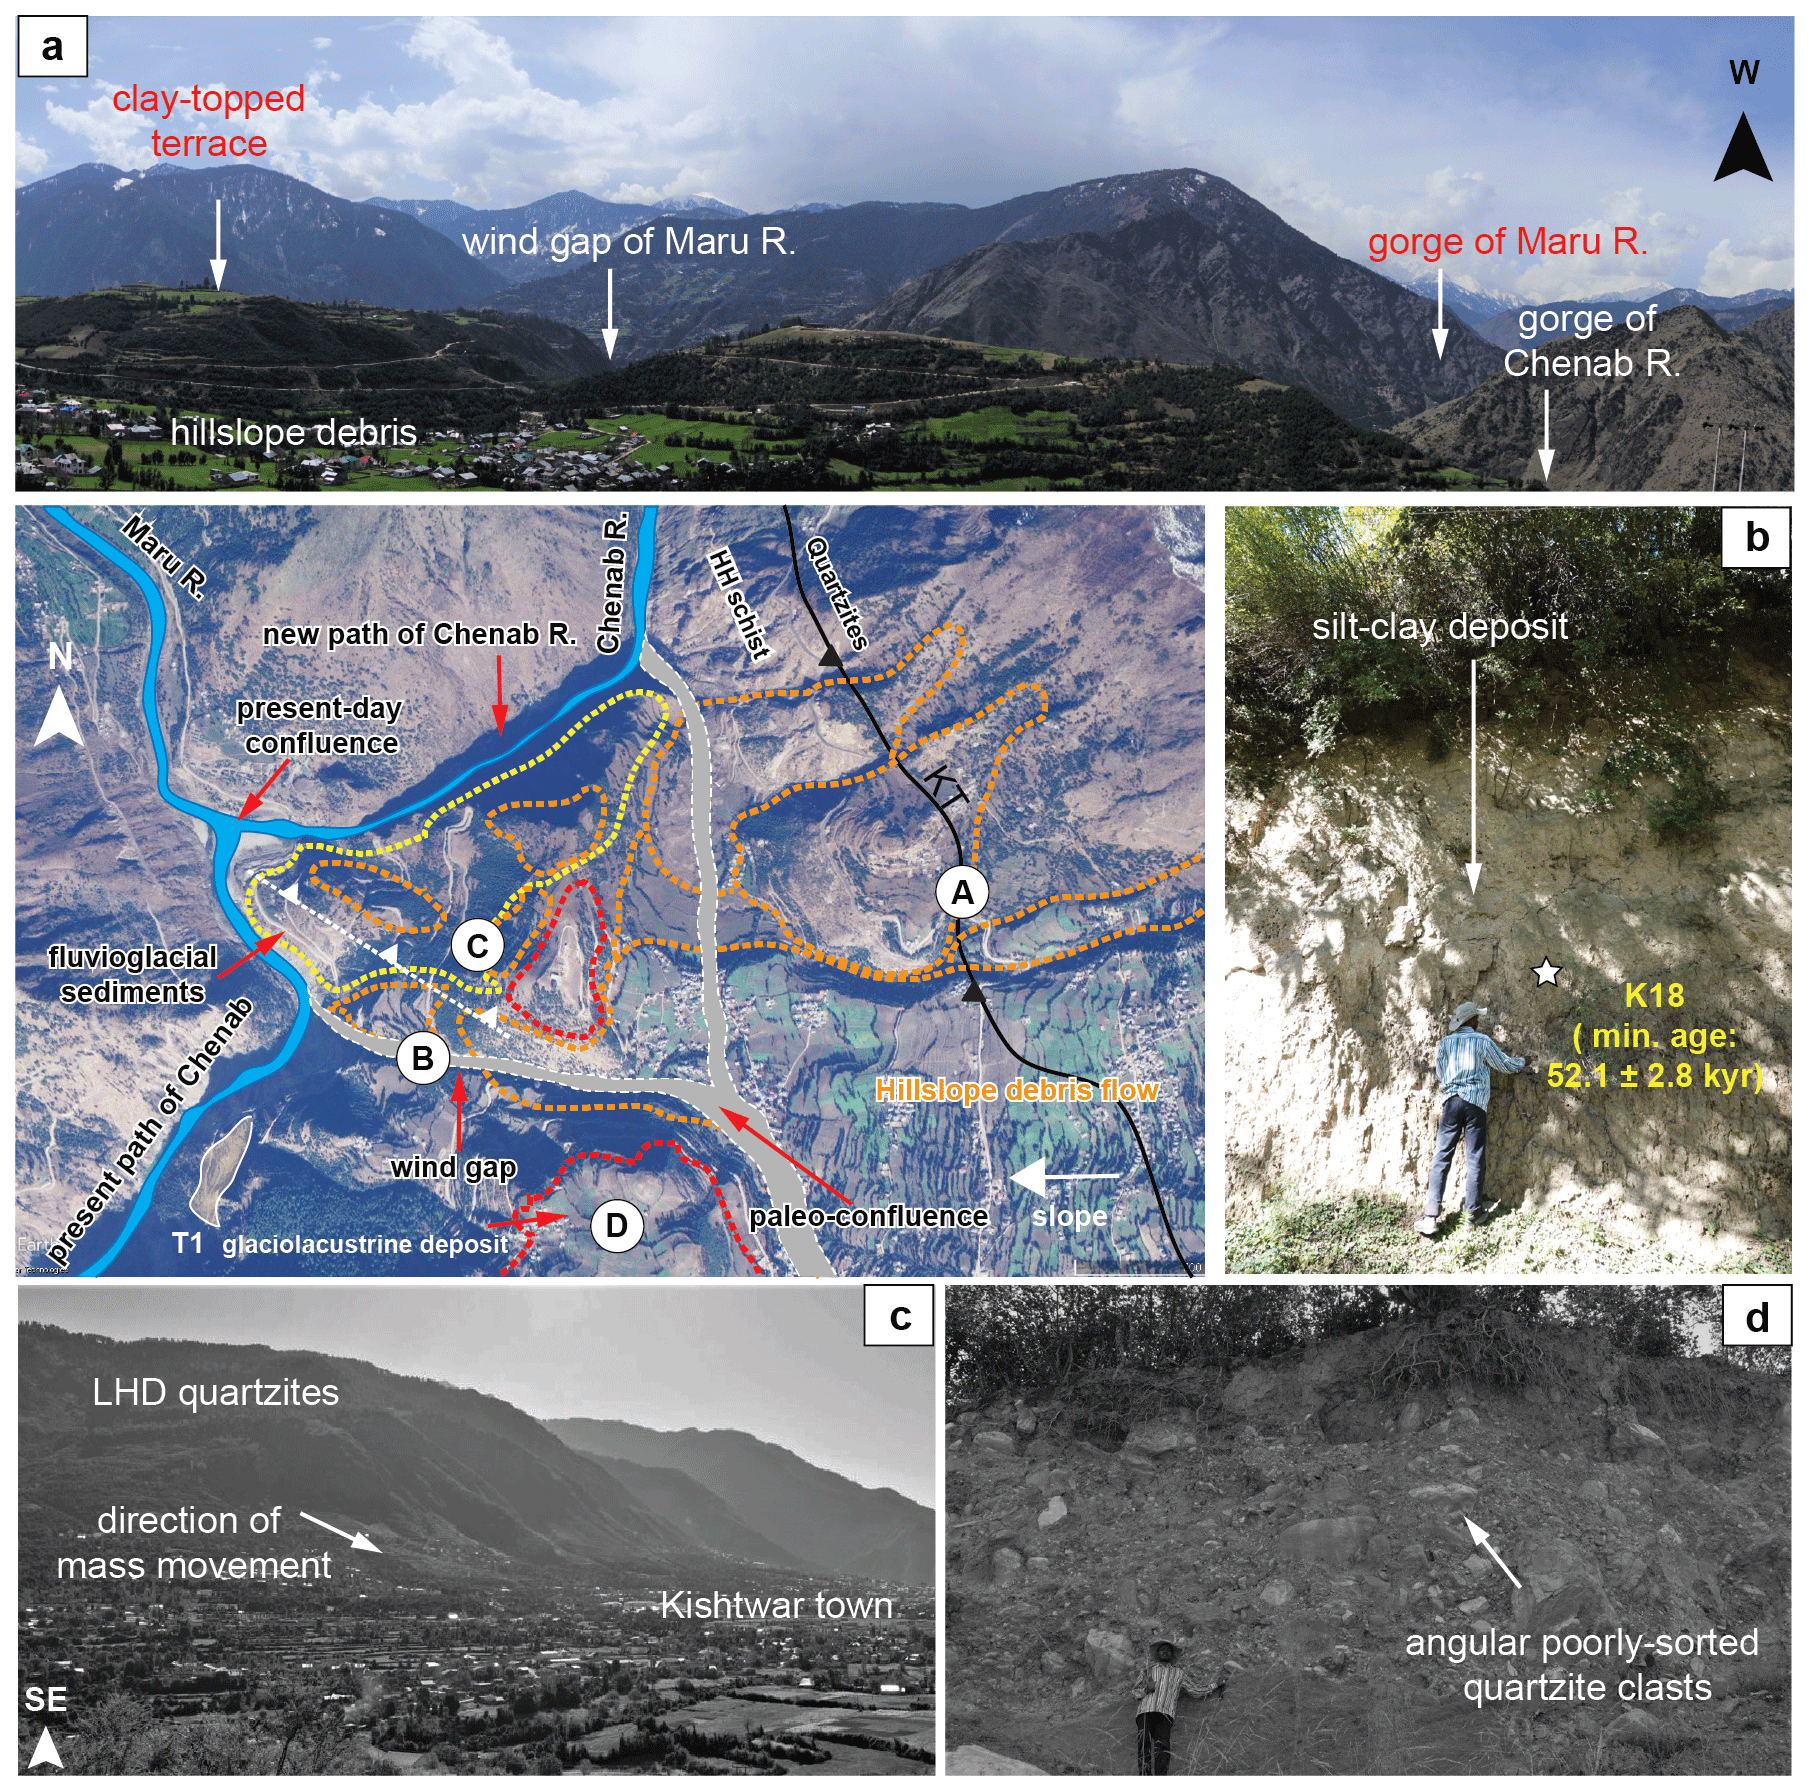
Figure 9A Google Earth satellite image of northern Kishtwar showing the present-day flow path of the Chenab River (see Fig. 8 for location) (© Google Earth). Hillslope debris originated from the steep western margin of the KW (only made of massive white quartzites) and was deposited over fluvioglacial and glacio-lacustrine sediments and Higher Himalaya schist bedrock exposed below in the Kishtwar valley. Massive hillslope sediment flux impeded the paleo-drainage system, leaving behind the paleo-valley of the tributary, the Maru River. Our interpretation of the paleo-drainage is marked by a white dashed line. (a) A view of the Kishtwar surface from the western margin of the KW showing the present-day gorge of the Chenab River and its tributary. The wind gap (paleo-valley) of the tributary is visible. (b) A thick clay–silt deposit in the wind gap suggests abandonment of river flow. The OSL sample is saturated and hence only denotes the minimum age of valley abandonment and hillslope debris flow. (c) Overview picture of the frontal horses of the LH duplex and the direction of debris flow towards Kishtwar. (d) Angular, poorly sorted clasts and boulders were observed at the base of the debris flow unit near the village of Pochal, north of Kishtwar. The white quartzites of the LH are exposed in the vicinity of Kishtwar (see satellite image) – only the eastern valley flank could have collapsed in the past.
4.2 Results from morphometric analysis
4.2.1 Steep stream segments and associated knickpoints
The longitudinal stream profile along the Chenab River does not portray a typically adjusted concave-up profile across the Himalaya (Fig. 6). We observe breaks in slope and concavity at several locations within a ∼150 km traverse upstream from the MBT across the KW. These breaks are defined as knickpoints. Starting from the eastern margin of the KW until the MBT in the downstream direction, we identified at least six (6) discrete knickpoints in the river profile (Fig. 6). Those are named KP1–KP6 according to their decreasing elevations. The upstream heads of KZ1 and KZ2 are marked as KP2 and KP3, respectively (Fig. 6). The slope breaks define the upstream reaches of the steep stream segments. The basin-wide steepness indices span ∼30– >750 m0.9 across the study area (Fig. 5d). We assigned a threshold value of ksn>550 for the steepest watersheds and stream segments. Along the traverse, the major knickpoints are KP1 (∼ 1770 m), KP2 (∼1700 m), KP3 (∼1150 m) and KP5 (∼800 m) (Fig. 6). Two minor knickpoints are KP4 (∼1000 m) and KP6 (∼650 m).
Nennewitz et al. (2018) previously proposed a high basin-averaged ksn value of >300 in the KW. Here in this study, we worked with a more detailed DEM and stream-specific ksn allocation (Fig. 7d), as well as a basin-wide steepness calculation. Our results corroborate the earlier findings but predict the zone of interest in greater detail. It is important to note that by setting a higher tolerance level in the “knickpointfinder” tool in TopoToolbox, we have managed to remove the DEM artifacts from consideration (Schwanghart and Scherler, 2014).
4.2.2 Channel width and valley morphology
The channel width of the Chenab River is on average low (30–60 m) within the core of the KW (Figs. 3b, 7b), and the low channel width continues until the Chenab River flows N–S along the western margin of the KW. However, there are a few exceptions; upstream from the knickpoint KP1 in the Padder valley (in which the town of Padder is located), the channel widens (width ∼80–100 m) and the channel gradient is low (Fig. 3a). The second instance of a wider channel is seen upstream from knickpoint KP3, where there is a reservoir for the Dul-Hasti dam. Downstream from KP3 within the Higher Himalaya, the channel width ranges from 50–70 m. However, towards the lower stretches of the N–S traverse, the width is even lower (16–52 m). The river width increases to 100–200 m as Chenab River takes a westward path thereafter. The channel width increases beyond 300 m until it leaves the crystalline rocks in the hanging wall of the MCT and enters the Lesser Himalaya in the hanging wall of the MBT across the Baglihar dam. Within the frontal LH, the channel width is again lowered (50–80 m).
4.2.3 Changes in specific stream power (SSP)
Discharge-normalized SSP data calculated from the upstream stretches and the knickzones KZ1 and KZ2 show a major increase in SSP within the steep knickzones. The increases in SSP from upstream to the knickzones KZ1 and KZ2 are 4.44 and 5.02 times, respectively (Table 1). Such a high increase in SSP is aided by steepening of the channel gradient (Fig. 7c) and narrowing of the channel bed (Fig. 7b).
4.3 Luminescence chronology
The results for the luminescence chronology are listed in Table 2. Samples collected from the fluvioglacial sediments overlain by debris flow deposit, namely K07, K08 and K09, yield IRSL ages of 104.5±5.9, 114.4±6.3 and 119.2±6.8 kyr, respectively. Fading corrections done for samples K07 and K09 yield correction factors (g%) of 0.89 and 1.11, respectively. The sample K08 has not been treated for fading correction, but for easier understanding, we have assumed a constant sedimentation rate between the samples K07 and K09 and extrapolated the “fading-corrected” age for K08. The oldest sample K09 (132±7 kyr) (fading-corrected IRSL age) is succeeded by samples K08 (126±6 kyr) and K07 (113±6 kyr). The finer fraction of the hillslope debris overlying the fluvioglacial deposits yields OSL ages of 81.1±4.6 kyr (K02) and 85±5 kyr (K11) (Fig. 6). OSL samples taken from sparsely preserved sediment layers above the T3 strath surface show heterogeneous bleaching, and hence we provide a minimum age of 22.8±2.1 kyr (sample K16) and 20.5±1.0 kyr (sample K17). One sample taken above the T1 strath level is saturated and shows a minimum age of 52.1±2.8 kyr (sample K18) (Table 2). OSL samples K01 and K06 taken from sand layers sitting atop the Higher Himalayan bedrock straths near the town of Doda portray depositional ages of 49.8±2.9 kyr and 51.6±2.4 kyr, respectively (Table 2).
Analyses of morphometric parameters are widely used as indicators of active tectonics and transient topography (Kirby and Whipple, 2012; Seeber and Gornitz, 1983). Many studies have used morphometry as a proxy for understanding the spatial distribution of active deformation across certain segments of the Himalayan front (Malik and Mohanty, 2007; van der Beek et al., 2016; Nennewitz et al., 2018; Kaushal et al., 2017). More importantly, some studies have integrated morphometric analysis with chronological constraints to assess the spatial and temporal variability in deformation within the sub-Himalaya (Lavé and Avouac, 2000; Thakur et al., 2014; Vassalo et al., 2015; Dey et al., 2016a). All these studies have demonstrated the applicability of morphometric indicators as an estimate of changes in uplift rate or spatial variations of deformation across different landscapes.
Previously published young apatite fission-track cooling ages (∼2–3 Myr) have been interpreted as the result of rapid exhumation of the LH duplex over a 106-year timescale (Gavillot et al., 2018). However, how and where the deformation is accommodated across the KW over the 103–105-year timescale are unknown. In this section, we discuss the obtained morphometric and fluvial characteristics of the studied region and compare these to existing models of deformation. We also discuss how our new luminescence chronological estimates from the transiently stored sediment archive help us to constrain fluvial incision rates over the late Pleistocene–Holocene timescale and put them in the context of regional tectonic deformation models: (1) a mid-crustal ramp model vs. (2) an out-of-sequence fault model.
5.1 Knickpoints and their genesis
Seeber and Gornitz (1983) recognized that the Chenab River is characterized by a zone of steep channel gradient in the vicinity of the KW. Nennewitz et al. (2018) demonstrated a strong correlation between steep longitudinal river profiles and young thermochronological cooling ages, suggesting recent focused rock uplift and rapid exhumation along many major rivers draining the southern Himalayan front. However, it is still an open debate whether uplift and growth of the LH duplex are triggered solely by slip over the crustal ramp of the MHT or additional out-of-sequence surface-breaking faults augmenting it (Herman et al., 2010; Elliott et al., 2016; Whipple et al., 2016).
The longitudinal profile of the lower Chenab traverse (below ∼2000 m a.m.s.l.) is punctuated by two prominent stretches of knickpoint zones and several minor knickpoints related to a change in the fluvial gradient (Fig. 6). Below we will discuss the potential cause of the formation of those major knickpoints in the context of detailed field observations, existing field-collected structural and lithological data, geomorphic features, and rock strength and channel width information (Fig. 7).
5.1.1 Lithologically controlled knickpoints
Our findings show that the Himalayan traverse of the Chenab River is characterized by large variations in substrate lithology and rock strength, which cause variations in the fluvial erodibility and form knickpoints on the river profile (Figs. 1, 7e). An instance of soft-to-hard substrate transition happens across the knickpoint KP1, lying downstream from the Padder valley at the eastern edge of the KW (Fig. 2a). Across KP1, the river enters the over-deepened LH bedrock gorge (R value >50) after exiting the Padder valley filled with transiently stored, unconsolidated fluvioglacial sediments (Fig. 3a). A similar soft-to-hard substrate transition is observed upstream from the MCT shear zone. The corresponding knickpoint KP5 represents a change in lithological formation from the sheared and deformed High Himalayan Crystalline Sequence (R value ∼35–40) to the deep-seated Haimanta Formation (R value ∼40–50). There is no field evidence, such as fault splays or ramps, in support of KP5 being structurally controlled.
5.1.2 Tectonically controlled knickpoints
Compiling previously published data on regional tectonogeomorphic attributes (Gavillot et al., 2018) as well as detailed field documentation of structural styles and tectonic features, we identified several stretches where variations in morphometric proxies indicate spatial variability in rock uplift and faulting across the KW. We have found at least two instances in which knickzones are not related to a change in substrate, nor are they artificially altered such as constructed dam sites.
The knickzone KZ1 (upstream marked by KP2 ∼1700 m a.m.s.l.) represents the upstream reach of a steepened river segment that represents a drop of ∼420 m of the Chenab River across a run length of ∼15–20 km (Fig. 8c). The upstream and downstream sides of KP2 are characterized by a change in the dip of the LH bedrock foliation (Figs. 2f, g, 8) and channel width (Fig. 7b). KP2 also reflects a change in the channel width (Fig. 7b). Interestingly, the steep segment exhibits a narrower channel and particularly steep valley walls through the core of the KW. Near the end of the steep segment, intensely deformed (folded and fractured) LH rocks are exposed (Fig. 2d, e). We infer two main possibilities for these field observations combined with systematic changes in geomorphic characteristics: (1) it may be related to an active surface-breaking out-of-sequence fault, or (2) it may be an inactive fault that defines the floor thrust of one of the numerous proposed duplex nappes. The observed changes in the geomorphic indices, along with stretch of the knickzone KZ1 and observed increase in the bedrock dip angle, may well be explained by a ramp on the basal decollement. This explanation is supported by the existence of mid-crustal ramps in the balanced cross section from Gavillot et al. (2018). However, the structural orientation of the rocks (Fig. 8a) differs considerably from those of the proposed LH duplex in Gavillot et al. (2008), raising questions about the duplex model. Our field observations are supported by previous studies by Fuchs (1975), Frank et al. (1995) and Stephenson et al. (2000), who argued against duplexing of multiple thrust nappes and favored internal folding of the Chail nappe to explain the tectonic growth and deformation pattern within the KW. Therefore, we cannot clearly comment on whether K1 represents a flat-to-ramp transition of the MHT or is indeed an active out-of-sequence thrust ramp.
On the other hand, the other knickpoint KP3 at the upstream head of KZ2 nearly coincides with the exposure of the KT (Fig. 6). KP3 cannot be a lithologically controlled knickpoint as it reflects a hard-to-soft substrate transition from LH rocks (R value >50) to HH rocks (R value <45) (Fig. 7e). We acknowledge that just across the point KP3, there are some strong leucosomatic layers within the migmatites (R: 58±3), but in general, the migmatites are also brittle-deformed. The rock strength measurement was not done in the multiply fractured units as it would show inaccurate values. In the longitudinal profile, KP3 does not represent a sharp slope break because the downstream segment runs parallel to the main structures and KW boundary for ∼25–30 km, including the KT. Therefore, we performed an orthogonal projection of the E–W-trending traverses of the Chenab River and estimated an orogen-perpendicular drop of the Chenab across KZ2 (Fig. 8c). The truncated profile across KZ2 shows a drop of ∼230 m of the channel across an orogen-perpendicular run length of ∼5 km. The orogen-parallel stretch of the river exhibits narrow channel width (<30–35 m) through moderately hard HH bedrock (R value: 35–45). The tributaries within this stretch form a significant knickpoint at the confluence with the trunk stream (Fig. 3f). These field observations suggest recent rapid uplift of the western margin of the KW. The observed differential uplift of the KW margin is possibly related to either growth of the LH duplex in the core of the window or surface expression of another crustal ramp emerging from the MHT (Fig. 8d). Both the knickzones KZ1 and KZ2 are the most prominent disturbance in the longitudinal profile of the Chenab River and are interpreted to portray the spatial distribution of differential uplift due to tectonic deformation.
5.2 Temporal and spatial variation of fluvial incision across the KW
Bedrock incision in the Himalaya is not a continuous process and is rather controlled by temporal variations in sediment flux that usually dictate the thickness of the veneer above the bedrock surfaces over which the rivers flow. Late Pleistocene–Holocene sediment transport studies have suggested an overall climatic control on sediment aggradation in the interiors of the Himalayan orogen (e.g., Bookhagen et al., 2005; Scherler et al., 2015; Dey et al., 2016b) where stronger climatic conditions may increase the sediment supply and prompt filling of a river valley. Transiently stored valley fills are re-incised once the climate weakens. Often, the re-incision phases dissect the bedrock units and form strath surfaces. In the Chenab valley, we have documented several stages of valley fills and fluvial strath surfaces.
5.2.1 Sediment aggradation in the Chenab valley
The Chenab valley records a net sediment aggradation and transient filling of an entire drainage network in the vicinity of the KW since the onset of the last glacial–interglacial cycle (∼130 ka) until ∼80 ka. Fluvioglacial outwash sediments range from at least ∼110–130 ka, whereas the hillslope debris ranges from ∼90 to ∼80 ka (Table 2). The chronology of the sediments is in agreement with the overall stratigraphic order of the sediments across the KW. We observe net fluvial re-incision and formation of bedrock strath surfaces since ∼80 ka and formation of epigenetic gorges (Fig. 10).
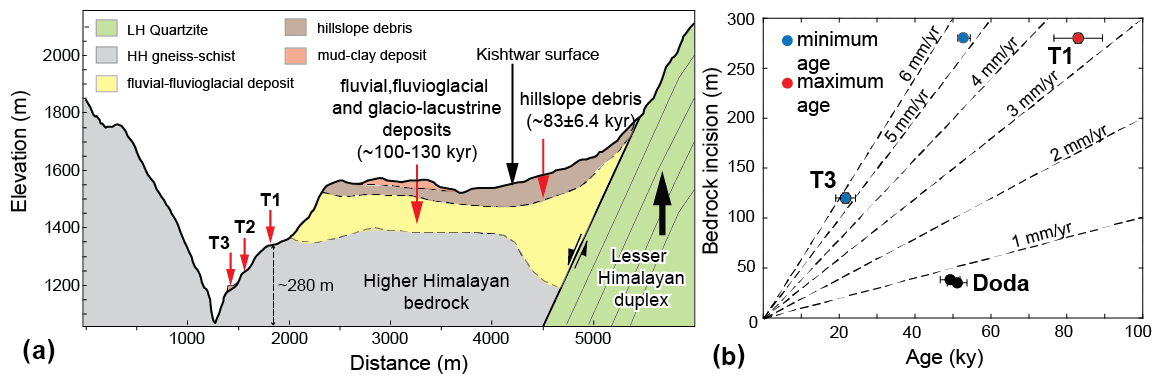
Figure 10(a) A topographic and geomorphic profile across the Chenab valley drawn over Kishtwar. The valley aggradation by fluvioglacial and hillslope debris sediments was succeeded by a fluvial incision, which penetrated through the unconsolidated sediments to a thickness of ∼140–150 m and incised Higher Himalayan bedrock by m, leaving behind at least three recognizable strath surfaces with a thin late Pleistocene sediment cover. The three strath surfaces are at 280±5 m (T1), ∼170 m (T2) and m (T3) heights from the present-day river. We assume that the present-day bedrock gorge has been carved since the deposition of the glacio-lacustrine sediment deposits (∼100–130 ka) and the hillslope debris (∼90–80 ka) onto the former fluvial strath surface of Higher Himalayan Bedrock. The width of the fluvial strath surface where Kishtwar is located indicates that the river network had been dammed earlier too. (b) Graphical representation of mean bedrock incision rates since 80 ka. Age constraints for T3 are shown in Fig. 4a. Based on the relative heights and depositional ages of late Pleistocene deposits, we propose a minimum and a maximum bedrock incision rate of 3.1–3.5 and 5.2–5.6 mm yr−1, respectively. In contrast, the bedrock incision rates calculated from bedrock straths further downstream from the KW range 0.7–0.8 mm yr−1.
5.2.2 Drainage reorganization and strath terrace formation along the Chenab River
Hillslope debris flow from the high-relief frontal horses of the Lesser Himalayan Duplex overlies the fluvioglacial sediments stored beneath the Kishtwar surface. We argue that the hillslope debris is from paleo-landslide deposits that intervened and dammed the paleo-drainage of the Chenab River, which might have been flowing through a more easterly path than now (Fig. 9). The Maru River, coming from the northwestern corner of our study area, also joined the Chenab River at a different location (Fig. 9). Our argument is supported by field observations of a thick silt–clay layer in the proposed paleo-valley of the Maru River (Fig. 9a, c). OSL sample K18 from the silt–clay layer is saturated and hence only provides the minimum age of 52±3 kyr. We suggest that the hillslope sediment flux dammed the flow of the Chenab River and also propagated through the aforementioned wind gap of the Maru River. The decline in the depositional energy resulted in a reduction of grain size. After the hillslope debris flow, the Chenab River also diverted to a new path. The new path of the Chenab River upstream from the confluence with the Maru River is defined by a very narrow channel flowing through the Higher Himalayan bedrock gorge (Fig. 7b). Downstream from the confluence, we are able to identify at least three levels of strath terraces lying at heights of ∼280–290 m (T1), ∼170 m (T2) and ∼120 m (T3) (Figs. 3g, 10a). Our field observations suggest that the formation of the straths is at least ∼52 kyr old. The luminescence chronology samples in this study belong to the ∼150–170 m thick soft sediments that are stored stratigraphically up from the T1 strath level. Our field observations and chronological estimates suggest that the renewed path of the Chenab River must have been formed after the hillslope debris flow at ∼80–90 ka but before 52 ka.
5.2.3 Knickpoint marking epigenetic gorge
Epigenetic gorges are common geomorphic features in a high-mountain landscape (Ouimet et al., 2008). Epigenetic gorges form when channels of a drainage system are transiently buried by sediment aggradation, and during subsequent re-incision, a new river channel, often into the neighboring bedrock, is incised. The N–S traverse of the Chenab River is largely affected by hillslope sediment flux (paleo-landslides and debris flow) from the steep eastern flank. The knickpoint KP4, situated near the village of Janwas, marks one such instance of an epigenetic gorge where the paleo-valley was initially filled by fluvioglacial sediments and the channel abandonment was caused by landslides and hillslope debris flow prior to 80 ka (Fig. 4b, c).
5.3 Rapid bedrock incision along the Chenab River on a late Pleistocene timescale
Considering the rate of excavation of softer sediments to be at least an order of magnitude higher than the rate of bedrock incision (Kothyari and Juyal, 2013; Sharma et al., 2016), we calculated the minimum bedrock incision rate at the western margin of the KW using the height of the T1 strath ( m) and the average age of the sediments from the hillslope debris flow deposit. It yields a minimum bedrock incision rate of ∼3.1–3.5 mm yr−1 over the last 80–90 kyr. Considering the saturated OSL sample from the paleo-valley, we estimated the maximum bedrock incision since 52 ka to be 5.1–5.5 mm yr−1. Similarly, using the minimum age estimate of the T3 terrace abandonment, we deduce a maximum bedrock incision rate of ∼5.7–6.1 mm yr−1 since ∼21 ka. However, further downstream, away from the KW, the average bedrock incision rate derived from dated strath surfaces ( m high from the Chenab River) near the town of Doda is 0.7±0.1 mm yr−1 (samples K01 and K06). We do not have bedrock incision rates from the core and the eastern margin of the KW, as the core is devoid of sediment storage, the eastern margin is filled with fluvioglacial sediments and the river is incising the fill. Nonetheless, these results indicate that despite transient choking of the drainage network by sediments during times of valley aggradation, the topography experienced high incision when sediment coverage was completely penetrated and bedrock straths were created after the renewal of the fluvial flow.
5.4 Our new results in context with previously published data
AFT cooling ages by Kumar et al. (1995) showcased young cooling ages from the core of the KW and its western margin (AFT ages: ∼2–3 Myr) compared to the surroundings (AFT age: 6–12 Myr). The calculated high exhumation rates proposed by Gavillot et al. (2018) are based on using a geothermal gradient of 35–40∘ C km−1 in Dodson's equation assuming a 1-D model (Dodson, 1973). Additional data and thermal modeling are needed across the KW to constrain the exhumation rates from vertical transects. However, lateral similarities of the regional topography and age patterns along the Sutlej area, in the Beas valley and the Dhauladhar Range (Thiede et al., 2009, 2017; Stübner et al., 2018) have yielded similar exhumation rates in the range of 2–3 mm yr−1. Long-term exhumation rates from the NW Himalaya agree well with findings of Nennewitz et al. (2018), who correlated the young thermochron ages with high basin-wide ksn values, suggesting high uplift rates over intermediate to longer timescales. Although the geomorphic implications for landscape evolution provide resolution at shorter timescales than low-T thermochron studies, our field observations and analysis support protracted long-term uplift rates across the KW. Interestingly, exhumation rates in the steepened stretches are nearly 1 order of magnitude higher than that of the Higher Himalayan units in the klippe. Our estimates of SSP also reflect an increase by ∼5 times within the steepened stretches.
5.5 Two competing models: duplex growth model vs. out-of-sequence fault ramp model
Deeply incised channel morphology and steep channel gradients marked by knickpoints at the upstream reaches in and around the KW could be explained by the presence of at least two orogen-parallel mid-crustal ramps on the MHT (Fig. 8d). Existence of two mid-crustal ramps has already been shown through sequential balanced cross sections for the last 10 Myr across the Kashmir Himalaya (Gavillot et al., 2018). The study by Gavillot et al. (2018) focused on the duplex growth model as the balanced cross section portrays several LH nappes stacked together (Fig. 8d). Translation on the MHT can impart differential uplift of the LH duplex across the two mid-crustal ramps as ramps would show higher uplift and exhumation due to a higher angle of the dip of the floor thrust of the duplex. Here we provide more detailed information on the spatial distribution of active differential uplift across the KW (Fig. 8a, d). Our field observations question the existence of multiple nappes forming a duplex (Gavillot et al., 2018) and rather favor anticlinal doming of the pervasively deformed Chail nappe, as suggested by Fuchs (1975) and Stephenson et al. (2000). We observe pronounced deformation at the core of the KW (Fig. 2d, e), suggesting that this could be related to active faulting, crustal buckling or internal folding, which maintains continuous rock uplift, forcing the Chenab River to incise and maintain the steepened stretch of KZ1. Gavillot et al. (2018) proposed that translation on a mid-crustal ramp of the MHT and not surface faulting is driving the uplift at the core of the KW (Fig. 8d). We provide an alternative explanation for the observed steep stream segment at the core of the KW. We speculate the existence of a crustal fault ramp emerging from the MHT that triggers rapid exhumation of the hanging wall. In that case, out-of-sequence faulting causes high relief, steep channel gradients and higher basin-wide steepness indices over the ramp (Fig. 7). Similar ramps have been proposed on the MBT beneath the Dhauladhar Range (Thiede et al., 2017) and in the east of the NW Himalaya (Caldwell et al., 2013; Mahesh et al., 2015; Stübner et al., 2018; Yadav et al., 2019). A similar mid-crustal ramp (MCR-2) has been proposed for the western margin of the KW by Gavillot et al. (2018). We do not have any direct field evidence of regional surface-breaking faults which could be related to KZ2. However, rapid fluvial incision, an increase in SSP and channel steepness probably justify the existence of either a mid-crustal ramp or an out-of-sequence surface-breaking fault.
Detailed structural mapping and morphometric analysis using high-resolution DEM provide important constraints on the spatial extent of deformation. We are able to resolve the high-relief Kishtwar Window and the surroundings into two major, steep orogen-parallel belts and zones (Fig. 5e, d): one at the core of the KW could be an active high-angle fault ramp emerging from the MHT or a crustal ramp, and the other observed along the western margin of the KW could be another ramp on the MHT or a surface-breaking back-thrust evolving in relation to the growth of the LH duplex. More importantly, we demonstrate that the Kishtwar Window is still growing and could therefore be a potential source of future seismic activity.
Our field observations and the characteristics of terrain morphology match the spatial pattern of previously published thermochronological data well and indicate that the Kishtwar Window is undergoing tectonic deformation, uplift and exhumation at present on late Pleistocene–Holocene timescales; it has also done so in the geological past since at least the late Miocene. By compiling our new results and published records, we favor the following conclusions.
-
The Chenab River maintains an over-steepened bedrock channel and a low channel width irrespective of lithological variations across the KW and beyond, suggesting ongoing rapid fluvial incision related to active tectonic rock uplift.
-
Our field observations, morphometric analysis and rock strength measurements document at least two of these major knickzones with steep longitudinal gradients on the trunk stream as non-lithologic and likely related to differential rock uplift. The incision potential (specific stream power) in the steepened stretches is ∼4–5 times higher than the surroundings.
-
The differential uplift can be explained either by slip on the multiple ramps on the MHT and exhumation of the duplex floor thrust or by a combination of slip on the MHT ramp and active out-of-sequence faulting. As of now, we do not have any evidence for large-scale out-of-sequence faulting.
-
Luminescence chronology of the transiently stored sediments along the Chenab River suggests that the valley was overfilled by sediments of fluvioglacial origin and by hillslope sediment flux. Massive sediment aggradation during ∼130–80 kyr led to drainage reorganization and bedrock incision, leaving behind strath surfaces.
-
The late Quaternary bedrock incision rates near the western margin of the KW are high at 3.1–3.6 mm yr−1, while away from the KW, the incision rates are low (<1 mm yr−1).
To summarize, our new study reinforces the importance of detailed field observations and morphometric analysis in understanding the neotectonic framework of the interiors of the Himalaya. With additional chronological evidence from transiently stored sediments, we showcase high rates of bedrock incision in the interior of the western Himalaya, which could potentially be indicative of tectonic control on landscape evolution. However, to solve the debate related to ongoing duplex growth vs. active out-of-sequence faulting, we would require more field data on active structures and chronological constraints on deformation rates across potentially active structures.
The authors used open-source codes from TopoToolbox and the Topographic Analysis Kit for this study.
Field data are provided in Sect. S1. Additional data on luminescence dating can be provided on request.
Samples used for luminescence dating have mostly been destroyed and are therefore not able to be shared.
Additional maps and figures on morphometric analysis and luminescence dating are listed in Sect. S1. Data on rock strength measurements are provided in Table S1. Luminescence sample processing is elaborated in Sect. S2. The supplement related to this article is available online at: https://doi.org/10.5194/esurf-9-463-2021-supplement.
SD, the first author, led this work and completed the fieldwork, sample processing, measurements and writing of this paper. RT helped in fieldwork, discussion and writing of this paper. AB performed the initial morphometric analysis. NC helped in the measurement of luminescence signals and assessment of the data. PC performed the channel width calculations and compiled the rock strength measurements. VJ helped with the discussion and writing of the paper.
The authors declare that there is no conflict of interest.
We thank Manoj Kumar Jaiswal and Mahadev Rawat for providing the elemental analysis. We thank Shambhu Das, Avi Das, Niklas Schaaf, Akashsingh Rajput and Chamel Singh for their assistance during fieldwork. We also thank Soumyajit Mukherjee, Rahul Kaushal and Shantamoy Guha for scientific inputs and comments on this paper. We acknowledge Adam Forte, Yann Gavillot, Stefan Hergarten and one anonymous reviewer for their constructive and insightful reviews. We would like to thank the editors, Richard Gloaguen and Aaron Joshua West, for their generous help during the review process.
This research has been supported by the Department of Science and Technology, Ministry of Science and Technology, India (grant no. DST/INSPIRE/04/2017/003278), and the Indian Institute of Technology Gandhinagar (grant no. IP/IITGN/ES/SD/201718-01). Rasmus C. Thiede is supported by the German Science Foundation (grant nos. DFG TH 1317-8 and DFG TH 1317-9).
This paper was edited by Richard Gloaguen and reviewed by Stefan Hergarten, Adam Forte, and Yann Gavillot.
Bagnold, R. A.: An approach to the sediment transport problem from general physics, US government printing office, Washington, USA, https://doi.org/10.3133/pp422I, 1966.
Bailey, R. M. and Arnold, L. J.: Statistical modelling of single grain quartz De distributions and an assessment of procedures for estimating burial dose, Quaternary Sci. Rev., 25, 2475–2502, 2006.
Bhatia, T. R., and Bhatia, S. K.: Sedimentology of the slate belt of Ramban-Banihal area, Kashmir Himalaya, Himal. Geol., 3, 116–134, 1973.
Bollinger, L., Henry, P., and Avouac, J. P.: Mountain building in the Nepal Himalaya: Thermal and kinematic model, Earth Planet Sci. Lett., 244, 58–71, https://doi.org/10.1016/j.epsl.2006.01.045, 2006.
Bookhagen, B., and Burbank, D. W.: Topography, relief, and TRMM-derived rainfall variations along the Himalaya, Geophys. Res. Lett., 33, L08405, https://doi.org/10.1029/2006GL026037, 2006.
Bookhagen, B., Thiede, R. C., and Strecker, M. R.: Late Quaternary intensified monsoon phases control landscape evolution in the northwest Himalaya, Geology, 33, 149–152, https://doi.org/10.1130/G20982.1, 2005.
Burgess, W. P., Yin, A., Dubey, C. S., Shen, Z. K., and Kelty, T. K.: Holocene shortening across the Main Frontal Thrust zone in the eastern Himalaya, Earth Planet Sci. Lett., 357, 152–167, https://doi.org/10.1016/j.epsl.2012.09.040, 2012.
Caldwell, W. B., Klemperer, S. L., Lawrence, J. F., and Rai, S. S.: Characterizing the Main Himalayan Thrust in the Garhwal Himalaya, India with receiver function CCP stacking, Earth Planet Sci. Lett., 367, 15–27, https://doi.org/10.1016/j.epsl.2013.02.009, 2013.
Chauhan, N. and Singhvi, A. K.: Distribution in SAR palaeodoses due to spatial heterogeniety of natural beta dose, Geochronometria, 38, 190–198, 2011.
Cunningham, A. C. and Wallinga, J.: Realizing the potential of fluvial archives using robust OSL chronologies, Quat. Geochronol., 12, 98–106, 2012.
DeCelles, P. G., Robinson, D. M., Quade, J., Ojha, T. P., Garzione, C. N., Copeland, P., and Upreti, B. N.: Stratigraphy, structure, and tectonic evolution of the Himalayan fold-thrust belt in western Nepal, Tectonics, 20, 487–509, https://doi.org/10.1029/2000TC001226, 2001.
Deeken, A., Thiede, R. C., Sobel, E. R., Hourigan, J. K., and Strecker, M. R.: Exhumational variability within the Himalaya of northwest India. Earth Planet Sci. Lett., 305, 103–114, https://doi.org/10.1016/j.epsl.2011.02.045, 2011.
Dey, S., Thiede, R. C., Schildgen, T. F., Wittmann, H., Bookhagen, B., Scherler, D., and Strecker, M. R.: Holocene internal shortening within the northwest Sub-Himalaya: Out-of-sequence faulting of the Jwalamukhi Thrust, India, Tectonics, 35, 2677–2697, https://doi.org/10.1002/2015TC004002, 2016a.
Dey, S., Thiede, R. C., Schildgen, T. F., Wittmann, H., Bookhagen, B., Scherler, D., Jain, V., and Strecker, M. R.: Climate-driven sediment aggradation and incision since the late Pleistocene in the NW Himalaya, India, Earth Planetary Sci. Lett., 449, 321–331, https://doi.org/10.1016/j.epsl.2016.05.050, 2016b.
DiPietro, J. A. and Pogue, K. R.: Tectonostratigraphic subdivisions of the Himalaya: A view from the west, Tectonics, 23, TC5001, https://doi.org/10.1029/2003TC001554, 2004.
Dodson, M. H.: Closure temperature in cooling geochronological and petrological systems, Contrib. Mineral. Petr., 40, 259–274, https://doi.org/10.1007/BF00373790, 1973.
Durcan, J. A., King, G. E., and Duller, G. A.: DRAC: Dose Rate and Age Calculator for trapped charge dating, Quat. Geochronol., 28, 54–61, 2015.
Elliott, J. R., Jolivet, R., González, P. J., Avouac, J. P., Hollingsworth, J., Searle, M. P., and Stevens, V. L.: Himalayan megathrust geometry and relation to topography revealed by the Gorkha earthquake, Nat. Geosci., 9, 174–180, https://doi.org/10.1038/ngeo2623, 2016.
Eugster, P., Scherler, D., Thiede, R. C., Codilean, A. T., and Strecker, M. R.: Rapid Last Glacial Maximum deglaciation in the Indian Himalaya coeval with midlatitude glaciers: New insights from 10Be-dating of ice-polished bedrock surfaces in the Chandra Valley, NW Himalaya, Geophys. Res. Lett., 43, 1589–1597, https://doi.org/10.1002/2015GL066077, 2016.
Finnegan, N. J., Roe, G., Montgomery, D. R., and Hallet, B.: Controls on the channel width of rivers: Implications for modelling fluvial incision of bedrock, Geology, 33, 229–232, https://doi.org/10.1130/G21171.1, 2005.
Flint, J. J.: Stream gradient as a function of order, magnitude, and discharge, Water Resour. Res., 10, 969–973, https://doi.org/10.1029/WR010i005p00969, 1974.
Forte, A. M. and Whipple, K. X.: Short communication: The Topographic Analysis Kit (TAK) for TopoToolbox, Earth Surf. Dynam., 7, 87–95, https://doi.org/10.5194/esurf-7-87-2019, 2019.
Frank, W., Grasemann, B., Guntli, P., and Miller, C.: Geological map of the Kishtwar-Chamba-Kulu region (NW Himalayas, India), Jahrbuch der Geologischen Bundesanstalt, 138, 299–308, 1995.
Fuchs, G.: Contributions to the geology of the North-Western Himalayas, Geologische Bundesanstalt, Vienna, Austria, 1975.
Fuchs, G.: Outline of the geology of the Himalaya, Mitt. osterr. geol. Ges, 74, 101–127, 1981.
Gavillot, Y., Meigs, A. J., Sousa, F. J., Stockli, D., Yule, D., and Malik, M.: Late Cenozoic Foreland-to-Hinterland Low-Temperature Exhumation History of the Kashmir Himalaya, Tectonics, 37, 3041–3068, https://doi.org/10.1029/2017TC004668, 2018.
Gavillot, Y., Meigs, A., Yule, Y., Heermance, R., Rittenour, T., Madugo, C., and Malik, M.: Shortening rate and Holocene surface rupture on the Riasi fault system in the Kashmir Himalaya: Active thrusting within the Northwest Himalayan orogenic wedge, Geol. Soc. Am. Bull., 128, 1070–1094, https://doi.org/10.1130/B31281.1, 2016.
Herman, F., Copeland, P., Avouac, J.P., Bollinger, L., Mahéo, G., Le Fort, P., Rai, S., Foster, D., Pêcher, A., Stüwe, K., and Henry, P.: Exhumation, crustal deformation, and thermal structure of the Nepal Himalaya derived from the inversion of thermochronological and thermobarometric data and modeling of the topography, J. Geophy. Res.-Sol. Ea., 115, B06407, https://doi.org/10.1029/2008JB006126, 2010.
Huntley, D. J. and Lamothe, M.: Ubiquity of anomalous fading in K-feldspars and the measurement and correction for it in optical dating, Can. J. Earth Sci., 38, 1093–1106, 2001.
Jain, A. K., Kumar, D., Singh, S., Kumar, A., and Lal, N.: Timing, quantification and tectonic modelling of Pliocene–Quaternary movements in the NW Himalaya: evidence from fission track dating, Earth Planet. Sci. Lett., 179, 437–451, 2000.
Kaushal, R. K., Singh, V., Mukul, M., and Jain, V.: Identification of deformation variability and active structures using geomorphic markers in the Nahan salient, NW Himalaya, India. Quat. Int., 462, 194–210, https://doi.org/10.1016/j.quaint.2017.08.015, 2017.
Kirby, E. and Whipple, K. X.,: Expression of active tectonics in erosional landscapes, J. Struct Geol., 44, 54–75, 2012.
Kothyari, G. C. and Juyal, N.: Implications of fossil valleys and associated epigenetic gorges in parts of Central Himalaya, Curr. Sci., 383–388, 2013.
Kumar, A., Lal, N., Jain, A. K., and Sorkhabi, R. B.: Late Cenozoic–Quaternary thermo-tectonic history of Higher Himalayan Crystalline (HHC) in Kishtwar–Padar–Zanskar region, NW Himalaya: Evidence from fission-track ages, J. Geol. Soc. India, 45, 375–391, 1995.
Lavé, J. and Avouac, J. P.: Active folding of fluvial terraces across the Siwaliks Hills, Himalayas of central Nepal., J. Geophys. Res.-Sol. Ea., 105, 5735–5770, https://doi.org/10.1029/1999JB900292, 2000.
Mahesh, P., Gupta, S., Saikia, U., and Rai, S. S.: Seismotectonics and crustal stress field in the Kumaon-Garhwal Himalaya, Tectonophysics, 655, 124–138, https://doi.org/10.1016/j.tecto.2015.05.016, 2015.
Malik, J. N. and Mohanty, C.: Active tectonic influence on the evolution of drainage and landscape: geomorphic signatures from frontal and hinterland areas along the Northwestern Himalaya, India, J. Asian Earth Sci., 29, 604–618, https://doi.org/10.1016/j.jseaes.2006.03.010, 2007.
Mitra, G., Bhattacharyya, K., and Mukul, M.: The lesser Himalayan duplex in Sikkim: implications for variations in Himalayan shortening, J. Geol. Soc. India, 75, 289–301, https://doi.org/10.1007/s12594-010-0016-x, 2010.
Mukherjee S.: A review on out-of-sequence deformation in the Himalaya, in: Tectonics of the Himalaya, edited by: Mukherjee, S., Carosi, R., van der Beek, P., Mukherjee, B. K., and Robinson, D., Geol. Soc. Lond. Spec. Publ., 412, 67–109, https://doi.org/10.1144/SP412.13, 2015.
Nábělek, J., Hetényi, G., Vergne, J., Sapkota, S., Kafle, B., Jiang, M., Su, H., Chen, J., and Huang, B. S.: Underplating in the Himalaya-Tibet collision zone revealed by the Hi-CLIMB experiment, Science, 325, 1371–1374, https://doi.org/10.1126/science.1167719, 2009.
Nennewitz, M., Thiede, R. C., and Bookhagen, B.: Fault activity, tectonic segmentation, and deformation pattern of the western Himalaya on Ma timescales inferred from landscape morphology, Lithosphere, 10, 632–640, https://doi.org/10.1130/L681.1, 2018.
Ni, J. and M. Barazangi: Seismotectonics of the Himalayan collision zone: Geometry of the underthrusting Indian plate beneath the Himalaya, J. Geophys. Res., 89, 1147–1163, https://doi.org/10.1029/JB089iB02p01147, 1984.
Niedzielski, T., Migoń, P., and Placek, A.,: A minimum sample size required from Schmidt hammer measurements, Earth Surf. Proc. Land., 34, 1713–1725, 2009.
Norin, E.: The relief chronology of the Chenab valley, Geogr. Ann., 8, 284–300, 1926.
Olley, J., Caitcheon, G., and Murray, A.,: The distribution of apparent dose as determined by optically stimulated luminescence in small aliquots of fluvial quartz: implications for dating young sediments, Quaternary Sci. Rev., 17, 1033–1040, 1998.
Owen, L. A., Finkel, R. C., and Caffee, M. W.,: A note on the extent of glaciation throughout the Himalaya during the global Last Glacial Maximum, Quaternary Sci. Rev., 21, 147–157, 2002.
Ouimet, W. B., Whipple, K. X., Crosby, B. T., Johnson, J. P., and Schildgen, T. F.: Epigenetic gorges in fluvial landscapes, Earth Surf. Processes, 33, 1993–2009, https://doi.org/10.1002/esp.1650, 2008.
Pant, R. K., Juyal, N., Basavaiah, N., and Singhvi, A. K.: Late Quaternary glaciation and seismicity in the Higher Central Himalaya: evidence from Shalang basin (Goriganga), Uttaranchal, Curr. Sci., 1500–1505, 2006.
Powers, P. M., Lillie, R. J., and Yeats, R. S.: Structure and shortening of the Kangra and Dehra Dun reentrants, sub-Himalaya, India. Geol. Soc. Am. Bull., 110, 1010–1027, https://doi.org/10.1130/0016-7606(1998)110<1010:SASOTK>2.3.CO;2, 1998.
Preusser, F.: IRSL dating of K-rich feldspars using the SAR protocol: comparison with independent age control, Ancient TL, 21, 17–23, 2003.
Robert, X., Van Der Beek, P., Braun, J., Perry, C., Dubille, M., and Mugnier, J. L.: Assessing Quaternary reactivation of the Main Central thrust zone (central Nepal Himalaya): New thermochronologic data and numerical modeling, Geology, 37, 731–734, https://doi.org/10.1130/G25736A.1, 2009.
Roberts, H. M.: Assessing the effectiveness of the double-SAR protocol in isolating a luminescence signal dominated by quartz, Radiat. Meas., 42, 1627–1636, 2007.
Robinson, D. M. and Martin, A. J.: Reconstructing the Greater Indian margin: A balanced cross section in central Nepal focusing on the Lesser Himalayan duplex, Tectonics, 33, 2143–2168, https://doi.org/10.1002/2014TC003564, 2014.
Royden, L. and Taylor Perron, J.: Solutions of the stream power equation and application to the evolution of river longitudinal profiles, J. Geophys. Res.-Earth, 118, 497–518, https://doi.org/10.1002/jgrf.20031, 2013.
Google earth v. 9.135.0.3., Kishtwar, India, 33∘13′1′′ N, 76∘07′54′′E, Eye alt, 1950 m, DigitalGlobe 2019, available at: http://www.earth.google.com, last access: 27 January 2020.
Scherler, D., Bookhagen, B., Wulf, H., Preusser, F., and Strecker, M. R.: Increased late Pleistocene erosion rates during fluvial aggradation in the Garhwal Himalaya, northern India, Earth Planet Sci. Lett., 428, 255–266, https://doi.org/10.1016/j.epsl.2015.06.034, 2015.
Schwanghart, W. and Scherler, D.: Short Communication: TopoToolbox 2 – MATLAB-based software for topographic analysis and modeling in Earth surface sciences, Earth Surf. Dynam., 2, 1–7, https://doi.org/10.5194/esurf-2-1-2014, 2014.
Searle, M. P., Stephenson, B., Walker, J., and Walker, C.: Restoration of the Western Himalaya: implications for metamorphic protoliths, thrust and normal faulting, and channel flow models, Episodes, 30, 242–257, https://doi.org/10.18814/epiiugs/2007/v30i4/001, 2007.
Seeber, L. and Gornitz, V.: River profiles along the Himalayan arc as indicators of active tectonics, Tectonophysics, 92, 335–367, https://doi.org/10.1016/0040-1951(83)90201-9, 1983.
Sharma, S., Bartarya, S. K., and Marh, B. S.: The role of pre-existing topography in the evolution of post-glacial fluvial landforms in the middle Satluj valley, north-western Himalaya, India, Quatern, Int., 425, 399–415, https://doi.org/10.1016/j.quaint.2016.08.015, 2016.
Singhvi, A. K., Williams, M. A. J., Rajaguru, S. N., Misra, V. N., Chawla, S., Stokes, S., Chauhan, N., Francis, T., Ganjoo, R. K., and Humphreys, G. S.: A ∼200 ka record of climatic change and dune activity in the Thar Desert, India, Quaternary Sci. Rev., 29, 3095–3105, 2010.
Steck, A.: Geology of the NW Indian Himalaya, Eclogae Geol. Helv., 96, 147–196, 2003.
Stephenson, B. J., Waters, D. J., and Searle, M. P.: Inverted metamorphism and the Main Central Thrust: field relations and thermobarometric constraints from the Kishtwar Window, NW Indian Himalaya, J. of Metamorph. Geol., 18, 571–590, https://doi.org/10.1046/j.1525-1314.2000.00277.x, 2000.
Stübner, K., Grujic, D., Dunkl, I., Thiede, R., and Eugster, P.: Pliocene episodic exhumation and the significance of the Munsiari thrust in the northwestern Himalaya, Earth Planet Sci. Lett., 481, 273–283, https://doi.org/10.1016/j.epsl.2017.10.036, 2018.
Thakur, V. C. (Ed.): Geology of western Himalaya, Pergamon Press, Oxford, United Kingdom, 19, 1–355, 1992.
Thakur, V. C., Joshi, M., Sahoo, D., Suresh, N., Jayangondapermal, R., and Singh, A.: Partitioning of convergence in Northwest Sub-Himalaya: estimation of late Quaternary uplift and convergence rates across the Kangra reentrant, North India. Int. J. Earth Sci., 103, 1037–1056, https://doi.org/10.1007/s00531-014-1016-7, 2014.
Thiede, R., Robert, X., Stübner, K., Dey, S., and Faruhn, J.: Sustained out-of-sequence shortening along a tectonically active segment of the Main Boundary thrust: The Dhauladhar Range in the northwestern Himalaya, Lithosphere, 9, 715–725, https://doi.org/10.1130/L630.1, 2017.
Thiede, R. C., Bookhagen, B., Arrowsmith, J. R., Sobel, E. R., and Strecker, M. R.: Climatic control on rapid exhumation along the southern Himalayan, Front. Earth Planet Sci. Lett., 222, 791–806, https://doi.org/10.1016/j.epsl.2004.03.015, 2004.
Thiede, R. C., Ehlers, T. A., Bookhagen, B., and Strecker, M. R.: Erosional variability along the northwest Himalaya, J. Geophys. Res.-Earth, 114, F01015, https://doi.org/10.1029/2008JF001010, 2009.
Turowski, J. M., Lague, D., and Hovius, N.: Response of bedrock channel width to tectonic forcing: Insights from a numerical model, theoretical considerations, and comparison with field data, J. Geophys. Res. Earth, 114, https://doi.org/10.1029/2008JF001133, 2009.
ul Haq, A., Pandita, S. K., Singh, Y., Bhat, G. M., Pandey, S. J., Singh, A., Verma, M., and Bansal, B. K.: Evidence of Active Tectonic Deformation in Kishtwar Area, Jammu and Kashmir, Northwest Himalaya, India, J. Geol. Soc. India, 93, 331–342, https://doi.org/10.1007/s12594-019-1181-1, 2019.
van der Beek, P., Litty, C., Baudin, M., Mercier, J., Robert, X., and Hardwick, E.: Contrasting tectonically driven exhumation and incision patterns, western versus central Nepal Himalaya, Geology, 44, 327–330, 2016.
Vannay, J. C., Grasemann, B., Rahn, M., Frank, W., Carter, A., Baudraz, V., and Cosca, M.: Miocene to Holocene exhumation of metamorphic crustal wedges in the NW Himalaya: Evidence for tectonic extrusion coupled to fluvial erosion, Tectonics, 23, TC1014, https://doi.org/10.1029/2002TC001429, 2004.
Vassallo, R., Mugnier, J. L., Vignon, V., Malik, M. A., Jayangondaperumal, R., Srivastava, P., and Carcaillet, J.: Distribution of the late-Quaternary deformation in northwestern Himalaya, Earth Planet Sci. Lett., 411, 241–252, https://doi.org/10.1016/j.epsl.2014.11.030, 2015.
Wadia, D. N.: The Cambrian-Trias sequence of north-western Kashmir (parts of Muzaffarabad and Baramula districts), Records of the Geological Survey of India, 68, 121–176, 1934.
Webb, A. A. G., Yin, A., Harrison, T. M., Célérier, J., Gehrels, G. E., Manning, C. E., and Grove, M.: Cenozoic tectonic history of the Himachal Himalaya (northwestern India) and its constraints on the formation mechanism of the Himalayan orogen, Geosphere, 7, 1013–1061, https://doi.org/10.1130/GES00627.1, 2011.
Wesnousky, S. G., Kumar, S., Mohindra, R., and Thakur, V. C.: Uplift and convergence along the Himalayan Frontal Thrust of India, Tectonics, 18, 967–976, https://doi.org/10.1029/1999TC900026, 1999.
Whipple, K. X. and Tucker, G. E.: Dynamics of the stream-power river incision model: Implications for height limits of mountain ranges, landscape response timescales, and research needs, J. Geophys. Res.-Sol. Ea., 104, 17661–17674, https://doi.org/10.1029/1999JB900120, 1999.
Whipple, K. X., Shirzaei, M., Hodges, K. V., and Arrowsmith, J. R.: Active shortening within the Himalayan orogenic wedge implied by the 2015 Gorkha earthquake, Nat. Geosci., 9, 711–716, https://doi.org/10.1038/ngeo2797, 2016.
Wobus, C. W., Hodges, K. V., and Whipple, K. X.: Has focused denudation sustained active thrusting at the Himalayan topographic front?, Geology, 31, 861–864, https://doi.org/10.1130/G19730.1, 2003.
Wobus, C., Whipple, K. X., Kirby, E., Snyder, N., Johnson, J., Spyropolou, K., Crosby, B., Sheehan, D., and Willett, S. D.: Tectonics from topography: Procedures, promise, and pitfalls, Geol. Soc. Am. Spec. Pap., 398, 55–74, https://doi.org/10.1130/2006.2398(04), 2006.
Yadav, R. K., Gahalaut, V. K., Bansal, A. K., Sati, S., Catherine, J., Gautam, P., Kumar, K., and Rana, N.: Strong seismic coupling underneath Garhwal–Kumaun region, NW Himalaya, India, Earth Planet Sci. Lett., 506, 8–14, https://doi.org/10.1016/j.epsl.2018.10.023, 2019.
Yin, A. and Harrison, T. M.: Geologic evolution of the Himalayan-Tibetan orogen, Annu. Rev. Earth Planet. Sci., 28, 211–280, https://doi.org/10.1146/annurev.earth.28.1.211, 2000.
- Abstract
- Introduction
- Geological background
- Methods of morphometric analysis and field data collection
- Results
- Discussion
- Conclusions
- Code availability
- Data availability
- Sample availability
- Author contributions
- Competing interests
- Acknowledgements
- Financial support
- Review statement
- References
- Supplement