the Creative Commons Attribution 4.0 License.
the Creative Commons Attribution 4.0 License.
 | 29 Jul 2021
Tectonically and climatically driven mountain-hopping erosion in central Guatemala from detrital 10Be and river profile analysis
Jane Kathrin Willenbring
Tristan Salles
Michael Cosca
Axel Guttiérez-Orrego
Noé Cacao Chiquín
Sergio Morán-Ical
Christian Teyssier
The rise of a mountain range affects moisture circulation in the atmosphere and water runoff across the land surface, modifying the distribution of precipitation and drainage patterns in its vicinity. Water routing in turn affects erosion on hillslopes and incision in river channels on surrounding mountain ranges. In central Guatemala, two parallel, closely spaced mountain ranges formed during two consecutive pulses of uplift, the first between 12 and 7 Ma (Sierra de Chuacús–Sierra de las Minas), and the second after 7 Ma (Altos de Cuchumatanes). We explore the climatic and tectonic processes through which the rise of the most recent range drove the slowing of river incision and hillslope erosion over the previously uplifted range. The 40Ar/39Ar dating of perched volcanic deposits documents the sequential rise and incision of these mountain ranges. Terrestrial cosmogenic 10Be in river sediments indicates that currently hillslopes in the older range erode more slowly than in the younger range (20–150 vs. 300 m Myr−1). These differences mimic the current distribution of precipitation, with the younger range intercepting the atmospheric moisture before it reaches the older range. River channel steepness and deformation of paleovalleys in the new range further indicate that the younger range has been rising faster than the older range up to today. We review how atmospheric moisture interception and river long-profile adjustment to the rise of the new range have contributed to the decline of erosion rates over the old range. We also explore the consequences of this decline and of aridification on the topographic evolution of the older range. The older range undergoes a slow topographic decay, dominated by backwearing, by the stacking of slowly migrating erosion waves along the mountain flanks, and by the formation of pediments around its base. The morphology of the old range is therefore transitioning from that of a front range to that of a dry interior range.
- Article
(30548 KB) - Full-text XML
-
Supplement
(4182 KB) - BibTeX
- EndNote


A mountain range affects both the circulation of atmospheric moisture around its relief and the flow of precipitated water over the land surface on its slope and in the vicinity. Moisture rises and precipitates on its windward side, while rain shadows tend to be cast over its lee-side and over the land surface located downwind (e.g., Meijers et al., 2018; Galewsky, 2009). Once precipitated, the fraction of water that runs off as overland flow drives hillslope erosion and river incision. River drainages are dynamic systems that can transmit forcing along drainage lines in both the downstream and upstream directions. Changes in climate and vegetation modulate hillslope erosion, and these changes are then transmitted to rivers from the headwaters downstream. Conversely, changes affecting downstream river reaches, such as the adjustment of river gradient to the rise of mountain ranges or to variations in sea level, can be transmitted upstream along river channels (Humphrey and Heller, 1995; Whittaker and Boulton, 2012). From there, they are transmitted uphill along valley slopes (Harvey, 2002; Mudd and Furbish, 2007). Mountain ranges affect the erosion of surrounding reliefs through this combination of top-down and bottom-up processes.
The growth of contractional orogens commonly involves the outward, sequential propagation of contraction, and the formation of successive, in-sequence mountain ranges. Moisture, by contrast, is commonly advected in the opposite direction, from the forelands to the orogen interiors. Precipitated water is then commonly returned to the foreland by river networks that flow from the orogen interiors to the forelands. The rise of front ranges therefore commonly takes place both upwind and downstream of preexisting ranges, driving the aridification of previously uplifted ranges (Garcia-Castellanos, 2007). The new front ranges will also affect the rivers that drain the previously uplifted ranges toward the forelands. These rivers will adjust to enhanced rock uplift by enhanced incision through the steepening of their gradient in areas of enhanced uplift (Leland et al., 1998). This steepening is accompanied by a transient decrease in incision rate upstream of the rising ranges (Champel et al., 2002). In some cases, the topography and underlying tectonic structure will respond fast enough to reach a new dynamic equilibrium between relief, climate, and tectonics (Willett and Brandon, 2002; Whipple and Meade, 2006) without any substantial alteration of the drainage network. In other cases, however, the range-transverse river networks will experience reorganization before the equilibrium is reached (Jackson et al., 2002; van der Beek et al., 2002; Brocard et al., 2012). In a few cases, the slowing down of landscape response time, as a result of aridification, upstream and downwind of the rising ranges will even lead to the disintegration of river drainages and to the topographic decay of interior ranges. This evolution characterizes the nucleation and growth of orogenic plateaus formed by lateral accretion (Sobel et al., 2003; Garcia-Castellanos, 2007). These different evolutionary pathways have been explored at the scale of entire orogens. They are, however, seldom documented at the scale of individual mountain ranges because their manifestation at that scale is harder to separate from more local signals driven by spatial variations in bedrock erodibility, stochastic processes (e.g., landslides), and topographic inheritance.
We document here how the rise of a recent mountain range (the 170 km long Altos de Cuchumatanes, AC, range) affected the topographic evolution of a nearby, older range (the 220 km long Sierra de Chuacús–Sierra de las Minas, SC-SM, range) in Guatemala (Fig. 1). Sharp topographic, climatic, and tectonic gradients in this region exert themselves over a relatively small (350×100 km) area, allowing a detailed investigation of the interactions between the two ranges. The SC-SM range started to rise first in early late Miocene time, when its flanks were deeply eroded (Brocard et al., 2011). The AC range, on the other hand, started to grow in the latest Miocene, next to the SC-SM range. The rise of the AC range sparked widespread drainage rearrangement in front of the SC-SM range during the late Miocene (Brocard et al., 2011). Numerous captures occurred during this event. Interestingly, these captures did not generate upstream-migrating waves of accelerated erosion. On the contrary: river incision stalled upstream of the capture sites (Brocard et al., 2011). We seek to identify the processes that arrested river incision and retrieve, from the characteristics of river long-profiles, insights into how arrested incision influenced the topographic evolution of the SC range.
New 40ArAr ages on volcanic rocks are used first to tighten the chronology of river incision and surface uplift of the SC-SM range. Detrital terrestrial 10Be erosion rates then provide a snapshot of current spatial variations in hillslope erosion rates in the SC-SM and AC ranges. Profile linearization is implemented to study the complex long-profiles of the rivers that drain these ranges. River knickpoints are extracted and then classified in order to identify river knickpoints that transmit the long-term landscape response of the drainage to the sequential uplift of the two ranges. We then discuss the respective contribution of topographically controlled climate and of tectonically controlled river profile adjustment to the decline of incision over the SC range during the rise of the AC range. We finally review topographic characteristics of the SC range directly related to the slowing down of erosion over the SC range.
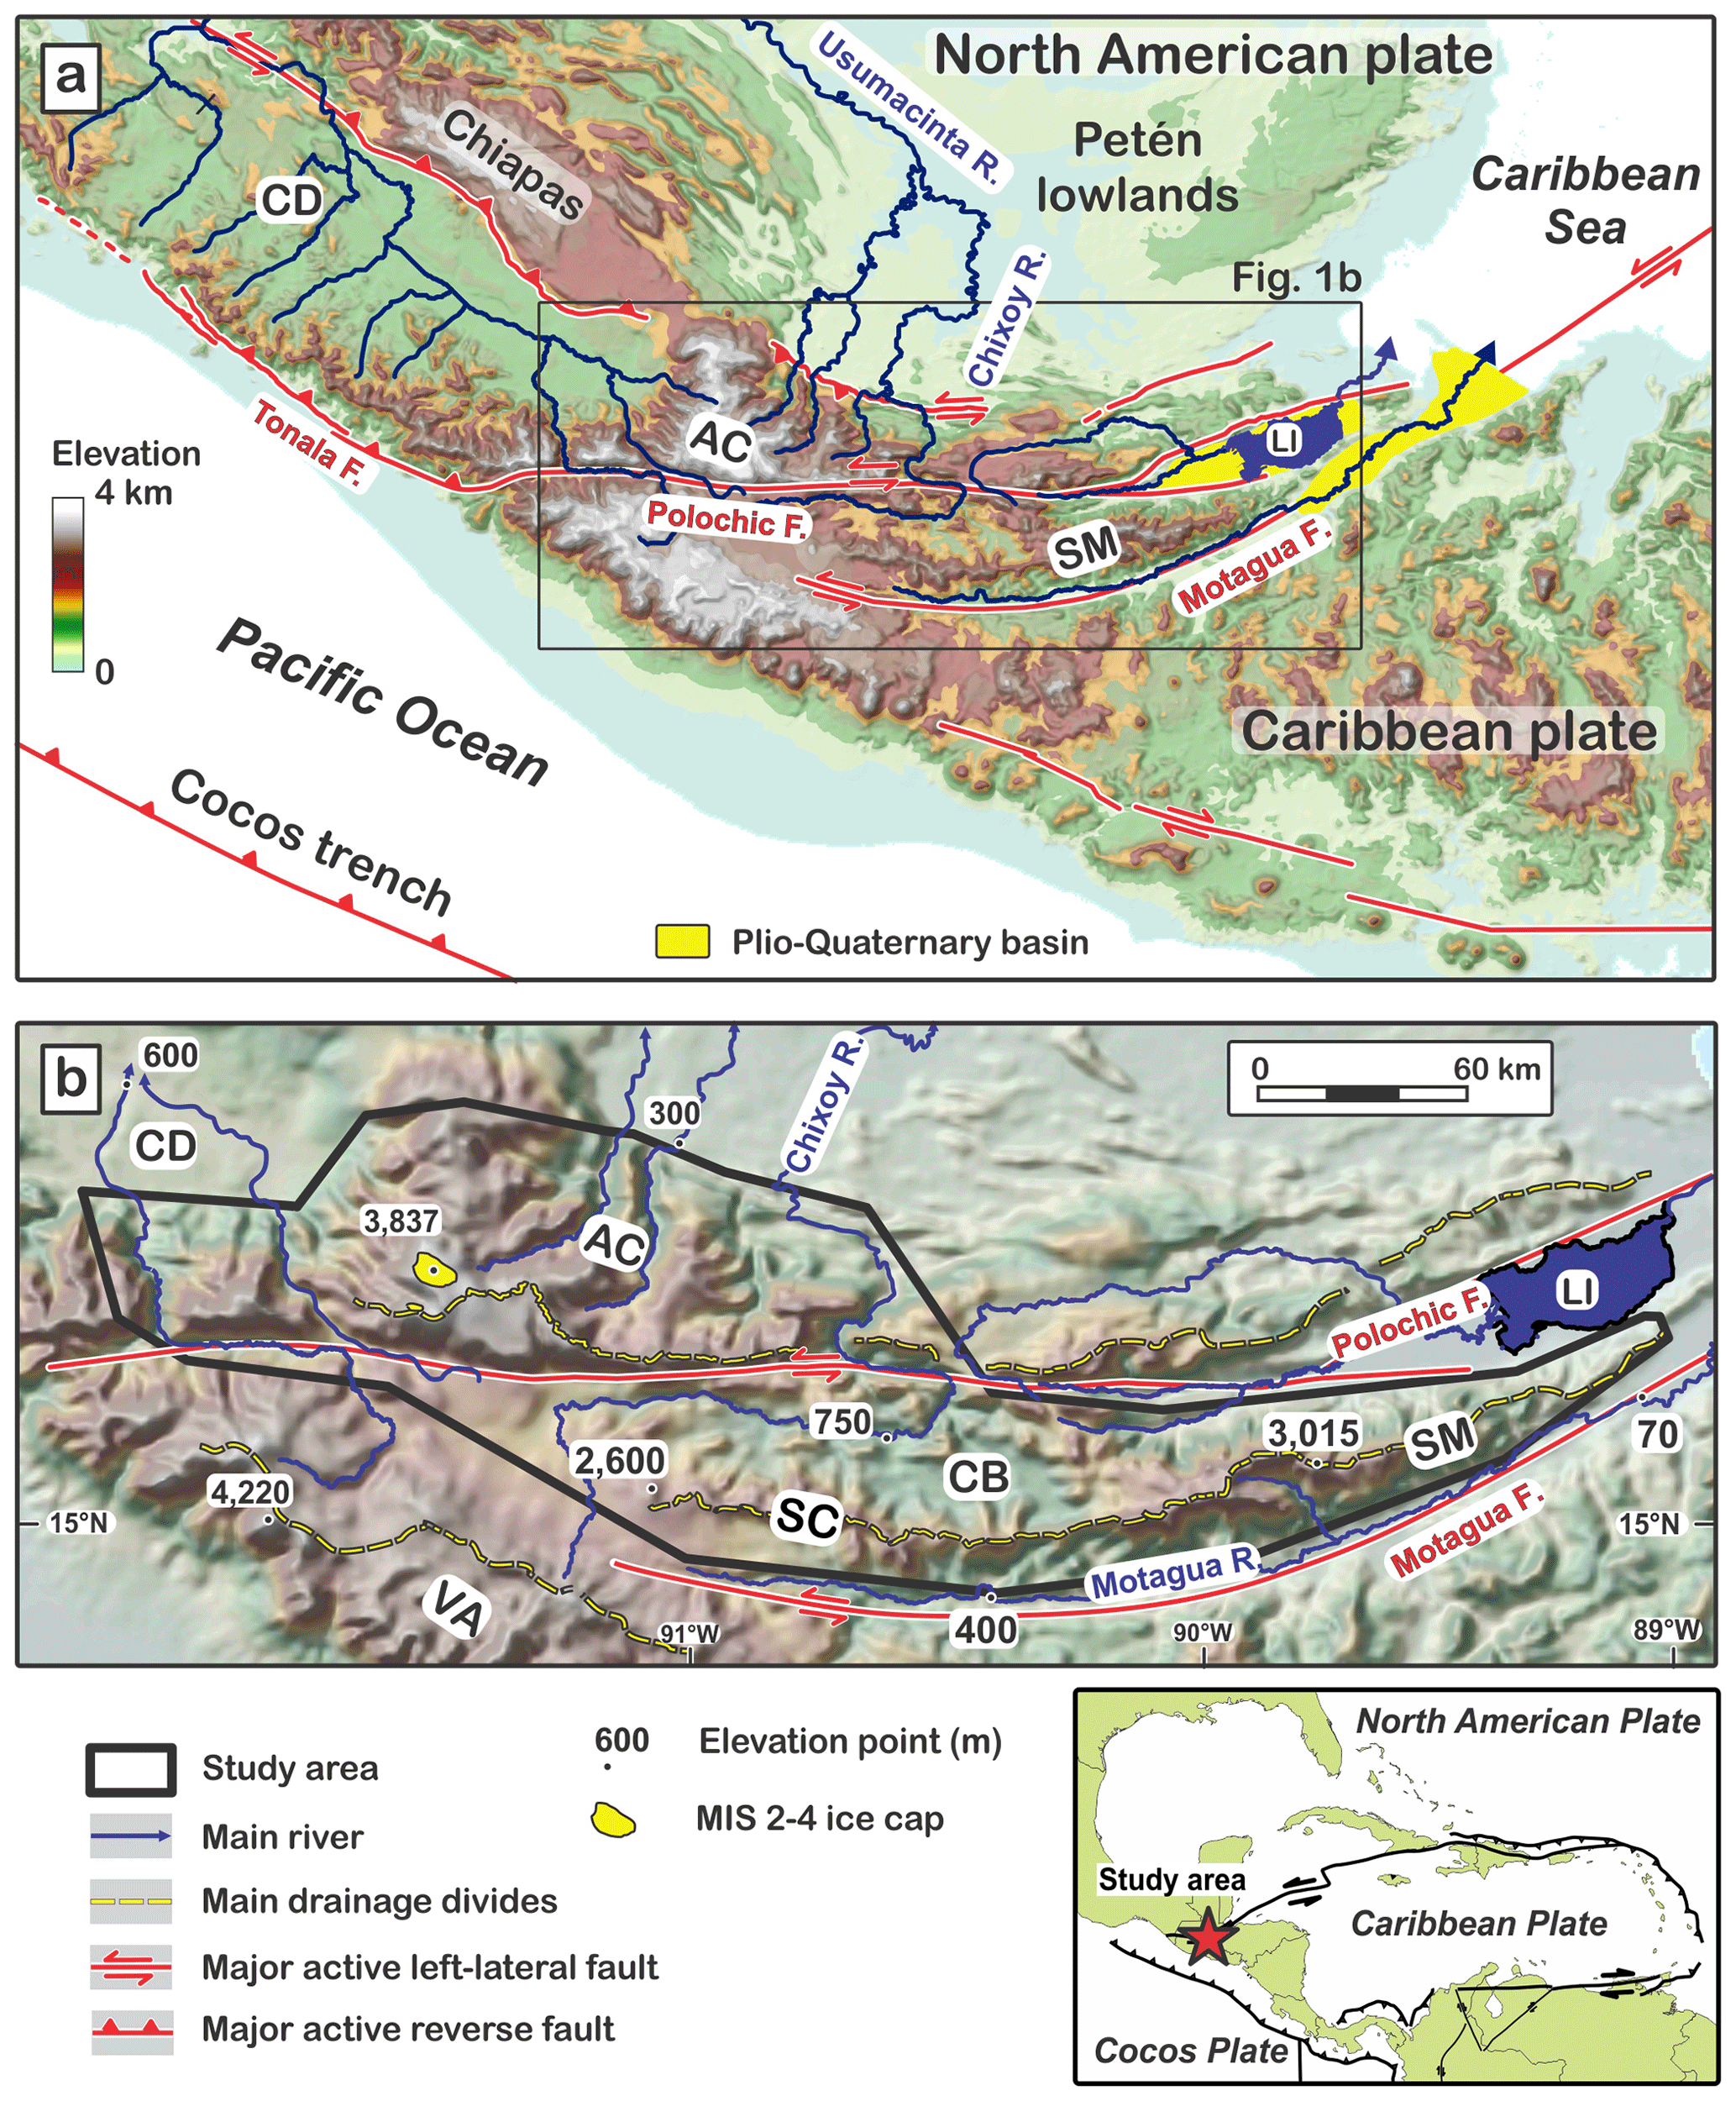
Figure 1Shaded topography of the study area, showing the tectonic setting of central Guatemala (a) and of the studied range (b). Topographic features are defined as follows: CB stands for Chixóy River basin, CD stands for Central Depression of Chiapas, AC stands for Altos de Cuchumatanes (AC range), LI stands for Lake Izabal, SC stands for Sierra de Chuacús (SC range), SM stands for Sierra de las Minas (SM range), and VA stands for Central American Volcanic Arc. MIS represents the δ18O marine isotopic stage.
2.1 Tectonics and orogenesis
Left-lateral motion along the North American–Caribbean plate boundary in central Guatemala has produced elongate ranges parallel to the plate boundary (Fig. 1a). We investigate the growth and erosion of two of these ranges, namely the Sierra de Chuacús–Sierra de las Minas range (SM-SC range), and the Altos de Cuchumatanes range (AC range, Fig. 1b). Rocks in the SC-SM range possess a deeply penetrative, sub-vertical tectonic fabric, imparted by 70 Myr of left-lateral wrenching along the Caribbean–North American plate boundary (Ratschbacher et al., 2009; Ortega-Gutierrez et al., 2004; Ortega-Obregón et al., 2008). Since Eocene time, left-lateral motion has been accommodated by the Motagua fault and, to a lesser extent, by the Polochic fault (Fig. 2b). The Motagua fault is, with >1100 km of total cumulative offset, the active subaerial fault with the largest cumulative offset on Earth. The Polochic fault has a total offset of 125±5 km (Burkart, 1978); it probably branches out of the Motagua fault offshore, somewhere in the Caribbean Sea (Fig. 1a), before running on land at an average distance of 50 km from the Motagua fault. Strain across the plate boundary is strongly partitioned between almost pure left-lateral slip on the Motagua and Polochic faults and dip-slip on faults parallel to the Polochic and Motagua faults (Authemayou et al., 2011; Brocard et al., 2012).
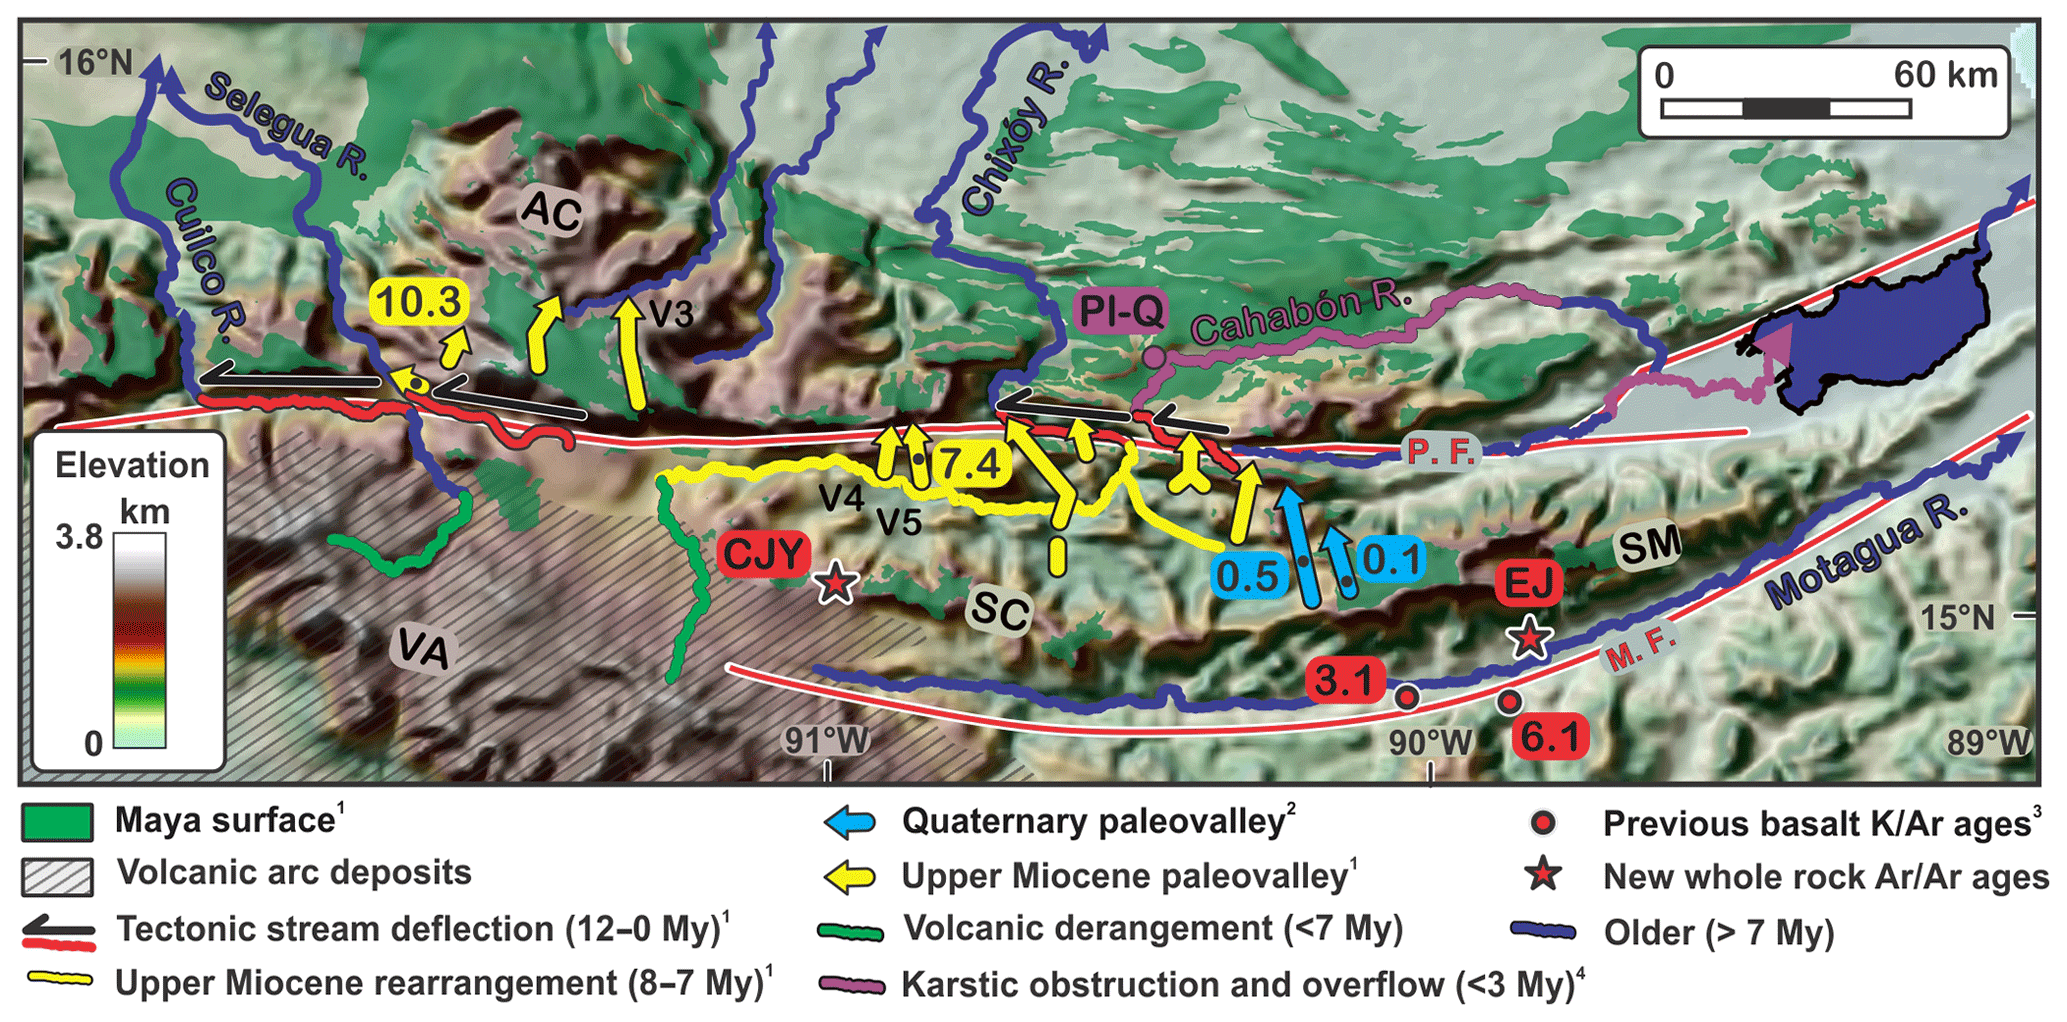
Figure 2Age of geomorphic markers and drainage lines in central Guatemala. Ages of Miocene valleys and Quaternary paleovalleys (V1–V12) in Myr. Data source are as follows: 1: Brocard et al. (2011); 2: Brocard et al. (2012); 3: Tobisch (1986); 4: Plio-Quaternary lacustrine deposits (Brocard et al., 2015a). Newly dated lavas are defined as follows: CJY: Chujuyúb; EJ: El Jute. Range names are defined as follows: AC: Altos de Cuchumatanes; SC: Sierra de Chuacús; SM: Sierra de las Minas; VA: volcanic arc. Faults are defined as follows: MF: Motagua; PF: Polochic. The background used is taken from the shaded GTOPO 30 DEM.
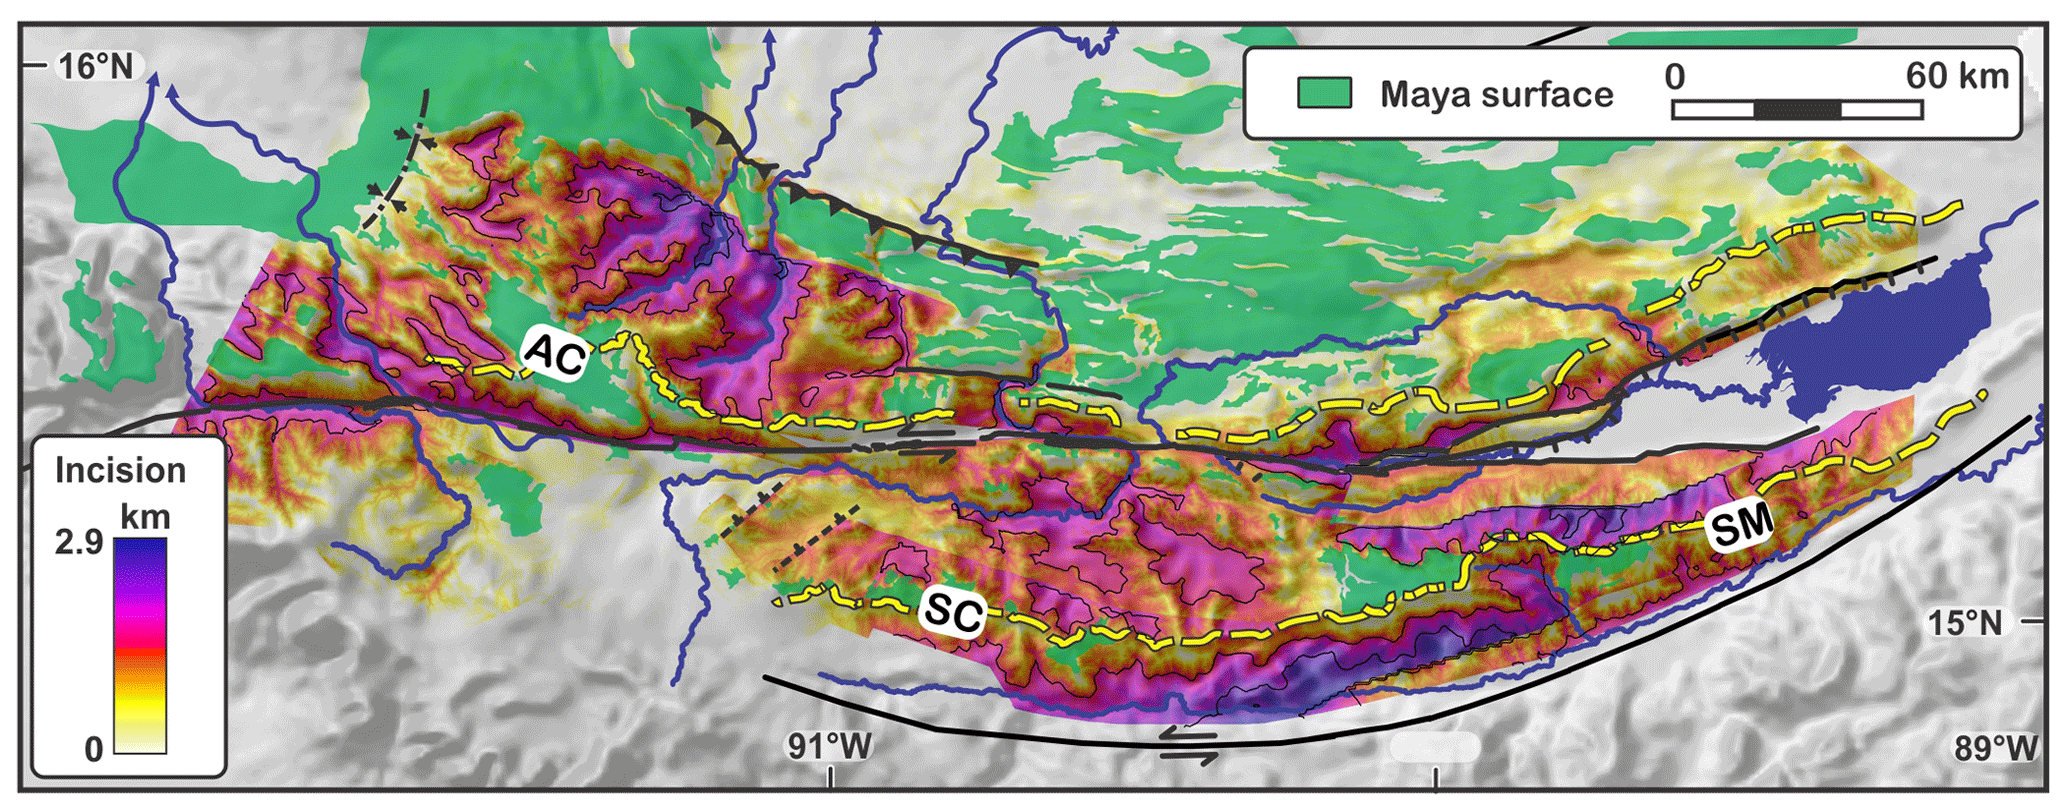
Figure 3Incision below the middle Miocene Maya surface, based on the elevation of surface remnants (upland relict surface). Incision contour line spacing is 1 km. Dashed yellow lines show range drainage divides. AC stands for Altos de Cuchumatanes, SC stands for Sierra de Chuacús, SM stands for Sierra de las Minas, and VA stands for volcanic arc.
Today, central Guatemala is straddled by 3–4 km high ranges separated by deep valleys. The floors of these valleys stand at elevations as low as 0.2–0.8 km (Fig. 1b). In middle Miocene times, the topography of central Guatemala was much more subdued. Remnants of that past topography (referred to as the Maya surface; Brocard et al., 2011) still cap numerous mountaintops across the study area (Fig. 2). They are separated by regions where the Maya surface has been deeply incised (Fig. 3). The Maya surface formed from the topographic decay of Eocene folds (Authemayou et al., 2011; Brocard et al., 2011). It grades to the east and north into lowlands, near the Caribbean Sea, indicating that it formed near sea level. Its uplift started after the middle Miocene, affecting both the southern (Simon-Labric et al., 2013) and northern side of the Motagua fault, as far north as the Polochic fault (Brocard et al., 2011). This event saw the rise of the SC-SM range during the late Miocene. Valleys up to 1000 m deep were incised within the northern flank of the SC-SM range between 12 and 7 Ma (Brocard et al., 2011).
Uplift propagated north of the Polochic fault during the late Miocene (Brocard et al., 2011) and was marked by the rise of the AC range in response to contraction within the North American plate (Authemayou et al., 2011). The rise of the AC range drove widespread reorganization among the rivers that drain the northern flank of the SC-SM range (Fig. 2). Numerous river valleys were then abandoned and left stranded on the rising AC range. Their deformation indicates that the AC range has risen >1–2 km relative to the SC range over the past 7 Myr (Brocard et al., 2011). Earthquake focal mechanisms further indicate that the tectonic structures bordering the AC range to the north still accommodate shortening today (Guzmán-Speziale, 2010; Authemayou et al., 2011).
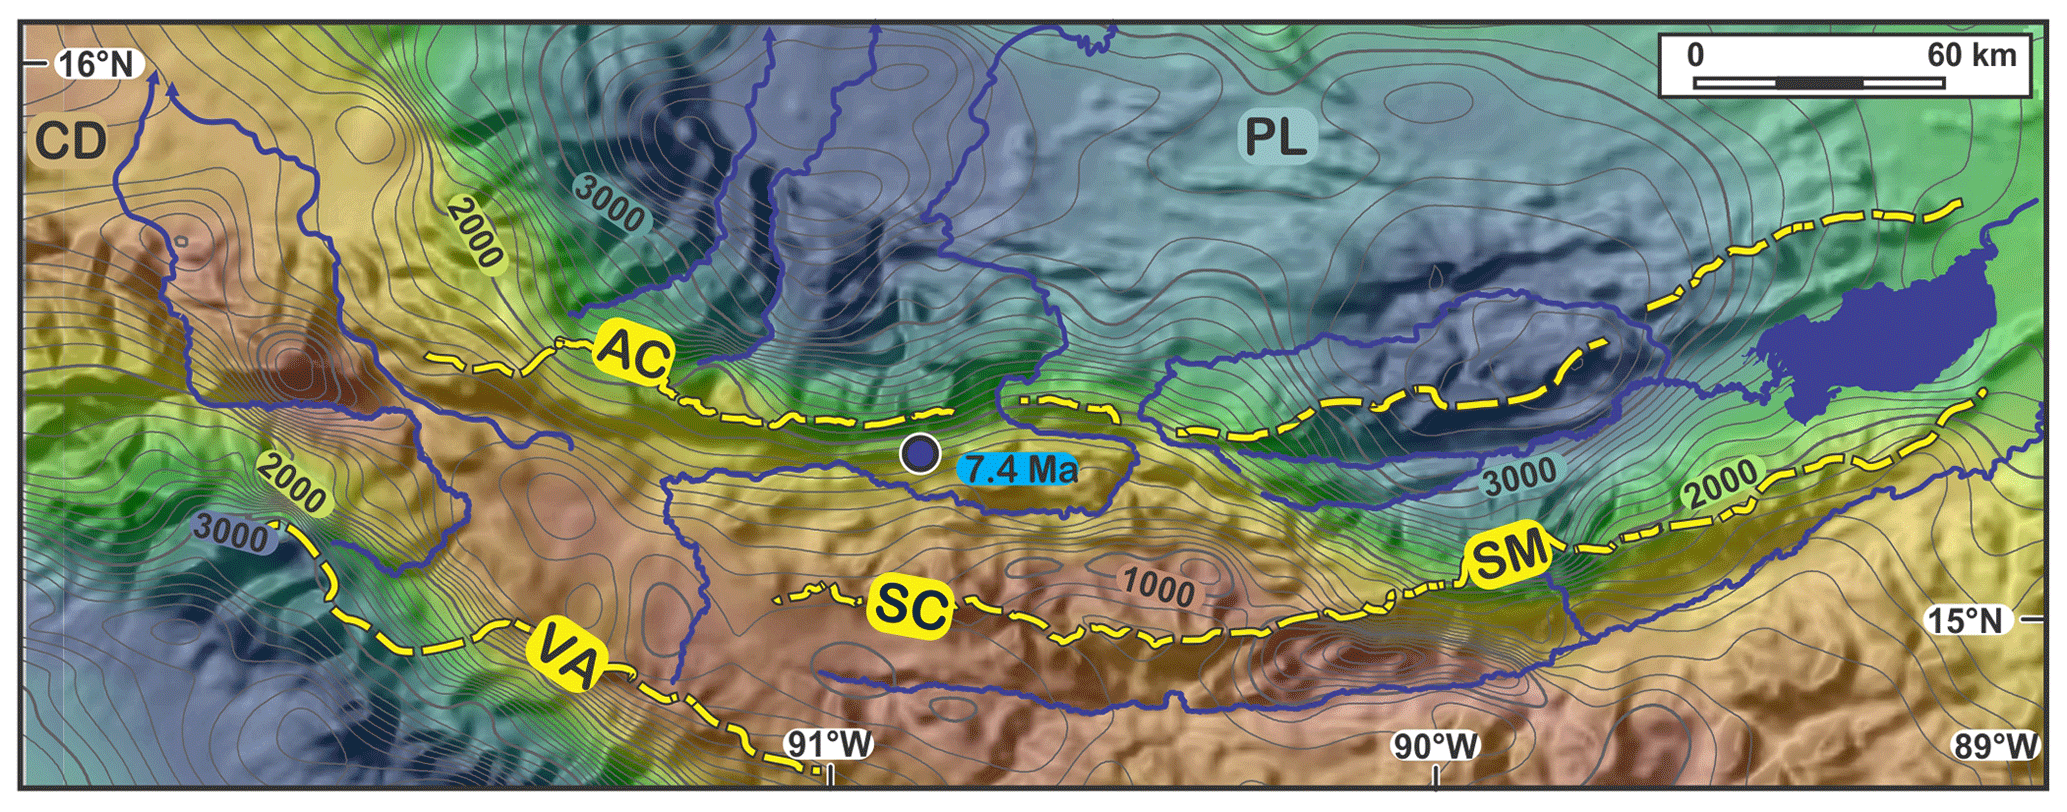
Figure 4Mean annual precipitation across the study (MARN, 2016) from dry (red) to wet (blue). Isohyet spacing is 100 mm, draped over the shadowed GTOPO 30 DEM. Dashed yellow lines show the range drainage divides. The blue dot shows the location of the fossil forest of Sicaché, buried below a 7.4 Myr ignimbrite (Brocard et al., 2011). CD stands for Central Depression of Chiapas, AC stands for Altos de Cuchumatanes, PL stands for Petén lowlands, SC stands for Sierra de Chuacús, SM stands for Sierra de las Minas, and VA stands for volcanic arc.
While contraction has defined the evolution of the western part of the study area, transtension has prevailed further east since the late Miocene at least. The dominance of transtension in the east results chiefly from an eastward increase in the divergence angle between the strike of the plate boundary and the direction of plate motion (Rogers and Mann, 2007). Transtension led to growth of the Lake Izabal basin (Fig. 1a), which is has been filled with ∼5 km of terrigenous sediments since the middle Miocene (Carballo-Hernandez et al., 1988; Bartole et al., 2019). Another ≥1.4 km deep, elongate (125×15 km) sedimentary basin formed over the same period at the eastern termination of the subaerial trace of the Motagua fault, next to the Caribbean Sea (Carballo-Hernandez et al., 1988) (Fig. 1a). Transtension spread further to the west during the Pliocene, generating normal faults that disrupt the northern flank of the SM range (Authemayou et al., 2011; Brocard et al., 2012).
2.2 Drainage evolution since the middle Miocene
The rivers located along the northern flank of the SC range represent the headwaters of a network that, farther downstream, experienced widespread reorganization during the late Miocene (Fig. 2). Reorganization led to the formation of range-parallel rivers halfway between the drainage divides of the SC-SM and the AC ranges. These E–W-striking rivers collect rivers that flow north, down the northern flank of the SC-SM range, and funnel them into the Chixóy River, one of the few rivers, together with the Cahabón, Chixóy, Selegua, and Cuilco rivers (Fig. 2), that still cross the AC range. These latter rivers also straddle the trace of left-lateral Polochic fault before entering the AC range. The Polochic fault has deflected and lengthened their course (Fig. 2) since the late Miocene (Brocard et al., 2011). Plio-Quaternary transtensional faulting along the northern flank of the SM range initiated a second (and still ongoing) pulse of drainage reorganization during the Quaternary (Fig. 2) (Brocard et al., 2012).
Since the Pliocene, large volcanoclastic aprons have piled up along the NE side of the Central American Volcanic arc. They have buried the western end of the SC range, deranging its river network (Fig. 2). This complex area is therefore excluded from the present study. Likewise, the karstic highlands of central Guatemala, especially those located north of the Polochic fault, are also excluded from the analysis because their dynamics is strongly influenced by the high-frequency opening and closure of subterranean karstic pathways (Brocard et al., 2015a, 2016a).
2.3 Current pattern of precipitation
Moisture tracking from the Pacific Ocean and from the Caribbean Sea is intercepted by slopes that face the western and eastern coasts of Guatemala and the Petén lowlands in the north (Fig. 4). The AC range receives 4–6 m yr−1 of mean annual precipitation (MAP) along its northern flank in the Zona Reina (Thattai et al., 2003). In the west, the Central American Volcanic Arc intercepts moisture rising from the Pacific Ocean. In the east, moisture from the Caribbean Sea is channeled along the Lake Izabal basin and then rises up along the northern flank of the SM range, where fog interception represents a substantial part of the annual precipitation above 2000 m (Holder, 2004). The volcanic arc, the SM range, and the AC range cast rain shadows over the Corridor Seco (Machorro, 2014), particularly over the SC range, which receives little precipitation. Semi-arid climate conditions are met in the valleys that surround the SC range.
2.4 Bedrock lithology
Rock belts in central Guatemala tend to follow the strike of the mountain ranges (Fig. 5). Late Cretaceous schists and gneisses of the Chuacús Formation (henceforth, formation will be abbreviated to Fm.). form the core of the SC-SM range. They are flanked by the late Cretaceous migmatites of the San Agustin Fm., and by marbles and amphibolites of the Jones Fm. In the north, this metamorphic core is tectonically juxtaposed, across the Baja Verapaz shear zone, to the basement of North America, which is covered mostly by a Permian megasequence of terrigenous sediments and carbonates (Sacapulas, Tactic-Esperanza, and Chochal Fms.; Anderson et al., 1973). The basement and cover are intruded by Paleozoic (e.g., Rabinal), Triassic, and Jurassic (e.g., Matanzas) plutons.
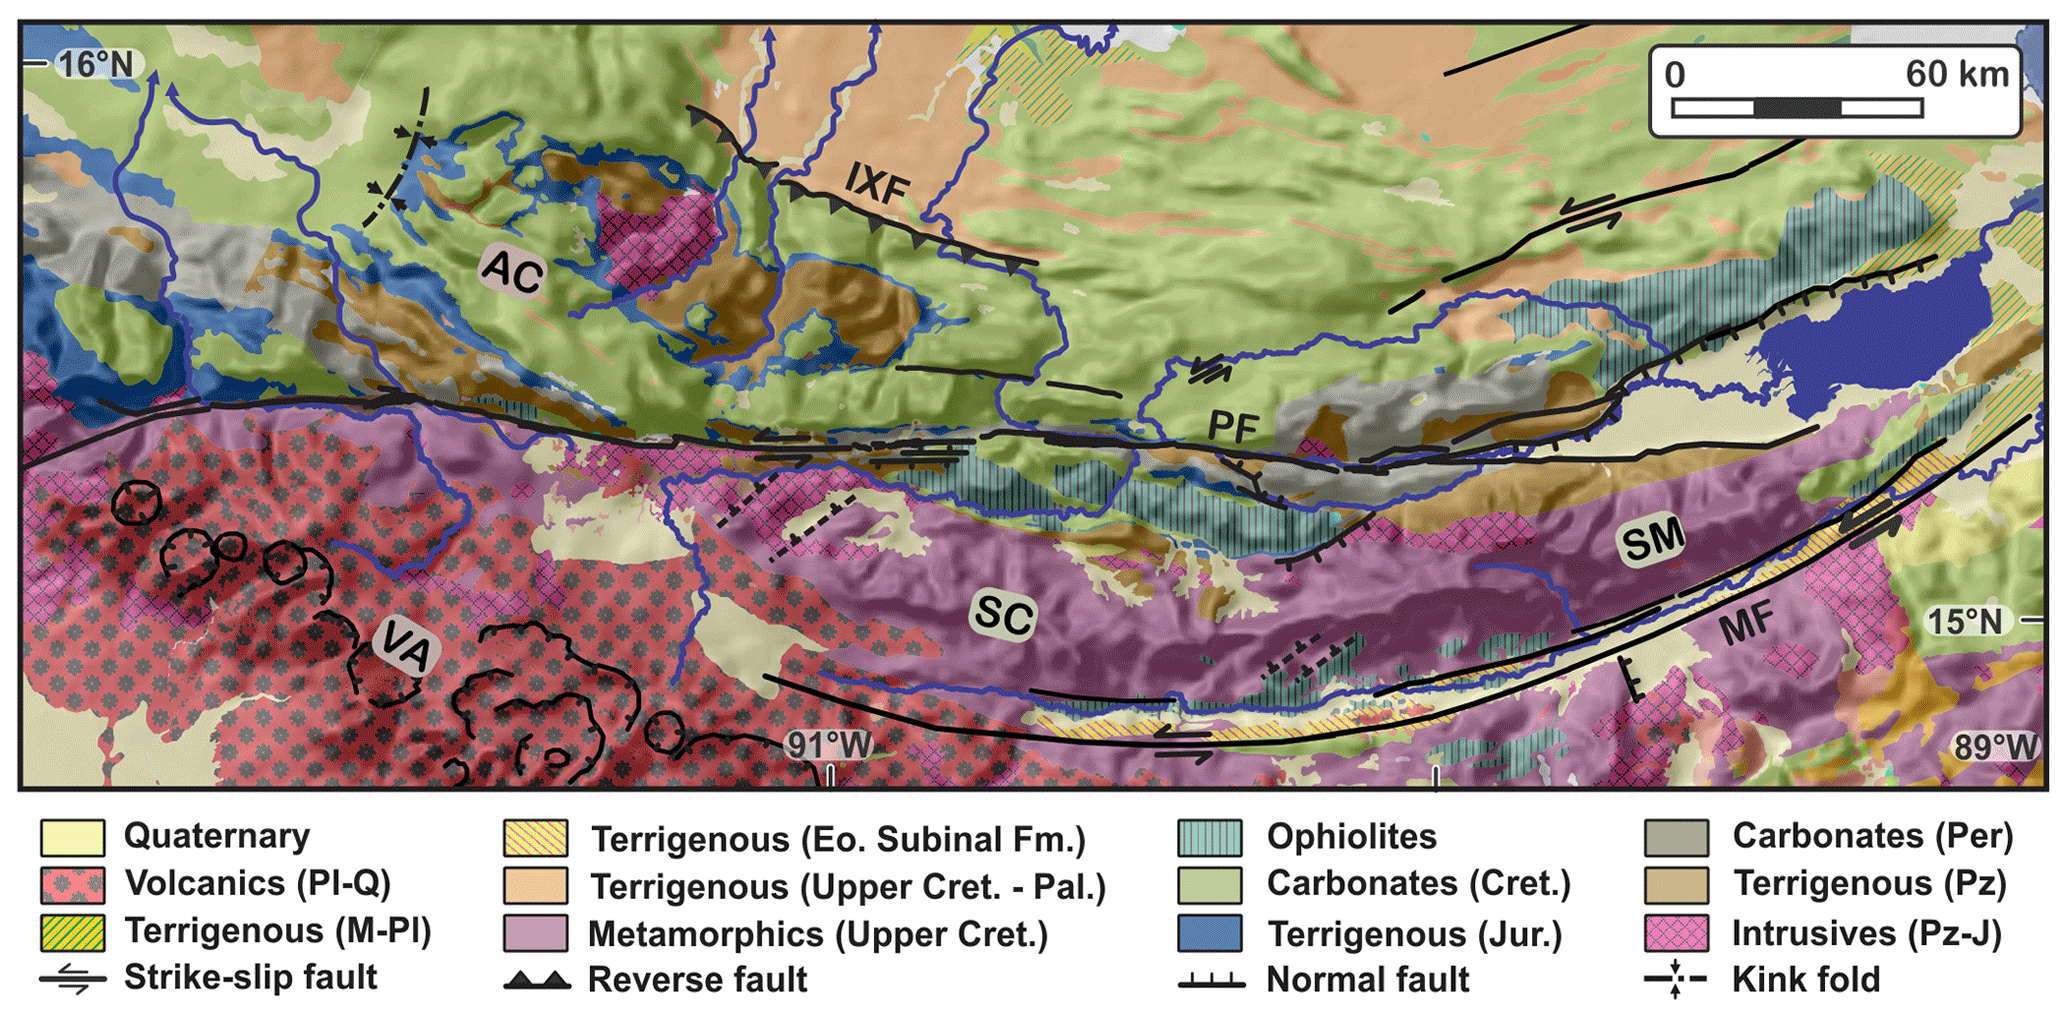
Figure 5Geology and structure of central Guatemala (Instituto Geográfico Nacional de Guatemala; Instituto Hondureño de Geología y Minas; Instituto Nacional de estadística y geografía de México), draped over the GTOPO 30 DEM. AC stands for Altos de Cuchumatanes, IXF stands for Ixcán fault, MF stands for Motagua fault, PF stands for Polochic fault, SC stands for Sierra de Chuacús, SM stands for Sierra de las Minas, and VA stands for volcanic arc.
A megasequence of continental terrigenous sediments (the Todos Santos Fm.), Cretaceous carbonates, and Cretaceous evaporites (Cobán Fm., Campur Fm.) covers much of the AC range (Fig. 5). Ultramafic rocks obducted over the carbonates in late Cretaceous (Campanian) time (Fourcade et al., 1994) are preserved within weakly metamorphic synformal klippes (Baja Verapaz, Santa Cruz, and Juan de Paz ophiolites). Higher-grade serpentine mélanges crop out along the Motagua valley (Flores et al., 2013).
The southern base of the SC-SM range is incised into sediments deposited in narrow transtensional basins along the Motagua fault (Ratschbacher et al., 2009). During Eocene times (Newcomb, 1975), one such basin was filled by continental red beds of the Subinal Fm. (Fig. 5), which has an exposed thickness of ≥1500 m (Hirschman, 1962). Some of its detrital sediments are derived from the current basement of the SC-SM range, while others were brought by an axial river that prefigures the current Motagua River (Guttiérrez, 2008). The Subinal Fm. now lies in tectonic contact against the SC-SM basement along high-angle reverse faults (Muller, 1979; Bosc, 1971).
3.1 The 40Ar-39Ar isotopic dating of volcanic rocks
The age of the low-relief Maya surface was previously constrained by bracketing age markers, such as 14–15 Ma overlying ignimbrites on the Chortís Block, and a 10 Ma ignimbrite filling a paleovalley, incised into the Maya surface (Brocard et al., 2011). To improve the dating of the Maya surface we resorted to the 40Ar/39Ar dating of andesite boulders, embedded in a lahar deposit that lies on the Maya surface at the western termination of the SC range, near the locality of Chujuyúb (Fig. 2). To establish the chronology of incision of the Motagua valley, we used previously dated alkaline basalts that crop out on the floor of the Motagua valley (Tobisch, 1986). We also dated a basalt flow that hangs 500 m above the Motagua River in the foothills of the Sierra de las Minas near the town of El Jute (Bosc, 1971) (Fig. 6). Two 40ArAr whole-rock ages were retrieved from the basalt of El Jute, and one whole-rock age was obtained on the basaltic andesite of Chujuyúb by the U.S. Geological Survey (USGS) in Denver, CO, USA (see Supplement 1).
3.2 Terrestrial 10Be erosion rates
We measured the concentration of 10Be in quartz grains extracted from soils and river sediments. We used the 10Be concentration to calculate hillslope erosion rates, integrated over the past 103–104 years (see Supplement 2). Soil and rock samples, collected along ridgelines in the SM range, provide erosion rates restricted to the sites of sampling (Table S2-1, Fig. S2-3c in the Supplement). Three samples consist of quartzose vein fragments exhumed from weathered orthogneiss, and two other samples come from outcrops of highly weathered pegmatite located on the monadnock of Cerro las Palomas, in the Montaña El Imposible (Fig. S2-3b).
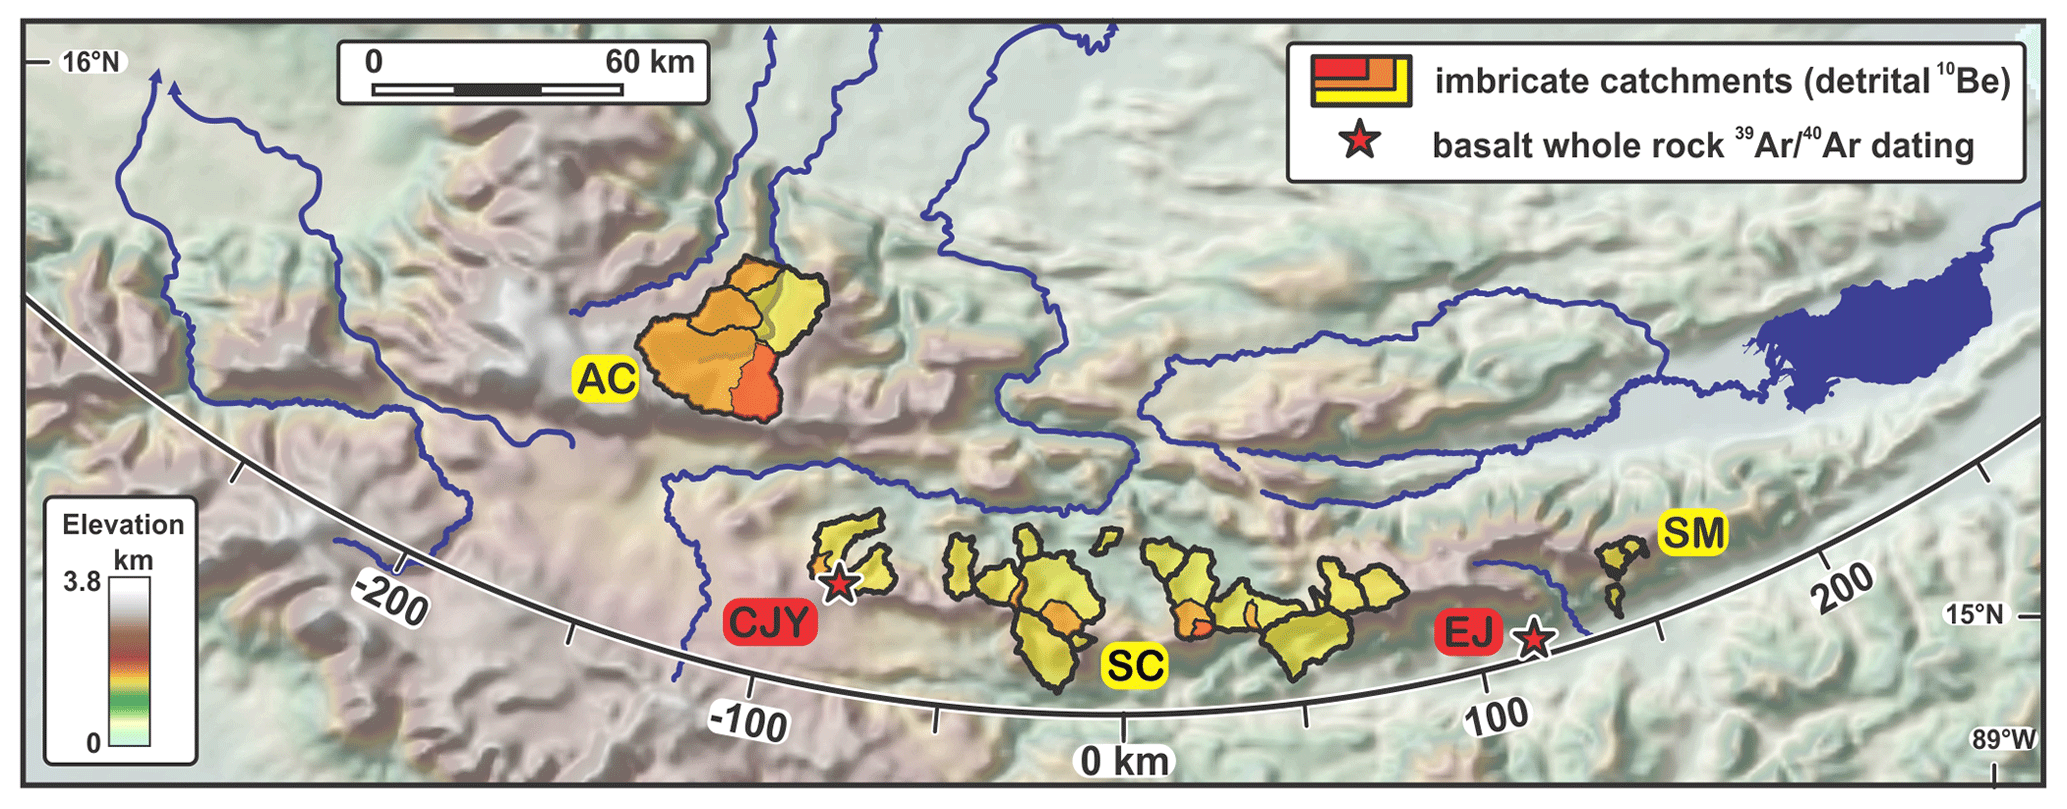
Figure 6Catchments sampled for the 10Be analysis (AC: Altos de Cuchumatanes; SC: Sierra de Chuacús; SM: Sierra de las Minas) and 40ArAr dating (CJY: Chujuyúb; EJ: El Jute). Enlarged maps of the catchments and their lithologies are provided in Fig. S2-1 in the Supplement). The arcuate line represents the axis used for plate-boundary-parallel projections of Figs. 10 and 12.
The majority of the samples consist of river-borne quartz collected in 30 rivers that drain the SM, SC, and AC ranges (Fig. 6, Table S2-2, Fig. S2-3 in the Supplement). They provide catchment-averaged hillslope erosion rates (Brown et al., 1995). Quartz was extracted from the sand grain-size fraction (250–500 µm) of the river sediments. Because 10Be production increases rapidly with elevation, systematic altitudinal variations in the concentration of quartz in the source rocks may skew the calculation of erosion rates. A sensitivity analysis to this effect was conducted in the AC range, where this situation in encountered, by weighting 10Be production according to the quartz concentration in the source rocks (Fig. S2-3a). Besides, the intense weathering of tropical mountains promotes the concentration of quartz in the soils and the underestimation of erosion rates. An assessment of the effect of quartz enrichment on erosion rates was therefore conducted (Table S2-2) using quartz enrichment values from mountain tropical soils of Puerto Rico (Ferrier et al., 2010). River sampling was conducted in nested catchments (Figs. 6 and S2-3a, b) in order to capture along-stream variations in erosion rates, such as those produced by headward-migrating knickpoints (Willenbring et al., 2013b; Brocard et al., 2015b). Samples were prepared at the 10Be extraction laboratory of the Department of Geology and Geophysics at the University of Minnesota and at the PennCIL lab of the Earth and Environmental Sciences department at the University of Pennsylvania (see Supplement 2).
3.3 Calculation of an erosion index
To test the influence of hillslope steepness and of precipitation on 10Be-derived erosion rates, we calculated a normalized erosion index (Montgomery and Stolar, 2006; Finnegan et al., 2008) over the study area. We used a formulation in which soil erosion is assumed to be proportional to shear stress:
where Q is discharge (in m3 s−1) and S the along-slope gradient (m m−1). Slope was extracted from the national Guatemalan Instituto Geográfico Nacional (IGN) digital elevation model (DEM) at a resolution of 20 m, and discharge was calculated using MAP provided in the MARN (2016) report. Rainfall values were corrected for evapotranspiration, using a map of vegetation from the MARN (2016) report, and evapotranspiration values were taken from the Puerto Rico GAP project (Gould et al., 2008). It amounts to 10 %–82 % of the total rainfall for the different types of vegetation reported in the MARN report. Erosion Index (EI) values were normalized to the highest obtained EI value within the study area.
3.4 River profile segmentation
We extracted the long-profiles of 220 rivers located in the AC, SC, and SM ranges, using the Guatemala national 20 m resolution DEM released by the National Geographic Institute of Guatemala. The beds of these rivers were observed on stereoscopic couples of aerial photographs, provided by the National Geographic Institute of Guatemala (see the next section for details). We sieved out rivers along which long-term dynamics are mired by adjustments to shorter-term disturbances, such as interactions with karst conduits, debris flows, and deep-seated landslides. A subset of 110 rivers that best capture long-term trends was used in the final analysis (Fig. 7).
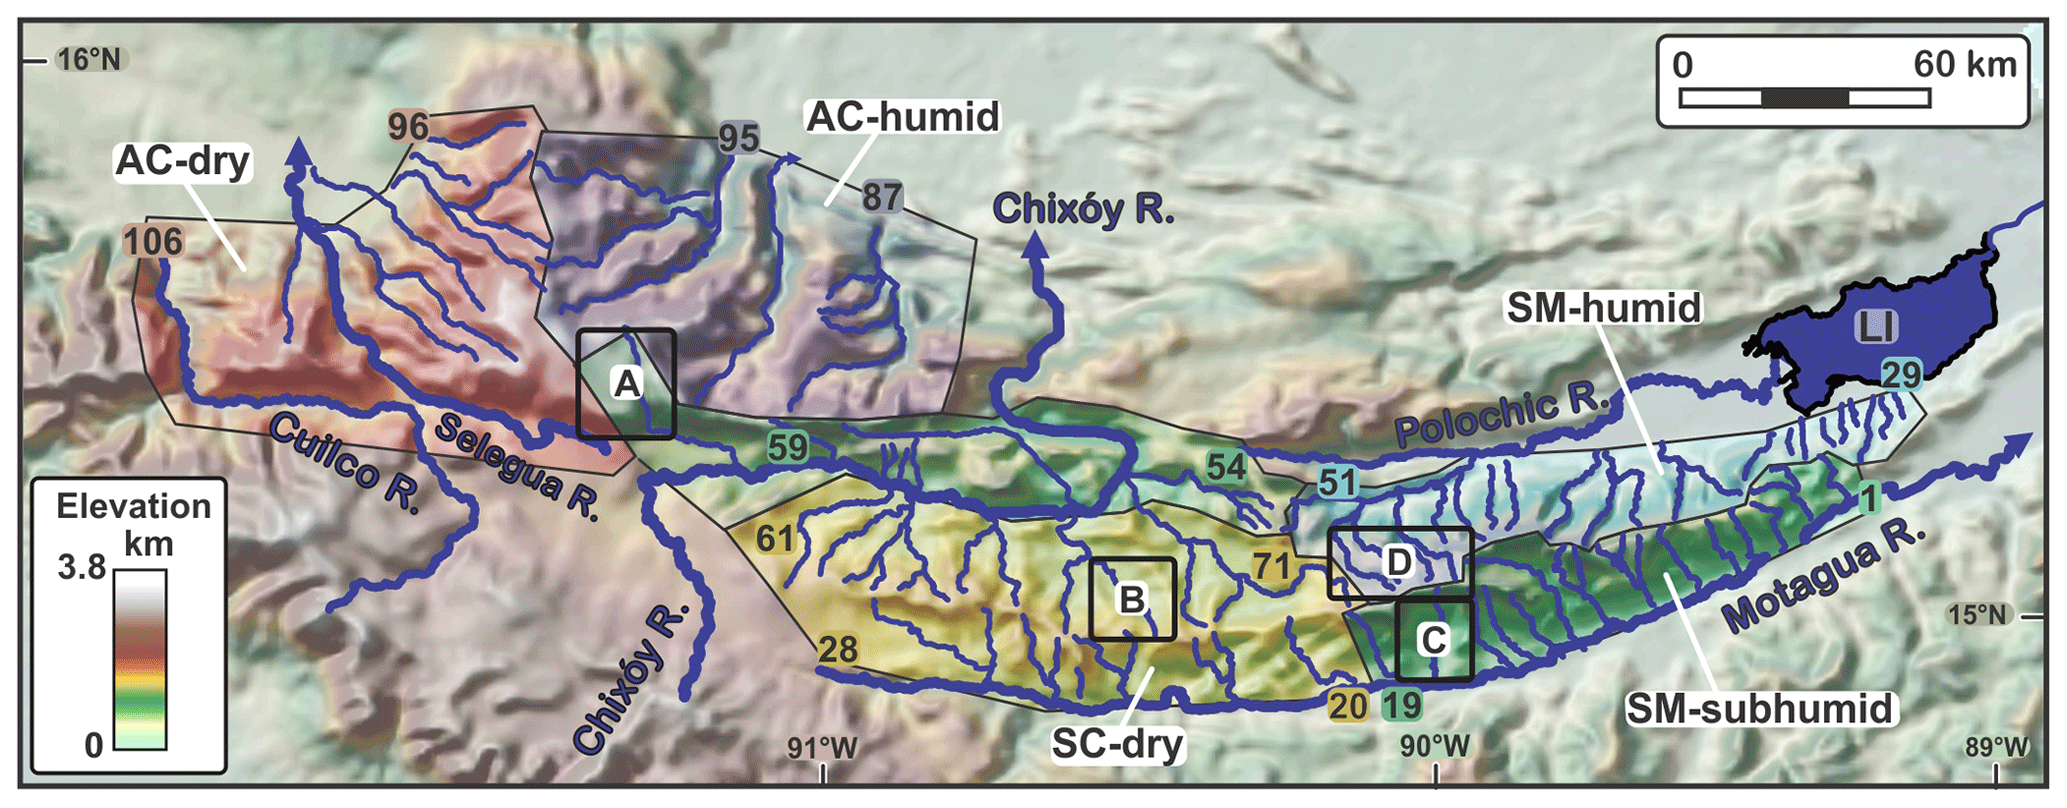
Figure 7Distribution and grouping of the streams used in the river long-profile analysis, and their grouping by geographic areas. AC stands for Altos de Cuchumatanes, LI stands for Lake Izabal, PF stands for Polochic fault, SC stands for Sierra de Chuacús, and SM stands for Sierra de las Minas. Numbers (1–106) correspond to the numbers ascribed to the rivers, as listed in table S4-1. The corresponding river profiles are presented in Figs. S4-2 to S4-7 in the Supplement and in Fig. 12. Boxes A–D show footprints of the maps displayed on Fig. 8.
We resorted to a linearization method that filters out the downstream increase in stream discharge to identify knickpoints along river profiles. We chose the integral method (Perron and Royden, 2013), in which elevation is plotted (on chi plots or χ plots) as a function of chi (or χ), which is an upstream integral of incremental upstream distance divided by a normalized local drainage area:
where A and x are the drainage area (in m2) and upstream distance (in m), respectively. Ao (in m2) is a reference drainage area, xo is a reference upstream distance taken at the same point, and m and n are two exponents that encapsulate the influence of drainage area and of local slope on river incision rate, respectively. This method divides river profiles into a succession of linear to sublinear segments, separated by break-in slopes that represent the knickpoints. The method overcomes much of the scatter that plagues earlier linearization methods (Whipple and Tucker, 2002; Goldrick and Bishop, 1995). It requires, however, a foreknowledge of the intrinsic concavity θ, defined as . The value of θ can be determined by incrementally fitting river profiles to a straight line (Mudd et al., 2014). Most of the studied rivers, however, have highly segmented profiles (see Sect. 4.3), preventing the retrieval of well-defined θ values. Besides, θ might vary along-stream as a result of changes in climate (Murphy et al., 2016) or changes in the dominant erosive processes operating on the streambed (Brocard and Van der Beek, 2006), such as the alternation of detachment-limited (Howard, 1994) and transport-limited river incision (Whipple and Tucker, 2002) or the alternation of sediment-starved and overfed reaches (Sklar and Dietrich, 2006). The method is chiefly used here to locate knickpoints. We therefore simply assessed whether the choice of θ would impact the location and number of break in slopes when varied within the range (0.4–0.6) over which the profiles appear well linearized. The segmentation being stable over this range (Supplement 3), a common normalizing concavity θn of 0.5 was applied to all river profiles.
3.5 Classification of stream segments
Streambed morphology was examined along each linearized segment using stereoscopic 0.5 m resolution black and white aerial photographs shot in 2001, provided by the Guatemala National Institute of Geography (see Supplement 4). Observations were occasionally ground-proofed during field work campaigns stretching over 6 years. River beds were grouped into types according to the bed component that dominantly determines river gradient along each segment, namely bedrock, bedrock and gravel bars, gravel bars over bedrock strath, gravel bars over thick alluvial fill, colluvium, large immobile boulders, boulders and gravel bars, and boulders and bedrock (Table S4-1 in the Supplement). Classification failed in many headwater channels, where beds are masked by overhanging riparian vegetation. The classification roughly reflects differences in the factors that determine stream incision. River incision is indeed likely detachment-limited along bed-load-dominated reaches, and transport-limited along gravel- and cobble-dominated reaches, lying over bedrock straths (Tucker and Whipple, 2002; Brocard and Van der Beek, 2006). Boulder-armored reaches are chocked by slowly- to non-moving boulders that act more like bedrock than bed load and are therefore likely detachment-limited. However, unlike other types of bedrock channels, boulder channels do not reflect the erodibility of the underlying bedrock but rather that of surrounding hillslopes because the majority of the boulders originate from valley sides. Changes in streambed type from one segment to the next assisted the classification of river knickpoints (see following section).
3.6 Classification of river knickpoints
Convex-up breaks in slopes along river profiles are commonly referred to as river knickpoints. For convenience, we refer here to all breaks in slope, whether convex or concave, as knickpoints. Knickpoints were classified as lithogenic, alluvial, tectonic, migrating, and miscellaneous (see Supplement 4). Miscellaneous knickpoints represent adaptations of river profiles to local, stochastic disturbances (such as landslides and epigenies) and are usually short-lived. Most knickpoints in the study area reflect adaptations of river gradients to along-stream variations in rock uplift rate, bedrock erodibility, sediment flux, or sediment grain size. These knickpoints can be regarded as steady, inasmuch as their location only changes very slowly along the river profiles, tracking spatial changes in the distribution of rock types, rock uplift, sediment fluxes, and bed load grain size. By contrast, knickpoints that spearhead step increases or step decreases in river incision rates migrate in the upstream direction along river profiles in the form of waves of accelerated (Rosenbloom and Anderson, 1994; Merritts et al., 1994) or decelerated (Howard, 1997) incision. They are hereafter referred to as migrating knickpoints, for they usually migrate faster than the knickpoints previously described. Concave-up migrating knickpoints commonly mark the transition from detachment-limited to transport-limited river incision (Whipple and Tucker, 2002) and are usually found at the apex of alluvial fans (Fig. 8c) and pediments (Fig. 8b).
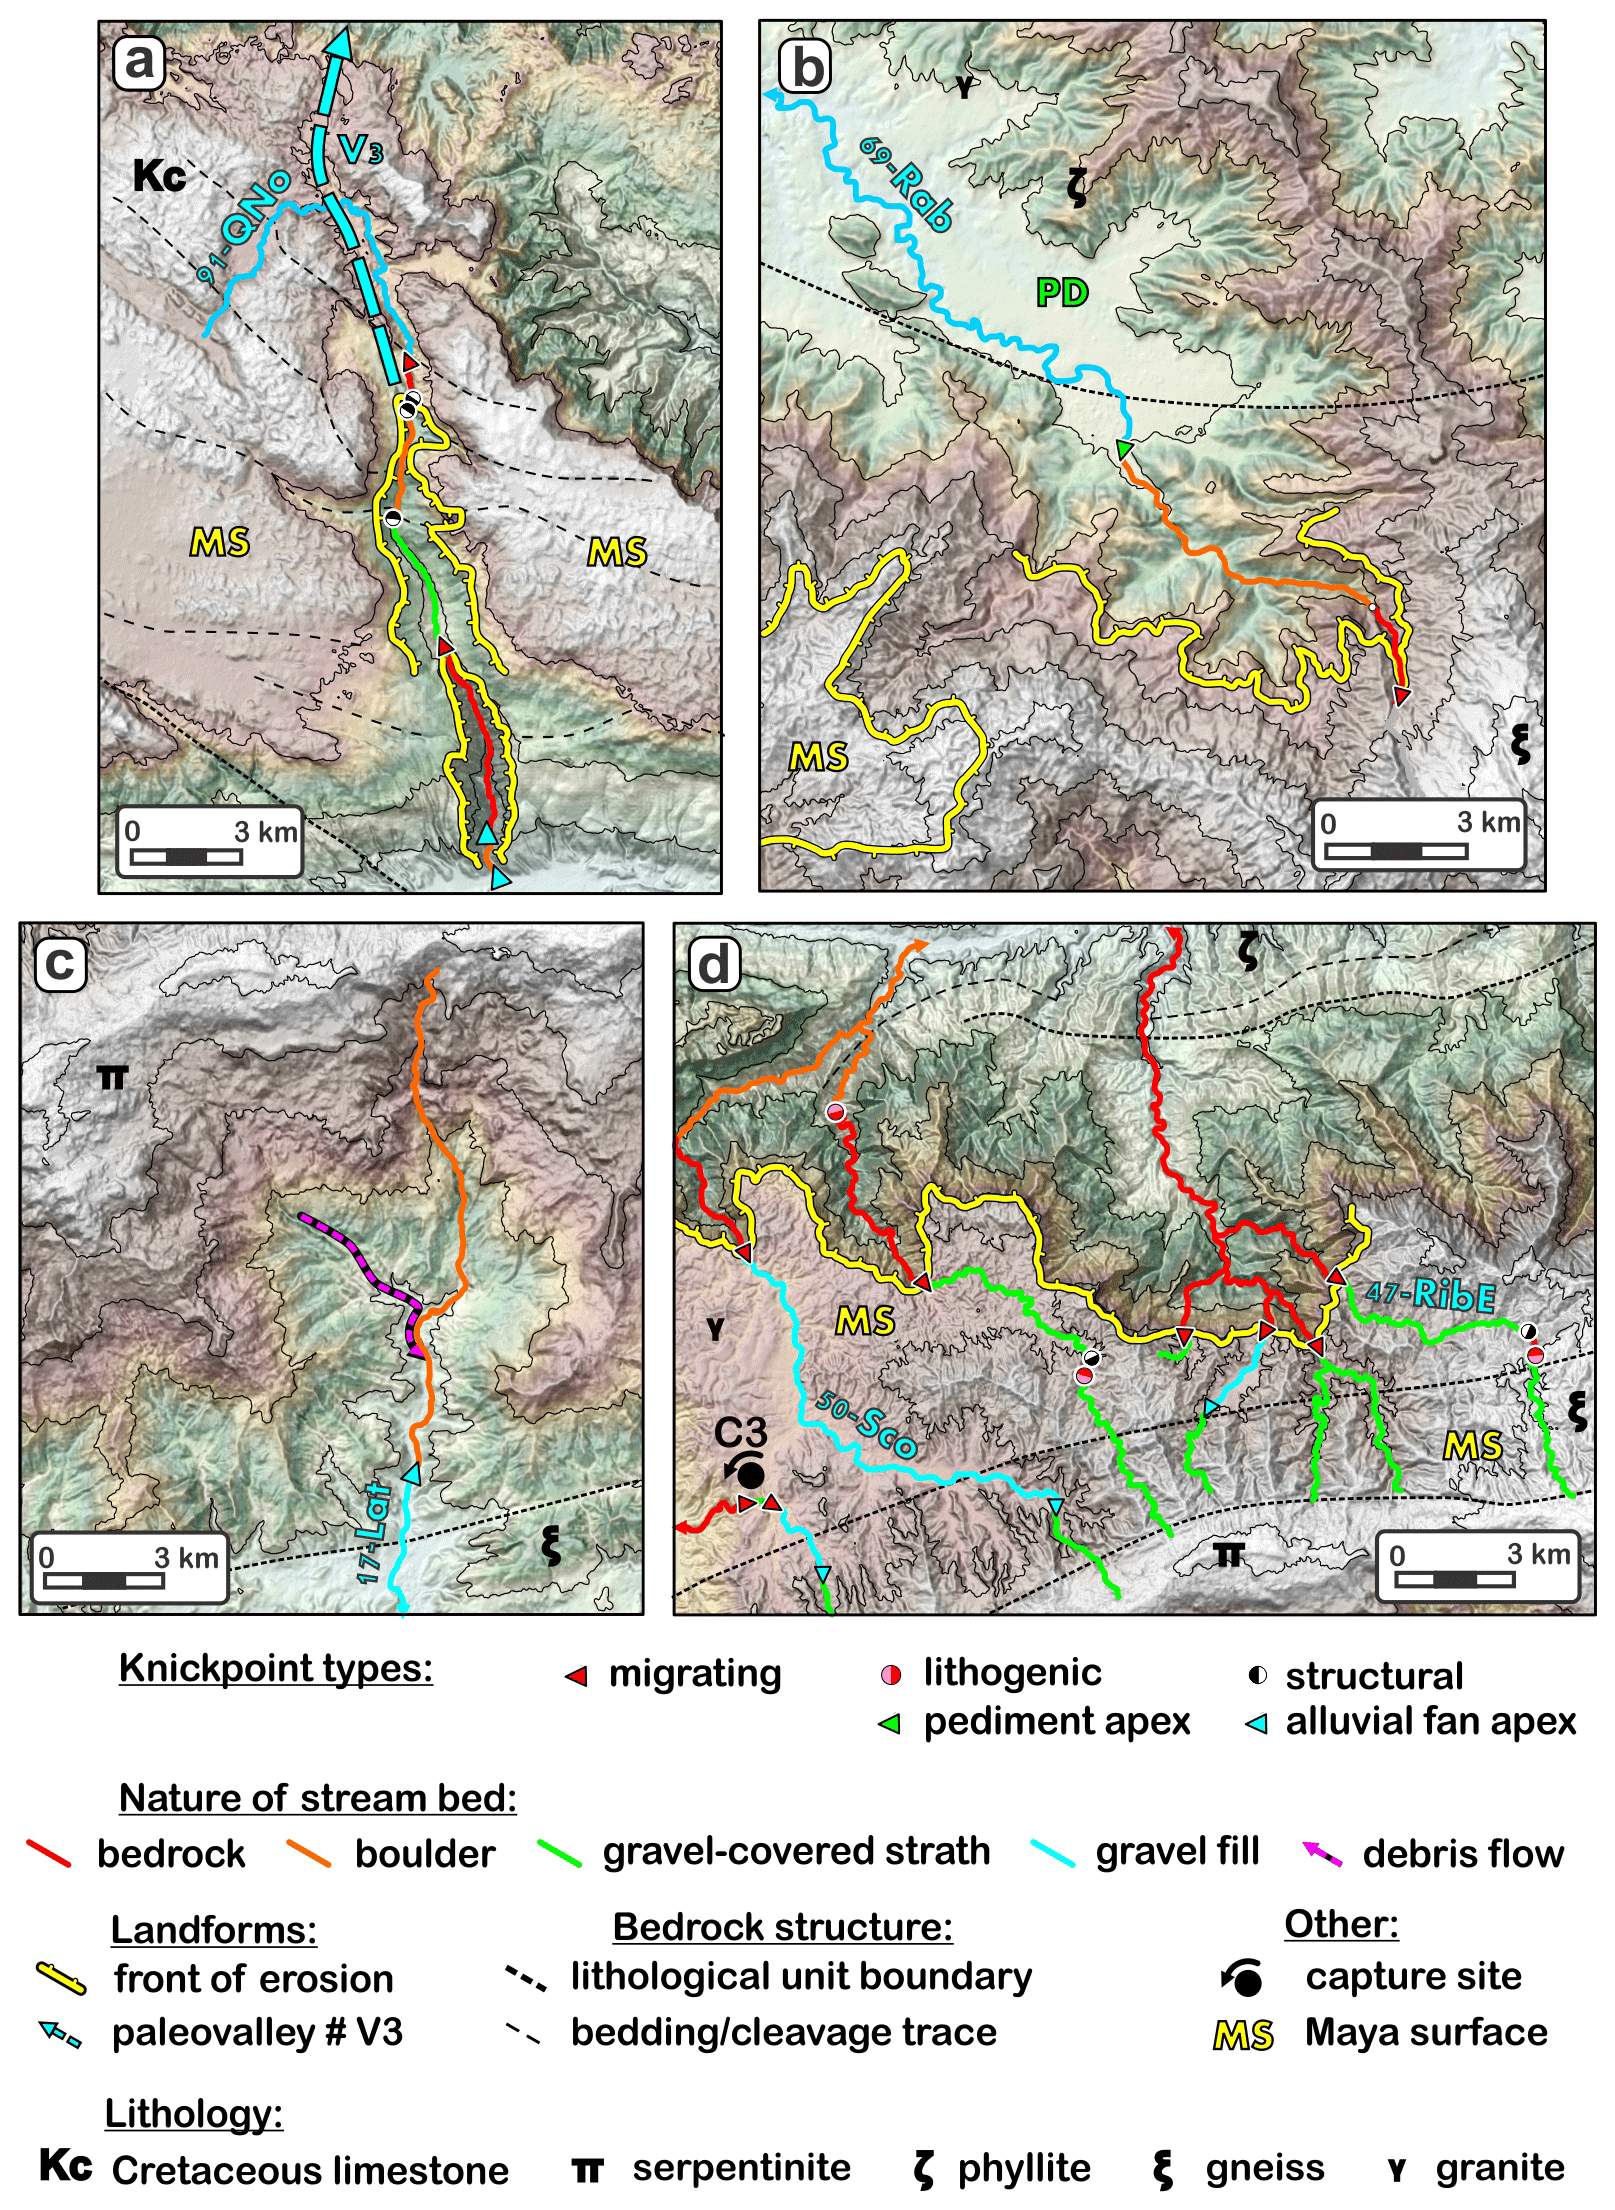
Figure 8Examples of some knickpoint types presented in their geomorphic setting. Shaded and sloped 30 m resolution ALOS DEM © JAXA. Location of maps A–D in Fig. 7. (a) Valley of the Quilén Novillo–Chancol rivers (91-QNo, AC Range), showing the paleovalley V3 (Fig. 2), shallowly incised into the Maya surface (Brocard et al., 2011), and two imbricate waves of erosion migrating up the reversed (southward-directed) drainage of the valley. (b) Typical stepped topography of the SC range in the catchment of the Rabinal river (69-Rab), showing three imbricate upstream-migrating erosive signals distributed along the mountain slope. The upper one is a wave of erosion that dissects the Maya surface, a second one is located halfway down the mountain flank, and the basal and final wave is located at the base of the range at the apex of pediments (PD). (c) Diffusive erosion in serpentinite mélanges, in the catchment of Río Hato (17-Lat, SM Range). (d) Dissection of the Maya surface by prominent migrating knickpoints along the northern flank of the SM Range, from the Ribaco River to the Chilasco River (47-Rib to 50Sco). C3 indicates a 200 kyr old avulsion site (Brocard et al., 2012).
Theoretical geometric differences between migrating and steady knickpoints in linearized spaces have been used to discriminate unstable, migrating knickpoints from stable, equilibrium knickpoints (Goldrick and Bishop, 1995; Perron and Royden, 2013; Whipple and Tucker, 2002). In χ space, upstream-migrating knickpoints, in which celerity is controlled by the stream power law and that propagate along various branches of a single drainage through a homogenous substrate affected by homogeneous rock uplift, should all share the same elevation and the same χ value (Royden and Taylor Perron, 2013). In the real world, however, variations in bedrock erodibility, climate, and rock uplift often scatter these values, challenging interpretations based on these sole geometric properties. This is especially the case in areas where environmental heterogeneities generate steady knickpoints in which heights and wavelengths are similar to that of the migrating knickpoints interspersed among them.
Additional discriminating elements must be used. A first screening consisted of checking whether the knickpoints coincide with marked variations in bedrock erodibility, rock uplift rates, or local anomalies, in which case they were classified as steady. To assess the effect of lithological variations we used 1:50 000 and 1:250 000 geological quadrangles of Guatemala and topical geologic maps from published papers (e.g., Brocard et al., 2011; Bosc, 1971). Stereoscopic 0.5 m black and white aerial photographs of the Guatemala National Institute of Geography were used to refine the location of lithological contacts and to assess the effects of bedrock fabric, fault damage zones, active faults, deep-seated landslides, and large debris flows on the location of knickpoints. We used our foreknowledge of the tectonics of the area (Authemayou et al., 2011, 2012; Brocard et al., 2012) and of the Quaternary drainage reorganization (Brocard et al., 2012) to assist the identification of tectonic knickpoints and of migrating knickpoints related to this recent reorganization. The remaining knickpoints were then considered as potentially migrating, carrying the signal of the long-term evolution of the studied mountains. We looked for supporting evidence of knickpoint migration, in particular break-in slopes running along valley flanks, tied to specific knickpoints (Fig. 8a and b) after verifying that such break-in slopes were not produced by lithological variations along valley sides. Changes in erosion rates along hillslopes associated to the passage of migrating knickpoints can affect saprolite thickness (Brocard et al., 2015b) and associated drainage density. In only a few cases were abandoned river terraces and hanging pediments found in the wake of migrating knickpoints.
The method has some limitations: first, local variations in bedrock erodibility maybe not be systematically detected, as a result of the imprecision of geologic maps, especially in the least accessible parts of the SM and AC ranges. Second, large intra-formational changes in facies can generate variations in bedrock resistance as sharp as (or even sharper than) erodibility differences between mapped geological units. These two effects may lead to the interpretation of stable knickpoints as migrating knickpoints. Conversely, some migrating knickpoints may be pinned to lithological contacts (Crosby and Whipple, 2006), and filtered out by the analysis. Nonetheless, we consider that, given the large number of analyzed knickpoints, the analysis captures the most import aspects of the evolution of the landscape within the study area.
4.1 Rock uplift and stream incision chronology from dating
The Maya surface (Figs. 2 and 3) likely formed close to sea level because it can be traced to the coast of the Caribbean Sea (Brocard et al., 2011). It was once covered by extensive fluvial deposits, especially south of the Motagua fault, where the fluvial deposits are preserved below extensive ignimbrites (Williams and McBirney, 1969). The lahar deposit of Chujuyúb rests directly on a thick saprolite that blankets the Maya surface. Lahar emplacement predates the incision of a 450 m deep valley. The lahar yielded a plateau age of 12.54±0.04 Ma (Fig. S1-1, Table S1-2 in the Supplement). It indicates that incision at Chujuyúb started after 12 Ma. This is consistent with the proposed 12 Ma entrenchment of the Cuilco River valley into the Maya surface (Fig. 7), 70 km to the NW of Chujuyúb (Brocard et al., 2011), as well as with the 10.3 Ma emplacement of an ignimbrite within the Colotenango valley (Fig. 2), 35 km to the NNW of Chujuyúb (Authemayou et al., 2012), which is shallowly incised into the Maya surface. It is also consistent with the 7.4 Ma deposition of an ignimbrite within a paleovalley, incised 1 km into the Maya surface (Fig. 2), 10–30 km to the NE of Chujuyúb (Brocard et al., 2011). The depth reached by the late Miocene valleys prior to their abandonment implies that incision proceeded at >140–280 m Myr−1 from 12 to 7 Ma, assuming that the dissection of the Maya surface started at 12 Ma (a, Fig. 9). Incision rates averaged over the length of the paleovalleys, between the SC and AC ranges, range from 145 to 205 m Myr−1 (b, Fig. 9). Subsequent incision, from the base of the late Miocene valley fills, down to modern valley floors, only amounts to a few tens of meters, at rates of <30 m Myr−1 (c, Fig. 9).
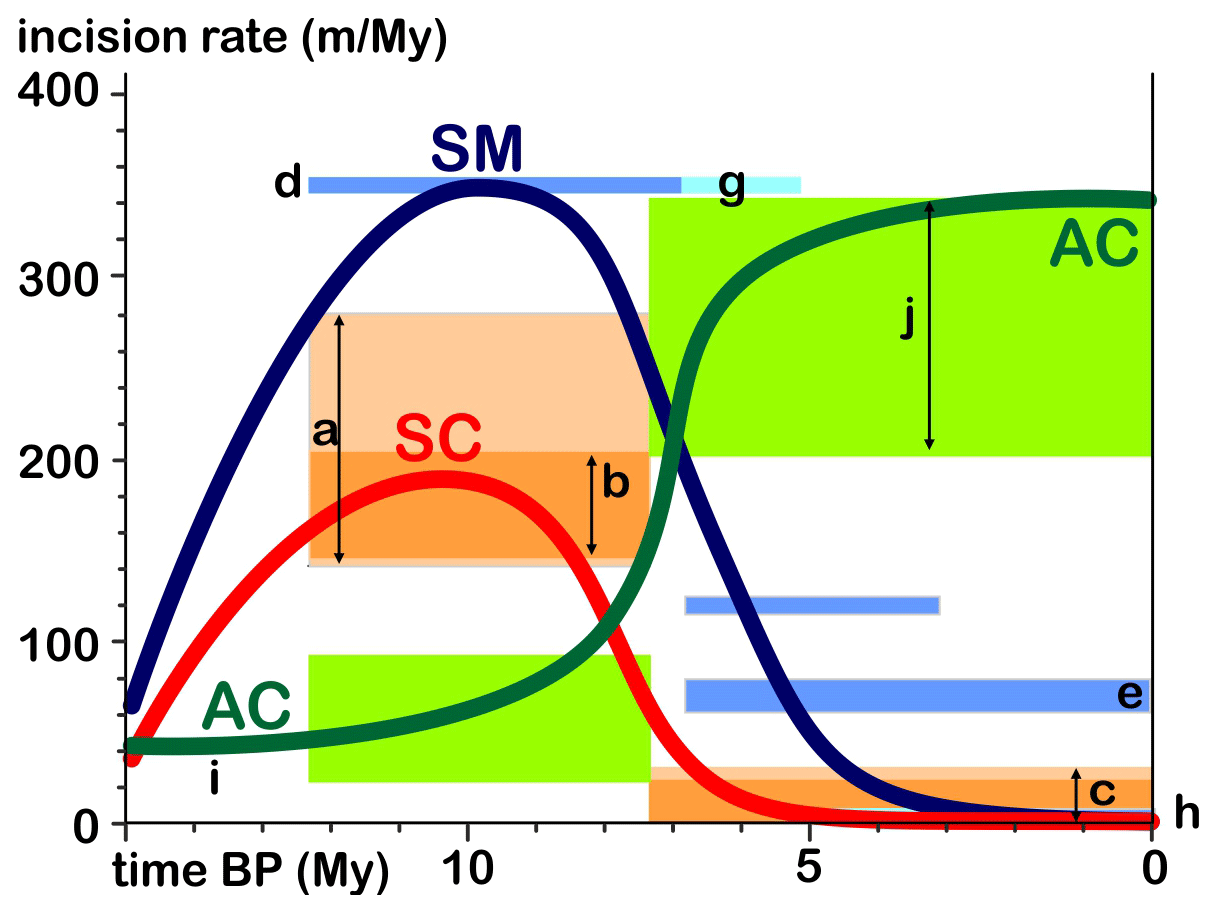
Figure 9Evolution of incision rates in the studied ranges. Letters a–j correspond to river incision rates inferred from 40ArAr dating (see text). Double-arrowed black lines show the range of calculated value for each of incision rate. Rectangles show the range of calculated values and time span of each of incision rate. Curves show the overall evolution of incision rates within each range, inferred from these discrete estimates. Blue shows Sierra de las Minas (SM), red shows Sierra de Chuacús (SC), and green shows Altos de Cuchumatanes (AC).
The chronology of incision along the southern side of the SC range is documented by remnants of basalt flows scattered along the floor of the Motagua valley. These flows track from vents located south of the valley on the Caribbean plate (Tobisch, 1986). The outcrop of El Jute represents the distal end of a lava flow that abutted the base of the SM range, backfilling the Huijo River valley with ≥70 m of basalt. The base of the flow lies >400 m above the Huijo River. Using the modern gradient of the transport-limited Huijo River as a proxy for its 6 Myr old gradient, we find that the basalt flow crossed the Motagua River 360 m above the current elevation of the Motagua River. The basalt yields a plateau age of 6.88±0.03 Ma and a slightly less constrained total age of 6.46±0.09 Ma (Fig. S1-1, Table S1-2). Assuming that incision of the Maya surface started 12 Myr ago, then the 2.6 km deep Motagua valley would have been incised at ∼350 m Myr−1 between 12 and 7 Ma (d, Fig. 9). Incision would have continued until today at an average rate of 79±4 m Myr−1. If the basalt dam was removed rapidly, however, then incision would have instead proceeded more slowly, at 59±9 m Myr−1.
The chronology of incision can be refined by incorporating the previously dated basalts (Tobisch, 1986). The closest occurrence, located 6 km upstream along the Motagua River, is the 6.1 Ma Cerro lo de China flow. The flow was actually emplaced 120 km farther west at current plate boundary slip rates because it lies on the southern side of the Motagua fault. Conversely, the 3.1±0.7 Ma Cerro Onanopa was emplaced on the same side of the plate boundary, 16 km upstream of El Jute. Its high vesicularity implies an emplacement at or near the ground surface, rather than as a sill deep within the Subinal Fm. followed by exhumation. Its base lies <10 m above the Motagua River. Strath terraces of the Motagua River have been cut in its flanks (Tobisch, 1986), indicating that the flow underwent some minor burial and exhumation. The accordance in elevation between its basal contact and the Motagua River suggests that the Motagua River has oscillated tightly around its current vertical position over the past 3 Myr.
Incision of the Motagua valley, from the elevation of the basalt of El Jute down to the current valley floor, would thus have occurred between 6.1 and 3.1 Ma at m Myr−1 (f, Fig. 9). If, after the emplacement of the basalt of El Jute, incision continued at the same ∼350 m Myr−1 rate as before (g, Fig. 9), then incision would have reached the current valley floor at ∼5 Ma, with no incision taking place afterwards (h, Fig. 9). The evolution of incision during the rise of the SC-SM range therefore looks similar on either side of the range: it is dominated by a single step of rapid incision, at 140–350 m Myr−1, between 12 and 7–5 Ma, followed by an almost complete cessation of incision along the main trunk streams (the Motagua and Chixóy Rivers), which act as base levels of the streams located in the SC range.
Large steeply dipping faults bound the Eocene fill of the Motagua valley. Dip-slip on these faults could be responsible, in part or in whole, for the deepening of the Motagua valley, a possibility contemplated by Tobisch (1986). Various traits of the valley, however, rule out any substantial contribution of these faults. First, fluvial sediments have bypassed the Motagua valley since Eocene time, feeding a transtensional basin at the lowest eastern end of the Motagua valley (Fig. 1b). Second, the alluvial fans that have grown astride these faults show no evidence of faulting, nor any anomaly in their catchment/fan surface ratios (Tobisch, 1986). Third, the faults encountered along the base of the SC-SM range exhibit only ancient, ductile to ductile-brittle left-lateral deformation (Bosc, 1971; Roper, 1978). Finally, the middle Miocene low-relief surfaces lie at about the same elevation north and south of the Motagua fault (Simon-Labric et al., 2013). Extension of antithetic boundary faults would need to remain well-balanced, despite hundreds of kilometers of left-lateral displacement along the Motagua fault since the middle Miocene, to avoid the development of significant offsets of these surfaces. The deepening of the Motagua valley therefore appears to have been achieved by erosion, through the removal of the erodible Eocene sediments that filled the Eocene fault basin, giving the valley the appearance of a recently active graben.
The incision chronology of the AC range is constrained by transverse paleovalleys that are shallowly incised into the Maya surface (e.g., Figs. 8a, i and 9). Uplift of the AC range since their abandonment provided space for the incision of 1500–2600 m deep valleys along the northern flank of the range (Fig. 3) at 200–350 m Myr−1 (j, Fig. 9). River incision of the AC range therefore started and developed while river incision in the SC-SM range was stalling.
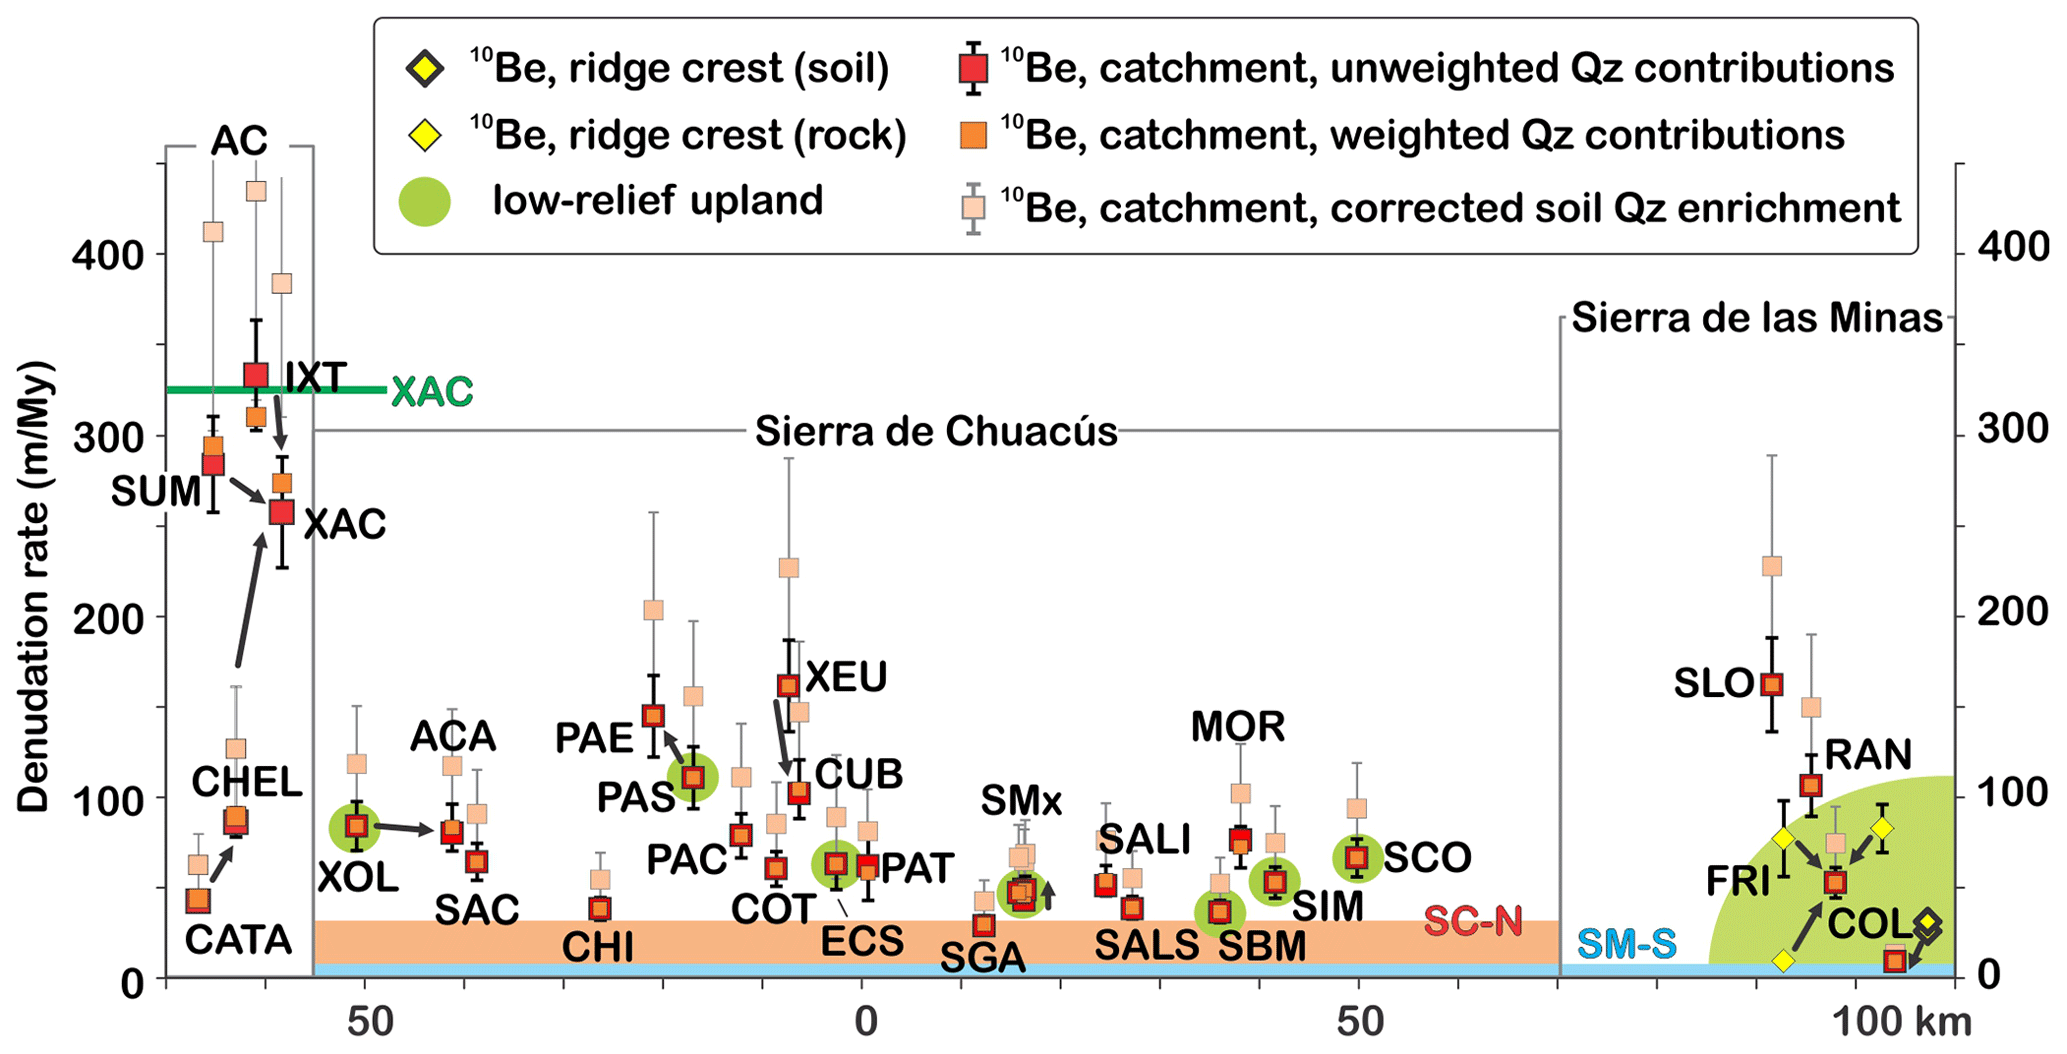
Figure 10Variations in detrital 10Be hillslope erosion rates along the strike of the plate boundary, from the AC range in the west, to the SM range in the east. Data are projected along the strike of the plate boundary, on an arc displayed on Fig. 6. Arrows show a feeding relationship between nested hillslope sites and catchments. Some uplands drain remnants of the middle Miocene Maya surface (green shaded areas). Detrital 10Be hillslope erosion rates are compared to river incision rates along the northern (salmon-colored shaded area, SC-N) and southern (blue-shaded area, SM-S) base of the SC-SM range over the past 7 Myr. XAC shows the peak incision rates in the AC range along Río Xacbal, below the Maya surface (Fig. 3).
4.2 Spatial variations in 10Be-derived erosion rates
Catchment-averaged detrital 10Be erosion rates range from 11 m Myr−1 within the catchments that drain the Maya surface on the SM range, up to 330 m Myr−1 along the wet and steep northern flank of the AC range (Fig. 10). Most slowly eroding catchments are located within the SC range. Weighting erosion rates by the relative concentration of quartz in quartz-feeding lithologies only marginally affects the calculated rates (by 3.4 % on average in the SC range, 4.8 % in the SM range, and <7 % in the AC range). Quartz enrichment corrections, on the other hand, increase erosion rates by up to 40 % (Fig. 10, Table S2-2), but the amplitude of this effect remains speculative in the absence of field measurements. However, because quartz enrichment increases with weathering intensity, its effects are probably smaller in the AC range, where soils erode the fastest. Quartz enrichment could therefore act such as to reduce contrasts in erosion rates between the SC-SM range and the AC range.
In the AC range, erosion rates (arrows, Fig. 10) show a marked increase from the drier and less steep highlands to the wet and steep frontal slopes (from CATA to CHEL to XAC). The SM range displays a similar trend of increasing erosion down the mountain flank, as entrenchment in the Maya surface increases (from COL to FRI to RAN), with one outlier (SLO). The magnitude of increase in the SM range is intermediate between the ones measured in the SC and CA ranges. In the SC range indeed, a downstream increase would be expected to occur first in the downstream direction, between the drainage divide and the mountain flanks, as a result of the decreasing contribution of slowly eroding low-relief uplands with downstream distance (Willenbring et al., 2013b). Increase should be followed by a decrease in erosion rate as rivers start draining pediments that floor the Chixóy River catchment. An increase in erosion rate, downstream of the paleosurface, is measured (from PAS to PAE), but it is much less pronounced than in the AC range. The decrease in erosion rate is also very subdued (from XEU to CUB). In one case (from SMS to SMM to SMI), no increase or decrease is observed.
4.3 Distribution of streambed types
A total of 9 % of the rivers retained in the analysis do not host any knickpoint, 16 % host one knickpoint, 51 % host 2–5 knickpoints, and 25 % host 5–12 knickpoints (Fig. 11), reflecting the high degree of segmentation of many rivers and high density of knickpoints. The knickpoints delimitate 452 river segments, of which 92 % are well linearized, 6 % are concave, and 2 % are convex, for an applied intrinsic concavity θ=0.5. River segments were grouped according to streambed types. The distribution of streambed types according to elevation is projected along the strike of the studied ranges on Fig. 12, and their distribution across the strike of the ranges on Figs. S4-2 to S4-6.

Figure 11Distribution of rivers according to the number of segments identified in each river.
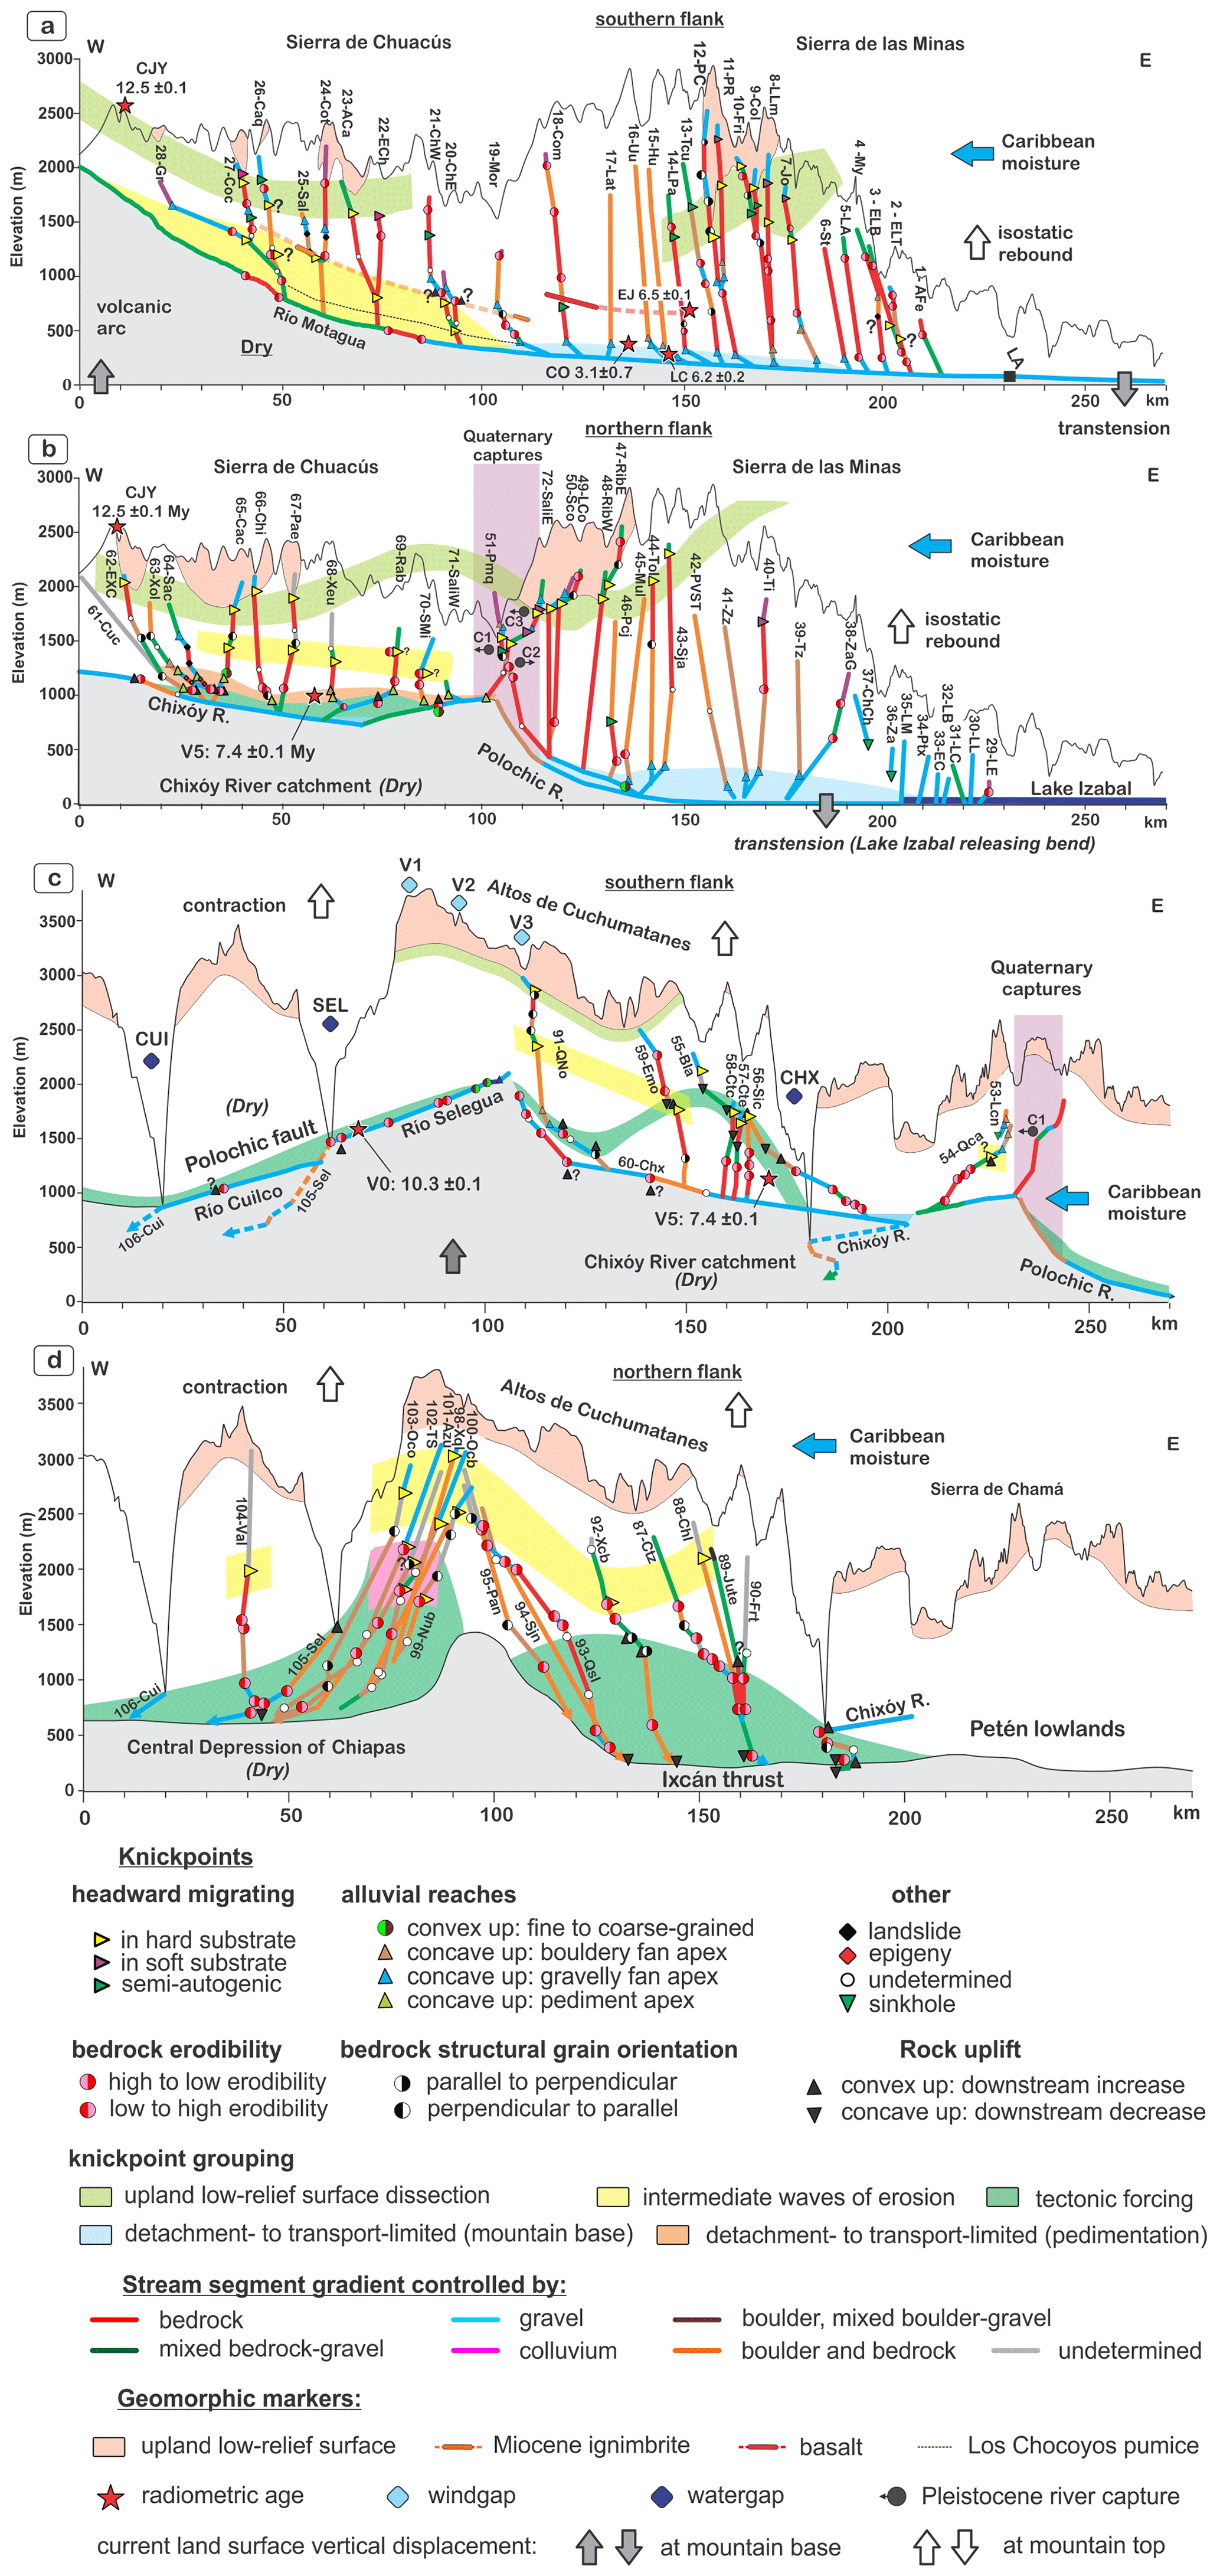
Figure 12(a, b) Distribution of linearized stream segments and knickpoints along the SC-SM range. (c, d) Distribution of linearized stream segments and knickpoints along the AC ranges. Distribution of linearized stream segments and knickpoints along the SC-SM and AC ranges. Mountain ranges are projected on the plate boundary, according to a small circle defined on Fig. 6. (a, b) Southern and northern flanks of the SC-SM range. (c, d) Southern and northern flanks of the AC range. The key to the abbreviated stream names is provided in Table S4-1 and in the captions of Figs. S4-2 to S4-7. Water gap names are as follows: CUI is Cuilco, SEL is Selegua, and CHX is Chixóy. Paleovalley numbering is taken from Brocard et al. (2011), river capture numbering is taken from Brocard et al. (2012). LA represents the city of Los Amates.
The distribution of alluvial reaches is bimodal in the SC-SM range (Fig. 12a1 and b2): alluvial reaches tend to be found either at the base of the mountains or at high elevation over the remnants of the Maya surface (e.g., Fig. 8a and d). High-elevation alluvial reaches tend to transport a rather fine-grained bed load, composed of sand derived from the weathering of micaschist, gneiss and granite, and gravel derived from quartzose veins and silicified pegmatites (Brocard et al., 2012). Intermediate-elevation alluvial reaches occur upstream of obstructions, most notably landslides in the SM-SC range, over extremely erodible fault damage zones, and within localized areas of tectonic subsidence (especially along the Polochic fault corridor, on the southern flank of the AC range).
Boulder reaches are found mostly on crystalline rocks. There, they are more frequent on the wet slopes SM range than on the dry slopes of the SC range. In the SM range, many boulder-strewn reaches form after the winnowing of the fine-grained matrix of debris flows. The SM range is the first range hit by tropical depressions tracking from the Caribbean Sea. They trigger numerous landslides along the wettest slopes of the SM range (Ramos Scharrón et al., 2012; Bucknam et al., 2001). Because SM range soils are more frequently close to water saturation, they are more likely to be affected by landslides when earthquakes strike the range (Harp et al., 1981). In the SM range, boulder armoring is common on the serpentinite mélanges that crop out up to high elevations along its southern flank, owing to the presence of knockers in the mélanges (e.g., Fig. 8c). Boulder-strewn reaches in the AC range form over phyllites. There, boulders are made of the most resistant beds of Pennsylvanian phyllites and of sandstone and limestone blocks derived from overlying formations that slid along valley flanks down to the streambeds.
Bedrock river reaches are most commonly found downstream of convex migrating knickpoints, the distribution of which is presented in the following section.
4.4 Distribution of steady and migrating knickpoints
Among the 350 identified knickpoints, 40 % can be tied to variations in bedrock erodibility, 6 % to temporary obstructions, 8 % to active tectonics, 21 % to upstream-migrating waves of accelerated erosion, and 14 % to upstream-migrating waves of decelerated incision. A total of 11 % are composite and result from some combination of the above.
Details about the significance of the distribution of steady knickpoints, as well as a more systematic review of the origin of all identified clusters of migrating knickpoints, are provided in Supplement 4. Some migrating knickpoints can be tied to well-identified and well-dated river Quaternary diversions (e.g., S3-1 to S3-3, Fig. 12a2, Brocard et al., 2012). Most migrating knickpoints dot the brim of upland low-relief surface remnants (Figs. 12a1 and a2 and 8d). They may have therefore initiated when the Maya surface started being incised, at ∼12 Ma, on the sides of the rising SM-SC range. Other clusters of migrating knickpoints are found halfway down mountain flanks. The most conspicuous of these clusters is restricted to the northern flank of the SC range, within the watershed of the Chixóy River. It hangs above a cluster of concave-up migrating knickpoints located at the apexes of pediments restricted to the drainage of the Chixóy River. The significance of these concave-up knickpoints and their genetic relationship with the clusters of convex knickpoints located upstream is discussed in Sect. 5.4.2.
The decline of river incision rates in the SC-SM range was coeval to the rise of in the AC range (Fig. 9). This can reflect a complete transfer of rock uplift from the SC-SM range to the AC range, but it remains surprising that river incision rates declined so sharply within the SM range, considering that the range had not undergone any substantial topographic decay. Likewise, very low hillslope erosion rates are maintained on steep slopes within the SC-SM range today. A genetic relationship can therefore exist between the rise of the AC range and the decline of river incision and hillslope erosion in the SC-SM range. The rise of the AC range may have affected incision rates in the SC-SM range in two ways. First, by decreasing moisture delivery to the SC-SM range, it may have reduced hillslope erosion rates and the delivery of water and sediment to the streams, thereby decreasing river incision rates. Second, by forcing the drainage of the northern side of the SC range to adjust to rock uplift in the AC range, it promoted a decrease in river incision rates upstream of the AC among the rivers of the SC range that still cross the AC range. After reviewing the respective contributions of these top-down and bottom-up processes, we analyze how they combined to affect the present-day morphological evolution of the SC-SM range.
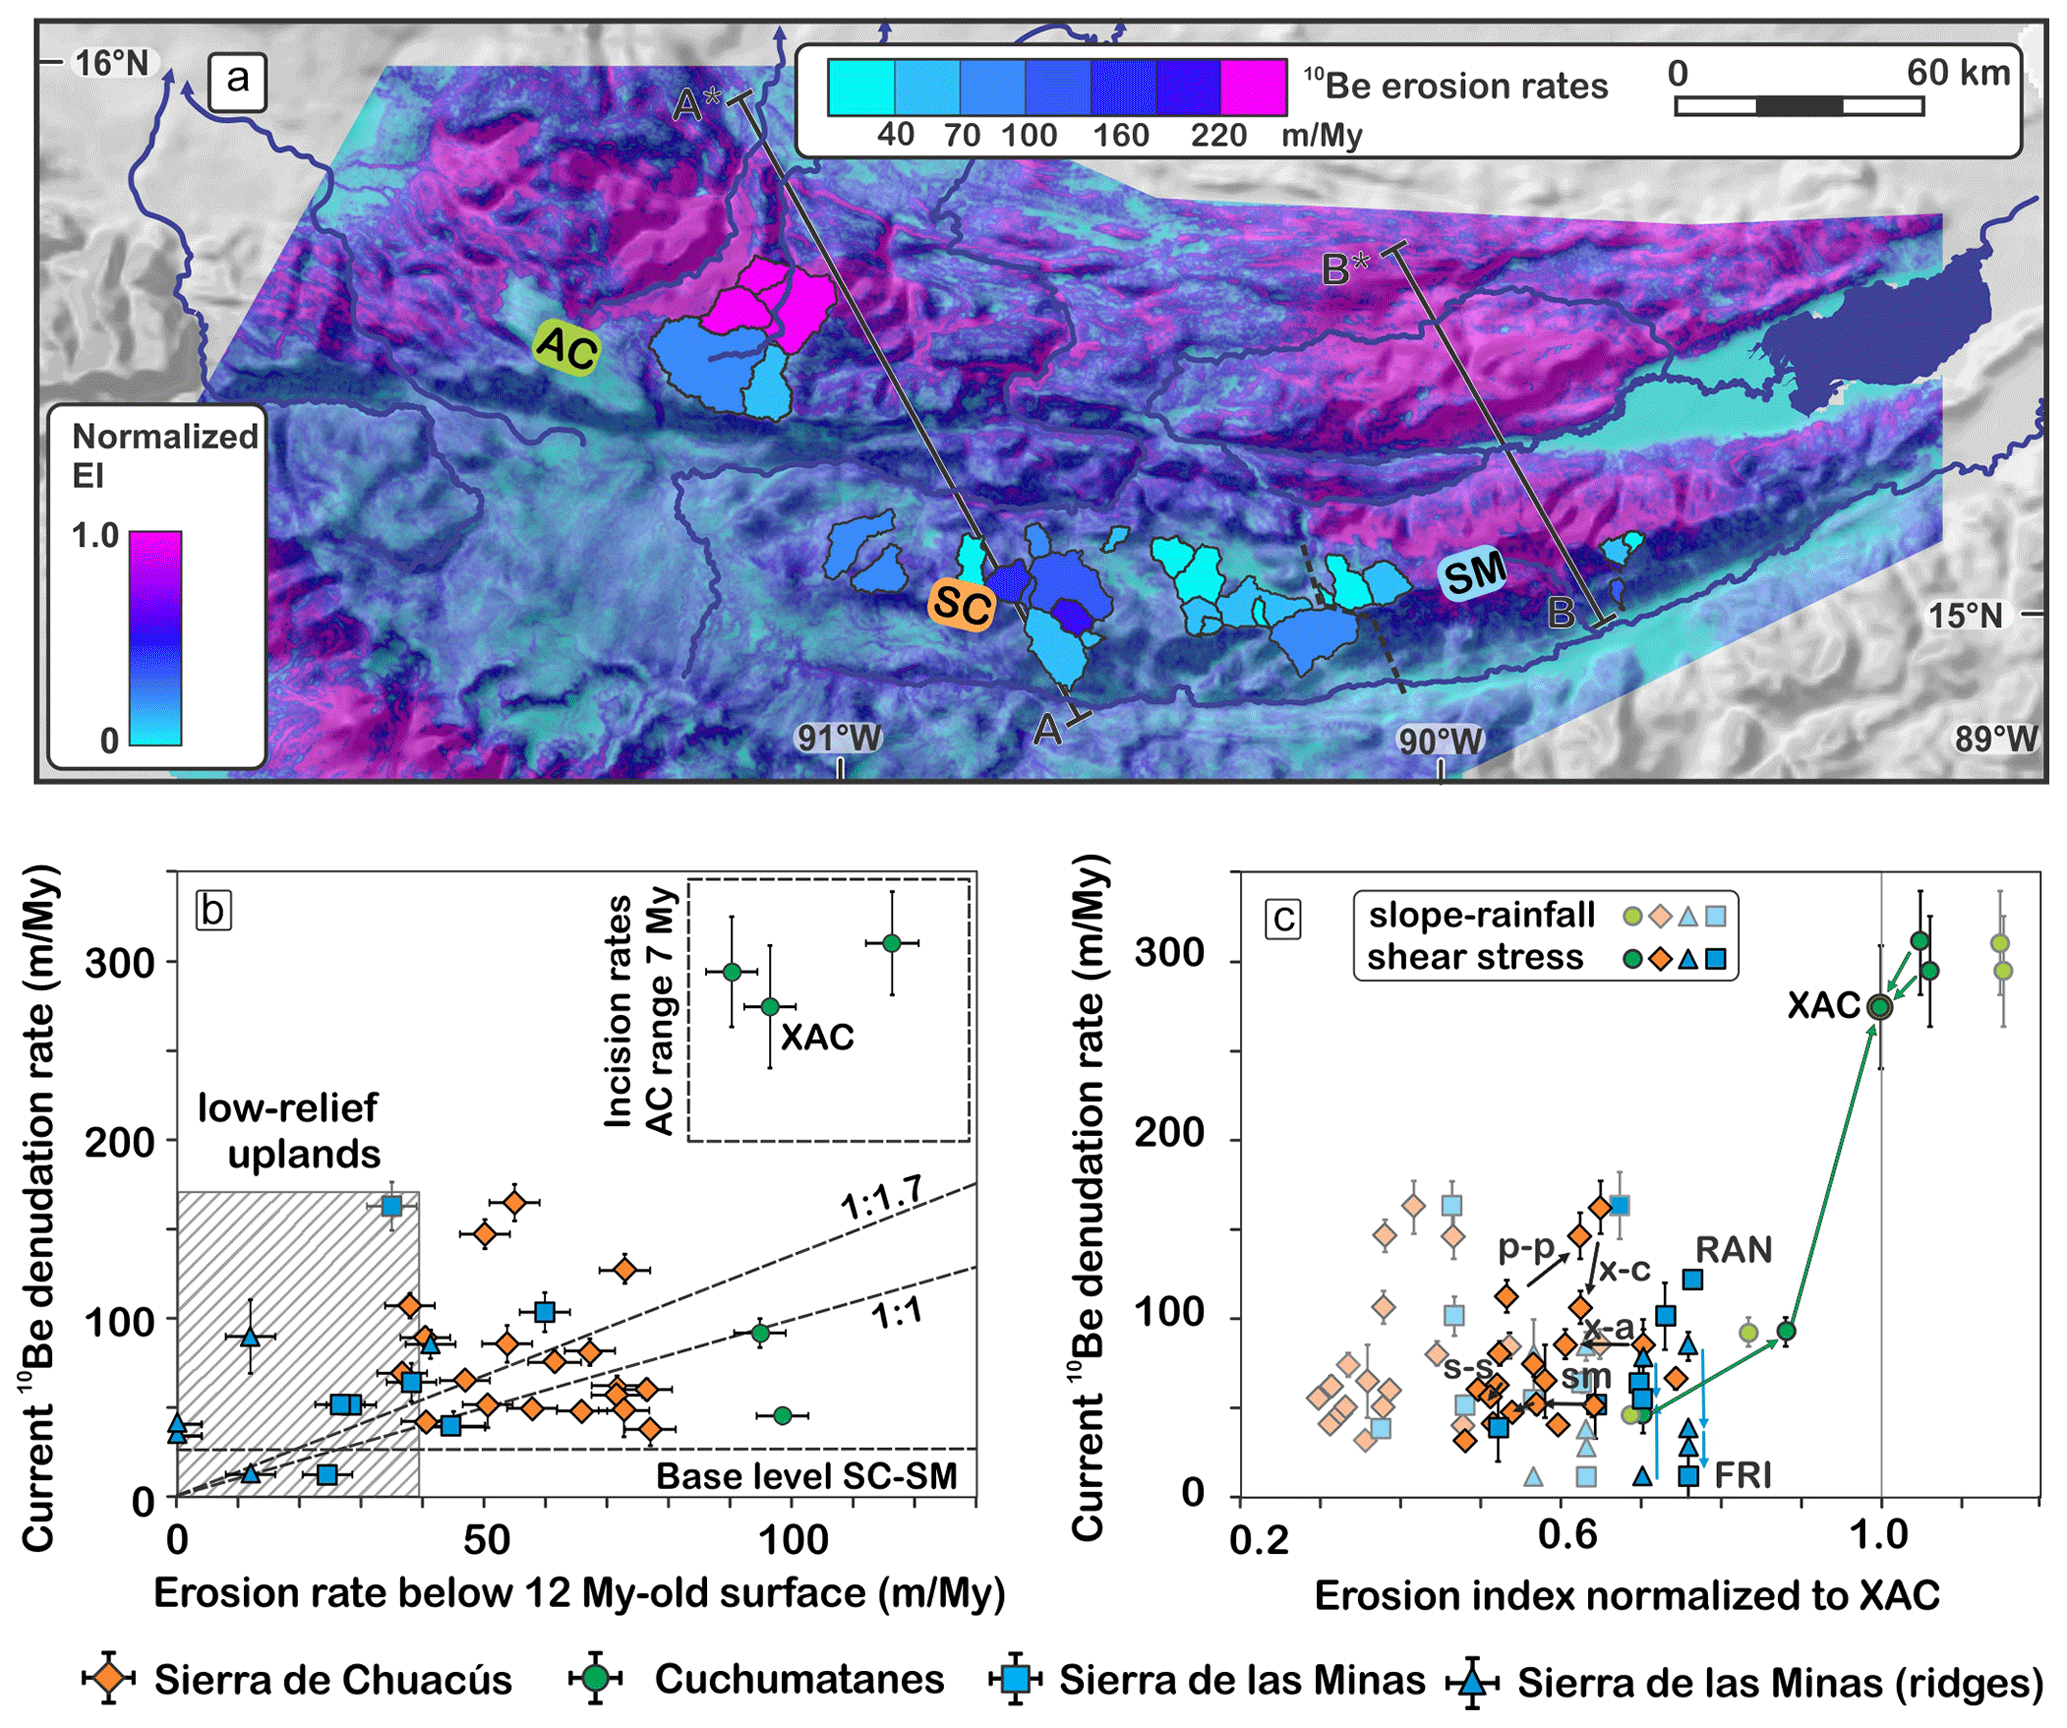
Figure 13(a) Map showing the spatial distribution of normalized catchment-wide 10Be erosion rates superposed to the predicted spatial distribution of erosion according to the normalized erosion index. (b) Catchment-wide 10Be erosion rates as a function of catchment-averaged precipitation. (c) Catchment-wide 10Be erosion rates as a function of catchment-averaged slope (from quartz-contributing slopes) Arrows show downstream connections between the nested catchment within the AC range. The dashed line shows the linear correlation within AC range data, with the correlation coefficient (r2) reported next to the line.
5.1 Effect of the rise of the AC range on climate-driven hillslope erosion
5.1.1 Climate and hillslope erosion in modern times
Silicate weathering is 3 times faster on the wet (1800–3000 mm yr−1, Fig. 4) side of the SM range than along its drier (1000–2400 mm yr−1) side (McAdams et al., 2015). Using detrital cosmogenic 10Be, we find that the wet (1900–3700 mm yr−1) side of the AC range erodes distinctively faster on average (with a 92 % probability, based on a Welch's t test, with t=2.246, p=0.08) than the drier (900–1300 mm yr−1) SC range. Individual catchments document a 6-fold increase in erosion (50 to 300 m Myr−1) from the SC range to the AC range (Figs. 10 and 13b and c). The spatial distribution of erosion rates predicted by the Erosion Index (Fig. 13a), which combines the effects of slope and precipitation on erosion, is consistent with the spatial distribution of measured detrital 10Be erosion rates. 10Be-feeding slopes in the AC range receive 3 times more precipitation ( m yr−1) than their counterparts in the SC and SM ranges ( and 1.2±0.3 m yr−1, respectively, Fig. 13b). Comparatively, 10Be-feeding slopes in the AC range are marginally (1.2 times) steeper (26±4∘) than in the SC and SM ranges (22±3 and 22±2∘, respectively, Fig. 13c). In the AC range, a linear relationship is observed between erosion rate, precipitation (r2=0.83), and slope (r2=0.95). When all ranges are considered together, however, the correlation is weaker (r2=0.61 for precipitation and 0.52 for slope) and very weak if the SC and SM range are considered individually (). The strong correlation in the AC range stems foremost from the greater homogeneity in bedrock erodibility among the measured catchments. In the AC range, slope gradient and MAP are good predictors of hillslope erosion rates at precipitation >2 m yr−1 (Fig. 13b). However, this linear relationship predicts that erosion ceases for MAP < 2 m yr−1 and slopes <15∘. By contrast, if the entire dataset is considered, the linear regression predicts that erosion tends toward zero as MAP declines toward zero, while hillslope erosion ceases on slopes that are still steep (≥19∘, Fig. 13c). Globally, erosion rates <50 m Myr−1 are generally observed at slope values <10∘ (Willenbring et al., 2013a). They are here measured in many catchments of the SC and SM ranges that still maintain average slope values of 18–25∘, pointing to a significant contribution of aridification to the limitation of erosion. The overall decrease in the steepness of the relationship between erosion and MAP curve from the AC range to the overall dataset may imply that the relationship is nonlinear and that the curve flattens for MAP < 2 m yr−1, a trend observed elsewhere (for example, at MAP < 2 m yr−1 on Kauai; Ferrier et al., 2013).
For MAP < 2 m yr−1, MAP is a poor predictor of erosion rates, likely because storminess and rainfall intensity become better predictors of hillslope erosion (Liang et al., 2020). The correlation between slope and erosion rates in the AC range implies that slopes have not reached the critical threshold for slope stability (Clarke and Burbank, 2010) in the AC range. In the SC range, slope steepness only faintly captures variations in erosion rates (r2= 0.41) under low MAP. Comparison between nested catchments indeed shows, in four out of six instances, that decreases and increases in EI values are not associated with significant changes in erosion rates.
It seems therefore that the most arid parts of these ranges erode slowly to very slowly, despite maintaining steep slopes. Besides, slope steepness and MAP become poor predictors of short-term (103–104 years) hillslope erosion rates at low MAP. The pattern of catchment-averaged 10Be erosion rates therefore shows that aridification limits the erosion on steep slopes. Fluctuations of climate over millions of years can therefore be expected to impact the long-term evolution of these ranges. This aspect is explored in the following section, particularly the interplay of mountain building and climate evolution in central Guatemala.
The sequential rise of the SC-SM and AC range generated an evolving pattern of hillslope steepness and of precipitation that may have contributed to the decline of incision in the SC range since the middle Miocene. We review hereafter evidence for changes in climate and tectonics susceptible to having impacted hillslope steepness and erosion over time.
5.1.2 Evolution of climate over the SC range since the rise of the AC range
The distribution of precipitation (Fig. 2) shows that the AC range currently prevents the ingress of moisture tracking from the Yucatán and Petén lowlands toward the SC range. Moisture was therefore likely able to reach the SC range before the rise of the AC range. Such a deep penetration of moisture is supported by paleo-precipitation estimates obtained from the analysis of tree species and of paleosols in the 7.4 Ma forest of Sicaché (Fig. 2). This subtropical forest was growing on the floor of a late Miocene paleovalley. The geochemical characteristics of its paleosols suggest mean annual precipitation between 950 and 1300 mm yr−1 (Brocard et al., 2011). Today, the fossil forest is located in a drier area covered by xerophytic vegetation. The SC range therefore likely received higher precipitation between 12 and 7 Ma, and its aridification was coeval to the rise of the AC range. Aridification likely led to the decrease in hillslope erosion rates, down to the values that are measured today.
5.2 Effect of the rise of the AC range on tectonically driven river incision in the SC range
The rise of the AC range sparked widespread reorganization of the range-transverse drainage (Brocard et al., 2011), tectonically defeating many rivers that used to cross the AC range. Some rivers maintained a course transverse to the rising structure by steepening their gradient. We review hereafter the evidence for faster rock uplift in the AC range than in the SC range, river course lengthening along the Polochic fault, and decreased rock uplift rates in the SC range. We review the contribution of each of these tectonic processes to the decline of river incision in the SC range.
5.2.1 Fast, ongoing rise of the AC range from river channel steepness
The deformation of paleovalleys abandoned during the uplift of the AC range documents >1–2 km of rock uplift in the AC range relative to the SC range since the late Miocene (Brocard et al., 2011), implying on average faster rock uplift in the AC range than in the SC range over 7 Myr. Whether such difference continues today is important to establish before analyzing river profile dynamics. Glacial and fluvial landforms in the AC range suggest that the AC range still rises faster than the SC range today. A 20×30 km ice cap was established on the summit plateau of the AC range (Fig. 1) during the last glaciation (Anderson et al., 1973; Lachniet and Vazquez-Selem, 2005). On other neotropical mountains, last glaciation moraine arcs are set in moraine arcs deposited by more extensive glaciers during earlier glaciations (Lachniet and Vazquez-Selem, 2005). In the AC range, however, older moraine arcs are not observed. Their absence implies that earlier ice caps were smaller than the one that occupied the plateau during the last glaciation. Their deposits were eroded away by the last glaciation ice cap. There is no particular reason why climatic forcing would have affected central Guatemala in a different manner that other neotropical areas. The most straightforward explanation therefore is that the fraction of the range located above the equilibrium line of accumulation (ELA) has increased steadily from one glacial cycle to the next as a result of sustained surface uplift. Uplift was fast enough to overcome differences in the intensity of glacial cycles from one cycle to the next. The effect of surface uplift on ELA was enhanced by the fact that the top of the range is a plateau, such that small increments of uplift bring large areas of the range above the ELA. The current driver of surface uplift is still contraction (Guzmán-Speziale, 2010; Authemayou et al., 2011), just as it was during the early stages of mountain growth. Erosional unloading driven by deep dissection along the northern flank of the AC range may now contribute substantially to surface uplift of the summit plateau.
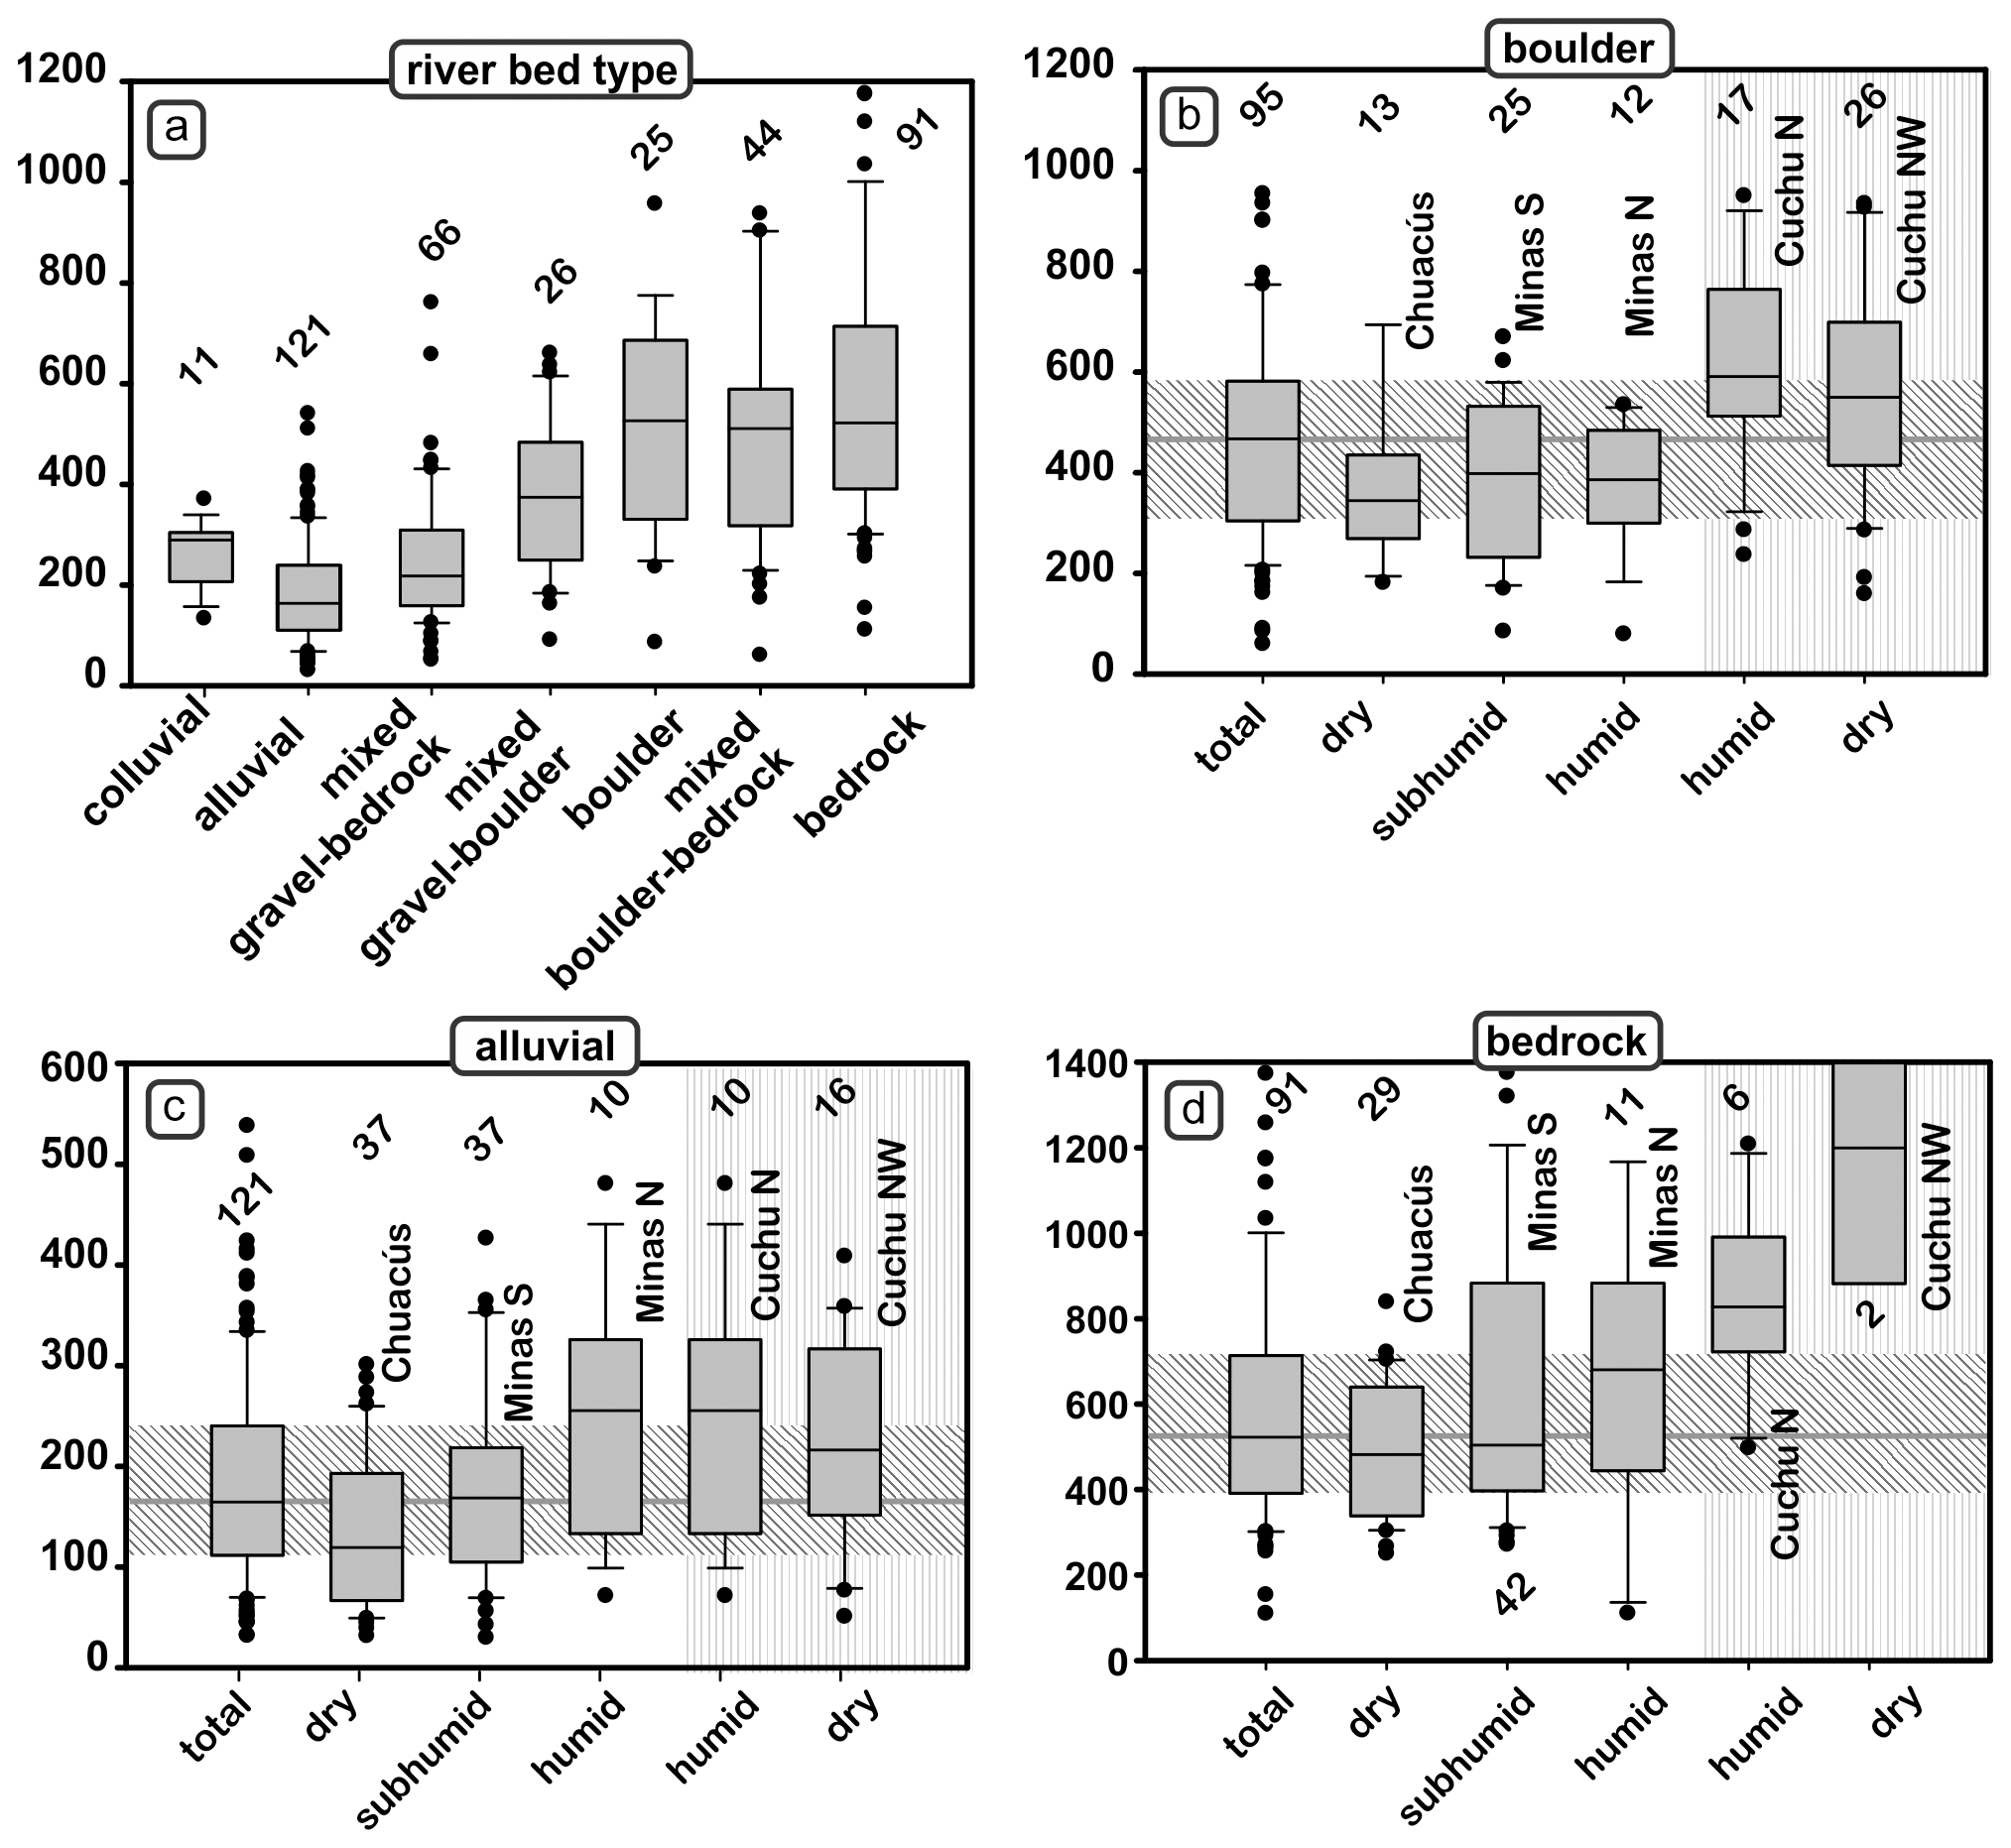
Figure 14Box plots of stream segment normalized steepness as a function of streambed type and location. (a) Comparison of steepness by streambed environment. (b–d) Spatial variations in channel steepness across the study area, according to regions defined on Fig. 7, for the three main types of streambed environment: (b) boulder, (c) alluvial, and (d) bedrock. Numbers above box plots show the number of segments in each category. Oblique hatches show the average over the total number of segments. Vertical hatches show the rapidly uplifting AC range.
The steepness of river profiles in the AC range further support the hypothesis that the range still rises faster than the SC range. The projection of river profiles in χ space (Figs. S4-2 to S4-7) shows that, in each of the analyzed areas (AC, SC, and SM ranges), linearized segments with similar streambed conditions (alluvial, boulder-armored, bedrock) share similar θn-normalized steepness (Fig. 14a). Rivers that flow over bedrock are steeper than rivers that flow over immobile boulders, which in turn are steeper than rivers that flow over alternations of gravel bars or bedrock and boulder, which in turn are steeper than alluvial rivers. Each category, however, exhibits steepness values that change from one range to the next (Fig. 14b–d). It is expected that bedrock rivers conform to the predictions of the stream power law because their incision is detachment-limited. At dynamic equilibrium, their steepness should therefore scale with rock uplift, bedrock erodibility, and precipitation (Whipple and Tucker, 1999). The progressive increase in steepness from the SC range to the the AC range does not result from an increase in bedrock erodibility because erodibility is higher in the AC range than in the SC and SM ranges. It does not result either from the observed increase in precipitation from the SC to the AC range, as increased precipitation instead decreases river gradient. The steeper reaches of the AC range are therefore best explained by faster incision in the AC range, driven by faster rock uplift. This is consistent with the higher 10Be hillslope erosion rates measured in the AC range, assuming that slopes and channels are well coupled (Callahan et al., 2019).
Boulder-armored and alluvial channels are also steeper in the AC range (Fig. 14b and c). Boulders act as bedrock, and boulder-armored channels can therefore be expected to behave like detachment-limited channels. Alluvial channels are likely transport-limited, and therefore their gradient is less sensitive to rock uplift (Whipple and Tucker, 2002; Cowie et al., 2008). The observed increase in alluvial channel gradient therefore most likely reflects an increase in bed load grain size with increasing erosion rate, resulting from shorter residence time and limited comminution of bedrock blocks in hillslope soils (Riebe et al., 2015; Neely and DiBiase, 2020).
5.2.2 Tectonic steepening of rivers transverse the AC range
The four rivers that still cross the AC range are the Cuilco, Selegua, Chixóy, and Cahabón rivers (Fig. 7). Of these, the Cahabón River is the smallest. It is affected by an ongoing pulse of drainage rearrangement, which over the past ∼1 Myr has drastically reduced the size of the Cahabón River catchment south of the Polochic fault (Brocard et al., 2012). To analyze the impact of the AC range on transverse rivers, we therefore focus on the three other rivers. Two of these, the Chixóy and Selegua rivers, exhibit steeper profiles as they cross the AC range (Fig. 15). Along these steepened reaches, the rivers incise rock formations that they incise farther upstream without displaying similar steepening. The steepening is therefore not caused by more resistant rocks but by faster uplift in the AC range (Leland et al., 1998; Kirby, 2003), consistent with the steepening of rivers in the AC range described in the previous section. The limited steepening of the Cuilco River could imply that the AC range does not rise faster than areas located farther upstream in the area crossed by the Cuilco River. Such an interpretation, however, is at odds with documented ongoing contractional deformation in the area (Authemayou et al., 2012). Instead, the lack of steepening is better explained by the fact that the Cuilco River is transport-limited over its entire length, as evidenced by a continuous cover of alluvium. The Selegua and Chixóy rivers display alternations of bedrock and alluvial reaches typical of detachment-limited rivers. Transport-limited conditions tend to generate less steepening than detachment-limited conditions in response to enhanced rock uplift (Cowie et al., 2008; Whipple and Tucker, 2002). Transport-limited conditions along the Cuilco River result from the profuse delivery of volcanic gravel in its headwaters, where river drains the Central American volcanic arc. The Chixóy River also drains the volcanic arc, but volcanic gravel sources in the Chixóy River catchment are located farther away from the AC range, such that, by the time the Chixóy River reaches the AC range, most of this gravel has been trapped or comminuted and its bed load is dominated by proximal gravel sources (Deaton and Burkart, 1984).
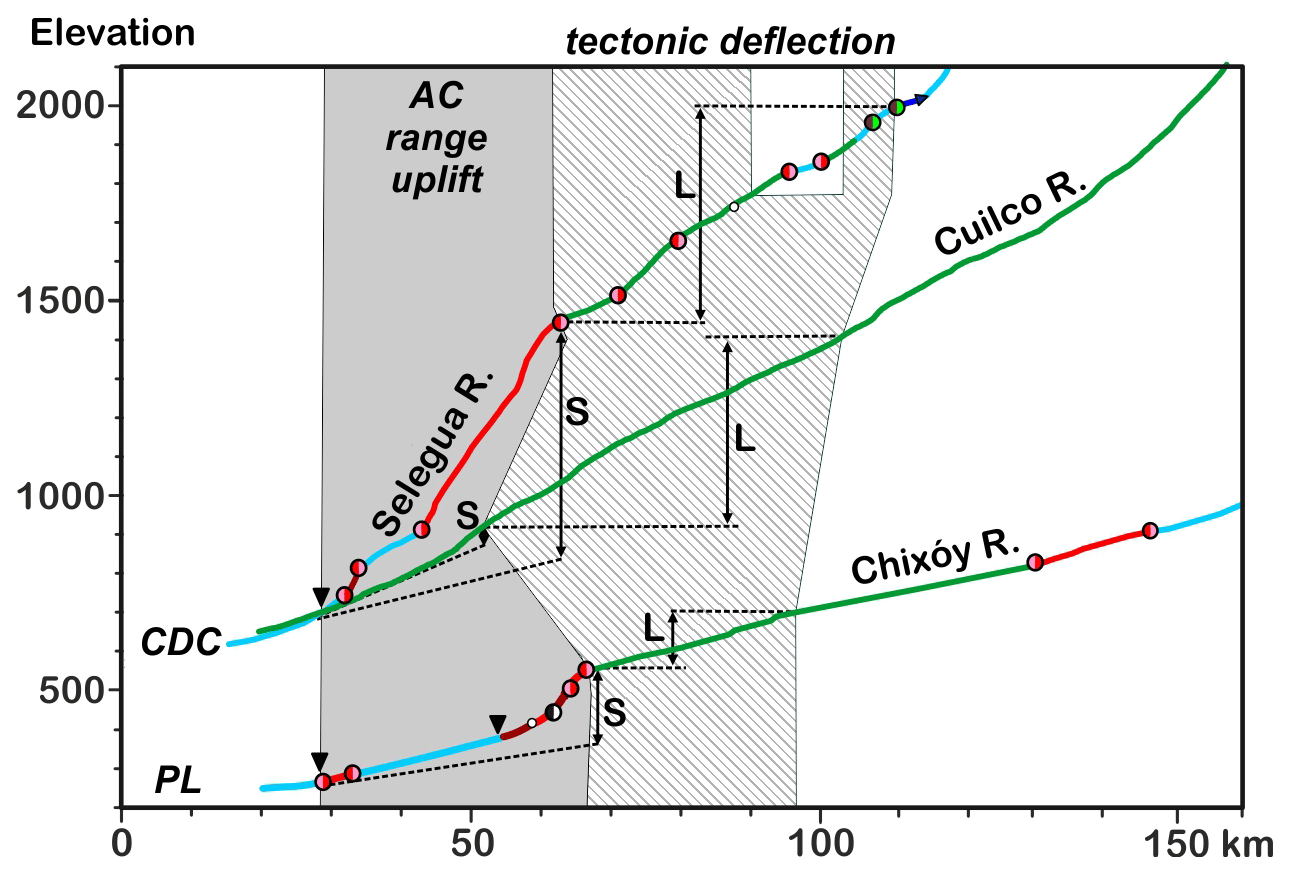
Figure 15Long profiles of rivers transverse to the AC range (Chixóy, Selegua, and Cuilco), with indications of reaches affected by vertical rock uplift (grey area), and those affected by horizontal lengthening along the Polochic fault (hatched area). S and L represent contributions of steepening and lengthening to the uplift of river profiles upstream of the AC range. River knickpoint nomenclature is listed in Fig. 12.
5.2.3 Transient slowing of incision in the SC range in response to river steepening in the AC range
The steepening of river profiles across the AC range occurs in response to the rise of the AC range in an area previously characterized by a foreland through which flowed shallow-gradient rivers. The phase of steepening that converted these shallow-gradient rivers to steep-gradient transverse rivers should have ended when the gradient of the transverse rivers became steep enough for river incision to counterbalance rock uplift in the AC range. Steepening requires the headwaters to rise with respect to the foreland. Such rise requires a transient imbalance, upstream of the AC range, during which incision rates are lower than rock uplift rates. The sharp drop in incision rates in the SC range from 145–205 to <30 m Myr−1 after ∼7 Ma (see Sect. 4.1) could have been driven by the steepening of the Chixóy River in response to the rise of the AC range, because the Chixóy River is the outlet of most rivers draining the northern flank of the SC range.
Using the river profile of the Chixóy River (Fig. 15), it can be assessed that ∼190 m of surface uplift along the Chixóy River can be ascribed to river steepening at ∼27 m Myr−1. If before 7 Ma rock uplift rates in the SC range matched its incision rates of 145–205 m Myr−1 (Fig. 9), then (if such uplift rates were sustained after 7 Ma) 1.5 to 2 Myr would be necessary to lift up the Chixóy River to its current elevation upstream of the AC range. Incision would resume afterwards. This estimate has limitations, in particular because the Chixóy and Selegua rivers experienced large changes in drainage area upstream of the AC range during the 7 Ma reorganization event (Brocard et al., 2011), which affected their gradient across the AC range. The Chixóy River was initially smaller, and therefore probably steeper. Conversely, the Río Selegua lost some of its headwaters, and this loss may have contributed to its steepening. The calculation, however, suggests that the timescale of equilibration should be much shorter than the 7 Myr that have elapsed since the AC range started to rise. Ever increasing rock uplift rate in the AC range would promote continuous steepening, and therefore could prevent the return of incision, upstream of the AC range. Although plausible, such an evolution remains speculative, because available data lack the resolution necessary to test it. We identified, however, other processes that can delay the resumption of incision along the northern flank of the SC range.
5.2.4 Slowing of incision in the SC range in response to river lengthening along the Polochic fault
River courses are progressively offset by felt-lateral slip on the Polochic fault, leading to the development of ever-lengthening tectonic deflections above the fault. Maintaining gradients along these deflections sufficiently steep to allow the downstream transport of the bed load requires uplift of river channels upstream of the tectonic deflections, commensurate to the amount of river lengthening. Before the rise of the AC range, left-lateral deflections formed at the contact between the SC range and the northern foreland. Streambed uplift along the deflections happened in an area where streambeds were shallowly incised, allowing frequent avulsions toward the foreland that annealed deflections (Sieh and Jahns, 1984) and limited river lengthening. The rise of the AC range promoted deeper entrenchment of the tectonic deflections along the Polochic fault, preventing the annealing of deflections and converting slip on the Polochic fault into permanent, cumulative river lengthening. The courses of the Chixóy, Selegua, and Chilco rivers have thus been lengthened by 25 to 40 km (Fig. 7). The westward increase in the length of these deflections, in a context of westward decrease in total slip on the Polochic fault (Authemayou et al., 2011), was interpreted as the result of an earlier entrenchment of the rivers in the west (Brocard et al., 2011). River lengthening drove 500, 600, and 150 m of surface uplift along the Cuilco, Selegua, and Chixóy rivers, respectively (Fig. 15). Because left-lateral slip on the Polochic fault has been fairly steady over the past 7 Ma, at 2.9±0.4 mm yr−1 along the Chixóy River deflection (Authemayou et al., 2012; Bartole et al., 2019), river lengthening and uplift likewise must have steadily contributed to surface uplift in the upstream parts of the Cuilco, Selegua, and Chixóy rivers, at 15±2 m Myr−1 along the Chixóy river. In contrast to river steepening, which generated 1.5 to 2 Myr of transient uplift, river lengthening has generated a constant uplift roughly proportional to slip rate on the Polochic fault.
5.2.5 Slowing of incision in the SC range in response to decreased in rock uplift rates in the SC range
With estimated surface uplift rates of ∼27 and 15±2 m Myr−1, tectonic steepening and river lengthening are the two bottom-up processes, driven by the rise of the AC range, that contributed to the decline in incision rates in the SC range. They only represent a fraction of the measured decline, which went from 145–205 m Myr−1 before 7 Ma, down to <30 m Myr−1 after ∼7 Ma (Fig. 9). The decrease may also result from a substantial decrease in rock uplift rate in the SC range.
A decrease in rock uplift rates in the SC range is documented by the difference in elevation between the paleovalleys located in the AC range, such as V3 (Figs. 2 and 8a), which underwent 2.8 km of uplift since ∼7 Ma (assuming an initial foreland elevation of 0.3 km), and the Chixóy River, which underwent only 0.35 km of uplift in the meantime. If the SC range had continued to rise after 7 Ma at the rate at which river incision was taking place in the SC range before 7 Ma (145–205 m Myr−1), then the resulting difference in elevation between V3 and the Chixóy River (0.9 km) would be only one-third of the actual difference. It would be even smaller than the 1 km of back-tilting measured along paleovalleys V4 and V5 south of the Polochic fault (Fig. 2 in Brocard et al., 2011). The observed difference therefore requires a substantial decrease in rock uplift in the SC range after 7 Ma.
Between 50 and 300 m of fluvial and volcanoclastic aggradation occurred along the rivers that used to drain the northern flank of the SC range prior to 7 Ma (Brocard et al., 2011). This phase of aggradation can be viewed as a transient response (van der Beek et al., 2002; Attal et al., 2008) to the rise of AC range (Brocard et al., 2011). It suggests that the AC range was already undergoing faster rock uplift than the SC range early during its growth. Rivers have since then incised down to pre-aggradation levels. If river incision in the SC range is now in dynamic equilibrium, then the lack of incision over the past 7 Myr implies that the SC range has not undergone any rock uplift relative to the foreland since 7 Ma. More precisely, rock uplift in the SC range would exactly match the 350 m of surface uplift necessary to accommodate river steepening in the AC range and river lengthening above the Polochic fault. We could not identify any obvious tectonic process whereby such a fine balance would be achieved.
5.3 Contribution of aridification to the decline of river incision in the SC range
The absence of incision in the SC range could also be viewed as a lack of response to tectonic forcing, in a landscape subjected to aridification since 7 Ma. By decreasing water discharge, aridification would reduce stream power. Besides, aridification could alter the balance between water and sediment discharges, such as to reduce sediment transport capacity and river incision (Beaumont et al., 1992). It could also dampen the delivery of tools to erode the bedrock (Sklar and Dietrich, 2006). A contribution of climate to the slowing down of incision is further supported by the evolution of the southern flank of the SC and SM ranges. These flanks, albeit exposed to a different tectonic forcing than the northern side of the SC range, underwent a similar decline in incision. The only possible contribution of bottom-up processes to the slowing down of incision along these flanks is the lengthening of the Motagua River at its downstream end into the Caribbean Sea. Such lengthening would promote surface uplift farther upstream in order to maintain the downstream dispersal of sediments. Some lengthening probably occurred during the emergence, at the downstream end of the river, of a transtensional basin (Fig. 1b) that has been filled with terrigenous sediments since the Mio-Pliocene (Carballo-Hernandez et al., 1988). This lengthening of >180 km involved <75 m of surface uplift (elevation of the river at the upstream end of the basin). This amount of uplift does not match the amount of surface uplift affecting the northern side of the range. It seems highly unlikely that independent tectonic phenomena, such as the uplift of the AC range and the lengthening of river courses along the Polochic fault to the north, the decrease in rock uplift rates within the SC range, and the lengthening of the Motagua River to the west, could produce a similar decline of incision on either side of the SC range. The aridification of the range, which is well documented on either side (Machorro, 2014), appears therefore to significantly contribute to the slowing down of river incision on both sides.
5.4 Topographic evolution of the SC range in response to the uplift of the AC range
5.4.1 Slowing down of hillslope erosion, topographic decay, and backwearing
Modern 10Be-derived hillslope erosion rates in the SC are higher (>50 m Myr−1) than the <30 m Myr−1 long-term river incision rates measured around the SC range (Fig. 10), suggesting that the relief of the SC range has been slowing decaying since 7 Ma. Hillslope degradation during the decay could account for the lower steepness of the quartz-feeding slopes in the SC range (22±3∘) compared to those in the AC range (26±4∘). Hillslope degradation should ultimately lead to the decrease of the local relief of the SC range. The preservation of the Maya surface on many summits and the absence of incision at the base of the SC range instead imply that the height of the SC range has not been significantly reduced over the past 7 Myr. Instead, decay appears to have proceeded by backwearing of the mountain flanks, from the base of the range inward, toward its divide. This is manifested by the development of pediments at the base of the range and by the presence of upstream-migrating river knickpoints on the backwearing slopes.
5.4.2 Origin of migrating river knickpoints within the SC range
Three clusters of migrating knickpoints are found at different elevations along the northern flank of the SC range (Figs. 8b and 12a2). The uppermost cluster consists of convex knickpoints that dissect the middle Miocene Maya surface. They represent the front of an erosion wave that formed in response to the initial uplift of the SC range at 12 Ma. These knickpoints may have nucleated near the base of the range along the Polochic fault, which back then represented the boundary between the SC range and the northern foreland (Fig. 16a). The second cluster of knickpoints consists of convex knickpoints located 500 m farther downslope, along the northern flank of the SC range (Figs. 8b and 12a2). These knickpoints have heights of 200–300 m (Fig. S4-3). If their height represents the amount of incision associated to their passage, then their passage must predate 7 Ma because these rivers have only incised 20–90 m since 7 Ma between the knickpoints and the Polochic fault (Brocard et al., 2011). Like the knickpoints of the upper cluster, the middle cluster knickpoints could have nucleated above the Polochic fault but at a later time.
The 10Be hillslope erosion rates suggest that today these two generations of migrating knickpoints are almost immobile. Indeed, hillslope erosion rates are expected to increase in the downstream direction across actively migrating knickpoints. However, only marginal (e.g., catchments XEU to Cub) to negligible (e.g., SMS to SMM) increases in erosion rate are documented across the knickpoints (see Sect. 4.2). Knickpoint celerity is influenced by top-down processes, such as the amount of water runoff and sediment discharge delivered from upslope (Crosby and Whipple, 2006; Brocard et al., 2016b), and, under certain circumstances, by bottom-up processes, such as the rate of base level fall (Whittaker and Boulton, 2012). Therefore, both the stability of the base level around the SC range over the past 7 Myr and the reduction in rainfall resulting from the rise of the AC range may have contributed, together with decreasing upstream drainage area (Crosby and Whipple, 2006), to the slowing down of migrating knickpoints within the SC range (Fig. 16a and b).
The third cluster is located at the base of the mountain. It consists of concave-up knickpoints dotting the apex of pediments that have formed along the range (Figs. 8b and 12a2). The pediments are currently extensively buried under pumice, deposited during a large late Pleistocene eruption (Brocard and Morán, 2014; Rose et al., 1987). Pediments usually form under semi-arid climates, along drainages with stable base levels. They grow by extending their apex into the range (Pelletier, 2010; Strudley et al., 2006; Thomas, 1989). The pediments of the SC range have developed in an area that has been incising slowly over the past 7 Myr (<30 m Myr−1) and where the climate is among the driest in Guatemala (Machorro, 2014). The concave-up knickpoints can be regarded as knickpoints spearheading a wave of decreased incision (Baldwin, 2003). Streambed analysis further shows that these knickpoints are located at the transition between detachment-limited and transport-limited reaches downstream (Fig. S4-3), as predicted by theory (Whipple and Tucker, 2002). Lateral planation tends to dominate over vertical incision, downstream of that transition (Brocard and Van der Beek, 2006), which is consistent with pediment development.
The steepest reaches along the northern flank of the SC range are located between the intermediate cluster of convex-up knickpoints, and the basal cluster of concave-up knickpoints. The close association of the middle and lower clusters may not be coincidental. An alternate hypothesis for the formation of the intermediate cluster is that it did not nucleate, as hypothesized above, at the front of the range but on site by faster backwearing of the lower slopes than downwearing of the upper slopes, immediately ahead of the lower cluster. They would have since grown in height and steepness as the pediments extend into the range. The intermediate cluster and basal cluster can be viewed as the lips and toes of large knickzones (or knickpoint faces; Gardner, 1983). Models predict that if water discharge has a larger influence than river gradient on stream incision, such knickpoint faces tend to steepen and amplify over time during backwearing (Weissel and Seidl, 1998; Tucker and Whipple, 2002), which is consistent with the observed topography. The intermediate and basal clusters are not present farther east along the wet flank of the SM range (Figs. 12d and 16c). Only one cluster of large migrating knickpoints separates the very flat uplands of the SM range from its deeply incised, wet lower flank (Fig. 8d). Aridification therefore appears to be responsible for the development of the highly stepped topography of the SC range.
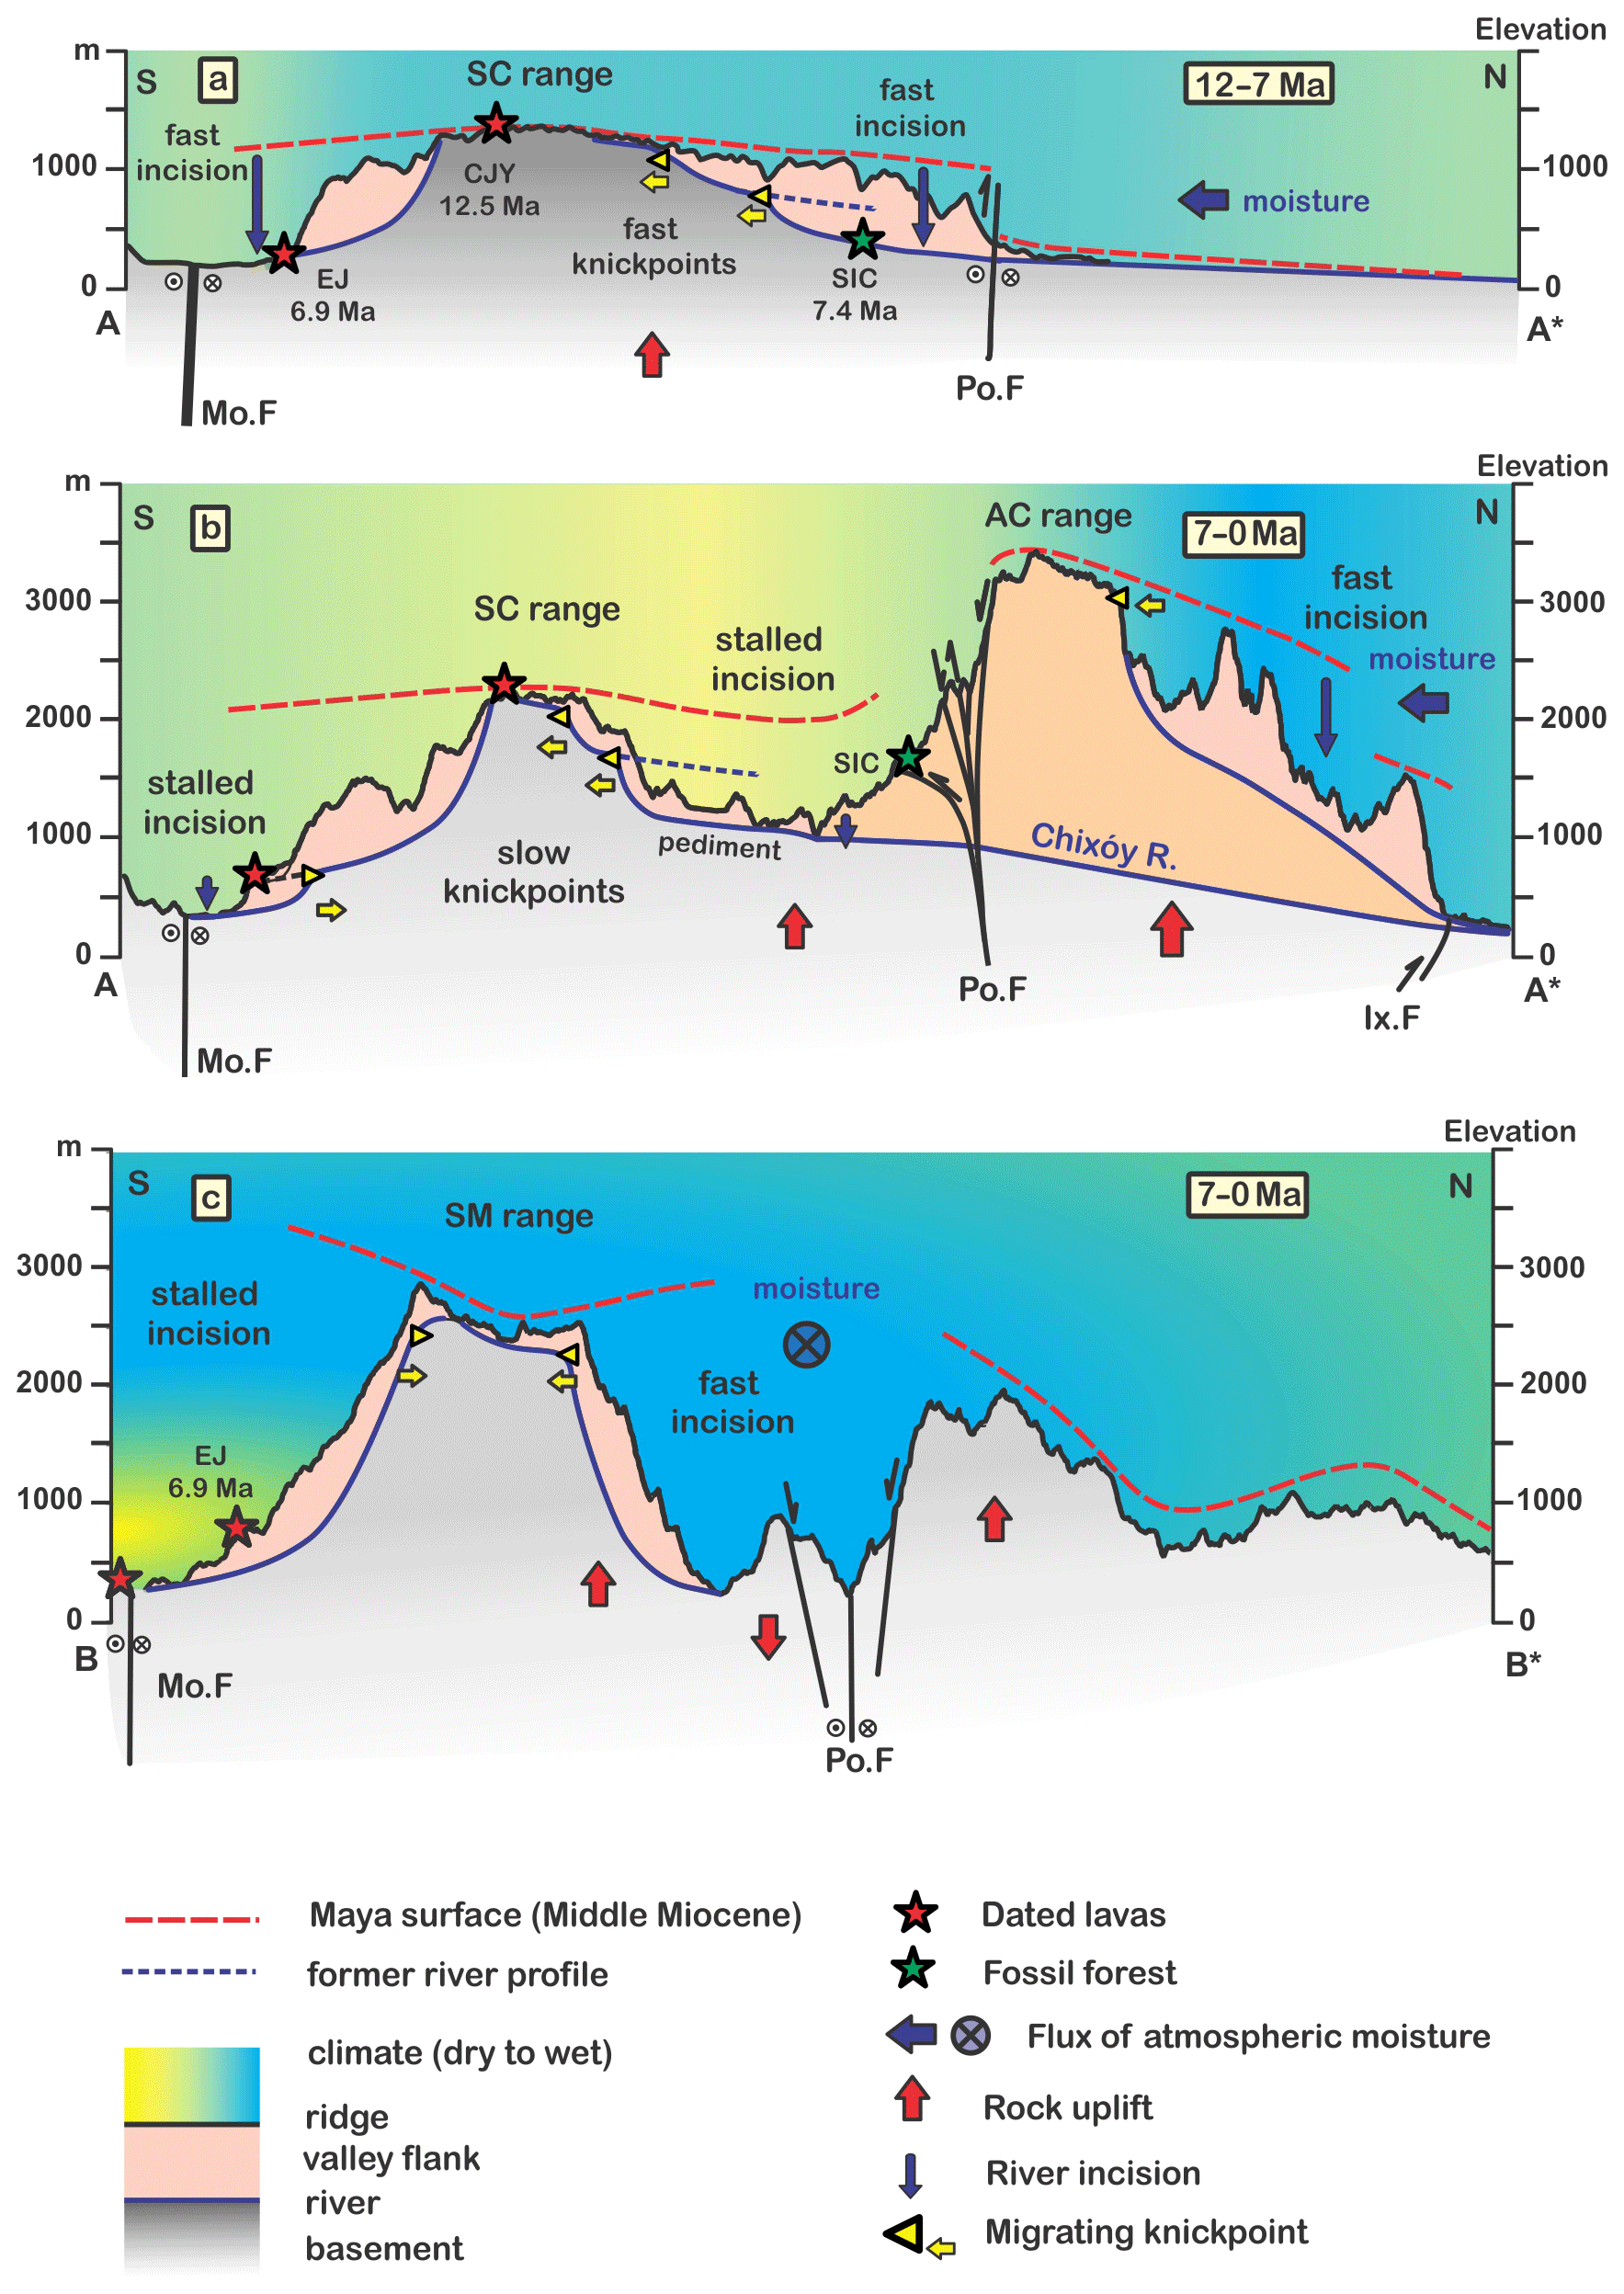
Figure 16Development of the central ranges of Guatemala. Along profiles A-A* and B-B* (see Fig. 13a for location) (AC: Altos de Cuchumatanes; EJ: El Jute; Mo.F: Motagua Fault; Po.F: Polochic Fault; SC: Sierra de Chuacús; SIC: fossil forest of Sicaché; SM: Sierra de las Minas).
5.4.3 Range-hopping erosion and the development of dry orogen interiors
The evolution of the study area can be summarized as follows. Orogenesis started with the rise and coeval incision of the SC-SM range, from 12 to 7 Ma (Fig. 16a). After 7 Ma, rock uplift decreased in the SC range and picked up in the AC range. Fast uplift in the AC range led to the tectonic defeat of many rivers which, upon exiting the SC range, flowed across the foreland. Most of the defeated rivers were rerouted into the drainage of the Chixóy River, one the four rivers that maintained a course across the AC range. Transient steepening of rivers in response to the fast rise of the AC range and the lengthening of these same rivers by the Polochic fault promoted surface uplift within the SC range. The complete cessation of river incision along the northern side of the range may therefore result from a combination of river steepening, river lengthening, and decrease in rock uplift in the SC range. However, the fact the stalling of incision is as complete along the southern side of the range as along the northern side suggests that tectonics was not the only cause but that the aridification of the SC range, resulting from the rise of the AC range, was also instrumental in the stalling of river incision. The decrease in precipitation over the SC range reduced erosion on its hillslopes, decreased river discharge, and therefore contributed to the stalling of river incision on both sides of the range. Precipitation and erosion concentrated on the northern flanks of the AC and SM ranges, while the SC range became almost passively uplifted.
The high erosion rates and wet slopes that characterize the AC range today are reminiscent of the SC range between 12 and 7 Ma. The AC range became the front range, intercepting the moisture that tracks from the foreland, while the SC became an inner range, upstream of the front range and within its rain shadow. A decrease in rock uplift rate alone cannot account for the sharp decline of erosion in the SC range after 7 Ma because the relief and steepness of the range did not suddenly decrease. Aridification within the rain shadow of the AC range contributed to the overall decline in erosion in the SC range. The SC range displays characteristics of dry orogen interior ranges and of orogenic plateaus. It has entered a stage of progressive topographic decay, marked by the development of pediments. Pediment formation occurs in a context of aridity and very low incision rates. Such low incision rates, driven by aridification in the rain shadow of front ranges and by river steepening across the front ranges, characterize the evolution orogenic plateaus formed by tectonic accretion (Sobel et al., 2003; Garcia-Castellanos, 2007). On orogenic plateaus, this evolution ultimately leads to the disintegration of river drainages, isolating dry interior drainages from the forelands. Along interior drainages incision then further decreases, with the rivers being graded to high-elevation base levels. Reduction in local relief then receives the added contribution of the sediment infilling of the now closed catchments (Sobel et al., 2003). If the drying of the SC range was more severe it could ultimately lead to drainage disintegration.
Continued growth of the pediment could lead to the formation of an intramontane pediplain (Baulig, 1957), at elevations of 0.9–1.2 km, halfway between the high-standing remnants of the middle Miocene Maya surface and the Petén–Yucatán lowlands. The Central American Dry Corridor, which straddles the SC range, continues to the NW over the central Chiapas Depression (Fig. 1a), where extensive pediments have developed over the basement rocks of the Sierra Madre de Chiapas (Authemayou et al., 2011), in an area isolated from the Pacific moisture by the Sierra Madre de Chiapas to the SE and from Caribbean moisture by the Sierra de Chiapas in the NW (Fig. 1a). These pediments are in a more advanced stage of coalescence and pediplanation. Pediplanation in a context of active orogenesis may explain the great abundance of low-relief perched surfaces that appear to form quickly in many orogens without significant pauses in mountain building (Calvet et al., 2015; Pain and Ollier, 1995; Babault et al., 2005).
-
Isotopic 39Ar/40Ar dating on volcanic rocks confirms our earlier finding that the mountain range the closest to the plate boundary (the SM-SC range) was incised during the late Miocene from 12 to 7 Ma. Incision almost completely stalled afterwards, during the formation of the Altos de Cuchumatanes (AC range) farther north.
-
The deformation of paleovalleys indicates that the AC range experienced >1000 m of uplift relative to the SC range over the past 7 Myr. Today the range is highly dissected. High river profile steepness and ever-expanding ice caps indicate that the AC range still undergoes fast rock and surface uplift.
-
The concentration of detrital terrestrial 10Be in the sediments of rivers that drain these ranges show that hillslope erosion reaches 300 m Myr−1 in the AC range but is commonly <100 m Myr−1 in the SC-SM range. The patterns of hillslope erosion rates mimic spatial patterns of precipitation and stream incision.
-
Precipitation is strongly controlled by topographic obstructions resulting from the rise of the AC range, which intercepts Caribbean moisture. Precipitation is high along the northern flanks of the AC range but low over the SC range, which lies within rain shadows. Fossil vegetation preserved at the base of the SC range indicates a wetter climate at 7 Ma, which is when the AC range started to grow.
-
In this context, the slow current hillslope erosion rates in the SC range appear to be contributed to in part by the rise of the AC and the development of rain shadows. It can be hypothesized, therefore, that hillslope erosion rates in the SC range were higher before the uplift of the AC range.
-
The rise of the AC range led to the steepening of river profiles along the rivers that maintained a course across the rising range. The steepening of river profiles triggered a transient decrease in river incision rates upstream of the AC range. The lack of resumption of river incision upstream of the AC range implies either that these rivers have not re-established equilibrium profiles or that other factors prevent the return of incision.
-
The rise of the AC range led to the entrenchment of range-transverse rivers along the Polochic strike-slip fault. Fault slip has driven continuous lengthening of river courses on top of the fault over the past 7 Myr. Lengthening contributes to the rise of river profiles upstream of the Polochic fault, and therefore to the slowing down of river incision in the SC range.
-
The difference in elevation between paleovalley in the AC range and the SC range imply rock uplift rates have declined in the SC range. This decrease in rock uplift rates may have also contributed to the decline in incision in the SC range
-
The fact that incision decreased equally on either sides of the SC range, despite widely different tectonic forcing, implies instead that aridification of the SC range contributed significantly to the decrease of river incision over the SC range.
-
In the SC range, hillslope erosion slightly outpaces base level lowering, implying an overall trend to slow topographic decay, despite continuing surface uplift. The persistence of middle Miocene low-relief surfaces on mountain tops in the SC range instead implies no net reduction in the range height, and a decay that proceeds by backwearing rather than downwearing.
-
The slowing down or erosion rates over the SC range has resulted in a slowing down and stacking of upstream-migrating knickpoints and erosion waves over the SC range and of the development of pediments at its base.
All data used in this work are provided in the Supplement.
The supplement related to this article is available online at: https://doi.org/10.5194/esurf-9-795-2021-supplement.
GB contributed to project design, river 10Be sampling (AC and SM ranges), 10Be sample processing (AC and SM ranges), river segment analysis, and manuscript preparation, with contributions from all authors. JKW contributed to 10Be sample processing (SM-SC range). TS contributed to river profile segmentation. MC contributed to dating. AGO and NCC contributed to 10Be stream sampling (SM-SC range). SMI contributed to field work coordination. CT contributed to project design and coordination.
The authors declare that they have no conflict of interest.
Publisher's note: Copernicus Publications remains neutral with regard to jurisdictional claims in published maps and institutional affiliations.
We thank the department of Geology at the Centro Universitario del Noreste (CUNOR) of the University of San Carlos de Guatemala (USAC) for their dependable support during field work. We thank reviewer Paul Umhoefer and the anonymous reviewer for their insightful comments.
This research has been supported by the College of Science and Engineering, University of Minnesota (grant no. 1003-524-5983), and the Swiss National Foundation (grant no. 200020-120117/1).
This paper was edited by Simon Mudd and reviewed by Paul J. Umhoefer and one anonymous referee.
Anderson, T. H., Burkart, B., Clemons, R. E., Bohnenberger, O. H., and Blount, D. N.: Geology of the Western Altos de Cuchumatanes, Northwestern Guatemala, Geol. Soc. Am. Bull., 84, 805–826, https://doi.org/10.1130/0016-7606(1973)84<805:gotwac>2.0.co;2, 1973.
Attal, M., Tucker, G. E., Whittaker, A. C., Cowie, P. A., and Roberts, G. P.: Modeling fluvial incision and transient landscape evolution: Influence of dynamic channel adjustment, J. Geophys. Res., 113, F03013, https://doi.org/10.1029/2007jf000893, 2008.
Authemayou, C., Brocard, G., Teyssier, C., Simon-Labric, T., Guttierrez, A., Chiquin, E. N., and Moran, S.: The Caribbean-North America-Cocos Triple Junction and the dynamics of the Polochic-Motagua fault systems: Pull-up and zipper models, Tectonics, 30, TC3010, https://doi.org/10.1029/2010tc002814, 2011.
Authemayou, C., Brocard, G., Teyssier, C., Suski, B., Cosenza, B., Moran-Ical, S., Gonzalez-Veliz, C. W., Aguilar-Hengstenberg, M. A., and Holliger, K.: Quaternary seismo-tectonic activity of the Polochic Fault, Guatemala, J. Geophys. Res.-Sol. Ea., 117, B07403, https://doi.org/10.1029/2012jb009444, 2012.
Babault, J., Van Den Driessche, J., Bonnet, S., Castelltort, S., and Crave, A.: Origin of the highly elevated Pyrenean peneplain, Tectonics, 24, TC2010, https://doi.org/10.1029/2004TC001697, 2005.
Baldwin, J. A.: Implications of the shear stress river incision model for the timescale of postorogenic decay of topography, J. Geophys. Res., 108, ETG7-1, https://doi.org/10.1029/2001jb000550, 2003.
Bartole, R., Lodolo, E., Obrist-Farner, J., and Morelli, D.: Sedimentary architecture, structural setting, and Late Cenozoic depocentre migration of an asymmetric transtensional basin: Lake Izabal, eastern Guatemala, Tectonophysics, 750, 419–433, 2019.
Baulig, H.: Peneplains and pediplains, Geol. Soc. Am. Bull., 68, 913–930, 1957.
Beaumont, C., Fullsack, P., and Hamilton, J.: Erosional control of active compressional orogens, in: Thrust tectonics, Springer, Dordrecht, 1–18, 1992.
Bosc, E. A.: Geology of the San Agustin Acasaguastlan quadrangle and northeastern part of El Progreso quadrangle, Guatemala, PhD thesis, Rice University, Houston, 131 pp., 1971.
Brocard, G. and Morán, S.: Phreatic clastic dikes and other degasing structures in the Los Chocoyos pumice formation, Guatemala, Revista Guatemalteca de Ciencias de la Tierra, 1, 55–65, 2014.
Brocard, G. and Van der Beek, P.: Influence of incision rate, rock strength, and bedload supply on bedrock river gradients and valley-?at widths: Field-based evidence and calibrations from western Alpine rivers (southeast France), edited by: Willett, S. D. et al., Geol. Soc. Am. Spec. Pap., 398, 101–126, 2006.
Brocard, G., Teyssier, C., Dunlap, W. J., Authemayou, C., Simon-Labric, T., Cacao-Chiquin, E. N., Gutierrez-Orrego, A., and Moran-Ical, S.: Reorganization of a deeply incised drainage: role of deformation, sedimentation and groundwater flow, Basin Res., 23, 631–651, https://doi.org/10.1111/j.1365-2117.2011.00510.x, 2011.
Brocard, G., Willenbring, J., Suski, B., Audra, P., Authemayou, C., Cosenza-Muralles, B., Moran-Ical, S., Demory, F., Rochette, P., Vennemann, T., Holliger, K., and Teyssier, C.: Rate and processes of river network rearrangement during incipient faulting: The case of the cahabon river, guatemala, Am. J. Sci., 312, 449–507, https://doi.org/10.2475/05.2012.01, 2012.
Brocard, G., Morán, S., Dura, T., and Vásquez, O.: The Plio-Pleistocene lacustrine Jolom Naj Formation of Cobán, Alta Verapaz: implications for the growth and demise of the Cahabón River network, Guatemala, Revista Guatemalteca de Ciencias de la Tierra, 2, 45–56, 2015a.
Brocard, G. Y., Willenbring, J. K., Scatena, F. N., and Johnson, A. H.: Effects of a tectonically-triggered wave of incision on riverine exports and soil mineralogy in the Luquillo Mountains of Puerto Rico, Appl. Geochem., 63, 586–598, 2015b.
Brocard, G., Morán, S., Jared Vasquez, O., and Fernandez, M.: Natural hazard associated with the genesis of Lake Chichoy, Alta Verapaz, Guatemala, Revista Guatemalteca de Ciencias de la Tierra, 3, 5–19, 2016a.
Brocard, G. Y., Willenbring, J. K., Miller, T. E., and Scatena, F. N.: Relict landscape resistance to dissection by upstream migrating knickpoints, J. Geophys. Res.-Earth, 121, 1182–1203, 2016b.
Brown, E., Stallard, R. F., Larsen, M. C., Raisbeck, G. M., and Yiou, F.: Denudation rates determined from the accumulation of in-situ produced 10Be in the Luquillo experimental forest, Puerto Rico, Earth Planet. Sc. Lett., 129, 193–202, https://doi.org/10.1016/0012-821x(94)00249-x, 1995.
Bucknam, R. C., Coe, J. A., Chavarría, M. M., Godt, J. W., Tarr, A. C., Bradley, L.-A., Rafferty, S., Hancock, D., Dart, R. L., and Johnson, M. L.: Landslides triggered by Hurricane Mitch in Guatemala–inventory and discussion, US Geological Survey Open File Report, 1, 2001.
Burkart, B.: Offset across the Polochic fault of Guatemela and Chiapas, Mexico Geology, 6, 328–332, https://doi.org/10.1130/0091-7613(1978)6<328:oatpfo>2.0.co;2, 1978.
Callahan, R. P., Ferrier, K. L., Dixon, J., Dosseto, A., Hahm, W. J., Jessup, B. S., Miller, S. N., Hunsaker, C. T., Johnson, D. W., and Sklar, L. S.: Arrested development: Erosional equilibrium in the southern Sierra Nevada, California, maintained by feedbacks between channel incision and hillslope sediment production, Geol. Soc. Am. Bull., 131, 1179–1202, 2019.
Calvet, M., Gunnell, Y., and Farines, B.: Flat-topped mountain ranges: Their global distribution and value for understanding the evolution of mountain topography, Geomorphology, 241, 255–291, 2015.
Carballo-Hernandez, M., Banks, N., Franco-Austin, J., and Lopez-Aguilar, L.: Cuenca Amatique, Guatemala: Una Cuenca Transtencional al Sur del Limite de Placas NorteAmericana–Caribe, Paper Presented at Congreso Geologico Chileno, 8–12 August 1988, Santiago, Chile, 1988.
Champel, B., van der Beek, P., Mugnier, J. L., and Leturmy, P.: Growth and lateral propagation of fault-related folds in the Siwaliks of western Nepal: Rates, mechanisms, and geomorphic signature, J. Geophys. Res.-Sol. Ea., 107, 2111, https://doi.org/10.1029/2001jb000578, 2002.
Clarke, B. A. and Burbank, D. W.: Bedrock fracturing, threshold hillslopes, and limits to the magnitude of bedrock landslides, Earth Planet. Sc. Lett., 297, 577–586, https://doi.org/10.1016/j.epsl.2010.07.011, 2010.
Cowie, P. A., Whittaker, A. C., Attal, M., Roberts, G., Tucker, G. E., and Ganas, A.: New constraints on sediment-flux-dependent river incision: Implications for extracting tectonic signals from river profiles, Geology, 36, 535–538, https://doi.org/10.1130/g24681a.1, 2008.
Crosby, B. T. and Whipple, K. X.: Knickpoint initiation and distribution within fluvial networks: 236 waterfalls in the Waipaoa River, North Island, New Zealand, Geomorphology, 82, 16–38, https://doi.org/10.1016/j.geomorph.2005.08.023, 2006.
Deaton, B. C. and Burkart, B.: Time of sinistral slip along the Polochic fault of Guatemala Tectonophysics, 102, 297–313, https://doi.org/10.1016/0040-1951(84)90018-0, 1984.
Ferrier, K. L., Kirchner, J. W., Riebe, C. S., and Finkel, R. C.: Mineral-specific chemical weathering rates over millennial timescales: Measurements at Rio Icacos, Puerto Rico, Chem. Geol., 277, 101–114, https://doi.org/10.1016/j.chemgeo.2010.07.013, 2010.
Ferrier, K. L., Perron, J. T., Mukhopadhyay, S., Rosener, M., Stock, J. D., Huppert, K. L., and Slosberg, M.: Covariation of climate and long-term erosion rates across a steep rainfall gradient on the Hawaiian island of Kaua `i, Geol. Soc. Am. Bull., 125, 1146–1163, 2013.
Finnegan, N. J., Hallet, B., Montgomery, D. R., Zeitler, P. K., Stone, J. O., Anders, A. M., and Yuping, L.: Coupling of rock uplift and river incision in the Namche Barwa-Gyala Peri massif, Tibet, Geol. Soc. Am. Bull., 120, 142–155, https://doi.org/10.1130/b26224.1, 2008.
Flores, K. E., Martens, U. C., Harlow, G. E., Brueckner, H. K., and Pearson, N. J.: Jadeitite formed during subduction: In situ zircon geochronology constraints from two different tectonic events within the Guatemala Suture Zone, Earth Planet. Sc. Lett., 371–372, 67–81, https://doi.org/10.1016/j.epsl.2013.04.015, 2013.
Fourcade, E., Mendez, J., Azema, J., Cros, P., Dewever, P., Duthou, J. L., Romero, J. E., and Michaud, F.: Pre-Santonian Campanian age for the obdcution of the Guatemalan ophiolites, C. R. Acad. Sci. II, 318, 527–533, 1994.
Galewsky, J.: Rain shadow development during the growth of mountain ranges: An atmospheric dynamics perspective, J. Geophys. Res.-Earth, 114, F001085, https://doi.org/10.1029/2008JF001085, 2009.
Garcia-Castellanos, D.: The role of climate during high plateau formation. Insights from numerical experiments, Earth Planet. Sc. Lett., 257, 372–390, 2007.
Gardner, T. W.: Experimental study of knickpoint and longitudinal profile evolution in cohesive, homogeneous material, Geol. Soc. Am. Bull., 94, 664, https://doi.org/10.1130/0016-7606(1983)94<664:esokal>2.0.co;2, 1983.
Goldrick, G. and Bishop, P.: Differentiating the roles of lithology and uplift in the steepening of bedrock river long profiles: an example from southeastern Australia, J. Geol., 103, 227–231, 1995.
Gould, W. A., Alarcón, C., Fevold, B., Jiménez, M. E., Martinuzzi, S., Potts, G., Quiñones, M., Solórzano, M., and Ventosa, E.: The Puerto Rico Gap Analysis Project volume 1: land cover, vertebrate species distributions, and land stewardship, Gen. Tech. Rep. IITF-39, 1, US Dept. Agric. For. Serv. Int. Inst. Trop. For. Río Piedras, Puerto Rico, 2008.
Guttiérrez, A.: Caracterización de conglomerados y areniscas en la formación Subinal, en el suroriente del país, University San Carlos de Guatemala, 90, 2008.
Guzmán-Speziale, M.: Beyond the Motagua and Polochic faults: Active strike-slip faulting along the Western North America–Caribbean plate boundary zone, Tectonophysics, 496, 17–27, https://doi.org/10.1016/j.tecto.2010.10.002, 2010.
Harp, E. L., Wilson, R. C., and Wieczorek, G. F.: Landslides from the February 4, 1976, Guatemala earthquake, US Government Printing Office, Washington, DC, 1981.
Harvey, A. M.: Effective timescales of coupling within fluvial systems, Geomorphology, 44, 175–201, 2002.
Hirschman, T.: Reconnaissance geology of part of the Department of El Progreso, Guatemala: Unpub, Master's thesis, Univ. Indiana, 1962.
Holder, C. D.: Rainfall interception and fog precipitation in a tropical montane cloud forest of Guatemala, Forest Ecol. Manag., 190, 373–384, https://doi.org/10.1016/j.foreco.2003.11.004, 2004.
Howard, A. D.: A detachment-limited model of drainage basin evolution, Water Resour. Res., 30, 2261–2285, 1994.
Howard, A. D.: Badland morphology and evolution: Interpretation using a simulation model, Earth Surf. Proc. Land., 22, 211–227, 1997.
Humphrey, N. F. and Heller, P. L.: Natural oscillations in coupled geomorphic systems: An alternative origin for cyclic sedimentation, Geology, 23, 499, https://doi.org/10.1130/0091-7613(1995)023<0499:noicgs>2.3.co;2, 1995.
Jackson, J., Ritz, J. F., Siame, L., Raisbeck, G., Yiou, F., Norris, R., Youngson, J., and Bennett, E.: Fault growth and landscape development rates in Otago, New Zealand, using in situ cosmogenic 10Be, Earth Planet. Sc. Lett., 195, 185–193, https://doi.org/10.1016/s0012-821x(01)00583-0, 2002.
Kirby, E.: Distribution of active rock uplift along the eastern margin of the Tibetan Plateau: Inferences from bedrock channel longitudinal profiles, J. Geophys. Res., 108, 2217, https://doi.org/10.1029/2001jb000861, 2003.
Lachniet, M. S. and Vazquez-Selem, L.: Last Glacial Maximum equilibrium line altitudes in the circum-Caribbean (Mexico, Guatemala, Costa Rica, Colombia, and Venezuela), Quatern. Int., 138–139, 129–144, https://doi.org/10.1016/j.quaint.2005.02.010, 2005.
Leland, J., Reid, M. R., Burbank, D. W., Finkel, R., and Caffee, M.: Incision and differential bedrock uplift along the Indus River near Nanga Parbat, Pakistan Himalaya, from 10Be and 26Al exposure age dating of bedrock straths, Earth Planet. Sc. Lett., 154, 93–107, https://doi.org/10.1016/s0012-821x(97)00171-4, 1998.
Liang, Z., Liu, H., Zhao, Y., Wang, Q., Wu, Z., Deng, L., and Gao, H.: Effects of rainfall intensity, slope angle, and vegetation coverage on the erosion characteristics of Pisha sandstone slopes under simulated rainfall conditions, Environ. Sci. Pollut. Res., 27, 17458–17467, 2020.
Machorro, R.: Drought assessment in the Dry Corridor of Guatemala, Earth Science Review of Guatemala, 1, 11, 2014.
MARN – Ministerio de Ambiente y Recursos Naturales: Informe ambiental del Estado 2016 – Guatemala, Guatemala, 138 pp., 2016.
McAdams, B. C., Trierweiler, A. M., Welch, S. A., Restrepo, C., and Carey, A. E.: Two sides to every range: orographic influences on CO2 consumption by silicate weathering, Appl. Geochem., 63, 472–483, 2015.
Meijers, M. J., Brocard, G. Y., Cosca, M. A., Lüdecke, T., Teyssier, C., Whitney, D. L., and Mulch, A.: Rapid late Miocene surface uplift of the Central Anatolian Plateau margin, Earth Planet. Sc. Lett., 497, 29–41, https://doi.org/10.1016/j.epsl.2018.05.040, 2018.
Merritts, D. J., Vincent, K. R., and Wohl, E. E.: Long river profiles, tectonism, and eustasy – a guide to interpreting fluxial terraces, J. Geophys. Res.-Sol. Ea., 99, 14031–14050, https://doi.org/10.1029/94jb00857, 1994.
Montgomery, D. R. and Stolar, D. B.: Reconsidering Himalayan river anticlines, Geomorphology, 82, 4–15, https://doi.org/10.1016/j.geomorph.2005.08.021, 2006.
Mudd, S. M. and Furbish, D. J.: Responses of soil-mantled hillslopes to transient channel incision rates, J. Geophys. Res.-Earth, 112, F03S18, https://doi.org/10.1029/2006JF000516, 2007.
Mudd, S. M., Attal, M., Milodowski, D. T., Grieve, S. W., and Valters, D. A.: A statistical framework to quantify spatial variation in channel gradients using the integral method of channel profile analysis, J. Geophys. Res.-Earth, 119, 138–152, 2014.
Muller, P. D.: Geology of the Los Amates quadrangle and vicinity, Guatemala, Central America, State University of NY, New York, 1979.
Murphy, B. P., Johnson, J. P., Gasparini, N. M., and Sklar, L. S.: Chemical weathering as a mechanism for the climatic control of bedrock river incision, Nature, 532, 223–227, https://doi.org/10.1038/nature17449, 2016.
Neely, A. B. and DiBiase, R. A.: Drainage Area, Bedrock Fracture Spacing, and Weathering Controls on Landscape-Scale Patterns in Surface Sediment Grain Size, J. Geophys. Res.-Earth, 125, e2020JF005560, https://doi.org/10.1002/essoar.10502617.1, 2020.
Newcomb, W. E.: Geology, Structure and Metamorphism of the Chuacus Group, Rio Hondo Quadrangle and Vicinity, Guatemala, State University of New York, Binghamton, 1975.
Ortega-Gutierrez, F., Solari, L. A., Sole, J., Martens, U., Gomez-Tuena, A., Moran-Ical, S., Reyes-Salas, M., and Ortega-Obregon, C.: Polyphase, high-temperature eclogite-facies metamorphism in the Chuacus Complex, Central Guatemala: Petrology, geochronology, and tectonic implications, Int. Geol. Rev., 46, 445–470, https://doi.org/10.2747/0020-6814.46.5.445, 2004.
Ortega-Obregón, C., Solari, L., Keppie, J., Ortega-Gutiérrez, F., Solé, J., and Morán-Ical, S.: Middle-Late Ordovician magmatism and Late Cretaceous collision in the southern Maya block, Rabinal-Salamá area, central Guatemala: implications for North America–Caribbean plate tectonics, Geol. Soc. Am. Bull., 120, 556–570, 2008.
Pain, C. and Ollier, C.: Inversion of relief – a component of landscape evolution, Geomorphology, 12, 151–165, 1995.
Pelletier, J. D.: How do pediments form?: A numerical modeling investigation with comparison to pediments in southern Arizona, USA, Geol. Soc. Am. Bull., 122, 1815–1829, https://doi.org/10.1130/b30128.1, 2010.
Perron, J. T. and Royden, L.: An integral approach to bedrock river profile analysis, Earth Surf. Proc. Land., 38, 570–576, https://doi.org/10.1002/esp.3302, 2013.
Ramos Scharrón, C. E., Castellanos, E. J., and Restrepo, C.: The transfer of modern organic carbon by landslide activity in tropical montane ecosystems, J. Geophys. Res., 117, G03016, https://doi.org/10.1029/2011jg001838, 2012.
Ratschbacher, L., Franz, L., Min, M., Bachmann, R., Martens, U., Stanek, K., Stubner, K., Nelson, B. K., Herrmann, U., Weber, B., Lopez-Martinez, M., Jonckheere, R., Sperner, B., Tichomirowa, M., McWilliams, M. O., Gordon, M., Meschede, M., and Bock, P.: The North American-Caribbean Plate boundary in Mexico-Guatemala-Honduras, Geological Society, London, Special Publications, 328, 219–293, https://doi.org/10.1144/sp328.11, 2009.
Riebe, C. S., Sklar, L. S., Lukens, C. E., and Shuster, D. L.: Climate and topography control the size and flux of sediment produced on steep mountain slopes, P. Natl. Acad. Sci. USA, 112, 15574–15579, 2015.
Rogers, R. D. and Mann, P.: Transtensional deformation of the western Caribbean–North America plate boundary zone, Geol. Soc. Am. Spec. Pap., 428, 37–64, 2007.
Roper, P.: Stratigraphy of the Chuacu's Group on the south side of the Sierra de las Minas range, Guatemala, Geol. Mijn, 57, 309–313, 1978.
Rose, W. I., Newhall, C. G., Bornhorst, T. J., and Self, S.: Quaternary silicic pyroclastic deposits of atitlan caldera, Guatemala, J. Volcanol. Geoth. Res., 33, 57–80, https://doi.org/10.1016/0377-0273(87)90054-0, 1987.
Rosenbloom, N. A. and Anderson, R. S.: Hillslope and channel evolution in a marine terraced landscape, Santa Cruz, California, J. Geophys. Res.-Sol. Ea., 99, 14013–14029, 1994.
Royden, L. and Taylor Perron, J.: Solutions of the stream power equation and application to the evolution of river longitudinal profiles, J. Geophys. Res.-Earth, 118, 497–518, 2013.
Sieh, K. E. and Jahns, R. H.: Holocene activity of the San Andreas fault at Wallace Creek, California, Geol. Soc. Am. Bull., 95, 883, https://doi.org/10.1130/0016-7606(1984)95<883:haotsa>2.0.co;2, 1984.
Simon-Labric, T., Brocard, G. Y., Teyssier, C., van der Beek, P. A., Fellin, M. G., Reiners, P. W., and Authemayou, C.: Preservation of contrasting geothermal gradients across the Caribbean-North America plate boundary (Motagua Fault, Guatemala), Tectonics, 32, 1–18, https://doi.org/10.1002/tect.20060, 2013.
Sklar, L. S. and Dietrich, W. E.: The role of sediment in controlling steady-state bedrock channel slope: Implications of the saltation–abrasion incision model, Geomorphology, 82, 58–83, https://doi.org/10.1016/j.geomorph.2005.08.019, 2006.
Sobel, E. R., Hilley, G. E., and Strecker, M. R.: Formation of internally drained contractional basins by aridity-limited bedrock incision, J. Geophys. Res.-Sol. Ea., 108, 2344, https://doi.org/10.1029/2002JB001883, 2003.
Strudley, M. W., Murray, A. B., and Haff, P. K.: Emergence of pediments, tors, and piedmont junctions from a bedrock weathering–regolith thickness feedback, Geology, 34, 805, https://doi.org/10.1130/g22482.1, 2006.
Thattai, D., Kjerfve, B., and Heyman, W.: Hydrometeorology and variability of water discharge and sediment load in the inner Gulf of Honduras, western Caribbean, J. Hydrometeorol., 4, 985–995, 2003.
Thomas, M. F.: The role of etch processes in landform development. I. Etching concepts and their applications, Z. Geomorphol., 33, 129–142, 1989.
Tobisch, M. K.: Part I, late Cenozoic geology of the central Motagua Valley, Guatemala: part II, uplift rates, deformation and neotectonics of Holocene marine terraces from Point Delgado to Cape Mendocino, California, PhD thesis, University of California, Ssanta Cruz, 276 pp., 1986.
Tucker, G. E. and Whipple, K.: Topographic outcomes predicted by stream erosion models: Sensitivity analysis and intermodel comparison, J. Geophys. Res., 107, 2179, https://doi.org/10.1029/2001jb000162, 2002.
van der Beek, P., Champel, B., and Mugnier, J. L.: Control of detachment dip on drainage development in regions of active fault-propagation folding, Geology, 30, 471–474, https://doi.org/10.1130/0091-7613(2002)030<0471:coddod>2.0.co;2, 2002.
Weissel, J. K. and Seidl, M. A.: Inland propagation of erosional escarpments and river profile evolution across the southeast Australian passive continental margin, in: Rivers over rock: fluvial processes in bedrock channels, Geophysical Monograph 107, American Geophysical Union, Washington, DC, 189–206, 1998.
Whipple, K. and Meade, B.: Orogen response to changes in climatic and tectonic forcing, Earth Planet. Sc. Lett., 243, 218–228, https://doi.org/10.1016/j.epsl.2005.12.022, 2006.
Whipple, K. X. and Tucker, G. E.: Dynamics of the stream-power river incision model: Implications for height limits of mountain ranges, landscape response timescales, and research needs, J. Geophys. Res., 104, 17661, https://doi.org/10.1029/1999jb900120, 1999.
Whipple, K. X. and Tucker, G. E.: Implications of sediment-flux-dependent river incision models for landscape evolution, J. Geophys. Res.-Sol. Ea., 107, 2039, https://doi.org/10.1029/2000jb000044, 2002.
Whittaker, A. C. and Boulton, S. J.: Tectonic and climatic controls on knickpoint retreat rates and landscape response times, J. Geophys. Res., 117, F02024, https://doi.org/10.1029/2011jf002157, 2012.
Willenbring, J. K., Codilean, A. T., and McElroy, B.: Earth is (mostly) flat: Apportionment of the flux of continental sediment over millennial time scales, Geology, 41, 343–346, https://doi.org/10.1130/g33918.1, 2013a.
Willenbring, J. K., Gasparini, N. M., Crosby, B. T., and Brocard, G.: What does a mean mean? The temporal evolution of detrital cosmogenic denudation rates in a transient landscape, Geology, 41, 1215–1218, 2013b.
Willett, S. D. and Brandon, M. T.: On steady states in mountain belts, Geology, 30, 175, https://doi.org/10.1130/0091-7613(2002)030<0175:ossimb>2.0.co;2, 2002.
Williams, E. A. and McBirney, A. R.: Volcanic history of Honduras, University of California publications in Geological Sciences, University of California, Berkeley, 85, 1–65, 1969.