the Creative Commons Attribution 4.0 License.
the Creative Commons Attribution 4.0 License.
 | 03 Aug 2021
Last-glacial-cycle glacier erosion potential in the Alps
Julien Seguinot
Ian Delaney
The glacial landscape of the Alps has fascinated generations of explorers, artists, mountaineers, and scientists with its diversity, including erosional features of all scales from high-mountain cirques to steep glacial valleys and large overdeepened basins. Using previous glacier modelling results and empirical inferences of bedrock erosion under modern glaciers, we compute a distribution of potential glacier erosion in the Alps over the last glacial cycle from 120 000 years ago to the present. Despite large uncertainties pertaining to the climate history of the Alps and unconstrained glacier erosion processes, the resulting modelled patterns of glacier erosion include persistent features. The cumulative imprint of the last glacial cycle shows a very strong localization of erosion potential with local maxima at the mouths of major Alpine valleys and some other upstream sections where glaciers are modelled to have flowed with the highest velocity. The potential erosion rates vary significantly through the glacial cycle but show paradoxically little relation to the total glacier volume. Phases of glacier advance and maximum extension see a localization of rapid potential erosion rates at low elevation, while glacier erosion at higher elevation is modelled to date from phases of less extensive glaciation. The modelled erosion rates peak during deglaciation phases, when frontal retreat results in steeper glacier surface slopes, implying that climatic conditions that result in rapid glacier erosion might be quite transient and specific. Our results depict the Alpine glacier erosion landscape as a time-transgressive patchwork, with different parts of the range corresponding to different glaciation stages and time periods.
- Article
(11448 KB) - Full-text XML
-
Supplement
(24962 KB) - BibTeX
- EndNote


The glacial erosion landscape of the Alps has fascinated generations of
explorers, artists, mountaineers, and scientists for centuries. Its cultural
impact is indeed so far-reaching, that in English, a non-Alpine language,
the adjective “alpine” with non-capital “a” is now casually used to
describe an Alpine-like, glacially modified mountain landscape outside the
Alps, while the proper noun “Alps” has been applied to nickname
Alpine-like, glacier-eroded mountain ranges in Norway (Lyngsalpene),
New Zealand (Southern Alps), Japan
( , Nihon Arupusu), and elsewhere. Some mountain ranges are predominantly characterized by cirque glaciation (e.g. Uinta Mountains), glacial valleys (e.g. Putorana Plateau), or large-scale overdeepenings (e.g. Patagonia). But other regions, including the Alps (e.g. Penck, 1905), present a higher variety of glacier erosional landforms, whose implications for glacial history are yet to be understood. In parallel to such landscape diversity, the cosmogenic nuclide memory of bedrock erosion provides a more quantitative but equally varied picture of glacier erosion effectiveness both within and between glaciated regions (Jansen et al., 2019; Steinemann et al., 2020, 2021).
Glacially eroded topography has sometimes been used as a proxy for mapping palaeoglacier extent (e.g. Margold et al., 2011; Fu et al., 2012). Cold-based glaciers, however, have been observed to preserve landforms as fragile as sand beaches (Kleman, 1994), leading to the reinterpretation of complex glacial landscapes within a binary conceptual framework of cold and temperate basal thermal regimes (Kleman et al., 2008, 2010; Fabel et al., 2012; Fu et al., 2013). Nevertheless, it remains elusive whether glacial topography is a proxy for temperate ice-cover duration and why some glaciated regions show preserved periglacial blockfields topped by erratic boulders and others, including the Alps, do not (Wirsig et al., 2016; Seguinot et al., 2018).
On a larger scale, glacier erosion also likely governs, at least in part, the height of mountains (Egholm et al., 2009; Thomson et al., 2010) through the “glacier buzzsaw”. In turn, evidence suggests that increased mountain erosion rates coincided with global cooling and Pleistocene glaciations from roughly 2.6 million years before present (Herman and Champagnac, 2016). However, oceanic isotopic proxies for global weathering rates remained constant over this time period (Willenbring and Von Blanckenburg, 2010). Examination of contemporary erosion rates across different climates suggests that increased temperatures within glaciated regions lead to higher erosion rates (Koppes and Montgomery, 2009; Koppes et al., 2015; Fernandez et al., 2016). However, understanding the link between climate and glacier erosion in the sedimentary record remains difficult due to timescale biases (Ganti et al., 2016) and the non-linear relationship between atmospheric temperature and erosion (e.g. Anderson et al., 2012; Mariotti et al., 2021). Numerical glacier modelling may provide insights into such complexity.
Observing and quantifying long-term glacier erosion and sedimentation processes has been a challenge, and two general methods have been adopted to quantify erosion (Alley et al., 2019). Physically based models describe the quarrying process and abrasion of bedrock by debris-laden ice (e.g. Alley et al., 1997; Iverson, 2012; Beaud et al., 2014). Describing the processes physically provides a basis for understanding erosion processes (Hallet, 1979; Ugelvig et al., 2018) and yields insight into the formation of glacial landforms, such as tunnel valleys and eskers (Beaud et al., 2018; Hewitt and Creyts, 2019). Yet, these models prove difficult to implement in many cases due to the large number of poorly constrained parameters and processes, i.e. water pressure fluctuations and subglacial debris concentration (e.g. Hallet, 1979; Seguinot, 2008; Ugelvig et al., 2018).
Instead, empirical relationships between glacier sliding and erosion can represent erosional quantities well and can recreate important glacial landforms (e.g. Harbor et al., 1988; MacGregor et al., 2000). For instance, Humphrey and Raymond (1994) correlated temporal variations in ice velocity and suspended sediment load during a surge of Variegated Glacier to establish a linear erosion law. Koppes et al. (2015) quantified sediment yields in 15 Patagonian and Antarctic Peninsula fjords, concluding there was a predominant control of surface air temperature on rapid glacier erosion and calibrating a near-square law from glacier velocity to erosion rate. Herman et al. (2015) collected suspended sediment samples for 5 months in the outlet stream of Franz Josef Glacier, mapped their chemical composition to geological zones of distinctive glacier speed, and also concluded there was a near-square relationship between basal sliding and glacier erosion. Cook et al. (2020) assembled a global compilation of erosion rates for 38 glaciers, showing a predominant role of glacier sliding velocity over climate variables yet concluding there was a sub-linear relationship to erosion.
Here, the non-linear erosion law by Koppes et al. (2015) is applied to previously published model results (Seguinot et al., 2018) and the patterns of modelled erosion potential and cumulative last-glacial-cycle erosion potential are analysed. We examine the glaciological conditions that cause erosion and discuss the implications of these conditions on understanding the mark of ancient glaciers on Alpine topography and the relationship between climate and glacier erosion. Despite aggregated uncertainties in palaeoclimate, glacier flow, and glacier erosion processes, our results provide insights into the diversity of the Alpine glacial erosion landscape.
2.1 Ice sheet modelling
The ice sheet model set-up was presented in an earlier publication (Seguinot et al., 2018) and is briefly summarized here. The simulations were conducted using the Parallel Ice Sheet Model (PISM, development version e9d2d1f), an open-source, finite-difference, shallow-ice, and shallow-shelf model (the PISM authors, 2017). Our set-up includes temperature-dependent and water-content-dependent creep, pseudo-plastic basal sliding, bedrock isostatic deformation under the ice load, and a positive degree-day (PDD) surface mass balance model. The model is initialized with assumed present-day ice thickness and 1 km resolution bedrock topography from SRTM (Jarvis et al., 2008) and ice and bedrock temperature at 120 ka (1 ka is 1000 years before the present) and is run to the present. The ice sheet model physical parameters are listed in the earlier open-access publication (Seguinot et al., 2018), and the complete list of PISM parameters is stored in long-term, archived model output metadata for the present study (Seguinot, 2021a) and for the earlier publication (Seguinot, 2019, 2020).
Climate forcing is provided by a monthly climatology from interpolated observational data (WorldClim; Hijmans et al., 2005) and the European Centre for Medium-Range Weather Forecasts Interim Reanalysis (ERA-Interim; Dee et al., 2011), amended with temperature changes from the European Project for Ice Coring in Antarctica (EPICA; Jouzel et al., 2007) and time-dependent palaeo-precipitation reductions (Huybrechts, 2002). Coarser, 2 km resolution runs based on alternative palaeoclimate scenarios (Seguinot et al., 2018), forced by temperature changes from the Greenland Ice Core Project (GRIP; Dansgaard et al., 1993) and an oceanic sediment core from the Iberian margin (MD01-2444; Martrat et al., 2007), are analysed in the Discussion section (Sect. 4.1).
2.2 Erosion law
Modelled erosion rates, , are calculated from the modelled basal velocities, ub, using an empirical erosion power law,
where m1−l al−1 and l=2.34 are empirical constants calibrated on quantified fjord sediment yields and velocities from 15 Patagonian and Antarctic Peninsula tidewater glaciers (using the full dataset from Koppes et al., 2015, including outliers). We discuss the role of alternative values of Kg and l in the Discussion section (Sect. 4.2).
Our approach does not account for feedbacks of glacier erosion onto bedrock topography and then onto ice dynamics (e.g. Anderson et al., 2012). Furthermore, we do not account for the downstream advection of debris (e.g. Anderson and Anderson, 2016) or fluvial transport of subglacial sediment (Delaney et al., 2019). Instead, we assume that eroded material is instantly transported out of the system, thus neglecting its role in shielding the bedrock from glacier erosion in zones of temporary storage (Preusser et al., 2010). Nor do we account for differences in erosion effectiveness on different lithologies or erosion from subglacial and interglacial hydrological processes. For the aforementioned reasons, we refer to the above-computed rates, , as “potential erosion rates”.
Secondly, we compute the time-integrated glacier erosion rate,
and refer to it as the “cumulative erosion potential”. The integration is numerically approximated using a time step of 10 a in the main simulation and 100 a in the alternative climate scenarios runs. Note that in the above formula with an exponent, l, higher than 1, the cumulative erosion potential has a greater dependency on the basal ice dynamics, ub, than the duration of glacier cover.
3.1 Cumulative erosion
The modelled cumulative (time-integrated) glacial erosion potential (Fig. 1a) varies by several orders of magnitude from insignificant to 100 m scale erosion potential. Its spatial patterns show a very strong localization along the Alpine valleys, with local maxima occurring both at the Alpine gates, where ice flow transited from valley to piedmont glaciers, and further upstream, where the valley slopes increase. While mountain cirque glaciers and relevant erosion processes may not be captured by the model physics and horizontal resolution, high cumulative erosion potential also occurs near the valley heads. There is a general tendency for higher cumulative erosion in the north-western Alps where the input winter precipitation is higher (WorldClim; Fig. 1h in Seguinot et al., 2018) and the glacial relief more pronounced in the topography.
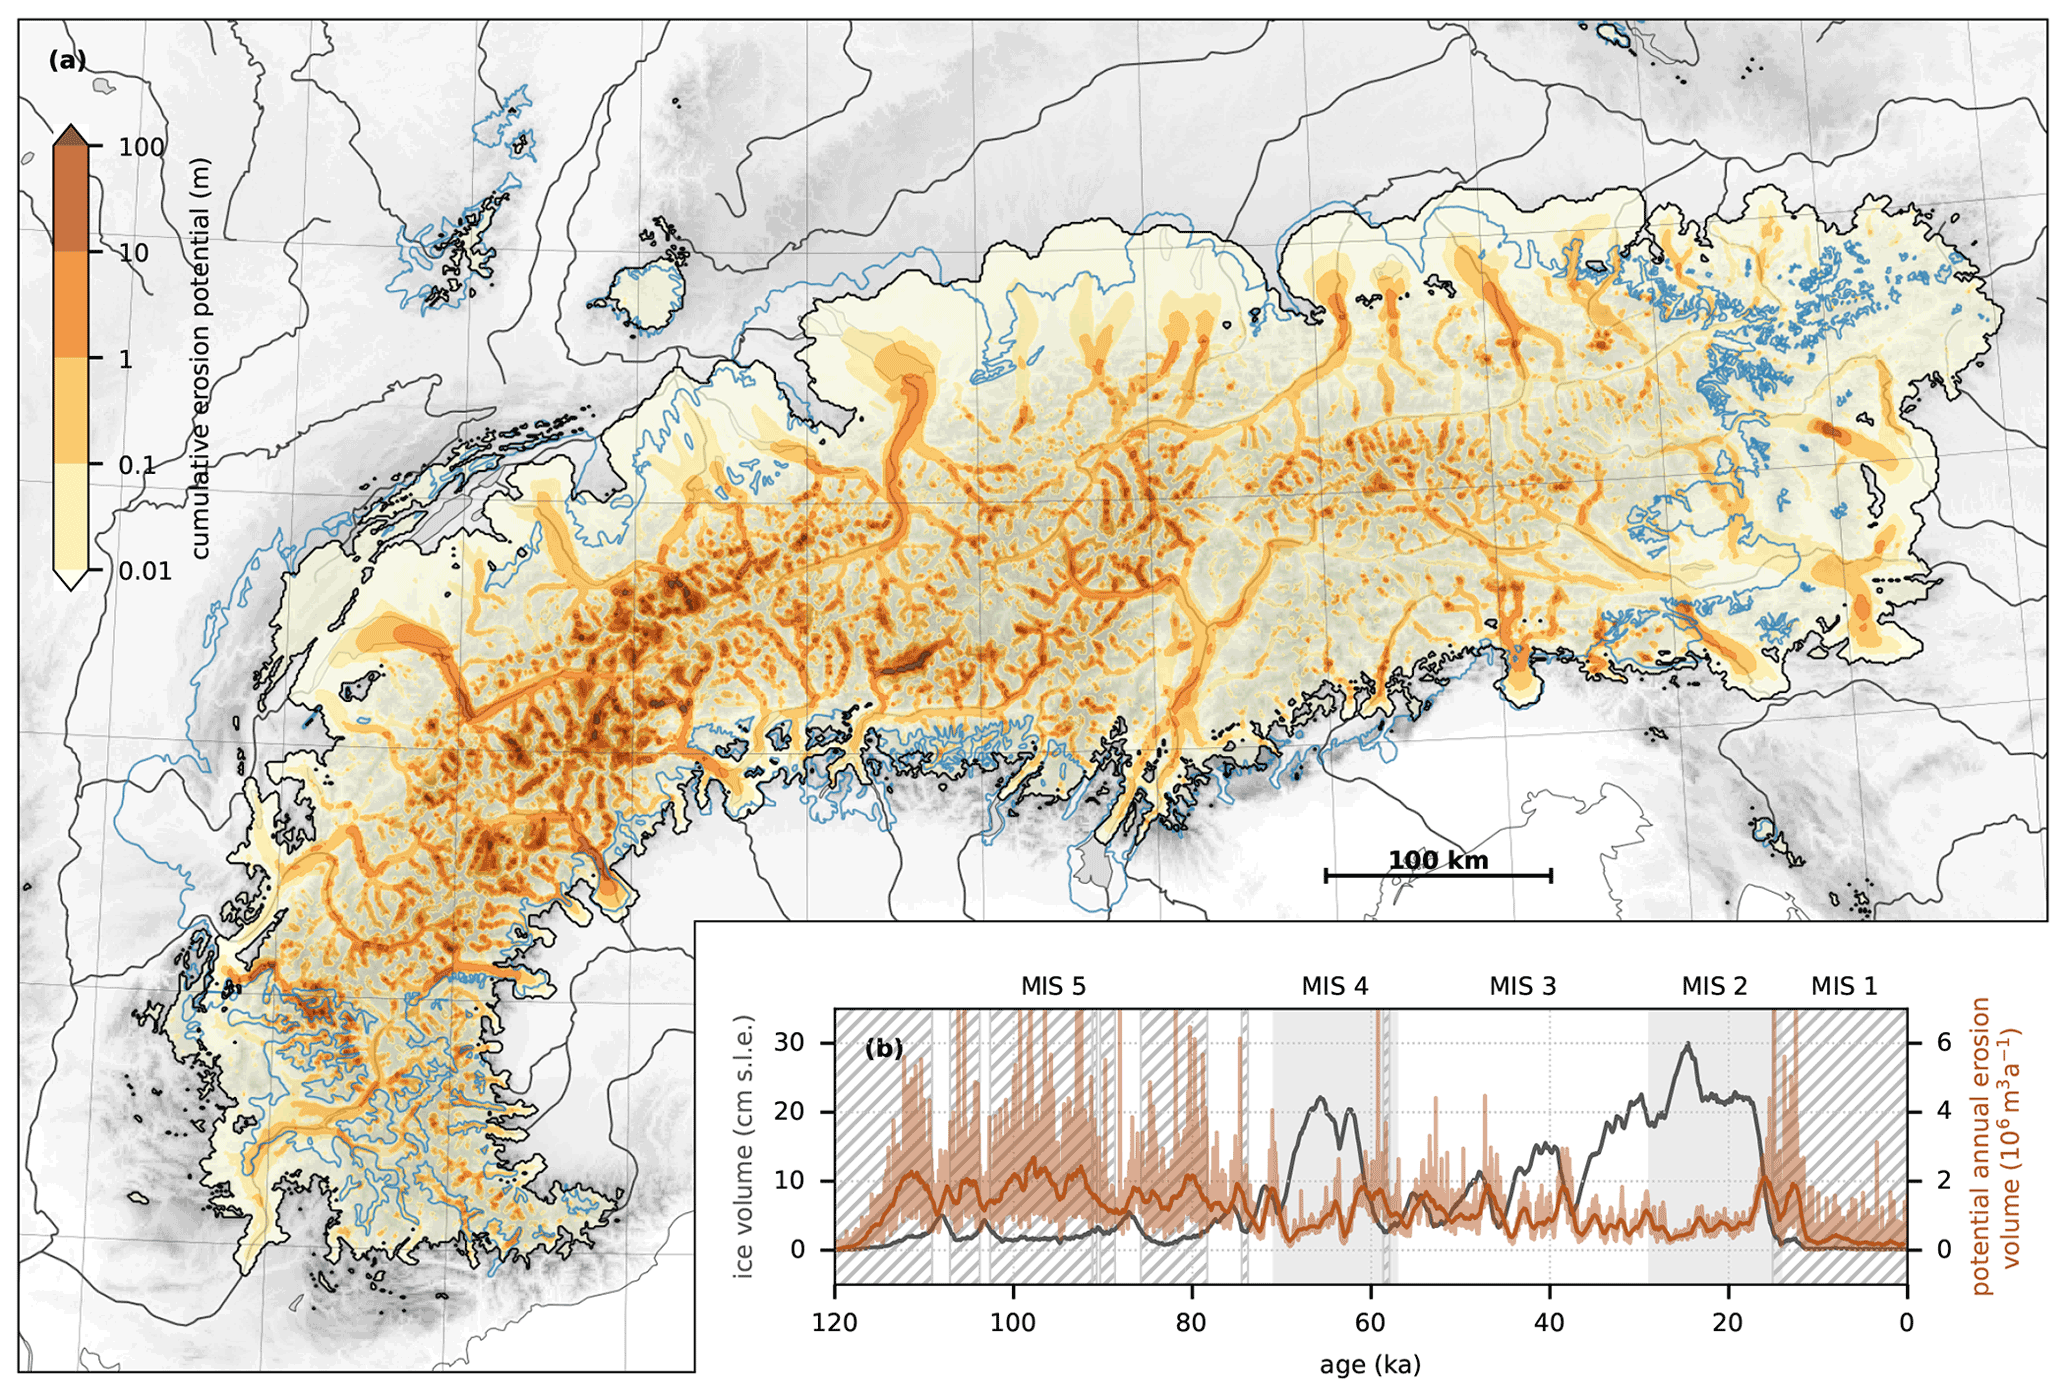
Figure 1(a) Modelled cumulative (time-integrated) glacial erosion potential over the last glacial cycle and geomorphological reconstruction of Last Glacial Maximum Alpine glacier extent for comparison (solid blue line; Ehlers et al., 2011). The background map consists of the initial basal topography from SRTM (Jarvis et al., 2008) and Natural Earth data (Patterson and Kelso, 2017). (b) Modelled total ice volume in centimetres of sea-level equivalent (cm s.l.e., black), annual (domain-integrated) potential erosion volume (light brown), and its 1 ka running mean (dark brown). Shaded grey areas indicate the timing for MIS 2 (marine oxygen isotope stage) and 4 (Lisiecki and Raymo, 2005). Hatching marks periods with ice volume below 3 cm s.l.e. where glacier sliding may be affected by stress-balance approximations and the model horizontal resolution (see Sect. 4.4).
3.2 Temporal evolution
The modelled annual (domain-integrated) potential glacial erosion volume does not systematically correlate with the modelled total ice volume (Fig. 1b). Except for the onset and termination of the glacial cycle were ice volume is low and sliding processes are unlikely to be captured by the model resolution, a comparison between the modelled ice volume and the modelled annual erosion volume shows no single relation between these two quantities (Fig. 2). After significant ice volume has been reached, there is a general tendency for slower erosion during periods of extensive glaciation (Fig. 2). However, the domain-integrated erosion volume is modelled to be consistently higher (by a factor of 2 to 10) during periods of decreasing ice volume than during periods of increasing ice volume (Fig. 2).

Figure 2Modelled annual (domain-integrated) potential erosion volume (light curves) and its 1 ka running mean (dark curves) in relation to the modelled total ice volume in centimetres of sea-level equivalent. Blue dashed lines indicate increasing ice volume and solid brown lines decreasing ice volume. Hatching indicates low confidence due to limited glacier volume.
3.3 Spatial migration
A closer look at Rhine Glacier, one of the palaeo ice sheet's largest outlets, reveals a spatial migration of the modelled rapid erosion areas. During stages of glacier advance and maximum extension, erosion is modelled to be under 1 mm a−1 and restricted to the lower parts of the catchment, while much of the intra-montane Alps (modelled to be largely cold-based; Fig. 6c in Seguinot et al., 2018) experience insignificant erosion potential (Fig. 3a and b). The potential erosion rates both increase and propagate inwards during periods of glacier retreat (Fig. 3c and e).
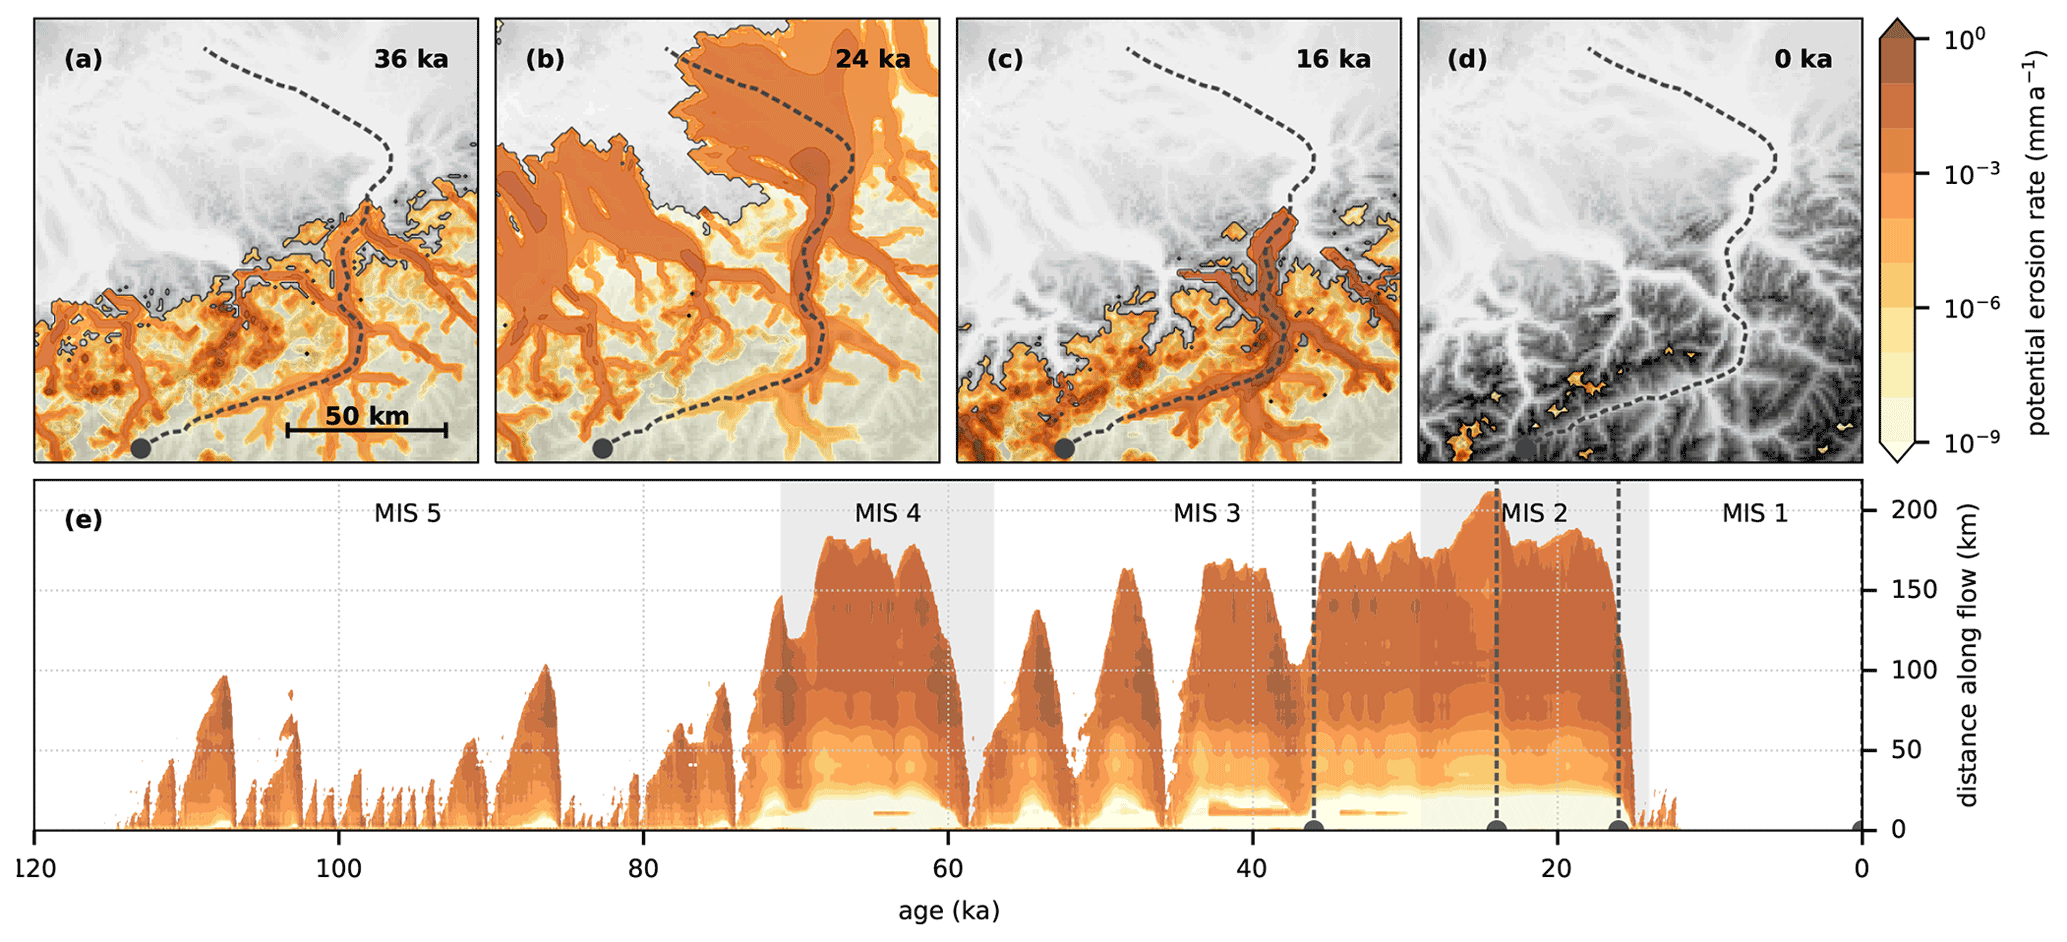
Figure 3(a–d) Modelled instantaneous potential erosion rate of Rhine Glacier for selected glacier advance and retreat ages and the final model state for topographic reference. (e) Interpolated instantaneous potential erosion rate along a Rhine Glacier transect (upper panels, dashed line) for the entire last glacial cycle.
The results found in the Rhine Glacier catchment can be generalized to the entire model domain by using (present-day) bedrock altitude as a proxy for along-flow distance (Fig. 4). Thus more generally, periods of modelled increasing and maximum ice volume correspond to lower values for elevation-aggregated potential erosion rates, with significant erosion potential restricted to lower elevations. In contrast, periods of modelled decreased ice volume correspond to higher local modelled erosion rates and more extensive rapid erosion potential in higher-elevation areas (Fig. 4).
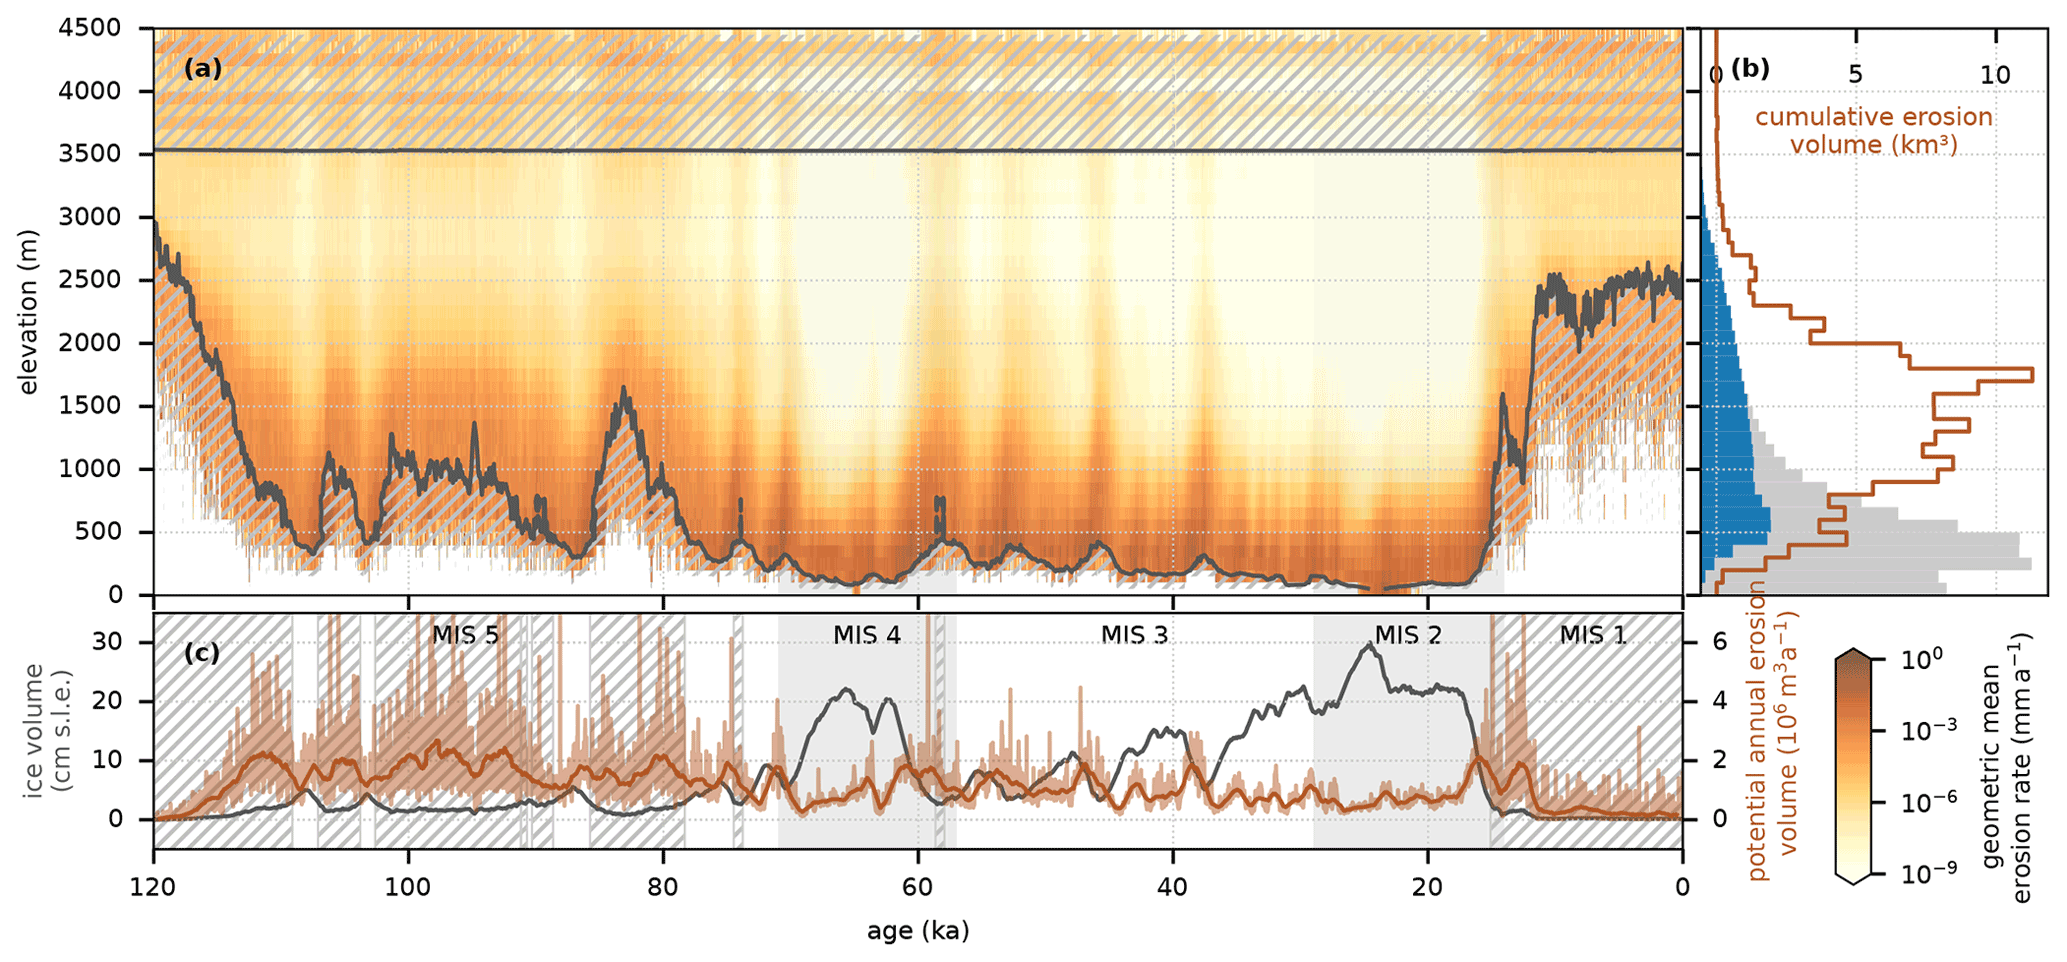
Figure 4(a) Potential erosion rate “hypsogram”, showing the geometric mean of modelled rates in 100 m elevation bands across the entire model domain and its time evolution. Hatching indicates elevation bands with fewer than a hundred grid cells (100 km2). (b) Distribution of model domain bedrock topography (grey bars) and glaciated topography (blue bars) in 100 m elevation bands and the corresponding cumulative potential erosion volume (brown line). (c) Same as Fig. 1b.
4.1 Climate sensitivity
Different palaeoclimate forcing scenarios lead to different modelled glaciation histories (Seguinot et al., 2018) and thus different results in terms of glacial-cycle cumulative erosion potential (Fig. 5). Scenarios including higher (constant, present-day) input precipitation rates yield generally higher modelled ice discharge and thus higher erosion potential (Fig. 5a–c), while scenarios including palaeo-precipitation reductions (Fig. 5d–f), including our default high-resolution run (Fig. 1), yield a smaller erosion potential.
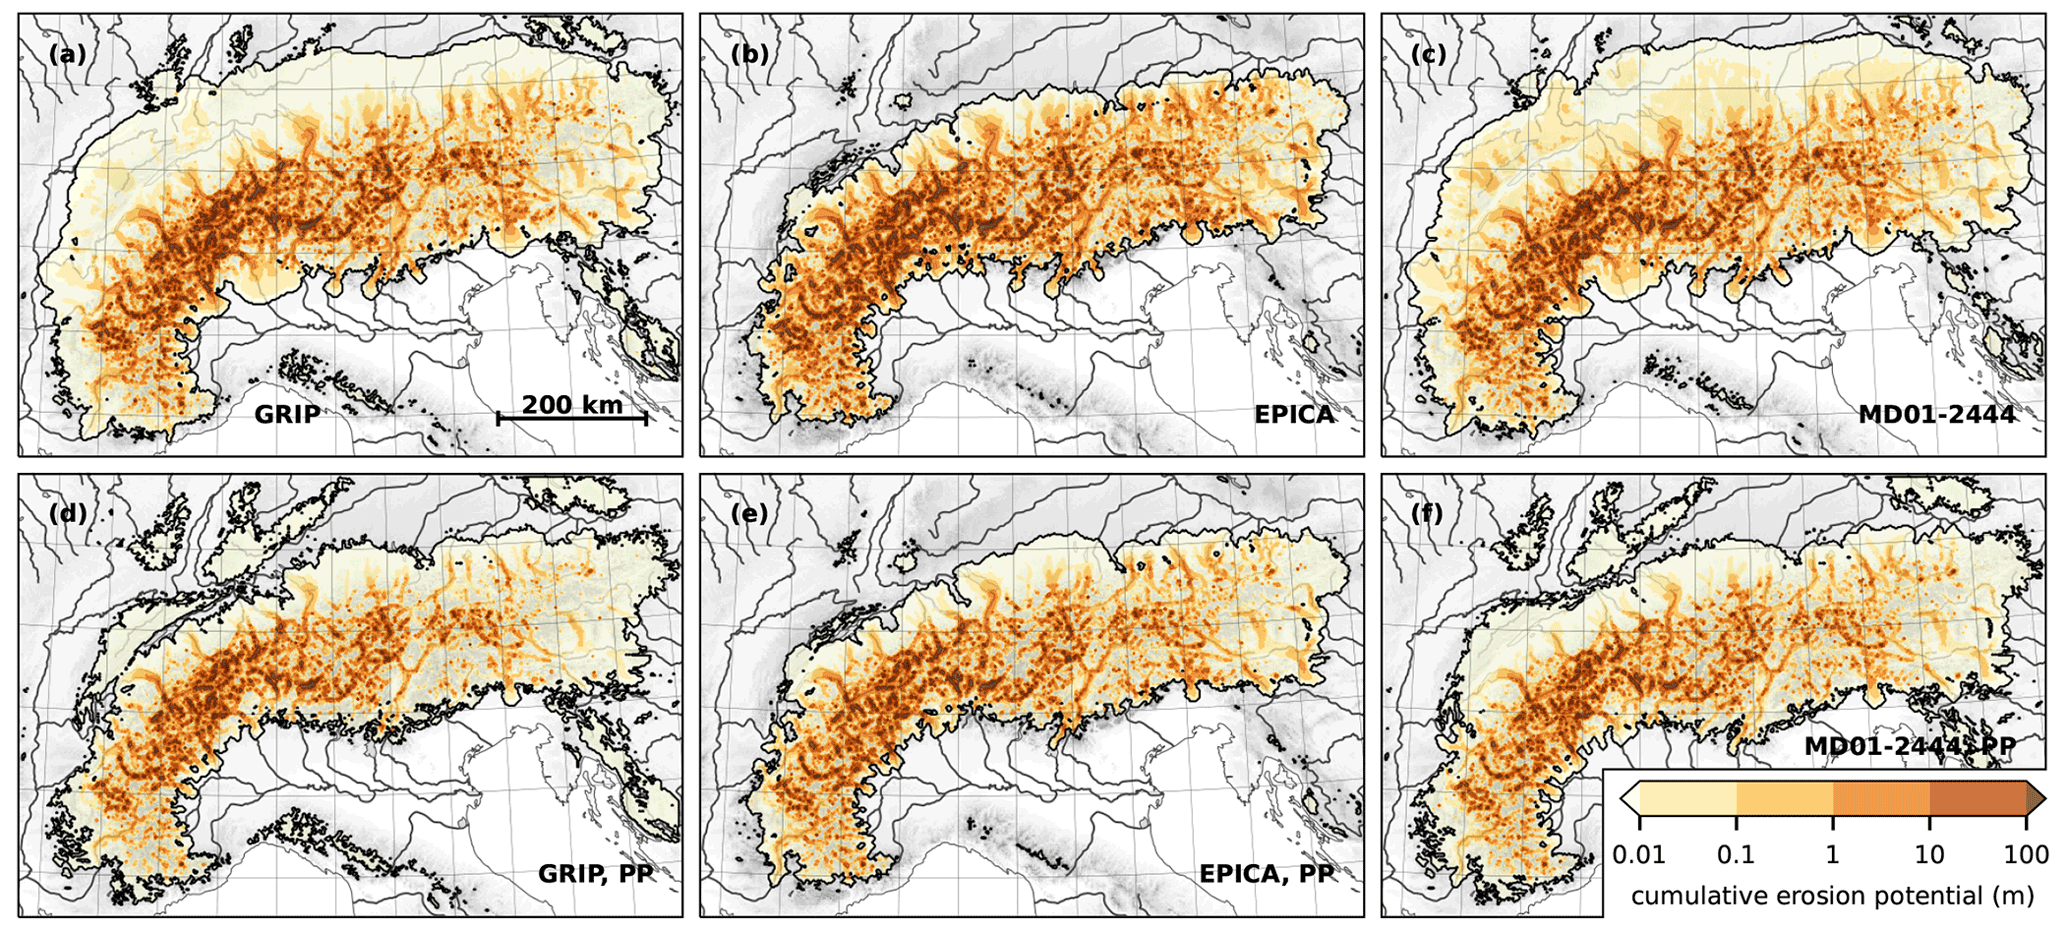
Figure 5Modelled cumulative glacial erosion potential over the last glacial cycle using three different palaeo-temperature histories from (a, d) the Greenland Ice Core Project (GRIP; Dansgaard et al., 1993), (b, e) the European Project for Ice Coring in Antarctica (our default, EPICA; Jouzel et al., 2007), and (c, f) an oceanic sediment core from the Iberian margin (MD01-2444; Martrat et al., 2007), both (a–c) without and (d–f) with palaeo-precipitation reductions (Seguinot et al., 2018).
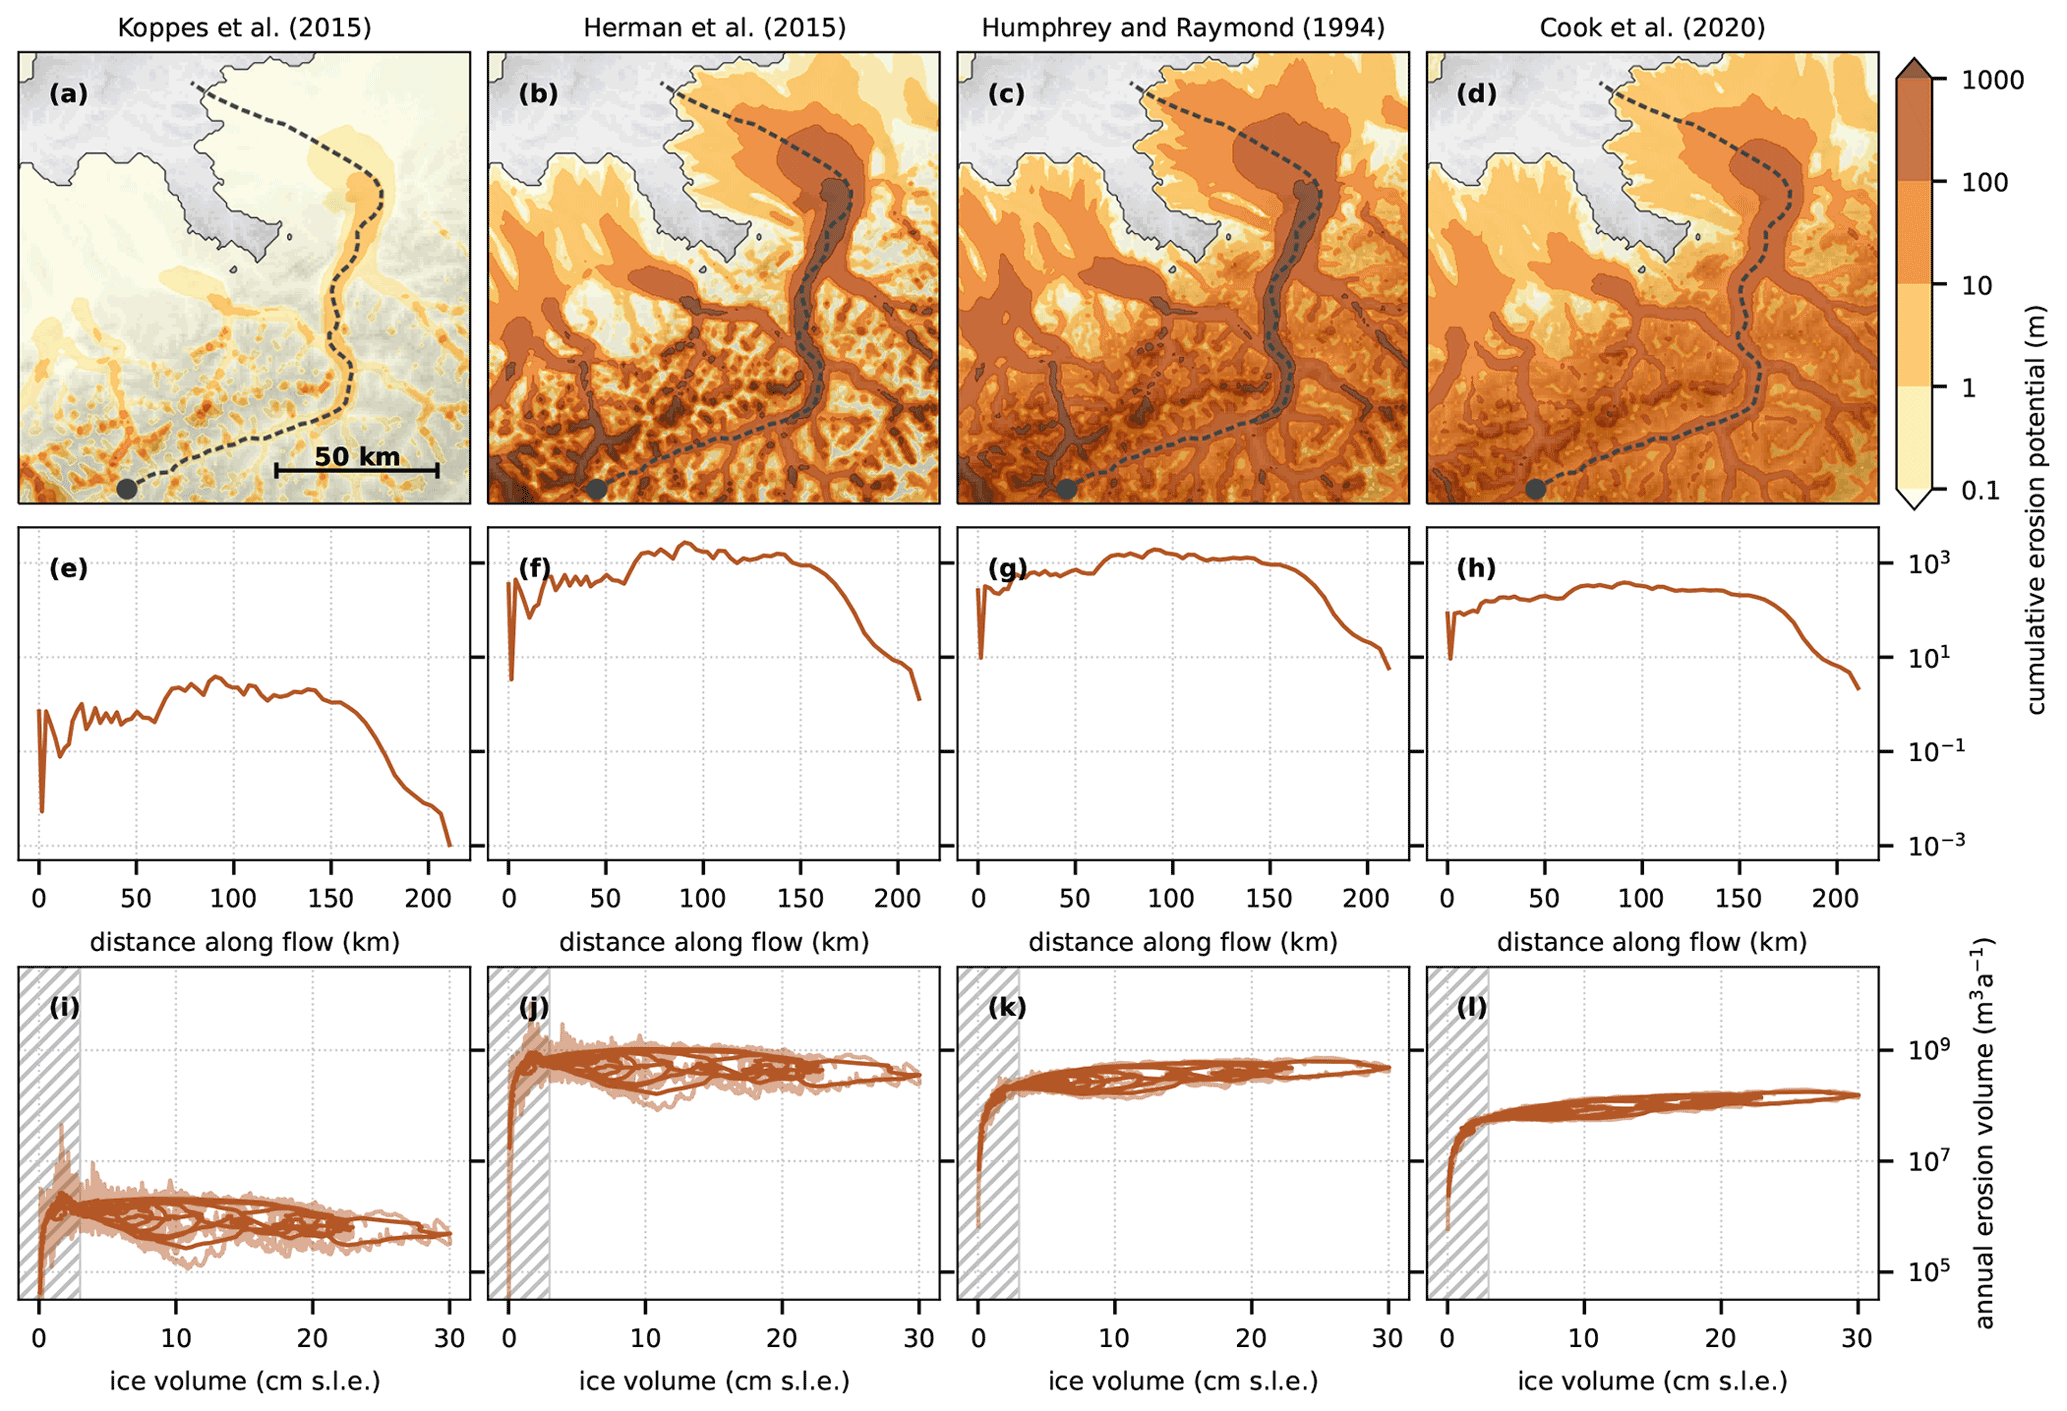
Figure 6Modelled cumulative (time-integrated) glacial erosion potential for three different erosion laws published by (a) Koppes et al. (2015), (same as Fig. 1a but with a different colour scale); (b) Herman et al. (2015), ; (c) Humphrey and Raymond (1994), ; and (d) Cook et al. (2020), . (e–h) Corresponding modelled cumulative glacial erosion potential along a Rhine Glacier transect (upper panels, dashed line) and (i–l) corresponding modelled evolution of annual (domain-integrated) erosion volume (light brown) and 1 ka running mean (dark brown) in relation to modelled total ice volume in centimetres of sea-level equivalent (as in Fig. 2a).
The spatial pattern of modelled time-integrated erosion is nevertheless generally consistent across the palaeoclimate scenarios tested, despite variations in the glaciation maximum extent (Fig. 3 in Seguinot et al., 2018; Fig. 5). It should be noted, however, that all runs presented here show a systematic bias with excessive glacier cover in the Eastern Alps and a diminished glacier extent in the Western Alps (Fig. 1a; further discussed in Seguinot et al., 2018). Thus the modelled patterns of erosion potential certainly include a similar bias. However, uncertainties due to palaeoclimate appear minor in regard to the much larger uncertainties affecting the choice of erosion law.
4.2 Choice of erosion law
The choice of erosion law significantly impacts the results (Fig. 6). Our default, based on quantified sediment yields from Patagonian and Antarctic Peninsula tidewater glaciers (; Koppes et al., 2015) yields a moderate and strongly localized cumulative erosion potential (Figs. 1 and 6a). The erosion law based on measured suspended sediment load from Franz Joseph Glacier (; Herman et al., 2015) also yields a strongly localized, and yet much higher, modelled erosion potential (Fig. 6b). The erosion law based on measured suspended sediment load during a surge of Variegated Glacier (, Humphrey and Raymond, 1994) results in similarly high values but a less localized pattern of cumulative erosion potential (Fig. 6c). Finally, the erosion law based on a global compilation of glacier velocities and erosion rates (; Cook et al., 2020) yields an even flatter pattern of cumulative erosion potential (Fig. 6d).
With a total Pleistocene glacial relief on the order of 1 km (Preusser et al., 2011; Valla et al., 2011), a cumulative glacial erosion for the last glacial cycle on the order of 10 to 100 m can be expected. However, none of the tested erosion power laws fall within this range. Instead, the erosion law calibrated on tidewater glaciers (Koppes et al., 2015) yields cumulative erosion in the Rhine Valley on the order of metres, while the three erosion laws based on terrestrial glaciers (Humphrey and Raymond, 1994; Herman et al., 2015; Cook et al., 2020) result in kilometre-scale integrated erosion potential. During the Last Glacial Maximum and much of the last glacial cycle, Alpine palaeoglaciers were closer in size, slope (an important parameter as we argue in the next section), and climatic context to the present-day glaciers of Patagonia and the Antarctic Peninsula (Koppes et al., 2015) than to Franz Joseph Glacier (Herman et al., 2015) and many of the glaciers included in the global compilation by Cook et al. (2020). This may help to explain why the reality appears to fall in between the tested erosion laws.
That said, the magnitude of the modelled erosion rates can hardly be used as a criterion to rule out this or that erosion law for the glacial Alps. While sliding is modelled here by a pseudo-plastic law based on till dilatation under high water pressure (Tulaczyk et al., 2000), empirical erosion rules are thought to be a proxy for glacier abrasion (e.g. Hallet, 1979; and possibly plucking) of a glacier flowing over a hard bed. Current erosion rates in the Alps strongly vary depending on the substratum (Steinemann et al., 2020, 2021), and it is arguable that a layer of till and proglacial sediments may have armoured the glacier bed against erosion for at least parts of the glacial cycle. Thus, given the lack of data to constrain the erosion rule, it can not be excluded that a linear or sub-linear erosion law (e.g. Cook et al., 2020) would lead to a less localized pattern of erosion (Fig. 6c and d) and a stronger correlation between modelled ice volume and erosion (Fig. 6k and l). On the other extreme, an even more non-linear erosion law, not tested here, derived from tidewater glaciers but excluding two outliers (; Koppes et al., 2015) would result in an even more localized pattern of erosion potential.
The modelled pattern of erosion potential depends on PISM glacier physics and sliding model parameters. In particular, the pseudo-plastic sliding law exponent (q=0.25 in Seguinot et al., 2018) controls the sharpness of the transition between adherent and decoupled basal conditions. Recent ensemble validation of Antarctic Ice Sheet glacial-cycle simulations against geological and present-day observations (Albrecht et al., 2020a, b) supports a higher value of q=0.75 and thus a sliding law closer to linear, which would perhaps result in a smoother distribution of sliding velocity and erosion potential. Lateral stress gradients missing from the shallow-shelf approximation stress balance could also contribute to moderate sliding velocity in narrow troughs (Herman et al., 2011; Egholm et al., 2012a, b; Pedersen et al., 2014).
Because the intrinsically large variations in modelled glacier sliding velocities yield cumulative glacial-cycle erosion 2 to 3 orders of magnitude higher in the Alpine valleys than near the mountain tops (Fig. 6d), we argue that the modelled highly localized pattern of erosion potential is qualitatively robust. This pattern, as well as the lithologic variations in bedrock erodibility, may explain order-of-magnitude variation in glacier erosion rates observed in the cosmogenic nuclide record (Jansen et al., 2019; Steinemann et al., 2020, 2021).
4.3 Climate control on erosion
The modelled, domain-integrated glacier erosion volume does not increase together with ice volume. In contrast, periods of ice advance and maximum glaciation correspond to comparatively slow erosion potential (Figs. 1 and 2). This result may seem paradoxical and is modulated to a limited extent by the exponent, l, in the erosion rule (Fig. 6). Nevertheless, it may explain why some areas covered during glacial maxima only, such as some valleys on the southern side of the Alps, appear to have experienced only little glacial modification of their topography. During deglaciation periods, increased surface melt at low elevations results in a steepened topographic profile (Fig. 7a), as observed and further expected on currently retreating glaciers (Huss et al., 2010; Zekollari and Huybrechts, 2015). The buttress formed by the glacier foot against gravitational forces is reduced, causing an increase in the magnitude of the basal shear stress (basal drag) relative to the ice overburden pressure and an increase in the area where sliding and, thus, erosion can occur (Fig. 7b).

Figure 7(a) Modelled basal and surface topographies interpolated along Rhine Glacier during glacier advance (36 ka, dashed blue line), maximum extent (24 ka, solid grey line), and retreat (16 ka, solid brown line, using the same transect as in Fig. 7). (b) Interpolated yield stress in the pseudo-plastic sliding law (dotted lines) and magnitude of the basal shear stress (basal drag, solid lines), both normalized against the ice overburden pressure. Basal drag values greater than yield stress result in glacier sliding (see Seguinot, 2014; Seguinot et al., 2016, for model physics). Some of the observed basal drag fluctuations in the upper part of the transect result from steep slopes on either side of the narrow valley.
This result is corroborated by a recent denudation record from the Mediterranean Alps, which includes an increase in glacier erosion in the Var Valley, roughly at 25 ka following an extended period of low denudation rates (Mariotti et al., 2021). While that increase in erosion pre-dates the increase observed in our study (ca. 15 ka; Fig. 2), it demonstrates that climatic conditions over which glacier erosion occurs are relatively specific and likely transient. Other field-based studies have evidenced increased glacier erosion and proglacial sedimentation during the current deglaciation period (e.g. Koppes and Montgomery, 2009; Micheletti and Lane, 2016; Lane et al., 2017; Bendixen et al., 2017). This increase has often been attributed to higher meltwater availability; promoting sediment transport (Delaney and Adhikari, 2020); enhanced glacier sliding (Herman et al., 2011); and hydrofracturing, i.e. plucking (Hallet, 1996; Ugelvig et al., 2018; Hildes et al., 2004).
But importantly, these hydrological processes are not included in our model, so deglaciation surface meltwater is assumed to instantly exit the glacier with no effect on glacier dynamics (cf. Werder et al., 2013; Iverson, 2012; Ugelvig et al., 2018). The enhanced glacier velocity during periods of ice retreat is here modelled to result from changes in glacier geometry alone (Fig. 7b). Coincidentally, the link between climate and erosion is also the topic of a recent, independent study using PISM (Lai and Anders, 2021). Observed feedbacks between surface meltwater and basal sliding, not included in the model, presumably further accelerated erosion during deglaciation (Herman et al., 2011). Furthermore, we omit the fluvial transport of sediment, which could well increase sediment discharge and erosion with increased melt, so long as additional sediment remains available (Delaney and Adhikari, 2020). Rapid glacier erosion can be expected to accompany the ongoing 21st-century deglaciation, especially for the ice sheets of Greenland and Antarctica where polythermal and cold-based glaciers are warming and sliding may increase (e.g. Moon et al., 2012; Mouginot et al., 2014; Overeem et al., 2017).
4.4 Age of the glacial landscape
In many places throughout the Alps, significant modelled cumulative erosion occurs far inside the Alpine valleys (Fig. 1). However, the potential erosion patterns experience spatial shifts through the glacial cycle (Fig. 3), so high-altitude rapid erosion is not modelled to date from expansive glaciation stages but instead from stages of intermediate glacier cover (Fig. 4; Barr et al., 2019).
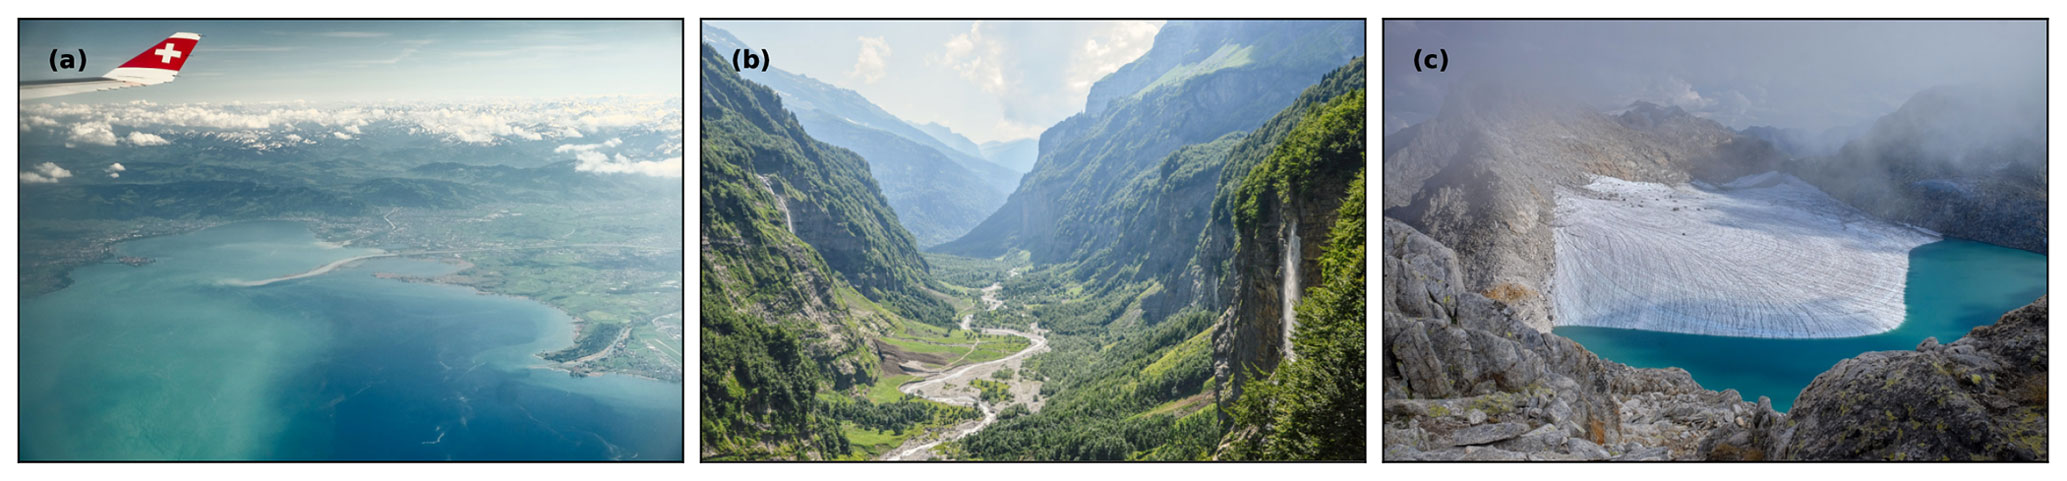
Figure 8Alpine glacial erosion landscape diversity. (a) Piedmont overdeepening of Lake Constance, ca. 10×50 km. (b) Glacial trough at Bout du Monde, ca. 1×10 km. (c) The unusually deep mountain cirque revealed by the current demise of Chüeboden Glacier, ca. 1×1 km.
For instance, low-elevation piedmont overdeepened basins such as Lake Constance (Fig. 8a), Lake Geneva, and Lake Maggiore are here modelled to be the product of extensive Last Glacial Maximum-like glaciations. Other modelling work suggests that features such as these likely form when water can access the glacier bed and encourage glacier sliding and, thus, erosion (Herman et al., 2011). The model herein does not include subglacial hydrology, yet the role of climate warming in increasing glacier erosion at the lower elevations remains evident (Fig. 4). Alpine terrain with elevations above 1000 m is modelled to experience virtually no erosion from 35 to 18 ka BP (Fig. 4), so many of the most spectacular, intermediate-elevation glacial valleys of the Alps such as Lauterbrunnental, Haslital (upper Aare), or Bout du Monde (upper Giffre, Fig. 8b) would date from periods of intermediate glacier extension.
The validity of the model results at high elevation is discussable. Crystalline massifs such as the Écrins, Gran Paradiso, Monte Rosa, Aare, Ötztal, and High Tauern massifs locally exhibit a strikingly high erosion potential. However, the computation of glacier flow velocities on such steep surfaces is strongly limited by the model horizontal resolution of 1 km, the shallow-ice glacier flow physics (Imhof et al., 2019), and PISM's current mass-conservation heuristics (Imhof, 2021, Appendix). Besides, bergschrund (rimaye) processes likely to dominate interglacial cirque erosion at such altitudes (Sanders et al., 2012) are not captured by the velocity-based glacier erosion power laws. Nevertheless, the lack of rapid erosion at high elevations for much of the modelled glacial cycle (Fig. 4) implies that the highest mountain cirques (e.g. Fig. 8c) would have formed over interglacial periods, when glaciers are confined to high terrain (Barr et al., 2017, 2019). Similar processes also occur on Himalayan glaciers and may limit erosion for the high-elevation portion of that mountain range during cold periods as well, failing to offset uplift rates (Harper and Humphrey, 2003). Over longer timescales, though, the vertical distribution of erosion rates also depends on the erosional modification of topography (Sternai et al., 2013).
Finally, the time-transgressive nature of the modelled glacial erosion rates hints at a new explanation for the Alpine glacier trim line and lack of cold-based glaciation evidence. Due to their geographic location in the mid-latitudes and their steep topographic gradient, the Alps appear to be a mountain range that hosted glaciers of various sizes throughout the varying climate of the Quaternary, resulting in a transgressive localization of glacier erosion throughout their elevational range, from the piedmont during glacial maxima to the highest cirques during interglacial periods. The Alpine trim line, in this case, would correspond neither to the upper reach of the Last Glacial Maximum glaciers (e.g. Kelly et al., 2004) nor to an englacial temperate-ice boundary (Coutterand, 2010; Seguinot et al., 2018) but to a time-transgressive upper limit of erosion from advancing and retreating glaciers on steep terrain.
Due to compounded uncertainties regarding palaeoclimate, glacier sliding, and erosion processes, our quantitative results are very likely inaccurate. However, we draw the following qualitative conclusions:
-
The non-linear physics of glacier deformation and sliding combined with non-linear empirical erosion laws results in a very strong localization of rapid glacier erosion in regions of fast flow.
-
This high spatio-temporal variability hints at a complex relationship between climate and glacier erosion, so a highly variable response of glacier erosion to climate should be expected.
-
Increased gravitational drag due to surface profile steepening provides a mechanism for accelerated erosion during deglaciation periods, irrespective of surface meltwater penetration to the glacier bed.
-
If a non-linear glacier erosion law is used, the climate-induced slowdown of erosion counterbalances glacier expansion, so Alpine-wide glacier erosion volumes do not correlate with the ice volume.
-
Rapid glacier erosion is restricted to low elevation during stages of glacier advance and maximum glaciation but propagates up-valley to higher elevations during periods of glacier retreat.
-
The diversity of the Alpine glacier erosion landscape appears to be the time-transgressive signature of a variety of glacial stages ranging from pan-Alpine ice sheets to modern-style mountain glaciers.
PISM is available as open-source software (https://github.com/pism/pism/commit/e9d2d1f, last access: 8 March 2017) (the PISM authors, 2017). Time and domain-aggregated erosion variables such as those used in the figures are available for the four presented erosion power laws (https://doi.org/10.5281/zenodo.5084579; Seguinot, 2021a). Other model output variables were previously made available (https://doi.org/10.5281/zenodo.3604174; Seguinot, 2019; https://doi.org/10.5281/zenodo.3604142; Seguinot, 2020).
Animations made available online show the spatio-temporal distribution of modelled glacier potential erosion rates (https://vimeo.com/503162771, last access: 2 August 2021; Seguinot, 2021b, supplementing Fig. 1), the evolving relationship between ice volume and potential annual erosion volume (https://vimeo.com/512478926, last access: 2 August 2021; Seguinot, 2021c, supplementing Fig. 2), and the distribution of potential erosion rates against bedrock altitude (https://vimeo.com/512479008, last access: 2 August 2021; Seguinot, 2021d, supplementing Fig. 4).
The supplement related to this article is available online at: https://doi.org/10.5194/esurf-9-923-2021-supplement.
JS performed the computations and prepared the figures. ID interpreted the results in a broader context. Both authors contributed to the text.
The authors declare that they have no conflict of interest.
Publisher's note: Copernicus Publications remains neutral with regard to jurisdictional claims in published maps and institutional affiliations.
We are very thankful to Constantine Khroulev, Ed Bueler, and Andy Aschwanden for their constant help and development with PISM, without whom this work would not have been possible. Julien Seguinot would like to thank John Jansen and Martin Margold for insightful early discussions; Susan Ivy-Ochs for being a constant (droid) motivator; Popi, Mattheos, Karsta, Stefan, Françoise, and Dominique for welcoming him on Anafi and providing agreeable conditions for work in times of a pandemic; and the Long Haul Trucker for conveying his laptop and data unbroken for 5000 km across Europe and 14 countries. Ian Delaney thanks Frédéric Herman for valuable support and conversations while at the University of Lausanne. Both authors thank the anonymous reviewer and Ian Evans (aided by Iestyn Barr, Jeremy Ely, Matt Tomkins, Pippa Whitehouse, Cristina Balaban, and Matt Wiecek) for providing constructive feedback which has been incorporated into the present paper and the associate editor Andreas Lang for handling the reviews. The (previously published) ice flow simulations were made with computer resources provided by the Swiss National Supercomputing Centre (CSCS) allocation nos. s573 and sm13 made to Julien Seguinot.
This paper was edited by Andreas Lang and reviewed by Ian Evans and one anonymous referee.
Albrecht, T., Winkelmann, R., and Levermann, A.: Glacial-cycle simulations of the Antarctic Ice Sheet with the Parallel Ice Sheet Model (PISM) – Part 1: Boundary conditions and climatic forcing, The Cryosphere, 14, 599–632, https://doi.org/10.5194/tc-14-599-2020, 2020a. a
Albrecht, T., Winkelmann, R., and Levermann, A.: Glacial-cycle simulations of the Antarctic Ice Sheet with the Parallel Ice Sheet Model (PISM) – Part 2: Parameter ensemble analysis, The Cryosphere, 14, 633–656, https://doi.org/10.5194/tc-14-633-2020, 2020b. a
Alley, R. B., Cuffey, K. M., Evenson, E. B., Strasser, J. C., Lawson, D. E., and Larson, G. J.: How glaciers entrain and transport basal sediment: physical constraints, Quaternary Sci. Rev., 16, 1017–1038, https://doi.org/10.1016/S0277-3791(97)00034-6, 1997. a
Alley, R. B., Cuffey, K. M., and Zoet, L. K.: Glacial erosion: status and outlook, Ann. Glaciol., 60, 1–13, https://doi.org/10.1017/aog.2019.38, 2019. a
Anderson, L. S. and Anderson, R. S.: Modeling debris-covered glaciers: response to steady debris deposition, The Cryosphere, 10, 1105–1124, https://doi.org/10.5194/tc-10-1105-2016, 2016. a
Anderson, R., Dühnforth, M., Colgan, W., and Anderson, L.: Far-flung moraines: Exploring the feedback of glacial erosion on the evolution of glacier length, Geomorphology, 179, 269–285, https://doi.org/10.1016/j.geomorph.2012.08.018, 2012. a, b
Barr, I., Ely, J., Spagnolo, M., Clark, C., Evans, I., Pellicer, X., Pellitero, R., and Rea, B.: Climate patterns during former periods of mountain glaciation in Britain and Ireland: Inferences from the cirque record, Palaeogeogr., Palaeocl., 485, 466–475, https://doi.org/10.1016/j.palaeo.2017.07.001, 2017. a
Barr, I., Ely, J., Spagnolo, M., Evans, I., and Tomkins, M.: The dynamics of mountain erosion: cirque growth slows as landscapes age, Earth Surf. Proc. Land., 44, 2628–2637, https://doi.org/10.1002/esp.4688, 2019. a, b
Beaud, F., Flowers, G. E., and Pimentel, S.: Seasonal-scale abrasion and quarrying patterns from a two-dimensional ice-flow model coupled to distributed and channelized subglacial drainage, Geomorphology, 219, 176–191, https://doi.org/10.1016/j.geomorph.2014.04.036, 2014. a
Beaud, F., Venditti, J., Flowers, G., and Koppes, M.: Excavation of subglacial bedrock channels by seasonal meltwater flow, Earth Surf. Proc. Land., 43, 1960–1972, https://doi.org/10.1002/esp.4367, 2018. a
Bendixen, M., Iversen, L. L., Bjørk, A. A., Elberling, B., Westergaard-Nielsen, A., Overeem, I., Barnhart, K. R., Khan, S. A., Abermann, J., Langley, K., and Kroon, A.: Delta progradation in Greenland driven by increasing glacial mass loss, Nature, 550, 101–104, https://doi.org/10.1038/nature23873, 2017. a
Cook, S. J., Swift, D. A., Kirkbride, M. P., Knight, P. G., and Waller, R. I.: The empirical basis for modelling glacial erosion rates, Nat. Commun., 11, 759, https://doi.org/10.1038/s41467-020-14583-8, 2020. a, b, c, d, e, f
Coutterand, S.: Etude géomorphologique des flux glaciaires dans les Alpes nord-occidentales au Pléistocène récent: du maximum de la dernière glaciation aux premières étapes de la déglaciation, PhD thesis, Université de Savoie, Savoie, 2010. a
Dansgaard, W., Johnsen, S. J., Clausen, H. B., Dahl-Jensen, D., Gundestrup, N. S., Hammer, C. U., Hvidberg, C. S., Steffensen, J. P., Sveinbjörnsdottir, A. E., Jouzel, J., and Bond, G.: Evidence for general instability of past climate from a 250-kyr ice-core record, Nature, 364, 218–220, https://doi.org/10.1038/364218a0, 1993. a, b
Dee, D. P., Uppala, S. M., Simmons, A. J., Berrisford, P., Poli, P., Kobayashi, S., Andrae, U., Balmaseda, M. A., Balsamo, G., Bauer, P., Bechtold, P., Beljaars, A. C. M., van de Berg, L., Bidlot, J., Bormann, N., Delsol, C., Dragani, R., Fuentes, M., Geer, A. J., Haimberger, L., Healy, S. B., Hersbach, H., Hólm, E. V., Isaksen, L., Kållberg, P., Köhler, M., Matricardi, M., McNally, A. P., Monge-Sanz, B. M., Morcrette, J.-J., Park, B.-K., Peubey, C., de Rosnay, P., Tavolato, C., Thépaut, J.-N., and Vitart, F.: The ERA-Interim reanalysis: configuration and performance of the data assimilation system, Q. J. Roy. Meteorol. Soc., 137, 553–597, https://doi.org/10.1002/qj.828, 2011. a
Delaney, I. and Adhikari, S.: Increased Subglacial Sediment Discharge in a Warming Climate: Consideration of Ice Dynamics, Glacial Erosion, and Fluvial Sediment Transport, Geophys. Res. Lett., 47, e2019GL085672, https://doi.org/10.1029/2019GL085672, 2020. a, b
Delaney, I., Werder, M. A., and Farinotti, D.: A numerical model for fluvial transport of subglacial sediment, J. Geophys. Res.-Earth, 124, 2197–2223, https://doi.org/10.1029/2019jf005004, 2019. a
Egholm, D., Nielsen, S., Pedersen, V., and Lesemann, J.-E.: Glacial effects limiting mountain height, Nature, 460, 884–887, https://doi.org/10.1038/nature08263, 2009. a
Egholm, D., Pedersen, V., Knudsen, M., and Larsen, N.: Coupling the flow of ice, water, and sediment in a glacial landscape evolution model, Geomorphology, 141–142, 47–66, https://doi.org/10.1016/j.geomorph.2011.12.019, 2012a. a
Egholm, D., Pedersen, V., Knudsen, M., and Larsen, N.: On the importance of higher order ice dynamics for glacial landscape evolution, Geomorphology, 141–142, 67–80, https://doi.org/10.1016/j.geomorph.2011.12.020, 2012b. a
Ehlers, J., Gibbard, P. L., and Hughes, P. D. (Eds.): vol. 15 of Dev. Quaternary Sci., Elsevier, Amsterdam, 2011. a
Fabel, D., Ballantyne, C. K., and Xu, S.: Trimlines, blockfields, mountain-top erratics and the vertical dimensions of the last British-Irish Ice Sheet in NW Scotland, Quaternary Sci. Rev., 55, 91–102, https://doi.org/10.1016/j.quascirev.2012.09.002, 2012. a
Fernandez, R., Anderson, J., Wellner, J., Minzoni, R., Hallet, B., and Smith, R. T.: Latitudinal variation in glacial erosion rates from Patagonia and the Antarctic Peninsula (46∘ S–65∘ S), B. Geol. Soc. Am., 128, 1000–1023, https://doi.org/10.1130/B31321.1, 2016. a
Fu, P., Heyman, J., Hättestrand, C., Stroeven, A. P., and Harbor, J. M.: Glacial geomorphology of the Shaluli Shan area, southeastern Tibetan Plateau, J. Maps, 8, 48–55, https://doi.org/10.1080/17445647.2012.668762, 2012. a
Fu, P., Harbor, J. M., Stroeven, A. P., Hättestrand, C., Heyman, J., and Zhou, L.: Glacial geomorphology and paleoglaciation patterns in Shaluli Shan, the southeastern Tibetan Plateau – Evidence for polythermal ice cap glaciation, Geomorphology, 182, 66–78, https://doi.org/10.1016/j.geomorph.2012.10.030, 2013. a
Ganti, V., von Hagke, C., Scherler, D., Lamb, M., Fischer, W., and Avouac, J.-P.: Time scale bias in erosion rates of glaciated landscapes, Sci. Adv., 2, e1600204, https://doi.org/10.1126/sciadv.1600204, 2016. a
Hallet, B.: A theoretical model of glacial abrasion, J. Glaciol., 23, 39–50, https://doi.org/10.3189/s0022143000029725, 1979. a, b, c
Hallet, B.: Glacial quarrying: a simple theoretical model, Ann. Glaciol., 22, 1–8, https://doi.org/10.3189/1996aog22-1-1-8, 1996. a
Harbor, J. M., Hallet, B., and Raymond, C. F.: A numerical model of landform development by glacial erosion, Nature, 333, 347–349, https://doi.org/10.1038/333347a0, 1988. a
Harper, J. and Humphrey, N.: High altitude Himalayan climate inferred from glacial ice flux, Geophys. Res. Lett., 30, 1764, https://doi.org/10.1029/2003GL017329, 2003. a
Herman, F. and Champagnac, J.-D.: Plio-Pleistocene increase of erosion rates in mountain belts in response to climate change, Terra Nova, 28, 2–10, https://doi.org/10.1111/ter.12186, 2016. a
Herman, F., Beaud, F., Champagnac, J., Lemieux, J. M., and Sternai, P.: Glacial hydrology and erosion patterns: a mechanism for carving glacial valleys, Earth Planet. Sc. Lett., 310, 498–508, https://doi.org/10.1016/j.epsl.2011.08.022, 2011. a, b, c, d
Herman, F., Beyssac, O., Brughelli, M., Lane, S. N., Leprince, S., Adatte, T., Lin, J. Y. Y., Avouac, J.-P., and Cox, S. C.: Erosion by an Alpine glacier, Science, 350, 193–195, https://doi.org/10.1126/science.aab2386, 2015. a, b, c, d, e
Hewitt, I. and Creyts, T.: A model for the formation of eskers, Geophys. Res. Lett., 46, 6673–6680, https://doi.org/10.1029/2019GL082304, 2019. a
Hijmans, R. J., Cameron, S. E., Parra, J. L., Jones, P. G., and Jarvis, A.: Very high resolution interpolated climate surfaces for global land areas, Int. J. Climatol., 25, 1965–1978, https://doi.org/10.1002/joc.1276, 2005. a
Hildes, D. H., Clarke, G. K., Flowers, G. E., and Marshall, S. J.: Subglacial erosion and englacial sediment transport modelled for North American ice sheets, Quaternary Sci. Rev., 23, 409–430, https://doi.org/10.1016/j.quascirev.2003.06.005, 2004. a
Humphrey, N. F. and Raymond, C. F.: Hydrology, erosion and sediment production in a surging glacier: Variegated Glacier, Alaska, 1982–83, J. Glaciol., 40, 539–552, https://doi.org/10.3189/s0022143000012429, 1994. a, b, c, d
Huss, M., Jouvet, G., Farinotti, D., and Bauder, A.: Future high-mountain hydrology: a new parameterization of glacier retreat, Hydrol. Earth Syst. Sci., 14, 815–829, https://doi.org/10.5194/hess-14-815-2010, 2010. a
Huybrechts, P.: Sea-level changes at the LGM from ice-dynamic reconstructions of the Greenland and Antarctic ice sheets during the glacial cycles, Quaternary Sci. Rev., 21, 203–231, https://doi.org/10.1016/s0277-3791(01)00082-8, 2002. a
Imhof, M.: Combined climate-ice flow modelling of the Alpine ice field during the Last Glacial Maximum, PhD thesis, ETH Zürich, Zurich, https://doi.org/10.3929/ethz-b-000471073, 2021. a
Imhof, M. A., Cohen, D., Seguinot, J., Aschwanden, A., Funk, M., and Jouvet, G.: Modelling a paleo valley glacier network using a hybrid model: an assessment with a Stokes ice flow model, J. Glaciol., 65, 1000–1010, https://doi.org/10.1017/jog.2019.77, 2019. a
Iverson, N. R.: A theory of glacial quarrying for landscape evolution models, Geology, 40, 679–682, https://doi.org/10.1130/G33079.1, 2012. a, b
Jansen, J., Knudsen, M., Andersen, J., Heyman, J., and Egholm, D.: Erosion rates in Fennoscandia during the past million years, Quaternary Sci. Rev., 207, 37–48, https://doi.org/10.1016/j.quascirev.2019.01.010, 2019. a, b
Jarvis, A., Reuter, H., Nelson, A., and Guevara, E.: Hole-filled SRTM for the globe Version 4, available from the CGIAR-CSI SRTM 90 m Database, available at: http://srtm.csi.cgiar.org (last access: 28 April 2017), 2008. a, b
Jouzel, J., Masson-Delmotte, V., Cattani, O., Dreyfus, G., Falourd, S., Hoffmann, G., Minster, B., Nouet, J., Barnola, J. M., Chappellaz, J., Fischer, H., Gallet, J. C., Johnsen, S., Leuenberger, M., Loulergue, L., Luethi, D., Oerter, H., Parrenin, F., Raisbeck, G., Raynaud, D., Schilt, A., Schwander, J., Selmo, E., Souchez, R., Spahni, R., Stauffer, B., Steffensen, J. P., Stenni, B., Stocker, T. F., Tison, J. L., Werner, M., and Wolff, E. W.: Orbital and Millennial Antarctic Climate Variability over the Past 800,000 Years, Science, 317, 793–796, https://doi.org/10.1126/science.1141038, 2007. a, b
Kelly, M. A., Buoncristiani, J.-F., and Schlüchter, C.: A reconstruction of the last glacial maximum (LGM) ice surface geometry in the western Swiss Alps and contiguous Alpine regions in Italy and France, Eclog. Geol. Helv., 97, 57–75, https://doi.org/10.1007/s00015-004-1109-6, 2004. a
Kleman, J.: Preservation of landforms under ice sheets and ice caps, Geomorphology, 9, 19–32, https://doi.org/10.1016/0169-555x(94)90028-0, 1994. a
Kleman, J., Stroeven, A. P., and Lundqvist, J.: Patterns of Quaternary ice sheet erosion and deposition in Fennoscandia and a theoretical framework for explanation, Geomorphology, 97, 73–90, https://doi.org/10.1016/j.geomorph.2007.02.049, 2008. a
Kleman, J., Jansson, K., De Angelis, H., Stroeven, A., Hättestrand, C., Alm, G., and Glasser, N.: North American ice sheet build-up during the last glacial cycle, 115–21 kyr, Quaternary Sci. Rev., 29, 2036–2051, https://doi.org/10.1016/j.quascirev.2010.04.021, 2010. a
Koppes, M., Hallet, B., Rignot, E., Mouginot, J., Wellner, J. S., and Boldt, K.: Observed latitudinal variations in erosion as a function of glacier dynamics, Nature, 526, 100–103, https://doi.org/10.1038/nature15385, 2015. a, b, c, d, e, f, g, h, i
Koppes, M. N. and Montgomery, D. R.: The relative efficacy of fluvial and glacial erosion over modern to orogenic timescales, Nat. Geosci., 2, 644–647, https://doi.org/10.1038/ngeo616, 2009. a, b
Lai, J. and Anders, A. M.: Climatic controls on mountain glacier basal thermal regimes dictate spatial patterns of glacial erosion, Earth Surf. Dynam. Discuss. [preprint], https://doi.org/10.5194/esurf-2021-26, in review, 2021. a
Lane, S. N., Bakker, M., Gabbud, C., Micheletti, N., and Saugy, J.: Sediment export, transient landscape response and catchment-scale connectivity following rapid climate warming and alpine glacier recession, Geomorphology, 277, 210–227, https://doi.org/10.1016/j.geomorph.2016.02.015, 2017. a
Lisiecki, L. E. and Raymo, M. E.: A Pliocene-Pleistocene stack of 57 globally distributed benthic δ18O records, Paleoceanography, 20, PA1003, https://doi.org/10.1029/2004pa001071, 2005. a
MacGregor, K., Anderson, R., Anderson, S., and Waddington, E.: Numerical simulations of glacial-valley longitudinal profile evolution, Geology, 28, 1031–1034, https://doi.org/10.1130/0091-7613(2000)28<1031:NSOGLP>2.0.CO;2, 2000. a
Margold, M., Jansson, K. N., Kleman, J., and Stroeven, A. P.: Glacial meltwater landforms of central British Columbia, J. Maps, 7, 486–506, https://doi.org/10.4113/jom.2011.1205, 2011. a
Mariotti, A., Blard, P.-H., Charreau, J., Toucanne, S., Jorry, S., Molliex, S., Bourlès, D., Aumaitre, G., and Keddadouche, K.: Nonlinear forcing of climate on mountain denudation during glaciations, Nat. Geosci., 14, 16–22, https://doi.org/10.1038/s41561-020-00672-2, 2021. a, b
Martrat, B., Grimalt, J. O., Shackleton, N. J., de Abreu, L., Hutterli, M. A., and Stocker, T. F.: Four climate cycles of recurring deep and surface water destabilizations on the Iberian margin, Science, 317, 502–507, https://doi.org/10.1126/science.1139994, 2007. a, b
Micheletti, N. and Lane, S. N.: Water yield and sediment export in small, partially glaciated Alpine watersheds in a warming climate, Water Resour. Res., 52, 4924–4943, https://doi.org/10.1002/2016WR018774, 2016. a
Moon, T., Joughin, I., Smith, B., and Howat, I.: 21st-Century Evolution of Greenland Outlet Glacier Velocities, Science, 336, 576–578, https://doi.org/10.1126/science.1219985, 2012. a
Mouginot, J., Rignot, E., and Scheuchl, B.: Sustained increase in ice discharge from the Amundsen Sea Embayment, West Antarctica, from 1973 to 2013, Geophys. Res. Lett., 41, 1576–1584, https://doi.org/10.1002/2013GL059069, 2014. a
Overeem, I., Hudson, B. D., Syvitski, J. P. M., Mikkelsen, A. B., Hasholt, B., van den Broeke, M. R., Noël, B. P. Y., and Morlighem, M.: Substantial export of suspended sediment to the global oceans from glacial erosion in Greenland, Nat. Geosci., 10, 859–863, https://doi.org/10.1038/NGEO3046, 2017. a
Patterson, T. and Kelso, N. V.: Natural Earth, Free vector and raster map data, available at: http://naturalearthdata.com, last access: 22 November 2017. a
Pedersen, V. K., Huismans, R. S., Herman, F., and Egholm, D. L.: Controls of initial topography on temporal and spatial patterns of glacial erosion, Geomorphology, 223, 96–116, https://doi.org/10.1016/j.geomorph.2014.06.028, 2014. a
Penck, A.: Glacial Features in the Surface of the Alps, J. Geol., 13, 1–19, https://doi.org/10.1086/621202, 1905. a
Preusser, F., Reitner, J. M., and Schlüchter, C.: Distribution, geometry, age and origin of overdeepened valleys and basins in the Alps and their foreland, Swiss J. Geosci., 103, 407–426, 2010. a
Preusser, F., Graf, H. R., Keller, O., Krayss, E., and Schlüchter, C.: Quaternary glaciation history of northern Switzerland, Quaternary Sci. J., 60, 282–305, https://doi.org/10.3285/eg.60.2-3.06, 2011. a
Sanders, J. W., Cuffey, K. M., Moore, J. R., MacGregor, K. R., and Kavanaugh, J. L.: Periglacial weathering and headwall erosion in cirque glacier bergschrunds, Geology, 40, 779–782, https://doi.org/10.1130/g33330.1, 2012. a
Seguinot, J.: Glacial quarrying and development of overdeepenings in glacial valleys: modelling experiments and case studies at Erdalen, Western Norway, École normale supérieure, Paris, https://doi.org/10.31237/osf.io/8fzd6, 2008. a
Seguinot, J.: Numerical modelling of the Cordilleran ice sheet, PhD thesis, Stockholm University, Stockholm, available at: http://urn.kb.se/resolve?urn=urn:nbn:se:su:diva-106815 (last access: 2 August 2021), 2014. a
Seguinot, J.: Alpine ice sheet glacial cycle simulations aggregated variables [data set], Zenodo, https://doi.org/10.5281/zenodo.3604174, 2019. a, b
Seguinot, J.: Alpine ice sheet glacial cycle simulations continuous variables [data set], Zenodo, https://doi.org/10.5281/zenodo.3604142, 2020. a, b
Seguinot, J.: Alpine ice sheet erosion potential aggregated variables [data set], Zenodo, https://doi.org/10.5281/zenodo.5084579, 2021a. a, b
Seguinot, J.: Alpine glaciers erosion potential over the last 120 000 years, vimeo, available at: https://vimeo.com/503162771 (last access: 2 August 2021), 2021b. a
Seguinot, J.: Alpine glacial cycle erosion vs ice volume, vimeo, available at: https://vimeo.com/512478926 (last access: 2 August 2021), 2021c. a
Seguinot, J.: Alpine glacial cycle erosion vs bedrock altitude, vimeo, available at: https://vimeo.com/512479008 (last access: 2 August 2021), 2021d. a
Seguinot, J., Rogozhina, I., Stroeven, A. P., Margold, M., and Kleman, J.: Numerical simulations of the Cordilleran ice sheet through the last glacial cycle, The Cryosphere, 10, 639–664, https://doi.org/10.5194/tc-10-639-2016, 2016. a
Seguinot, J., Ivy-Ochs, S., Jouvet, G., Huss, M., Funk, M., and Preusser, F.: Modelling last glacial cycle ice dynamics in the Alps, The Cryosphere, 12, 3265–3285, https://doi.org/10.5194/tc-12-3265-2018, 2018. a, b, c, d, e, f, g, h, i, j, k, l, m
Steinemann, O., Ivy-Ochs, S., Grazioli, S., Luetscher, M., Fischer, U. H., Vockenhuber, C., and Synal, H.-A.: Quantifying glacial erosion on a limestone bed and the relevance for landscape development in the Alps, Earth Surf. Proc. Land., 45, 1401–1417, https://doi.org/10.1002/esp.4812, 2020. a, b, c
Steinemann, O., Ivy-Ochs, S., Hippe, K., Christl, M., Haghipour, N., and Synal, H.-A.: Glacial erosion by the Trift glacier (Switzerland): Deciphering the development of riegels, rock basins and gorges, Geomorphology, 375, 107533, https://doi.org/10.1016/j.geomorph.2020.107533, 2021. a, b, c
Sternai, P., Herman, F., Valla, P. G., and Champagnac, J.-D.: Spatial and temporal variations of glacial erosion in the Rhone valley (Swiss Alps): Insights from numerical modeling, Earth Planet. Sc. Lett., 368, 119–131, 2013. a
the PISM authors: PISM, a Parallel Ice Sheet Model [code], available at: https://github.com/pism/pism/commit/e9d2d1f, last access: 8 March 2017. a, b
Thomson, S., Brandon, M., Tomkin, J., Reiners, P., Vásquez, C., and Wilson, N.: Glaciation as a destructive and constructive control on mountain building, Nature, 467, 313–317, https://doi.org/10.1038/nature09365, 2010. a
Tulaczyk, S., Kamb, W. B., and Engelhardt, H. F.: Basal mechanics of Ice Stream B, west Antarctica: 1. Till mechanics, J. Geophys. Res., 105, 463–481, https://doi.org/10.1029/1999jb900329, 2000. a
Ugelvig, S., Egholm, D., Anderson, R., and Iverson, N.: Glacial erosion driven by variations in meltwater drainage, J. Geophys. Res.-Earth, 123, 2863–2877, https://doi.org/10.1029/2018JF004680, 2018. a, b, c, d
Valla, P. G., Shuster, D. L., and van der Beek, P. A.: Significant increase in relief of the European Alps during mid-Pleistocene glaciations, Nat. Geosci., 4, 688–692, https://doi.org/10.1038/ngeo1242, 2011. a
Werder, M. A., Hewitt, I. J., Schoof, C. G., and Flowers, G. E.: Modeling channelized and distributed subglacial drainage in two dimensions, J. Geophys. Res.-Earth, 118, 2140–2158, https://doi.org/10.1002/jgrf.20146, 2013. a
Willenbring, J. and Von Blanckenburg, F.: Long-term stability of global erosion rates and weathering during late-Cenozoic cooling, Nature, 465, 211–214, https://doi.org/10.1038/nature09044, 2010. a
Wirsig, C., Zasadni, J., Christl, M., Akçar, N., and Ivy-Ochs, S.: Dating the onset of LGM ice surface lowering in the High Alps, Quaternary Sci. Rev., 143, 37–50, https://doi.org/10.1016/j.quascirev.2016.05.001, 2016. a
Zekollari, H. and Huybrechts, P.: On the climate–geometry imbalance, response time and volume–area scaling of an alpine glacier: insights from a 3-D flow model applied to Vadret da Morteratsch, Switzerland, Ann. Glaciol., 56, 51–62, https://doi.org/10.3189/2015aog70a921, 2015. a