the Creative Commons Attribution 4.0 License.
the Creative Commons Attribution 4.0 License.
 | 12 Aug 2021
Dynamics of salt intrusion in the Mekong Delta: results of field observations and integrated coastal–inland modelling
Sepehr Eslami
Piet Hoekstra
Herman W. J. Kernkamp
Nam Nguyen Trung
Dung Do Duc
Hung Nguyen Nghia
Tho Tran Quang
Arthur van Dam
Stephen E. Darby
Daniel R. Parsons
Grigorios Vasilopoulos
Lisanne Braat
Maarten van der Vegt
On the list of challenges facing the world largest deltas, increased saline water intrusion (SWI) in the surface water system and its role in jeopardizing freshwater supply are often ranked very high. Yet, detailed process-based studies of SWI at the whole delta scale are limited, and the trends are regularly associated with global sea level rise. Here, using field measurements and a sophisticated 3D model that integrates the riverine, rural, estuarine, and coastal dynamics within one numerical domain, we study SWI at the scale of the Mekong Delta in extensive detail. While many studies downscale the SWI problem to a topic within an estuary, we show that the physical processes on the continental shelf, such as monsoon-driven ocean surge, directly influence salinity dynamics within the delta. Typical values of 20–40 cm surge over the continental shelf contribute to up to 10 km of further SWI. The delta's estuarine system is also more sensitive than many other systems to variations of river discharge. Furthermore, spring–neap variability plays a key role in SWI in the delta. The estuarine variability from a stratified to a mixed system between neap and spring tides develops 3D processes such as estuarine circulation and tidal straining that become the main upstream salt transport mechanisms. The 3D nature of salinity dynamics, and the role of upstream and downstream processes, suggests that compromising on dimension or extent of the numerical domain can limit the accuracy of predictions of SWI in the delta. The study also showcases the fact that riverbed incision in response to anthropogenic sediment starvation in the last 2 decades has increased stratification and activated or magnified 3D salt transport subprocesses that amplify upstream salt transport. With all the external forces on the delta, namely climate change and an altered hydrological regime by the upstream dams, due to deeper estuarine channels (driven by sand mining and upstream impoundments) compared to its near past, the delta itself has become far more vulnerable to even mild natural events. This exemplifies the fundamental importance of preserving the sediment budget and riverbed levels in protecting the world's deltas against SWI.
- Article
(16689 KB) - Full-text XML
- BibTeX
- EndNote


Over the past decade, saline water intrusion (SWI) in the Vietnamese Mekong Delta (VMD) has been an issue of major concern and was identified as the key to regional land use and its future habitability (CGIAR Research Centers in Southeast Asia, 2016; Kantoush et al., 2017; UNDP, 2016). The 2016 and 2020 droughts resulted in significant disruptions (∼ 450–650 k ha of crop loss) within the delta due to SWI (IFRC, 2020; UNDP 2016; United Nations Resident Coordinator-Vietnam, 2016). Eslami et al. (2019b) showed that there have been increasing trends of SWI and tidal amplification, even with increasing freshwater discharge from upstream (Eslami et al., 2019b; Li et al., 2017; Lu et al., 2014; Räsänen et al., 2017), that are being driven by bed level changes, especially within the tidal rivers (Doan et al., 2018; Eslami et al., 2019b; Vasilopoulos et al., 2021), in response to anthropogenic sediment starvation. This sediment starvation is itself caused by sediment trapping by upstream dams (Fan et al., 2015; Koehnken, 2014; Kondolf et al., 2014, 2018; Kummu et al., 2010; Manh et al., 2015; MRC, 2011; Thi Ha et al., 2018) and intensive downstream sand mining (Brunier et al., 2014; Eslami et al., 2019b). Amid various reports of extreme SWI within the VMD, the present study shows the observed dynamics of SWI in the dry season and applies an integrated state-of-the-art coastal–inland 3D numerical model to explain the observed trends of increased SWI. While in response to groundwater extraction, the delta experiences land subsidence (Erban et al., 2014; Minderhoud et al., 2017) and SWI in the groundwater system (Hung Van Pham et al., 2019), this paper is focused on fresh–saline water dynamics in the surface water system.
Previous studies on estuarine salinity dynamics can be roughly classified into three categories: (1) the tidally averaged steady-state theories of competition between upstream dispersive vs. downstream advective salt flux (Mac Cready and Geyer, 2010; Hansen and Rattray, 1965; Prandle, 2004; Pritchard, 1956; Savenije, 2005); (2) non-stationary decomposition of salt transport processes such as Stokes transport, tidal pumping, tidal straining, gravitational circulation, and residual flow (Banas et al., 2004; Díez-Minguito et al., 2013; Dyer, 1997; Fischer, 1976; Lewis and Lewis, 1983; Simpson et al., 2001; Uncles et al., 1985); and (3) 3D numerical modelling (Burchard and Hetland, 2010; Hetland and Geyer, 2004; Lerczak et al., 2009; Monismith et al., 2002; Simpson et al., 2001; Warner et al., 2005). The first category generally provides a primary framework for studying long-term (seasonal or decadal) trends in estuarine systems. The second is an approach to understand the physical processes that dominate estuarine salinity dynamics. However, as estuarine systems are often quasi-steady or unsteady and in transition, in the absence of detailed high-resolution long-term measurements in these large bodies of water, prognostic evaluation of estuarine dynamics can significantly benefit from numerical modelling (the third category of study). The competition between upstream dispersive and downstream advective salt flux, along with competition between buoyancy production and tidal mixing, leads to variations of salinity and its transport mechanisms on multiple temporal and spatial scales. To qualitatively describe the effect of freshwater inflow and tides in an estuarine system, a tidally averaged steady-state approach can be adopted. When quantitative in-depth knowledge is required, the spatio-temporal estuarine variabilities of spring–neap cycles, stratification, transversal variabilities, and their interactions become critical processes. To address these processes, 1D numerical models can perform adequately when an estuarine system is fully mixed; however, very often, stratification changes with spring–neap tidal cycles (Jay, 2010; Jay and Dungan Smith, 1990c) and, together with morphological changes, can lead to estuarine salinity regime shifts (Geyer and MacCready, 2013; Simpson et al., 1990). These variabilities develop complexities that demand more detailed measurements and more sophisticated modelling approaches.
Given the gravity of SWI as a threat to the livelihood of the VMD and other major deltas around the world that also face SWI such as Ganges–Brahmaputra, Indus, Mississippi, Chao Phraya, Orinoco, Ayeyarwady, Red, and Pearl River deltas (Bucx et al., 2014; Echezuría et al., 2002; Gong and Shen, 2011a; Hoeppner et al., 2008; Nguyen et al., 2017; Rabbani et al., 2013; Takeda et al., 2016; Zia et al., 2017), the available literature addressing SWI in the VMD is limited. Some field measurements (Gugliotta et al., 2017; Nguyen and Savenije, 2006; Nowacki et al., 2015) provide snapshots of specific periods or regions form a qualitative impression of salinity within the VMD. Modelling efforts are bound to analytical models (e.g. Nguyen and Savenije, 2006) that are mainly focused on the steady-state salinity regime, and existing numerical modelling efforts are either in 1D (Smajgl et al., 2015; Tran Quoc Dat et al., 2011; Vu et al., 2018) with limitations in capturing various physical processes or depth-averaged and variable in width (2DH) with limited domains (Tran Anh et al., 2018); both overlook the effect of stratification. Furthermore, all these numerical studies are focused on projections in response to climate change, while recent work has shown that channel changes are a much more significant control on barotropic and baroclinic dynamics (Eslami et al., 2019b; Vasilopoulos et al., 2021). Moreover, despite all the anecdotal reports of SWI in the VMD, it is only recently that a systematic analysis of available salinity data has shown how salinity is increasing within the VMD (Eslami et al., 2019b). The shear dimensions of the Mekong Mega-Delta (∼ 200 km × 200 km, with more than 8000 primary and secondary irrigation canals), the lack of detailed data, the computation capacity, and limitations in past numerical models have all conspired to make it difficult to study SWI on that scale and with the requisite temporal and spatial detail. However, recent developments in numerical modelling techniques now make it feasible to integrate upstream and coastal processes within one numerical domain with different dimensions (Eslami et al., 2019a; Kernkamp et al., 2011; Martyr-Koller et al., 2017).
The aim of this study is to (a) show the effect of subtidal variability (e.g. surge, discharge, and spring–neap tide) on SWI, (b) study temporal 3D estuarine variability and the 3D nature of SWI in the VMD, and (c) demonstrate how bed level changes in the VMD have changed the salt transport mechanisms, resulting in excessive SWI within the VMD. To that end, we measured salinity structure simultaneously along two distributary channels of the Hau River during a spring–neap tidal cycle. We previously (Eslami et al., 2019a) showed the importance of the VMD irrigation system for barotropic tidal propagation. Here, we use a state-of-the-art high-resolution 3D numerical model (Kernkamp et al., 2011) of the Mekong estuarine system, including its system of primary and secondary channels and part of the continental shelf, incorporating a new 2018 bathymetry (Vasilopoulos et al., 2021) covering the principal distributary channel network. In a series of sensitivity analyses and perturbation simulations, we demonstrate the role of spring–neap variability and the subtidal surge effect on SWI, and we show the temporal variation of advective and dispersive salt fluxes. Furthermore, we show how SWI would have varied during the 2016 drought if an older bathymetry (2008) was still in place, thereby clearly demonstrating how recent (2008–2018) changes in bathymetry have dramatically altered salt transport mechanisms that exacerbate SWI in the Mekong Delta.
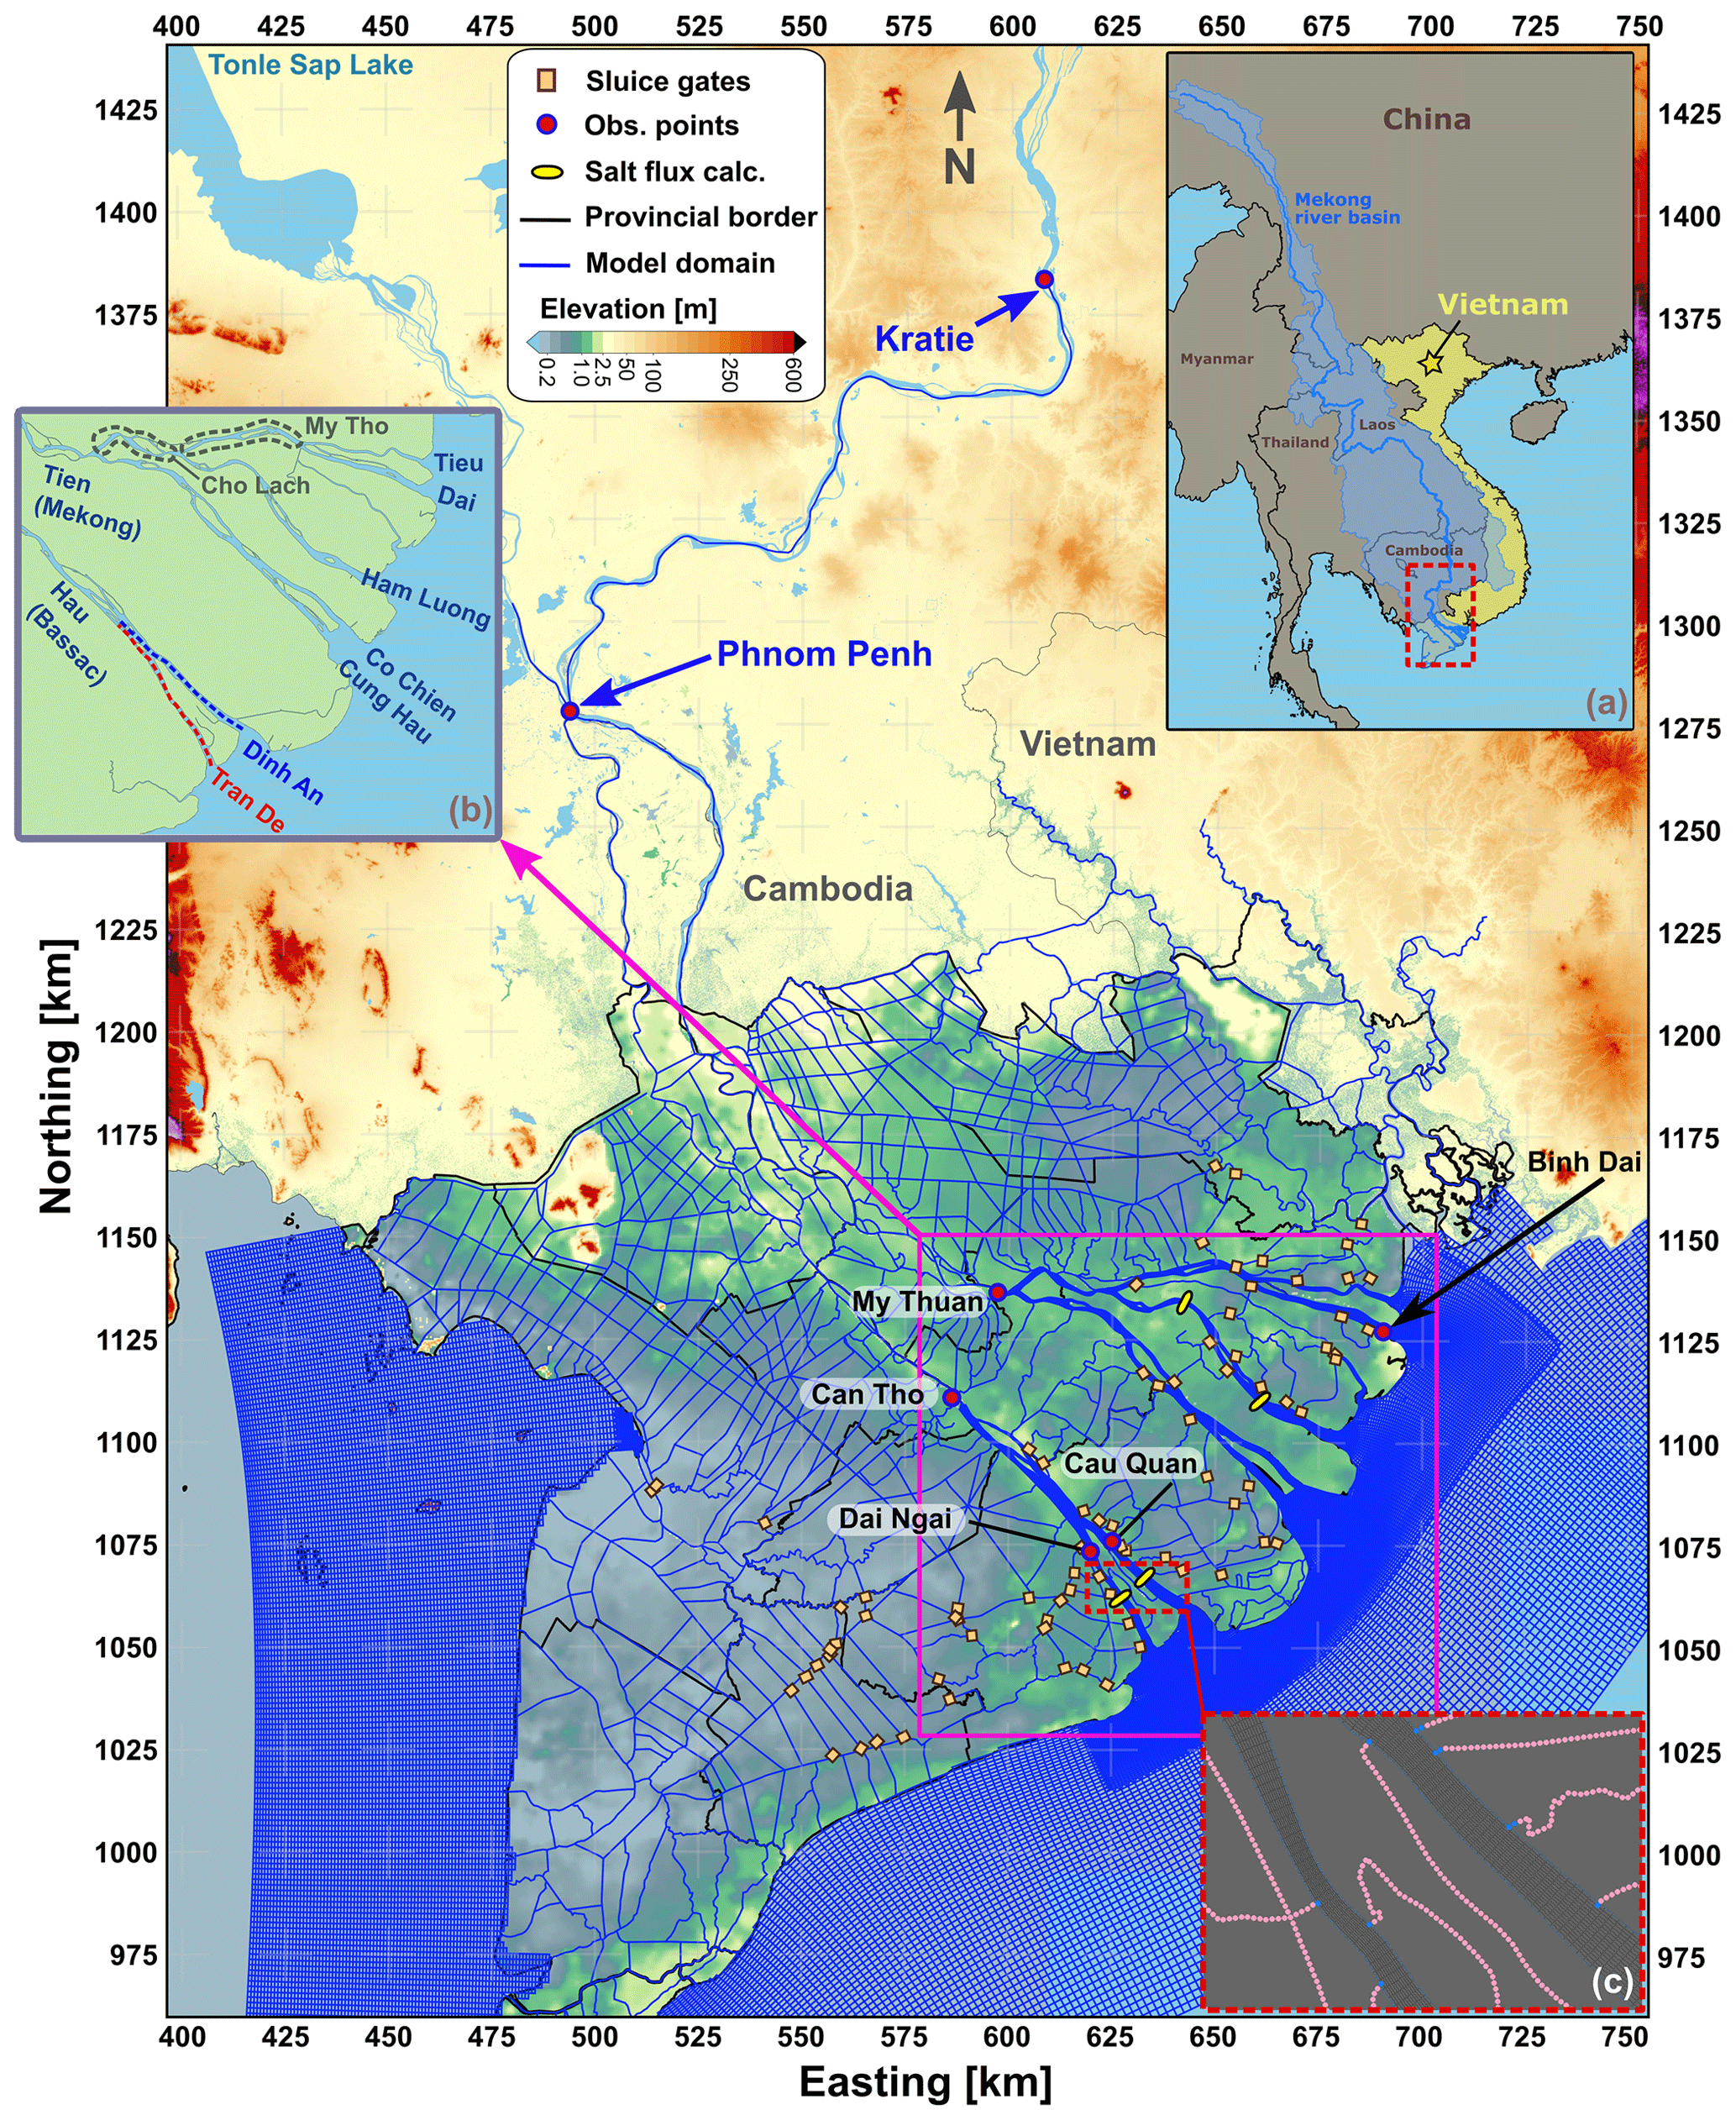
Figure 1Digital elevation map of the Mekong Delta (Minderhoud et al., 2019), the numerical domain developed for this study, and the observation points and the studied cross sections. (a) An overview of the Mekong River Basin and the Mekong Delta. (b) The salinity measurement trajectories along the Dinh An and Tran De channels (dotted lines) and the names of estuarine distributary channels, with the grey dashed lines highlighting the regional names of some river stretches. (c) Top view of part of the 2DV–3D grid (coord. system: WGS-84 UTM 48N).
2.1 Area of study
The Mekong River (MR) springs from the Tibetan Plateau in China and crosses Laos, Thailand, and Cambodia until it forms the Vietnamese Mekong Delta (see Fig. 1). The MR, annually carrying 340–450 109 m3 of water (total yearly interquartile range based on MRC data), prior to entering the VMD, splits into two branches and forms the two systems of the Tien (Mekong) and Hau (Bassac) tidal rivers. Further downstream, the two rivers split into, in total, seven estuarine distributary channels (Fig. 1b) with various channel width and depths (see Eslami et al., 2019a). Despite different properties, all these estuarine channels share similarities in their tidal dynamics; i.e. they are all mesotidal hyposynchronous (Dyer, 1997; Eslami et al., 2019a; Nichols and Biggs, 1985), with strong spring–neap variations. Spring tides are dominated by semi-diurnal tidal species (tidal range ∼ 3 m) and neap tides are determined by diurnal tidal components (tidal range ∼ 2 m), defining a sharp spring–neap variability. Morphologically, the lower ∼ 80 km of the channels is tide-dominated and fluvially influenced, with widening and shallowing channels seaward and significant mud content in the seabed (Gugliotta et al., 2017). Between that lower ∼ 80 km and Phnom Penh, Cambodia, the channels are fluvially dominated and tidally influenced, with meandering channels that deepen seaward and little mud content (Gugliotta et al., 2017). The VMD is characterized by strong monsoon-driven seasonal climate variations (Mekong River Commission, 2010), with the wet (July to October, SW monsoon) and dry (December–May, NE monsoon) seasons contrasting dramatically. The wet season floods the floodplains of Cambodia and Vietnam, tidal propagation is damped by the large freshwater discharge from upstream, and ocean saline water cannot penetrate more than a few kilometres into the estuarine channels (Eslami et al., 2019a; Gugliotta et al., 2017). However, during the dry season, the MR only carries 7 %–9 % of the total yearly discharge, tidal range increases from ∼ 1 to 2 m in Can Tho (see Fig. 1) and My Thuan (see Eslami et al., 2019a), salinity intrudes up to ∼ 50–60 km (assuming a 2 PSU threshold) into the surface water system of the delta (Gugliotta et al., 2017; Nguyen and Savenije, 2006; Nowacki et al., 2015), and the north-eastern monsoon winds continuously create modest surge events (∼ 10–30 cm) along the VMD coast (Eslami et al., 2019a). In this study, as we focus on SWI, we limit the timescale to the dry season and specifically focus on the 2016 drought, driven by the 2015–2016 El Niño, and the subsequent excessive SWI within the VMD.
2.2 Field campaign
Although drought is not new in the Mekong Delta, in 2016, there were numerous anecdotal reports of salinity reaching Can Tho City (e.g. UNDP, 2016). To measure the dynamics during this extreme event, we aimed to measure maximum SWI during a high water slack (HWS) along the Hau River distributary network (Dinh An and Tran De) using a moving-boat measurement technique (Nguyen and Savenije, 2006; Savenije, 1986). The method captures estuarine salinity structure along the channel thalweg at HWS. On two different dates, 1 and 9 April 2016 during neap and spring tides, respectively, we measured salinity structures and intrusion lengths simultaneously along the two channels (see Fig. 1b for the salinity routes). For that, starting from the estuary mouth at the HWS, we measured conductivity and temperature profiles over the depth using conductivity sensors (SensorNet TetraCon 700 IQ) at 1 m vertical resolution. To follow HWS upstream, we then sailed upstream with a speed boat at the tidal propagation speed (∼ 30–35 km h−1) and repeated the measurement over the full depth every 3 km until we reached nearly zero conductivity (∼ 0.5 mS s−1). Salinity was then transformed to PSU from conductivity [mS s−1] and temperature [∘C] measurements following the UNESCO (1981) definition.
2.3 Model description
Delft3D-Flexible Mesh (Delft3D-FM) (Kernkamp et al., 2011) is a state-of-the-art, open-source numerical model that solves the incompressible (hydrostatic) Reynolds-averaged Navier–Stokes equations (within the 3D domain) and shallow water equations (within the 1D–2D domain) in an orthogonally unstructured staggered-grid discretization (Kramer and Stelling, 2008). The model applies a finite-volume conservation formulation of mass, momentum, turbulence, salinity, temperature, and conservative matter. The barotropic pressure coupling is implicit, but baroclinic pressure is treated explicitly by spatially applying a finite-volume staggered-grid discretization. The model implicitly solves conservation of mass, momentum, transport of matter, and the Eckart (Eckart, 1958) or UNESCO (UNESCO, 1981) equation of state in three dimensions to calculate water level, horizontal and vertical velocity, and salinity concentration. In the vertical, a so-called z-layer (fixed) scheme is applied, along which a hydrostatic pressure assumption and a Manning bottom friction treatment are adopted. Furthermore, in the vertical a k−ϵ turbulence closure is applied (Rodi, 1993). Vertical advection of momentum and the turbulence properties are solved with a first-order upwind scheme, but vertical transport of matter is treated with a higher-order discretization scheme. The reader is referred to Kernkamp et al. (2011) and Martyr-Koller et al. (2017) for more details on Delft3D-FM development and background.
2.4 Model set-up and modelling approach
The previously developed coupled 1D–2DH barotropic model of the VMD (Eslami et al., 2019a) is further extended and modified in this study to assess detailed SWI processes. The 2DH parts of the network are expanded to 3D, and the 1D channels are expanded in depth to 2DV (width-integrated but depth-varying), following vertical layering identical to the rest of the model. Furthermore, part of the western continental shelf (70 km offshore) is added to the model domain and downstream of Can Tho and My Thuan (see Fig. 1), and the model domain is updated to 3D (previously in 1D). The horizontal model resolution is increased to approximately 200 m along the channels and 50–200 m across the channels (depending on channel width). The vertical resolution of the z layers is set to 0.5 m, i.e. 20 vertical layers in 10 m of depth. Vertical resolution is gradually increased below 15 m of depth to save computation time in the deeper continental shelf. Following Eslami et al. (2019a), the re-calibrated spatially varying Manning bed friction coefficient is lower along the downstream estuarine distributary channels (0.02 ) and increases to 0.04 along the upstream rivers.
Table 1Summary of input gauge, bathymetry, wind, and tidal data.
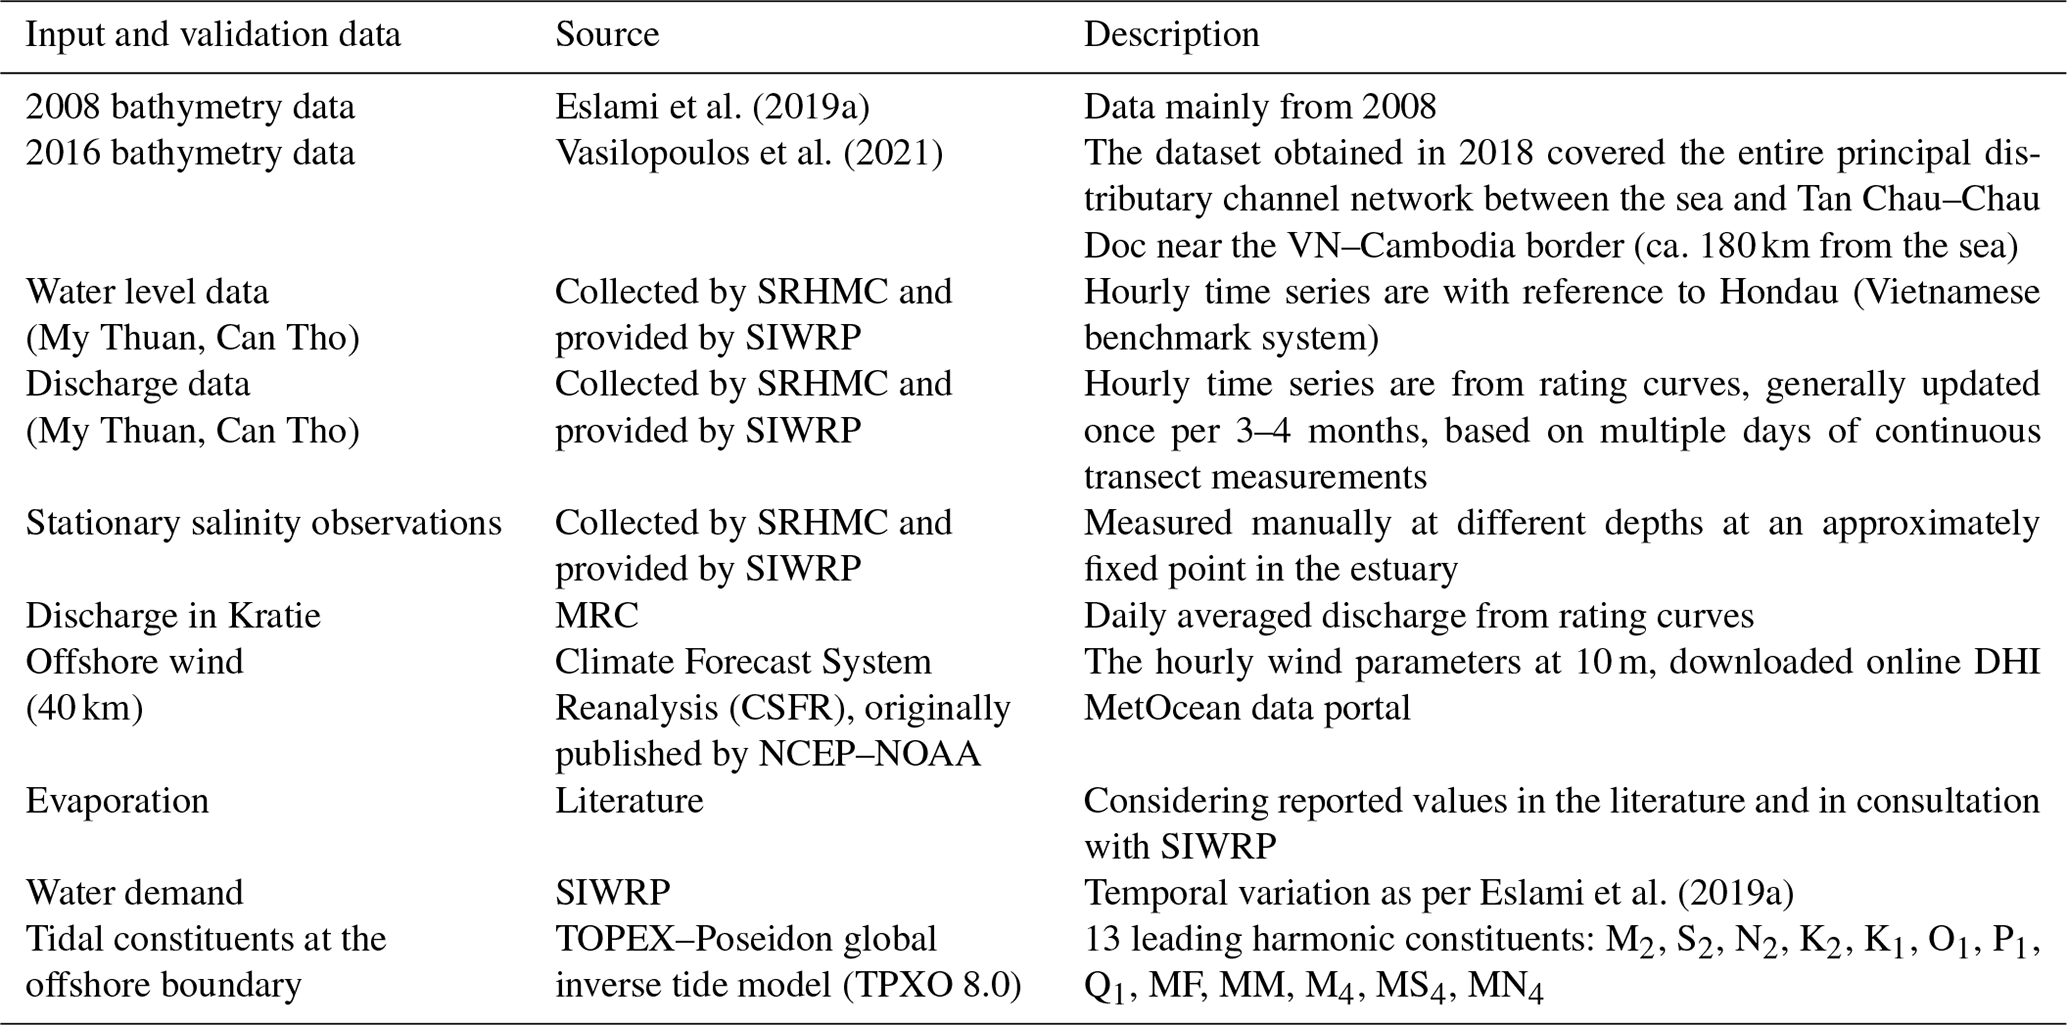
From upstream, the model is forced with the daily averaged discharge at Kratie, Cambodia (nearly 500 km upstream), and from downstream by 13 leading astronomic tidal components located 70 km offshore. Measured subtidal water level at Binh Dai (see Fig. 4) is superimposed to the offshore boundary with its associated time lag (similar to Eslami et al., 2019a) to replicate subtidal water level variations, representing the effect of ocean surge at the boundary. The negligible (very low in the simulated year 2016) daily averaged discharge from the Tonlé Sap Lake is calculated as the difference between the discharge entering the VMD (as observed for the Tien and Hau rivers at Tan Chau and Chau Doc) and the Mekong River discharge as observed at Kratie (considering the time lag between Kratie and the VMD). Neumann conditions are assigned to the cross-coastline boundaries, and offshore wind is considered uniformly distributed over the model domain. Evaporation gradually increased from 4 to 7 mm d−1 from January to April (Kumiko et al., 2008; Kummu et al., 2014), transpiration is neglected, and precipitation is assumed to be zero during the dry season. Spatially varying water demand is incorporated in a manner identical to Eslami et al. (2019a), and a total of 52 sluice gates (Fig. 1) contained the irrigation system from SWI and remained closed throughout the simulations. Table 1 provides a summary of the input data and their sources.
As SWI is a dry season phenomenon, the simulations ran from January to the end of April, and the first month of simulation is considered spin-up time. In order to examine various physical processes, following a method of factor separation (Buschman et al., 2010; Eslami et al., 2019a; Sassi et al., 2011), various model forcings are specifically turned on and off in order to evaluate their effect on and importance for SWI. Riverbed levels have significantly changed in the past 20 years (Eslami et al., 2019b; Vasilopoulos et al., 2021). In order to demonstrate the role of riverbed level changes in SWI, the calibrated model with the 2018 bathymetry is also run with an older 2008 bathymetry. The 2008 bathymetry is partly obtained from the Mekong River Commission (MRC) and partly obtained from the Southern Institute for Water Resources Planning (SIWRP), while for 2016 simulations the 2018 bathymetry of Vasilopoulos et al. (2021) is used.
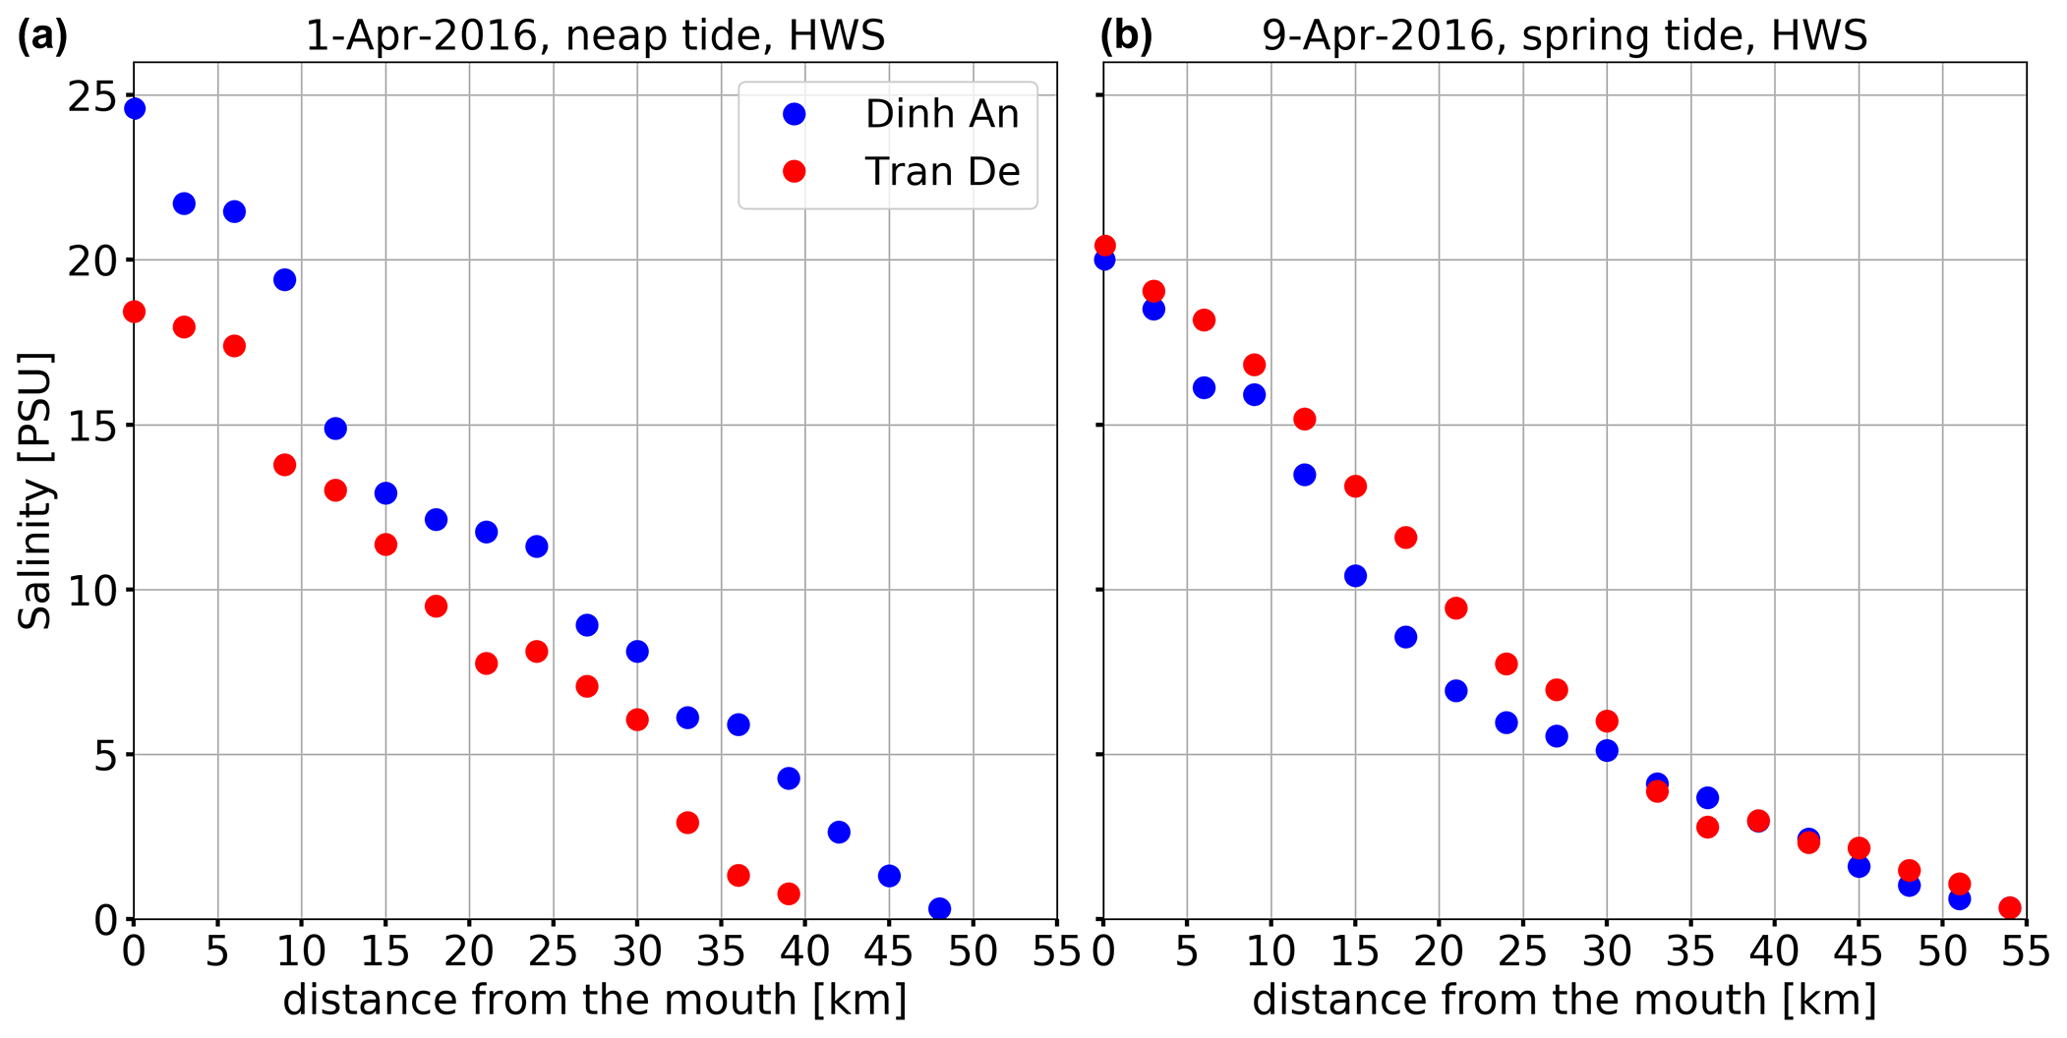
Figure 2Observed salt intrusion at high water slack (HWS) during two consecutive neap (a) and spring (b) tides along the two lower Song Hau distributary channels (Dinh An and Tran De) during the 2016 VMD drought event.
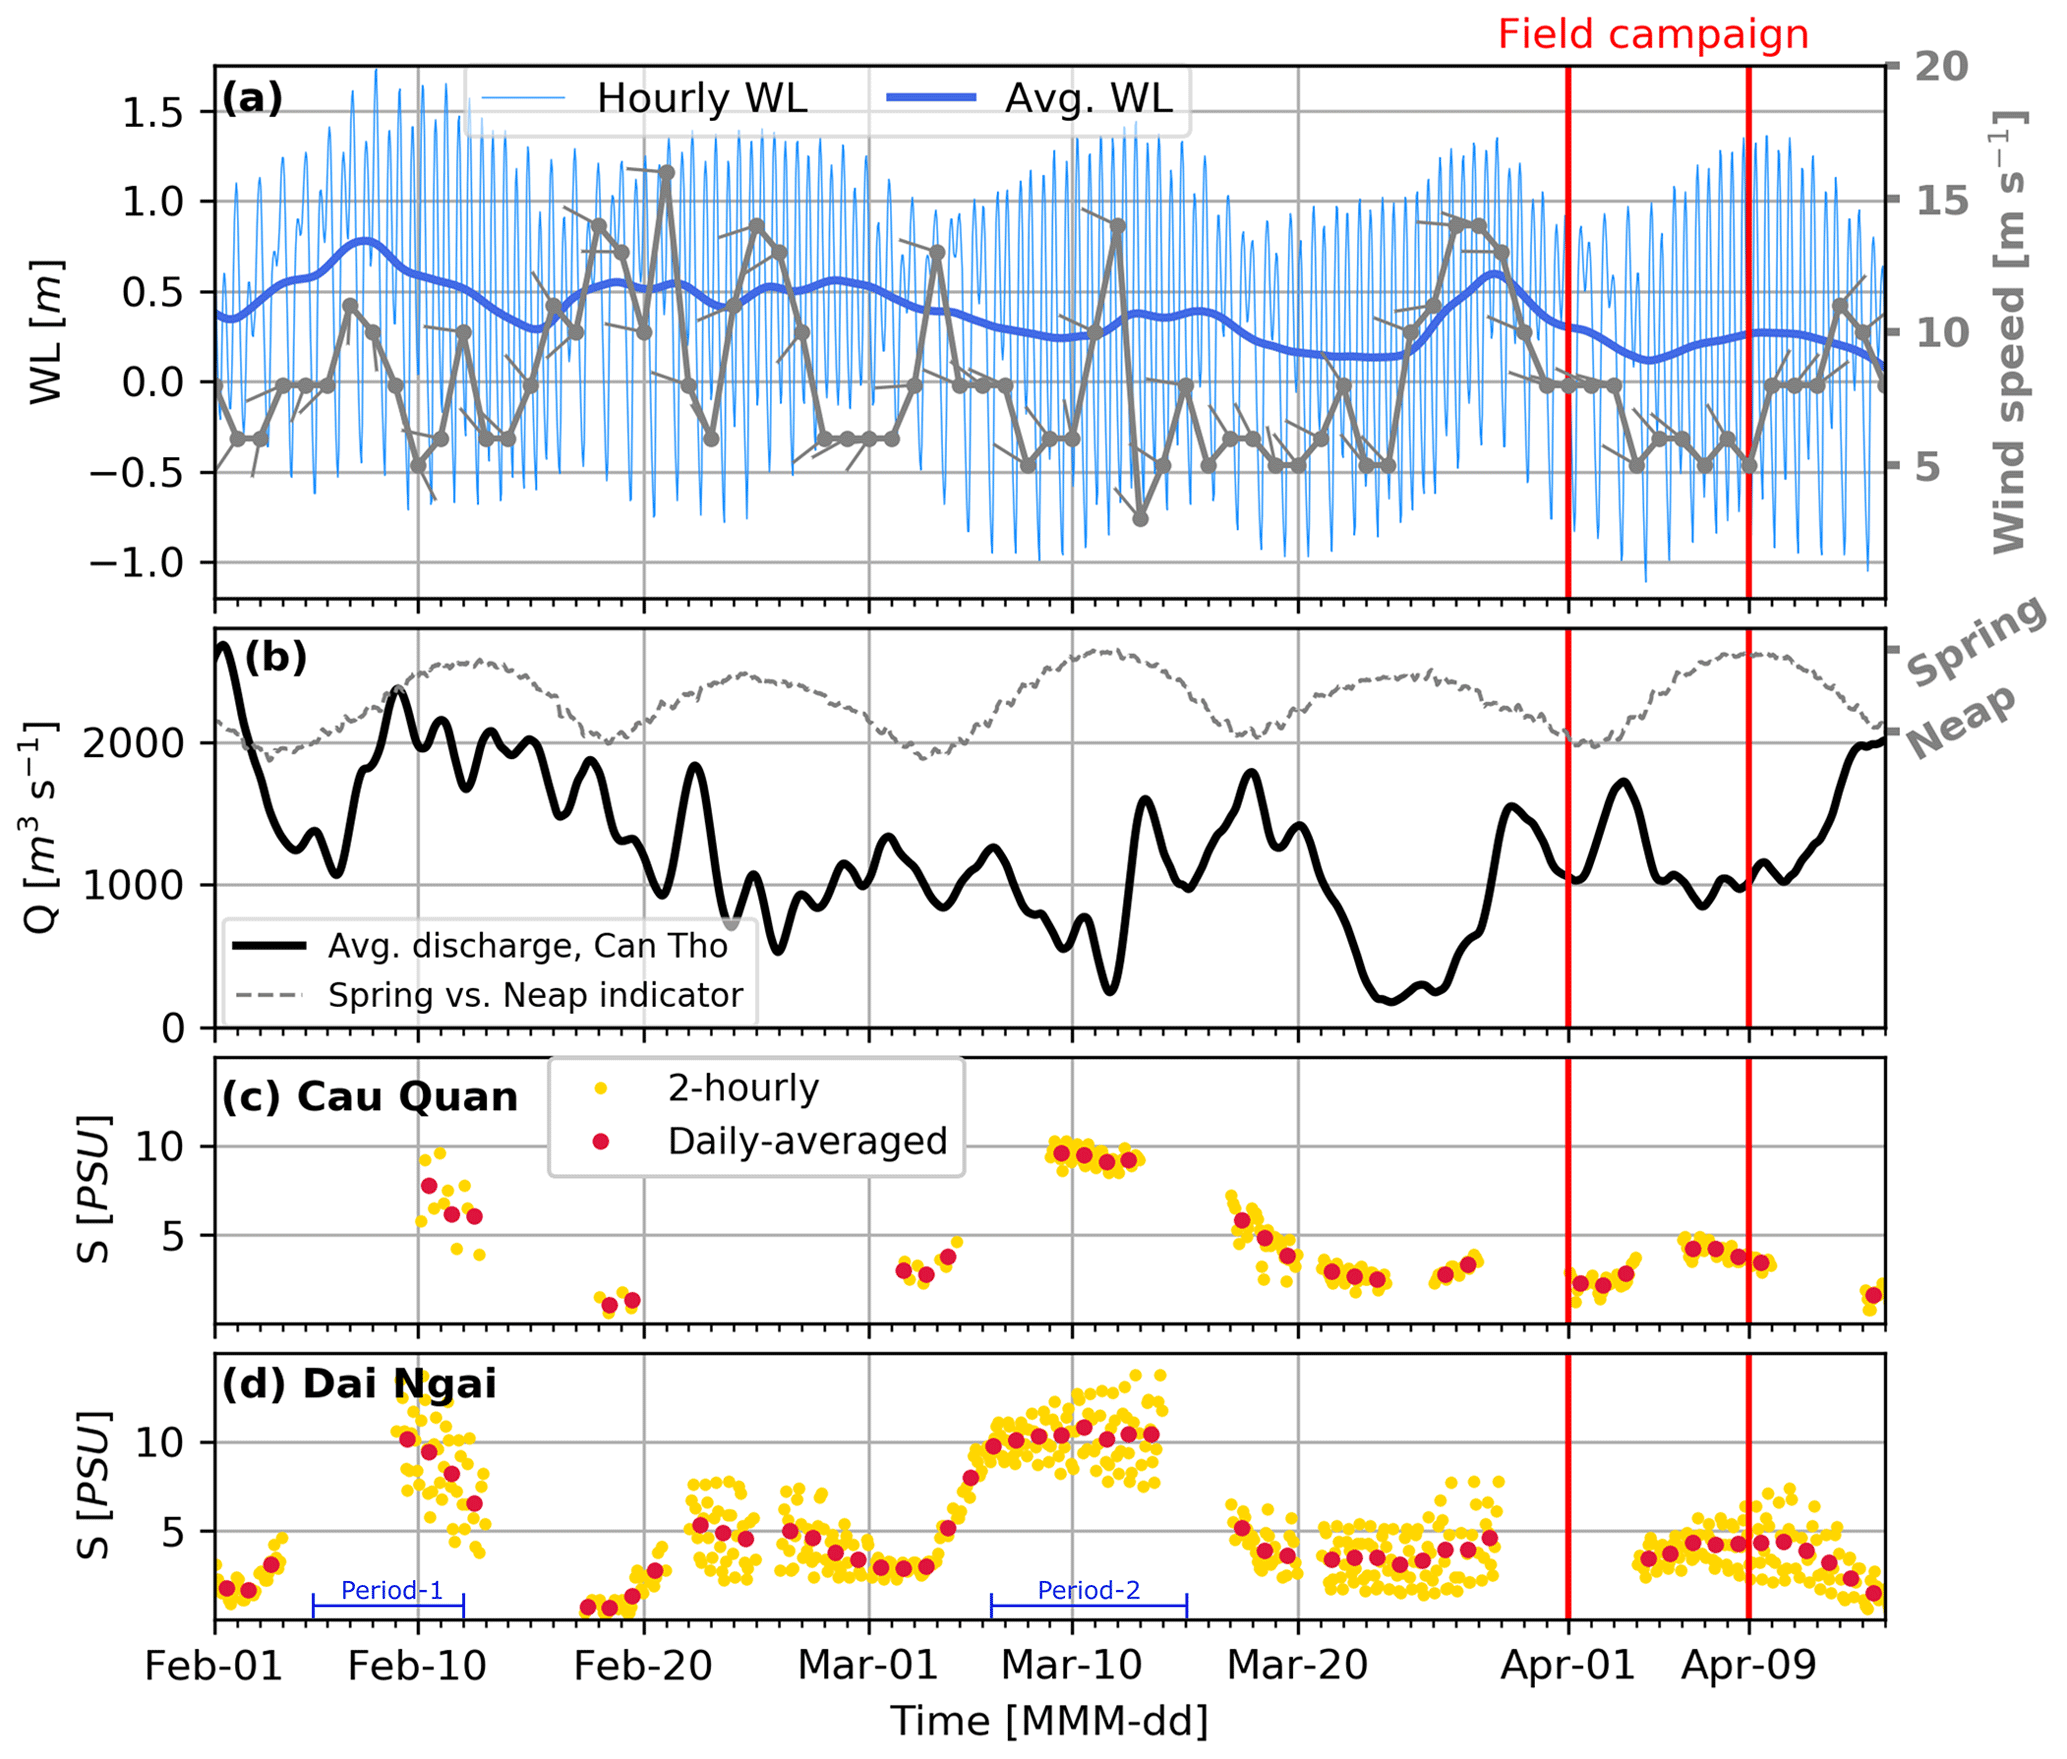
Figure 3Water level at Can Tho (80 km from the estuary mouth) and offshore ocean wind speed and direction (nautical convention, from the vectors ) (a), observed subtidal discharge at Can Tho and the daily semi-diurnal tidal amplitude as an indication of spring–neap cycle (b), and stationary salinity measurements in the lower distributary channels of the Hau River, Dinh An channel (c), and Tran De channel (d) prior to and during the field campaign.
3.1 Field campaign
Amid various reports of historical SWI up to 90 km (near Can Tho City) in 2016 (e.g. UNDP, 2016), in our field campaign we did not measure values that substantially exceeded previously published observations. Along the Dinh An channel, we measured a maximum SWI of ∼ 50 km (with 2 PSU as the threshold) during spring tide (see Fig. 2), similar to observations of Nguyen and Savenije (2006). This triggered various questions on the timing and the extent of SWI as the drought reports were still on the news. Despite not measuring the historical SWI length, the observed trends were intriguing. Within the Dinh An channel, SWI length was slightly higher during the spring tide, but salinity near the mouth was significantly higher during the neap tide, while this did not change significantly at the Tran De estuary mouth. Stratification was reduced remarkably from neap tide to spring tide in the Dinh An channel but did not change significantly in the Tran De channel. Figure 3 shows various environmental parameters during the 2016 dry season. To correlate the observations with various environmental indicators, observed daily averaged wind speed and direction (predominantly NE monsoon wind) along with the tidal and Godin-filtered (Godin, 1972) subtidal water level at Can Tho (Fig. 3a) show the subtidal response of water level to wind (also see Eslami et al., 2019a). Furthermore, subtidal discharge at Can Tho (Fig. 3b), which is controlled by upstream freshwater supply and downstream subtidal variations, shows a response (lag) to subtidal water level variations; i.e. despite overall trends, there seems to be a trough and peak response to ocean surge peaks (also see Eslami et al., 2019a).
Stationary 2-hourly measurements of depth-averaged salinity (see Sect. 3.2 for further detail) at two stations, Dai Ngai and Cau Quan, showed that salinity was highest around the second week of February (period 1) and March (period 2) and declined significantly past mid-March before the field campaign took place. These two periods do follow episodes of lower subtidal discharge, but they do not necessarily coincide with the lowest freshwater discharge periods (e.g. 22 March to 1 April). In terms of tidal stage, both periods coincide with the transition period of neap to spring tide. Both periods of high salinity also coincide with ocean surge events, although period 1 correlates with a significantly stronger surge. Overall, this implies that a combination of physical forces determines salinity level in the delta and cannot be reduced to simply upstream discharge or downstream tidal forcing. At the sea boundary it is not only the tidal variation, but also the residual current intensity and river discharge in the preceding period that determine the overall salinity at the ocean boundary. These complexities demand an integrated three-dimensional modelling with as many environmental forcings as possible to explain the barotropic, baroclinic, and intra-tidal and subtidal processes that drive SWI within the system.
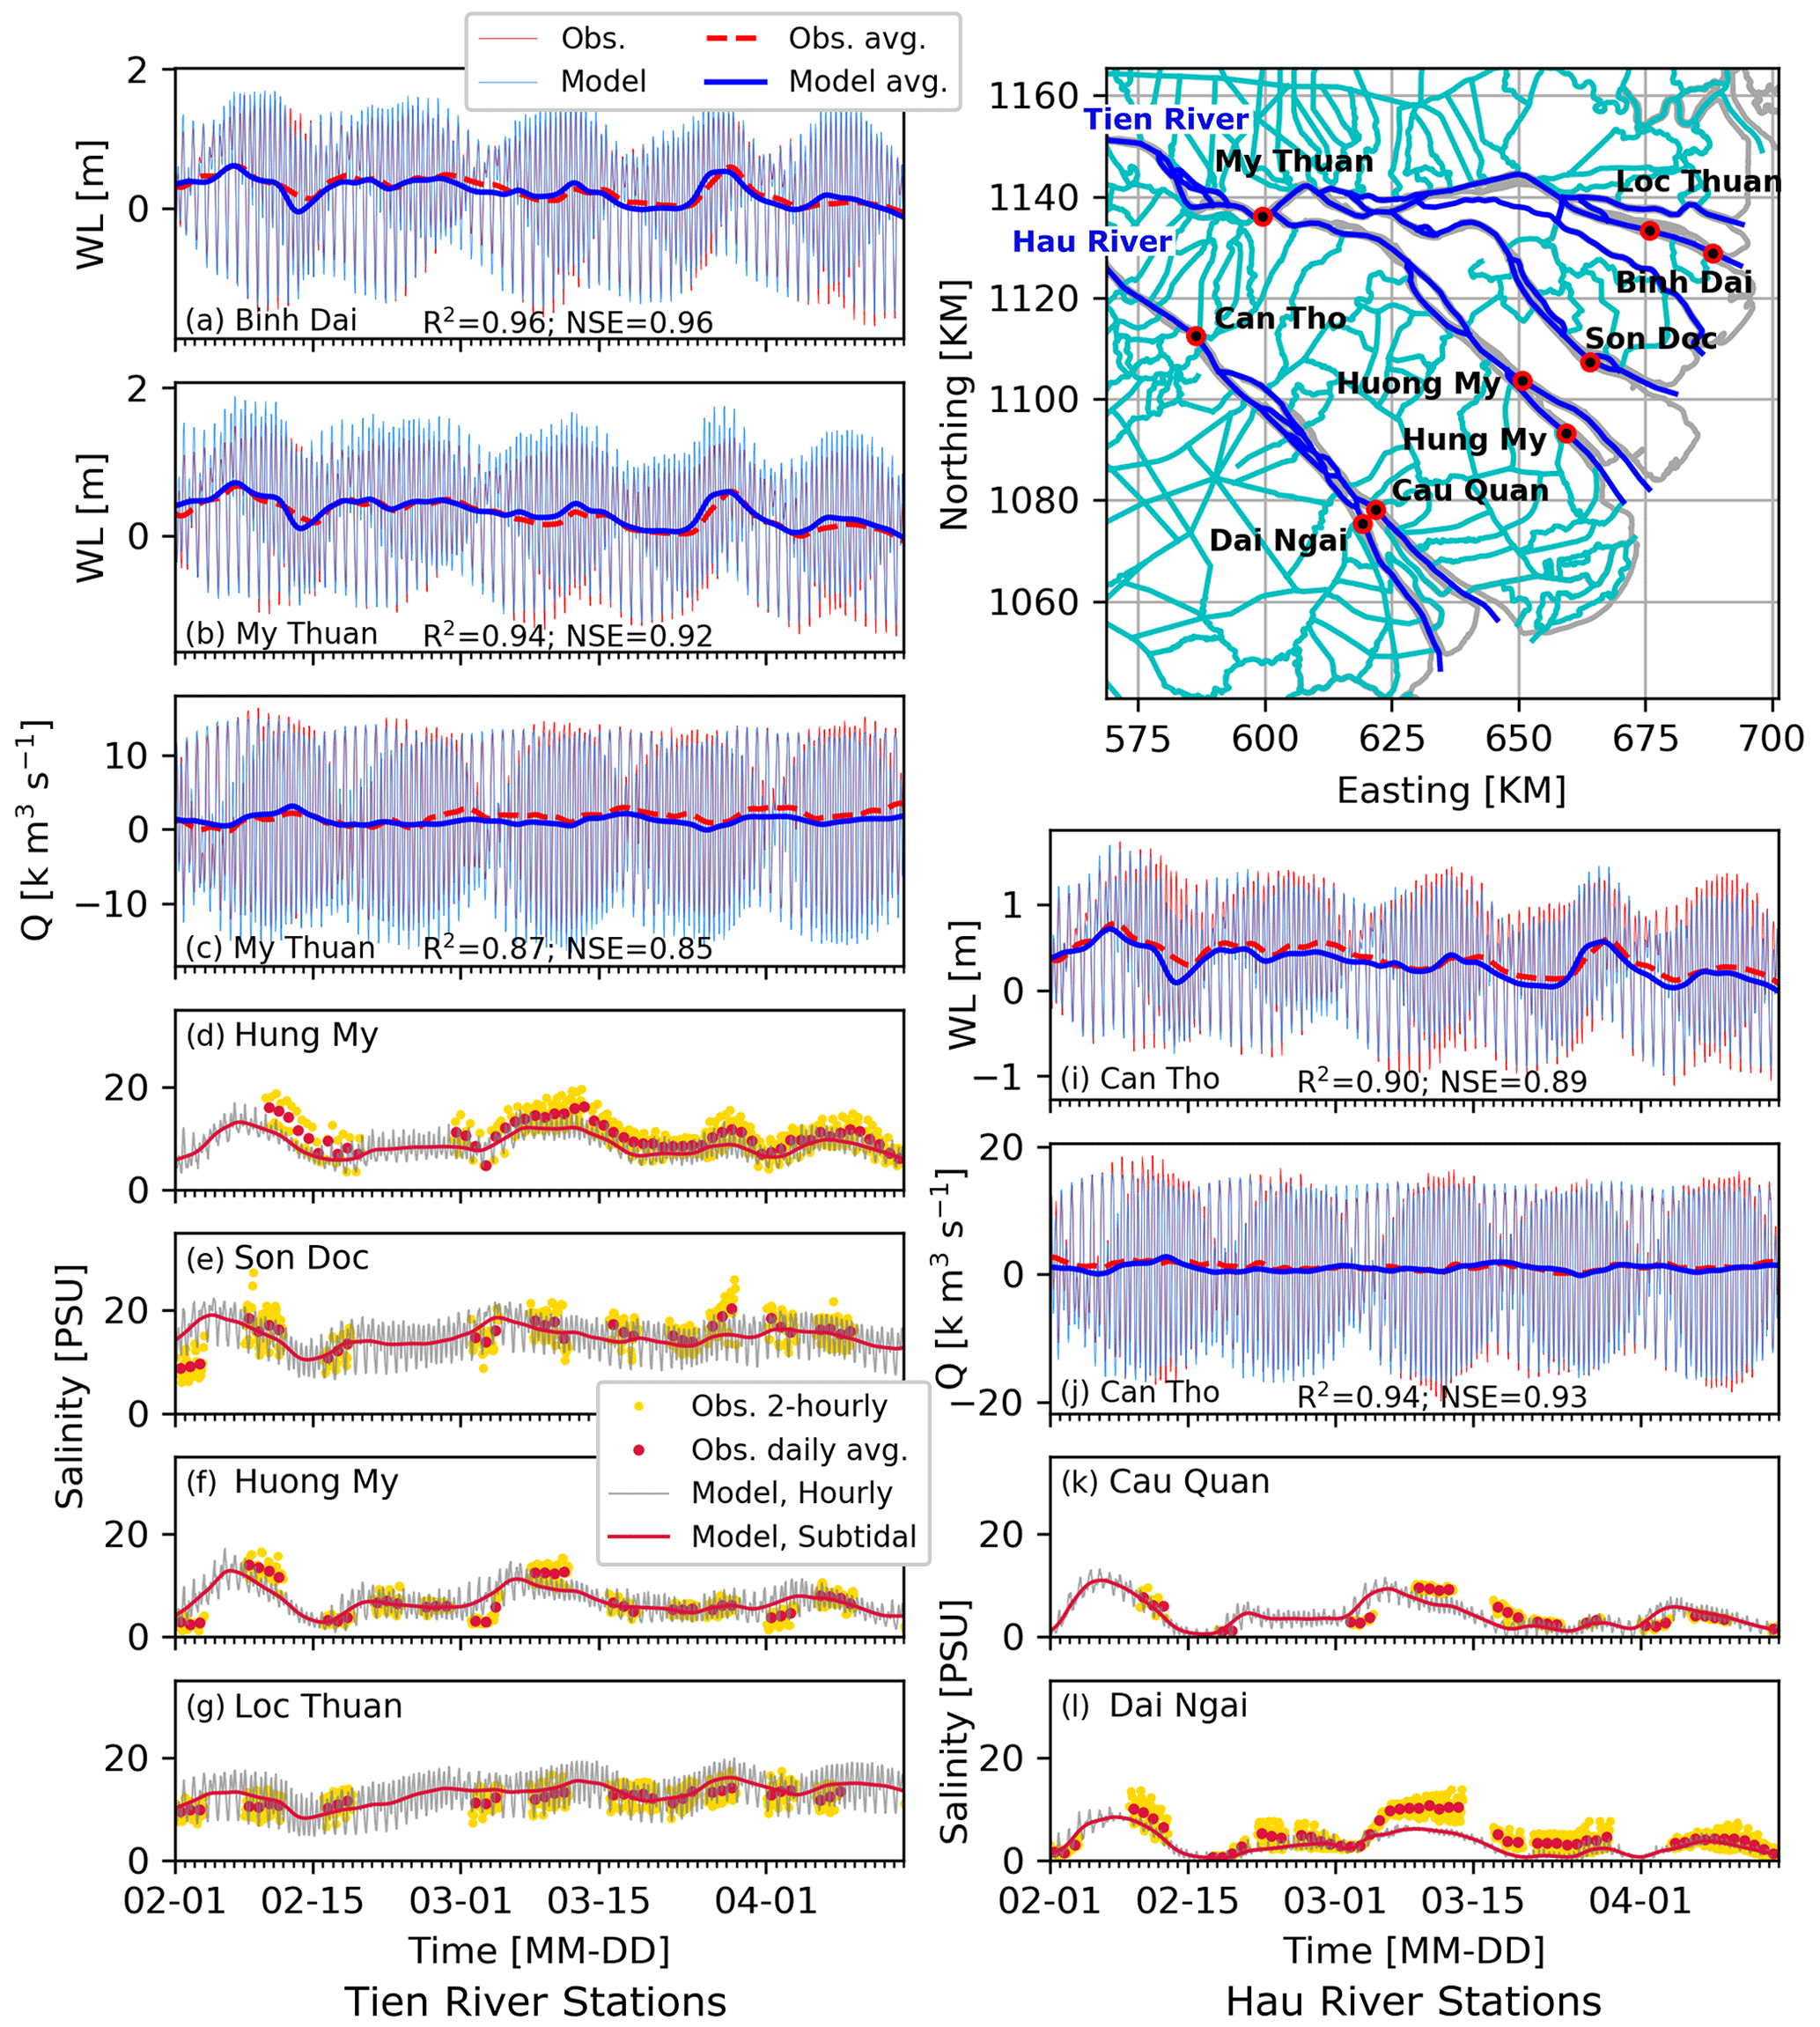
Figure 4Model results vs. observed stationary water level, discharge, and salinity measurements at multiple stations across the Mekong Delta.
3.2 Model validation
For the year 2016, a series of model performance statistics (Pearson correlation coefficient, R2, and Nash–Sutcliffe coefficient of efficiency, NSE; Nash and Sutcliffe, 1970) are calculated to examine the Delft3D-FM model performance (see Fig. 4a–c, i, and j). Comparison of stationary salinity observations with the model is slightly more complicated. The observations are at 2-hourly intervals with irregular gaps in between. The actual measurements are carried out manually at a point off the riverbank. Manual measurements over depth are then averaged by , where S is the observed depth-averaged salinity as presented (personal communication with SRHMC and SIWRP). Furthermore, it will be shown later that salinity within the VMD is highly sensitive to small variations of freshwater supply and other subtidal forcings. Therefore, although the assumed water demand distribution is as close as possible to reality (see also Eslami et al., 2019a), in practice, it is subject to spatial and temporal variations, especially in specific drought years, that are not input to the model. This makes the model–observation comparison a delicate matter.

Figure 5Measured (a and c with green frames) vs. modelled (b and d ) HWS salinity structure along two distributary channels of the Hau River during neap tide (a and b, 15 April) vs. spring tide (c and d, 9 April) for the year 2016.
By calculating a depth-averaged salinity in the same fashion, based on the model output, the qualitative comparison is made for intra-tidal and subtidal variations at multiple stations (see Fig. 4d–g, k, and l). Subtidal salinity is modelled reasonably well at all stations, but intra-tidal salinity variability at Dai Ngai (Fig. 4l) is underestimated. However, given the low salinity at Dai Ngai and its location near a major primary water distribution canal, with multiple islands in the vicinity and in proximity to an estuarine junction, comparisons at this location are difficult. Furthermore, Fig. 5 shows a comparison of the modelled and observed (field campaign) HWS estuarine salinity structures along the two distributary channels of the Hau River during neap and spring tide. The Dinh An channel clearly transitions from a stratified estuary during neap tide to a partially mixed system during the spring tide, while the Tran De channel remains a moderately stratified to partially mixed system over the entire period. In a qualitative comparison, these patterns were also reproduced by the model, although the model tends to have slightly smaller top–bottom differences in salinity and smaller SWI than observed. The model–data comparison shows that the model represents the spatial and temporal patterns in SWI reasonably well and reproduces the estuarine spring–neap variability.
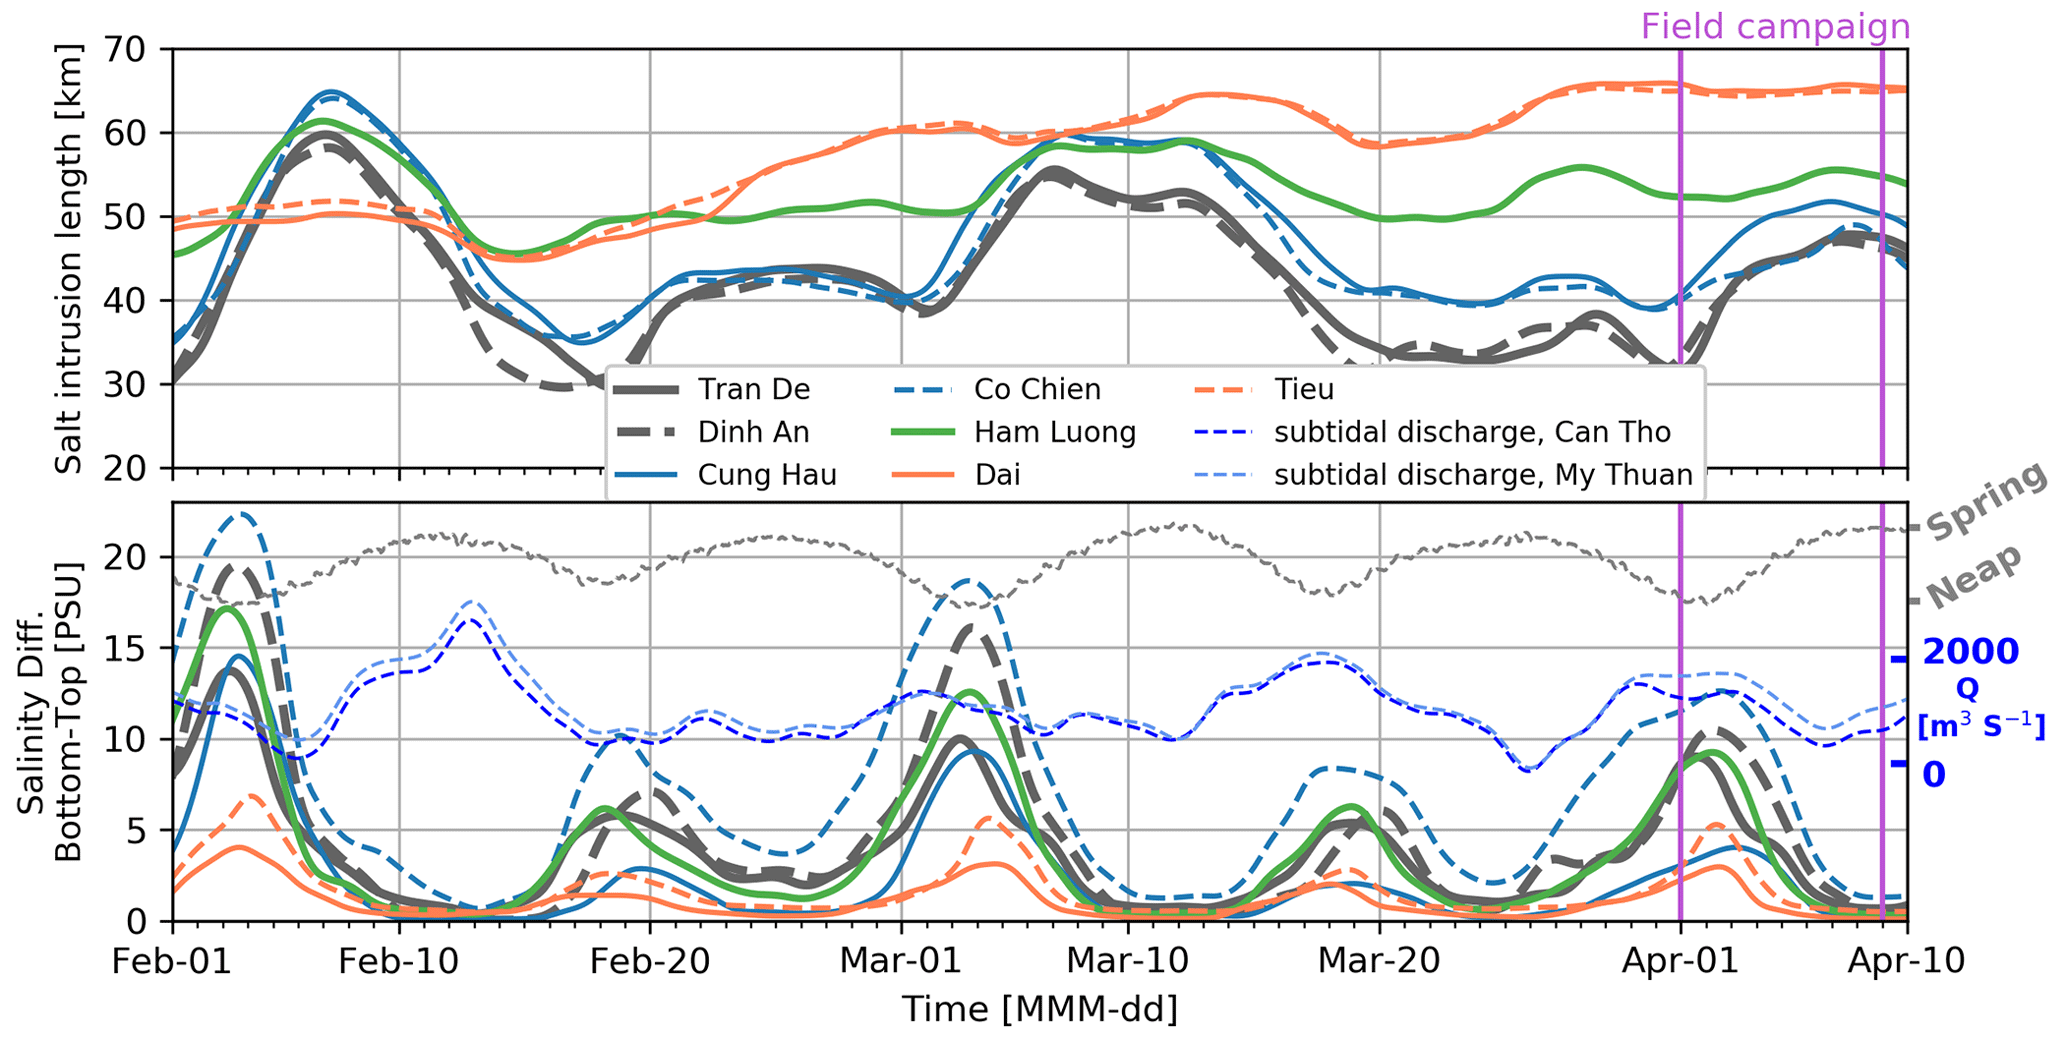
Figure 6Modelled salt intrusion length along seven estuarine distributary channels of the Mekong (upper) and over-depth salinity difference at a point along the thalweg ∼ 15 km from each estuarine distributary channel (lower).
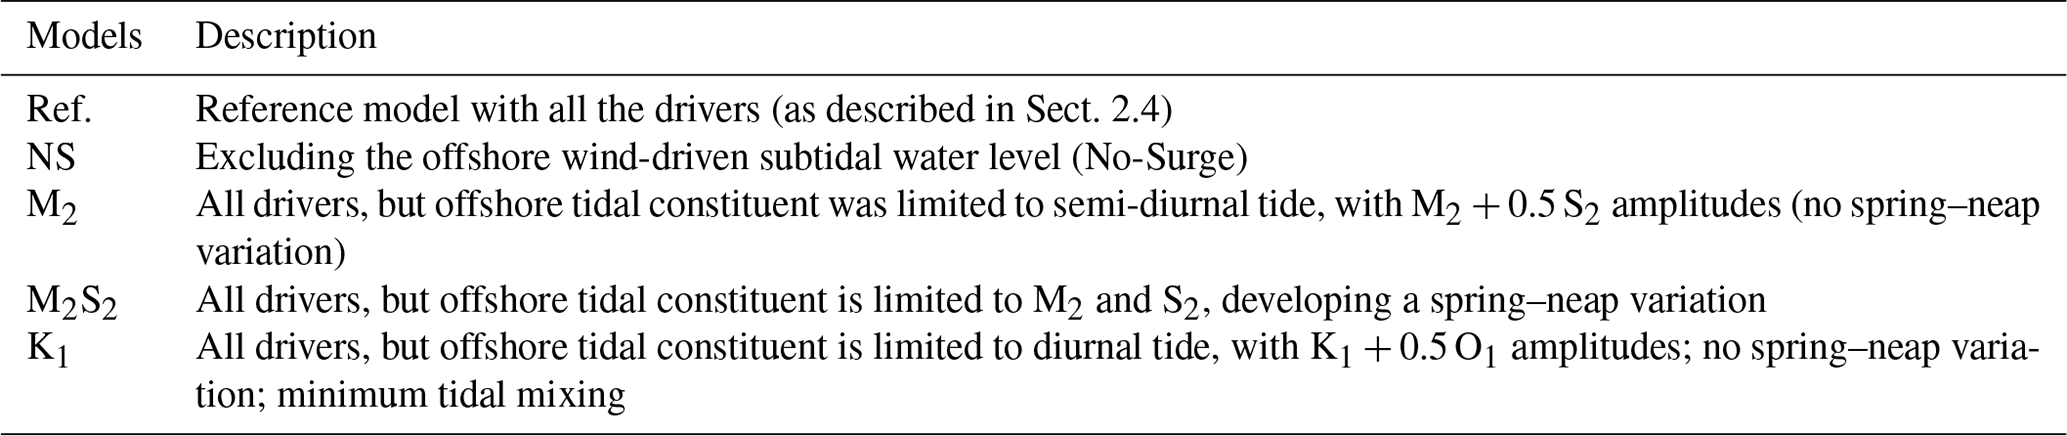
Table 2List of simulations run in this study with a brief description.
3.3 General trends of SWI
In the previous section, we showed a strong spring–neap variability along the two lower distributary channels of the Hau River. To study the SWI along all the estuarine distributary channels, Fig. 6 shows the modelled temporal variations of subtidal depth-averaged SWI length (with 2 PSU threshold) along seven distributary channels and the over-depth salinity difference, indicating stratification. Overall, the VMD experiences a variable SWI of ∼ 30–70 km during the dry season. Despite differences in magnitude, with the exception of the lower My Tho estuarine distributaries (Dai and Tieu), SWI follows similar trends in the lower distributary channels of the Hau and Tien rivers. The estuarine systems of Tran De–Dinh An and Co Chien–Cung Hau, as well as the Ham Luong channel, show analogous temporal variations of SWI length. Furthermore, in terms of stratification, Co Chien–Cung Hau and Tran De–Dinh An show similar bi-weekly spring–neap variations; i.e. during the neap tide, Dinh An and Co Chien (the two deeper channels) experience a much higher stratification than Tran De and Cung Hau. Between the lower distributary channels of Cho Lach, stratification patterns of the single Ham Luong channel also resemble those of the deeper Dinh An and Co Chien channels.
However, within the lower My Tho channels, the narrower and shallower Dai and Tieu have more continuous SWI patterns. This can be partially explained by the limited temporal estuarine variability in terms of stratification. While all channels show increased stratification during neap tide, this is limited in Dai and Tieu. These estuarine channels remain partially mixed to well-mixed throughout the dry season and consequently show a slower response to short-term environmental forcing anomalies; i.e. they mainly follow the large-scale trends of variations of river discharge. In addition, as the Mekong River discharge gradually increases in April, so does water demand within the provinces along the Tien River. As their received freshwater supply during the dry season is in total ∼ 5 % of the total VMD freshwater inflow, upon increasing salinity in the channels, the minor spatial variations in discharge and downstream water level gradient are not sufficient to compensate for the upstream baroclinic pressure gradient. Therefore, during the transition from the dry to the wet season, it takes longer for these channels to become fresh again.
Since the model was able to reproduce the intra-tidal and subtidal processes, as listed in Table 2, in a number of simulations, we examined the role of various processes in determining SWI. As the measurement campaign was carried out in the lower Hau River and its two distributary channels and most of the estuarine channels seem to follow similar SWI trends in time, for further detailed analysis we focus only on the Hau River estuarine channels.

Figure 7Comparison of the reference model (Ref.) including the ocean surge and the No-Surge (NS) model excluding the ocean surge for (a) water level (b) discharge. Panels (c) and (d) show salinity in the Dinh An and Tran De channels, respectively. (e) Salt intrusion length in time along the Dinh An distributary of the Hau River in the reference (Ref.) model in comparison to the NS (No-Surge), M2 (only including the M2 tidal constituent), and M2S2 (replicating a spring–neap cycle) models. Panels (f) and (g) show various salt fluxes (positive upstream) in Dinh An and Tran De, respectively, at cross sections 15 km from the estuary mouth in the reference simulation.
3.4 Ocean surge effect
Figure 7a shows modelled tidal and subtidal water levels at Can Tho, including (reference simulation called Ref.) and excluding (referred to as NS) offshore ocean surge, showing how higher subtidal water levels are associated with ocean surge and correlated with strong NE monsoon winds. Figure 7b shows the effect of the surge on the subtidal discharge in Can Tho, upstream of the Dinh An–Tran De estuarine network. Note that even in the absence of ocean surge (NS simulation), there is still a strong spring–neap signal in the subtidal discharge. During spring tides the river–tide interaction results in larger subtidal friction, which causes the generation of a subtidal wave and temporary storage of water that is released during neap tide (see Eslami et al., 2019a). Figure 7c and d show the simulated change in salinity in the absence of ocean surge near two stationary observation points, and Fig. 7e shows SWI length in the Dinh An channel with and without the effect of ocean surge. In general, an increase in water level driven by ocean surge can increase subtidal stationary salinity by 20 %–30 % 25 km from the river mouth and increase the subtidal SWI length by as much as 10 km (see Fig. 7e). This underscores the interconnectivity of baroclinicity within the Mekong estuarine system with processes that develop hundreds of kilometres offshore. Therefore, depending on the sensitivity of the application, accurate forecasting of SWI demands a system that at least incorporates complete barotropic variations of the continental shelf.
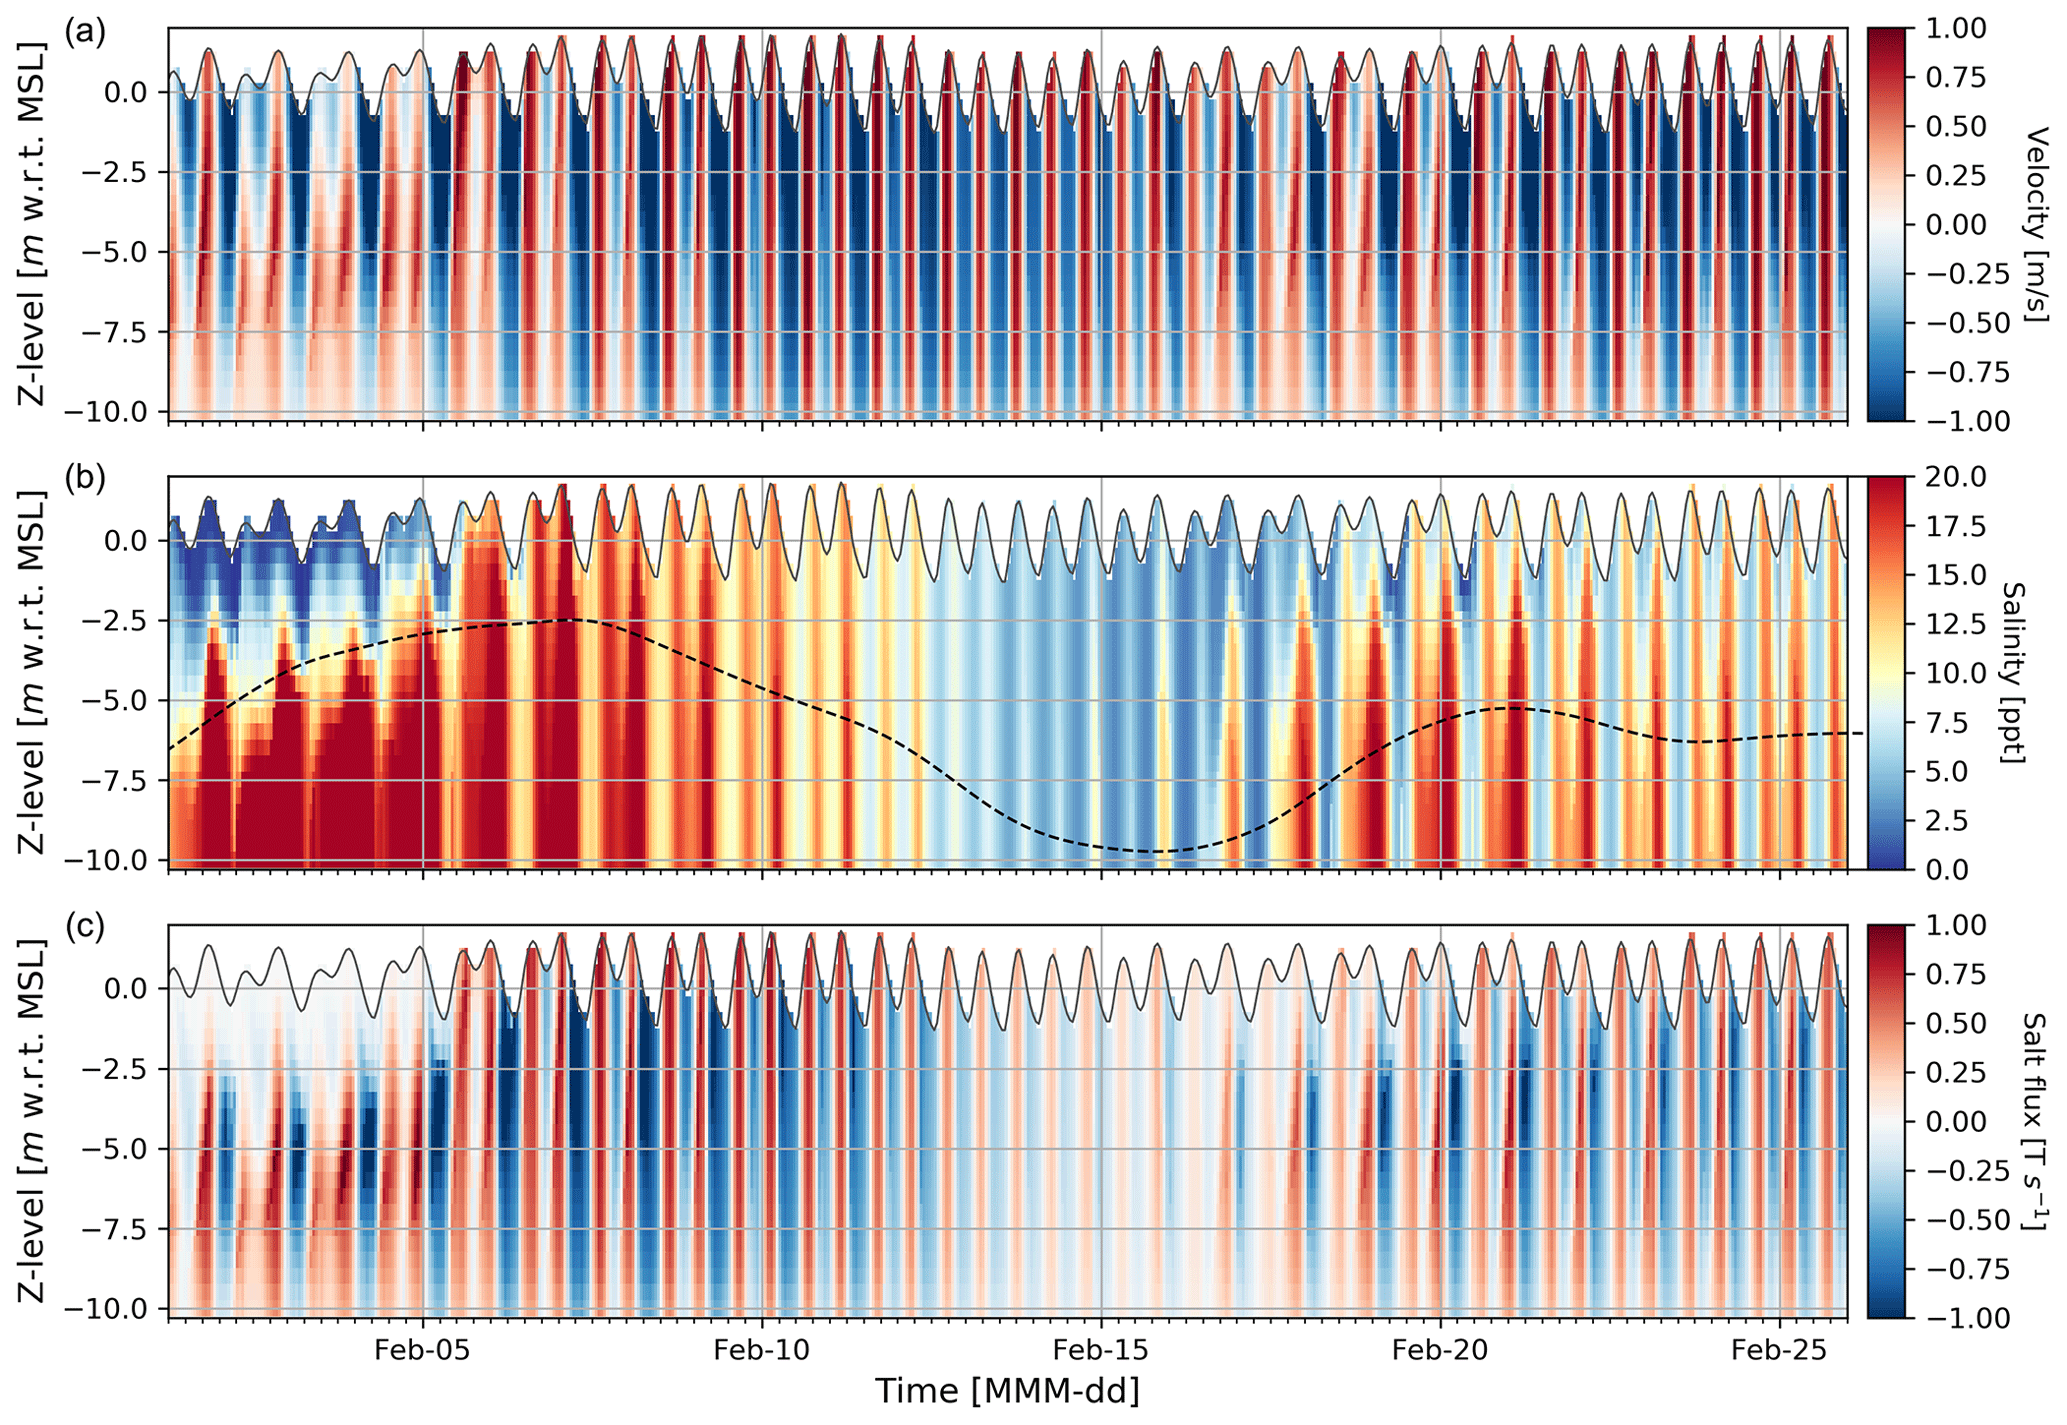
Figure 8Modelled temporal stationary estuarine variability at a point 15 km from the sea in the Dinh An channel in period 1 (maximum salinity). (a) Velocity profile in time. (b) Salinity profile in time (15 km from the sea) and subtidal depth-averaged salinity at Cau Quan as a black dashed line scaled with the right y axis (the right y axis shares the labels with the colour bar). (c) Salt flux (product of salinity and velocity in a grid cell at a point along the thalweg).
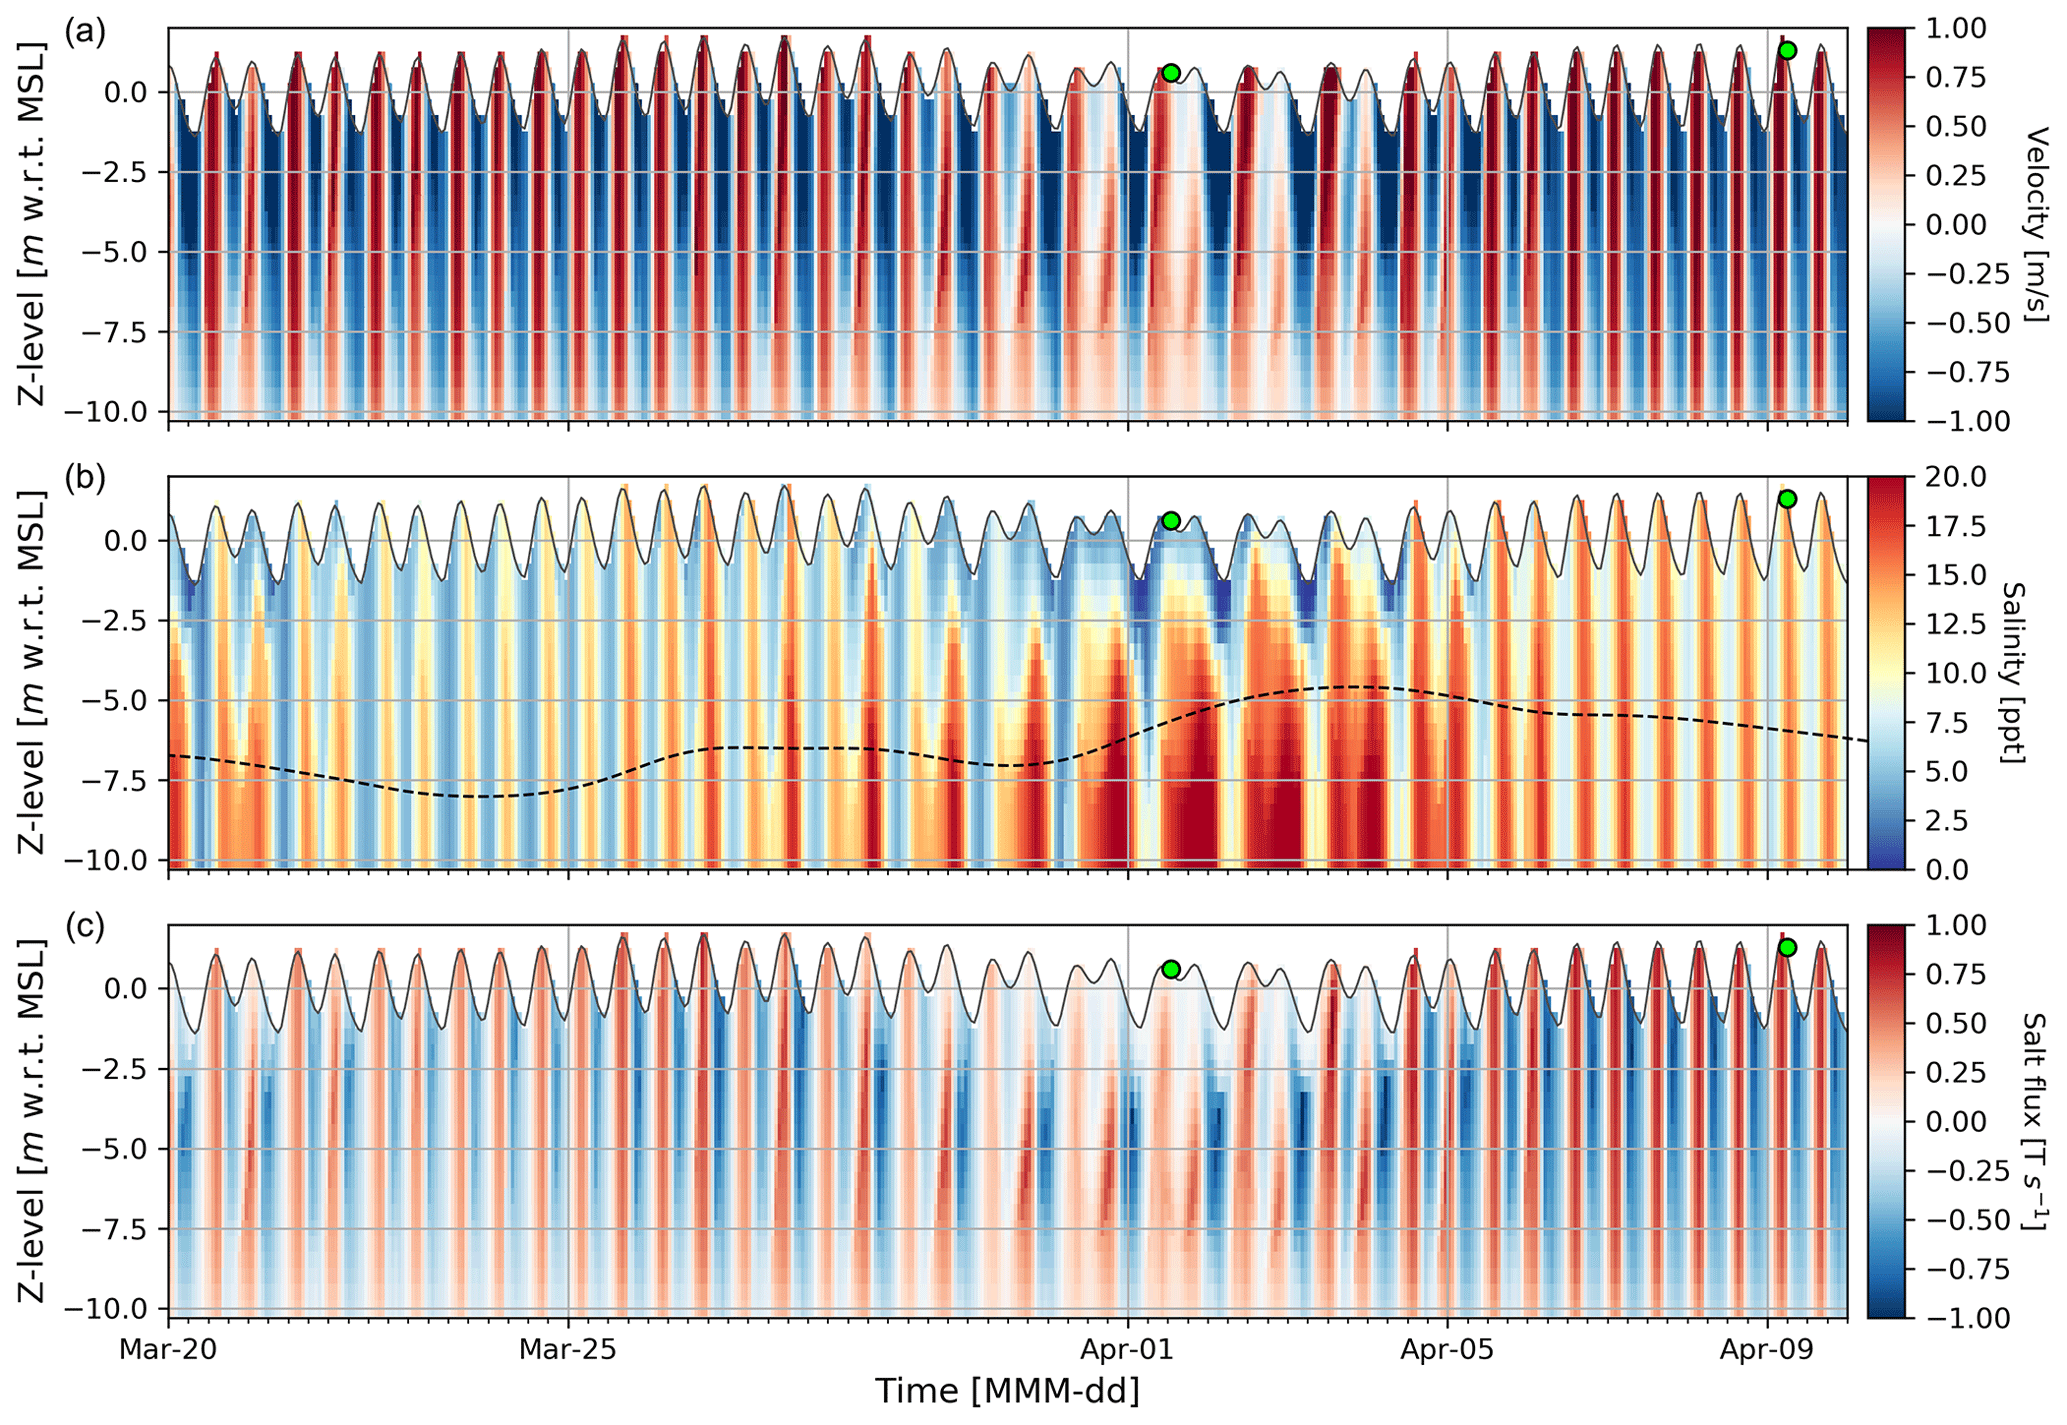
Figure 9Modelled temporal stationary estuarine variability at a point 15 km from the sea in the Dinh An channel in period 2 (field campaign). (a) Velocity profile in time with the green circles marking the measurement locations of the field campaign along the Dinh AN channel. (b) Salinity profile in time (15 km from the sea) and depth-averaged salinity at Cau Quan as a black dashed line scaled with the right y axis (the right y axis shares the labels with the colour bar). (c) Salt flux (product of salinity and velocity in a grid cell at a point along the thalweg).
3.5 Spring–neap cycle
In Sect. 3.3, we briefly touched upon the spring–neap variability of the estuarine channels and its potential role in SWI. Here, by limiting the offshore tidal constituents to a single semi-diurnal M2 tide (with amplitude M2 + 0.5 S2; see Table 2) while other environmental forces remain unchanged (e.g. ocean surge, discharge variability, water demand), we removed the spring–neap cycle from the system forcing, which resulted in up to ∼ 30 km lower SWI length (Fig. 7e). Contrarily, by limiting the tidal species to a diurnal constituent (with K1 amplitude + O1 amplitude), effectively reducing tidal mixing, salinity intrusion length increased up to ∼ 20 km. By limiting the tidal constituents to M2 and S2 to generate a spring–neap cycle (M2S2 model; see Table 2), in the absence of 11 other tidal constituents, the modelled SWI length was still generally close to the reference simulation, accentuating the significant role of spring–neap variability in SWI. Figures 8 and 9 show estuarine variability in the Dinh An channel over two periods: (period 1) high SWI in early February (Fig. 8) and (period 2) prior to the field campaign (Fig. 9), which was carried out between 30 March and 9 April. Period 1, during its first 10 d, is marked by a strong ocean surge that amplified channel depth and hence stratification, and period 2 generally shows lower salinity that is partly driven by lower salt content due to higher discharge along the second half of March. Nonetheless, both periods show that periods of stratified salinity structure are followed by periods of high upstream salt flux (see Sect. 3.6). Maximum salinity is reached during the transition of the system from stratified (neap) to (partially) mixed (spring) states when the system responds to tidal forcing. When the system is not stratified anymore, average salinity starts declining, with advective transport dominating total salt flux in the downstream direction. Given the similar temporal trends of estuarine variability in different estuarine channels of the VMD, this indicates how important the role of spring–neap variability is in increasing total SWI in most of the VMD. By decomposing the salt fluxes in Sect. 3.6 we will further expand on the role of tidal variability and the effect of the spring–neap cycle, along with other environmental forces, on SWI in different periods.
3.6 Salt fluxes
To better understand how the temporal changes in forcing (spring–neap, discharge variation, ocean surge) or bathymetry vary the SWI, we studied the subtidal salt transport and decomposed it into its different contributions. Following several previous studies (Banas et al., 2004; Dyer, 1997; Lewis and Lewis, 1983; Simpson et al., 2001; Uncles et al., 1985) and borrowing the notation of Díez-Minguito et al. (2013), total over-depth salt flux is
where u is the along-channel velocity per unit of width, s is the salt content, h0 is the mean depth, η is elevation, and h is total depth. Velocity and salinity can be written as
with denoting the depth-averaged, referring to tidally averaged (subtidal), xv showing deviation from depth-averaged, and showing deviation from the subtidal signal, where x can be any variable. Total salt flux can be decomposed into eight components as follows.
Here, T1 is the Eulerian non-tidal flow, summing up salt flux by river discharge, Stokes return flow, and all influences on the mean flow. T2 is associated with Stokes transport, and T3, T4, and T5 are tidal pumping terms correlating tidal variations of depth and depth-averaged current and salinity. T6 is a term associated with covariance of depth-varying current and salinity, namely tidal straining. T7 refers to estuarine circulation, consisting of vertical gravitational circulation and other vertically sheared flows (e.g. strain-induced periodic stratification), and T8 is a normally negligible triple correlation of water level variation and depth-varying deviation of velocity and salinity. These fluxes are then integrated over the cross section.
Figure 7f and g show different cross-sectionally integrated salt fluxes in the two lower distributary channels of the Hau River nearly 15 km from the sea. In both channels, the Stokes transport is always positive (upstream), and the residual Eulerian transport is always negative (downstream). The Dinh An channel, because of its larger depth and cross-sectional area (nearly double in width), shows salt fluxes larger by nearly 2-fold. In both channels, the Stokes transport peaks by spring tide, driven by an increased amplitude of the semi-diurnal tide and its associated mixing, while total salt transport is mainly downstream, driven by advective Eulerian transport. Total salt flux in the Dinh An channel can be characterized as more event-like compared to the Tran De channel. This is especially driven by its spring–neap variability in stratification due to the larger depth of the Dinh An channel. In both channels, estuarine circulation increases and dominates salt flux with lower reduced mixing during neap tide. Prior to the two periods with maximum SWI (early February and March) upstream salt transport peaks, especially in the Dinh An channel. These peaks start with peaks in estuarine circulation during neap tide and are sustained with peaks in tidal straining at the onset of transition to the spring tide. While the terms associated with tidal pumping show a limited contribution to the total salt flux, tidal straining becomes an important term during peak SWI events. Tidal straining maximizes in transition between neap and spring, when semi-diurnal tidal amplitude increases, but the system is yet to transition from stratified to partially mixed. The assessment of salt fluxes further visualizes the importance of various forcings as well as geometry and bathymetry, i.e. channel depth, in SWI. Therefore, by leveraging a similar analysis, we will further investigate what salt transport mechanisms are influenced when riverbed levels change within the estuarine system of the VMD.
3.7 Effect of bathymetry
The calibrated model was run with the 2008 bathymetry to demonstrate how bed level changes have influenced SWI in the VMD. It was previously shown that the Ham Luong estuarine channel (see Fig. 1) has experienced the largest increase in SWI compared to other estuarine channels (Eslami et al., 2019b). That study also showed that tidal amplitude in the Tien River system has increased by nearly 40 %. Therefore, in this section, we focus on the model results of the Ham Luong estuarine channel. Comparison of the 2008 and 2018 (Vasilopoulos et al., 2021) bathymetries shows an average ∼ 1.5 m incision in the Ham Luong channel during this period (nearly 10 % increase in depth), but this value increases to ∼ 3 m along the thalweg, which implies a significant influence on tidal propagation and fresh–saline water dynamics. Figure 13a shows that under identical environmental forces, SWI length would be 5–10 km shorter had the riverbed levels not changed in the past decade. Figure 13b and c show various salt fluxes at two cross sections, 20 and 50 km from the sea, respectively. In terms of significance of various fluxes, we observe similar trends between the Ham Luong and Dinh An channels (see also Figs. 6 and 7). Total salt transport, especially during neap tide when the system is more stratified, has increased by nearly 50 %. This is mainly driven by fluxes associated with gravitational circulation and tidal straining, directly correlated with increased stratification in response to deeper riverbed levels. Upstream Stokes transport that is mainly driven by an increased semi-diurnal tidal amplitude and the cross-sectional area has also increased by nearly 15 % under the more recent bathymetry. However, as Stokes transport is maximum during spring tide when stratification is minimized, its effect is compensated for by the advective downstream residual transport, dominated by river discharge and Stokes return flow.
This exercise shows that increased river depth directly and profoundly impacts salt flux mechanisms. For example, 50 km from the estuarine mouth (Fig. 13c), there would nearly be no salt flux due to estuarine circulation. However, under the current (2018) bathymetry, salt transport by estuarine circulation is the dominant mechanism and through tidal straining has nearly doubled. Note that the most impacted processes are those associated with vertical gradients (salinity and velocity) with temporal variations in their significance. Salt transport by estuarine circulation is maximized during the neap tide, and transport by tidal straining is maximized in the early transition of neap tide to spring tide, while Stokes transport that is often treated reasonably well, even in 1D numerical and/or analytical approaches, peaks during spring tide. These dynamics suggest not only that the bathymetry change has shifted the salt flux regime of the estuary, but it has also developed to a more complicated system that requires a more sophisticated treatment. Therefore, it is plausible to argue that one-dimensional treatment of such a complicated system, as it is common practice, cannot accurately reflect changes in the salinity dynamics of the Mekong Delta.
Previous modelling studies of salinity in the Mekong Delta can be classified into three categories: (1) applying analytical stationary models along with field measurements (Nguyen et al., 2008; Nguyen and Savenije, 2006), with temporal and spatial limitations; (2) 1D numerical studies (Khang et al., 2008; Smajgl et al., 2015) that include the system of primary and secondary channels but exclude the shelf dynamics – these models need to force downstream salt concentration boundary conditions and due to their depth-averaged nature are limited in physical representation; or (3) offline numerical coupling of 1D and 2D (Tran Anh et al., 2018) or 3D (Nguyen and Tanaka, 2007), limited to the lower Hau River. Given recent advances in numerical methods and computational power, it has become possible to efficiently model the entire Mekong Delta in a combination of 2DV and 3D. This provided a powerful tool with a fully integrated online-coupled model of upstream river sections, irrigation canals, estuarine channels, and a large part of the continental shelf. With this tool, 3D processes were fully represented, and salt transport mechanisms were modelled with three-dimensional fidelity. Many 1D modelling exercises have to resort to forced or analytical definitions of downstream salinity as they do not extend offshore. As salinity at the estuary mouth is highly variable with a principal effect on SWI in the estuary, here, we do not compromise on artificially forced boundary conditions and can fully capture the interconnectivity of coastal–inland salinity dynamics in response to various forcings.
4.1 Three-dimensionality of SWI
The combination of variable external forcing in discharge, tide, and wind, for example, as well as large variations in geometry, bathymetry, and the fresh–saline water dynamics result in a wide range of estuarine characteristics around the globe (Dyer, 1997; Fischer, 1976; Geyer and MacCready, 2013; Valle-Levinson, 2010). These characteristics are projected in salt transport mechanisms that lead to the realized salt balance or saline water intrusion in these systems. These mechanisms can be more depth-averaged (2D) when buoyancy is limited or depth-varying (3D) when the system is more stratified. Examples of systems with more depth-averaged processes are Conwy Estuary, where salt transport is dominated by tidal pumping (Simpson et al., 2001), and the Guadalquivir Estuary where non-tidal and Stokes transport mechanisms are the most important salt fluxes (Díez-Minguito et al., 2013). On the other hand, in a system such as the Columbia River Estuary salt transport is more dominated by the quarter-diurnal signal (Mac Cready and Geyer, 2010) of tidal straining (Burchard and Hetland, 2010; Jay and Musiak, 1994; Jay and Dungan Smith, 1990a, b), which is a three-dimensional process.
Table 3Summary of sensitivity analysis simulations and their descriptions.

This study, for the first time, provides a coherent and integrated picture of salinity dynamics in the Mekong Delta and shows that SWI within the delta has a 3D character with large variability on different temporal and spatial scales. Previously, estuarine salinity of the VMD was either measured stationary (Eslami et al., 2019b; Nowacki et al., 2015) or in along-channel snapshots during spring tide (Nguyen and Savenije, 2006). The estuarine salinity structure and its neap–spring variability were studied here for the first time. Estuarine stratification variability can have significant implications for 3D estuarine circulation (Jay and Dungan Smith, 1990a, b; Jay, 2010). We showed that temporal changes in mixing, driven by the spring–neap cycle, have dominant roles in SWI within the VMD. The gravitational circulation and other vertically sheared flows resulting from depth-varying forcing dominate salt transport during the neap tide, and tidal straining becomes the significant process in transition to the spring tide, both of which are highly 3D processes. During the spring tide, the partially to fully mixed system acts more as a depth-averaged system and generally flushes salt with non-tidal residual flow, predominantly a combination of river discharge and the return flow of the strong non-linear Stokes transport. In short, we can say the system imports salt in a 3D fashion but flushes in a depth-averaged manner.
4.2 Subtidal variability
It was shown that under low-discharge regimes, ocean surge can travel hundreds of kilometres upstream (Henrie and Valle-Levinson, 2014) and influence discharge division in multi-channel estuarine systems (Eslami et al., 2019a), but its effect on SWI was not addressed before. This study quantifies the effect of ocean surge on SWI (up to 20 % stationary or 10 km in intrusion length of subtidal depth-averaged salinity), along with other subtidal variations such as discharge and spring–neap variability. The salinity peaks of the VMD during the 2016 drought not only coincided with low-discharge periods, but also with high-surge events. While discharge variation inversely changes SWI in a relatively well-understood manner (Abood, 1974; Gong and Shen, 2011a; Monismith et al., 2002; Ralston et al., 2010), we could conclude from the sensitivity analysis that a positive surge increases SWI, but it was not directly clear from the sensitivity analyses with real forcing (e.g. Fig. 7) how exactly ocean surge impacts SWI. To examine system response in time and space, a perturbation analysis with synthetic forcing was set up. A series of perturbation simulations (for the entire VMD) were run for 160 d with constant discharge (ranging from 3000 to 6000 m3 s−1) and different tidal forcings (only M2, only K1 or M2 + S2) to arrive at a stationary or equilibrium state. These stationary states were then interrupted with perturbation of upstream discharge (in Kratie) or subtidal offshore water level. A positive or negative peak or trough of a 10 d discharge or surge wave was forced at the upstream or downstream boundary, and the adaptation time and the salinity intrusion response were examined. Table 3 summarizes the list of 39 perturbation simulations.
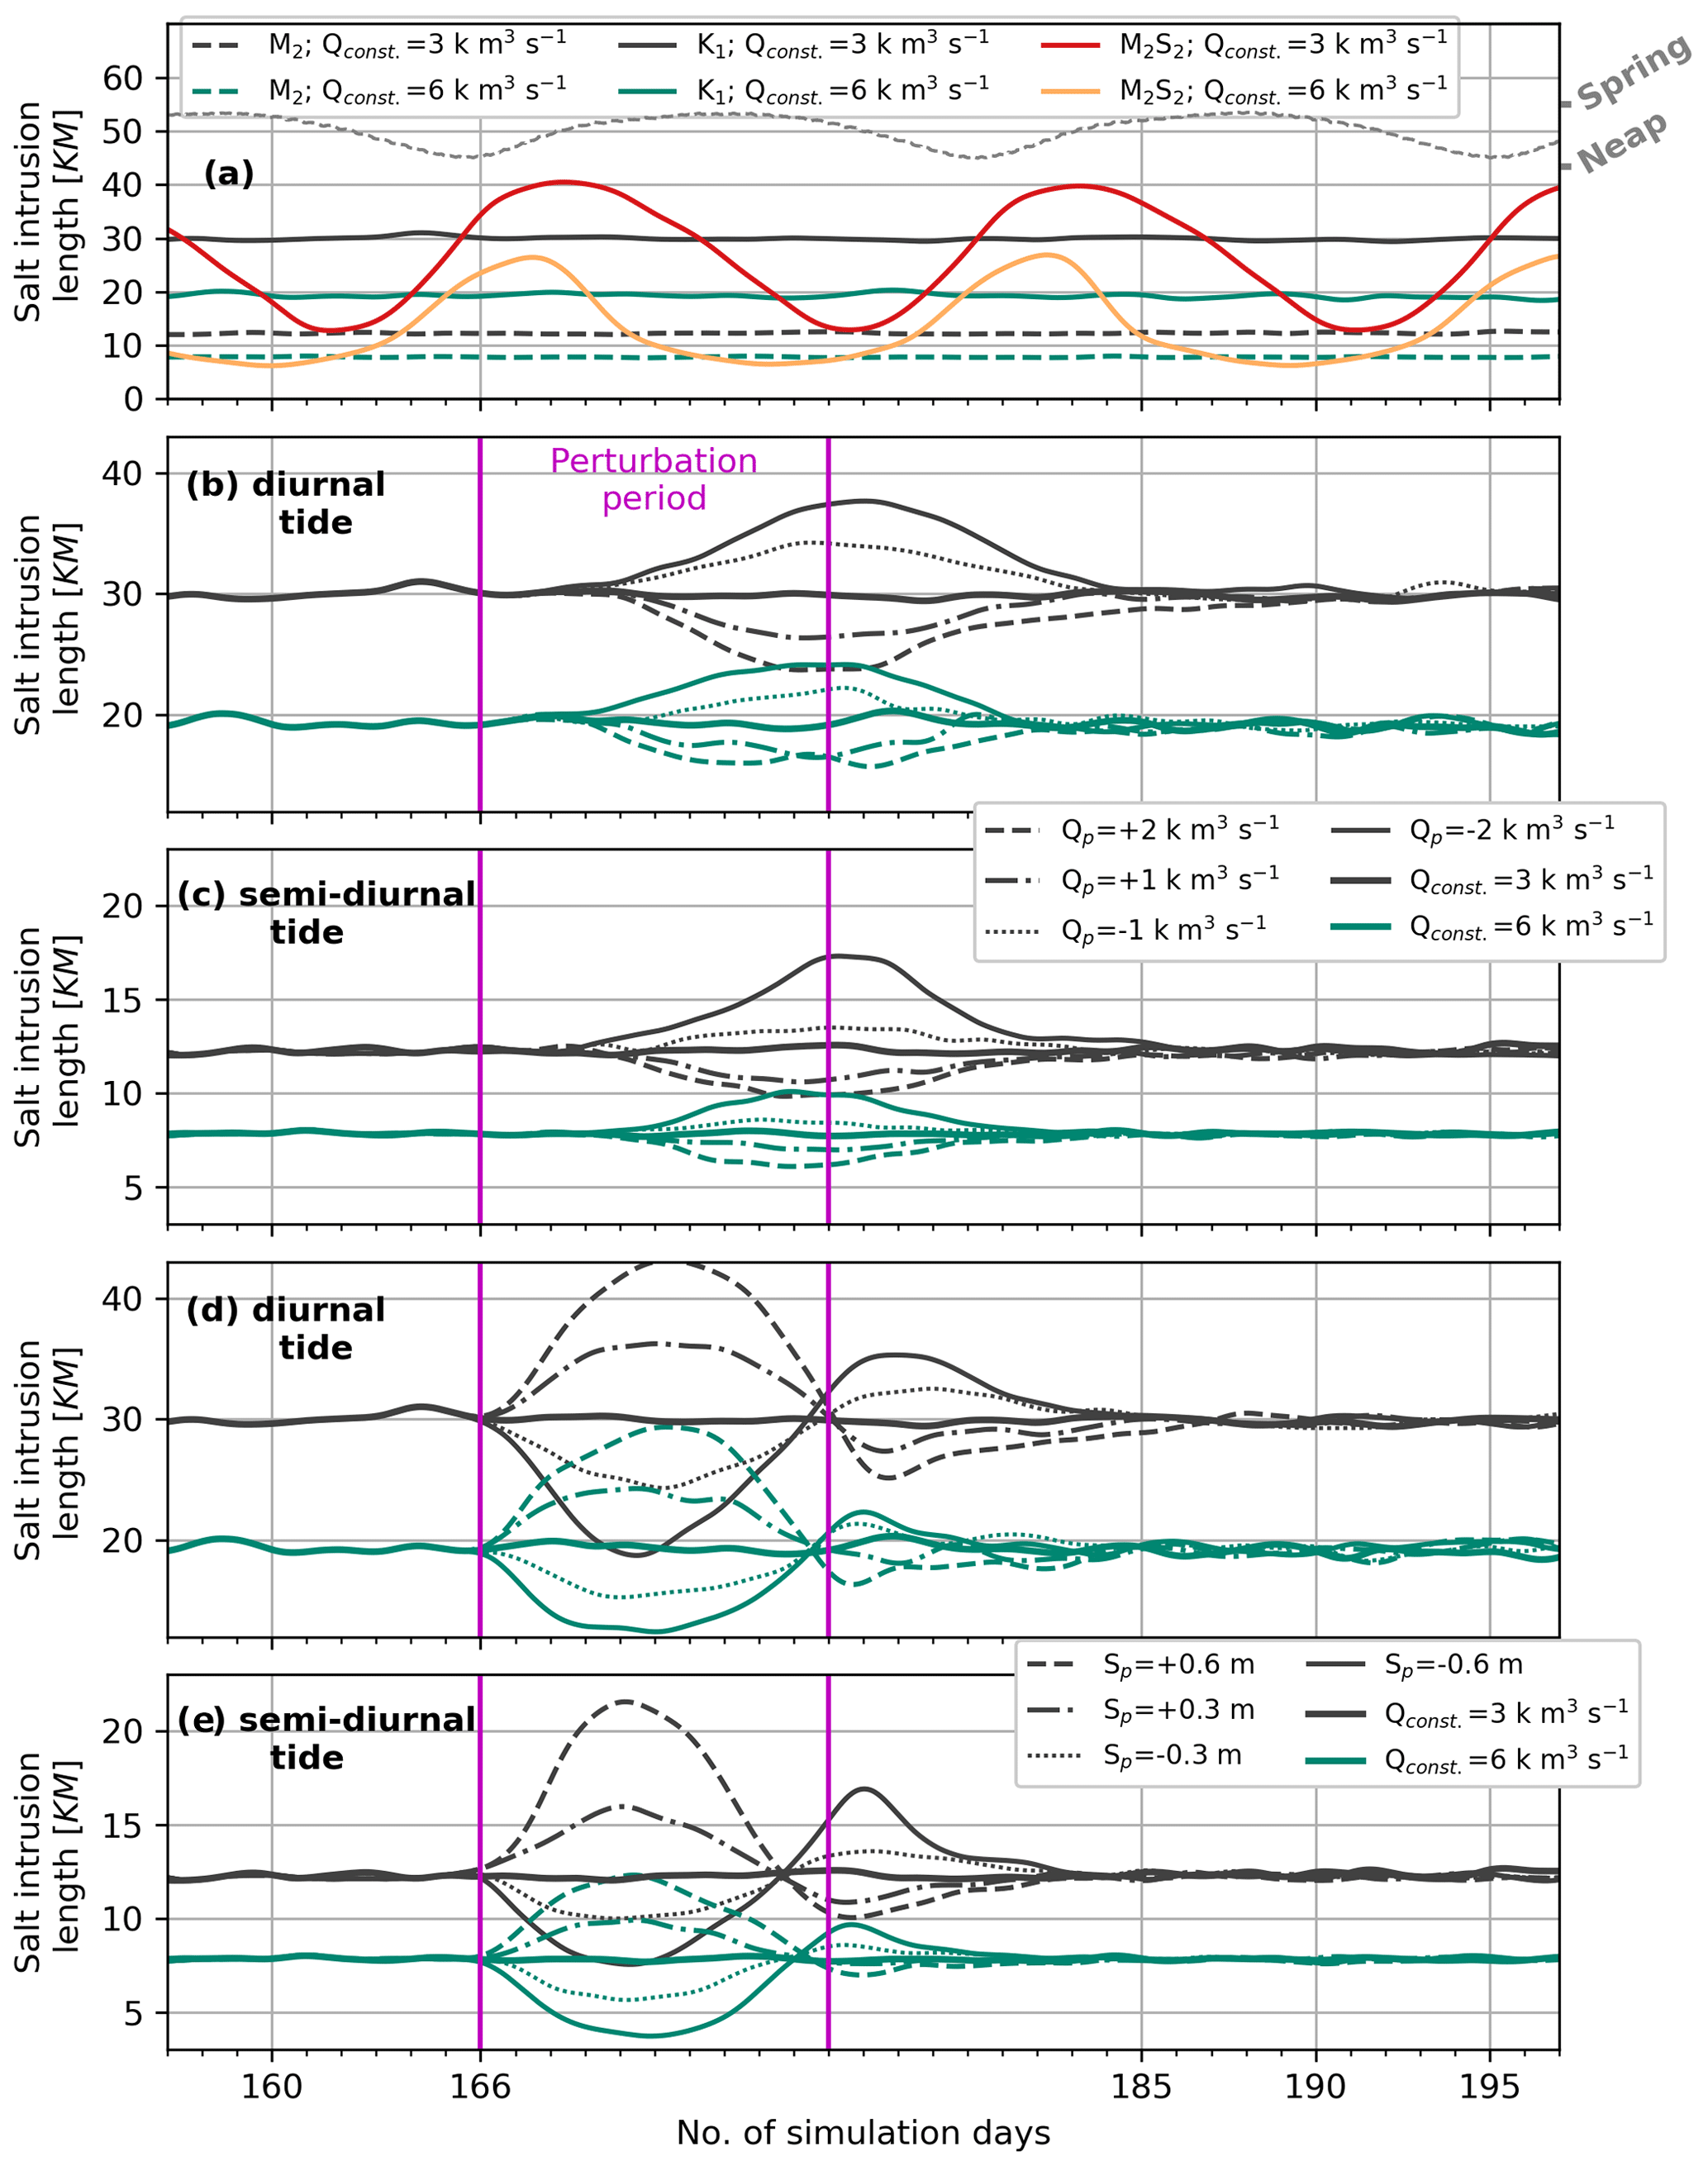
Figure 10Comparison of temporal variation of salt intrusion length along the Dinh An channel for models with (a) constant discharge including a spring–neap cycle (M2S2) and excluding a spring–neap cycle with only semi-diurnal (M2) or diurnal (K1) tidal species. The salt intrusion response along the Dinh An channel is depicted in time and space to (b) a 10 d discharge perturbation from upstream and (e) a 10 d subtidal offshore sea level perturbation when salt intrusion is in stationary conditions in models with constant discharge excluding spring–neap cycles.
Figure 10 summarizes the results of the perturbation analysis for the Dinh An channel, while similar trends could also be observed in other channels, except lower My Tho distributary channels (see Sect. 3.3). Generally, the system with a diurnal tide (less mixing) experiences longer SWI length than a system with only a semi-diurnal tide (more mixing), and the difference increases (from ∼ 12 to ∼ 18 km) with decreasing discharge from 6 to 3 k m3 s−1 (Fig. 10a). Furthermore, as spring–neap variability increases maximum SWI compared to when the system is forced by only a diurnal or semi-diurnal tide, the variations and sensitivity to the spring–neap cycle increase non-linearly with lower discharge and longer SWI length. Figure 10b and c show the system response to upstream discharge (in Kratie) variation, and Fig. 10d and e show SWI adaptation to subtidal changes in coastal water levels. Both system responses are examined for conditions with only diurnal (Fig. 10b and d) or semi-diurnal tides (Fig. 10c and e). There is an immediate reaction to subtidal water level changes but the effect of discharge in Kratie is delayed nearly 2–3 d until the upstream wave reaches the delta. In response to subtidal variations (both upstream discharge and downstream surge), a semi-diurnal system (more mixing) adapts faster and returns more quickly to stationary conditions than a diurnal system (less mixing). In general, the longer the SWI, the slower it is to go back to its unperturbed conditions.
Estuarine response time to river discharge variation can be addressed by relating SWI length to a power law of river discharge, whereby , with Qf as discharge and α and n constants (Abood, 1974; Gong and Shen, 2011b; Monismith et al., 2002; Ralston et al., 2010). The lower Hau River, in terms of response to discharge, showed similar behaviour as Madaomen Estuary (one of the estuaries of the Pearl River Delta), scaling with n≈ −0.5. This value is smaller than those associated with estuaries such as the Hudson River (−0.33), Skagit (−0.25) and Merrimack (−0.19), implying a system more sensitive to discharge variations. Furthermore, similar to previous observations (Gong and Shen, 2011b; Hetland and Geyer, 2004), the system has a slightly shorter response time to increasing discharge (reducing SWI) than decreasing discharge (rising SWI). Finally, the net increase in SWI length due to a discharge trough is stronger than the net decrease due to a discharge peak.
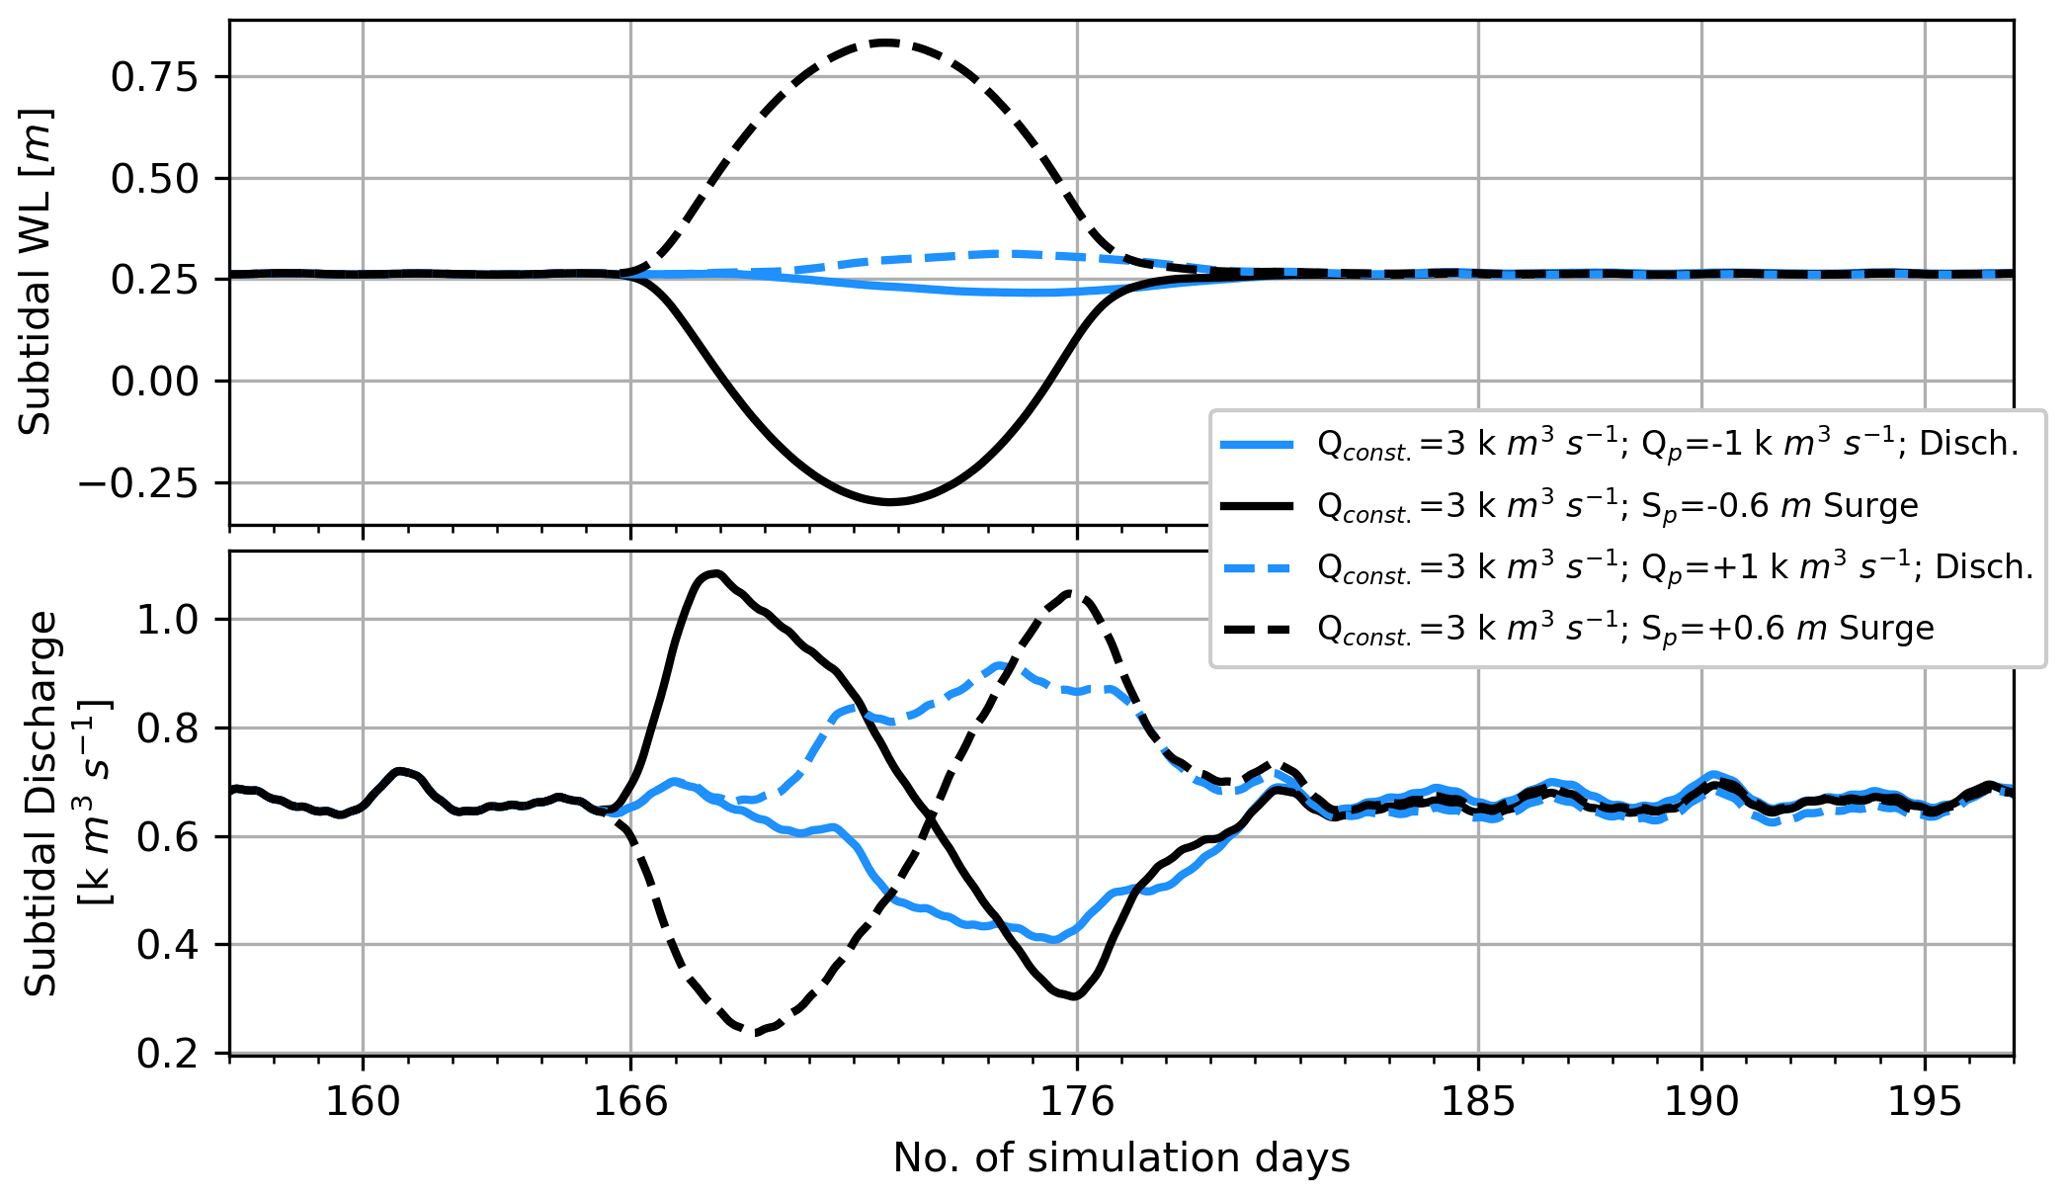
Figure 11Upstream (in Can Tho) subtidal water level and discharge response to variation in discharge and surge level.
The surge effect on SWI introduces a slightly different behaviour in terms of estuarine response, which was not addressed previously. Generally, the adaptation time (17–20 d to a 10 d surge) is shorter under a semi-diurnal (mixed) tidal regime than under diurnal (stratified) tidal forcing. Similar to discharge variation, under a diurnal (stratified) tidal forcing, up-estuary dispersive salt flux (by rising surge) is slower than down-estuary advective flux. This means that the system reacts slightly faster to a falling surge than a rising surge. However, as down-estuary advective flux is stronger under a semi-diurnal tidal regime, adaptation time to a rising surge is slightly shorter than to a falling surge. As the SWI response to upstream discharge variation is delayed and peak-like, the response to downstream surge is immediate but longer as it entails a secondary response in discharge in the second limp of the surge. This is interesting because a subtidal water level trough can also temporarily increase SWI after it reduces that in the first response. Therefore, the system adaptation time to the surge is longer (up to 20 d). This is elaborated further in Fig. 11, showing subtidal water level and discharge response to surge and discharge perturbation upstream of the Dinh An channel in Can Tho. The rising upstream discharge translates to a simple rise in water level and discharge in Can Tho. However, a rising surge causes an upstream-directed flow, decreasing local discharge, while a falling surge drives a seaward-directed flow, resulting in a rising discharge. The rising surge increases SWI by increasing channel depth and superimposing a landward current, but due to its rebound effect on discharge in the falling limb, a rise in SWI is followed by a decline. This implies that the physical processes of the continental shelf are intrinsic components of the very same delta system influencing SWI in the delta. Therefore, 1D models that exclude this crucial part of the system (e.g. Smajgl et al., 2015; Tran Quoc Dat et al., 2011; Vu et al., 2018) can be prone to significant errors.
4.3 Comparison to an analytical model
An alternative of a numerical model can be a simple analytical model. To test how well an analytical model can perform compared to a 3D modelling approach, we compared our results with the Savenije analytical model (Savenije, 2012). This model relates the steady-state along-channel salinity profile to a varying dispersion coefficient that is a function of upstream salinity gradient. In simple terms, along-channel salinity is described as
where i indicates a state associated with high water slack (HWS), low water slack (LWS), or tidally averaged (TA), Si is the salinity, Sf is the freshwater salinity, and the coefficient ci is defined as
Here, A is the tidally averaged cross-sectional area, Qf the river discharge, Di the dispersion coefficient, and K the Van der Burgh coefficient. Then by calibrating the model for K and D0,i (dispersion coefficient at the estuary mouth, x=0), along-channel depth-averaged salinity associated with any of the three steady-state conditions can be computed by
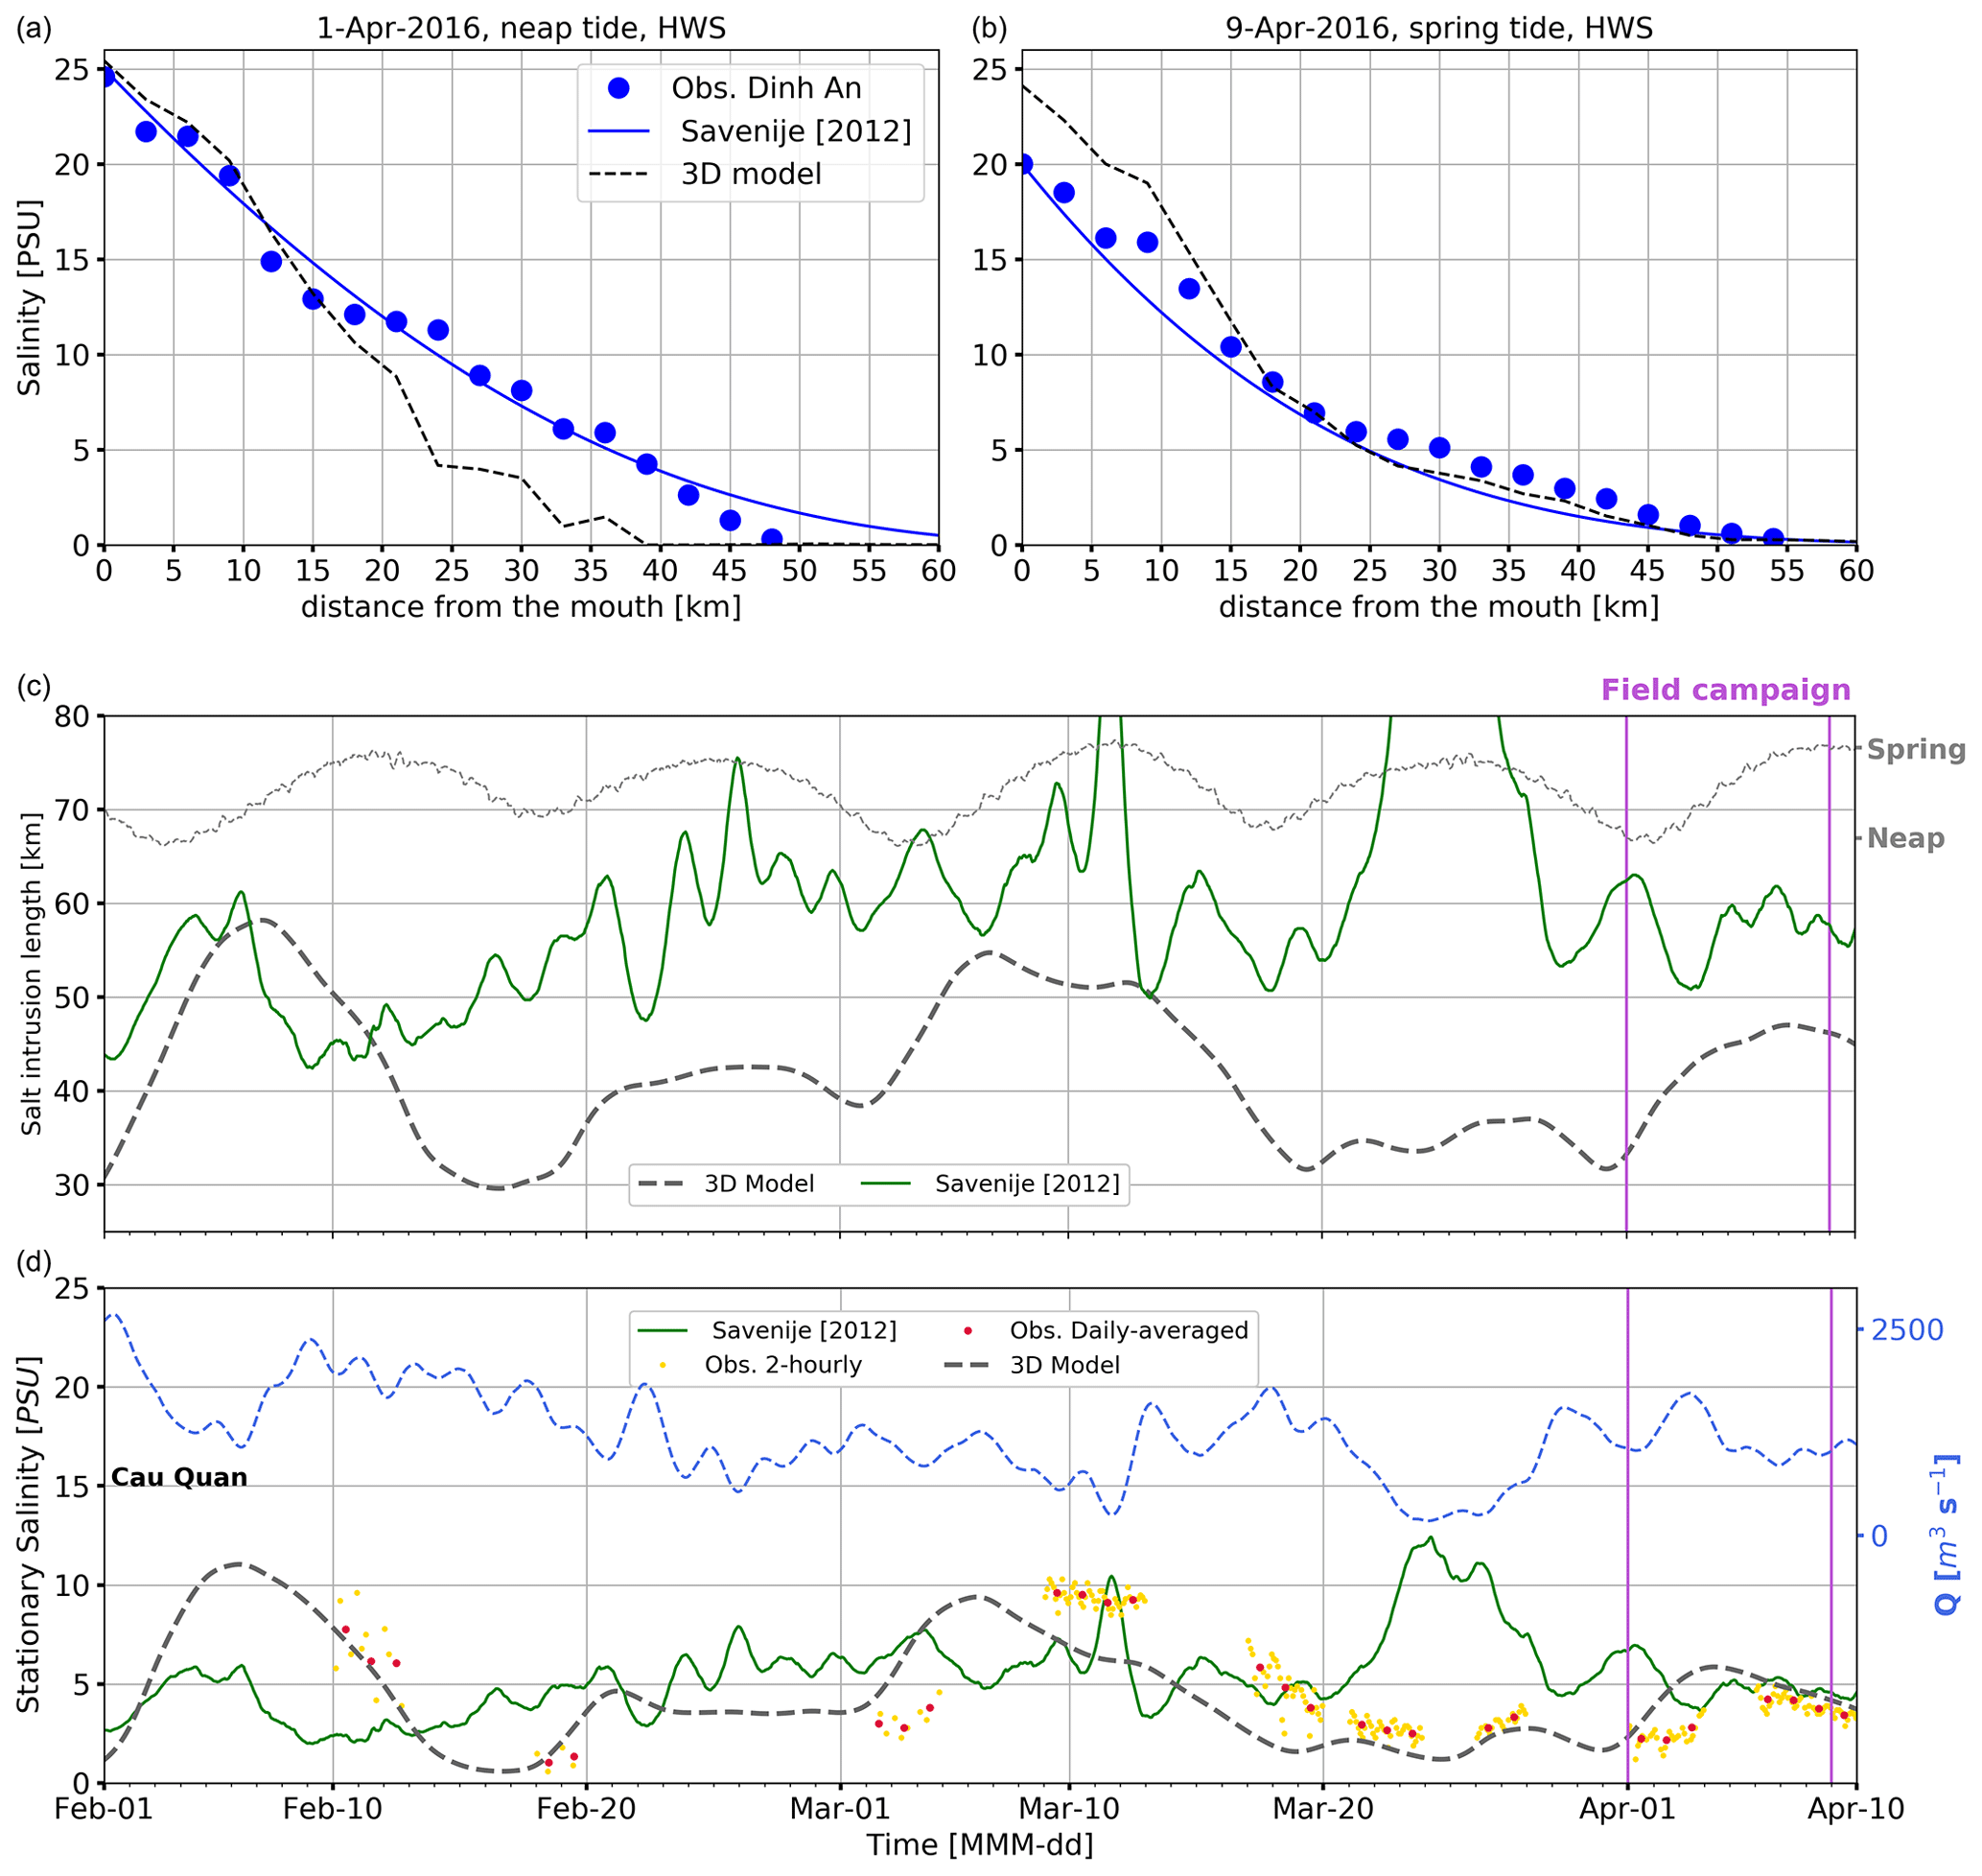
Figure 12(a, b) Observed vs. numerically (3D) and analytically (Savenije, 2012) modelled depth-averaged along-channel salinity at high water slack (HWS) along the Dinh An channel. (c) Comparison of the numerical (3D) vs. analytical (Savenije, 2012) tidally averaged SWI length along the Dinh An channel. (d) Observed vs. numerically (3D) and analytically (Savenije, 2012) modelled salinity at Cau Quan station nearly 27 km from the sea within the Dinh An channel.
Then, SWI length is calculated as
where a is the e-folding length for channel cross-sectional area and A0 the cross-sectional area at the estuary mouth (x=0). Savenije (2012) also provides some predictive equations for K and D0,i. These predictive equations use various parameters such as average channel depth h, tidal wave period T, tidal range H0, and flow velocity amplitude V0 at the boundary. We calibrated the dispersion parameters for our measurement campaign during the two HWS steady-state conditions (Fig. 12a and b), and apart from Qf (varying as observed subtidal discharge in Can Tho) and T (varying between 12 and 18 from spring to neap tide), we kept other parameters constant for the simulation period to have a fair comparison between the models. Note that the along-channel salinity profile calibrates well with a 12 h tidal wave period during the spring tide as the tidal signal is highly semi-diurnal. During neap tide, when the tidal signal is almost but not fully diurnal, the model calibrated better with 18 h, which is shorter than the ∼ 24 h wave period of the diurnal tidal species.
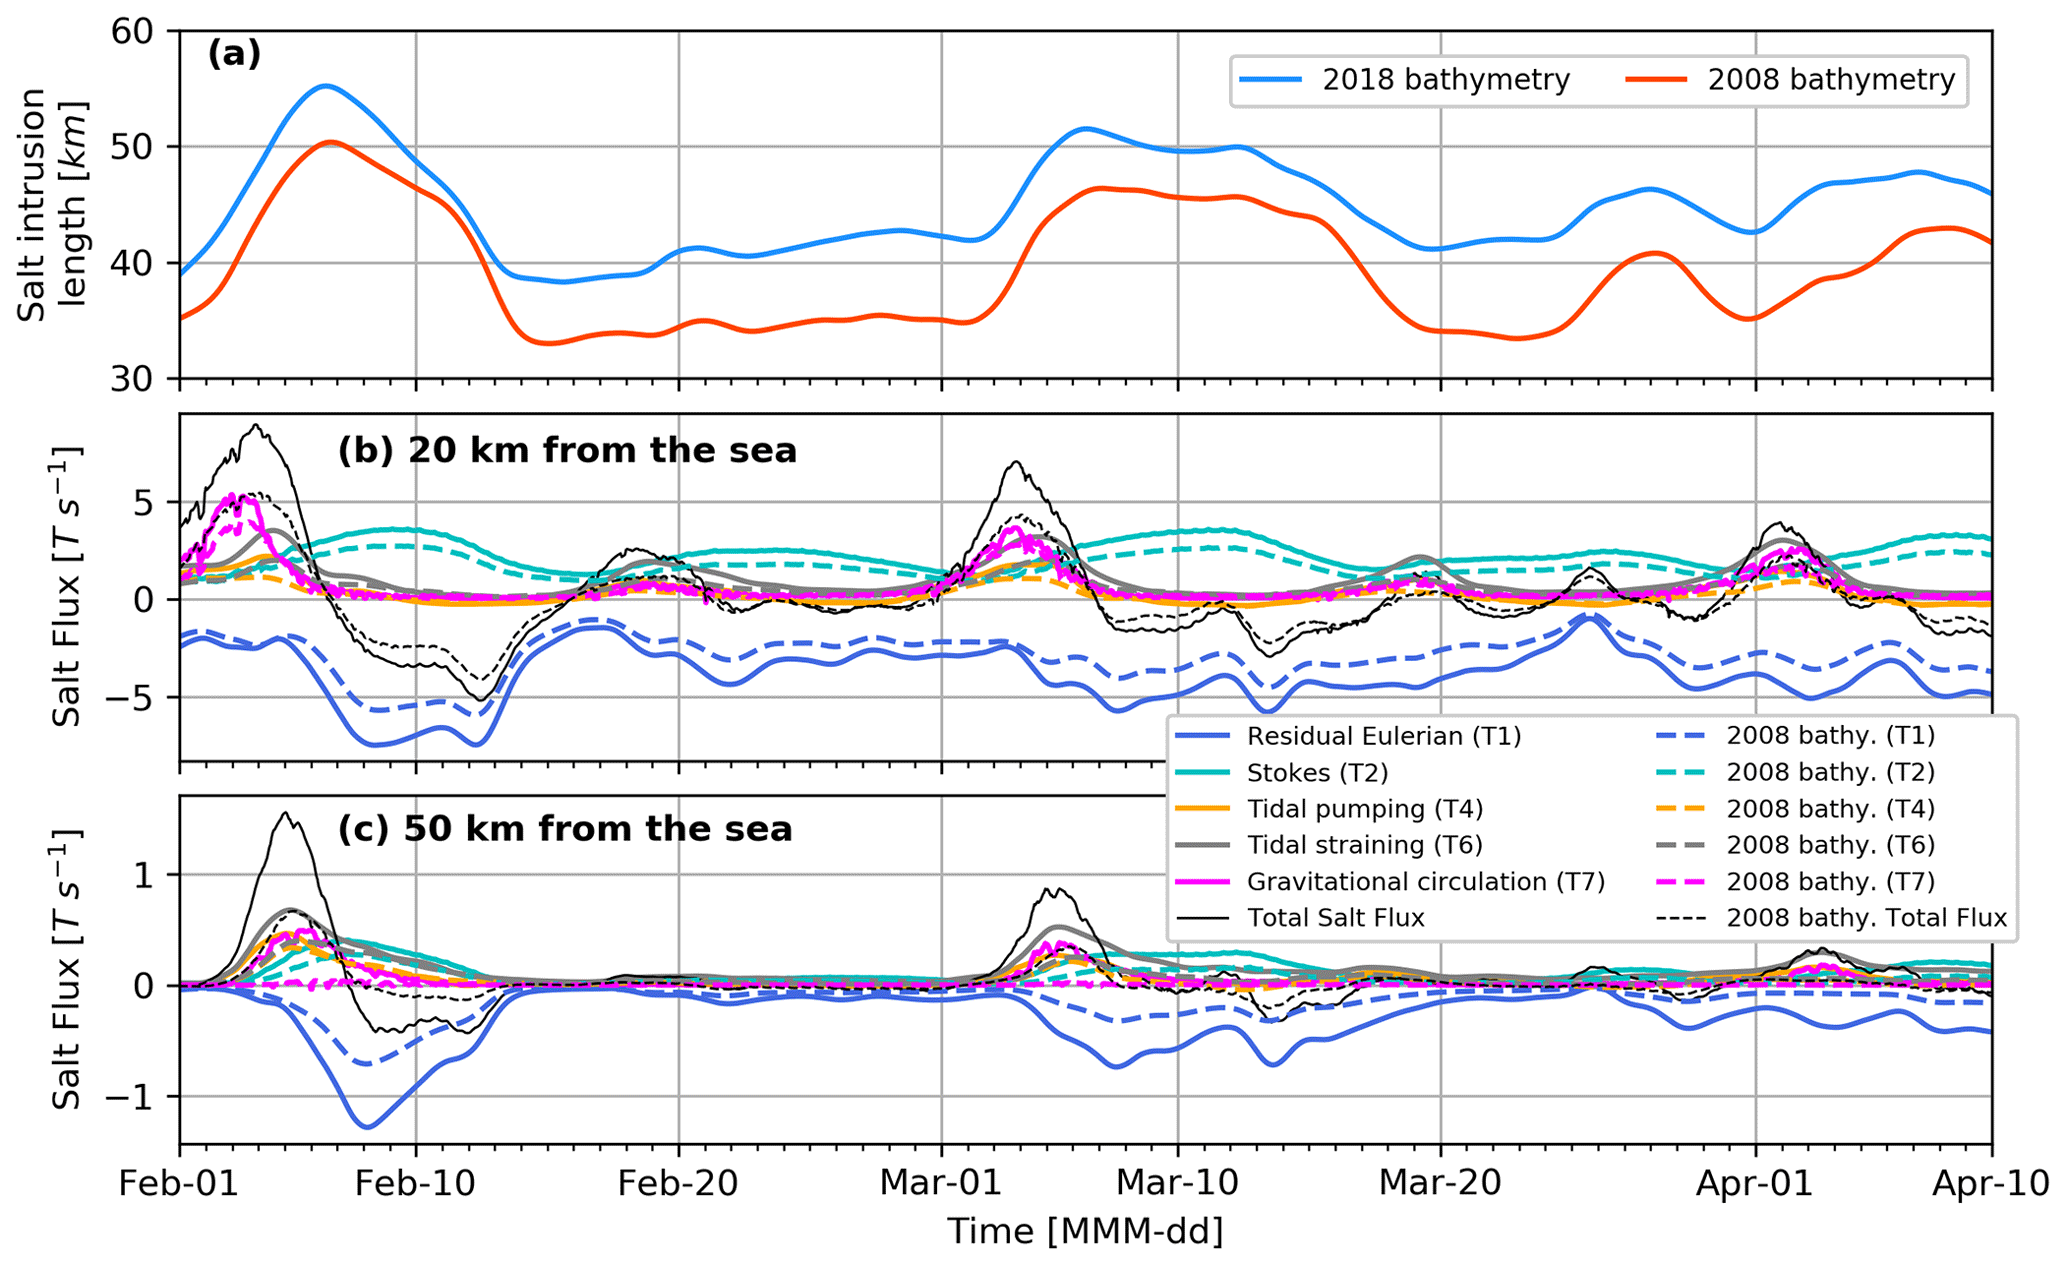
Figure 13Variation in tidally averaged salt intrusion length in the Ham Luong channel under existing (2018) and the older (2008) bathymetries (a). Major salt flux mechanisms under two bathymetries at 20 km (b) and 50 km (c) from the sea.
Figure 12 shows the comparison of model results for the Dinh An channel. The Savenije approach shows excellent correspondence with the HWS during spring tide and has a good performance during neap tide but overestimates the SWI length. The 3D model has a good performance for spring tide and while it has an accurate reproduction of the near-sea estuarine salinity, it underestimates SWI length. Both models deviate more if we look at the time series of SWI length and salinity. The Savenije model (computed for a tidally averaged along-channel profile) is quite sensitive to changes in upstream discharge and most often has significantly larger SWI than the 3D model. Although we do not have time series of observed SWI length (Fig. 12c), the comparison of salinity at a fixed station (Fig. 12d) suggests that the Savenije model overpredicts the salinity quite often and is more variable in time than the 3D model and the observation data. Based on the comparison of salinity at a fixed station we conclude that the 3D model does a better job. Of course, this comes at a high computation cost. However, when it comes to realistic representation of salinity in the delta (for example, for salinity forecast or operational systems) a 3D approach is preferred over an analytical model, while for first-order estimates and system response evaluation to changes in physical processes and trend analysis, the analytical model is a powerful tool.
4.4 Impact of riverbed level changes
Examples of increased SWI in response to riverbed level incision have been shown in other estuaries such as the Hudson, Eems, Elbe, Loire, Schelde, and Tanshui (Liu et al., 2004; Ralston and Geyer, 2019; Winterwerp and Wang, 2013). Had the riverbeds within the VMD remained at their 2008 elevations, the impact of SWI during the 2016 drought would have been significantly lower. The deeper channels activate and/or magnify 3D subprocesses of upstream salt transport that can increasingly amplify SWI. The VMD and many of its distributaries occupy a wider area compared to e.g. the Hudson River within the estuarine parameter space (Geyer and MacCready, 2013). Because of the spring–neap variability and discharge sensitivity to external forces, the wide range of the mixing parameter M (see Geyer and MacCready, 2013), ranging between 0.6 and 2, shifts the VMD between areas occupied by the Hudson River and the Columbia and Conwy River. Unlike the Hudson River Estuary, where increased SWI could not be associated with gravitational circulation (Ralston and Geyer, 2019), here we quantify a clear increase in gravitational circulation and tidal straining, related to increased stratification. This implies that perhaps gravitational circulation and tidal straining tend to be more sensitive to depth variation in systems with higher spring–neap variability compared to systems that tend to remain mixed or stratified in time. As the main driver of increased SWI within the Ham Luong channel (as well as others), approximately 10 km of additional SWI can be directly associated with riverbed level incision (Fig. 13). Although changes in SWI is often associated with sea level rise and global climate change, this detailed study of salinity in an Asian mega-delta emphasizes the fact that riverbed level changes have been the key determinant of changes in SWI in the VMD (also see Eslami et al., 2019b).
This study has provided a new understanding of the physical processes that dominate SWI in the Mekong Delta. This was done by carrying out field measurements and applying a novel 2DV–3D numerical modelling of the entire Mekong Delta and a large part of its continental shelf (70 km offshore) that could reproduce various observed salinity patterns. This facilitated efficient integrated modelling of the shelf processes, estuarine channels, and the complicated irrigation system. Amid the 2016 drought and extreme SWI within the VMD, we measured estuarine salinity structure along two lower distributary channels of the Hau River. We observed significant estuarine variability between neap (strongly stratified) and spring (partially mixed to well-mixed) tides. It was shown that most of the estuarine channels of the VMD follow the strong spring–neap variability, except the lower My Tho distributary channels that demonstrate a more mixed system. We quantified increased stratification during the neap tide as leading to estuarine circulation dominating upstream salt transport during the neap tide. In the transition to spring tide, tidal straining stimulates upstream salt flux, but as we reach the spring tide, with increased mixing (reduced stratification), down-estuary advective salt flux dominates and flushes salinity. Studying salt fluxes showed that salt transport in the system is a 3D phenomenon.
Moreover, the system is significantly sensitive to external forces. This study, for the first time, showed that subtidal ocean surge can impact the temporal variation of salinity by up to 20 %. During the dry season, typical variations (20–40 cm) in surge showed a larger (5–10 km) impact on SWI than typical variations (1000–2000 m3 s−1) in upstream discharge (2–5 km). The Mekong estuarine system demonstrated short (a few days) flushing and transition times in response to subtidal variations (e.g. ocean surge or discharge variations). A discharge pulse at Kratie (Cambodia) travels to the delta in 3–4 d and its effect lasts 3–4 d longer than the pulse itself. The ocean surge, however, leads to a nearly immediate response in SWI, and because of its rebound effect on discharge, its impact was felt for twice as long as the surge period itself.
The complexity and three-dimensionality of salt transport mechanisms in this deltaic system demand a 3D model to capture the delicate temporal variations of upstream salt transport. The sensitivity of salinity to ocean–estuary interaction at the mouth, with the processes within the continental shelf highly impacting the estuarine system dynamics, demands a model that extends far offshore to integrate both barotropic and baroclinic interactions of the inland–coastal system. Therefore, although analytical and 1D numerical models are useful for studying general trend dynamics, to analyse or forecast salinity within the delta, using a 3D integrated (inland–coastal) numerical domain that incorporates all processes will eventually perhaps be necessary.
This study also emphasizes the importance of riverbed levels in controlling SWI. By modelling SWI during the dry season of 2016 with the recent (2018) and old (2008) bathymetries, we showed the significance of riverbed level changes for 3D processes of SWI within the VMD. Although upstream dams, by altering the hydrological cycle, do have a significant impact on freshwater supply to the Mekong Delta, the delta itself is far more vulnerable to external forces (e.g. drought) due to its deeper channels, driven by sediment deprivation from upstream dams and shear amounts of sand mining within the delta. This is substantial further evidence suggesting that riverbed levels are essential assets to preserve livelihood and the way of life within the Mekong Delta.
DFlow-FM is an open-source numerical model available at https://oss.deltares.nl/web/delft3dfm (Deltares Open Source Softwares, 2021). The underlying gauge data (observed water level, discharge, and salinity) provided by the SIWRP, following the organizational policy, can be provided upon request for non-commercial use. The wind data originally developed by NCEP/NOAA can be downloaded from the DHI repository at https://www.metocean-on-demand.com/#/main (DHI metocean data portal, 2021). The geometry data on the network of primary and secondary channels can only be provided in direct communication with the SIWRP. The 2008 bathymetry data are partly received from the Mekong River Commission at https://portal.mrcmekong.org/data-catalogue (Mekong River Commission (MRC) data portal, 2021) and partly received from the SIWRP; the 2018 contemporary bathymetry data can be downloaded from https://hydra.hull.ac.uk/resources/hull:17952 (Vasilopoulos et al., 2018). Nevertheless, all the data and models that cannot be directly accessed by the public can be provided to the reviewers for any validation or reproduction.
SE coordinated efforts of various parties, carried out formal analysis, set up the salinity measurement field campaign and models, pre-processed, post-processed, and visualized the data, and led the paper draft. PH and MVdV were responsible for funding acquisition, supervision, and review of the research and paper. SEA, together with MVdV and PH, conceptualized the study. HWJK and AvD supported software application and conducted the required numerical model development and update at various stages. HWJK contributed to the writing and reviewed the paper, and AvD reviewed the final draft. GV carried out the field measurement of bathymetry, prepared the bathymetry for application in the modelling exercise, and reviewed and edited the final paper. DDD provided resources and reviewed the findings and the writing, while NNT and TTQ supported the investigation, analysis, and model set-up, as well as reviewing the findings and the writing. LB assisted during the field campaign and pre-processing and post-processing of the data, as well as leading the video abstract development and reviewing the final paper. HNN facilitated and coordinated the salinity and bathymetry measurement field campaigns and reviewed the final paper. SED and DRP facilitated the funding acquisition for the bathymetry field campaign, supervised the bathymetry development, and contributed to the writing of the final paper.
The authors declare that they have no conflict of interest.
Publisher's note: Copernicus Publications remains neutral with regard to jurisdictional claims in published maps and institutional affiliations.
We would like to show our gratitude to Le Quan amongst other colleagues at SIWRR for their sincere support during the field campaign and our stay in the city of Dai Ngai. Without their support, this study would not be possible. Special thanks to the personnel of the Southern Institute for Water Resources Planning (Ho Chi Minh City, Vietnam) for openly supporting the project during its development. We are grateful to Jasper RFW Leuven for his support through the toughest times of the field campaign. We sincerely appreciate how DHI supported our research by generously providing us with wind, water level, and velocity data in the coastal waters.
This research is part of the “Rise and Fall” project, funded by NWO-WOTRO (W 07.69.105), Urbanizing Deltas of the World-1 (UDW1). The 2018 bathymetric data were acquired with support from NERC under two distinct projects referenced as NE/S002847/1 and NE/P014704/1.
This paper was edited by Paola Passalacqua and reviewed by two anonymous referees.
Abood, K. A.: Circulation in the Hudson estuary, edited by: O. A. Roels, Hudson River Colloquium, 250, 38–111, 1974.
Banas, N. S., Hickey, B. M., MacCready, P., and Newton, J. A.: Dynamics of Willapa Bay, Washington: A Highly Unsteady, Partially Mixed Estuary, J. Phys. Oceanogr., 34, 2413–2427, https://doi.org/10.1175/JPO2637.1, 2004.
Brunier, G., Anthony, E. J., Goichot, M., Provansal, M., and Dussouillez, P.: Recent morphological changes in the Mekong and Bassac river channels, Mekong delta: The marked impact of river-bed mining and implications for delta destabilisation, Geomorphology, 224, 177–191, https://doi.org/10.1016/j.geomorph.2014.07.009, 2014.
Bucx, T., van Driel, W., de Boer, H., Graas, S., Langenberg, V. T., Marchand, M., and van de Guchte, C.: Comparative assessment of the vulnerability and resilience of deltas—extended version with 14 deltas—synthesis report, available at: https://library.wur.nl/WebQuery/wurpubs/fulltext/344952 (last access: 29 July 2021), 2014.
Burchard, H. and Hetland, R. D.: Quantifying the Contributions of Tidal Straining and Gravitational Circulation to Residual Circulation in Periodically Stratified Tidal Estuaries, J. Phys. Oceanogr., 40, 1243–1262, https://doi.org/10.1175/2010JPO4270.1, 2010.
Buschman, F. A., Hoiting, A. J. F., van der Vegt, M., and Hoekstra, P.: Subtidal flow division at a shallow tidal junction, Water Resour. Res., 46, https://doi.org/10.1029/2010WR009266, 2010.
CGIAR Research Centers in Southeast Asia: The drought and salinity intrusion in the Mekong River Delta of Vietnam, International Center for Tropical Agriculture (CIAT), Hanoi, Vietnam, 2016.
Deltares Open Source Softwares: Delft3D Flexible Mesh, available at: https://oss.deltares.nl/web/delft3dfm, last access: 29 July 2021.
DHI metocean data portal: https://www.metocean-on-demand.com/#/main, last access: 29 July 2021.
Díez-Minguito, M., Contreras, E., Polo, M. J., and Losada, M. A.: Spatio-temporal distribution, along-channel transport, and post-riverflood recovery of salinity in the Guadalquivir estuary (SW Spain), J. Geophys. Res.-Oceans, 118, 2267–2278, https://doi.org/10.1002/jgrc.20172, 2013.
Doan, V. B., Kantoush, S., Sumi, T., Nguyen, P. M., and Vinh, L. V.: Field investigation on river bed changes and salinity intrusion along Tien and Hau Rivers in Vietnamese Mekong Delta considering upstream dams' impacts, in: DPRI Annuals, Kyoto Univerisyt, Tokyo, Japan, available at: http://www.dpri.kyoto-u.ac.jp/hapyo/18/ (last access: 29 July 2021), 2018.
Dyer, K.: Estuaries, a physical introduction, 2nd edn., John Wiley & Sons ltd., Chichester, England, 1997.
Echezuría, H., Córdova, J., González, M., González, V., Méndez, J., and Yanes, C.: Assessment of environmental changes in the Orinoco River delta, Reg. Environ. Change, 3, 20–35, https://doi.org/10.1007/s10113-001-0038-4, 2002.
Eckart, C. H.: The equation of state of water and sea water at low temperatures and pressures, Part 2 of Properties of water, Am. J. Sci., 256, 225–240, https://doi.org/10.2475/ajs.256.4.225, 1958.
Erban, L. E., Gorelick, S. M., and Zebker, H. A.: Groundwater extraction, land subsidence, and sea-level rise in the Mekong Delta, Vietnam, Environ. Res. Lett., 9, 084010, https://doi.org/10.1088/1748-9326/9/8/084010, 2014.
Eslami, S., Hoekstra, P., Kernkamp, H., Trung, N. N., Do Duc, D., Quang, T. T., Februarianto, M., Van Dam, A. and van der Vegt, M.: Flow Division Dynamics in the Mekong Delta: Application of a 1D-2D Coupled Model, Water, 11, https://doi.org/10.3390/w11040837, 2019a.
Eslami, S., Hoekstra, P., Nguyen Trung, N., Ahmed Kantoush, S., Van Binh, D., Duc Dung, D., Tran Quang, T., and van der Vegt, M.: Tidal amplification and salt intrusion in the Mekong Delta driven by anthropogenic sediment starvation, Sci. Rep.-UK, 9, 18746, https://doi.org/10.1038/s41598-019-55018-9, 2019b.
Fan, H., He, D., and Wang, H.: Environmental consequences of damming the mainstream lancang-mekong river: A review, Earth-Sci. Rev., 146, 77–91, https://doi.org/10.1016/j.earscirev.2015.03.007, 2015.
Fischer, H. B.: Mixing and Dispersion in Estuaries, Annu. Rev. Fluid Mech., 8, 107–133, https://doi.org/10.1146/annurev.fl.08.010176.000543, 1976.
Geyer, W. R. and MacCready, P.: The Estuarine Circulation, Annu. Rev. Fluid Mech., 46, 130829112240001, https://doi.org/10.1146/annurev-fluid-010313-141302, 2013.
Godin, G.: The analysis of tides, University of Toronto, Toronto, 1972.
Gong, W. and Shen, J.: The response of salt intrusion to changes in river discharge and tidal mixing during the dry season in the Modaomen Estuary, China, Cont. Shelf Res., 31, 769–788, https://doi.org/10.1016/j.csr.2011.01.011, 2011a.
Gong, W. and Shen, J.: The response of salt intrusion to changes in river discharge and tidal mixing during the dry season in the Modaomen Estuary, China, Cont. Shelf Res., 31, 769–788, https://doi.org/10.1016/j.csr.2011.01.011, 2011b.
Gugliotta, M., Saito, Y., Nguyen, V. L., Ta, T. K. O., Nakashima, R., Tamura, T., Uehara, K., Katsuki, K., and Yamamoto, S.: Process regime, salinity, morphological, and sedimentary trends along the fluvial to marine transition zone of the mixed-energy Mekong River delta, Vietnam, Cont. Shelf Res., 147, 7–26, https://doi.org/10.1016/j.csr.2017.03.001, 2017.
Hansen, D. V. and Rattray, M.: Gravitational circulation in straits and estuaries, J. Mar. Res., 23, 104–122, https://doi.org/10.1098/rspb.2009.2214, 1965.
Henrie, K. and Valle-Levinson, A.: Subtidal variability in water levels inside a subtropical estuary, J. Geophys. Res.-Oceans, 119, 7483–7492, https://doi.org/10.1002/2014JC009829, 2014.
Hetland, R. D. and Geyer, W. R.: An Idealized Study of the Structure of Long, Partially Mixed Estuaries, J. Phys. Oceanogr., 34, 2677–2691, https://doi.org/10.1175/JPO2646.1, 2004.
Hoeppner, S. S., Shaffer, G. P., and Perkins, T. E.: Through droughts and hurricanes: Tree mortality, forest structure, and biomass production in a coastal swamp targeted for restoration in the Mississippi River Deltaic Plain, Forest Ecol. Manag., 256, 937–948, https://doi.org/10.1016/j.foreco.2008.05.040, 2008.
IFRC: Vietnam – Drought and Saltwater Intrusion Emergency Plan of Action, Situation Report, available at: https://reliefweb.int/report/viet-nam/vietnam-drought-and-saltwater-intrusion-emergency-plan-action-epoa-dref-operation-0 (last access: 29 July 2021), 2020.
Jay, D. A.: Estuarine variability, in: Contemporary Issues in Estuarine Physics, edited by: Valle-Levinson, A., Cambridge University Press, New York, 62–99, 2010.
Jay, D. A. and Dungan Smith, J.: Residual circulation in shallow estuaries: 1. Highly stratified, narrow estuaries, J. Geophys. Res., 95, https://doi.org/10.1029/JC095iC01p00711, 1990a.
Jay, D. A. and Dungan Smith, J.: Residual circulation in shallow estuaries: 2. Weakly stratified and partially mixed, narrow estuaries, J. Geophys. Res.-Oceans, 95, 733–748, https://doi.org/10.1029/JC095iC01p00733, 1990b.
Jay, D. A. and Dungan Smith, J.: Circulation, density distribution and neap-spring transitions in the Columbia River Estuary, Prog. Oceanogr., 25, 81–112, https://doi.org/10.1016/0079-6611(90)90004-L, 1990c.
Jay, D. A. and Musiak, J. D.: Particle trapping in estuarine tidal flows, J. Geophys. Res., 99, 20445, https://doi.org/10.1029/94JC00971, 1994.
Kantoush, S., Binh, D. van, Sumi, T., and Trung, L. V.: Impact of upstream hydropower dams and climate change on hydrodynamics of Vietnamese Mekong Delta, J. Japan Soc. Civ. Eng. Ser. B1 Hydraulic Eng., 73, 109–114, https://doi.org/10.2208/jscejhe.73.I_109, 2017.
Kernkamp, H. W. J., Van Dam, A., Stelling, G. S., and De Goede, E. D.: Efficient scheme for the shallow water equations on unstructured grids with application to the Continental Shelf, Ocean Dynam., 61, 1175–1188, https://doi.org/10.1007/s10236-011-0423-6, 2011.
Khang, N. D., Kotera, A., Sakamoto, T., and Yokozawa, M.: Sensitivity of Salinity Intrusion to Sea Level Rise and River Flow Change in Vietnamese Mekong Delta-Impacts on Availability of Irrigation Water for Rice Cropping, J. Agric. Meteorol., 64, 167–176, https://doi.org/10.2480/agrmet.64.3.4, 2008.
Koehnken, L.: Discharge Sediment Monitoring Project (DSMP) 2009–2013: Summary & Analysis of Results Final Report, Mekong River Commission, Vientiane, Lao PDR, available at: http://portal.mrcmekong.org/assets/documents/Report-workshop/Technical-Report_DSMP/DSMP-Report-2009_13-Final-Report-July-2014.pdf (last access: 29 July 2021), 2014.
Kondolf, G. M., Rubin, Z. K., and Minear, J. T.: Dams on the Mekong: Cumulative sediment starvation, Water Resour. Res., 50, 5158–5169, https://doi.org/10.1002/2013WR014651, 2014.
Kondolf, G. M., Schmitt, R. J. P., Carling, P., Darby, S., Arias, M., Bizzi, S., Castelletti, A., Cochrane, T. A., Gibson, S., Kummu, M., Oeurng, C., Rubin, Z., and Wild, T.: Changing sediment budget of the Mekong: Cumulative threats and management strategies for a large river basin, Sci. Total Environ., 625, 114–134, https://doi.org/10.1016/j.scitotenv.2017.11.361, 2018.
Kramer, S. C. and Stelling, G. S.: A conservative unstructured scheme for rapidly varied flows, Int. J. Numer. Meth. Fl., 58, 183–212, https://doi.org/10.1002/fld.1722, 2008.
Kumiko, T., Takao, M., and Toru, M.: Seasonal changes in radiation and evaporation implied from the diurnal distribution of rainfall in the Lower Mekong, Hydrol. Process., 22, 1257–1266, https://doi.org/10.1002/hyp.6935, 2008.
Kummu, M., Lu, X. X., Wang, J. J., and Varis, O.: Basin-wide sediment trapping efficiency of emerging reservoirs along the Mekong, Geomorphology, 119, 181–197, https://doi.org/10.1016/j.geomorph.2010.03.018, 2010.
Kummu, M., Tes, S., Yin, S., Adamson, P., Józsa, J., Koponen, J., Richey, J., and Sarkkula, J.: Water balance analysis for the Tonle Sap Lake-floodplain system, Hydrol. Process., 28, 1722–1733, https://doi.org/10.1002/hyp.9718, 2014.
Lerczak, J. A., Geyer, W. R., and Ralston, D. K.: The Temporal Response of the Length of a Partially Stratified Estuary to Changes in River Flow and Tidal Amplitude, J. Phys. Oceanogr., 39, 915–933, https://doi.org/10.1175/2008JPO3933.1, 2009.
Lewis, R. E. and Lewis, J. O.: The principal factors contributing to the flux of salt in a narrow, partially stratified estuary, Estuar. Coast. Shelf S., 16, 599–626, https://doi.org/10.1016/0272-7714(83)90074-4, 1983.
Li, D., Long, D., Zhao, J., Lu, H., and Hong, Y.: Observed changes in flow regimes in the Mekong River basin, J. Hydrol., 551, 217–232, https://doi.org/10.1016/j.jhydrol.2017.05.061, 2017.
Liu, W.-C., Hsu, M.-H., Wu, C.-R., and Kuo, A. Y.: Modeling Salt Water Intrusion in Tanshui River Estuarine System – Case Study Contrasting Now and Then, J. Hydraul. Eng., 130, 849–859, 2004.
Lu, X. X., Li, S., Kummu, M., Padawangi, R., and Wang, J. J.: Observed changes in the water flow at Chiang Saen in the lower Mekong: Impacts of Chinese dams?, Quatern Int., 336, 145–157, https://doi.org/10.1016/j.quaint.2014.02.006, 2014.
Mac Cready, P. and Geyer, W. R.: Advances in Estuarine Physics, MC, Annu. Rev. Mar. Sci., 2, 35–58 available at: http://www.annualreviews.org/toc/marine/2/1 (last access: 29 July 2021), 2010.
Manh, N. Van, Dung, N. V., Hung, N. N., Kummu, M., Merz, B., and Apel, H.: Future sediment dynamics in the Mekong Delta floodplains: Impacts of hydropower development, climate change and sea level rise, Global Planet. Change, 127, 22–33, https://doi.org/10.1016/j.gloplacha.2015.01.001, 2015.
Martyr-Koller, R. C., Kernkamp, H. W. J., van Dam, A., Van Der Wegen, M., Lucas, L. V., Knowles, N., Jaffe, B., and Fregoso, T. A.: Application of an unstructured 3D finite volume numerical model to flows and salinity dynamics in the San Francisco Bay-Delta, Estuar. Coast. Shelf S., 192, 86–107, https://doi.org/10.1016/j.ecss.2017.04.024, 2017.
Mekong River Commission: State of the Basin Report 2010, MRC, Vientiane, Lao PDR, 2010.
Mekong River Commission (MRC) data portal, available at: https://portal.mrcmekong.org/data-catalogue, last access: 29 July 2021.
Minderhoud, P. S. J., Erkens, G., Pham, V. H., Bui, V. T., Erban, L., Kooi, H., and Stouthamer, E.: Impacts of 25 years of groundwater extraction on subsidence in the Mekong delta, Vietnam, Environ. Res. Lett., 12, 064006, https://doi.org/10.1088/1748-9326/aa7146, 2017.
Minderhoud, P. S. J., Coumou, L., Erkens, G., Middelkoop, H., and Stouthamer, E.: Mekong delta much lower than previously assumed in sea-level rise impact assessments, Nat. Commun., 10, 3847, https://doi.org/10.1038/s41467-019-11602-1, 2019.
Monismith, S. G., Kimmerer, W., Burau, J. R., and Stacey, M. T.: Structure and Flow-Induced Variability of the Subtidal Salinity Field in Northern San Francisco Bay, J. Phys. Oceanogr., 32, 3003–3019, https://doi.org/10.1175/1520-0485(2002)032<3003:SAFIVO>2.0.CO;2, 2002.
MRC: Assessment of Basin-wide Development Scenarios, Basin Dev. Plan Program. Phase 2, (April), Mekong River Commission, Vientianne, Lao PDR, available at: https://www.mrcmekong.org/assets/Publications/basin-reports/BDP-Assessment-of-Basin-wide-Dev-Scenarios-2011.pdf (last access: 3 August 2021), 2011.
Nash, J. E. and Sutcliffe, J. V.: River Flow Forecasting Through Conceptual Models Part I–a Discussion of Principles, J. Hydrol., 10, 282–290, https://doi.org/10.1016/0022-1694(70)90255-6, 1970.
Nguyen, A. D. and Savenije, H. H.: Salt intrusion in multi-channel estuaries: a case study in the Mekong Delta, Vietnam, Hydrol. Earth Syst. Sci., 10, 743–754, https://doi.org/10.5194/hess-10-743-2006, 2006.
Nguyen, A. D., Savenije, H. H. G., Pham, D. N., and Tang, D. T.: Using salt intrusion measurements to determine the freshwater discharge distribution over the branches of a multi-channel estuary: The Mekong Delta case, Estuar. Coast. Shelf S., 77, 433–445, https://doi.org/10.1016/j.ecss.2007.10.010, 2008.
Nguyen, T. V and Tanaka, H.: Study on the Effect of Morphology Change on Salinity Distribution in the Dinh An Estuary, Lower Mekong River of Vietnam, J. Coast. Res., 268–272, available at: http://www.jstor.org/stable/26481596 (last access: 3 August 2021), 2007.
Nguyen, Y. T. B., Kamoshita, A., Dinh, V. T. H., Matsuda, H., and Kurokura, H.: Salinity intrusion and rice production in Red River Delta under changing climate conditions, Paddy Water Environ., 15, 37–48, https://doi.org/10.1007/s10333-016-0526-2, 2017.
Nichols, M. and Biggs, R.: Estuaries, in: Coastal Sedimentary environment, edited by: Davis, R. A., Springer-Verlag, New York, NY, ISBN 978-1-4612-5078-4, 77–186, https://doi.org/10.1007/978-1-4612-5078-4, 1985.
Nowacki, D. J., Ogston, A. S., Nittrouer, C. A., Fricke, A. T., and Van, P. D. T.: Sediment dynamics in the lower Mekong River: Transition from tidal river to estuary, J. Geophys. Res.-Oceans, 120, 6363–6383, https://doi.org/10.1002/2015JC010754, 2015.
Prandle, D.: Salinity intrusion in partially mixed estuaries, Estuar. Coast. Shelf S., 59, 385–397, 2004.
Prichard, D. W.: Structure of Coastal Plain Estuary, J. Mar. Res., 33–42, 1956.
Rabbani, G., Rahman, A., and Mainuddin, K.: Salinity-induced loss and damage to farming households in coastal Bangladesh, Int. J. Global Warm., 5, 400–415, https://doi.org/10.1504/IJGW.2013.057284, 2013.
Ralston, D. K. and Geyer, W. R.: Response to Channel Deepening of the Salinity Intrusion, Estuarine Circulation, and Stratification in an Urbanized Estuary, J. Geophys. Res.-Oceans, 124, 4784–4802, https://doi.org/10.1029/2019JC015006, 2019.
Ralston, D. K., Geyer, W. R., and Lerczak, J. A.: Structure, variability, and salt flux in a strongly forced salt wedge estuary, J. Geophys. Res.-Oceans, 115, C06005, https://doi.org/10.1029/2009JC005806, 2010.
Räsänen, T. A., Someth, P., Lauri, H., Koponen, J., Sarkkula, J., and Kummu, M.: Observed river discharge changes due to hydropower operations in the Upper Mekong Basin, J. Hydrol., 545, 28–41, https://doi.org/10.1016/j.jhydrol.2016.12.023, 2017.
Rodi, W.: Turbulence models and their application in hydraulics: A state-of-the-art review, third edn., Taylor & Francis Group, London, 1993.
Sassi, M. G., Hoitink, A. J. F., De Brye, B., Vermeulen, B., and Deleersnijder, E.: Tidal impact on the division of river discharge over distributary channels in the Mahakam Delta, Ocean Dynam., 61, 2211–2228, https://doi.org/10.1007/s10236-011-0473-9, 2011.
Savenije, H. H. G.: A one-dimensional model for salinity intrusion in alluvial estuaries, J. Hydrol., 85, 87–109, https://doi.org/10.1016/0022-1694(86)90078-8, 1986.
Savenije, H. H. G.: Salinity and tides in alluvial estuaries, Elsevier, Amsterdam, 2005.
Savenije, H. H. G.: Salinity and tides in alluvial estuaries, 2nd edn., Delft University of Technology, Delft, 2012.
Simpson, J., Brown, J., Matthews, J., and Allen, G.: Tidal straining, density currents, and stirring in the control of estuarine stratification, Estuaries, 13, 125–32, 1990.
Simpson, J. H., Vennell, R., and Souza, A. J.: The Salt Fluxes in a Tidally-Energetic Estuary, Estuar. Coast. Shelf S., 52, 131–142, https://doi.org/10.1006/ecss.2000.0733, 2001.
Smajgl, A., Toan, T. Q., Nhan, D. K., Ward, J., Trung, N. H., Tri, L. Q., Tri, V. P. D., and Vu, P. T.: Responding to rising sea levels in the Mekong Delta, Nat. Clim. Change, 5, 167–174, https://doi.org/10.1038/nclimate2469, 2015.
Takeda, M., Laphimsing, A., and Putthividhya, A.: Dry season water allocation in the Chao Phraya River basin, Thailand, Int. J. Water Resour. D., 32, 321–338, https://doi.org/10.1080/07900627.2015.1055856, 2016.
Thi Ha, D., Ouillon, S., and Van Vinh, G.: Water and Suspended Sediment Budgets in the Lower Mekong from High-Frequency Measurements (2009–2016), Water, 10, 846, https://doi.org/10.3390/w10070846, 2018.
Tran Anh, D., Hoang, P. L., Bui, D. M., and Rutschmann, P.: Simulating Future Flows and Salinity Intrusion Using Combined One- and Two-Dimensional Hydrodynamic Modelling—The Case of Hau River, Vietnamese Mekong Delta, Water, 10, 897, https://doi.org/10.3390/w10070897, 2018.
Tran, Q. D., Nguyen, H. T., Likitdecharote, K., and Srisatit, T.: Modeling the Influence of River Discharge and Sea Level Rise on Salinity Intrusion in Mekong Delta, Proceedings of the 1st Asia international Conference “Environmental supporting in food and energy security: crisis and opportunity”, Bangkok, Thailand, 2011.
Uncles, R. J., Elliott, R. C. A., and Weston, S. A.: Observed fluxes of water, salt and suspended sediment in a partly mixed estuary, Estuar. Coast. Shelf S., 20, 147–167, https://doi.org/10.1016/0272-7714(85)90035-6, 1985.
UNDP-Vietnam: Vietnam Drought and Saltwater Intrusion: Transitioning from Emergency to Recovery. Analysis Report and Policy Implications, available at: https://reliefweb.int/report/viet-nam/viet-nam-drought-and-saltwater-intrusion-situation-update-no-2-14-april-2016 (last access: 3 August 2021), United Nations, Ha Noi, Vietnam, 2016.
UNESCO: The Practical Salinity Scale 1978 and the International Equation of State of Seawater 1980, Unesco Tech. Pap. Mar. Sci., 36, Pergamon Press Ltd., Oxford, United Kingdom, 1981.
United Nations Resident Coordinator-Vietnam: Vietnam: Drought and Saltwater Intrusion Situation Update No. 2 (as of 14 April 2016), available at: https://reliefweb.int/report/viet-nam/viet-nam-drought-and-saltwater-intrusion-situation-update-no-2-14-april-2016, United Nations, Ha Noi, Vietnam, 2016.
Valle-Levinson, A.: Contemporary issues in Estuarine physics, Cambridge University Press, New York, 2010.
Van Pham, H., Van Geer, F. C., Bui Tran, V., Dubelaar, W., and Oude Essink, G. H. P.: Paleo-hydrogeological reconstruction of the fresh-saline groundwater distribution in the Vietnamese Mekong Delta since the late Pleistocene, J. Hydrol. Reg. Stud., 23, 100594, https://doi.org/10.1016/j.ejrh.2019.100594, 2019.
Vasilopoulos, G., Parsons, D. R., and Le Quan, Q.: Vietnamese Mekong Delta Principle Channel Bed Elevations for 2018, University of Hull, available at: https://hydra.hull.ac.uk/resources/hull:17952 (last access: 4 August 2021), 2018.
Vasilopoulos, G., Quan, Q. L., Parsons, D. R., Darby, S. E., Tri, V. P. D., Hung, N. N., Haigh, I. D., Voepel, H. E., Nicholas, A. P., and Aalto, R.: Establishing sustainable sediment budgets is critical for climate-resilient mega-deltas, Environ. Res. Lett., 16, 64089, https://doi.org/10.1088/1748-9326/ac06fc, 2021.
Vu, D. T., Yamada, T., and Ishidaira, H.: Assessing the impact of sea level rise due to climate change on seawater intrusion in Mekong Delta, Vietnam, Water Sci. Technol., 77, 1632–1639, https://doi.org/10.2166/wst.2018.038, 2018.
Warner, J. C., Geyer, W. R., and Lerczak, J. A.: Numerical modeling of an estuary: A comprehensive skill assessment, J. Geophys. Res.-Oceans, 110, 1–13, https://doi.org/10.1029/2004JC002691, 2005.
Winterwerp, J. C. and Wang, Z. B.: Man-induced regime shifts in small estuaries—I: theory, Ocean Dynam., 63, 1279–1292, https://doi.org/10.1007/s10236-013-0662-9, 2013.
Zia, I., Zafar, H., Shahzad, M. I., Meraj, M., and Kazmi, J. H.: Assessment of sea water inundation along Daboo creek area in Indus Delta Region, Pakistan, J. Ocean U. China, 16, 1055–1060, https://doi.org/10.1007/s11802-017-3350-4, 2017.