the Creative Commons Attribution 4.0 License.
the Creative Commons Attribution 4.0 License.
 | 15 Mar 2022
Autogenic knickpoints in laboratory landscape experiments
Léopold de Lavaissière
Stéphane Bonnet
Anne Guyez
Philippe Davy
The upstream propagation of knickpoints in river longitudinal profiles is commonly assumed to be related to discrete changes in tectonics, climate or base level. However, the recognition that some knickpoints may form autogenically, independent of any external perturbation, may challenge these assumptions. We investigate here the genesis and dynamics of such autogenic knickpoints in laboratory experiments at the drainage basin scale, where landscapes evolved in response to constant rates of base level fall and precipitation. Despite these constant forcings, we observe that knickpoints regularly initiate in rivers at the catchments' outlet throughout the duration of experiments. The upstream knickpoint propagation rate does not decrease monotonically in relationship with the decrease in drainage area, as predicted by stream-power-based models, instead the propagation rate first increases until the mid-part of catchments before decreasing. To investigate the dynamics of the knickpoints, we calculated hydraulic information (water depth, river width, discharge and shear stress) using a hydrodynamic model. We show that knickpoint initiation at the outlet coincides with a fairly abrupt river narrowing entailing an increase in their shear stress. Then, once knickpoints have propagated upward, rivers widen causing a decrease in shear stress and incision rate, and making the river incision less than the base level fall rate. This creates an unstable situation which drives the formation of a new knickpoint. The experiments suggest a new autocyclic model of knickpoint generation controlled by river width dynamics independent of variations in climate or tectonics. This questions an interpretation of landscape records focusing only on climate and tectonic changes without considering autogenic processes.
- Article
(20140 KB) - Full-text XML
-
Supplement
(777 KB) - BibTeX
- EndNote


Knickpoints are discrete zones of steepened bed gradient that are commonly observed in river longitudinal profiles. Although they occasionally occur due to changes in bedrock properties (e.g., Duvall et al., 2004), in many cases they are dynamic features that propagate upstream along drainage networks (Whipple and Tucker, 1999; Kirby and Whipple, 2012; Whittaker and Boulton, 2012). In this latter case, they are commonly regarded as formed in response to variations in external forcing such as uplift rate, sea level or climate (e.g., Crosby and Whipple 2006; Berlin and Anderson, 2007; Kirby and Whipple, 2012; Whittaker and Boulton, 2012; Mitchell and Yanites, 2019), which opens up the possibility of using knickpoints in landscapes to identify such changes. Several studies have pointed out, however, that some knickpoints could be autogenic, that is to say internally generated without any variation in boundary conditions (e.g., Hasbargen and Paola, 2000, 2003; Finnegan and Dietrich, 2011). Understanding how knickpoints can form autogenically is therefore crucial for interpreting changes in external forcing from knickpoint occurrence in landscapes. Most observations of autogenic knickpoint formation come from experimental modeling (see for example Paola et al., 2009), their initiation being attributed to the amplification of local instabilities in flume (Scheingross et al., 2019) and drainage basin-scale (Hasbargen and Paola, 2000) experiments. In these latter experiments, for example, successive knickpoints initiated despite constant external forcing (base level fall and precipitation) throughout the duration of the runs, even when landscapes were on average at steady state in terms of sediment flux. Internal processes may also complexify the propagation of knickpoints as shown in the flume experiments of Cantelli and Muto (2014) and Grimaud et al. (2016), where a single discrete event of base level drop resulted in the propagation of multiple waves of knickpoints.
In this work, we consider the generation and dynamics of autogenic knickpoints in laboratory-scale drainage basin experiments forced by a constant rate of base level fall and steady precipitation. Such landscape experiments have been used successfully to explore how tectonics and climate impact erosion processes and the evolution of topography under controlled conditions (e.g., Hasbargen and Paola, 2000; Bonnet and Crave, 2003; Lague et al., 2003; Turowski et al., 2006; Bonnet, 2009; Singh et al., 2015; Sweeney et al., 2015; Moussirou and Bonnet, 2018). This approach allows for the observation of complex dynamics that are sometimes difficult to simulate numerically and sheds new light on the way natural landforms may evolve. Landscape experiments capture the tree-like structure of drainage networks, the supply of eroded material from hillslopes and especially their fluctuations, which is a natural complexity that is not reproduced in flume experiments, for example. The experiments presented here have been performed using a new setup specifically designed to investigate the evolution of a large, meter-long, single drainage basin under controlled forcing condition. In previous similar catchment-scale experiments (Hasbargen and Paola, 2000, 2003; Bigi et al., 2006; Rohais et al., 2012) the outlet location was pinned to a narrow motor-controlled gate used to simulate base level fall and which also set the river width at the outlet. A specificity of our setup here is to use a large gate instead of a narrow one, allowing experimental rivers to freely evolve downstream, with no constraints on their width. We report here results from experiments where successive knickpoints initiate near the outlet autogenically and propagate within drainage basins. The experiments show a new model of autogenic knickpoint initiation and propagation driven by downstream river width dynamics.
We present here results from three experiments – BL05, BL10 and BL15 – performed with different rates of base level fall of, respectively, 5, 10 and 15 mm h−1 (Table 1). The facility is a box with the dimensions 100 cm × 55 cm filled with silica paste (Fig. 1; see also Fig. S1 in the Supplement). At its front side, a sliding gate, 41 cm wide, drops down at a constant rate, acting as the base level. The initial surface consists of a plane with a counterslope of ∼3∘, opposite the base level side (Fig. 1c). During a run, runoff-induced erosion occurs in response to steady base level fall and rainfall (mean rainfall rate is 95 mm h−1 with a spatial coefficient of variation (standard deviation/mean) of 35 %). Incision initiates at some point along the base level and propagates upstream until complete dissection of the initial surface. Note that the counterslope of the initial surface allows separating the rainfall flux between the base level and the opposite side of the device, creating a water divide (Fig. 1b).
Table 1Parameters of experiments.
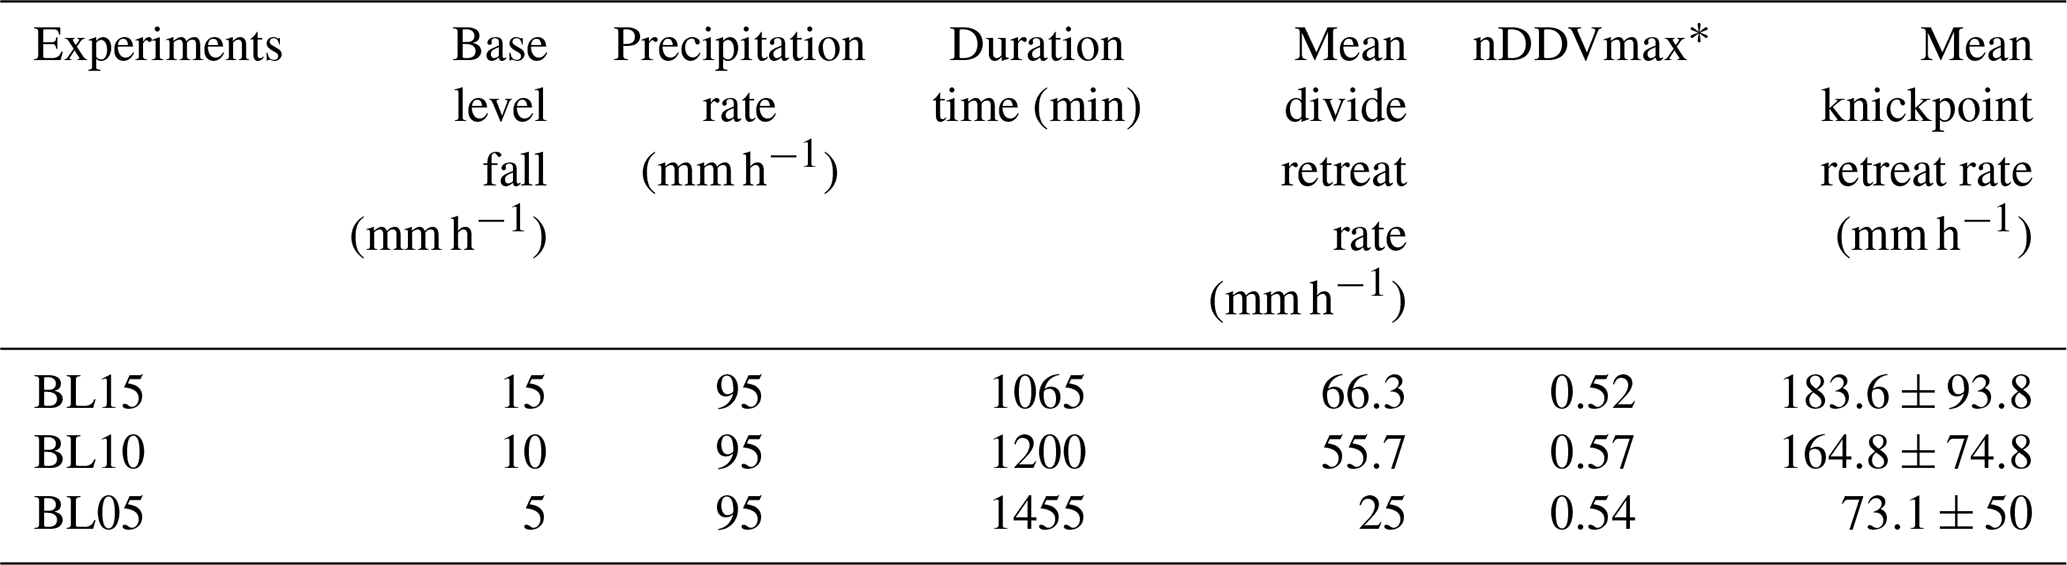
* nDDVmax: normalized distance of maximum knickpoint velocity.
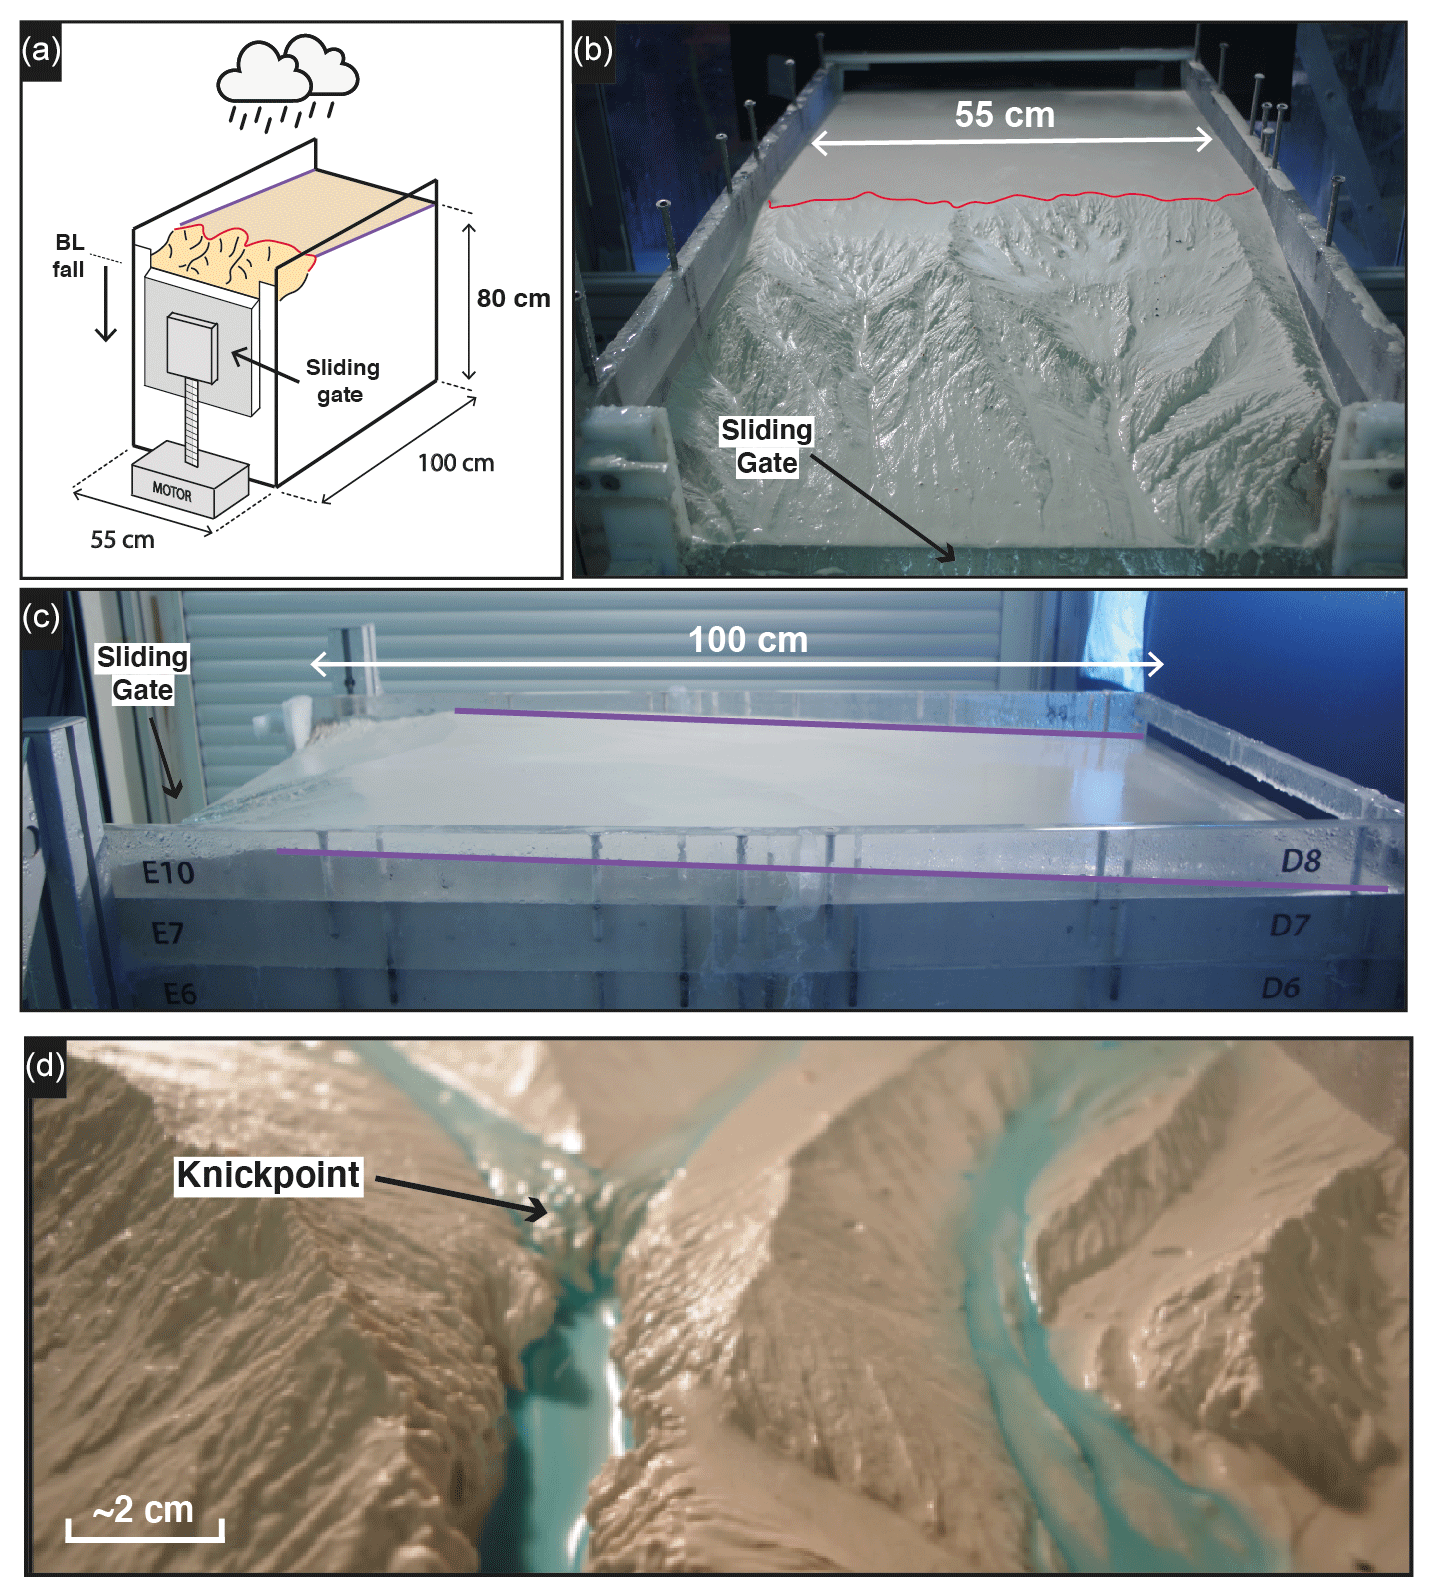
Figure 1Experimental setup. Purple and red lines show, respectively, the counterslope of the initial topography and the main water divide. (a) Sketch of the erosion box with the sliding gate, 41 cm wide, used to drop down the base level (BL). (b, c) Front and side photographs (experiments BL10 at 525 min and BL15 at 185 min). (d) Photograph of a typical knickpoint studied here.
Experiments were stopped every 5 min to digitize the topography using a laser sheet and to construct digital elevation models (DEMs) with a pixel size of 1 mm2. Longitudinal profiles and knickpoints were extracted with a semiautomatic procedure that had to be developed to process the ∼200 DEMs per experiment. For this purpose, we first extracted longitudinal profiles by finding the lowest elevation on successive rows (lines oriented parallel to the sliding gate) of each DEM within a 20 cm wide swath perpendicular to the sliding gate that included the main river (the one with the largest catchment for each experiment). Then the lowest elevation found in our search was plotted against distance down the long axis of the box. This procedure has already been applied by Baynes et al. (2018) and Tofelde et al. (2019). It may result in a slight overestimation in channel slope because it does not consider the obliquity of channels within the box in the distance calculation nor their sinuosity. However, these effects are of minor influence here because most channels are straight and roughly parallel to the long side of the box. In a second step, we computed the erosion rates by considering the elevation difference between each successive pairs of longitudinal profiles and we identified knickpoints as peaks in erosion rates with values above the steady erosion amount defined by the rate of base level fall (Fig. 2). We verified manually that this procedure defines knickpoints correctly by checking the computed positions on longitudinal profiles. We investigated in particular if the procedure is robust with respect to the time interval between successive profiles. We found that the record interval of 5 min is too small to produce well-defined erosional peaks, which lead us to identify knickpoint positions from a time interval of 10 min. Then, we built a first catalogue of knickpoint positions at different times from which we manually extract the successive positions of each individual knickpoint. We complemented the database by computing incremental retreat rates of knickpoints from their successive positions.

Figure 2Graph showing two successive longitudinal profiles of experiment BL10 taken at 10 min interval (a) and corresponding erosion rate profile (b). Triangles illustrate the position of erosional peaks taken as knickpoint position (black arrows). Red dashed line shows the rate of base level fall.
DEMs were also used to compute hydraulic information (water depth, river width, discharge and shear stress) using the Floodos hydrodynamic model of Davy et al. (2017; see also Baynes et al., 2018, 2020, for previous use of Floodos for analyzing laboratory experiments). Floodos is a precipitation-based model that calculates the 2D shallow water equations (SWEs) without inertia terms, from the routing of elementary water volumes on top of topography. We ran Floodos on successive DEMs of experiments by inputting the spatial distribution of precipitation, then generating several output raster products at the pixel size, including water depth, unit discharge and bed shear stress that were then used for the computation of hydrologic parameters (river width, specific discharge and shear stress). The solution of the SWE depends on the friction coefficient (C) that depends on water viscosity only for laminar flow; its theoretical value is m−1 s−1 at 10 ∘C (Baynes et al., 2018). To ensure that Floodos outputs (e.g., water depth raster maps) calculated using this value are consistent with actual experiment hydraulic conditions, we injected dye into the rainfall water during a run to catch the actual extent of water flow and make rivers visible. A visual comparison with Floodos results shows a good match between model outputs and experimental results (Fig. S2), which validates the numerical method and the expected theoretical friction coefficient C (Baynes et al., 2018). Given the difficulty of measuring the millimeter-scale water depth without perturbating the flow, river widths were extracted from Floodos DEM outputs by thresholding the water depth maps considering that river banks correspond to sharp variations in water depth. The water depth threshold was estimated by trial and error by comparing the rivers extracted from the calculation with direct observations on experiments where rainwater was colored by red dye (Fig. 3). A good visual agreement was obtained for a threshold value of the water depth between 0.1 and 0.5 mm, and a mid-value of 0.3 mm was then used for determining river widths.

Figure 3Impact of water depth threshold used to delineate river boundaries on estimated river widths. (a) Map views of water depths (blue colors) superimposed on DEM, for water depth threshold values between 0.025 and 1.5 mm. Red and purple lines show corresponding river widths for two rivers. Photo on the bottom right shows the active river width during the corresponding experimental run (“control run”), viewed by injecting red dye into the water used to generate the artificial rainfall. (b) Corresponding local river widths for the two sections shown by red and purple lines. A threshold value of between 0.1 and 0.5 mm shows a good similarity between rivers on water depth map and the control run. Here, a mid-value of 0.3 mm has been chosen for computing river widths.
3.1 Dynamics of knickpoint retreat
In each experiment, base level fall induces the growth of drainage networks by headward erosion and the progressive migration of a main water divide (Fig. 4). The migration rate of the divide is constant in each experiment (Fig. 5 and Table 1), and this value increases from 25 to 66 mm h−1 with a prescribed rate of base level fall of 5 to 15 mm h−1. The successive longitudinal profiles of the main river investigated in each experiment (Fig. 6) illustrate the growth of rivers as they propagate within the box. These profiles show alternations of segments with low and high slopes, the latter defining knickpoints. Knickpoints regularly initiate at the outlet throughout the duration of the runs in all experiments and propagate upward until they reach and merge with the divide, some profiles showing even several knickpoints that retreat simultaneously (Fig. 6). A characteristic of these knickpoints highlighted in Fig. 7 (see also Fig. 6) is that they generally initiate downstream with a gentle slope and gradually steepen as they migrate upstream. Their maximum slope is generally reached when they have propagated to the central part of the profiles (see below). Then the slope is maintained or slightly decreases during their retreat in the upper segment of the profiles.
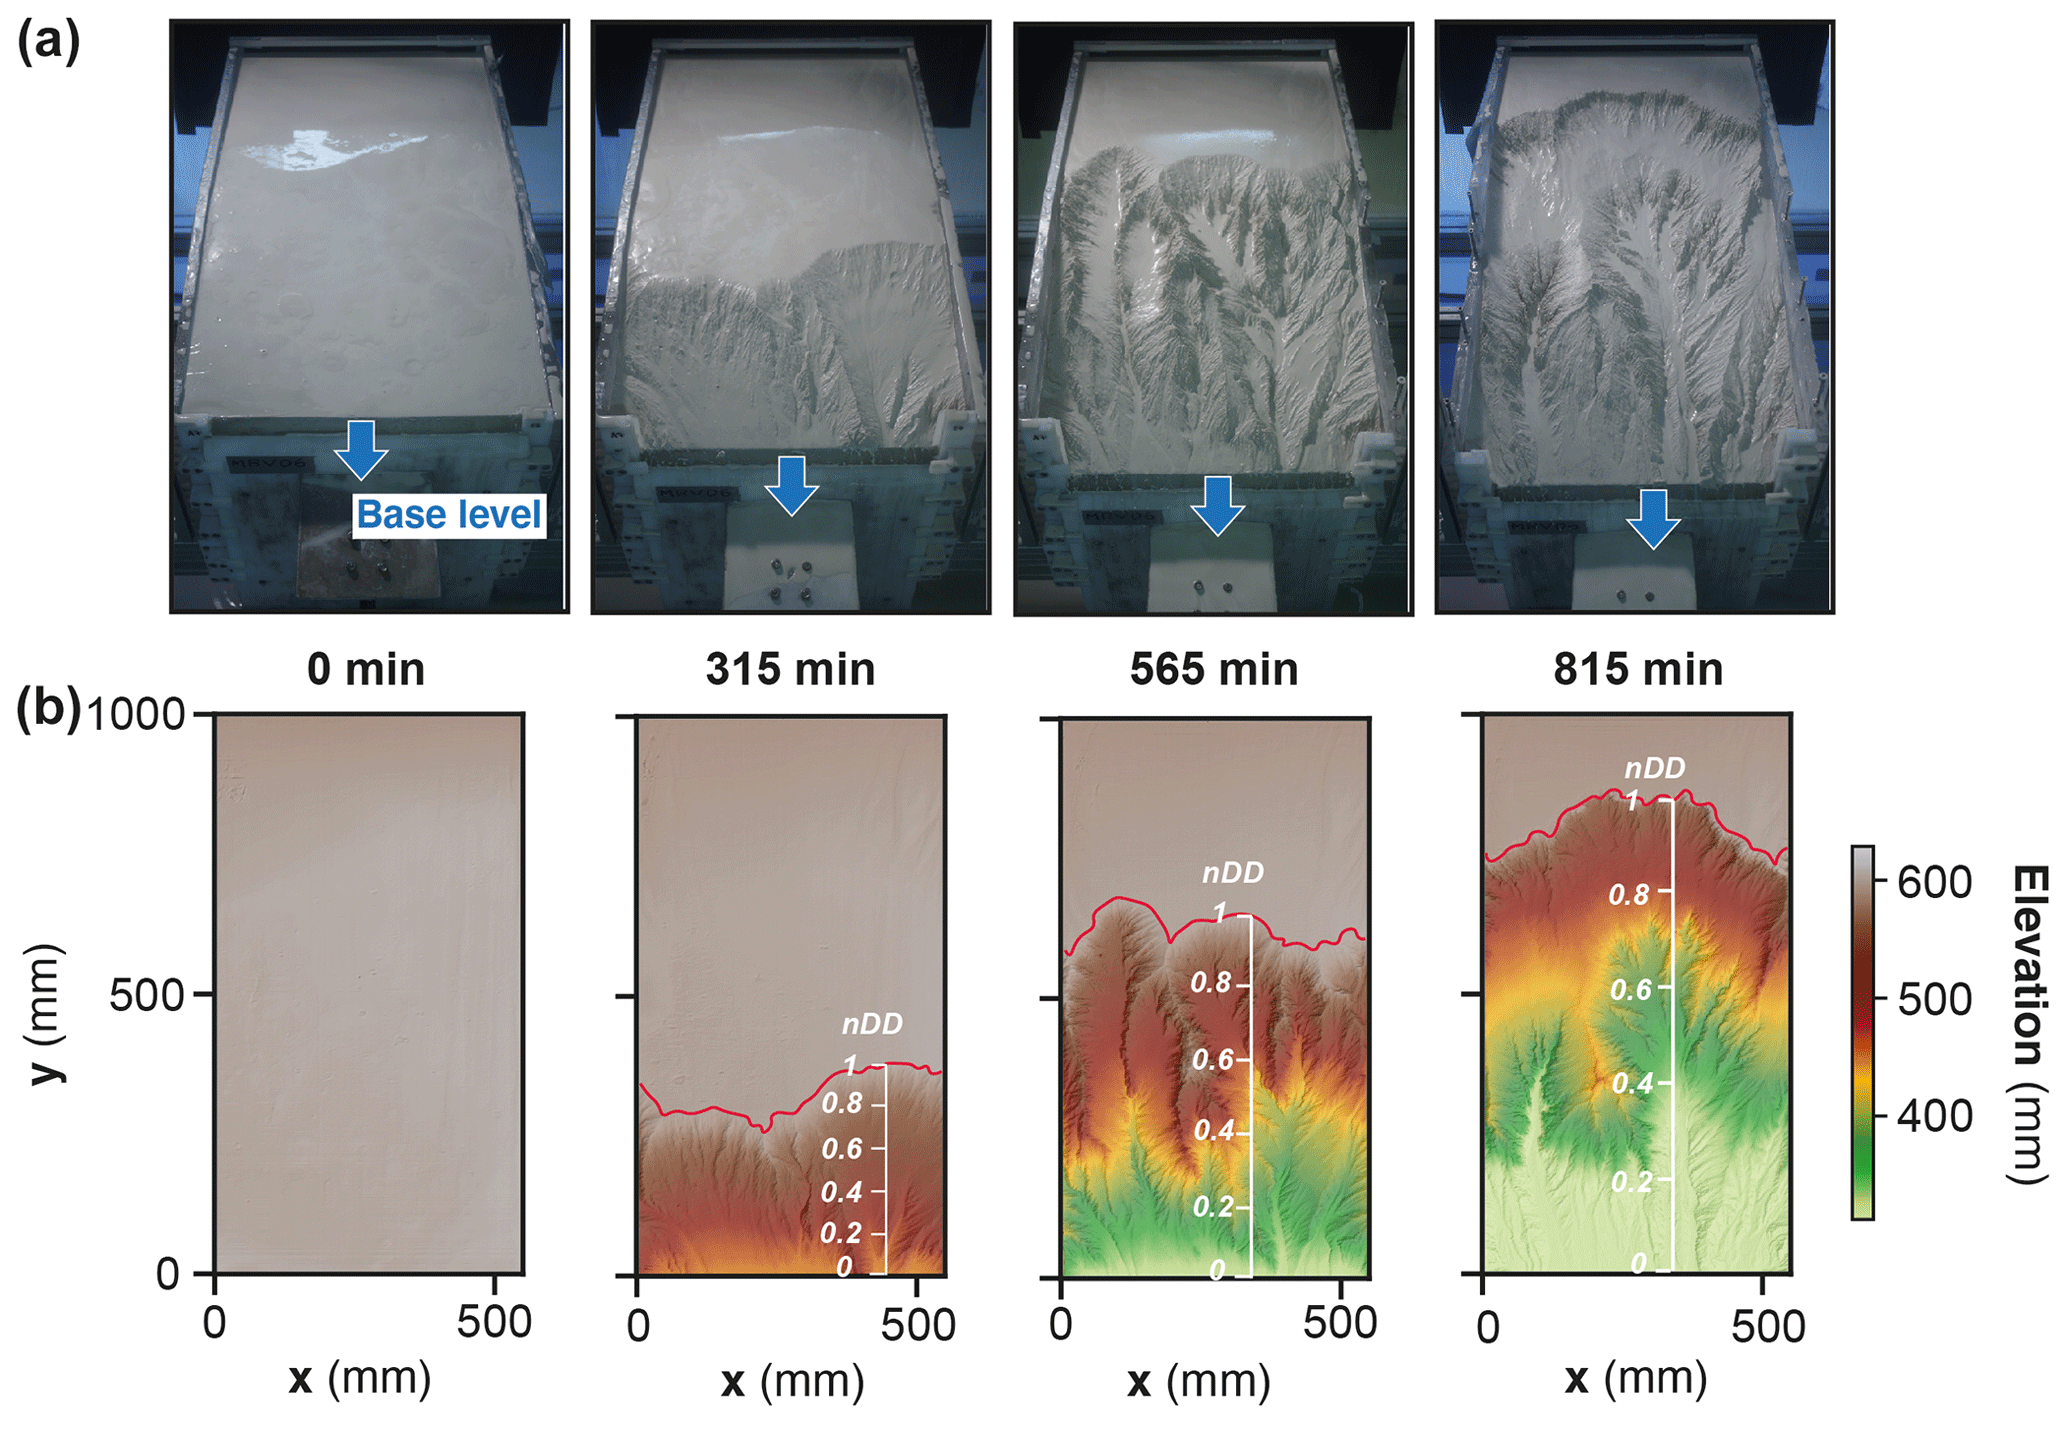
Figure 4Photos (a) and corresponding DEMs (b) of experiment BL15 at four run times. Note the propagation of the divide (red line) through the erosion box and the drop of the sliding gate used for falling base level (blue arrows). The normalized distance to divide (nDD, see text) used to follow the position of knickpoints during runs is shown superimposed on DEMs.
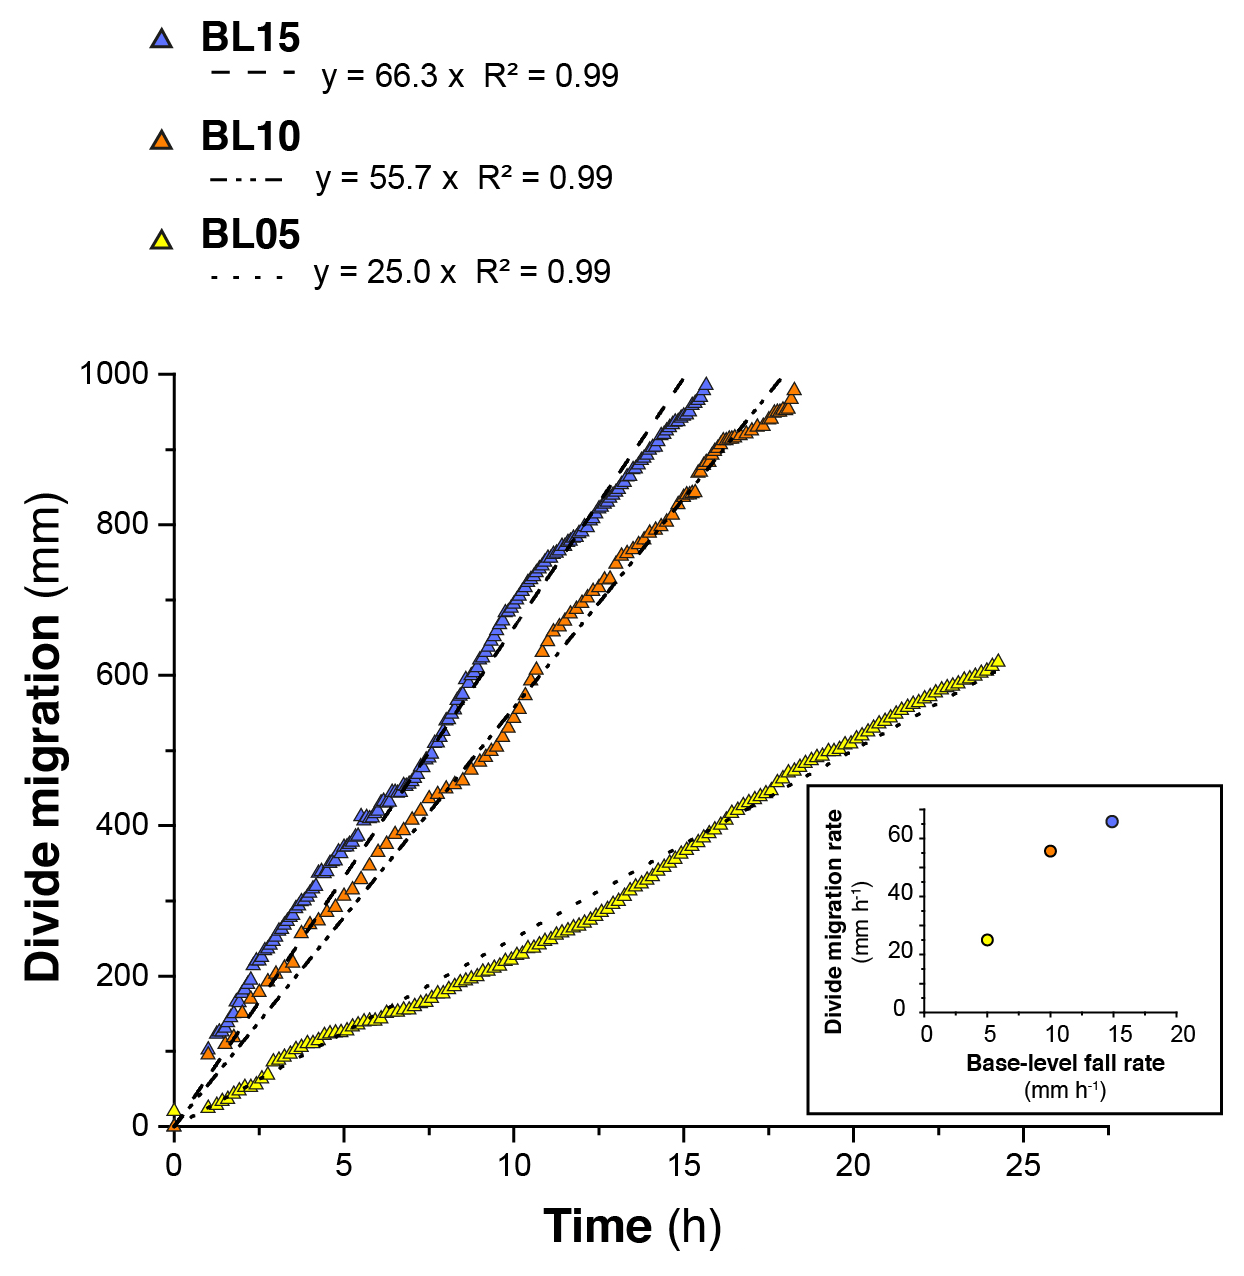
Figure 5Evolution of the water divide position within the erosion box for the three experiments. The inset figure (bottom right panel) shows the relation between the divide migration rate in the three experiments and their related base level fall rate.
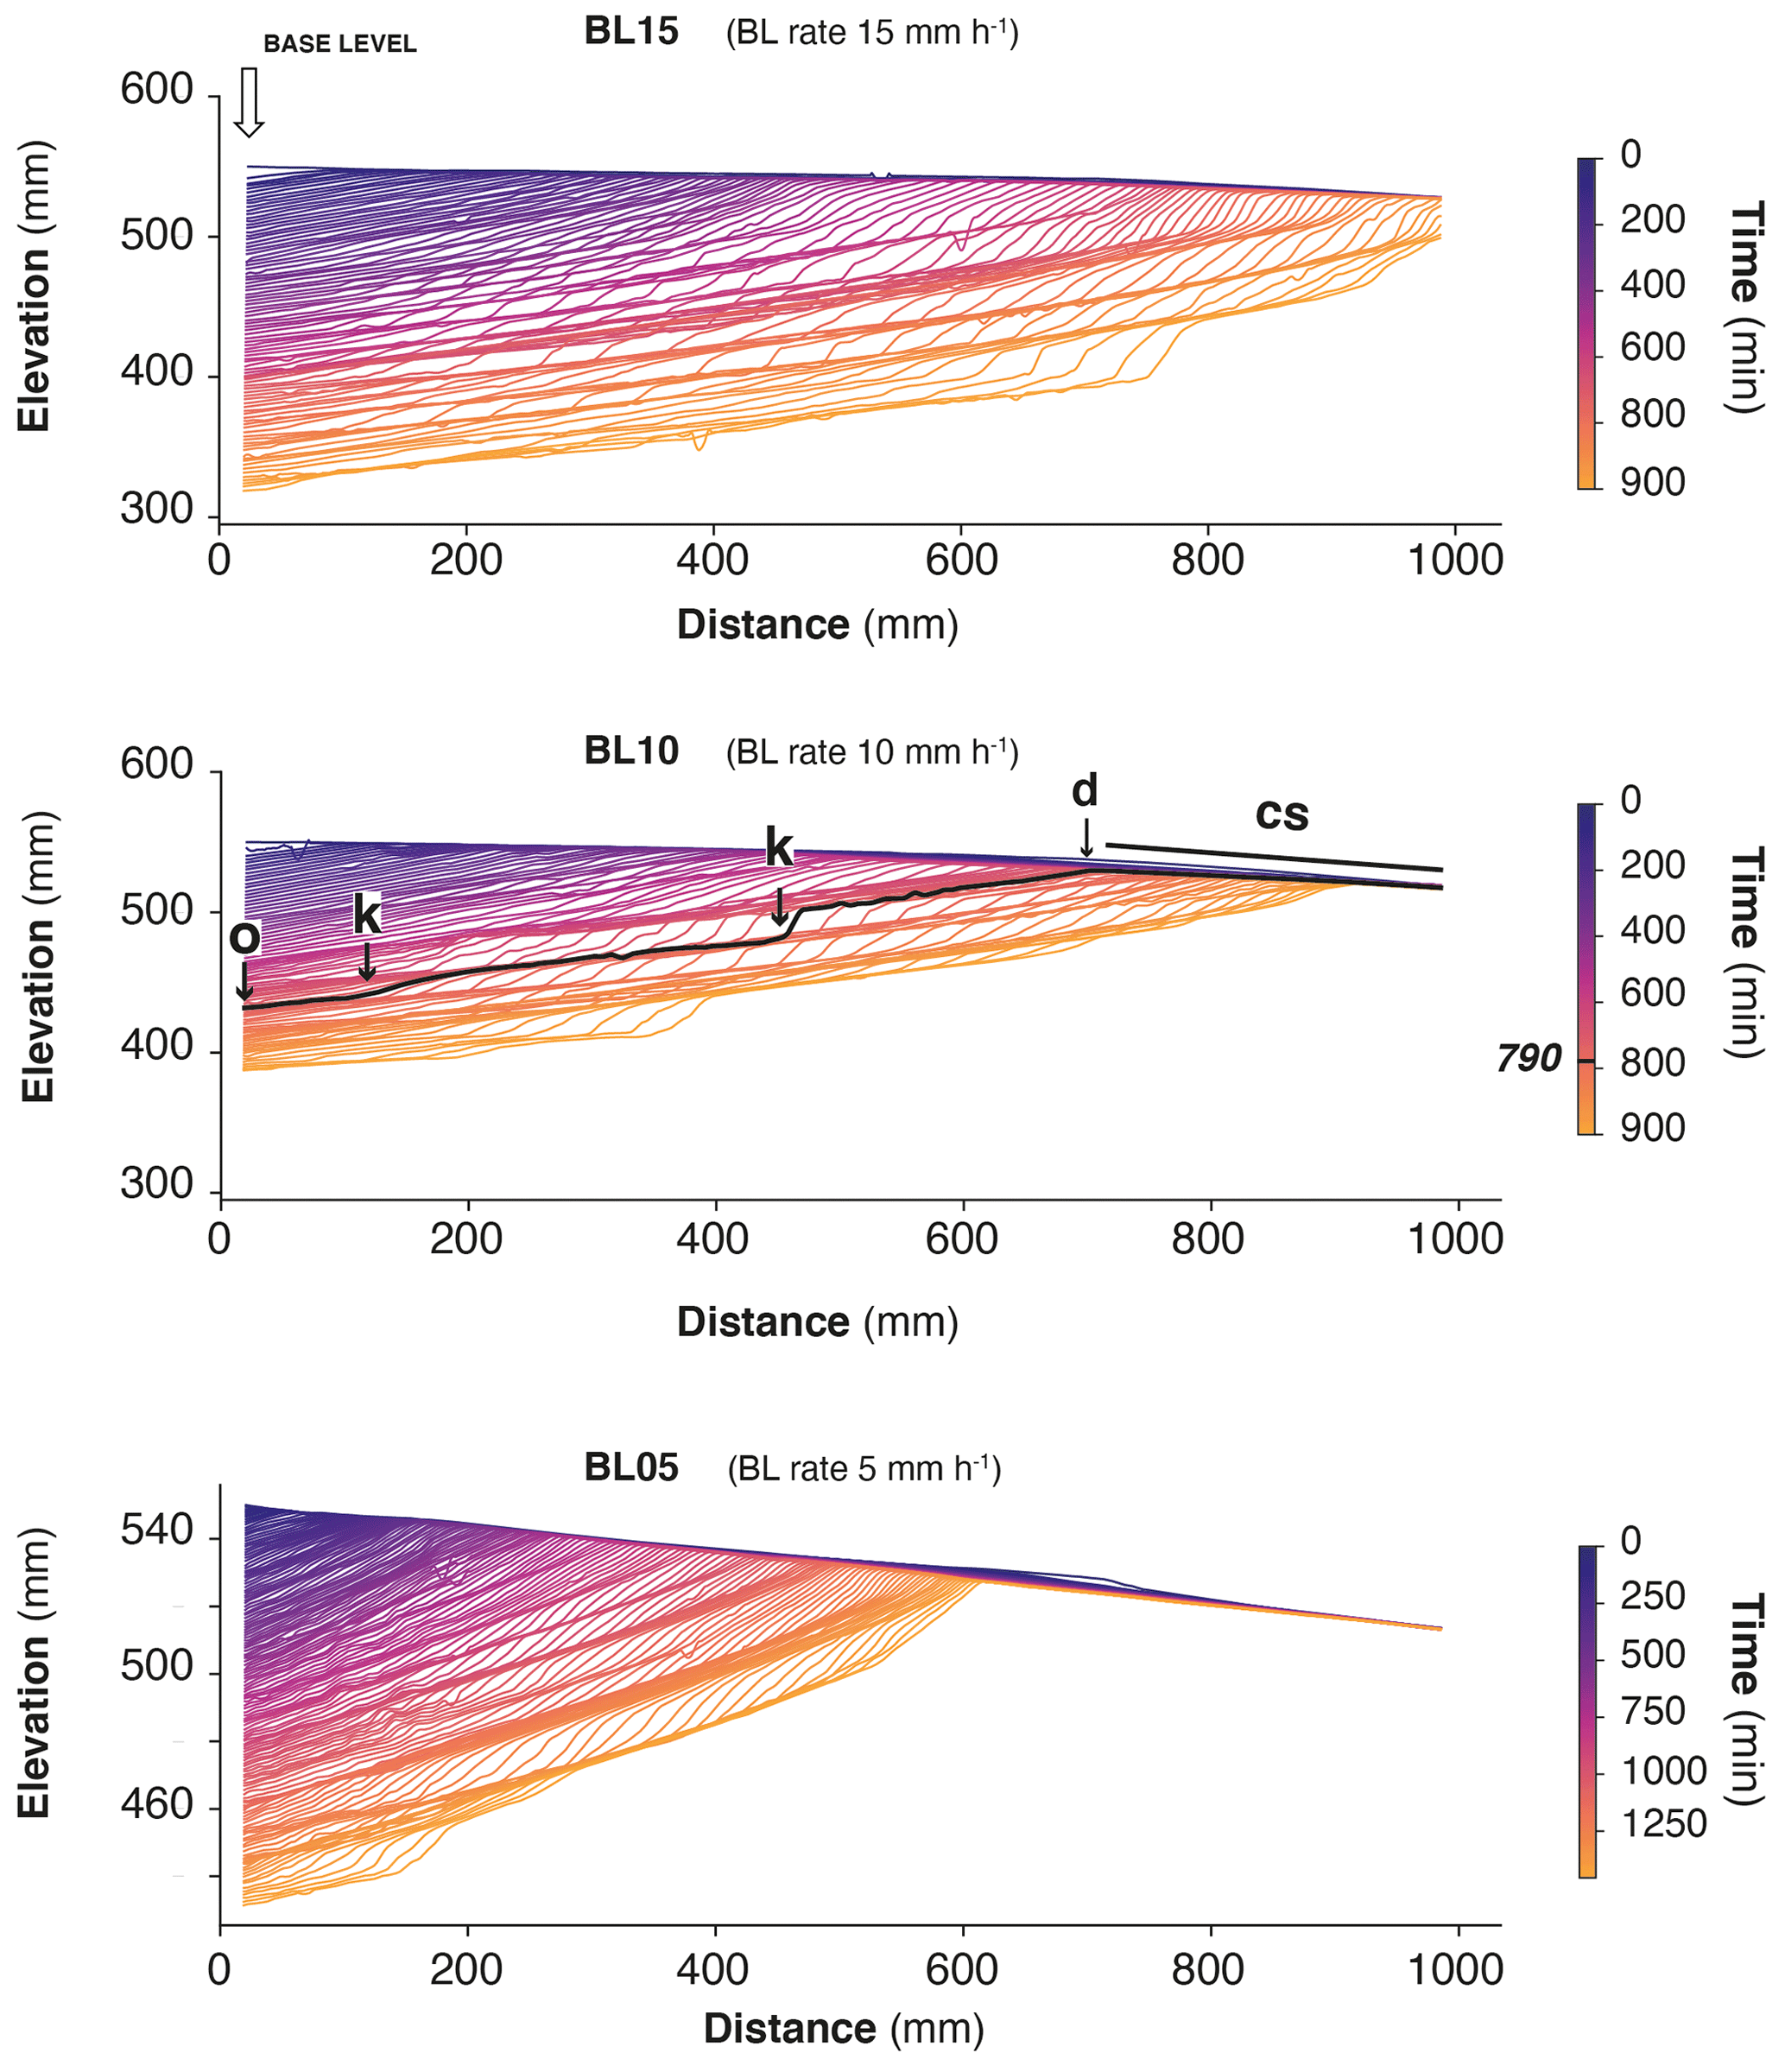
Figure 6Successive river longitudinal profiles of experiments, shown here every 10 min. Each longitudinal profile is colored according to experimental runtime. The sliding gate used to drop the base level is to the left. Note the initial counterslope (cs). Thick black line on BL10 is the longitudinal profile at t=790 min, illustrating the outlet (o), knickpoints (k) and water divide (d). Note the change in scale for experiment BL05.
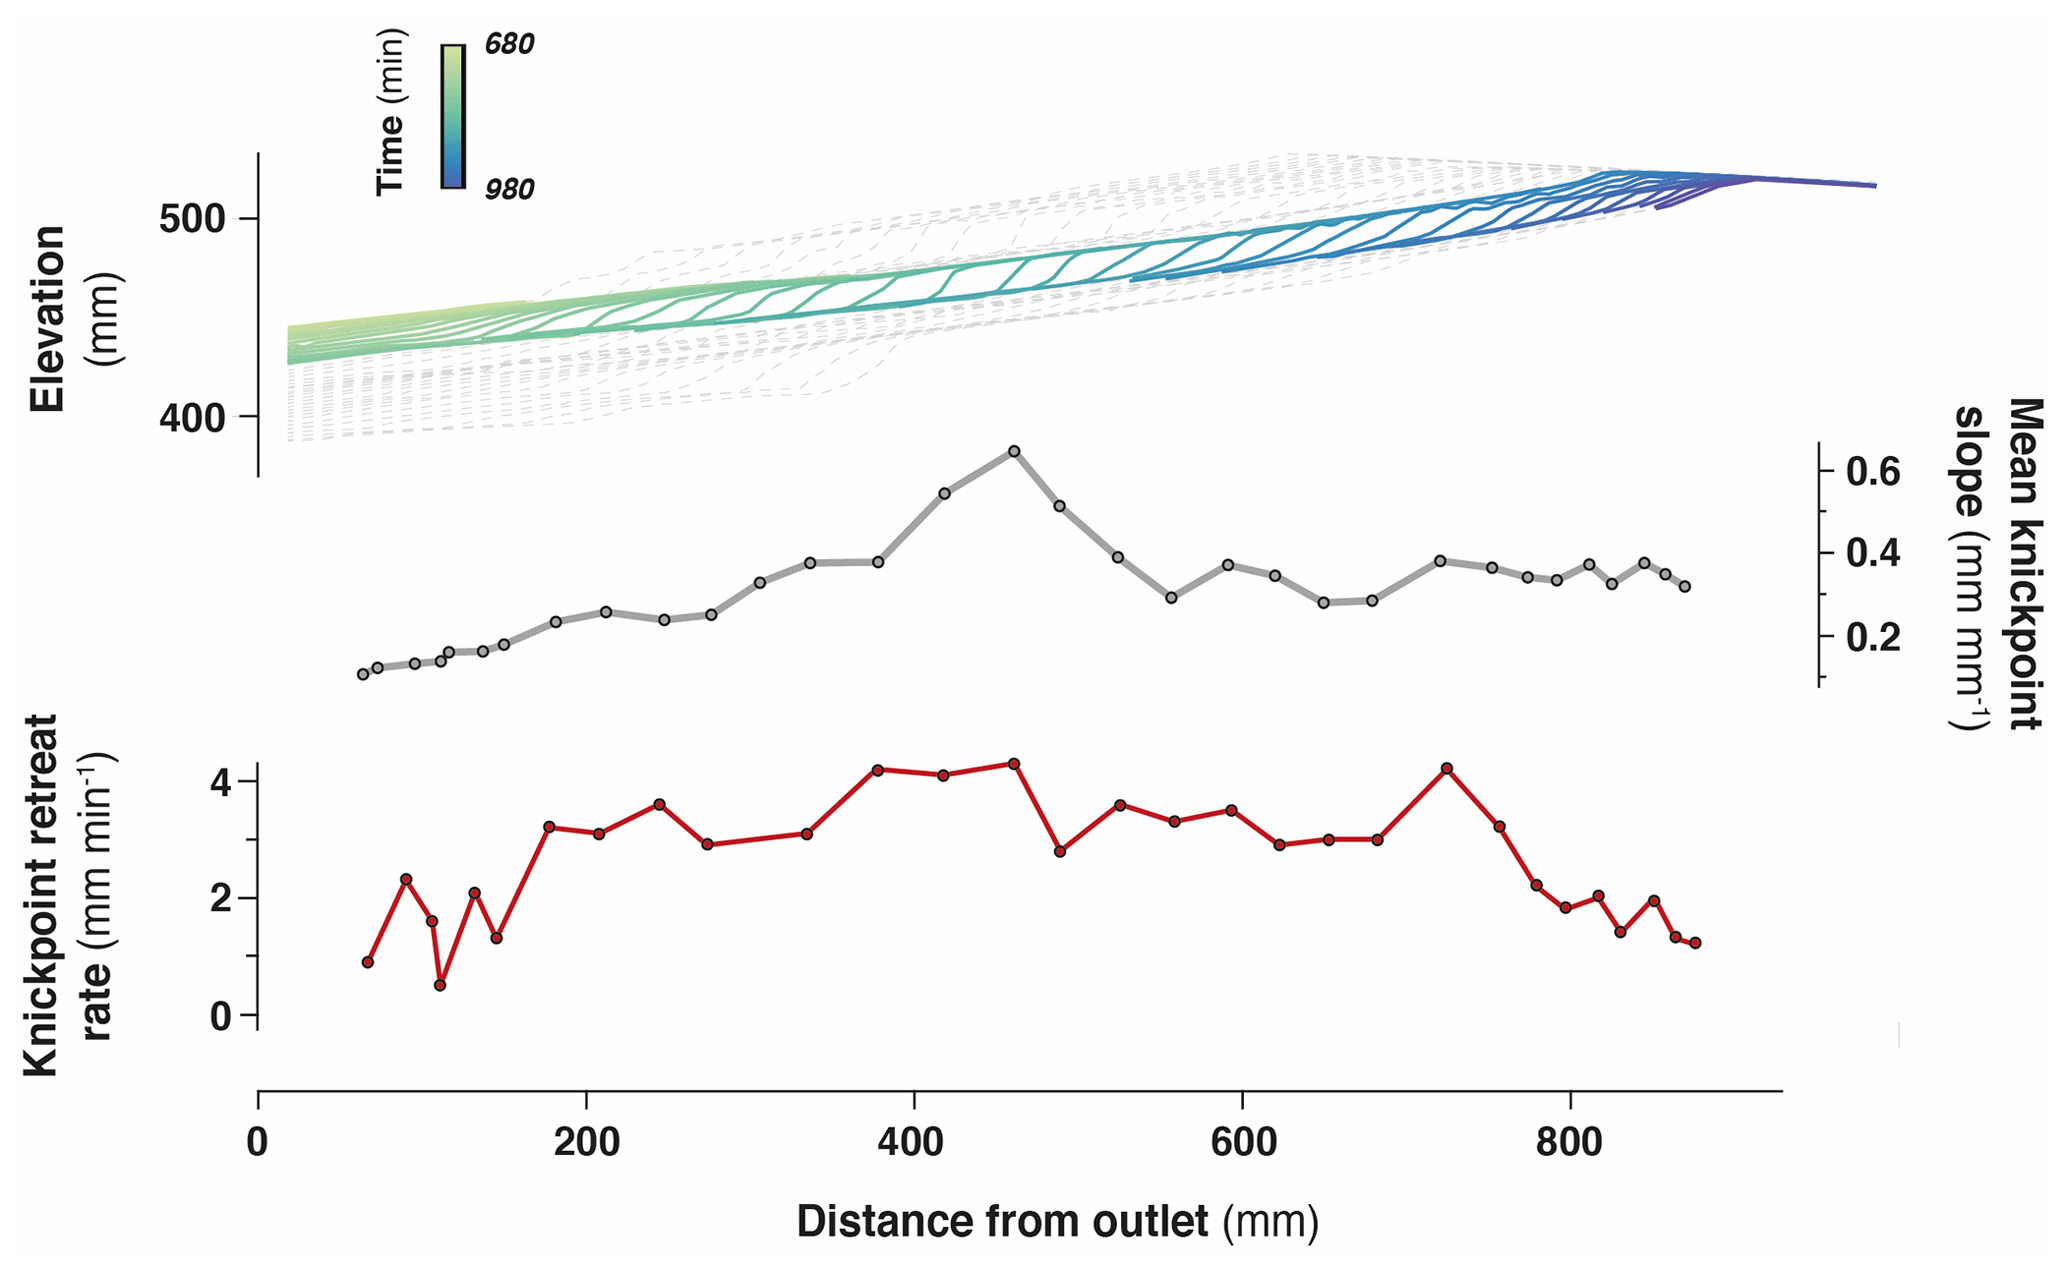
Figure 7Retreat of an individual knickpoint from experiment BL10 (see also Fig. 6) showing its initiation with a gentle slope which subsequently steepens as it migrates upstream (see also Fig. S3). Its maximum slope is reached at mid-distance between the outlet and the divide. Its lowest retreat rates are observed downstream near the outlet and upstream near the divide.
The mean retreat velocity of knickpoints varies between experiments from 73±50 to 183±94 mm h−1 (Table 1) and increases as a function of the rate of base level fall. Data suggest a non-linear relationship between base level fall rate and mean retreat velocity of knickpoints; however, complementary experiments would be necessary to constraint this dependency. To investigate the propagation of the knickpoints, we built space–time diagrams (Fig. 8) by plotting the successive along-stream position of each knickpoint over experimental runtime, as well as the position of the water divide in the box as already reported in Fig. 5. To compare the dynamics of knickpoints within an experiment regardless of the stage of water divide retreat into the box, the position of knickpoints (distance to outlet, D) has been normalized to the position of the divide, hereafter referred to as normalized distance to divide (nDD; nDD = 0 at outlet and nDD = 1 at the divide; Fig. 4). Lines of isovalue of nDD considering an increment of 0.1 are also shown in the space–time diagrams (Fig. 8). To a first order, the trajectories of each knickpoint are very comparable within an experiment regardless of the stage of retreat of the water divide and the size of the catchment. Visually for example, in the space–time diagrams there is no systematic variation in the general slope of the successive knickpoint trajectories over time, as the rivers expand, that would indicate a change in mean knickpoint velocity in relation to the change in the river length and catchment size. In detail, an inflection of trajectories is visible for many knickpoints when they are close to the divide, for nDD > ∼0.8 (Fig. 8), which indicates that they slow down as they approach the divide. The opposite is observed for some knickpoints when they are close to the outlet, for nDD < , with some trajectories suggesting, on the contrary, an acceleration after their initiation (Fig. 8; see also Fig. 7). These qualitative interpretations are supported by the detailed analysis of retreat velocity data shown in Fig. 9. For each experiment, we show in Fig. 9a the stack of successive retreat velocities of each individual knickpoint according to distance nDD. These data show that the range of knickpoint retreat rates depends on the rate of base level fall. Moreover, the envelopes draw a bell-shaped distribution for each experiment, which suggests that retreat velocities are at a maximum when knickpoints are located at a mid-distance between the outlet and the divide, for central values of nDD, between 0.4 and 0.6. This is supported by summary statistics of retreat velocities at 0.1 intervals of nDD considering all knickpoints in each experiment (Fig. 9b). Both the mean and median values show higher rates of upstream propagation when knickpoints are in the central section of rivers in the three experiments and conversely lower rates near the outlet (nDD < ) where they initiate and start to propagate and near the divide (nDD > 0.8), as suggested by trajectories shown in Fig. 8. To further characterize this trend, we determined the position of maximum knickpoint velocity on longitudinal profiles, hereafter nDD, from a second-order polynomial fit (Fig. 9c). nDD values are very similar between experiments (0.52, 0.57 and 0.54: Table 1). They separate positive to negative trends of knickpoint velocities versus normalized distance as also illustrated in Fig. S4. Data from the three experiments indicate that after their initiation near the outlet, knickpoints first speed up with a maximum in the central part of the catchments before decelerating near the divide. It is worth noting that this specific trend of knickpoint retreat rates is observed regardless of the experiment stages and thus whatever the position of the divide in the box. This applies both to rivers in the early stages of experiments evolution, i.e., when they are small, as well as for very large rivers at the end of experiments.
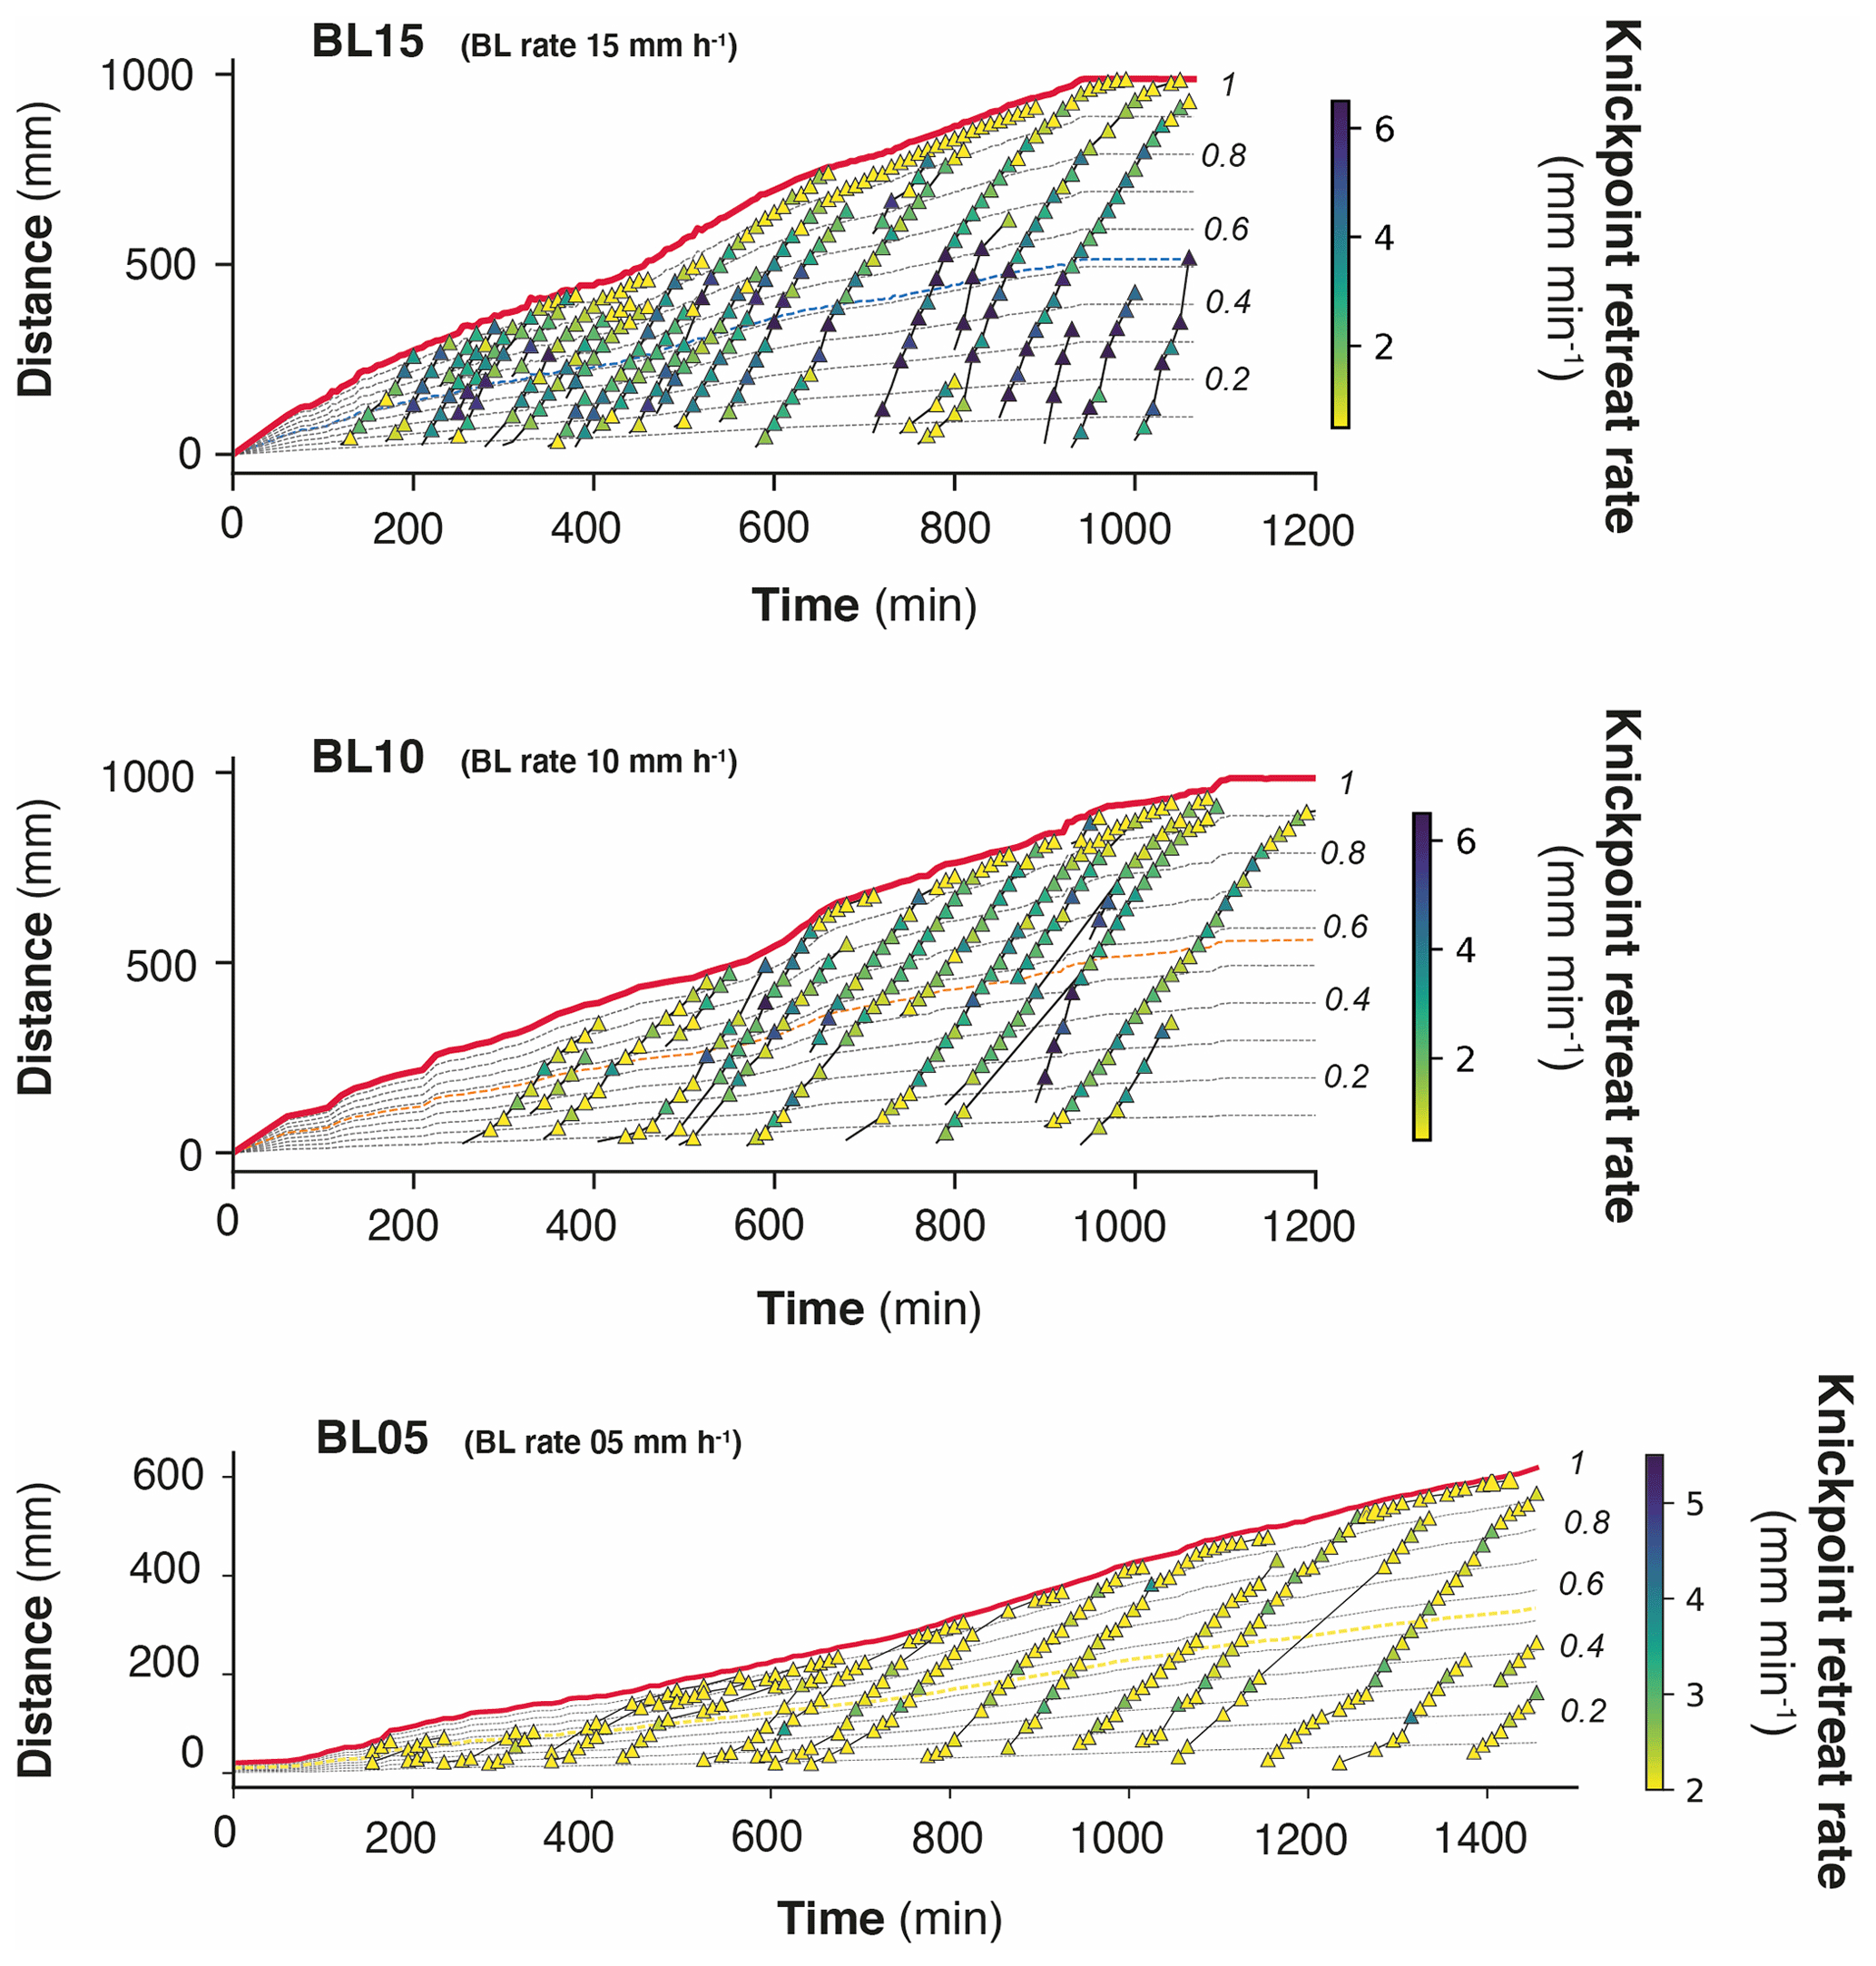
Figure 8Space–time diagrams showing the propagation of the water divide (red line) and successive trajectories of knickpoints (triangles). Symbol color shows instant (10 min) knickpoint retreat rate. Thin dashed black lines show the normalized distances to divide (nDD). Thin dashed colored lines show nDD, the normalized distance where the highest rate of retreat velocity is deduced from the analysis (see text and Fig. 9c). Note the change in scale and color bar for experiment BL10.
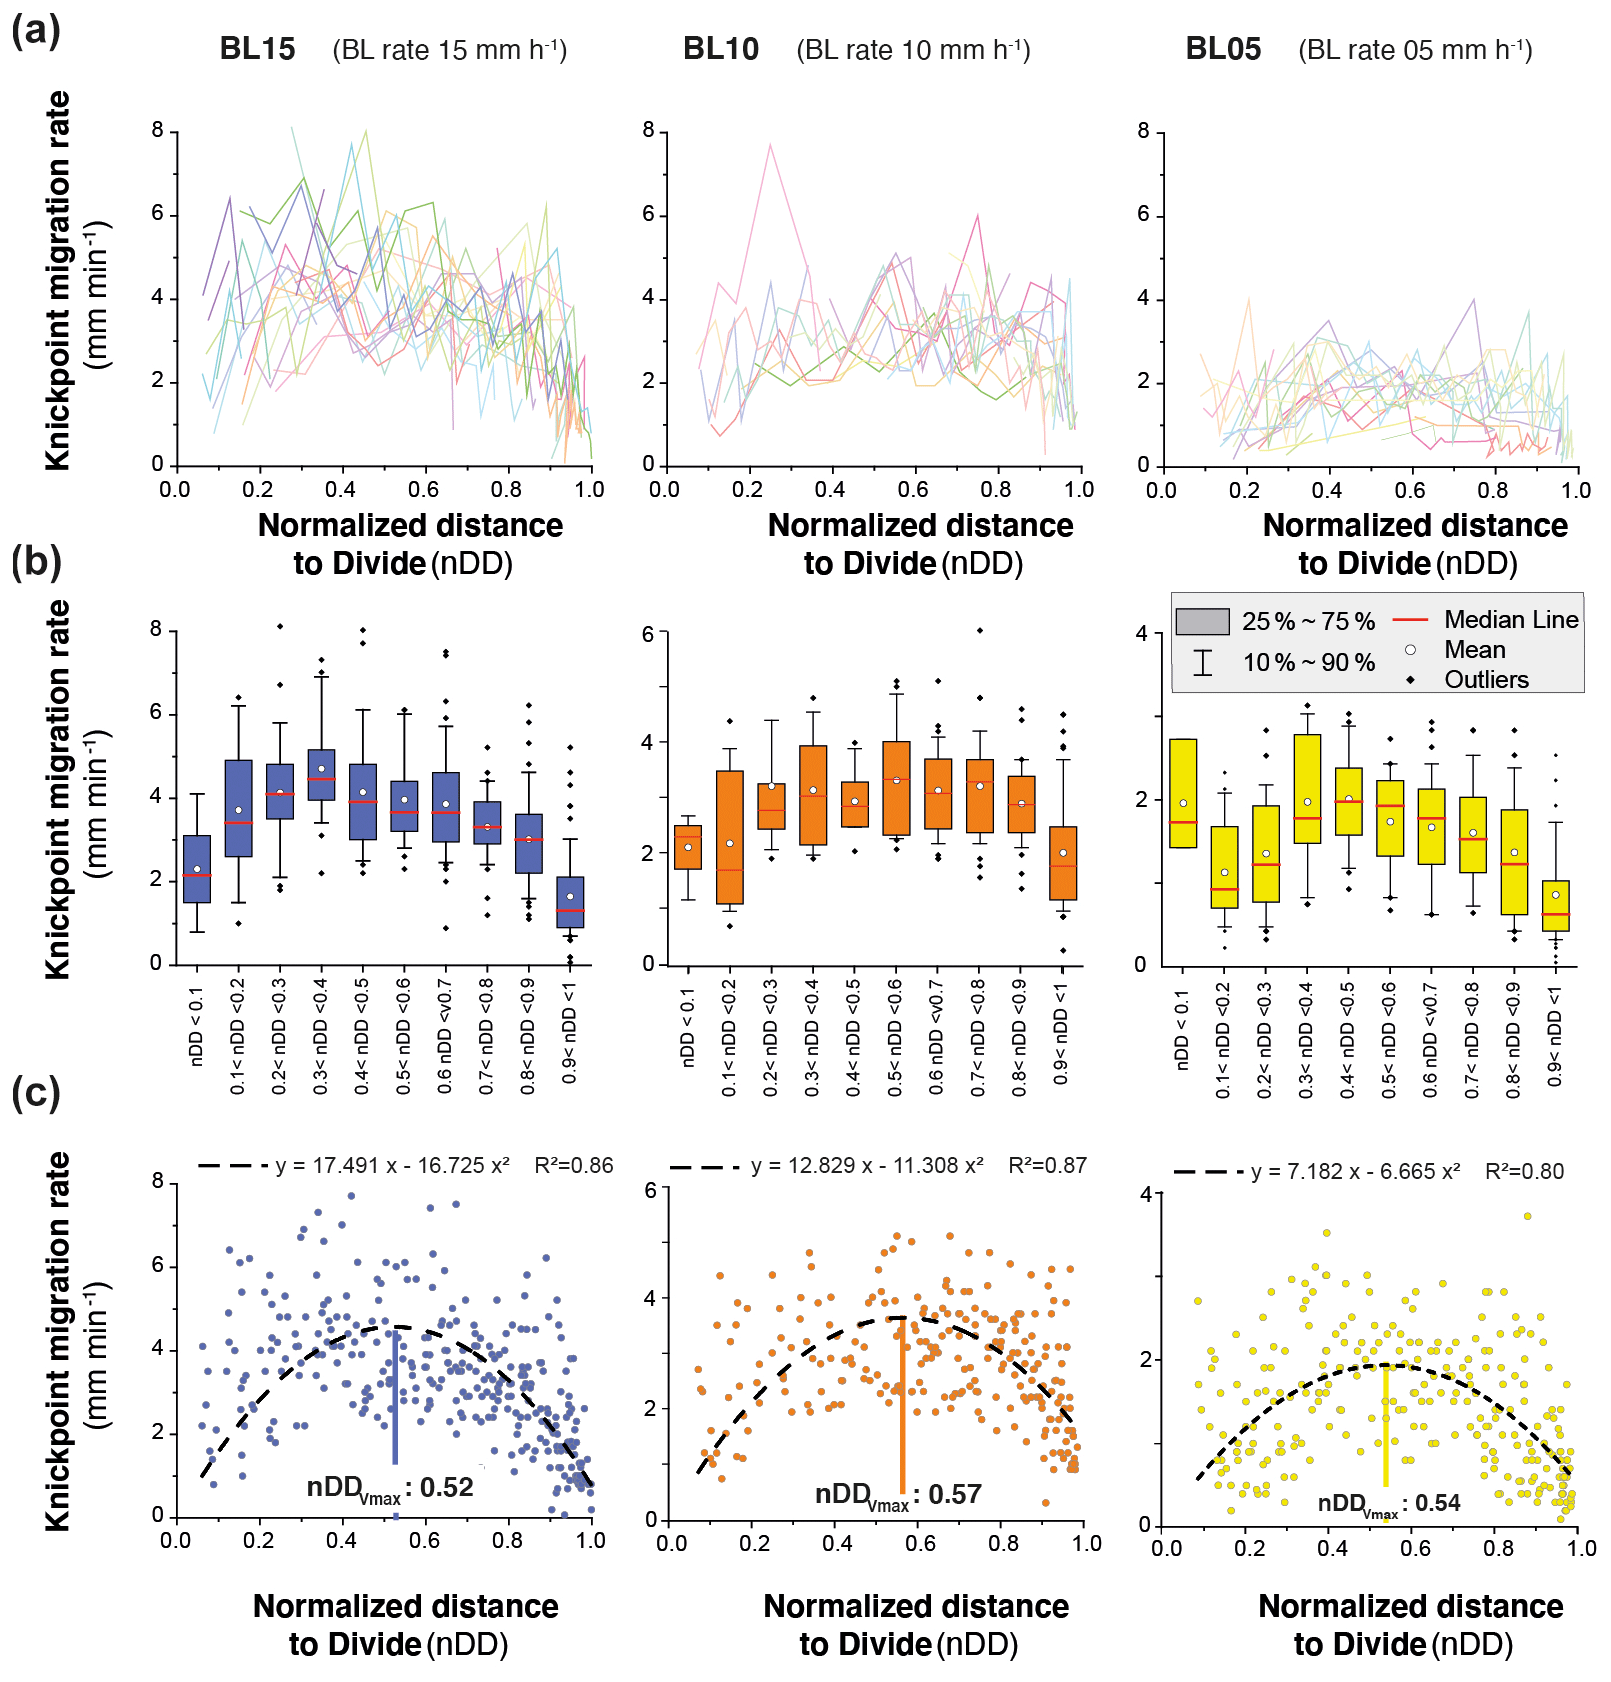
Figure 9(a) Knickpoint retreat rates according to the normalized distances to divide (nDD) for each knickpoint of experiments. Each color line corresponds to an individual knickpoint of the space–time diagram in Fig. 8. Note that the scale on the y axis is the same for all graphs. (b) Summary statistics of retreat rates for nDD intervals of 0.1. Note the change in scale on the y axis between the graphs. (c) Plot of all knickpoint retreat rates for each experiment. Note the change in scale on the y axis between the graphs. Dashed black line shows the second-order polynomial fit to the data used to define the normalized longitudinal distance of maximum velocity of knickpoints (nDD; see also Fig. S4).
3.2 Knickpoint initiation
To illustrate how knickpoints initiated near the outlet, we consider here a 120 min long sequence of channel evolution in experiment BL15 during which two knickpoints (K1 and K2) successively initiate and propagate upward (Fig. 10). In addition, we analyzed the history of channel width (Fig. 11a) and unit water discharge (Fig. 11b) at a cross section located 8 cm from the outlet (see location in Fig. 10b). We also present a summary of the statistics of normalized elevation changes (Fig. 11c) and shear stress (Fig. 11d) for all pixels across the section. The sequence starts with a “standard” profile (i.e., a typical river profile without any perturbation) at run times 880 and 890 min once a previous knickpoint had already propagated through the section, still visible upstream in Fig. 10a. The channel is 23 to 25 mm wide (Figs. 10b and 11a) and the unit discharge is about 1.5×106 mm2 h−1. Erosion in the channel is on average lower than the base level fall as normalized erosion (erosion rate/base level fall rate) is <1 for most pixels along the section (Fig. 11c). Then, knickpoint K1 initiates at runtime 895 min and starts to propagate upstream. At the surveyed section, the channel first narrows, up to ∼15 mm wide at 905 min (∼60 % decrease), and then widens (∼25 mm) once the knickpoint has moved upstream of the section, at 910 min (Fig. 10b). The narrowing phase is naturally associated with an increase in the unit discharge (Fig. 11b) and with enhanced erosion greater than the base level fall rate: up to 4 times the base level fall rate on average at 900 min (Fig. 11c), with extremes as high as 8 times the base level fall rate. Once knickpoint K1 has retreated, unit discharge decreases as the channel subsequently widens, to reach a width of 25 to 28 cm between 925 and 930 min (Fig. 11a), while a new regular profile, i.e., without any slope break, is established at 930 min (Fig. 10a). The normalized erosion across the section decreases below the base level value (Fig. 11c), with mean erosion rate values of 0.53, 0.36 and 0.76 times below the base level rates between 915 to 925 min. Longitudinally, the profiles stack together downstream of the knickpoint following its retreat from 895 to 925 min (Fig. 10a), which also indicates minor vertical erosion here once the knickpoint has retreated despite the ongoing base level falling. The second knickpoint (K2) then initiates at 935 min and propagates upstream in a similar way, leading to the setting up of a new regular profile at 980 min downstream of its position at that time (Fig. 10a). Channel narrowing is also observed on the cross section at the passage of this second knickpoint with a width that decreases to ∼15 mm wide (Figs. 10b and 11a), associated with an increase in the unit discharge and the erosion rate (Fig. 11c). It is followed again by a phase of widening to reach a width to around 30 to 35 mm once the knickpoint has propagated upstream and by a decreasing erosion below the base level fall rate (Fig. 11c). Again, the longitudinal profiles stack together downstream of the knickpoint (Fig. 10a). Note that at 975 min, most of the surveyed section is undergoing sedimentation (mean normalized erosion rate is 0.1 and median is −0.25: Figs. 10b and 11c). The distribution of riverbed shear stress along the section is given in Fig. 11d. Despite a large variability along the section, one can observe a significant increase in the median and maximum values at the time of the knickpoint passage, both for K1 and K2. Once knickpoints have passed, the shear stresses decrease as the river widens.
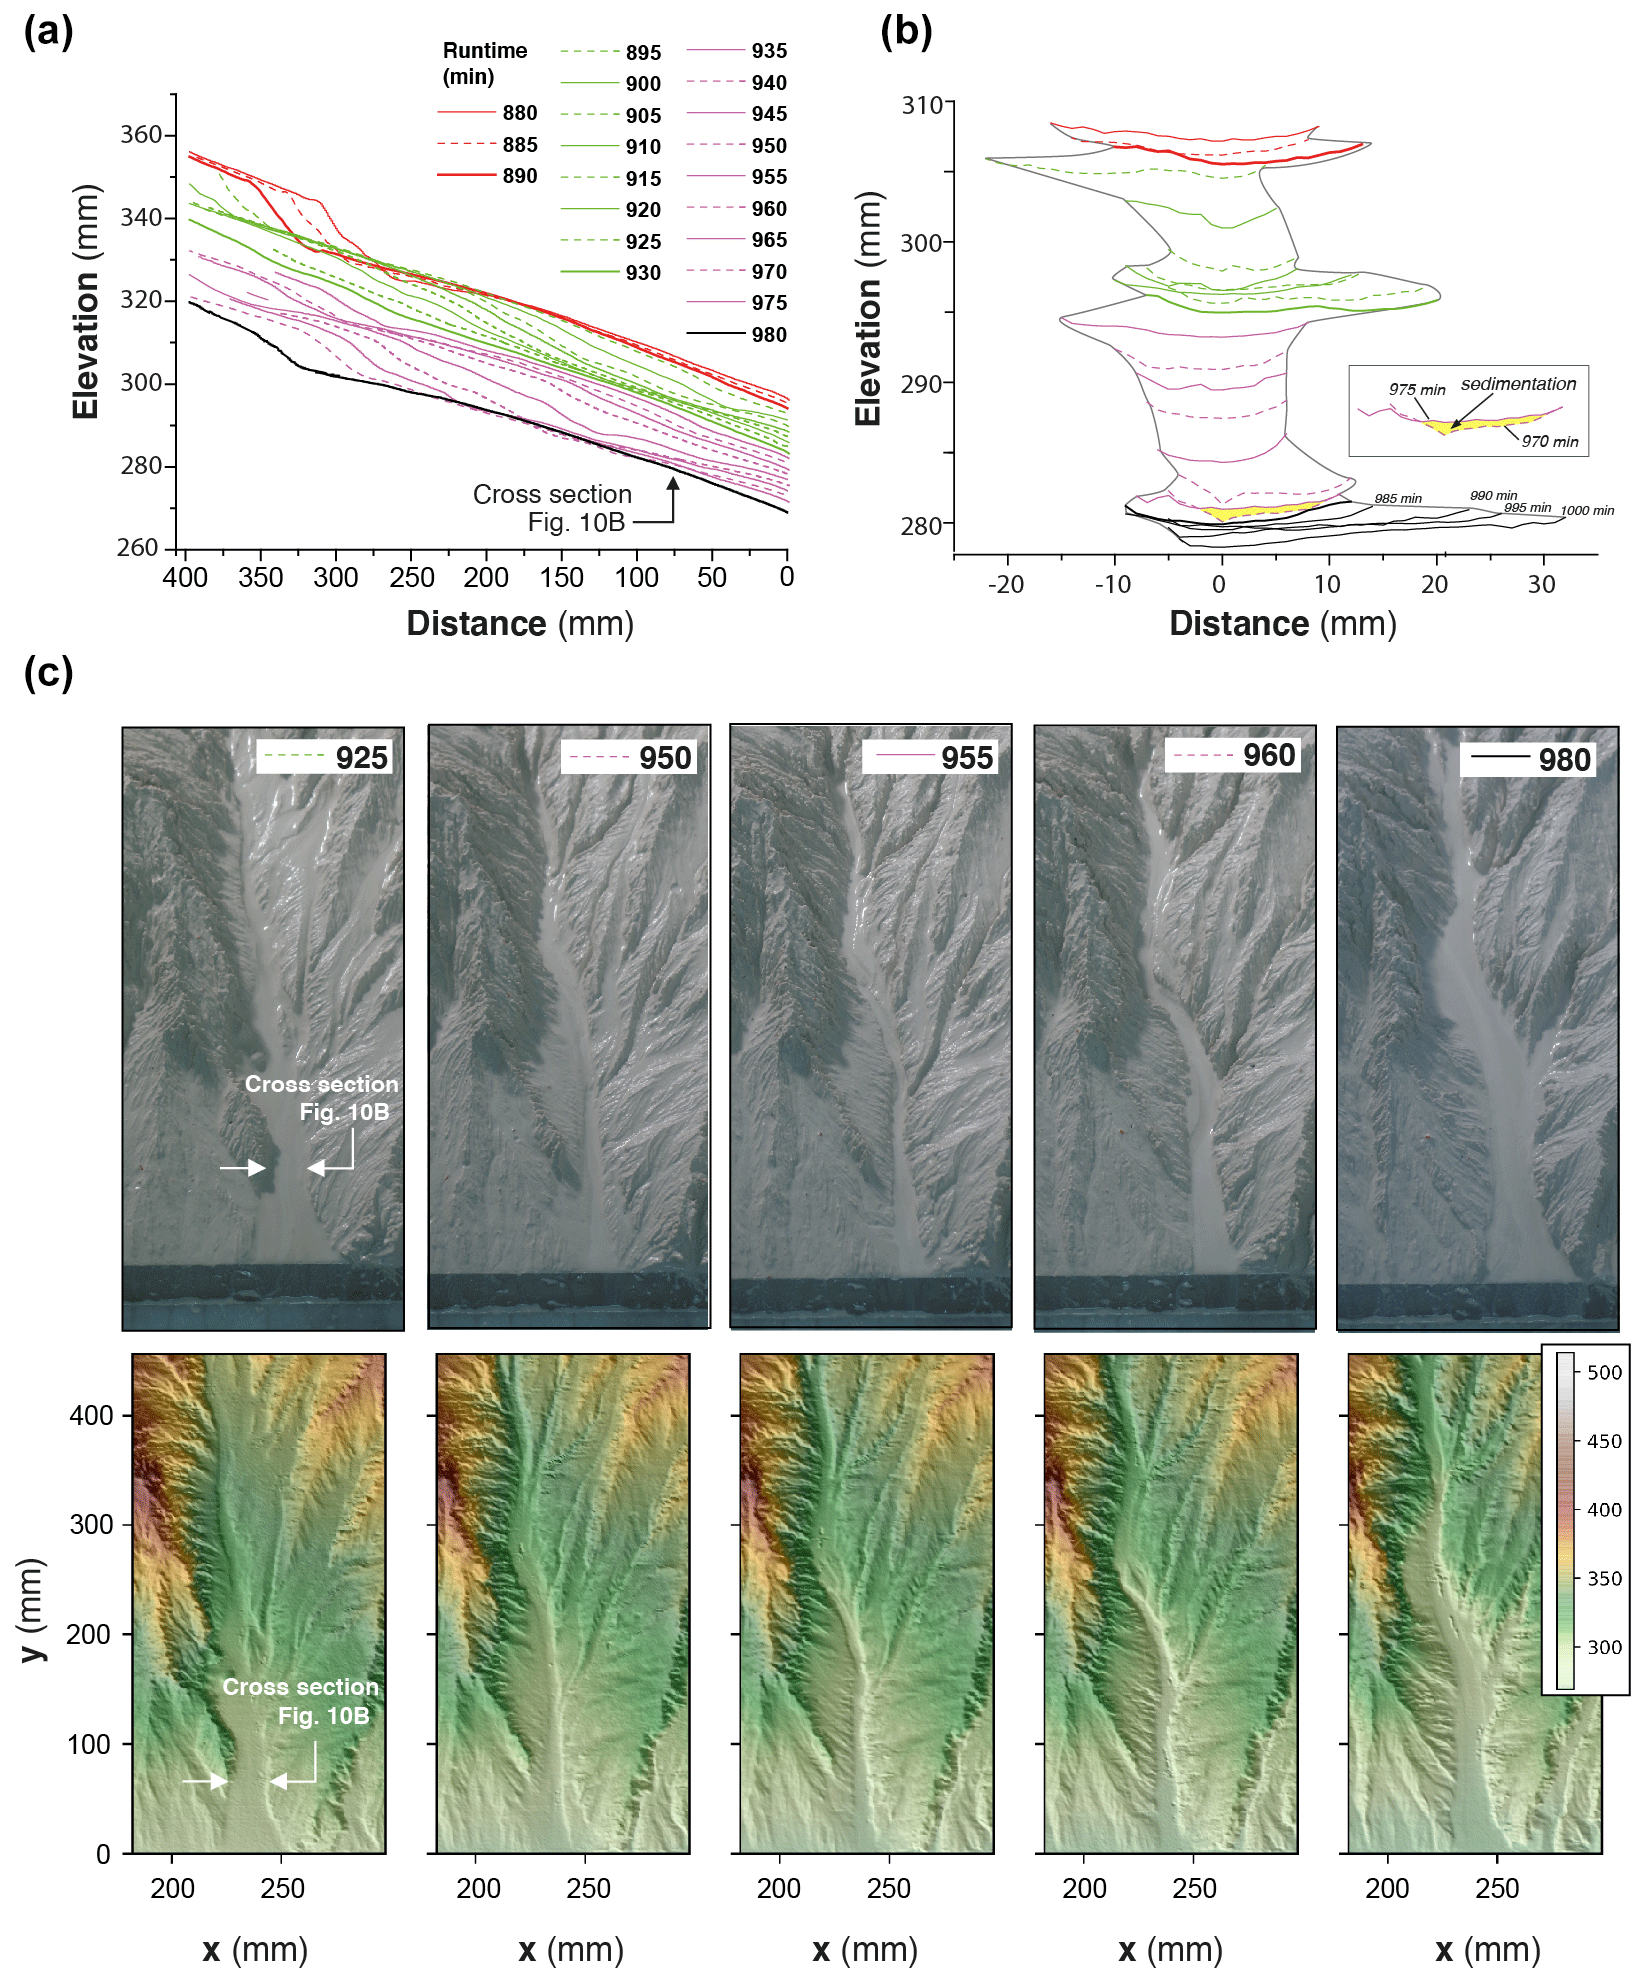
Figure 10Downstream knickpoint initiation and propagation in a 120 min long sequence of experiment BL15 from experimental runtime 880 to 1000 min. (a) Sequence of downstream longitudinal profiles (5 min time interval) of the investigated river, corresponding to the sequence hydro-geomorphic parameters shown in Figs. 11 and 12. Propagation of the first (K1; initiated at 895′) and second (K2; initiated at 935′) knickpoints is shown in green and purple colors, respectively (see text). (b) Time evolution of successive cross sections of the channel at 80 mm from the outlet. Colors are the same as in Fig. 10a. (c) Photos (top row panels) and perspective views of DEM (bottom row panels) at five time steps. Color bar is elevation in millimeters.
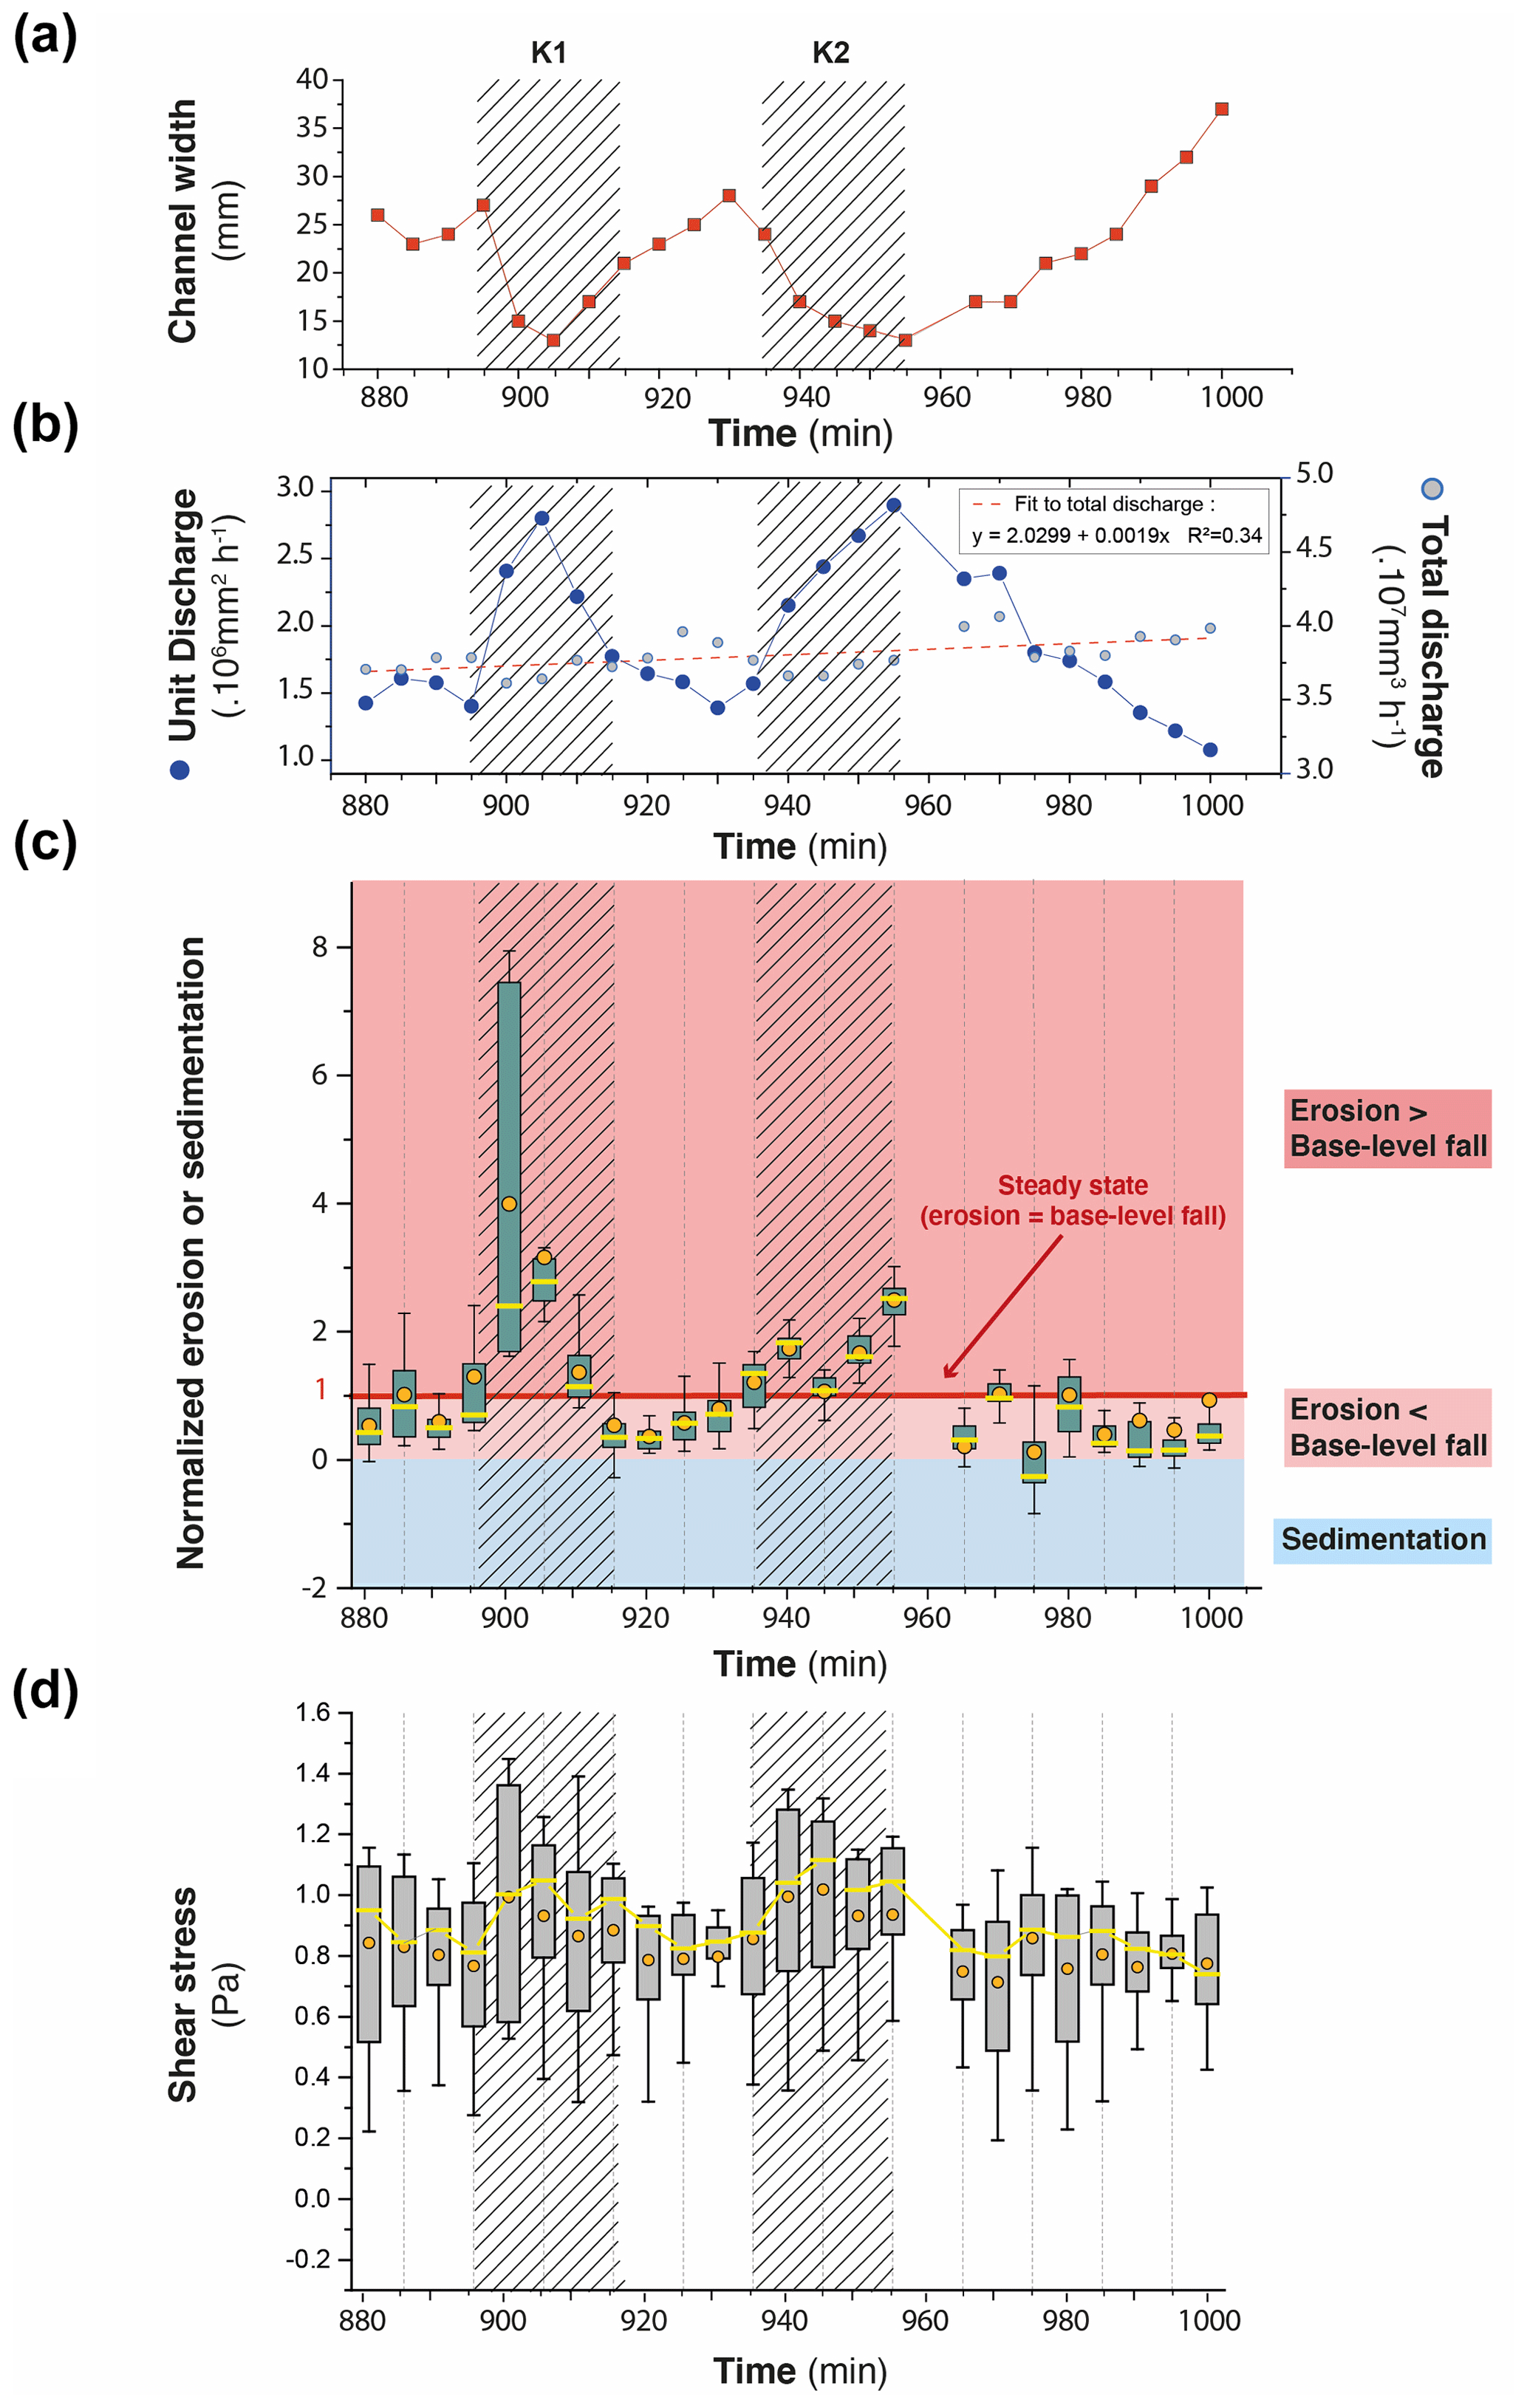
Figure 11Time series (5 min time interval) of river width (a) and unit and total discharge (b) for the channel in experiment BL15 shown in Fig. 10b (see also location of Fig. 10c). Time series of box-and-whisker plots of normalized erosion or sedimentation (c) and shear stress (d) for all pixels across the channel cross section. Solid orange circles and yellow lines show the mean and median values, respectively. Edges of the boxes indicate the 25th and 75th percentiles. Note that in (c), normalized values of 1 indicate erosion at the same rate as base level fall (steady-state conditions). Values > 1 or <1 indicate, respectively, a higher and lower erosion rate than BL fall rate. Negative values indicate sedimentation. On all graphs, crosshatched areas indicate the passage of knickpoints K1 and K2.
This sequence illustrates that the rivers are never in equilibrium at the 5 min timescale but continuously oscillate over time between disequilibrium states with periods when channel are too wide to keep pace with the base level and periods of knickpoint propagation when the erosion is enhanced to catch up with the base level. The river width is the regulation parameter which allows the river erosion to adapt by increasing or decreasing the unit discharge. These knickpoints then propagate upward up to the divide as discussed previously (Fig. 6). The average erosion rate is similar to the base level fall rate (mean normalized erosion rate of the sequence is 0.99), but it does not correspond to any stable configuration of the river since the erosion rate fluctuates between smaller and larger values. Knickpoints are by-products of these unsteady dynamics, which are generated during the phases when the river catches up with its erosion deficit with respect to the base level.
To complement cross-section data, we also illustrate (Fig. 12) how parameters vary longitudinally by considering four stages: two before (925 min) and after (975 min) the passage of knickpoint K2 and two during its retreat (945 and 950 min). Note that at 925 min, the previous knickpoint (K1) has just passed upstream of the investigated profile and is responsible for the enhanced normalized erosion and increased shear stress upstream between distance 200 to 350 mm. Similarly, at 975 min the second knickpoint (K2) is still in the upstream part of the profile between distance 300 to 350 mm. We also reported the longitudinal variations in river width, shear stress and normalized erosion along the profiles (Fig. 12). At run times 925 and 975 min, before and after the passage of knickpoint K2, erosion is below the base level rate along all the profiles down the knickpoints, with even localized sedimentation at 975 min between 50 and ∼150 mm. These sections are characterized by low shear stress values, being between 0.5 and 1, and by rivers that widen downward (around 0.7 mm cm−1). By contrast, during the passage of knickpoint K2, at run times 945 and 950 min, mean shear stress increases locally at the knickpoint location, being >1, and the normalized erosion surpasses the base level rate there. These knickpoint segments are characterized by a narrowing of the rivers as already shown previously. The data illustrate that erosion mainly occurs during periods of knickpoint retreat though a combination of local steepening of the profile and narrowing of the river, resulting in an increased shear stress. By contrast, once a knickpoint has propagated and between the passage of two successive knickpoints, erosion decreases significantly and no longer compensates the base level fall. These periods of defeated erosion are characterized by low bed shear stress values in wide rivers that widen downward.

Figure 12Longitudinal trends of hydro-geomorphic parameters in experiment BL15 at run times 925, 945, 950 and 975 min (see text for comments). K1 and K2: first and second knickpoints discussed in the text (see also Fig. 10a).
4.1 Autogenic knickpoints
Our experiments illustrate the generation and retreat of successive knickpoint waves that traveled across the landscape during the growth of drainage networks. They formed throughout the duration of experiments independent of the steady precipitation and base level fall rates and of the homogeneity of the eroded material. These knickpoints were autogenically generated (Hasbargen and Paola, 2000), arising only from internal geomorphic adjustments within the catchments rather than from variation in external forcing. Our observations appear very similar to those of Hasbargen and Paola (2000, 2003) and Bigi et al. (2006), who also reported the generation of successive autogenic knickpoints in landscape experiments evolving under steady forcing (rainfall and base level fall rate) throughout the duration of the runs. Unlike our experiments, which mainly consider the growth phase of drainage networks, experiments reported in Hasbargen and Paola (2000, 2003) and Bigi et al. (2006) considered the propagation of knickpoints after the phase of network growth, while their system was at steady state on average (mean catchment erosion rate equal to base level rate). Then, given that the size of their experimental catchment was steady over time and given the steady rainfall rate, they were able to rule out variations in water discharge over time as a main driver for the generation of their knickpoints. By contrast, in our experiments the size of catchments continuously increased over time, and thus so did the water discharge. However, this does not appear as a key factor controlling knickpoint initiation for several reasons. First, as we already mentioned, knickpoints arose at all stages of network growth and divide retreat, for both small and large rivers (Fig. 8), and thus whatever the range of water discharge at outlet. Second, the migration of the water divide related to drainage network growth occurred steadily and roughly at a constant rate during the experiments (see Figs. 5 and 8) as did the size of the catchments and the related increase in water discharge. Thus, we can rule out abrupt variations in discharge as the driving mechanism for knickpoint initiation. Last, knickpoint initiations occurred at a higher frequency than the increase in water discharge that resulted from catchment expansion and divide migration. For example, in addition to unit discharge, in Fig. 11b we also reported the variation in total discharge during the 120 min long sequence of knickpoint initiation discussed previously. The total discharge rose from 3.7×10⁷ to 4.0×107 mm3 h−1 in 120 min representing a ∼8 % increase, which is relatively low compared to the ∼100 % increase in unit discharge during the passage of a knickpoint. For all these reasons we conclude that the change in catchment size was not the main driver of successive knickpoint initiation in our experiments, which occurred at a higher frequency.
4.2 Processes controlling knickpoint initiation and propagation
Given that the initiation of successive knickpoints was not related to changes in external factors and catchment size over time, we consider internal geomorphic processes as driving mechanisms. The detailed sequence of knickpoint initiation and propagation discussed above shows enhanced incision above the rate of base level fall during the periods of knickpoint propagation. This occurred through local steepening of the longitudinal profile and narrowing of the river; these two factors lead to an increase in unit discharge and bed shear stress along the knickpoints. Several studies already documented how steepening and narrowing act together to increase river incision rate (e.g., Lavé and Avouac, 2001; Duvall et al., 2004; Whittaker et al., 2007; Cook et al., 2013), which is what we also document here. The novelty in our finding here, however, lies in the evolution after knickpoint retreat. Immediately after the retreat of a knickpoint, we show that erosion in the section of the channel where the knickpoint just passed is inhibited despite the ongoing base level fall: river incision is lower than the rate of base level fall, until the passage of a new knickpoint. Although only illustrated in the sequence detailed previously (Figs. 10 to 12), this was a general behavior that occurred in all three experiments along their whole longitudinal profile, not only their downstream part as in this sequence. This systematic decrease in erosion downstream of the knickpoints is inherent to the geometry of the stacks of all successive longitudinal profiles of each experiment (Fig. 6). In most cases, profiles downstream of retreating knickpoints stack on top of each other, as illustrated schematically in Fig. 13a, which indicates minor or no erosion downstream of the knickpoints until the passage of a new one. In the case of continuous steady adjustment of rivers to base level fall downstream of the knickpoints, the geometry of profiles should instead show a pattern as illustrated in Fig. 13b. The pattern of profile evolution over time documented here is usually observed following incremental drops in base level (Finnegan, 2013; Grimaud et al., 2016), and to our best knowledge this is the first time here that such geometry is documented in the case of a continuous base level fall. This particular pattern is explained by the decrease in erosion rate downstream of the retreating knickpoints, which acts as if the base level was not falling continuously at a constant rate but instead dropped regularly step by step. Therefore, understanding the systematic occurrence of successive knickpoints in our experiments requires understanding why erosion rate dropped downstream of knickpoints, following their retreat. After the passage of knickpoints, we systematically observe a widening of the rivers, as also documented in natural systems (e.g., Cook et al., 2014; Zavala-Ortiz et al., 2021), and a decrease in the bed shear stress. Because an increase in channel width over time inevitably reduces the bed shear stress if discharge and river gradient remain constant (Fuller et al., 2016), we propose that widening was the main factor responsible for the decrease in shear stress and erosion rate after the passage of a knickpoint and thus for the occurrence of the successive autogenic knickpoints. Demonstrating the sole effect of river width on bed shear stress and erosion rate is complicated by covariations in these factors with river slope and variations in discharge related to the connection of tributaries. This can be illustrated however on the basis of the sequence considered previously, particularly at runtime 925 min between the passage of the two successive knickpoints K1 and K2 (Figs. 10 and 12). At that time, the profile of the river here had a roughly constant slope (Fig. 14), without any slope break and no major tributary connected (Fig. 10) that could have significantly changed the water discharge. As illustrated in Fig. 12, this river segment was characterized by widening and decreasing shear stress downward despite constant slope and total discharge. Thus, this example illustrates a decrease in shear stress that was only the result of the widening of the river downward (Fig. 14), which supports the hypothesis that decreased erosion downstream of the propagating knickpoints was mainly due to the widening dynamics of the experimental rivers.
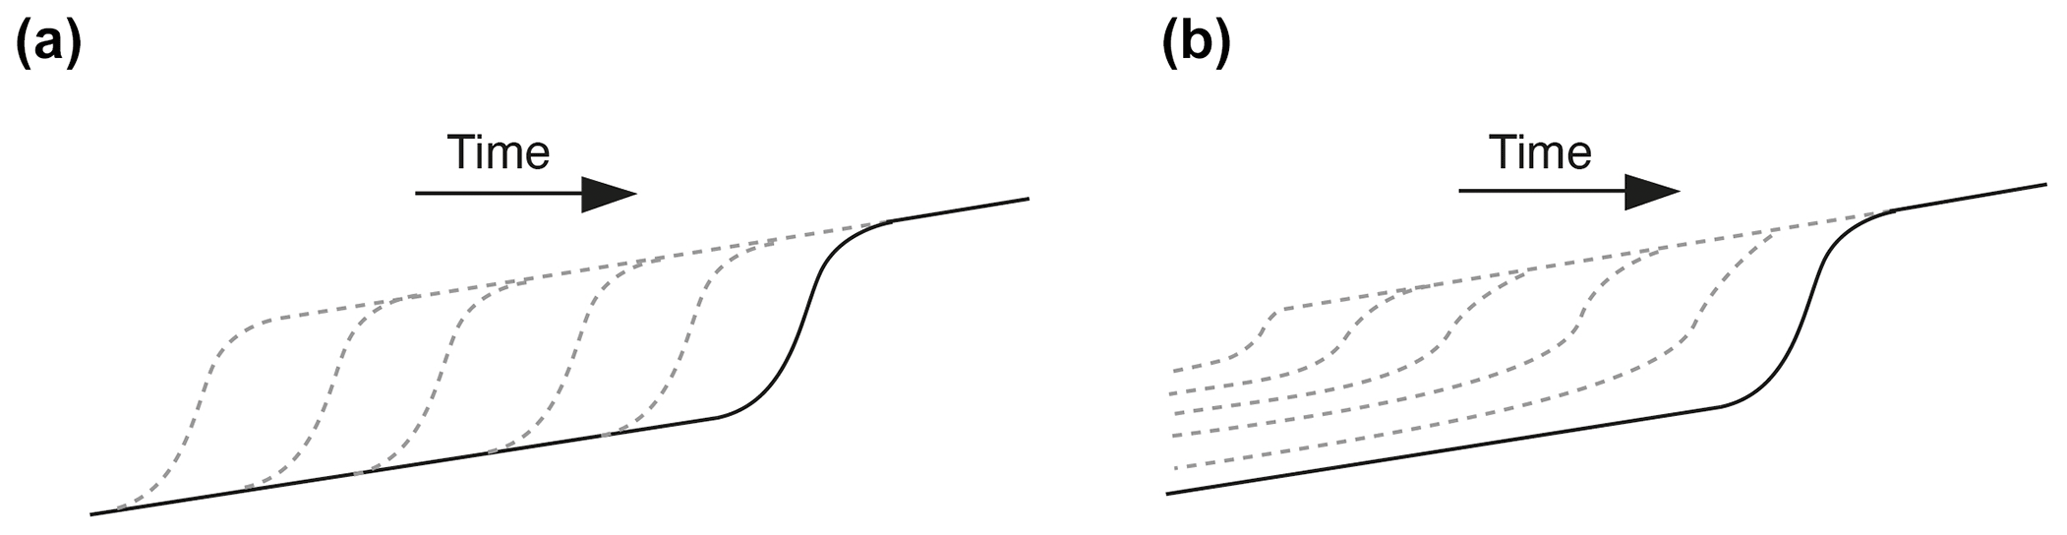
Figure 13Sketches illustrating the difference in the geometry of successive longitudinal profiles following the retreat of a knickpoint depending on whether fluvial incision is inhibited (a) or not (b) downstream of the retreating knickpoint with respect to the continuously falling base level.
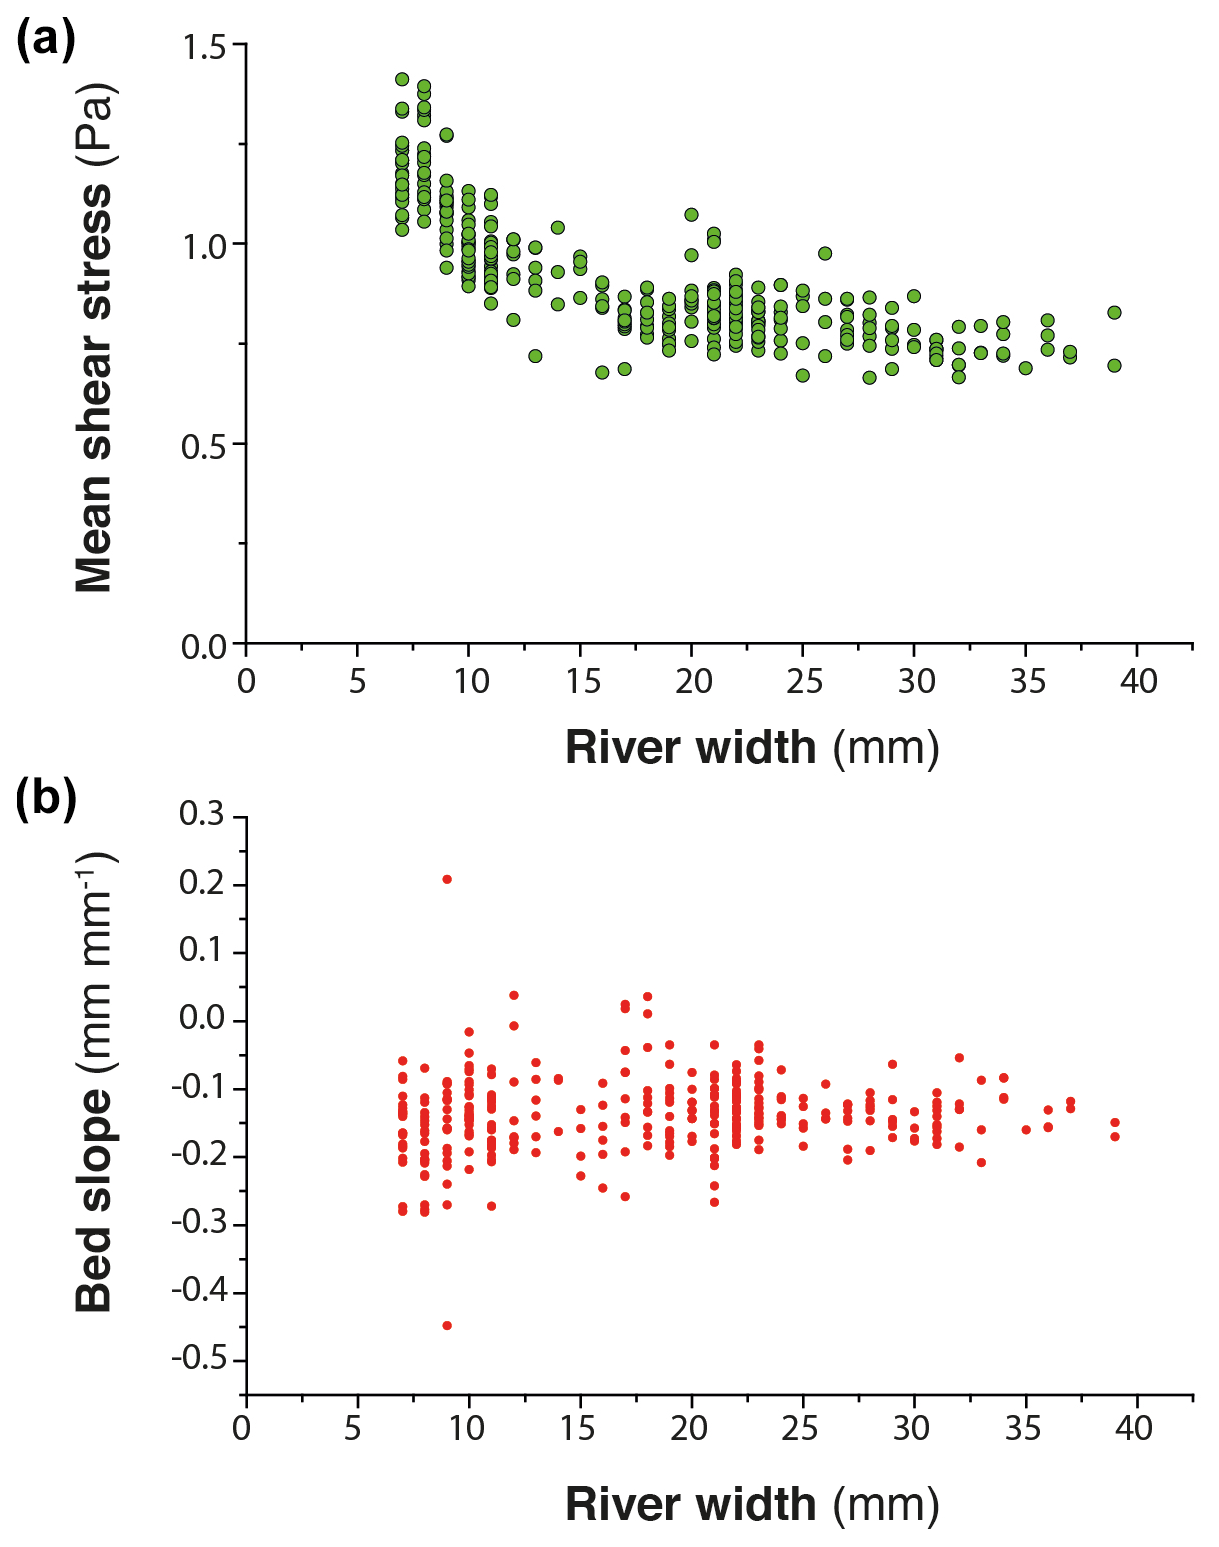
Figure 14(a) Riverbed shear stress versus river width in the downstream section, 40 cm long, of experiment BL15 at runtime 925 (see also Fig. 12). (b) Corresponding slope of the riverbed.
Incision of rivers in our experiments is fundamentally discontinuous despite continuous forcing, and we highlight downstream river width dynamics, in particular river widening, as a main cause of instability. We show that once knickpoints have retreated, unit discharge, shear stress and incision rate all decrease downstream while the rivers widen, resulting in a state where incision no longer counterbalances the base level fall. This results in an unstable situation that ends with the initiation and propagation of a new knickpoint and a new sequence of width narrowing, increasing shear stress and incision rate and allowing the river to recover from the incision delay accumulated during the previous widening period. Further work is required to understand the mechanisms responsible for lateral channel erosion in our experiments, which is a key ingredient for understanding river mobility and widening. Several field (e.g., Hartshorn et al., 2002; Turowski et al., 2008; Fuller et al., 2009), experimental (e.g., Wickert et al., 2013; Bufe et al., 2016; Fuller et al., 2016; Baynes et al., 2020) and numerical (e.g., Turowski et al., 2007; Lague, 2010; Langston and Tucker, 2018; Li et al., 2021) studies have demonstrated that high sediment flux relative to transport capacity promotes increased lateral channel erosion. Most of these studies highlight the role of cover effect, the protection of the riverbed by transient deposition of sediments on the riverbed (Sklar and Dietrich, 2001; Turowski et al., 2007, 2008; Lague, 2010; Baynes et al., 2020; Li et al., 2021), as a main factor promoting lateral erosion in high-sediment-flux settings. Other studies show that by modifying the bed roughness, sediment deposition may deflect the flow, which also promotes lateral erosion and widening (Finnegan et al., 2005; Fuller et al., 2016). Contrary to experimental devices specifically designed to address these issues (e.g., Finnegan et al., 2005; Fuller et al., 2016), direct observation of actual processes that drive lateral erosion in our experiments is made difficult by the small size of the topographic features, the depth of rivers being of millimeter scale, and the low grain size of the material used. Opacity due to the generation of the artificial rainfall also considerably limits direct observation during the runs. Despite these limitations, data suggest that lateral erosion and river widening in our experiments is also related to an increase in sediment flux. We show that knickpoints are locations of enhanced erosion well above the rate of base level fall. We document, for example, mean erosion rates greater than 5 times the base level fall rate, with extreme values up to a factor of 8 locally (Figs. 11 and 12). Downstream, where rivers widen, we observe that the general decrease in erosion rate is also associated with local deposition in some parts of the channels (for example at runtime 915 min in Fig. 11 or 975 min in Figs. 10 to 12). We thus hypothesize that lateral erosion and widening are due in part to the increased sediment flux related to enhanced erosion on knickpoints. Further work is needed to test this hypothesis, for example by investigating in detail spatiotemporal variations in erosion and sedimentation during width widening.
Further work is also needed to better understand how knickpoints initiate after the phases of widening, in particular for determining whether river narrowing drives the formation of the knickpoints (e.g., Amos and Burbank, 2007) or whether narrowing is a consequence of steepening (e.g., Finnegan et al., 2005). Some studies that investigated river response to increased uplift rate show that narrowing alone, at a constant river gradient, can allow rivers to increase their incision rate (Lavé and Avouac, 2001; Duvall et al., 2004; Amos and Burbank, 2007). In this context, Amos et al. (2007) propose a model in which the river response to an increase in uplift rate first involves width narrowing, with the increase in slope and formation of a knickpoint occurring only in a second stage if the increase in incision induced by narrowing is not sufficient to counteract the uplift rate. In our experiments here, we suggest that channel narrowing predates, and in fact enables, the steepening of the profile in the initial stages of knickpoint formation. Indeed, we observe that the transition from a wide to a narrow channel occurs very quickly, at a smaller timescale than the time interval between two successive digitizations of the experiments (5 min), and the knickpoints that form then have a very gentle slope, which then amplifies as they migrate upstream (Fig. 7). This suggests that it is not the steepening that drives river narrowing but, on the contrary, that narrowing is essential for knickpoints to initiate. Further work would also be needed to verify this hypothesis, in particular with additional experiments with much higher frequency of data acquisition to capture these changes in much more detail.
4.3 Implications
Knickpoints in river longitudinal profiles are commonly related to variations in tectonics or climate through their influence on base level and/or sediment supply (e.g., Whipple and Tucker, 1999; Crosby and Whipple, 2006; Kirby and Whipple, 2012; Whittaker and Boulton, 2012) and are then used to highlight such changes when interpreting their occurrence in natural systems. The recognition here that knickpoints may be generated autogenically due to cycles of river widening and narrowing is then of first importance for retrieving information on tectonics and climate from their record in landscapes in the form of knickpoints. Finding criteria that could be used in the analysis of natural systems to differentiate these autocyclic knickpoints from those formed in response to tectonics or climate would be an important step in the continuation of this work. A specificity of knickpoints in our experiments is to initiate downstream with a gentle slope, which subsequently steepens in the early stages of migration, and as a hypothesis we suggest that this may be characteristic of their autogenic formation following the mechanism described here. Being able to recognize these autogenic knickpoints would also be important for studies that investigate knickpoint propagation (e.g., Crosby and Whipple 2006; Berlin and Anderson, 2007; Schwanghart and Scherler, 2020) because knickpoints in our experiments are characterized by an upward dynamic of retreat that is not conventional. According to stream-power-based celerity models, these studies consider that the upstream propagation rate of knickpoints depends inversely on drainage area (a proxy for discharge; Crosby and Whipple, 2006; Berlin and Anderson, 2007), implying a monotonous decrease in their retreat rate as they propagate upstream due to the progressive reduction in drainage area and water discharge. This property is used for example to invert their present location for dating the external perturbation responsible for their formation (Crosby and Whipple, 2006; Berlin and Anderson, 2007). Here, knickpoints in our experiments first accelerate during their initial stages of propagation before decelerating a second time as they approach the divide (Fig. 9). Only this later phase of decreasing knickpoint velocity in the upstream part of rivers (for normalized distance NDD > nDD: Fig. 9) is consistent with predictions from stream-power-based celerity models (see Fig. S5). By contrast, a sole control by drainage area and discharge cannot explain the increase in velocity observed in the downstream sections (for NDD < nDD: Fig. 9), which implies an additional controlling factor. We suggest that this specific mode of retreat downstream is related to the progressive steepening of the knickpoints rather than to a purely hydrologic control. Deciphering the respective roles of slope and discharge in the retreat dynamics documented would require further in-depth analysis, particularly during the early stages of initiation and propagation which appear to be specific to the autogenic mechanism defined here.
We show that the formation of knickpoints in our experiments is closely related to periods of decreasing erosion rate as the rivers widen, counterbalanced by increasing rates greater than the rate of base level fall as the rivers narrow and knickpoints form. Thus, the sequential evolution of longitudinal profiles is very similar to the geometry that would be observed if the system was forced by discrete drops of the base level, rather than by a continuous drop as is actually the case. We did not measure the sediment flux at the output of our models, but we can assume that it would be characterized by fluctuations controlled by the frequency of knickpoint initiation, superimposed on a longer-term increasing trend related to the growth of drainage networks. Some sediment outflux fluctuations were actually measured by Hasbargen and Paola (2000) in their experiments and interpreted as the consequence of knickpoint propagation. This study and our work illustrate that fluctuations in sediment flux can be observed at the catchment outlet despite constant forcing parameters when autocyclic knickpoints are generated in river systems.
By performing such exploratory experiments, we do not pretend to reproduce natural landscapes in the laboratory because of important scaling issues (see Paola et al., 2009, for an extensive reflection on this matter) but rather to highlight and document complex system behaviors under controlled conditions that could provoke further investigations. Our findings support ongoing investigations that aim to better understand the links between lateral erosion, channel geometry and valley width, which is an issue that has been emerging in the last years (e.g., Turowski, 2018; Croissant et al., 2019; Langston and Tucker, 2018; Baynes et al., 2020; Zavala-Ortiz et al., 2021). An outlook building on our work would be to investigate the mechanism of knickpoint generation driven by river width variations and the conditions that lead to their formation using landscape evolution models that incorporate lateral erosion and a dynamic river width (e.g., Davy et al., 2017; Carretier et al., 2018; Langston and Tucker, 2018). Simulations of Langston and Tucker (2019) highlight the role of bedrock erodibility as an important factor controlling lateral migration of rivers and the width of valleys, an issue that has not been investigated here given the similarity of the eroded materials in our experiments here. This study also confirms the assumption of Hancock and Anderson (2002) that lateral erosion and widening occurs preferentially in contexts of low incision rates, i.e., in domains with a low uplift rate. It is likely in such contexts that the new mode of autogenic knickpoint formation driven by river width dynamics that we define in this study should apply.
Knickpoints in the longitudinal profile of rivers are commonly assumed to be incisional waves that propagate upstream through landscapes in response to changes in tectonics, climate or base level. Based on results from a set of laboratory experiments at the drainage basin scale that simulate the growth of drainage networks in response to constant base level fall and rainfall, we show that knickpoints also form autogenically, independent of any variations in these external forcing factors. In all experiments, successive knickpoints initiate and propagate upward throughout the duration of the experimental runs, independent of the rate of base level fall applied and of the size of the rivers as the catchments expand. Thanks to the computation of hydraulic information (water depth, river width, discharge and shear stress) using a hydrodynamic model, we show that the formation of knickpoints is driven by variations in river width at the outlet of catchments, and we highlight width widening as a main cause of instability leading to knickpoint formation. Widening entails a decrease in shear stress and an incision rate lower than the rate of base level fall, resulting in an unstable situation that ends up with a sequence of width narrowing, increasing shear stress and incision rate as a knickpoint initiates. Rivers in our experiments thus evolve following sequences of width widening and narrowing that drive the initiation and propagation of successive knickpoints. As a result, incision is fundamentally discontinuous over time despite continuous forcing. It occurs during discrete events of knickpoint propagation that allow the rivers to recover from the incision delay accumulated during widening periods.
The Floodos software is available at https://doi.org/10.5281/zenodo.6037711 (Davy, 2022).
The experimental data are available from Stéphane Bonnet on request.
The supplement related to this article is available online at: https://doi.org/10.5194/esurf-10-229-2022-supplement.
SB designed the experimental device. LdL, SB and AG built the experimental setup and carried out the experiments. LdL analyzed the data with the help of SB and PD. All authors discussed the data. LdL and SB wrote the paper with input from AG and PD.
The contact author has declared that neither they nor their co-authors have any competing interests.
This work was supported by ORANO-Malvesi and the CNRS-INSU Tellus-Syster program. We thank Sebastien Carretier and Odin Marc for fruitful discussions and Jens Turowski for his comments on a preliminary version of this paper. We thank Laure Guerit and an anonymous reviewer for their constructive comments, which greatly improved the paper.
This paper was edited by Fiona Clubb and reviewed by Laure Guerit and one anonymous referee.
Amos, C. B. and Burbank, D. W.: Channel width response to differential uplift, J. Geophys. Res., 112, F02010, https://doi.org/10.1029/2006JF000672, 2007.
Baynes, E. R. C., Lague, D., Attal, M., Gangloff, A., Kirstein, L. A., and Dugmore, A. J.: River self-organisation inhibits discharge control on waterfall migration, Scient. Rep., 8, 2444, https://doi.org/10.1038/s41598-018-20767-6, 2018.
Baynes, E. R. C., Lague, D., Steer, P., Bonnet, S., and Illien, L.: Sediment flux-driven channel geometry adjustment of bedrock and mixed gravel–bedrock rivers, Earth Surf. Proc. Land., 45, 3714–3731, https://doi.org/10.1002/esp.4996, 2020.
Berlin, M. M. and Anderson, R. S.: Modeling of knickpoint retreat on the Roan Plateau, western Colorado, J. Geophys. Res., 112, F03S06, https://doi.org/10.1029/2006JF000553, 2007.
Bigi, A., Hasbargen, L. E., Montarani, A., and Paola, C.: Knickpoints and hillslope failure: Interactions in a steady-state experimental landscape, in: Tectonics, Climate and Landscape evolution, Geological Society of America Special paper 398, edited by: Willet, C. D., Hovius, N., Brandon, M. T., and Fisher, D. M., Geological Society of America, 295–307, https://doi.org/10.1130/2006.2398(18), 2006.
Bonnet, S.: Shrinking and splitting of drainage basins in orogenic landscapes from the migration of the main drainage divide, Nat. Geosci., 2, 766–771, https://doi.org/10.1038/ngeo666, 2009.
Bonnet, S. and Crave, A.: Landscape response to climate change: Insights from experimental modeling and implications for tectonic versus climatic uplift of topography, Geology, 31, 123–126, https://doi.org/10.1130/0091-7613(2003)031<0123:LRTCCI>2.0.CO;2, 2003.
Bufe, A., Paola, C., and Burbank, D. W.: Fluvial beveling of topography controlled by lateral channel mobility and uplift rate, Nat. Geosci., 9, 706–710, https://doi.org/10.1038/ngeo2773, 2016.
Cantelli, A. and Muto, T.: Multiple knickpoints in an alluvial river generated by a single drop in base level: experimental investigation, Earth Surf. Dynam., 2, 271–278, https://doi.org/10.5194/esurf-2-271-2014, 2014.
Carretier, S., Godderis, Y., Maertinez, J., Reich, M., and Martinod, J.: Colluvial deposits as a possible weathering reservoir in uplifting mountains, Earth Surf. Dynam., 6, 217–237, https://doi.org/10.5194/esurf-6-217-2018, 2018.
Cook, K. L., Turowski, J. M., and Hovius, N.: A demonstration of the importance of bedload transport for fluvial bedrock erosion and knickpoint propagation, Earth Surf. Proc. Land., 38, 683–695, https://doi.org/10.1002/esp.3313, 2013.
Cook, K. L., Turowski, J. M., and Hovius, N.: River gorge eradication by downstream sweep erosion, Nat. Geosci., 7, 682–686, https://doi.org/10.1038/NGEO2224, 2014.
Croissant, T., Lague, D., and Davy, P.: Channel widening downstream of valley gorges influenced by flood frequency and floodplain roughness, J. Geophys. Res.-Earth, 124, 154–174, https://doi.org/10.1029/2018JF004767, 2019.
Crosby, B. T. and Whipple, K. X.: Knickpoint initiation and distribution within fluvial networks: 236 waterfalls in the Waipaoa River, North Island, New Zealand, Geomorphology, 82, 16–38, https://doi.org/10.1016/j.geomorph.2005.08.023, 2006.
Davy, P.: Riverlab (version 6), Zenodo [code], https://doi.org/10.5281/zenodo.6037712, 2022.
Davy, P., Croissant, T., and Lague, D.: A precipition method to calculate river hydrodynamics, with applications to flood prediction, landscape evolution models, and braiding instabilities, J. Geophys. Res.-Earth, 122, 1491–1512, https://doi.org/10.1002/2016JF004156, 2017.
Duvall, A., Kirby, E., and Burbank, D.: Tectonic and lithologic controls on bedrock channel profiles and processes in coastal California, J. Geophys. Res., 109, F03002, https://doi.org/10.1029/2003JF000086, 2004.
Finnegan, N. J.: Interpretation and downstream correlation of bedrock river terrace treads created by propagation knickpoints, J. Geophys. Res.-Earth, 118, 54–64, https://doi.org/10.1029/2012JF002534, 2013.
Finnegan, N. J. and Dietrich, W. E.: Episodic bedrock strath terrace formation due to meander migration and cutoff, Geology, 39, 143–146, https://doi.org/10.1130/G31716.1, 2011.
Finnegan, N. J., Roe, G., Montgomery, D. R., and Hallet, B.: Controls on the channel width of rivers: Implications for modeling fluvial incision of bedrock, Geology, 33, 229–232, https://doi.org/10.1130/G21171.1, 2005.
Fuller, T. K., Perg, L. A., Willenbring, J. K., and Lepper, K.: Field evidence of climate-driven changes in sediment supply leading to strath terrace formation, Geology, 37, 467–470, https://doi.org/10.1130/G25487A.1, 2009.
Fuller, T. K., Gran, K. B., Sklar, L. S., and Paola, C.: Lateral erosion in an experimental bedrock channel: The influence of bed roughness on erosion by bed load impacts, J. Geophys. Res.-Earth, 121, 1084–1105, https://doi.org/10.1002/2015JF003728, 2016.
Grimaud, J.-L., Paola, C., and Voller, V.: Experimental migration of knickpoints: influence of style of base-level fall and bed lithology, Earth Surf. Dynam., 4, 11–23, https://doi.org/10.5194/esurf-4-11-2016, 2016.
Hancock, G. S. and Anderson, R. S.: Numerical modeling of fluvial strath-terrace formation in response to oscillating climate, Geol. Soc. Am. Bull., 114, 1131–1142, 2002.
Hartshorn, K., Hovius, N., Dade, W. B., and Slingerland, R. L.: Climate-driven bedrock incision in an active mountain belt, Science, 297, 2036–2038, 2002.
Hasbargen, L. E. and Paola, C.: Landscape instability in an experimental drainage basin, Geology, 24, 1067–1070, 2000.
Hasbargen, L. E. and Paola, C.: How predictable is local erosion rate in erosional landscape?, in: Prediction in Geomorphology, edited by: Wilcox, P. R. and Iverson, R. M., American Geophysical Union Geophysical Monograph 135, American Geophysical Union, https://doi.org/10.1029/135GM16, 2003.
Kirby, E. and Whipple, K. X.: Expression of active tectonics in erosional landscapes, J. Struct. Geol., 44, 54–75, https://doi.org/10.1016/j.jsg.2012.07.009, 2012.
Lague, D.: Reduction of long-term bedrock incision efficiency by short-term alluvial cover intermittency, J. Geophys. Res., 115, F02011, https://doi.org/10.1029/2008JF001210, 2010.
Lague, D., Crave, A., and Davy, P.: Laboratory experiments simulating the geomorphic response to tectonic uplift, J. Geophys. Res.-Solid, 108, 2008, https://doi.org/10.1029/2002JB001785, 2003.
Langston, A. L. and Tucker, G. E.: Developing and exploring a theory for the lateral erosion of bedrock channels for use in landscape evolution models, Earth Surf. Dynam., 6, 1–27, https://doi.org/10.5194/esurf-6-1-2018, 2018.
Lavé, J. and Avouac, J. P.: Fluvial incision and tectonic uplift across the Himalayas of central Nepal, J. Geophys. Res.-Solid, 106, 26561–26591, https://doi.org/10.1029/2001JB000359, 2001.
Li, T., Venditti, J. G., and Sklar, L. S.: An analytical model for lateral erosion from saltating bedload particle impacts, J. Geophys. Res.-Earth, 126, e2020JF006061, https://doi.org/10.1029/2020JF006061, 2021.
Mitchell, N. A. and Yanites, B. J.: Spatially variable increase in rock uplift in the Northern U.S. Cordillera recorded in the distribution of river knickpoint and incision depths, J. Geophys. Res.-Earth, 124, 1238–1260, https://doi.org/10.1029/2018JF004880, 2019.
Moussirou, B. and Bonnet, S.: Modulation of the erosion rate of an uplifting landscape by long-term climate change: An experimental investigation, Geomorphology, 303, 456–466, https://doi.org/10.1016/j.geomorph.2017.12.010, 2018.
Paola, C., Straub, K., Mohrig, D., and Reinhardt, L.: The “unreasonable effectiveness” of stratigraphic and geomorphic experiments, Earth-Sci. Rev., 97, 1–43, https://doi.org/10.1016/j.earscirev.2009.05.003, 2009.
Rohais, S., Bonnet, S., and Eschard, R.: Sedimentary record of tectonic and climatic erosional perturbations in an experimental coupled catchment-fan system, Basin Res., 24, 198–212, https://doi.org/10.1111/j.1365-2117.2011.00520.x, 2012.
Scheingross, J. S., Lamb, M. P., and Fuller, B. M.: Self-formed bedrock waterfalls, Nature, 567, 229–233, https://doi.org/10.1038/s41586-019-0991-z, 2019.
Schwanghart, W. S. and Scherler, D.: Divide mobility controls knickpoint migration on the Roan Plateau (Colorado, USA), Geology, 48, 698–702, https://doi.org/10.1130/G47054.1, 2020.
Singh, A., Reinhardt, L., and Foufoula-Georgiou, E.: Landscape reorganization under changing climatic forcing: Results from an experimental landscape, Water Resour. Res., 51, 4320–4337, https://doi.org/10.1002/2015WR017161, 2015.
Sklar, L. S. and Dietrich, W. E.: Sediment and rock strength controls on river incision into bedrock, Geology, 29, 1087–1090, 2001.
Sweeney, K. E., Roering, J. J., and Ellis, C.: Experimental evidence for hillslope control of landscape scale, Science, 349, 51–53, https://doi.org/10.1126/science.aab0017, 2015.
Tofelde, S., Savi, S., Wickert, A. D., Bufe, A., and Schildgen, T. F.: Alluvial channel response to environmental perturbations: fill-terrace formation and sediment-signal disruption, Earth Surf. Dynam., 7, 609–631, https://doi.org/10.5194/esurf-7-609-2019, 2019.
Turowski, J. M.: Alluvial cover controlling the width, slope and sinuosity of bedrock channels, Earth Surf. Dynam., 6, 29–48, https://doi.org/10.5194/esurf-6-29-2018, 2018.
Turowski, J. M., Lague, D., Crave, A., and Hovius, N.: Experimental channel response to tectonic uplift, J. Geophys. Res.-Earth, 111, F03008, https://doi.org/10.1029/2005JF000306, 2006.
Turowski, J. M., Lague, D., and Hovius, N.: Cover effect in bedrock abrasion: A new derivation and its implication for the modeling of bedrock channel morphology, J. Geophys. Res., 112, F04006, https://doi.org/10.1029/2006JF000697, 2007.
Turowski, J. M., Hovius, N., Meng-Long, H., Lague, D., and Men-Chiang, C.: Distribution of erosion across bedrock channels, Earth Surf. Proc. Land., 33, 353–363, https://doi.org/10.1002/esp.1559, 2008.
Whipple, K. X. and Tucker, G. E.: Dynamics of the stream-power river incision model: Im- plications for height limits of mountain ranges, landscape response times cales, and research needs, J. Geophys. Res., 104, 17661–17674, 1999.
Whittaker, A. C. and Boulton, S. J.: Tectonic and climatic controls on knickpoint retreat rates and landscape response times, J. Geophys. Res., 117, F02024, https://doi.org/10.1029/2011JF002157, 2012.
Whittaker, A. C., Cowie, P. A., Attal, M., Tucker, G. E., and Roberts, G. P.: Bedrock channel adjustment to tectonic forcing: Implications for predicting river incision rates, Geology, 35, 103–106, https://doi.org/10.1130/G23106A.1, 2007.
Wickert, A. D., Martin, J. M., Tal, M., Kim, W., Sheets, B., and Paola, C.: River channel lateral mobilitu: Metrics, time scales, and controls, J. Geophys. Res.-Earth, 118, 396–412, https://doi.org/10.1029/2012JF002386, 2013.
Zavala-Ortiz, V., Carretier, S., Regard, V., Bonnet, S., Riquelme, R., and Choy, S.: Along-stream variations in valley flank erosion rates measured using 10Be concentrations in colluvial deposits from canyons in the Atacama Desert, Geophys. Res. Lett., 48, e2020GL089961, https://doi.org/10.1029/2020GL089961, 2021.