the Creative Commons Attribution 4.0 License.
the Creative Commons Attribution 4.0 License.
 | 31 Mar 2022
Signal response of the Swiss plate geophone monitoring system impacted by bedload particles with different transport modes
Zheng Chen
Siming He
Tobias Nicollier
Lorenz Ammann
Alexandre Badoux
Dieter Rickenmann
Controlled experiments were performed to investigate the acoustic signal response of the Swiss plate geophone (SPG) system impacted by bedload particles varying in size, impact angle, and transport mode. The impacts of bedload particles moving by saltation, rolling, and sliding were determined by analyzing the experimental videos and corresponding vibration signals. The finite element method (FEM) was utilized to construct a numerical model of the SPG system and to simulate the signals triggered by a quartz sphere hitting the plate at impact angles ranging from 0∘ to 90∘. For a particle impact on the bed or on the geophone plates, the signature of the generated signal in terms of maximum amplitude, number of impulses, and centroid frequency was extracted from the raw monitoring data. So-called signal packets were determined by performing a Hilbert transform of the raw signal. The number of packets was calculated for each transport mode and for each particle size class, with sizes ranging from 28.1 to 171.5 mm. The results show how the number of signal impulses per particle mass, the amplitude of the signal envelope, and the centroid frequency change with increasing particle size, and they also demonstrate the effect of bedload transport mode on the signal response of the SPG system. We found that there is a general increase in the strength of the signal response or in the centroid frequency when the transport mode changes from sliding to rolling to saltation. The findings of this study help us to better understand the signal responses of the SPG system for different bedload transport modes, and may also contribute to an improvement of the procedure to determine bedload particle size from the SPG signal.
- Article
(9283 KB) - Full-text XML
- BibTeX
- EndNote


Quantification of bedload transport processes constitutes a significant challenge in river dynamics and can provide a prerequisite for the design of hydraulic engineering structures and for the assessment of natural hazards (Rickenmann, 2016). Additionally, measurements of bedload transport rates in both the laboratory and the field help to improve our understanding of its transport mechanism and to validate existing models or formulas (Habersack and Laronne, 2002; Schneider et al., 2015; Rickenmann, 2020).
In general, there are two types of methods for measuring bedload transport rates: (1) direct methods to measure the transported bedload mass, which involve installing physical samplers and traps on the river bed for some time frame (Bunte et al., 2004; Childers, 1999; Emmett, 1980; Hayward, 1980; Helly and Smith, 1971; Gray et al., 2010; Ryan et al., 2005), and (2) indirect methods, in particular acoustic-based monitoring devices, including piezoelectric sensors (Krein et al., 2008; Rickenmann and McArdell, 2007), hydrophones (Barton et al., 2010; Camenen et al., 2012; Rigby et al., 2015, 2016; Geay et al., 2017, 2020), an ADCP (acoustic Doppler current profiler) (Rennie et al., 2017; Conevski et al., 2019), pipe microphones (Mizuyama et al., 2010), geophones (Antoniazza et al., 2020; Rickenmann et al., 2012, 2014; Rickenmann, 2017), and seismic sensors (Bakker et al., 2020; Farin et al., 2019; Gimbert et al., 2019; Roth et al., 2017; Tsai et al., 2012).
The advantage of the indirect bedload measuring method is that it provides long-term continuous data on bedload transport (Rickenmann, 2017). In comparison, the direct bedload measuring method is suited to gravel-bed streams under the condition of low or medium discharge levels and typically a relatively short sampling duration (Gray et al., 2010), and taking bedload samples can be challenging in the case of large flow discharges and steep streams (Rickenmann and Fritschi, 2017; Nicollier et al., 2019). However, indirect measurements must be calibrated using direct methods (Wyss et al., 2016a, b).
Acoustic-based indirect devices record the vibration signals generated by bedload particles impacting on a stream bed, an impact plate, or an impact pipe (Rickenmann, 2017). The acoustic vibration signal contains information, e.g., in terms of amplitude, impulses, and the characteristic frequency (Barton et al., 2006; Burtin et al., 2008, 2010, 2011; Govi et al., 1993; Hsu et al., 2011; Tsai et al., 2012; Vasile, 2020), which can be used to infer the bedload transport rates (Wyss et al., 2016a, b; Nicollier et al., 2020). One such method, the Swiss plate geophone (SPG) system, is a robust monitoring device that records the acoustic signal generated by bedload particles impacting onto steel plates. The SPG system has been deployed at more than 20 field sites, mainly across Europe (Rickenmann, 2017), with the aim of deriving bedload fluxes and particle size distributions (Wyss et al., 2014, 2016c). Significant differences between field-based calibration relationships were found to be possibly caused by variations in particle impact location and impact angle (Turowski et al., 2013), particle shape (Cassel et al., 2021; Krein et al., 2008), streamflow velocity (Rickenmann et al., 2014; Wyss et al., 2016a), grain size distribution (Nicollier et al., 2021a), and particle transport mode (Krein et al., 2008; Turowski and Rickenmann, 2009; Turowski et al., 2015).
In addition to field calibration measurements, controlled flume experiments were conducted with different types of acoustic devices (Beylich and Laute, 2014; Møen et al., 2010; Mizuyama et al., 2010; Wyss et al., 2016a) to investigate their suitability for monitoring bedload transport with variable transport modes (Tsakiris et al., 2014). In particular, saltation, rolling, and sliding are the bedload transport modes that influence the acoustic signal responses of geophones or other acoustic sensors (Tsakiris et al., 2014), thus affecting the signal–bedload calibration relations. Previous studies have shown that particles transported in the rolling and sliding modes are associated with greater signal power at lower frequencies compared to salting particles (Krein et al., 2008). This finding was also supported by a flume experiment with a geophone impact plate and unisized spherical glass beads with different transport modes (Tsakiris et al., 2014). Additionally, the signal responses of the geophone were observed to depend both on the flow conditions and on the transport modes (Tsakiris et al., 2014). It is therefore important to quantify the effect of the transport mode on the signal response, as this will eventually affect the signal-based particle size classification.
Controlled outdoor flume experiments with the SPG system (Nicollier et al., 2021a) were carried out to better understand the influence of the transport mode. However, the flow conditions (turbidity, illumination) sometimes impaired the clarity of the videos that were recorded by a camera during the experiments to capture the motion characteristics of the bedload particles. A way to extend the experimental data is to apply the finite element method (FEM), which has already been used successfully to simulate the structural dynamic responses of an SPG system impacted by a quartz sphere falling vertically onto the SPG plate (Chen et al., 2021, 2022). The dynamic response of the SPG system, which corresponds to the recorded signal, can be fully described by partial differential equations (PDEs) based on elastoplastic mechanics, and these PDEs can be numerically solved by the FEM formulations, resulting in a system of algebraic equations. The FEM simulation is also used here for non-vertical impacts to investigate the effects of different bedload impact angles, covering a wide range of angles for the transport modes (saltation, rolling, and sliding) observed in the flume experiments.
The aim of the present work is to investigate how the signal response of an SPG system impacted by bedload particles changes for different transport modes. First, controlled flume experiments and inclined chute experiments were performed with natural bedload particles and quartz spheres. On the basis of the video material recorded during these experiments, we compared the motion of the bedload particles (including the transport mode, impact position, and impact instant) for each impact event with the acoustic signal recorded by the SPG system. Second, a FEM model of the SPG system was used to simulate the signal responses of the SPG system produced by quartz spheres with varying impact angles ranging from 0∘ to 90∘ for different particle sizes, and the results were compared with the observations from the inclined chute experiment. Data from the physical experiments and the numerical simulations were analyzed quantitatively in terms of signal responses for each transport mode and for changing particle size.
In this section, we introduce in turn the controlled experiments, including the controlled flume experiments and inclined chute experiments, numerical simulations with the FEM model, methods of transport mode analysis, and signal processing.
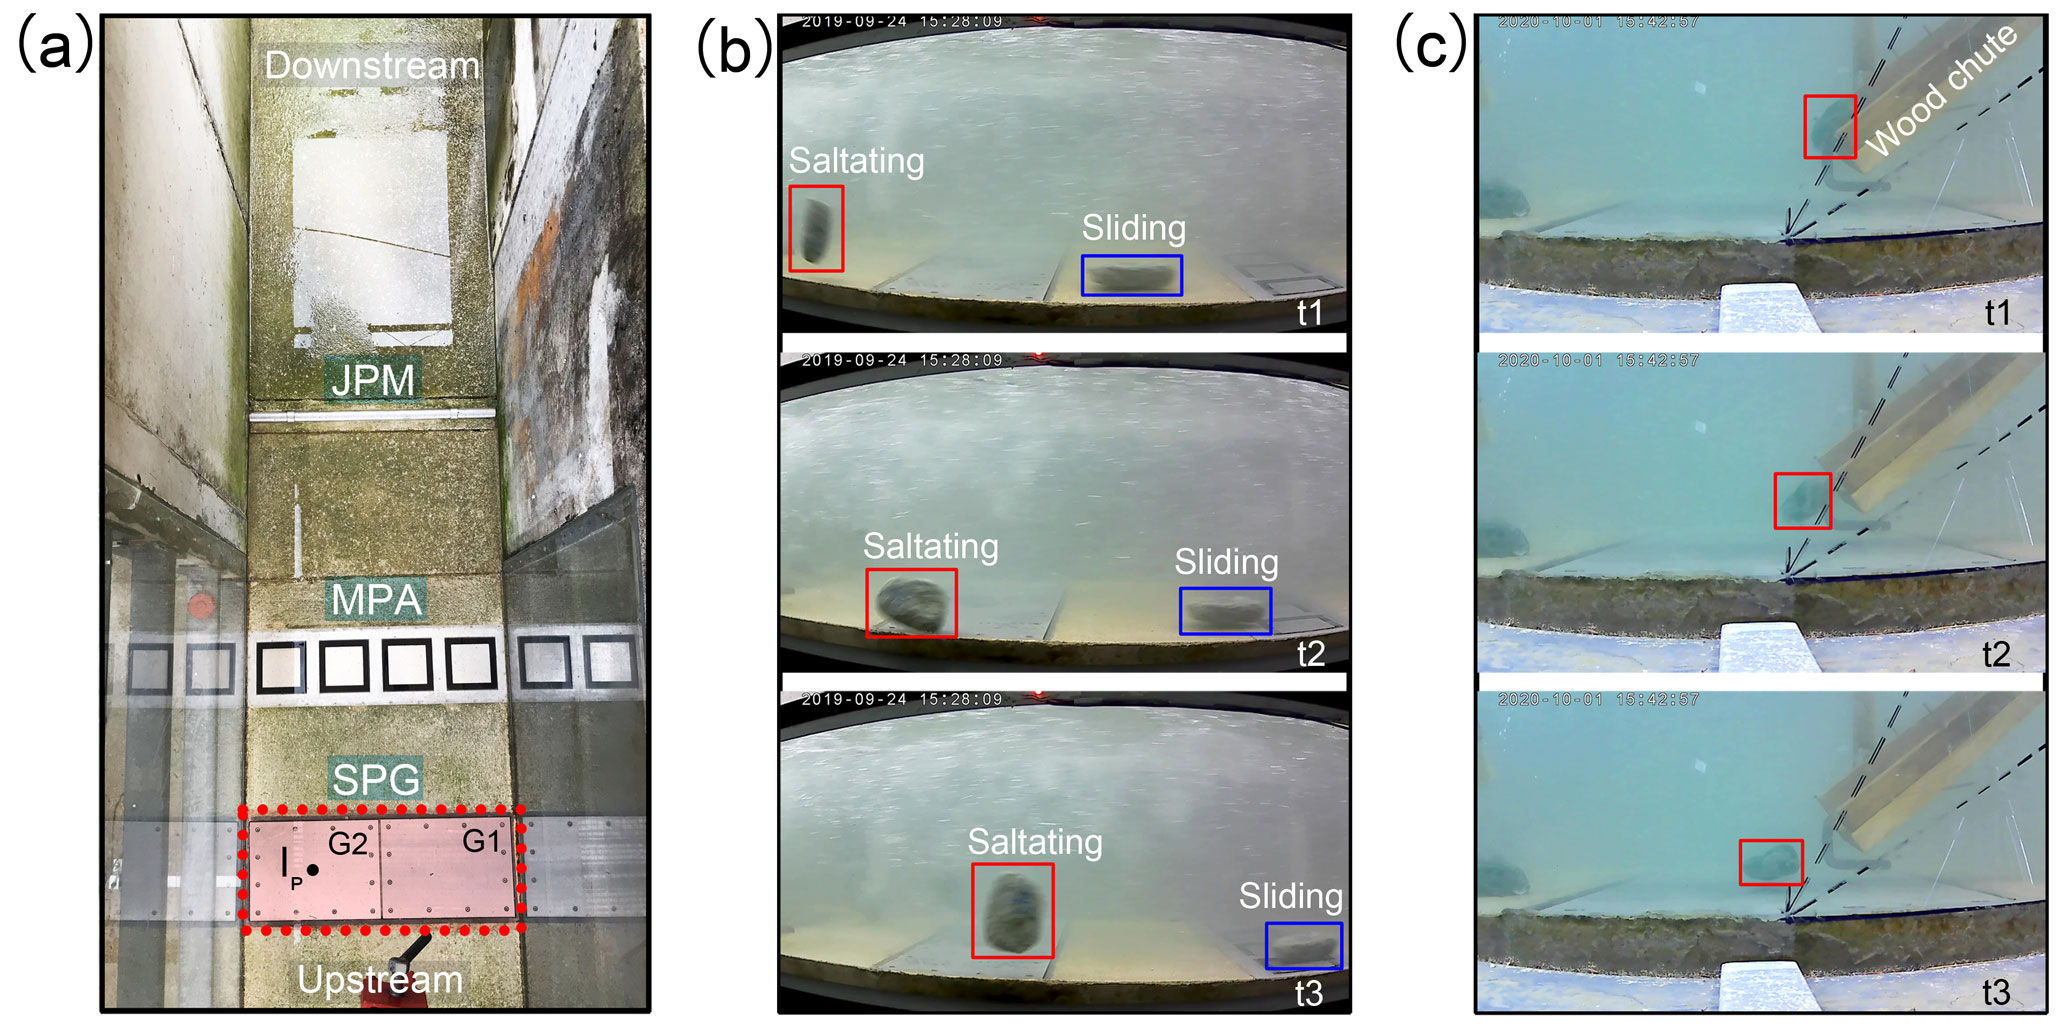
Figure 1Measuring site at the Obernach experimental flume. (a) Measuring reach with different types of sensors mounted on the flume bed, including the Swiss plate geophone (SPG), the miniplate accelerometer (MPA), and the Japanese pipe microphone (JPM). (b) Frames from a video recorded during a controlled flume experiment that were used to track particles (mean b axis = 127.9 mm) impacting onto and moving over the SPG plates. The particle marked with the red rectangle is transported in saltation, while the one marked with the blue rectangle is sliding. (c) Frames from a video recorded during a drop experiment with a wood chute inclined at an angle of 45∘. G1 and G2 in (a) are two plates of the SPG system, and the black dot next to IP marks the impact location of the bedload particles on plate G2 for the inclined chute experiments. The time interval between consecutive frames for each column in (b) and (c) is s. The length of the geophone plate in the flow direction is 0.36 m.
2.1 Controlled experiments
2.1.1 Experimental setup
Full-scale controlled flume experiments were performed with natural bedload particles varying in size (Nicollier et al., 2019, 2020, 2021a) using an outdoor experimental facility at the Oskar von Miller Institute of the Technical University of Munich in Obernach, Germany. The entire experimental system can be divided into several parts: the flume channel made of concrete; the measuring reach equipped with different types of sensors (Fig. 1a), namely the Swiss plate geophone (SPG) system, the miniplate accelerometer (MPA), and the Japanese pipe microphone (JPM); and the basin for collecting and recycling bedload particles. This experimental system enables quantitative investigations regarding the process of bedload transport, including observations of the characteristics of the motion of the particles and measurements of the vibration signals during the bedload transport process. The experimental channel reach used in this study has a rectangular cross section, a length of 24 m, a width of 1.02 m, a maximum depth of 2.02 m, and a slope of 4 % (Nicollier et al., 2019). The channel bed roughness is due to gravel particles with sizes corresponding to D67 and D84 (see Table 1) of the bedload material sampled at the Navisence field site in Switzerland. These particles are embedded in concrete, with about half of each particle protruding into the flow. The SPG system is installed in the measuring reach (Fig. 1a) with the plates mounted flush with the channel bed and the geophone sensor recording the vertical vibration (displacement velocity) of the plate. The side wall of the measuring reach is made from plexiglass to enable video observations.
2.1.2 Flume experiments
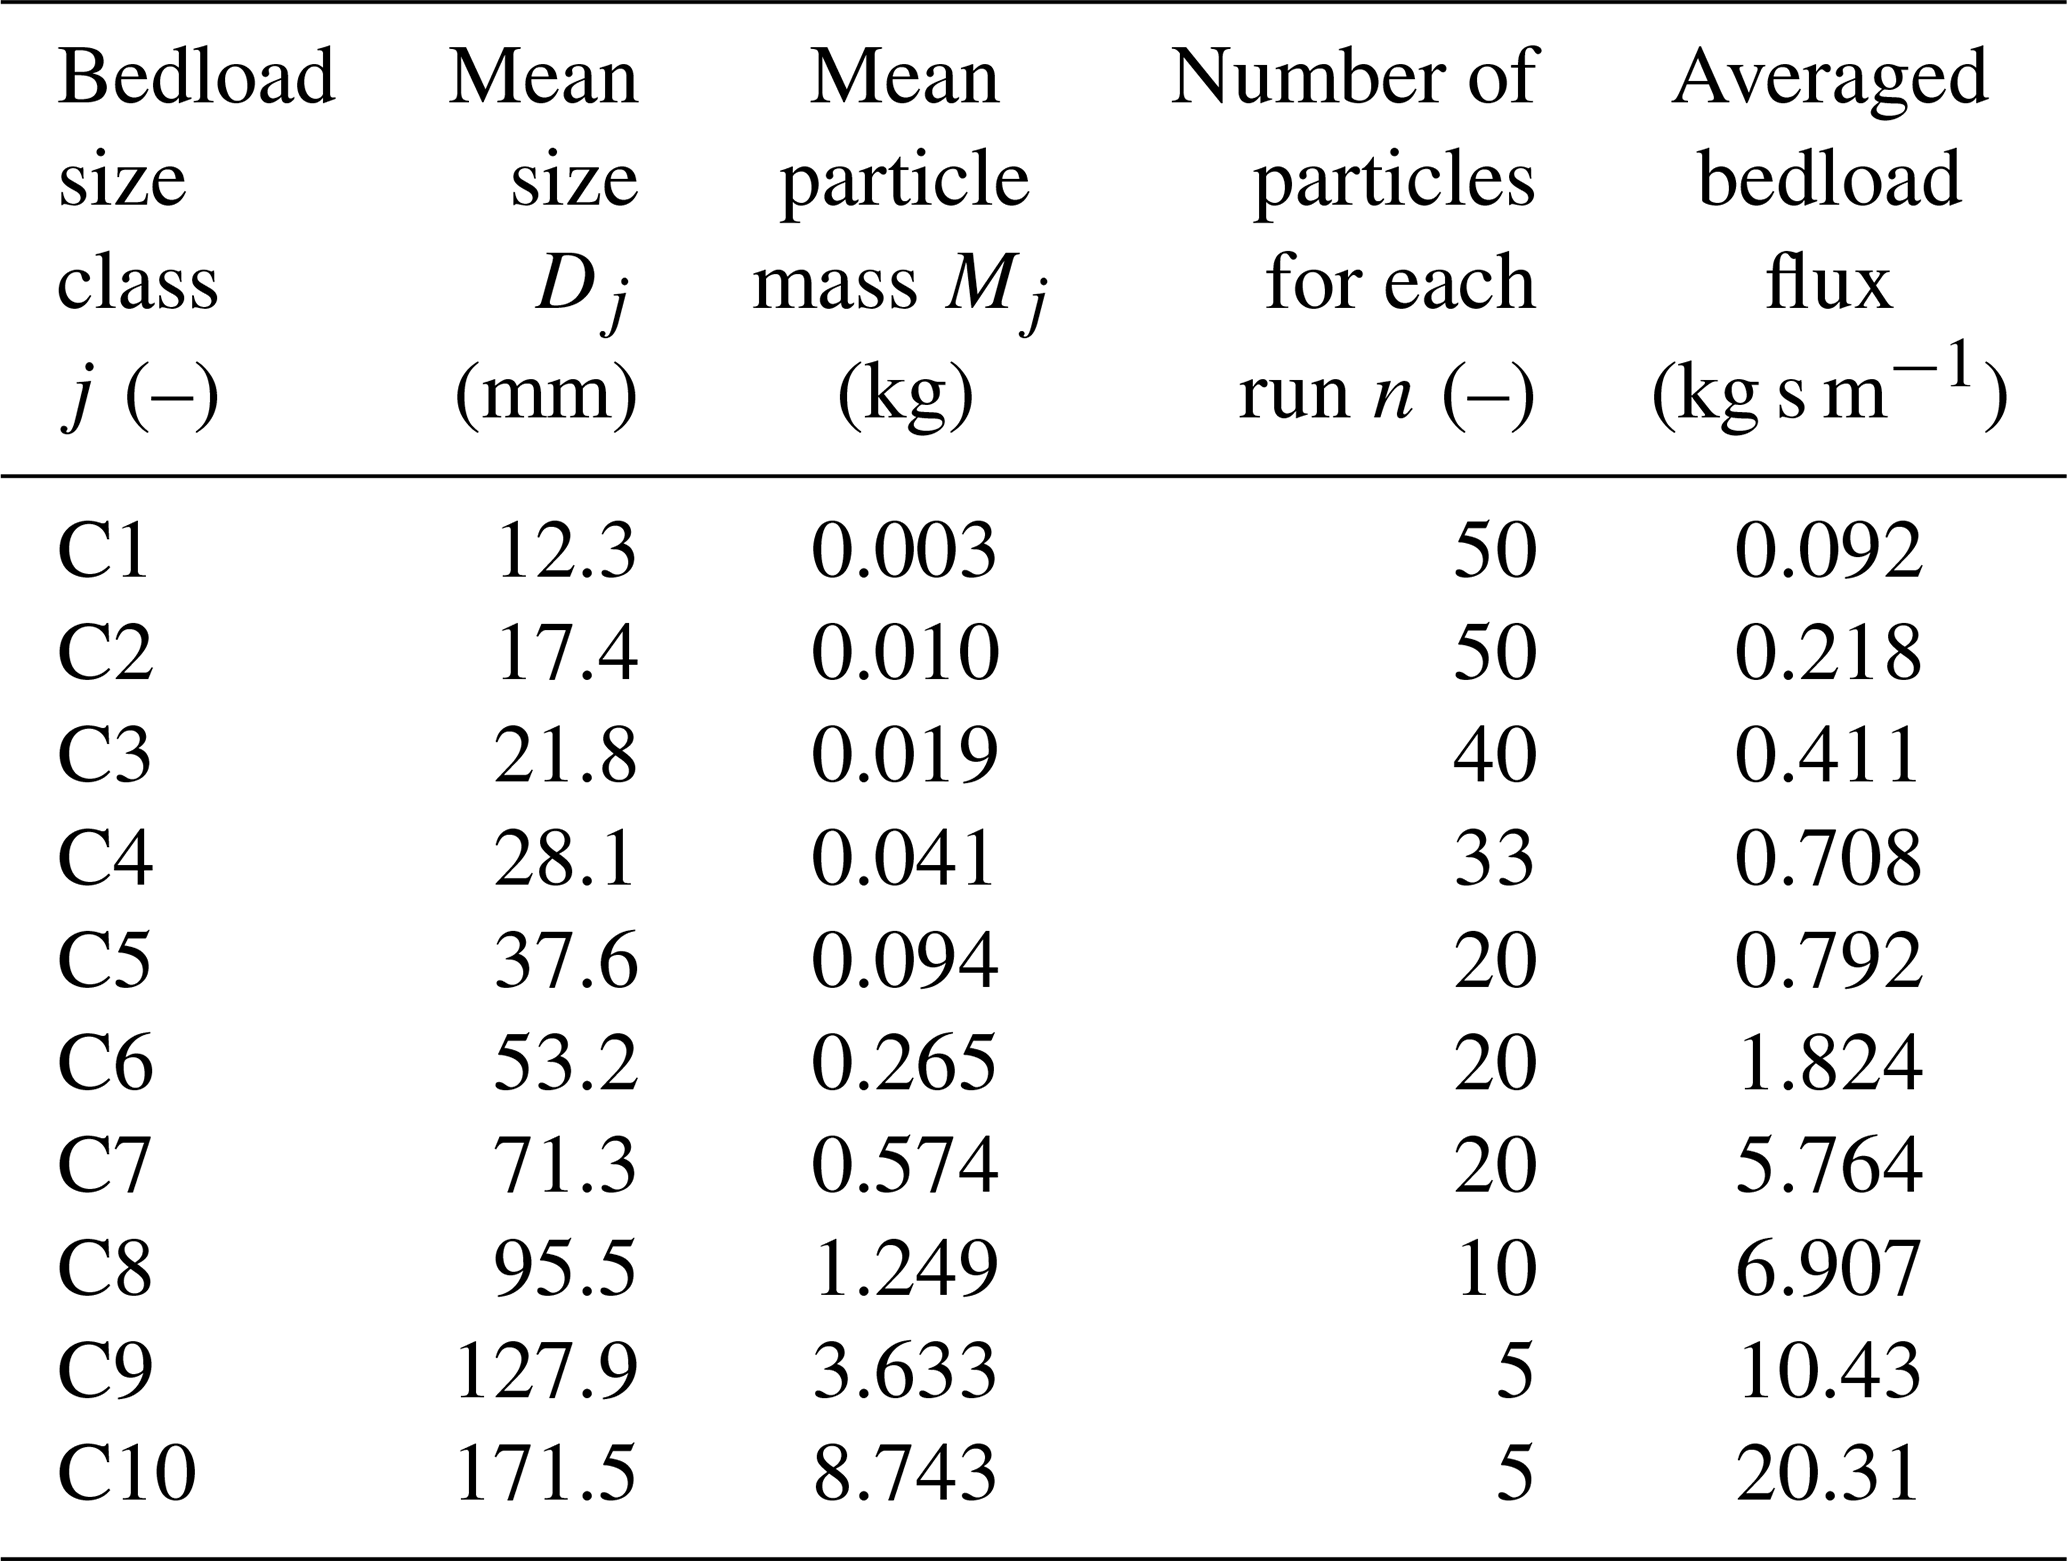
During the flume experiments, the flow velocity and flow depth were adjusted to match that at the Navisence field site. The experimental flow rate was maintained constant and the flow was roughly uniform along the experimental reach, with a flow depth of about 0.54 m. The flow velocity was set to 3.3 m s−1 and monitored using a flow meter (OTT MFpro) positioned 0.1 m above the SPG plate in the middle of the cross section. Information on bed characteristics and hydraulic conditions is given in Table 1. Bedload particles with a natural shape were released into the flume several meters upstream of the SPG system. A Lenco camera was set in a side view perpendicular to the plexiglass side wall to record videos at 30 frames per second (FPS) throughout the duration of each experiment. Figure 1b shows typical images of two different particles of size class C9 moving over the SPG plates. The video recordings were analyzed frame by frame, and the instants when the bedload particles impacted on the concrete bed and the SPG plates were determined. In addition, the transport modes of the particle (i.e., saltation, rolling, or sliding, as illustrated in Fig. 3) were assessed from the videos. The experimental particles were sorted into ten size classes (C1–C10) ranging from 12.3 to 171.5 mm (Table 2). The averaged bedload fluxes for all particle size classes were estimated to range from 0.092 to 20.31 kg s m−1 (see also Table 2). In this study, only the data obtained from experiments involving the particle size classes C4–C10 are presented. Particle impacts for the size classes C1–C3, ranging from 12.3 to 21.8 mm, were difficult to distinguish in the videos due to (1) poor lighting conditions, resulting in low contrast in the video frame image, and (2) the large number of small-sized particles used in each experimental run.
Table 1Bed and flow conditions at the Navisence field site and in the flume experiments.
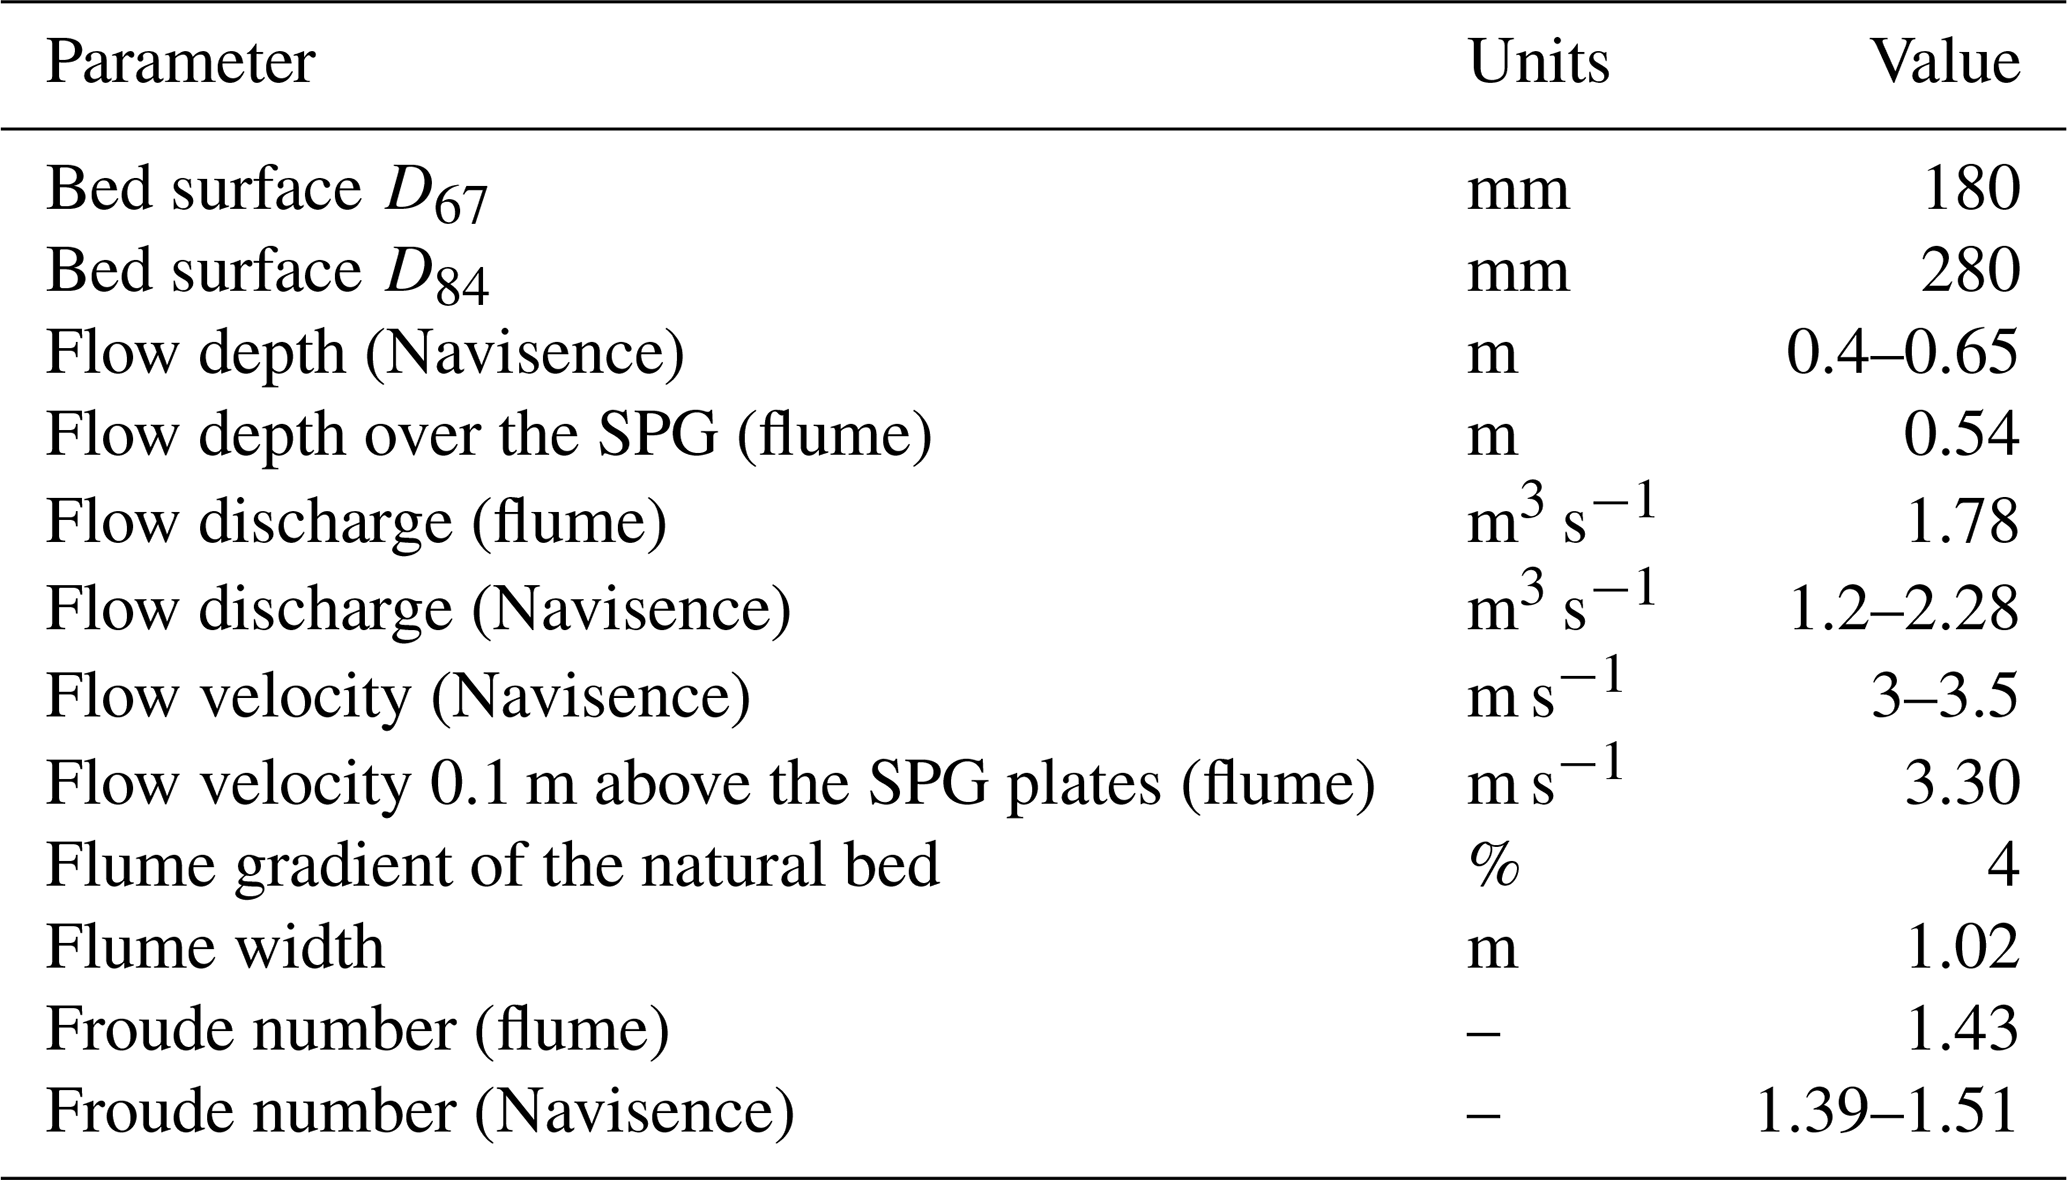
Table 2Bedload particle characteristics for each grain size class j.
2.1.3 Inclined chute experiments
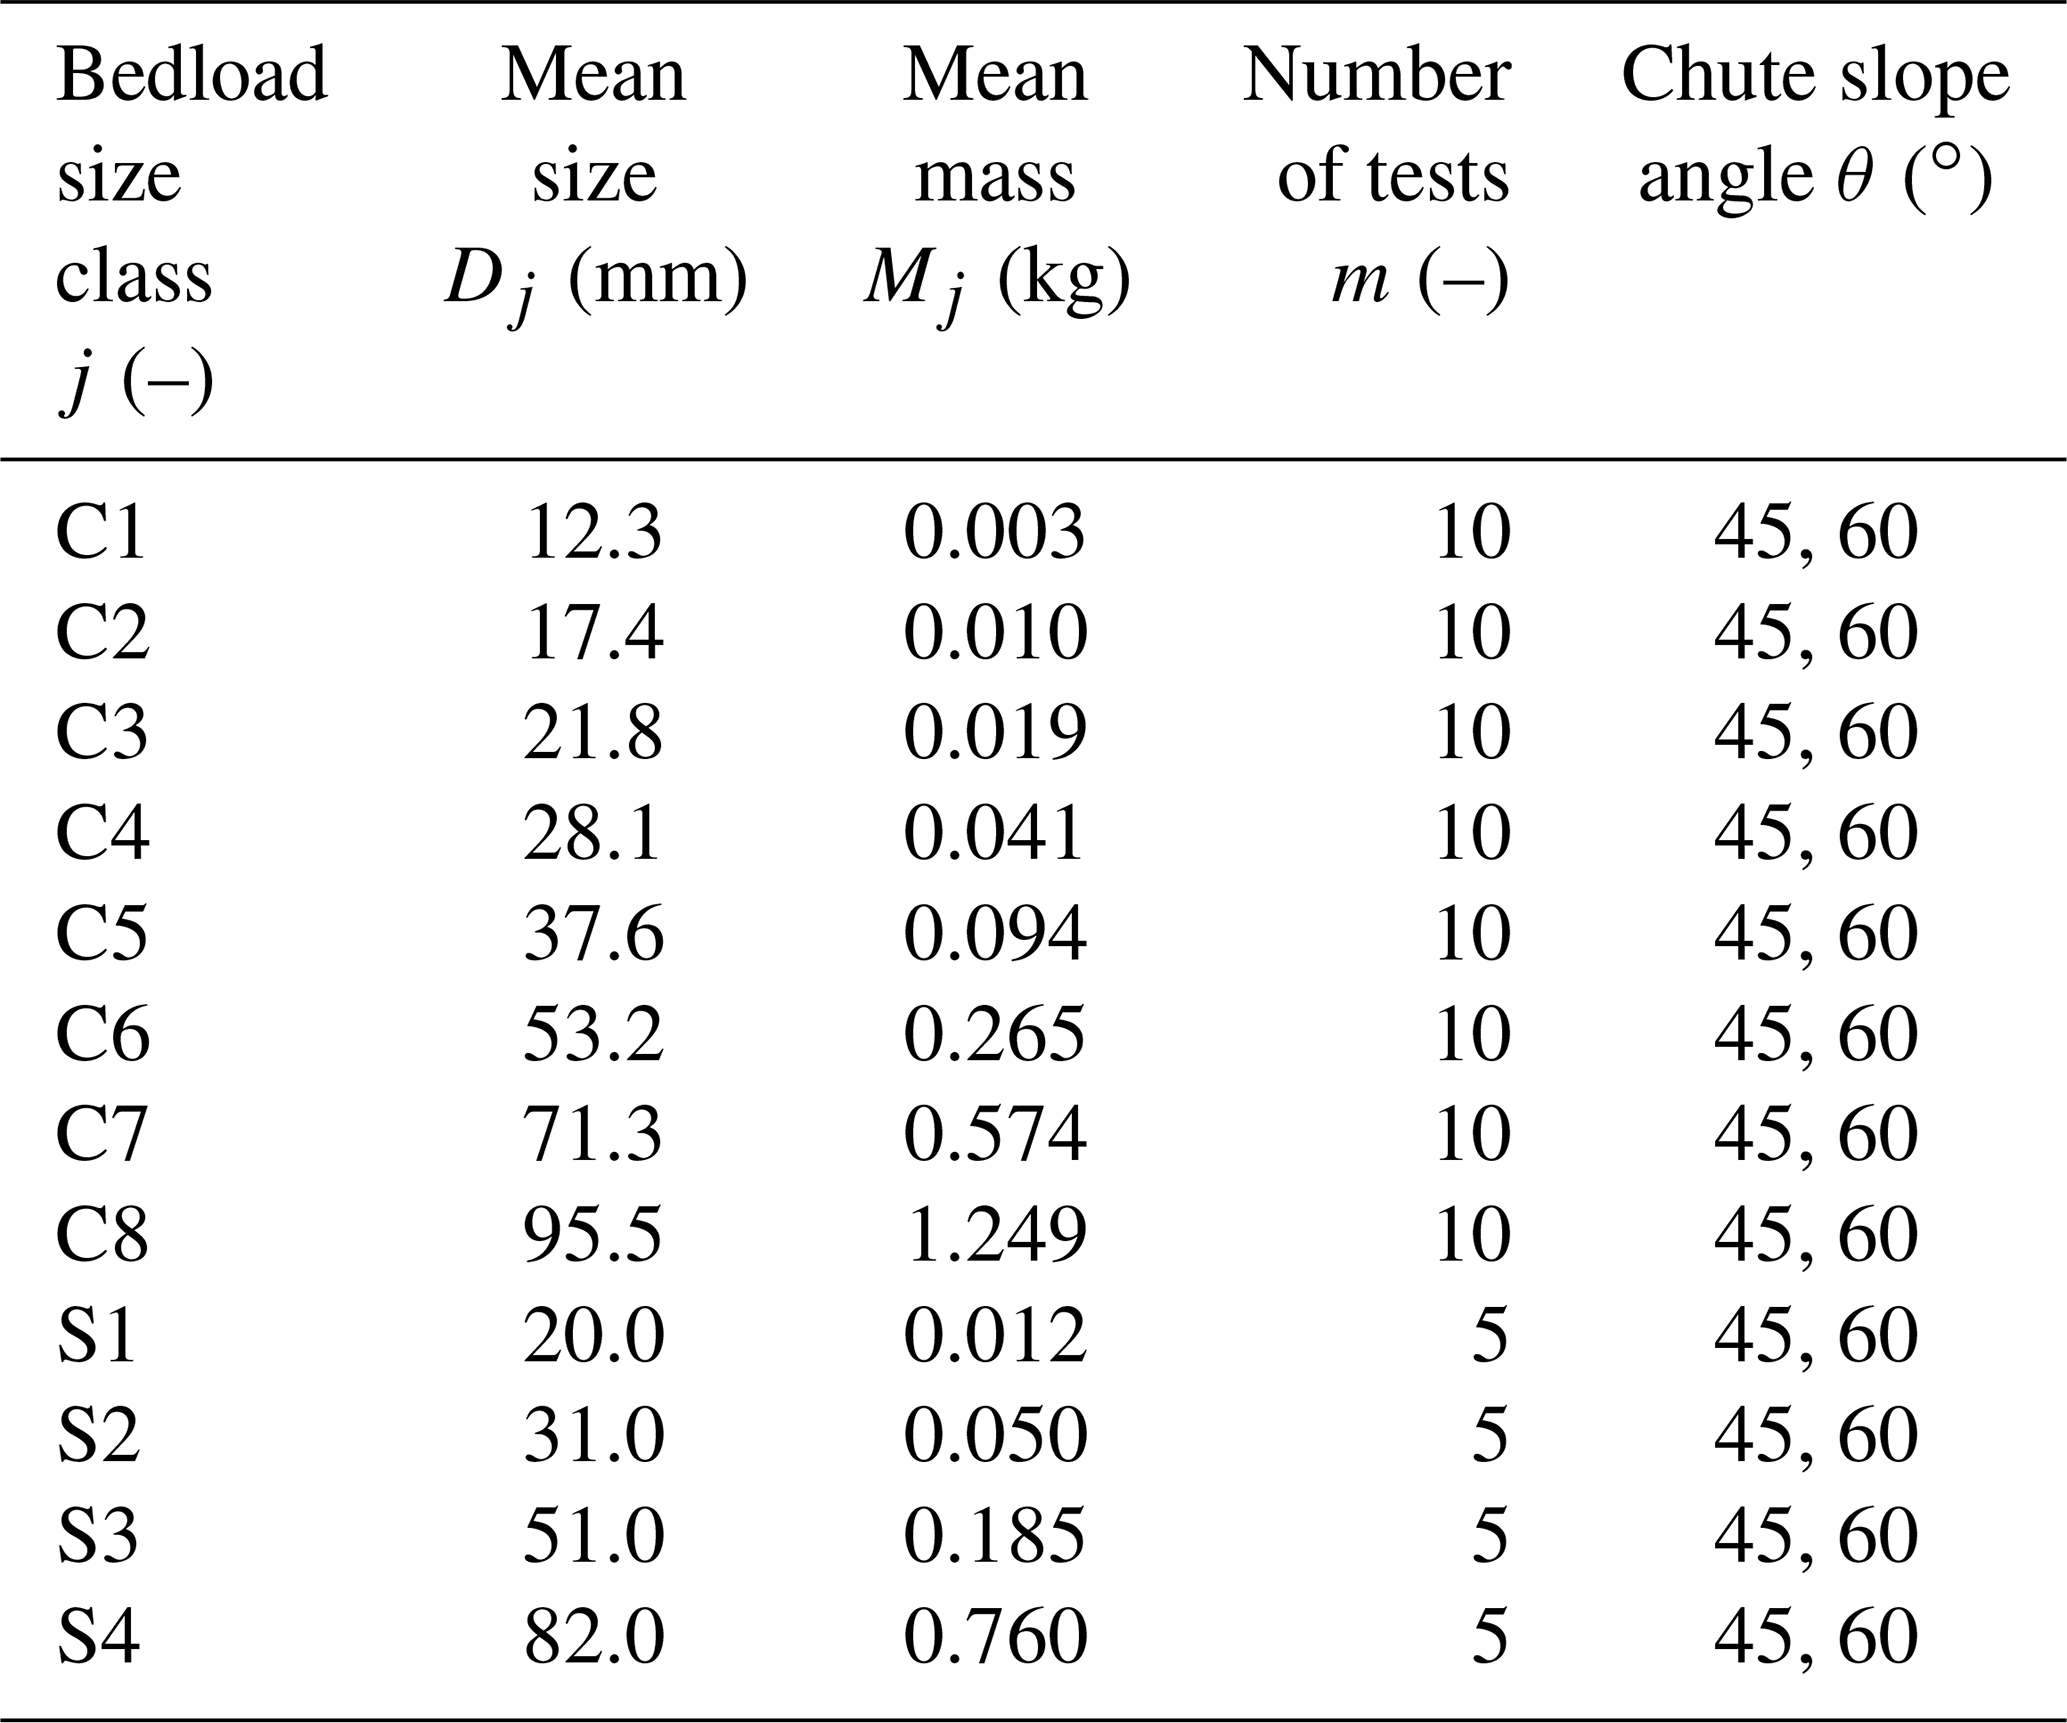
Significant differences between transport modes (saltation, rolling, and sliding) were observed with regard to the impact angle on the channel bed. Therefore, an inclined chute experiment was conducted in still water to examine the effect of particle impact angle on the signal response of the SPG system (Fig. 1c). The length of the chute was 1.0 m and the width was about 0.1 m. Due to the solid friction, it was difficult for the particles released at the top of the wood chute to keep moving at small chute angles. Hence, the experimental angles chosen for this study were 45∘ and 60∘ for natural bedload particles with sizes ranging from 12.3 to 95.5 mm (where the size is given as the b axis of the particle) and for spherical particles with sizes ranging from 20 to 82 mm (see Table 3). For each test, the flow velocity was around 0 m s−1 (no flow) and the water depth was 0.84 m. The impact velocity of the bedload particle on the SPG plates was determined to be about 3.7 and 4.1 m s−1 for chute angles of 45∘ and 60∘, respectively, considering the energy conservation law or by estimating the velocity using the experimental video frames. Note that the impact velocity in the inclined chute experiments is considerably higher than the average impact velocities of the particles in the flume experiments, which are generally estimated as fractions of a meter per second, and the investigated angles are rather steep compared to another study with smaller experimental particles (Auel et al., 2017b). The inclined chute experiments were performed in this study to investigate the effect of impact angle on the SPG signal responses and to compare with the results obtained by the numerical model introduced below.
Table 3Mean particle size Dj and mass Mj and number of test repetitions m for bedload particle size class j for the impact experiments with channel angles of 45∘ and 60∘. S1, S2, S3, and S4 refer to four quartz spheres of increasing size.
2.2 Numerical simulations
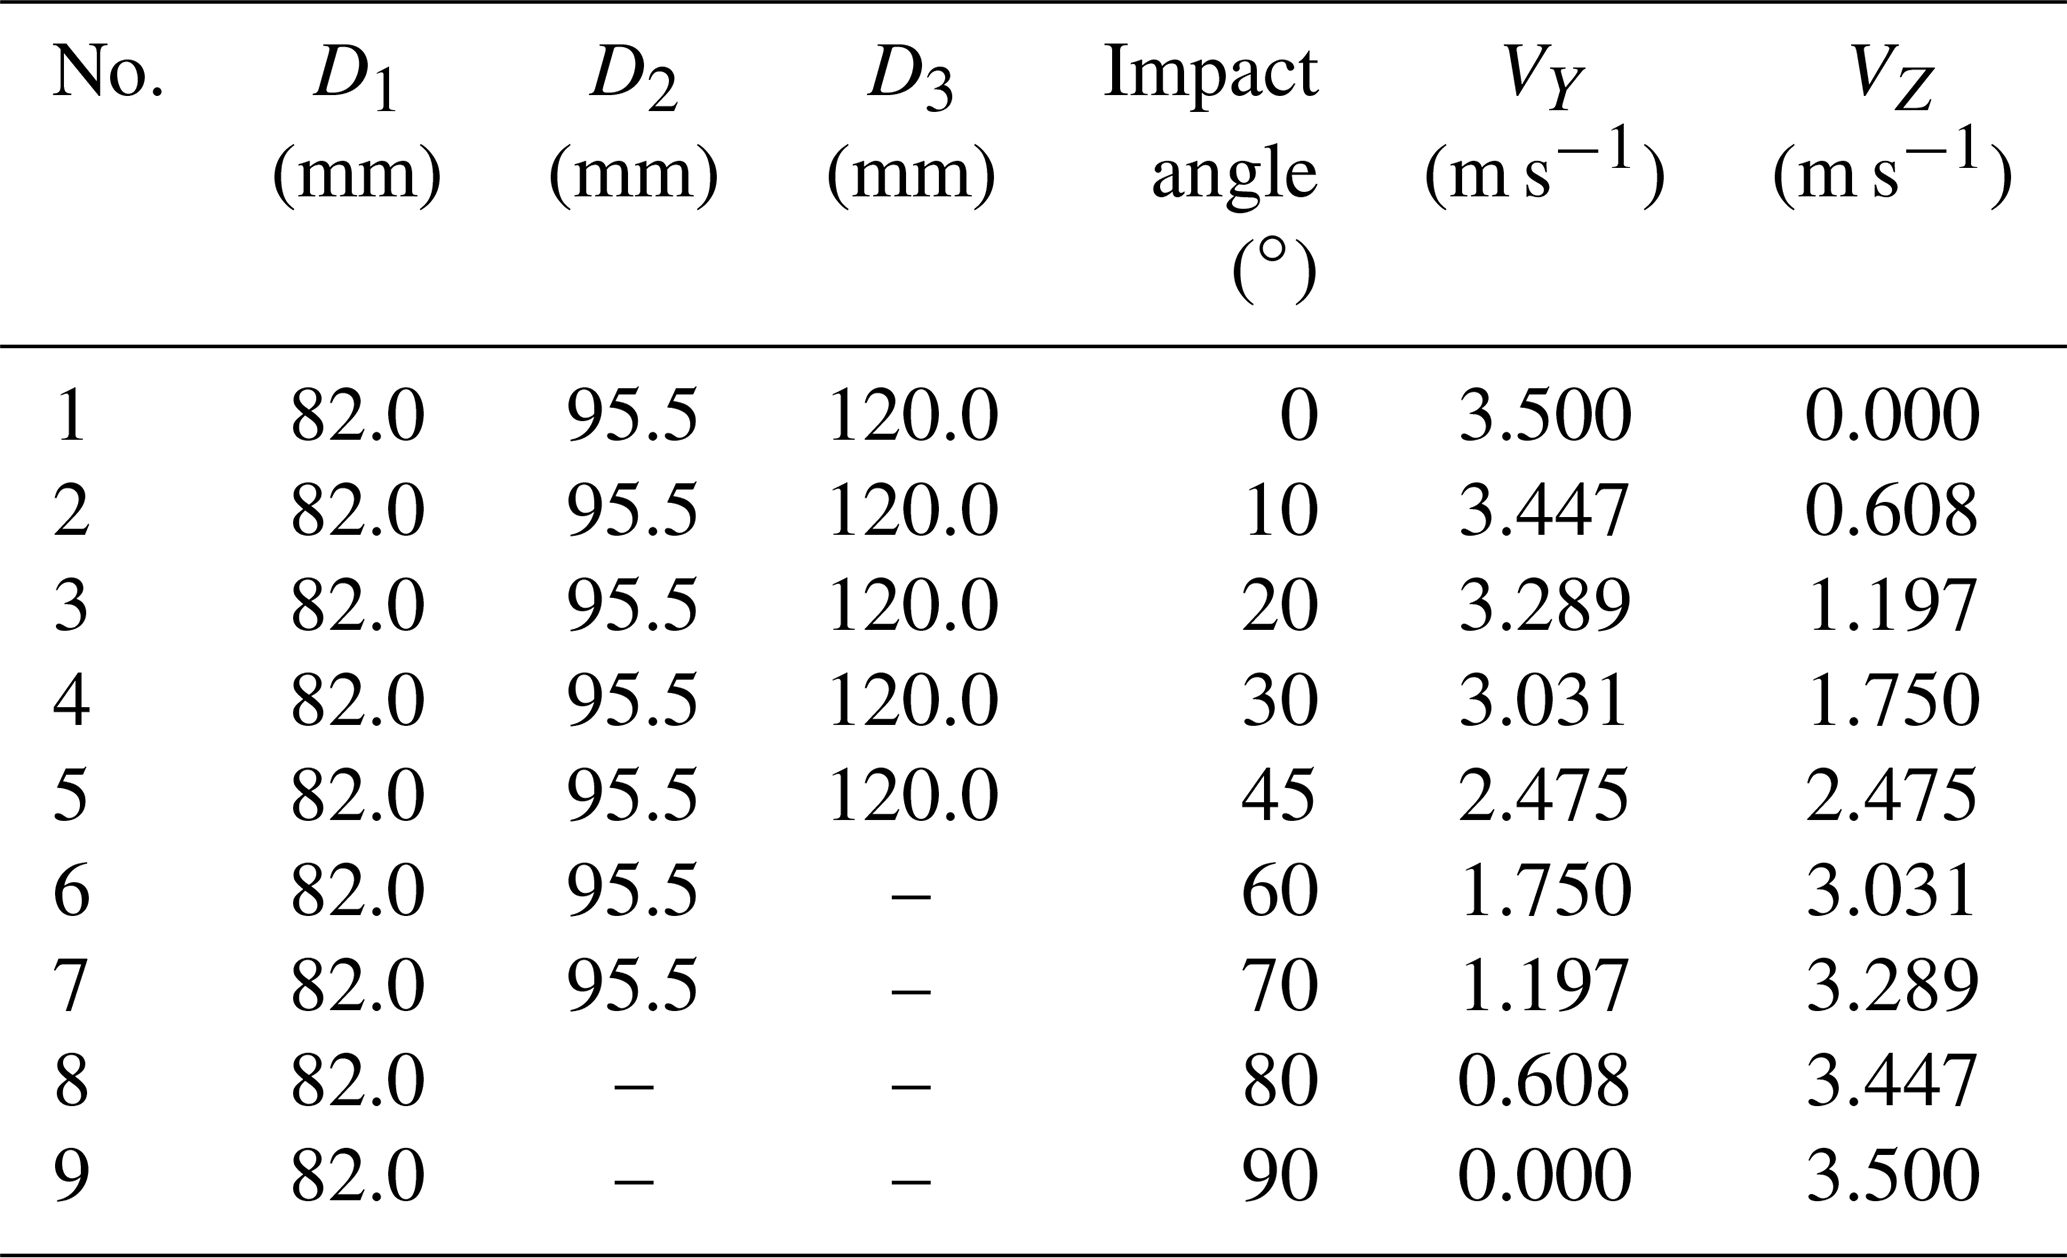
To supplement the experimental data, particularly for smaller impact angles, a finite element method (FEM) was built to produce a virtual model of the SPG system, as illustrated in Fig. 2. The FEM model included structural components of the SPG system such as the steel plate, bolts, sensor casings, and elastomers, and the internal and outer frames were individually subdivided into small finite elements. Subsequently, all the components were assembled considering mechanical contacts and frictions, and the entire SPG system was simulated in LS-DYNA (LSTC, 2014). Detailed information used in the FEM model are reported by Chen et al. (2021, 2022). Before the numerical simulations, the FEM model was calibrated with results obtained from previous lab experiments (drop tests) with quartz spheres (see Appendix A and Chen et al., 2021, 2022). The FEM model was used to numerically simulate the signal response for spherical particles impacting a SPG plate with a velocity of 3.5 m s−1 (irrespective of the impact angle) at different angles ranging from 0∘ to 90∘ and for sphere diameters of 82, 95.5, and 120 mm, as indicated in Table 4.

Figure 2(a) Cross-sectional sketch of the SPG system impacted by a spherical particle. (b) Cross-sectional view of the FEM model of the SPG system. The coordinate system is set up with the X axis pointing in the transverse direction (across the flume width), the Y axis pointing downstream (in the flow direction), and the Z axis pointing up perpendicular to the plate's surface. θ is the impact angle of the sphere. FContact is the contact force between the sphere and the plate. V is the impact velocity of the sphere onto the plate, which has two components VY and VZ (given in Table 4).
Table 4Characteristic values of the spheres and impact angles used in the FEM simulations. The diameters D1, D2, and D3 of the spheres are 82, 95.5, and 120 mm, respectively. A constant density ρs=2677 kg m−3 was used in the FEM simulations. VY and VZ are the components of the impact velocity in the Y and Z directions, respectively.
2.3 Bedload transport modes
2.3.1 Saltation, rolling, and sliding
Generally, bedload particles are transported in three types of motions, namely saltation, rolling, and sliding, as illustrated in Fig. 3. In other studies, the motion mode of the bedload transport was investigated experimentally and showed a correlation with the time-averaged bed shear stress or the ratio of to the critical value of the bed shear stress τcritical for incipient particle motion (Tsakiris et al., 2014). In the case of uniform flow, the value of is constant and can be calculated as
where ρ is the water density, g is the acceleration due to gravity, S is the bed slope, Rh is the hydraulic radius, which can be expressed as for a rectangular cross section, h is the flow depth, and b is the channel width. For our flume experiments, is determined as 102.9 N m−2.
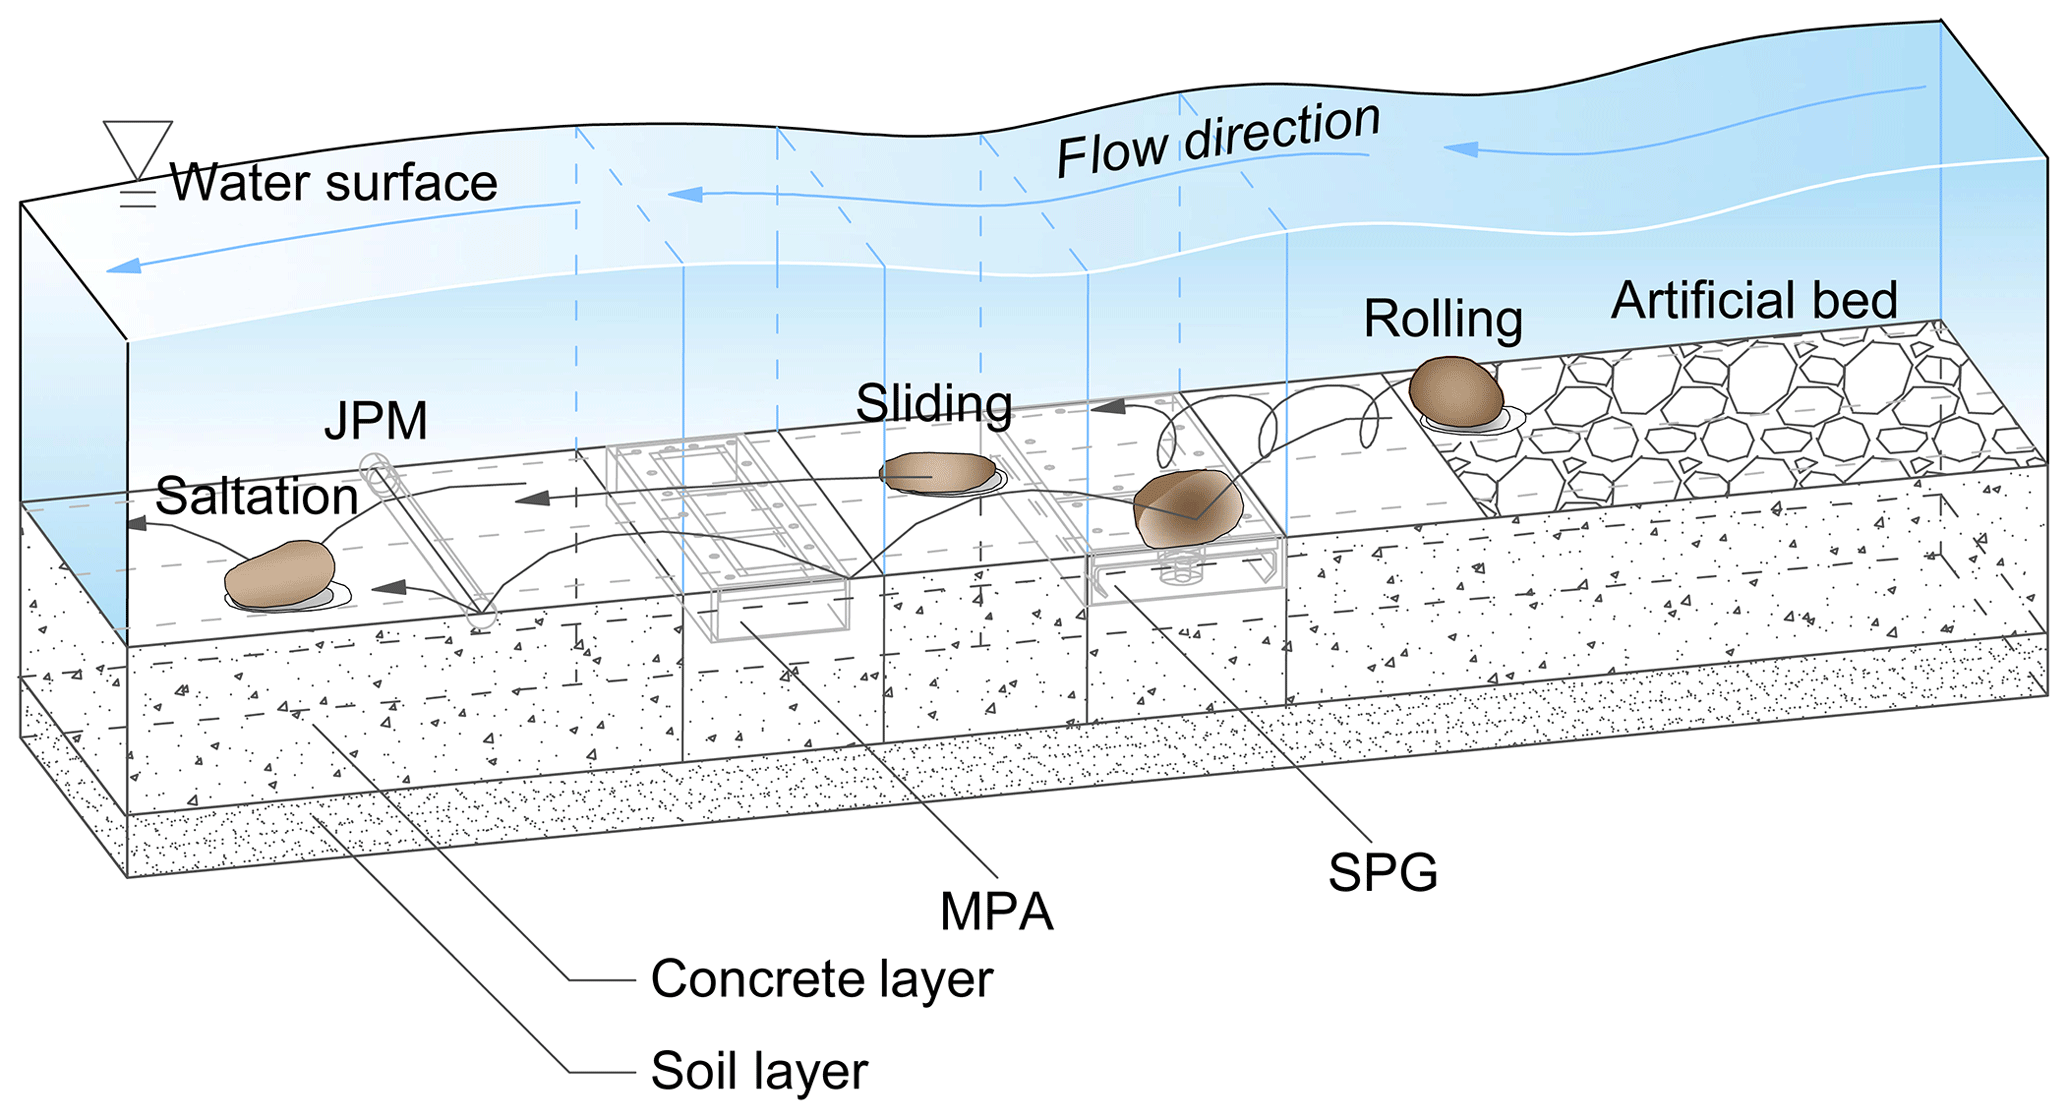
Figure 3Sketch of bedload particles moving via different transport modes, including saltation, rolling, and sliding, over the Obernach flume facility.
The critical Shields parameter ΘCritical is defined as the ratio of the critical bed shear stress τcritical to the submerged particle weight:
where ρs is the particle density.
An estimation of ΘCritical for our experimental conditions was made in two ways. First, ΘCritical was estimated based on the maximum particle size DMax (=171.5 mm) transported in our experiments, assuming that this size is close to (but not equal to) the critical size of bedload particles that started moving during the experiments. However, the true value of ΘCritical should be somewhat smaller than the estimated value . Second, considering that the controlled experiments in this study were performed in a flume facility reconstructed from the field site, the critical Shields parameter ΘCritical should be rather similar to that at the field site. According to the study of Schneider et al. (2015), which included several mountain streams, the median value of the effective shear stress (corresponding to ΘCritical) was determined to be about 0.03 from the main dataset, and showed less dependency on the slope of the stream bed. Shahmohammadi et al. (2021) statistically obtained ΘCritical vs. relative roughness correlation curves using the data from a large number of flume experiments. The relative roughness of our experiments ranges from 0.023 to 0.32, resulting in a median value for the critical Shields parameter of approximately 0.05. However, given our flume-based estimate and the fact that our experimental conditions are comparable to the field sites investigated by Schneider et al. (2015), the critical Shields parameter ΘCritical in our flume experiments is assumed to be 0.03.
The excess transport stage T (Auel et al., 2017a) can then be calculated via
Studies have shown that the probabilities of saltation PSal, rolling PRol, and sliding PSli are related to the flow intensity or T (Auel et al., 2017a; Hu and Hui, 1996). For our flume experiments, T is calculated to range from 0.22 to 6.42 for particle sizes ranging from 171.5 to 28.1 mm.
2.3.2 Impact instant and video analysis
In order to match the transport mode of a bedload particle with the vibration signal, an important parameter that needs to be determined from experimental videos is the time instant when the particle impacts the channel bed. Figure 4a–c show sketches of the saltation, rolling, and sliding transport modes, respectively, and also indicate an interaction between the bedload particle and the SPG plate. The forces introduced in the sketches in Fig. 4 are used only as an aid to illustrate how we observe a few moments when the particles are in contact with the plate or the channel bed. Specifically, a shear stress between the geophone plate and the contact surface of a particle is generated when the particle impacts the plate at a certain angle, as seen in Fig. 4a. The frictional force Fc together with the fluid drag force Fw form a force couple. Similarly, another force couple is present in the vertical direction, namely the vertical support force Fn and the particle weight force G. These force couples act together on the particle and finally rotate it. This small rotation of the bedload particle occurs immediately after impact, allowing us to determine the impact instant (at T1) from the video frames. Appendix B gives more details on how we analyzed the experimental videos.
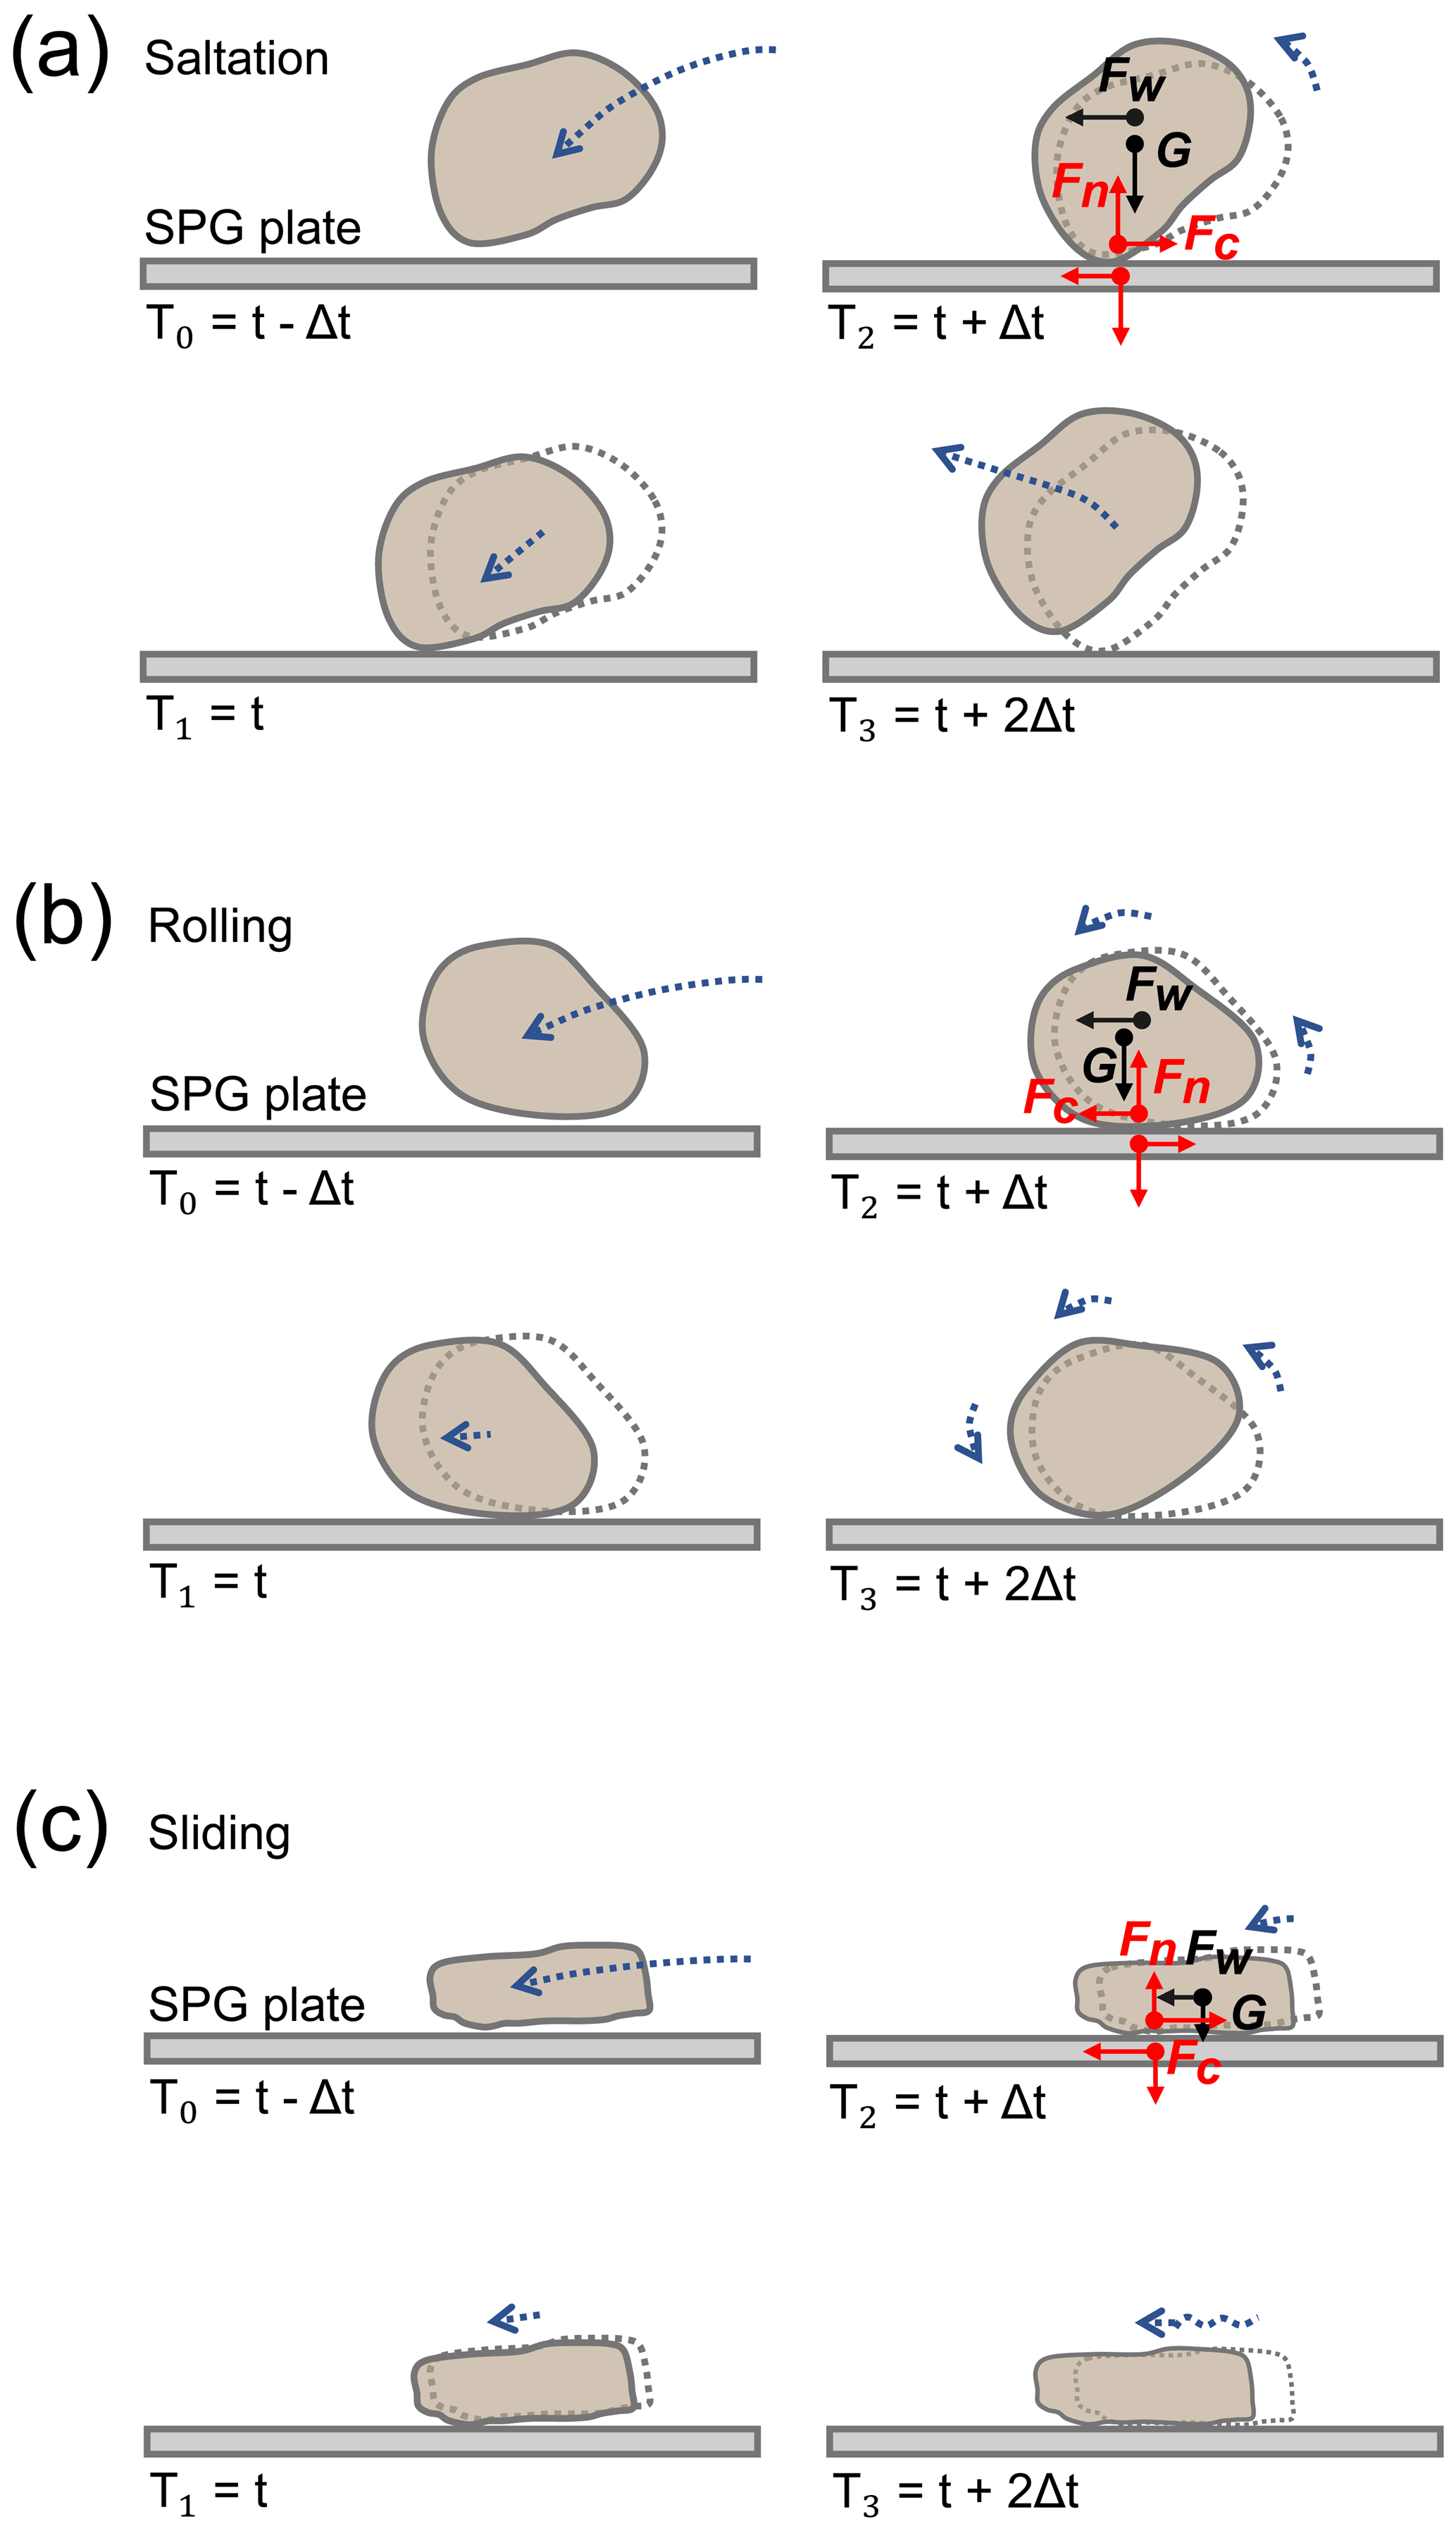
Figure 4Schematic illustration of the three observed types of transport modes: (a) saltation, (b) rolling, and (c) sliding. T0, T1, T2, and T3 are four different time instants during particle motion that indicate the impact and rebound of a particle on the SPG plate. In particular, T2 is the instant when the bedload particle impacts on the SPG plate. Fc and Fn denote the frictional force and the vertical support force exerted by the SPG plate on the bedload particle, respectively. Fw is the force from water acting on the bedload particle. G is the force due to the particle's weight.
2.4 Signal processing
2.4.1 Signal characteristics: amplitude, impulse, frequency
A typical signal response of the SPG system recorded during a flume experiment for bedload particles of grain-size class C9 moving over the SPG plates is illustrated in Fig. 5. The packets (Fig. 5a and b) were delimited on the basis of the envelope (blue line) of the signal computed with the Hilbert transform (Wyss et al., 2016a). Each packet corresponds to the signal response following a single particle impact on the SPG plate, as seen in Fig. 5c. Subsequently, these packets were classified according to the respective transport modes of saltation (in gray), rolling (in red), and sliding (in blue), as determined from the experimental videos that were introduced above. The signals for the purple-colored packets recorded by the sensor G1 or G2 appear to have been triggered by impacts on the neighboring sensor G2 or G1, respectively, or they represent signals that could not be matched with the videos due to limitations caused by the light conditions.
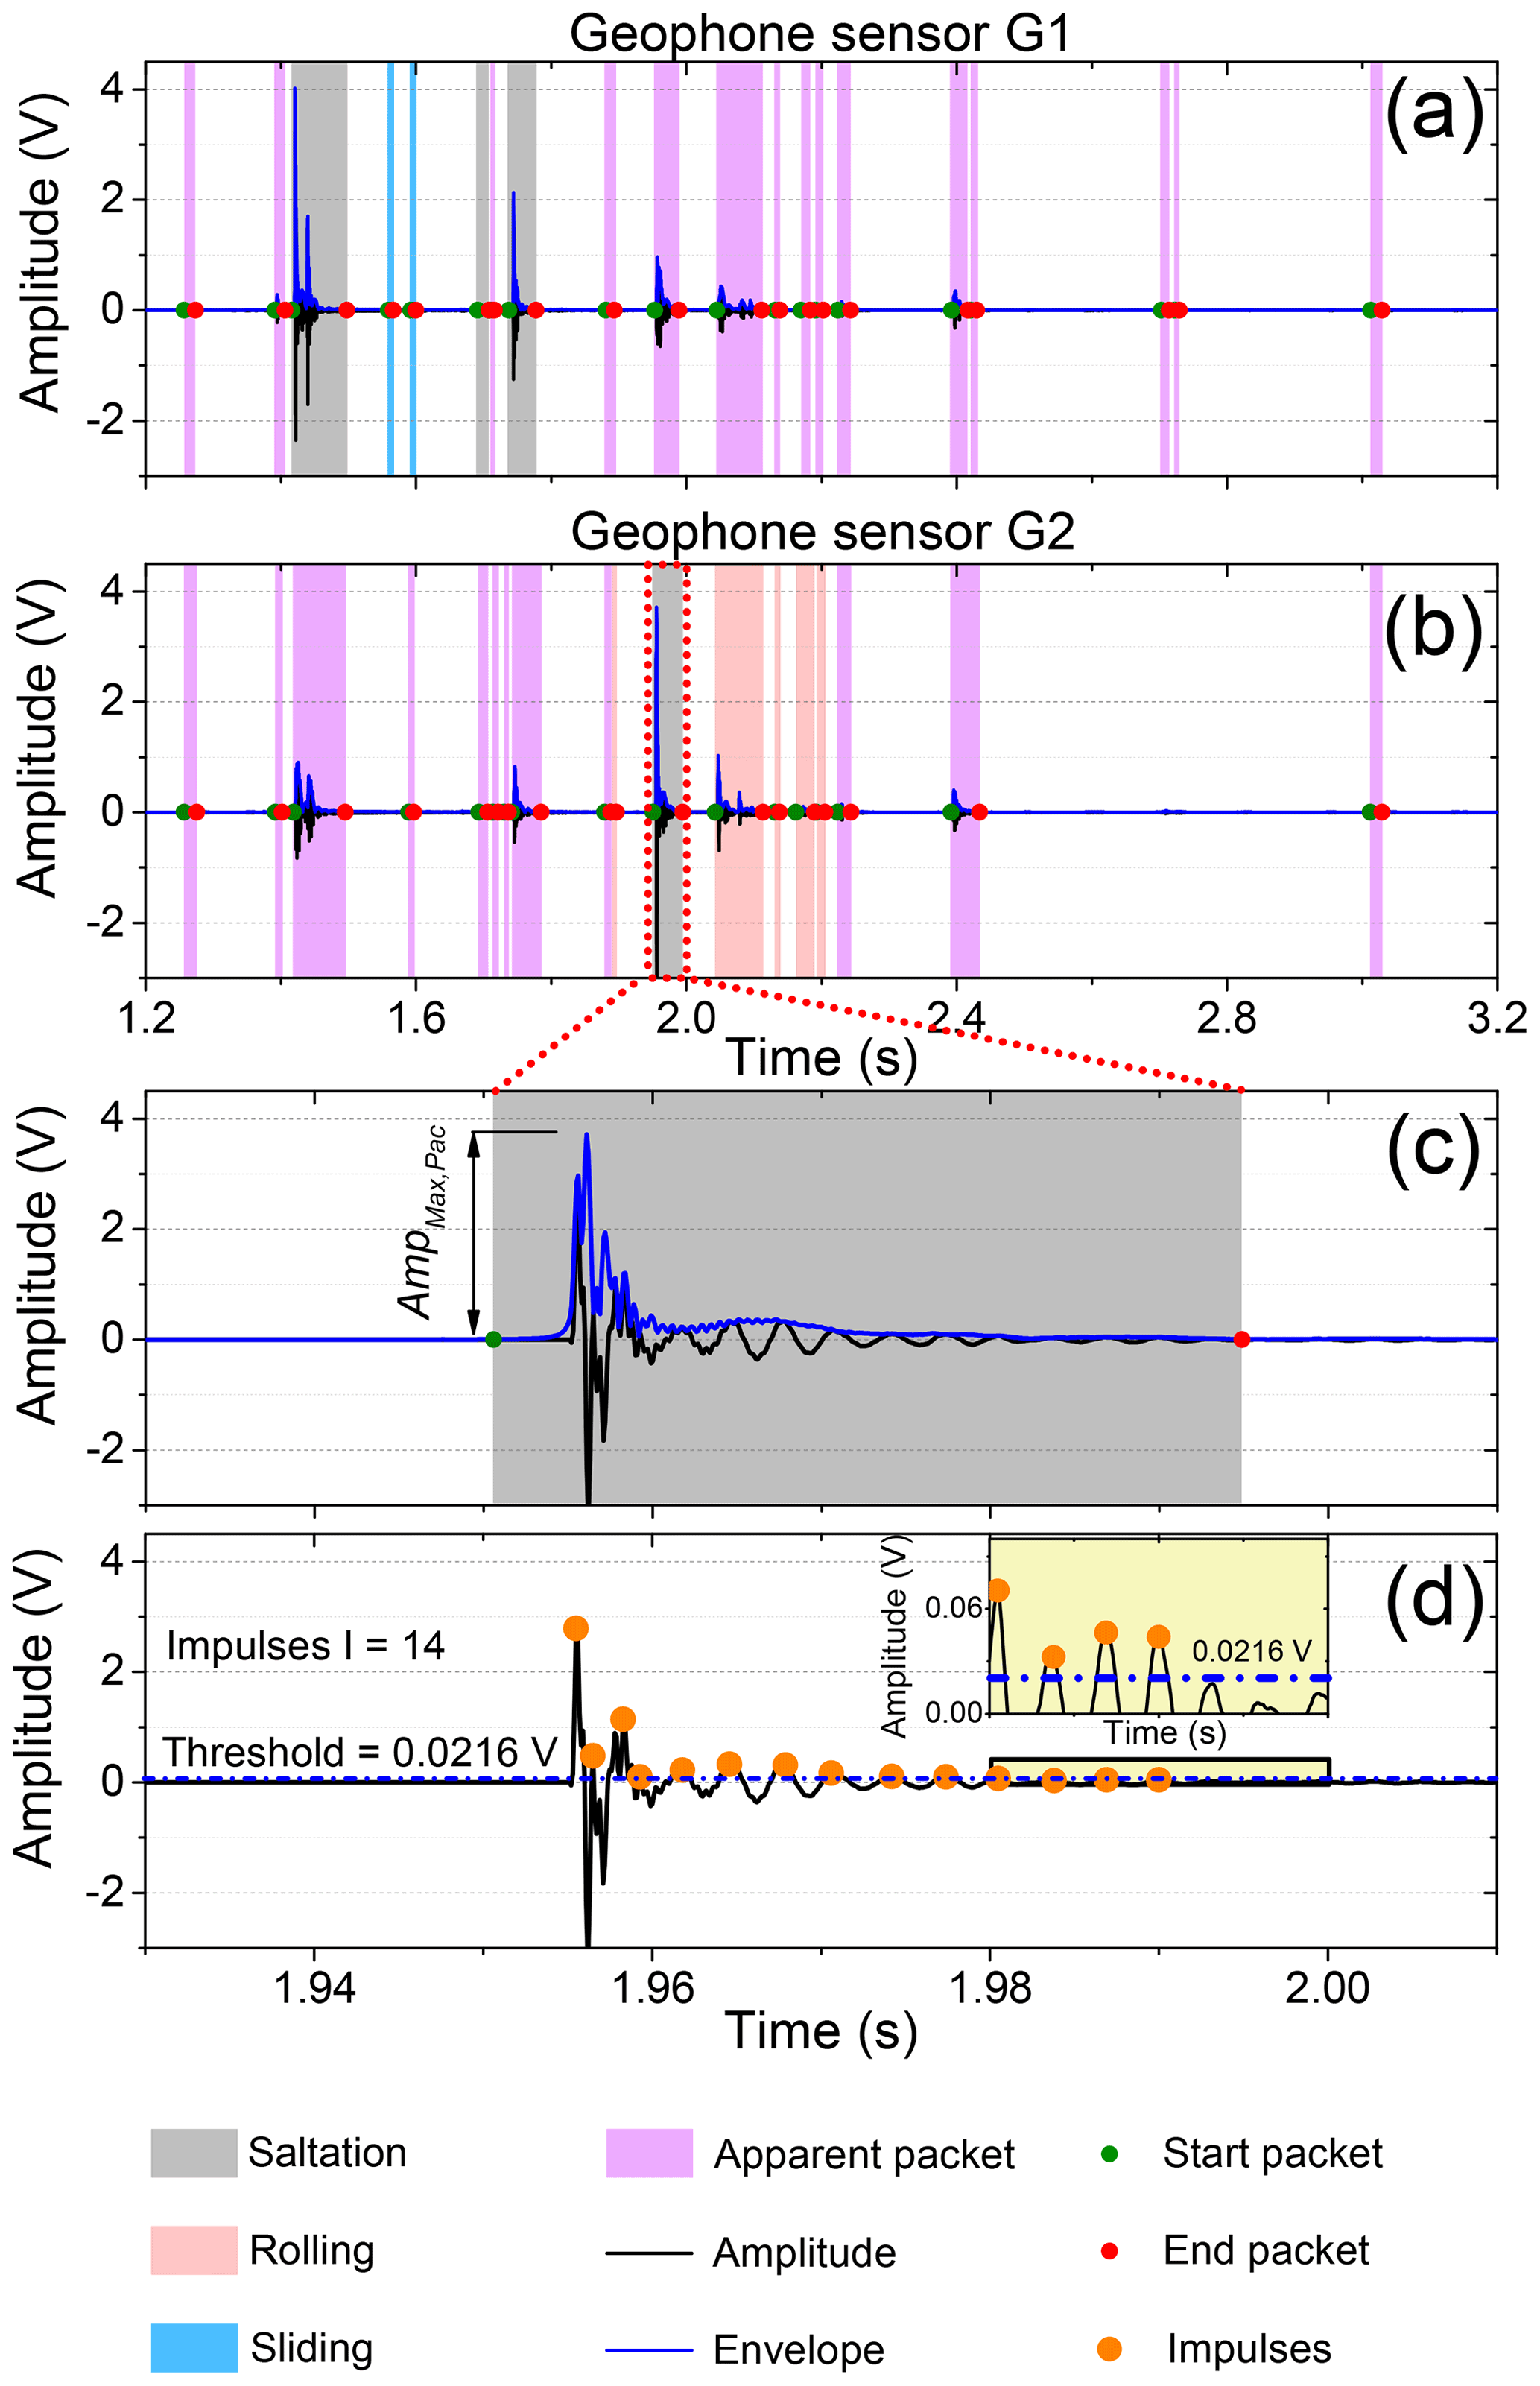
Figure 5Illustration of the SPG vibrations and signal packets for different transport modes following a flume experiment with bedload particles of grain-size class C9. Panels (a) and (b) represent signals that were recorded by geophone sensor G1 and G2, respectively, with a flow velocity of 3.3 m s−1. (c) Illustration of the packet definition as the envelope (blue line) of the raw signal that is computed with the Hilbert transform and represents one impact of a saltating particle. (d) Definition of the impulse count I (=14) as the number of times the signal exceeds the threshold (0.0216 V, see the dash-dotted blue line) in the positive domain.
The positive maximum amplitude of a packet is given as AmpMax,Pac, as seen in Fig. 5c. The number of impulses I (Fig. 5d) of each packet is obtained by counting the number of positive signal excursions above the predefined system threshold (Rickenmann et al., 2012, 2014; Wyss et al., 2016a). The threshold value in our study is 0.0216 V, as indicated by the dash-dotted blue line in Fig. 5d. Based on field bedload measurements at various sites, the number of impulses I was found to be reasonably well correlated with the total transported bedload mass MTot according to the equation I=kbMTot, where kb is the site-dependent calibration coefficient. The coefficient kb is further developed for different grain-size classes j as the coefficient kbj, which has been utilized to infer the bedload transport from SPG signals by grain-size fractions (Wyss et al., 2016c; Nicollier et al., 2020).
The mass-impulse coefficient kIPM used in the present study is similar to the coefficient kb used in other studies (Rickenmann et al., 2014; Nicollier et al., 2021a) but more comparable to the kbj value, although not completely the same. kIPM was used as a parameter relating the signal impulses triggered by each impact to the transported bedload mass M (Chen et al., 2021), and is defined as the number of impulses per particle mass:
where I is the number of signal impulses recorded by the SPG system and M is the corresponding transported particle mass.
According to the Hertz theory, the centroid frequency FreqCentroid of the SPG signal is an important parameter that can help to support bedload size identification (Wyss et al., 2016a; Rickenmann, 2017; Thorne, 2014):
where fm is the spectrum frequency (Hz) and AFFT,m is the amplitude (V Hz−1) obtained by calculating the fast Fourier transform (FFT) for the signals. Note that the definition of the centroid frequency in Eq. 5 is different from the definition of the central frequency in Thorne (1986).
2.4.2 Number of packets
The amplitude and frequency characteristics of the signal are found to vary significantly with the impact location of the bedload particle, in particular when an impact occurs on a neighboring plate or on the concrete bed of the channel. An amplitude-frequency-based filtering method to identify packets generated by these impacts and to classify them as “apparent” has been developed by Nicollier et al. (2021b). In contrast, packets generated by bedload particles impacting on the SPG plate above the considered geophone sensor are classified as “real.” This filtering process accounts for the phenomenon of attenuation that acts on a propagating seismic wave. In fact, the further a seismic wave propagates, the stronger the attenuation of high frequencies with respect to low frequencies and thus the lower the energy of the wave. Apparent packets can therefore be identified on the basis of their low amplitude-frequency content and removed from the final packet counting.
Subsequently, the ratio of the total number of real packets over all transport modes based on the video observations to the real-packet number determined by the filtering method is calculated as
where is the total number of real packets for experimental run i and grain-size class j over the transport modes based on the video analysis, and is the number of real packets determined by the filtering method for experimental run i and grain-size class j.
In addition, similar to the definition in Wyss et al. (2016c), the ratio of the number of packets Pi,j to the number of particles Ni,j for each experimental run i and grain-size class j is given as
For each transport mode, if we use all detected packets (including both real and apparent packets), we have
where is the ratio of the number of packets to the number of particles for experimental run i and particle-size class j for the transport modes of saltation, rolling, and sliding, and and are the number of packets and number of transported particles for experimental run i and particle-size class j for the modes of saltation, rolling, and sliding, respectively.
2.4.3 Estimation of particle velocity
Generally, the bedload particle velocity VP is expected to be less than the depth-averaged water flow velocity VW. If the ratio and VW are given, then VP can be estimated by the following equation:
where is called the estimated particle velocity in the present study; rPW ranges from 0.3 to 0.8 for natural particles, as suggested by Julien and Bounvilay (2013).
VP can be also calculated from the particle travel distance LP and time ΔTP using the expression
where is called the calculated particle velocity in this study, is a constant (0.775 m) corresponding to the center-to-center distance between the SPG and MPA systems, and is the arrival time difference determined from the starting times of the packets and for the SPG and MPA systems, respectively. More details about the calculation of can be found in Appendix C.
To compare our experimental data with the other flume studies, the particle velocities introduced above are normalized as follows:
where represents the nondimensional particle velocity ( or ), i.e., the particle velocity normalized by the term , and s is the ratio of the particle's density ρs to the density of water ρ.
3.1 Percentage distribution of transport modes
To assess the signal signatures of the SPG system impacted by bedload particles with varying transport modes, a total of 2414 bedload impacts were analyzed for particles ranging in size (b axis) from 28.1 to 171.5 mm (size classes C4–C10) under a constant-flow condition. Figure 6a shows the total number of impacts for each bedload grain-size class (identified in the video analysis), including the real impacts for the modes of saltation, rolling, and sliding. Apparent impacts (bedload impacts on a neighboring plate or on the concrete bed) and impacts that generate no packets are both included in the category “other impacts.” Out of the total number of impacts, the percentage that are real impacts (indicating packets triggered by bedload particles impacting on the plate above the considered geophone sensor) ranges from 22 % to 31 %, generally increasing with increasing particle size. As a consequence, the total number of real impacts over all particle sizes is calculated to be 571. The total number of recorded impacts equals the number of real impacts plus the number of apparent impacts for all transport modes at all impact locations, including the concrete bed and the SPG plates, as seen in Fig. 6b.
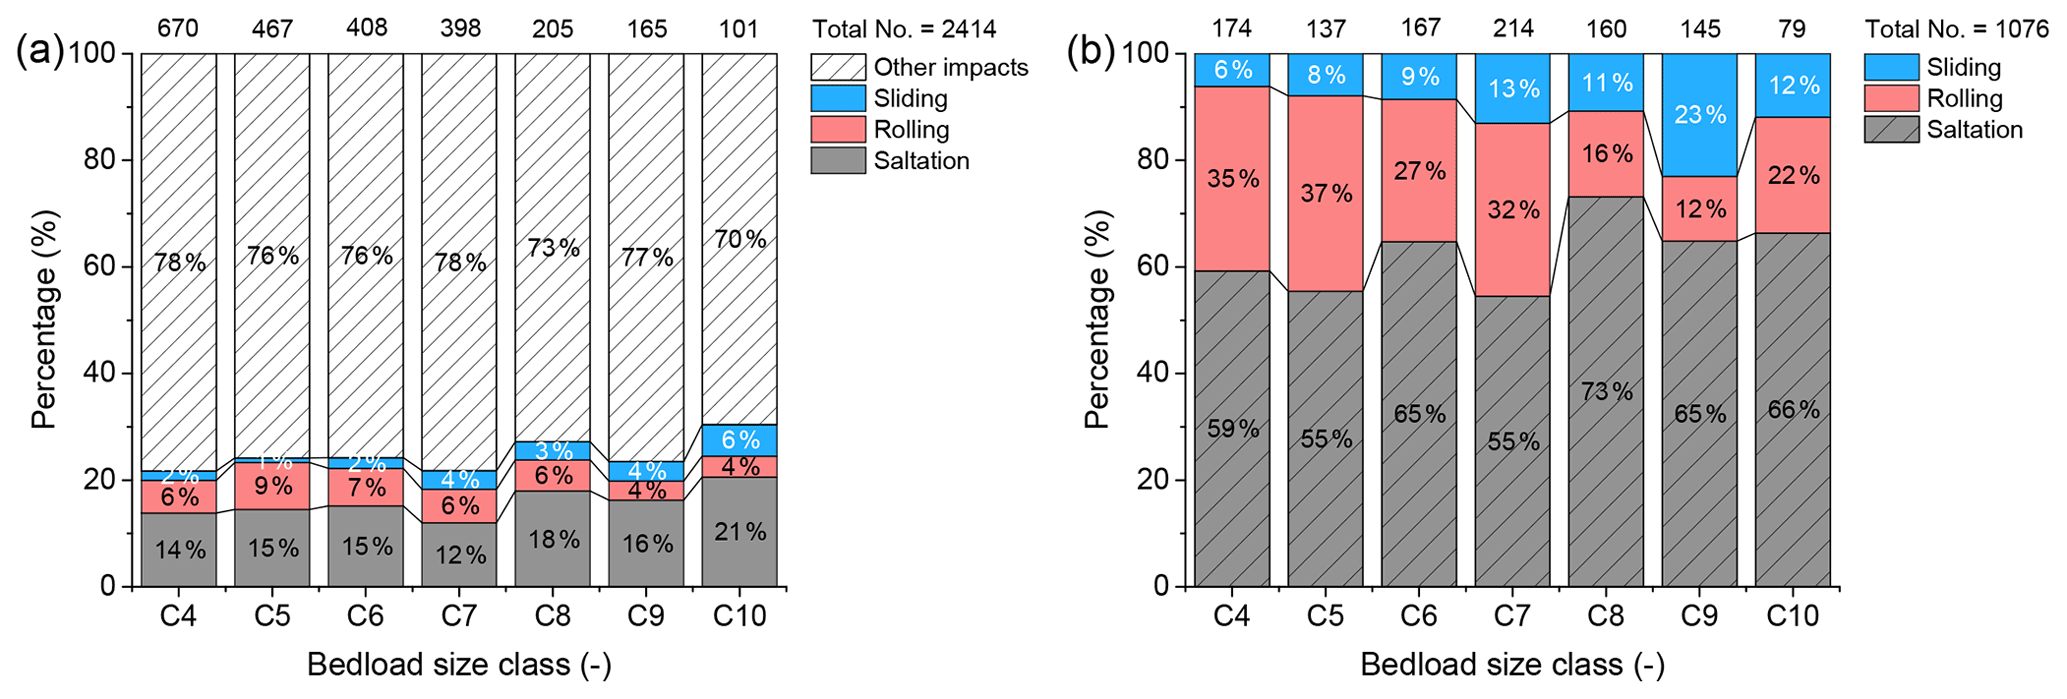
Figure 6Percentages of the total number of impacts for the transport modes of saltation, rolling, and sliding. (a) The total number of impacts (given at the top of each column) and the percentage of real impacts on the geophone plates for each transport mode. (b) The percentage of total recorded impacts for each transport mode anywhere on the bed or plates. The total number of recorded impacts (given at the top of each column) is the sum of real impacts and apparent impacts, where the real impacts correspond to bedload impacts on the plate above the considered geophone sensor while the apparent impacts represent bedload impacts on a neighboring plate or on the concrete bed. The transport mode was determined through video analysis.
The value of is slightly smaller than but close to 1 for small particle sizes ranging from 28.1 to 71.3 mm (Fig. 7), indicating that the number of real packets based on the video analysis is smaller than that obtained from the filtering method using the amplitude-frequency information as introduced above. However, for the three largest particle size classes, the value of generally increases with increasing particle size.
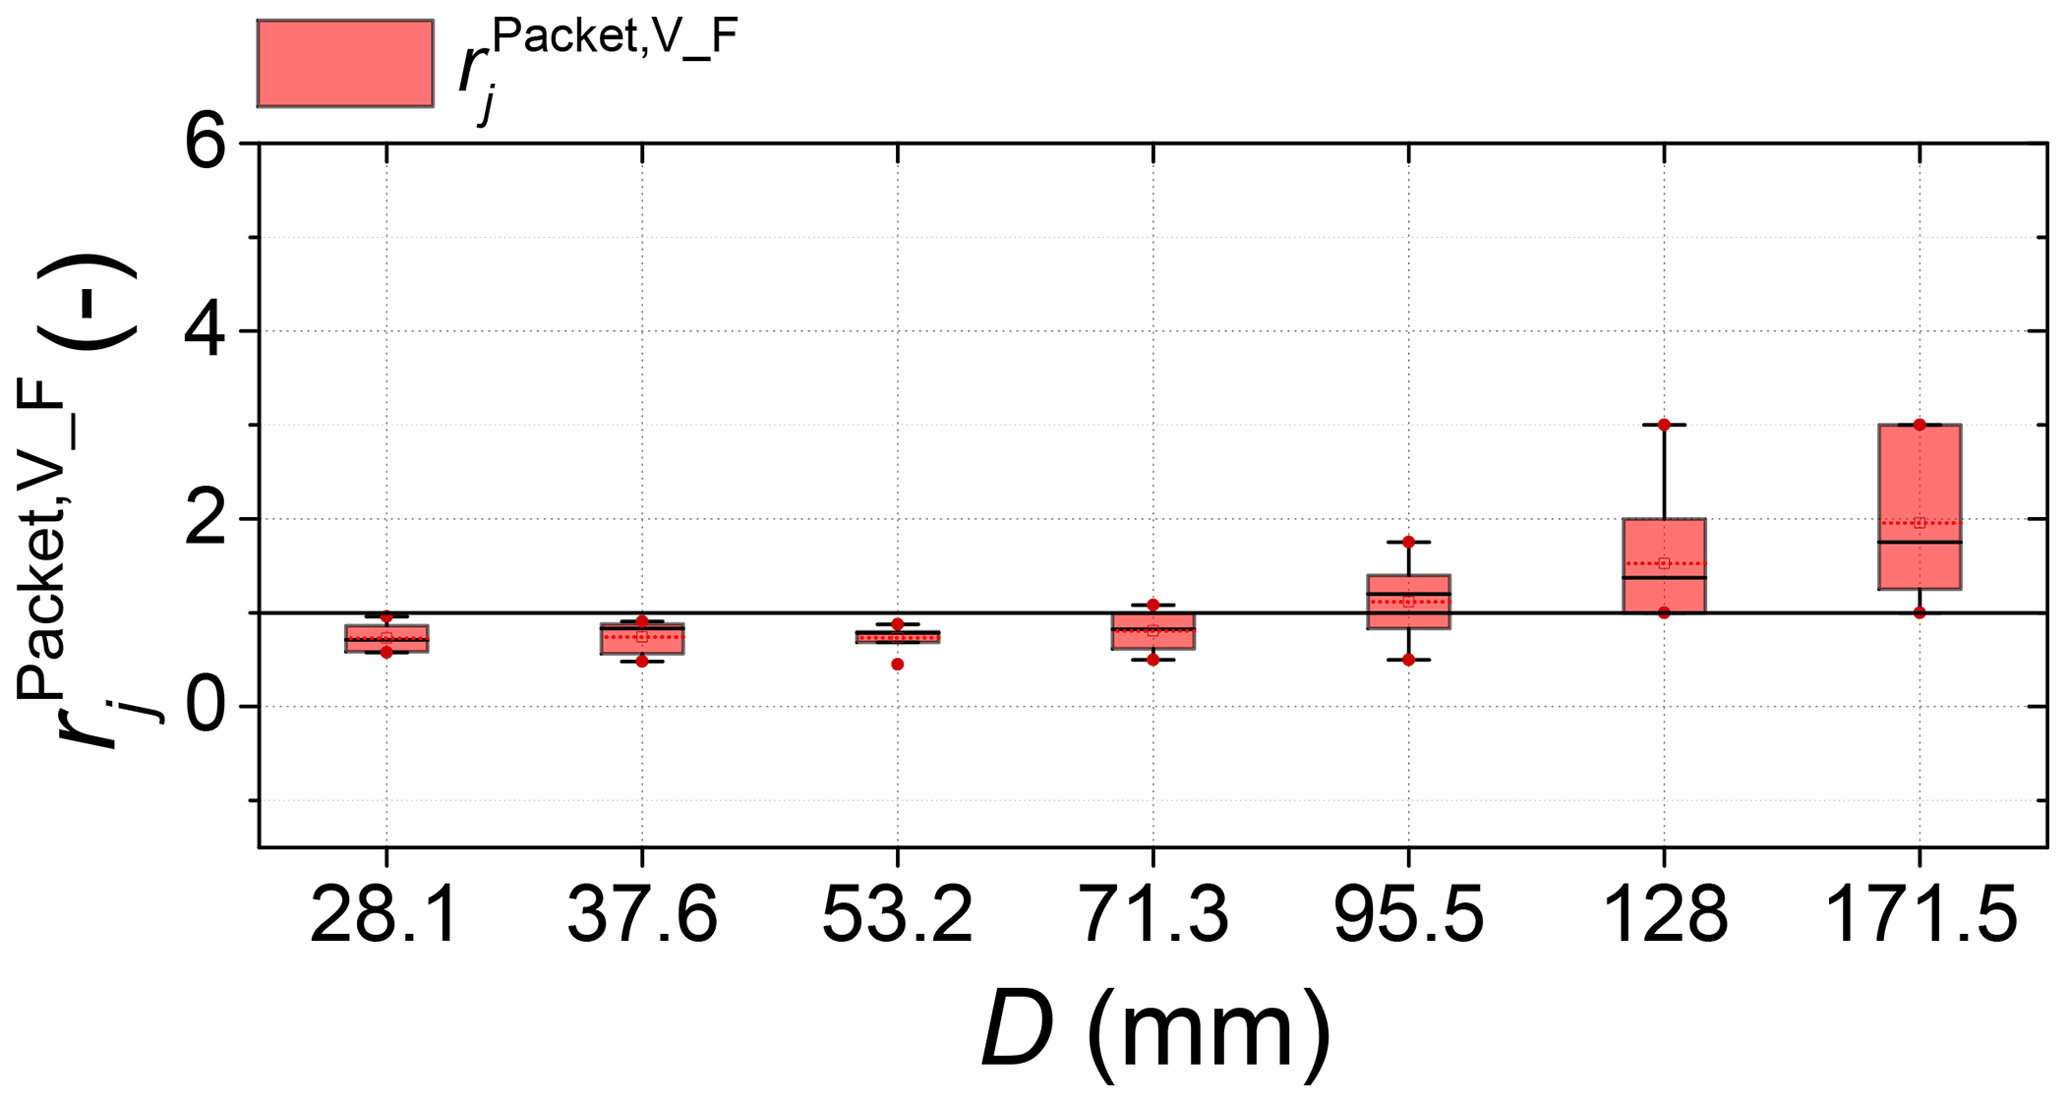
Figure 7The ratio of the total number of real packets for all transport modes based on the video analysis to the number of real packets determined by the filtering method for each particle size class j.
3.2 Signal responses of the SPG system
In the following, we present the summary statistics of the coefficient kIPM (number of signal impulses extracted from the real packets per particle mass), the maximum amplitude AmpMax,Pac, and the centroid frequency FreqCentroid as a function of particle size and a function of impact angle for different transport modes. A constant impact velocity of 3.5 m s−1 for the spheres was used in the FEM simulations, resulting in different vertical impact velocities for different impact angles onto the plate (Table 4). The results from the inclined chute experiments are given in Table 5.
Table 5Results from the inclined chute experiments, including impact slope angles of 45∘ and 60∘. Characteristic values of the number of signal impulses per particle mass kIPM, the maximum amplitude AmpMax,Pac, and the centroid frequency FreqCentroid were obtained from the SPG signal. The diameter of the spheres and the b-axis length of the natural particles were 95.5 mm. The value ranges of kIPM, AmpMax,Pac, and FreqCentroid are given in parentheses as (25th percentile, 75th percentile).

The coefficient kIPM decays strongly with increasing particle size D, regardless of whether the particles are saltating, rolling, or sliding (Fig. 8a). On average, the kIPM values of saltating particles are larger than those of rolling particles, and sliding particles tend to have the lowest values. The overlap of the kIPM values for particles in different transport modes varies depending on the particle size, which makes it difficult to distinguish motion modes by only considering the value of kIPM.
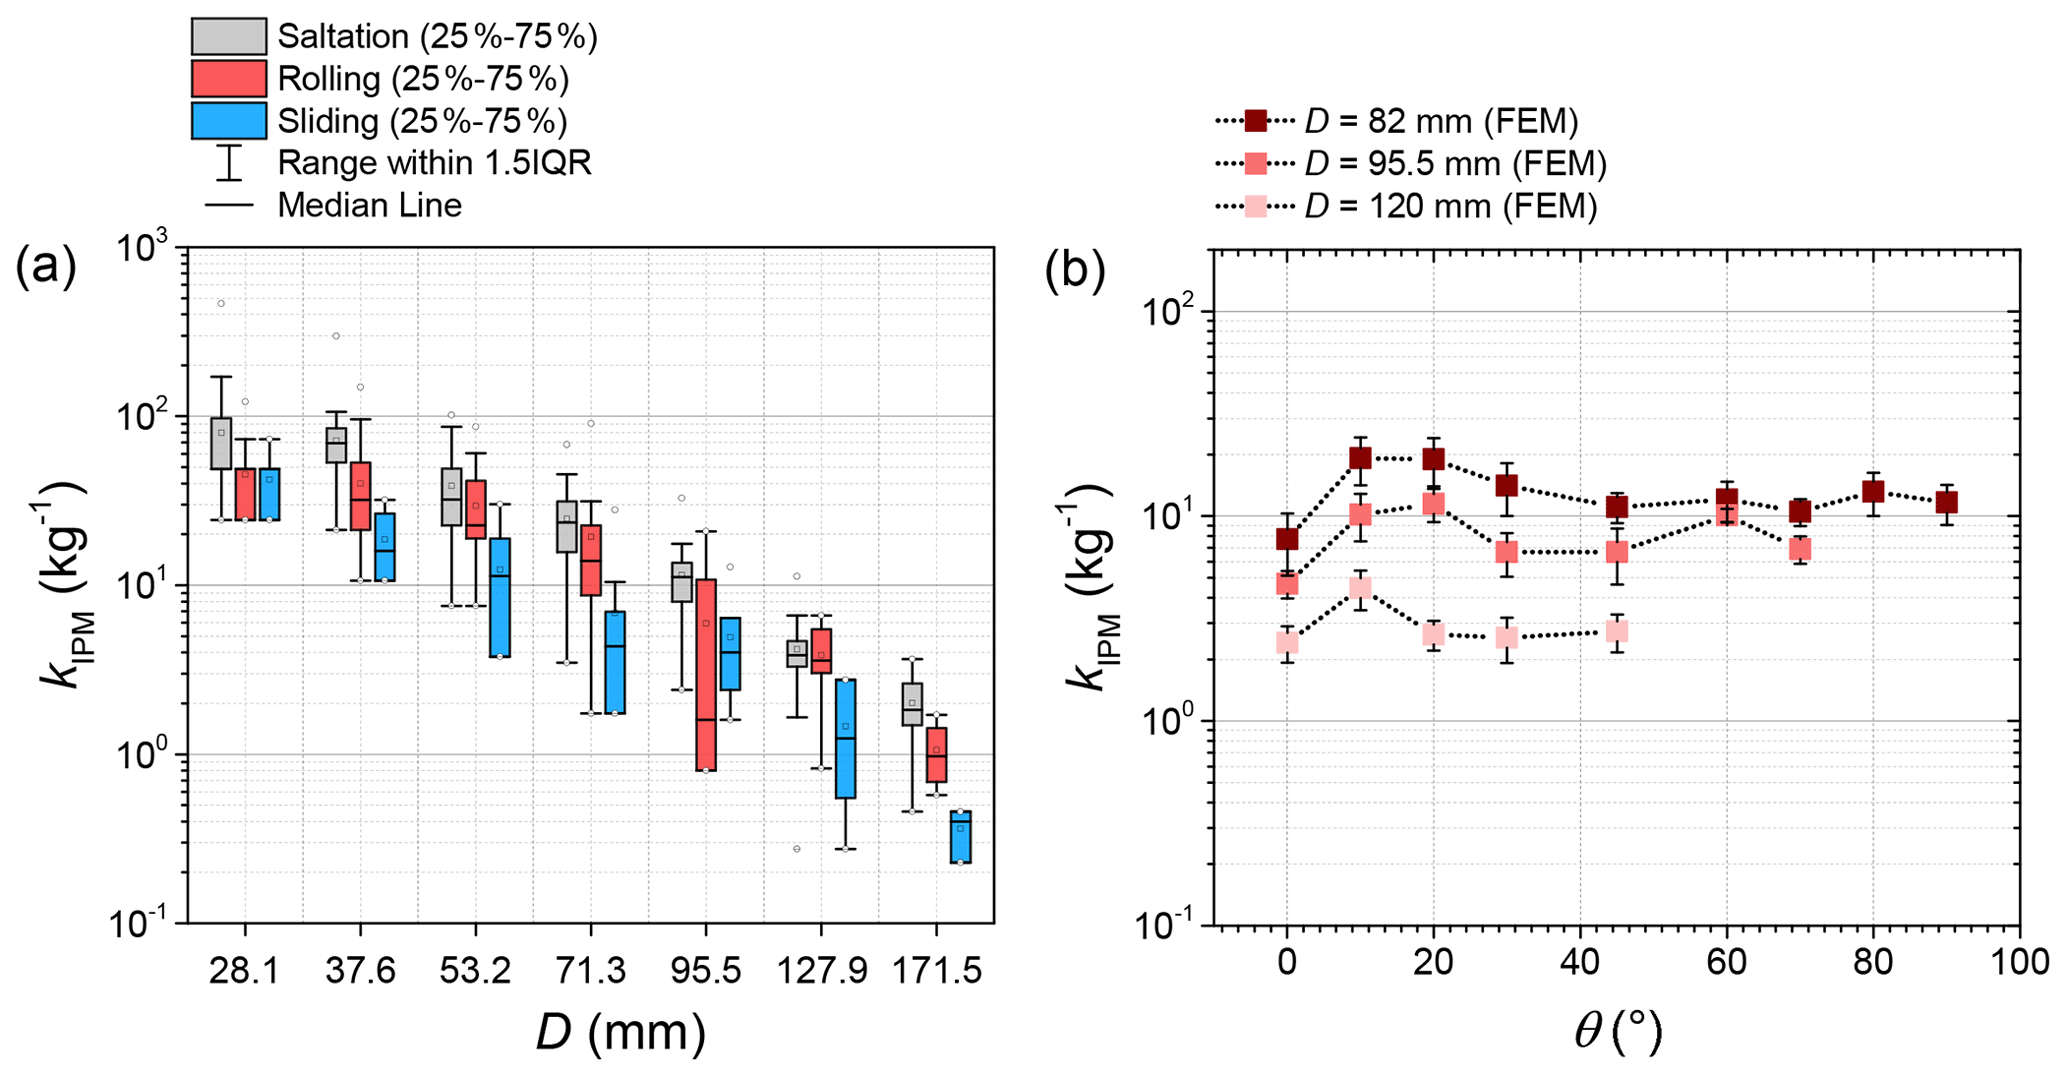
Figure 8(a) Impulse-mass coefficient kIPM versus bedload particle size D (b axis) for different transport modes. (b) Impulse-mass coefficient kIPM versus the impact angle θ for different impacting particle sizes. FEM denotes simulations with the finite element method.
According to the inclined chute experiments, the 75th percentile values of the impulse-mass coefficient kIPM change slightly upon increasing the slope angle from 45∘ to 60∘. However, compared to the spheres, the natural particles show greater variation (25th to 75th percentile) in kIPM (Table 5). The FEM simulations indicate that kIPM varies only moderately with impact angle for a given particle size, except when the impact angle is changed from 0∘ to 10∘ (Fig. 8b). In contrast, the coefficient kIPM decreases with increasing sphere size. This is in agreement with results from the flume experiments with natural particles (Fig. 8a).
The maximum amplitude of a packet AmpMax,Pac generally increases with increasing bedload particle size D for all transport modes (Fig. 9a). The saltating particles tend to generate the largest signal amplitudes, followed by the rolling particles and then the sliding particles. The sliding particles do not display a very clear relation between AmpMax,Pac and D.

Figure 9(a) Maximum amplitude AmpMax,Pac versus bedload particle size D for different transport modes. (b) AmpMax,Pac versus impact angle θ for different particle sizes. FEM denotes simulations with the finite element method.
The FEM simulations show that the maximum amplitude of a packet AmpMax,Pac increases with increasing particle impact angle θ up to about θ=60∘ (Fig. 9b). The inclined chute experiments indicate better results for sphere impacts than for natural particle impacts, and they show a slightly increasing trend for the 75th percentile data due to the limited range of the slope angle (Table 5).
The centroid frequency FreqCentroid generally decreases with increasing D for all transport modes (Fig. 10a). Similar to the maximum amplitude, FreqCentroid values for saltating particles are generally largest, followed by values for the rolling particles and then those for the sliding particles. However, it appears that the discriminating effect of particle transport mode on the centroid frequency is rather weak for some particle sizes. The variability in frequency for each transport mode may also be partly due to variable particle impact locations on the geophone plate. Other factors such as the particle shape can also play a role.

Figure 10(a) Centroid frequency FreqCentroid versus bedload particle size D for different motion modes. (b) Centroid frequency FreqCentroid versus impact angle θ for different impacting particle sizes. FEM denotes simulations with the finite element method.
According to the FEM simulations, the centroid frequency FreqCentroid increases with impact angle up to about θ=20∘ (Fig. 10b). The data from the inclined chute experiments show a slight decrease in FreqCentroid for the two tested impact angles (Table 5).
While there are discrepancies between the chute experiment data and the FEM results, the limited changes in the characteristic values of the chute experiments with changing slope angle are in qualitative agreement with the FEM results, where approximately constant characteristic values were observed over a much larger range of slope angles from 20∘ to 90∘.
4.1 Effect of transport mode on the SPG signal response
4.1.1 Number of packets for each transport mode
We showed that the ratio between the total number of real packets based on the video analysis and the number of packets resulting from the filtering method (Nicollier et al., 2021b) is slightly smaller than but close to 1 for particle sizes ranging from 28.1 to 71.3 mm (Fig. 7). The ratio is close to 1 for two reasons. First, in the video analysis, we considered only the signal packets that were generated by particle impacts on the SPG plates. Second, given that the impacts of such small particles are generally too weak to generate apparent packets, the number of detected packets can be expected to be close to the number of impacts on the SPG plates. A possible explanation for could therefore be the limited visibility during the video analysis due to flow turbulence, resulting in an underestimation of the number of impacts on the SPG plates. However, the value of increases with increasing particle size in the range from 95.5 to 171.5 mm, and approaches a value of around 2 for the largest particle size class, which is possibly because of the following reasons. (a) Some particles that impacted close to boundaries (e.g., bolts) of the geophone plates were filtered out. (b) The number of impacts caused by sliding particles increases with increasing particle size. However, due to weak impact amplitudes/energies, some sliding particles may have been incorrectly filtered out. (c) It has been noticed that some bedload particles in the largest size classes may be misclassified due to the filtering method itself. Nevertheless, the data from video analysis is in general agreement with that obtained from the filtering method (Nicollier et al., 2021b).
The ratio represents the number of packets (identified from the SPG signal) divided by the number of particles transported over the plates (Wyss et al., 2016c). This represents a detection probability and can be considered a calibration curve of the SPG system that provides the value of as a function of bedload particle size for each transport mode (Fig. 11). For the transport mode of saltation, the larger particles generally generate more packets that are recorded by the SPG system due to their higher impact energies, which lead to longer wave transport distances. The values of for the rolling and sliding particles change less with increasing particle size (Fig. 11), and they are smaller than the values for the saltating particles over all bedload particle size classes. This is likely due to the fact that, in this study, the bed shear stress is constant during the flume experiments and is considerably larger than the critical bed shear stress, causing saltation to be the dominant transport mode.
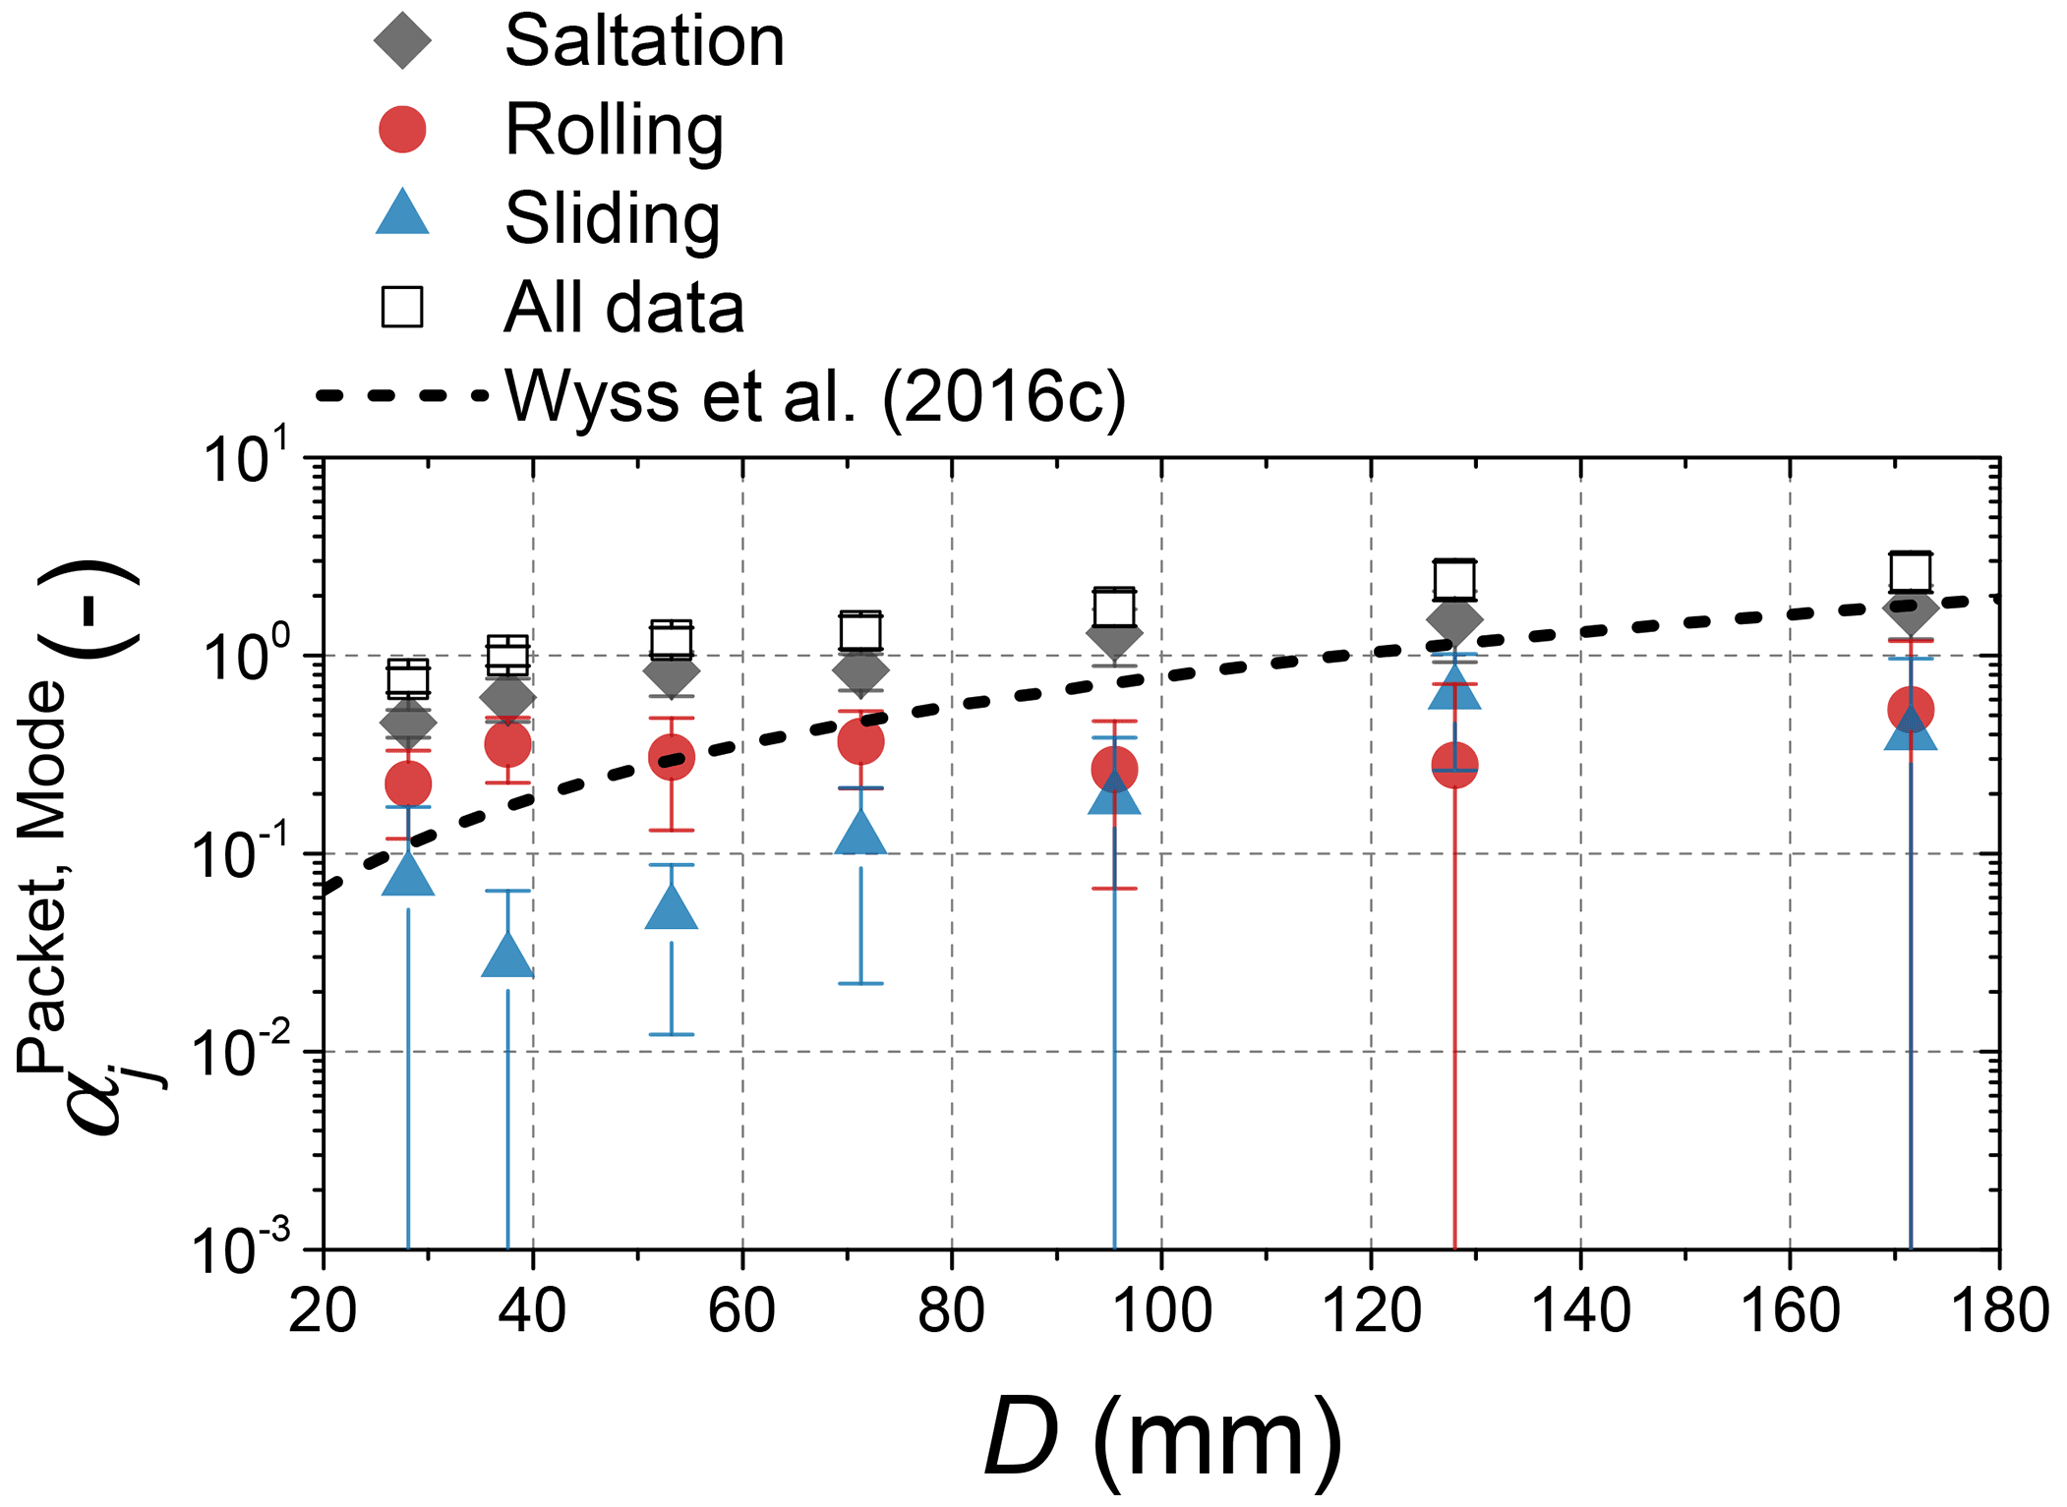
Figure 11The number of packets divided by the number of transported particles for each transport mode () as a function of bedload particle size D in the range from 28.1 to 171.5 mm. “All data” represents the sum of the packets generated by saltating, rolling, and sliding particles. The results from the flume experiments are also compared to the data from the Erlenbach field measurements analyzed by Wyss et al. (2016a) for a mean flow velocity of 5 m s−1.
The results obtained from the field measurements at the Erlenbach (Wyss et al., 2016c) were compared with the results of our controlled flume experiments. They showed smaller values than the overall data and the saltation data based on the video analysis. However, the differences between the field measurement data and the overall packet data from the flume experiments decrease with increasing particle size. This indicates that for the transport conditions in the Erlenbach, saltation appears to the dominant transport mode for D > ca. 90 mm, while the larger flow velocity at the Erlenbach could be the reason for the lower signal response for D < ca. 90 mm there as compared to the Obernach flume data. Note that the field measurements conducted by Wyss et al. (2016c) were associated with a mean water flow velocity of 5 m s−1, which is higher than the corresponding value of 3.3 m s−1 in our flume experiments. As a consequence, the hop distance of a bedload particle in the flow direction should be considerably larger for the field measurements than for the flume experiments, making it more likely for particles to fly over the plates, therefore leading to a smaller value of .
4.1.2 Impulses per particle mass
The impulse-mass coefficient kIPM decreases differently with increasing particle size for the different transport modes of saltation, rolling, and sliding. Generally, more impulses are triggered by saltation, regardless of bedload particle size (Fig. 8a). This is possibly because the saltating particles have higher hop heights and vertical impact velocities compared to particles that are rolling and sliding under the same flow condition. The differences in kIPM between rolling and sliding become significant for larger bedload particle sizes. This could be due to the following reasons: (a) for the packet data that were used to calculate kIPM, it must be noted that the impact locations of bedload particles were variable, leading to differences between rolling and sliding particles, and (b) large sliding particles are flatter than rolling particles, meaning that they may have contributed differently to the signal impulses.
4.1.3 Maximum amplitude
The maximum amplitude of a packet AmpMax,Pac grows almost according to a power law with increasing particle size for all of the transport modes, especially for the modes of saltation and rolling (Fig. 9a). However, the values of AmpMax,Pac increase less with changing bedload size for the largest particle sizes (ranging from 127.9 to 171.5 mm), in qualitative agreement with the experiments at the Erlenbach (Wyss et al., 2016a) and with the FEM simulation data (Chen et al., 2022). This “saturation” limit in terms of the maximum amplitude of a packet is likely due to the mechanical behavior of the SPG system. The variation in signal amplitude for each particle size class and each transport mode is mainly considered to be caused by the particle impact location on the SPG plates because of the flowing water. Experimental results determined from laboratory drop tests and numerical data obtained from FEM simulations showed that the maximum amplitude was reduced by more than 50 % upon shifting the impact away from occurring centrally to occurring eccentrically (Chen et al., 2022). Note that, even within a given particle size class in the flume experiments, the particles have a variable natural shape, which could also cause variable signal responses.
The median value of AmpMax,Pac for the mode of saltation is larger than that for the rolling particles and significantly larger than that for the sliding particles (Fig. 9). This is because a particle undergoing saltation generally has a higher impact velocity and can transfer more impact energy to the SPG plate. A considerable difference in AmpMax,Pac between the transport modes could potentially be helpful in identifying sliding particles for a given size experiment, and therefore may improve the signal conversion into fractional bedload transport rates. However, the transport mode cannot be precisely identified using only the signal amplitude in natural field conditions. This leads to some challenges when attempting to further improve particle-size identification by removing the effect of transport mode on the signal response of the SPG system, because the signal amplitude depends on both particle size and on transport mode.
4.1.4 Centroid frequency
The frequency FreqCentroid of a generated signal decreases with increasing bedload particle size (Fig. 10a), in agreement with previous investigations (Rickenmann, 2017; Wyss et al., 2016a). The median value of FreqCentroid for saltating particles is slightly larger than that for rolling and sliding particles. Assuming that the vertical impact velocity generally decreases from saltating to rolling to sliding particles, the observed change in FreqCentroid upon changing the transport mode is in general agreement with the Hertz theory (Thorne, 1985). According to the Hertz contact theory (Johnson, 1985; Thorne, 1986), the characteristic frequency of the signal response of the geophone plate shows a dependency on the contacting particle size (Bogen and Møen, 2003; Barrière et al., 2015; Wyss et al., 2016b; Rickenmann, 2017) such that the frequency decreases with increasing particle size. However, for a given particle size class, the differences in FreqCentroid between the three transport modes are not very significant. In any case, among all contributing factors, particle size dominates over the centroid frequency according to the Hertz theory. Although all signal data were obtained under the same constant flow conditions, the velocity of saltating particles was larger than those of rolling and sliding particles, but not considerably larger. The rolling and sliding bedload particles with approximately the same impact velocity move near the flume bed, causing there to be little difference in frequency for the same size class.
4.2 Effect of the particle impact angle on the SPG signal response
The impact angle θ between the direction of water flow and the direction of bedload particle motion might have an influence on the signal responses of the SPG system because of the changes in the vertical and horizontal components of the impact velocity. The impulse-mass coefficient kIPM changes only moderately with increasing impact angle in the range from around 5∘ to 90∘, as seen in numerical results (Fig. 8b), which were compared with the inclined chute experiments with both spherical and natural particles for impact angles of 45∘ and 60∘. However, a clear effect of bedload particle size on kIPM can be observed in Fig. 8b, indicating that the value of kIPM reduces with increasing particle size, which shows reasonable agreement with previous findings (Chen et al., 2022). This means that the SPG monitoring system is more sensitive to the bedload particle size than to the impact angle, in agreement with the Hertz theory as indicated above.
The maximum amplitude AmpMax,Pac increases with increasing impact angle for the numerical data up to an intermediate angle of about 45∘ (Fig. 9b). The values of AmpMax,Pac for the FEM simulations are considerably larger than those from the chute experiments for the impact angles of 45∘ and 60∘. This may be partly because the impact velocities in the inclined chute experiments were overestimated. Note that the impact velocities calculated from the experimental videos were variable, even for a fixed release height and particle size, due to friction along the chute bed and the drag forces of the water. The curve of AmpMax,Pac versus impact angle tends to become flatter with increasing impact angle. This is possibly due to a plastic behavior of the plate material, as the vertical velocity component becomes relatively large compared to typical natural flow conditions.
For a given impacting sphere size, the centroid frequency FreqCentroid appears to be relatively insensitive to changes in the impact angle, except for nearly horizontal impacts (Fig. 10b). FreqCentroid is lower for impact angles ranging from 0∘ to 10∘ than for the rest of the impact angles, which can possibly be explained as follows. We consider the fact that the horizontal impacts (sliding mode) in the FEM simulations occur under perfect conditions with an impact angle of 0∘, indicating that the contact between the spherical particle and the SPG plate is dominated by friction. It is convenient to assume that as the impact angle approaches the horizontal, the normal stress goes down while the shear stress increases. Furthermore, FreqCentroid can drop due to the extremely low vertical impact velocity (see Table 4) for a horizontal impact. As a consequence, the signal response and wave propagation could be fundamentally different from those for non-horizontal impacts, leading to a lower signal centroid frequency.
The centroid frequency FreqCentroid has been found to be somewhat less sensitive to the flow velocity than to the maximum packet amplitude AmpMax,Pac in controlled flume experiments (Wyss et al., 2016a). In the present study, we found that the dependences of FreqCentroid on the transport mode (as stated previously) and the impact angle are less than the dependences of AmpMax,Pac on the transport mode and the impact angle. Therefore, the centroid frequency appears to be somewhat better suited for particle size identification than the maximum amplitude.
4.3 Comparison with other flume studies
4.3.1 Probability of transport mode
The probability of occurrence of each transport mode is related to the flow intensity or the transport stage (Auel et al., 2017a; Hu and Hui, 1996), indicating correlations with the bedload size as well. Note that the transport modes of rolling and sliding are not distinguished in Auel et al. (2017a); both modes are lumped together under one term: rolling mode. In the flume experiments conducted by Auel et al. (2017a), sediment particles of three size categories, namely small, medium, and large (ranging from about 5.3 to 17.5 mm), were investigated in an artificial channel and recorded using a high-speed camera. Subsequently, a regression line that represented the shift from the saltation mode to the rolling mode was obtained by considering partial data from Hu and Hui (1996), as seen in Fig. 12a. Auel et al. (2017a) defined the probability of the rolling mode as the ratio of the distance covered by a rolling particle to the overall distance traveled (determined as the sum of all transport modes, and averaged over the number of particles). By comparison, in our study, the probability is calculated as the number of signal packets generated by particle impacts for each transport mode divided by the total number of recorded packets. Since the total number of recorded packets can represent the number of particles transported over the geophone plates and the surrounding concrete, the definition used in our study is more similar to that used in Hu and Hui (1996).
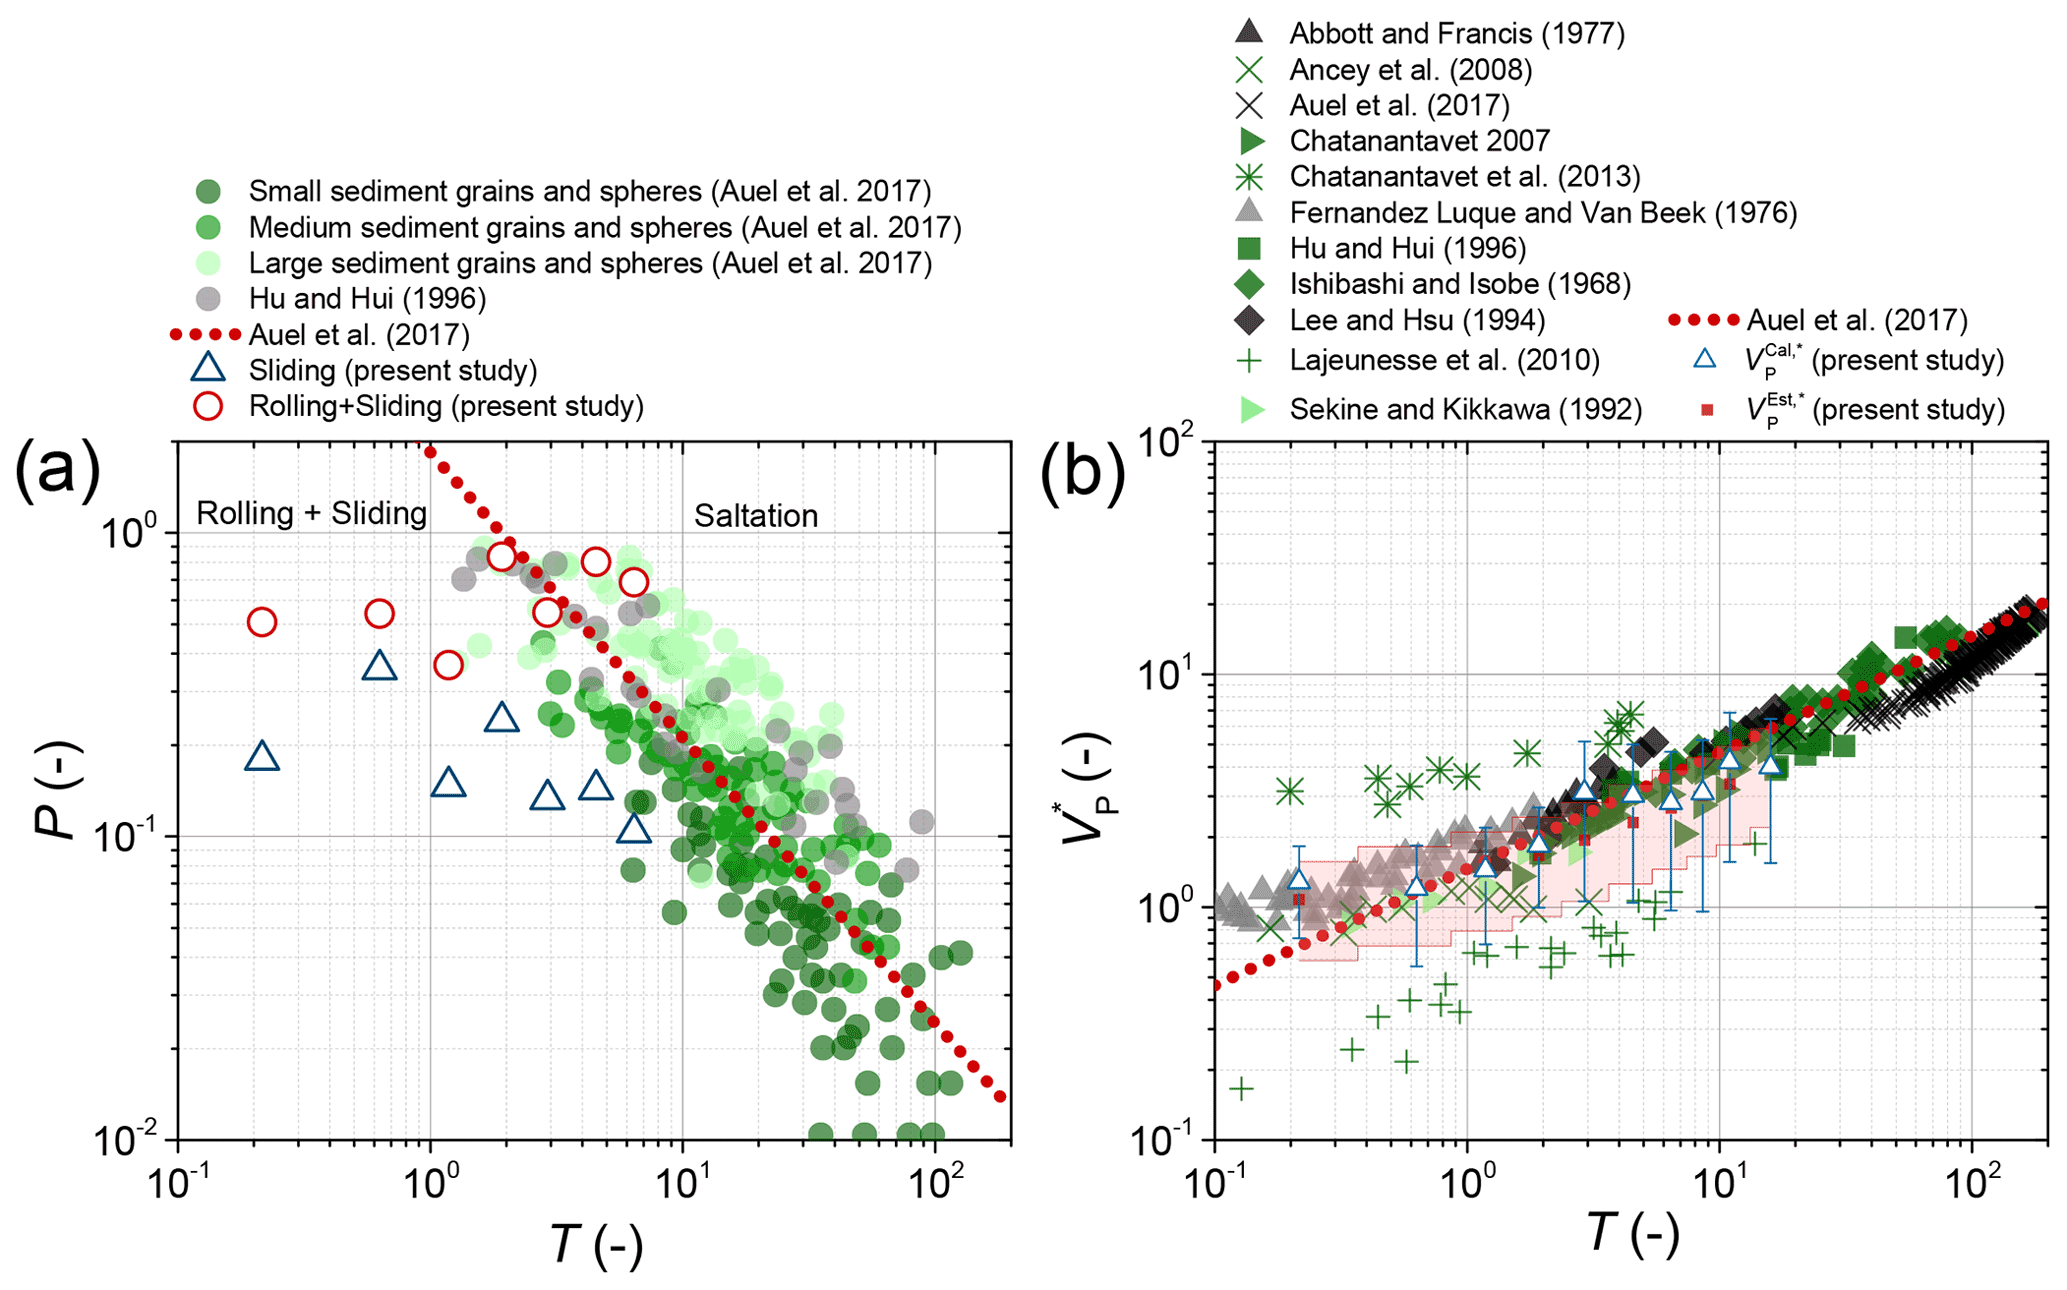
Figure 12(a) Probability of transport mode P (PSal for saltation, PRol for rolling, and PSli for sliding) as a function of the excess transport stage T. The data from Auel et al. (2017a), associated with natural grains and spheres with variable sizes ranging from about 5.3 to 17.5 mm, are shown in green. The data from Hu and Hui (1996) are presented in gray. The present results from our flume experiments with T ranging from 0.22 to 6.42 are compared to the power-law model (with R2=0.64) applied by Auel et al. (2017a) (dotted red line), and their compiled data. (b) The nondimensional particle velocity versus T. The power-law model (with R2=0.95) applied by Auel et al. (2017a) is shown as a dotted red line. The transparent red-shaded area indicates the variability of the particle velocity estimated as 30 %–80 % of the flow velocity, as suggested by Julien and Bounvilay (2013).
The probability of the rolling mode PRol decreases according to a power law with increasing excess transport stage T for the data compiled by Auel et al. (2017a), as is also illustrated by their proposed power law model to distinguish between the rolling and saltation regions in Fig. 12a. In our study, the dominant transport mode is saltation, as PSal equals about 55–73 %, varying with T. In contrast, 12–37 % of the particles are in rolling mode, and about 6–23 % are in sliding mode. We included our experimental data in Fig. 12a by defining the cumulative probability , based on the data from Fig. 6b. The changes in the probabilities of the transport modes are due to the presence of different particle sizes D in the range 28.1–171.5 mm, which causes the value of T to change from 6.42 to 0.22. With regard to PRol, the results of the flume experiments in Auel et al. (2017a) indicate that large particles have a high PRol for similar T values to those in our study. For the three smallest T values, our data show that the sum (PRol+PSli) is somewhat smaller whereas PSli is slightly larger than those for other (higher) T values. For small T values, the bed shear stress is very close to that for the incipient motion of particles, and this might have caused a decrease in the PRol values for more angular or flatter particles. Indeed, flatter particles are more likely to move via the sliding mode according to our video observations. For the four largest T values, our experimental data for rolling and saltating particles are reasonably consistent with the data of Auel et al. (2017a).
4.3.2 Particle velocity
Our experimental data for the dimensionless particle velocity show a dependency on the transport stage T, indicating a power law (Fig. 12b). A similar trend was found by Auel et al. (2017a), who compared their data with experimental data from other studies (Abbott and Francis, 1997; Ancey et al., 2008; Chatanantavet, 2007; Chatanantavet et al., 2013; Fernandez Luque and Van Beek, 1976; Hu and Hui, 1996; Ishibashi and Isobe, 1968; Lee and Hsu, 1994; Lajeunesse et al., 2010; Sekine and Kikkawa, 1992). represents the particle velocity VP ( and ) normalized by the term , where is the particle velocity calculated using the distance traveled by the particle and the arrival time difference determined from the starting times of the packets of the SPG and MPA signals, and is the estimated particle velocity, assuming that the ratio of the particle velocity to the flow velocity (30–80 %, the red-shaded area in Fig. 12b) is known.
Our results indicate that the estimated particle velocity is in the range of about 53–88 % of the flow velocity, showing that it is slightly higher than but basically agrees with the range given in Julien and Bounvilay (2013) (the transparent red-shaded area in Fig. 12b). The data are also close to the empirical model presented by Auel et al. (2017a), with the largest deviation obtained for the lowest T. The disagreement between our flume experiments and the power law function (see the dotted red line in Fig. 12b) of Auel et al. (2017a) is most pronounced for the smallest value of T. A reason might be that the bed stress was particularly close to that at incipient particle motion, and for such a condition there is generally larger scatter in all the experimental data than for larger values of T. Nevertheless, the general agreement of most of our experimental data on particle velocities suggests that our observations on particle transport modes should also be comparable with those in other flume studies.
In this research, systematic flume experiments and FEM simulations were conducted to study the signal response of the Swiss plate geophone bedload monitoring system when impacted by natural bedload particles with various sizes and with different angles of impact and transport modes. Some key parameters of the acoustic signal have been analyzed, including the ratio of the number of packets to the number of transported particles , the maximum amplitude of a packet AmpMax,Pac, the impulse-mass coefficient kIPM, and the centroid frequency FreqCentroid. The major conclusions of this study are summarized as follows:
-
The number of impacts counted from the experimental video is in general agreement with the data obtained from the filtering method. The number of packets for the rolling and sliding particles increases less with an increasing particle size. Also, for all bedload particle size classes, sliding and rolling generate a smaller number of packets than saltation.
-
The number of signal impulses per unit particle mass decreases nonlinearly with increasing bedload particle size and displays a dependency on the particle transport mode. It only weakly depends on the particle impact angle. In general, saltating particles trigger a larger number of signal impulses than rolling and sliding particles.
-
The maximum amplitude of a signal packet increases with increasing particle size for saltating and rolling particles, showing a dependency on the particle impact angle. The strongest signal response of the SPG system is excited by saltating particles, followed by rolling particles; the weakest signal is triggered by sliding particles.
-
The centroid frequencies of the acoustic signal generally decrease with increasing particle size across all transport modes. For the FEM simulations, the centroid frequency values are considerably lower for a horizontal impact than for the rest of the impact angles for a given particle size, indicating differences between the sliding and saltating particles. The centroid frequency appears to be somewhat better suited for particle size identification, as it is less sensitive to the transport mode and impact angle than the maximum packet amplitude is. This finding could be helpful for further improving the analysis of the SPG signal for fractional transport estimation.
-
The probability of each transport mode correlates with the transport stage and particle size of the bedload. The dominant transport mode in this study is saltation. The nondimensional velocity of the bedload particle increases according to a power law with increasing transport stage and is in general agreement with other flume studies.
Before the numerical simulations, the FEM model was calibrated with results obtained from previous lab experiments (drop tests) with quartz spheres (see below, Chen et al., 2021, 2022). Systematic drop experiments (Fig. A1a and b) were performed in quiescent water in the experimental flume with spheres of known mass and diameter. A transparent Plexiglas tube was used to control the drop height and to prevent any horizontal flow from disturbing the vertical fall trajectory of the sphere. The impact velocity of each quartz sphere falling onto the plate was measured in laboratory tests (Gaillard, 2018) using a high-speed camera mounted to give a side view. Figure A1c shows a comparison of the FEM signal and the experimental signal during a drop test in the Z direction (perpendicular to the plate and pointing up), which was triggered by a single bedload particle (diameter D=120 mm) impacting the plate (at a central location) with a velocity of 0.777 m s−1.
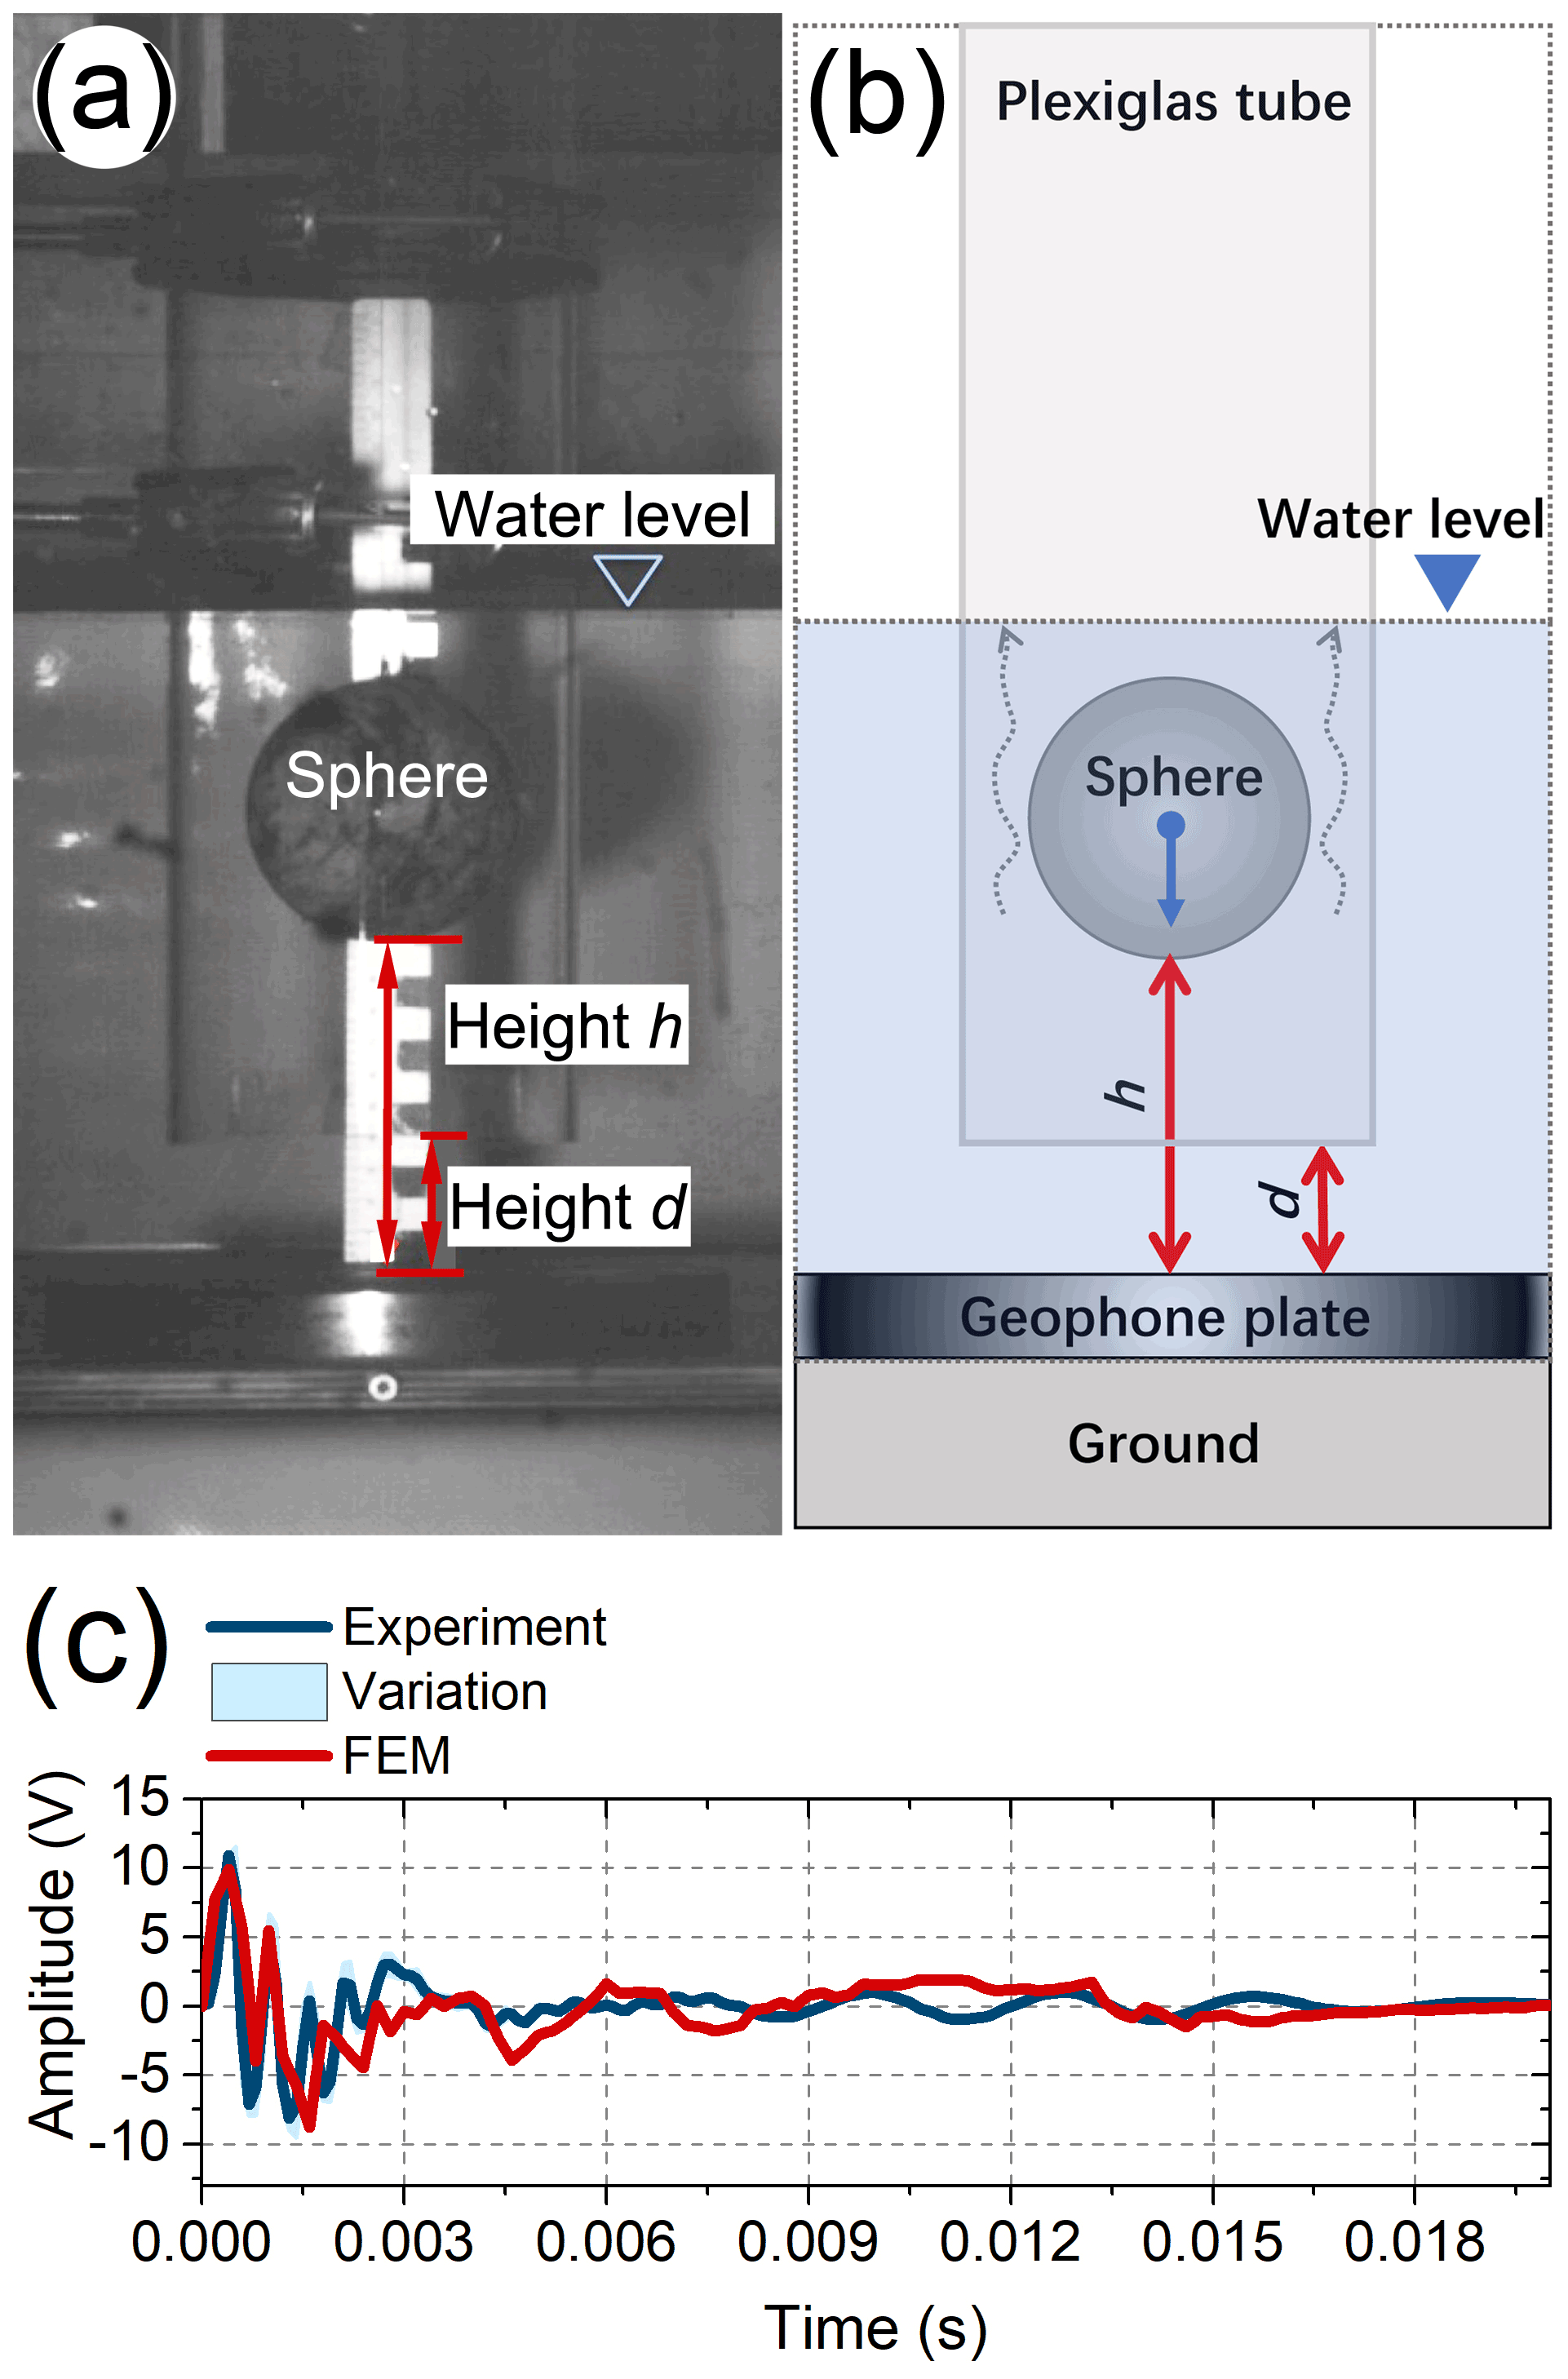
Figure A1(a) Side-view photo (Gaillard, 2018) and (b) sketch (taken from Chen et al., 2021, 2022) of the drop-test setup used in earlier laboratory tests to measure the impact velocity. h is the distance between the bottom surface of the sphere and the plate, and d is the distance between the bottom of the Plexiglas tube and the plate. The tube protects the sphere from flow turbulence in cases where the setup is used at field sites. (c) Comparison of the FEM signal and the experimentally generated signal (from the drop test) in the Z direction (perpendicular to the plate and pointing up), which was triggered by a single bedload particle (diameter D=120 mm) impacting at a central location on the plate with a velocity of 0.777 m s−1.
The analysis of the experimental videos included the following five steps: (1) tracking a saltating bedload particle from frame to frame for a certain time duration, especially when the particle contacts with the SPG plate or a nearby location, because saltation generally triggers a higher signal amplitude than the other two transport modes; (2) determining the time instants (time series ) of the impacts caused by this particle from the video frames, including the observation of a slight rotation (at time ) of the particle at the contact point, as described above; (3) isolating the signal packet (at time from the SPG output signals, as this packet is indicative of the particle impact on the SPG plates; (4) matching the analyzed particle impacts with the SPG signals using Eq. (B1) below and satisfying the condition of Eq. (B2) below; and (5) checking the impact instants generated by the rolling and sliding particles.
where is a coefficient for correcting the video time, is the calculated time instant for each signal packet, is the time instant of each bedload impact based on video observation, is the representative impact instant based on video observation, is the time instant for the isolated signal packet matched with , and is the packet time series recorded by geophones. The upper limit is considered in Eq. (B2) because, in general, the contact time between the particle and the plate ranges from 1 to 3 ms, which is less than the typical packet duration of 5–10 ms.
Figure C1a and b show representative signals of the SPG and MPA systems. The arrival time difference between the systems can be calculated from the starting time of the packets and for the SPG and MPA as , noting that the MPA system is located at the position downstream of the SPG system. Thus, the next task is to determine and .

Figure C1Illustration of the vibrations, signal packets, and packet number counts following a flume experiment with bedload particles of grain-size class C4 and a flow velocity of 3.3 m s−1. Panels (a) and (b) are representative signals that were recorded by the SPG and MPA systems, respectively. (c, d) Counting the number of packets and summing the numbers within the given time window (gray-shaded area in a and b). The blue and red lines are the summed number of packets in each time window for the SPG and MPA systems, respectively.
Given a time window TW and time step ΔtP (as seen in Fig. C1a and b), the number of packets within the kth time window is given by
where k=1, 2, …, (TE is the duration of the experiment and ⌊ ⌋ is the ceiling operator), n is the number of packets , which varies with the moving time window, and m=1.
In our study, the time window and time step are given as 1.0 and 0.05 s, respectively. Consequently, the numbers of packets for the SPG and MPA systems over the experimental duration TE can be expressed as functions of time that are shown by the blue and red lines in Fig. C1c and d, respectively. As the final number, we utilize the time difference that accounts for 5 % of the maximum value, as seen below:
where and correspond to 5 % of the maximum value in Fig. C1c.
| Symbol | Description |
| time instant for an isolated signal packet (s) | |
| representative impact instant based on | |
| video observation (s) | |
| AFFT,m | amplitude obtained by applying |
| a fast Fourier transform (FFT) to the signals | |
| (V Hz−1) | |
| AmpMax,Pac | maximum positive amplitude of the packet |
| (V) | |
| b | channel width (m) |
| Di | mean value of the bedload particle diameter |
| for each size class i (mm) | |
| Fc | frictional force exerted by the SPG plate on |
| the bedload particle (N) | |
| FContact | contact force between the sphere and the |
| plate (N) | |
| FEM | finite element method (–) |
| FFT | fast Fourier transform (–) |
| fm | spectral frequency (Hz) |
| Fn | vertical support force exerted by the SPG |
| plate on the bedload particle (N) |
| Symbol | Description |
| FPS | frames per second (s−1) |
| FreqCentroid | centroid frequency of acoustic signals |
| (Hz) | |
| Fw | force of water acting on the bedload |
| particle (N) | |
| G | particle weight force (N) |
| g | gravitational acceleration (m s−2) |
| h | flow depth (m) |
| I | number of impulses recorded by the SPG |
| system for each impact event (–) | |
| Ij | impulses recorded by the SPG system for |
| bedload particle-size class j (–) | |
| JPM | Japanese pipe microphone (–) |
| kIPM | number of impulses per particle mass that |
| is transported (kg−1) | |
| LP | particle travel distance (m) |
| center-to-center distance between the SPG | |
| and MPA systems (m) | |
| m | number of tests (–) |
| M | transported bedload mass (kg) |
| Mj | mean value of the bedload particle mass |
| for each size class j (kg) | |
| MPA | miniplate accelerometer (–) |
| n | number of particles for each experimental |
| run (–) | |
| Ni,j | number of particles for each experimental |
| run i and grain-size class j (–) | |
| number of particles for experimental run i | |
| and particle-size class j for the transport | |
| mode of saltation, rolling, or sliding (–) | |
| number of real packets for experimental | |
| run i and particle-size class j determined | |
| by the filtering method (–) | |
| total number of real packets for | |
| experimental run i and particle-size | |
| class j for all transport | |
| modes based on the video analysis (–) | |
| PDE | partial differential equations (–) |
| number of packets within the kth time | |
| window (–) | |
| Pi,j | number of packets for each experimental |
| run i and grain-size class j (–) | |
| number of packets for experimental | |
| run i and particle-size class j | |
| for the motion mode of saltation, rolling, | |
| or sliding (–) | |
| PM | probability of transport mode (PSal, PRol, |
| and PSli for saltation, rolling, and sliding, | |
| respectively) (–) | |
| Rh | hydraulic radius (m) |
| Symbol | Description |
| ratio of the total number of real packets | |
| for all transport modes based on the video | |
| observations to the number of real packets | |
| for experimental run i and particle-size | |
| class j determined by the numerical | |
| filtering method (–) | |
| rPW | ratio of particle velocity to water flow |
| velocity (–) | |
| S | bed slope (–) |
| s | ratio of particle density to water density |
| SPG | Swiss plate geophone (–) |
| T | excess transport stage (–) |
| TE | time duration of an experiment (–) |
| packet time series recorded by | |
| geophones (s) | |
| calculated time instant for each signal | |
| packet (s) | |
| kth time window (s) | |
| time instant of each bedload impact based | |
| on video observation (s) | |
| starting time of the packets for the MPA | |
| system (s) | |
| starting time of the packets for the SPG | |
| system, corresponding to 5 % of the | |
| maximum value (s) | |
| starting time of the packets for the MPA | |
| system corresponding to 5 % of the | |
| maximum value (s) | |
| starting time of the packets for the SPG | |
| system (s) | |
| TW | time window (s) |
| V | impact velocity of the sphere on the |
| plate (m s−1) | |
| VP | particle transport velocity (m s−1) |
| dimensionless particle velocity (–) | |
| calculated particle velocity (m s−1) | |
| particle velocity calculated from particle | |
| travel distance and time lag determined | |
| from the SPG and MPA signals (–) | |
| estimated particle velocity (m s−1) | |
| particle velocity estimated from the | |
| ratio of the averaged particle velocity | |
| to the water flow velocity (–) | |
| nondimensional particle velocity | |
| or (–) | |
| VW | water flow velocity (m s−1) |
| VY | Y component of the impact velocity |
| (m s−1) | |
| VZ | Z component of the impact velocity |
| (m s−1) | |
| ratio of the number of packets to the | |
| number of particles for each experimental | |
| run i and grain-size class j (–) |
| Symbol | Description |
| ratio of the number of packets to the | |
| number of particles for experimental | |
| run i, particle-size class j, and the | |
| transport mode of saltation, rolling, or | |
| sliding (–) | |
| ΔTP | particle travel time (s) |
| ΔtP | time step (s) |
| arrival time difference determined from | |
| the starting time of the packets and for | |
| the SPG and MPA systems (s) | |
| θ | impact angle (∘) |
| ΘCritical | critical Shields parameter (–) |
| λ | coefficient for correcting the video |
| time (–) | |
| ρ | water density (kg m−3) |
| ρs | density of a particle (kg m−3) |
| time-averaged bed shear stress (N m−2) | |
| τcritical | critical bed shear stress (N m−2) |
Readers should contact Dieter Rickenmann (dieter.rickenmann@wsl.ch) and Tobias Nicollier (tobias.nicollier@wsl.ch) if they are interested in the code used in this paper.
Datasets for this research are available to readers upon request.
ZC, TN, LA, AB, and DR conceived and planned the experiments. ZC, TN, and LA carried out the experiments. ZC, SH, and TN contributed to software and code. ZC performed the simulations and analyzed the data. ZC, TN, LA, AB, and DR contributed to the interpretation of the results. ZC wrote the manuscript. All authors reviewed, commented, and helped revise the manuscript.
The contact author has declared that neither they nor their co-authors have any competing interests.
Publisher's note: Copernicus Publications remains neutral with regard to jurisdictional claims in published maps and institutional affiliations.
The authors thank Arnd Hartlieb and his colleagues at TU Munich for their support with the experiments at the Obernach outdoor flume facility. The authors also warmly thank the associate editor Rebecca Hodge, the reviewer Thomas Geay, and one anonymous reviewer for their valuable comments on this paper.
This study was supported by the National Natural Science Foundation of China (grants 41772312 and 41790433 awarded to Siming He), the Key Deployment Project of CAS (grant KFZD-SW-424 awarded to Siming He), the China Scholarship Council CSC (file no. 201904910867 awarded to Zheng Chen), and the Swiss National Science Foundation SNSF (grant 200021L_172606 awarded to Dieter Rickenmann).
This paper was edited by Rebecca Hodge and reviewed by Thomas Geay and one anonymous referee.
Abbott, J. E. and Francis, J. R. D.: Saltation and suspension trajectories of solid grains in a water stream, Philos. T. Roy. Soc. A, 284, 225–254, https://doi.org/10.1098/rsta.1977.0009, 1977.
Ancey, C., Davison, A. C., Böhm, T., Jodeau, M., and Frey, P.: Entrainment and motion of coarse particles in a shallow water stream down a steep slope, J. Fluid Mech., 595, 83–114, https://doi.org/10.1017/S0022112007008774, 2008.
Antoniazza, G., Nicollier, T., Wyss, C. R., Boss, S., and Rickenmann, D.: Bedload transport monitoring in Alpine rivers: variability in Swiss plate geophone response, Sensors, 20, 4089, https://doi.org/10.3390/s20154089, 2020.
Auel, C., Albayrak, I., Sumi, T., and Boes, R. M.: Sediment transport in high-speed flows over a fixed bed: 1. Particle dynamics, Earth. Surf. Proc. Land., 42, 1365–1383, https://doi.org/10.1002/esp.4128, 2017a.
Auel, C., Albayrak, I., Sumi, T., and Boes, R. M.: Sediment transport in high-speed flows over a fixed bed: 2. Particle impacts and abrasion prediction, Earth. Surf. Proc. Land., 42, 1384–1396, https://doi.org/10.1002/esp.4132, 2017b.
Bakker, M., Gimbert, F., Geay, T., Misset, C., Zanker, S., and Recking, A.: Field application and validation of a seismic bedload transport model, J. Geophys. Res.-Earth, 125, e2019JF005416, https://doi.org/10.1029/2019JF005416, 2020.
Barrière, J., Krein, A., Oth, A., and Schenkluhn, R.: An advanced signal processing technique for deriving grain size information of bedload transport from impact plate vibration measurements, Earth. Surf. Proc. Land., 40, 913–924, https://doi.org/10.1002/esp.3693, 2015.
Barton, J. S., Slingerland, R. L., Pittman, S., and Gabrielson, T. B.: Passive acoustic monitoring of coarse bedload transport on the Trinity River, in: Eighth Federal Interagency Sedimentation Conference, 2–6 April 2006, 627–634, https://pubs.usgs.govVisc/FISC_1947-2006/pdf/1st-7thFISCs-CD/8thFISC/Session 9C-3_BartonEtAl.pdf (last access: 23 March 2022), 2006.
Barton, J. S., Slingerland, R. L., Pittman, S., and Gabrielson, T. B.: Monitoring coarse bedload transport with passive acoustic instrumentation: A field study, US Geol. Surv. Sci. Investig. Rep. 5091, US Geological Surve, 14 pp., https://pubs.usgs.gov/sir/2010/5091/papers/Barton.pdf (last access: 23 March 2022), 2010.
Beylich, A. A. and Laute, K.: Combining impact sensor field and laboratory flume measurements with other techniques for studying fluvial bedload transport in steep mountain streams, Geomorphology, 218, 72–87, https://doi.org/10.1016/j.geomorph.2013.09.004, 2014.
Bogen, J. and Møen, K.: Bed load measurements with a new passive acoustic sensor, in: Erosion and Sediment Transport Measurement in Rivers: Trends and Explanation, IAHS Publications, 283, 181–182, https://iahs.info/uploads/dms/iahs_283_181.pdf (last access: 23 March 2022), 2003.
Bunte, K., Abt, S. R., Potyondy, J. P., and Ryan, S. E.: Measurement of coarse gravel and cobble transport using portable bedload traps, J. Hydraul. Eng., 130, 879–893, https://doi.org/10.1061/(ASCE)0733-9429(2004)130:9(879), 2004.
Burtin, A., Bollinger, L., Vergne, J., Cattin, R., and Nábělek, J. L.: Spectral analysis of seismic noise induced by rivers: A new tool to monitor spatiotemporal changes in stream hydrodynamics, J. Geophys. Res.-Solid, 113, B05301, https://doi.org/10.1029/2007JB005034, 2008.
Burtin, A., Vergne, J., Rivera, L., and Dubernet, P.: Location of river-induced seismic signal from noise correlation functions, Geophys. J. Int., 182, 1161–1173, https://doi.org/10.1111/j.1365-246X.2010.04701.x, 2010.
Burtin, A., Cattin, R., Bollinger, L., Vergne, J., Steer, P., Robert, A., Findling, N., and Tiberi, C.: Towards the hydrologic and bed load monitoring from high–frequency seismic noise in a braided river: The “torrent de St Pierre”, French Alps, J. Hydrol., 408, 43–53, https://doi.org/10.1016/j.jhydrol.2011.07.014, 2011.
Camenen, B., Jaballah, M., Geay, T., Belleudy, P., Laronne, J. B., and Laskowski, J. P.: Tentative measurements of bedload transport in an energetic alpine gravel bed river, in: River flow, September 2012, 379–386, https://hal.inrae.fr/hal--02597879 (last access: 23 March 2022), 2012.
Cassel, M., Lavé, J., Recking, A., Malavoi, J. R., and Piégay, H.: Bedload transport in rivers, size matters but so does shape, Sci. Rep., 11, 1–11, https://doi.org/10.1038/s41598-020-79930-7, 2021.
Chatanantavet, P.: Physically-based models of bedrock incision processes in mountain streams, PhD thesis, University of Minnesota, Minneapolis, USA, 210 pp., https://ui.adsabs.harvard.edu/abs/2007PhDT.......214C/abstract, last access: 23 March 2022, ISBN 9780549308034, 2007.
Chatanantavet, P., Whipple, K. X., Adams, M. A., and Lamb, M. P.: Experimental study on coarse grain saltation dynamics in bedrock channels, J. Geophys. Res.-Earth, 118, 1161–1176, https://doi.org/10.1002/jgrf.20053, 2013.
Chen, Z., He, S., Nicollier, T., Ammann, L., Badoux, A., and Rickenmann, D.: Controlled experiments and finite element simulations with the Swiss plate geophone bedload monitoring system: particle size identification and transport mode, in: EGU General Assembly 2021, online, 19–30 April 2021, EGU21-2078, https://doi.org/10.5194/egusphere-egu21-2078, 2021.
Chen, Z., He, S., Nicollier, T., Ammann, L., Badoux, A., and Rickenmann, D.: Finite element modelling of the Swiss plate geophone bedload monitoring system, J. Hydraul. Res., accepted, 2022.
Childers, D.: Field comparisons of six pressure–difference bedload samplers in high–energy flow, US Department of the Interior, US Geological Survey, 71 pp., http://vulcan.wr.usgs.gov/Volcanoes/ (last access: 23 March 2022), 1999.
Conevski, S., Ruther, N., Guerrero, M., and Rennie, C.: Laboratory monitoring of bedload transport rates using hydro-acoustic techniques (ADCP), in: Proceedings of the 38th IAHR World Congress, September 2019, Panama city, Panama, 1–6, https://doi.org/10.3850/38WC092019-1594, 2019.
Emmett, W. W.: A field calibration of the sediment–trapping characteristics of the Helley–Smith bedload sampler, US Government Printing Office, 54 pp., https://doi.org/10.3133/pp1139, 1980.
Farin, M., Tsai, V. C., Lamb, M. P., and Allstadt, K. E.: A physical model of the high-frequency seismic signal generated by debris flows, Earth. Surf. Proc. Land., 44, 2529–2543, https://doi.org/10.1002/esp.4677, 2019.
Fernandez Luque, R. and Van Beek, R.: Erosion and transport of bed-load sediment, J. Hydraul. Res., 14, 127-144, https://doi.org/10.1080/00221687609499677, 1976.
Gaillard, A.: Laboratory experiments to develop a testing device for the geophone bedload transport measuring system, Bachelor thesis, University of Neuchâtel, Neuchâtel, Switzerland, 19 pp., 2018.
Geay, T., Belleudy, P., Gervaise, C., Habersack, H., Aigner, J., Kreisler, A., Seiz, H., and Laronne, J. B.: Passive acoustic monitoring of bed load discharge in a large gravel bed river, J. Geophys. Res.-Solid, 122, 528–545, https://doi.org/10.1002/2016JF004112, 2017.
Geay, T., Zanker, S., Misset, C., and Recking, A.: Passive Acoustic Measurement of Bedload Transport: Toward a Global Calibration Curve?, J. Geophys. Res.-Earth, 125, e2019JF005242, https://doi.org/10.1029/2019JF005242, 2020.
Gimbert, F., Fuller, B. M., Lamb, M. P., Tsai, V. C., and Johnson, J. P.: Particle transport mechanics and induced seismic noise in steep flume experiments with accelerometer-embedded tracers, Earth. Surf. Proc. Land., 44, 219–241, https://doi.org/10.1002/esp.4495, 2019.
Govi, M., Maraga, F., and Moia, F.: Seismic detectors for continuous bed load monitoring in a gravel stream, Hydrolog. Sci. J., 38, 123–132, https://doi.org/10.1080/02626669309492650, 1993.
Gray, J. R., Laronne, J. B., and Marr, J. D.: Bedload–surrogate monitoring technologies, US Department of the Interior, US Geological Survey, 37 pp., https://pubs.usgs.gov/sir/2010/5091/ (last access: 23 March 2022), 2010.
Habersack, H. M. and Laronne, J. B.: Evaluation and improvement of bed load discharge formulas based on Helley–Smith sampling in an alpine gravel bed river, J. Hydraul. Eng., 128, 484-499, https://doi.org/10.1061/(ASCE)0733-9429(2002)128:5(484), 2002.
Hayward, J. A.: Hydrology and stream sediments in a mountain catchment, Lincoln College, Tussock Grasslands and Mountain Lands Institute, http://researcharchive.lincoln.ac.nz/handle/10182/5664 (last access: 23 March 2022), 1980.
Helley, E. J., and Smith, W.: Development and calibration of a pressure–difference bedload sampler, US Department of the Interior, Geological Survey, Water Resources Division, 38 pp., https://xs.dailyheadlines.cc/books?hl=zh-CN&lr=&id=c6JTAAAAYAAJ&oi=fnd&pg=PA1&ots=_6LwGxeZr3&sig=TWoJa5WLyQJZxVOH0cN9VmJVz1w (last access: 23 March 2022), 1971.
Hsu, L., Finnegan, N. J., and Brodsky, E. E.: A seismic signature of river bedload transport during storm events, Geophys. Res. Lett., 38, L13407, https://doi.org/10.1029/2011GL047759, 2011.
Hu, C., and Hui, Y.: Bed-load transport. I: Mechanical characteristics, J. Hydraul. Eng., 122, 245–254, https://doi.org/10.1061/(ASCE)0733-9429(1996)122:5(245), 1996.
Ishibashi, T. and Isobe, A.: Hydraulic study on the protection of erosion of sand flush channel, CRIEPI – Central Research Institute of Electric Power Industry, Rep. 67104, 1968.
Johnson, K. L.: Contact mechanics, Cambridge University Press, UK, ISBN 0521255767, 1985.
Julien, P. Y. and Bounvilay, B.: Velocity of rolling bed load particles, J. Hydraul. Eng., 139, 177–186, https://doi.org/10.1061/(ASCE)HY.1943-7900.0000657, 2013.
Krein, A., Klinck, H., Eiden, M., Symader, W., Bierl, R., Hoffmann, L., and Pfister, L.: Investigating the transport dynamics and the properties of bedload material with a hydro-acoustic measuring system, Earth. Surf. Proc. Land., 33, 152–163, https://doi.org/10.1002/esp.1576, 2008.
Lajeunesse, E., Malverti, L., and Charru, F.: Bed load transport in turbulent flow at the grain scale: experiments and modelling, J. Geophys. Res.-Earth, 115, F04001, https://doi.org/10.1061/(ASCE)HY.1943-7900.0000657, 2010.
Lee, H. Y. and Hsu, I. S.: Investigation of saltating particle motions, J. Hydraul. Eng., 120, 831–845, https://doi.org/10.1061/(ASCE)0733-9429(1994)120:7(831), 1994.
LSTC: LS–DYNA keyword user's manual, Livermore Software Technology Corporation, Livermore, California, http://www.lstc.com/ (last access: 18 January 2020), 2014.
Mizuyama, T., Oda, A., Laronne, J. B., Nonaka, M., and Matsuoka, M.: Laboratory tests of a Japanese pipe geophone for continuous acoustic monitoring of coarse bedload, US Geological Survey Scientific Investigations Report 5091, US Geological Survey, 17 pp., https://www.researchgate.net/publication/266071395 (last access: 23 March 2022), 2010.
Møen, K. M., Bogen, J., Zuta, J. F., Ade, P. K., and Esbensen, K.: Bedload measurement in rivers using passive acoustic sensors, US Geological Survey Scientific Investigations Report 5091, US Geological Survey, 17 pp., https://www.researchgate.net/publication/267238644 (last access: 23 March 2022), 2010.
Nicollier, T., Rickenmann, D., and Hartlieb, A.: Calibration of the Swiss plate geophone system at the Albula field site with direct bedload samples and comparison with controlled flume experiments, in: SEDHYD 2019 Conference, Federal Interagency Sedimentation and Hydrologic, Modeling Conference, 24–28 June 2019, Reno, USA, 345 pp., https://mediatum.ub.tum.de/1539763 (last access: 23 March 2022), 2019.
Nicollier, T., Rickenmann, D., Boss, S., Travaglini, E., and Hartlieb, A.: Calibration of the Swiss plate geophone system at the Zinal field site with direct bedload samples and results from controlled flume experiments, River Flow 2020, in: Proceedings of the 10th Conference on Fluvial Hydraulics, 7–10 July 2020, Delft, the Netherlands, 1–8, https://doi.org/10.1201/b22619-127, 2020.
Nicollier, T., Rickenmann, D., and Hartlieb, A.: Field and flume measurements with the impact plate: Effect of bedload grain-size distribution on signal response, Earth. Surf. Proc. Land., 46, 1504–1520, https://doi.org/10.1002/esp.5117, 2021a.
Nicollier, T., Antoniazza, G., Rickenmann, D., and Hartlieb, A., Kirchner, J. W.: Improving the calibration of impact plate bedload monitoring systems by filtering out acoustic signals from extraneous particle impacts, ESSOAr (preprint), 13 August 2021, https://doi.org/10.1002/essoar.10507726.2, 2021b.
Rennie, C. D., Vericat, D., Williams, R. D., Brasington, J., and Hicks, M.: Calibration of acoustic doppler current profiler apparent bedload velocity to bedload transport rate, in: Gravel-Bed Rivers: Processes and Disasters, edited by: Tsutsumi, D. and Laronne, J. B., Wiley, Blackwell, Oxford, UK, 209–233, https://doi.org/10.1002/9781118971437.ch8, 2017.
Rickenmann, D.: Methods for the quantitative assessment of channel processes in torrents (steep streams), CRC Press, ISBN 978-1-138-02961-3, ISBN 978-1-4987-7662-2, 2016.
Rickenmann, D.: Bed–load transport measurements with geophones and other passive acoustic methods, J. Hydraul. Eng., 143, 03117004, https://doi.org/10.1061/(ASCE)HY.1943-7900.0001300, 2017.
Rickenmann, D.: Effect of sediment supply on cyclic fluctuations of the disequilibrium ratio and threshold transport discharge, inferred from bedload transport measurements over 27 years at the Swiss Erlenbach stream, Water Resour. Res., 56, e2020WR027741, https://doi.org/10.1029/2020WR027741, 2020.
Rickenmann, D. and Fritschi, B.: Bedload transport measurements with impact plate geophones in two Austrian mountain streams (Fischbach and Ruetz): system calibration, grain size estimation, and environmental signal pick-up, Earth Surf. Dynam., 5, 669–687, https://doi.org/10.5194/esurf-5-669-2017, 2017.
Rickenmann, D. and McArdell, B. W.: Continuous measurement of sediment transport in the Erlenbach stream using piezoelectric bedload impact sensors, Earth. Surf. Proc. Land., 32, 1362–1378, https://doi.org/10.1002/esp.1478, 2007.
Rickenmann, D., Turowski, J. M., Fritschi, B., Klaiber, A., and Ludwig, A.: Bedload transport measurements at the Erlenbach stream with geophones and automated basket samplers, Earth. Surf. Proc. Land., 37, 1000–1011, https://doi.org/10.1002/esp.3225, 2012.
Rickenmann, D., Turowski, J. M., Fritschi, B., Wyss, C., Laronne, J., Barzilai, R., Reid, I., Kreisler, A., Aigner, J., Seitz, H., and Habersack, H.: Bedload transport measurements with impact plate geophones: comparison of sensor calibration in different gravel-bed streams, Earth. Surf. Proc. Land., 39, 928–942, https://doi.org/10.1002/esp.3499, 2014.
Rigby, J. R., Kuhnle, R. A., Goodwiller, B. T., Nichols, M. H., Carpenter, W. O., Wren, D. G., and Chambers, J. P.: Sediment–generated noise (SGN): Comparison with physical bed load measurements in a small semi-arid watershed, in: SEDHYD Conference, April 2015, 19–23, https://www.ars.usda.gov/research/publications/publication/?seqNo115=313726 (last access: 22 March 2022), 2015.
Rigby, J. R., Wren, D. G., and Kuhnle, R. A.: Passive acoustic monitoring of bed load for fluvial applications, J. Hydraul. Eng., 142, 02516003, https://doi.org/10.1061/(ASCE)HY.1943-7900.0001122, 2016.
Roth, D. L., Finnegan, N. J., Brodsky, E. E., Rickenmann, D., Turowski, J. M., Badoux, A., and Gimbert, F.: Bed load transport and boundary roughness changes as competing causes of hysteresis in the relationship between river discharge and seismic amplitude recorded near a steep mountain stream, J. Geophys. Res.-Earth, 122, 1182–1200, https://doi.org/10.1002/2016JF004062, 2017.
Ryan, S. E., Porth, L. S., and Troendle, C. A.: Coarse sediment transport in mountain streams in Colorado and Wyoming, USA, Earth. Surf. Proc. Land., 30, 269–288, https://doi.org/10.1002/esp.1128, 2005.
Schneider, J. M., Rickenmann, D., Turowski, J. M., Bunte, K., and Kirchner, J. W.: Applicability of bed load transport models for mixed-size sediments in steep streams considering macro-roughness, Water Resour. Res., 51, 5260–5283, https://doi.org/10.1002/2014WR016417, 2015.
Sekine, M. and Kikkawa, H.: Mechanics of saltating grains II, J. Hydraul. Eng., 118, 536–558, https://doi.org/10.1061/(ASCE)0733-9429(1992)118:4(536), 1992.
Shahmohammadi, R., Afzalimehr, H., and Sui, J.: Assessment of Critical Shear Stress and Threshold Velocity in Shallow Flow with Sand Particles, Water, 13, 994, https://doi.org/10.3390/w13070994, 2021.
Thorne, P. D.: The measurement of acoustic noise generated by moving artificial sediments, J. Acoust. Soc. Am., 78, 1013–1023, https://doi.org/10.1121/1.393018, 1985.
Thorne, P. D.: Laboratory and marine measurements on the acoustic detection of sediment transport, J. Acoust. Soc., 80, 899–910, https://doi.org/10.1121/1.393913, 1986.
Thorne, P. D.: An overview of underwater sound generated by interparticle collisions and its application to the measurements of coarse sediment bedload transport, Earth Surf. Dynam., 2, 531–543, https://doi.org/10.5194/esurf-2-531-2014, 2014.
Tsai, V. C., Minchew, B., Lamb, M. P., and Ampuero, J. P.: A physical model for seismic noise generation from sediment transport in rivers, Geophys. Res. Lett., 39, 1–6, https://doi.org/10.1029/2011GL050255, 2012.
Tsakiris, A. G., Papanicolaou, A. T. N., and Lauth, T. J.: Signature of bedload particle transport mode in the acoustic signal of a geophone, J. Hydraul. Res., 52, 185–204, https://doi.org/10.1080/00221686.2013.876454, 2014.
Turowski, J. M. and Rickenmann, D.: Tools and cover effects in bedload transport observations in the Pitzbach, Austria, Earth. Surf. Proc. Land., 34, 26–37, https://doi.org/10.1002/esp.1686, 2009.
Turowski, J. M., Böckli, M., Rickenmann, D., and Beer, A. R.: Field measurements of the energy delivered to the channel bed by moving bed load and links to bedrock erosion, J. Geophys. Res.-Earth, 118, 2438–2450, https://doi.org/10.1002/2013JF002765, 2013.
Turowski, J. M., Wyss, C. R., and Beer, A. R.: Grain size effects on energy delivery to the streambed and links to bedrock erosion, Geophys. Res. Lett., 42, 1775–1780, https://doi.org/10.1002/2015GL063159, 2015.
Vasile, G.: Vibration data processing for bedload monitoring in underwater environments, Remote Sens., 12, 2797, https://doi.org/10.3390/rs12172797, 2020.
Wyss, C. R., Rickenmann, D., Fritschi, B., Turowski, J. M., Weitbrecht, V., and Boes, R. M.: Bedload grain size estimation from the indirect monitoring of bedload transport with Swiss plate geophones at the Erlenbach stream, in: River Flow 2014, 1907–1912, https://www.researchgate.net/publication/265515326 (last access: 23 March 2022), 2014.
Wyss, C. R., Rickenmann, D., Fritschi, B., Turowski, J. M., Weitbrecht, V., and Boes, R. M.: Laboratory flume experiments with the Swiss plate geophone bed load monitoring system: 1. Impulse counts and particle size identification, Water Resour. Res., 52, 7744–7759, https://doi.org/10.1002/2015WR018555, 2016a.
Wyss, C. R., Rickenmann, D., Fritschi, B., Turowski, J. M., Weitbrecht, V., Travaglini, E., Bardou, E., and Boes, R. M.: Laboratory flume experiments with the Swiss plate geophone bed load monitoring system: 2. Application to field sites with direct bed load samples, Water Resour. Res., 52, 7760–7778, https://doi.org/10.1002/2016WR019283, 2016b.
Wyss, C. R., Rickenmann, D., Fritschi, B., Turowski, J. M., Weitbrecht, V., and Boes, R. M.: Measuring bed load transport rates by grain–size fraction using the Swiss plate geophone signal at the Erlenbach, J. Hydraul. Eng., 142, 04016003, https://doi.org/10.1061/(ASCE)HY.1943-7900.0001090, 2016c.