the Creative Commons Attribution 4.0 License.
the Creative Commons Attribution 4.0 License.
 | 12 Jan 2022
From apex to shoreline: fluvio-deltaic architecture for the Holocene Rhine–Meuse delta, the Netherlands
Marc J. P. Gouw
Despite extensive research on alluvial architecture, there is still a pressing need for data from modern fluvio-deltaic environments. Previous research in the fluvial-dominated proximal and central Rhine–Meuse delta (the Netherlands) has yielded clear spatial trends in alluvial architecture. In this paper, we include the backwater length to establish architectural trends from apex to shoreline. Channel-belt sand body width thickness ratios and interconnectedness were determined, and the proportions of fluvial channel-belt deposits, fluvial overbank deposits, organics and intertidal deposits were calculated for the complete fluvio-deltaic wedge based on high-resolution geological cross sections. It was found that the average width thickness ratio of channel-belt sand bodies in the proximal delta is 5 times higher than in the distal delta. Other down-valley trends include an 80 % decrease in the channel deposit proportion (CDP) and a near-constant proportion of overbank deposits. Additionally, interconnectedness in the proximal delta is 3 times higher than in the distal delta. Based on the Rhine–Meuse dataset, we propose a linear empirical function to model the spatial variability of CDP. It is argued that this relationship is driven by four key factors: channel lateral-migration rate, channel-belt longevity, creation of accommodation space and inherited floodplain width. Additionally, it is established that the sensitivity of CDP to changes in the ratio between channel-belt sand body width and floodplain width (normalized channel-belt sand body width) varies spatially and is greatest in the central and distal delta. Furthermore, the proportion of fluvial channel-belt sands is generally an appropriate proxy for the total sand content of fluvio-deltaic successions, although its suitability as a total sand indicator rapidly fades in the distal delta. Characteristics of the backwater zone of the Rhine–Meuse delta are (1) sand body width thickness ratios that are lower as a consequence of channel narrowing (not deepening), (2) a rapid increase and then a drop in the organic proportion, (3) an increase in the total sand proportion towards the shoreline, and (4) a drop in the connectedness ratio. For this paper, unique high-resolution quantitative data and spatial trends of the alluvial architecture are presented for an entire delta, providing data that can be used to further improve existing fluvial stratigraphy models.
- Article
(3886 KB) - Full-text XML
- BibTeX
- EndNote


The architecture of fluvio-deltaic successions has been studied extensively in the past decades mainly because of the occurrence of valuable natural resources (water, hydrocarbons, precious metals, sand) within strata of fluvio-deltaic origin (e.g. Tye et al., 1999; Ryseth, 2000; Kombrink et al., 2007). Alluvial architecture describes the proportion, distribution and geometry of fluvial sediment bodies in sedimentary basins (Allen, 1978). Alluvial-architecture studies primarily focus on the geometry of fluvial sand bodies (see Gibling, 2006, for an extensive overview), the proportion of channel-belt sands within fluvial successions (e.g. Ryseth et al., 1998; Bridge et al., 2000; Flood and Hampson, 2015; Blum et al., 2013) and controlling factors reckoned to influence alluvial architecture (e.g. Heller and Paola, 1996; Zaleha, 1997; Hajek and Wolinsky, 2012). Despite the elaborate work that has already been done, there are still two aspects of interest concerning alluvial-architecture research.
First, the majority of published alluvial-architecture studies cover ancient (hard-rock) successions, often to provide analogues for hydrocarbon-bearing formations (e.g. Aigner et al., 1996; Bridge et al., 2000; Dalrymple, 2001). A drawback of studying ancient successions is that they are typically incomplete and/or deformed due to post-depositional processes (erosion, faulting, compaction), which introduces significant uncertainty in the interpretation of alluvial architecture. Furthermore, time control of ancient formations is usually poor, whereas adequate dating of the deposits is needed to characterize the architecture of a fluvial succession (Bridge, 2003). Moreover, acquired datasets of ancient deposits are mostly of limited (palaeo)geographic extent. Most alluvial-architecture research of ancient formations therefore encompasses only a limited section of the larger fluvial system or delta that the studied deposits are part of (e.g. Lopez-Gomez et al., 2009; Jensen and Pedersen, 2010; Corbett et al., 2011; York et al., 2011), meaning that the large-scale transition from river valley to coastal plain (and associated backwater effects) is understudied, despite the fact that we know from modern systems that these effects are substantial (Blum et al., 2013; Wu and Nitterour, 2020). Comprehensive studies covering the alluvial architecture on a delta scale are consequently scarce.
The second point of interest in alluvial-architecture research is the constant need for – or chronic lack of – architectural field data to aid (and enhance) geological modelling. Modelling is commonly employed by geologists to reconstruct and understand three-dimensional fluvial stratigraphy, for example to support reservoir characterization (see, e.g. Bridge, 2008; Keogh et al., 2007) or model the distribution of sand resources (Maljers et al., 2015). Geological models constantly need appropriate field data from a succession of interest, analogues and/or comparable modern fluvial systems to develop, test and/or improve the models. Particularly high-resolution data from which spatial trends can be deduced are necessary to support geological modelling and to enhance fundamental understanding of the alluvial architecture of (ancient) fluvial and fluvio-deltaic successions.
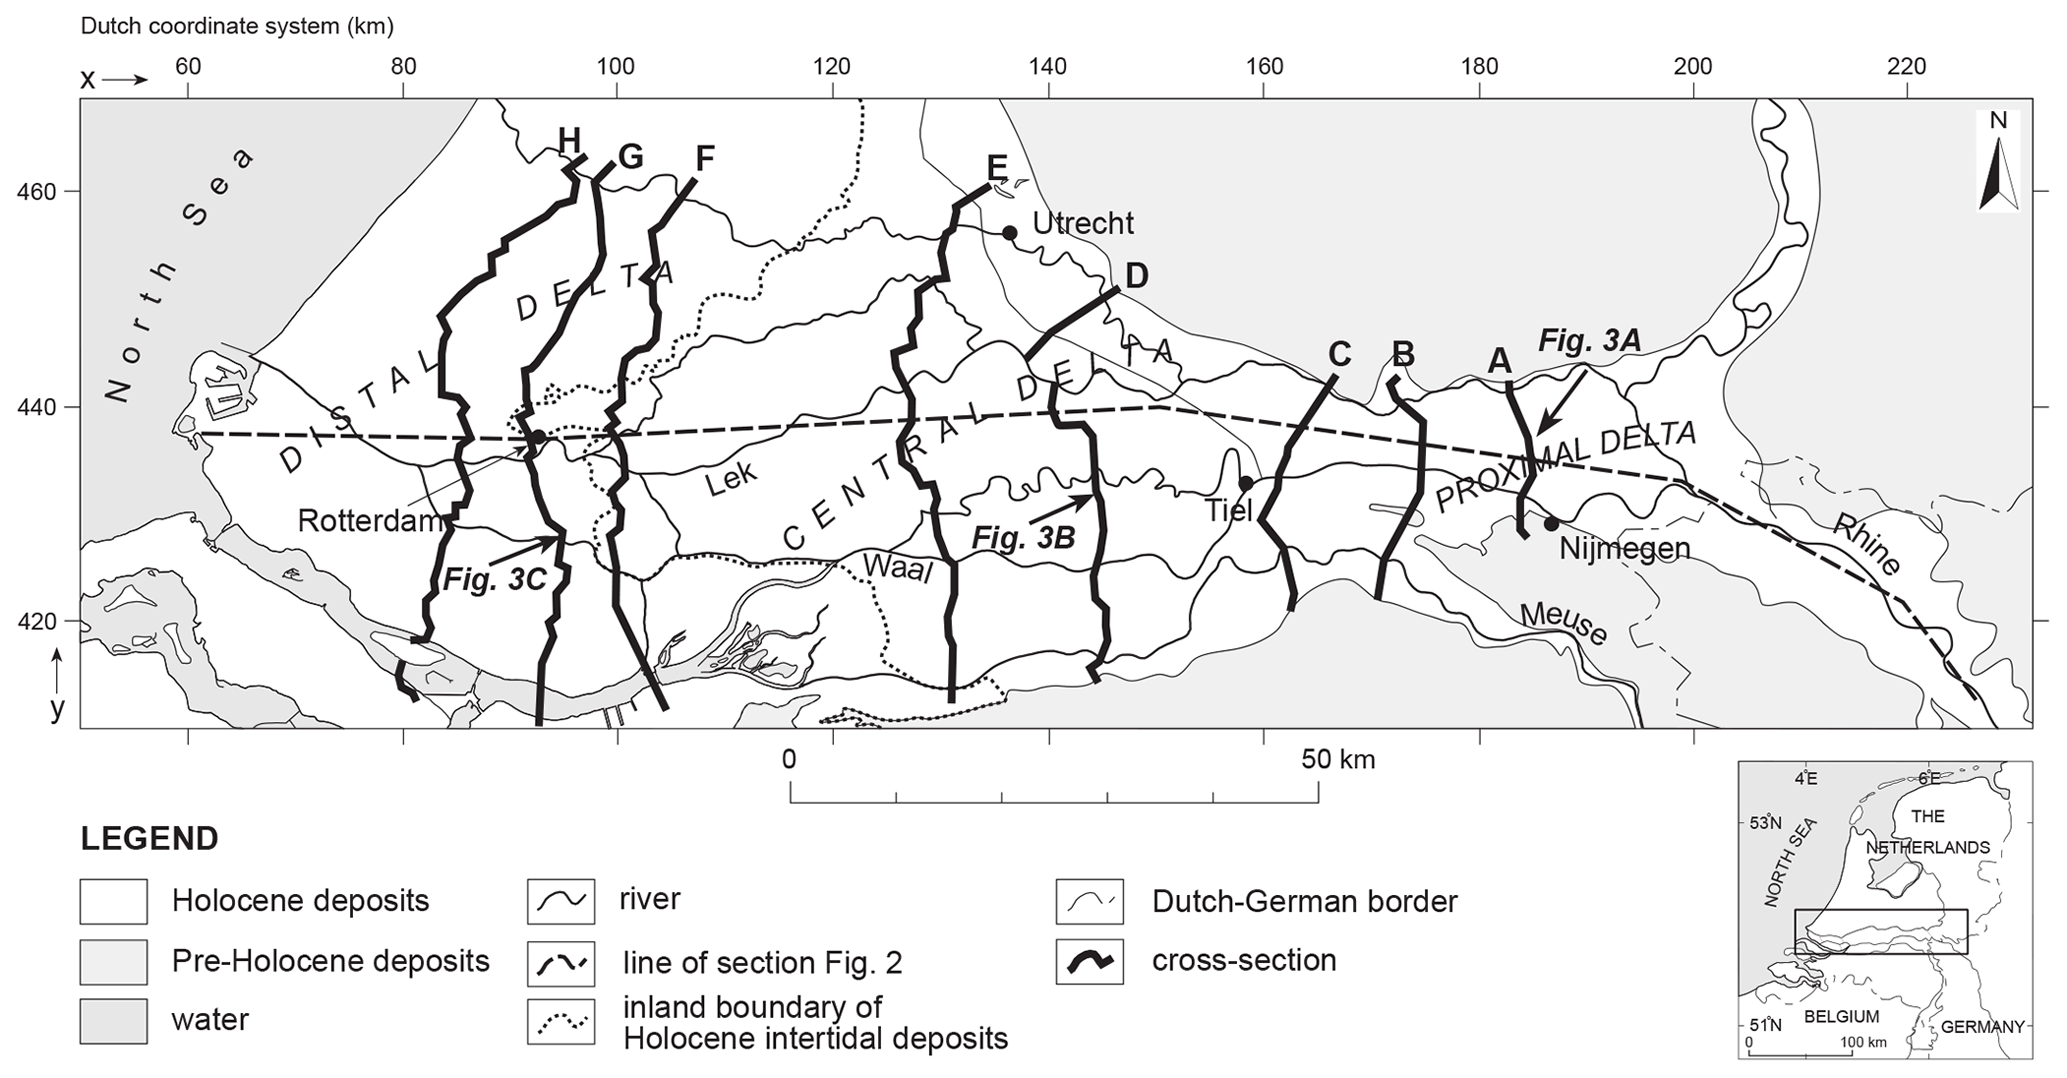
Figure 1Location of the Rhine–Meuse delta, the Netherlands. The cross sections used in this study are designated A–H: cross-sections A–E are from Gouw and Erkens (2007), and sections F–H are from Hijma et al. (2009, modified). Definition of the proximal (x= 160–220 km), central (x= 110–160 km) and distal delta (x= 70–110 km) is based on Stouthamer et al. (2011). The current delta apex is located ∼ 20 km upstream of the Dutch–German border.
The above-mentioned issues can be addressed by studying the architecture of modern records. The main advantage of studying modern fluvial successions is that they tend to be more complete than their ancient counterparts. The Holocene Rhine–Meuse delta (Fig. 1) is especially suitable for alluvial-architecture research because of the availability of a large amount of subsurface data (Berendsen et al., 2007; Cohen et al., 2012). The extensive Rhine–Meuse dataset includes lithological information from cores and cone penetration tests (CPTs), detailed geological maps and cross sections, and 14C and other dates (optically stimulated luminescence (OSL), archaeological, historical). Furthermore, extensive research over the past few decades has led to a sound understanding of the factors that controlled the development of the delta (see Törnqvist, 1994; Berendsen and Stouthamer, 2000; Cohen, 2005; Gouw, 2007a; Hijma et al., 2009; Stouthamer and Berendsen, 2000; Hijma and Cohen, 2011; Stouthamer et al., 2011), which can be used to explain alluvial architecture. Thus far, alluvial-architecture research in the Rhine–Meuse delta has concentrated on the fluvial-dominated upstream half of the delta (Gouw, 2007a, 2008), i.e. the proximal and central delta (for a definition of these terms, see Stouthamer et al., 2011). For that area, Gouw (2007a, 2008) reported a strong decrease in a downstream direction of both the proportion of fluvial channel-belt sands within the succession (channel deposit proportion, CDP) and the degree to which channel-belt sand bodies are interconnected (connectedness ratio, CR), largely because of the decrease of channel-belt sand body width relative to floodplain width. In this paper, new data from the lower reach of the Rhine–Meuse delta (distal delta) are evaluated, where marine and estuarine deposits intercalate with fluvial deposits, to test whether the calculated architectural relationships from upstream still hold.
With this paper we aim to (1) present new alluvial-architecture data from the distal Rhine–Meuse delta, (2) discuss the observed trends with specific attention to those in the backwater zone, and (3) develop a function that describes the delta-wide spatial trend in CDP based on the Rhine–Meuse dataset to be used in the Rhine–Meuse delta and potentially in other deltas as well.
The Rhine–Meuse delta is located in the south-east of the North Sea basin (Ziegler, 1994). To the north and south, undulating Pleistocene topography fringes the delta. During the Quaternary, the Rhine and Meuse rivers repeatedly shifted their courses and main depocentres (e.g. Busschers et al., 2007; Hijma et al., 2012). The delta apex region is currently located 150–160 km upstream of the present coastline (Stouthamer et al., 2011) in the basin hinge zone, while the backwater length is 70–90 km (Berendsen, 1982; Fernandes et al., 2016). The paragraphs below first describe the evolution of the Rhine–Meuse delta during the Holocene. The alluvial architecture of the Rhine–Meuse delta is then exemplified by showing parts of earlier published cross sections. The last paragraph summarizes our existing knowledge of the alluvial architecture of the proximal and central part of the Rhine–Meuse delta.
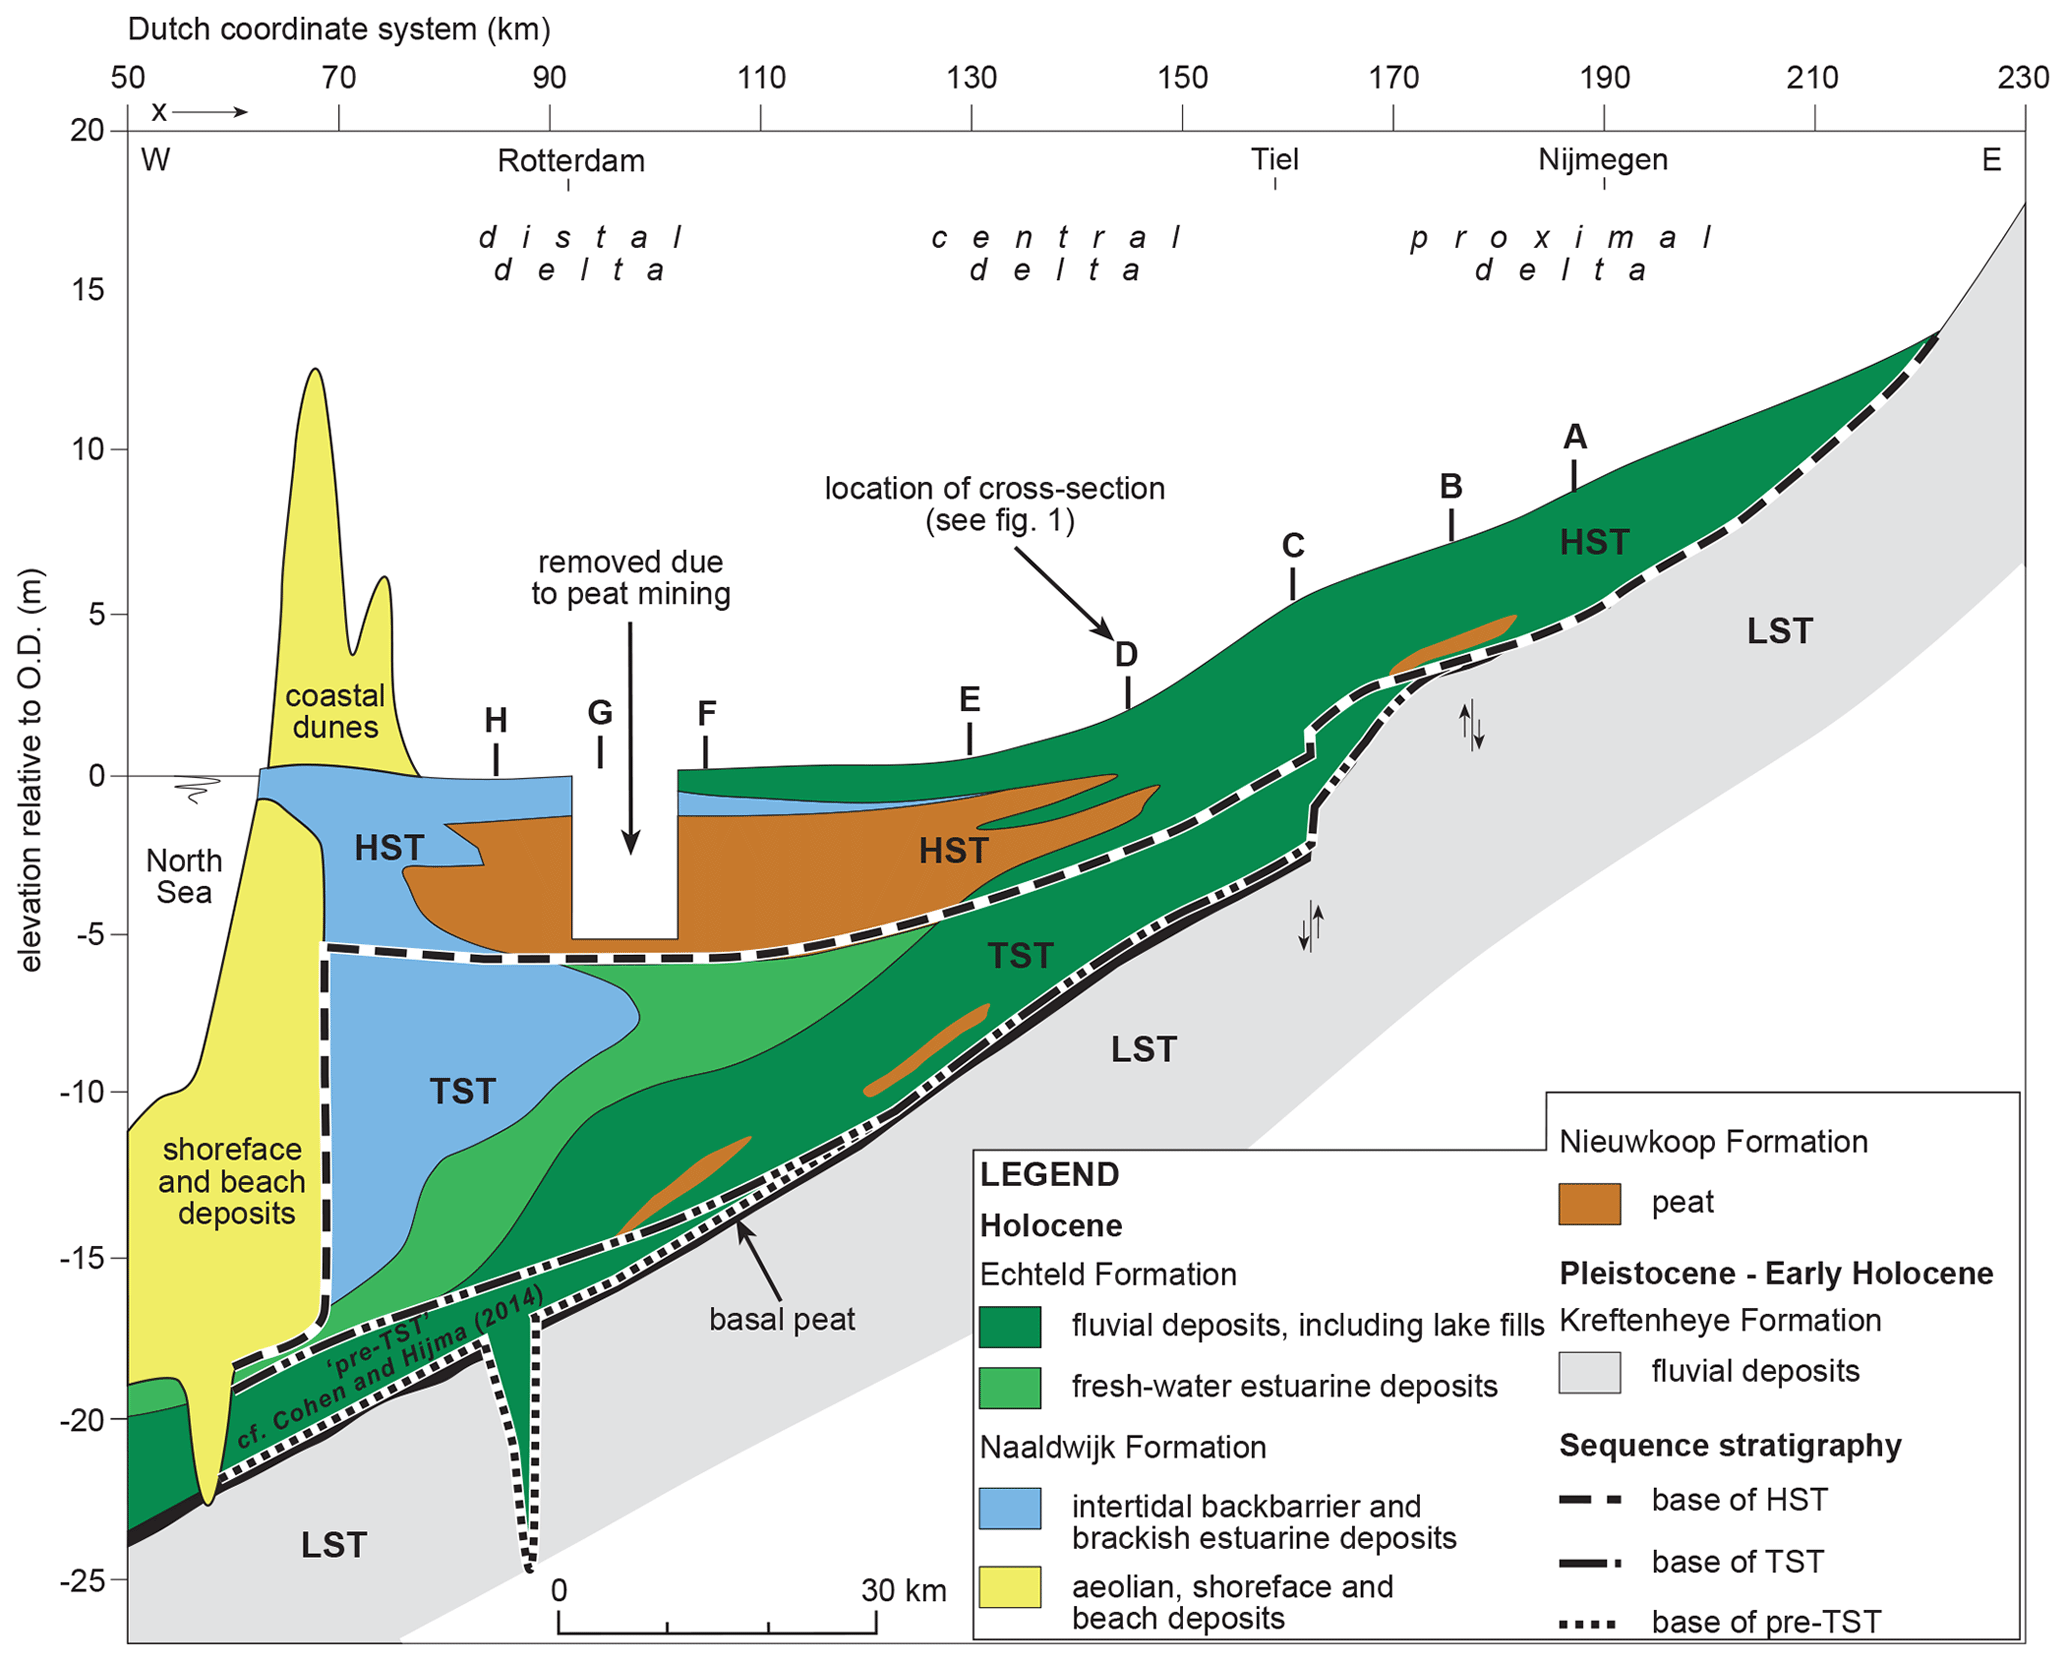
Figure 2Schematic longitudinal section and sequence stratigraphy of the Holocene fluvio-deltaic wedge of the Rhine–Meuse delta (Hijma and Cohen, 2011 modified). Sequence stratigraphic classification is from Hijma and Cohen (2011) and Cohen and Hijma (2014). The wedge largely consists of a stacked succession of clastic fluvial deposits and organics (peat). Towards the coast, estuarine and intertidal sedimentary lobes form the larger part of the wedge.
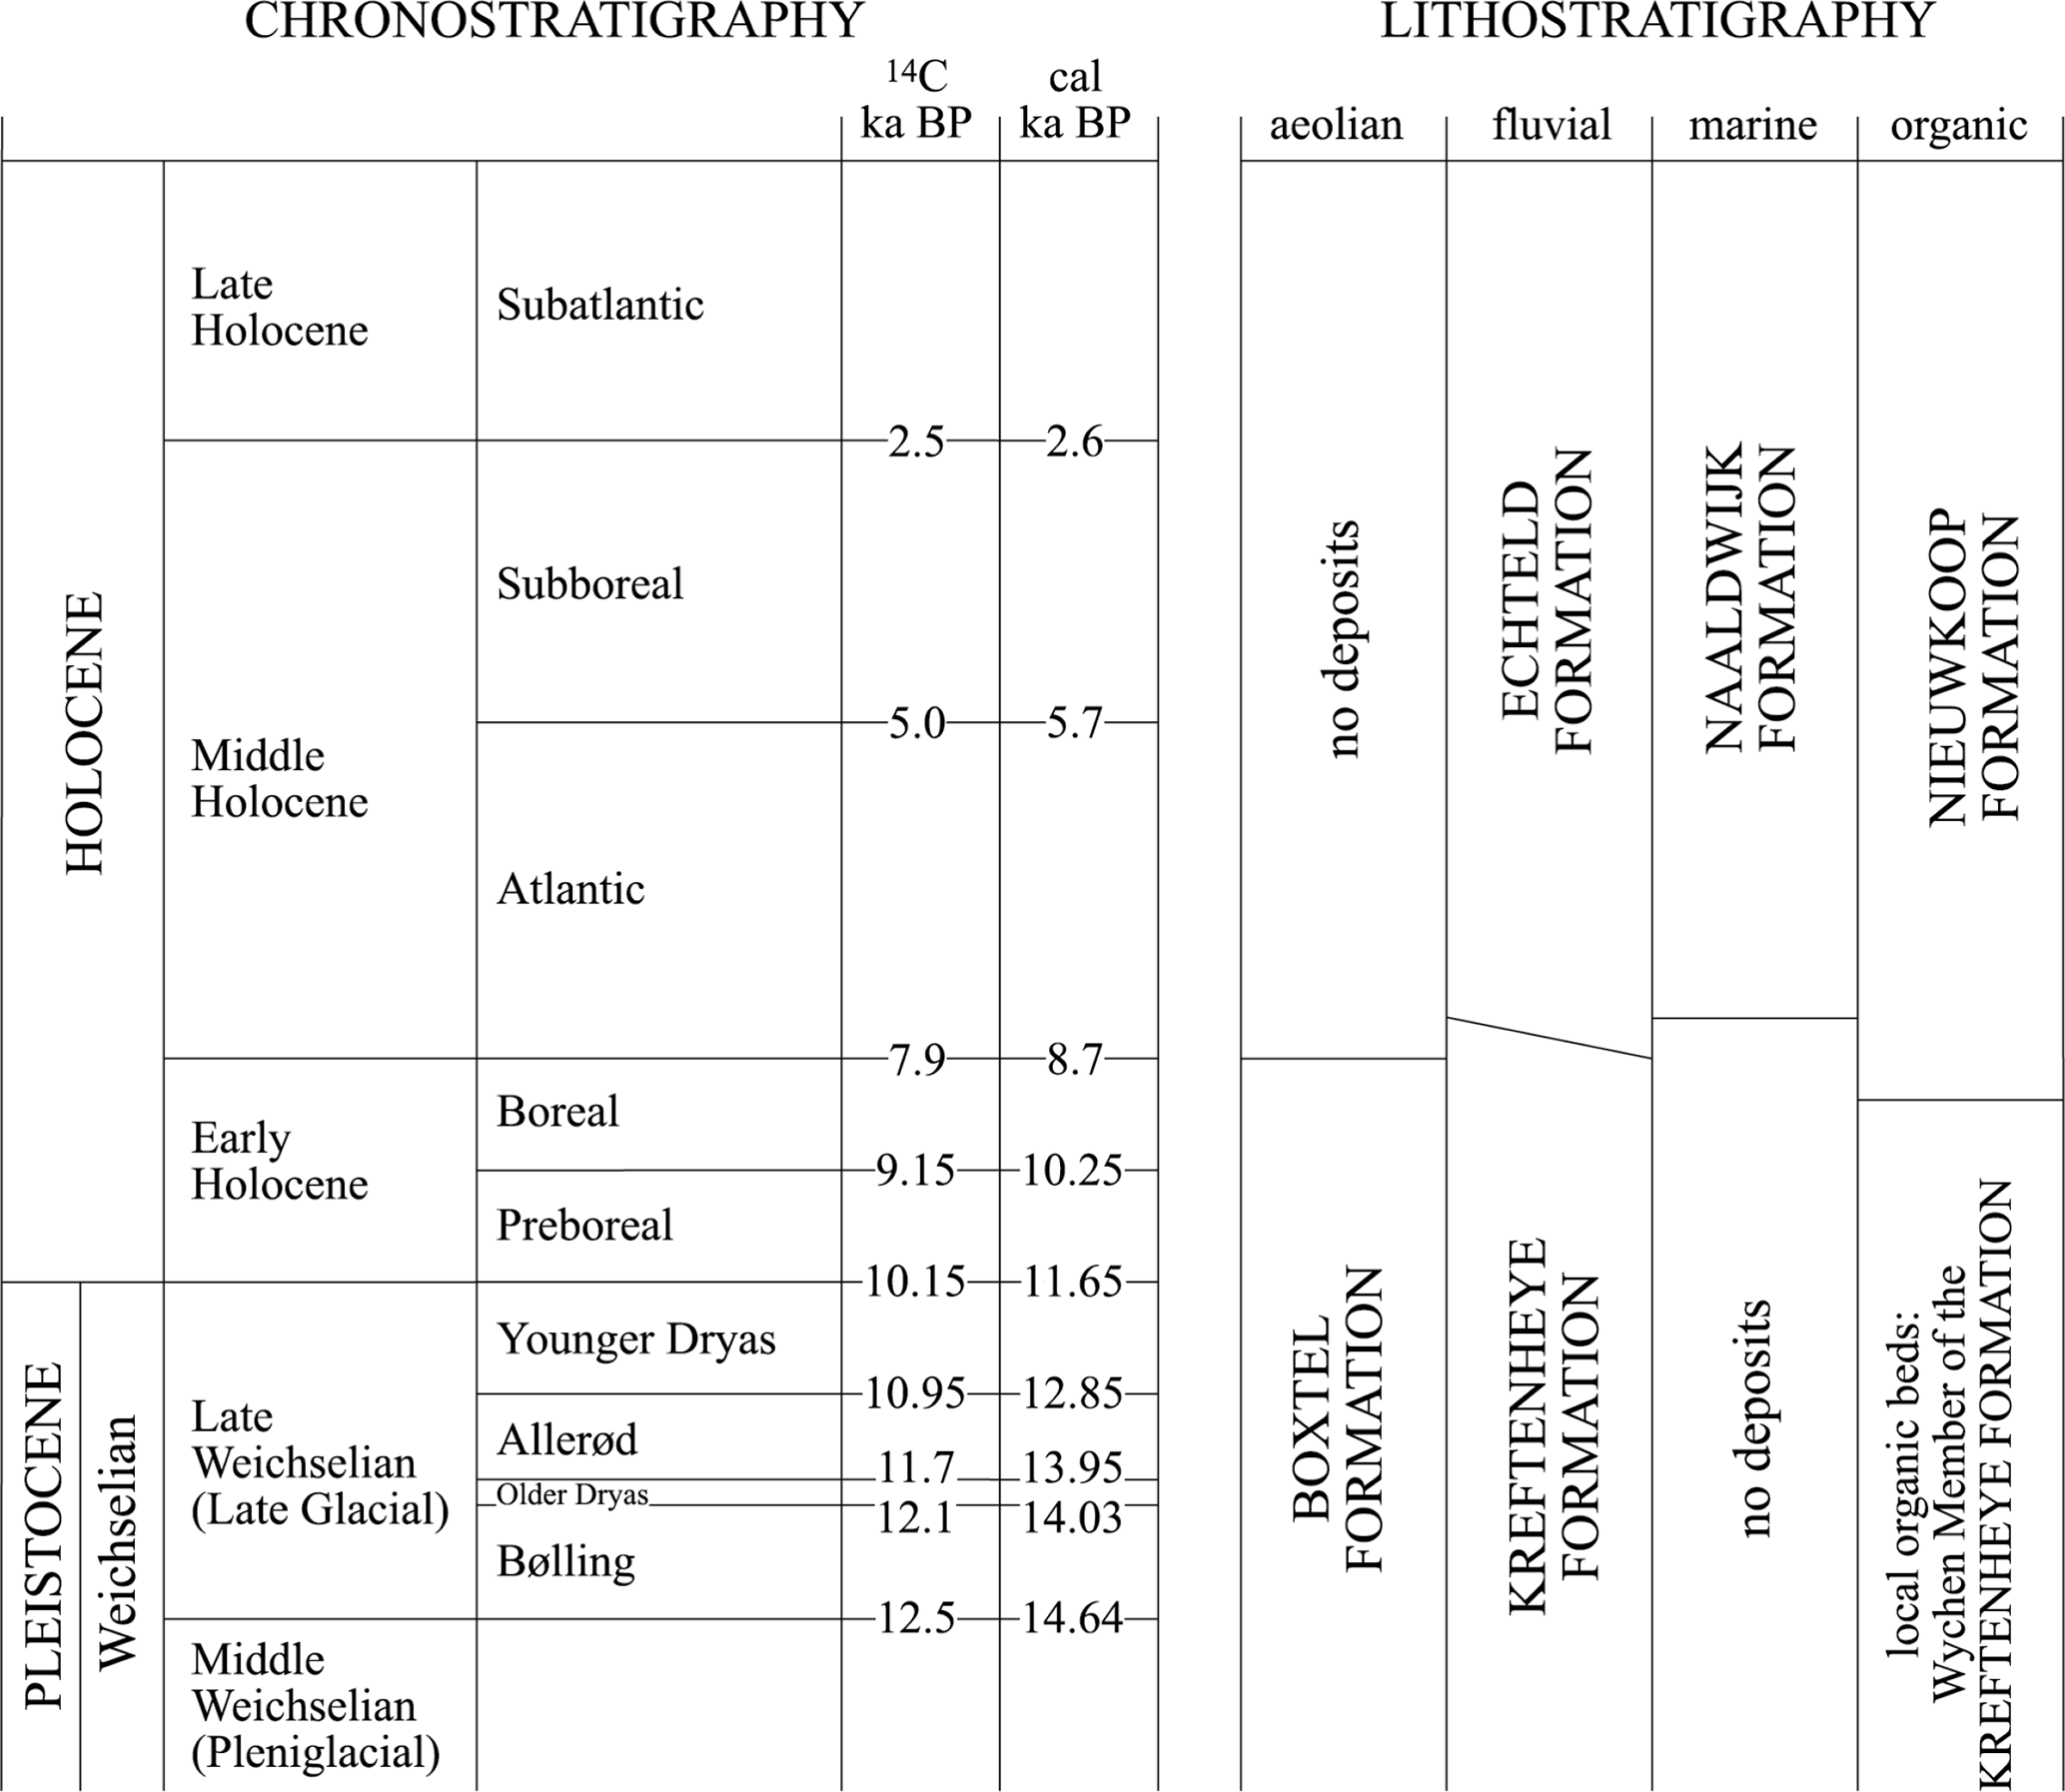
Table 1Chronostratigraphy and lithostratigraphy for the Holocene Rhine–Meuse delta. Chronostratigraphy for the Holocene follows Van Geel et al. (1981), and chronostratigraphy for the Late Glacial follows Hoek (2008) and Rasmussen et al. (2006). Lithostratigraphy nomenclature is following Westerhoff et al. (2003).

2.1 Evolution and architecture of the Holocene fluvio-deltaic wedge
Last Glacial and Early Holocene fluvial sediments underlie the Holocene fluvio-deltaic wedge. These coarse and gravelly sands have been deposited by precursors of the Rhine and Meuse rivers (Busschers et al., 2007; Hijma et al., 2009) (Kreftenheye Formation; Table 1) and are capped by a characteristic floodplain loam with palaeosol development (Wijchen Member; Autin, 2008). Outside the palaeo-valley, aeolian sedimentation prevailed until the earliest Holocene (Boxtel Formation). Relative sea-level rise after the Last Glacial Maximum caused onlap and the formation of the fluvio-deltaic wedge (or “coastal prism”; see Posamentier et al., 1992). The present Rhine–Meuse fluvio-deltaic wedge thickens in a western (downstream) direction to more than 20 m near the North Sea coast and is composed of a stacked succession of clastic fluvial, estuarine and marine deposits intercalated with organic layers (Fig. 2). All Holocene clastic fluvial deposits in the fluvio-deltaic wedge belong to the Echteld Formation. This formation also includes freshwater estuarine deposits (Hijma et al., 2009). Brackish estuarine and marine deposits are grouped into the Naaldwijk Formation. The organics are grouped into the separate Nieuwkoop Formation.
At the base of the Holocene, a near-continuous decimetre-thick peat layer is found that reflects drowning of the pre-Holocene topography and has been used to determine the timing of fluvial-deltaic onlap (e.g. Jelgersma, 1961; Hijma and Cohen, 2011; Van De Plassche, 1982). Onlap started around 8.5 ka (note that all dates are in calendar years, unless stated otherwise) and was driven by high rates of sea-level rise that caused rapid drowning of the fluvial valley (Fig. 1; Hijma and Cohen, 2010, 2019) and the transformation to an estuary (Hijma and Cohen, 2011) at the start of the Middle Holocene. An up to 5 m thick layer of freshwater fluvial–tidal and bay–head delta deposits (sand and clay) in the downstream fluvio-deltaic wedge reflect these estuarine conditions. Further transgression caused sedimentation of marine intertidal deposits within a back-barrier environment. These back-barrier sediments reach up to ∼ 40 km inland from the present coastline and mainly consist of an up to 5 m thick bed of fine sand and silty and sandy clay (Figs. 1 and 2). Under continuous but decelerating sea-level rise, fluvio-deltaic onlap progressively moved inland, and by ∼ 5 ka net aggradation occurred practically all over the present delta (Berendsen and Stouthamer, 2000; Cohen et al., 2002). The fluvial part of the wedge comprises numerous channel-belt sand bodies and associated overbank deposits. The sand bodies consist of fine to coarse sand that is sometimes admixed with gravel. The overbank deposits include natural levee, crevasse-splay, flood basin and lacustrine deposits. The natural levees (silty and sandy clay) fringe their associated channel-belt sand bodies in 50–500 m wide zones and have typical thicknesses of 1–3 m near the channel-belt edges, with 4–5 m as a maximum. The crevasse splays (sand, silty and sandy clay) cover an area of tens to hundreds of square kilometres each. The splays are 1–2 m thick, whereas the infill of crevasse channels is typically twice as thick (Berendsen, 1982; Stouthamer, 2001; Weerts and Bierkens, 1993). Flood-basin deposits occur in up to 5 m thick beds of massive clays. Additionally, flood-basin lake fills are found, mostly on the distal delta plain. The lakes existed in remote flood basins between the active river channels. The lake fills are partly organic and partly clastic (“organic-clastic lake fills”; see Bos, 2010) and are deposited in up to 5 m thick beds. The lake sediments are largely of fluvial origin (Bos, 2010).
The clastic fluvio-deltaic deposits in the Rhine–Meuse delta are intercalated with organic beds. The organics mainly consist of peat and form a significant part of the fluvio-deltaic wedge in the central and distal delta. Here, the organic beds are up to 7 m thick. In contrast, organics are virtually absent in the proximal delta; only thin (< 1 m) isolated layers of peat are found here (Fig. 2). Large-scale aggradation in the Rhine–Meuse delta ceased around 1200 CE (∼ 0.75 ka) with the embankment of the Rhine–Meuse distributaries (Berendsen and Stouthamer, 2000). Presently, sedimentation only takes place in the embanked floodplains along the modern Rhine and Meuse distributary channels.
The Last Glacial and Early Holocene substrate of the Rhine–Meuse palaeovalley forms the foundation of the Holocene succession. This is the lowstand systems tract (LST). Additionally, the earliest Holocene fluvial onlap sediments in the western delta are included in the LST (“pre-transgressive systems tract”, pre-TST; see Cohen and Hijma, 2014). In the distal delta plain, the TST comprises brackish and freshwater estuarine sediments and intertidal deposits formed in a back-barrier environment. Further upstream, fluvial, lacustrine and organic deposits formed in permanently inundated flood basins, and extensive swamps are grouped in the TST. The upper boundary of the TST (or base of the highstand systems tract, HST) in the distal delta is marked by the onset of widespread peat formation, dated at ∼ 6 ka (Hijma and Cohen, 2011). The HST in the distal delta therefore largely consists of thick peat layers that have been partly mined. For the purpose of our calculations, the original succession was reconstructed, i.e. the excavated areas were artificially refilled. In the central delta, clastic fluvial deposits and organics formed in periodically inundated flood basins and small-scale swamps are part of the HST. In the proximal delta, the HST directly overlies the LST. The TST is absent here because sediment delivery always outpaced accommodation-space creation in this part of the delta (Hijma and Cohen, 2011). The location of the downstream-most cross section (H) marks the downstream end of our study area; shoreface and beach deposits and coastal dunes are not included in this study. See Fig. 1 for the location of the longitudinal sections.
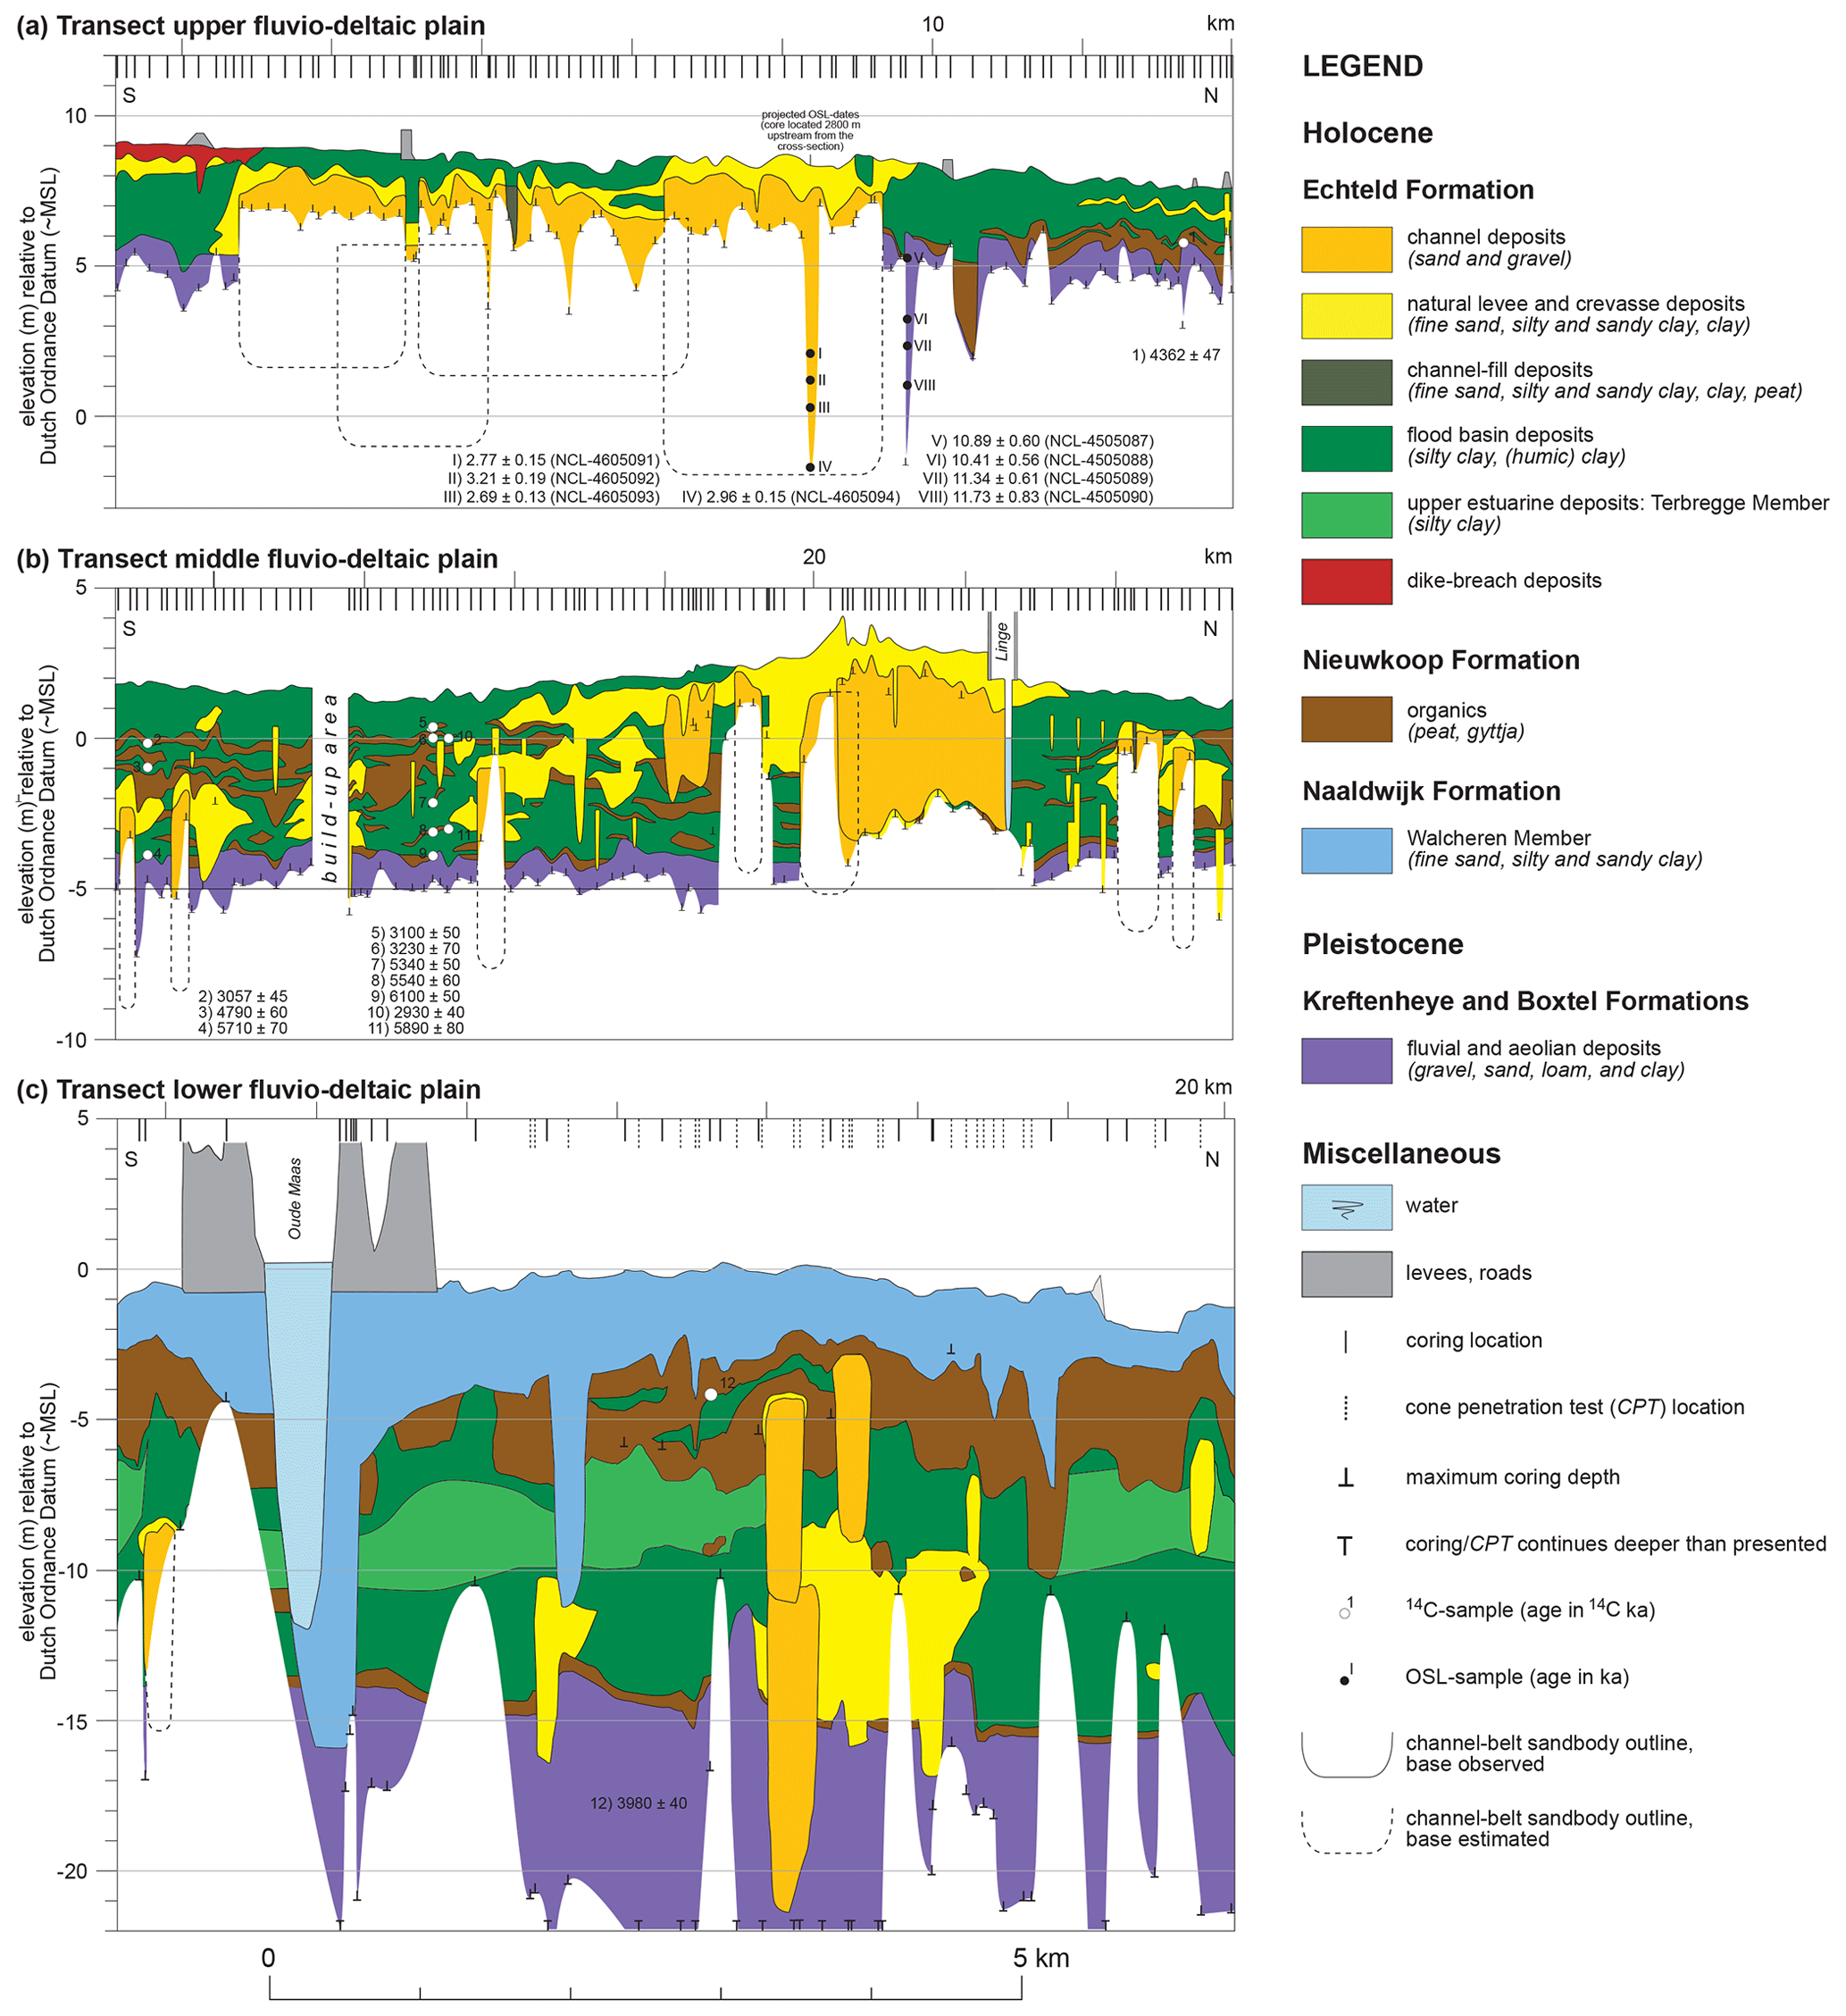
Figure 3Transects showing typical fluvio-deltaic stratigraphy of the proximal (a), central (b) and distal (c) Holocene Rhine–Meuse delta (after Gouw and Erkens, 2007, and Hijma et al., 2009, modified). See Fig. 1 for the locations. Kilometre scale above each transect refers to the original cross sections. Note that 14C dates are given in 14C ka and that OSL dates are given in ka. See the text for a general description of the transects.
2.2 Illustrative cross sections
Three transects illustrate the Holocene fluvio-deltaic succession of the Rhine–Meuse delta (Fig. 3). These transects (see Fig. 1 for their location) are modified fragments of the cross sections published earlier by Gouw and Erkens (2007, their cross sections A-A′ and D-D′, also published in Gouw, 2008) and Hijma et al. (2009, their cross-section B-B′). Below, the characteristics of the Rhine–Meuse fluvio-deltaic architecture are briefly described with the presented transects as typical examples for the preserved succession in the proximal (Fig. 3a), central (Fig. 3b) and distal (Fig. 3c) delta. For the original cross sections and elaborate descriptions thereof, we refer to the original papers (Gouw and Erkens, 2007; Hijma et al., 2009). The calculations of the alluvial-architecture parameters in this study are based on the full set of eight cross sections, as displayed in Fig. 1.
2.2.1 Transect proximal delta
The succession of the proximal delta is characterized by relatively wide channel-belt sand bodies, thin beds of overbank deposits and small-scale occurrence of organics (Fig. 3a). The floodplain is fringed by Pleistocene uplands (Fig. 1) and is therefore of limited width (15–25 km). Gouw (2008) used this fact to explain the observed high interconnectedness in this part of the delta; most sand bodies are interconnected, being up to 4300 m wide and 10 m thick. Additionally, all Holocene channel-belt sand bodies are connected to the sandy Pleistocene substrate (LST). Up to 3 m thick beds of overbank deposits bound the channel-belt sand bodies. The overbank deposits are often underlain by a decimetre-thick peat layer, which reflects beginning of Holocene onlap.
2.2.2 Transect central delta
Contrary to the upstream situation, the channel-belt sand bodies of the 50–60 km wide central delta are mostly not connected to another Holocene sand body, although a limited number of interconnected channel-belt sand bodies exist (Fig. 3b). The isolated channel-belt sand bodies are 100–1400 m wide and 5–7 m thick; the interconnected channel-belt sand bodies are up to 2600 m wide and 11 m thick. The channel-belt sand bodies, ∼ 75 % of which make contact with the Pleistocene substrate, are encased in a 6–9 m thick succession of overbank fines and organics. The overbank beds within the succession are mostly 1–4 m in thickness. Organic layers are typically 0.5–2 m thick, although beds of 5 m thick are also found in areas with minimal fluvial activity during the course of the Holocene (see, for example, kilometres 25–27 in cross section D-D′ of Gouw and Erkens, 2007, or cross-section D of Gouw, 2008).
2.2.3 Transect distal delta
The Holocene succession of the distal delta plain typically consists of narrow channel-belt sand bodies and thick beds of fluvial overbank deposits and organics (Fig. 3c). Furthermore, estuarine and back-barrier intertidal deposits are found on the ∼ 75 km wide distal delta plain. Most channel-belt sand bodies are not connected to another Holocene channel-belt sand body. However, practically all Holocene channel-belt sand bodies are attached to the underlying Pleistocene sands. Channel-belt sand body width is typically between 100 and 600 m and is ∼ 1200 m at a maximum. The thickness of the isolated channel-belt sand bodies ranges from 4 to 12.5 m and that of interconnected Holocene channel-belt sand bodies is up to 17 m.
The sand bodies are encased in an up to 15 m thick succession of fluvial overbank fines, estuarine deposits, organics and intertidal back-barrier deposits. Most overbank deposits are encountered in the lower half of the succession, roughly below 6 m OD (Dutch Ordnance Datum). Hijma et al. (2009) reckoned that a large part of these sediments are estuarine in nature, deposited partly under freshwater and partly under brackish conditions. The estuarine deposits are overlain by a 1–3 m thick peat layer that is present throughout the distal delta plain (e.g. Beets and Van Der Spek, 2000; Hijma et al., 2009). Back-barrier intertidal flat deposits, dissected by tidal channels, form the upper part of the fluvio-deltaic succession of the distal delta. The sandy infill of these channels may be over 25 m thick.
2.3 Alluvial architecture of the proximal and central Rhine–Meuse delta
Gouw (2008, 2007a) studied the upstream half of Rhine–Meuse fluvio-deltaic wedge (Fig. 2) and highlighted two aspects of alluvial architecture: (1) geometry of channel-belt sand bodies and (2) spatial and temporal trends in alluvial architecture.
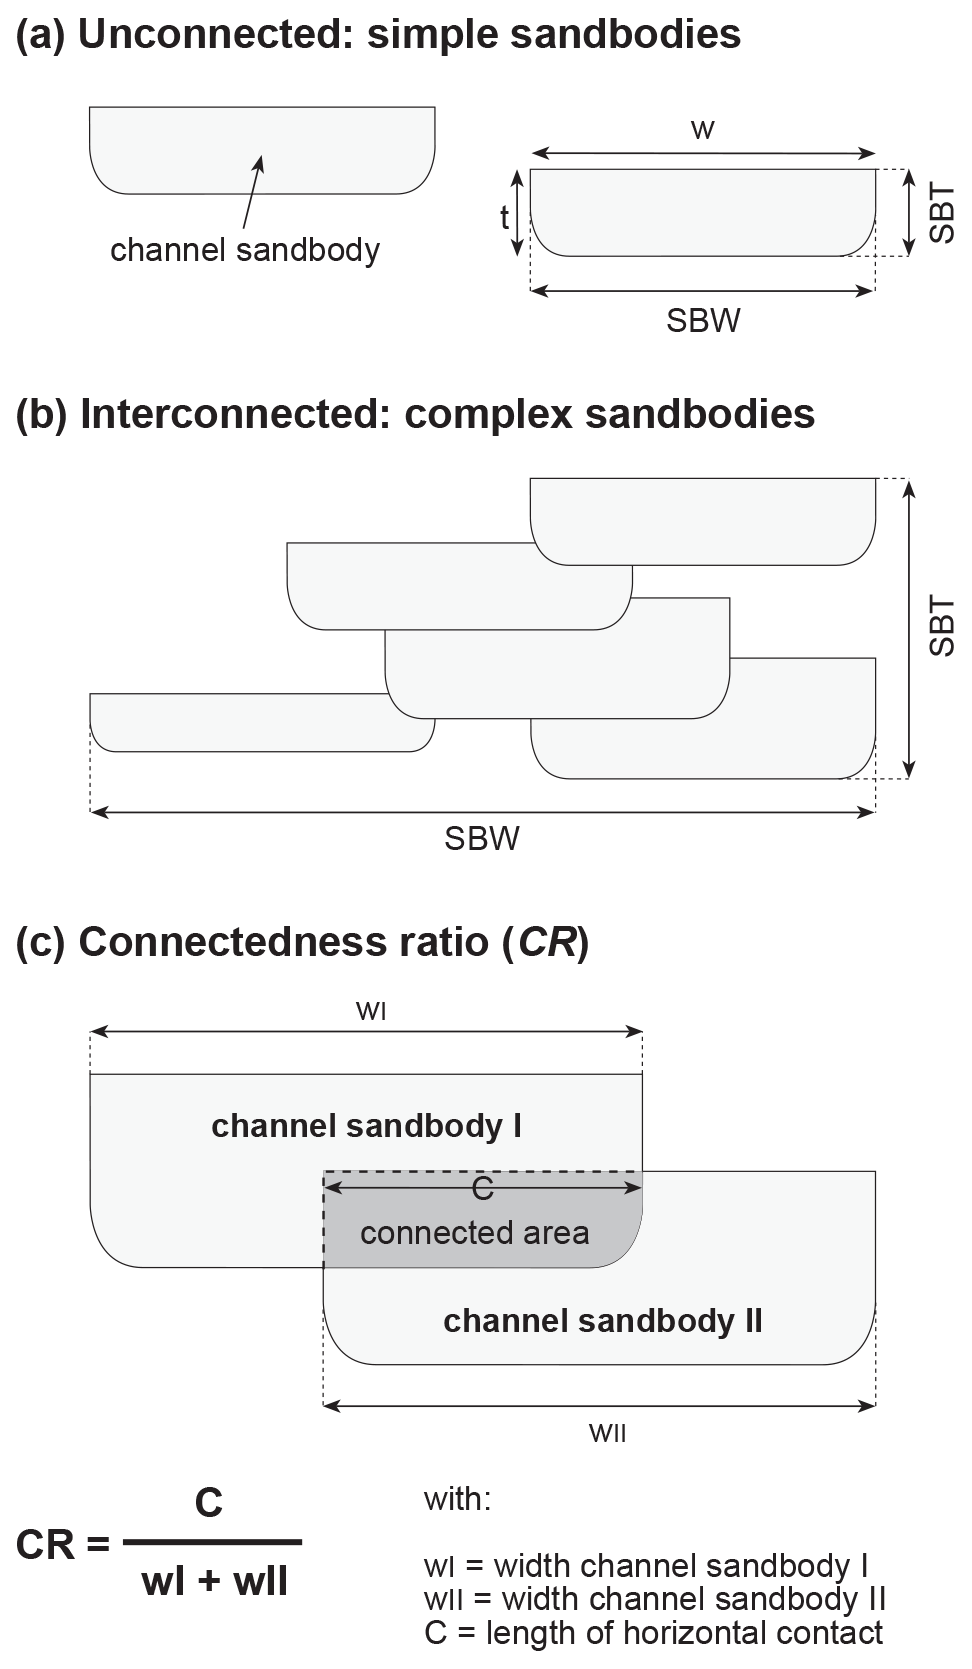
Figure 4Definition diagram showing geometric properties of fluvial channel-belt sand bodies (after Gouw, 2008, based on Mackey and Bridge, 1995). A channel-belt sand body may be composed of either a single channel-belt sand body (simple channel-belt sand body) or multiple interconnected channel-belt sand bodies (complex channel-belt sand body). The dimensions (SBW, SBT) of a simple channel-belt sand body are equal to the dimensions of the channel-belt sand body (w, t) that constitutes the simple sand body (a). In cases of complex channel-belt sand bodies, SBW and SBT may be significantly larger than the dimensions of the individual channel-belt sand bodies that are part of the complex sand body (b). Calculation of the connectedness ratio (CR) is schematically shown in (c).
2.3.1 Geometry of channel-belt sand bodies
The geometry of a channel-belt sand body is usually characterized by the ratio between its width (SBW) and thickness (SBT): the sand body width thickness ratio (). In this paper, the term “channel-belt sand body” refers to a sand body formed by a single or multiple river channels. A channel-belt sand body can either be the sand body of a single channel belt (referred to as a “simple sand body”) or be composed of multiple interconnected (amalgamated) channel belts (“complex sand body”) (Fig. 4). Major factors in determining the size of a channel-belt sand body are lateral migration rates of the channels and channel-belt longevity (see Sect. 5).
On the Rhine–Meuse delta plain, the width of simple channel-belt sand bodies varies between 40 and 3200 m. Their thickness typically ranges between 5 and 9 m and is 6.7 m on average. It was shown that the width thickness ratio of simple channel-belt sand bodies may decrease by a factor of 4 to 6.5 in a downstream direction, mainly due to narrowing of the sand bodies (Gouw and Berendsen, 2007). SBW and SBT of complex channel-belt sand bodies may be significantly larger than those of simple channel-belt sand bodies (Fig. 4). SBW of complex channel-belt sand bodies varies between 1400 and 4300 m, and SBT ranges from 5.2 to 10 m (Gouw, 2008). As with simple channel-belt sand bodies, of complex channel-belt sand bodies decreases downstream.
2.3.2 Previously established spatial and temporal trends in alluvial architecture for the proximal and central delta
Gouw (2008, 2007b) found distinct spatial trends in the alluvial architecture of the proximal and central Rhine–Meuse delta: (1) the proportion of channel deposits (CDP) decreases in a downstream direction; (2) concurrent to CDP, the connectedness between channel-belt sand bodies (CR) also decreases; (3) contrary to CDP, the organics proportion (OP) increases in a downstream direction; and (4) the proportion of overbank deposits (ODP) is more or less constant throughout the proximal and central delta plain. These spatial trends in alluvial architecture are attributed to variations in available accommodation space, channel-belt sand body size and floodplain geometry (Gouw, 2007a, 2008). For instance, CDP and CR are relatively high where floodplain width is limited, meaning that the inherited floodplain width is an important factor for CDP.
It was found that the alluvial architecture of the central delta also varies with the age of the succession. CDP and CR for the succession formed before 3 ka appear to be lower than for the post-3 ka succession. These temporal variations in alluvial architecture are mainly related to changing sand body geometry because channel-belt sand bodies in the post-3 ka succession are significantly wider than those in the pre-3 ka succession. Furthermore, the interaction between aggradation rate and avulsion frequency may have influenced alluvial architecture: CDP appears to be higher during periods of high local (i.e. natural levee) to regional (i.e. flood basin) aggradation rates and high avulsion frequencies (Gouw, 2008; Stouthamer et al., 2011). This means that the rate of accommodation-space creation, in addition to inherited floodplain width, is an important factor for CDP (see Sect. 5).
The architectural trends described above are valid for the proximal and central Rhine–Meuse delta. In this study, new data from the distal delta are incorporated in order to extend our knowledge of the alluvial architecture of the preserved Rhine–Meuse fluvio-deltaic wedge, including the increasing influence of backwater morphodynamics.
Eight cross-valley geological sections (designated A–H; Fig. 1) were used to determine alluvial architecture. These cross sections were previously published by Gouw and Erkens (2007) and Hijma et al. (2009), whereby the Hijma et al. (2009) sections were slightly extended to capture the Holocene fluvio-deltaic wedge for as much as possible. The sections were constructed with approximately 2800 borings, 724 cone penetration tests (CPTs), 278 14C dates and 16 OSL dates. The location of the sections was chosen such that they (1) capture the Holocene fluvio-deltaic succession as much as possible, (2) are orientated perpendicular to the general flow direction (towards the west) and (3) are distributed evenly over the study area as much as possible. Borehole spacing along the cross sections is ∼ 100 m on average. For details on the applied research methods and acquired field data, the authors refer to Gouw and Erkens (2007) and Hijma et al. (2009).
From the sections, parameters that characterize alluvial architecture were computed (cf. Gouw, 2008): (1) channel-belt sand body geometry, (2) alluvial-architecture proportions and (3) connectedness ratio. For cross-sections A–E, values for these alluvial-architecture parameters have already been published (Gouw, 2008, 2007a), although some have changed slightly after lengthening of the cross sections. The architectural parameters for cross sections F–H are new calculations. The original cross sections were converted to include four basic units: (1) fluvial channel-belt deposits, (2) fluvial overbank deposits, (3) organics and (4) intertidal (back-barrier) deposits. The units were further subdivided into sands and fines, after which the alluvial-architecture parameters were calculated as described below.
Table 2Dimensions of the channel-belt sand bodies in the cross sections. Average (av), minimum (min) and maximum (max) values for the channel-belt sand body dimensions are given for each section.
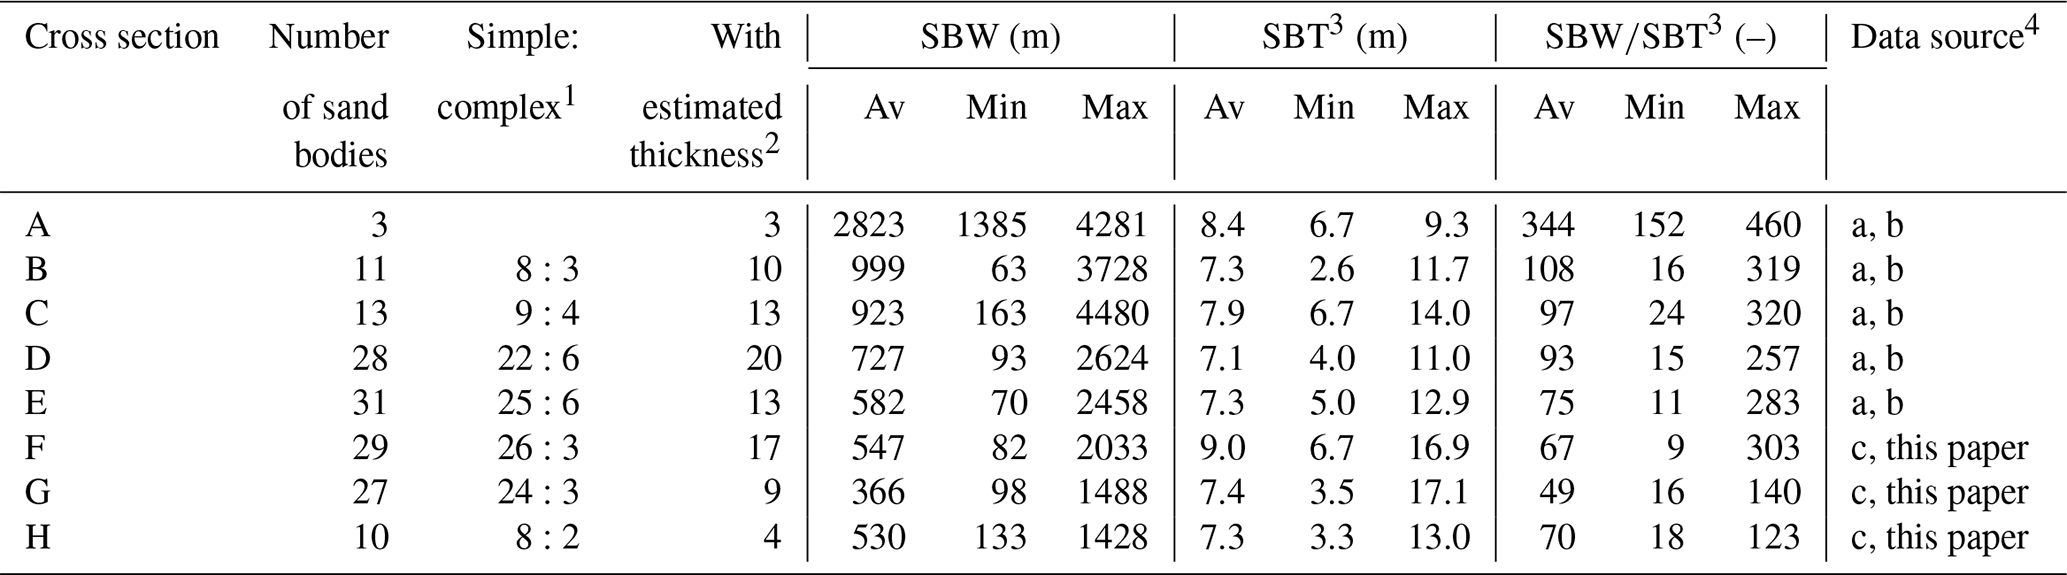
1 Number of simple sand bodies versus complex ones. For definitions, see the main text. 2 Number of sand bodies with an estimated thickness. When channel sand body thickness was unknown, data from Gouw and Berendsen (2007) were used as an estimate. See the main text for explanation. 3 Data presented are for the case wherein a thickness of 6.7 m is taken as an estimate for channel sand bodies with an unknown base (cf. Gouw and Berendsen, 2007). 4 Data sources are as follows: “a” refers to Gouw and Erkens (2007), “b” refers to Gouw (2007a, 2008) updated, and “c” refers to Hijma et al. (2009).
3.1 Channel-belt sand body geometry
The method of Gouw (2008) was followed to determine the width and thickness of each channel-belt sand body in the eight cross sections (Fig. 4). Channel-belt sand body width could be readily determined within 100 m for relatively wide (≥ 250 m) channel-belt sand bodies and within 50 m for narrow ones (≤ 100 m). However, data on channel-belt sand body thickness were relatively scarce. Exact thickness data were established for 40 % of the sand bodies crossed. When channel-belt sand body thickness was unknown, averages from Gouw and Berendsen (2007) were used as a substitute. They found a thickness of 6.7 ± 1.5 m (average ± 1σ) for individual Rhine channel-belt sand bodies in the proximal and central delta. Comparison with available field data showed that these values are realistic for the distal delta as well (Fig. 3c). The 1σ values were applied as margins of error in the calculations of the alluvial-architecture proportions.
3.2 Alluvial-architecture proportions
For all cross sections, the proportion of fluvial channel deposits (CDP), overbank deposits (ODP) and organics (OP) were determined. In the distal delta, fluvial channel-belt sand bodies merge into estuarine sand bodies (Hijma et al., 2009). The fluvial channel-belt sands and estuarine sands (notably bay-head delta deposits; Hijma et al., 2009) in cross-section H were therefore lumped together to calculate CDP. Additionally, the proportion of intertidal deposits (IDP) was calculated for the sections in the distal delta. Proportion values were calculated relative to the total area of the Holocene fluvio-deltaic succession in each cross section (cf. Mackey and Bridge, 1995). For example, ODP is the cross-sectional area of all overbank deposits divided by the total cross-sectional area. An ODP of 0.40 implies that 40 % of the succession consists of overbank deposits.
The total sand proportion of each section was also calculated. Total sand proportion is defined as the sum of fluvial channel-belt sands, sands in crevasse splays and lake deposits (“coarse-grained overbank deposits”; see Bos and Stouthamer, 2011), estuarine sands, and sandy intertidal deposits (“tidal channel deposits” of Hijma et al., 2009). The proportions of these sands are calculated similarly to the other alluvial-architecture parameters described above.
3.3 Connectedness ratio
The connectedness ratio (CR) is the summed length of horizontal contact between channel-belt sand bodies divided by the summed width of all channel-belt sand bodies in each cross section (Gouw, 2008; cf. Mackey and Bridge, 1995) (Fig. 4). The connectedness ratio is given as a fraction. For example, a CR of 0.50 implies that half the sand body width is connected to another channel-belt sand body.
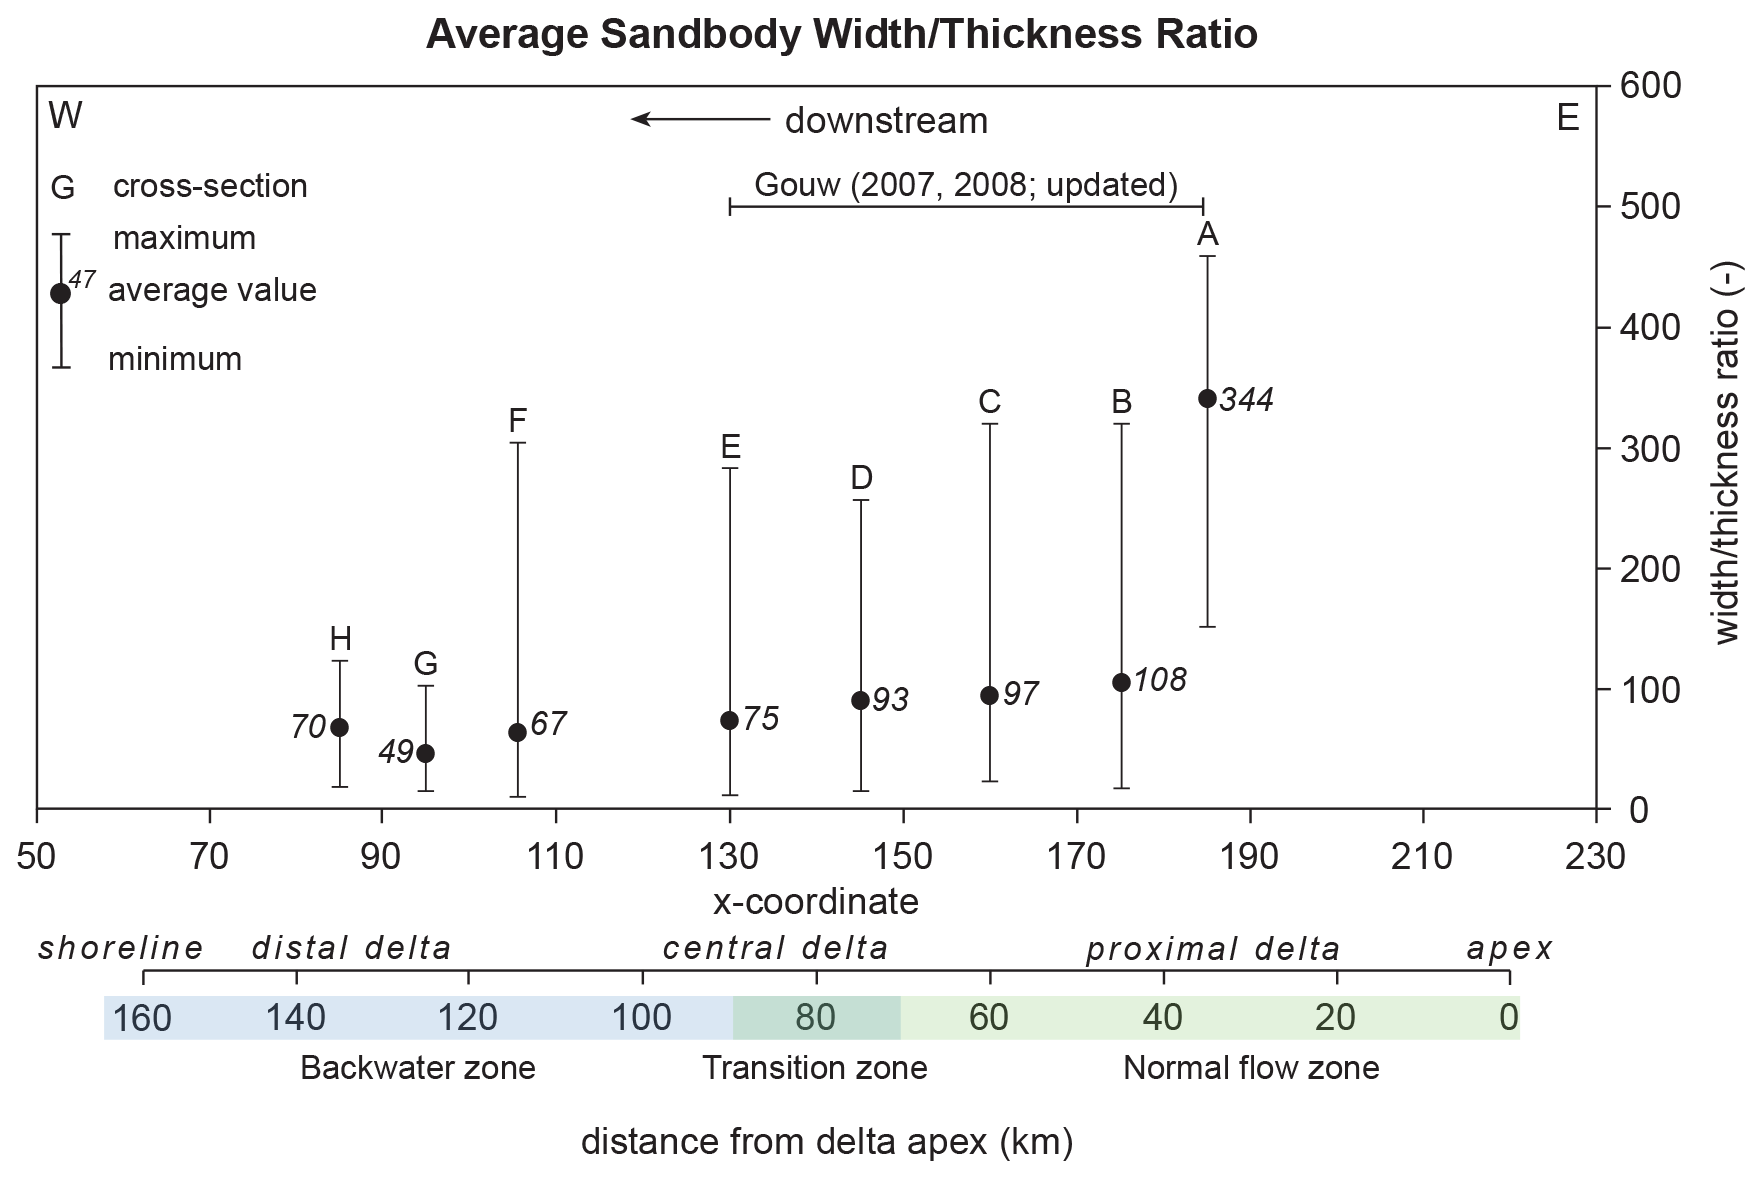
Figure 5Average width thickness ratios () as calculated for each cross section. The ranges result from applying a thickness of 5.2, 6.7, and 8.2 m (average ± 1σ) for channel-belt sand bodies with an unknown thickness (Gouw, 2008; cf. Gouw and Berendsen, 2007). The data records in this paper are plotted against the x coordinate because general flow direction is towards the west, which makes the x coordinate a suitable measure for downstream distance. Average decreases with downstream distance from the delta apex. Data for sections A–E is updated from Gouw (2008, 2007a).
4.1 Channel-belt sand body geometry
Geometric data for the channel-belt sand bodies in the cross-sections are summarized in Table 2 and Fig. 5. Average channel-belt sand body width decreases in a downstream direction, from more than 1000 m upstream to ca. 500 m downstream (Table 2). The exceptionally high value (2823 m) for cross-section A is due to the presence of three relatively wide sand bodies in that section (Gouw, 2008). Average channel-belt sand body thickness is practically constant throughout the study area (7–8.5 m) (Table 2).
The downstream-decreasing trend in channel-belt sand body width thickness ratio, as established for the proximal and central Rhine–Meuse delta (Gouw, 2008), more or less continues in the distal delta (Fig. 5; note that shown bandwidths represent min–max values, not confidence intervals). The highest averages (344 in section A and 108 in section B) are found in the proximal delta, whereas values of less than 70 are found downstream. In other words, average in the proximal delta is up to 5 times higher than average in the distal delta. This downstream-decreasing trend is attributed to the decrease in channel-belt sand body width because sand body thickness is near-constant over the study area (Table 2).

Figure 6Proportions of channel deposits (CDP), overbank deposits (ODP), organic matter (OP) and intertidal deposits (IDP) as established for the cross sections. Ranges are as in Fig. 5. CDP clearly decreases in a downstream direction, whereas ODP is near-constant in the larger part of the Rhine–Meuse delta. OP peaks in the central-to-distal-delta transition zone and subsequently decreases coastward. This decrease is associated with a steep increase in the proportion of intertidal back-barrier deposits (IDP), which is 0.6 at a maximum in our study area. Data for sections A–E is slightly modified from Gouw (2008, 2007a). Note the different vertical scale for the OP graph.
Table 3Data on the total sand proportion (TSP) and its contributors for the Rhine–Meuse fluvio-deltaic wedge. Proportions are relative to the total Holocene fluvio-deltaic succession. Percentages are relative to the total sand proportion.
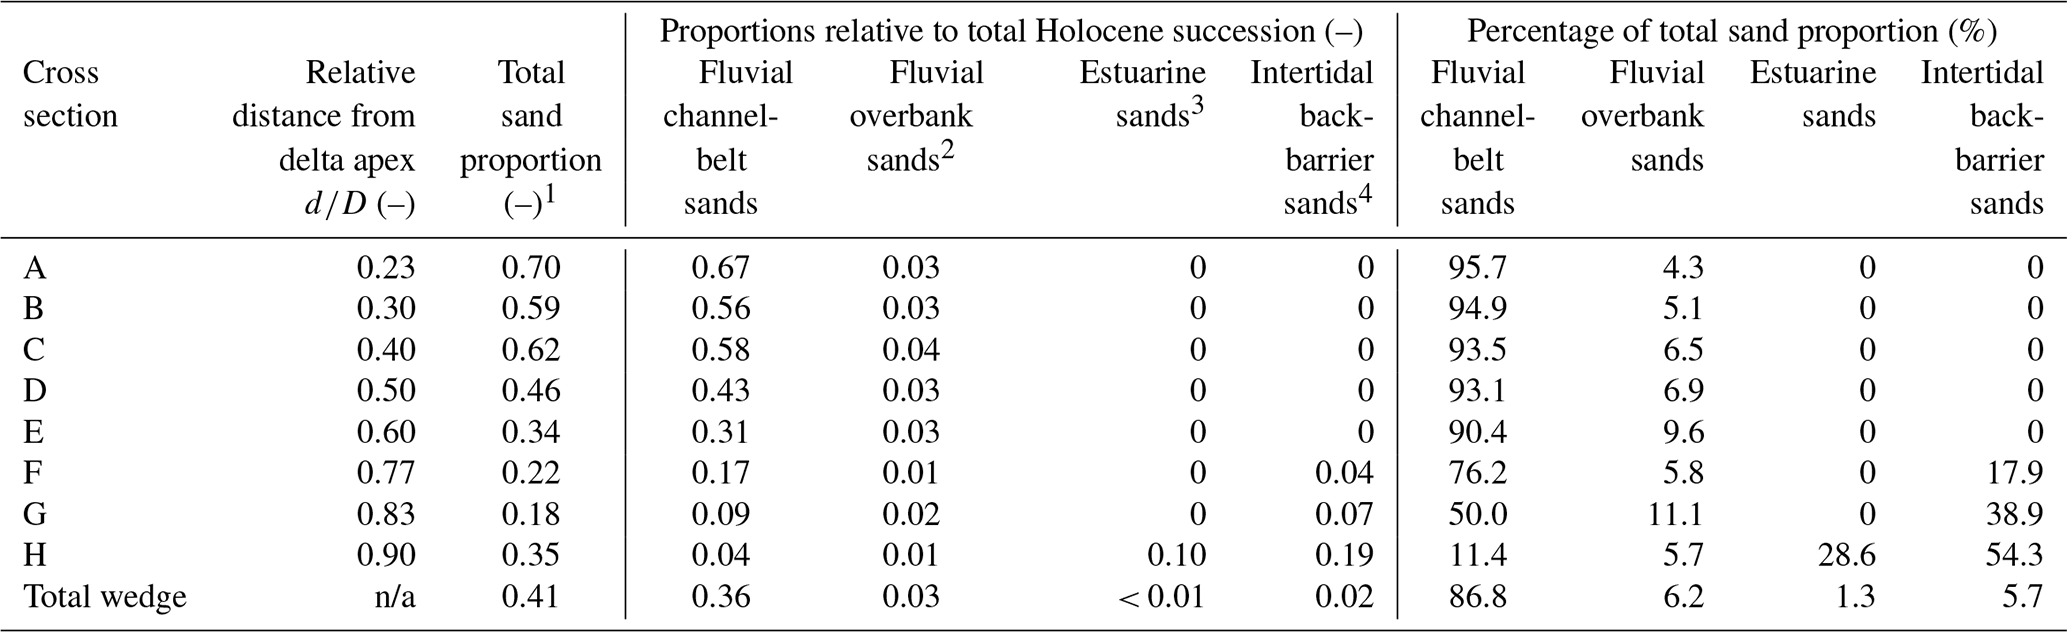
1 Total sand proportion is the sum of fluvial channel sands (CDP), fluvial overbank sands, estuarine sands and marine sands. 2 Sands in crevasse splays and lake deposits (“coarse-grained overbank deposits”; see Bos and Stouthamer 2011). 3 Notable bay–head delta deposits (Hijma et al., 2009); data are from Bos and Stouthamer (2011). 4 Sandy intertidal deposits, mainly tidal channel fills. n/a stands for not applicable.
4.2 Alluvial-architecture proportions
The alluvial-architecture proportions show prominent spatial trends (Fig. 6). First, the proportion of fluvial channel-belt deposits (CDP) strongly decreases in a downstream direction. It measures ∼ 0.70 in the proximal delta (cf. Gouw, 2008) and diminishes to 0.04 downstream. This implies that the amount of fluvial channel-belt sands in the distal delta is just 5 % of the amount in the proximal delta. In the succession of the distal delta, however, fluvial channel-belt sands blend seamlessly into estuarine bay–head sands (Hijma et al., 2009). Taking this into account, CDP including estuarine sands is ∼ 0.15 in the downstream-most cross section (Fig. 6; Table 3).
The proportion of overbank deposits (ODP) is more or less constant (0.4) in the larger part of the study area (cf. Gouw, 2008; Bos, 2010). The graph for the organics proportion (OP) reveals a distinct peak (0.30) in the transition zone from the central to the distal delta. From this point downstream, OP clearly decreases to 0.14. This trend corresponds to the appearance of intertidal deposits in the distal delta succession. The proportion of intertidal back-barrier deposits (IDP) rapidly increases coastward to a maximum of 0.58 in the downstream-most section.
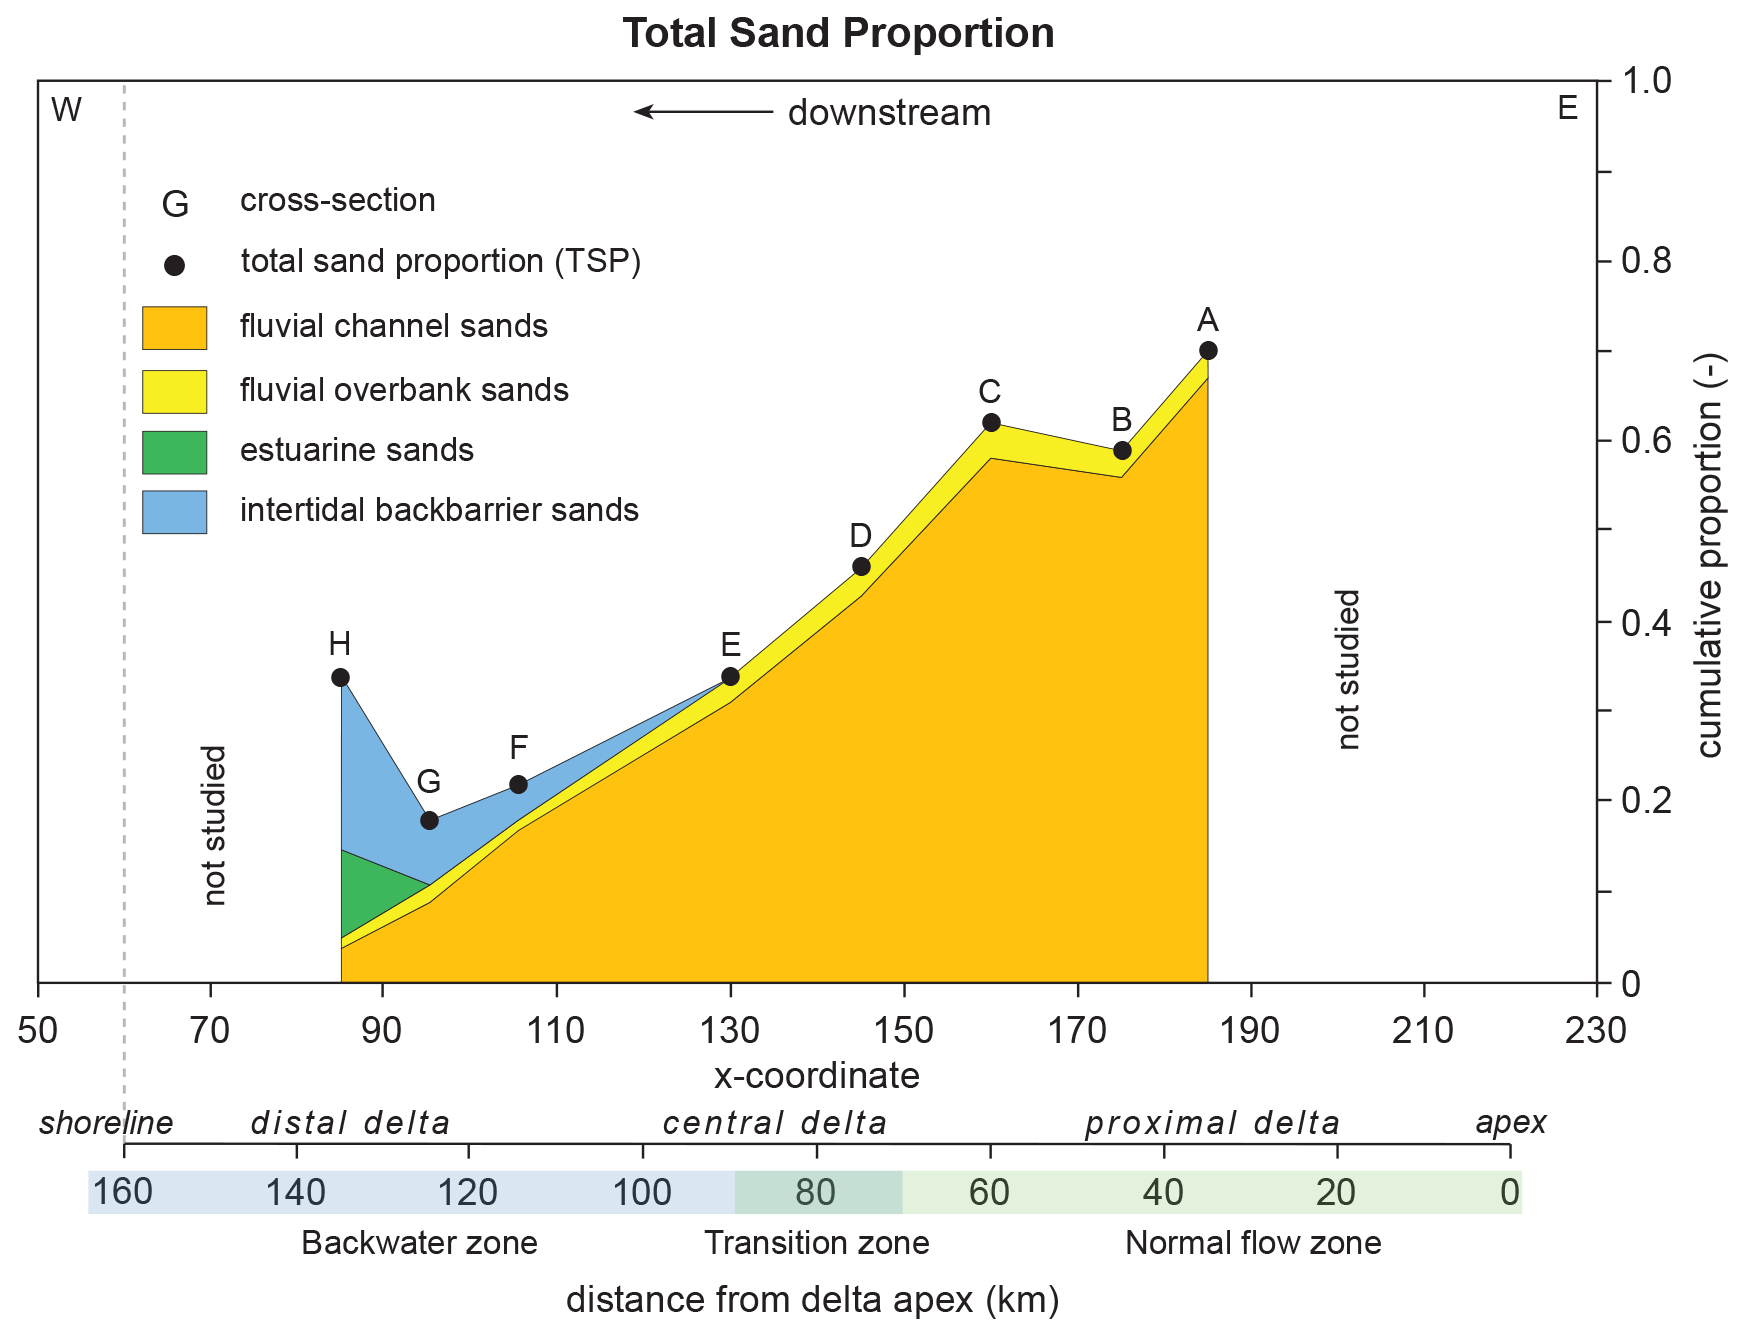
Figure 7Diagram showing the contributors to the total sand proportion for each cross section. The total sand proportion is the sum of fluvial channel-belt sands, coarse-grained overbank deposits in crevasse splays and lake deposits (cf. Bos and Stouthamer, 2011), estuarine sands (notably bay–head delta deposits; Hijma et al., 2009), and sandy back-barrier intertidal deposits. In the upstream delta, most sand is stored in fluvial channel-belt sand bodies. In contrast, most sand in the downstream delta is estuarine and intertidal in nature.
4.3 Total sand proportion
The total sand proportion varies between 0.18 and 0.70 (Table 3) and is 0.41 for the wedge as a whole. In other words, 41 % of the Rhine–Meuse fluvio-deltaic wedge is composed of sand. The total sand proportion generally decreases with downstream distance from the delta apex, with the lowest value in cross section G (Fig. 7, Table 3). This trend is reversed in the downstream-most cross-section where intertidal back-barrier and estuarine sands dominate. Here, total sand proportion amounts to 0.35.
Our data demonstrates that, except for the near-coastal area, the bulk of the sand is fluvial channel-belt sand, despite its decreasing proportion relative to the total Holocene succession (Table 3). In the proximal and central delta, fluvial channel-belt sands constitute 75 %–95 % of the total sand proportion, whereas in the distal delta it drops to approximately 10 %. Overall, fluvial channel-belt sands form 87 % of all sands in the wedge. The contribution of fluvial overbank sands to the total sand proportion is relatively constant and ranges between 4.3 % and 11.1 % (6 % overall). Estuarine and intertidal sands dominate in the downstream-most section H, where they form 28.6 % and 54.3 %, respectively, of the total sand proportion (Table 3).
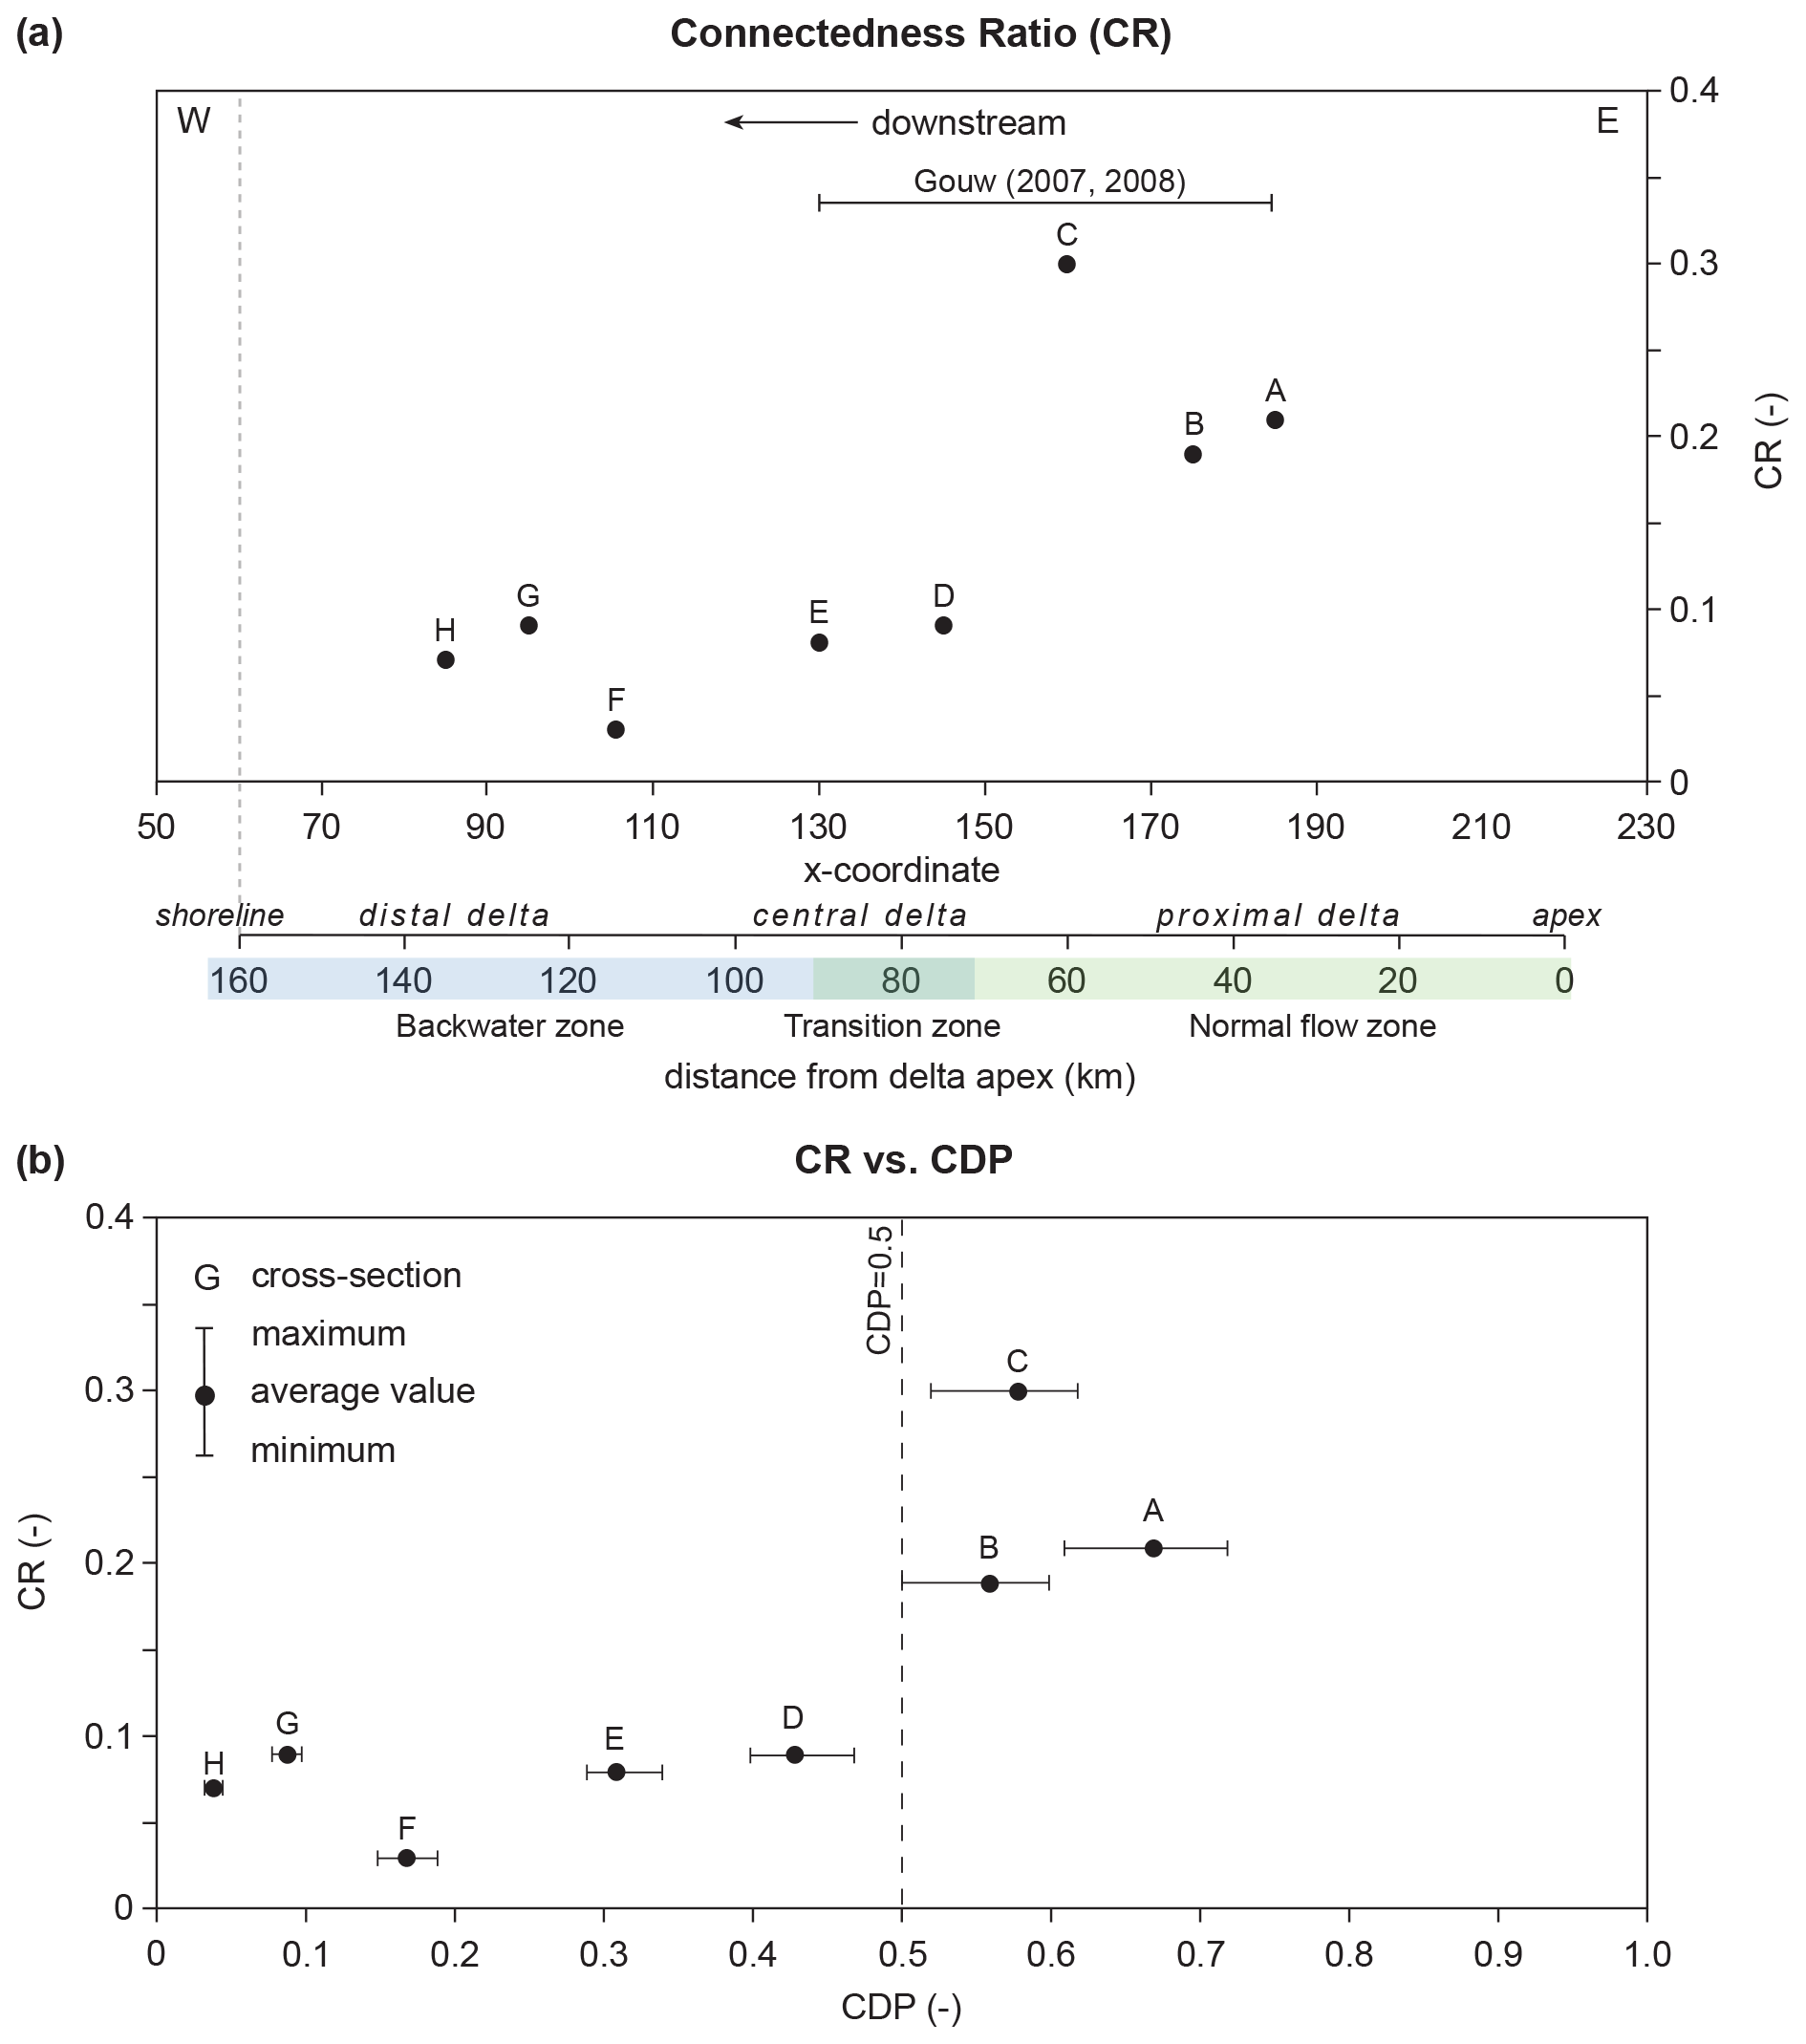
Figure 8(a) CR as established for the cross sections and (b) CR plotted against CDP. CR decreases in a downstream direction. The high value for cross-section C is due to the presence of an exceptionally large complex channel-belt sand body. CR is significantly higher when CDP exceeds 0.5 (cf. Gouw, 2008). Data for cross-sections A–E are from Gouw (2007a, 2008).
4.4 Connectedness
The connectedness ratio (CR) of fluvial channel-belt sand bodies is roughly 3 times higher in the proximal delta than in the distal delta (Fig. 8). CR is calculated at ∼ 0.25 in cross sections A–C and ∼ 0.08 in cross sections D–H, with a minimum of 0.03 (cross section F) and a maximum of 0.30 (cross section C).
Channel-belt sand body interconnectedness increases with the proportion of channel-belt sands in the succession (Fig. 8), although it is not a positive (curvilinear) correlation as suggested in modelling studies (Bridge and Mackey, 1993b; Mackey and Bridge, 1995). Our data show that CR instantly doubles as CDP rises above 0.5. Two CR populations divided by the CDP = 0.5 vertical are therefore recognized: CR ≥ 0.2 for CDP ≥ 0.5 and CR ≤ 0.1 for CDP < 0.5. This is in accordance with previously published data (Gouw, 2008).
All Holocene channel-belt sand bodies in the proximal delta are connected to the sandy Early Holocene–Pleistocene (lowstand) substrate. In the central delta, 75 %–80 % of the channel-belt sand bodies make contact. This figure rises in the distal delta, where approximately 90 % of the Holocene channel-belt sand bodies are connected to the Early Holocene–Pleistocene substrate. This is due to the fact that most fluvial channel-belt sand bodies in the distal delta are encountered in the lower half of the Holocene succession (see Fig. 3c).
The above sections dealt with the first aim of this paper, namely presenting new alluvial-architecture data from the distal Rhine–Meuse delta. The second aim concerns a discussion of the observed trends, with specific attention to the backwater zone. We start this discussion with the isolation of the main drivers that determined the alluvial architecture (with focus on CDP) of the Rhine–Meuse delta (Sect. 5.1) and then highlight the specific trends for the backwater zone (Sect. 5.2). Section 5.3 addresses the third aim and presents a function that describes the delta-wide spatial trend in CDP based on the Rhine–Meuse dataset to be used in the Rhine–Meuse delta and potentially in other deltas as well. Section 5.4 discusses potential applications of alluvial-architecture research.
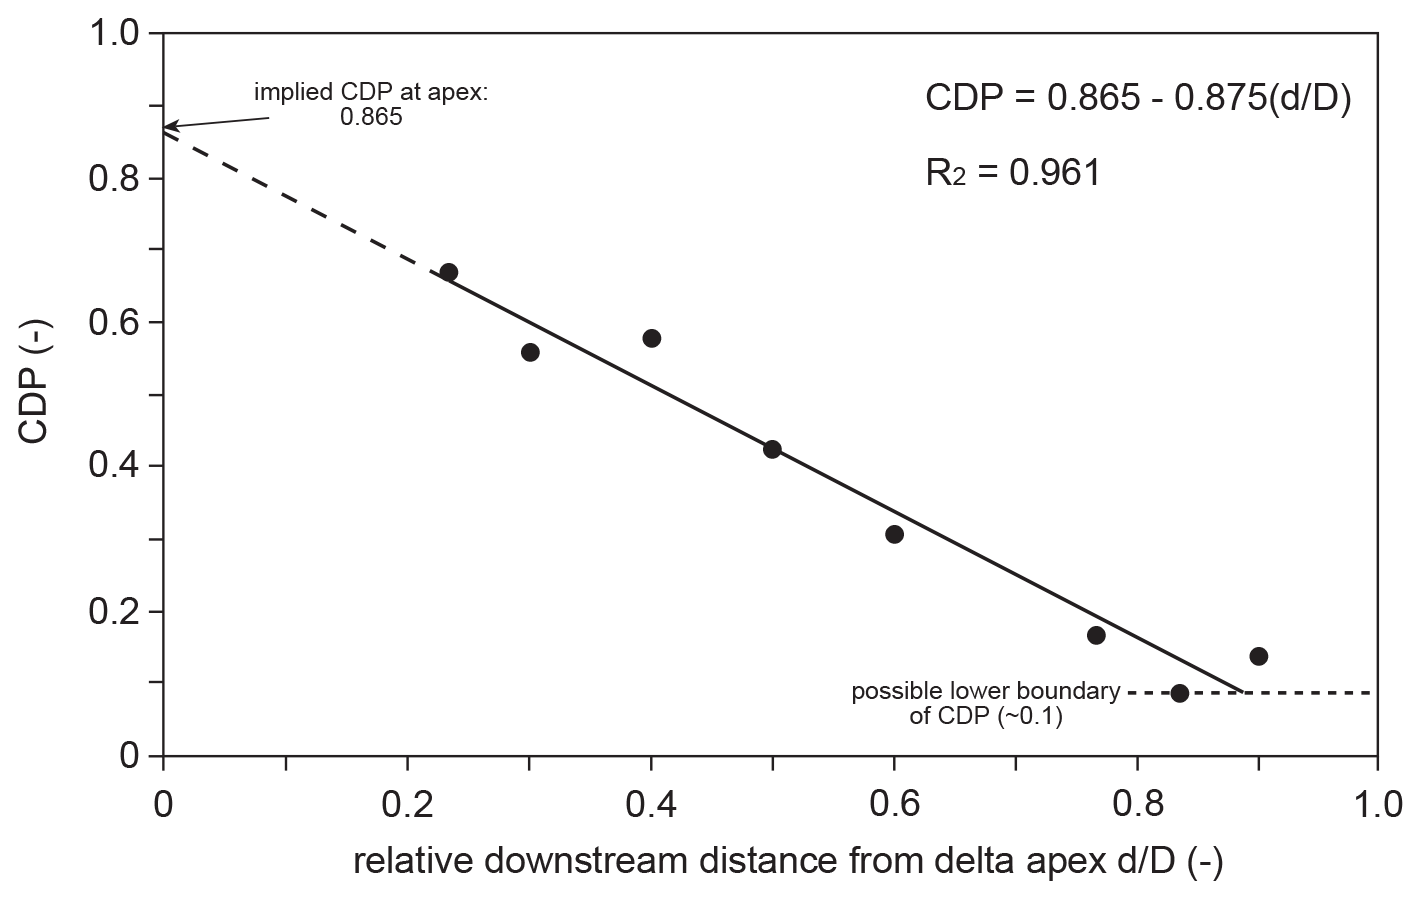
Figure 9Relationship between CDP and downstream distance from the delta apex. Distance is noted relative to the total distance between the delta apex and the shoreline (relative distance , with d being downstream distance from delta apex and D total distance between delta apex and shoreline). The derived linear function suggests a CDP of ∼ 0.9 near the delta apex (). CDP is at a minimum (0.10–0.15) in the distal delta ().
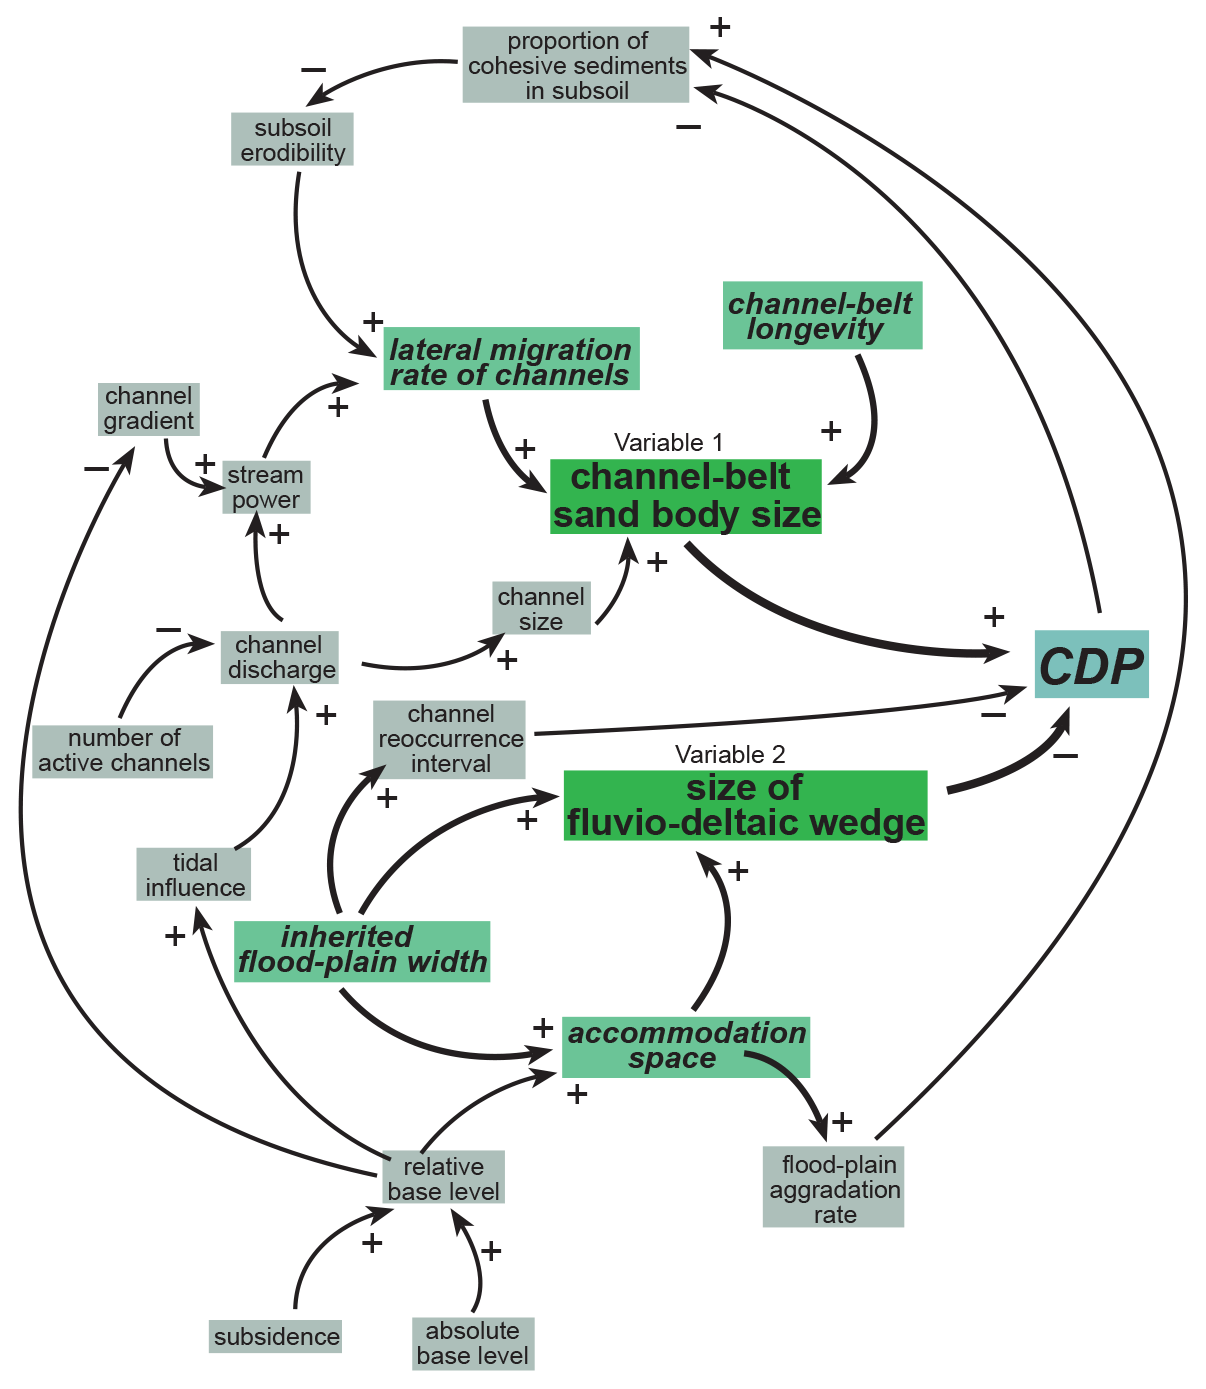
Figure 10Causal loop diagram displaying the interrelated variables for CDP. A plus sign indicates a positive relationship between variables (variables change in the same direction), and a minus sign indicates a negative relationship. CDP is calculated with two variables (marked in green boxes): channel-belt sand body size and size of the fluvio-deltaic wedge. These in turn are largely determined by channel lateral migration rate, channel-belt longevity, accommodation space and inherited floodplain geometry (width and topography) for which they are considered the key driving factors (green-blue boxes) explaining the relationship between CDP and downstream distance from delta apex. See the text for a discussion of this relationship.
5.1 Drivers of alluvial architecture in the Rhine–Meuse delta
In Sect. 4 it was shown that CDP clearly decreases in a downstream direction (Fig. 6). When CDP is plotted against the downstream distance from the delta apex (Fig. 9) a strong inverse relationship emerges. It thus seems that the proportion of channel-belt sands can be estimated using the distance from the delta apex. To assess whether this could also hold for other deltas, the key factors driving the relationship should be understood. Below, the two variables of CDP – channel-belt sand body size and size of the Holocene fluvio-deltaic wedge (Bridge and Mackey, 1993b; Mackey and Bridge, 1995) – are unravelled to identify key factors for the relationship between CDP and distance from the delta apex. To assist with this, a causal loop diagram is presented to visualize the interrelations between factors involved (Fig. 10). Because many of these factors have been extensively elaborated in previous publications, e.g. Cohen et al. (2002), Gouw and Berendsen (2007), Gouw and Erkens (2007), and Stouthamer et al. (2011), this discussion concentrates on subjects that in our opinion have been overlooked or insufficiently highlighted before, specifically channel-belt longevity, tidal influence, and the ratio between channel-belt sand body width and floodplain width.
5.1.1 Variable 1: channel-belt sand body size
Field studies (e.g. Bridge et al., 2000; Gouw, 2008) demonstrated that channel-belt sand body size strongly controls the proportion of channel-belt sands in the succession. Channel-belt sand body size is related to three variables: lateral migration rate of formative channels, channel-belt longevity and channel size (Fig. 10). Geometrically, channel-belt sand body size is largely determined by its width because sand body width is far larger than sand body thickness (Bridge et al., 2000; Gibling, 2006; Gouw and Berendsen, 2007). Sand body width increases with lateral migration rate and longevity of the formative channel. Initially, Gouw and Berendsen (2007) attributed the high width thickness ratios in the upper Rhine–Meuse delta (see Fig. 5) to high lateral migration rates of channels only. They hypothesized that these high lateral migration rates were caused by high subsoil erodibility (sandy subsoil) and high stream power (high channel gradient). They discussed that both bank erodibility and stream power decrease in a downstream direction – the former because of an increase of erosion-resistant bank material in the subsoil (thick layers of massive clay and peat; see Fig. 4b), the latter mainly because of decreasing river gradients in the backwater length (e.g. Blum et al., 2013; Nittrouer et al., 2012) – which reduces channel lateral migrations rates and thereby sand body width, width thickness ratios and CDP (see Figs. 5 and 6).
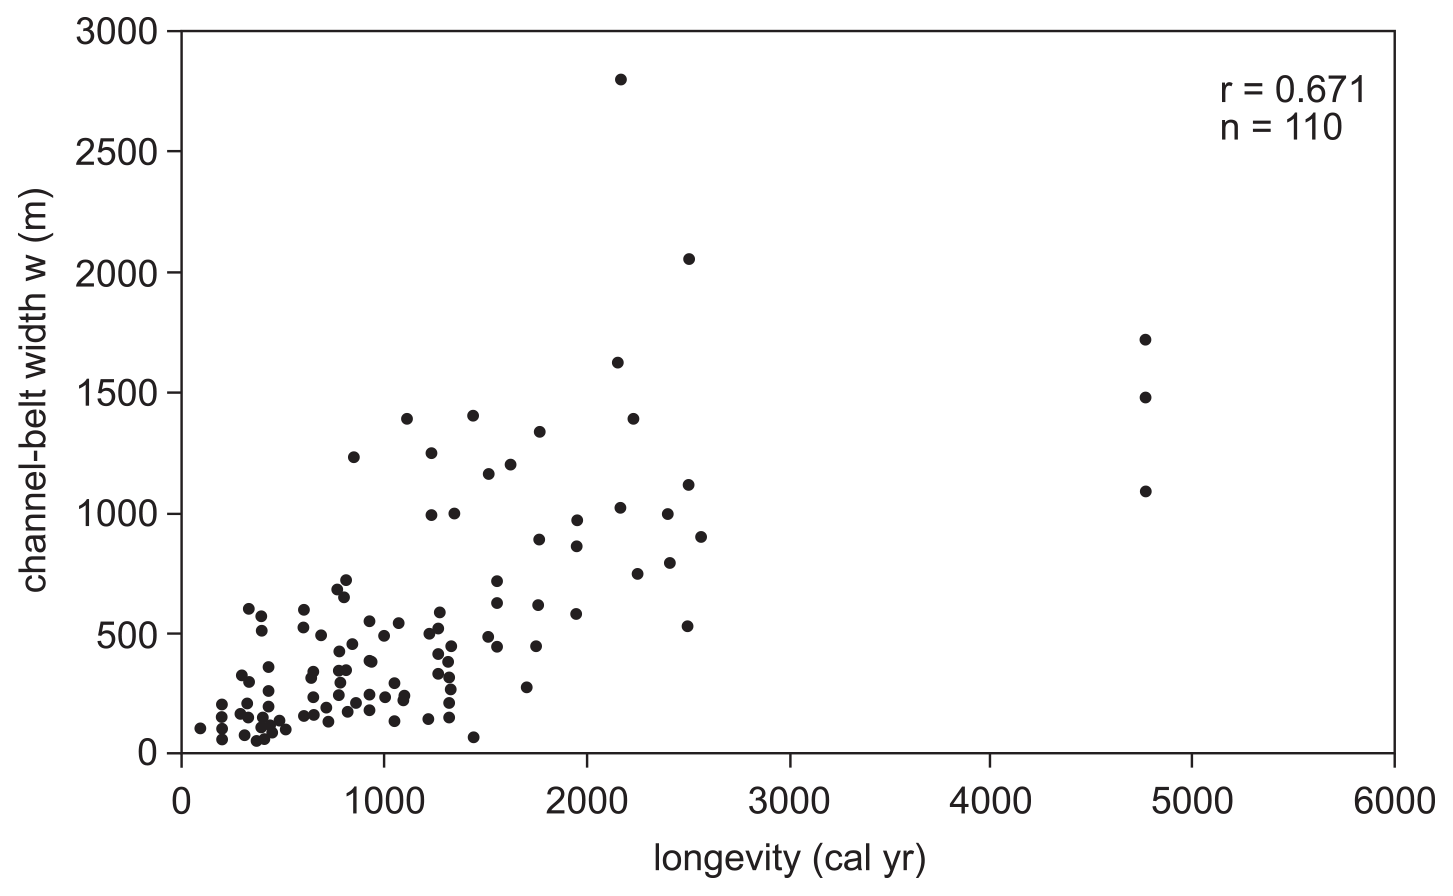
Figure 11Relationship between channel-belt width (w) and duration of channel activity (longevity). The graph shows a fairly strong positive correlation (r=0.671), which implies that channel-belt width generally increases with longevity. Data are from 110 selected Rhine–Meuse channel belts with a well-established longevity (cf. Cohen et al. 2012) and width (this study).
Although lateral migration rates do play a major role, Gouw and Berendsen (2007) overlooked channel-belt longevity, the second factor influencing channel-belt sand body size (Fig. 10). There is general consensus (as illustrated in Karssenberg and Bridge, 2008, for example) that high channel-belt longevity favours wide sand bodies because the formative channel has had more time to widen its associated sand body. Using the new dataset it is clear that this theory is also applicable to the Rhine–Meuse delta (Fig. 11). This is probably best exemplified in the central delta, where channel belts with the longest period of activity are generally the widest, despite the fact that many are encased in cohesive deposits (see Fig. 3b). The lifespan of the formative channels was apparently of sufficient length to enable widening of their associated sand bodies, although channel migration would have been hampered by cohesive banks. This suggests that the factor “channel-belt longevity” overpowers the factor “subsoil erodibility” for channel-belt sand body width, at least in the central delta. This effect is probably also in place in the proximal delta, although it is less obvious due to easily erodible sediments (sand) in the shallow subsurface favouring high channel migration rates. Most channel belts in the proximal delta have been active for several thousands of years (Berendsen and Stouthamer, 2000; Berendsen et al., 2007; Cohen et al., 2012), which is relatively long compared to the delta average (ca. 1000 years; Berendsen and Stouthamer, 2002). The channels thus had abundant time to form wide sand bodies, amplified by the easily erodible subsoil (see Fig. 3a), which explains why the channel-belt sand bodies in the proximal fluvial delta are significantly wider (∼ 900 m on average) than the delta average (∼ 550 m). In short, it seems that there is a positive correlation between channel-belt longevity and channel-belt sand body width – and thus width thickness ratios and CDP – in our study area.
Gouw and Berendsen (2007) argued that in the proximal and central delta subsoil erodibility is probably dominant over stream power in explaining the downstream decrease in lateral migration and thereby sand body width. It is suspected that the situation in the distal delta is more complicated because of the interplay between fluvial and tidal processes (cf. Dalrymple and Choi, 2007) and the impact of backwater effects (Blum et al., 2013). In the fluvial-dominated (upstream) part of the distal delta, fluvial-channel gradients and discharge per river channel, the two components of stream power, are both low. Channel gradients approach zero, whereas discharge is divided over multiple river courses causing discharge per river course to be minimal. The resultant stream power per river channel is therefore extremely low, leading to little lateral migration and consequently narrow sand bodies. In addition, as the energy to transport sediment decreases, the average grain size of the fluvial sand bodies decreases in concordance and suspended sediment concentrations rise. The latter reach a maximum somewhere in the fluvial–marine transition zone (in our study area, this would be around the x=100 coordinate). Further downstream in the distal delta, tidal currents become increasingly important. The tidal currents start to take over the role of transporting sediment, which leads to a drop in suspended sediment rates and increase in average grain size (e.g. Dalrymple and Choi, 2007). Moreover, tidal water fluxes through the channels increase seaward, i.e. discharge per channel increases due the influx of tidal waters. The increased discharge causes channel enlargement and rising stream power, which likely leads to increased sand body width. Additionally, bank erodibility probably increases in the distal delta due to a decrease of erosion-resistant peat layers in the subsoil (see Fig. 6, OP graph) in favour of immature subaqueous silt-laminated tidal clays and silty-sandy bay–head delta sediments that are easily erodible (Hijma and Cohen, 2011; Hijma et al., 2009). In the Rhine–Meuse delta peat layers have an important influence on lateral migration, more so than in most other deltas where in absence of thick peat sequences cohesive muds can play an important role (Edmonds and Slingerland, 2010; Dunne and Jerolmack, 2018). The presence of these soft clays and silts in the subsoil in combination with a decrease of resistant peat expectedly caused a decrease in bank resistance or, in other words, an increase in bank erodibility. This favours lateral migration and thereby sand body width. In short, based on the above, it can be expected that the proportion of channel-belt sands decreases downstream in the fluvial-dominated part of deltas, reaching a minimum in the fluvial–marine transition zone, and then stabilizes or even increases again in a seaward direction. This is exactly what is found in the data of this study (see Fig. 6a).
Channel size is the third factor influencing channel-belt sand body dimensions (Fig. 10). Channel size certainly influences sand body size because channel depth determines minimum channel-belt sand body thickness and channel width is a minimum for channel-belt sand body width (see Gouw and Berendsen, 2007) provided that the channel is filled in with sandy bar deposits. Whereas channel-belt sand body thickness roughly reflects channel depth, channel-belt sand bodies are mostly far wider than the width of its associated channel (Allen, 1965; Fisk, 1944; Bridge, 2003). Gouw and Berendsen (2007), for example, reported sand body width to channel width ratios of 6 to 10 for the modern Rhine and Meuse distributaries. In addition, they found significant variation in the ratio between sand body width and channel width. In other words, although channel width can be considered as a minimum for sand body width, it has a weak relation with the resultant sand body size. Therefore, channel size is not regarded as a key factor for channel-belt sand body size or CDP.
5.1.2 Variable 2: dimensions of the Holocene fluvio-deltaic wedge
The dimensions of the fluvio-deltaic wedge influences CDP because its cross-sectional area is the denominator in the CDP calculations (cf. Mackey and Bridge, 1995). The Rhine–Meuse delta is a typical example of a fluvial system experiencing relative base-level rise and increasing aggradation rates in a downstream direction (Cohen, 2005; Van Dijk et al., 1991; Cohen et al., 2005). As a result, the preserved Holocene fluvio-deltaic wedge thickens seaward (see Fig. 2). Because the wedge also widens, its volume increases strongly in a downstream direction. This geometry is typical for the Rhine–Meuse delta, and it should be noted that the geometry – and architectural patterns – of fluvio-deltaic wedges varies, for example, with the direction of basin subsidence (fore-tilted versus back-tilted basins) (e.g. Heller and Paola, 1996). Two factors with regard to the geometry of the Rhine–Meuse fluvio-deltaic wedge are briefly discussed: (1) creation of accommodation space, which mainly provides room for vertical expansion (thickening), and (2) the inherited floodplain topography, which mainly influences horizontal expansion (widening) (Fig. 10).
A principal prerequisite for the preservation of any fluvial succession is the availability of accommodation space, which is defined as the available space to store sediments (Blum and Törnqvist, 2000). Accommodation space in the Rhine–Meuse delta has been created by relative base-level rise, which in turn is driven by two key processes: absolute sea-level rise and land subsidence (Cohen, 2005; Gouw and Erkens, 2007; Hijma et al., 2009; for elaborate discussions, see Van Dijk et al., 1991) (Fig. 10). The rate at which accommodation space was created in the Rhine–Meuse delta increased in a downstream direction (Cohen, 2005), as it does in most deltas with an apex in the basin hinge zone and a basin-ward depocentre. This enabled vertical expansion of the wedge and downstream thickening of the preserved fluvio-deltaic succession. In the central delta, creation of accommodation space outpaced sediment delivery, causing an increase in organics within the succession (see Fig. 6c). In the distal delta, the rate of accommodation space creation was even larger, but the space was mainly filled in with intertidal and estuarine muds behind a coastal barrier that formed from ∼ 7.5 ka onwards. Actually, the end position of this coastal barrier also determined the dimensions of the preserved fluvio-deltaic wedge as it forms its downstream end (Hijma et al., 2009, 2010; Hijma and Cohen, 2011).
The inherited floodplain topography affected the dimensions of the Rhine–Meuse fluvio-deltaic wedge because bordering Pleistocene uplands in the proximal delta (Fig. 1) limit floodplain width. These uplands are absent further downstream, which made horizontal expansion of the wedge possible. Because the amount of created accommodation space in the central and distal delta was indeed sufficient to enable enlargement of the wedge, the cross-sectional area of the fluvio-deltaic wedge increases downstream. The downstream enlargement of the wedge yields relatively low CDP values, as observed in the field data (Fig. 6a).
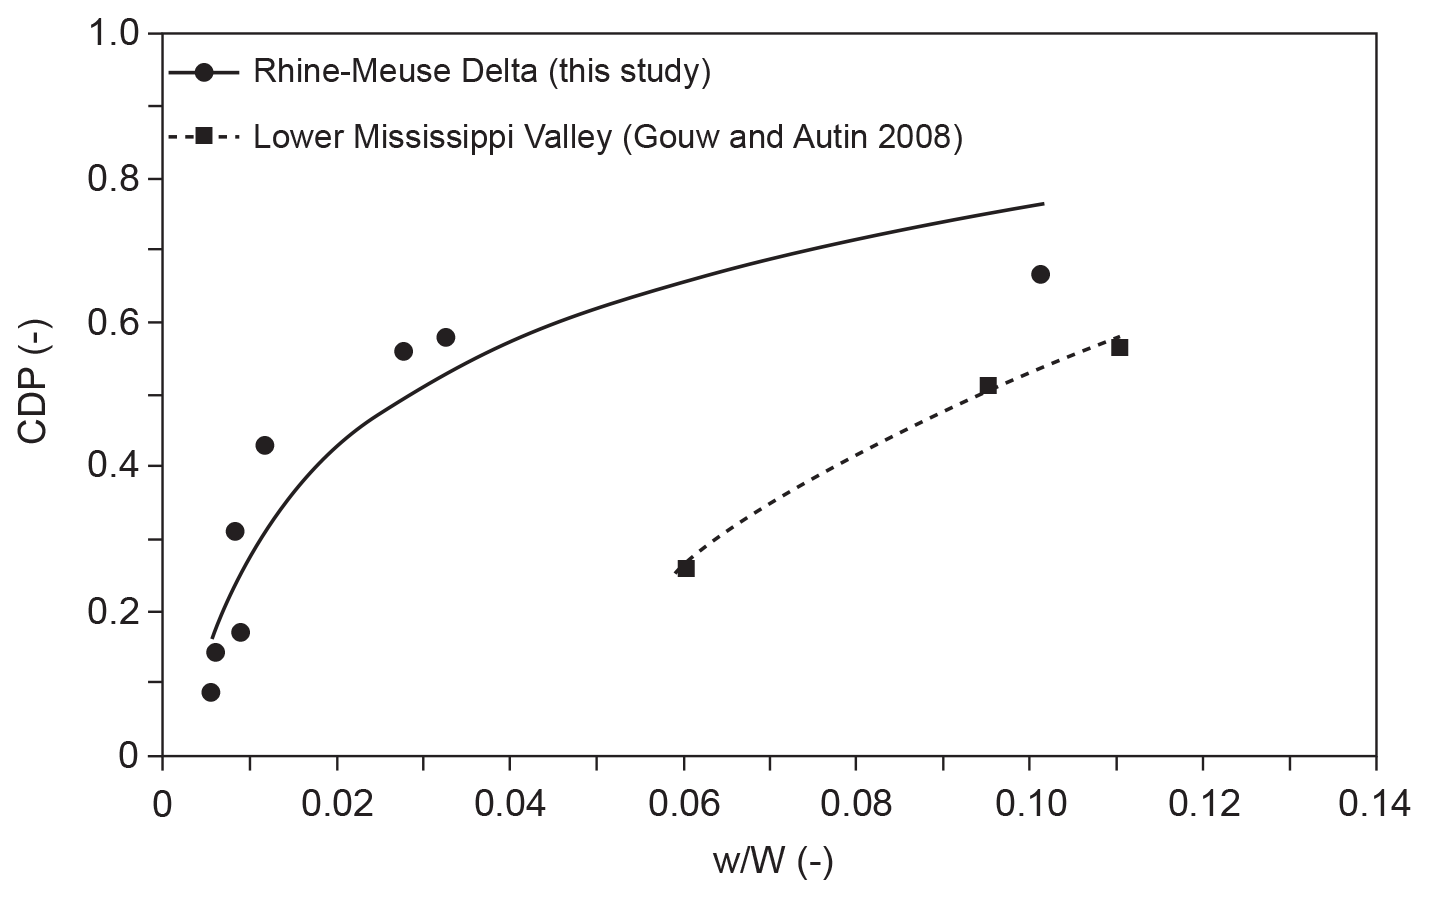
Figure 12Channel-belt deposit proportion (CDP) plotted against normalized channel-belt sand body width (), the Rhine–Meuse delta (points) and the Lower Mississippi River valley (rectangles). The data reveals a positive relationship between the two variables. The Rhine–Meuse data clearly displays a strong increase of CDP with when is low (< 0.02). The sensitivity of CDP for changes in declines with increasing . Data for the Lower Mississippi River valley are from Gouw and Autin (2008).
5.1.3 Relationship between CDP and normalized channel-belt sand body width
Several authors have postulated that variations in CDP should not be explained by changes in channel-belt sand body size or floodplain size alone but rather by variations in the ratio between these variables. The rationale behind this hypothesis is that if channel-belt sand bodies are large relative to floodplain size, they occupy a relatively large part of the available room on the floodplain – and its subsurface – which naturally leads to a high CDP of the resultant succession. Early modelling studies revealed the importance of the ratio between channel-belt sand body width (w) and floodplain width (W), or “normalized channel-belt sand body width” (see Bridge and Mackey, 1993b), for alluvial architecture (Bridge and Mackey, 1993b, a; Leeder, 1978; Bridge and Leeder, 1979; Bridge, 1999). Available field data seem to corroborate the model output despite the simplicity of these models. For example, Gouw and Autin (2008), in their field study on the Holocene alluvial architecture of the Lower Mississippi River valley (USA), indeed found that CDP increases with (Fig. 12). Their dataset is of limited size though, which causes significant uncertainty in the outcome. However, Gouw (2008) also recognized a positive correlation between and CDP for the fluvial-dominated part of the Rhine–Meuse delta, but the exact nature of the correlation remained obscure. To resolve the suspected relationship between the proportion of channel-belt sands and normalized channel-belt sand body width, new data from the current study is incorporated and plotted against (Fig. 12). The graphic shows that CDP is extremely sensitive to changes in when values of are low (for our dataset, < 0.02). In the Rhine–Meuse delta, low values are applicable to the central and distal delta due to the presence of relatively narrow channel-belt sand bodies (low w) on a wide floodplain (high W). The sensitivity of CDP for changes in weakens as rises (Fig. 12). Relatively high values occur in the proximal Rhine–Meuse delta, caused by wide channel-belt sand bodies (high w) and limited floodplain width (low W). These results imply that the sensitivity of CDP for changes in normalized channel-belt sand body width varies spatially, and is especially strong in the central and distal delta. Because a similar trend in the relationship between CDP and has been observed for the Lower Mississippi Valley (Fig. 1), it is likely that spatial variations in the sensitivity of CDP on normalized channel-belt sand body width are applicable to other deltas as well. It is therefore suggested to account for these spatial variations when explaining the alluvial architecture of fluvio-deltaic successions.
5.2 Influence of backwater effects on alluvial architecture
For the Rhine–Meuse delta, the present paper adds data from the distal delta to the existing body of literature on the alluvial-architecture of this delta. The distal delta lies directly upstream from the shoreline and contains the backwater zone that has a length of about 70–90 km (Berendsen, 1982). It is hypothesized by Fernandes et al. (2016) that in this zone channel belts are represented by thick, narrow and heterolithic deposits, in agreement with recent findings from the Mungaroo Formation in Australia (Martin et al., 2018). Our data show that in the backwater zone of the Rhine–Meuse delta the sand body width thickness ratio is lower than in the more upstream parts of the delta, but this is predominantly caused by narrowing of the channels and not so much by thickening. The deposits do become more heterolithic, especially within the fluvial–tidal area (Hijma et al., 2009). We do not find that channel-belt widths increase downstream up to the start of the backwater zone as suggested by Nittrouer et al. (2012) and Blum et al. (2013), but we instead find a steady decrease in channel-belt width from the proximal to the distal delta.
With respect to the backwater zone, Figs. 6–8 show distinct differences between this zone and the more upstream part. From Fig. 6 the most prominent one is the rapid increase in organics (OP) in the backwater zone. The OP tops around 30 % in the middle part of the backwater zone and then drops again towards the shoreline. For the Rhine–Meuse delta it is the part of the backwater zone with the lowest stream power and also the part where water stagnated in lakes and flood basins in a back-barrier setting. Closer to shore OP decreases, presumably as an effect of increased stream power (tides) and erosion by tidal channels. The suggestion of increased stream power in proximity of the shoreline is in line with data from other studies (Lamb et al., 2012; Nittrouer et al., 2012; Smith et al., 2020). The increase of intertidal deposits in the backwater zone signals the transition to the fluvial–tidal portion of this zone.
An interesting observation is that the negative trend for the total sand proportion becomes less negative starting in the backwater zone, and closer to the shoreline the total sand proportion increases again (Fig. 7). The negative trend is mostly the effect of widening of the delta plain, for a smaller part it is also the result of less transport of sand due to decreasing stream power. Closer to shore, sand is also brought in from the sea and deposited both in beach barriers (not in these cross-sections) and (estuarine) tidal flats and channels.
Figure 8 demonstrates that in the backwater zone the connectedness ratio drops from 0.2–0.3 to ∼ 0.08. This drop is again partly caused by widening of the flood plain, providing more room to spread, although the number of channels also increases. Another reason for the CR drop is lower rates of lateral migration and a thick fluvio-deltaic wedge. Both the latter two factors result in a lower chance for channel belts to connect to other channel belts. This effect is also seen in the Mississippi River delta (Blum et al., 2013).
5.3 Key factors for the CDP trend and empirical formula
Four factors were identified that are probably of key importance for the inverse relationship between CDP and downstream distance from the delta apex (Fig. 10): channel lateral migration rate, channel-belt longevity, creation of accommodation and inherited floodplain width. Because these factors are rather generic to fluvial systems at continental margins (see, e.g. Blum and Törnqvist, 2000; Saucier, 1994; Bridge, 2003; Gouw, 2007a; Blum et al., 2013), it is likely that the inferred relationship is applicable to other deltas as well. Indeed, available field data from the modern Lower Mississippi River point to an inverse relationship of CDP with downstream distance (Gouw and Autin, 2008). Fragmentary data from ancient fluvio-deltaic deposits also suggest downstream-decreasing CDP values (Foix et al., 2013; Klausen et al., 2014). Regardless, an inverse relationship makes sense because fluvial and estuarine channel-belt sands should eventually dissipate in the marine realm. For these reasons, it is hypothesized that downstream-decreasing CDP is probably a common characteristic of fluvio-deltaic successions. To model the spatial variability of CDP, an inverse linear function is proposed, with CDP ∼ 0.9 in the delta apex region (Fig. 9), using the following formula:
where CDP is channel deposit proportion (–), d is downstream distance from delta apex (km), D is total distance between the delta apex and shoreline (km), and is the relative distance downstream from the delta apex (–).
Because CDP cannot be negative, minimum CDP (zero) is reached at . In other words, the formula predicts fluvial and estuarine sands to be dissipated in the resultant succession at the (highstand) coastline. However, it is quite possible that the downstream-most data points in Fig. 9 represent minimum CDP, suggesting that CDP stabilizes at ∼ 0.1. This situation could occur when the oldest fluvial sediments of the wedge are preserved. This is often the case in the distal part of deltas where preservation potential of older sediments is relatively high, as these are below the scouring depth of younger channels (see, for example, Fig. 2).
5.4 Possible applications for alluvial-architecture research
In theory, the derived relationship between CDP and distance from the delta apex (or shoreline) offers opportunities for application in alluvial-architecture research in two directions. First, provided that the palaeogeographic location within the former delta is known, the CDP of a succession can be estimated even if the deposits are only partly exposed, as is often the case for ancient formations. For example, suppose it is assessed that a given fluvio-deltaic succession in outcrop is formed approximately halfway between the apex of the palaeo-delta and its associated shoreline (). One can then argue that the CDP of the surveyed succession in vicinity of the outcrop location would be on the order of 0.4. The other way around, the formula can be used to predict the palaeogeographic location based on a known value of CDP. This application is somewhat tricky because CDP can vary significantly, even at short distances. However, the CDP of extensive outcrops or cross sections could be used to get at least a rough estimate of where the succession was formed in the palaeo-delta. A succession with a CDP of 0.2, for instance, would indicate that the succession was formed at a relative distance of ∼ 0.75, which is halfway between the central delta and the shoreline, well inside the distal delta. In both directions the relationship will benefit the understanding of the studied delta and hence the associated geological modelling.
The above-stated formula can thus be applied in two ways: to estimate sand proportions with fragmentary geologic information and/or to understand deltaic palaeogeography. Both applications, which if necessary can be combined with other techniques such as shoreline trajectory analysis within sequence stratigraphic research (Bullimore and Helland-Hansen, 2009), are valuable because they can contribute to a better interpretation of (partly exposed) fluvio-deltaic successions and optimization of research strategies. However, the formula is derived solely from the Rhine–Meuse dataset, and although it is expected that the observed trend is valid for other deltas as well, it would be good to test this hypothesis in other settings. This expectation is not difficult to fulfil, as is evident from the good match in geometric trends of channel belts in the Mississippi Delta and the Rhine–Meuse Delta (Fernandes et al., 2016). To do so, field data (notably spatial trends in sand proportion) from other fluvio-deltaic settings – both modern and ancient – should be gathered. Relatively well-studied modern and/or ancient fluvio-deltaic successions could be used as a starting point. Possible examples are the Holocene Lower Mississippi River valley, USA (see, amongst others, Autin et al., 1991; Saucier, 1994) and extensively studied hydrocarbon reservoirs such as the Middle Jurassic Oseberg Field in the Norwegian North Sea (Ryseth, 2000; Ryseth et al., 1998) and the Upper Carboniferous Coevorden Field in the Netherlands (see Kombrink et al., 2007). Data from these settings would be greatly beneficial to better understand the spatial variability of channel-belt sands in fluvio-deltaic successions.
-
Fluvial sand body size in the Holocene Rhine–Meuse delta strongly decreases in a downstream direction. Average sand body width thickness ratio () in the upper fluvio-deltaic plain is up to 5 times higher than average in the lower fluvio-deltaic plain. values of up to 300 are found in the upper delta, whereas they are less than 70 in the lower delta. This trend is fully associated with a downstream decrease in sand body width because sand body thickness is nearly constant in the Rhine–Meuse delta.
-
A significant downstream decrease in the proportion of fluvial channel-belt sands (CDP) in the Rhine–Meuse succession was found. CDP, including estuarine channel-belt sands, diminishes from 0.7 to 0.1. The proportion of overbank fines is near-constant (∼ 0.4) throughout the delta. Organic matter proportion peaks (0.3) at the transition from the central to the distal delta. The connectedness ratio (CR) is roughly 3 times higher in the proximal delta (∼ 0.25) than in the distal delta (∼ 0.08).
-
A linear inverse function is proposed to model the spatial variability of CDP in fluvio-deltaic settings. Our data demonstrate that CDP decreases linearly with downstream distance from the delta apex, with CDP∼ 0.9 near the delta apex and approaching zero near the shoreline.
-
Four key factors were identified that most likely explain the relationship between CDP and distance from the delta apex: channel lateral migration rate, channel-belt longevity, creation of accommodation and inherited floodplain width. The observed decrease in CDP is explained by downstream narrowing of fluvial sand bodies, which in turn is partly the result of decreasing lateral migration rates of formative channels. In addition, channel-belt sand body width appears to increase with channel-belt longevity. This effect is most noticeable in the proximal and central Rhine–Meuse delta, where channel belts with the longest lifespan are generally the widest. Accommodation-space creation and floodplain geometry determine the size of the fluvio-deltaic wedge and thereby influences CDP because the size of the Holocene wedge is the denominator in CDP calculations. Furthermore, the sensitivity of CDP for changes in the ratio between channel-belt sand body width and floodplain width, referred to as normalized channel-belt sand body width, varies spatially which should be accounted for when explaining alluvial architecture.
-
Based on our data, it is proposed that the proportion of fluvial channel-belt sands is generally a strong indicator for the total sand content of fluvio-deltaic successions. It was found that more than 90 % of the sands in the proximal and central delta are of fluvial-channel origin. Therefore, total sand content can be satisfactorily approximated by calculating the proportion of fluvial channel-belt sands alone; the contribution of overbank sands (e.g. crevasse sands) to the total sand content is limited. In the distal delta, however, the proportion of fluvial channel-belt sands alone does not reflect total sand content because a mix of fluvial channel-belt sands, estuarine sands and intertidal sands largely form the total sand proportion, with the importance of fluvial channel-belt sands rapidly diminishing coastward.
-
Characteristics of the backwater zone of the Rhine–Meuse delta are (1) a sand body width thickness ratios that is lower as a consequence of channel narrowing rather than deepening, (2) a rapid increase in the organic proportion followed by a subsequent decrease, (3) an increase in the total sand proportion towards the shoreline and (4) a drop in the connectedness ratio.
With this paper, high-resolution quantitative data and spatial trends of the alluvial architecture are available for an entire delta for the very first time. The unique parameterizations based on real-world data will hopefully ignite further research on alluvial architecture in order to enhance our understanding of delta development and sediment preservation and to improve existing fluvial stratigraphy models.
The Rhine-Meuse dataset is an extensive digital dataset belonging to Utrecht University. It can be accessed via https://doi.org/10.17026/dans-x7g-sjtw (Cohen and Stouthamer, 2012).
MJPG used the cross sections to calculate alluvial-architectural parameters. The authors contributed equally to the analysis and the writing of the paper.
The contact author has declared that neither they nor their co-author has any competing interests.
Publisher's note: Copernicus Publications remains neutral with regard to jurisdictional claims in published maps and institutional affiliations.
We thank the two anonymous reviewers for their constructive comments on this paper.
This paper was edited by Daniel Parsons and reviewed by two anonymous referees.
Aigner, T., Asprion, U., Hornung, J., Junghans, W. D., and Kostrewa, R.: Integrated outcrop analogue studies for triassic alluvial reservoirs: Examples from Southern Germany, J. Petrol. Geol., 19, 393-406, https://doi.org/10.1111/j.1747-5457.1996.tb00446.x, 1996.
Allen, J. R. L.: A review of the origin and characteristics of recent alluvial sediments, Sedimentology, 5, 89–191, 1965.
Allen, J. R. L.: Studies in fluviatile sedimentation – Exploratory quantitative model for architecture of avulsion-controlled alluvial suites, Sediment. Geol., 21, 129–147, https://doi.org/10.1016/0037-0738(78)90002-7, 1978.
Autin, W. J.: Stratigraphic analysis and paleoenvironmental implications of the Wijchen Member in the lower Rhine–Meuse Valley of the Netherlands, Neth. J. Geosci., 87, 291–307, 2008.
Autin, W. J., Burns, S. F., Miller, B. J., Saucier, R. T., and Snead, J. I.: Quaternary geology of the Lower Mississippi Valley, in: Quaternary Nonglacial Geology: Conterminous U. S., The Geology of North America, K-2, edited by: Morrison, R. B., 547–582, https://doi.org/10.1130/DNAG-GNA-K2.547, 1991.
Beets, D. J. and Van der Spek, A. J. F.: The Holocene evolution of the barrier and the back-barrier basins of Belgium and the Netherlands as a function of late Weichselian morphology, relative sea-level rise and sediment supply, Neth. J. Geosci., 79, 3–16, 2000.
Berendsen, H. J. A.: De genese van het landschap in het zuiden van de provincie Utrecht, een fysisch-geografische studie, Universiteit Utrecht, Utrecht, 1982.
Berendsen, H. J. A. and Stouthamer, E.: Late Weichselian and Holocene palaeogeography of the Rhine–Meuse delta, The Netherlands, Palaeogeogr. Palaeocl., 161, 311–335, https://doi.org/10.1016/s0031-0182(00)00073-0, 2000.
Berendsen, H. J. A. and Stouthamer, E.: Palaeogeographic evolution and avulsion history of the Holocene Rhine–Meuse delta, The Netherlands, Neth. J. Geosci., 81, 97–112, 2002.
Berendsen, H. J. A., Cohen, K. M., and Stouthamer, E.: The use of GIS in reconstructing the Holocene palaeogeography of the Rhine–Meuse delta, The Netherlands, Int. J. Geogr. Inf. Sci., 21, 589–602, https://doi.org/10.1080/13658810601064918, 2007.
Blum, M., Martin, J., Milliken, K., and Garvin, M.: Paleovalley systems: Insights from Quaternary analogs and experiments, Earth-Sci. Rev., 116, 128–169, https://doi.org/10.1016/j.earscirev.2012.09.003, 2013.
Blum, M. D. and Törnqvist, T. E.: Fluvial responses to climate and sea-level change: a review and look forward, Sedimentology, 47, 2–48, https://doi.org/10.1046/j.1365-3091.2000.00008.x, 2000.
Bos, I. J.: Architecture and facies distribution of organic-clastic lake fills in the fluvio-deltaic Rhine–Meuse system, The Netherlands, J. Sediment. Res., 80, 339–356, https://doi.org/10.2110/jsr.2010.035, 2010.
Bos, I. J. and Stouthamer, E.: Spatial and temporal distribution of sand-containing basin fills in the Holocene Rhine–Meuse Delta, the Netherlands, J. Geol., 119, 641–660, https://doi.org/10.1086/661976, 2011.
Bridge, J. S.: Alluvial architecture of the Mississippi valley: predictions using a 3D simulation model, in: Floodplains: Interdisciplinary Approaches, edited by: Marriott, S. B., and Alexander, J., Geol. Soc. London Spec. Publ., 163, 269–278, 1999.
Bridge, J. S.: Rivers and floodplains: forms, processes, and sedimentary record, Blackwell, Oxford, 491 pp., 2003.
Bridge, J. S.: Numerical modelling of alluvial deposits: recent developments, in: Analogue and Numerical Modelling of Sedimentary Systems: From Understanding to Prediction, edited by: De Boer, P., Postma, G., van der Zwan, K., Burgess, P., and Kukla, P., Int. Ass. Sedimentol. Spec. Publ., 40, 97–138, 2008.
Bridge, J. S. and Leeder, M. R.: A simulation model of alluvial stratigraphy, Sedimentology, 26, 617–644, https://doi.org/10.1111/j.1365-3091.1979.tb00935.x, 1979.
Bridge, J. S. and Mackey, S. D.: A revised alluvial stratigraphy model, in: Alluvial Sedimentation, edited by: Marzo, M. and Puigdefabregas, C., Int. Ass. Sedimentol. Spec. Publ., 17, 319–336, 1993a.
Bridge, J. S. and Mackey, S. D.: A theoretical study of fluvial sandstone body dimensions, in: The Geological Modeling of Hydrocarbon Reservoirs, edited by: Flint, S. and Bryant, I. D., Int. Ass. Sedimentol. Spec. Publ., 15, 213–236, 1993b.
Bridge, J. S., Jalfin, G. A., and Georgieff, S. M.: Geometry, lithofacies, and spatial distribution of Cretaceous fluvial sandstone bodies, San Jorge Basin, Argentina: outcrop analog for the hydrocarbon-bearing Chubut Group, J. Sediment. Res., 70, 341–359, https://doi.org/10.1306/2dc40915-0e47-11d7-8643000102c1865d, 2000.
Bullimore, S. A. and Helland-Hansen, W.: Trajectory analysis of the lower Brent Group (Jurassic), Northern North Sea: contrasting depositional patterns during the advance of a major deltaic system, Basin Res., 21, 559–572, https://doi.org/10.1111/j.1365-2117.2009.00410.x, 2009.
Busschers, F. S., Kasse, C., van Balen, R. T., Vandenberghe, J., Cohen, K. M., Weerts, H. J. T., Wallinga, J., Johns, C., Cleveringa, P., and Bunnik, F. P. M.: Late Pleistocene evolution of the Rhine–Meuse system in the southern North Sea basin: imprints of climate change, sea-level oscillation and glacio-isostacy, Quaternary Sci. Rev., 26, 3216–3248, 2007.
Cohen, K. M.: 3D geostatistical interpolation and geological interpretation of paleogroundwater rise in the Holocene coastal prism in the Netherlands, in: River deltas: concepts, models and examples, 35 edn., edited by: Giosan, L. and Bhattacharya, J. P., SEPM Spec. Publ., 295–320, https://doi.org/10.2110/pec.05.83.0341, 2005.
Cohen, K. M. and Hijma, M. P.: The transgressive Early–Middle Holocene boundary: the case for a GSSP at Rotterdam, Rhine Delta, North Sea Basin, in: STRATI 2013. First International Congress on Stratigraphy – At the Cutting Edge of Stratigraphy, edited by: Rocha, R., Pais, J., Kullberg, J. C., and Finney, S., Springer Geology, Springer International Publishing, Switzerland, 925–929, https://doi.org/10.1007/978-3-319-04364-7, 2014.
Cohen, K. M. and Stouthamer, E.: Digitaal Basisbestand Paleogeografie van de Rijn–Maas Delta, DANS [data set], https://doi.org/10.17026/dans-x7g-sjtw, 2012.
Cohen, K. M., Stouthamer, E., and Berendsen, H. J. A.: Fluvial deposits as a record for Late Quaternary neotectonic activity in the Rhine–Meuse delta, The Netherlands, Neth. J. Geosci., 81, 389–405, 2002.
Cohen, K. M., Gouw, M. J. P., and Holten, J. P.: Fluvio-deltaic floodbasin deposits recording differential subsidence within a coastal prism (Central Rhine–Meuse Delta, The Netherlands), in: Fluvial Sedimentology VII, edited by: Blum, M. D., Marriot, S. B. and Leclair, S. F., Int. Ass. Sedimentol. Spec. Publ., 35, 295–320, 2005.
Cohen, K. M., Stouthamer, E., Pierik, H. J., and Geurts, A. H.: Rhine–Meuse Delta Studies' Digital Basemap For Delta Evolution And Palaeogeography/Digitaal Basisbestand Paleogeografie van de Rijn–Maas Delta, available at: https://easy.dans.knaw.nl/ui/datasets/id/easy-dataset:52125 (last access: 1 April 2021), 2012.
Corbett, M. J., Fielding, C. R., and Birgenheier, L. P.: Stratigraphy of a Cretaceous coastal-plain fluvial succession: the Campanian Masuk Formation, Henry Mountains syncline, Utah, U. S. A., J. Sediment. Res., 81, 80–96, https://doi.org/10.2110/jsr.2011.12, 2011.
Dalrymple, M.: Fluvial reservoir architecture in the Statfjord Formation (northern North Sea) augmented by outcrop analogue statistics, Petrol. Geosci., 7, 115–122, https://doi.org/10.1144/petgeo.7.2.115, 2001.
Dalrymple, R. W. and Choi, K.: Morphologic and facies trends through the fluvial–marine transition in tide-dominated depositional systems: A schematic framework for environmental and sequence-stratigraphic interpretation, Earth-Sci. Rev., 81, 135–174, 2007.
Dunne, K. B. J. and Jerolmack, D. J.: Evidence of, and a proposed explanation for, bimodal transport states in alluvial rivers, Earth Surf. Dynam., 6, 583–594, https://doi.org/10.5194/esurf-6-583-2018, 2018.
Edmonds, D. A. and Slingerland, R. L.: Significant effect of sediment cohesion on delta morphology, Nat. Geosci., 3, 105–109, https://doi.org/10.1038/ngeo730, 2010.
Fernandes, A. M., Törnqvist, T. E., Straub, K. M., and Mohrig, D.: Connecting the backwater hydraulics of coastal rivers to fluvio-deltaic sedimentology and stratigraphy, Geology, 44, 979–982, https://doi.org/10.1130/g37965.1, 2016.
Fisk, H. N.: Geological investigation of the alluvial valley of the Lower Mississippi River, U. S. Army Corps of Engineers, Mississippi River Commission, Vicksburg, Mississippi, 78 pp., 1944.
Flood, Y. S. and Hampson, G. J.: Quantitative analysis of the dimensions and distribution of channelized fluvial sandbodies within a large outcrop dataset: Upper Cretaceous Blackhawk Formation, Wasatch Plateau, Central Utah, U. S. A., J. Sediment. Res., 85, 315–336, https://doi.org/10.2110/jsr.2015.25, 2015.
Foix, N., Paredes, J. M., and Giacosa, R. E.: Fluvial architecture variations linked to changes in accommodation space: Río Chico Formation (Late Paleocene), Golfo San Jorge basin, Argentina, Sediment. Geol., 294, 342–355, 2013.
Gibling, M. R.: Width and thickness of fluvial channel bodies and valley fills in the geological record: A literature compilation and classification, J. Sediment. Res., 76, 731–770, https://doi.org/10.2110/jsr.2006.060, 2006.
Gouw, M. J. P.: Alluvial architecture of the Holocene Rhine–Meuse delta (The Netherlands) and the Lower Mississippi Valley (U. S. A.), Utrecht University, Utrecht, 2007a.
Gouw, M. J. P.: Alluvial architecture of fluvio-deltaic successions: a review with special reference to Holocene settings, Neth. J. Geosci., 86, 211–228, 2007b.
Gouw, M. J. P.: Alluvial architecture of the Holocene Rhine–Meuse delta (The Netherlands), Sedimentology, 55, 1487–1516, 2008.
Gouw, M. J. P. and Autin, W. J.: Alluvial architecture of the Holocene Lower Mississippi Valley (USA) and a comparison with the Rhine–Meuse delta (The Netherlands), Sediment. Geol., 204, 106–121, https://doi.org/10.1016/j.sedgeo.2008.01.003, 2008.
Gouw, M. J. P. and Berendsen, H. J. A.: Variability of channel-belt dimensions and the consequences for alluvial architecture: Observations from the Holocene Rhine–Meuse delta (The Netherlands) and Lower Mississippi Valley (USA), J. Sediment. Res., 77, 124–138, https://doi.org/10.2110/jsr.2007.013, 2007.
Gouw, M. J. P. and Erkens, G.: Architecture of the Holocene Rhine–Meuse delta (the Netherlands) – A result of changing external controls, Neth. J. Geosci., 86, 23–54, 2007.
Hajek, E. A. and Wolinsky, M. A.: Simplified process modeling of river avulsion and alluvial architecture: Connecting models and field data, Sediment. Geol., 257, 1–30, https://doi.org/10.1016/j.sedgeo.2011.09.005, 2012.
Heller, P. L. and Paola, C.: Downstream changes in alluvial architecture: An exploration of controls on channel-stacking patterns, J. Sediment. Res., 66, 297–306, 1996.
Hijma, M. P. and Cohen, K. M.: Timing and magnitude of the sea-level jump preluding the 8200 yr event, Geology, 38, 275–278, 2010.
Hijma, M. P. and Cohen, K. M.: Holocene transgression of the Rhine river mouth area, The Netherlands/Southern North Sea: palaeogeography and sequence stratigraphy, Sedimentology, 58, 1453–1485, 2011.
Hijma, M. P. and Cohen, K. M.: Holocene sea-level database for the Rhine–Meuse Delta, The Netherlands: Implications for the pre-8.2 ka sea-level jump, Quaternary Sci. Rev., 214, 68–86, https://doi.org/10.1016/j.quascirev.2019.05.001, 2019.
Hijma, M. P., Cohen, K. M., Hoffmann, G., Van der Spek, A. J. F., and Stouthamer, E.: From river valley to estuary: the evolution of the Rhine mouth in the early to middle Holocene (western Netherlands, Rhine–Meuse delta), Neth. J. Geosci., 88, 13–53, 2009.
Hijma, M. P., Van der Spek, A. J. F., and Van Heteren, S.: Development of a mid-Holocene estuarine basin, Rhine–Meuse mouth area, offshore The Netherlands, Mar. Geol., 271, 198–211, https://doi.org/10.1016/j.margeo.2010.02.011, 2010.
Hijma, M. P., Cohen, K. M., Roebroeks, W., Westerhoff, W. E., and Busschers, F. S.: Pleistocene Rhine–Thames landscapes: geological background for hominin occupation of the southern North Sea region, J. Quaternary Sci. 27, 17–39, https://doi.org/10.1002/jqs.1549, 2012.
Hoek, W. Z.: The Last Glacial-Interglacial Transition, Episodes, 31, 226–229, 2008.
Jelgersma, S.: Holocene sea-level changes in The Netherlands, Mededelingen Geologische Stichting, 7, 1–101, 1961.
Jensen, M. A. and Pedersen, G. K.: Architecture of vertically stacked fluvial deposits, Atane Formation, Cretaceous, Nuussuaq, central West Greenland, Sedimentology, 57, 1280–1314, https://doi.org/10.1111/j.1365-3091.2010.01146.x, 2010.
Karssenberg, D. and Bridge, J. S.: A three-dimensional numerical model of sediment transport, erosion and deposition within a network of channel belts, floodplain and hill slope: extrinsic and intrinsic controls on floodplain dynamics and alluvial architecture, Sedimentology, 55, 1717–1745, https://doi.org/10.1111/j.1365-3091.2008.00965.x, 2008.
Keogh, K. J., Martimus, A. W., and Osland, R.: The development of fluvial stochastic modelling in the Norwegian oil industry: A historical review, subsurface implementation and future directions, Sediment. Geol., 202, 249–268, https://doi.org/10.1016/j.sedgeo.2007.05.009, 2007.
Klausen, T. G., Ryseth, A. E., Helland-Hansen, W., Gawthorpe, R., and Laursen, I.: Spatial and temporal changes in geometries of fluvial channel bodies for the Triassic Snadd Formation of offshore Norway, J. Sediment. Res., 84, 567–585, https://doi.org/10.2110/jsr.2014.47, 2014.
Kombrink, H., Bridge, J. S., and Stouthamer, E.: The alluvial architecture of the Coevorden Field (Upper Carboniferous), the Netherlands, Neth. J. Geosci., 86, 3–14, 2007.
Lamb, M. P., Nittrouer, J. A., Mohrig, D., and Shaw, J.: Backwater and river plume controls on scour upstream of river mouths: Implications for fluvio-deltaic morphodynamics, J. Geophys. Res.-Earth, 117, F01002, https://doi.org/10.1029/2011JF002079, 2012.
Leeder, M. R.: A quantitative stratigraphic model for alluvium, with special reference to channel deposit density and interconnectedness, in: Fluvial Sedimentology, edited by: Miall, A. D., Can. Soc. Pet. Geol. Mem., 5, 587–596, 1978.
Lopez-Gomez, J., Martin-Chivelet, J., and Palma, R. M.: Architecture and development of the alluvial sediments of the Upper Jurassic Tordillo Formation in the Canada Ancha Valley, northern Neuquen Basin, Argentina, Sediment. Geol., 219, 180–195, https://doi.org/10.1016/j.sedgeo.2009.05.006, 2009.
Mackey, S. D. and Bridge, J. S.: Three-dimensional model of alluvial stratigraphy – theory and application, J. Sediment. Res., 65, 7–31, 1995.
Maljers, D., Stafleu, J., van der Meulen, M. J., and Dambrink, R. M.: Advances in constructing regional geological voxel models, illustrated by their application in aggregate resource assessments, Neth. J. Geosci., 94, 257–270, https://doi.org/10.1017/njg.2014.46, 2015.
Martin, J., Fernandes, A. M., Pickering, J., Howes, N., Mann, S., and McNeil, K.: The Stratigraphically Preserved Signature of Persistent Backwater Dynamics in a Large Paleodelta System: The Mungaroo Formation, North West Shelf, Australia, J. Sediment. Res., 88, 850–872, https://doi.org/10.2110/jsr.2018.38, 2018.
Nittrouer, J. A., Shaw, J., Lamb, M. P., and Mohrig, D.: Spatial and temporal trends for water-flow velocity and bed-material sediment transport in the lower Mississippi River, Geol. Soc. Am. Bull., 124, 400–414, https://doi.org/10.1130/b30497.1, 2012.
Posamentier, H. W., Allen, G. P., James, D. P., and Tesson, M.: Forced regression in a sequence stratigraphic framework – Concepts, examples, and exploration significance, AAPG Bull., 76, 1687–1709, 1992.
Rasmussen, S. O., Andersen, K. K., Svensson, A. M., Steffensen, J. P., Vinther, B. M., Clausen, H. B., Siggaard-Andersen, M. L., Johnsen, S. J., Larsen, L. B., Dahl-Jensen, D., Bigler, M., Rothlisberger, R., Fischer, H., Goto-Azuma, K., Hansson, M. E., and Ruth, U.: A new Greenland ice core chronology for the last glacial termination, J. Geophys. Res., 111, D06102, https://doi.org/10.1029/2005JD006079, 2006.
Ryseth, A.: Differential subsidence in the Ness Formation (Bajocian), Oseberg area, northern North Sea: facies variation, accommodation space development and sequence stratigraphy in a deltaic distributary system, Norsk Geol. Tidsskr., 80, 9–25, https://doi.org/10.1080/002919600750042645, 2000.
Ryseth, A., Fjellbirkeland, H., Osmundsen, I. K., Skalnes, A., and Zachariassen, E.: High-resolution stratigraphy and seismic attribute mapping of a fluvial reservoir: Middle Jurassic Ness Formation, Oseberg field, AAPG Bull., 82, 1627–1651, 1998.
Saucier, R. T.: Geomorphology and Quaternary geologic history of the Lower Mississippi Valley. 2 Volumes, U. S. Army Corps of Engineers Waterways Experiment Station, Mississippi River Commission, Vicksburg, Mississippi, 364 pp., 1994.
Smith, V., Mason, J., and Mohrig, D.: Reach-scale changes in channel geometry and dynamics due to the coastal backwater effect: the lower Trinity River, Texas, Earth Surf. Proc. Land., 45, 565–573, https://doi.org/10.1002/esp.4754, 2020.
Stouthamer, E.: Sedimentary products of avulsions in the Holocene Rhine–Meuse Delta, The Netherlands, Sediment. Geol., 145, 73–92, https://doi.org/10.1016/s0037-0738(01)00117-8, 2001.
Stouthamer, E. and Berendsen, H. J. A.: Factors controlling the Holocene avulsion history of the Rhine–Meused delta (The Netherlands), J. Sediment. Res., 70, 1051–1064, https://doi.org/10.1306/033000701051, 2000.
Stouthamer, E., Cohen, K. M., and Gouw, M. J. P.: Avulsion and its implications for fluvio-deltaic architecture: insights from the Holocene Rhine–Meuse Delta, in: From River to Rock Record: The Preservation of Fluvial Sediments and Their Subsequent Interpretation, edited by: Davidson, S. K., Leleu, S. and North, C. P., SEPM Spec. Publ., 215–231, https://doi.org/10.2110/sepmsp.097.215, 2011.
Törnqvist, T. E.: Middle and Late Holocene avulsion history of the River Rhine (Rhine–Meuse delta, The Netherlands), Geology, 22, 711–714, https://doi.org/10.1130/0091-7613(1994)022<0711:malhah>2.3.co;2, 1994.
Tye, R. S., Bhattacharya, J. P., Lorsong, J. A., Sindelar, S. T., Knock, D. G., Puls, D. D., and Levinson, R. A.: Geology and stratigraphy of fluvio-deltaic deposits in the Ivishak formation: Applications for development of Prudhoe Bay field Alaska, AAPG Bull., 83, 1588–1623, 1999.
Van de Plassche, O.: Sea-level change and water-level movements in The Netherlands during the Holocene, PhD thesis, Vrije Universiteit, Amsterdam, 1982.
Van Dijk, G. J., Berendsen, H. J. A., and Roeleveld, W.: Holocene water level development in the Netherlands river area – Implications for sea-level reconstruction, Neth. J. Geosci., 70, 311–326, 1991.
Van Geel, B., Bohncke, S. J. P., and Dee, H.: A paleoecological study of an upper Late Glacial and Holcoene sequence from De Borchert, The Netherlands, Rev. Palaeobot. Palyno., 31, 367–448, 1981.
Weerts, H. J. T. and Bierkens, M. F. P.: Geostatistical analysis of overbank deposits of anastomosing and meandering fluvial system; Rhine–Meuse delta, The Netherlands, Sediment. Geol., 85, 221–232, https://doi.org/10.1016/0037-0738(93)90085-j, 1993.
Westerhoff, W. E., Wong, T. E., and De Mulder, E. F. J.: Opbouw van de ondergrond. Opbouw van het Neogeen en Kwartair, in: De ondergrond van Nederland, edited by: De Mulder, E. F. J., Geluk, M. C., Ritsema, I. L., Westerhoff, W. E. and Wong, T. E., Wolters Noordhoff, Groningen/Houten, 295–352, 2003.
Wu, C. and Nitterour, J. A.: Impacts of backwater hydrodynamics on fluvial–deltaic stratigraphy, Basin Res., 32, 567–584, https://doi.org/10.1111/bre.12385, 2020.
York, C. C., Painter, C. S., and Carrapa, B.: Sedimentological characterization of the Sego Sandstone (NW Colorado, USA): a new scheme to recognize ancient flood-tidal-delta deposits and implications for reservoir potential, J. Sediment. Res., 81, 401–419, https://doi.org/10.2110/jsr.2011.35, 2011.
Zaleha, M. J.: Intra- and extrabasinal controls on fluvial deposition in the Miocene Indo-Gangetic foreland basin, northern Pakistan, Sedimentology, 44, 369–390, https://doi.org/10.1111/j.1365-3091.1997.tb01530.x, 1997.
Ziegler, P. A.: Cenozoic rift system of Western and Central-Europe – An overview, Neth. J. Geosci., 73, 99–127, 1994.