the Creative Commons Attribution 4.0 License.
the Creative Commons Attribution 4.0 License.
 | 24 Jun 2022
Alpine rock glacier activity over Holocene to modern timescales (western French Alps)
Robert S. Anderson
Xavier Bodin
Diego Cusicanqui
Pierre G. Valla
Julien Carcaillet
Active rock glaciers are some of the most frequent cryospheric landforms in midlatitude high-elevation mountain ranges. Their activity strongly influences the hydrology and geomorphology of alpine environments over short (years to decades) and long (centuries to millennia) timescales. Being conspicuous expressions of mountain permafrost and important water reserves in the form of ground ice, rock glaciers are seen as increasingly important actors in the geomorphological and hydrological evolution of mountain systems, especially in the context of current climate change. Over geological timescales, rock glaciers both reflect paleoclimate conditions and transport rock boulders produced by headwall erosion, and they therefore participate in shaping high mountain slopes. However, the dynamics of rock glaciers and their evolution over different timescales remain under-constrained.
In this study, we adopt a multi-method approach, including field observations, remote sensing, and geochronology, to investigate the rock glacier system of the Vallon de la Route (Combeynot Massif, western French Alps). Remotely sensed images and correlation techniques are used to document the displacement field of the rock glacier over timescales ranging from days to decades. Additionally, to estimate displacement over periods from centuries to millennia, we employ terrestrial cosmogenic nuclide (quartz 10Be) surface-exposure dating on rock boulder surfaces located along the central flow line of the rock glacier, targeting different longitudinal positions from the headwall to the rock glacier terminus.
The remote sensing analysis demonstrates that between 1960 and 2018 the two lower units of the rock glacier were motionless, the transitional unit presented an integrated surface velocity of 0.03±0.02 m a−1, and the two upper active units above 2600 m a.s.l. showed a velocity between 0.14±0.08 and 0.15±0.05 m a−1. Our results show 10Be surface-exposure ages ranging from 13.10±0.51 to 1.88±0.14 ka. The spatial distribution of dated rock glacier boulders reveals a first-order inverse correlation between 10Be surface-exposure age and elevation and a positive correlation with horizontal distance to the headwall. These observations support the hypothesis of rock boulders falling from the headwall and remaining on the glacier surface as they are transported down valley, and they may therefore be used to estimate rock glacier surface velocity over geological timescales. Our results also suggest that the rock glacier is characterized by two major phases of activity. The first phase, starting around 12 ka, displays a 10Be age gradient with a rock glacier surface velocity of about 0.45 m a−1, following a quiescent period between ca. 6.2 and 3.4 ka before the emplacement of the present-day upper two active units. Climatic conditions have favored an integrated rock glacier motion of around 0.18 m a−1 between 3.4 ka and present day. These results allow us to quantify back-wearing rates of the headwall of between 1.0 and 2.5 mm a−1, higher than catchment-integrated denudation rates estimated over millennial timescales. This suggests that the rock glacier system promotes the maintenance of high rock wall erosion by acting as debris conveyor and allowing freshly exposed bedrock surfaces to be affected by erosion processes.
- Article
(17064 KB) - Full-text XML
- BibTeX
- EndNote


Rock glaciers are important geomorphic structures influencing the evolution of high-elevation mountain environments. They are lobate or tongue-shaped assemblages of angular rock debris and ice. Rock glaciers move by the deformation of internal ice, conveying large caliber sediments from high-elevation steep slopes and cirque headwalls to their terminus at lower elevations (Barsch, 1977; Giardino and Vitek, 1988). In the context of current climate change, rock glaciers are considered one of the most resilient cryospheric bodies in alpine environments thanks to the insulating effect of their rocky carapace (Jones et al., 2019). Indeed, they represent an important water storage when mountain glaciers have disappeared (e.g., Jones et al., 2019). However, in situ measurements in the last few decades have shown rock glacier acceleration and destabilization associated with increasing air temperature in the European Alps (e.g., Marcer et al., 2021). Over geological timescales, rock glaciers participate actively in the development of asymmetrical mountain crests by conveying rock from lee side headwalls (where rockfall is the primary source of debris) to lower elevations in the valley (Gilbert, 1904; Johnson, 1980). Although rock glaciers have received considerable attention in the last couple decades, being catalogued in several geographic areas (see Jones et al., 2019, for the latest review), the formation and evolution of rock glaciers are still a subject of debate, with two main holistic views (see Haeberli et al., 2006; Berthling, 2011). On the one hand, rock glaciers are seen as periglacial features in which ice forms and ice content increases within debris interstices and thereby forms an ice–rock mixture that creeps by the influence of gravity and sufficient slope (e.g., Wahrhaftig and Cox, 1959; Ikeda et al., 2008). On the other hand, rock glaciers are also thought to be the remnants of glaciers with a deforming ice core protected by a continuous debris cover (e.g., Whalley, 1974; Monnier and Kinnard, 2015; Anderson et al., 2018).
The development of rock glaciers is a long process taking decades to thousands of years (e.g., Berthling, 2011). Their morphology, activity, and dynamics reflect present and past climates (e.g., temperature and precipitation fluctuations) and geomorphological forcing (rock and snow avalanching, bedrock structural patterns; Ikeda and Matsuoka, 2006; Kellerer-Pirklbauer and Rieckh, 2016; Jones et al., 2019). Rock glacier activity is categorized into active, transitional, and relict modes and has been recently updated based on geomorphological indicators (Delaloye and Echelard, 2020). An active rock glacier presents movement over most of its surface, whereas a transitional rock glacier presents low magnitude of movement only detectable by in situ or remote sensing measurement and/or is restricted to non-dominant areas. Finally, a relict rock glacier has no detectable movement and no morphological evidence of recent movement and/or ice content (Delaloye and Echelard, 2020). Rock glaciers have been documented in the European Alps that have accelerated with increasing temperature (Delaloye et al., 2010; Kellerer-Pirklbauer, 2017; Wirz et al., 2016; Eriksen et al., 2018; Kenner et al., 2018; Marcer et al., 2021), but when the ice content falls below a critical saturation threshold, rock glaciers stop creeping, turning from active into transitional and eventually relict mode (Sandeman and Ballantyne, 1996). Their activity is also controlled by the geomorphology of the surrounding topography. For instance, it has been suggested that when the rock boulder delivery rate and debris and ice incorporation become insufficient to sustain the insulation of the ice-rich part, the activity of the rock glacier will decrease and stop regardless of the rock glacier thermal state (Amschwand et al., 2021).
The relationships between external forcings and the activity of rock glaciers need to be better understood. Consequently, their past activity and in particular past vs. modern rock glacier surface velocity estimates must be quantified from annual to millennial timescales. This will allow us to assess how ongoing climate change has and will affect rock glaciers. Analytical advances over the past decades have allowed significant progress based on remote sensing tools for monitoring changes on high-mountain landforms (e.g., Necsoiu et al., 2016; Vivero and Lambiel, 2019; Blöthe et al., 2021; Robson et al., 2022). Indeed, methods such as lidar (Micheletti et al., 2017), InSAR (e.g., Liu et al., 2013; Barboux et al., 2014; Strozzi et al., 2020), aerial photogrammetry (e.g., Kaab et al., 1997), and unpiloted aerial vehicle systems (e.g., Dall'Asta et al., 2017; Vivero and Lambiel, 2019) have made a remarkable improvement to the temporal and spatial resolution of surface velocity surveys for rock glaciers. Recent studies have shown the feasibility of using high-resolution digital elevation models (DEMs) and ortho-rectified images produced from historical aerial and satellite images to reconstruct the surface velocity of rock glaciers over the last 7 decades (Fleischer et al., 2021; Vivero et al., 2021; Kääb et al., 2021; Cusicanqui et al., 2021). Extrapolations from short-term surface velocities have been used to estimate the rock glacier formation time and to reconstruct their activity over longer timescales (Kaab et al., 1997; Frauenfelder and Kááb, 2000; Bodin, 2013). However, it remains difficult to assess such extrapolations and to accurately constrain the long-term dynamics and morphological changes of rock glaciers without reliable estimates over centennial to millennial timescales.
To improve our understanding of rock glacier long-term dynamics and potential forcing mechanisms, relative and absolute dating methods have been applied on both active and relict rock glaciers (e.g., Haeberli, 2013; Amschwand et al., 2021). In rare cases, radiocarbon dating has been used on lacustrine sediments or trees buried by rock glaciers (Paasche et al., 2007) or on vegetal macrofossils found in old permafrost cores from a rock glacier (Krainer et al., 2015). Schmidt hammer methods have been employed to estimate the surface-exposure age of boulders from numerous rock glaciers (European Alps, Pyrenees, Norway, Iceland, and New Zealand) but such an approach requires local calibration surfaces and often only provides relative dating (e.g., Böhlert et al., 2011; Scapozza et al., 2014; Matthews and Wilson, 2015; Winkler and Lambiel, 2018). Similarly, lichenometry has been applied successfully on rock glaciers with stable rock boulders at the surface, although absolute dating requires calibration of this technique (e.g., Konrad et al., 1999). Optically stimulated luminescence has been used to quantify the travel time of buried fine sediments in rock glaciers (Swiss Alps), but large uncertainties potentially coming from pre-burial bleaching of fine sediments make this approach challenging to apply at a larger scale (Fuchs et al., 2013).
Terrestrial cosmogenic nuclide (TCN) dating has been successfully applied to constrain the exposure time of rock boulders at the surface of relict rock glaciers and their stabilization in the European Alps (Hippolyte et al., 2009; Steinemann et al., 2020), the Iberian Peninsula (Rodríguez-Rodríguez et al., 2017; Andrés et al., 2018; Palacios et al., 2020; García-Ruiz et al., 2000), Scotland (Sandeman and Ballantyne, 1996), and Iceland (Fernández-Fernández et al., 2020), demonstrating their potential as independent paleoclimate archives to reconstruct past permafrost development and to identify activity phases of rock glaciers (Andrés et al., 2018). Cossart et al. (2010) combined 10Be surface-exposure dating and weathering rind thickness to document three main generations of a rock glacier in the southern French Alps. Recently, two studies (in Iceland and Switzerland) have applied TCN dating on rock glacier systems composed of both active and relict units (Fernández-Fernández et al., 2020; Amschwand et al., 2021), showing deactivation and stabilization of the rock glacier at lower elevations and greater distances from the headwall.
The onset of rock glacier development in the high-elevation parts of the European Alps is thought to have started after the onset of glacier retreat following the Last Glacial Maximum (around 19–18 ka in the European Alps, e.g., Ivy-Ochs, 2015; Monegato et al., 2017; Lehmann et al., 2020). Chronologies of rock glacier development in the Alps of Austria, central Switzerland, and France have shown different rock glacier generations: during the Lateglacial (ca. 16 ka; Steinemann et al., 2020), during or shortly after the Younger Dryas (ca. 12 ka; Cossart et al., 2010; Steinemann et al., 2020; Charton et al., 2021), and during the late Holocene (Amschwand et al., 2021), probably at the end of Subboreal period (– ka; Cossart et al., 2010) when the high-elevation cirques became ice-free.
The goal of this study is to reconstruct the activity and the surface velocities at different timescales of the rock glacier system of the Vallon de la Route (Combeynot Massif, western French Alps). A remote sensing approach utilizing image correlation over photogrammetric products allows us to reconstruct the surface displacement field of the rock glacier over the last 6 decades. Over longer periods (103 to 104 years), we apply TCN dating (quartz 10Be) to rock boulder surfaces at different positions along the central flow line of the rock glacier, from its terminus to its highest part, allowing the conversion of the 10Be surface-exposure ages into long-term surface displacement estimates. By discussing our estimates of rock glacier surface kinematics at different timescales, we show that it is possible to reconstruct the history of past activity of the rock glacier and to use rock glaciers as independent paleoclimate and paleo-geomorphological proxies to reveal the evolution of alpine environments.
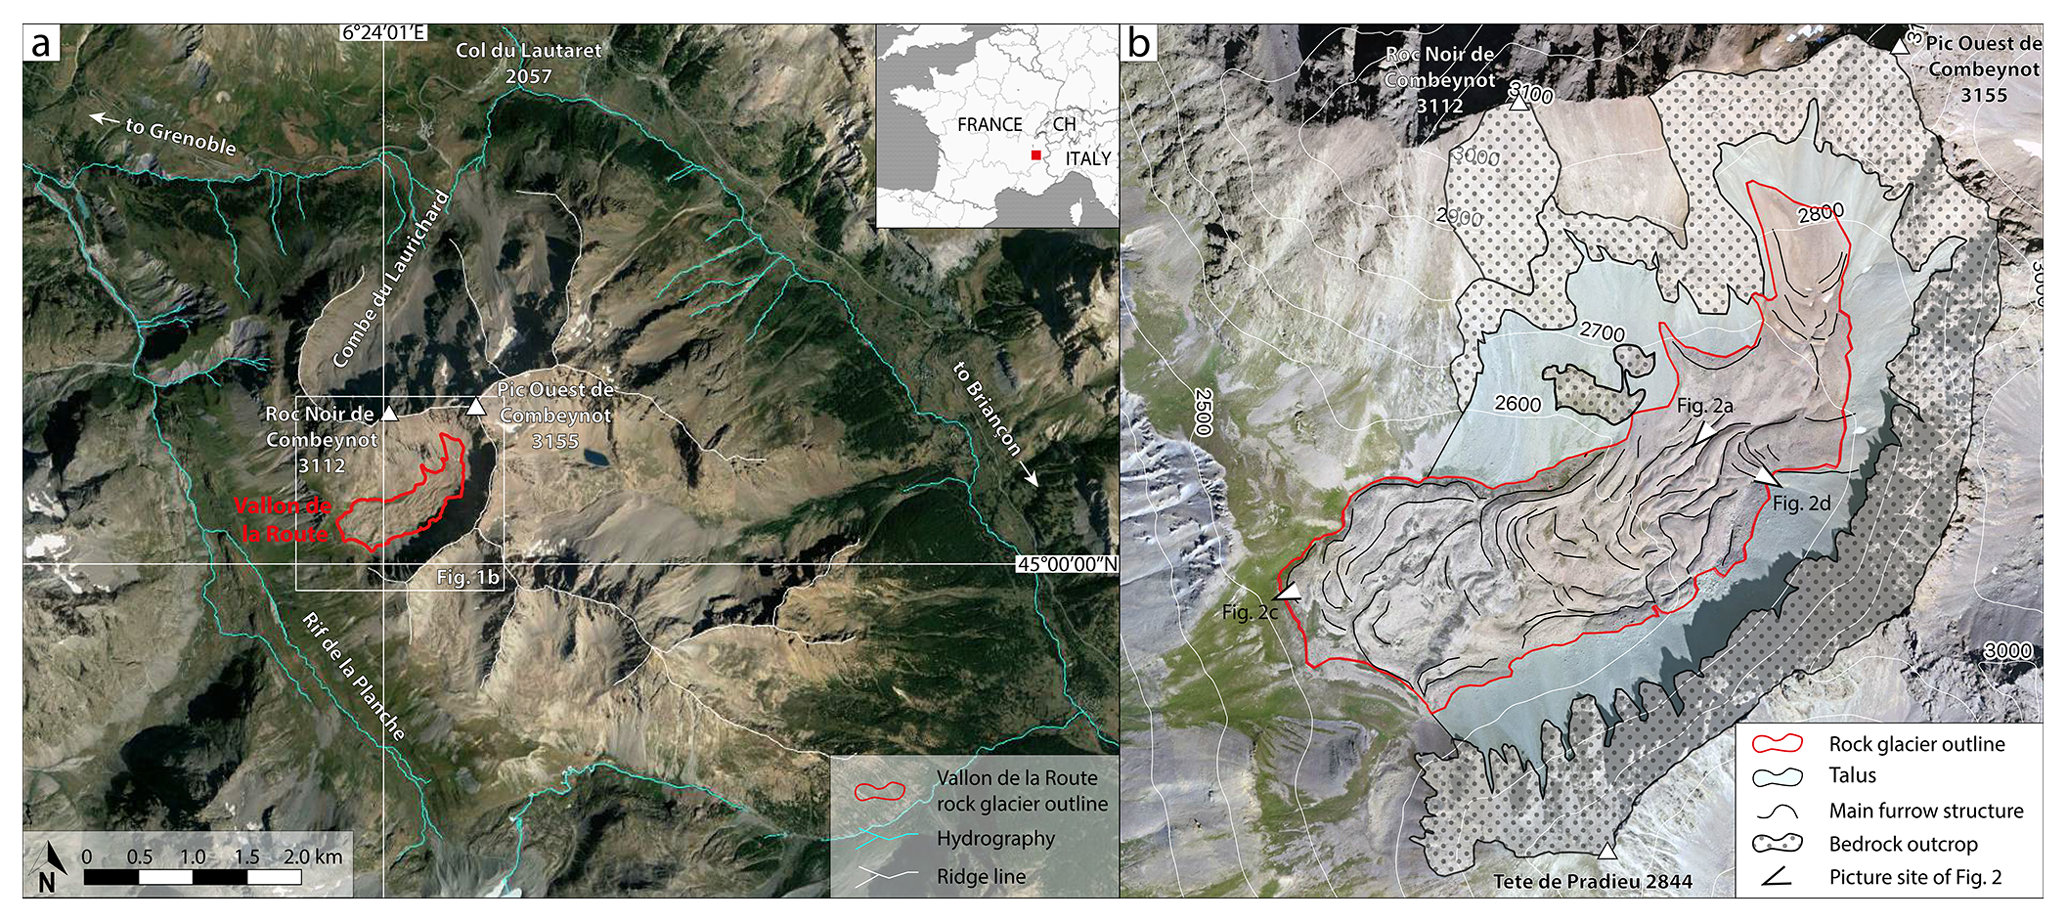
Figure 1(a) Regional map of the Combeynot Massif showing the Vallon de la Route rock glacier and surrounding topography (satellite image from © Google Earth 2020). Outline of the rock glacier (red), hydrography (cyan), and ridge line (white) from Bodin (2007). The inset in (a) shows location of the Vallon de la Route rock glacier within western Europe. (b) Map of the Vallon de la Route rock glacier, with the outline of the rock glacier, the main furrow structures, the outline of the bedrock outcrops (from Bodin, 2007), and the location and orientation of pictures presented in Fig. 2. The satellite image from Bing Aerial © Microsoft.
The Combeynot Massif (45∘0′ N–6∘2′ E) represents the northeastern part of the Ecrins Pelvoux Massif, located in the western French Alps (Fig. 1a). The Ecrins Pelvoux Massif has a high alpine topography, with its highest summit being the only one above 4000 m a.s.l. (Barre des Ecrins, 4101 m a.s.l.) and valley bottoms around 1000–1500 m a.s.l. Widespread U-shaped valley profiles, hanging valleys and glacial trimlines illustrate the imprint of Quaternary glaciations on the massif (Delunel et al., 2010; Valla et al., 2010; Le Roy et al., 2017). Paleo-glacier reconstructions since the Last Glacial Maximum have been previously constrained using mapping, interpolation of glacial features, and TCN dating applied on moraine deposits and glacially polished bedrock surfaces (Delunel, 2010). Evidence for Egesen stadial readvances (the alpine counterpart of the Younger Dryas) have been mapped and dated in several catchments of the massif (e.g., Coûteaux and Edouard, 1987; Charton et al., 2021; Chenet et al., 2016; Hofmann et al., 2019). Based on surface-exposure dating of moraine deposits, glacial advances in the Ecrins Pelvoux Massif have been identified from the Lateglacial to the early Holocene (around 11 ka, Hofmann et al., 2019). Glacial advances during the Neoglacial (from ca. 4.3 ka) have also been reconstructed (Le Roy et al., 2017). Modern glacierized terrain is characterized by small cirque and slope ice bodies, which covered 68.6 km2 in 2009 (Gardent et al., 2014). The two largest valley glaciers remaining today are the Girose Glacier (5.1 km2) and the Glacier Blanc (4.8 km2); most of the other glaciers are cirques or debris-covered glaciers (Gardent et al., 2014; Fig. 1b in Le Roy et al., 2017).
Ranging from 1670 to 3155 m a.s.l., the Combeynot Massif hosts 33 active and transitional rock glacier systems and 38 relict rock glaciers (Bodin, 2013). These landforms range from 2000 to 2850 m a.s.l.; the mean elevation of the rooting zones of active rock glaciers is about 2700 m a.s.l., whereas the mean elevation of their frontal positions is 2620 m a.s.l. (Bodin, 2013). The Laurichard rock glacier, on the northern side of the Combeynot Massif (Fig. 1a), is the site of one of the longest geodetic surveys for surface velocity in the European Alps (since the late 1970s; Francou and Reynaud, 1992; Thibert et al., 2018).
The Combeynot Massif is comprised of a slice of granitic intrusion confined in volcanic–sedimentary gneiss; a flysch layer of the ultra-dauphinoise zone locally covers its eastern side (Barbier et al., 1973). The characteristic macro-crystalline scale fragility of the crystalline bedrock can be related to pre-Hercynian hydrothermal activity. A network of NNW–SSE faults and a high density of diaclases cut the Combeynot Massif, producing meter- and sub-meter-scale jointing of the bedrock (Francou and Reynaud, 1992). Thick superficial deposits (mostly coarse material) are the consequence of gravitational and nivo-periglacial processes (cryoclastic and avalanche activity; Francou, 1982). From a present-day climatic point of view, the Combeynot Massif is located in the transition zone between areas influenced by the Mediterranean climate and areas with a more Atlantic climate. Consequently, the local climatic setting is characterized by western frontal incursions and rainfall coming from the Italian side of the Alps and summer periods with low rainfall (Bodin, 2013). Cusicanqui et al. (2021) have performed weather reanalysis of data provided by the S2M (SAFRAN data from Durand et al., 2009a, b; Vernay et al., 2020). Their results show annual average temperature of 1.3±0.76 ∘C and snowfall of 791±169 mm yr−1 for the period 1958–2018 at the Laurichard site (elevation 2400 m a.s.l., northern exposure, 20∘ slope; Cusicanqui et al., 2021). The average air temperature for the 1958–1990 period is 1.0 against 1.7 ∘C for the period 1991–2018, revealing a change trend of +0.23 ∘C per decade (Cusicanqui et al., 2021). Inversely, the mean number of days of snow cover during winter went from 221 for the 1958–1990 period to 200 for the 1990–2018 period (Cusicanqui et al., 2021).

Figure 2(a) Photograph taken looking toward the NE and a geomorphological interpretation (b) of the rock glacier units III, IV, and V, with bedrock outcrops, talus, ridge, furrow and fronts. (c) Photograph taken looking toward the NEE of the relict unit I and sampled boulder (VR16). (d) Photograph taken looking toward the NW of the ridge I where two different boulders were sampled (VR5 and VR6). Picture locations and orientations are indicated in Fig. 1b.
The Vallon de la Route catchment is occupied by neither debris-free nor debris-covered glaciers, but is sheltering a rock glacier system of about 0.674 km2. The total catchment area is about 4.41 km2, is southwest facing, and ranges from 1960 to 3155 m a.s.l. It is bounded upstream by the highest peaks of the massif, the Tete de Pradieu (2879 m a.s.l.), the Roc Noir de Combeynot (3112 m a.s.l.), and the West Pic of Combeynot (3155 m a.s.l.) and downstream by the torrent of the Rif de la Planche (Fig. 1a and b). The rock glacier system is overhung by a debris source with area of about 5.351×10⁵ m2 composed of leucogranitic bedrock (Fig. 1b). Geoelectrical measurements (performed in 2006) on the rock glacier have shown that the active layer reaches a maximum thickness of 9 m at 2630 m a.s.l. and that the ice-rich layer does not exceed 15 m and may consist of ice-cemented debris, with occasional layers of higher ice content (Bodin, 2013). The rock glacier system of the Vallon de la Route (Fig. 1) was chosen because it presents the ideal attributes of a rock glacier for this study, namely (i) it has an active snout and sharp edges, (ii) its total length is on the order of 1 km long (with both (i) and (ii) allowing remote sensing analysis), (iii) it is located in the middle of a valley (to be able to identify from where debris are coming from), and (iv) it has one single bedrock type in the headwall source (i.e., leucogranite allowing the use of TCN dating).
A multi-method approach combining geomorphological mapping and identification, remote sensing, and geochronology was used to reconstruct the history of activity of the rock glacier system of the Vallon de la Route (Combeynot Massif, western French Alps).
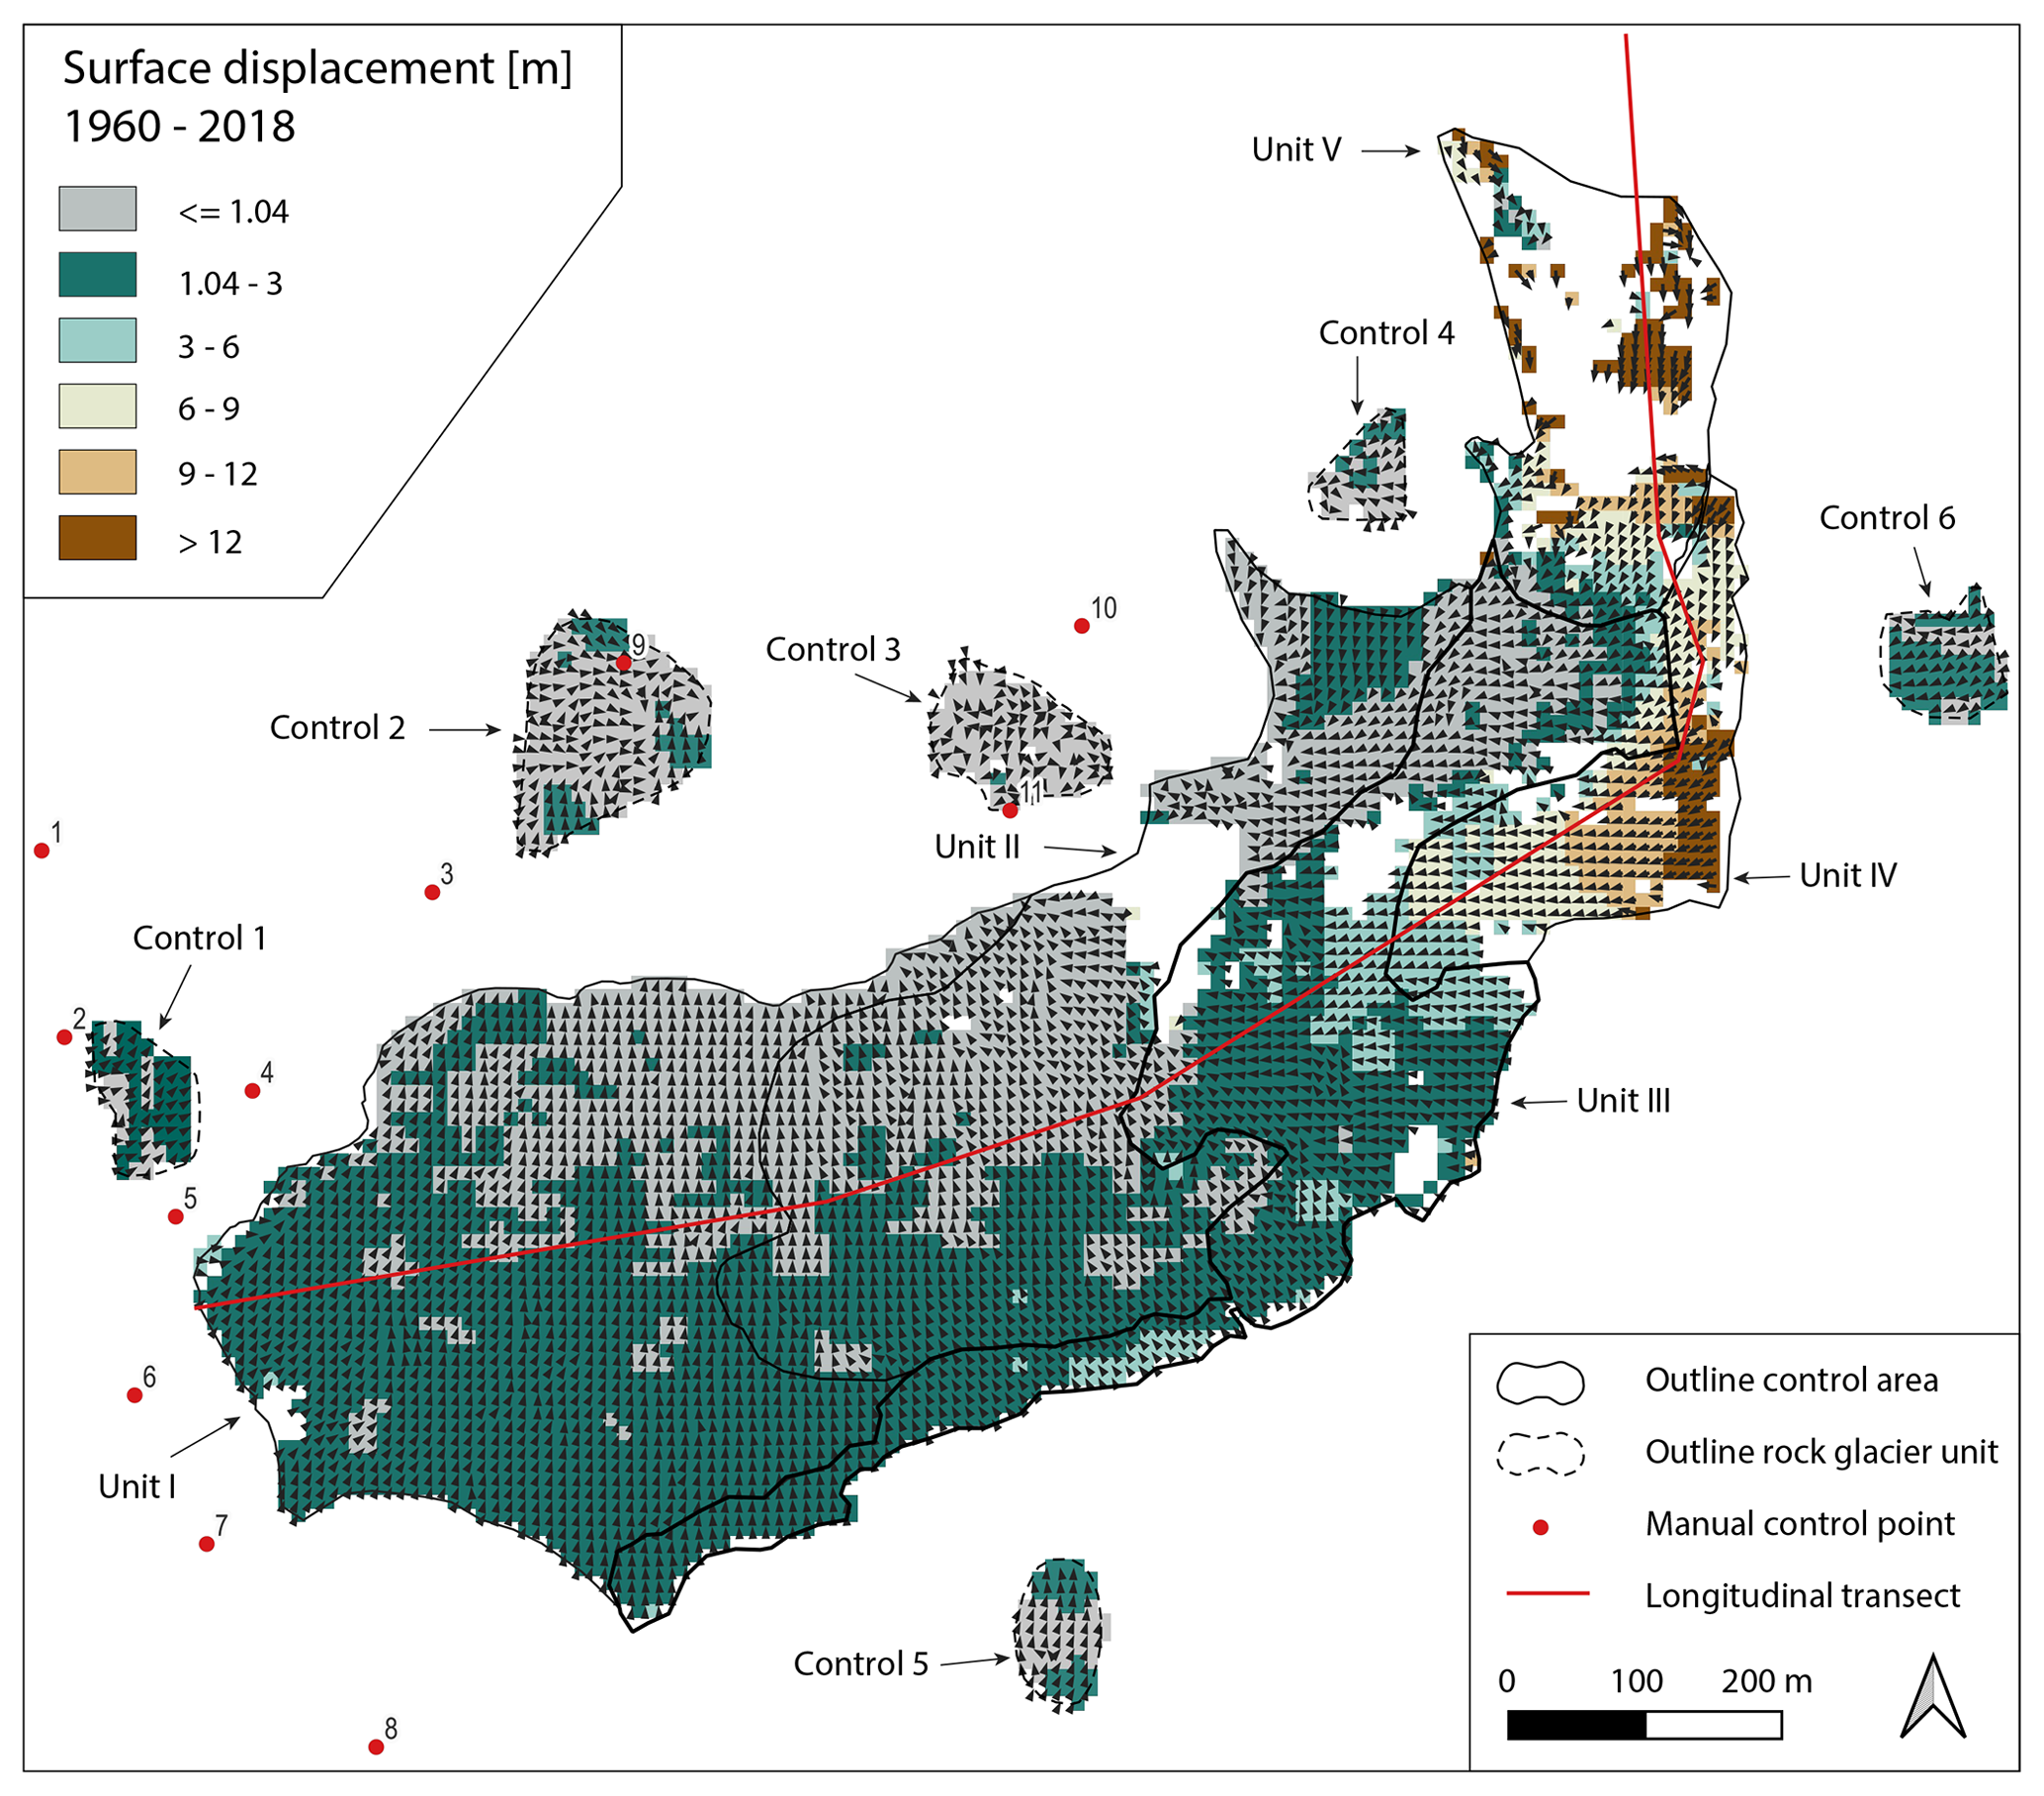
Figure 3Surface displacement map (1960–2018) of the Vallon de la Route rock glacier. The red line is the longitudinal transect used to extract surface displacement (Fig. 5a). The solid black lines outline the different units of the rock glacier system. The dashed black line delimits the stable terrain control areas, and the red dots show the locations of the manual control points used to quantify uncertainties in the image correlation. Non-mapped areas are the result of the filtering process as described in Sect. 3.1.3.
3.1 Geomorphological mapping and identification and image correlation
3.1.1 Geomorphological mapping and identification
Geomorphological recognition was performed using the protocol described in the “Towards standard guidelines for inventorying rock glaciers, Baseline concepts” document of the International Permafrost Association Action group for rock glacier inventories and kinematics (Delanoye and Echelard, 2020). In situ visual inspection, such as observation of the steepness of the front, description of ridge and furrow topography, and size and shape distribution of the debris cover, was performed alongside a high-resolution lidar digital surface model (DSM, 0.5 m resolution) survey realized by SINTEGRA and landscape image analysis to geomorphologically classify the different landforms and their connection with each other. Five units (I, II, III, IV, and V) were identified from bottom to top according to in situ geomorphological observations such as their elevation, slope, vegetation cover, continuity, and the apparent activity of their landforms (elevation, average slope, and covered area were determined using the 0.5 m lidar high-resolution DSM; Figs. 1–4). Units are separated by either ridge and furrow topography or front, which are the expression of the gravity-driven buckle folding of rock glacier morphology (Frehner et al., 2015). In the present study, we focus our sampling strategy on 13 ridges annotated using the letters A to M (Table 1 and Figs. 2 and 6).
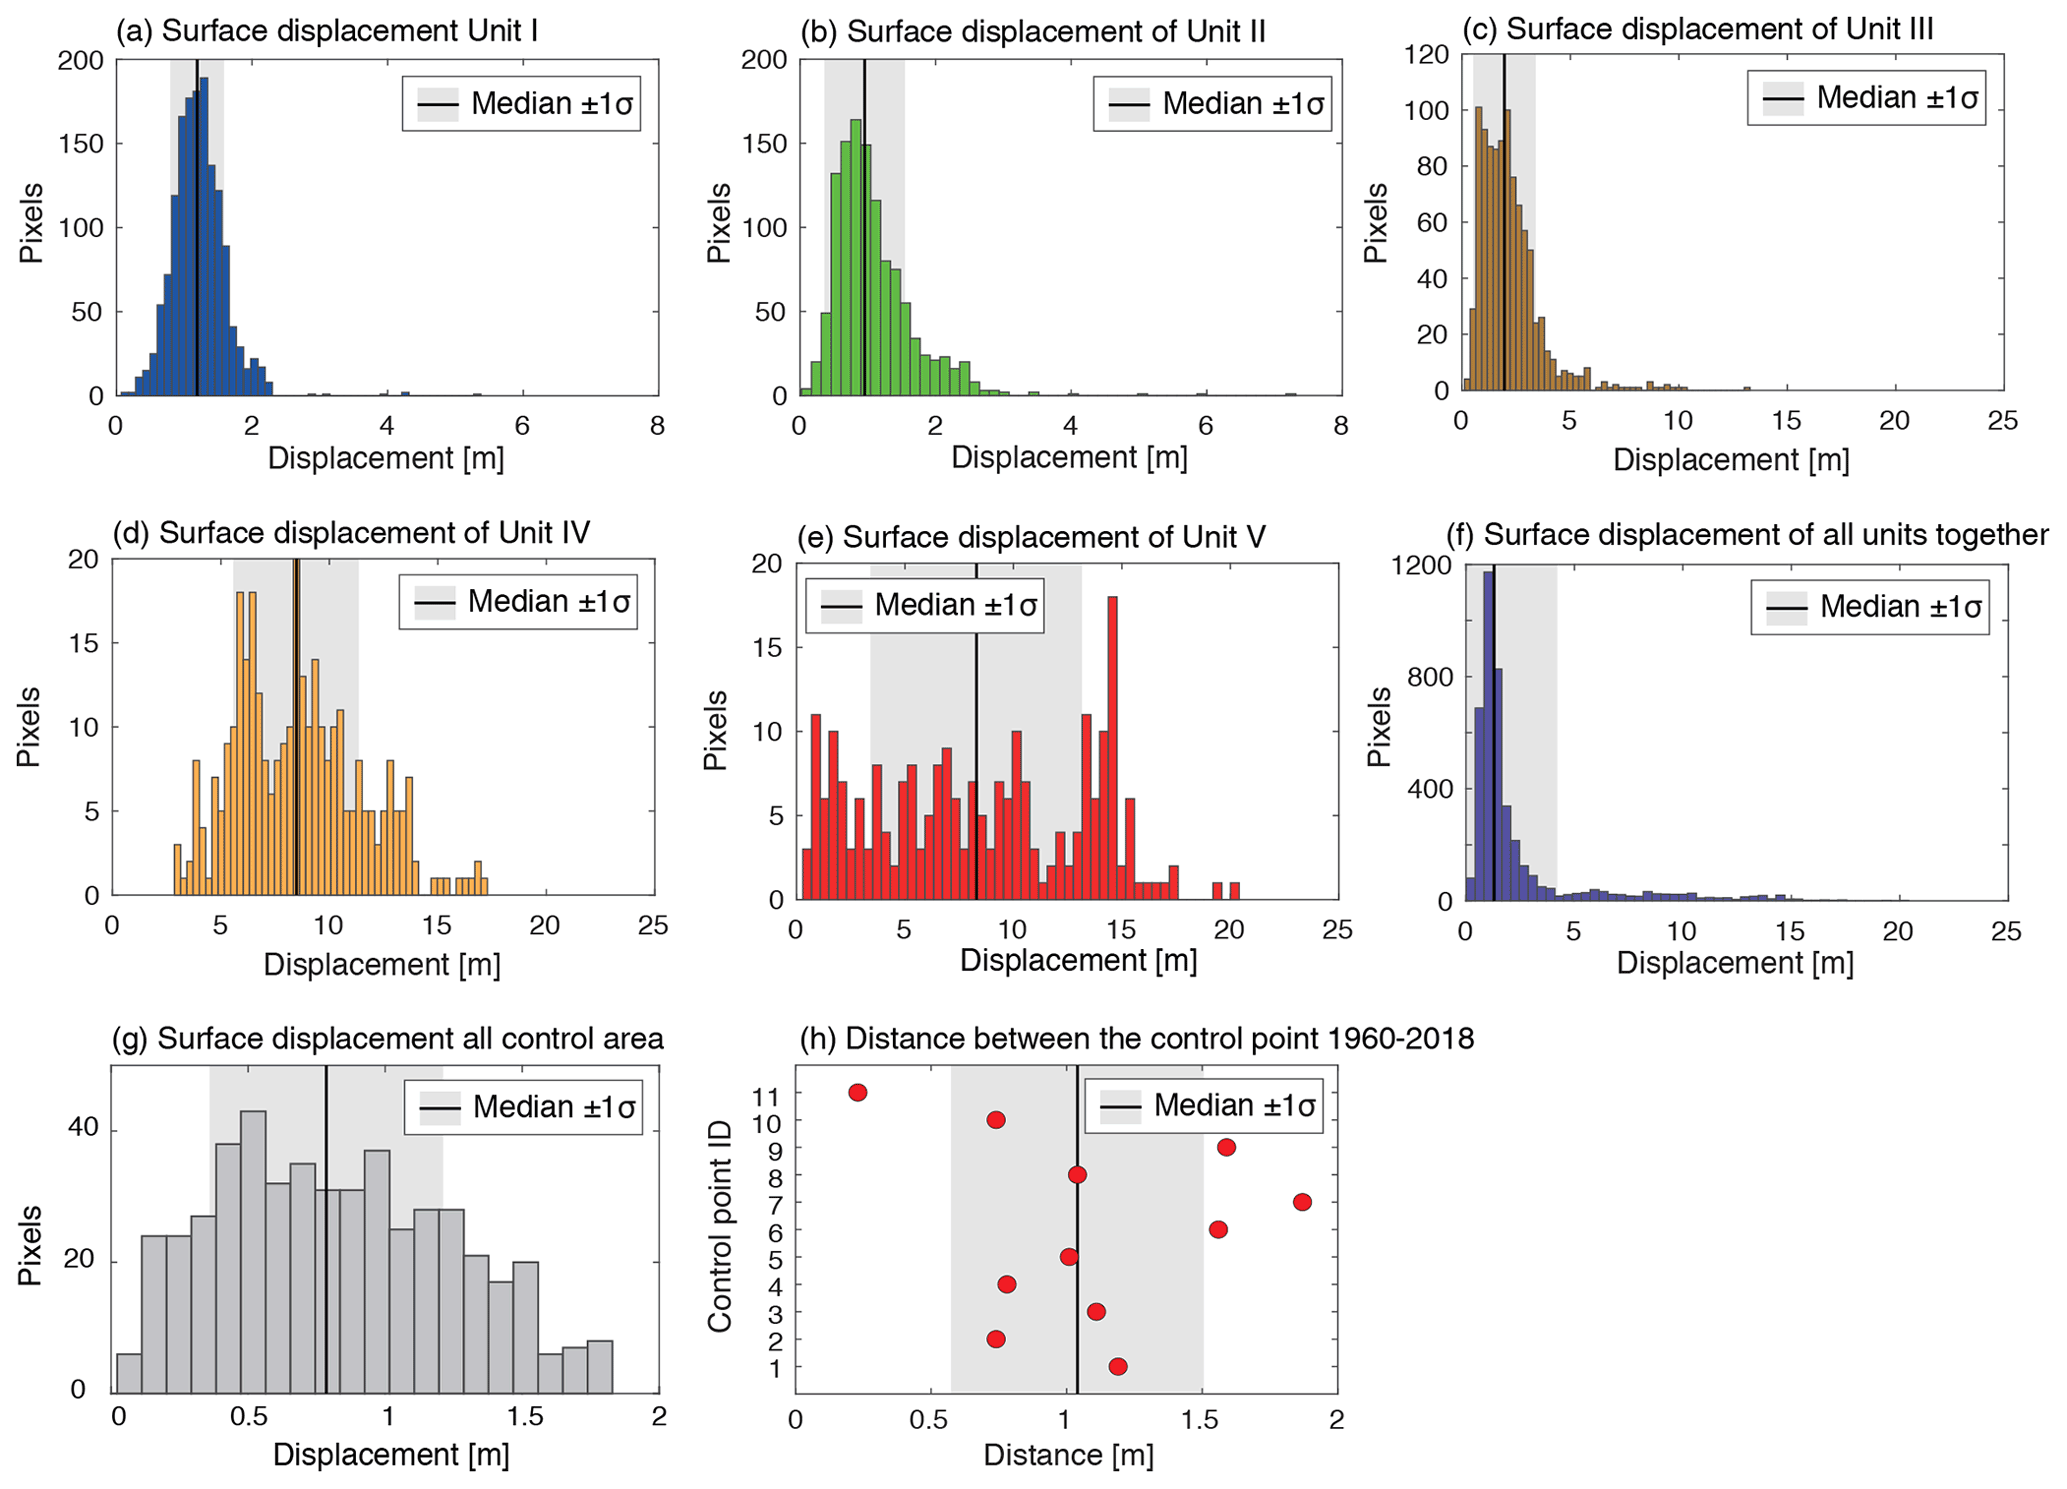
Figure 4(a–f) Histograms of the surface displacements and median (±1σ) values extracted for each unit area and the entire rock glacier. (g) Histograms of the surface displacements and median (±1σ) values extracted from the entire control areas as shown in Figs. 3 and A1. Independent histograms of surface displacement values for each control area are presented in Fig. A3. (h) Distance between the two orthomosaics (1960 and 2018) manually estimated using a control point (stable features) as shown in Figs. 3 and A1 and Table 2.
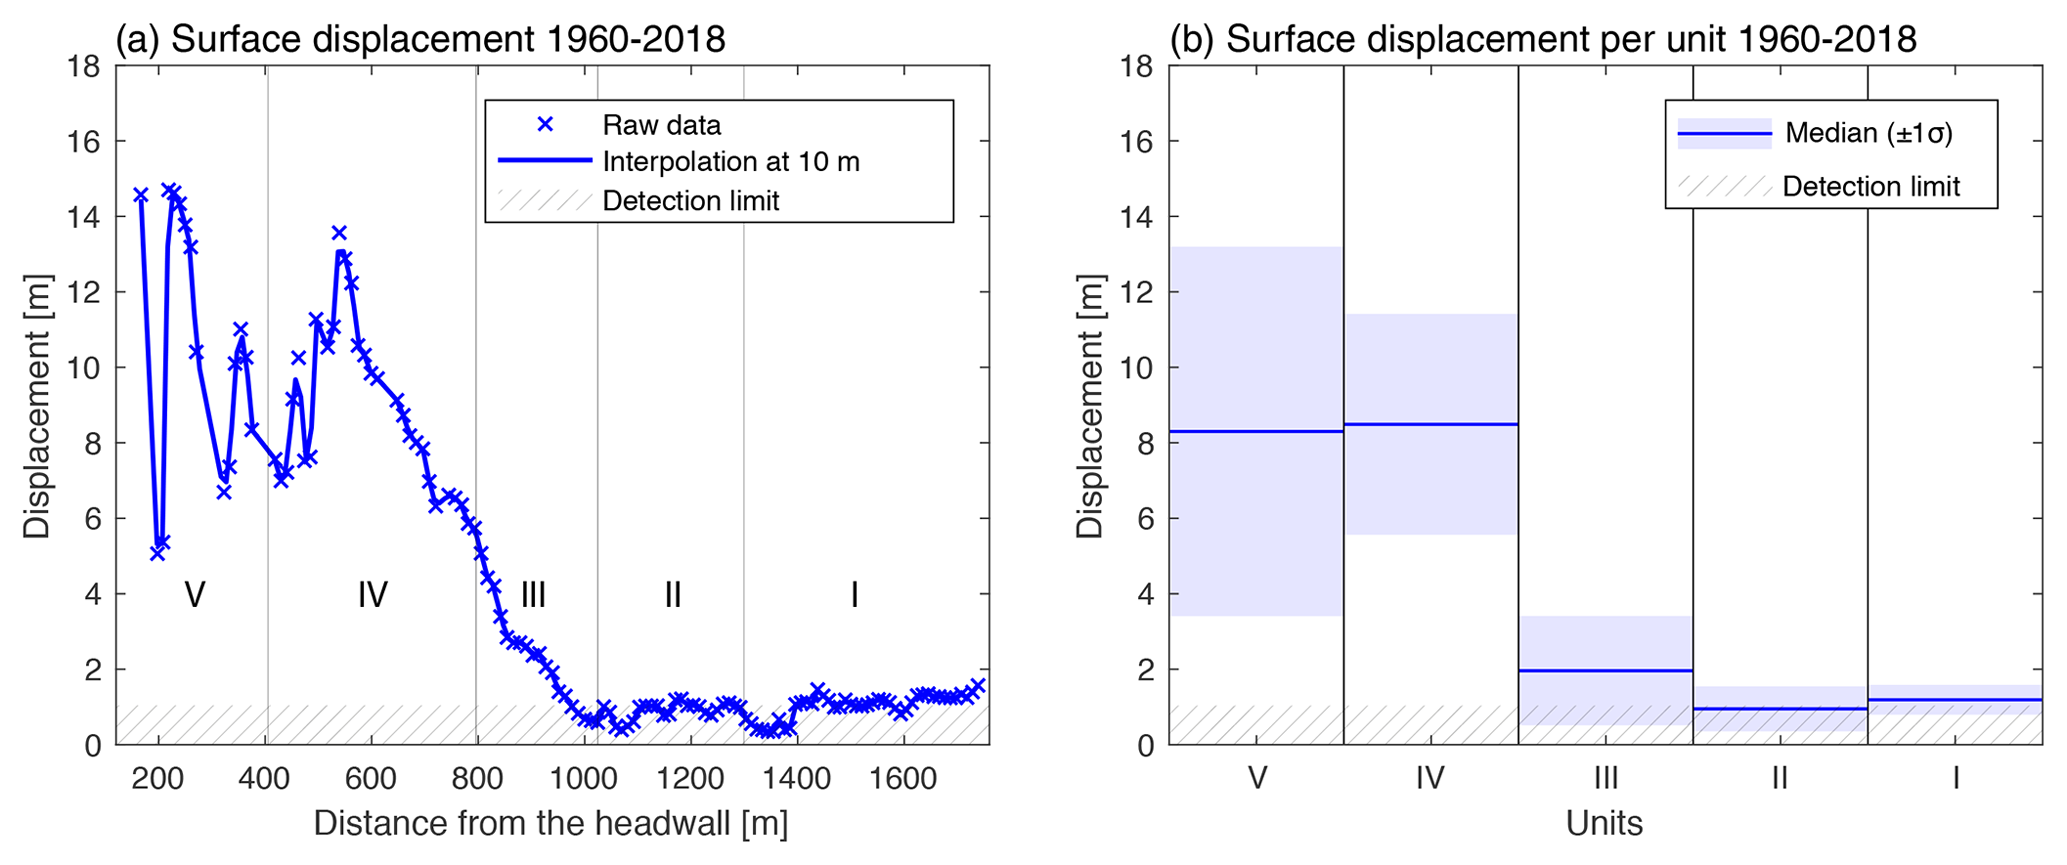
Figure 5(a) Surface displacement (1960–2018) extracted following the longitudinal transect (red line in Fig. 3) with identification of units I to V. The blue line represents the 10 m interpolation of the raw data. (b) Median surface displacement in each rock glacier unit with its ±1σ variability (see Fig. 4 for histograms). The cross-hatched pattern represents the detection limit defined by median value of the control areas (Fig. 4) used as a threshold value for detection of rock glacier surface displacement.
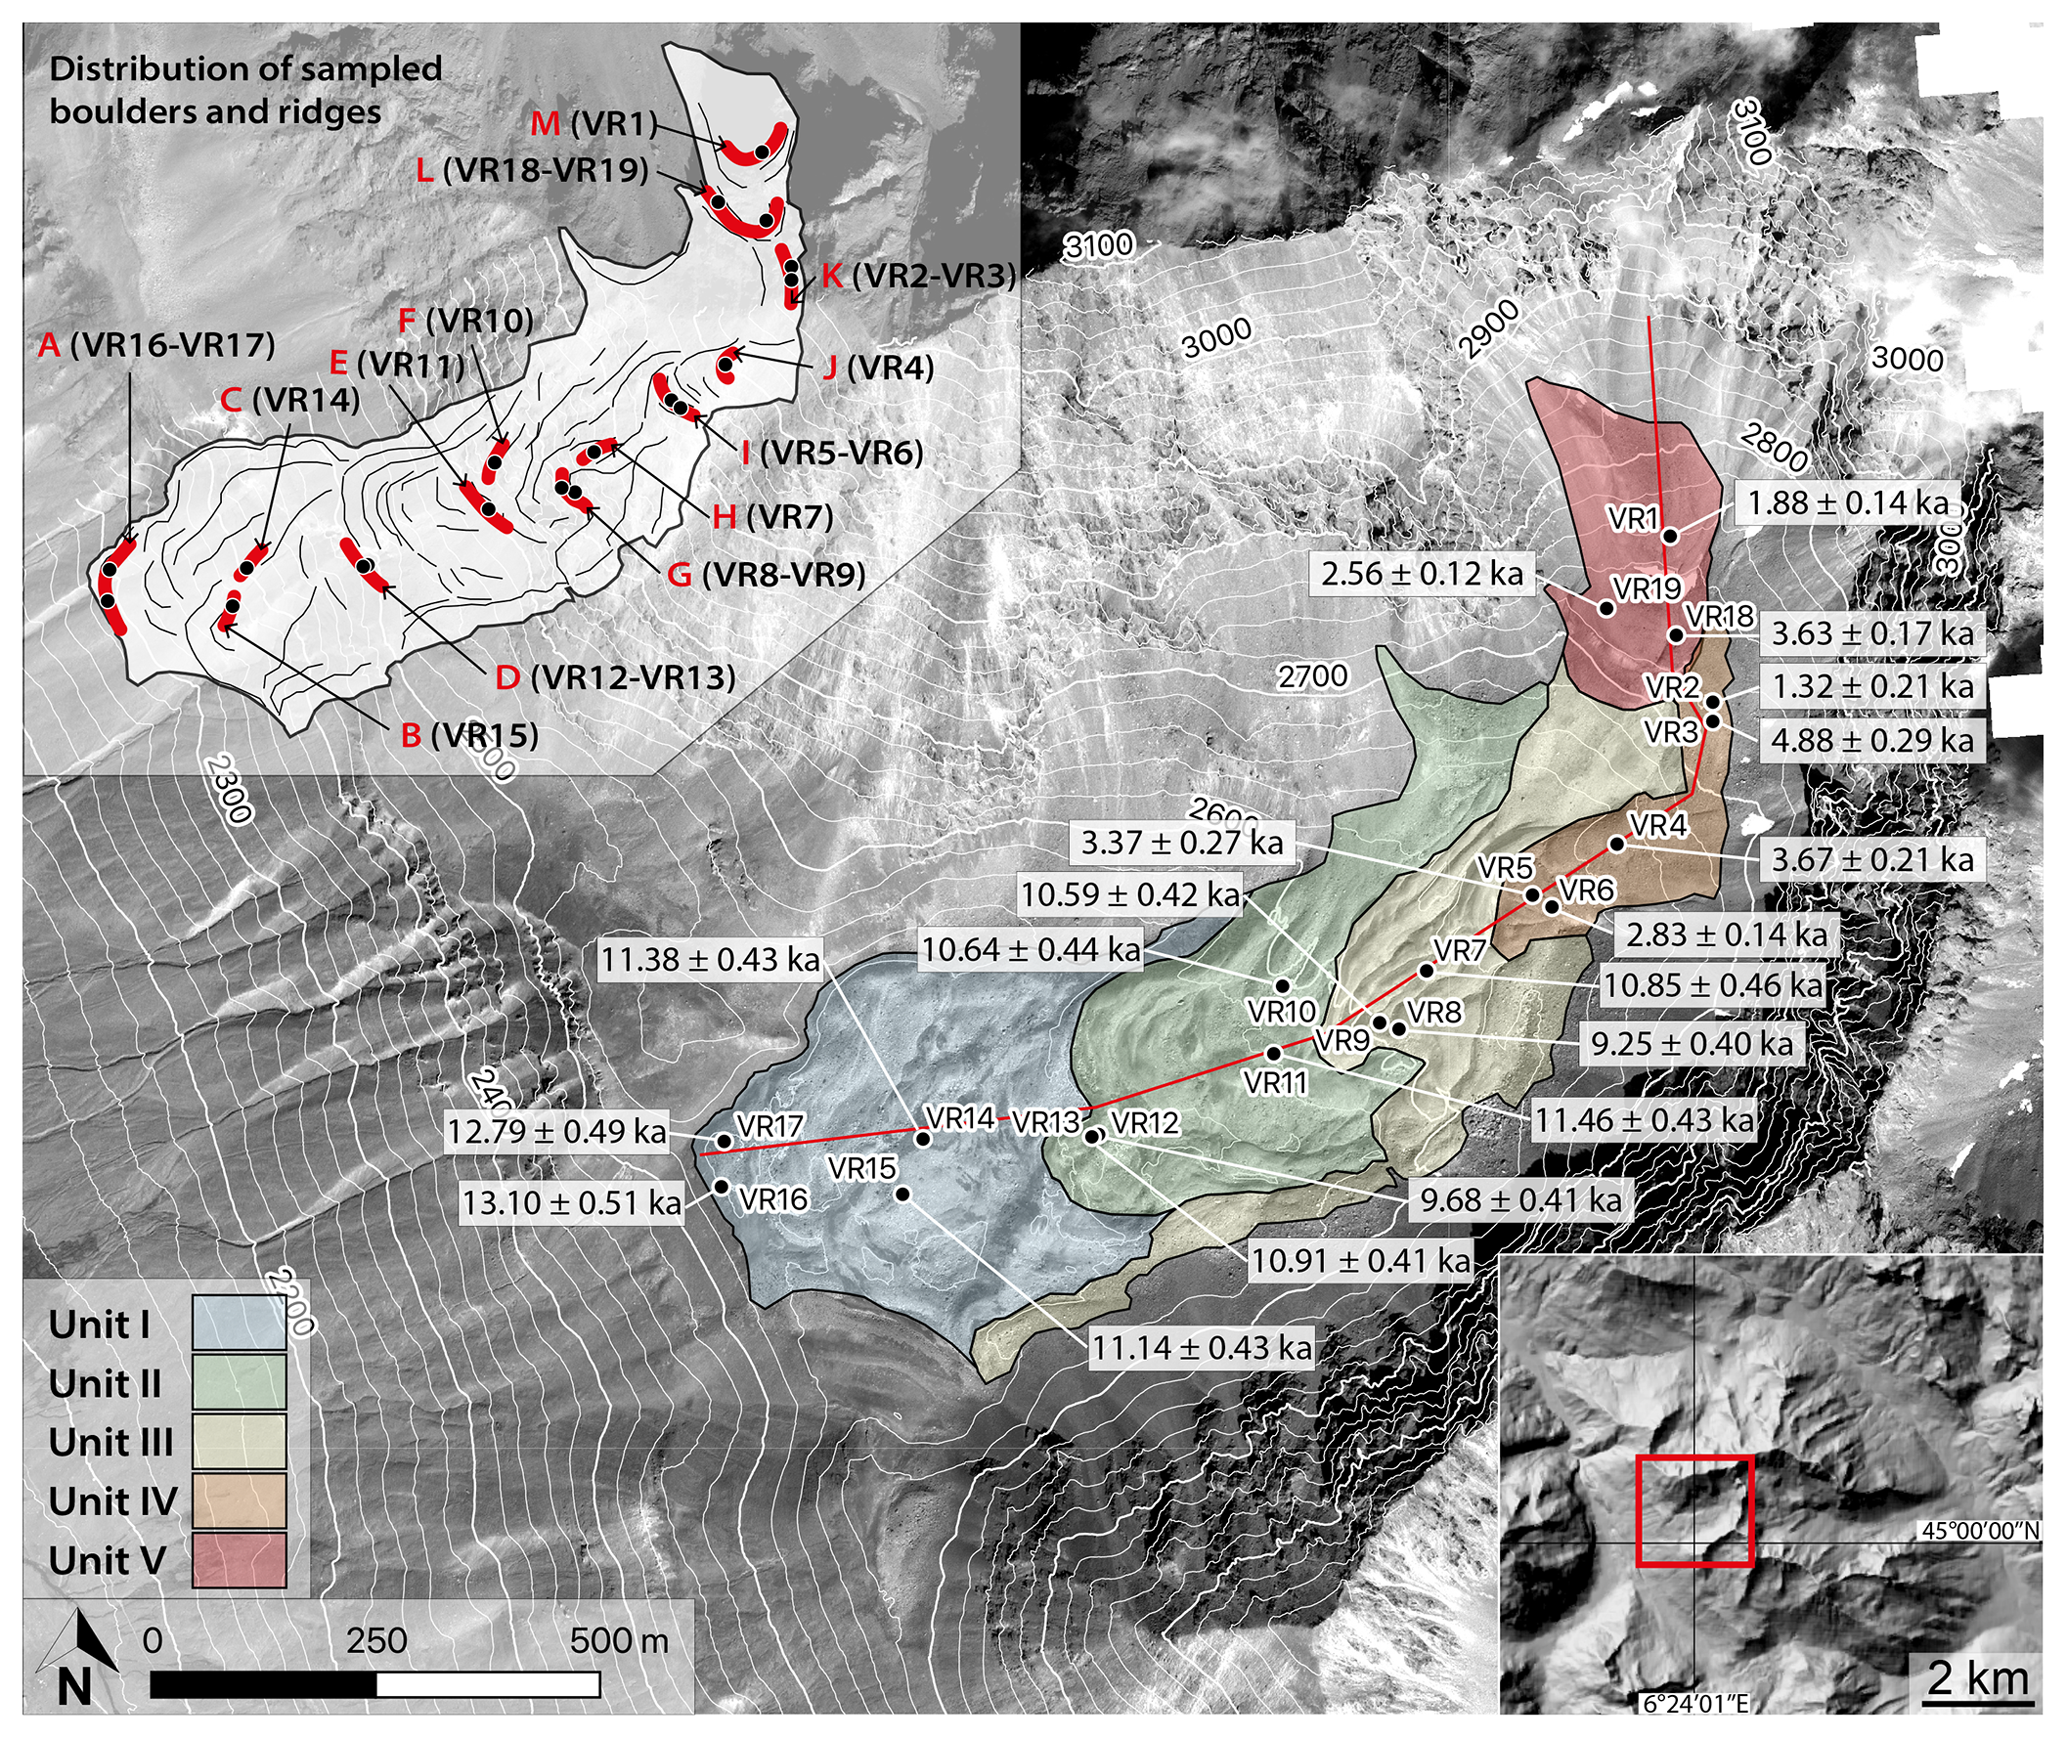
Figure 6Map of the Vallon de la Route rock glacier, with units and sample locations. The hillshade DEM in the inset has been produced from a high-resolution lidar DSM (0.5 m resolution) survey realized by SINTEGRA (17 August 2012); the white lines show elevation isolines derived from the same data. The red line is the longitudinal transect used to extract surface displacement (Fig. 5a). Individual 10Be surface-exposure ages are shown with 1 standard deviation (Table 2). The lower-right inset shows the location of the study area within the Combeynot Massif (red box). The upper-left inset shows the samples (black dots) and ridges (red lines) distributed over the main furrow structures (black lines). The background is the orthomosaic of 2018 computed using a tri-stereo Pléaides 0.7 m acquisition.
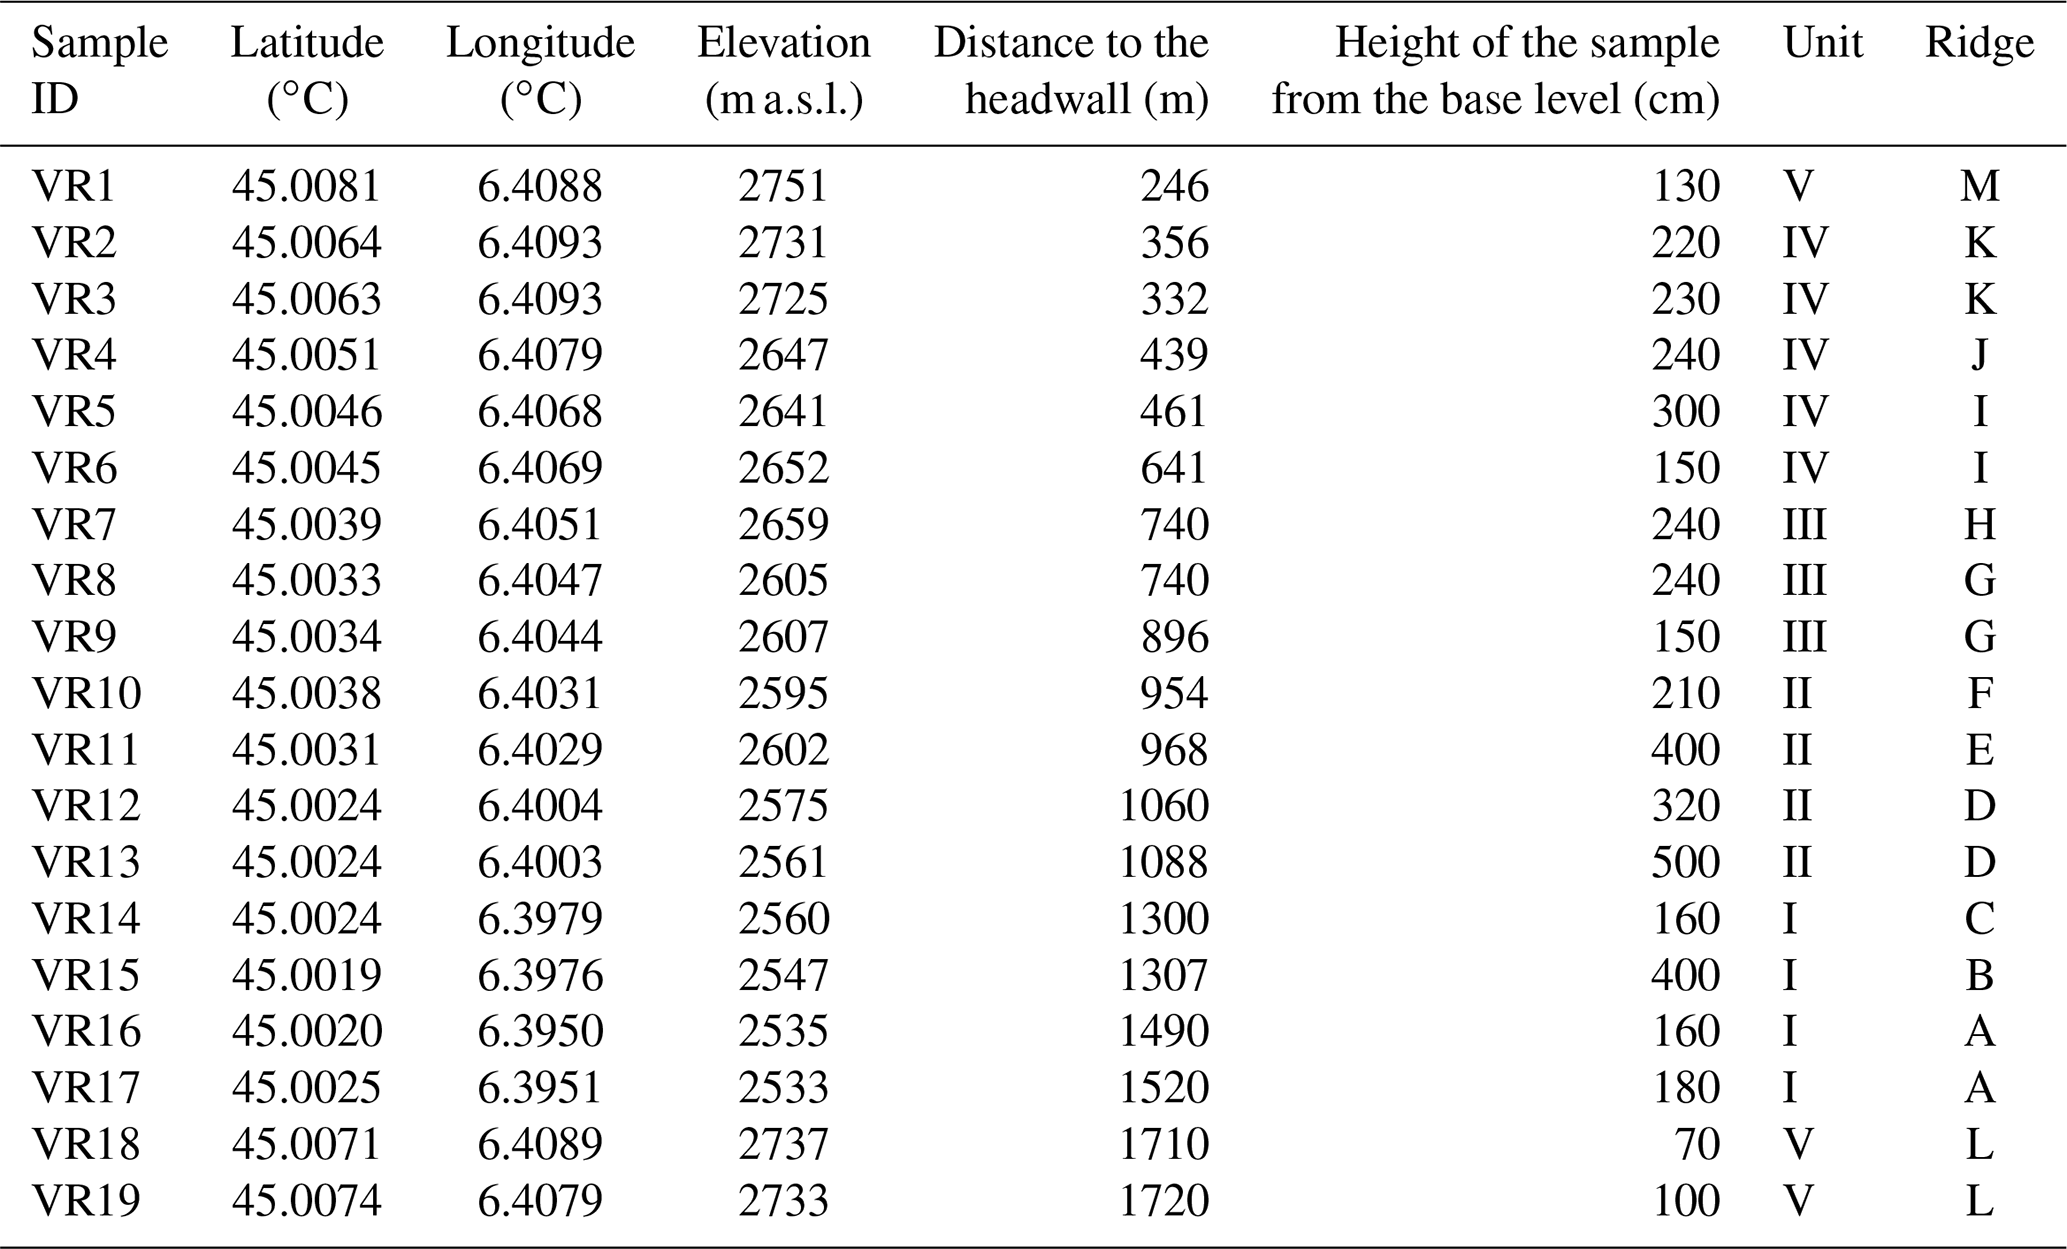
Table 1Geographic details within the rock glacier system of the Vallon de la Route (Combeynot Massif, France) of the samples collected for 10Be surface-exposure dating. Units represent areas of the rock glacier that have been defined geomorphologically. Ridges are also indicated (Fig. 3); for six of the ridges, two replicate boulders have been sampled. Ridge codes go from A at the lowest elevation to M at the highest elevation. The distance to the headwall has been measured following the center line of the rock glacier starting at the foot of the headwall (red line in Figs. 3 and 6).
3.1.2 Orthomosaic production
The reconstruction of the rock glacier surface displacement over decadal timescales is done using image correlation protocol between different orthomosaics. Here, we compared time series of two different orthomosaics (1960 and 2018). The oldest one is built from three historical aerial photographs acquired on 22 August 1960 and distributed by the French National Institute of Geographic Information and Forestry (IGN, https://remonterletemps.ign.fr/, last access: 15 April 2022) as black and white images of the original scanned films, with an average ground resolution of 0.59 m. The processing of those three images is based on the structure-from-motion and multi-view stereo photogrammetry approach implemented into the Agisoft Metashape software. The orthomosaic of 2018 was computed using tri-stereo Pléaides 0.7 m resolution acquisition (acquired on 12 August 2018) and an Ames Stereo Pipeline (ASP) (Shean et al., 2016) without ground control points (GCPs). ASP uses rational polynomial coefficients (RPCs) provided with the Pléaides images, eliminating the requirement of many high-accuracy GCPs. The 1960 orthomosaics were computed with Agisoft Metashape (version 1.6) software using 14 GCPs with coordinates collected from the IGN map service (https://www.geoportail.gouv.fr/, last access: 15 April 2022) and elevations using a high-resolution lidar DSM (0.5 m resolution) survey realized by SINTEGRA (17 August 2012). Details about the coordinates of the GCPs are given in Fig. A1 and Table A1. As the 2018 orthomosaic presented slight shifts due to processing without GCPs, the corresponding DSMs were then co-registered using a previous lidar high-resolution DSM and following the Nuth and Kääb (2011) methodology. Consequently, orthomosaics were then also shifted (translation only) with co-registration values (x and y displacements). All original orthomosaics were resampled at a 0.5 m resolution and set in a common 3465 pixel by 3541 pixel grid system.
3.1.3 Image correlation for surface displacement measurement
The 2D displacements of the rock glacier between orthomosaic pairs (1960 and 2018) were computed using the IMCORR module within the SAGA toolbox in QGIS (Scambos et al., 1992). The feature-tracking algorithm retrieves pixel patterns between two georeferenced images and attempts to match small subscenes (called “chips”) and produce shapefiles (points and lines) containing the 2D surface displacements. The program uses a normalized cross-covariance method based on a fast Fourier transform (Scambos et al., 1992). In the present study, several parameters of the algorithm were tested before settling on the following parameters: a search chip size of 128 pixels, a reference chip size of 64 pixels, and a grid space of 10 m.
The obtained surface displacements were first filtered with a threshold of 100 pixels for error on x- and y-direction estimates (IMCORR xerr and yerr values) removing about 1 % of the initial values. We then manually filtered according to (i) different local spatial coverage and artifacts (e.g., related to random local similarity of the coarse blocky surface; Bodin et al., 2018), (ii) lack of consistency of the displacement between neighboring vectors (difference > 30∘), and (iii) outlier displacement values (Cusicanqui et al., 2021). Finally, 5.4 % of the points were removed. The ±1σ variability is calculated using all the pixels for each unit together with the median displacement. The quality of the results mentioned above is assessed through two analyses. First, the displacements obtained on the rock glacier system are compared to the measured displacements of six control areas where no displacement should be observed. Details of those control areas are given in Figs. 3, A1, and A2 and Table A3. These control areas were chosen to be outside of and around the rock glacier system and out of the scree field. The absence of movement (solifluction, creeping, landsliding) was determined by visually inspecting historical aerial photographs collected from the IGN-France and the two orthomosaics. Next, the potential mismatches between 11 control points in the two orthomosaics were manually measured. These manual control points were chosen based on topographic features of the surface of our studied area (blocks, cliff structures), and their stability was estimated using the historical aerial photographs collected from the IGN-France.
3.2 10Be surface-exposure dating
TCN surface-exposure dating is based on the observation that when cosmic rays reach the Earth's surface, they produce cosmogenic isotopes in specific targets, such as the production of Beryllium-10 (10Be) in quartz minerals (e.g., Gosse and Phillips, 2001; Lifton et al., 2014). The in situ production of 10Be in quartz occurs predominantly within a few meters of Earth's surface and decreases exponentially with depth, such that by knowing a measured concentration of 10Be in the first centimeter of a rock surface and the local production rate of 10Be in such a rock, it is possible to calculate an apparent surface-exposure age (Portenga and Bierman, 2011). In this section, we detail how samples were collected, prepared, and analyzed, and we explain how external processes affecting the dataset can be estimated.
3.2.1 Sampling
The samples were collected with approximately 0.5 kg of rock material from the 13 ridges of interest (Tables 1 and 2; Fig. 6). For six of these ridges (A, D, G, I, K and L, Table 1 and Fig. 6), two different boulders were sampled to evaluate the reproducibility of our dating approach (Fig. 2c). The boulders were chosen following the central flow line, which was defined to be both at the center of the rock glacier width and perpendicular to the main ridge and furrow topography (red lines in Figs. 3 and 6) from the terminus to the high-elevation active lobes of the rock glacier system. Sampled boulders were chosen on the top of the ridges to minimize topographic shielding, snow-cover effect, and complex exposure histories (i.e., sediment or clast cover and late exhumation; Fig. 2c and d). Suitable boulders are large (>1.5 m) and in a stable position (Fig. 2c and d). Appropriate rock surfaces do not show signs of intense weathering or recent chipping. Sampling was done using a hammer, chisel, and small electric circular saw over 4 d (28 September–1 October 2020). The sampling details of each rock boulder, including coordinates, elevation, distance to the headwall, height of the sample from the ground, size of the boulder, and topographical shielding are summarized in Tables 1 and 2.
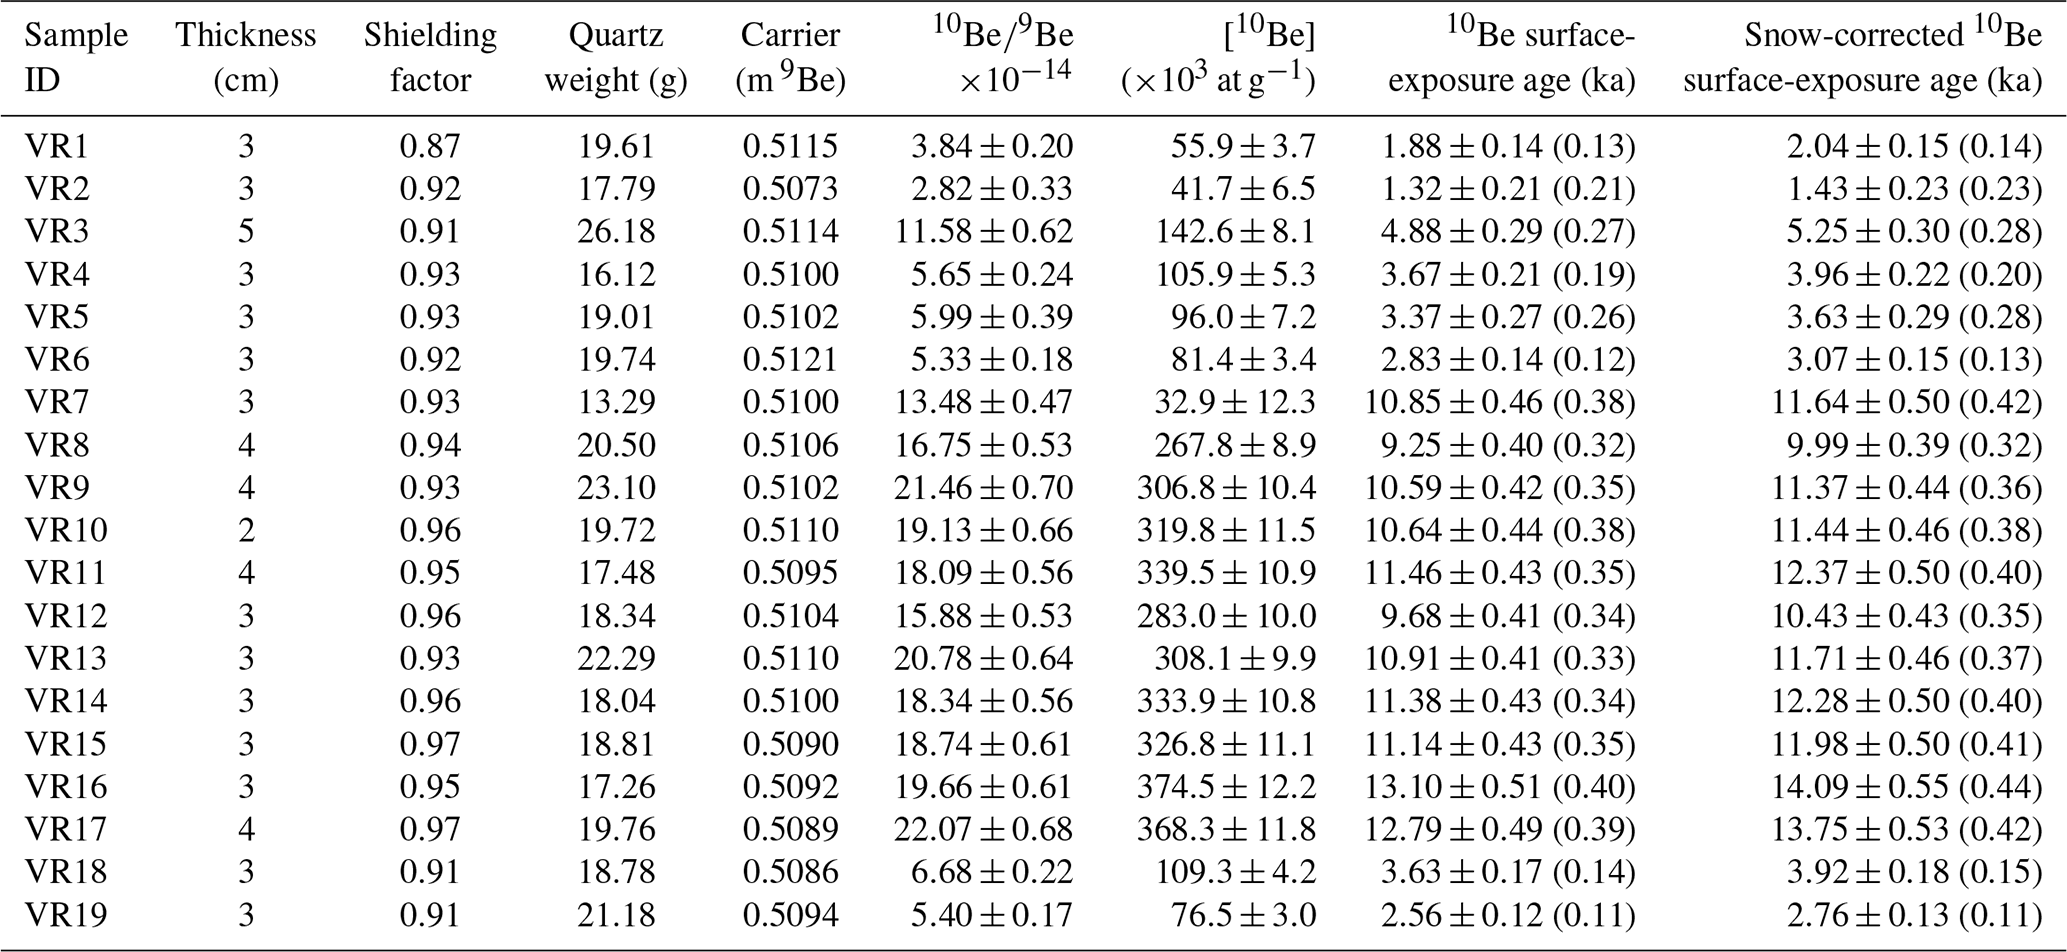
Table 2Sample details, analytical data related to 10Be measurements and surface-exposure ages for the rock glacier system of the Vallon de la Route (Combeynot Massif, France), and inputs for the CREp (Cosmic Ray Exposure program) calculator (https://crep.otelo.univ-lorraine.fr/, last access: 3 March 2022; Martin et al., 2017). We used the production rate (4.16±0.10 at g−1 a−1) derived by Claude et al. (2014) at the Chironico landslide site. The 10Be surface-exposure ages are presented with ±1σ external error and ±1σ internal error (in brackets). Shielding correction includes the topographic shielding due to the surrounding landscape, and the dip of the sampled surface is calculated with the CRONUS-Earth online calculators (Balco et al., 2008, http://hess.ess.washington.edu/math, last access: 3 March 2022). The density of the rock boulder samples is assumed to be 2.75 g cm−3. The 10Be concentrations were corrected with a blank ratio of . Snow cover correction was calculated using the Gosse and Phillips (2001) equation with a snow density of 0.3 g cm−3, an attenuation length for fast neutrons in snow of 150 g cm−2, and a cover of 50 cm of snow for 6 months of the year.
3.2.2 TCN preparation and 10Be measurement
Samples were crushed and sieved to retain the 200–500 µm grain size fraction. Beryllium extraction was performed at the GTC platform (ISTerre, France) using a chemical protocol adapted from Brown et al. (1991) and Merchel and Herpers (1999). Magnetic separation was used to isolate the quartz fraction, followed by successive leaching in an mixture. In order to speed up the purification of quartz and save leaching cycles, magnetic separation with fine magnetite powder was performed between leaching cycles to remove partially altered minerals. Meteoric Be purification was achieved with three sequential dissolutions using diluted hydrofluoric acid (HF; Kohl and Nishiizumi, 1992). The purified quartz samples (13–26 g for each individual sample) were completely dissolved in concentrated HF after being spiked with ∼510 mg of a 998 mg L−1 Be carrier solution (Scharlab ICP Standard, batch 16107901) to fix the ratio (Table 2). After HF evaporation, perchloric and nitric acids were added and evaporated to remove organic compounds and fluorides. Beryllium was extracted by successive alkaline precipitations of Be(OH)2 alternated with separation on anion and cation columns. Samples were then oxidized at 700 ∘C for 1 h, and the final BeO mixture was mixed with Nb powder and loaded into nickel cathodes. The 10Be concentrations were measured at ASTER national facility (Cerege, France) against standard BeO_STD-11 (; Braucher et al., 2013) and were corrected for the full process blank with a ratio of .
3.2.3 Surface-exposure age calculation
Surface-exposure ages were computed with the CREp online calculator (Martin et al., 2017) using the Lifton–Sato–Dunai (LSD) scaling scheme (Lifton et al., 2014), the ERA40 atmospheric model (Uppala et al., 2005) and the Lifton VDM 2016 geomagnetic database (Pavón-Carrasco et al., 2014). We used the Chironico landslide production rate (with high-latitude sea level value of 4.16±0.10 atoms per gram per year; Claude et al., 2014), scaled according to the sample longitude, latitude, and elevation.
The production rate was corrected for sample thickness (Table 2) and density (2.75 g cm−3). Shielding correction includes the topographic shielding due to surrounding landscape and the dip of the sampled surface calculated with the CRONUS-Earth online calculator (Balco et al., 2008; http://hess.ess.washington.edu/math, last access: 3 March 2022). In addition, we explore the influence of snow cover attenuation using the Gosse and Phillips (2001) equation with a snow density of 0.3 g cm−3 and an attenuation length for fast neutrons in snow of 150 g cm−2 (Delunel et al., 2014). According to a previous study that dated a rock avalanche less than 1 km north of our site (Chenet et al., 2016), we use an estimate of 50 cm cover of snow for 6 months of the year, the values that are most often cited in the literature for the Alpine regions for these altitudes (Hormes et al., 2008; Ivy-Ochs et al., 2006; Kelly et al., 2004; Schindelwig et al., 2012; Wirsig et al., 2016; Chenet et al., 2016).
3.2.4 Inheritance and pre-exposure estimation
The measured 10Be concentrations of rock glacier boulder surfaces should always be interpreted with caution as multiple external processes can affect them. Surface erosion can cause a depletion of 10Be concentration at the rock boulder surface, as can complex exposure histories (discontinuous exposure, snow and sediment cover), both of which would lead to an underestimation of the “accurate” 10Be surface-exposure age. Note that in this study we do not consider the effect of boulder surface erosion; consequently, our reported 10Be surface-exposure ages must be seen as minimum estimates. On the other hand, inheritance (i.e., headwall pre-exposure before rock collapse on the rock glacier) will lead to overestimation of the 10Be surface-exposure age. We choose two approaches to quantify the potential inheritance and pre-exposure bias. The first one is to use linear regression between 10Be surface-exposure age and distance to the headwall. Without inheritance, boulders located at the contact between the headwall and the talus slope (distance to the headwall equals to zero) should have a negligible 10Be concentration. Any 10Be concentration given by linear regression at the headwall would be interpreted as time spent (inheritance) in the cliff before the rockfall event. The second approach is to compare the 10Be concentration of samples collected on the same ridge. Any difference in 10Be concentration could be interpreted as a difference in time spent on the cliff face before the rockfall event. In this case, the inheritance time is calculated using the 10Be concentration difference between replicates using the 10Be production rate at the elevation of 2997 m a.s.l. (corresponding to the middle elevation of the cliff source).
3.3 Surface velocity estimation
Armed with both geochronological and remote sensing datasets, the time-averaged surface velocity of the rock glacier system can be estimated. When considering 10Be surface-exposure dating, the mean surface speeds are calculated by dividing the distance to the headwall of either the individual sample or the unit (mean distance to the headwall evaluated at all pixels inside within the unit limits) by their corresponding individual or median 10Be surface-exposure ages. Here we assumed that the 10Be surface-exposure age represents exposure between the time of the rockfall event that delivered the block to the surface of the headwall and talus transition and its arrival at the sample site. In contrast, the modern velocities derived from remote sensing analysis are calculated by dividing the measured displacement or the median values for each unit by the time between the two orthomosaics, in this case 58 years (1960–2018 period).
According to the geomorphological mapping and identification approach described in Sect. 3.1.1, the rock glacier system was divided into five different units in which we apply the approach presented above to reconstruct the chronology of the rock glacier displacement since the onset of the Holocene.
4.1 Field observations
At the lower part of the rock glacier system, i.e., units I and II, with elevation ranges of 2585–2521 and 2718–2557 m a.s.l., respectively (and covering about 0.214 and 0.177 km2, respectively), clearly display relict morphologies with no geomorphological evidence of recent surface movement. Their debris layers (on scales from meters to several meters) are highly covered by superficial material and vegetation (Fig. 2c). Unit III, spanning from 2685 to 2556 m a.s.l. and covering 0.155 km2, was evaluated to be transitional. Indeed, the evidence of downslope movement is less visible (but still detectable) than for units IV and V, as the ridge-and-furrow topography is less prominent. Unit IV (ranging from 2735 and 2626 m a.s.l.) and unit V (ranging from 2867 and 2685 m a.s.l.) were classified as active and cover areas of about 0.542 and 0.729 km2, respectively. They display evidence of downslope creep movement such as steep fronts, strongly marked ridge-and-furrow topography, absence of vegetation cover, and active layers composed of angular debris that are tens of centimeters to meters in size. These two units are talus connected, meaning that they are part of a downslope sequence including headwall, talus slope, and rock glacier (Fig. 2a and b). The delivery of debris is likely accomplished by rockfall activity, surface runoff, debris flow, and/or avalanche events from the headwall bedrock. The horizontal limit between the talus slope and rock glacier units can be estimated with about 50 m of uncertainty. This top to bottom organization from active to transitional and relict units is common in alpine settings (Amschwand et al., 2021). The surfaces of the boulders evolve along the rock glacier longitudinal transect. The boulders of units I and II are rounded and display quartz phenocrystals, a rugged surface, millimeter-scale weathered crust, and about 80 % lichen cover (Fig. 2c). On the other hand, boulders of units IV and V are more angular, with only about 10 % to 30 % of lichen cover and less obvious surface weathering features (Fig. 2d).
Table 3The 10Be surface-exposure ages for each ridge of the rock glacier system of the Vallon de la Route (Combeynot Massif, France), where n represents the number of samples per ridge. For the ridges with replicates, the median values are reported with the standard variation ±1σ. For the inheritance estimate, the difference in 10Be concentration of each pair of replicates has been used, and 10Be surface-exposure ages have been recalculated assuming an origin in the headwall (at an elevation of 2997 m a.s.l.).

4.2 Image correlation
As described in Sect. 3.2, we used a pair of orthomosaics to reconstruct surface displacement of the rock glacier system. The 1960–2018 pair is the most suited to reconstruct the activity of the rock glacier system over decadal timescales. As the aim of this study is to compare modern to Holocene rock glacier activity, we focus on the integrated displacement over the longest and best-quality time series available, instead of focusing on shorter-scale variations in surface displacement over modern timescales (e.g., Cusicanqui et al., 2021). Figures 3–5 present the results obtained using the IMCORR feature-tracking module. The surface displacement of the control areas (dashed outlined area in Figs. 3 and A1) within stable terrain shows a median displacement of 0.79±0.43 m (Figs. 4g, A2 and Table A3). This value represents the accumulation of error from the orthomosaic production and the image correlation procedure. The quality of the orthomosaic production can be assessed using the statistics on the GCPs showing a median absolute error of 0.57±0.34 m (Table A1) and the manual control points presenting a median mismatch distance between the two orthomosaics of about 1.04±0.45 m (Fig. 4h and Table A2). This last value, being the highest of the three error estimations, is used hereafter as a threshold value to control the confidence level of our remote sensing analysis and should be considered the detection limit. Consequently, all rock glacier areas showing surface displacement lower than 1.04 m are consequently considered below the detection level (dashed area in Fig. 5).
Surface displacements calculated over the entire rock glacier system for the last 58 years (i.e., between 1960 and 2018) show a maximum value of 20.4 m, with a median displacement of 1.3 m and a standard deviation of 2.0 m over the entire rock glacier area (Figs. 3, 4f and Table A3). Note that those estimates integrate displacements over 58 years and do not allow us to assess whether the displacements have been steady or not. The spatial distribution (Fig. 3) and the longitudinal transect (Fig. 5a, location shown by the red line in Fig. 3) show that significant surface displacements are concentrated in the upper part of the rock glacier system. Indeed, units IV and V show median surface displacements over the 1960–2018 period of 8.5±2.9 and 8.3±4.9 m, respectively (values calculated for all the values inside each unit outline; Figs. 3, 4d–e and Tables 4, A3). This agrees with our classification as “active” from geomorphological observations (Fig. 2 and Sect. 4.1). Unit III presents surface displacements of 1.9±1.4 m (Figs. 3, 4c and Tables 4, A3), which is above the detection limit. Our classification of transitional activity (Sect. 4.1) thus seems appropriate. Finally, units I and II, with median displacement of 1.2±0.4 and 0.9±0.6 m, respectively, are similar within ±1σ and below the detection limit (Figs. 3, 4a–b and Tables 4, A3). These parts of the rock glacier system can thus be considered to be immobile over this period and correspond well with the relict classification determined from geomorphological observations (Sect. 4.1). The rock glacier becomes inactive around 945 m from the headwall, corresponding to an elevation of about 2600 m a.s.l. In addition, two displacement peaks can be observed in the upper part of the rock glacier system (Figs. 3 and 5a), one in unit IV and another in unit V, potentially indicating different debris sources for the two units.
Table 4Median value of the 10Be surface-exposure ages for each unit of the rock glacier system of the Vallon de la Route (Combeynot Massif, France), where n represents the number of samples per unit. Surface velocity calculated from 10Be surface-exposure dating (distance from the headwall divided by 10Be surface-exposure age) and from image correlation (IMCORR, SAGA package on QGIS) of orthoimages (1960–2018 interval).
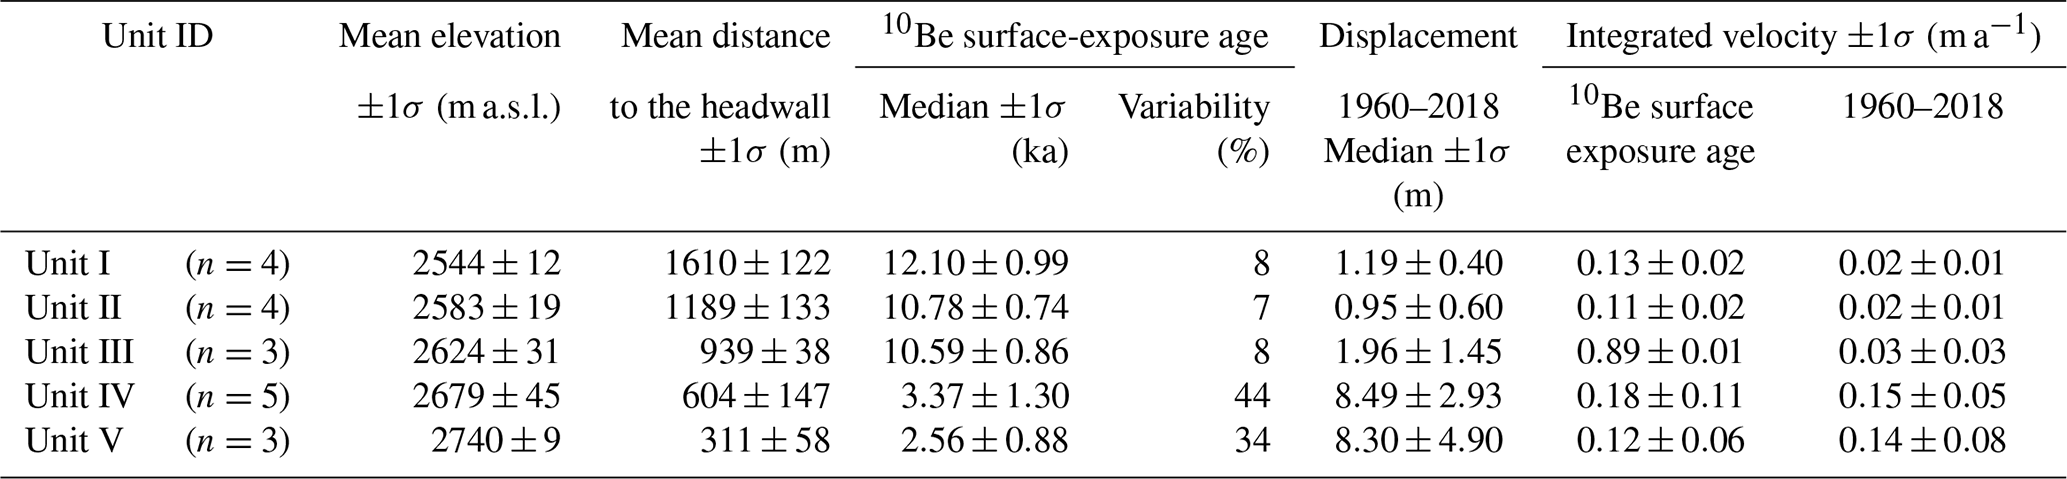
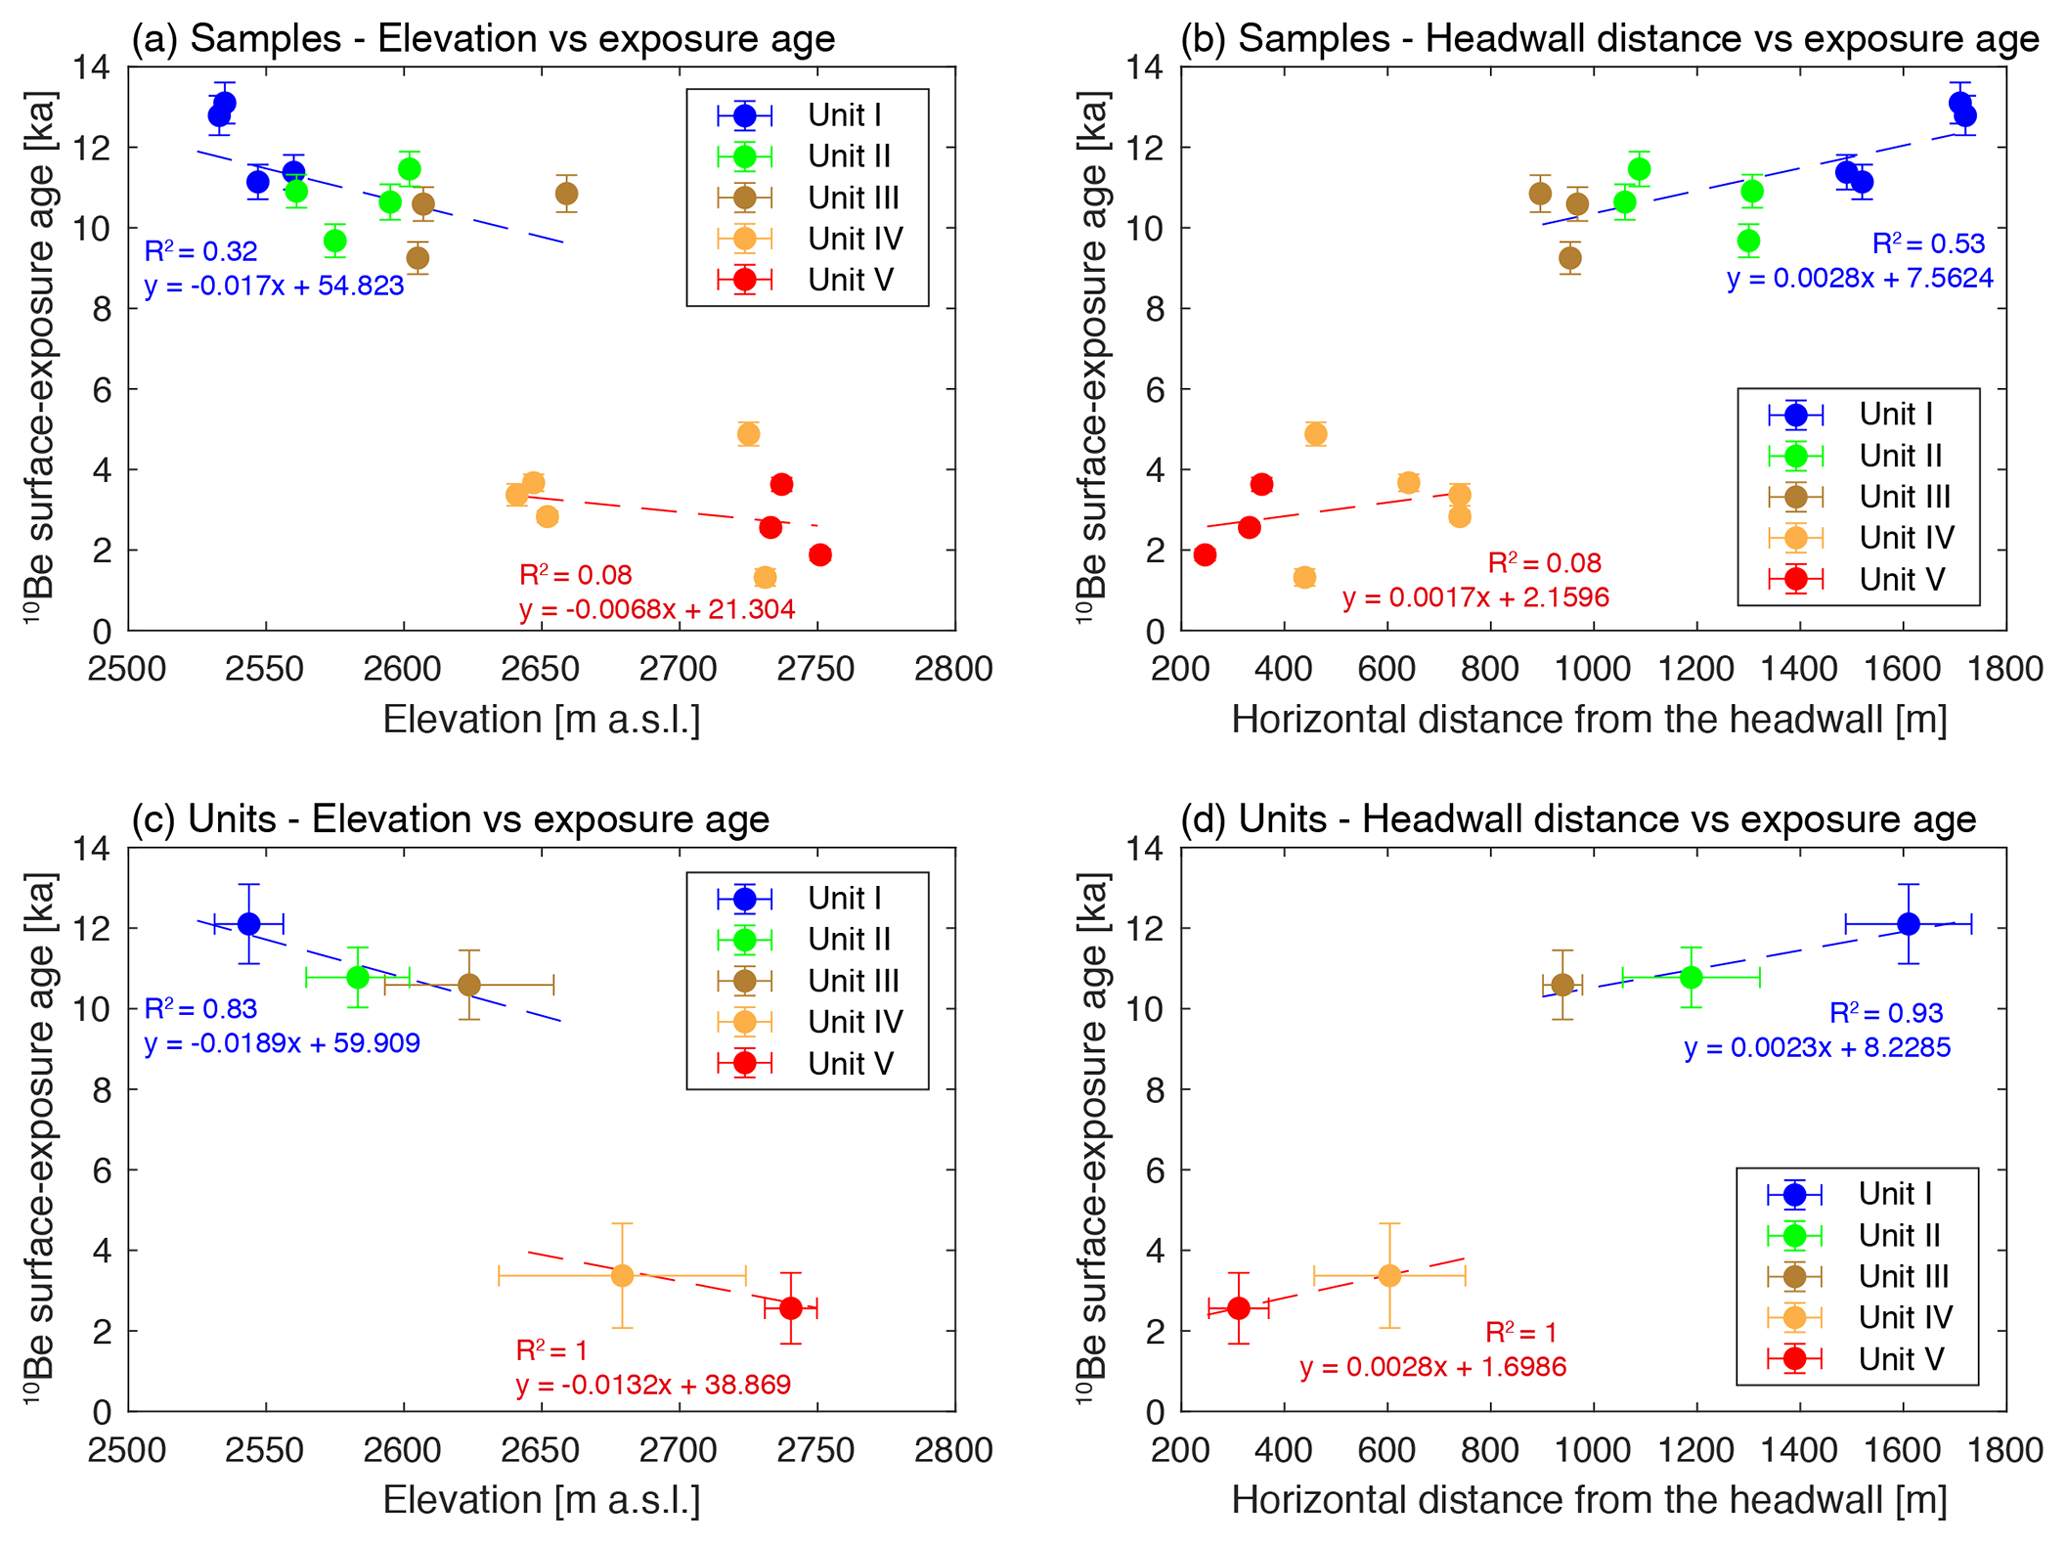
Figure 7The 10Be surface-exposure ages of individual samples (a, b) and units (c, d, median values) plotted against elevation (a, c) and horizontal distance to the headwall (b, d). The dashed red and blue lines represent the linear regressions for cluster 1 (units I, II, and III) and 2 (units IV and V), respectively.
4.3 Surface-exposure dating results
Figures 6 and 7, together with Tables 2–4, present the analytical results of 10Be surface-exposure dating for each individual boulder sample, as well as for statistics within ridges and units. Our 10Be age results range from 13.10±0.51 to 1.88±0.14 ka for the entire dataset. The correction for snow cover shielding ranges between 7 % and 9 % between samples. In view of the controversy over whether wind could remove snow from moraine and rock glacier ridges during the Holocene period (Federici et al., 2008; Schimmelpfennig et al., 2014; Moran et al., 2016; Chenet et al., 2016), we refrain from correcting the output 10Be ages for snow cover in the following discussion. This implies that our reported 10Be ages, with neither snow cover nor surface erosion correction, should be considered as minimum estimates.
Our results clearly reveal a first-order inverse correlation between 10Be surface-exposure age and elevation and a positive correlation between 10Be surface-exposure age and horizontal distance from the headwall (Fig. 7). These correlations remain valid when we consider the median values of the 10Be surface-exposure ages for each unit (Fig. 7c and d, Table 3) and ridge (Fig. A3, Table 4).
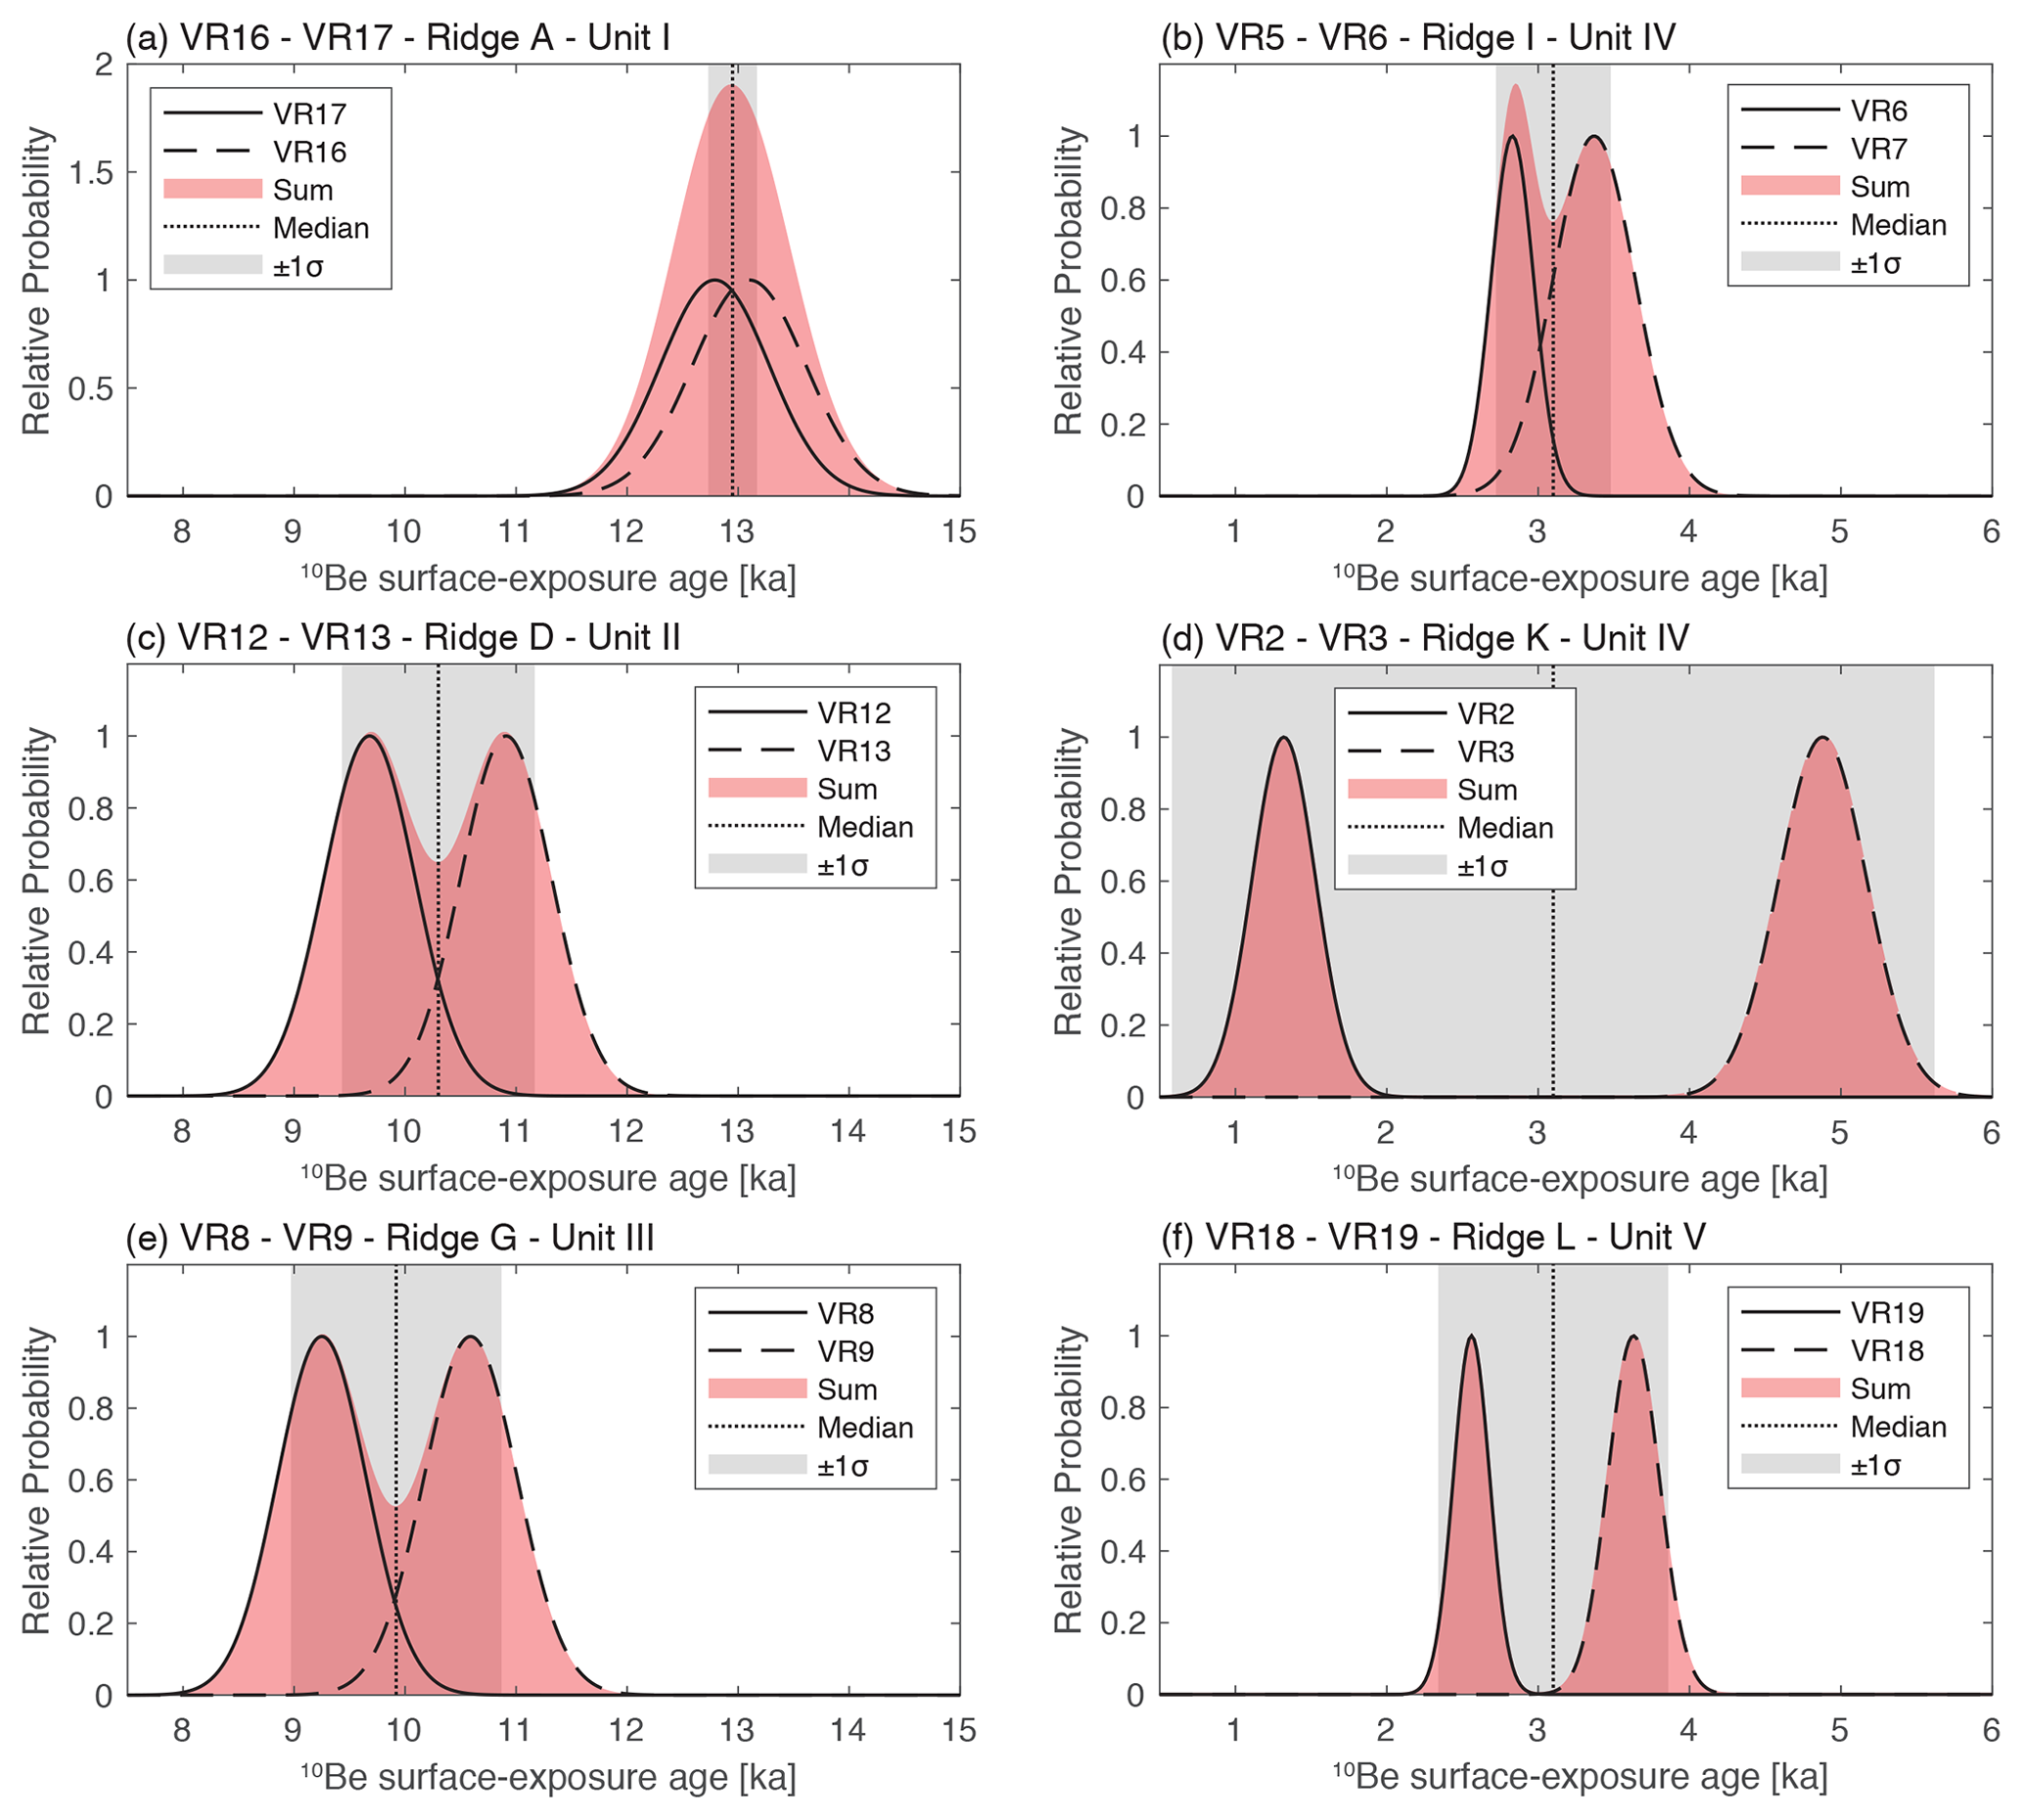
Figure 8Probability distributions of the individual 10Be surface-exposure age, sum, and median for each ridge (similar results are shown in Fig. A4 for each unit).
Visual inspection of the 10Be age dataset allows the identification of two clusters: cluster 1 includes the lowermost units (I, II, and II), whereas cluster 2 combines the highest units (IV and V). Cluster 1 presents 10Be ages between 9.25±0.40 and 13.1±0.51 ka, and cluster 2 shows 10Be ages between 1.88±0.14 and 4.88±0.29 ka. These results agree with the geomorphological classification we proposed for these rock glacier units, in which units I and II are viewed as relict, unit III is viewed as transitional, and units IV and V are viewed as active.
To assess the reproducibility of our dating approach, we sampled two different boulders on six of the rock glacier ridges (A, D, G, I, K and L; Figs. 2d, 6, and 8). The minimum and maximum horizontal distances between two replicates are about 8 and 82 m for ridges D (samples VR12 and VR13) and L (samples VR18 and VR19), respectively, a minimum elevation difference of about 2 m for ridges G (VR8 and VR9) and A (VR16 and VR17), and a maximum elevation difference of 14 m for ridge D (Fig. 6 and Tables 1 and 2). Significant variability in 10Be surface-exposure age occurs at the ridge scale, although it does not affect the correlations discussed above (Table 3 and Fig. 7). Ridge K presents the higher age variability (99 %, 10Be surface-exposure ages of 1.32±0.21 and 4.88±0.29 ka for samples VR2 and VR3, respectively; see Table 3 and Fig. 8d). The age variability for the other ridges is correlated with elevation and anticorrelated with distance to the headwall (26 %, 13 %, 10 %, 8 %, and 2 % of age variability for two samples per ridge for ridges L, I, G, D, and A, respectively; see Table 3 and Fig. 8). Only ridge A displays variability that is smaller than the absolute uncertainty on individual 10Be surface-exposure ages and may therefore be considered non-significant. The same pattern is observable for variability at the scale of the units (Table 4 and Fig. A4). Finally, samples from cluster 2 show much higher variability than samples from cluster 1.

Figure 9(a) Rock glacier surface velocity from 10Be surface-exposure dating (distance from the headwall divided by the 10Be surface-exposure age, shown as red squares) and from orthoimage correlation (IMCORR, SAGA package in QGIS, 1960–2018 interval, shown as a blue line). (b) Median surface velocities are presented for each independent method and each individual unit alongside their standard deviation (±1σ). The dashed pattern represents the detection limit (0.026 m a−1) defined by median value of the control areas in Fig. 3 (used as a threshold value to detect rock glacier surface movement).
4.4 Surface velocity
Figure 9 and Table 4 compile and illustrate the rock glacier surface velocities calculated from the 10Be surface-exposure dating and from the correlation of aerial and satellite orthomosaics. The surface velocities based upon 10Be surface-exposure dating range from 0.08±0.004 to 0.33±0.05 m a−1 with a median value of 0.13 m a−1 (Fig. 9). When we calculate the median value for the different units, the surface velocities range from 0.09±0.01 to 0.18±0.11 m a−1 (Table 4).
For the remote sensing analysis, we define a detection limit of 0.02 m a−1 corresponding to the median mismatch distance between the manual control point integrated over the 1960–2018 period (Figs. 4h, 5 and Table A2). As the displacements of units I and II show surface velocities identical to the detection limit, we consider them immobile over the last 6 decades. Measurable motion occurs above 2600 m a.s.l., with velocities of 0.03±0.03 m a−1 in unit III. The upper units display higher velocities of the same order, about 0.15±0.05 and 0.14±0.08 m a−1 for units IV and V, respectively (Fig. 9).
The surface displacement reconstructions of the rock glacier system of the Vallon de la Route from both image correlation and 10Be surface-exposure dating provide interesting and original insights into the applicability of such a methodology on rock glacier landforms. It also suggests potential feedback between rock glacier activity, past climate, and geomorphological processes such as headwall erosion. Here we discuss the implications of the results obtained at the Vallon de la Route rock glacier system.
5.1 Inheritance or pre-exposure and loss or incomplete exposure
The evaluation of the source elevation of debris and the estimation of the inheritance and pre-exposure of investigated boulders was performed using linear regression of the 10Be dataset presented in Fig. 7, as explained in Sect. 3.4 (Amschwand et al., 2021). For instance, when we calculate the intercept of cluster 2 regression (i.e., elevation at which the 10Be surface-exposure age is null), we obtain an elevation of 2737 m a.s.l. Whereas if we include all the samples together (dotted red and black lines in Fig. 7a, respectively), we obtain 2748 m a.s.l. From our geomorphological observations, the elevation at which the talus slope connects to the headwall is close to 2880 m a.s.l. (mean elevation of the foot of upper headwall), which may safely be considered the elevation at which debris is delivered to the rock glacier. The difference between these elevations could lead to the interpretation that the 10Be surface-exposure ages are underestimated. We argue that this discrepancy can instead be explained by the fact that our sampling strategy targeted the biggest boulders at the surface of the rock glacier so that the likelihood of any burial event was minimized. The sampled meter- to meters-scale boulders might have rolled farther from the cliff and might therefore be incorporated onto the rock glacier surface at a higher distance and lower elevation than the present-day limit between the talus and the headwall. The relationship between 10Be surface-exposure age and elevation is also dependent on the relation between elevation and distance along the rock glacier (i.e., hypsometric distribution of the rock glacier surface) and the potential inheritance and pre-exposure effects on the measured 10Be concentrations.
Linear regression between horizontal distance from the headwall and 10Be surface-exposure age (Fig. 7b) allows us to quantify potential inheritance and pre-exposure bias (e.g., Amschwand et al., 2021b). By considering cluster 2, the samples have experienced inheritance and pre-exposure of about 2.16 ka (intercept of dashed red line in Fig. 7b). This assumes (i) that blocks fall at the talus–headwall contact and (ii) that the displacement rate is continuous over the temporal range of the considered 10Be surface-exposure ages. Once again, this inheritance and pre-exposure estimate must be put in proper geomorphic perspective, as units IV and V do not share the same headwall source (with potentially different slope aspects and thus different erosion rates). When regressed individually for units IV and V, the estimated inheritances are about 2.79 and 1.59 ka for units IV and V, respectively. For the above calculations, we only used samples from cluster 2, being the youngest and closest to the headwall. Samples from cluster 1, with the oldest 10Be surface-exposure ages and the greatest distances from the headwall, could also involve other biases that include non-continuous displacement rate over this timescale and loss or incomplete exposure due to surface erosion or tilting and burial of the sampled surface.
The variabilities of our 10Be surface-exposure ages of the ridges and the units are lower at low elevation and far from the headwall (Tables 3–4 and Figs. 8–A4). A first interpretation is that of the samples whose variability is smoothed between samples during transport and exposure on the rock glacier (cluster 1). We interpret this as highlighting that the events of tilting, burial, and/or erosion of the sampled boulders do not strongly influence the reported 10Be surface-exposure ages and that the variability likely arises instead from differing exposure times on the headwall prior to rockfall delivery onto the rock glacier surface. Secondly, the importance of inheritance and pre-exposure events would have less importance for the oldest 10Be surface-exposure ages than for the youngest 10Be surface-exposure ages. The high variability in cluster 2 of 10Be surface-exposure ages could be explained by variation in 10Be inheritance due to pre-exposure in the headwall. Using the difference in 10Be concentration between replicates, we estimated an inheritance. The calculated age differences are about 0.17±0.01, 0.67±0.03, 1.06±0.04, 0.39±0.03, 2.88±0.47, and 0.88±0.04 ka for ridges A, D, G, I, K, and L, respectively (Table 3). The median value of those results is 0.78±0.97 ka and can now be compared with the inheritance estimate of 2.16 ka derived from using linear regression between 10Be surface-exposure age and distance to the headwall of cluster 2.
We interpret the majority of the observed variability in 10Be surface-exposure ages as representing the stochastic nature of rockfall events. This leads to both different residence times of boulders in the headwall before rockfall and different sites of incorporation of boulders in the talus–rock glacier system. Interestingly, all sample 10Be surface-exposure ages suggest low inheritance compared to other settings in the European Alps. In the Mont Blanc Massif, for example, the more competent granitic spurs result in potential inheritance of >10 ka (Gallach et al., 2018), with a commensurately lower rate of debris supply and lower frequency of rockfall events (see Sect. 5.3 for a discussion about headwall erosion rates).
5.2 Surface velocity comparison and reconstruction
The 1960–2018 rock glacier surface velocities calculated from the correlation of aerial and satellite orthomosaics validate our proposed geomorphological classification for the activity of the different units (units I and II are relict, unit III is transitional, and units IV and V are active). This activity is occurring above 2600 m a.s.l. While no correlation between the distance from the headwall and the surface velocity is clearly visible, the variability in surface velocity is significantly higher for units IV and V. The difference between units IV and V likely reflects their different debris and snow avalanche sources; they may therefore have independent age and surface velocity profiles. This could therefore lead to an overestimation of the distance to the headwall for unit IV (as the central line is defined with respect to unit V, Fig. 6) and as a consequence to an overestimation of its surface velocity.
The velocity of the two upper units above 2600 m a.s.l., which show surface velocity of about ∼0.15 m a−1 between 1960 and 2018, are slower than the reconstructed surface velocity of the Laurichard rock glacier, located in the adjacent cirque 1 km north of our study site and facing north (Cusicanqui et al., 2021). In this study, we quantified an acceleration of the average surface velocity changing from 0.5±0.09 m a−1 for the 1952–1994 period to 1±0.09 m a−1 for the period 2013–2017 for this landform ranging from 2430 to 2630 m a.s.l. The difference of activity between the two sites could be explained by the control of insolation and mean annual temperature on the permafrost conditions, which are more favorable to the north-facing slopes (Laurichard) than the southeast-facing slopes (Vallon de la Route). This has been highlighted by the Permafrost Favorability Index distribution of the area (Marcer et al., 2017). In addition, Marcer et al. (2021) have estimated the rock glacier kinematics over the past 7 decades for the entire French Alps using aerial orthoimagery. Mean displacement rates increased from 0.3 m a−1 (for the period from 1948–1952 to 2001–2004) to 0.97 m a−1 (for the period between 2001–2004 and 2008–2009) to 1.25 m a−1 (from 2008–2009 to 2015–2017). Note that the values obtained in our study site are below the detection limit of this regional reconstruction (0.52 m a−1 for the period from 2008–2009 to 2015–2017; Marcer et al., 2021).
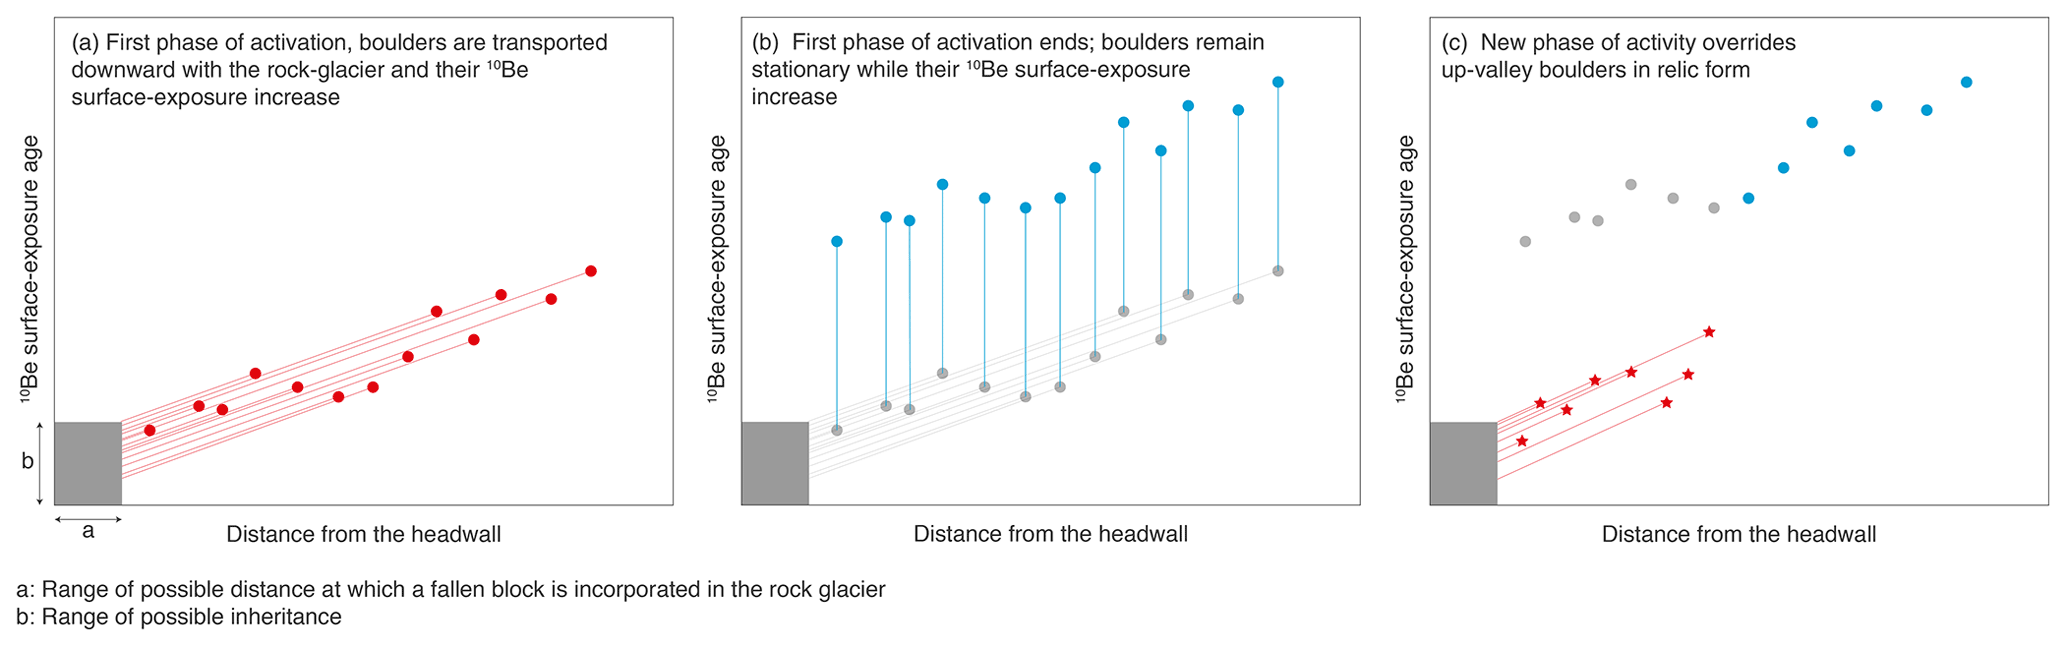
Figure 10Schematic interpretation of the evolution of the 10Be surface-exposure age patterns as a function of distance from the headwall, considering two phases of rock glacier activity and stochastic rockfall delivery of boulders. See Sect. 5.3 for details.
The velocity obtained by integrating 10Be surface-exposure age over the distance to the headwall, ranging from 0.08±0.004 to 0.33±0.05 m a−1, are about the same order of magnitude as that obtained by Amschwand et al. (2021) using the same approach (∼0.3 m a−1). Comparing the surface velocity obtained with our two datasets (orthomosaics correlation and 10Be surface-exposure dating), we see that active units (IV and V) share similar surface velocities between long-term and short-term approaches (blue and red datasets in Fig. 9). Integration of the short-term surface velocities over the late Holocene appears to predict the 10Be surface-exposure ages of investigated rock glacier boulders well. This suggests that the climatic and geomorphological conditions controlling the activity of the rock glacier have been stable above 2600 m a.s.l. over the last ca. 5 ka.
These observations should be put in a spatial perspective. The remote sensing analysis results in an estimate of the mean surface velocity over the entire area of the unit. In contrast, the velocity estimated from the 10Be surface-exposure dating was calculated from samples collected at the center of the rock glacier system, where the surface velocity is likely to be the fastest regarding a transversal cross section. The median velocity of the unit will be lower than the maximum centerline speed, as lower thicknesses at the margins should slow the surface speeds. It is therefore expected that the 10Be-based method would likely yield faster speeds than the remote sensing method. Consequently, the agreement and relationship between the two datasets and the two timescales should be interpreted with caution.
5.3 History of rock glacier activity
The Vallon de la Route cirque is occupied by a rock glacier system with well-defined rock glacier geomorphological attributes such as steep fronts, margins, ridges, and furrows topography (Figs. 1b and 2). No evidence of former occupation of the cirque by a clean ice or debris-covered glacier is visible (no moraine nor polished bedrock surface). Consequently, we interpret the correlations presented in Sect. 4.3 between the 10Be surface-exposure age and distance to the headwall to support the hypothesis that rock boulders originate from the headwall and are then transported downward on the surface of the rock glacier: the further from the headwall (and the lower the elevation) the boulder is, the older its 10Be surface-exposure age will be.
Following this reasoning and acknowledging the 10Be surface-exposure age distribution along the rock glacier, we propose a possible history for the rock glacier activity that includes two pulses of constant surface velocity. Figure 10 schematically presents our interpretation of the two clusters of 10Be surface-exposure ages according to their distances from the headwall (Figs. 7b and 11b). During the first phase of activity, boulders fall from the headwall onto the surface of the rock glacier (Fig. 10a). The random distance from the headwall at which the boulder is incorporated into the rock glacier represents the stochasticity of rockfall travel. Therefore, the 10Be inheritance, which corresponds to the residence time of the rock in the headwall, is also stochastic. As rockfall-derived boulders are transported down valley, both their 10Be surface-exposure ages and distances from headwall increase from these initial values (red lines in Fig. 10a). When the motion halts (presumably because the rock glacier thins beyond some threshold thickness), this first phase of activity ends and boulders remain stationary while their 10Be surface-exposure ages continue to increase (Fig. 10b). During this phase of inactivity, we consider neither snow nor rock avalanches to be active. Finally, a new phase of activity begins at the base of the talus (red points in Fig. 10c), and the new rock glacier overrides the up-valley boulders on the relict rock glacier (shadow points in Fig. 10c). In this conceptual model, we assume that the first phase of activity transported the boulders further downstream than the second phase of activity.

Figure 11(a) Activity phases of the rock glacier, defined as the evolution of the rock glacier surface velocity in time (explored histories and the best-fitting history are shown as grey and green lines, respectively). (b) Relationship between 10Be surface-exposure age and distance to the headwall. Observed values of the clusters 1 and 2 are shown as red and blue squares, respectively. Modeled and best-fit values are shown in grey and green, respectively. (c) Likelihood distribution of the inversion exploring the time at which the first phase of activity ends (t2). See Sect. 5.3 for details.
We therefore argue that cluster 1, corresponding to 10Be surface-exposure ages of units I, II, and III, represents a first phase of activity of the rock glacier and that cluster 2, with units IV and V, represents a second phase of activity. To constrain both the timing and the surface velocities of these phases of activity, we numerically simulate the evolution of 10Be surface-exposure ages of boulders during their movement at the surface of the rock glacier (Fig. 11b). To represent its stochasticity, we prescribed the inheritance (Fig. 10b) with random values between 0 and 2.16 ka (as determined in Sect. 5.1). In the same way, the distance of incorporation of boulders on the rock glacier surface (Fig. 10a) is randomly sampled between 0 and a maximum of 100 m. In this model, three different times must be prescribed. The initiation of the first phase of activity is set at 12.1 ka (t1 in Fig. 11a), which is the 10Be surface-exposure median age of unit I. The second phase of activity is set to start at 3.4 ka (t3 in Fig. 11a) as this is the 10Be surface-exposure median age of unit III and is still active now. Only the time at which the first phase of activity ends cannot be directly extracted from the data (t2 in Fig. 11a). Consequently, we simulate the 10Be surface-exposure age structure of the rock glacier complex for 100 values of t2 ranging from t3 (3.4 ka) to the youngest age of cluster 1 (i.e., 9.25 ka for sample VR8). The velocity of phase 1 is calculated using the maximum distance a block traveled at the surface of the rock glacier (1720 m) and the activity duration of phase 1 (t1 and t2). The velocity of phase 2 is fixed at 0.22 m a−1, a value calculated using the maximum distance a block traveled at the surface of the rock glacier during this phase (740 m) and the duration of activity (t3 in Fig. 11a).
The 100 simulations are evaluated against the measured 10Be concentrations using chi-square per degree of freedom, . The chi-square is a weighted sum of squared deviations: , where σ is the variance on our 10Be dataset, O is the observations, and C is the modeled data. The degree of freedom, , is equal to the number of observations (n) minus the number of fitted parameters (m; here there are four parameters: maximum inheritance, maximum distance of incorporation of a boulder on the rock glacier, the initiation of phase 1, i.e., t1, and the initiation of phase 2, i.e., t3). The likelihood probability function is then calculated as and normalized with its maximum to extract the median value and the standard variation (±1σ) of t2 (Fig. 11c). The inversion results suggest that the first phase of activity lasted from 12.1 to 6.26±1.96 (±1σ) ka, with a surface velocity of 0.29±0.15 (±1σ) m a−1. The second phase of activity starts at 3.4 ka and has a surface velocity of 0.22 m a−1 (Fig. 11a). The most recent phase of activity overrides the 10Be surface-exposure ages of the two upper units. We now discuss how these two phases of rock glacier activity can be connected to what is known about the paleo-environmental conditions in the western European Alps.
5.4 Reconstruction of paleo-environmental conditions
In the European Alps, the end of the Lateglacial (i.e., Egesen) led to readvancing of the mountain glaciers, reaching a maximum extent around 12 ka for both the eastern and western Alps (e.g., Ivy-Ochs et al., 2008; Protin et al., 2019; Hofmann et al., 2019). Directly downstream of the Vallon de la Route catchment, 10Be surface-exposure ages of moraines show ages of 13.0±1.1 and 12.4±1.5 ka, providing evidence for two stages of glacial advance or standstill at the end of the Lateglacial (Chenet et al., 2016). In a southern valley of the Ecrins Pelvoux Massif, morainic deposits at Pré de la Chaumette (down valley from Rougnoux Valley) have been dated at 12.5±0.6 ka (Hofmann et al., 2019). Immediately after the onset of the Alpine glacier retreat (12.2±1.5 ka in the same valley, Chenet et al., 2016), several advance episodes lasting ∼1 ka were identified in the Ecrins Massif. Dating in the southern part of this massif has shown glacial activity during the Lateglacial that may have lasted until the early Holocene before final glacial retreat (around 11 ka, Hofmann et al., 2019). Cossart et al. (2010) reported histories of glacier retreat and rock glacier generation in the Clarée Valley (about 10 km to the east of our study site). They identified three generations of rock glacier development during the second half of the Holocene, ranging in elevation from ∼2400 to 2800 m a.s.l. Recent dating of Charton et al., (2021) on two rock glaciers located ∼3 km to the north of our site and at an elevation of about 2050 m a.s.l. reveals 10Be surface-exposure ages of ca. 11 ka. They interpreted the 10Be surface-exposure ages as marking the end of activity of the rock glacier.
In the present study, we interpret the 10Be surface-exposure ages as being the sum of its residence time on the headwall cliff, the time spent traveling on the surface of the rock glacier, and the time since deactivation of the relict portion of the rock glacier for the relict units. We argue that rock boulders remain at the surface of the rock glacier while being transported down valley. This is supported by the small variability in 10Be surface-exposure ages obtained from the ridge replicates far from the headwall, which implies little occurrence of tilting and burial events (cf. Sect. 5.1). This is also supported by the rock boulder weathering evolution along the rock glacier, which displays more weathered surfaces far from the headwall (cf. Sect. 4.1). Consequently, in the Vallon de la Route catchment, the first phase of rock glacier activity appears to start around 12.1 ka from our oldest 10Be surface-exposure age (median value of the unit I). We suggest that this coincides with the final glacier retreat at the end of the Lateglacial at the onset of the warm period marking the Younger Dryas–Holocene transition (e.g., Liu et al., 2014). The upper mountain catchments and cirques then became free of glaciers, allowing the headwall and scree field to feed a rock glacier with debris thickness sufficient to insulate the ice. In this case, the rock glacier development would be geomorphically controlled by contrast to a climatic control (Cossart et al., 2010). As presented above, this first phase of activity would have ended around 6.26±1.96 (±1σ) ka. According to our reconstruction, the second generation of rock glacier development occurred starting at about 3.4 ka. This is earlier than the estimate proposed by Bodin (2013) from the relationship between slope and velocity based upon an estimated time of 1.7 ka for debris to reach the front of the unit V lying at around 2740 m a.s.l.
Whereas lateral glacier moraines dated using 10Be surface-exposure approach suggest several minor glacier re-advances between ca. 4.25 and 0.92 ka in the main glacierized valleys of the Ecrins-Pelvoux Massif (Le Roy et al., 2017), there is no evidence for glacial re-occupation during the Neoglacial (Little Ice Age) periods in the Vallon de la Route Massif. This specific cirque does not share an upstream connection with any of the main glacierized valleys of the massif. The headwall and scree taluses were ice free and could therefore feed the rock glacier system with debris and snow avalanches, maintaining the rock glacier during the last 3.4 ka, when the Neoglacial (Little Ice Age) climate was favorable for glacier and rock glacier activity.
Consequently, the inspection of the age structure of our rock glacier suggests two episodes of motion (Fig. 11a). The first phase, starting around 12.1 ka, displays a gradient in age with rock glacier surface velocity of about 0.45 m a−1. The rock glacier activity then declines and stops at 6.26±1.96 ka. By around 3.4 ka, the climate again becomes conducive to rock glacier motion at elevations above 2600 m a.s.l. where the presently active upper two units have been emplaced. Even if the climate fluctuated during the late Holocene (e.g., Liu et al., 2014), the integrated velocities calculated with the 10Be surface-exposure ages reveal that the surface velocity of 0.18 m a−1 (Fig. 11a) agrees with modern estimates.
5.5 Headwall erosion and implications
The reconstruction of the rock glacier activity provides a way to quantify the erosion rate of the surrounding headwalls over Holocene timescales (e.g., Humlum, 2000; Amschwand et al., 2021). Bodin (2013) has performed geophysical measurement of the rock glacier area and could determine a maximum thickness of the active layer of about 9 m and a maximum thickness of the ice-rich layer of about 15 m at 2630 m a.s.l. The entire area of the rock glacier is 6.745×10⁵ m2. An approximation of the total volume of debris, considering a total thickness of between 9.5 m (active layer thickness of 5 m and ice-rich layer of 4.5 m thickness at 2720 m a.s.l.; Bodin, 2013) and 24 m (combining maximum of active layer thickness of 9 m and ice-rich layer of 15 m thickness at 2630 m a.s.l.; Bodin, 2013), gives 3.37×10⁶ and 13.49×10⁶ m3, respectively. Regarding the low surface velocity estimated between 1960 and 2018, between 0.14 and 0.03 m a−1 over 42 % of the total area (units III, IV, and V), and the lack of movement for the other 58 % of the total rock glacier area (units I and II), we can assume a negligible ice concentration over the full volume of the rock glacier system. Taking this volume of debris over 12.1 ka (the median 10Be surface-exposure age of unit I) and considering that all boulders are derived from bedrock exposed above the rock glacier system (about 5.351×10⁵ m2), we can calculate a mean rate of erosion of the headwalls of between 1.0 and 2.5 mm a−1. These results agree with estimates of erosion rate (∼1.2–4.1 mm a−1) from the granodioritic headwall of Bleis Marscha rock glacier in the eastern part of the Swiss Alps (Amschwand et al., 2021). The catchment-wide denudation rate of the Ecrins-Pelvoux Massif has been estimated to range from around 0.3 to 1.1 mm a−1 on millennial timescales using 10Be concentrations in stream sediment (Delunel et al., 2010), suggesting that frost-cracking processes strongly control the post-glacial topographic evolution of midlatitude mountain belts. The high erosion rates estimated in our study highlight that the steep rock walls that serve as the sources for debris on the rock glacier are retreating rapidly. This may be aided by the downstream conveyance of boulders and debris by the rock glaciers that prevent the headwalls from burying themselves in their own debris. This system therefore promotes the maintenance of high rockwall erosion rates, the development of cirques, and the possibility of distinctly asymmetric mountain ridges where the local climate is more conducive to rock glacier development on one side of a ridge than the other (Gilbert, 1904).
In this study, we quantitatively constrain the surface displacement field of an alpine rock glacier system over Holocene and modern timescales by using both remote sensing and geochronological datasets. The 10Be surface-exposure dating of individual boulders along the main center line of the rock glacier reveals ages from 13.1 to 1.8 ka, corresponding to elevations of 2535 and 2751 m a.s.l., respectively. Our first-order observation shows an inverse correlation between 10Be surface-exposure age and elevation and a positive correlation between 10Be surface-exposure age and distance from the headwall. This confirms the simple conceptual model in which rock debris falls from the headwall and remains at the surface as they are transported down valley by the rock glacier. Comparison of replicates from the transverse ridges along the rock glacier shows that loss and incomplete exposure due to surface erosion, burial, or tilting of the boulders is negligible. These replicates also show that 10Be concentrations of boulders close to the headwall can vary, which in turn provides constraint on the inheritance and pre-exposure of rock boulders. We estimate the possible maximum inheritance of 2.16 ka in our study area, corresponding to the residence time of boulders in the headwall.
Comparison of orthoimages from both aerial (1960) and satellite (2018) surveys shows that the rock glacier system is composed of the two uppermost active units with a surface velocity of about 0.14 m a−1 at elevations from 2867 and 2626 m a.s.l. and a transitional unit with a surface velocity of about 0.03 m a−1 at elevations between 2685 and 2556 m a.s.l. Analysis of a stable area outside of the rock glacier system constrains the detection limit to be 0.02 m a−1. Reported values of less than this detection threshold imply that the downstream part of the rock glacier below 2600 m a.s.l. is presently immobile, confirming our geomorphic analysis of the feature as relict. The comparison of the surface velocities estimated using the 10Be surface-exposure dating relative to distance to the headwall and from the surface displacement integrated over the 1960–2018 period between the orthoimage surveys shows that late Holocene and modern velocities are comparable for the active units of the rock glacier system.
Comparison of these results for the entire rock glacier allows us to propose an activity history for the Vallon de la Route rock glacier that consists of two main phases of surface displacement. The first episode lasted between about 12.1 and 6.26±1.96 ka, with onset around the end of the Younger Dryas cooling event, when the cirques became ice free, allowing the headwall and scree field to feed the rock glacier with debris with insulation of the ice beneath. After a period of quiescence, the second phase of activity started around 3.4 ka and continues towards the present, possibly attributed to the more favorable climate of the Neoglacial (Little Ice Age) period. Finally, we use the surface velocities obtained using 10Be surface-exposure dating to reconstruct the erosion rate of the headwalls. The suggested erosion rates are between 1.0 and 2.5 mm a−1. These are higher than catchment-wide denudation rates estimated over millennial timescales over the entire Ecrins-Pelvoux Massif, suggesting that the rock glacier system promotes the maintenance of high rock wall erosion (back-wearing) rates and the development of cirques. To go further in reconstructing the paleo-environmental conditions of this specific region, physically based numerical modeling of rock glacier evolution (e.g., Anderson et al., 2018) should be applied using the existing topography, the spatial patterns of 10Be surface-exposure ages, and the modern surface velocities as modeling targets.
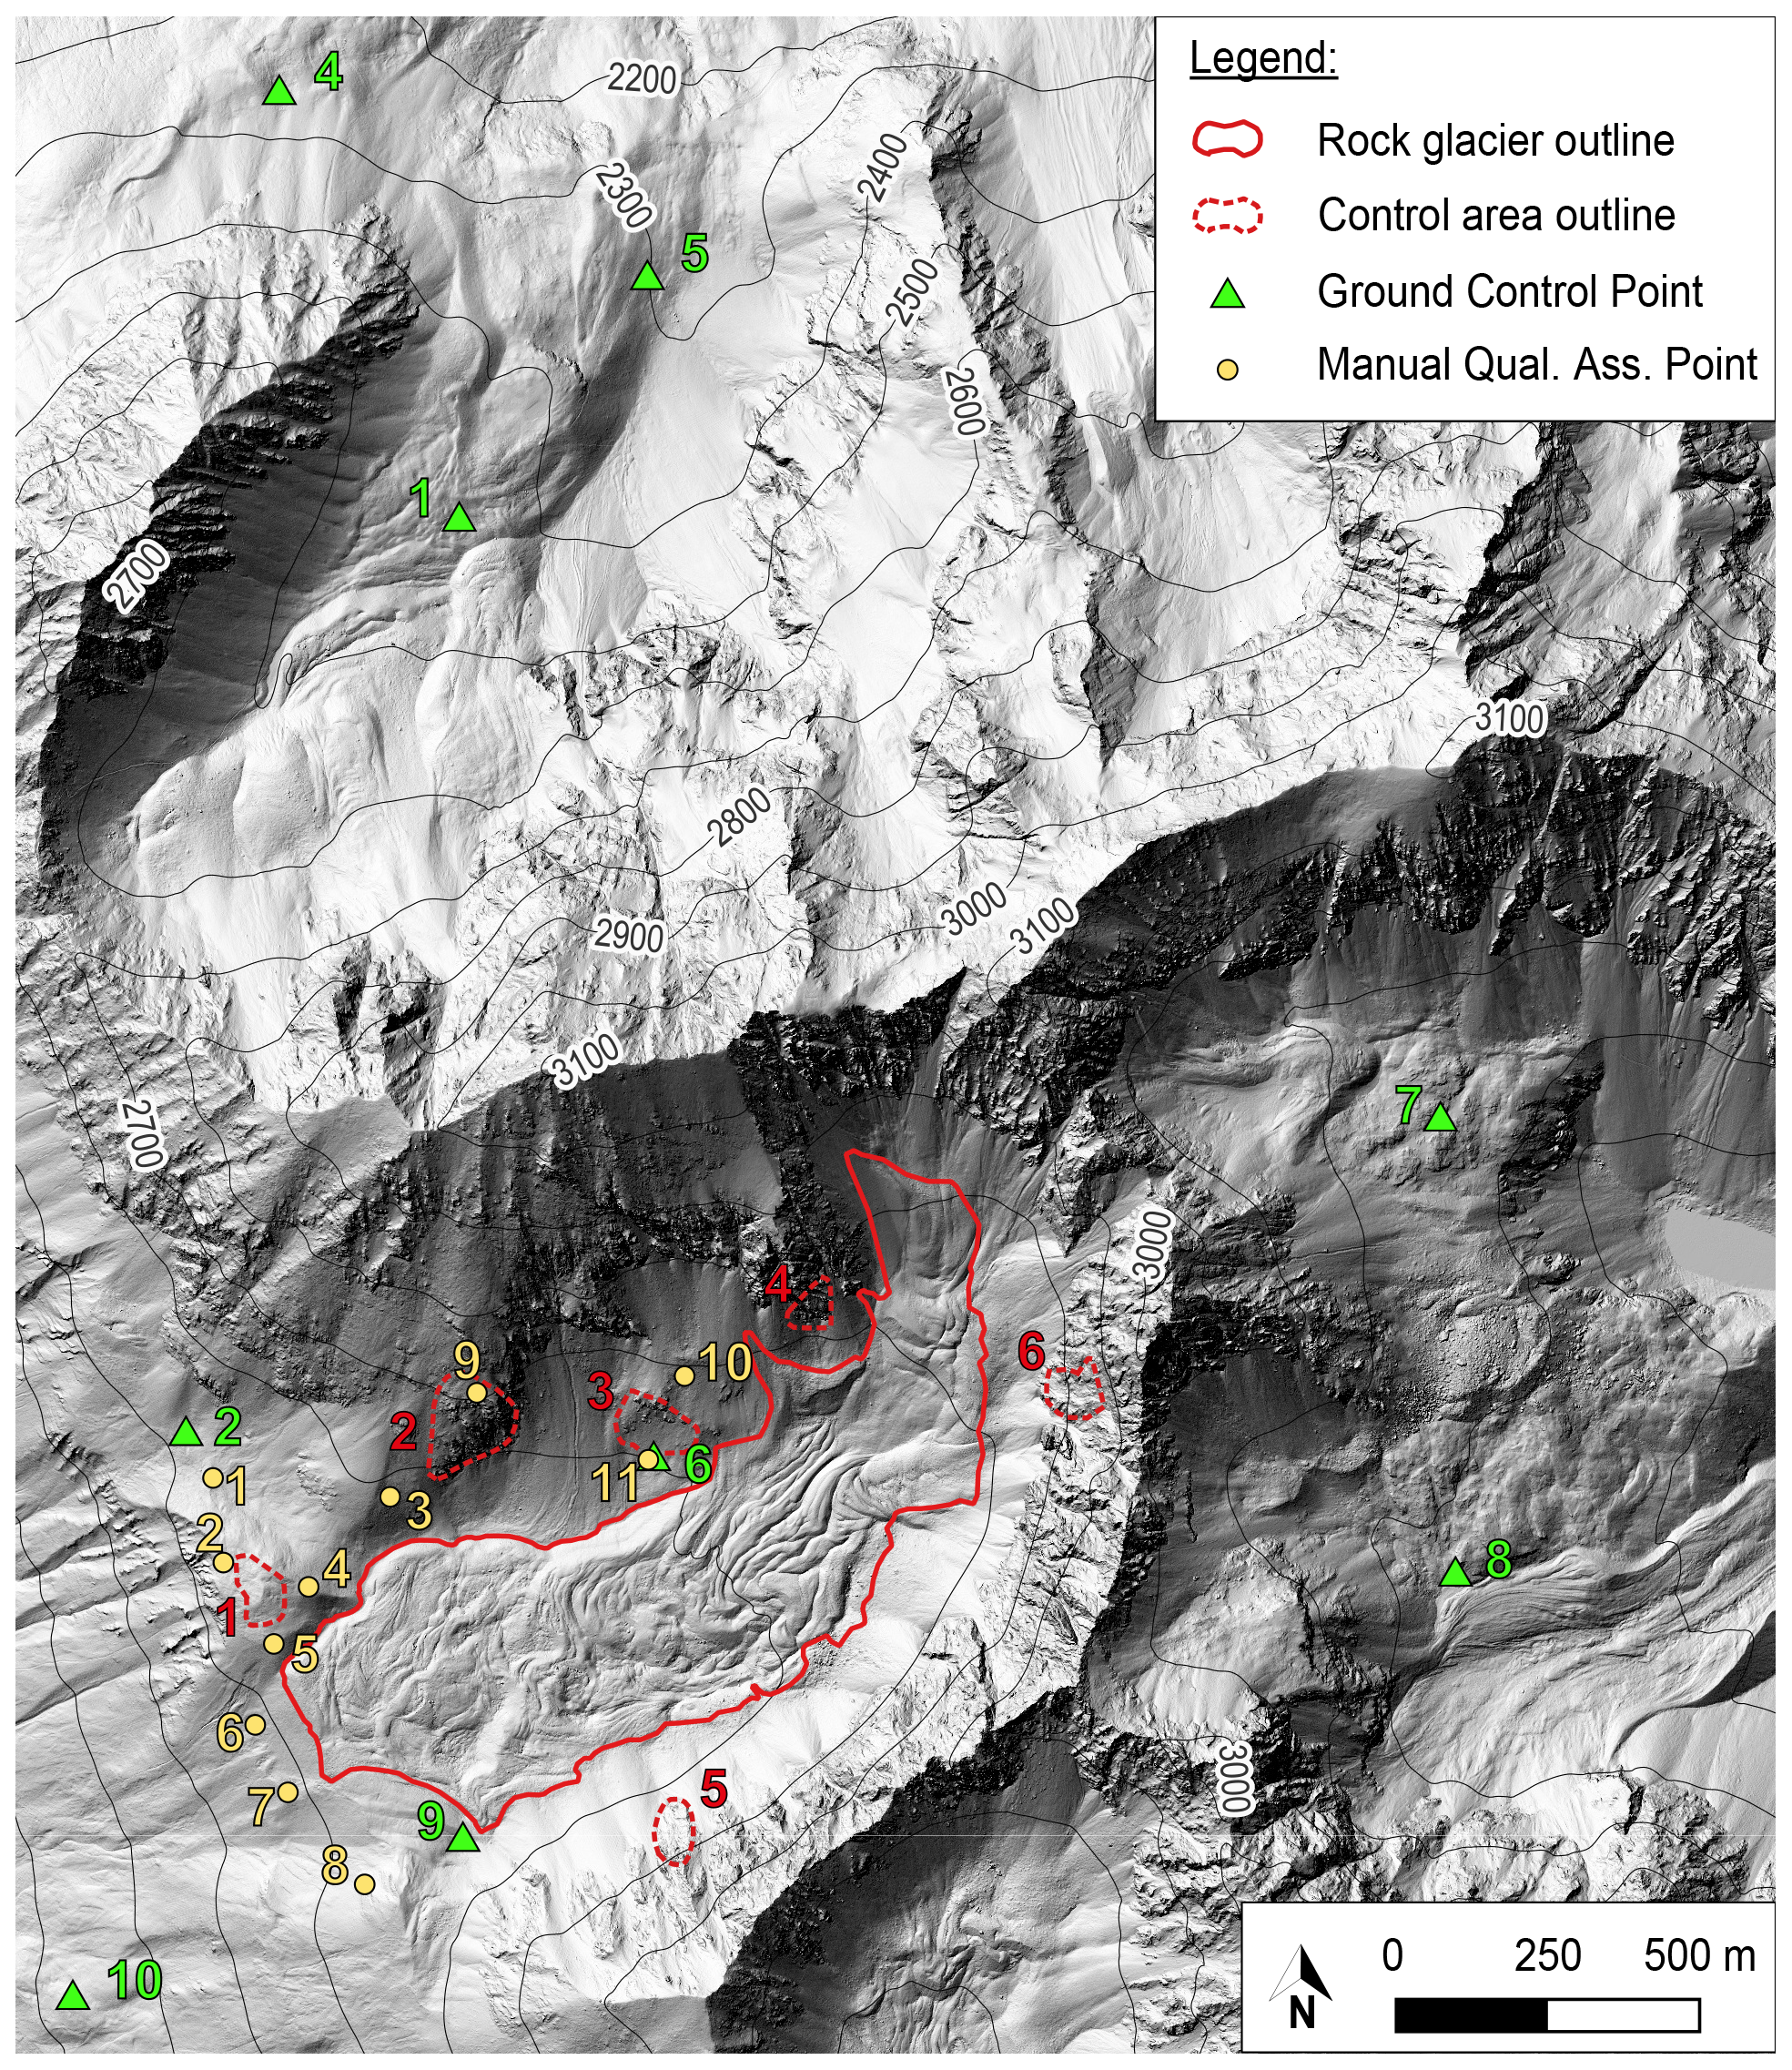
Figure A1Map showing the location of the ground control points, the control areas, and the manual control points used in the remote sensing analysis. Hillshade DEM has been produced from high-resolution lidar DSM (0.5 m resolution) survey realized by SINTEGRA (17 August 2012).
Table A1Statistics of the ground control points (GCPs) used for the co-registrations of the two orthomosaics. Coordinates are mentioned in the EPSG:2154–RGF93 v1/Lambert-93 systems.
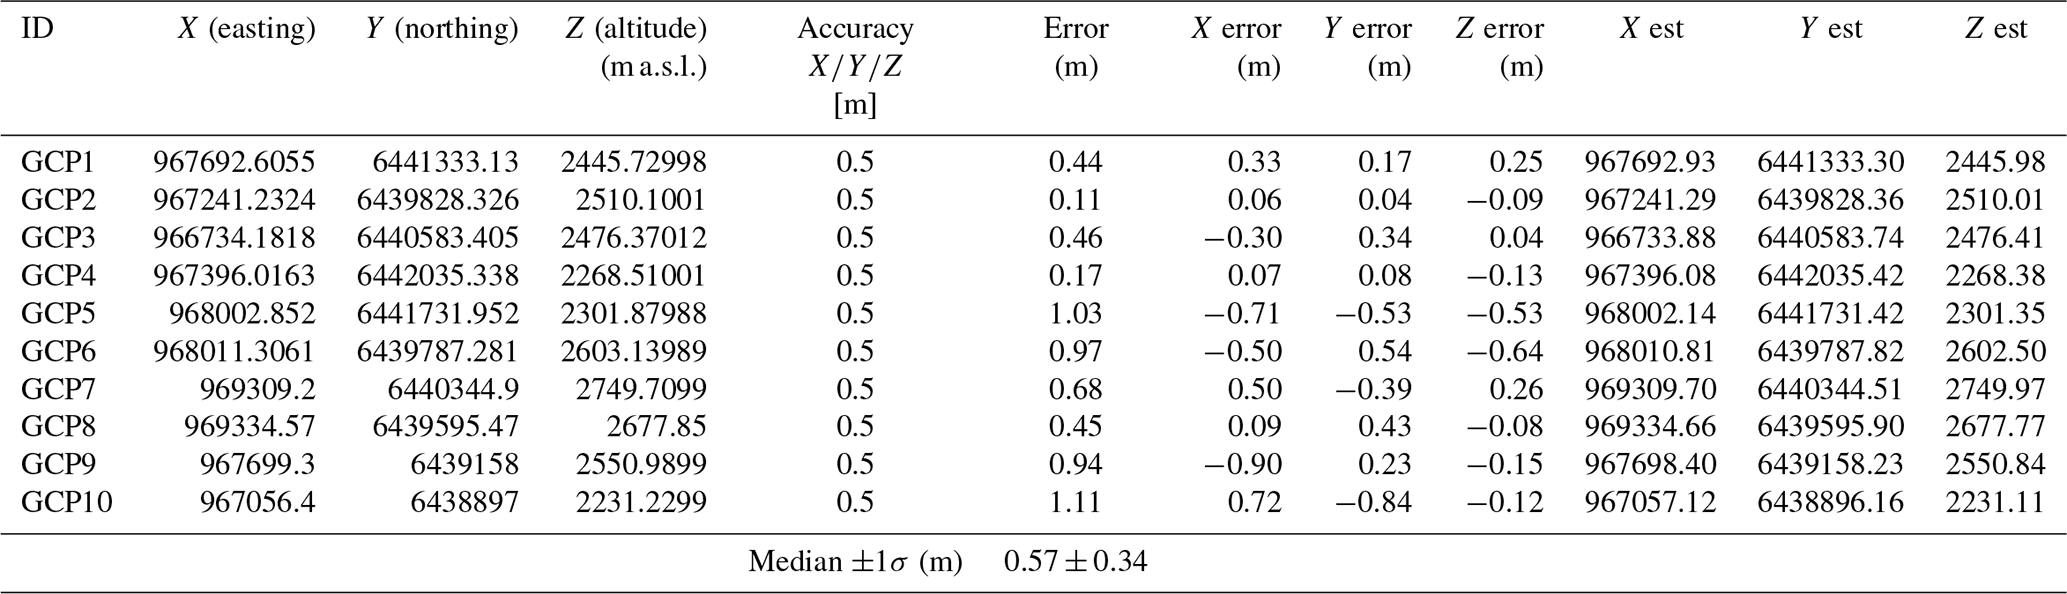
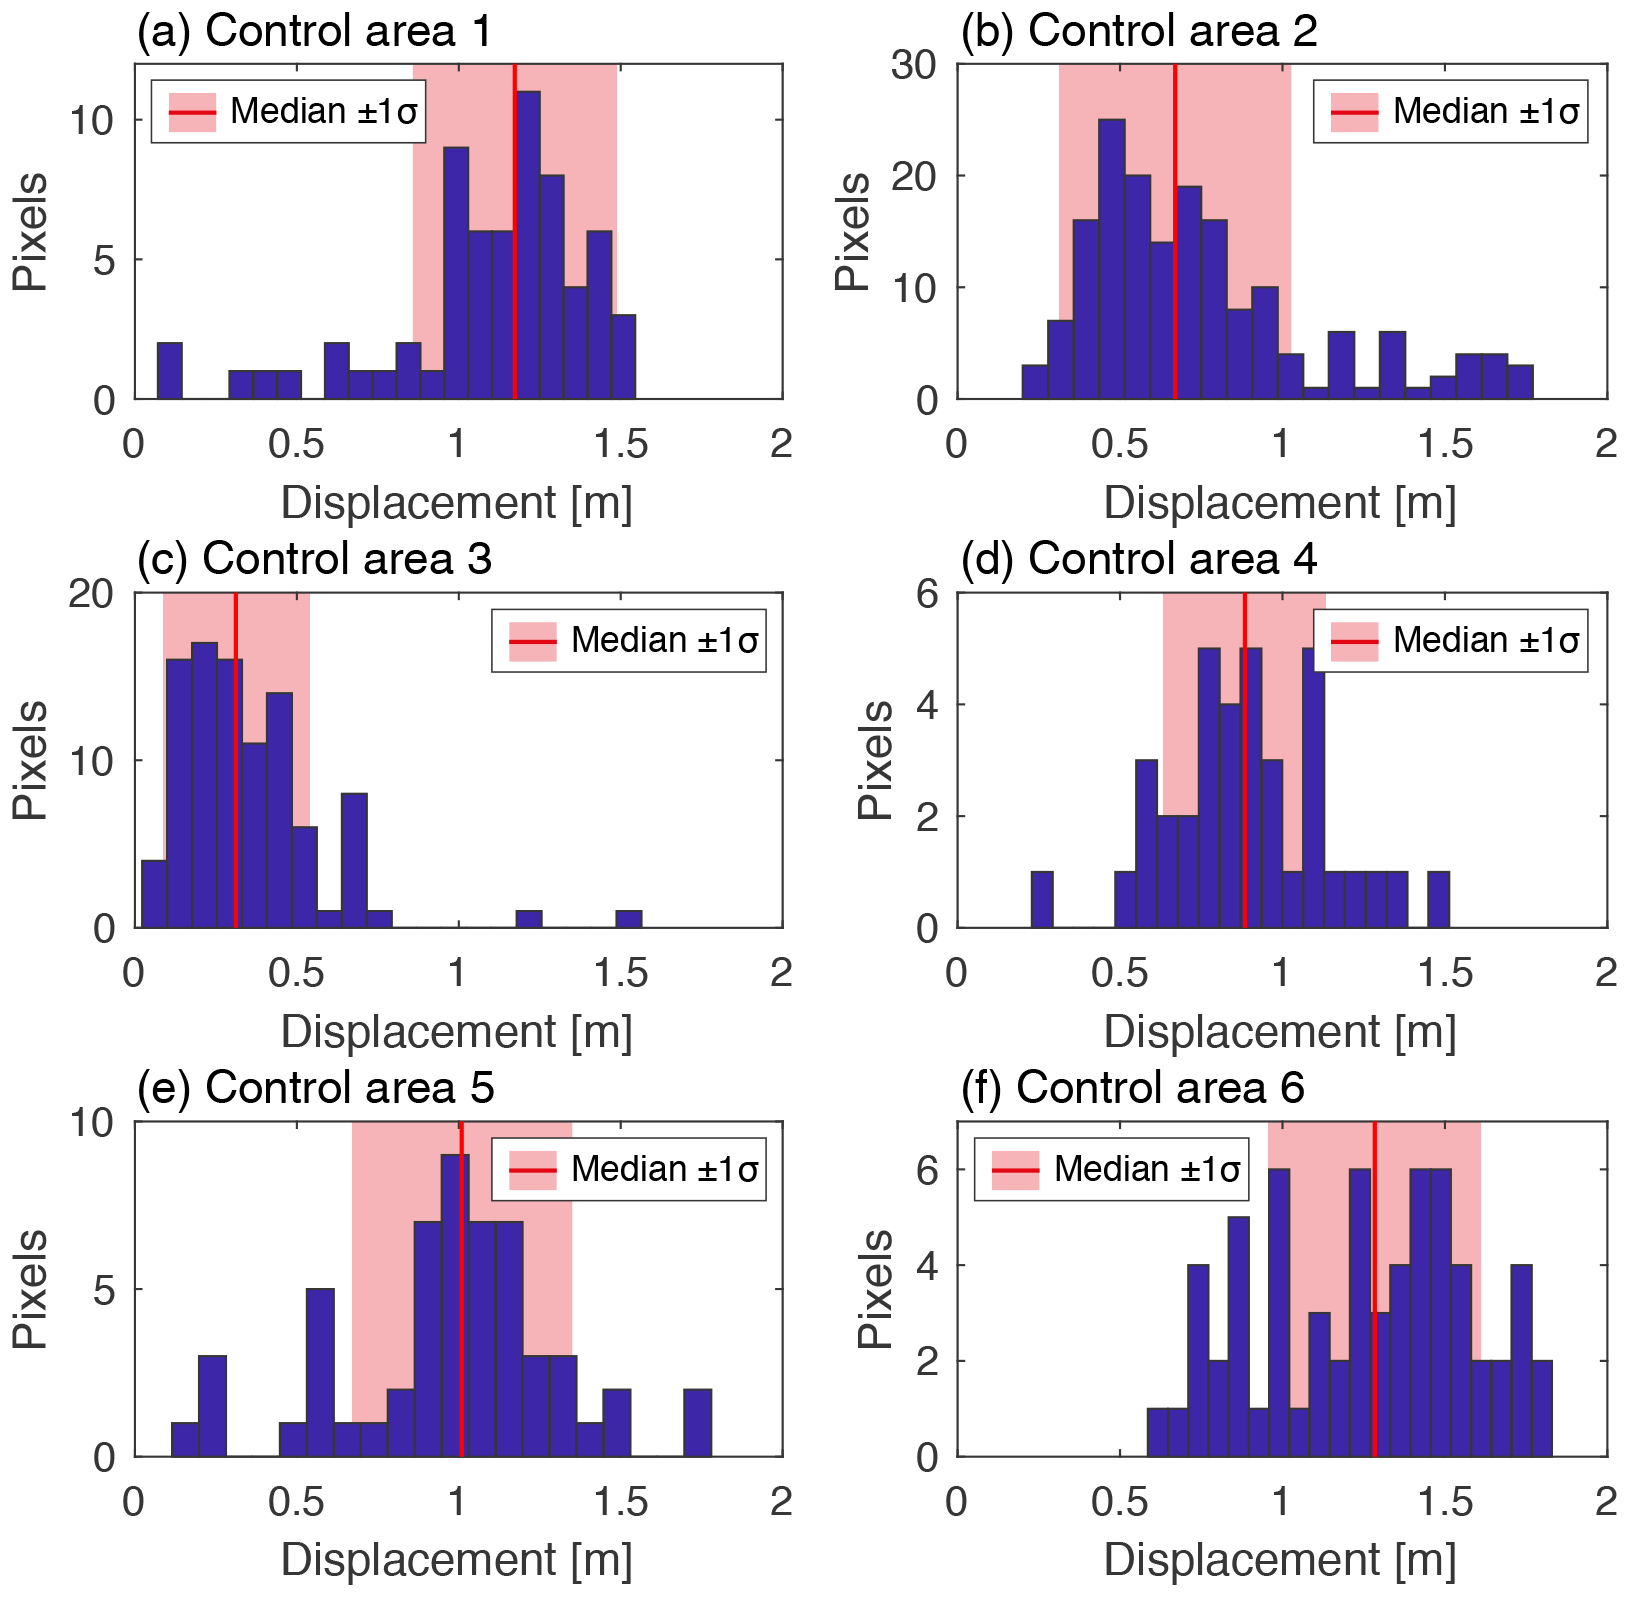
Figure A2Histograms and median values of the surface displacement for each control area, as shown in Figs. 3 and A1.
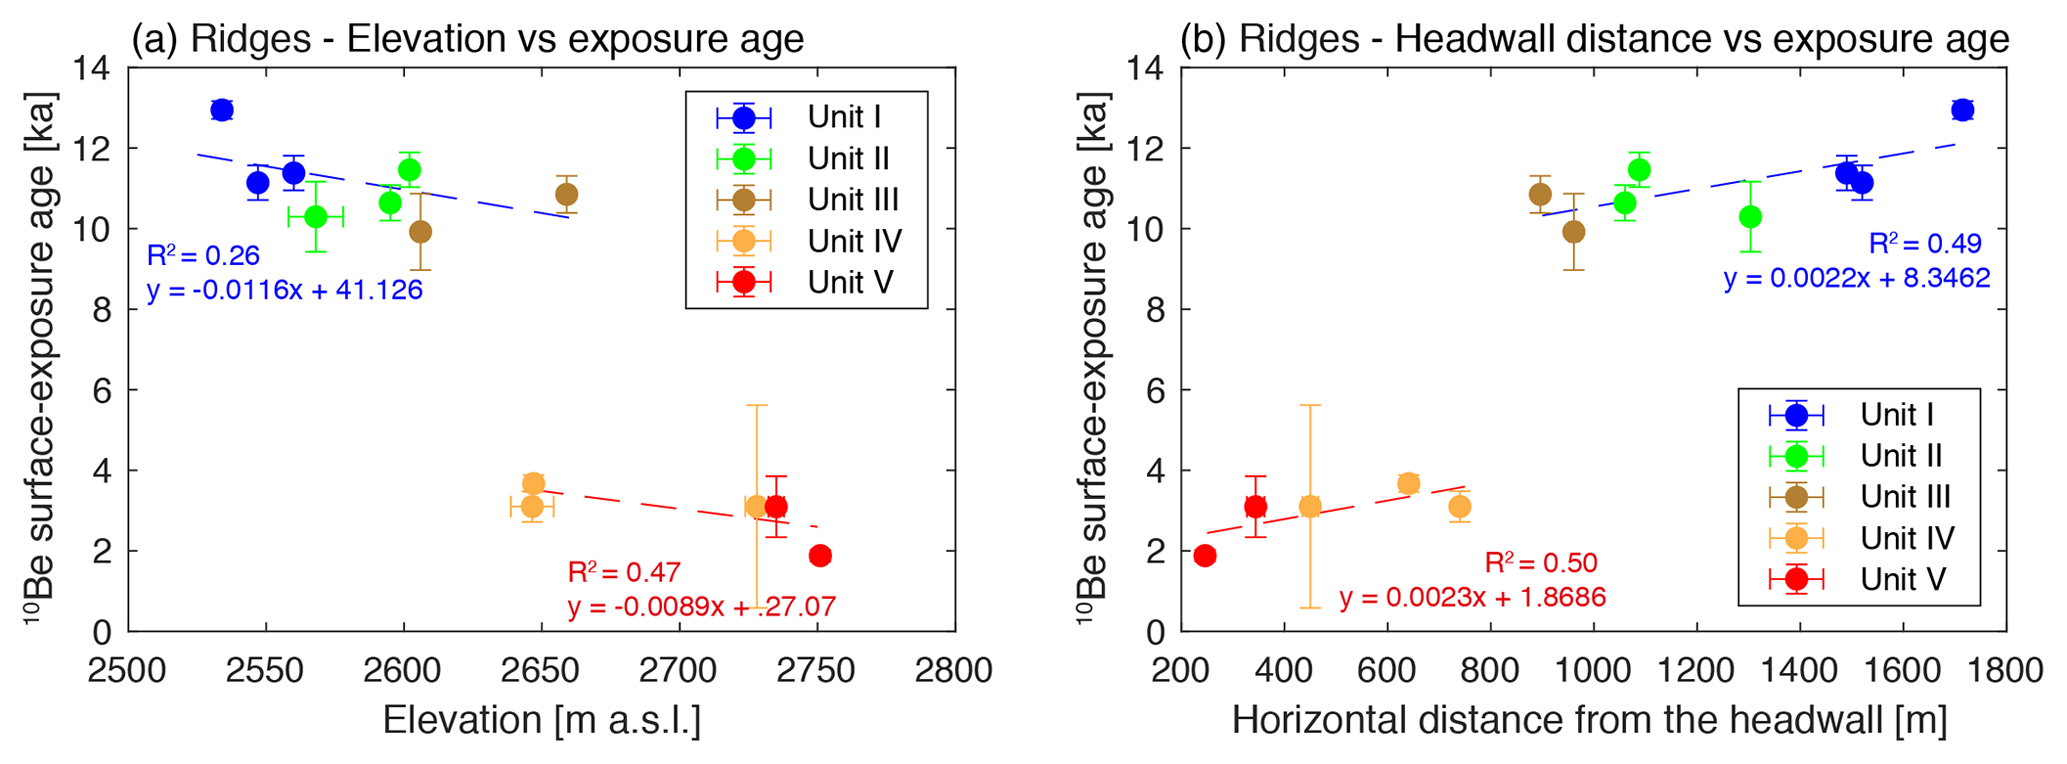
Figure A3The 10Be surface-exposure ages of individual ridges (a, b) plotted against elevation (a) and horizontal distance to the headwall (b). The dashed red and blue lines represent the linear regressions for cluster 1 (units I, II, and III) and 2 (units IV and V), respectively.
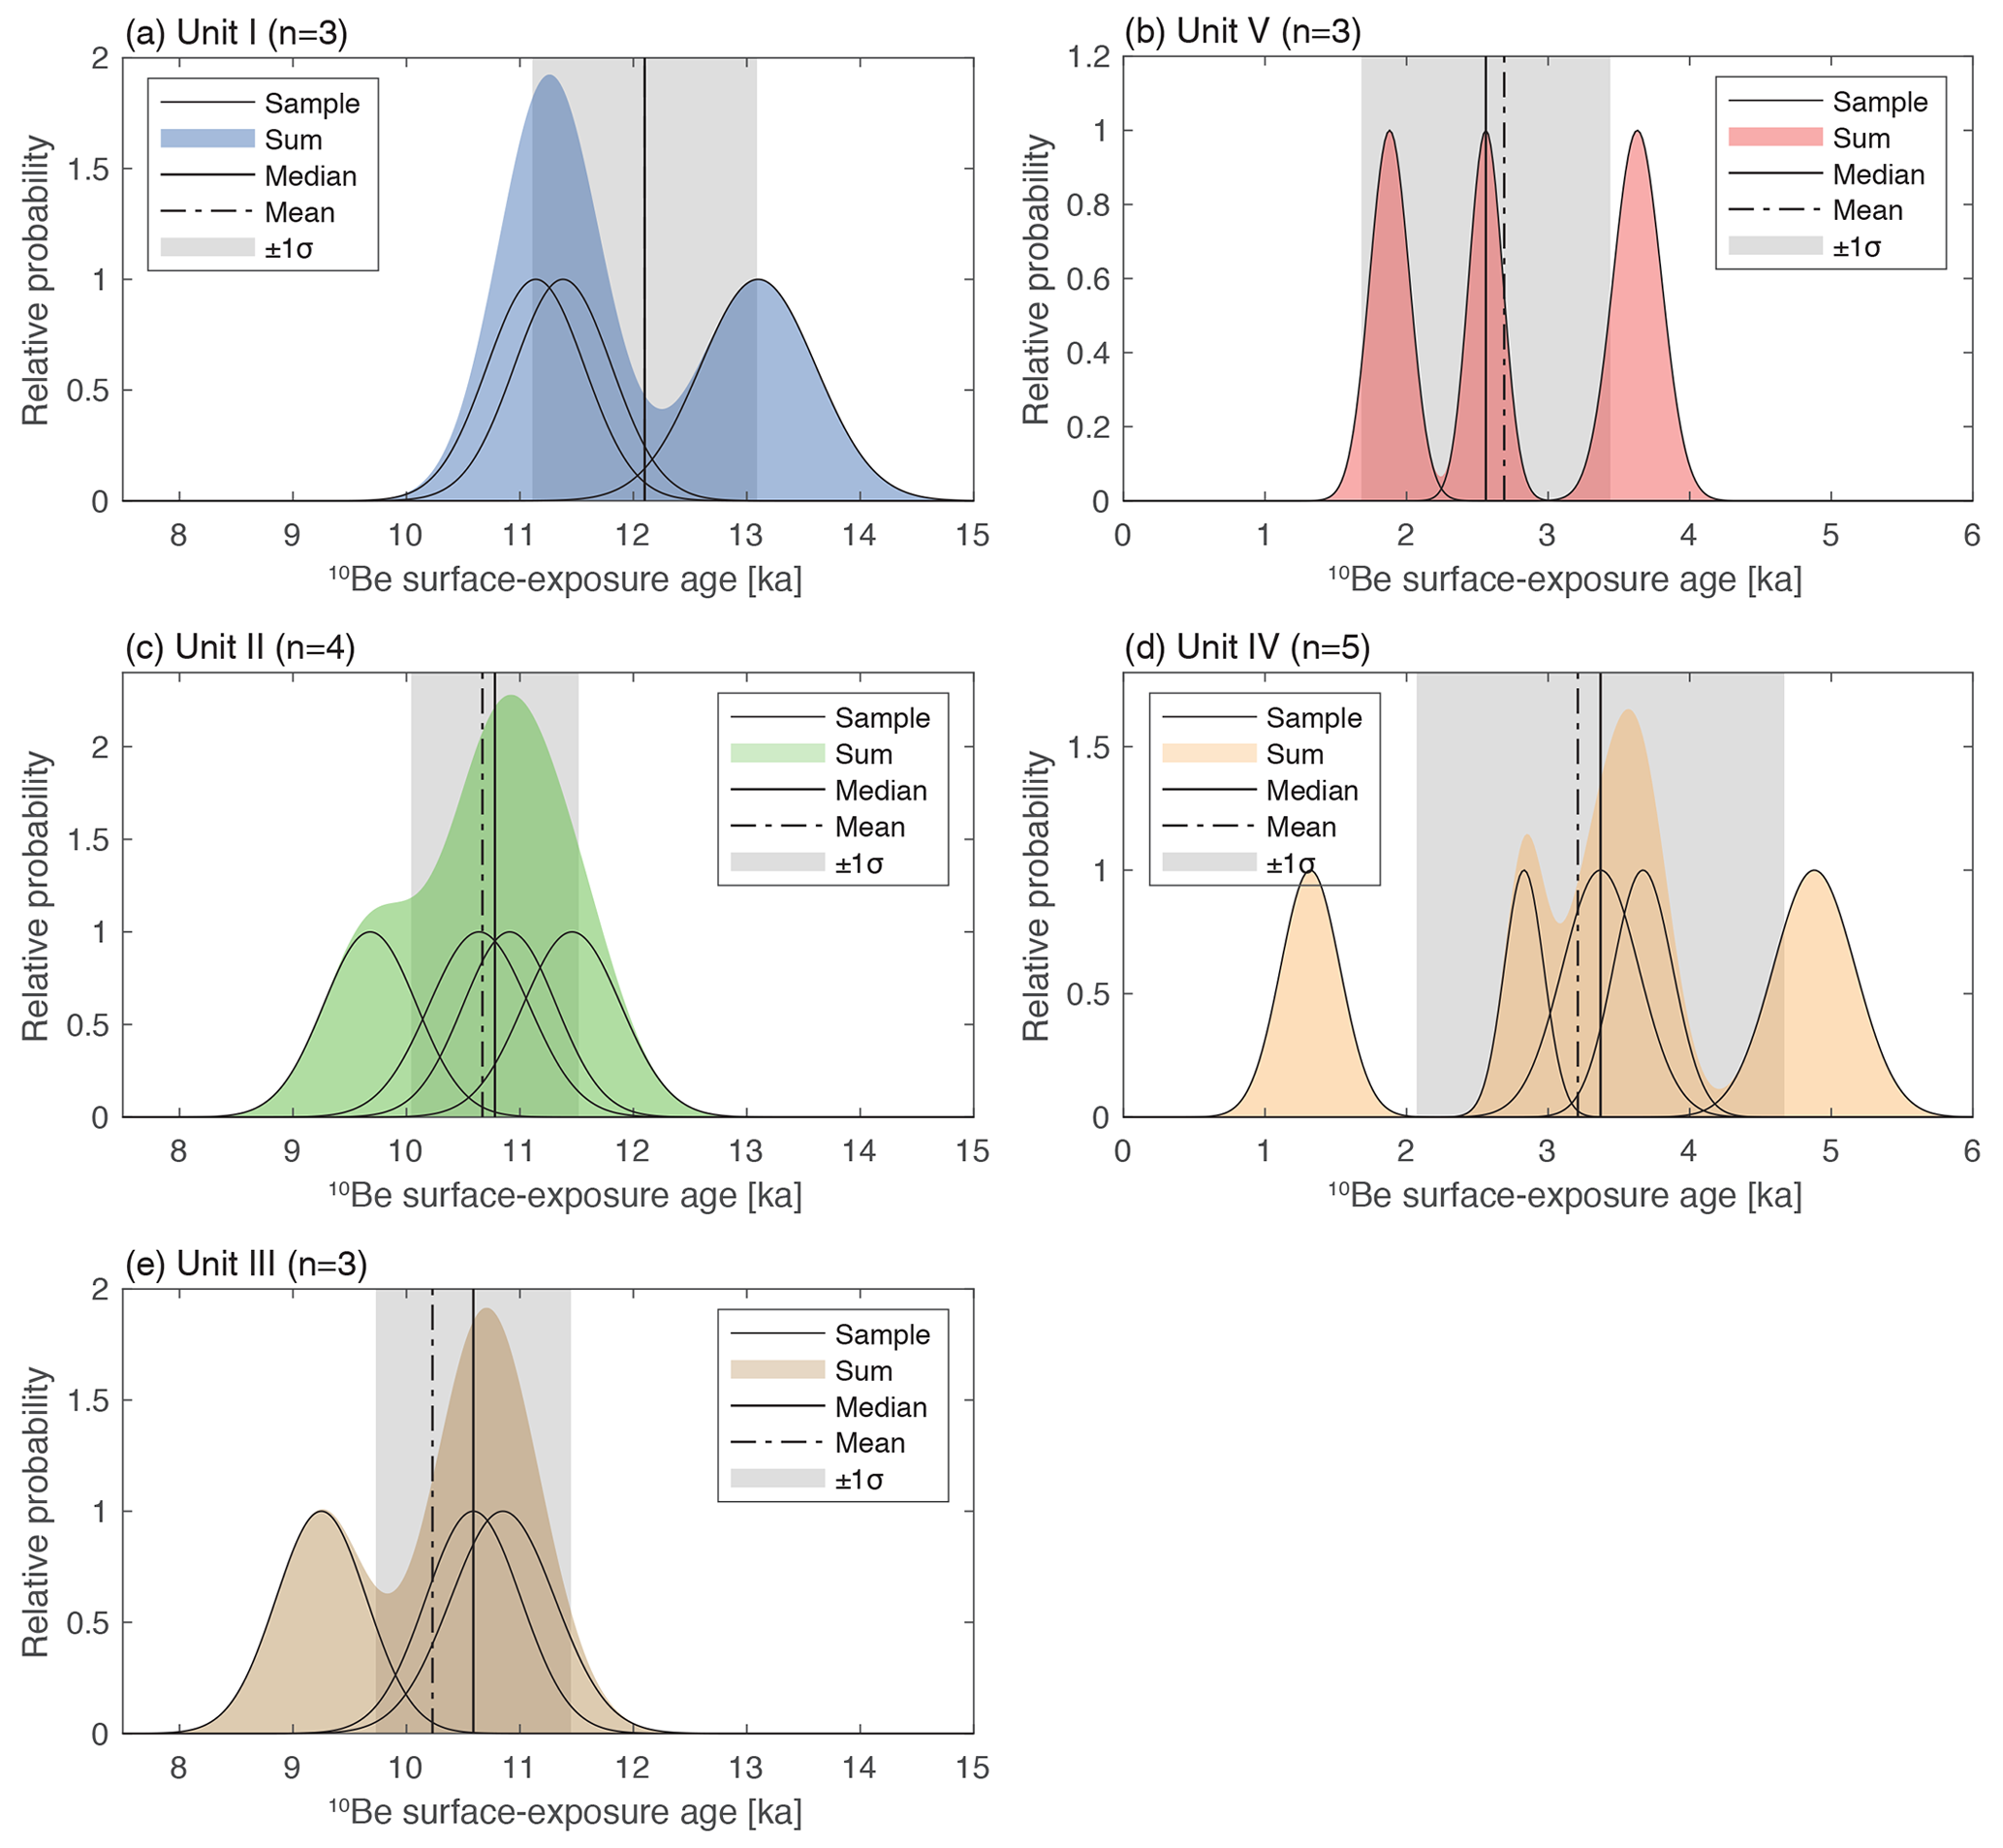
Figure A4Probability distributions of the 10Be surface-exposure ages for individual samples with sum, mean, median, and standard deviation given for each unit.
Table A2Results of the manual control point assessment between the orthomosaics of 1960 and 2018. Locations of the points are shown in Figs. 3 and A1. Coordinates are mentioned in the EPSG:2154 – RGF93 v1/Lambert-93 systems.
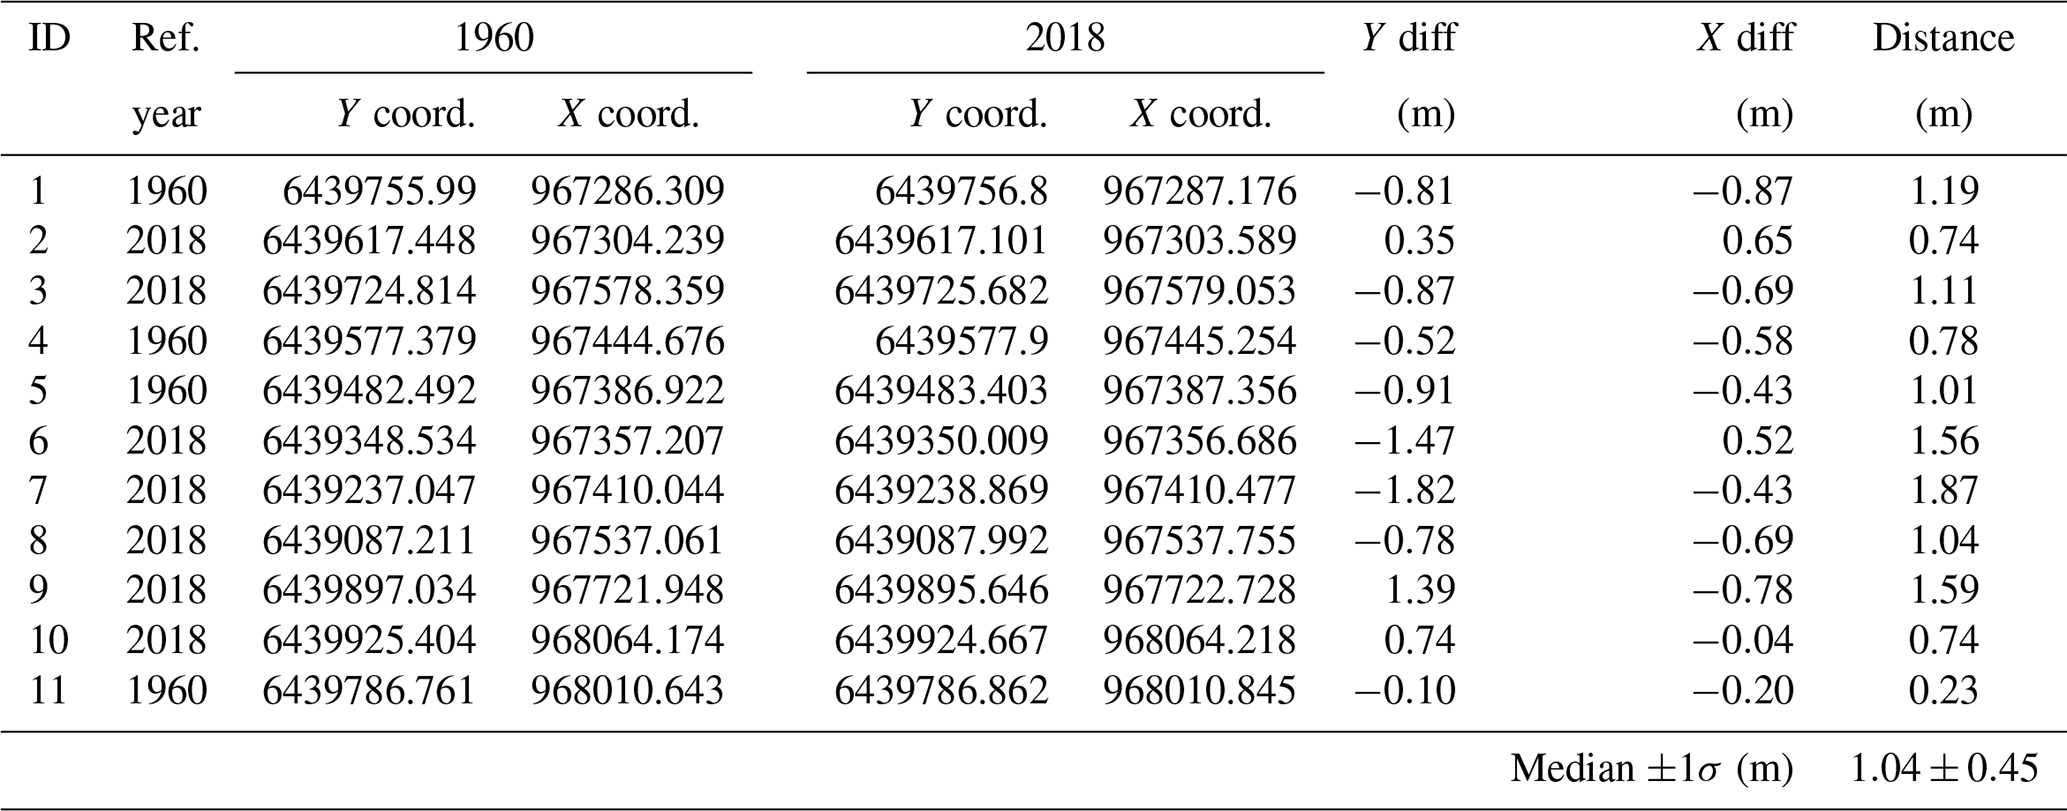
Table A3Statistics of the rock glacier, units, and control areas from the IMCORR analysis. The total area of both orthomosaics is 3 067 391 m2.
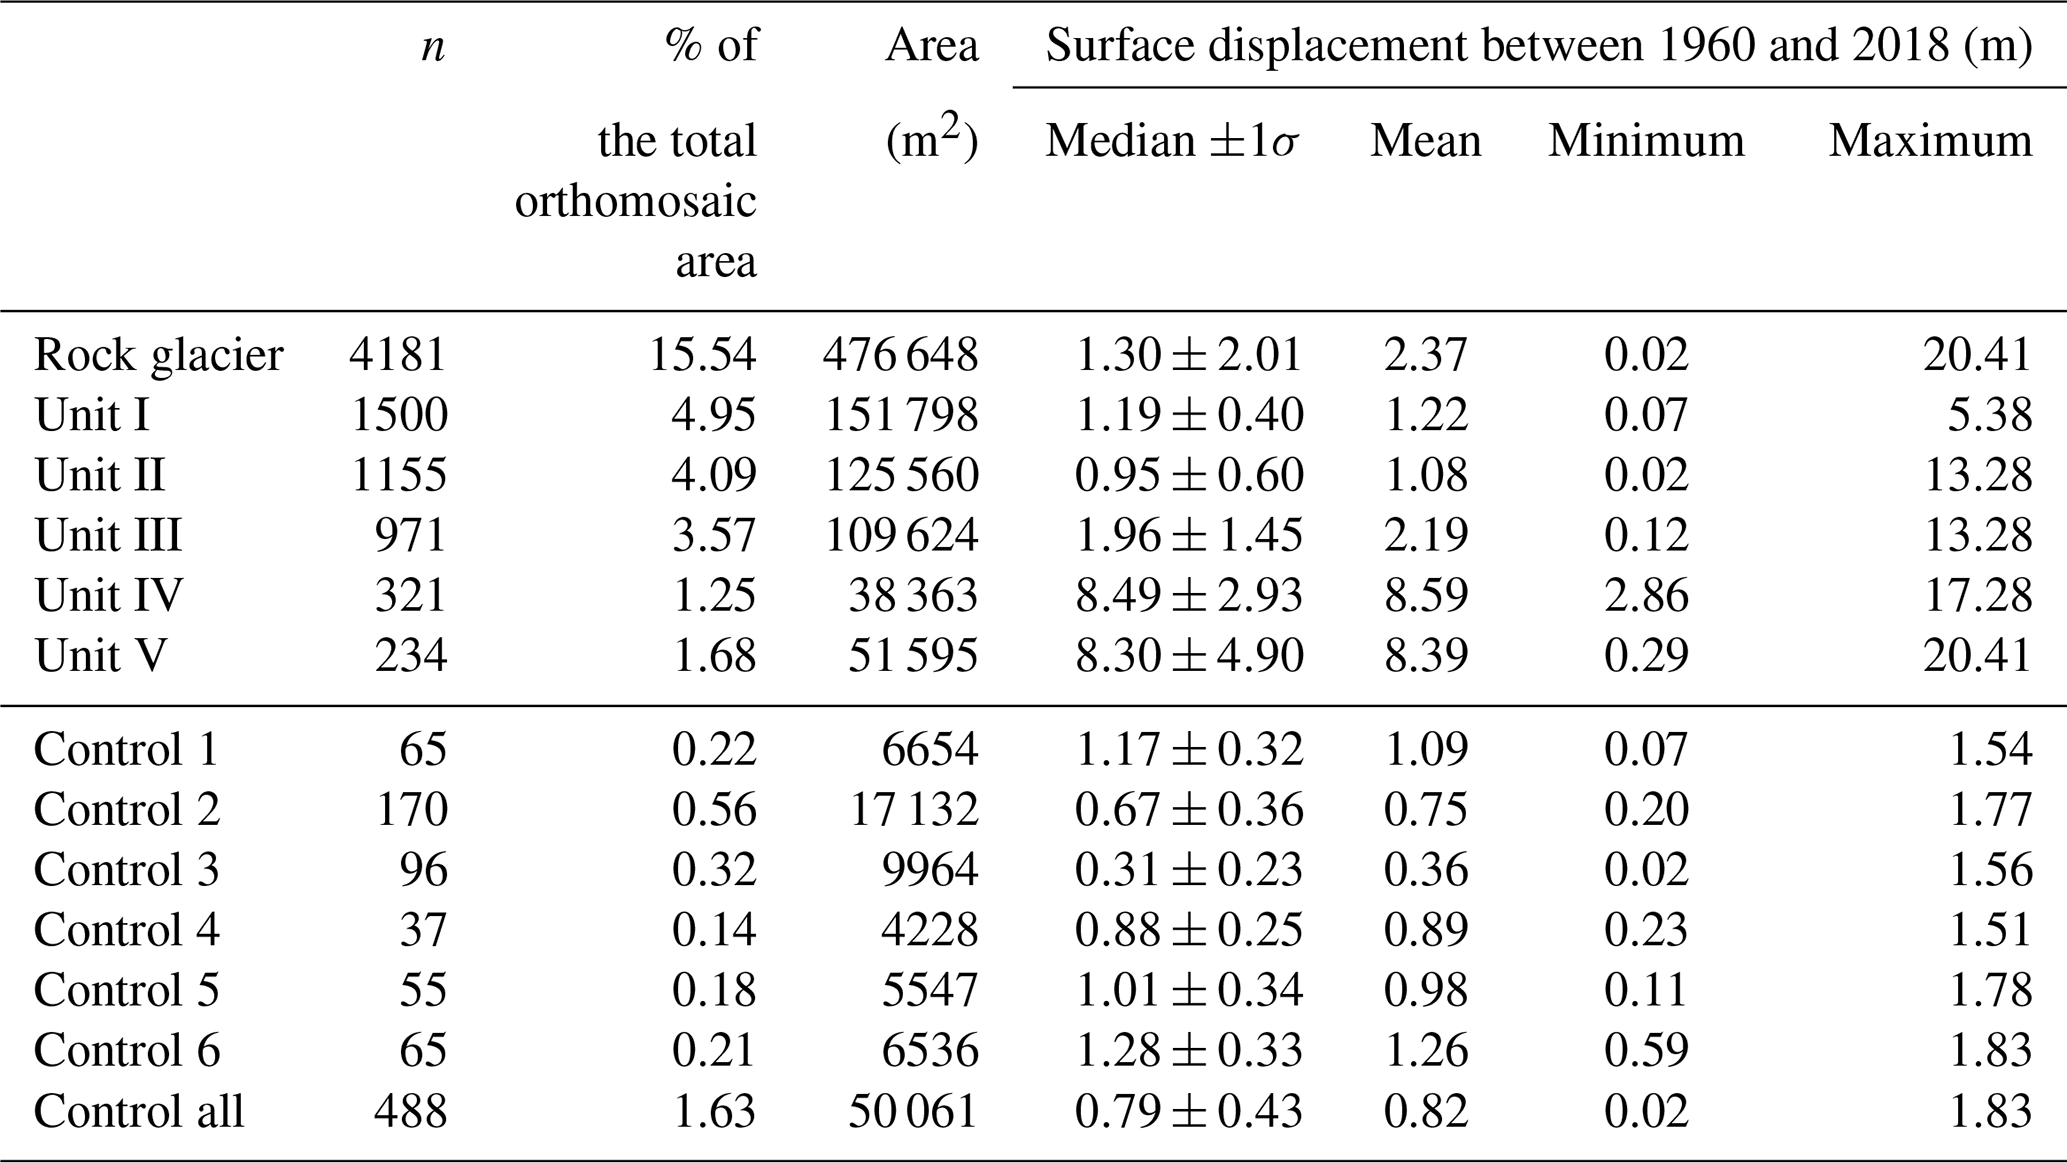
The inversion code used in Sect. 5.3 is publicly available and can be found using the following link: https://doi.org/10.5281/zenodo.6686296 (Lehmann, 2022). The code name is “Inversion_ActivityPhase_from_10Be_result.m”.
Remote sensing datasets are available upon request to the corresponding author.
BL and RSA designed the study. BL and XB chose the study site and collected the samples in the field. PGV and JC supervised the TCN lab work of BL and provided the financial support for the TCN dating. BL and DC performed the remote sensing analysis. BL and RSA wrote the numerical modeling experiments. All authors contributed to the writing of the manuscript.
The contact author has declared that neither they nor their co-authors have any competing interests.
Publisher's note: Copernicus Publications remains neutral with regard to jurisdictional claims in published maps and institutional affiliations.
This study has been funded through the Mobility Fellowship P2LAP2_191400 of the Swiss National Science Foundation. The authors acknowledge the Joseph Fourier alpine station for providing logistical and hosting support during the field campaign and the ASTER team (Karim Keddadouche, George Aumaitre, Regis Braucher, and Vincent Godard) for AMS analyses. The TRB team (ISTerre) is acknowledged for providing financial support for TCN dating. Pierre G. Valla acknowledges funding from the Swiss National Science Foundation (SNSF, grant no. 639 PP00P2_170559) and the French ANR-PIA program (grant no. ANR-18-MPGA-0006). We acknowledge the Kalideos-Alpes project (https://alpes.kalideos.fr, last access: 15 June 2022), funded by the French Space Agency (Centre National d'Etudes Spatiales, CNES) and the Investissements d'Avenir program “Risk@UGA” (ANR-15-IDEX-02) for providing the Pleiades high-resolution satellite image. Finally, we thank Marcelo Fernandes and the anonymous reviewer for their input on the manuscript and editors the Susan Conway, Andreas Lang, and Polina Shvedko for handling the manuscript.
This research has been supported by the Schweizerischer Nationalfonds zur Förderung der Wissenschaftlichen Forschung (grant no. P2LAP2_191400).
This paper was edited by Susan Conway and reviewed by Marcelo Fernandes and one anonymous referee.
Amschwand, D., Ivy-Ochs, S., Frehner, M., Steinemann, O., Christl, M., and Vockenhuber, C.: Deciphering the evolution of the Bleis Marscha rock glacier (Val d'Err, eastern Switzerland) with cosmogenic nuclide exposure dating, aerial image correlation, and finite element modeling, The Cryosphere, 15, 2057–2081, https://doi.org/10.5194/tc-15-2057-2021, 2021.
Anderson, R. S., Anderson, L. S., Armstrong, W. H., Rossi, M. W., and Crump, S. E.: Glaciation of alpine valleys: The glacier – debris-covered glacier – rock glacier continuum, Geomorphology, 311, 127–142, https://doi.org/10.1016/j.geomorph.2018.03.015, 2018.
Andrés, N., Gómez-Ortiz, A., Fernández-Fernández, J. M., Tanarro, L. M., Salvador-Franch, F., Oliva, M., and Palacios, D.: Timing of deglaciation and rock glacier origin in the southeastern Pyrenees: a review and new data, Boreas, 47, 1050–1071, https://doi.org/10.1111/bor.12324, 2018.
Balco, G., Stone, J. O., Lifton, N. A., and Dunai, T. J.: A complete and easily accessible means of calculating surface exposure ages or erosion rates from 10Be and 26Al measurements, Quatern. Geochronol., 3, 174–195, https://doi.org/10.1016/J.QUAGEO.2007.12.001, 2008.
Barbier, R., Barféty, J.-C., Bocquet, A., Bordet P., Le Fort, P., and Meloux, J.: La Grave “Aiguilles d'Arves – Col du Lautaret”, Carte géologique à , BRGM, Orléans, 1973.
Barboux, C., Delaloye, R., and Lambiel, C.: Inventorying slope movements in an Alpine environment using DInSAR, Earth Surf. Proc. Land., 39, 2087–2099, https://doi.org/10.1002/ESP.3603, 2014.
Barsch, D.: Ein Permafrostprofil aus Graubünden, Schweizer Alpen, Z. Geomorphol., 21, 79–86, 1977.
Berthling, I.: Beyond confusion: Rock glaciers as cryo-conditioned landforms, Geomorphology, 131, 98–106, https://doi.org/10.1016/J.GEOMORPH.2011.05.002, 2011.
Blöthe, J. H., Halla, C., Schwalbe, E., Bottegal, E., Trombotto Liaudat, D., and Schrott, L.: Surface velocity fields of active rock glaciers and ice-debris complexes in the Central Andes of Argentina, Earth Surf. Proc. Land., 46, 504–522, https://doi.org/10.1002/esp.5042, 2021.
Bodin, X.: Géodynamique du pergélisol de montagne: fonctionnement, distribution et évolution récente. L'exemple du massif du Combeynot (Hautes Alpes), thèse de doctorat, Université Paris-Diderot, p. 274, https://tel.archives-ouvertes.fr/tel-00203233/document (last access: 22 June 2022), 2007.
Bodin, X.: Present status and development of rock glacier complexes in south-faced valleys (45∘ N, French Alps), Geografia Fisica e Dinamica Quaternaria, 36, 27–38, https://doi.org/10.4461/GFDQ.2013.36.2, 2013.
Bodin, X., Thibert, E., Sanchez, O., Rabatel, A., and Jaillet, S.: Multi-Annual kinematics of an active rock glacier quantified from very high-resolution DEMs: An application-case in the French Alps, Remote Sens., 10, 547, https://doi.org/10.3390/rs10040547, 2018.
Böhlert, R., Compeer, M., Egli, M., Brandová, D., Maisch, M., Kubik, P. W., and Haeberli, W.: A combination of relative-numerical dating methods indicates two high alpine rock glacier activity phases after the glacier advance of the younger dryas, Open Geogr. J., 4, 115–130, 2011.
Braucher, R., Bourlès, D., Marchel, S., Vidal-Romani, J., Fernadez-Mosquera, D., Marti, K., Léanni, L., Chauvet, F., Arnold, M., Aumaître, G., and Keddadouche, K.: Determination of muon attenuation lengths in depth profiles from in situ produced cosmogenic nuclides, Nucl. Instrum. Meth. Phys. Res., 294, 484–490, https://doi.org/10.1016/j.nimb.2012.05.023, 2013.
Brown, E. T., Edmond, J. M., Raisbeck, G. M., Yiou, F., Kurz, M. D., and Brook, E. J.: Examination of surface exposure ages of Antarctic moraines using in situ produced 10Be and 26Al, Geophys. Res. Lett., 55, 2269–2283, https://doi.org/10.1016/0016-7037(91)90103-C, 1991.
Charton, J., Verfaillie, D., Jomelli, V., and Francou, B.: Early Holocene rock glacier stabilisation at col du Lautaret (French Alps): Palaeoclimatic implications, Geomorphology, 394, 107962, https://doi.org/10.1016/j.geomorph.2021.107962, 2021.
Chenet, M., Brunstein, D., Jomelli, V., Roussel, E., Rinterknecht, V., Mokadem, F., Biette, M., Robert, V., and Léanni, L.: 10Be cosmic-ray exposure dating of moraines and rock avalanches in the Upper Romanche valley (French Alps): Evidence of two glacial advances during the Late Glacial/Holocene transition, Quaternary Sci. Rev., 148, 209–221, https://doi.org/10.1016/J.QUASCIREV.2016.07.025, 2016.
Claude, A., Ivy-Ochs, S., Kober, F., Antognini, M., Salcher, B., and Kubik, P. W.: The Chironico landslide (Valle Leventina, southern Swiss Alps): age and evolution, Swiss J. Geosci., 107, 273–291, https://doi.org/10.1007/s00015-014-0170-z, 2014.
Cossart, E., Fort, M., Bourles, D., Carcaillet, J., Perrier, R., Siame, L., and Braucher, R.: Climatic significance of glacier retreat and rockglaciers re-assessed in the light of cosmogenic dating and weathering rind thickness in Clarée valley (Briançonnais, French Alps), Catena, 80, 204–219, https://doi.org/10.1016/j.catena.2009.11.007, 2010.
Coûteaux, M. and Edouard, J.-L.: La déglaciation du site du lac des Bèches (Massif des Ecrins), Etude pollenanalytique et glacio-morphologique, 75, 63–77, https://doi.org/10.3406/rga.1987.2666, 1987.
Cusicanqui, D., Rabatel, A., and Vincent, C.: Interpretation of Volume and Flux Changes of the Laurichard Rock Glacier Between 1952 and 2019, French Alps, J. Geophys. Res.-Earth, 126, e2021JF006161, https://doi.org/10.1029/2021JF006161, 2021.
Dall'Asta, E., Forlani, G., Roncella, R., Santise, M., Diotri, F., and Morra di Cella, U.: Unmanned Aerial Systems and DSM matching for rock glacier monitoring, ISPRS J. Photogram. Remote Sens., 127, 102–114, https://doi.org/10.1016/j.isprsjprs.2016.10.003, 2017.
Delaloye, R. and Echelard, T.: IPA Action Group Rock glacier inventories and kinematics (version 4.1), 1–13, https://www.google.com/url?sa=t&rct=j&q=&esrc=s&source=web&cd=&ved=2ahUKEwjvtLGEuLD4AhWVdc0KHXbGB98QFnoECAgQAQ&url=https%3A%2F%2Fbigweb.unifr.ch%2FScience%2FGeosciences%2FGeomorphology%2FPub%2FWebsite%2FIPA%2FGuidelines%2FV4%2F200507_Baseline_Concepts_Inventorying_Rock_Glaciers_V4.1.pdf&usg=AOvVaw1i3zQhaj3gemphcKQq-PEl (last access: 15 June 2022), 2020.
Delaloye, R., Lambiel, C., and Gärtner-Roer, I.: Aperçu de la cinématique des glaciers rocheux dans les alpes suisses. Rythme saisonnier, variations interannuelles et tendance pluri-décennale, Geogr. Helv., 65, 135–145, https://doi.org/10.5194/gh-65-135-2010, 2010.
Delunel, R.: Evolution géomorphologique du massif des Ecrins-Pelvoux depuis le Dernier Maximum Glaciaire-Apports des nucléides cosmogéniques produits in-situ, https://www.google.com/url?sa=t&rct=j&q=&esrc=s&source=web&cd=&ved=2ahUKEwj3gKieuLD4AhWXRs0KHehDD3EQFnoECAgQAQ&url=https%3A%2F%2Ftel.archives-ouvertes.fr%2Ftel-00511048%2Fdocument&usg=AOvVaw0In5ks4OD9WaL852Xrw6iq (last access: 15 June 2022), 2010.
Delunel, R., Bourlès, D. L., van der Beek, P. A., Schlunegger, F., Leya, I., Masarik, J., and Paquet, E.: Snow shielding factors for cosmogenic nuclide dating inferred from long-term neutron detector monitoring, Quatern. Geochronol., 24, 16–26, https://doi.org/10.1016/j.quageo.2014.07.003, 2014.
Durand, Y., Laternser, M., Giraud, G., Etchevers, P., Lesaffre, B., and Mérindol, L.: Reanalysis of 44 yr of climate in the French Alps (1958–2002): Methodology, model validation, climatology, and trends for air temperature and precipitation, J. Appl. Meteorol. Clim., 48, 429–449, https://doi.org/10.1175/2008JAMC1808.1, 2009a.
Durand, Y., Giraud, G., Laternser, M., Etchevers, P., Mérindol, L., and Lesaffre, B.: Reanalysis of 47 years of climate in the French Alps (1958–2005): Climatology and trends for snow cover, J. Appl. Meteorol. Clim., 48, 2487–2512, https://doi.org/10.1175/2009JAMC1810.1, 2009b.
Eriksen, H., Rouyet, L., Lauknes, T. R., Berthling, I., Isaksen, K., Hindberg, H., Larsen, Y., and Corner, G. D.: Recent Acceleration of a Rock Glacier Complex, Ádjet, Norway, Documented by 62 Years of Remote Sensing Observations, Geophys. Res. Lett., 45, 8314–8323, https://doi.org/10.1029/2018GL077605, 2018.
Federici, P. R., Granger, D. E., Pappalardo, M., Ribolino, A., Spagnolo, M., and Cyr, A. J.: Exposure age dating and Equilibrium Line Altitude reconstruction of an Egesen moraine in the Maritime Alps, Italy, Boreas, 37, 245–253, https://doi.org/10.1111/j.1502-3885.2007.00018.x, 2008.
Fernández-Fernández, J. M., Palacios, D., Andrés, N., Schimmelpfennig, I., Tanarro, L. M., Brynjólfsson, S., López-Acevedo, F. J., Sæmundsson, Þ., and Team, A. S. T. E. R.: Constraints on the timing of debris-covered and rock glaciers: An exploratory case study in the Hólar area, northern Iceland, Geomorphology, 361, 107196, https://doi.org/10.1016/j.geomorph.2020.107196, 2020.
Fleischer, F., Haas, F., Piermattei, L., Pfeiffer, M., Heckmann, T., Altmann, M., Rom, J., Stark, M., Wimmer, M. H., Pfeifer, N., and Becht, M.: Multi-decadal (1953–2017) rock glacier kinematics analysed by high-resolution topographic data in the upper Kaunertal, Austria, The Cryosphere, 15, 5345–5369, https://doi.org/10.5194/tc-15-5345-2021, 2021.
Francou, B.: Chutes de pierres et éboulisation dans les parois de l'étage périglaciaire, Revue de géographie alpine, 70, 279–300, https://doi.org/10.3406/rga.1982.2508, 1982.
Francou, B. and Reynaud, L.: 10-year surficial velocities on a rock glacier (Laurichard, French Alps), Permafrost Periglac. Process., 3, 209–213, https://doi.org/10.1002/ppp.3430030306, 1992.
Frauenfelder, R. and Kááb, A.: Towards a palaeoclimatic model of rock glacier formation in the Swiss Alps, Ann. Glaciol., 31, 281–286, https://doi.org/10.3189/172756400781820264, 2000.
Frehner, M., Ling, A. H. M., and Gärtner-Roer, I.: Furrow-and-ridge morphology on rockglaciers explained by gravity-driven buckle folding: A case study from the murtèl rockglacier (Switzerland), Permafrost Periglac. Process., 26, 57–66, https://doi.org/10.1002/ppp.1831, 2015.
Fuchs, M. C., Böhlert, R., Krbetschek, M., Preusser, F., and Egli, M.: Exploring the potential of luminescence methods for dating Alpine rock glaciers, Quatern. Geochronol., 18, 17–33, https://doi.org/10.1016/j.quageo.2013.07.001, 2013.
Gallach, X., Ravanel, L., Egli, M., Brandova, D., Schaepman, M., Christl, M., Gruber, S., Deline, P., Carcaillet, J., and Pallandre, F.: Timing of rockfalls in the Mont Blanc massif (Western Alps): evidence from surface exposure dating with cosmogenic 10Be, Landslides, 15, 1991–2000, https://doi.org/10.1007/s10346-018-0999-8, 2018.
García-Ruiz, J. M., Palacios, D., Fernández-Fernández, J. M., Andrés, N., Arnáez, J., Gómez-Villar, A., Santos-González, J., Álvarez-Martínez, J., Lana-Renault, N., Léanni, L., and ASTER Team: Glacial stages in the Peña Negra valley, Iberian Range, northern Iberian Peninsula: Assessing the importance of the glacial record in small cirques in a marginal mountain area, Geomorphology, 362, 107195, https://doi.org/10.1016/j.geomorph.2020.107195, 2020.
Gardent, M., Rabatel, A., Dedieu, J. P., and Deline, P.: Multitemporal glacier inventory of the French Alps from the late 1960s to the late 2000s, Global Planet. Change, 120, 24–37, https://doi.org/10.1016/j.gloplacha.2014.05.004, 2014.
Giardino, J. R. and Vitek, J. D.: The significance of rock glaciers in the glacial-periglacial landscape continuum, J. Quaternary Sci., 3, 97–103, https://doi.org/10.1002/jqs.3390030111, 1988.
Gilbert, G. K.: Systematic Asymmetry of Crest Lines in the High Sierra of California, J. Geol., 12, 579–588, https://doi.org/10.1086/621182, 1904.
Gosse, J. C. and Phillips, F. M.: Terrestrial in situ cosmogenic nuclides: Theory and application, Quaternary Sci. Rev., 20, 1475–1560, https://doi.org/10.1016/S0277-3791(00)00171-2, 2001.
Haeberli, W.: Mountain permafrost – research frontiers and a special long-term challenge, Cold Reg. Sci. Technol., 96, 71–76, https://doi.org/10.1016/j.coldregions.2013.02.004, 2013.
Haeberli, W., Hallet, B., Arenson, L., Elconin, R., Humlum, O., Kääb, A., Kaufmann, V., Ladanyi, B., Matsuoka, N., Springman, S., and Mühll, D. V.: Permafrost creep and rock glacier dynamics, Permafrost Periglac. Process., 17, 189–214, https://doi.org/10.1002/ppp.561, 2006.
Hippolyte, J. C., Bourlès, D., Braucher, R., Carcaillet, J., Léanni, L., Arnold, M., and Aumaitre, G.: Cosmogenic 10Be dating of a sackung and its faulted rock glaciers, in the Alps of Savoy (France), Geomorphology, 108, 312–320, https://doi.org/10.1016/j.geomorph.2009.02.024, 2009.
Hofmann, F. M., Alexanderson, H., Schoeneich, P., Mertes, J. R., and Léanni, L.: Post-Last Glacial Maximum glacier fluctuations in the southern Écrins massif (westernmost Alps): insights from 10Be cosmic ray exposure dating, Boreas, 48, 1019–1041, https://doi.org/10.1111/BOR.12405, 2019.
Hormes, A., Ivy-Ochs, S., Kubik, P. W., Ferreli, L., and Maria Michetti, A.: 10Be exposure ages of a rock avalanche and a late glacial moraine in Alta Valtellina, Italian Alps, Quatern. Int., 190, 136–145, https://doi.org/10.1016/j.quaint.2007.06.036, 2008.
Humlum, O.: The geomorphic significance of rock glaciers: Estimates of rock glacier debris volumes and headwall recession rates in West Greenland, Geomorphology, 35, 41–67, https://doi.org/10.1016/S0169-555X(00)00022-2, 2000.
Ikeda, A. and Matsuoka, N.: Pebbly versus bouldery rock glaciers: Morphology, structure and processes, Geomorphology, 73, 279–296, https://doi.org/10.1016/j.geomorph.2005.07.015, 2006.
Ikeda, A., Matsuoka, N., and Kääb, A.: Fast deformation of perennially frozen debris in a warm rock glacier in the Swiss Alps: An effect of liquid water, J. Geophys. Res.-Earth, 113, F01021, https://doi.org/10.1029/2007JF000859, 2008.
Ivy-Ochs, S.: Glacier variations in the European Alps at the end of the last glaciation, Cuadernos de investigación geográfica/Geographical Research Letters, 41, 295–315, https://doi.org/10.18172/CIG.2750, 2015.
Ivy-Ochs, S., Kerschner, H., Kubik, P. W., and Schlüchter, C.: Glacier response in the European Alps to Heinrich Event 1 cooling: The Gschnitz stadial, J. Quaternary Sci., 21, 115–130, https://doi.org/10.1002/jqs.955, 2006.
Ivy-Ochs, S., Kerschner, H., Reuther, A., Preusser, F., Heine, K., Maisch, M., Kubik, P. W., and Schlüchter, C.: Chronology of the last glacial cycle in the European Alps, J. Quaternary Sci., 23, 559–573, https://doi.org/10.1002/jqs.1202, 2008.
Johnson, P. G.: Glacier- rock glacier transition in the southwest Yukon Territory, Canada, Arct. Alp. Res., 12, 195–204, https://doi.org/10.2307/1550516, 1980.
Jones, D. B., Harrison, S., Anderson, K., and Whalley, W. B.: Rock glaciers and mountain hydrology: A review, Earth-Sci. Rev., 193, 66–90, https://doi.org/10.1016/j.earscirev.2019.04.001, 2019.
Kaab, A., Haeberli, W., and Hilmar Gudmundsson, G.: Analysing the creep of mountain permafrost using high precision aerial photogrammetry: 25 years of monitoring Gruben rock glacier, Swiss Alps, Permafrost Periglac. Process., 8, 409–426, https://doi.org/10.1002/(SICI)1099-1530(199710/12)8:4<409::AID-PPP267>3.0.CO;2-C, 1997.
Kääb, A., Strozzi, T., Bolch, T., Caduff, R., Trefall, H. kon, Stoffel, M., and Kokarev, A.: Inventory and changes of rock glacier creep speeds in Ile Alatau and Kungöy Ala-Too, northern Tien Shan, since the 1950s, The Cryosphere, 15, 927–949, https://doi.org/10.5194/tc-15-927-2021, 2021.
Kellerer-Pirklbauer, A.: Potential weathering by freeze-thaw action in alpine rocks in the European Alps during a nine year monitoring period, Geomorphology, 296, 113–131, https://doi.org/10.1016/j.geomorph.2017.08.020, 2017.
Kellerer-Pirklbauer, A. and Rieckh, M.: Monitoring nourishment processes in the rooting zone of an active rock glacier in an alpine environment, Z. Geomorphol., 60, 99–121, https://doi.org/10.1127/zfg_suppl/2016/00245, 2016.
Kelly, M. A., Buoncristiani, J. F., and Schlüchter, C.: A reconstruction of the last glacial maximum (LGM) ice-surface geometry in the western Swiss Alps and contiguous Alpine regions in Italy and France, Ecl. Geolog. Helvet., 97, 57–75, https://doi.org/10.1007/s00015-004-1109-6, 2004.
Kenner, R., Phillips, M., Limpach, P., Beutel, J., and Hiller, M.: Monitoring mass movements using georeferenced time-lapse photography: Ritigraben rock glacier, western Swiss Alps, Cold Reg. Sci. Technol., 145, 127–134, https://doi.org/10.1016/j.coldregions.2017.10.018, 2018.
Kohl, C. P. and Nishiizumi, K.: Chemical isolation of quartz for measurement of in-situ-produced cosmogenic nuclides, Geochim. Cosmochim. Ac., 56, 3583–3587, https://doi.org/10.1016/0016-7037(92)90401-4, 1992.
Konrad, S. K., Humphrey, N. F., Steig, E. J., Clark, D. H., Potter, N., and Pfeffer, W. T.: Rock glacier dynamics and paleoclimatic implications, Geology, 27, 1131–1134, https://doi.org/10.1130/0091-7613(1999)027<1131:RGDAPI>2.3.CO;2, 1999.
Krainer, K., Bressan, D., Dietre, B., Haas, J. N., Hajdas, I., Lang, K., Mair, V., Nickus, U., Reidl, D., Thies, H., and Tonidandel, D.: A 10,300-year-old permafrost core from the active rock glacier Lazaun, southern Ötztal Alps (South Tyrol, northern Italy), Quatern. Res., 83, 324–335, https://doi.org/10.1016/J.YQRES.2014.12.005, 2015.
Lehmann, B.: BenjaminLehmann/Esurf2022: Esurf2022_code_data, Zenodo [code and data set], https://doi.org/10.5281/zenodo.6686296, 2022.
Lehmann, B., Herman, F., Valla, P. G., King, G. E., Biswas, R. H., Ivy-Ochs, S., Steinemann, O., and Christl, M.: Postglacial erosion of bedrock surfaces and deglaciation timing: New insights from the Mont Blanc massif (western Alps), Geology, 48, 139–144, https://doi.org/10.1130/G46585.1, 2020.
Le Roy, M., Deline, P., Carcaillet, J., Schimmelpfennig, I., and Ermini, M.: 10Be exposure dating of the timing of Neoglacial glacier advances in the Ecrins-Pelvoux massif, southern French Alps, Quaternary Sci. Rev., 178, 118–138, https://doi.org/10.1016/j.quascirev.2017.10.010, 2017.
Lifton, N., Sato, T., and Dunai, T. J.: Scaling in situ cosmogenic nuclide production rates using analytical approximations to atmospheric cosmic-ray fluxes, Earth Planet. Sc. Lett., 386, 149–160, https://doi.org/10.1016/j.epsl.2013.10.052, 2014.
Liu, L., Millar, C. I., Westfall, R. D., and Zebker, H. A.: Surface motion of active rock glaciers in the Sierra Nevada, California, USA: Inventory and a case study using InSAR, The Cryosphere, 7, 1109–1119, https://doi.org/10.5194/tc-7-1109-2013, 2013.
Liu, Z., Zhu, J., Rosenthal, Y., Zhang, X., Otto-Bliesner, B. L., Timmermann, A., Smith, R. S., Lohmann, G., Zheng, W., and Timm, O. E.: The Holocene temperature conundrum, P. Natl. Acad. Sci. USA, 111, E3501, https://doi.org/10.1073/PNAS.1407229111, 2014.
Marcer, M., Bodin, X., Brenning, A., Schoeneich, P., Charvet, R., and Gottardi, F.: Permafrost favorability index: Spatial modeling in the French alps using a rock Glacier inventory, Front. Earth Sci., 5, 105, https://doi.org/10.3389/feart.2017.00105, 2017.
Marcer, M., Cicoira, A., Cusicanqui, D., Bodin, X., Echelard, T., Obregon, R., and Schoeneich, P.: Rock glaciers throughout the French Alps accelerated and destabilised since 1990 as air temperatures increased, Commun. Earth Environ., 2, 1–11, https://doi.org/10.1038/s43247-021-00150-6, 2021b.
Martin, L. C. P., Blard, P. H., Balco, G., Lavé, J., Delunel, R., Lifton, N., and Laurent, V.: The CREp program and the ICE-D production rate calibration database: A fully parameterizable and updated online tool to compute cosmic-ray exposure ages, Quatern. Geochronol., 38, 25–49, https://doi.org/10.1016/J.QUAGEO.2016.11.006, 2017.
Matthews, J. A. and Wilson, P.: Improved Schmidt-hammer exposure ages for active and relict pronival ramparts in southern Norway, and their palaeoenvironmental implications, Geomorphology, 246, 7–21, https://doi.org/10.1016/j.geomorph.2015.06.002, 2015.
Merchel, S. and Herpers, U.: An update on radiochemical separation techniques for the determination of long-lived radionuclides via accelerator mass spectrometry, Radiochim. Acta, 84, 215–219, https://doi.org/10.1524/ract.1999.84.4.215, 1999.
Micheletti, N., Tonini, M., and Lane, S. N.: Geomorphological activity at a rock glacier front detected with a 3D density-based clustering algorithm, Geomorphology, 278, 287–297, https://doi.org/10.1016/j.geomorph.2016.11.016, 2017.
Monegato, G., Scardia, G., Hajdas, I., Rizzini, F., and Piccin, A.: The Alpine LGM in the boreal ice-sheets game, Scient. Rep., 7, 1–8, https://doi.org/10.1038/s41598-017-02148-7, 2017.
Monnier, S. and Kinnard, C.: Reconsidering the glacier to rock glacier transformation problem: New insights from the central Andes of Chile, Geomorphology, 238, 47–55, https://doi.org/10.1016/j.geomorph.2015.02.025, 2015.
Moran, A. P., Ivy Ochs, S., Vockenhuber, C., and Kerschner, H.: Rock glacier development in the Northern Calcareous Alps at the Pleistocene-Holocene boundary, Geomorphology, 273, 178–188, https://doi.org/10.1016/j.geomorph.2016.08.017, 2016.
Necsoiu, M., Onaca, A., Wigginton, S., and Urdea, P.: Rock glacier dynamics in Southern Carpathian Mountains from high-resolution optical and multi-temporal SAR satellite imagery, Remote Sens. Environ., 177, 21–36, https://doi.org/10.1016/J.RSE.2016.02.025, 2016.
Nuth, C. and Kääb, A.: Co-registration and bias corrections of satellite elevation data sets for quantifying glacier thickness change, The Cryosphere5, 271–290, https://doi.org/10.5194/tc-5-271-2011, 2011.
Paasche, Ø., Dahl, S. O., Løvlie, R., Bakke, J., and Nesje, A.: Rockglacier activity during the Last Glacial-Interglacial transition and Holocene spring snowmelting, Quaternary Sci. Rev., 26, 793–807, https://doi.org/10.1016/j.quascirev.2006.11.017, 2007.
Palacios, D., Oliva, M., Gómez-Ortiz, A., Andrés, N., Fernández-Fernández, J. M., Schimmelpfennig, I., Léanni, L., and Team, A. S. T. E. R.: Climate sensitivity and geomorphological response of cirque glaciers from the late glacial to the Holocene, Sierra Nevada, Spain, Quaternary Sci. Rev., 248, 106617, https://doi.org/10.1016/j.quascirev.2020.106617, 2020.
Pavón-Carrasco, F. J., Osete, M. L., Torta, J. M., and de !Santis, A.: A geomagnetic field model for the Holocene based on archaeomagnetic and lava flow data, Earth Planet. Sc. Lett., 388, 98–109, https://doi.org/10.1016/j.epsl.2013.11.046, 2014.
Portenga, E. W. and Bierman, P. R.: Understanding earth's eroding surface with 10Be, GSA Today, 21, 4–10, https://doi.org/10.1130/G111A.1, 2011.
Protin, M., Schimmelpfennig, I., Mugnier, J. L., Ravanel, L., le Roy, M., Deline, P., Favier, V., Buoncristiani, J. F., Aumaître, G., Bourlès, D. L., and Keddadouche, K.: Climatic reconstruction for the Younger Dryas/Early Holocene transition and the Little Ice Age based on paleo-extents of Argentière glacier (French Alps), Quaternary Sci. Rev., 221, 105863, https://doi.org/10.1016/J.QUASCIREV.2019.105863, 2019.
Robson, B. A., MacDonell, S., Ayala, Á., Bolch, T., Nielsen, P. R., and Vivero, S.: Glacier and rock glacier changes since the 1950s in the La Laguna catchment, Chile, The Cryosphere, 16, 647–665, https://doi.org/10.5194/tc-16-647-2022, 2022.
Rodríguez-Rodríguez, L., Jiménez-Sánchez, M., Domínguez-Cuesta, M. J., Rinterknecht, V., and Pallàs, R.: Timing of last deglaciation in the Cantabrian Mountains (Iberian Peninsula; North Atlantic Region) based on in situ-produced 10Be exposure dating, Quaternary Sci. Rev., 171, 166–181, https://doi.org/10.1016/j.quascirev.2017.07.012, 2017.
Sandeman, A. F. and Ballantyne, C. K.: Talus rock glaciers in scotland: Characteristics and controls on formation, Scot. Geogr. Mag., 112, 138–146, https://doi.org/10.1080/14702549608554947, 1996.
Scambos, T. A., Dutkiewicz, M. J., Wilson, J. C., and Bindschadler, R. A.: Application of image cross-correlation to the measurement of glacier velocity using satellite image data, Remote Sens. Environ., 42, 177–186, https://doi.org/10.1016/0034-4257(92)90101-O, 1992.
Scapozza, C., Lambiel, C., Bozzini, C., Mari, S., and Conedera, M.: Assessing the rock glacier kinematics on three different timescales: A case study from the southern Swiss Alps, Earth Surf. Proc. Land., 39, 2056–2069, https://doi.org/10.1002/ESP.3599, 2014.
Schimmelpfennig, I., Schaefer, J. M., Akçar, N., Koffman, T., Ivy-Ochs, S., Schwartz, R., Finkel, R. C., Zimmerman, S., and Schlüchter, C.: A chronology of Holocene and Little Ice Age glacier culminations of the Steingletscher, Central Alps, Switzerland, based on high-sensitivity beryllium-10 moraine dating, Earth Planet. Sc. Lett., 393, 220–230, https://doi.org/10.1016/j.epsl.2014.02.046, 2014.
Schindelwig, I., Akçar, N., Kubik, P. W., and Schlüchter, C.: Lateglacial and early Holocene dynamics of adjacent valley glaciers in the Western Swiss Alps, J. Quaternary Sci., 27, 114–124, https://doi.org/10.1002/jqs.1523, 2012.
Shean, D. E., Alexandrov, O., Moratto, Z. M., Smith, B. E., Joughin, I. R., Porter, C., and Morin, P.: An automated, open-source pipeline for mass production of digital elevation models (DEMS) from very-high-resolution commercial stereo satellite imagery, ISPRS J. Photogram. Remote Sens., 116, 101–117, https://doi.org/10.1016/j.isprsjprs.2016.03.012, 2016.
Steinemann, O., Reitner, J. M., Ivy-Ochs, S., Christl, M., and Synal, H. A.: Tracking rockglacier evolution in the Eastern Alps from the Lateglacial to the early Holocene, Quaternary Sci. Rev., 241, 106424, https://doi.org/10.1016/J.QUASCIREV.2020.106424, 2020.
Strozzi, T., Caduff, R., Jones, N., Barboux, C., Delaloye, R., Bodin, X., Kääb, A., Mätzler, E., and Schrott, L.: Monitoring rock glacier kinematics with satellite synthetic aperture radar, Remote Sens., 12, 559, https://doi.org/10.3390/RS12030559, 2020.
Thibert, E., Bodin, X., Bonnefoy-Demongeot, M., and Finance, F.: Extracting the time signal in surface velocity changes along 3 decades at Laurichard rock glacier (French Alps), https://www.researchgate.net/ (last access: 15 June 2022), 2018.
Uppala, S. M., Kållberg, P. W., Simmons, A. J., Andrae, U., Bechtold, V. D. C., Fiorino, M., Gibson, J. K., Haseler, J., Hernandez, A., Kelly, G. A., Li, X., Onogi, K., Saarinen, S., Sokka, N., Allan, R. P., Andersson, E., Arpe, K., Balmaseda, M. A., Beljaars, A. C. M., Berg, L. van de, Bidlot, J., Bormann, N., Caires, S., Chevallier, F., Dethof, A., Dragosavac, M., Fisher, M., Fuentes, M., Hagemann, S., Hólm, E., Hoskins, B. J., Isaksen, L., Janssen, P. A. E. M., Jenne, R., Mcnally, A. P., Mahfouf, J.-F., Morcrette, J.-J., Rayner, N. A., Saunders, R. W., Simon, P., Sterl, A., Trenberth, K. E., Untch, A., Vasiljevic, D., Viterbo, P., and Woollen, J.: The ERA-40 re-analysis, Q. J. Roy. Meteorol. Soc., 131, 2961–3012, https://doi.org/10.1256/qj.04.176, 2005.
Valla, P. G., van der Beek, P. A., and Lague, D.: Fluvial incision into bedrock: Insights from morphometric analysis and numerical modeling of gorges incising glacial hanging valleys (Western Alps, France), J. Geophys. Res.-Earth, 115, 1–25, https://doi.org/10.1029/2008JF001079, 2010.
Vernay, M., Lafaysse, M., Hagenmuller, P., Nheili, R., Verfaillie, D., and Morin, S.: The S2M meteorological and snow cover reanalysis in the French mountainous areas (1958–present), AERIS [data set], https://doi.org/10.25326/37, 2020.
Vivero, S. and Lambiel, C.: Monitoring the crisis of a rock glacier with repeated UAV surveys, Geogr. Helv., 74, 59–69, https://doi.org/10.5194/gh-74-59-2019, 2019.
Vivero, S., Bodin, X., Farías-Barahona, D., MacDonell, S., Schaffer, N., Robson, B. A., and Lambiel, C.: Combination of Aerial, Satellite, and UAV Photogrammetry for Quantifying Rock Glacier Kinematics in the Dry Andes of Chile (30∘ S) Since the 1950s, Front. Remote Sens., 2, 42, https://doi.org/10.3389/FRSEN.2021.784015, 2021.
Wahrhaftig, C. and Cox, A.: Rock glaciers in the Alaska Range, Geol. Soc. Am. Bull., 70, 383–436, https://doi.org/10.1130/0016-7606(1959)70[383:RGITAR]2.0.CO;2, 1959.
Whalley, W. B.: Origin of rock glaciers, J. Glaciol., 13, 323–324, https://doi.org/10.3189/s0022143000023145, 1974.
Winkler, S. and Lambiel, C.: Age constraints of rock glaciers in the Southern Alps/New Zealand – Exploring their palaeoclimatic potential, Holocene, 28, 778–790, https://doi.org/10.1177/0959683618756802, 2018.
Wirsig, C., Zasadni, J., Christl, M., Akçar, N., and Ivy-Ochs, S.: Dating the onset of LGM ice surface lowering in the High Alps, Quaternary Sci. Rev., 143, 37–50, https://doi.org/10.1016/J.QUASCIREV.2016.05.001, 2016.
Wirz, V., Geertsema, M., Gruber, S., and Purves, R. S.: Temporal variability of diverse mountain permafrost slope movements derived from multi-year daily GPS data, Mattertal, Switzerland, Landslides, 13, 67–83, https://doi.org/10.1007/s10346-014-0544-3, 2016.