the Creative Commons Attribution 4.0 License.
the Creative Commons Attribution 4.0 License.
 | 30 Oct 2023
Spatial and temporal variations in rockwall erosion rates derived from cosmogenic 10Be in medial moraines at five valley glaciers around Pigne d'Arolla, Switzerland
Katharina Wetterauer
Dirk Scherler
Rockwall erosion in high-alpine glacial environments varies both temporally and spatially. Where rockwalls flank glaciers, changes in debris supply and supraglacial cover will modify ice ablation. Yet, quantifying spatiotemporal patterns in erosion across deglaciating rockwalls is not trivial. At five nearby valley glaciers around Pigne d'Arolla in Switzerland, we derived apparent rockwall erosion rates using 10Be cosmogenic nuclide concentrations ([10Be]) in medial moraine debris. Systematic downglacier sampling of six medial moraines that receive debris from rockwalls with differing orientation, slope, and deglaciation histories enabled us to assess rockwall erosion through time and to investigate how distinct spatial source rockwall morphology may express itself in medial moraine [10Be] records. Our dataset combines 24 new samples from medial moraines of Glacier du Brenay, Glacier de Cheilon, Glacier de Pièce, and Glacier de Tsijiore Nouve with 15 published samples from Glacier d'Otemma. For each sample, we simulated the glacial debris transport using a simple debris particle trajectory model to approximate the time of debris erosion and to correct the measured [10Be] for post-depositional 10Be accumulation. Our derived apparent rockwall erosion rates range between ∼ 0.6 and 10.0 mm yr−1. Whereas the longest downglacier [10Be] record presumably reaches back to the end of the Little Ice Age and suggests a systematic increase in rockwall erosion rates over the last ∼ 200 years, the shorter records only cover the last ∼ 100 years from the recent deglaciation period and indicate temporally more stable erosion rates. For the estimated time of debris erosion, ice cover changes across most source rockwalls were small, suggesting that our records are largely unaffected by the contribution of recently deglaciated bedrock of possibly different [10Be], but admixture of subglacially derived debris cannot be excluded at every site. Comparing our sites suggests that apparent rockwall erosion rates are higher where rockwalls are steep and north-facing, indicating a potential slope and temperature control on rockwall erosion around Pigne d'Arolla.
- Article
(8354 KB) - Full-text XML
-
Supplement
(5243 KB) - BibTeX
- EndNote


Alpine glacial environments are characterized by steep rockwalls near the head of valley glaciers that expose bare rock surfaces to erosion. Erosion in these environments largely proceeds via frequent small-scale rockfalls and infrequent large-scale mass-wasting processes (e.g. Boulton and Deynoux, 1981; Anderson, 2000; Arsenault and Meigs, 2005). On glacier surfaces, rockwall debris is passively entrained, becoming part of the glacial system, for example in the form of medial moraines (e.g. Eyles and Rogerson, 1978; Gomez and Small, 1985; Anderson, 2000). Where debris is transported on the surface, it alters sub-debris melt rates (Østrem, 1959) and potentially modifies glacier retreat (e.g. Scherler et al., 2011; Rowan et al., 2015; Vincent et al., 2016). The debris cover thickness and its change are influenced by the rate at which the surrounding rockwalls erode (Scherler and Egholm, 2020). However, rockwall erosion and thus debris supply rates are not spatially uniform, as evidenced by topographic asymmetry across glacial landscapes (e.g. Gilbert, 1904; Tuck, 1935; Naylor and Gabet, 2007). Although such asymmetry is commonly associated with spatial and temporal gradients in erosion, the underlying conditions are still controversial.
In the European Alps, recent temporal and spatial variability in rockwall erosion has been commonly linked to post-Little Ice Age (LIA; approximately post-1850) warming and/or to locally distinct temperature-related conditions. As temperatures increase and permafrost thaws, the stability of alpine rockwalls decreases, promoting rockfalls and slope failures (e.g. Gruber and Haeberli, 2007; Huggel et al., 2010; Ravanel et al., 2010; Fischer et al., 2012). Enhanced destabilization is also observed in recently deglaciating bedrock, where glacial thinning and unloading are thought to affect the thermomechanical stress field and frost damage intensity within the adjacent bedrock (e.g. Wegmann et al., 1998; Kenner et al., 2011; Hartmeyer et al., 2020). Spatial variability in erosion has previously been related to rock face aspect, and higher rockfall activity at north-facing rockwalls has been associated with differences in moisture supply and damage by frost (e.g. Coutard and Francou, 1989; Gruber et al., 2004; Sass, 2005, 2010). Yet, rockfalls are pronounced stochastic processes (e.g. Ward and Anderson, 2011; Sanders et al., 2013), and their observation is typically based on repeated monitoring over comparatively short time periods (100–101 years). Therefore, the number of quantified rockwall erosion rates and their spatiotemporal analyses are still limited.
An alternative approach for quantifying rockwall erosion rates over longer time periods (> 102–104 years) uses downglacier records of in situ-produced cosmogenic 10Be concentrations ([10Be], atoms g−1) in medial moraines. By interval sampling along medial moraines, rockwall erosion is quantified through time based on the [10Be] within the debris that reflects the rockwall erosion products. The approach exploits the conveyor-belt nature of glaciers: passively transported rockwall debris forms medial moraines as it melts out below the equilibrium line altitude (ELA) in the glacier ablation zone or as it is merged from individual glacier branches (e.g. Eyles and Rogerson, 1978; Gomez and Small, 1985; Anderson, 2000). Thus, medial moraine deposits tend to be older downglacier (for detailed treatments on rockwall [10Be] in medial moraine debris see Ward and Anderson, 2011; Scherler and Egholm, 2020; Wetterauer et al., 2022a). Previous work from the Himalaya (Scherler and Egholm, 2020) and the Swiss Alps (Wetterauer et al., 2022a) suggests that medial moraines can indeed act as archives for the temporal evolution of rockwall erosion. At both sites, downglacier records indicate an acceleration in erosion rates with climate warming, consistent with the aforementioned monitoring observations. However, using [10Be] from supraglacial debris has also proven challenging: medial moraine [10Be] likely reflects a mixed signal of rockwall erosion, rockwall deglaciation, and englacial–supraglacial transport time, and our understanding of how these processes affect erosion rate estimates is still limited.
This study examines patterns of rockwall erosion in a broader context using medial moraine [10Be] records from five valley glaciers surrounding the Pigne d'Arolla, a Swiss mountain peak in the canton of Valais. We aim to (i) further evaluate the systematics of medial moraine [10Be]-derived estimates of rockwall erosion rates, (ii) check for temporal trends along downglacier medial moraine records, and (iii) test for differences among rockwall erosion rates in relation to spatially distinct geomorphic rockwalls. This study expands the work by Wetterauer et al. (2022a) on the Glacier d'Otemma, closely resembling their approach to remain as comparable as possible. As an extension to their previous strategy of assessing the temporal evolution of rockwall erosion rates from downglacier medial moraine [10Be] records, we now additionally integrate the comparison of records from several different glaciers with varied source rockwalls in the same area to capture possible spatial patterns in rockwall erosion. In addition to the records from Glacier d'Otemma, our new rockwall erosion dataset comprises downglacier [10Be] records from four new study sites close by: Glacier du Brenay, Glacier de Cheilon, Glacier de Pièce, and Glacier de Tsijiore Nouve. All glaciers flow down either from the northern or southern flanks of the Pigne d'Arolla and receive debris from rockwalls that differ in their exposure and morphology. We corrected our [10Be] records for englacial–supraglacial transport and derived estimates of apparent rockwall erosion rates using a simple debris particle trajectory model (Wetterauer et al., 2022a, b), for which we generated ∼ 40-year records of glacier surface velocities by manually tracing medial moraine boulders across orthoimages. Finally, we compared the different source rockwalls with respect to their area, elevation, slope, aspect, and deglaciation history based on former glacier outlines and historical photographs.
2.1 Pigne d'Arolla massif
The Pigne d'Arolla (3790 m; all elevations stated as metres above sea level) is a mountain in the southern Swiss Alps, near the border with Italy (Fig. 1a, b). The massif surrounding it is part of the Dent Blanch nappe (Austroalpine unit) and consists of crystalline rocks of the Arolla series, mainly orthogneiss and metadiorites (Swisstopo, 2022). The majority of its ice-free slopes are around 3000 m in elevation, with more south- than north-facing slopes in terms of area (Fig. 2a, b). At this elevation and higher, slopes are typically inclined by 30 to 50∘, with north faces tending to be steeper than south faces (Fig. 2a, c). At present, the area around Pigne d'Arolla is still glaciated (Fig. 1). Several valley glaciers emerge from the faces of an east–west-trending ridgeline, which connects Pigne d'Arolla to the adjacent Mont Blanc de Cheilon, and flow down-valley in a northerly or southerly direction. These include the five study sites: Glacier du Brenay, Glacier de Cheilon, Glacier d'Otemma, Glacier de Pièce, and Glacier de Tsijiore Nouve. From now on, we refer to this set of five glacier catchments as the “Pigne d'Arolla massif” and to the individual glaciers as “Brenay”, “Cheilon”, “Otemma”, “Pièce”, and “Tsijiore Nouve” for brevity.
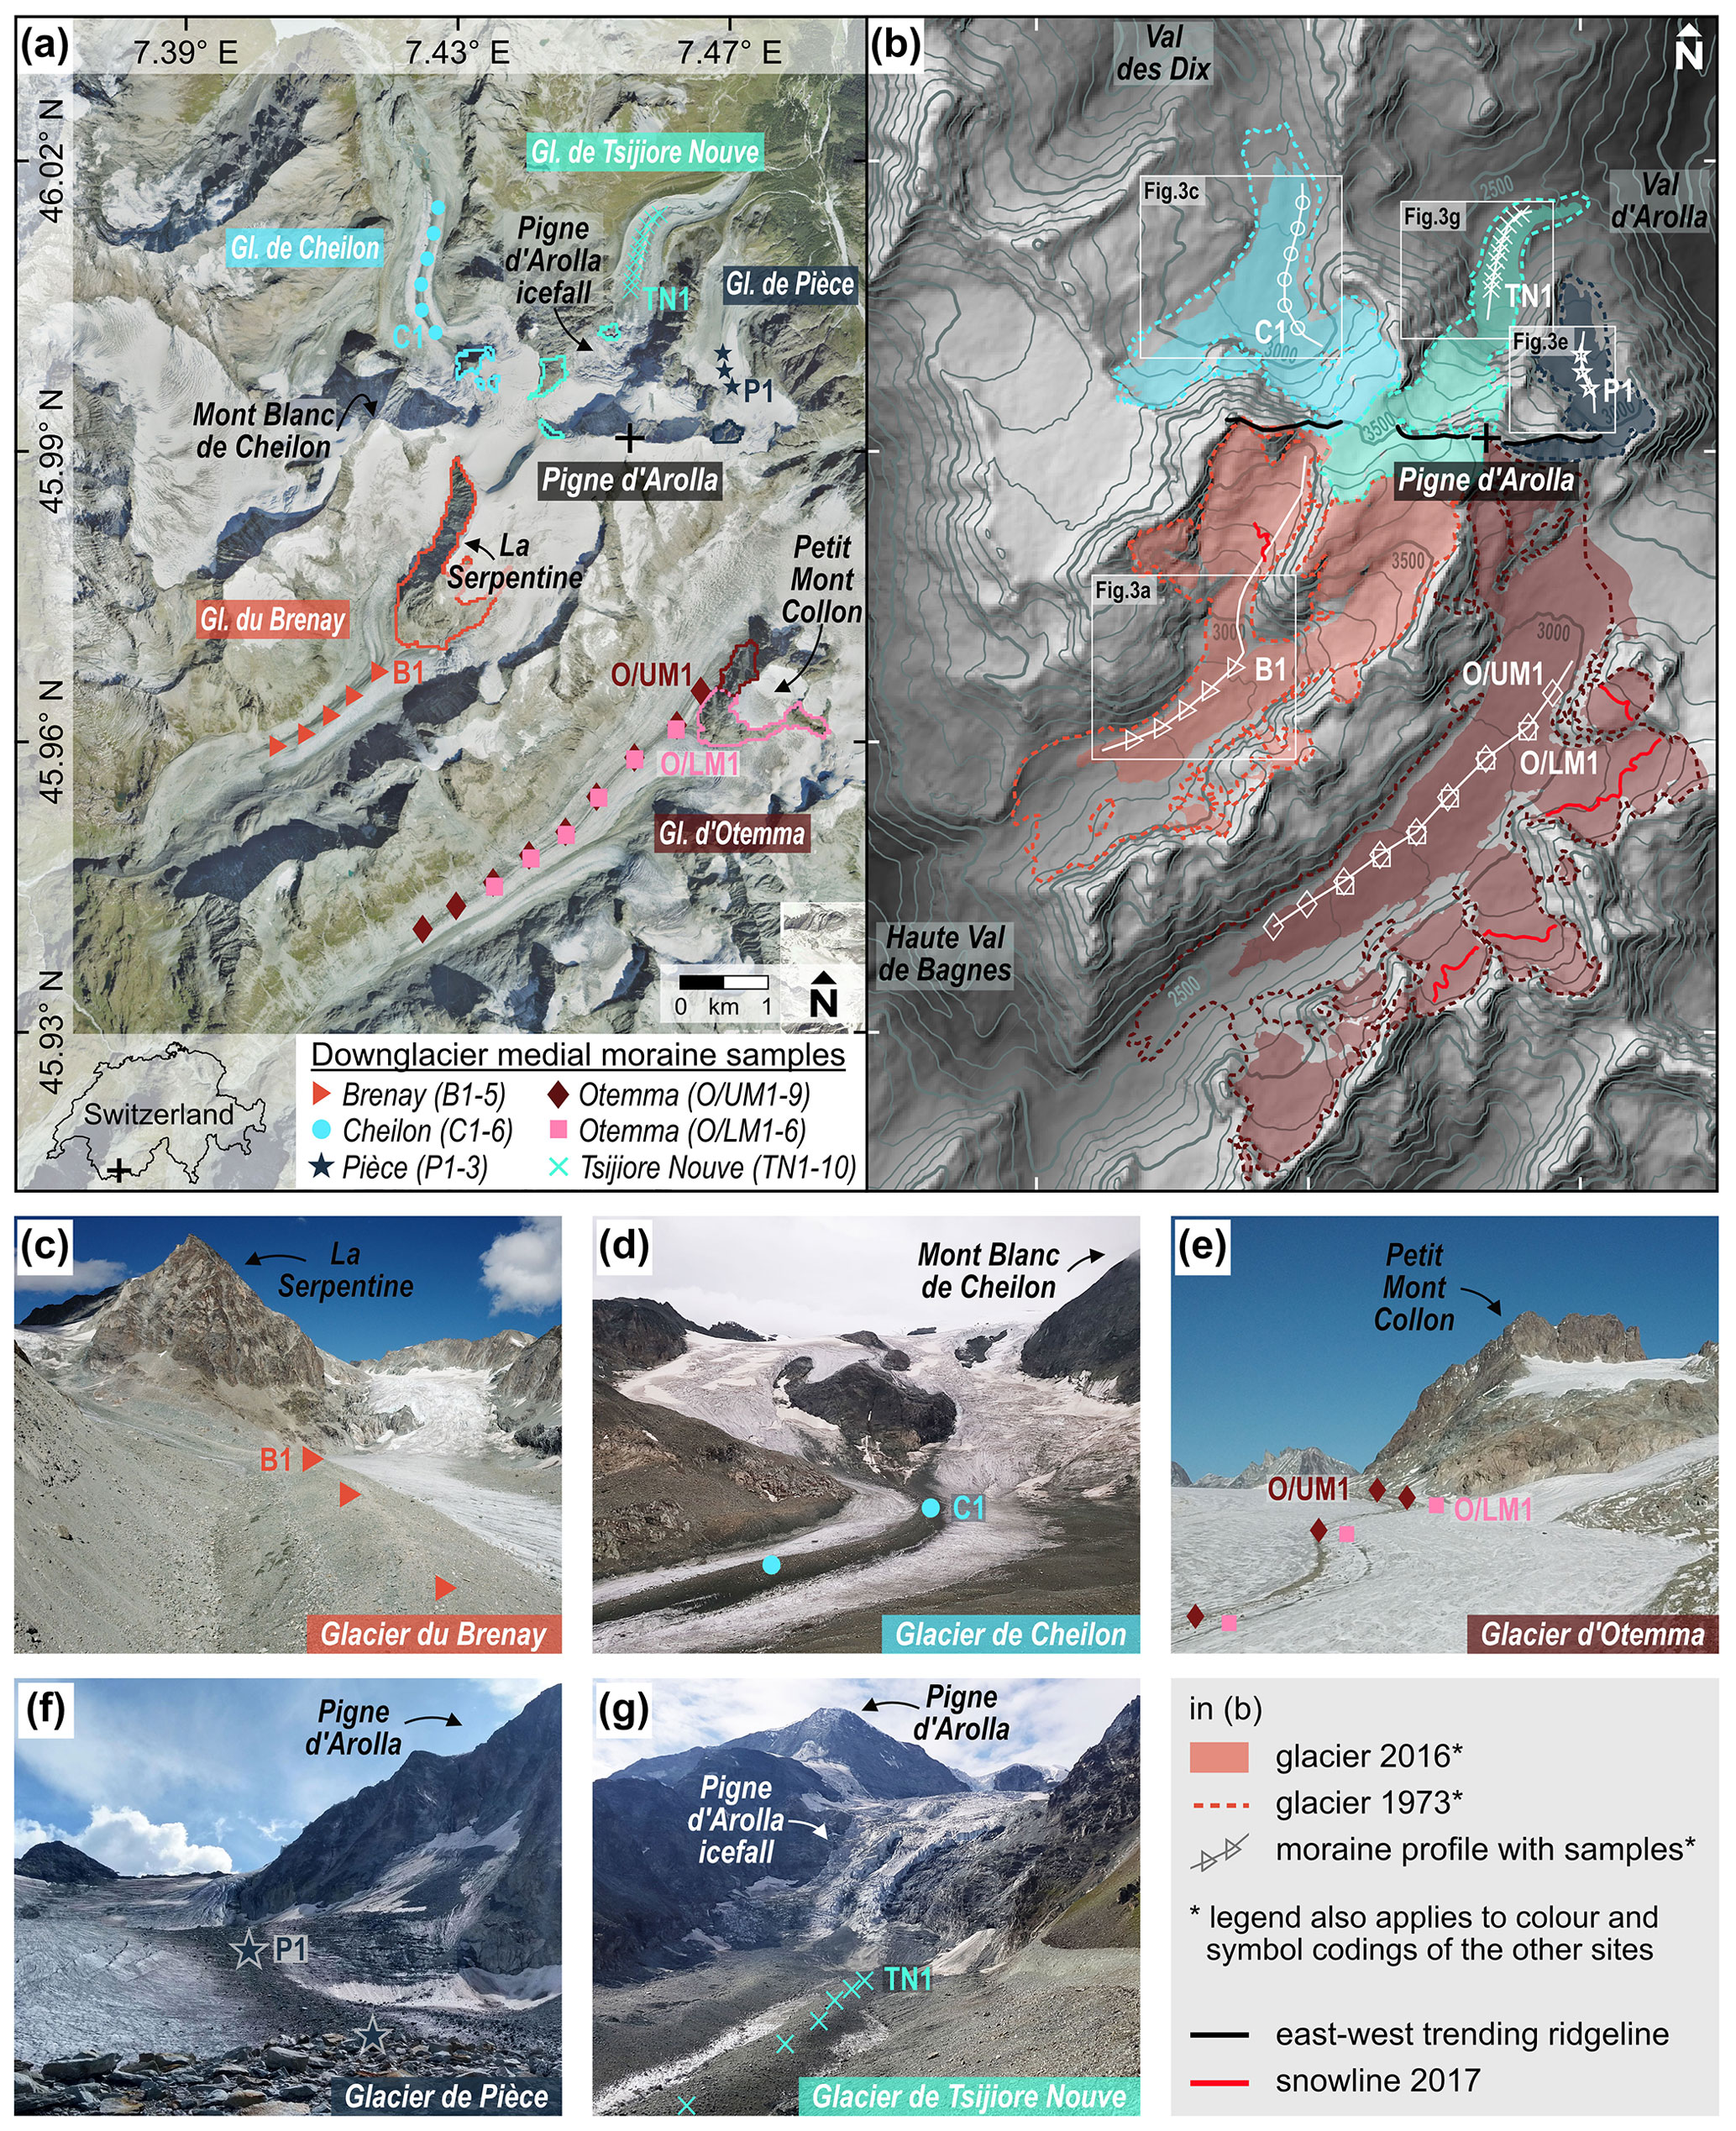
Figure 1Pigne d'Arolla massif, Switzerland. (a) Orthoimage showing the five glacier catchments and their downglacier medial moraine sample locations. The respective associated source rockwalls are outlined (orthoimage from 2017 by Swisstopo, 2022). (b) Hillshade image of the same area as in (a) with glacier extents in 2016 and 1973 after Linsbauer et al. (2021) and Müller et al. (1976), respectively. The snowline of the 2017 orthoimage is indicated as an approximation of the recent equilibrium line altitude. Hillshade and 100 m contour lines are based on the DEM SRTM GL1 (NASA Shuttle Radar Topography Mission SRTM, 2013). White rectangles indicate map extents shown in Fig. 3. Note the east–west-trending ridgeline between Pigne d'Arolla and Mont Blanc de Cheilon closely following the ∼ 3500 m contour line. (c–g) Field photographs showing medial moraines, approximated sample locations, and associated source rockwalls of (c) Glacier du Brenay, (d) Glacier de Cheilon, (e) Glacier d'Otemma (samples from Wetterauer et al., 2022a), (f) Glacier de Pièce, and (g) Glacier de Tsijiore Nouve.
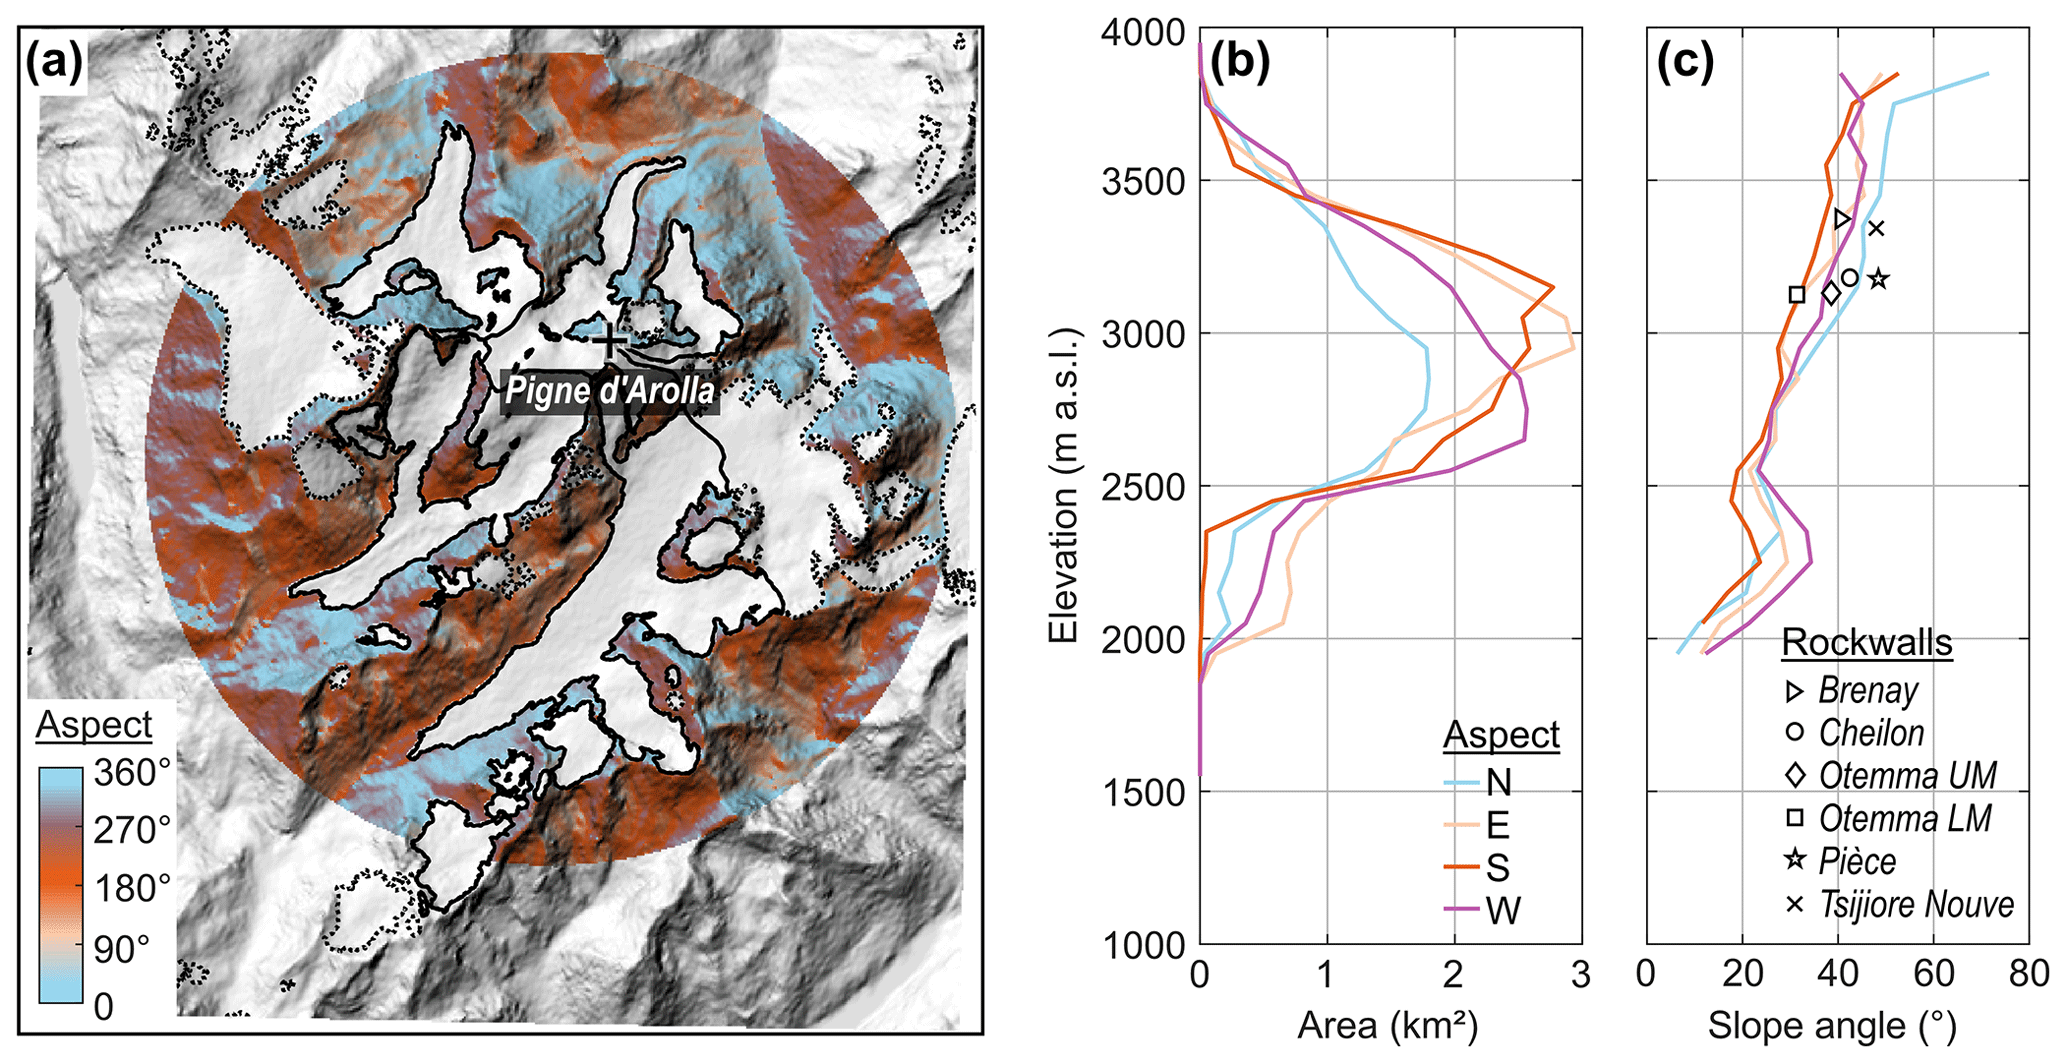
Figure 2Morphology of ice-free rock faces and slopes in an area with 6 km radius, centred on the studied glaciers of the Pigne d'Arolla massif. (a) Topographic map indicating the aspect of ice-free areas. Areas covered by glacial ice (dashed black outlines) are excluded from the analysis and the five studied glacier sites (bold black outline) explicitly highlighted (2016 glacier outlines by Linsbauer et al., 2021). (b) Hypsometry and (c) slope angles of ice-free areas in 100 m elevation bins, differentiated by aspect. Symbols denote the mean elevation and mean slope angle of the studied source rockwalls.
Throughout the Pigne d'Arolla massif, rockwalls of varying extent and morphology deposit debris on the glacier surfaces, forming distinct medial moraines as the debris is transported downglacier (Fig. 1c–g). At present, these rockwalls are still located within the distribution zone of modelled mountain permafrost in the Swiss Alps (BAFU, 2005). The recent ELA is located above 3000 m (e.g. > 3100 m at Otemma between autumn 2019 and 2021; GLAMOS, 2021b). Therefore, where recent debris deposition occurs below 3000 m elevation, in the ablation zone, downglacier debris transport is exclusively supraglacial. However, aerial images from 1983 indicate a lower ELA, debris deposition in the accumulation zone above, and therefore englacial transport in the past (Swisstopo, 2022).
In the following, we will introduce each study site separately. Please note the following: (i) glacier areas were assigned according to the latest Swiss Glacier Inventory SGI2016 dataset (Linsbauer et al., 2021); (ii) for simplicity we describe only the medial moraines and associated source rockwalls relevant to this study; and (iii) descriptions below are for the present time based on the latest datasets available via Swisstopo's online map viewer (Swisstopo, 2022) unless otherwise noted.
2.2 Glacier du Brenay
Brenay (Fig. 1c) is the second-largest glacier of the Pigne d'Arolla massif (7.1 km2 in 2016; Linsbauer et al., 2021), originating from two basins. Its eastern and main tributary emerges from the southern–southwestern flanks of Pigne d'Arolla, while its subparallel western tributary originates at the southern flanks of Mont Blanc de Cheilon. Both join at 2900 m elevation, continuing southwest into the Haut Val de Bagnes. In 2020, the glacier was ∼ 5 km long, ranging from 2640 to > 3600 m elevation. On a relatively snow-free 2017 orthoimage, the snowline is located between 3200 and 3300 m elevation within the western tributary (Fig. 1a, b). Between 1881 and 2020, the glacier continuously retreated by 1.6 km (GLAMOS, 2021a), and between 1850 and 2010, it lost 30 % of its surface area and 60 % of its ice volume (Lambiel and Talon, 2019). Between 1934 and 2017, the geodetic glacier-wide mass balance decreased from −0.2 to −0.6 m water equivalent (w.e.) yr−1 (GLAMOS, 2021c). The medial moraine of Brenay originates below 3100 m elevation within the western tributary as a lateral moraine and continues for another ∼ 2 km as a medial moraine from the confluence to the glacier terminus. It is sourced from the rockwalls of La Serpentine (3700 m), a ∼ 2 km long mountain ridge that separates the two tributaries. These rockwalls tower up to 700 m above the glacier surface and are mainly composed of quartz diorite. Whereas rockwalls to the southeast and main tributary are still largely covered by ice, the southern to northwestern rockwalls are generally ice-free. At present, debris deposition occurs in both the accumulation and ablation zone.
2.3 Glacier de Cheilon
Cheilon (Fig. 1d) is the third-largest glacier of the Pigne d'Arolla massif (3.5 km2 in 2016; Linsbauer et al., 2021). An eastern and a western tributary both originate at the northern flanks of Mont Blanc de Cheilon and join at 2900 m elevation, flowing northwards into the Val des Dix. In 2020, the glacier was ∼ 3 km long, ranging from 2700 to 3500 m elevation. Between 1924 and 2020, it was shrinking in a stepwise manner, with its terminus retreating 1.2 km (GLAMOS, 2021a). The medial moraine of Cheilon originates within the eastern tributary and extends for ∼ 2 km towards the glacier terminus. It is nourished from three bedrock knobs that emerge between flanking sectors of an icefall in the centre of the eastern tributary at 3000 m elevation. These rockwalls face north, reach heights of up to 300 m, show remnants of ice cover on their flatter tops, and comprise mainly quartz diorite. At present, they deposit debris in the glacier ablation zone.
2.4 Glacier d'Otemma
The study site at Otemma (Fig. 1e) has been described in detail in Wetterauer et al. (2022a) and we provide only a brief summary here. Otemma is the largest of the five glaciers (12.6 km2 in 2016; Linsbauer et al., 2021) and originates at the southern–southeastern flanks of the Pigne d'Arolla, flowing towards the southwest into the Haut Val de Bagnes. In 2020, its main trunk was ∼ 6 km long, extending from 2500 to 3000 m elevation. The ELA was located at 3165 m elevation (GLAMOS, 2021b), indicating that the glacier lost most of its former accumulation basin (Fig. 1b). Between 1881 and 2020, the glacier continuously retreated by 2.5 km (GLAMOS, 2021a), and between 1850 and 2010, it lost 40 % of its surface area and 60 % of its ice volume (Lambiel and Talon, 2019). Between 1934 and 2017, the geodetic glacier-wide mass balance decreased from −0.4 to −1.3 m w.e. yr−1 (GLAMOS, 2021c). Two parallel medial moraines exist below 3000 m elevation. We refer to them as the upper (UM) and lower (LM) medial moraine of Otemma, and they can be traced downglacier for > 4 and ∼ 3 km, respectively. Both are nourished from adjacent but different rock faces of the isolated nunatak Petit Mont Collon at the glacier head. At present, its northwest-facing rockwalls deliver debris to the UM moraine and are largely ice-fee. Its southwest-facing rockwalls supply the LM moraine and are topped by remnants of a small, currently isolated glacier. Overall, these UM and LM rockwalls are up to 500 m high, mainly composed of orthogneiss and schist, and they deposit debris in the ablation zone.
2.5 Glacier de Pièce
Pièce (Fig. 1f) is the smallest glacier within the massif (1.3 km2 in 2016; Linsbauer et al., 2021). It originates on the east to northeastern flanks of the Pigne d'Arolla, and its main trunk flows northwards into the Val d'Arolla. In 2020, the main trunk was ∼ 1.5 km long, ranging from 2700 to > 3100 m elevation. We found no monitoring datasets of the glacier, but historical topographic maps (Swisstopo, 2022) indicate its retreat since the end of the 19th century. The medial moraine of Pièce is comparatively short and can be traced for ∼ 1 km downglacier, starting on the easternmost flanks of the Pigne d'Arolla. These rockwalls face northeast, are up to 300 m high, and are mainly composed of orthogneiss and granodiorites. They are largely ice-free, but at their easternmost margin, ice from the southern faces of Pigne d'Arolla reroutes northward into the main trunk. Debris is deposited at 3000 m elevation and currently transported supraglacially.
2.6 Glacier de Tsijiore Nouve
Tsijiore Nouve (Fig. 1g) is the second-smallest of the five glaciers (2.8 km2 in 2016; Linsbauer et al., 2021). It originates on the northern flanks of the Pigne d'Arolla and takes a northeastward turn into the Val d'Arolla. In 2020, the glacier was ∼ 5 km long, covering a large elevation range from 2300 to > 3700 m. The glacier itself can be split into different sections (e.g. Small and Clark, 1974; Small et al., 1979; Small and Gomez, 1981): (i) an upper accumulation basin that spans the upper ∼ 500 m elevation and largely comprises partly crevassed clean ice, (ii) the steep and heavily crevassed Pigne d'Arolla icefall that drops across the middle ∼ 600 m elevation and hosts the recent ELA, and (iii) a lower and at present heavily debris-covered part in the ablation zone that spans the lower ∼ 300 m elevation and is flanked by large lateral moraines. The glacier's recession history has been discontinuous. Between 1880 and 2020, its terminus retreated by 0.4 km in total; however, this was disrupted by two major periods of re-advance from 1914 to 1921 and 1971 to 1990 (GLAMOS, 2021a). The sampled medial moraine of Tsijiore Nouve is one of two prominent moraines that both extend along the entire lower part, occupying almost the full recent glacier width. They are separated from each other by an ice septum of a few tens of metres of width and are distinguishable by their ridge-like shape. In this study, we focused on the western medial moraine. Unlike the other glaciers, there is no direct apparent continuity to its source rockwalls (Small and Clark, 1974) due to the intervening Pigne d'Arolla icefall and the elongated nature of the accumulation basin. Apparent debris source areas (Fig. 1a) are (i) a 200 m high bedrock face of Pigne d'Arolla that crops out to the north between flanking sectors of a small icefall, (ii) up to 300 m high rockwalls of an adjacent mountain ridge that flanks the western rim of the accumulation basin and faces east, and (ii) a 200 m sized bedrock patch recently uncovered at the base of the Pigne d'Arolla icefall (Small and Clark, 1974; Small and Gomez, 1981). All three areas comprise mainly quartz diorites. Where deposited above the Pigne d'Arolla icefall, debris takes englacial pathways.
3.1 10Be-derived rockwall erosion rates from medial moraine debris
Where rockwalls erode in cosmogenic steady state, their “apparent” rockwall erosion rate E (mm yr−1) is described by Eq. (1) (Lal, 1991):
where [10Be]rockwall is the 10Be concentration (atoms g−1) at the rockwall surface accumulated during exposure to cosmic rays, Psp(0) is the spallogenic surface production rate (atoms g−1 yr−1), λ is the decay constant (yr−1) (here based on a half-life of 1.387±0.012 Myr; Chmeleff et al., 2010; Korschinek et al., 2010), Λ is the absorption mean free path (g cm−2), and ρ is the material density (here 2.65 g cm−3). In our study, we consider rockwall erosion to proceed surface-perpendicular, resulting in lateral rockwall retreat. Moreover, we refer to our rockwall erosion rates as apparent because the steady-state assumption precludes nuclide inheritance and erosion rate changes over time, and it implies that the period of rockwall erosion is longer than the nuclide integration time, which, however, may not apply to recently deglaciating rockwalls (Wetterauer et al., 2022a).
In Eq. (1), [10Be]rockwall is not equal to the actual measured 10Be concentration ([10Be]measured) in the medial moraine. During supraglacial transport from rockwall to sample location, debris continues to accumulate 10Be ([10Be]transport) (Ward and Anderson, 2011; Scherler and Egholm, 2020; Wetterauer et al., 2022a). Therefore, to obtain [10Be]rockwall, we need to know [10Be]transport and subtract it from [10Be]measured. As supraglacial exposure times and rockwall erosion rates vary for individual glaciers, [10Be]transport and its importance relative to [10Be]rockwall likely vary, too. Therefore, estimating and comparing apparent rockwall erosion rates in the Pigne d'Arolla massif require two independent data acquisitions: (i) quantifying [10Be]measured from debris samples as well as computing rockwall 10Be production rates (Sect. 3.1.1) and (ii) estimating glacier flow and debris transport time to correct for [10Be]transport and to approximate the time of rockwall erosion (Sect. 3.1.2).
3.1.1 Debris sampling, 10Be measurements, and 10Be production in rockwalls
In autumn 2019, we collected 24 new debris samples along medial moraine profiles in the Pigne d'Arolla massif (Table 1, Fig. 1a). The new data expand our previously published 15 samples from the Glacier d'Otemma (Wetterauer et al., 2022a, b) by four new glaciers. As rockwalls erode by stochastic processes and individual bedrock samples may have different [10Be], rockwall erosion rate records should reflect outcrop-scale average rates and thus amalgamate [10Be] across the entire source rockwall area to avoid episodic effects on single measurements (Small et al., 1997). Therefore, each sample is a 3–4 kg amalgamation of supraglacial clasts from coarse sand to pebble size (∼ 1–30 mm), randomly hand-scraped across medial moraine surface areas that cover 5–30 m along a moraine by the entire moraine width. In addition, to minimize subjective selection of sample locations, samples from the same medial moraine were taken at regular downglacier intervals. At each site, sample numbers are in ascending order downglacier. None of the moraines was heavily intersected by open crevasses, and debris contribution from valley sidewalls or lateral moraines was not observed. At Brenay, five samples (B1–5) were collected every ∼ 350 m along a 1.5 km long profile. The moraine topography is pronounced, doubling from ∼ 15 to 30 m in height and increasing from ∼ 70 to 110 m in width downglacier. At Cheilon, six samples (C1–6) were collected every ∼ 300 m along a 1.5 km long profile. Downglacier, the moraine topography gains relief, with heights increasing from < 1 to ∼ 20 m and widths increasing from ∼ 50 to 130 m. At Pièce, three samples (P1–3) were collected every ∼ 200 m from a 0.4 km long profile, along which the moraine topography is < 1 m and the width remains at ∼ 50 m. At Tsijiore Nouve, 10 samples (TN1–10) were collected every ∼ 100 m from a 1.0 km long profile. Downglacier, the moraine topography varies, with heights between ∼ 10 and 20 m and widths between ∼ 70 and 90 m. At the last three sampling locations, the moraine flanks had distinct ice cliffs. The 15 Otemma samples by Wetterauer et al. (2022a) were collected every ∼ 500 m from two medial moraines profiles: nine samples from the UM moraine (O/UM1–9) along 4.2 km and six samples from the LM moraine (O/LM1–6) along 2.7 km. Along both medial moraines, the initial height of ∼ 3 m flattens out in the central part of the glacier and stays low, and the width decreases from ∼ 20 to 6 m.
Table 1Medial moraine debris samples from the Pigne d'Arolla massif, as well as AMS data with measured 10Be 9Be ratios and 10Be concentrations ([10Be]measured).
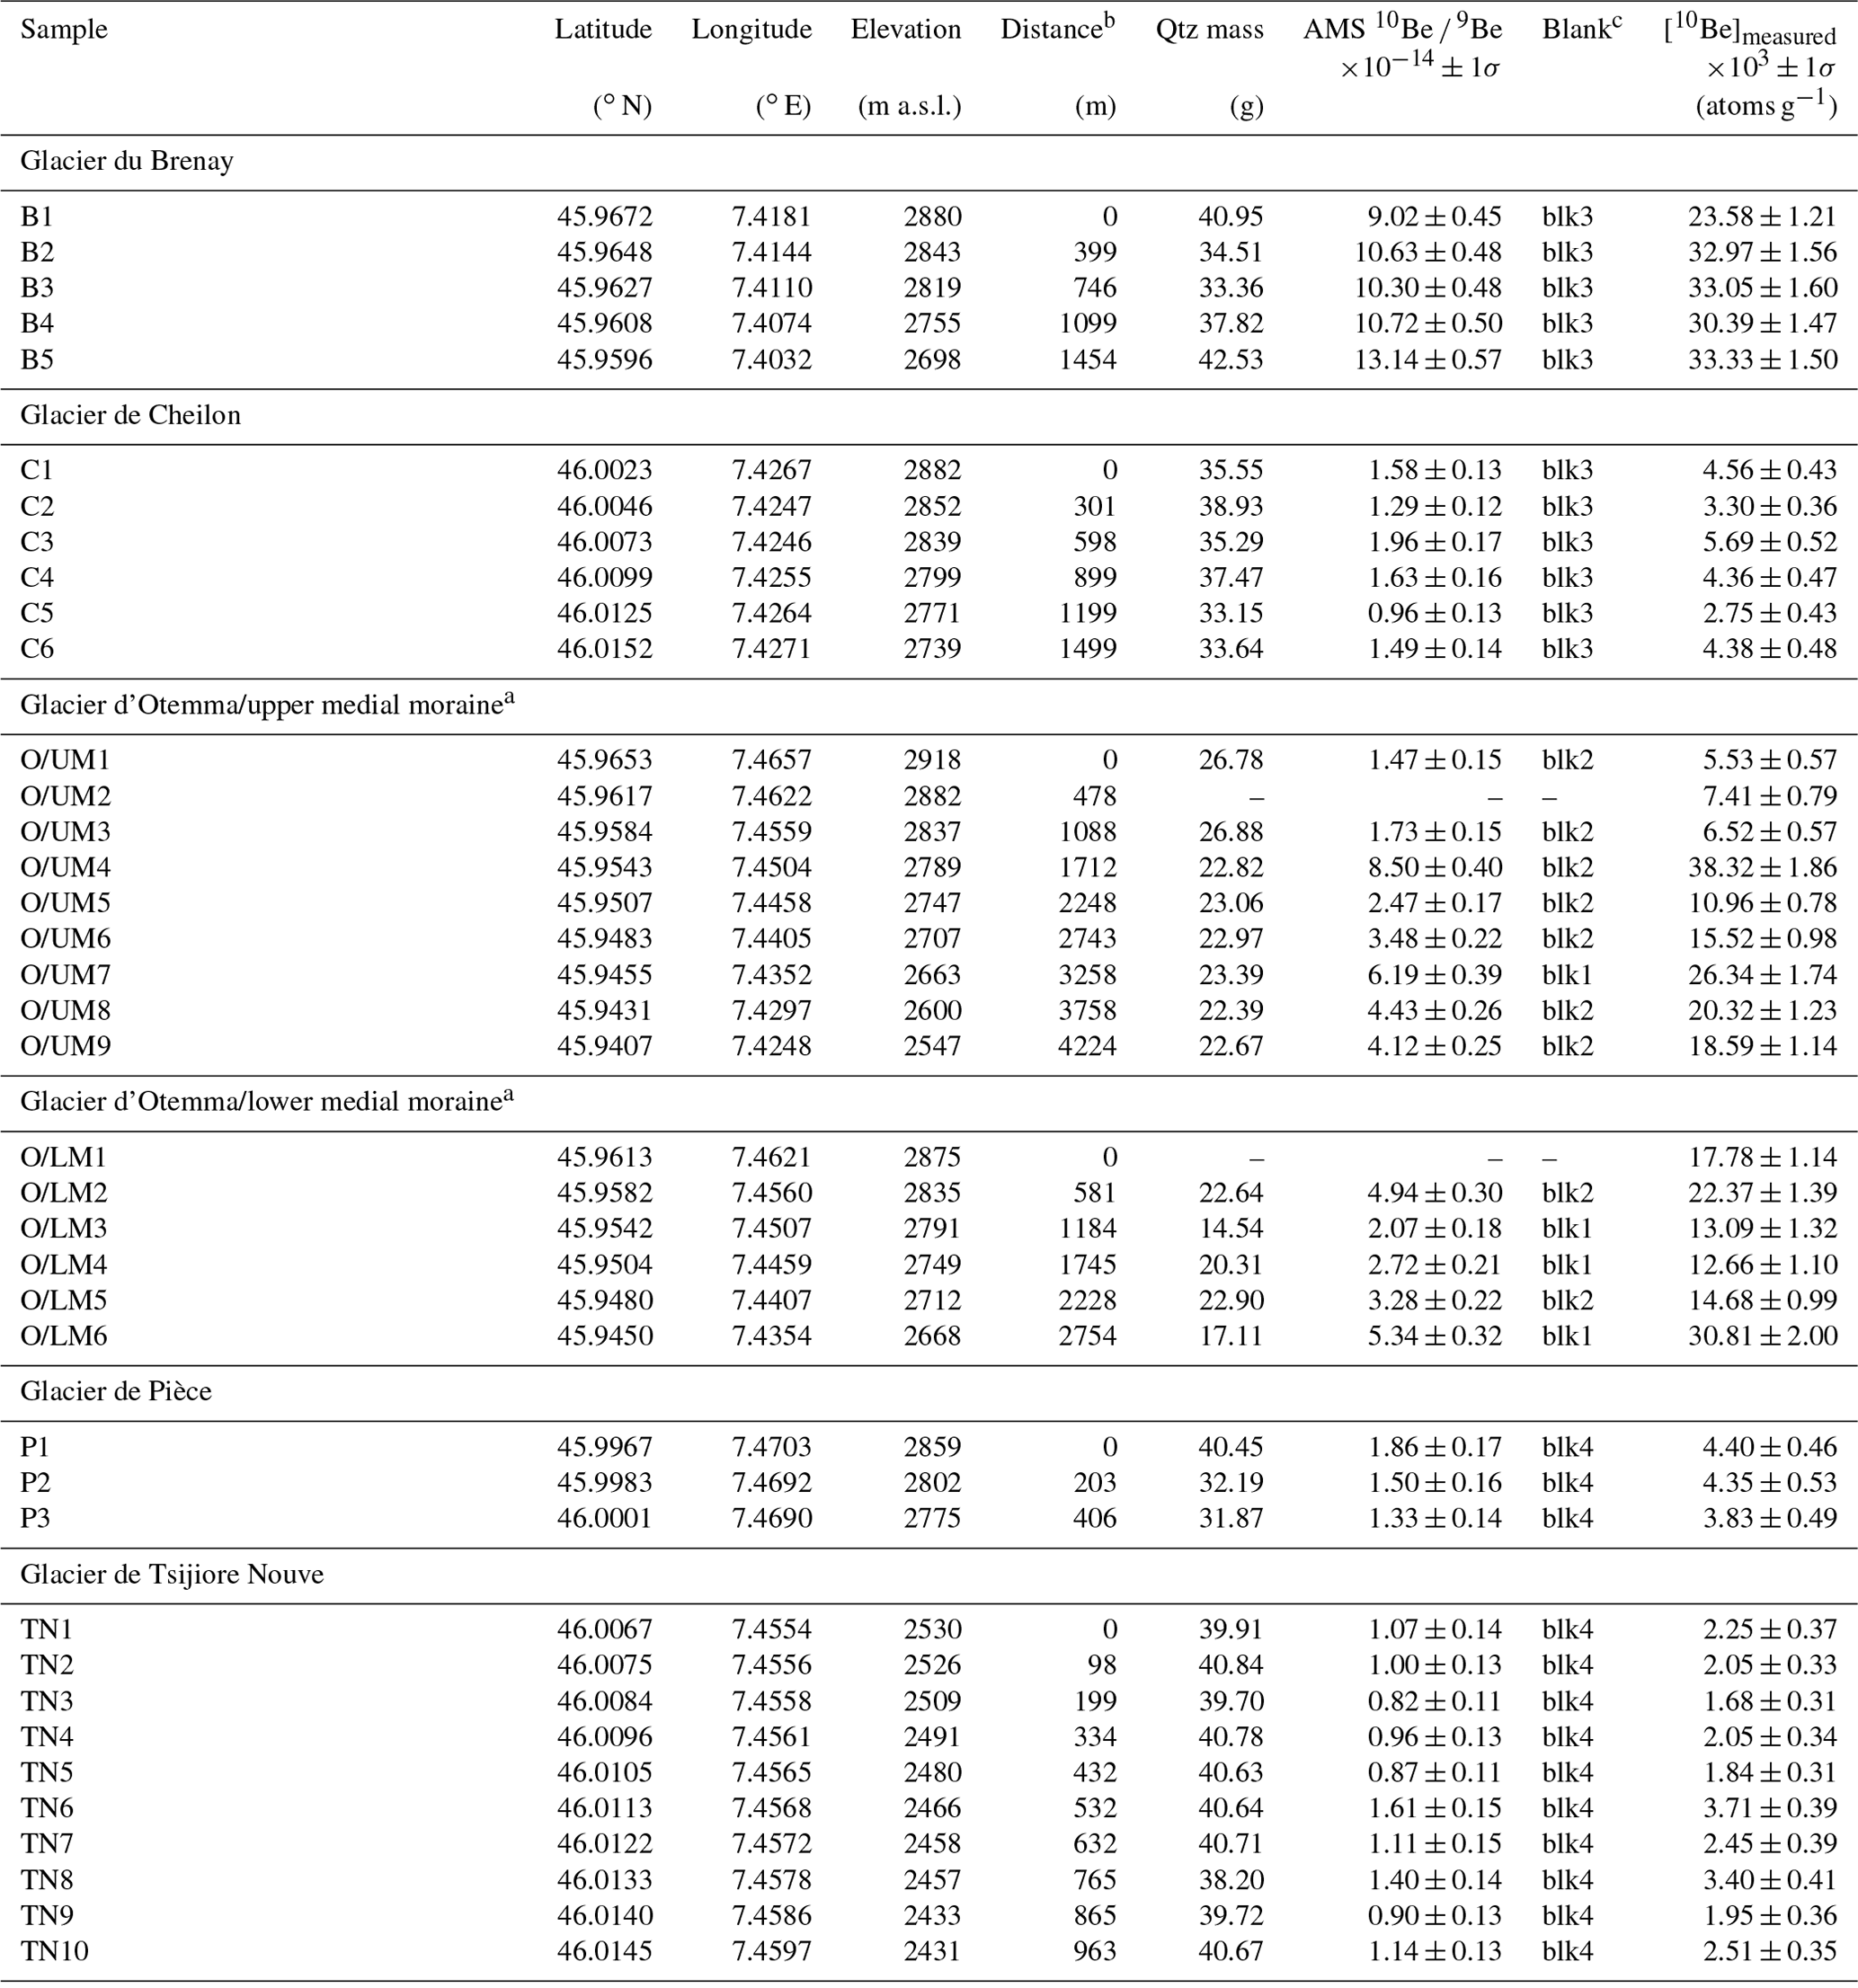
a Samples O/UM1–9 and O/LM1–6 within this study correspond to published samples UM1–9/f and LM1–6/f in Wetterauer et al. (2022a, b). b Downglacier distance from the uppermost sample of the respective medial moraine.c Process blank used to correct respective sample batches, where corresponding AMS 10Be 9Be ratios are blk1 = , blk2 = , blk3 = , and blk4 = .
In situ-produced 10Be separation was performed on grain size fractions of 1–16 mm (B, C, P, and TN samples) and 0.125–4 mm (O/UM and O/LM samples), as described in Wetterauer and Scherler (2023) and Wetterauer et al. (2022b), respectively, largely following the procedures of von Blanckenburg et al. (2004). All samples were prepared at the Helmholtz Laboratory for the Geochemistry of the Earth Surface (HELGES) at the GFZ German Research Centre for Geosciences in Potsdam, Germany. 10Be 9Be ratios (Table 1) were measured by the accelerator mass spectrometer (AMS) at the University of Cologne, Germany (Dewald et al., 2013), relative to standards KN01-6-2 and KN01-5-3 (nominal 10Be 9Be ratios: and , respectively). All ratios were converted into [10Be]measured and corrected for co-processed blanks (10Be 9Be ratios: , , , ).
Mean Psp(0) and Λ per debris source area were computed on a digital elevation model (DEM) for ice-free rockwalls in 1850, 1973, and 2017 (see Sect. 3.2 for details on the DEM and rockwall outlines). To quantify apparent rockwall erosion rates the mean values for the 1973 exposed rockwalls were used. In brief, mean Psp(0) values are based on the CRONUS functions v2.3 (Balco et al., 2008), the constant spallation scaling model “St” (Lal, 1991; Stone, 2000), and a sea level high-latitude (SLHL) production rate of 4.01±0.33 atoms g−1 yr−1 (Borchers et al., 2016). We considered topographic shielding (Dunne et al., 1999) using the TopoToolbox v2 function “toposhielding” (Schwanghart and Scherler, 2014) and surface area correction by local slope angles. We neglected temporal variations in production rates (due to young sample ages of 101–102 years; Wetterauer et al., 2022a), production by muons (typically < 1 % of spallogenic production), and snow cover shielding (as rockwalls remain largely snow-free throughout snow cover seasons; Swisstopo, 2022). Mean Λ values were corrected for the surface slope dependency of cosmic-ray attenuation in bedrock (Masarik et al., 2000).
3.1.2 Debris transport time and additional 10Be production
To assess [10Be]transport additionally accumulated during debris transport from source rockwalls to the sampling location, we used the simple 1D debris particle trajectory model developed for Otemma and described in detail in Wetterauer et al. (2022a, b). For every glacier, we estimated the horizontal and vertical ice velocities along the sampled medial moraine through time using observed surface velocities as well as mass-balance-dependent particle burial and re-emergence, respectively. For a given time span, we then fed the glacial conveyor belt with particles and tracked their downglacier and englacial–supraglacial position. For each sample, we estimated its sample age, which corresponds to the time of debris erosion, and [10Be]transport from the modelled transport duration by averaging the trajectories of particles that arrived supraglacially within ±30 m of the sample location in 2019.
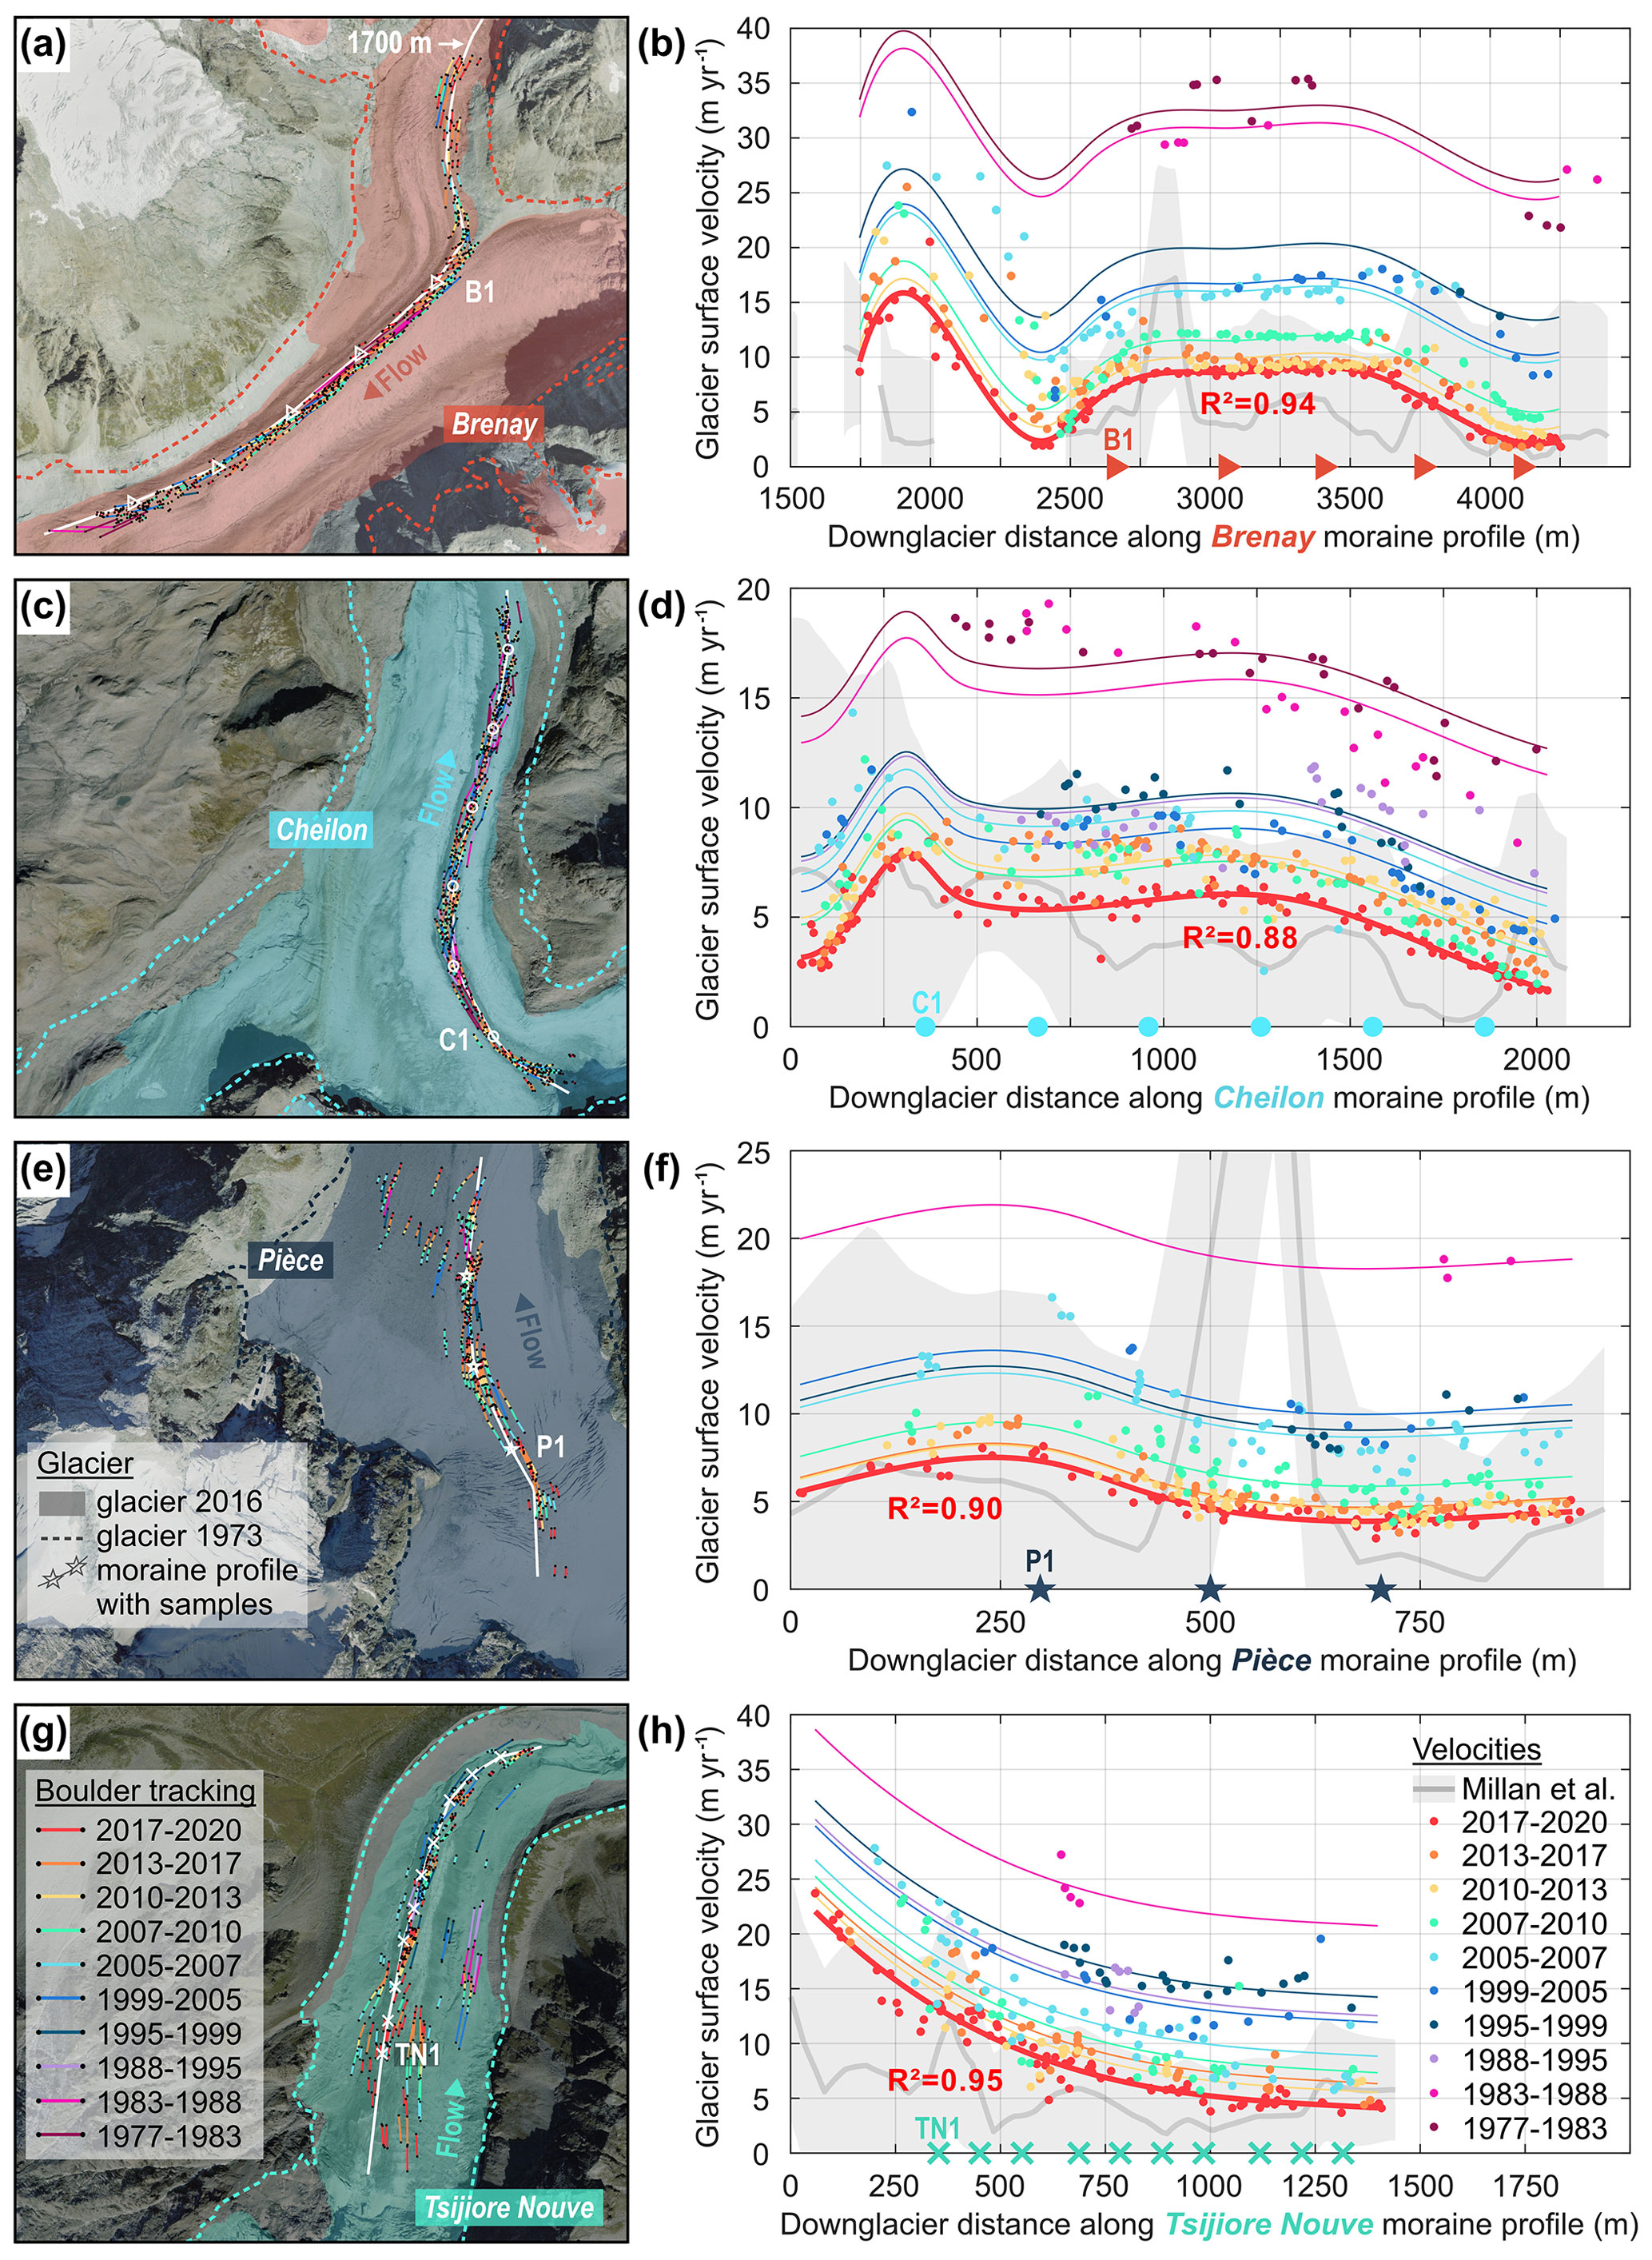
Figure 3Glacier surface velocities along the four newly sampled medial moraines, reconstructed from 10 boulder-tracking periods between the years 1977 and 2020. (a, c, e, g) Tracked boulder displacements along downglacier profiles, which trace the sampled medial moraines. Where a boulder could be followed across several tracking periods colour-coded lines are connected. Note that boulder displacements at Brenay could only be tracked after a profile distance of ∼ 1700 m due to englacial transport along the first half of the profile (2017 orthoimage by Swisstopo, 2022; glacier extents by Linsbauer et al., 2021; Müller et al., 1976). (b, d, f, h) Glacier surface velocities through time derived from the mapped boulder tracks. The solid red line and R2 indicate the fit of the velocities obtained for the most recent tracking period 2017–2020, and thin coloured lines reflect the same fit applied to the nine older tracking periods. For reference, remotely sensed velocities plus or minus uncertainties by Millan et al. (2022) are shown in grey in the background, and downglacier sample locations are indicated on the x axis. All datasets indicate a systematic slowdown of glacier flow towards the present. For reconstructions of Glacier d'Otemma see Wetterauer et al. (2022b).
We determined glacier surface velocities and elevations as well as a generalized ELA history for the four new study sites Brenay, Cheilon, Pièce, and Tsijiore Nouve. Unfortunately, recent surface velocities obtained from cross-correlation of satellite imagery tend to be poorly resolved for the relatively small and slow glaciers of the Pigne d'Arolla massif. Especially close to the rockwalls, uncertainties are typically similar to the derived velocities (Fig. 3b, d, f, h; Millan et al., 2022). Therefore, we estimated horizontal glacier surface velocities by manually tracing the displacement of medial moraine boulders across orthoimages of the last ∼ 40 years (Swisstopo, 2022). Boulder displacements were measured between successive orthoimages from the years 1977, 1983, 1988, 1995, 1999, 2005, 2007, 2010, 2013, 2017, and 2020 (Fig. 3a, c, e, g). We considered boulder displacements parallel to profiles of the respective medial moraine and averaged boulder velocities over the respective time period between two orthoimages. Although exact acquisition dates were unavailable, the orthoimages presumably stem from a similar time during the summer season, as the snowline was located high, and the medial moraines were largely snow-free, except during the period 1995–1999. The positional accuracy for the orthoimages increases from 1 m before 1999 to 0.1 m at present (Swisstopo, 2022). Due to the increasing orthoimage resolution, we were able to identify and track more boulders during more recent periods, which allowed us to obtain continuous downglacier velocity profiles. For earlier periods, this was hampered by fewer velocity estimates with greater uncertainties. To nevertheless obtain temporally continuous velocity profiles, we fitted the most recent tracking period 2017–2020 using Shape Language Modeling tools (D'Errico, 2022) and shifted this fit vertically to the higher velocities during earlier periods using least squares (Fig. 3b, d, f, h). Velocity changes over the entire period 1977–2020 were obtained by linear interpolation between the individual periods (Fig. 4b). For the years 1880–1977, velocity changes were approximated by aligning the gradient of velocity change with the linear gradient of the respective glacier's length change for the same period, obtained from long-term glacier length monitoring records (Fig. 4, GLAMOS, 2021a).
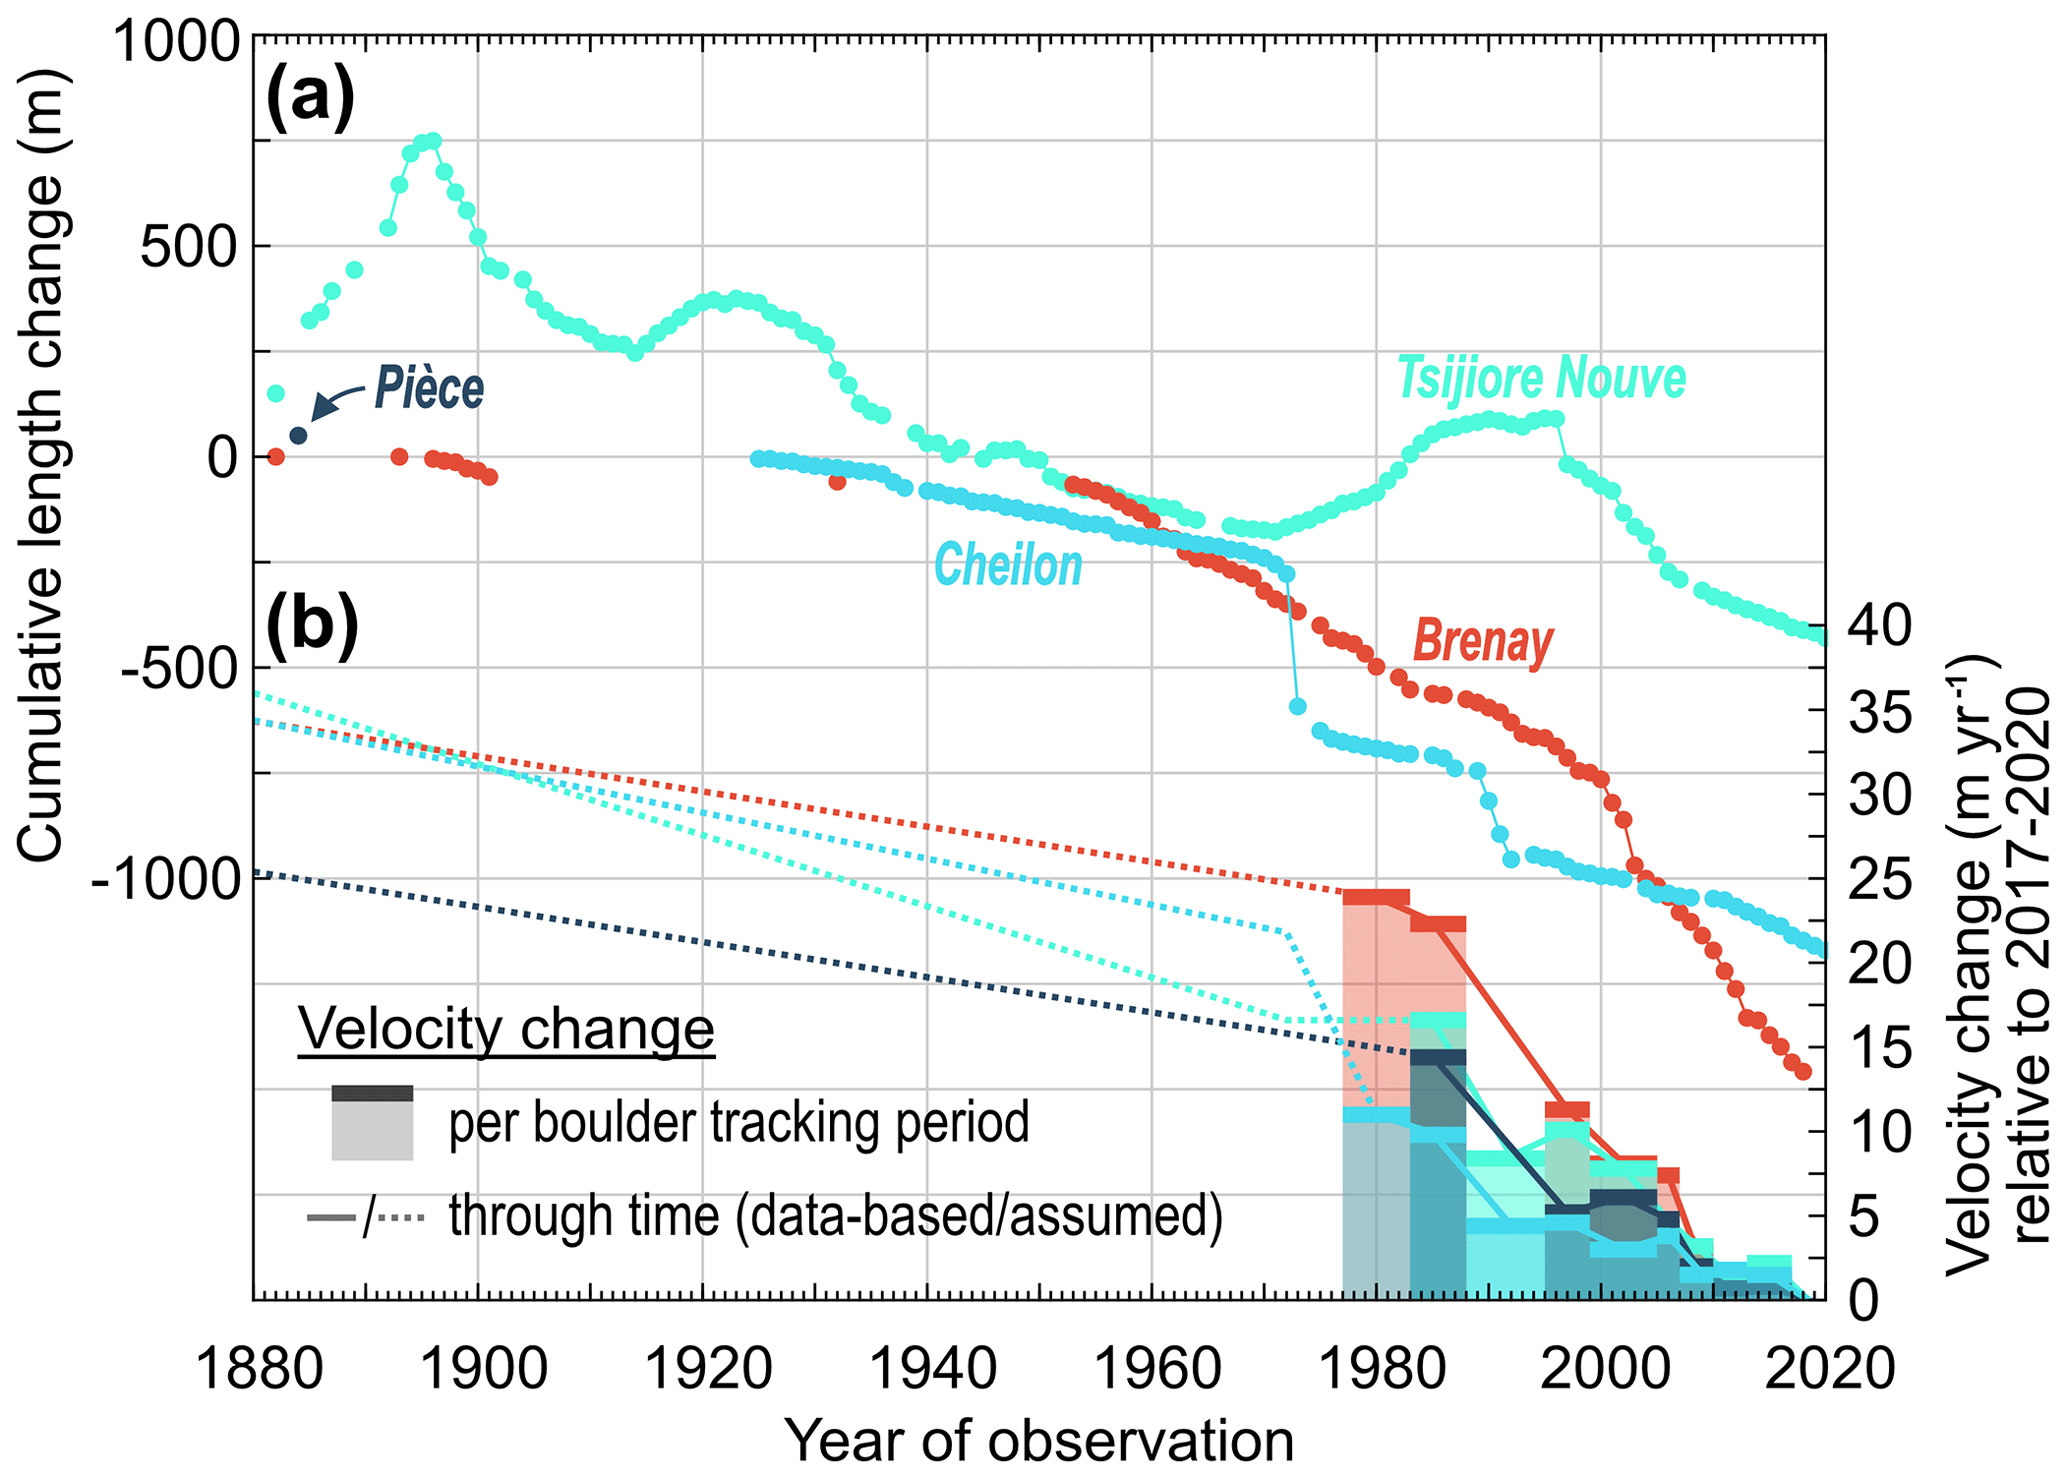
Figure 4Glacier change at the four new study sites since 1880. (a) Long-term monitoring records of glacier length change (GLAMOS, 2021a). Note that markers from consecutive years are connected and that no length change record exists for Glacier de Pièce. (b) Reconstructed temporal changes in glacier surface velocity relative to the most recent boulder-tracking period 2017–2020. Per boulder-tracking period, the velocity change corresponds to the y-axis shift of its fit line to the solid red fit line in Fig. 3b, d, f, and h. On a year-to-year basis, velocity changes are based on linear interpolation between the velocity changes of the different tracking periods. Pre-1977 changes in velocities were approximated with reference to the linear gradient of the glacier's length change in (a). Due to a lack of length data at Glacier de Pièce, pre-1977 assumptions there align with Glacier du Brenay. For reconstructions of Glacier d'Otemma see Wetterauer et al. (2022b).
To constrain ice surface lowering along the four new moraine profiles through time, we interpolated between contour lines for the year 1880 extracted from the Siegfried map (first edition 1870–1926) and a topographic map from 2016 (Swisstopo, 2022) using a three-step linear decline (Wetterauer et al., 2022b). ELA elevations through time were adopted from a recent ELA reconstruction dataset for this region (Žebre et al., 2021). Model settings of a generalized vertical mass balance profile (gradient: 0.7 m w.e. yr−1 per 100 m elevation, maximum snow accumulation above the ELA: 0.75 m w.e. yr−1) and the computation of 10Be production rates as a function of transport time, downglacier distance, and burial depth were adopted from Wetterauer et al. (2022b). At Brenay, where the elongated source rockwalls of La Serpentine lead to debris deposition along the first 2.3 km of the profile (Fig. 1), we additionally considered the mixing of debris particles of different age and [10Be]transport at a sample location. There, particle trajectories were modelled from various source locations and weighted according to the above rockwall area, which we defined by flow directions using the steepest decent approach (Supplement Fig. S2). At the other sites, where debris deposition occurs approximately at the profile's head, trajectories were modelled from the profile head as a single point source.
We acknowledge that our reconstruction of glacier surface velocities and elevations contains several sources of unquantified uncertainties. On average, our uncertainty estimates for the velocities derived from boulder tracking are small (see Sect. S1 in the Supplement). However, properly modelling these glaciers and the particle transport (e.g. Scherler and Egholm, 2020) requires even more empirical constraints that are currently unavailable, and, as we will show in Sect. 5.2, our findings are largely insensitive to the [10Be]transport.
3.2 Source rockwall analysis
To compare the different medial moraine debris source areas in the Pigne d'Arolla massif and quantitatively assess the extent to which they are affected by deglaciation, we obtained source rockwall outlines for a recent (2017) and two past time slices (1973, 1850). Recent outlines were defined manually by mapping the ice-free rockwalls on a 2017 orthoimage (Swisstopo, 2022). Former outlines of ice-free rockwalls are based on reconstructed glacier outlines from the years 1973 and 1850 (Müller et al., 1976; modified from Maisch et al., 2000). Across the defined rockwalls (Fig. S1), area, elevation, slope, and aspect were determined for each pixel in a 30 m resolution digital elevation model (DEM; global raster dataset SRTM GL1; NASA Shuttle Radar Topography Mission SRTM, 2013). The surface area covered per pixel was corrected for its local slope angle. To visualize changes in ice cover across the source rockwalls, we further compiled historical photographs from the online archives of Swisstopo (2022) and the ETH Library (2022).
Below, the four new datasets of Brenay, Cheilon, Pièce, and Tsijiore Nouve are presented in summary form and in context with the two published Otemma datasets (Wetterauer et al., 2022a, b). Details on [10Be] measurement results (Table 1), model-based corrections, and derived apparent rockwall erosion rates (Table 2) of individual medial moraine samples as well as on distinct debris source area properties (Table 3) are provided in the data tables as indicated.
Table 2Model results of downglacier debris transport with samples ages, burial depth, and additional 10Be accumulation ([10Be]transport), as well as transport-corrected 10Be concentrations ([10Be]rockwall) and derived minimum and maximum apparent rockwall erosion rates.
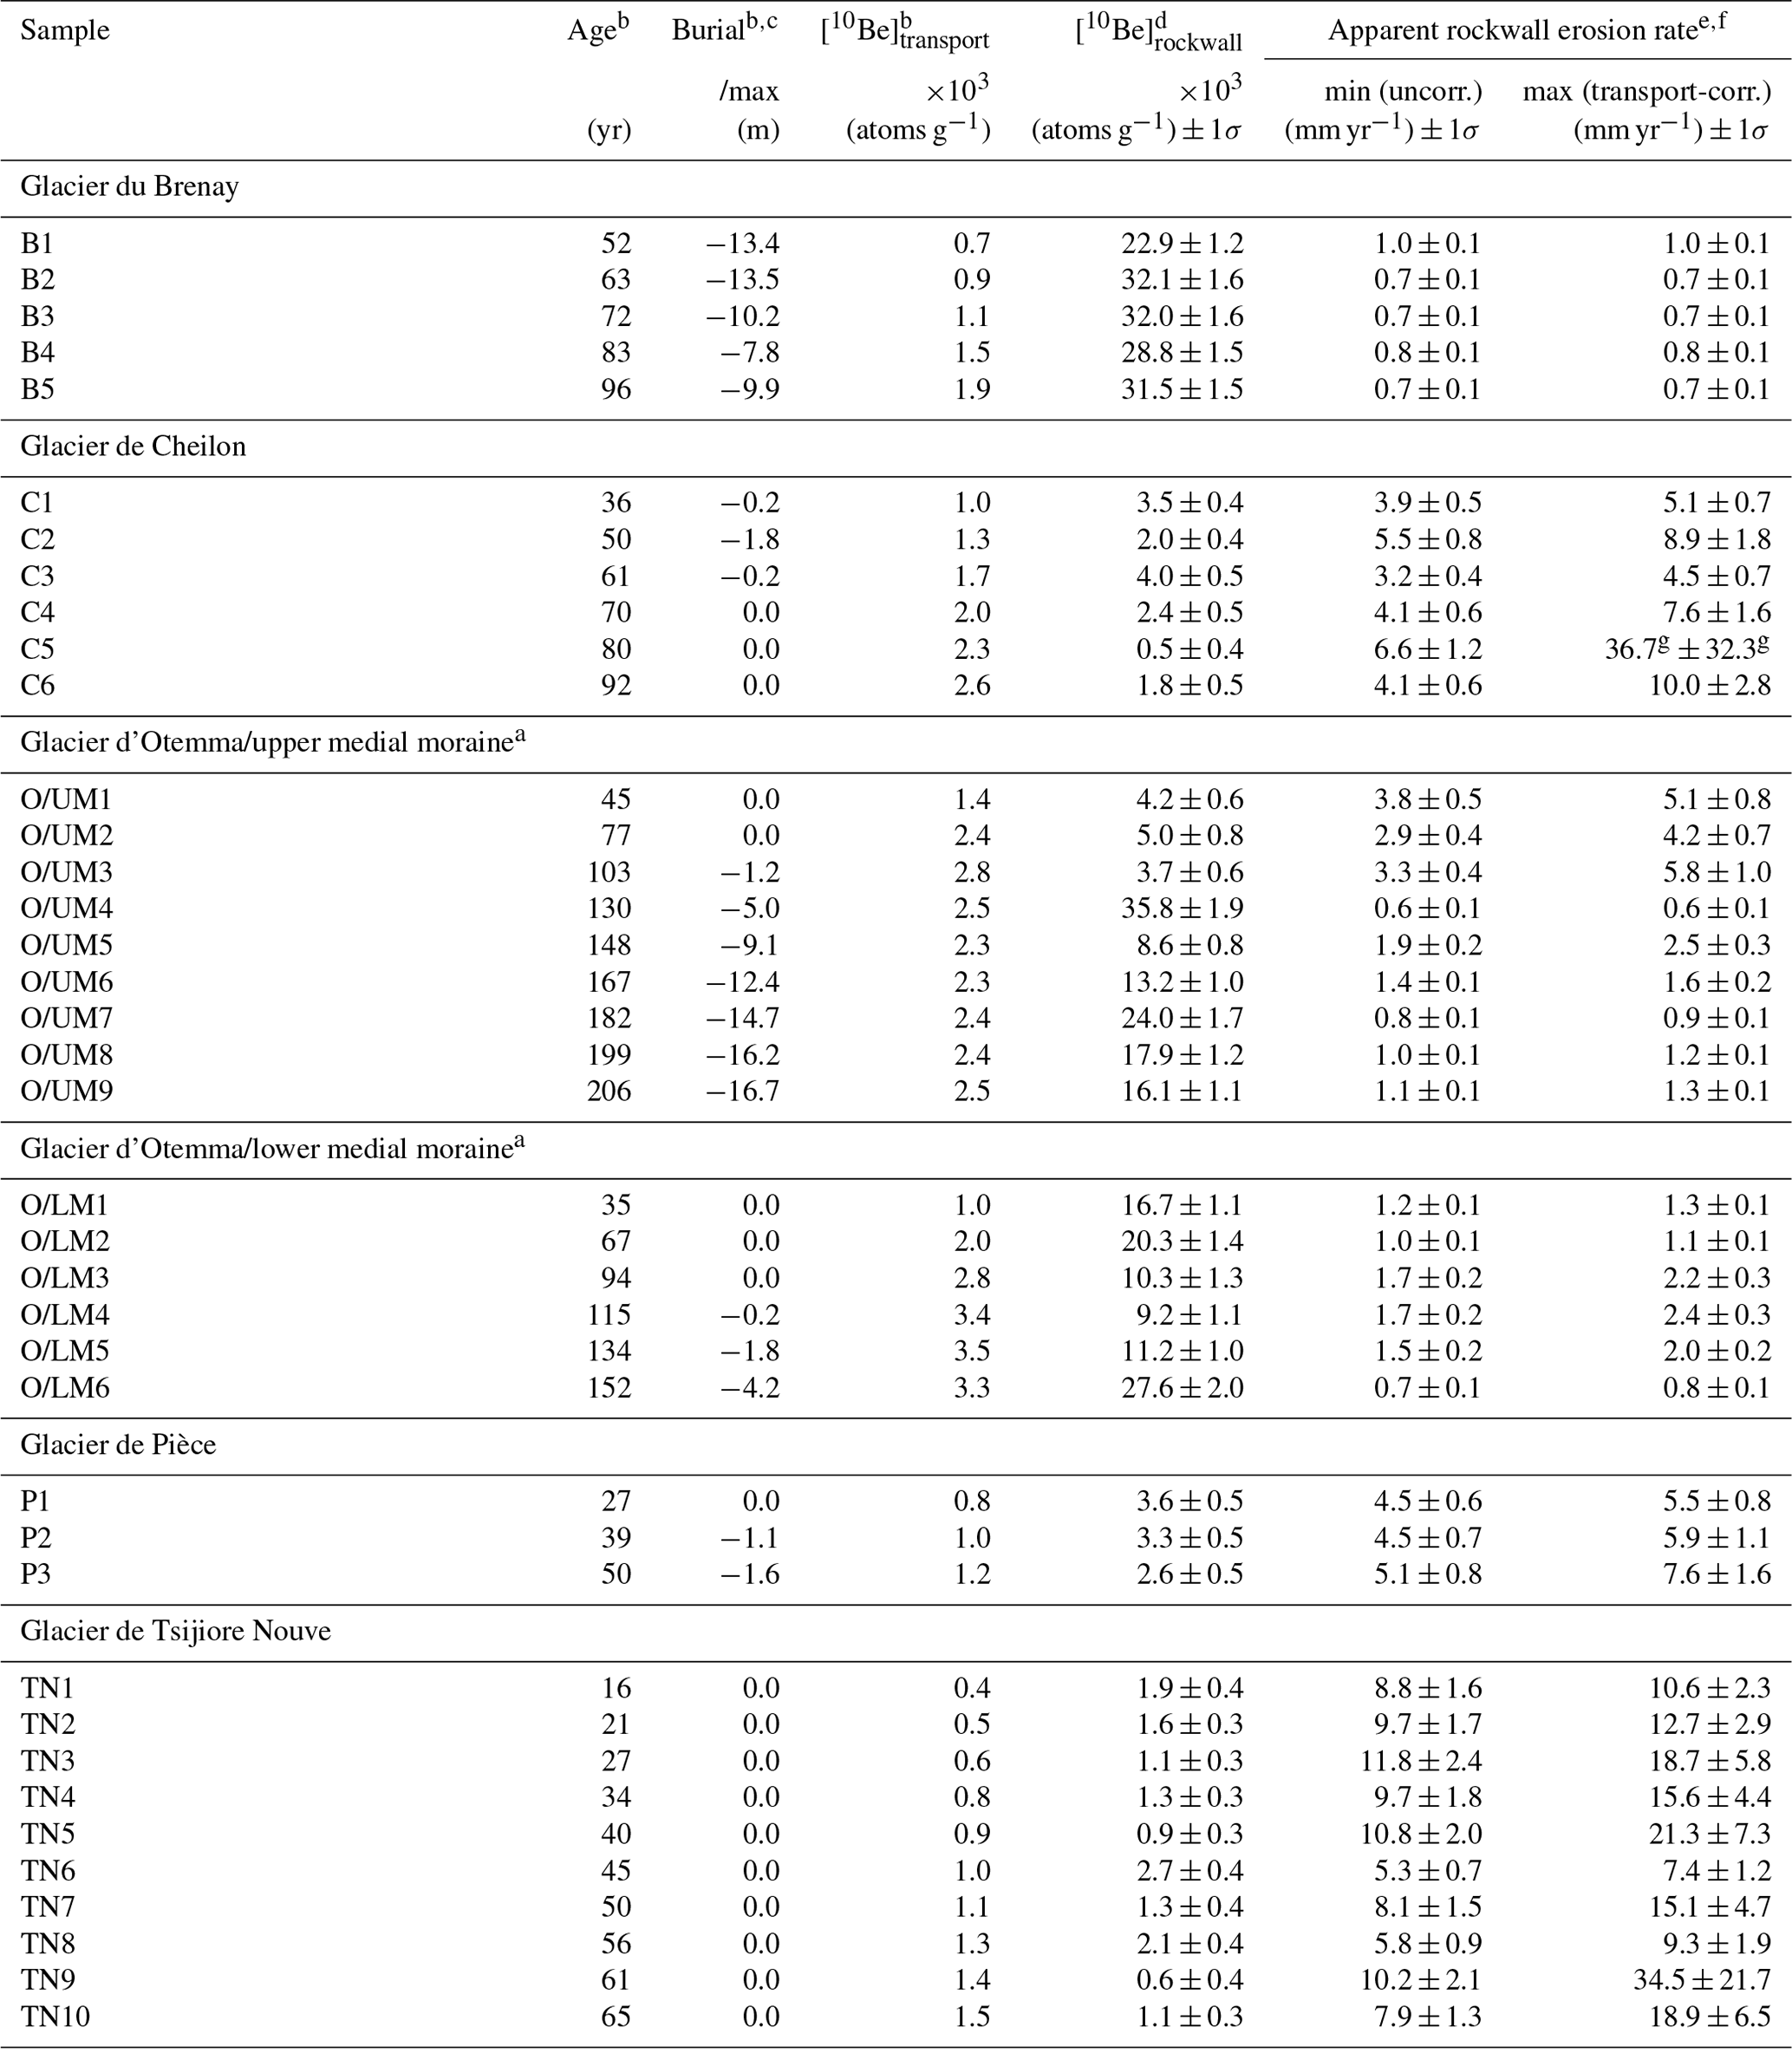
a Samples O/UM1–9 and O/LM1–6 within this study correspond to published samples UM1–9/f and LM1–6/f in Wetterauer et al. (2022a, b). b Computed using a simple 1D debris particle trajectory model (Wetterauer et al., 2022b). c Maximum burial depth modelled for debris particles of a sample. Negative numbers indicate partially englacial transport, and 0 indicates exclusively supraglacial transport. d Calculated by subtracting [10Be]transport from [10Be]measured. 1σ estimates correspond to analytical uncertainties of [10Be]measured. e Calculated using the mean spallogenic production rates and absorption mean free paths of the respective 1973 exposed source rockwalls listed in Table 3. 1σ estimates are based on the analytical uncertainties of [10Be]measured. f Minimum rates were derived from [10Be]measured, uncorrected for downglacier transport. Maximum rates were derived from [10Be]rockwall, corrected for downglacier transport. g Value excluded from any erosion rate-based analysis due to unreasonable [10Be]rockwall estimate (see Sect. 5.1).
Table 3Geomorphic parameters of source rockwalls in the years 1850, 1973, and 2017, as well as 10Be production rates and absorption mean free paths.
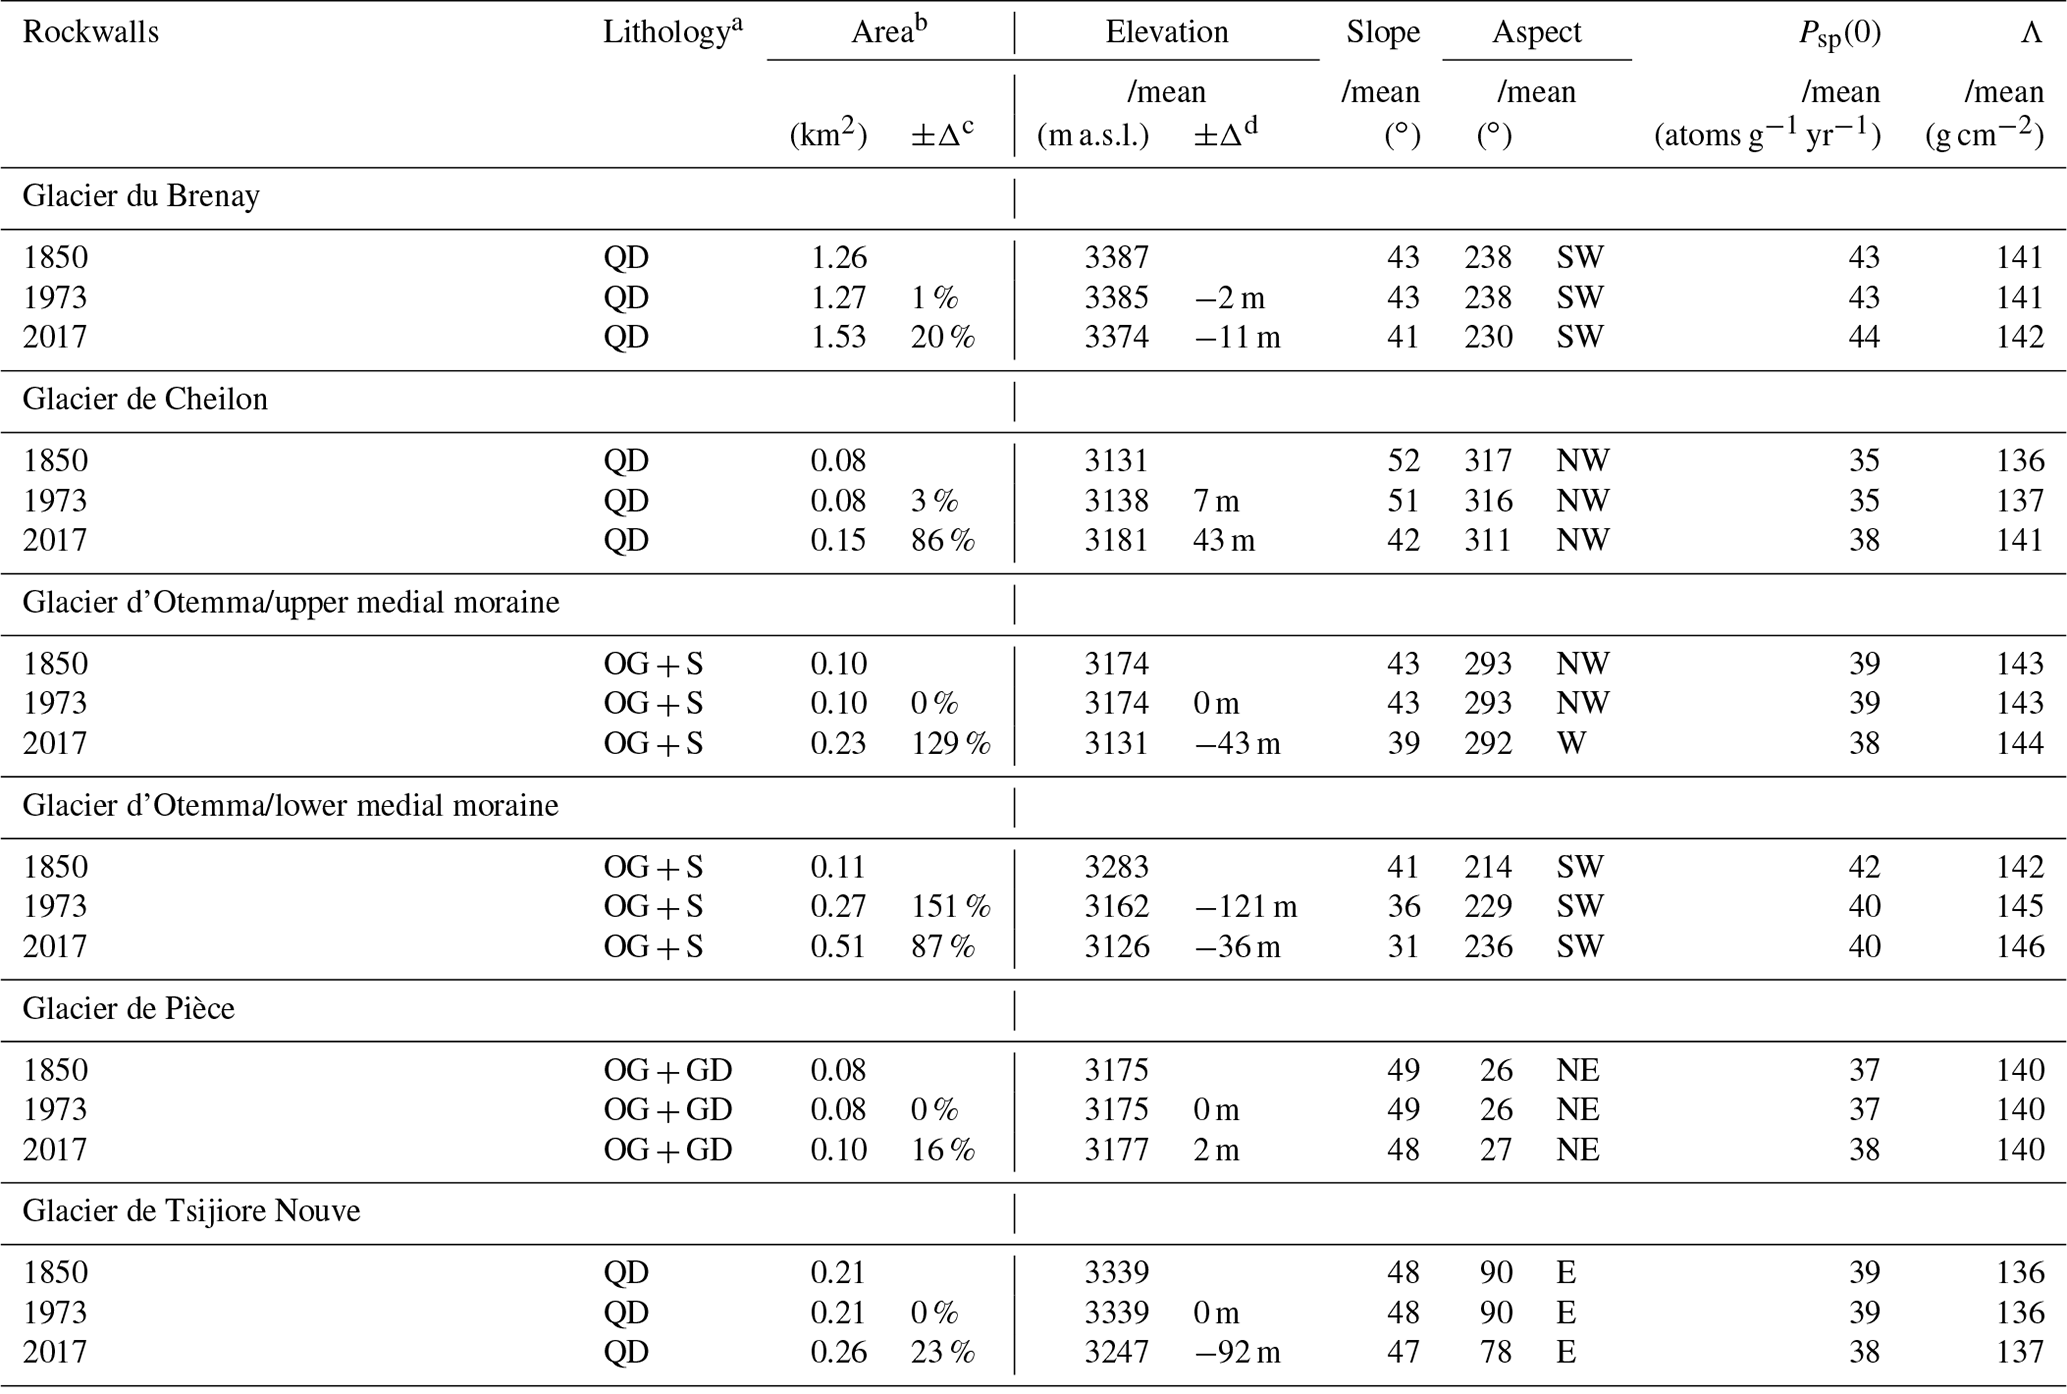
a Crystalline rocks of the Arolla series. GD: granodiorite, OG: orthogneiss, QD: quartz diorite, S: schist. b Corrected for slope. c Area expansion ( %) between 1850 and 1973 and between 1973 and 2017, respectively. d Mean elevation gain or loss (m) between 1850 and 1973 and between 1973 and 2017, respectively, indicating the predominant direction of area expansion.
4.1 Glacier surface velocities, estimated 10Be transport concentrations, and sample ages
The tracked boulder displacements resulted in well-defined glacier surface velocities along our four new sampled medial moraines for the most recent period (Fig. 3b, d, f, h). The further back in time, the more fragmented the records. Our approach to fit the most recent tracking period and shift the velocity fit vertically appears to yield reasonable fits to velocity estimates from earlier tracking periods. However, observations prior to 1995 are scarce, especially for Pièce and Tsijiore Nouve, and the shifted fit does not agree very well with the pre-1988 estimates for Cheilon.
Based on the modelled debris trajectories at Brenay, Cheilon, Pièce, and Tsijiore Nouve, transport occurred supraglacial over most of the downglacier distance, sometimes even exclusively (Figs. S3–S4). The resulting [10Be]transport values reach up to 3×10³ atoms g−1 (Table 2). The estimated sample ages overlap and are generally younger than 100 years (Table 2, Fig. 5). In contrast, sample ages at the Otemma UM and LM moraine cover the last 200 and 150 years, respectively (Wetterauer et al., 2022a).
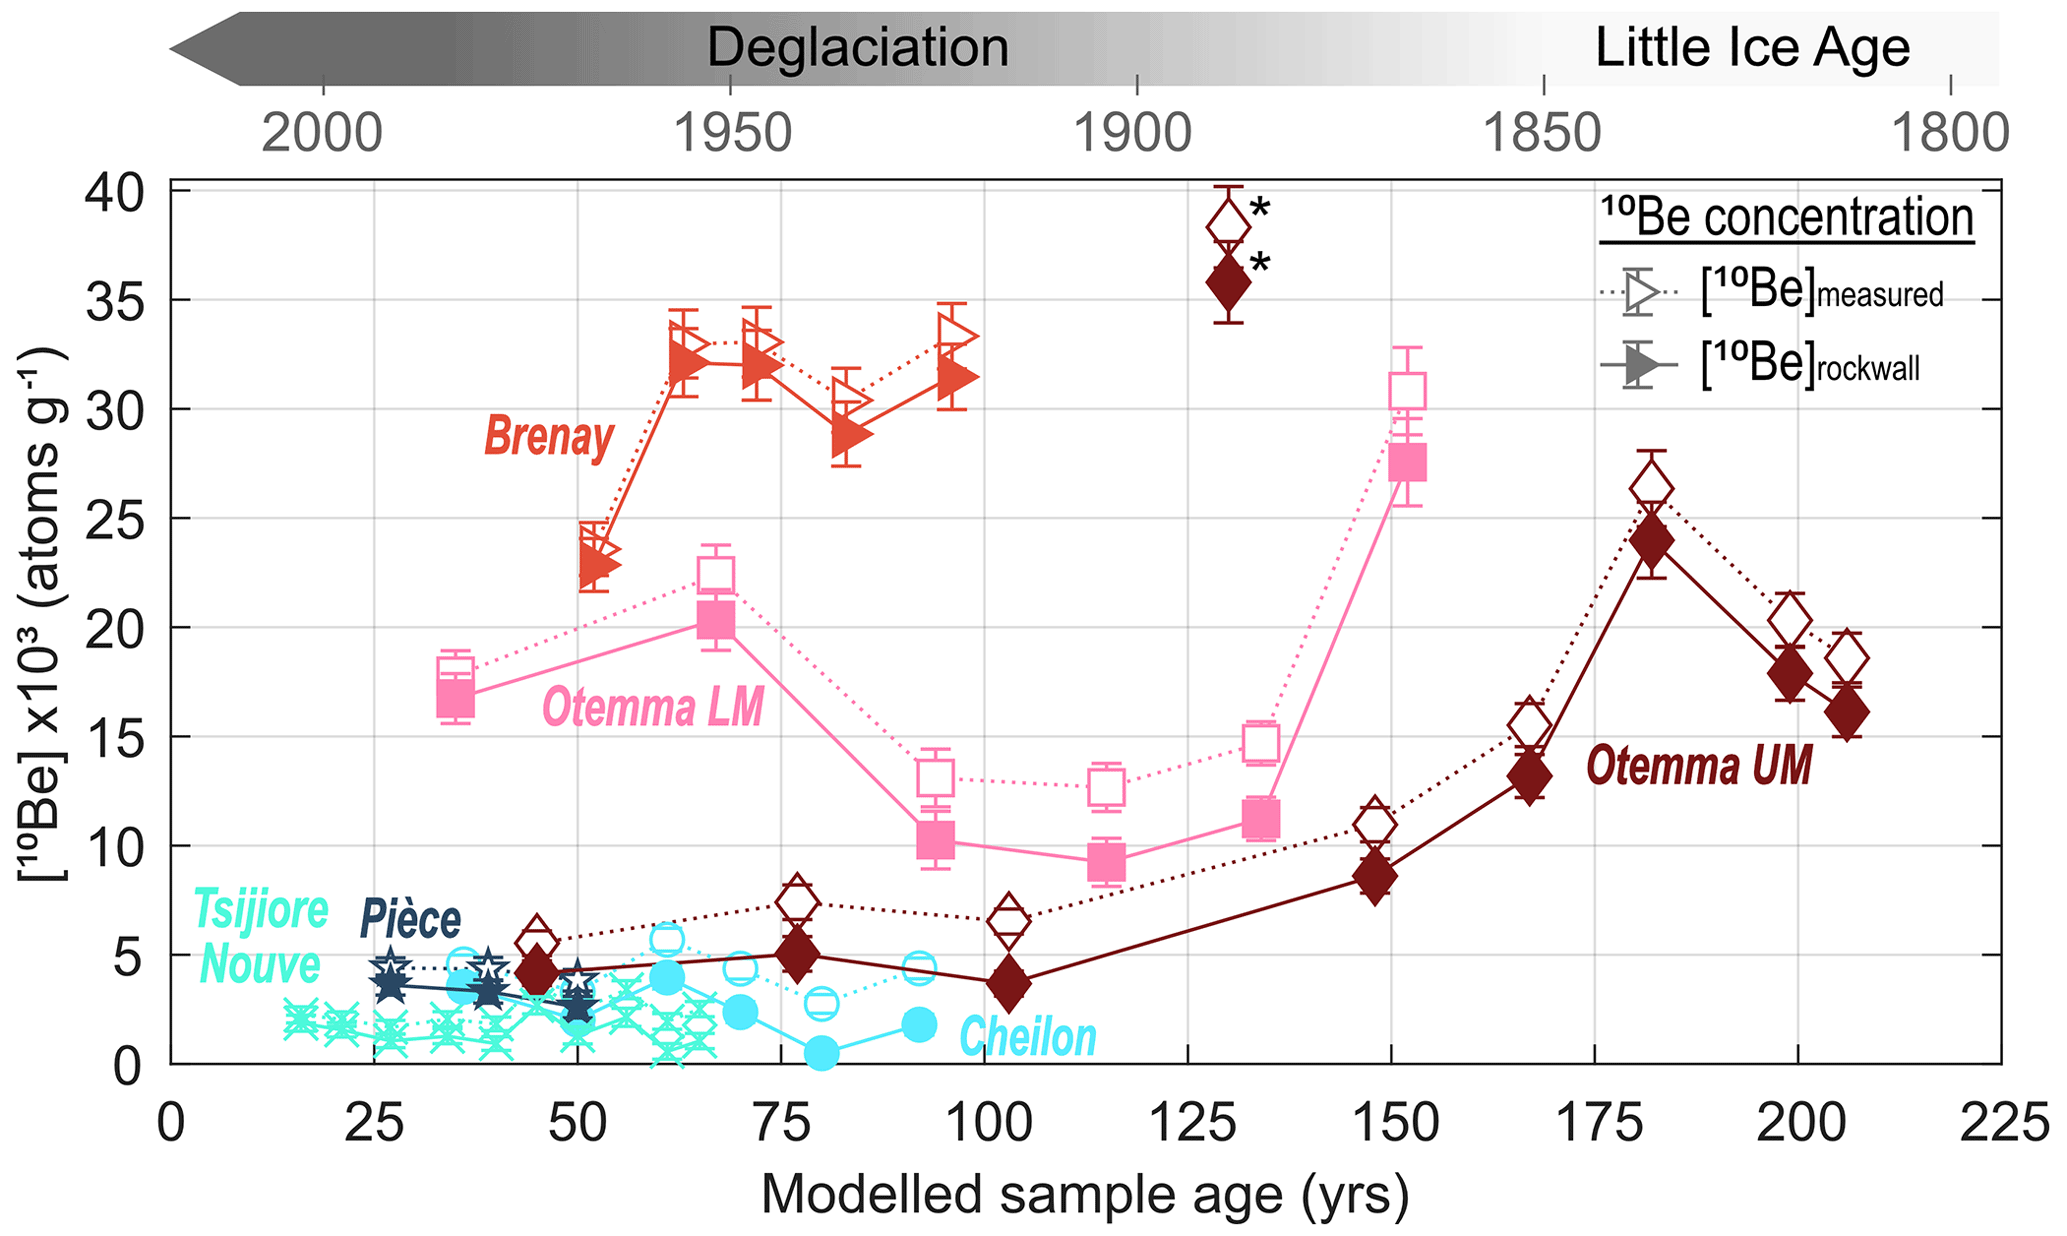
Figure 5Comparison of uncorrected ([10Be]measured) and transport-corrected ([10Be]rockwall) medial moraine [10Be] records of the Pigne d'Arolla massif through time (data from Glacier d'Otemma by Wetterauer et al., 2022a). Concentrations (±1σ analytical error) are plotted against modelled sample ages, reflecting the timing of rockwall erosion either during the Little Ice Age or the following deglaciation period, as indicated by the timeline above. Note that a re-measurement of a high-concentration outlier at the Otemma UM moraine (*) at a slightly coarser grain size fraction fits the temporal trend well (see Fig. 6a in Wetterauer et al., 2022a).
4.2 Measured 10Be and estimated 10Be rockwall concentrations
The [10Be]measured values of our 24 new medial moraine debris samples range between 2×10³ and 33×103 atoms g−1 (Table 1, Fig. 5). At Brenay, Cheilon, Pièce, and Tsijiore Nouve, [10Be]measured values are rather uniform along the medial moraine, averaging at 31×103, 4×10³, 4×10³, and 2×10³ atoms g−1, respectively. Correcting [10Be]measured for [10Be]transport results in overall lower [10Be]rockwall (Table 2, Fig. 5). At Brenay, where [10Be]measured is high, [10Be]transport is only a small fraction of the concentration (3 %–6 %). For samples with low [10Be]measured at Cheilon, Pièce, and Tsijiore Nouve, the correction can account for up to half (17 %–49 %) and in individual cases even more (58 %–82 %). Still, the general tendency of the individual [10Be]measured records towards temporal consistency is maintained in [10Be]rockwall. The concentration ranges are comparable to the Otemma datasets (Fig. 5); however, medial moraine [10Be] at Otemma was found to be more variable and to systematically increase downglacier at the Otemma UM moraine (Wetterauer et al., 2022a).
4.3 Apparent rockwall erosion rates
We provide two estimates of apparent rockwall erosion rates: based on the uncorrected [10Be]measured and on the transport-corrected [10Be]rockwall (Table 2). At Brenay, the mean uncorrected and corrected rate estimates (±1σ) both round to 0.8±0.1 mm yr−1. For Cheilon and Pièce, mean uncorrected and corrected rate estimates deviate more strongly and are comparatively higher at 4.6±1.2 and 7.2±2.4 as well as 4.7±0.4 and 6.3±1.1 mm yr−1, respectively. Mean uncorrected and corrected rate estimates are much higher at Tsijiore Nouve at 8.8±2.1 and 16.4±7.8 mm yr−1, which we consider to be unreasonable for reasons discussed in Sect. 5.1. For comparison, mean uncorrected and corrected rate estimates at the Otemma UM and LM rockwalls are 1.9±1.2 and 2.6±2.0 as well as 1.3±0.4 and 1.6±0.6 mm yr−1, respectively (Wetterauer et al., 2022a). We note that our erosion rate analyses are based on the ice-free rockwall areas of 1973 because debris deposition and thus rockwall erosion presumably occurred largely between 1850 and 1973 (Fig. 5).
4.4 Source rockwall morphology
We compare the debris source areas in the Pigne d'Arolla massif by area, aspect, and mean slope of the ice-free rockwall areas in the years 1850, 1973, and 2017 (Table 3). Overall, rockwalls are located between 3100 and 3400 m elevation. While the rockwalls at Brenay represent by far the largest debris source area, the other rockwalls are comparatively small. Southwest-facing rockwalls at Brenay in 1973 were inclined by 43∘ on average. At the northwest- to east-facing rockwalls of Cheilon, Pièce, and Tsijiore Nouve mean slope angles were steeper, ranging between 48 and 51∘. These observations are consistent with mean slope angles at Otemma, which in 1973 were steeper at the northwest-facing UM rockwalls (43∘) than at the southwest-facing LM rockwalls (36∘; Wetterauer et al., 2022a).
Source rockwall deglaciation in the Pigne d'Arolla massif after 1850 differs locally. Ice-free areas at Brenay, Cheilon, the Otemma UM rockwalls, Pièce, and Tsijiore Nouve expanded by < 5 % between 1850 and 1973, resulting in minimal changes in mean rockwall elevation. At the Otemma LM rockwalls, however, ice-free areas expanded by ∼ 150 %, and the mean elevation markedly dropped. Brenay, Pièce, and Tsijiore Nouve rockwalls seem to have expanded by only ∼ 20 % between 1973 and 2017. Thus, shifts in mean elevations have again remained small, except at Tsijiore Nouve, where recent bedrock exposure at the Pigne d'Arolla icefall reduced the mean rockwall elevation. In contrast, ice-free areas at Cheilon and the Otemma UM and LM rockwalls approximately doubled since 1973, expanding by 86 % to 129 %. Whereas at Cheilon mean rockwall elevation has shifted upward, Otemma UM and LM rockwalls have expanded predominantly downward. Visually, the degree of rockwall deglaciation is also evident on historical photographs (Fig. 6), particularly the significant ice cover changes across Otemma LM rockwalls.
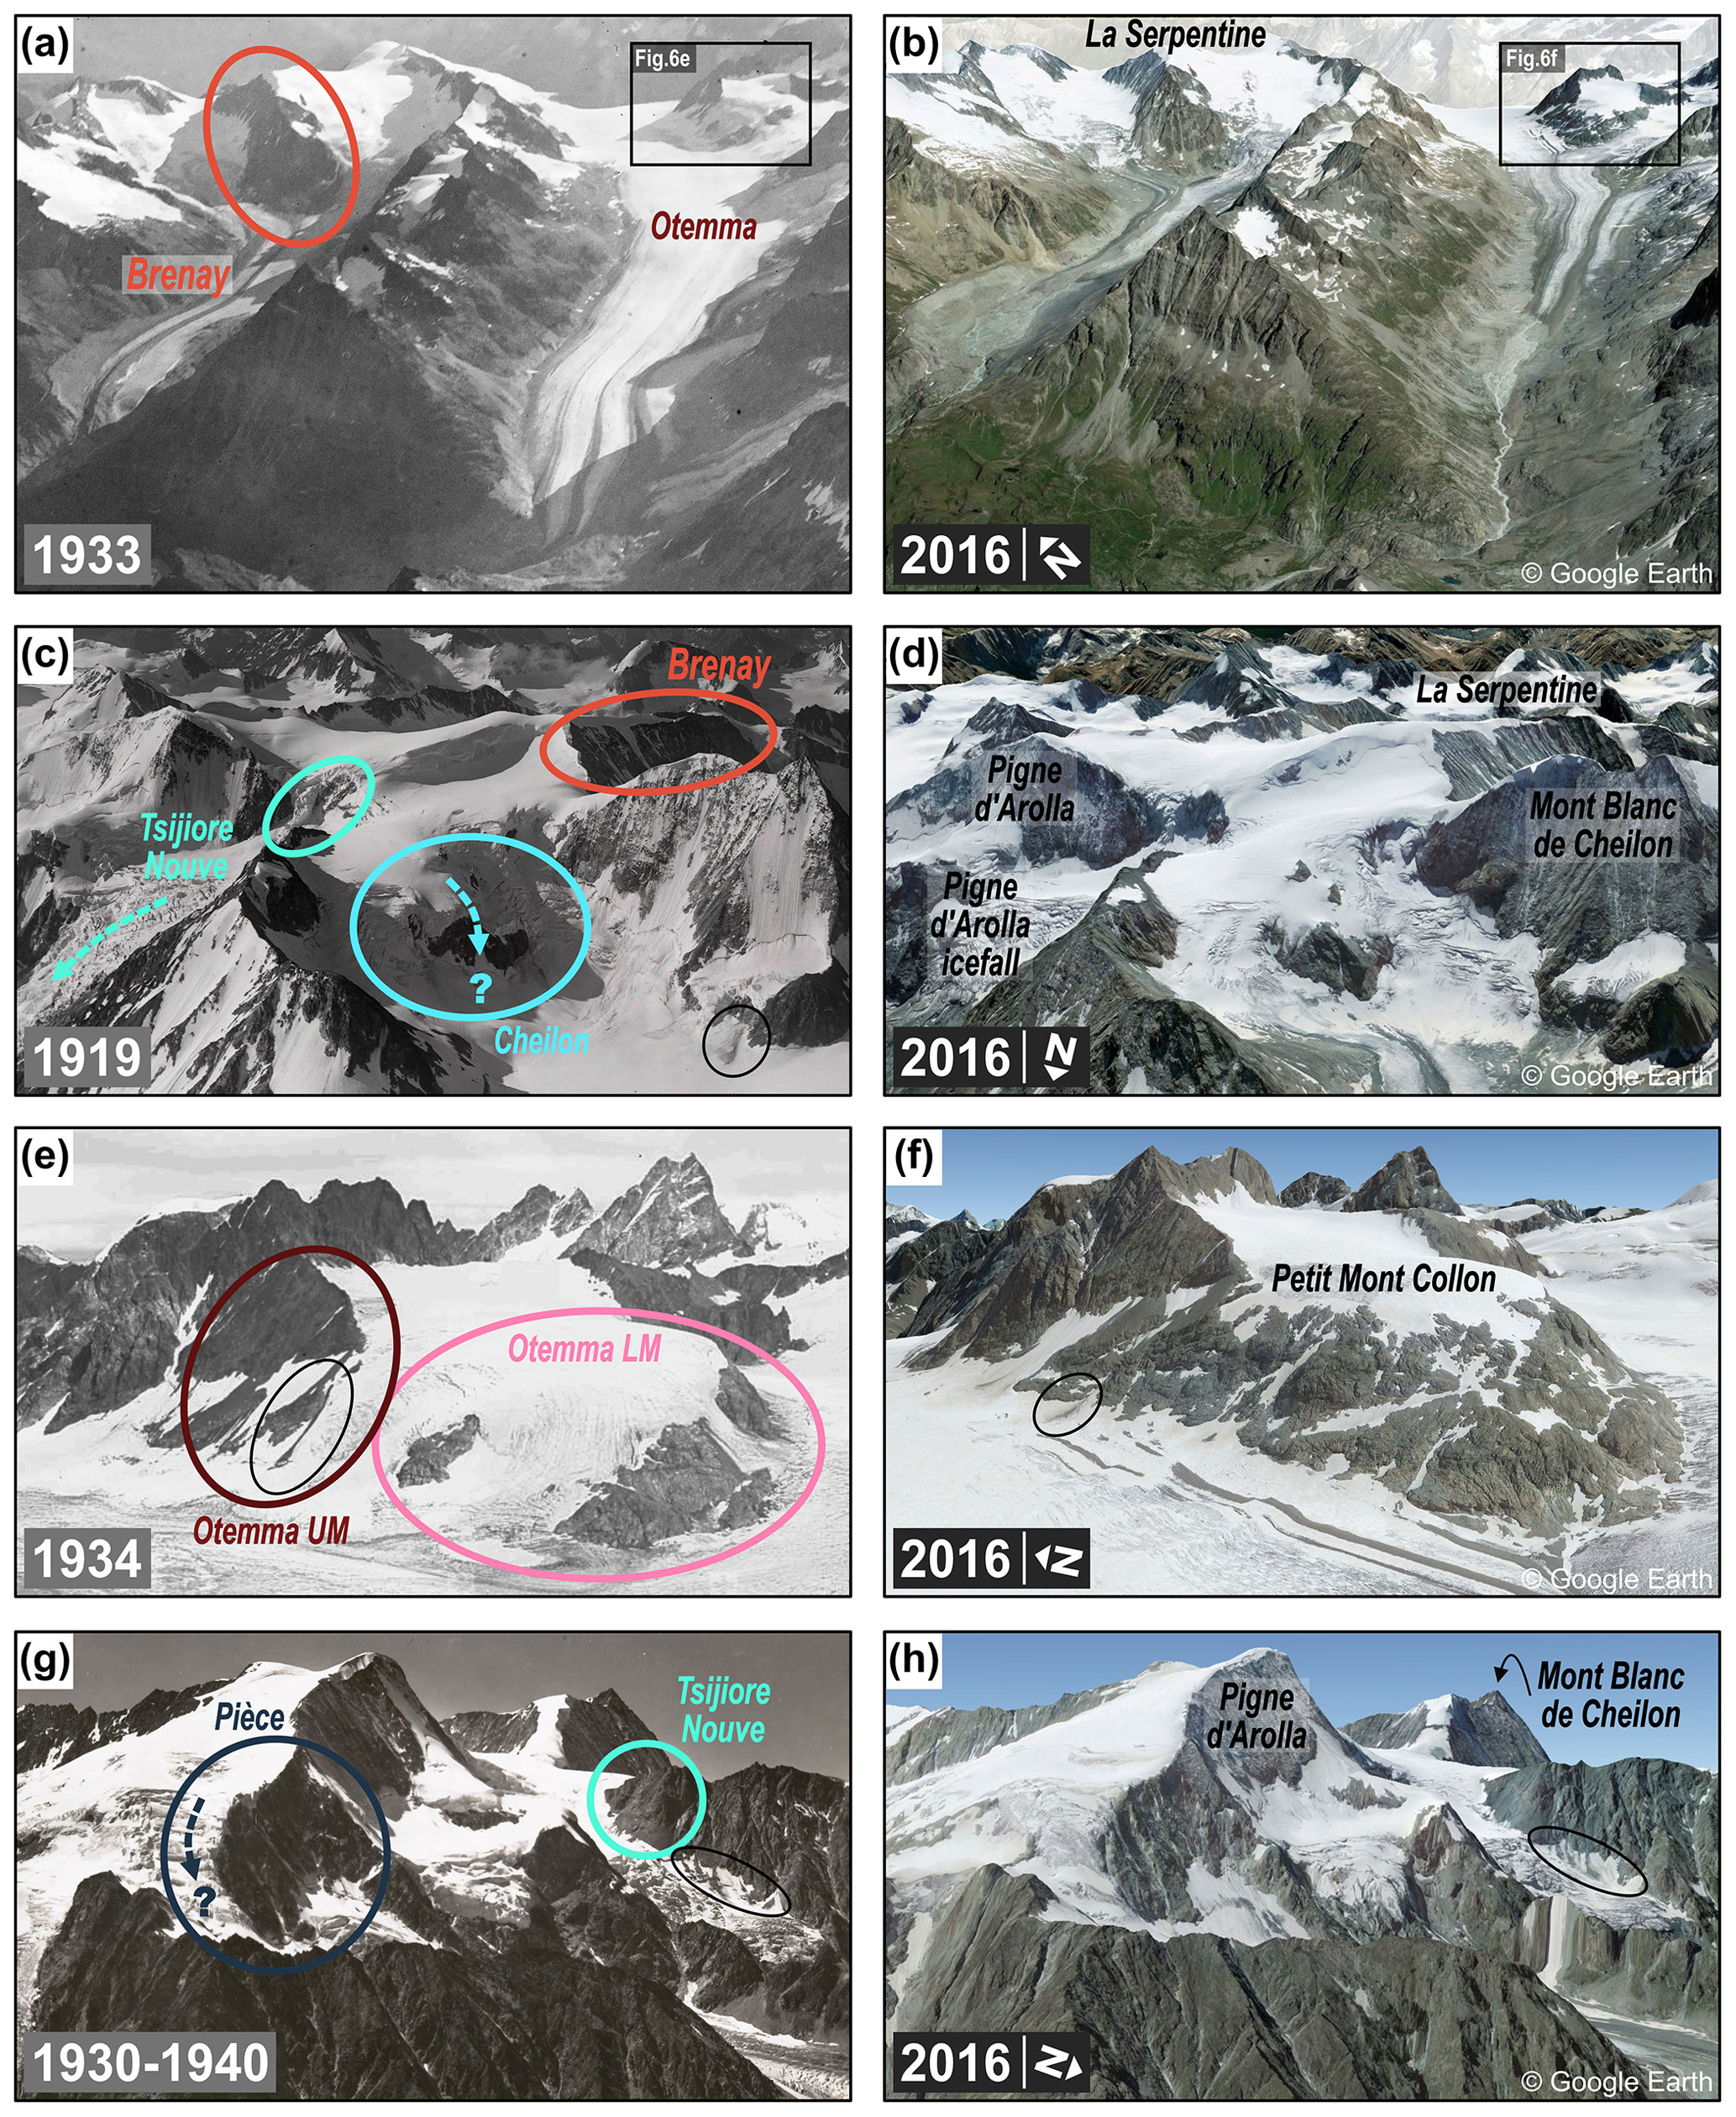
Figure 6Ice cover changes across deglaciating source rockwalls in the Pigne d'Arolla massif between the beginning of the (a, c, e, g) 20th and (b, d, f, h) 21st century. For each historical photograph on the left, approximately the same view from Google Earth (https://earth.google.com, last access: 5 December 2022) is shown on the right. The years shown are indicated (historical photographs by the ETH Library, 2022; Swisstopo, 2022). For clarity, debris source areas are only indicated on the left (coloured circles), and mountain peaks or ridges mentioned in the text are only labelled on the right. Areas where subglacial erosion may bias our medial moraine records are indicated (dashed arrows). Note the examples of small-scale rockfalls representative of rockwall erosion (black circles).
5.1 How “apparent” are the rockwall erosion rate estimates?
The medial moraine records of the Pigne d'Arolla massif – including the Otemma datasets (Wetterauer et al., 2022a) – cover a wide range of apparent rockwall erosion rates (Table 2), largely spanning between 0.6 and 10.0 mm yr−1 and presumably covering the last 200 years. Our particle trajectory modelling suggests that our new samples from Brenay, Cheilon, Pièce, and Tsijiore Nouve cover the post-LIA deglaciation period, and their [10Be] values indicate relatively stable apparent erosion rates (Fig. 5). In contrast, [10Be] values in the longer Otemma UM moraine record were found to decrease after the end of the LIA (Wetterauer et al., 2022a). Our estimates are broadly consistent with previous estimates of rockwall erosion rates in glacial landscapes in the Alps. Other studies using cosmogenic nuclides, albeit from different sources, report comparable erosion rates ranging from 0.1 to 6.4 mm yr−1 (Wittmann et al., 2007; Mair et al., 2019, 2020; Sarr et al., 2019). Similarly, erosion rates derived from optically stimulated luminescence reach values up to 4.3 mm yr−1 over the last ∼ 100 years (Lehmann et al., 2020), whereas erosion rates derived from terrestrial laser scanning between the years 2005 and 2010 reach values as high as 6.5 and 8.4 mm yr−1 (Rabatel et al., 2008; Kenner et al., 2011). Despite the similarity of our and previously estimated erosion rates, we emphasize that estimating apparent rockwall erosion rates from medial moraine [10Be]measured involves uncertainties that are not easy to quantify (Wetterauer et al., 2022a).
Apart from the assumption of isotopic steady state that underlies our calculation (Sect. 3.1), the range of our erosion rate estimates depends on whether we account for post-depositional 10Be accumulation during downglacier debris transport (transport-corrected [10Be]rockwall) or not (uncorrected [10Be]measured). The differences are negligible for samples with high [10Be]measured but noticeable where [10Be]measured values are low (Table 2). Overall, our particle trajectory model involves generalized assumptions, and thus sample ages and [10Be]transport should be considered approximations. Our temporal assignment seems to be quite robust because even if we assume half or twice the velocity changes for years before 1977, for which we lack boulder-tracking data, the modelled sample ages are mostly < 5 years older or younger (Supplement Table S1). Yet, we note here that the model is not capable of simulating debris transport through an icefall and that debris trajectories at Tsijiore Nouve start at the base of the Pigne d'Arolla icefall and therefore probably underestimate the overall debris transport time. Assuming fast surface velocities across the Pigne d'Arolla icefall of up to ∼ 70 m yr−1 (Millan et al., 2022), sample ages at Tsijiore Nouve would be a few decades older (< 40 years) than estimated and would thus still fall into the post-LIA deglaciation period. Our estimates of supraglacial transport paths largely agree with historical photographs. At Brenay, our modelled trajectories (Fig. S3) indicate supraglacial transport below the confluence of both tributaries at all times. This is consistent with historical photographs (Fig. 6a) and reconstructions of the glacier in 1850, which indicate that the medial moraine was already at the surface at the end of the LIA (Lambiel and Talon, 2019). At Pièce, burial and englacial transport of debris deposited before or around 1980, as suggested by our modelled trajectories (Fig. S4b), also appear to be consistent with aerial images taken in September 1983 (Fig. S5), which indicate a low ELA and re-emergence of debris further downglacier. However, exceptionally high erosion rate estimates for Cheilon sample C5, which result from very low calculated [10Be]rockwall, suggest that the model may overestimate [10Be]transport at this glacier. Specifically, the simulated transport of C5 is exclusively supraglacial (Fig. S4a), with its modelled trajectory always being slightly below the assumed ELA. We note that it is possible that the local ELA history may well differ from the assumed one, which we adopted from a regional large-scale record (Žebre et al., 2021). In fact, samples deposited subsequently to C5 have been buried and aerial images from 1983 (Fig. S5) indicate debris deposition in the accumulation zone (at the time of image acquisition), suggesting that it is unlikely that C5 was never buried. Also, at Tsijiore Nouve, [10Be]transport values seem to be maximum estimates, as our model does not incorporate englacial transport through the Pigne d'Arolla icefall. There, modelled debris particles experience supraglacial transport only (Fig. S4c), even though early observations (Small and Clark, 1974) and aerial images from 1983 (Fig. S5) suggest englacial transport in the past, downglacier of the icefall base. However, in the absence of better-resolved ELA, mass balance, and pre-1977 glacier velocity data, it is difficult to obtain more reliable estimates of [10Be]transport. Therefore, we consider the provided uncorrected erosion rate estimates to be minimum values, whereas our transport-corrected estimates may instead be considered maximum values if we overestimate supraglacial transport time, as indicated by the C5 and TN samples. Nevertheless, given the mostly rather narrow ranges, except for C5 and TN samples, any trend that we observe in our apparent erosion rates is likely real and not an artefact of downglacier transport.
In addition to 10Be accumulation during transport, the possible contribution of subglacially derived debris challenges the direct interpretation of our apparent rockwall erosion rates as actual rockwall erosion rates. Subglacially eroded debris probably has a low [10Be] and, if admixed with supraglacially eroded debris, would tend to reduce the concentration signal in medial moraine debris (Wetterauer et al. 2022a), especially where [10Be] signals of rockwall erosion are low. At Tsijiore Nouve, the two medial moraines do not directly detach from their source rockwalls but are separated from them by the upper accumulation basin and the Pigne d'Arolla icefall (Fig. 1g). Samples therefore possibly combine rockwall debris buried and transported englacially in the upper accumulation basin, as well as debris from subglacially eroded bedrock brought up by the icefall, both melting out and mixing in the ablation zone below the icefall (Small et al., 1979; Small and Gomez, 1981; Gomez and Small, 1983). Still, supraglacial sources have been suggested to be dominant based on a higher proportion of angular medial moraine clasts (Small and Gomez, 1981). This is supported by the ridge-like topography of both moraines and their separation by an ice septum (Fig. 1g), which indicate locally enhanced supply from rockwall debris. If subglacial supply along the icefall were dominant, we would expect a more continuous debris cover over the entire ablation zone width, which is not the case. At Pièce and Cheilon, ice moving along the rockwall margin may also contribute subglacial material. Whether such material would lower the [10Be] of the debris by much is difficult to assess. However, rockwall debris deposition at Pièce occurs over ∼ 200 m of distance, while potential subglacial input seems to be confined to a single local point source at the easternmost rockwall margin (Fig. 6g). In contrast, at Cheilon, the emergence of rockwalls within the glacier tributary (Fig. 6c) could allow for subglacial input along larger sections of the rockwall margin, which may explain the low concentrations measured in sample C5 (Table 1).
Since the end of the LIA, glaciers around the Pigne d'Arolla massif have been retreating, exposing bedrock surfaces formerly shielded from cosmic radiation, which are now probably eroding. However, the expansion of ice-free areas is not uniform across the study sites (Table 3, Fig. 6), raising the question of whether our samples with low [10Be] may be due to the erosion of recently uncovered bedrock with a potentially low concentration (Scherler and Egholm, 2020; Wetterauer et al., 2022a). At the Otemma LM rockwalls, Wetterauer et al. (2022a) have found that the ice cover has shrunk significantly in patches since 1850, so the associated patchy rockwall expansion could be the reason why [10Be] here shows the comparatively largest spread among the deglaciation records from the massif. In contrast, between 1850 and 1973, the reconstructed rockwall expansion due to shrinking ice cover was small (< 5 %) at Brenay, Cheilon, Pièce, and Tsijiore Nouve, as well as at the Otemma UM rockwalls (Fig. S1c). Since 1973, the ice-free rockwall areas have changed only slightly (∼ 20 %) at Brenay, Pièce, and Tsijiore Nouve but more significantly at Cheilon and the Otemma UM rockwalls, where the areas have doubled (Fig. S1b). Our modelled sample ages suggest that erosion at Brenay, Cheilon, and the Otemma UM rockwalls presumably occurred before 1973, and thus we expect that the associated erosion rate estimates are largely unaffected by ice cover changes. Similarly, in the younger records of Pièce and Tsijiore Nouve, post-1973 deglaciation effects should be comparatively small as rockwall areas varied only marginally. Even if our modelled age estimates were too old by a few years, it is not straightforward to provide estimates of the relative amounts of debris eroded from surfaces newly exposed since 1973 that are included in medial moraine debris and what their actual [10Be] is. However, we would expect continuous ice surface lowering to have notable effects, probably reflected by temporal trends, which is only observed for the long Otemma UM moraine record. If we assume that the temporal trend in the Otemma UM moraine record since 1850 reflects a pure deglaciation signal, due to the addition of debris from formerly subglacial surfaces with a [10Be] of zero atoms g−1 at the same erosion rate as before, the medial moraine would require a contribution of 75 % of such debris to lower the mean [10Be]rockwall of the pre-1860 LIA value (∼ 18 × 103 atoms g−1 for O/UM6–9) to the mean [10Be]rockwall of the post-1900 deglaciation value (∼ 4 × 10³ atoms g−1 for O/UM1–3). This would correspond to a quadrupling of the debris source area and supply. Such an increase in the debris supply should also be visible in the amount of material exposed in the medial moraine. Yet, our source rockwall analysis indicates no changes in ice-free areas at Otemma UM rockwalls from 1850 to 1973 (Table 3, Fig. S1c), and the downglacier narrowing of the UM moraine between sample locations O/UM3 and O/UM8 is most probably due to the acceleration of flow velocities at the ice confluence below Petit Mont Collon (see Fig. S2c in Wetterauer et al., 2022b).
Based on the above assessments, we assume that the actual 10Be-derived rockwall erosion rates lie somewhere between our apparent minimum and maximum rockwall erosion rate estimates. The fact that within these bounds, the records are either trending or stable, rather than being randomly scattered, suggests that the operating erosion processes (see Sect. 5.2) are characterized by continuity. Source rockwall expansion into formerly glaciated terrain is small at Brenay, Cheilon, Pièce, Otemma UM rockwalls, and Tsijiore Nouve but can be problematic at Otemma LM rockwalls, where deglaciation is most pronounced and complex. At Cheilon and Pièce, the contribution of subglacially derived debris of low concentration is possible, probably with a greater chance of bias at Cheilon, as subglacial input could occur along larger rockwall sections. The icefall at Tsijiore Nouve likely introduces subglacial material that may lower [10Be]measured, suggesting that actual 10Be-derived rockwall erosion rates are lower. Nevertheless, the temporal consistency of its record and the continuity of its medial moraine indicate that erosion rates remained fairly stable through time, as is the case for most other post-LIA records, too.
5.2 Spatial trends in apparent rockwall erosion
The source rockwalls of the Pigne d'Arolla massif differ in their morphology (Table 3), and comparison with our apparent rockwall erosion rates, averaged over the deglaciation period, indicates some spatial trends: mean erosion rate estimates appear to be higher for smaller rockwall areas (Fig. 7a) and for steeper slopes (Fig. 7d) but vary independently of mean rockwall elevation (Fig. 7b). Differentiating by aspect, mean erosion rate estimates are higher at northwest- to northeast-facing rockwalls but lower at southwest faces (Fig. 7c). These trends are the same for apparent minimum and maximum rockwall erosion rates. We note that aspect and slope angle appear to be related in the area around Pigne d'Arolla: at the approximate elevation range of the studied debris source areas, ice-free north faces are the steepest, while south faces are the shallowest (Fig. 2c).
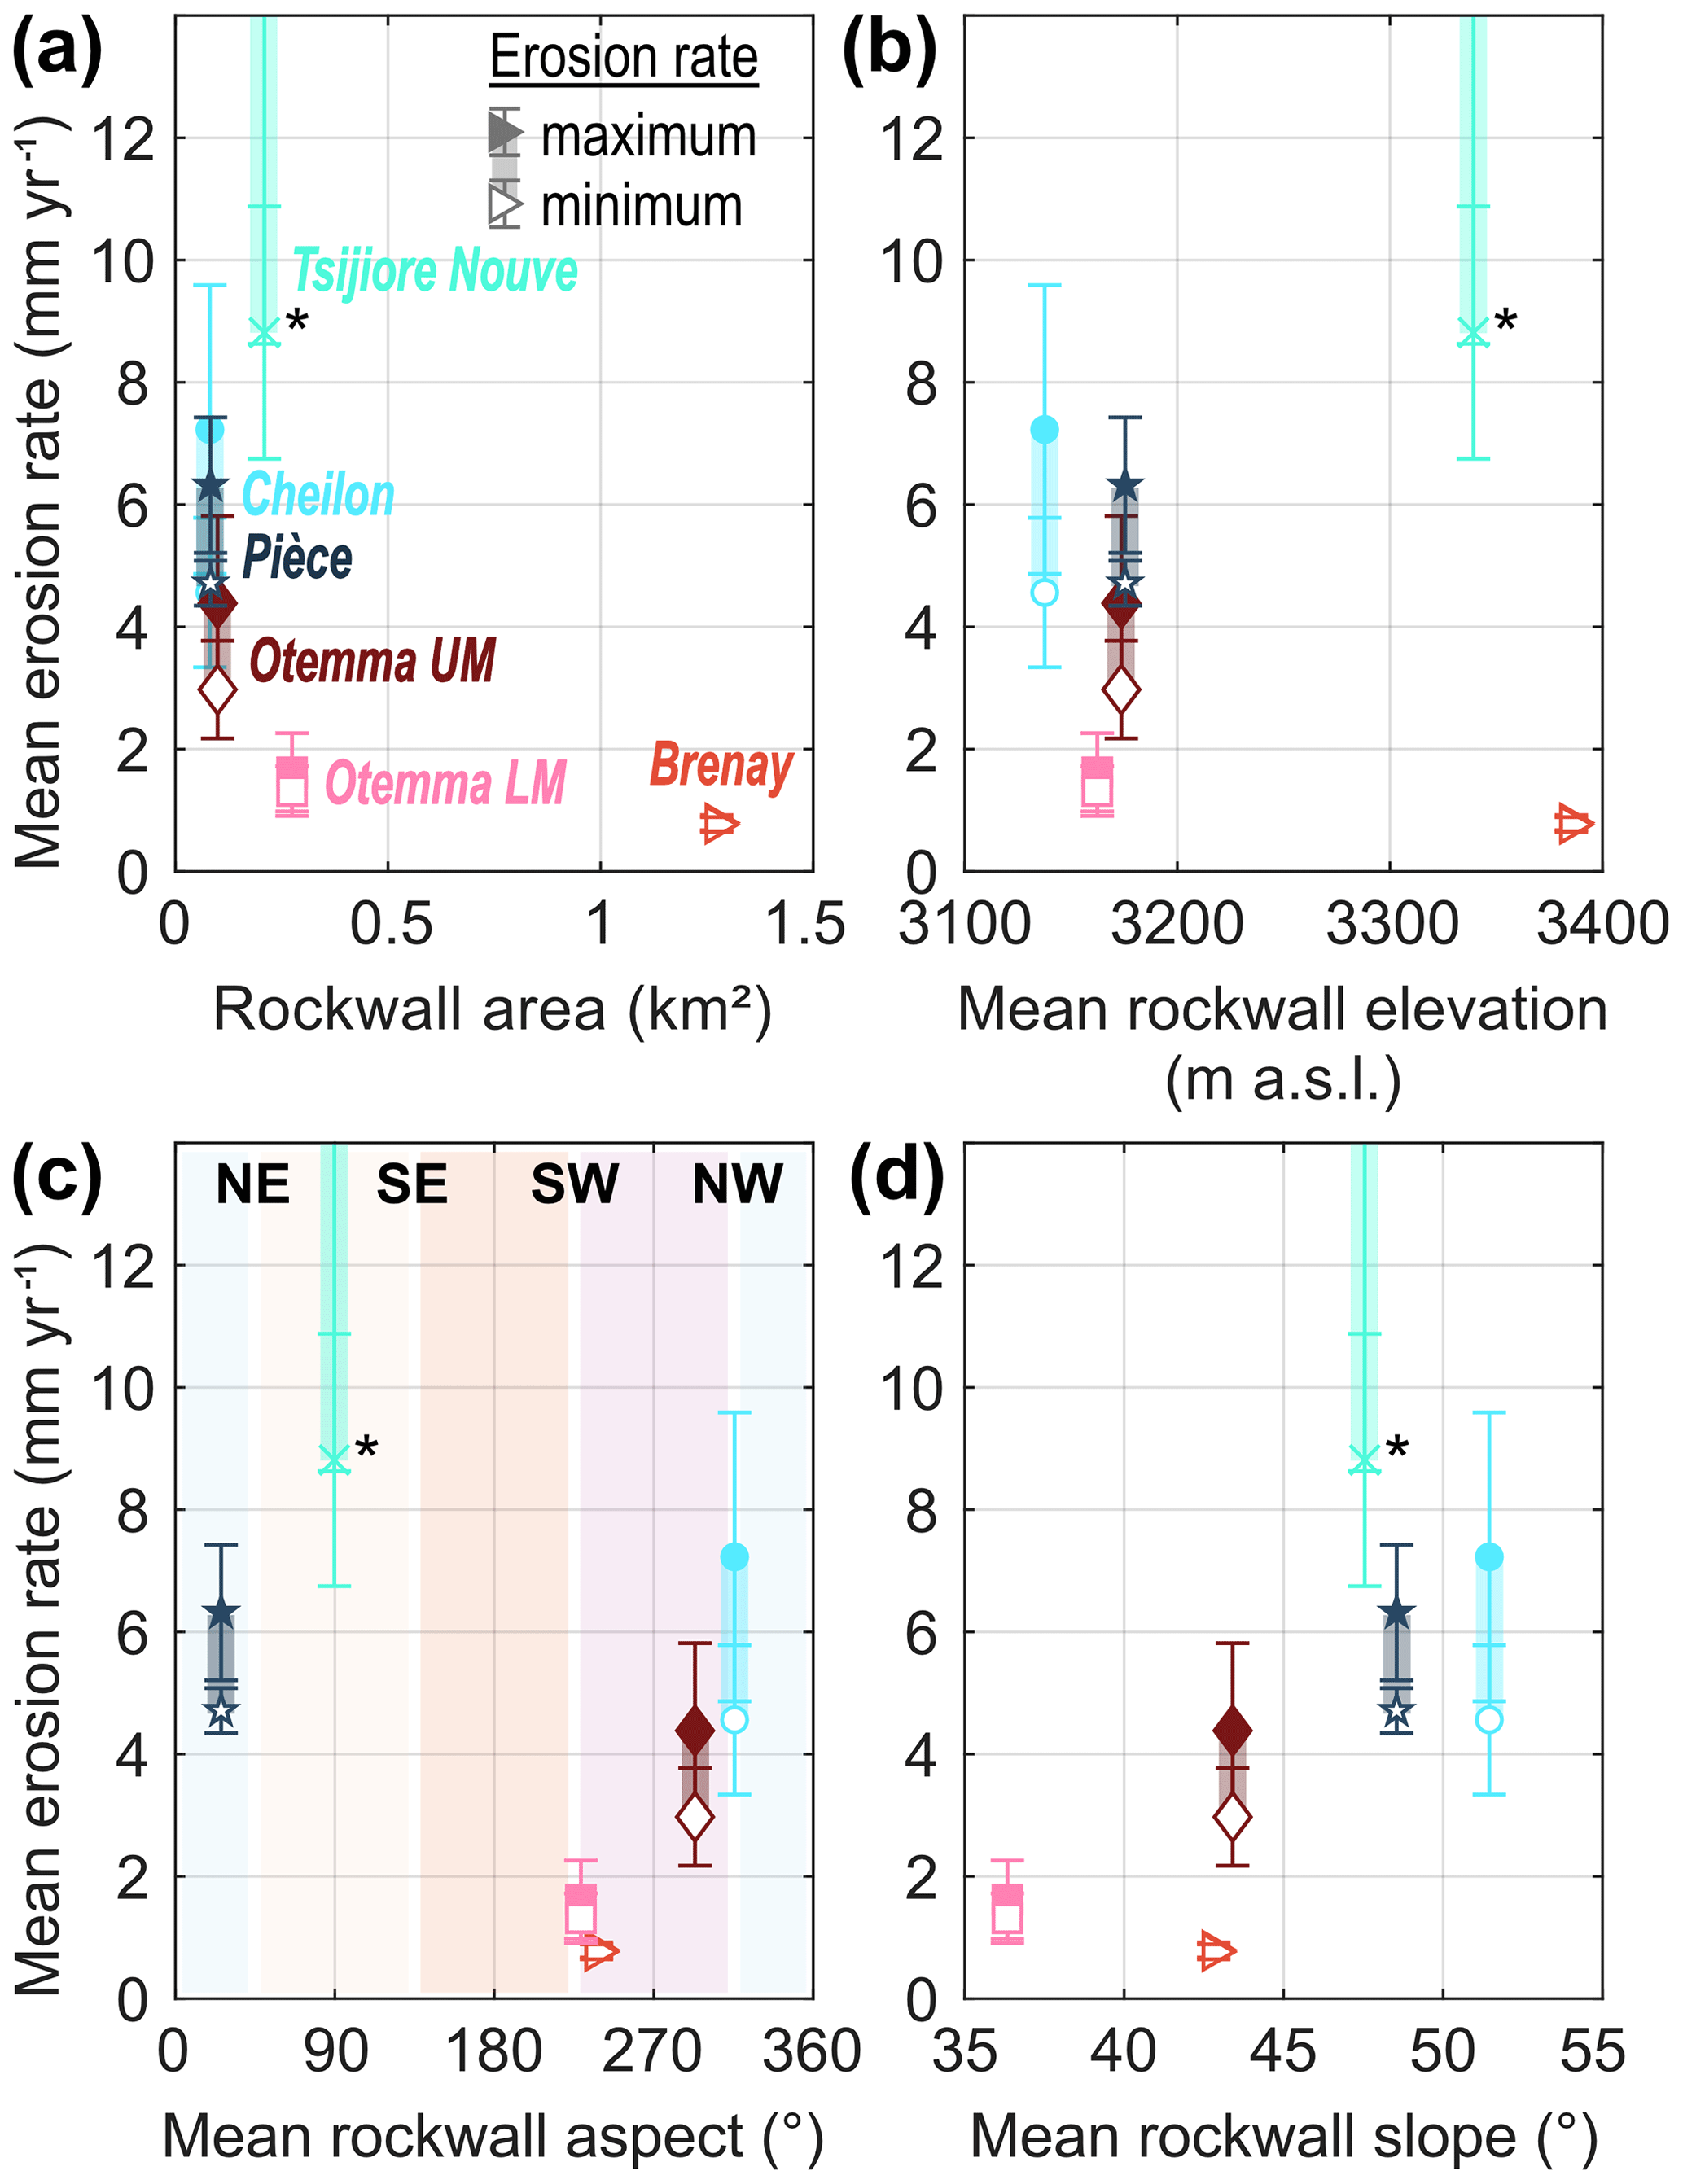
Figure 7Comparison of apparent mean rockwall erosion rates with respect to (a) area, (b) mean elevation, (c) mean aspect, and (d) mean slope of the 1973 exposed source rockwalls. Apparent mean erosion rates (±1σ) are depicted as shaded ranges from minimum (uncorrected) to maximum (transport-corrected) estimates. For comparison, mean erosion rates here include only samples associated with the recent deglaciation period (Fig. 5) but exclude samples from the Little Ice Age (O/UM6–9). The high-concentration outlier at Glacier d'Otemma (O/UM4, Fig. 5) is also excluded but would not change the overall pattern if included. Note that mean erosion rates at Glacier de Tsijiore Nouve (*) should be treated with caution and are likely overestimated due to an unquantified subglacial bias (see Sect. 5.1) and that Glacier de Cheilon sample C5 was excluded from the maximum estimate due to its unreasonably high erosion rate (see Sect. 5.1).
At mountain ridges where asymmetry between north and south slopes has been observed, cirque erosion has been suggested to be the dominant process promoting retreat of glaciated north slopes at the expense of unglaciated south slopes during glacial periods (Oskin and Burbank, 2005; Naylor and Gabet, 2007). Our datasets indicate that asymmetry may also be observed where both north and south faces are glaciated. North of the east–west-trending ridgeline between Pigne d'Arolla and Mont Blanc de Cheilon, steeper rockwalls tower above smaller glaciers, while to the south, shallower rockwalls tower above larger glaciers (Fig. 1a, b). It appears that steeper north-facing rockwalls, although smaller in area, have higher erosion rates than the more extensive shallower south-facing rockwalls, where larger bedrock areas are exposed (Fig. 7a). In the following, we will address the relevance of (i) rockwall area, (ii) slope, and (iii) aspect as potential controls on the observed spatial trends in our apparent rockwall erosion rates.
- i.
The larger a source area, the more likely it is to capture and average a variety of erosive events. In smaller areas, however, large individual events may represent a larger portion of the total area and may result in overall higher erosion rates. Nevertheless, recent rockfalls in the Pigne d'Arolla massif seem small enough (Fig. 6) not to dominate an entire area or sample. According to studies that examine the size of recent rockfalls in the Alps, large-volume rockfalls of 100 to 1000 m3 are rare, though measured over short recent time periods (e.g. Strunden et al., 2015; Hartmeyer et al., 2020), and would still only represent a fraction of our source rockwall areas (Table 3). Moreover, we could not delineate massive deposits of debris instantly released onto the ice on any of the orthoimages of the last ∼ 40 years (Swisstopo, 2022) that we used for our boulder tracking.
- ii.
Erosion is typically considered a slope-dependent process (Gilbert, 1877). According to nonlinear transport laws, erosion rates linearly increase with steepening hillslopes at shallow gradients but rapidly increase when reaching a critical hillslope angle (e.g. Roering et al., 1999, 2001). This positive correlation has been widely recognized across fluvial landscapes, where catchment-wide erosion rates derived from cosmogenic nuclides suggest a broad linear trend up to a critical angle, often around 30∘ (e.g. Granger et al., 1996; Binnie et al., 2007; Ouimet et al., 2009; DiBiase et al., 2012; Delunel et al., 2020). Ice-free rockwalls in glacial landscapes, however, are much steeper and considered to be at their threshold angle (Scherler, 2014), and a similarly clear correlation may be complicated by the stochastic nature of rockfalls. Still, our erosion rate estimates suggest a positive correlation with rockwall slope in the Pigne d'Arolla massif, as do erosion rates from rockwalls flanking the Mer de Glace in the Mont Blanc massif (Lehmann et al., 2020).
- iii.
In alpine landscapes, spatial variability in rockwall stability and erosion is often suggested to be temperature-driven (e.g. Sass, 2005; Gruber and Haeberli, 2007; Hales and Roering, 2009; Delunel et al., 2010; Mair et al., 2020). At north faces, higher rockfall activity has been associated with higher moisture supply and deeper continued freezing, favouring damage by frost on shaded versus sunny faces (Coutard and Francou, 1989; Sass, 2005). In addition, recent rockwall destabilization has also been related to climate-induced permafrost degradation (Gruber and Haeberli, 2007), with thaw anomalies and rockfall activity appearing to be particularly pronounced at north faces, which are accustomed to a lower inter-annual thawing depth variability due to less direct solar radiation (Gruber et al., 2004; Sass, 2010). Furthermore, frost-cracking models predict rockwall erosion to be higher where rockwalls reach into the frost-cracking window, an elevation-dependent temperature range of high frost-cracking efficiency (e.g. Walder and Hallet, 1985; Anderson, 1998; Hales and Roering, 2007), typically near the base of steep rockwalls (Hales and Roering, 2005; Sanders et al., 2012; Scherler, 2014). Overall higher apparent rockwall erosion rates at north faces in the Pigne d'Arolla massif could hence also be related to distinct aspect-related temperature conditions. Permafrost is still most extensive at the shaded north faces of the ridgeline (Fig. S6; BAFU, 2005) and probably more susceptible to post-LIA warming than the discontinuous permafrost occurrence to the south. Moreover, where rockwall base elevations are similar (∼ 3000 m at all sites except Tsijiore Nouve, Fig. 1b), temperature conditions at north faces may be more favourable for frost cracking. It is noteworthy that, although Brenay rockwalls partially also face northwest, erosion rate estimates are much lower than at the other north-facing sites. Here, elevation could play a role as the northwest faces at Brenay are located high (3400–3700 m; Fig. 1b) and may experience less permafrost degradation and/or different altitudinal controls on frost cracking compared to the other slightly lower north-facing sites (3000–3400 m).
Based on the above assessments, we do not expect spatial trends in rockwall erosion among our study sites to be dominated by an area effect. Rather, higher mean apparent erosion rates at steeper northwest-facing rockwalls may indicate a potential slope and aspect control, which could be related to distinct temperature-driven destabilization conditions. Yet, as our studied sites are overall very steep and cover only a narrow range of slope gradients, it is not easy to resolve slope dependency in rockwall erosion more precisely or even to generalize patterns. Moreover, it is difficult to judge whether the aspect-related differences in permafrost and frost-cracking conditions suggested above were already as pronounced at the estimated time of rockwall erosion. Future studies following this approach may therefore examine datasets that cover a wider range of rockwall gradients and incorporate temporal records of land surface temperatures or frost-cracking models to further assess the role of aspect and temperature.
We derived apparent rockwall erosion rates around Pigne d'Arolla in Switzerland from [10Be] in medial moraine debris at five nearby valley glaciers. The total of six medial moraine records largely span 0.6 to 10.0 mm yr−1 and cover the recent deglaciation period (Glacier du Brenay, Glacier de Cheilon, Glacier de Pièce, Glacier de Tsijiore Nouve), back to the end of the LIA (Glacier d'Otemma). Our analyses lead us to the following main findings.
- i.
Although glacial landscapes typically erode stochastically, which could make random variability along temporal records likely, our medial moraine [10Be] records are temporally consistent for the deglaciation period and decrease systematically from the end of the LIA towards deglaciation. Whereas large-volume rockfalls are typically identifiable by the additional volume of rock delivered to the glacier, the morphology of the studied medial moraines varies only gradually and is more likely to reflect gradual variations in ice dynamics or rockwall erosion. This suggests that the medial moraines from the Pigne d'Arolla massif indeed act as archives of rockwall erosion.
- ii.
Post-depositional debris exposure during downglacier transport, ice cover changes across deglaciating rockwalls, and subglacially derived material introduce uncertainties that complicate the conversion of measured medial moraine [10Be] to rockwall erosion rates directly and require high-resolution datasets on the temporal evolution of the studied glaciers. For the majority of samples, the transport corrections derived from our boulder-tracking velocities and debris trajectory modelling seem reasonable when compared to historical photographs. They are overall negligible where the measured [10Be] values are high but more significant for lower values, yet without affecting any observed systematic consistency or variability. Quantifying ice cover changes across the source rockwalls indicates that source area changes have been small, except for one site. Yet, the contribution of recently deglaciated bedrock and/or subglacially derived material remains difficult to quantify, may affect some of the sites, and requires further analysis.
- iii.
Temporally, [10Be] records at Glacier du Brenay, Glacier de Cheilon, Glacier de Pièce, and Glacier de Tsijiore Nouve appear comparatively stable over the last ∼ 100 years, as do their debris source areas for the estimated time of rockwall erosion. This may indicate that source area changes, which are reflected in the decrease in [10Be] in the ∼ 200-year-long record from the Glacier d'Otemma, are transient processes related to the transition from the LIA to the following deglaciation period. The absence of similar trends at the other sites may suggest that changes in source area either play a minor role or have stabilized again after a short time period.
- iv.
The choice of the small and localized massif around Pigne d'Arolla, with its similar rockwall lithology, facilitates the relative spatial comparison of its debris source areas without major bias arising from comparing sites with different tectonic or climatic settings or pronounced lithological differences. Around Pigne d'Arolla, higher mean apparent erosion rates at overall steeper north-facing compared to shallower southwest-facing rockwalls indicate a potential slope and aspect control on our records and may be related to rockwall erosion and destabilization affected by temperature conditions.
The cosmogenic nuclide dataset and derived glacier surface velocities of this study are available in the accompanying data publication: Wetterauer and Scherler (2023) at https://doi.org/10.5880/GFZ.3.3.2023.002. These data are freely available under the Creative Commons Attribution 4.0 International (CC BY 4.0) open-access license at GFZ Data Services. Please make sure to cite the dataset and possibly this article when using the dataset.
The supplement related to this article is available online at: https://doi.org/10.5194/esurf-11-1013-2023-supplement.
KW carried out sample collection and preparation, conducted the data analyses, and prepared the paper based on the comments and edits of DS. DS conceived and supervised the project and was the main advisor during data analyses and paper drafting.
At least one of the (co-)authors is a member of the editorial board of Earth Surface Dynamics. The peer-review process was guided by an independent editor, and the authors also have no other competing interests to declare.
Publisher's note: Copernicus Publications remains neutral with regard to jurisdictional claims made in the text, published maps, institutional affiliations, or any other geographical representation in this paper. While Copernicus Publications makes every effort to include appropriate place names, the final responsibility lies with the authors.
We are grateful to Leif Anderson and Deniz Gök for support during sampling and fieldwork. Stefan Heinze and Steven Binnie from the University of Cologne are thanked for performing AMS measurements. Hella Wittmann, Cathrin Schulz, and Kristina Krüger are thanked for their help and advice in sample preparation. We also thank the editors and the two reviewers, Neil Glasser and one anonymous referee, for their constructive feedback on the paper.
This research has been supported by the European Research Council under the European Union's Horizon 2020 research and innovation programme (grant no. 759639).
The article processing charges for this open-access publication were covered by the Helmholtz Centre Potsdam – GFZ German Research Centre for Geosciences.
This paper was edited by Arjen Stroeven and reviewed by Neil Glasser and one anonymous referee.
Anderson, R. S.: Near-surface thermal profiles in alpine bedrock: implications for the frost weathering of rock, Arctic Alpine Res., 30, 362–372, https://doi.org/10.2307/1552008, 1998.
Anderson, R. S.: A model of ablation-dominated medial moraines and the generation of debris-mantled glacier snouts, J. Glaciol., 46, 459–469, https://doi.org/10.3189/172756500781833025, 2000.
Arsenault, A. M. and Meigs, A. J.: Contribution of deep-seated bedrock landslides to erosion of a glaciated basin in southern Alaska, Earth Surf. Proc. Land., 30, 1111–1125, https://doi.org/10.1002/esp.1265, 2005.
Balco, G., Stone, J. O., Lifton, N. A., and Dunai, T. J.: A complete and easily accessible means of calculating surface exposure ages or erosion rates from 10Be and 26Al measurements, Quat. Geochronol., 3, 174–195, https://doi.org/10.1016/j.quageo.2007.12.001, 2008.
Bundesamt für Umwelt (BAFU): Hinweiskarte der potenziellen Permafrostverbreitung, https://map.geo.admin.ch (last access: 14 November 2022), 2005.
Binnie, S. A., Phillips, W. M., Summerfield, M. A., and Fifield, L. K.: Tectonic uplift, threshold hillslopes, and denudation rates in a developing mountain range, Geology, 35, 743–746, https://doi.org/10.1130/G23641A.1, 2007.
Borchers, B., Marrero, S., Balco, G., Caffee, M., Goehring, B., Lifton, N., Nishiizumi, K., Phillips, F., Schaefer, J., and Stone, J.: Geological calibration of spallation production rates in the CRONUS-Earth project, Quat. Geochronol., 31, 188–198, https://doi.org/10.1016/j.quageo.2015.01.009, 2016.
Boulton, G. S. and Deynoux, M.: Sedimentation in glacial environments and the identification of tills and tillites in ancient sedimentary sequences, Precambrian Res., 15, 397–422, https://doi.org/10.1016/0301-9268(81)90059-0, 1981.
Chmeleff, J., von Blanckenburg, F., Kossert, K., and Jakob, D.: Determination of the 10Be half-life by multicollector ICP-MS and liquid scintillation counting, Nucl. Instrum. Meth. B, 268, 192–199, https://doi.org/10.1016/j.nimb.2009.09.012, 2010.
Coutard, J.-P. and Francou, B.: Rock temperature measurements in two alpine environments: implications for frost shattering, Arctic Alpine Res., 21, 399–416, https://doi.org/10.2307/1551649, 1989.
Delunel, R., Van Der Beek, P. A., Carcaillet, J., Bourlès, D. L., and Valla, P. G.: Frost-cracking control on catchment denudation rates: insights from in situ produced 10Be concentrations in stream sediments (Ecrins-Pelvoux massif, French Western Alps), Earth Planet. Sc. Lett., 293, 72–83, https://doi.org/10.1016/j.epsl.2010.02.020, 2010.
Delunel, R., Schlunegger, F., Valla, P.G., Dixon, J., Glotzbach, C., Hippe, K., Kober, F., Molliex, S., Norton, K.P., Salcher, B., Wittmann, H., Akçar, N., and Christl, M.: Late-Pleistocene catchment-wide denudation patterns across the European Alps, Earth-Sci. Rev., 211, 103407, https://doi.org/10.1016/j.earscirev.2020.103407, 2020.
D'Errico, J.: SLM – Shape Language Modeling, MATLAB Central File Exchange [code], https://www.mathworks.com/matlabcentral/fileexchange/24443-slm-shape-language-modeling, last access: 20 July 2022.
Dewald, A., Heinze, S., Jolie, J., Zilges, A., Dunai, T., Rethemeyer, J., Melles, M., Staubwasser, M., Kuczewski, B., Richter, J., Radtke, U., von Blanckenburg, F., and Klein, M.: CologneAMS, a dedicated center for accelerator mass spectrometry in Germany, Nucl. Instrum. Meth. B, 294, 18–23, https://doi.org/10.1016/j.nimb.2012.04.030, 2013.
DiBiase, R. A., Heimsath, A. M., and Whipple, K. X.: Hillslope response to tectonic forcing in threshold landscapes, Earth Surf. Proc. Land., 37, 855–865, https://doi.org/10.1002/esp.3205, 2012.
Dunne, J., Elmore, D., and Muzikar, P.: Scaling factors for the rates of production of cosmogenic nuclides for geometric shielding and attenuation at depth on sloped surfaces, Geomorphology, 27, 3–11, https://doi.org/10.1016/S0169-555X(98)00086-5, 1999.
ETH Library: e-pics Image Archive Online, ETH Library, Zürich, https://www.e-pics.ethz.ch/en/home_en/, last access: 15 August 2022.
Eyles, N. and Rogerson, R. J.: A framework for the investigation of medial moraine formation: Austerdalsbreen, Norway, and Berendon Glacier, British Columbia, Canada, J. Glaciol., 20, 99–113, https://doi.org/10.3189/S0022143000021249, 1978.
Fischer, L., Purves, R. S., Huggel, C., Noetzli, J., and Haeberli, W.: On the influence of topographic, geological and cryospheric factors on rock avalanches and rockfalls in high-mountain areas, Nat. Hazards Earth Syst. Sci., 12, 241–254, https://doi.org/10.5194/nhess-12-241-2012, 2012.
Gilbert, G. K.: Geology of the Henry Mountains, U.S. Geographical and Geological Survey, Government Printing Office, https://doi.org/10.3133/70038096, 1877.
Gilbert, G. K.: Systematic asymmetry of crest lines in the High Sierra of California, J. Geol., 12, 579–588, 1904.
GLAMOS: Swiss glacier length change, release 2021, Glacier Monitoring Switzerland, https://doi.org/10.18750/lengthchange.2021.r2021, 2021a.
GLAMOS: Swiss glacier mass balance, release 2021, Glacier Monitoring Switzerland, https://doi.org/10.18750/massbalance.2021.r2021, 2021b.
GLAMOS: Swiss glacier volume change, release 2021, Glacier Monitoring Switzerland, https://doi.org/10.18750/volumechange.2021.r2021, 2021c.
Gomez, B. and Small, R. J.: Genesis of englacial debris within the lower Glacier de Tsidjiore Nouve, Valais, Switzerland, as revealed by scanning electron microscopy, Geogr. Ann. A, 65, 45–51, https://doi.org/10.1080/04353676.1983.11880073, 1983.
Gomez, B. and Small, R. J.: Medial moraines of the Haut Glacier d'Arolla, Valais, Switzerland: debris supply and implications for moraine formation, J. Glaciol., 31, 303–307, https://doi.org/10.3189/S0022143000006638, 1985.
Granger, D. E., Kirchner, J. W., and Finkel, R.: Spatially averaged long-term erosion rates measured from in situ-produced cosmogenic nuclides in alluvial sediment, J. Geol., 104, 249–257, 1996.
Gruber, S. and Haeberli, W.: Permafrost in steep bedrock slopes and its temperature-related destabilization following climate change, J. Geophys. Res.-Earth, 112, F02S18, https://doi.org/10.1029/2006JF000547, 2007.
Gruber, S., Hoelzle, M., and Haeberli, W.: Permafrost thaw and destabilization of Alpine rock walls in the hot summer of 2003, Geophys. Res. Lett., 31, L13504, https://doi.org/10.1029/2004GL020051, 2004.
Hales, T. C. and Roering, J. J.: Climate-controlled variations in scree production, Southern Alps, New Zealand, Geology, 33, 701–704, https://doi.org/10.1130/G21528.1, 2005.
Hales, T. C. and Roering, J. J.: Climatic controls on frost cracking and implications for the evolution of bedrock landscapes, J. Geophys. Res.-Earth, 112, F02033, https://doi.org/10.1029/2006JF000616, 2007.
Hales, T. C. and Roering, J. J.: A frost “buzzsaw” mechanism for erosion of the eastern Southern Alps, New Zealand, Geomorphology, 107, 241–253, https://doi.org/10.1016/j.geomorph.2008.12.012, 2009.
Hartmeyer, I., Delleske, R., Keuschnig, M., Krautblatter, M., Lang, A., Schrott, L., and Otto, J.-C.: Current glacier recession causes significant rockfall increase: the immediate paraglacial response of deglaciating cirque walls, Earth Surf. Dynam., 8, 729–751, https://doi.org/10.5194/esurf-8-729-2020, 2020.
Huggel, C., Salzmann, N., Allen, S., Caplan-Auerbach, J., Fischer, L., Haeberli, W., Larsen, C., Schneider, D., and Wessels, R.: Recent and future warm extreme events and high-mountain slope stability, Philos. T. R. Soc. A, 368, 2435–2459, https://doi.org/10.1098/rsta.2010.0078, 2010.
Kenner, R., Phillips, M., Danioth, C., Denier, C., Thee, P., and Zgraggen, A.: Investigation of rock and ice loss in a recently deglaciated mountain rock wall using terrestrial laser scanning: Gemsstock, Swiss Alps, Cold Reg. Sci. Technol., 67, 157–164, https://doi.org/10.1016/j.coldregions.2011.04.006, 2011.
Korschinek, G., Bergmaier, A., Faestermann, T., Gerstmann, U.C., Knie, K., Rugel, G., Wallner, A., Dillmann, I., Dollinger, G., Lierse von Gostomski, Ch., Kossert, K., Maiti, M., Poutivtsev, M., and Remmert, A.: A new value for the half-life of 10Be by Heavy-Ion Elastic Recoil Detection and liquid scintillation counting, Nucl. Instrum. Meth. B, 268, 187–191, https://doi.org/10.1016/j.nimb.2009.09.020, 2010.
Lal, D.: Cosmic ray labeling of erosion surfaces: in situ nuclide production rates and erosion models, Earth Planet. Sc. Lett., 104, 424–439, https://doi.org/10.1016/0012-821X(91)90220-C, 1991.
Lambiel, C. and Talon, P.: Les glaciers du haut val de Bagnes au Petit Age glaciaire, Annales valaisannes, Actes du colloque Giétro 1818 sous la loupe des sciences, 63–75, https://wp.unil.ch/hmg/files/2023/04/Lambiel-Talon-2019.pdf (last access: 24 October 2023), 2019.
Lehmann, B., Herman, F., Valla, P. G., King, G. E., Biswas, R. H., Ivy-Ochs, S., Steinemann, O., and Christl, M.: Postglacial erosion of bedrock surfaces and deglaciation timing: new insights from the Mont Blanc massif (western Alps), Geology, 48, 139–144, https://doi.org/10.1130/G46585.1, 2020.
Linsbauer, A., Huss, M., Hodel, E., Bauder, A., Fischer, M., Weidmann, Y., Bärtschi, H., and Schmassmann, E.: The new Swiss Glacier Inventory SGI2016: from a topographical to a glaciological dataset, Front. Earth Sci., 9, 1–22, https://doi.org/10.3389/feart.2021.704189, 2021.
Mair, D., Lechmann, A., Yeşilyurt, S., Tikhomirov, D., Delunel, R., Vockenhuber, C., Akçar, N., and Schlunegger, F.: Fast long-term denudation rate of steep alpine headwalls inferred from cosmogenic 36Cl depth profiles, Sci. Rep.-UK, 9, 1–15, https://doi.org/10.1038/s41598-019-46969-0, 2019.
Mair, D., Lechmann, A., Delunel, R., Yeşilyurt, S., Tikhomirov, D., Vockenhuber, C., Christl, M., Akçar, N., and Schlunegger, F.: The role of frost cracking in local denudation of steep Alpine rockwalls over millennia (Eiger, Switzerland), Earth Surf. Dynam., 8, 637–659, https://doi.org/10.5194/esurf-8-637-2020, 2020.
Maisch, M., Wipf, A., Denneler, B., Battaglia, J., and Benz, C.: Die Gletscher der Schweizer Alpen: Gletscherhochstand 1850, Aktuelle Vergletscherung, Gletscherschwund-Szenarien, Schlussbericht NFP 31, 2 Auflage, vdf Hochschulverlag an der ETH Zürich, Glacier Inventory 1850 [data set], https://www.glamos.ch/en/downloads#inventories/B45-04 (last access: 19 June 2020), 2000.
Masarik, J., Kollar, D., and Vanya, S.: Numerical simulation of in situ production of cosmogenic nuclides: effects of irradiation geometry, Nucl. Instrum. Meth. B, 172, 786–789, https://doi.org/10.1016/S0168-583X(00)00121-X, 2000.
Millan, R., Mouginot, J., Rabatel, A., and Morlighem, M.: Ice velocity and thickness of the world's glaciers, Nat. Geosci., 15, 124–129, https://doi.org/10.1038/s41561-021-00885-z, 2022.
Müller, F., Caflisch, T., and Müller, G.: Firn und Eis der Schweizer Alpen (Gletscherinventar), Publ. Nr. 57/57a. Geographisches Institut, ETH Zürich, 2 Vol., Glacier Inventory 1973 [data set], https://www.glamos.ch/en/downloads#inventories/B45-04 (last access: 19 June 2020), 1976.
NASA Shuttle Radar Topography Mission SRTM: Shuttle Radar Topography Mission (SRTM) Global, OpenTopography [data set], https://doi.org/10.5069/G9445JDF, 2013.
Naylor, S. and Gabet, E. J.: Valley asymmetry and glacial versus nonglacial erosion in the Bitterroot Range, Montana, USA, Geology, 35, 375–378, https://doi.org/10.1130/G23283A.1, 2007.
Oskin, M. and Burbank, D. W.: Alpine landscape evolution dominated by cirque retreat, Geology, 33, 933–936, https://doi.org/10.1130/G21957.1, 2005.
Østrem, G.: Ice melting under a thin layer of moraine, and the existence of ice cores in moraine ridges, Geogr. Ann., 41, 228–230, https://doi.org/10.1080/20014422.1959.11907953, 1959.
Ouimet, W. B., Whipple, K. X., and Granger, D. E.: Beyond threshold hillslopes: channel adjustment to base-level fall in tectonically active mountain ranges, Geology, 37, 579–582, https://doi.org/10.1130/G30013A.1, 2009.
Rabatel, A., Deline, P., Jaillet, S., and Ravanel, L.: Rock falls in high-alpine rock walls quantified by terrestrial lidar measurements: a case study in the Mont Blanc area, Geophys. Res. Lett., 35, L10502, https://doi.org/10.1029/2008GL033424, 2008.
Ravanel, L., Allignol, F., Deline, P., Gruber, S., and Ravello, M.: Rock falls in the Mont Blanc Massif in 2007 and 2008, Landslides, 7, 493–501, https://doi.org/10.1007/s10346-010-0206-z, 2010.
Roering, J. J., Kirchner, J. W., and Dietrich, W. E.: Evidence for nonlinear, diffusive sediment transport on hillslopes and implications for landscape morphology, Water Resour. Res., 35, 853–870, https://doi.org/10.1029/1998WR900090, 1999.
Roering, J. J., Kirchner, J. W., and Dietrich, W. E.: Hillslope evolution by nonlinear, slope-dependent transport: steady state morphology and equilibrium adjustment timescales, J. Geophys. Res.-Sol. Ea., 106, 16499–16513, https://doi.org/10.1029/2001JB000323, 2001.
Rowan, A. V., Egholm, D. L., Quincey, D. J., and Glasser, N. F.: Modelling the feedbacks between mass balance, ice flow and debris transport to predict the response to climate change of debris-covered glaciers in the Himalaya, Earth Planet. Sc. Lett., 430, 427–438, https://doi.org/10.1016/j.epsl.2015.09.004, 2015.
Sanders, J. W., Cuffey, K. M., Moore, J. R., MacGregor, K.R., and Kavanaugh, J. L.: Periglacial weathering and headwall erosion in cirque glacier bergschrunds, Geology, 40, 779–782, https://doi.org/10.1130/G33330.1, 2012.
Sanders, J. W., Cuffey, K. M., MacGregor, K. R., and Collins, B. D.: The sediment budget of an alpine cirque, Geol. Soc. Am. Bull., 125, 229–248, https://doi.org/10.1130/B30688.1, 2013.
Sarr, A.-C., Mugnier, J.-L., Abrahami, R., Carcaillet, J., and Ravanel, L.: Sidewall erosion: insights from in situ-produced 10Be concentrations measured on supraglacial clasts (Mont Blanc massif, France), Earth Surf. Proc. Land., 44, 1930–1944, https://doi.org/10.1002/esp.4620, 2019.
Sass, O.: Spatial patterns of rockfall intensity in the northern Alps, Z. Geomorphol. Supp., 138, 51–65, 2005.
Sass, O.: Spatial and temporal patterns of talus activity – a lichenometric approach in the Stubaier Alps, Austria, Geogr. Ann. A, 92, 375–391, https://doi.org/10.1111/j.1468-0459.2010.00402.x, 2010.
Scherler, D.: Climatic limits to headwall retreat in the Khumbu Himalaya, eastern Nepal, Geology, 42, 1019–1022, https://doi.org/10.1130/G35975.1, 2014.
Scherler, D. and Egholm, D.L.: Production and transport of supraglacial debris: insights from cosmogenic 10Be and numerical modeling, Chhota Shigri Glacier, Indian Himalaya, J. Geophys. Res. Earth Surf., 125, e2020JF005586, https://doi.org/10.1029/2020JF005586, 2020.
Scherler, D., Bookhagen, B., and Strecker, M. R.: Spatially variable response of Himalayan glaciers to climate change affected by debris cover, Nat. Geosci., 4, 156–159, https://doi.org/10.1038/NGEO1068, 2011.
Schwanghart, W. and Scherler, D.: Short Communication: TopoToolbox 2 – MATLAB-based software for topographic analysis and modeling in Earth surface sciences, Earth Surf. Dynam., 2, 1–7, https://doi.org/10.5194/esurf-2-1-2014, 2014.
Small, R. J. and Clark, M. J.: The medial moraines of the lower Glacier de Tsidjiore Nouve, Valais, Switzerland, J. Glaciol., 13, 255–263, https://doi.org/10.3189/S0022143000023066, 1974.
Small, R. J. and Gomez, B.: The nature and origin of debris layers within Glacier de Tsidjiore Nouve, Valais, Switzerland, Ann. Glaciol., 2, 109–113, https://doi.org/10.3189/172756481794352414, 1981.
Small, R. J., Clark, M. J., and Cawse, T. J. P.: The formation of medial moraines on Alpine glaciers, J. Glaciol., 22, 43–52, https://doi.org/10.3189/S0022143000014040, 1979.
Small, E. E., Anderson, R. S., Repka, J. L., and Finkel, R.: Erosion rates of alpine bedrock summit surfaces deduced from in situ 10Be and 26Al, Earth Planet. Sc. Lett., 150, 413–425, https://doi.org/10.1016/S0012-821X(97)00092-7, 1997.
Stone, J. O.: Air pressure and cosmogenic isotope production, J. Geophys. Res.-Sol. Ea., 105, 23753–23759, https://doi.org/10.1029/2000JB900181, 2000.
Strunden, J., Ehlers, T. A, Brehm, D., and Nettesheim, M.: Spatial and temporal variations in rockfall determined from TLS measurements in a deglaciated valley, Switzerland, J. Geophys. Res.-Earth, 120, 1251–1273, https://doi.org/10.1002/2014JF003274, 2015.
Swisstopo: Federal Office of Topography Swisstopo, https://map.geo.admin.ch, last access: 14 November 2022.
Tuck, R.: Asymmetrical topography in high latitudes resulting from alpine glacial erosion, J. Geol., 43, 530–538, https://doi.org/10.1086/624333, 1935.
Vincent, C., Wagnon, P., Shea, J. M., Immerzeel, W. W., Kraaijenbrink, P., Shrestha, D., Soruco, A., Arnaud, Y., Brun, F., Berthier, E., and Sherpa, S. F.: Reduced melt on debris-covered glaciers: investigations from Changri Nup Glacier, Nepal, The Cryosphere, 10, 1845–1858, https://doi.org/10.5194/tc-10-1845-2016, 2016.
von Blanckenburg, F., Hewawasam, T., and Kubik, P.W.: Cosmogenic nuclide evidence for low weathering and denudation in the wet, tropical highlands of Sri Lanka, J. Geophys. Res.-Earth, 109, F03008, https://doi.org/10.1029/2003JF000049, 2004.
Walder, J. and Hallet, B.: A theoretical model of the fracture of rock during freezing, Geol. Soc. Am. Bull., 96, 336–346, https://doi.org/10.1130/0016-7606(1985)96<336:ATMOTF>2.0.CO;2, 1985.
Ward, D. J. and Anderson, R. S.: The use of ablation-dominated medial moraines as samplers for 10Be-derived erosion rates of glacier valley walls, Kichatna Mountains, AK, Earth Surf. Proc. Land., 36, 495–512, https://doi.org/10.1002/esp.2068, 2011.
Wegmann, M., Gudmundsson, G. H., and Haeberli, W.: Permafrost changes in rock walls and the retreat of alpine glaciers: a thermal modelling approach, Permafrost Periglac., 9, 23–33, https://doi.org/10.1002/(SICI)1099-1530(199801/03)9:1<23::AID-PPP274>3.0.CO;2-Y, 1998.
Wetterauer, K. and Scherler, D.: Medial moraine cosmogenic 10Be data and glacier surface velocities from four Swiss valley glaciers around Pigne d'Arolla, GFZ Data Services [data set], https://doi.org/10.5880/GFZ.3.3.2023.002, 2023.
Wetterauer, K., Scherler, D., Anderson, L. S., and Wittmann, H.: Temporal evolution of headwall erosion rates derived from cosmogenic nuclide concentrations in the medial moraines of Glacier d'Otemma, Switzerland, Earth Surf. Proc. Land., 47, 2437–2454, https://doi.org/10.1002/esp.5386, 2022a.
Wetterauer, K., Scherler, D., Anderson, L. S., and Wittmann, H.: Sample and modelling data for cosmogenic 10Be in medial moraine debris of Glacier d'Otemma, Switzerland, GFZ Data Services [data set], https://doi.org/10.5880/GFZ.3.3.2021.007, 2022b.
Wittmann, H., von Blanckenburg, F., Kruesmann, T., Norton, K. P., and Kubik, P. W.: Relation between rock uplift and denudation from cosmogenic nuclides in river sediment in the Central Alps of Switzerland, J. Geophys. Res.-Earth, 112, F04010, https://doi.org/10.1029/2006JF000729, 2007.
Žebre, M., Colucci, R. R., Giorgi, F., Glasser, N. F., Racoviteanu, A. E., and Del Gobbo, C.: 200 years of equilibrium-line altitude variability across the European Alps (1901–2100), Clim. Dynam., 56, 1183–1201, https://doi.org/10.1007/s00382-020-05525-7, 2021.