the Creative Commons Attribution 4.0 License.
the Creative Commons Attribution 4.0 License.
 | 01 Nov 2023
Marsh-induced backwater: the influence of non-fluvial sedimentation on a delta's channel morphology and kinematics
John B. Shaw
Samuel M. Zapp
José Silvestre
Ripul Dutt
Kyle M. Straub
We investigate the interaction of fluvial and non-fluvial sedimentation on the channel morphology and kinematics of an experimental river delta. We compare two deltas: one that evolved with a proxy for non-fluvial (“marsh”) sedimentation (treatment experiment) and one that evolved without the proxy (control). We show that the addition of the non-fluvial sediment proxy alters the delta's channel morphology and kinematics. Notably, the flow outside the channels is significantly reduced in the treatment experiment, and the channels are deeper (as a function of radial distance from the source) and longer. We also find that both the control and treatment channels narrow as they approach the shoreline, though the narrowing is more pronounced in the control compared to the treatment. Interestingly, the channel beds in the treatment experiment often exist below sea level in the terrestrial portion of the delta top, creating a ∼ 0.7 m reach of steady, non-uniform backwater flow. However, in the control experiment, the channel beds generally exist at or above relative sea level, creating channel movement resembling morphodynamic backwater kinematics and topographic flow expansions. Differences between channel and far-field aggradation produce a longer channel in-filling timescale for the treatment compared to the control, suggesting that the channel avulsions triggered by a peak in channel sedimentation occur less frequently in the treatment experiment. Despite this difference, the basin-wide timescale of lateral channel mobility remains similar. Ultimately, non-fluvial sedimentation on the delta top plays a key role in the channel morphology and kinematics of an experimental river delta, producing channels which are more analogous to channels in global river deltas and which cannot be produced solely by increasing cohesion in an experimental river delta.
- Article
(15943 KB) - Full-text XML
- BibTeX
- EndNote


River deltas are dynamic systems that accumulate sediment through the interaction of many processes occurring in the distributary channels, floodplain, and basin. The formation and movement of channels (channel kinematics) distribute fluvial sediment across the delta plain, leading to both active depocenters and quiescent regions that change location through time (i.e., river avulsions; e.g., Coleman, 1988; Straub et al., 2009; Hoyal and Sheets, 2009; Chadwick et al., 2020). The active depocenters are dominated by fluvial sedimentation, which includes sediment deposition in mouth bars, channels, and the delta front, as well as finer-grained overbank deposition adjacent to the river occurring during floods (e.g., Coleman, 1988; Paola et al., 2011; Khan et al., 2013). The passive areas aggrade through fine-grained mineral sediment delivered from the ocean through waves, tides, and storms (e.g., Smith et al., 2015; Sanks et al., 2020), primary production of organic material via wetland vegetation (e.g., Nyman et al., 2006; Holmquist et al., 2018, 2021; Kelsall et al., 2023), and/or the redistribution of sediment from marsh edge erosion (e.g., Hopkinson et al., 2018; Valentine et al., 2023), the combination of which we refer to as non-fluvial (“marsh”) sedimentation.
Understanding and managing sediment accretion in rivers, floodplains, and adjacent wetlands remains a key strategy to mitigate the impacts of relative sea level rise (RSLR) worldwide. For example, Louisiana has planned and implemented both engineered sediment diversions (e.g., the recently approved mid-Barataria sediment diversion) and artificial marsh creation projects (e.g., CPRA, 2017; Nittrouer et al., 2012; White et al., 2019) to reconnect the river to its wetlands and restore the coastal land area (e.g., Elsey-Quirk et al., 2019; Peyronnin et al., 2017; Xu et al., 2019). Another strategy is engineered river avulsions, in which the avulsion location can be optimized if the location of the maximum channel sedimentation is known (Moodie and Nittrouer, 2021). On the short-term, the success of these mitigation strategies depends on the interaction of channel and wetland aggradation (e.g., Kirwan and Megonigal, 2013; Paola et al., 2011), which can be maximized under certain conditions (Esposito et al., 2017). This is because, in order for these ecosystems to succeed on short (management) timescales, they need to accumulate both organic sediment produced in situ and mineral sediment from channels or offshore processes (e.g., Sanks et al., 2020; Elsey-Quirk et al., 2019; Kelsall et al., 2023). However, the implications of wetland–channel coupling over timescales longer than avulsions (10–103 years, depending on the river delta) remain unclear. As such, understanding the equilibrium morphology of a coupled wetland–delta system can enhance short- and long-term management decisions.
The deposition of fluvial sediment is controlled by the proximity to channels in a river delta, and the life of a delta depends on the intrinsic ability for a river to avulse (Slingerland and Smith, 2004). Fluvial sedimentation typically occurs via topographic flow expansions in physical delta experiments (e.g., Hoyal and Sheets, 2009; Chatanantavet and Lamb, 2014; Sittoni et al., 2014; Shaw et al., 2018). As the river enters the basin, the channels lose confinement, which triggers rapid deposition at the mouth bar (e.g., Edmonds and Slingerland, 2007; Sittoni et al., 2014; Törnqvist and Bridge, 2002). The rapid deposition leads to an upstream migration of the depocenter, which is referred to as the “morphodynamic backwater effect” (Hoyal and Sheets, 2009; i.e., “backfilling” in the alluvial fan literature; Bull, 1968). Eventually, this process leads to a channel avulsion, which is thought to occur at some distance upstream of the shoreline and is related to channel superelevation (e.g., Edmonds et al., 2009; Shaw et al., 2021; Mohrig et al., 2000; Hajek and Wolinsky, 2012; Ganti et al., 2016b; Jobe et al., 2020). The location of avulsions appears to occur preferentially at the backwater length scale (Jerolmack and Swenson, 2007), which is defined as the channel depth divided by the energy slope for low Froude number systems (e.g., Shaw and McElroy, 2016). This length scale serves as an estimate of the distance between a channel mouth and the location where the channel bed of a river drops below sea level (Paola and Mohrig, 1996). Morphodynamic models of the channel deposition suggest that avulsion locations depend on variable discharge of a river to move the location of maximum aggradation upstream through scour during floods (e.g., Nittrouer et al., 2011, 2012; Chatanantavet et al., 2012; Ganti et al., 2016b; Chadwick et al., 2019). It is argued that when fluctuating flows are not present, the location of the maximum deposition is inevitably at the channel mouth, producing topographic flow expansions (or morphodynamic backwater effects) that typically dominate the channel kinematics of physical delta experiments.
Avulsion locations scale with hydrodynamic backwater length, but there appear to be multiple possible causes for this scaling. The backwater length, or the length of the river that is influenced by offshore processes, is thought to be controlled by complex hydrodynamics of rivers (e.g., Lamb et al., 2012; Chatanantavet et al., 2012; Nittrouer et al., 2011). More recently, Ratliff et al. (2021) and Prasojo et al. (2022) have shown that avulsion locations on a river delta can be explained without backwater hydrodynamics and are a function of a break in slope in the channel (i.e., morphology of the channel). In other words, even though the avulsion location scales with the hydrodynamic backwater length, Ratliff et al. (2021) suggest that avulsion locations and subsequent channel movement can be explained simply through a change in geometry without the need for complex backwater hydrodynamics. Similar to Ratliff et al. (2021), Moodie et al. (2019) showed that a decrease in channel slope (i.e., a change in channel geometry) triggers lobe progradation, subsequently moving the location of maximum channel aggradation (and the avulsion location) further upstream. Relatedly, Sanks et al. (2022) showed that non-fluvial aggradation near the coastline can significantly rearrange the depositional patterns on experimental deltas, thus influencing delta hypsometry and floodplain geometry. As such, non-fluvial deposition may control channel kinematics as well.
Despite these different mechanisms for avulsions, the impact of non-fluvial sedimentation on the channel kinematics of deltaic systems remains largely unknown (Paola et al., 2011). While channel morphology and kinematics of river deltas in experimental (e.g., Hoyal and Sheets, 2009; Li et al., 2017; Straub et al., 2013; Barefoot et al., 2021; Carlson et al., 2018), numerical (e.g., Edmonds et al., 2009; Caldwell and Edmonds, 2014; Lauzon and Murray, 2018), and field settings (e.g., Shaw et al., 2016; Wilson and Goodbred, 2015; Aslan et al., 2005; Carlson et al., 2021) are well documented, wetland dynamics are rarely seen as being coupled to, or a driver for, channel dynamics. In numerical and experimental settings, added sediment cohesion is often used to represent the influence of vegetation on the delta top for its ability to increase critical shear stresses and reduce erosion (e.g., Hoyal and Sheets, 2009; Edmonds and Slingerland, 2010; Li et al., 2017). Another numerical study shows that there is an optimal vegetation height for inorganic sediment trapping on deltaic marsh platforms (Nardin and Edmonds, 2014). Similarly, Piliouras et al. (2017) used alfalfa to simulate vegetation in an experimental delta, which showed enhanced sediment trapping and increased delta-top roughness. Because the alfalfa increased the delta-top slope, they found that the results of the experiments were only applicable to fan deltas and not the low-sloping coastal deltas of interest here. While valuable, these previous studies leave out a critical property of wetlands, which is the ability to accumulate non-fluvially delivered sediment in situ via the primary production of vegetation (i.e., accumulation of above- and belowground biomass; e.g., Kosters et al., 1987; Morris et al., 2002; Mudd et al., 2009) and the accumulation of fine-grained mineral sediment (muds), presumably delivered from the ocean (e.g., Leonardi et al., 2021; Sanks et al., 2020). In contrast to this body of work, Sanks et al. (2022) and Zapp et al. (2022) show that non-fluvial sedimentation can act independently of cohesion by changing the distribution of elevations, delta-top slope, sediment partitioning, and shallow compaction rates.
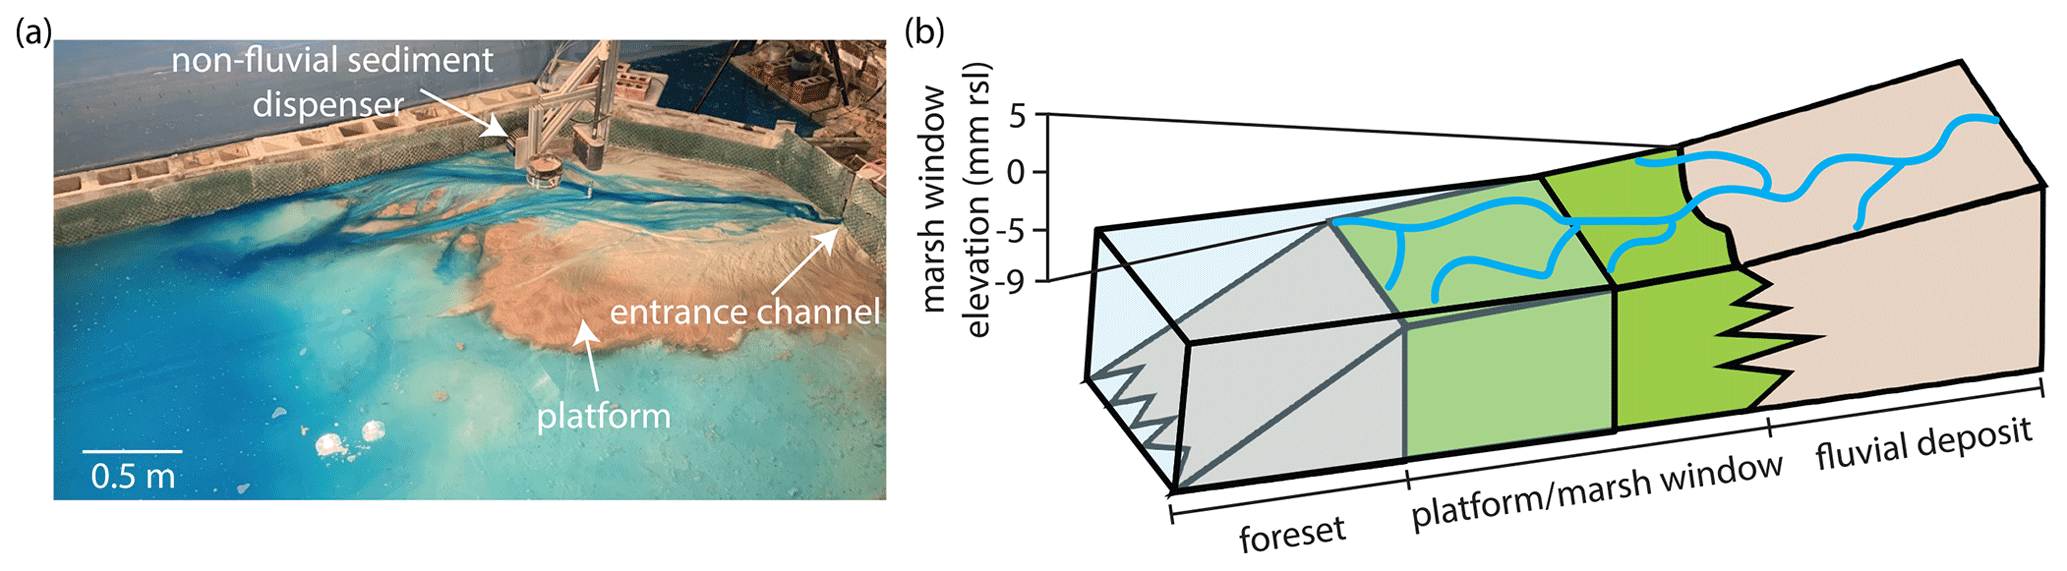
Figure 1(a) Aerial image from the treatment experiment adapted from Sanks et al. (2022) showing the entrance channel, which delivers water and fluvial sediment to the delta top, and the marsh sediment dispenser, which delivers non-fluvial sediment to the delta top. The brown sediment is the kaolinite marsh proxy, which forms a platform near sea level. (b) Conceptual diagram of a delta–wetland system adapted from NASA (2014). In field systems, the platform aggrades through a combination of fluvially delivered fine-grained sediment, muds and organics delivered from offshore, and organic sediment produced in situ by vegetation. In the treatment experiment, the platform encompasses the area of the delta between 5 and −9 mm relative to sea level and aggrades through our simplified elevation-based model. The fluvial deposit exists above 5 mm relative to sea level in the treatment experiment and aggrades solely through the deposition of fluvially delivered sediment.
To test the control of non-fluvial sedimentation on channel kinematics, we separate the broad variation in delta-top facies into “non-fluvial” (e.g., wetlands, interdistributary bays, and tidal flats) and “fluvial” (e.g., upper delta plain, levees, mouth bars, and prodelta) components (Bhattacharya, 2006). We define non-fluvial sedimentation as the spatially extensive, persistent, fine-grained, and compactible deposition that occurs in the quiescent, protected regions of deltas most commonly associated with wetland platforms (Fig. 1). In contrast, the fluvial sediment that is the default on experimental deltas is coarser grained, less compactible, and not persistent. If a small amount of non-fluvial sedimentation can significantly rearrange the delta mass balance (Sanks et al., 2022), then it is possible for it to affect channel dynamics as well. We investigate this hypothesis here.
2.1 Experimental setup and data
Despite the differences in the scale of field and experimental systems, physical experiments approximate conditions and processes that occur in global systems (Paola et al., 2009). Thus, physical delta experiments are an ideal way to study the influence of non-fluvial sedimentation on channel morphology and kinematics. We compare two experiments run under the same boundary conditions (Table 1), except that one experiment has a proxy for non-fluvial (marsh) sedimentation (treatment) and one does not (control). The addition of the kaolinite marsh proxy accounts for ∼ 15 % of the final delta volume and ∼ 8 % of the mass in the treatment experiment (Sanks et al., 2022). Thus, we assume that any statistically significant changes in channel kinematics can be attributed directly to this non-fluvial sedimentation. Both experiments were run for 560 h or ∼ 20 times the compensation timescale to capture autogenics (i.e., self-generated dynamics like channel avulsions) and account for the inherent stochasticity of the systems (Wang et al., 2011). Ultimately, the systems accumulate about 20 channel depths of stratigraphy, as the channels are ∼ 7 mm deep, and the deltas evolve with a background relative sea level rise rate (RSLRb) of 140 mm over 560 h. Because the experiments are run in an equilibrium state, we do not focus on temporal dynamics herein, though this is an interesting area for future research.
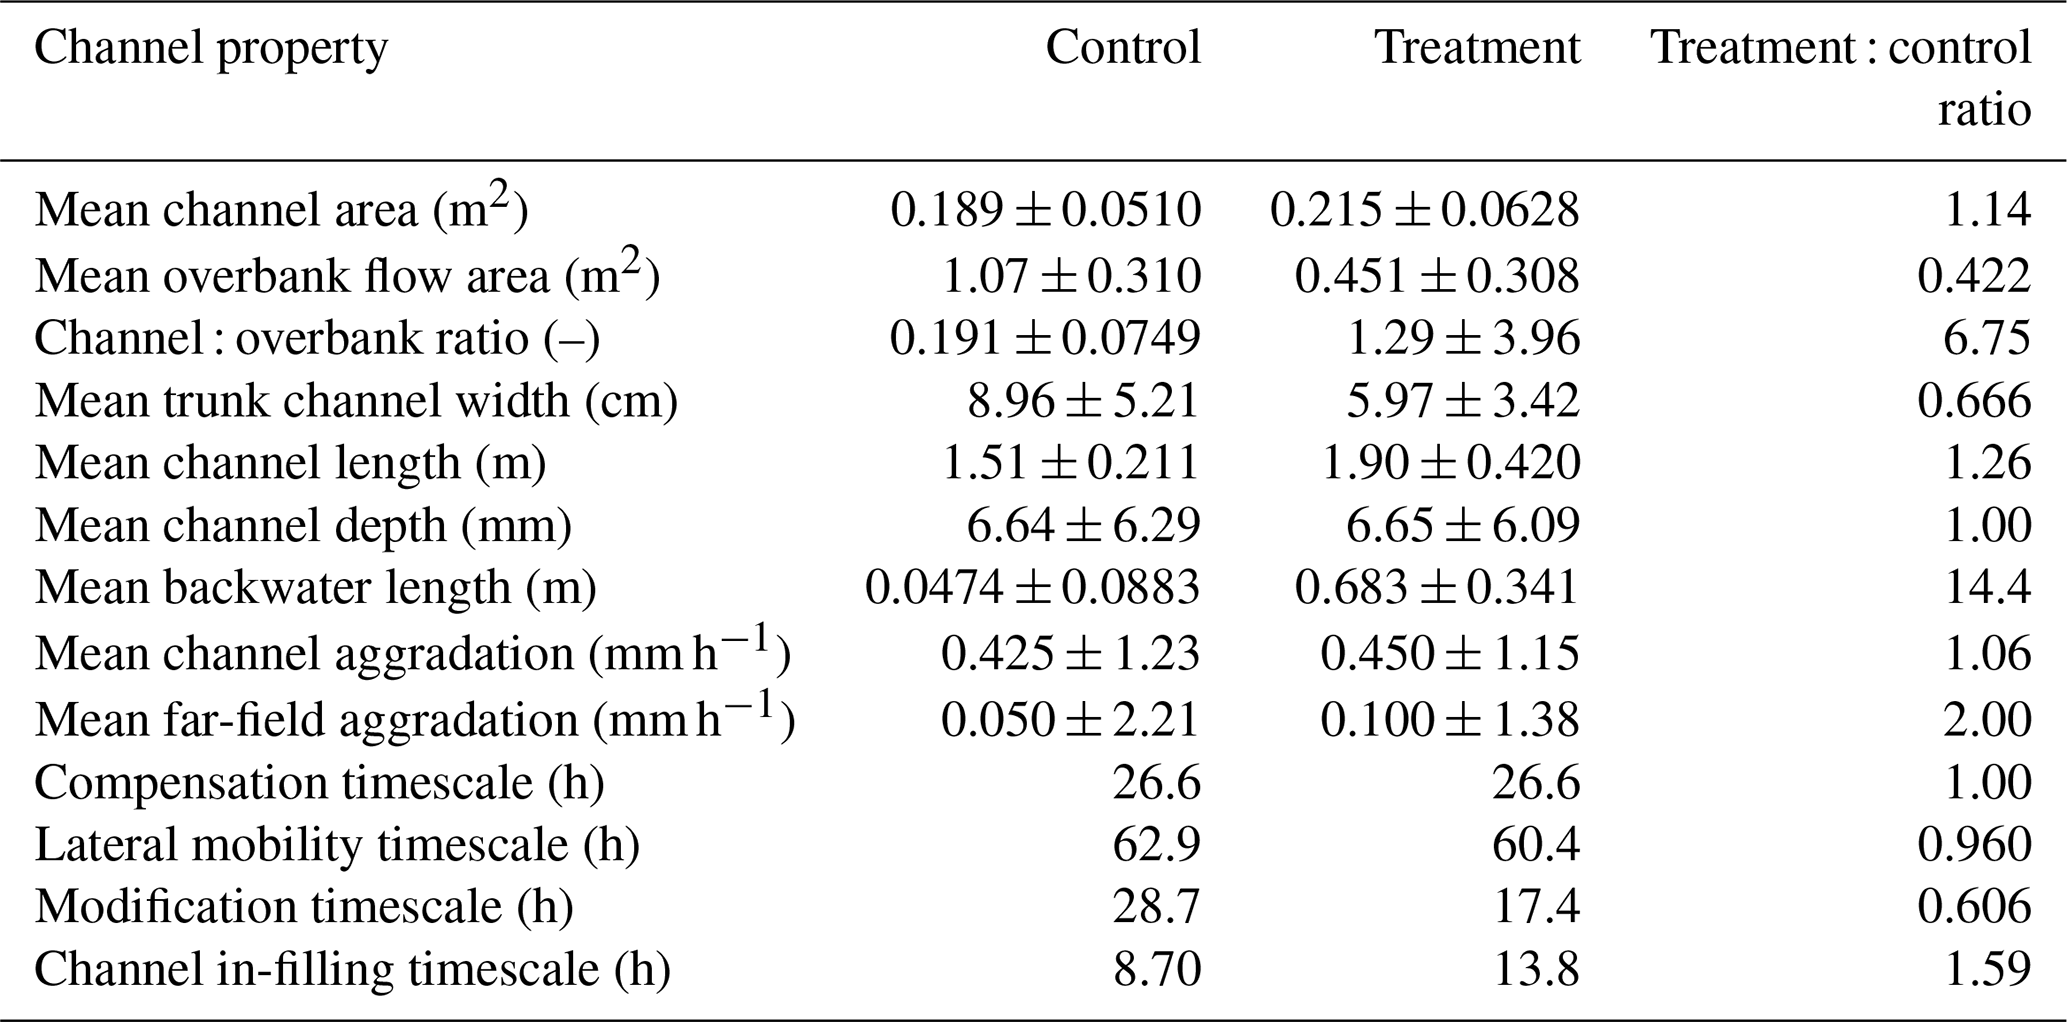
Table 1The experimental conditions for both the control (no marsh) and treatment (marsh) experiments used for comparison in this study taken from Sanks et al. (2022).
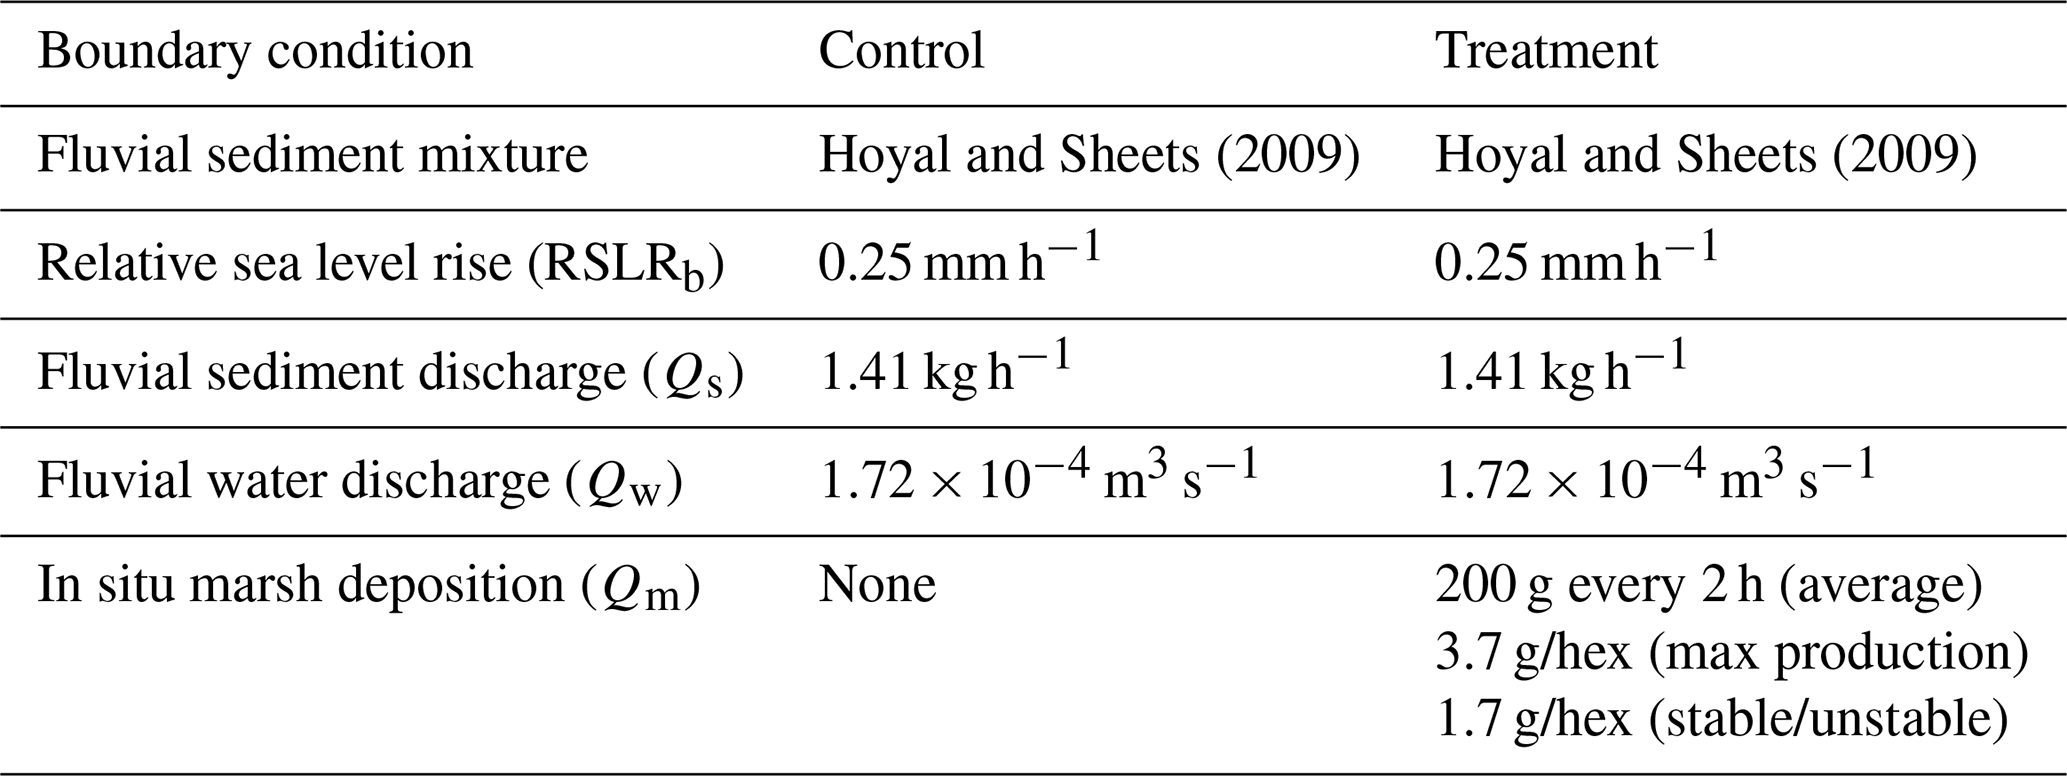
Elevation relative to sea level (r.s.l.) is a primary control on the deposition of mud in tidal flats and wetland platforms (e.g., Fagherazzi et al., 2006) and organic sediment production in wetlands (e.g., Morris et al., 2002). Thus, an elevation-based model is representative of all non-fluvial sedimentation that occurs in deltaic coastal environments. Note that we neglect the drag of vegetation in this study, as we are interested solely in the impact of additional mass that accumulates in global deltas on the long-term dynamics of the system. Although wetland sedimentation can be a complex process, we adapt a model tying primary production in salt marshes to elevation relative to mean high tide from Morris et al. (2002) and simplify this model to produce three distinct regions of non-fluvial deposition, namely unstable (−9 to −5 mm r.s.l.), maximum production (−5 to 0 mm r.s.l.), and stable (0 to 5 mm r.s.l.; Fig. 1b). Because the experiments evolve with the absence of tidal processes, we scaled the marsh window to the relative sea level instead of mean high tide. The marsh window spans 14 mm in elevation, which is equivalent to about one experimental channel depth. The marsh window elevation band encompassed 30 % of the planform area in the control experiment. The non-fluvial sediment is Edgar Plastic Kaolin (a type of kaolinite clay with a mean grain size of 1.36 µm) that we deposit from above using a sieve (see the Methods section in Sanks et al., 2022; Fig. 1a). The river sediment mixture has a range of grain sizes from 1 to 1000 µm, with a mean of 67 µm, and contains a polymer for added cohesion (Straub et al., 2015). Deposition rates are determined using a hexagonal grid (7.5 cm sides) to find the average elevation inside each hexagon. If the average elevation falls within one of the three regions, we deposit either 3.4 g (maximum production; accumulates 1RSLRb) or 1.7 g (stable and unstable; accumulates 0.5RSLRb) of kaolinite every 2 h in that hexagon. The deposition rate was calibrated based on the assumption that kaolinite deposited in water has a porosity of 90 %. Non-fluvial deposition occurred while the experiments were running, so that any kaolinite deposited in the channels would be immediately washed out and transported offshore.
To analyze the channel properties and kinematics from both experiments, we use dry and wet lidar scans, binary channel maps, and binary flow maps (Appendix A). We collect dry lidar scans every hour for the control and every 2 h for the treatment while the experiments are paused. Because non-fluvial deposition occurs every 2 h in the treatment experiment, this controls the frequency of dry lidar scans. As explained later, all sedimentation rate analyses are conducted on a 2 h timescale for both experiments to avoid the Saddler effect. The dry lidar scans have 5×5 mm horizontal resolution and a sub-millimeter vertical resolution and are used solely for elevation-based analyses. We collect wet lidar scans every hour for both experiments while they are running. The wet lidar scans are used for flow mapping and also have 5×5 mm horizontal resolution. We create binary channel maps by hand mapping the channels using hourly aerial imagery (generated from the wet scans; Fig. A1) because simple color thresholds are unable to differentiate between channelized and non-channelized flow. However, a simple color threshold can capture total flow on the delta top (Fig. 3c, d), so we use this method to create total flow maps. As such, overbank flow maps can be produced by differencing the total and channel flow maps. While overbank maps are sensitive to thresholding, the final results are insensitive to threshold choice. We note that due to artifacts from the moving cart during marsh deposition, channels were obstructed in some aerial images (n=73) in the treatment experiment.
2.2 Channel properties
We analyze the treatment and control experiments for differences in channel properties (Table 2), including but not limited to channel depth (Hc), trunk channel depth (Htc), channel planform area (Ac), channel length (Lc), and trunk channel width (Wtc). Channel properties are calculated for each channel segment within a radial transect. Channel depths are calculated every 5 mm (width of 1 lidar pixel) from 0 mm (the apex) to 3100 mm (max channel length) from the apex, while all other channel properties are calculated every 50 mm from 0 mm (the apex) to 3100 mm from the apex because those mean properties are not sensitive to bin width. All trunk channel depths are calculated by taking the deepest channel in each transect, and all trunk channel widths are calculated by taking the widest channel in each transect. In any context that we do not specify that we are analyzing only the trunk channel, we are analyzing all channels on the delta top (trunk and non-trunk channels).
To calculate channel depths, we use a square channel buffer of 20 mm (4 pixels) on all sides of the channel maps to ensure that the levee crests are captured in the measurement. Hc (mm) is then given by
where max(zc) is the maximum channel elevation for each channel within the radial transect (i.e., levee crest; Fig. 2c, d), and min(zc) is the minimum channel elevation for each corresponding channel in the radial transect (i.e., channel thalweg; Fig. 2c, d). We use the levee crest (maximum channel elevation) to compute the channel depth because the flow is almost always at the levee crest. Because each transect often has multiple channel segments and thus multiple channel depths, we compute a trunk channel depth (Htc; mm) for each radial segment through time by
Now, every 5 mm from the apex, we have one channel depth (i.e., the trunk channel depth) for each time step. We use these data to compute the mean channel depth (through time) for Htc as a function of distance from the apex. We also determine the basin-wide , which is simply the mean of all (trunk and non-trunk) channel depths through space and time.
The basin-wide channel area (Acb; cm2) is the time-averaged channel area (Ac). Ac is simply the sum of all channel pixels on the delta top multiplied by 0.25 cm2 (the area of 1 pixel). Mean radial channel fraction is then given by
where Acr is the time-averaged channel area of the radial transect, and Ar is the area of the radial transect.
The channel length (Lc) is assumed to be the straight-line distance from the entrance channel to the most distal channel pixel at each time step. We note that this is an underestimate for the length of any sinuous channels in the experiments, but a visual inspection shows nearly straight channels, with no systematic variation between experiments. Wtc is the trunk channel width (cm) and is given by
where Acr is the area of each channel in the 5 cm radial bin of interest (cm2), and Lr is 5 cm, which is the length of each radial transect. We note that this is likely an overestimate for the last radial transect (i.e., the channel tip) because the channelized portion in the last radial transect likely does not encompass the entire length of the radial transect.
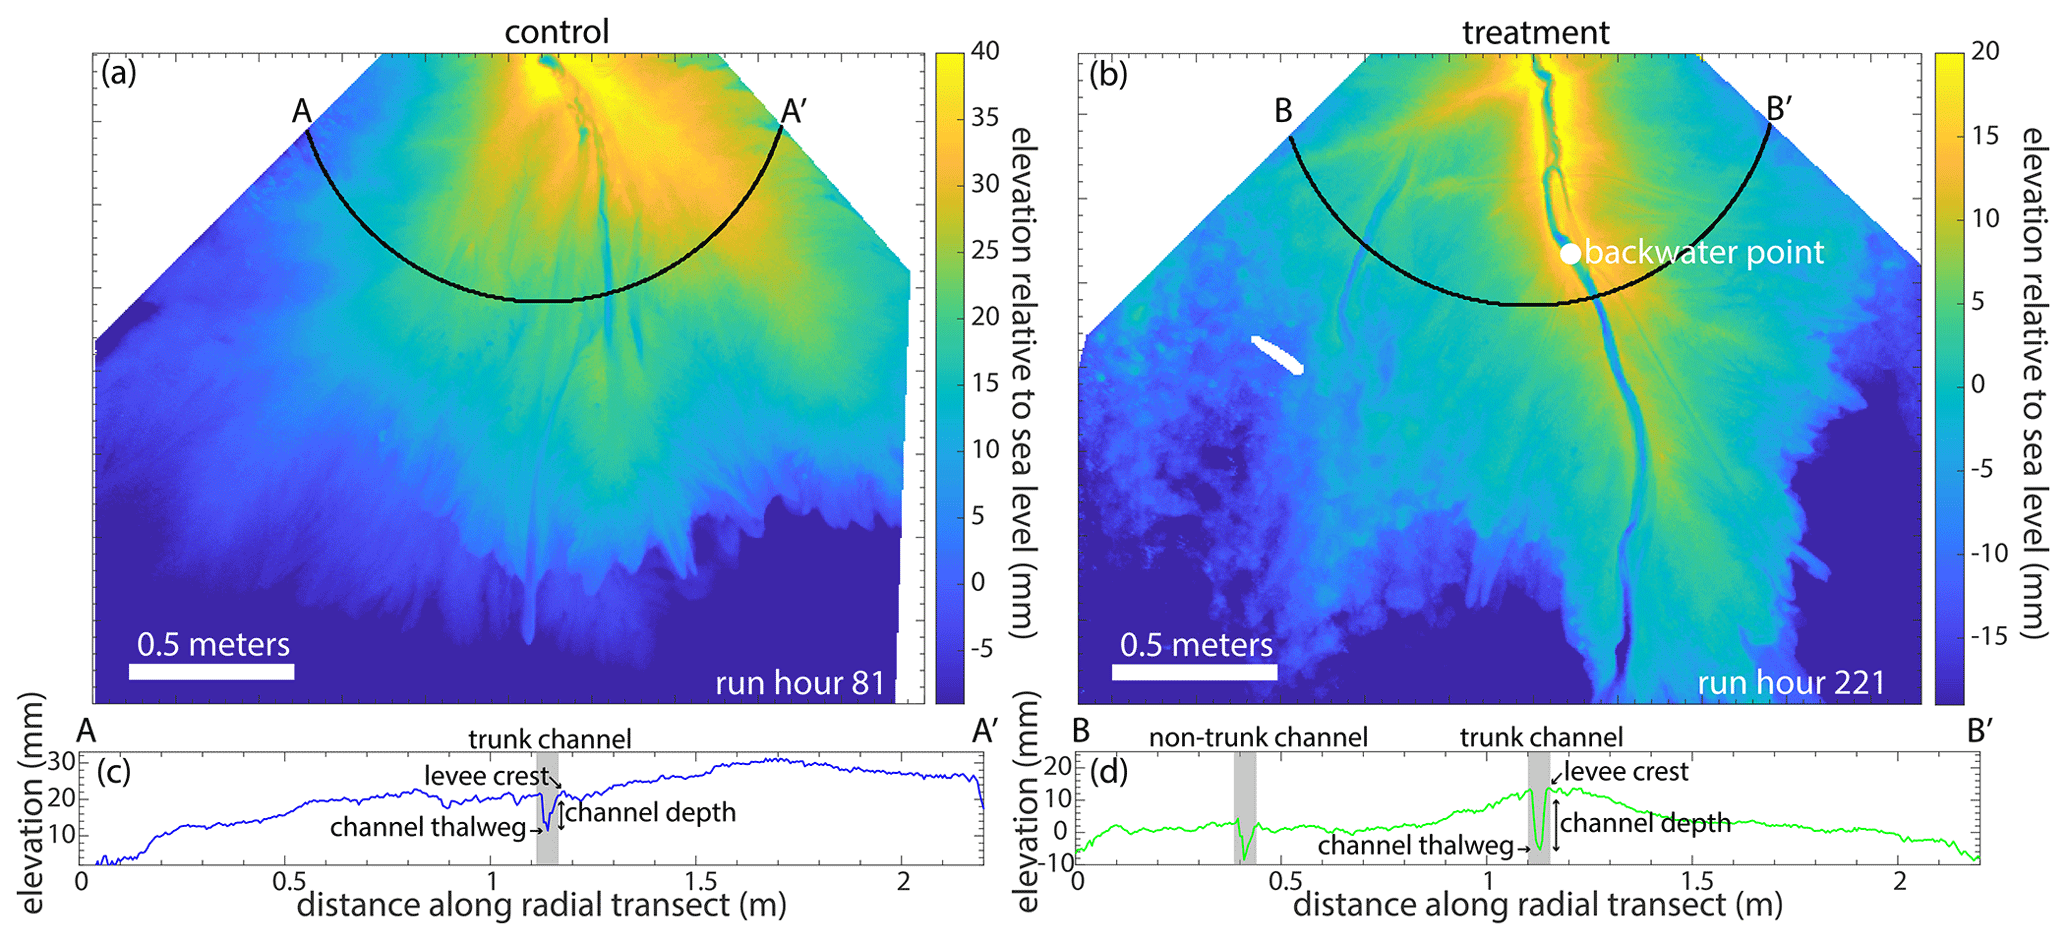
Figure 2(a) Lidar map of the control delta at run hour 81, showing elevations relative to sea level. The black line represents the transect A-A′, which is 1 m from the apex. See Fig. 8a for an aerial image. (b) Lidar map of the treatment delta at run hour 221, showing elevations relative to sea level. The black line represents the transect B-B′, which is 1 m from the apex. See Fig. 8b for an aerial image. (c) Elevation relative to sea level versus the distance along the radial transect A-A′. (d) Elevation relative to sea level versus the distance along the radial transect B-B′.
We are also interested in the hydrodynamic backwater effects present in both experiments. We define the hydrodynamic backwater length as the longest continuous length of the channel reach, where the channel bed is at or below sea level (Chatanantavet et al., 2012). To calculate the length of the backwater reach, we use dry lidar scans and channel maps at 1 h (control) and 2 h (treatment) intervals (n=560 for the control and n=265 for the treatment, due to artifacts rendering 15 time steps unusable). We determine the location of the beginning of the longest continuous backwater reach for each time step, and this location is referred to as the backwater point (Fig. 2b). If the channel tip is above sea level or there is no radial channel transect with at least 16 % of channel bed elevations at or below sea level, then there is effectively no backwater reach, and we assume that the backwater length is zero. Although the absolute backwater length is somewhat sensitive to this threshold choice, the presence of a significant backwater length in the treatment experiment as compared to the control is not.
2.3 Channel kinematics
Various metrics were used to compare channel kinematics between the experiments. The delta-top area used to quantify lateral channel movement is defined as the area above sea level for at least 50 % of the experiment (pland; Fig. B1), consistent with Li et al. (2017). We compute the fraction of the delta (delta area is pland; m2) that has not been visited by a channel through time, which can be used to estimate the lateral channel mobility of the system (Li et al., 2017). This metric (fmob; unitless) is defined as
where i is the initial hour, and n is every time step from 1 to 560 (e.g., if using a time step n>i, then the numerator is the cumulative channel area from hours i through n; Ac; m2). The unvisited area of the experiments decays exponentially through time. To describe this, we compute the e-folding lateral mobility timescale (Tmob; h). Tmob is the inverse of the exponent from the function that describes the lateral channel mobility decay of the system (Li et al., 2017). Radial lateral mobility is also calculated every 50 mm from 0 mm (the apex) to 3100 mm from the apex. In this case, Ac is the channelized area in the radial transect, and pland is the area of the radial transect. Similarly, we calculate the planform overlap decorrelation metric described in Wickert et al. (2013) as an independent check on the lateral mobility of the system. This metric describes the time it takes for subsequent channel maps to decorrelate. The planform overlap is described in Appendix B (see also Fig. B5). Both the lateral channel mobility and planform overlap indirectly describe the avulsion timescale, as they determine how quickly channels move across the delta top. While channels move in other ways besides avulsions, the largest changes occur due to channel avulsions, and thus, the time it takes for channels to visit most of the delta top (lateral mobility) and how long it takes channel maps to decorrelate from each other (planform overlap) are channel movement statistics.
We then calculate channel mobility metrics related to sedimentation patterns on the delta, as channel sedimentation can trigger an avulsion (e.g., Jobe et al., 2020; Ganti et al., 2016b; Moodie and Nittrouer, 2021). The first is the fraction of the delta that is unmodified (fum; unitless), which is defined as the fraction of the delta that has accumulated at least 1 mm of sediment in the terrestrial delta (pland) for various periods of time. Similar methods to the lateral mobility are used to determine fum (Li et al., 2017). The modification timescale (hours) is the inverse of the exponent from the function that describes how long it takes to accumulate 1 mm of sediment in the terrestrial delta.
Next, we calculate the compensation timescale (Tc; h). Compensation is a metric used to describe surface processes in channelized systems and compares long-term sedimentation patterns to general accommodation of the system. In general, compensation describes a channel's inherent tendency to fill low-lying areas on the delta (Straub et al., 2009). Tc refers to how long it takes to accumulate roughly one channel depth of sediment everywhere on the delta top. Again, to capture levee crests in the channel depths, we use a square channel buffer of 20 mm (4 pixels) on all sides of the channel maps. The basin-wide Tc is given by
where Hc is the basin-wide mean channel depth (mm), and Vt is 0.25 mm h−1, which is the mean aggradation rate for both experiments. Tc is also calculated radially from the apex using 5 mm bins, where Hc is the mean trunk channel depth (mm) of the radial bin, and Vt is the mean total aggradation rate (mm h−1) of the radial bin. To directly compare aggradation rates between the experiments at the same timescale (Sadler, 1981), we use 2 h lidar difference maps for both experiments.
Last, we determine the channel in-filling timescale (Tf; h). Avulsion locations can be related to peaks in channel aggradation (e.g., Chatanantavet et al., 2012; Chadwick et al., 2019; Moodie and Nittrouer, 2021), so we calculate channel and far-field aggradation rates (mm h−1), allowing us to compare channelized (channel) and non-channelized (far-field) sediment depositional patterns. We again use the buffered channel maps and compute aggradation rates every 2 h. The channel in-filling timescale (Tf; h) is given by
where Hc is the basin-wide mean channel depth (mm), Vc is the basin-wide channel aggradation rate (mm h−1), and Vff is the basin-wide far-field aggradation rate (mm h−1). We also compute a channel in-filling timescale radially from the apex every 5 mm. In this case, Hc is the time-averaged trunk channel depth for each radial transect, Vc is the time-averaged channel aggradation rate (mm h−1) for each radial transect, and Vff is the time-averaged far-field aggradation rate (mm h−1) for each radial transect.
3.1 Channel properties
Does the presence of non-fluvial sedimentation influence channel morphology in experimental deltas? A simple comparison reveals considerable differences. Importantly, there is a reduction in the mean fraction of the delta top covered in overbank flow by about one-third in the treatment experiment (0.183 ± 0.122; all error bounds represent 1 standard deviation from the mean, unless otherwise noted) compared to the control (0.489 ± 0.119). Though this decrease in overbank flow does not lead to an increase in planform channel area, it does suggest that the flow is concentrated in channels in the treatment experiment. A loss of the downstream channel confinement is observed, which is associated with an increase in overbank flow in both the control and treatment experiments near the mean shoreline (Fig. 3a and b).
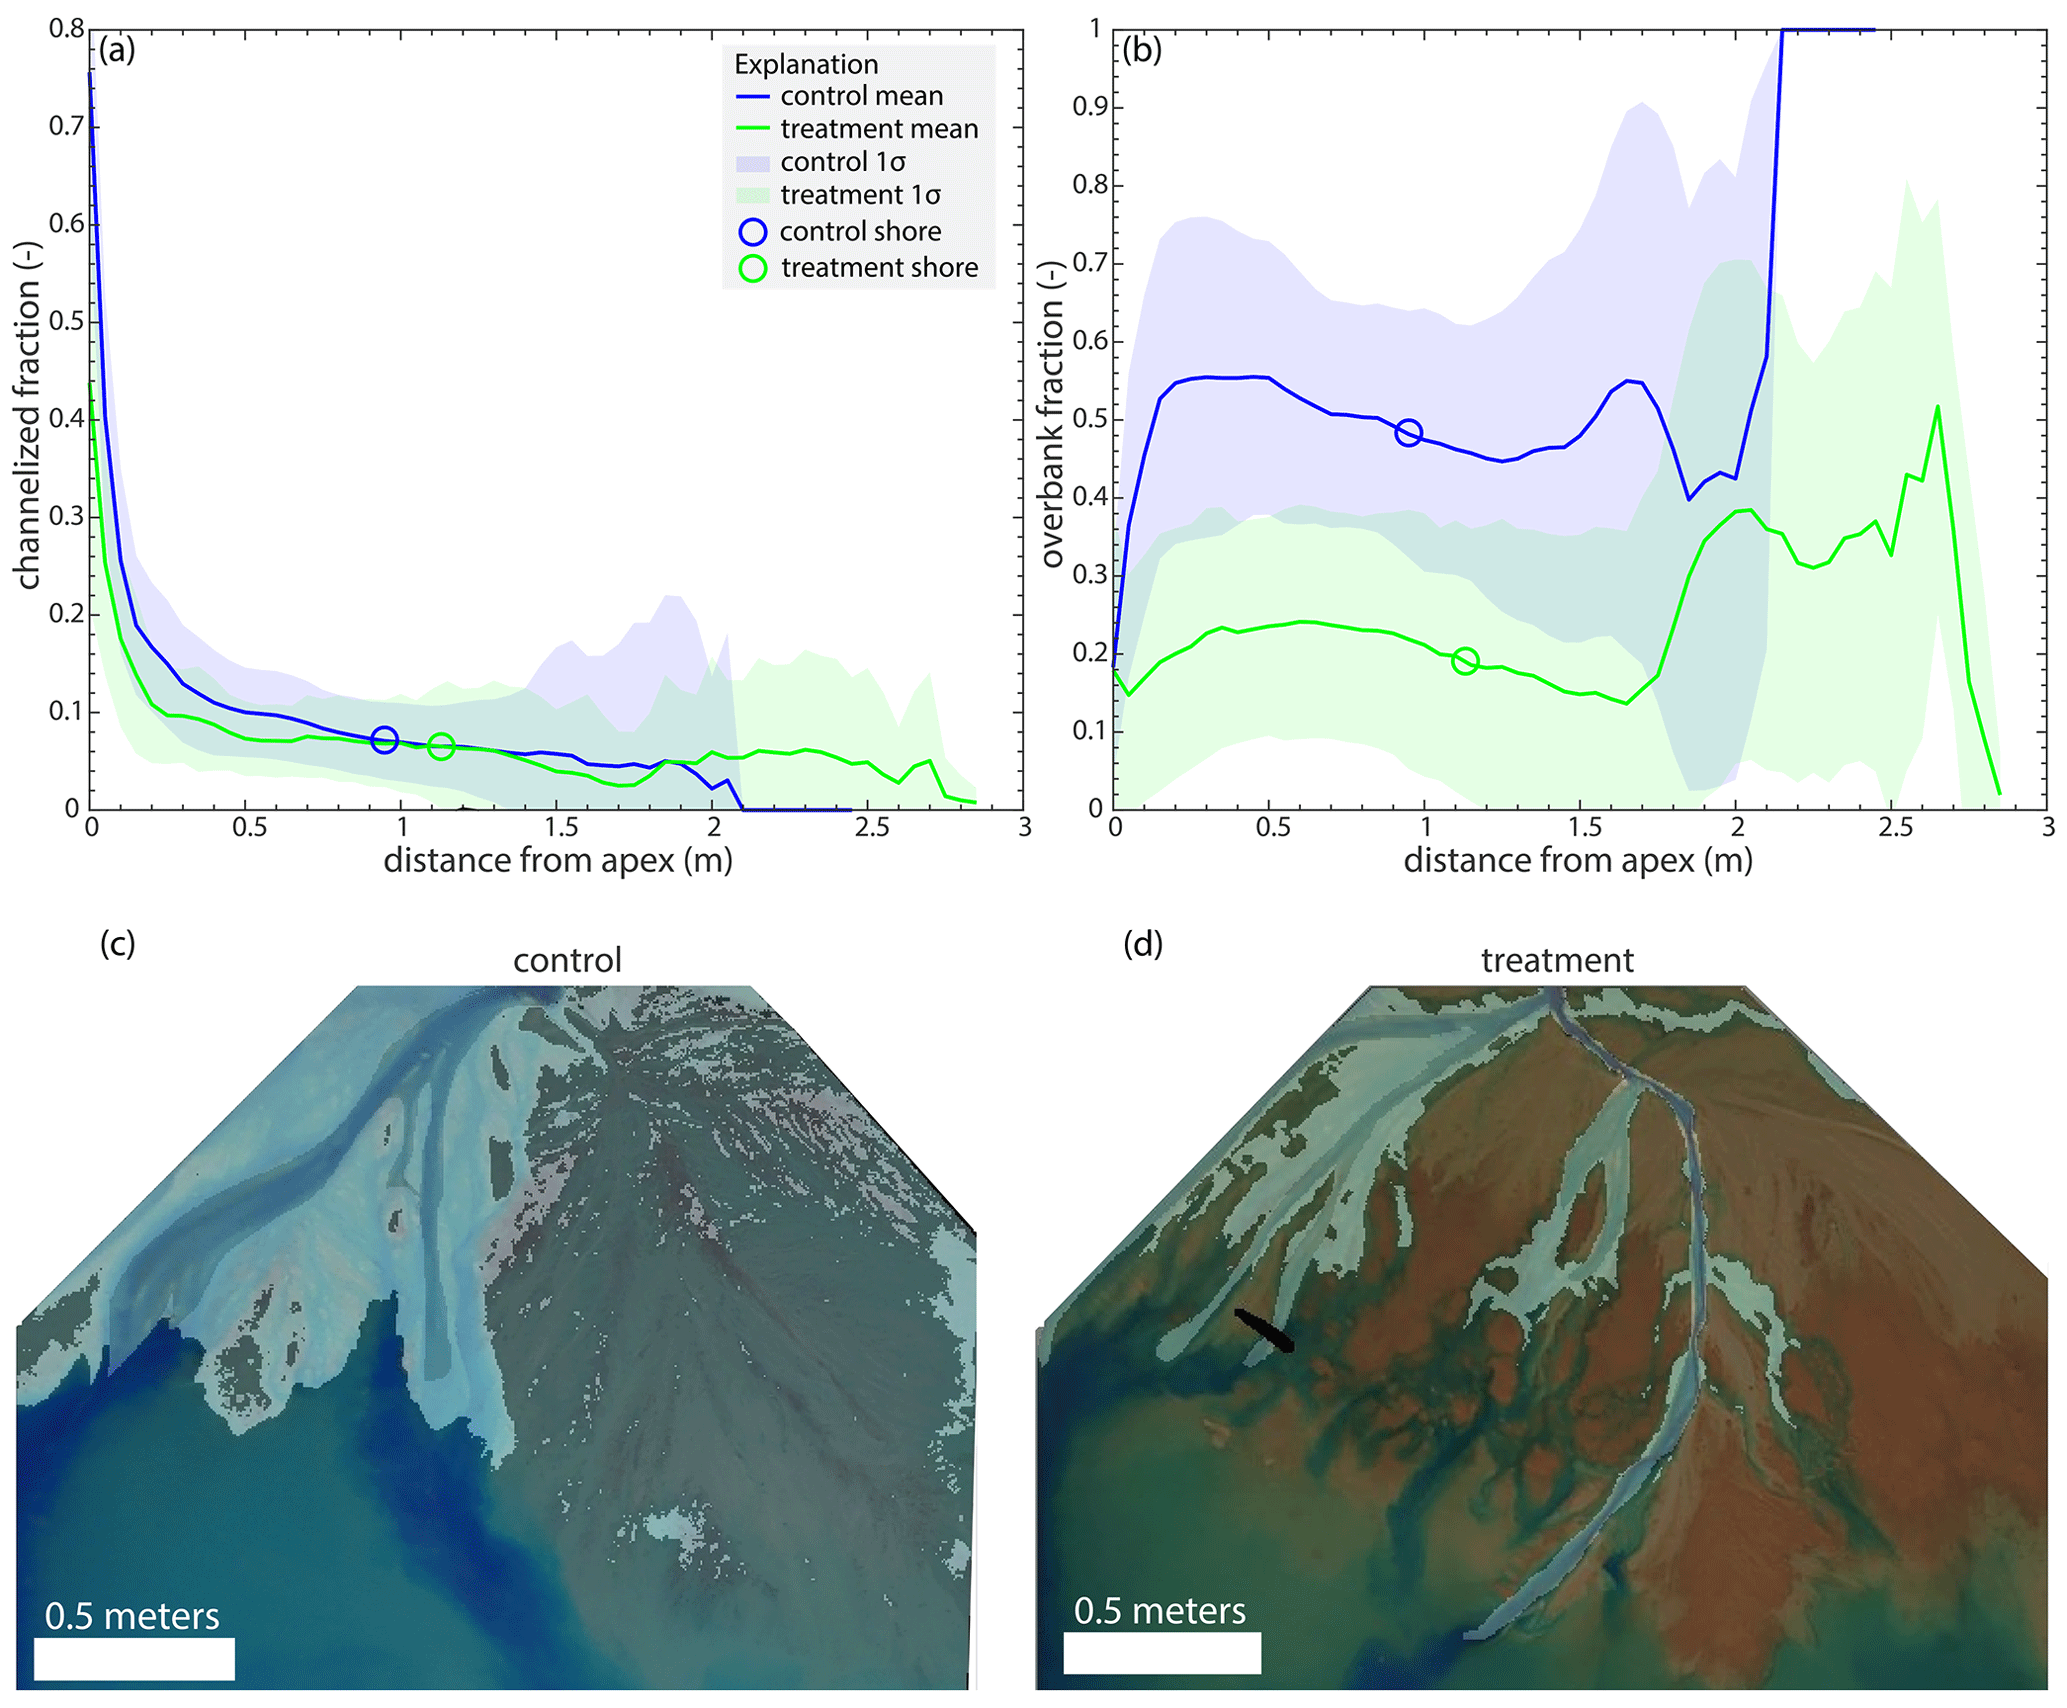
Figure 3(a) Mean channelized and (b) overbank flow fraction as a function of distance from the apex for the control (blue) and treatment (green), with 1σ standard deviation shown in the shaded polygons. (c) The channelized and overbank flow on the terrestrial delta top for the control experiment at hour 181, which approximates the mean flow conditions during the experiment. (d) The channelized and overbank flow on the terrestrial delta top for the treatment experiment at hour 360, which approximates the mean flow conditions during the experiment.
The basin-wide channel morphology of the control and treatment experiments is different (Table 2). The channels are on average narrower (Fig. 4b) and longer (Fig. 4c) in the treatment experiment compared to the control. Furthermore, the treatment experiment has a greater number of distributary channels (computed automatically through image segmentation) on the delta top (Fig. 4d).
Table 2Basin-wide channel properties for the control and treatment experiments.
The channels in the treatment and control experiments extend past the mean shoreline (Fig. 4a and c). The mean shoreline in the control experiment is 0.942 ± 0.156 m (blue open circles in all radial figures; the interquartile range (IQR) is 0.874 m [0.486,1.36]), and the mean channel length is 1.51 ± 0.211 m. On average, the channels extend 0.571 ± 0.265 m past the mean shoreline. The mean shoreline in the treatment experiment is 1.11 ± 0.156 m (green open circles in all radial figures; the IQR is 0.889 m [0.651,1.14]), and the mean channel length is 1.90 ± 0.420 m. On average, the channels extend 0.793 ± 0.413 m past the mean shoreline. While the slope break occurs around the median shoreline (∼ 1.5 m from the apex) for the treatment experiment (i.e., the channels extending past the local shoreline (overstepped channels) have a slope break), there is no such break in the control (Fig. 4a), even though the channels extend past the mean shoreline as well. The channel beds in the treatment are often below mean sea level, suggesting the presence of hydrodynamic backwater effects (Fig. 4a). However, this is not the case in the control, as the channels are perched above sea level, suggesting that the channels do not always extend past the local shoreline. The channels in the control experiment are wider near the apex and get narrower as they approach the shoreline. The distal narrowing of the channels is also observed in the treatment experiment, but the variation is channel width as a function of distance from the apex is not as large (Fig. 4b). The combination of more and longer channels in the treatment experiment produces channels with similar planform area as the control (Table 1). The number of channels decreases with radial distance from the apex in both experiments, supporting loss of channel definition (i.e., a loss of self-formed levees) near the shoreline.
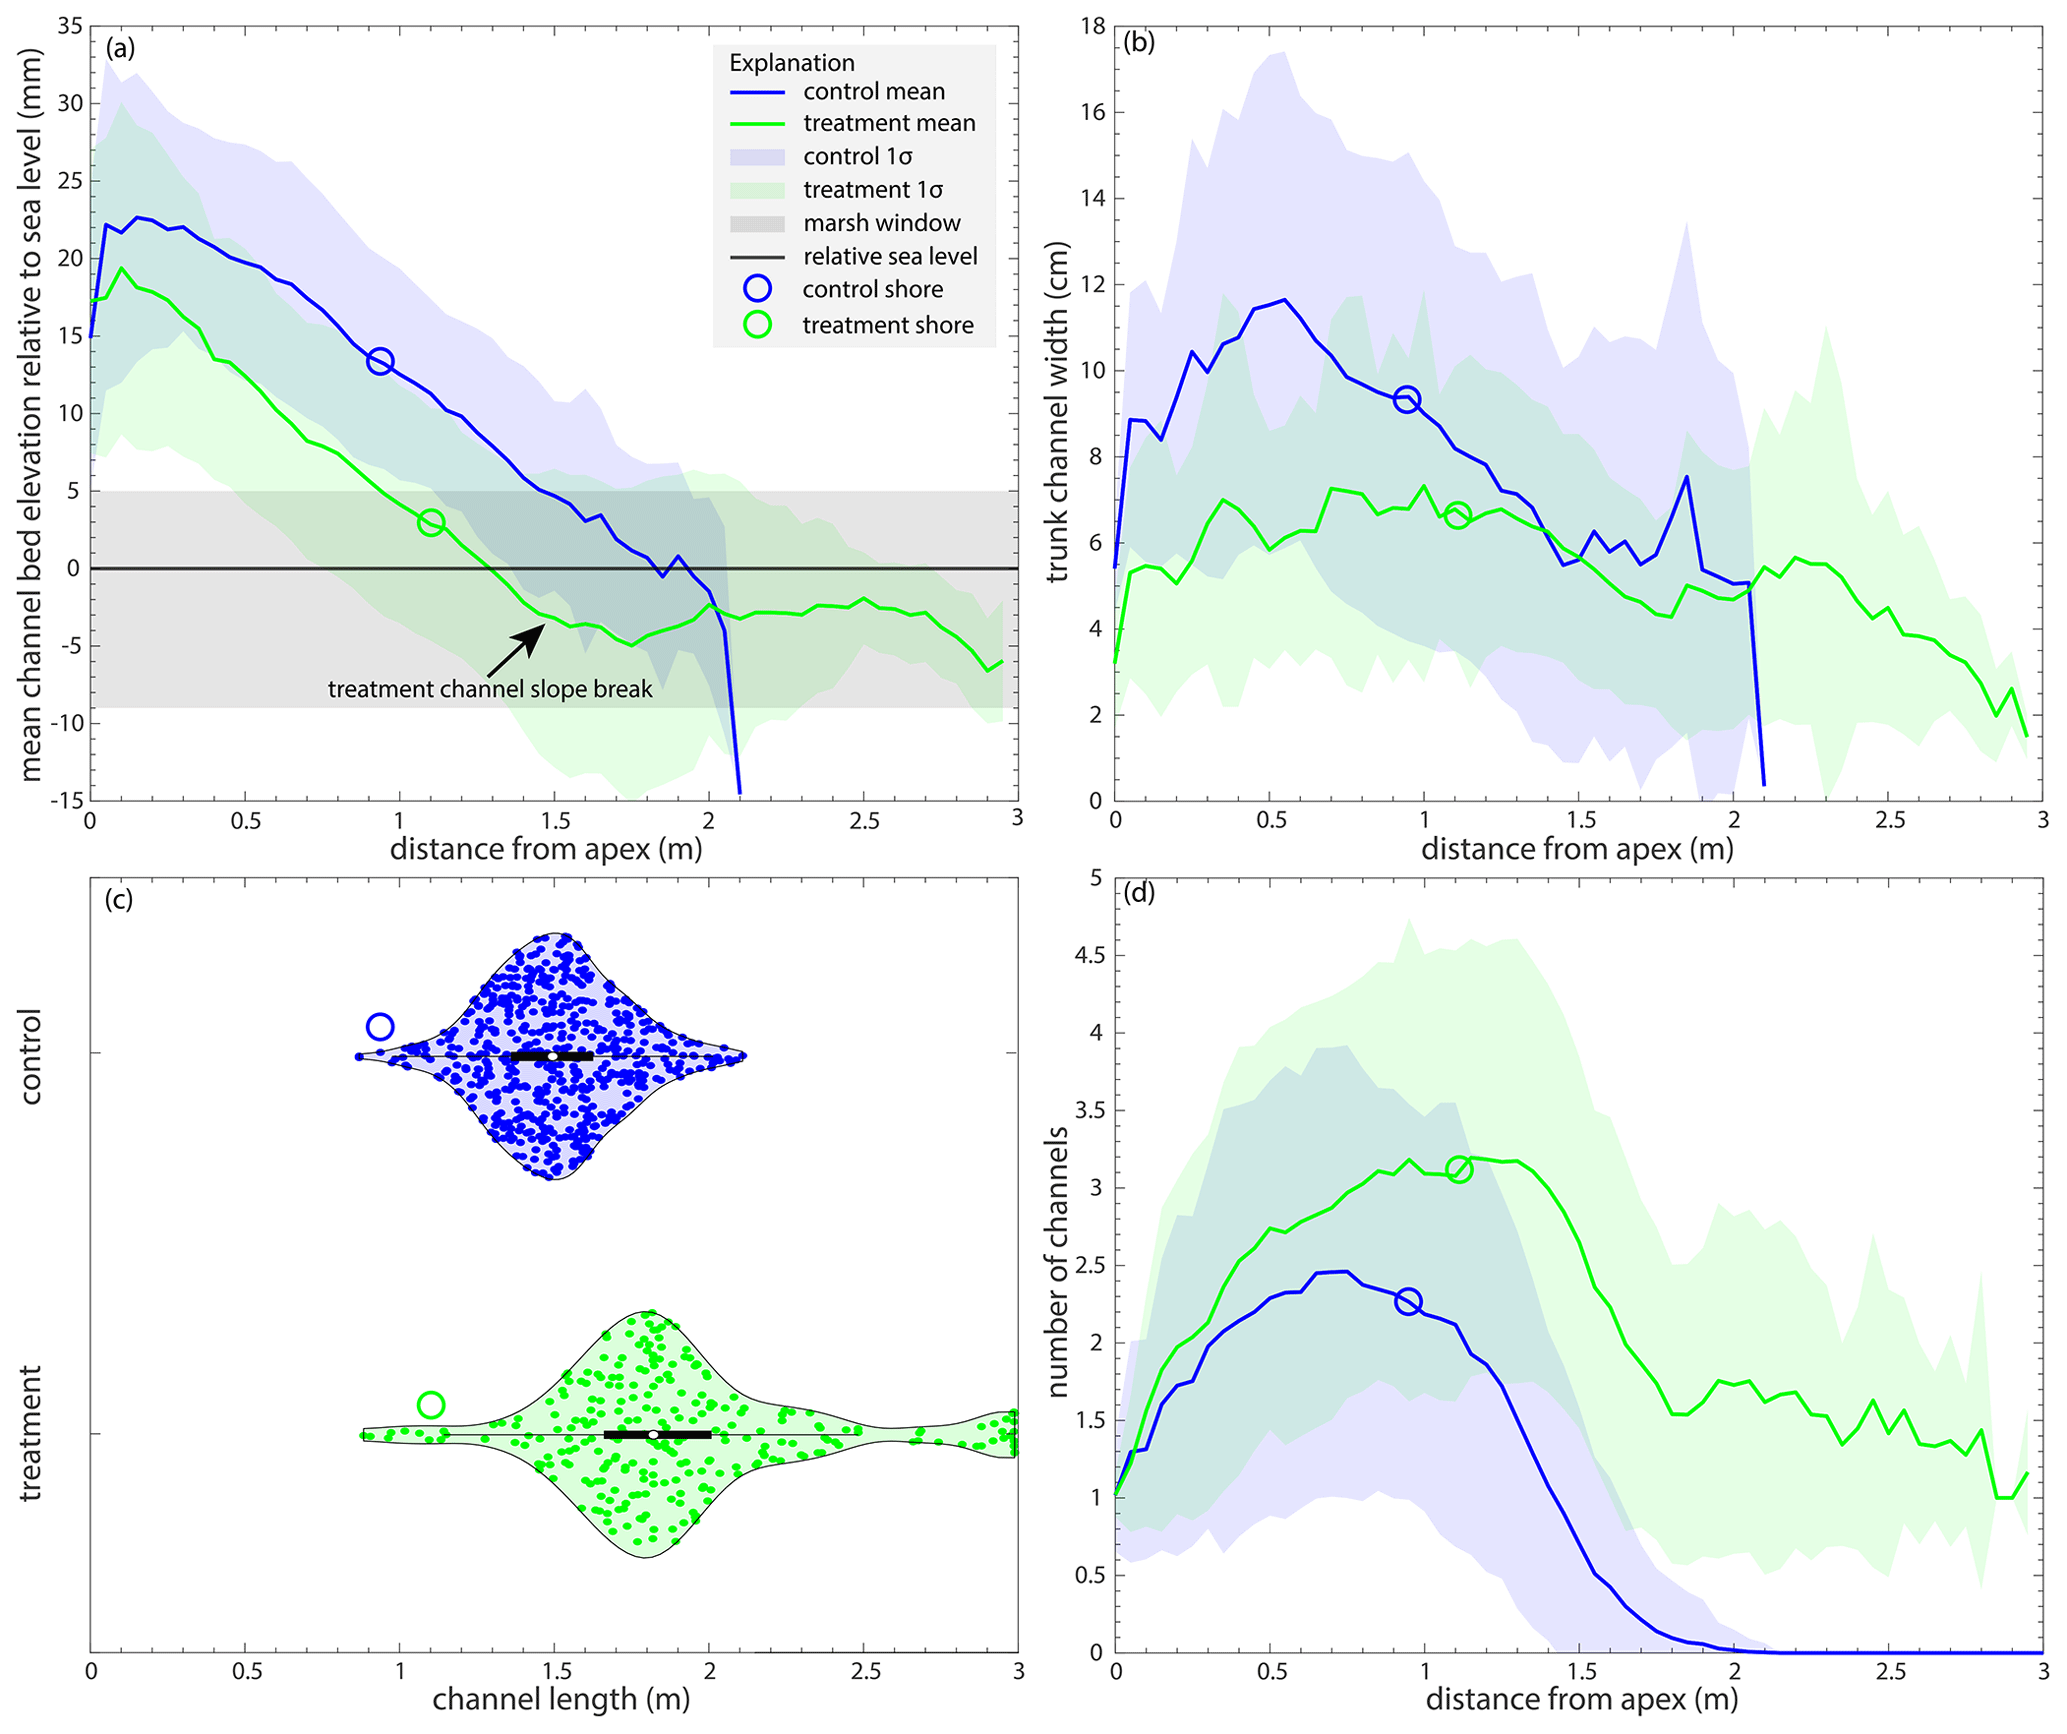
Figure 4Channel morphology for the control (blue) and treatment (green) experiments. (a) The mean channel bed elevation relative to sea level (mm) as a function of radial distance from the apex (m). (b) The mean trunk channel width (cm) as a function of radial distance from the apex (m). (c) Violin plots of the channel length (m) for the control and treatment experiments. (d) The mean number of channels as a function of distance from the apex (m). The shaded blue (control) and green (treatment) areas signify 1σ standard deviation from the mean, and open circles are the mean shoreline positions.
How does the addition of marsh deposition affect the presence of a backwater reach? We show that the treatment experiment has a significant backwater reach that is not observed in the control experiment (Fig. 5). Out of the 560 h of the control experiment, there is no radial transect with at least 16 % of the elevations at or below sea level for 49 % of the experiment (274 h). Of the 286 hours in the control experiment with an observed backwater reach, only 1 % of the channels have backwater lengths > 0.5 m, with a maximum backwater length of 0.57 m (Fig. 5). However, a backwater length is always observed in the treatment experiment for the 265 h where there is a viable channel map. The treatment experiment has a backwater length > 0.5 m 69 % of the time, with a maximum backwater length of 1.91 m (Fig. 5). The average backwater length in the control experiment is 0.0474 m, and it is 0.683 m in the treatment (Table 2; Fig. 5). Both the control and treatment experiments show variability in backwater lengths through time, with peaks roughly every 50 h (∼Tc).
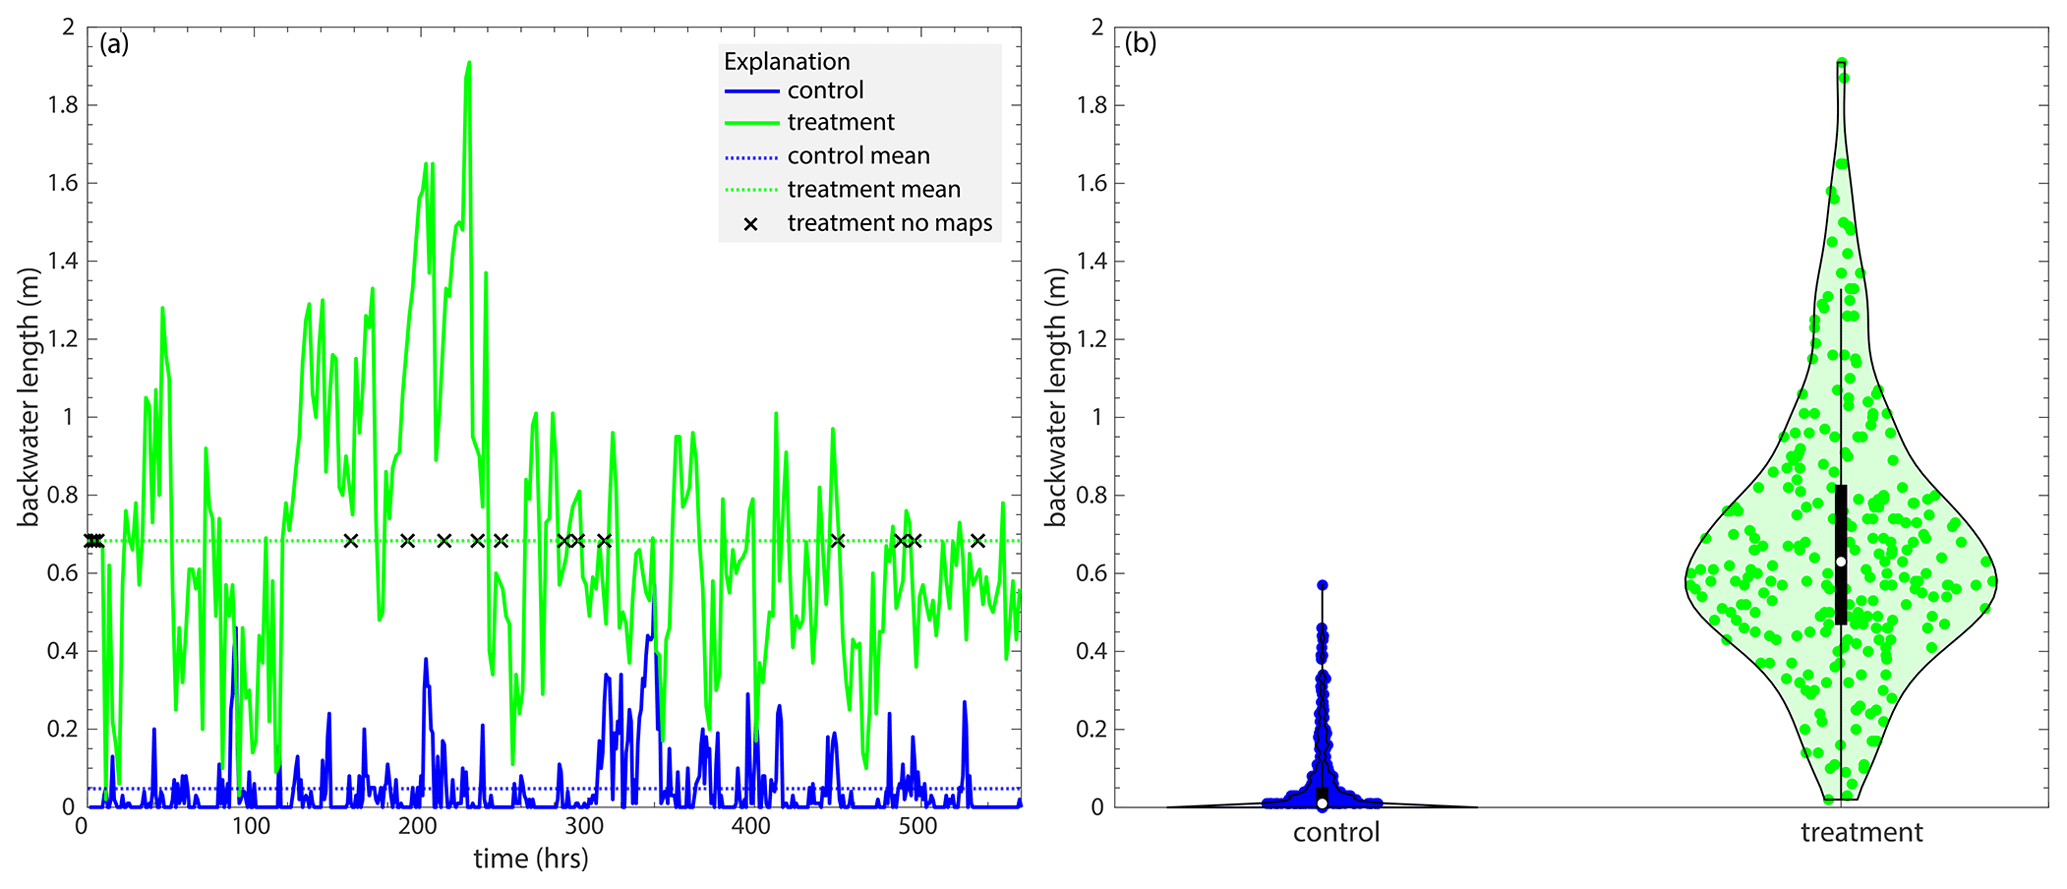
Figure 5(a) The backwater length (m), measured as the maximum consecutive length of the channel domain that is at or beneath sea level, for the control (blue) and treatment (green) experiments through time. The black crosses represent the times with no channel maps for the treatment experiment. (b) Violin plots of the backwater length for the control (blue) and treatment (green) experiments.
3.2 Channel kinematics
Despite the differences in channel morphology, we observe only subtle differences in the statistics characterizing channel kinematics or the motion of the channels. We first characterize the channel and far-field aggradation rates for both experiments and observe differences (Fig. 6a). The mean channel aggradation rate in the control experiment increases with radial distance from the apex with a large peak near the downstream end, which is characteristic of topographic flow expansions (Fig. 6a). In contrast, the treatment experiment shows a significantly reduced peak in the mean channel aggradation rates near the shoreline (Fig. 6a). The long-term aggradation rate near the mean shoreline for both experiments is 0.25 mm h−1 (Sanks et al., 2022), but the highly mobile channels mean that, at short timescales, channel aggradation rates near the shoreline are more rapid than long-term aggradation rates. The reduced peak in the treatment channels compared to the control channels corresponds to the start of the hydrodynamic backwater zone (Fig. 4a) and the larger number of channels in that zone (Fig. 4b).
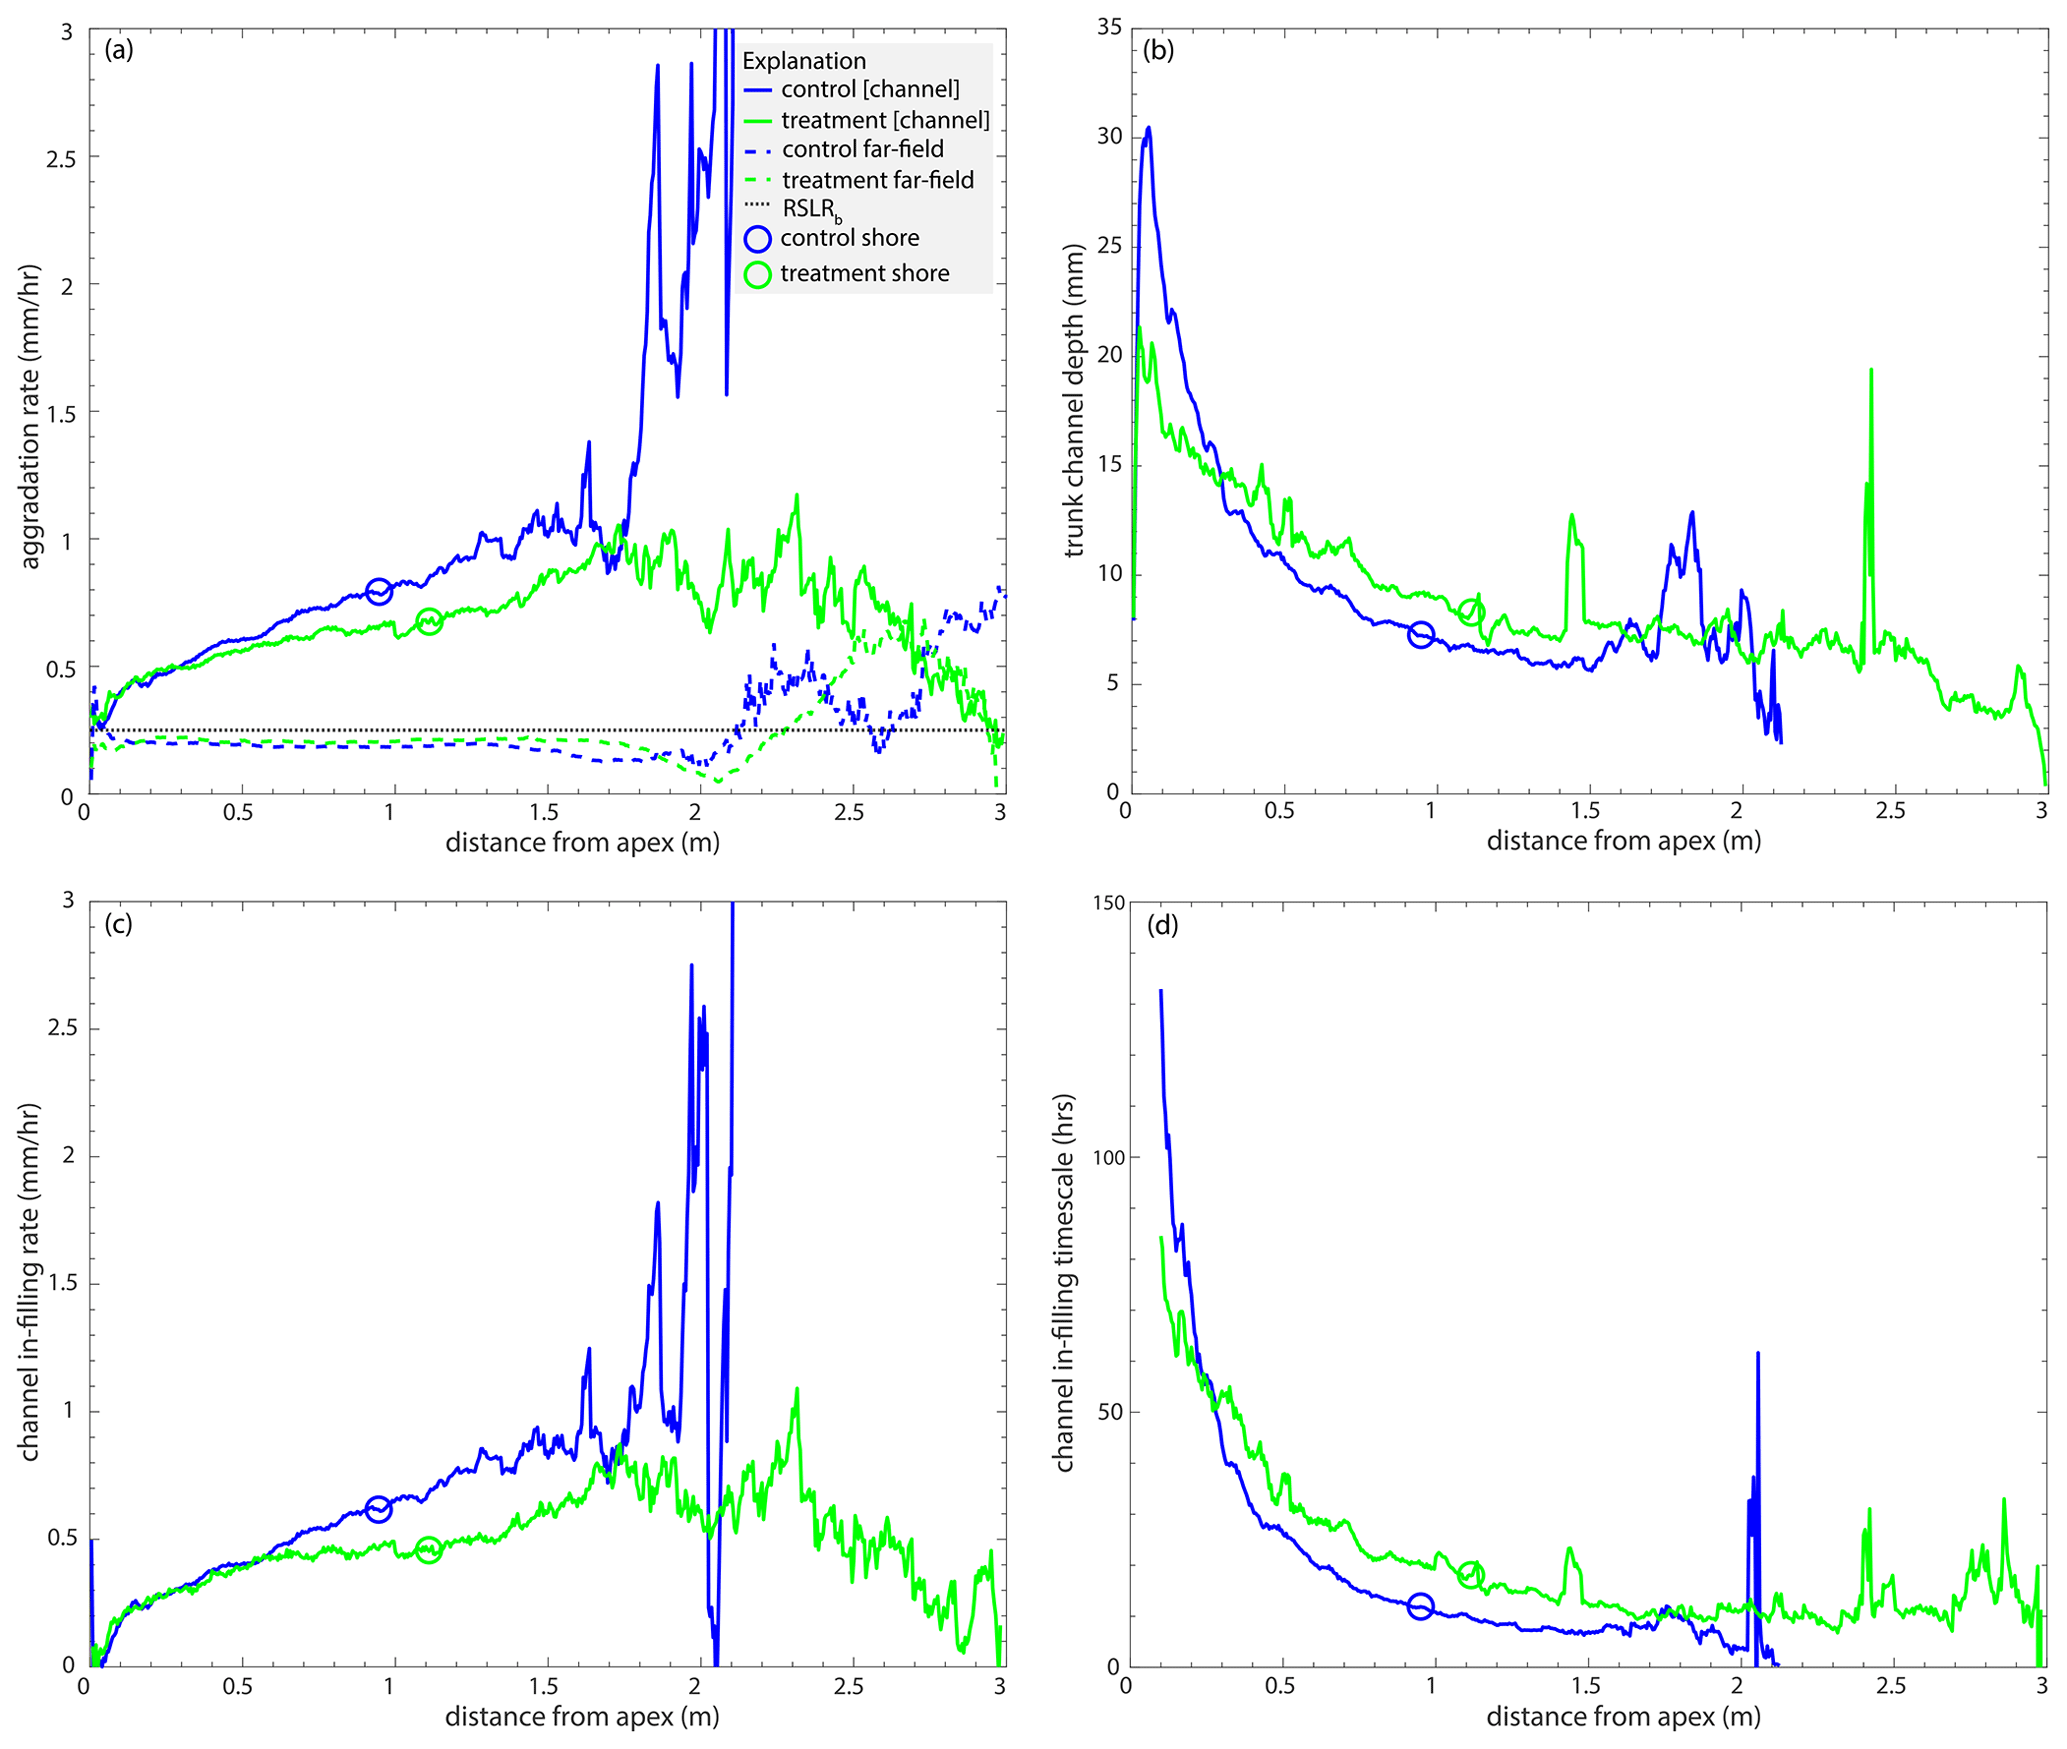
Figure 6(a) The mean channel (solid line) and far-field (dashed line) aggradation rates (mm h−1) in the control (blue) and treatment (green) experiments as a function of radial distance from the apex (m). (b) The mean trunk channel depth (mm) as a function of radial distance from the apex (m). (c) The aggradation difference (mm h−1; i.e., the channel in-filling rate) between far-field and channel aggradation rates as a function of radial distance downstream (m). (d) The channel in-filling timescale (h) as a function of radial distance downstream (m) for locations ≥ 0.1 m from the apex. Please refer to Fig. C1 for the same figure which shows the data that have been cut off from panels (a) and (c) here.
Sediment accumulation rates show that the mean basin-wide channel aggradation rate for the control experiment is 0.425 ± 1.23 and 0.450 ± 1.15 mm h−1 for the treatment. The radially and time-averaged channel aggradation rate for the control experiment is 1.06 ± 0.869 and 0.679 ± 0.190 mm h−1 for the treatment (Fig. 6a). The basin-wide mean far-field aggradation rate for the control is 0.050 ± 2.21 and 0.100 ± 1.38 mm h−1 for the treatment. The radially and time-averaged far-field aggradation rate for the control experiment is 0.277 ± 0.180 and 0.250 ± 0.146 mm h−1 for the treatment (Fig. 6a). Because the basin-wide channel depths are similar for both experiments, this results in a basin-wide channel in-filling timescale (Tf) of 8.70 h for the control and 13.8 h for the treatment experiment (using Eq. 7). It takes about 1.5 times as long for channels to fill in relative to the floodplain in the treatment experiment than the control, suggesting the presence of channel buttressing via the non-fluvial sedimentation in the treatment experiment. Despite similar basin-wide channel depths, the trunk channels in the treatment experiment are deeper than in the control (Fig. 6b), again producing a longer Tf as a function of radial distance from the apex (Fig. 6d).
Both control and treatment experiments exhibited mobile channels with some clear episodes of avulsion and lateral migration (Appendix B). However, the steady presence of shallow unchannelized flow in both experiments made it impossible to map the discrete avulsion locations. Instead, both deltas appeared to maintain overbank flows that kept the “finding phase” (Reitz et al., 2015) of the avulsion cycle active (Figs. B3, B4). No clear distinction in avulsion location or timescale could be established (e.g., Figs. 6, 7, and B5–B8), despite the significant difference in backwater length and aggradation patterns.
The basin-wide lateral mobility is roughly the same in both experiments (Fig. 7a). The basin-wide lateral mobility timescale (Tmob) for the control experiment is 63 and 60 h for the treatment experiment (Fig. 7a). However, we see subtle differences in Tmob as a function of radial distance from the apex (Fig. 7c, d). The channels on the terrestrial delta top (i.e., pland) move slightly slower in the treatment compared to the control. Lateral channel movement increases (i.e., channels move faster) slightly as the channels approach the mean shoreline in the treatment, whereas channel movement is less variable across the terrestrial delta top in the control. The perceived slower channel movement past the mean shoreline in both experiments is due to the fact that channels do not always reach that far into the basin (Fig. 4c), which artificially creates longer channel mobility timescales. This is why lateral mobility is typically analyzed on a basin-wide scale in experimental river deltas, as shown in Fig. 7a. Similar to the Tmob, the planform overlap metric (another proxy for an avulsion timescale; Wickert et al., 2013) shows little difference between control and treatment experiments (Appendix B; Fig. B5). However, it takes about one-half of the time to modify 90 % delta top by at least 1 mm of aggradation in the treatment compared to the control experiment (Fig. 7b), which agrees with the channel and far-field channel aggradation rates and is due to the addition of the non-fluvial proxy in the low-lying region of the delta top that induces far-field sedimentation in the treatment experiment that would otherwise not receive sediment, which is the case in the control experiment. Thus, the addition of non-fluvial sediment in the marsh window (∼ 0.25 mm h−1 for areas in the stable marsh window) is more widespread and outpaces (on a short-term scale) the far-field sediment deposition of the control experiment. Relatedly, because the channels are the same depth (basin-wide mean; Eq. 1) and the experiments both have long-term, basin-wide aggradation rates of 0.25 mm h−1 (or RSLRb), the basin-wide Tc (Eq. 6) is the same (Table 2).
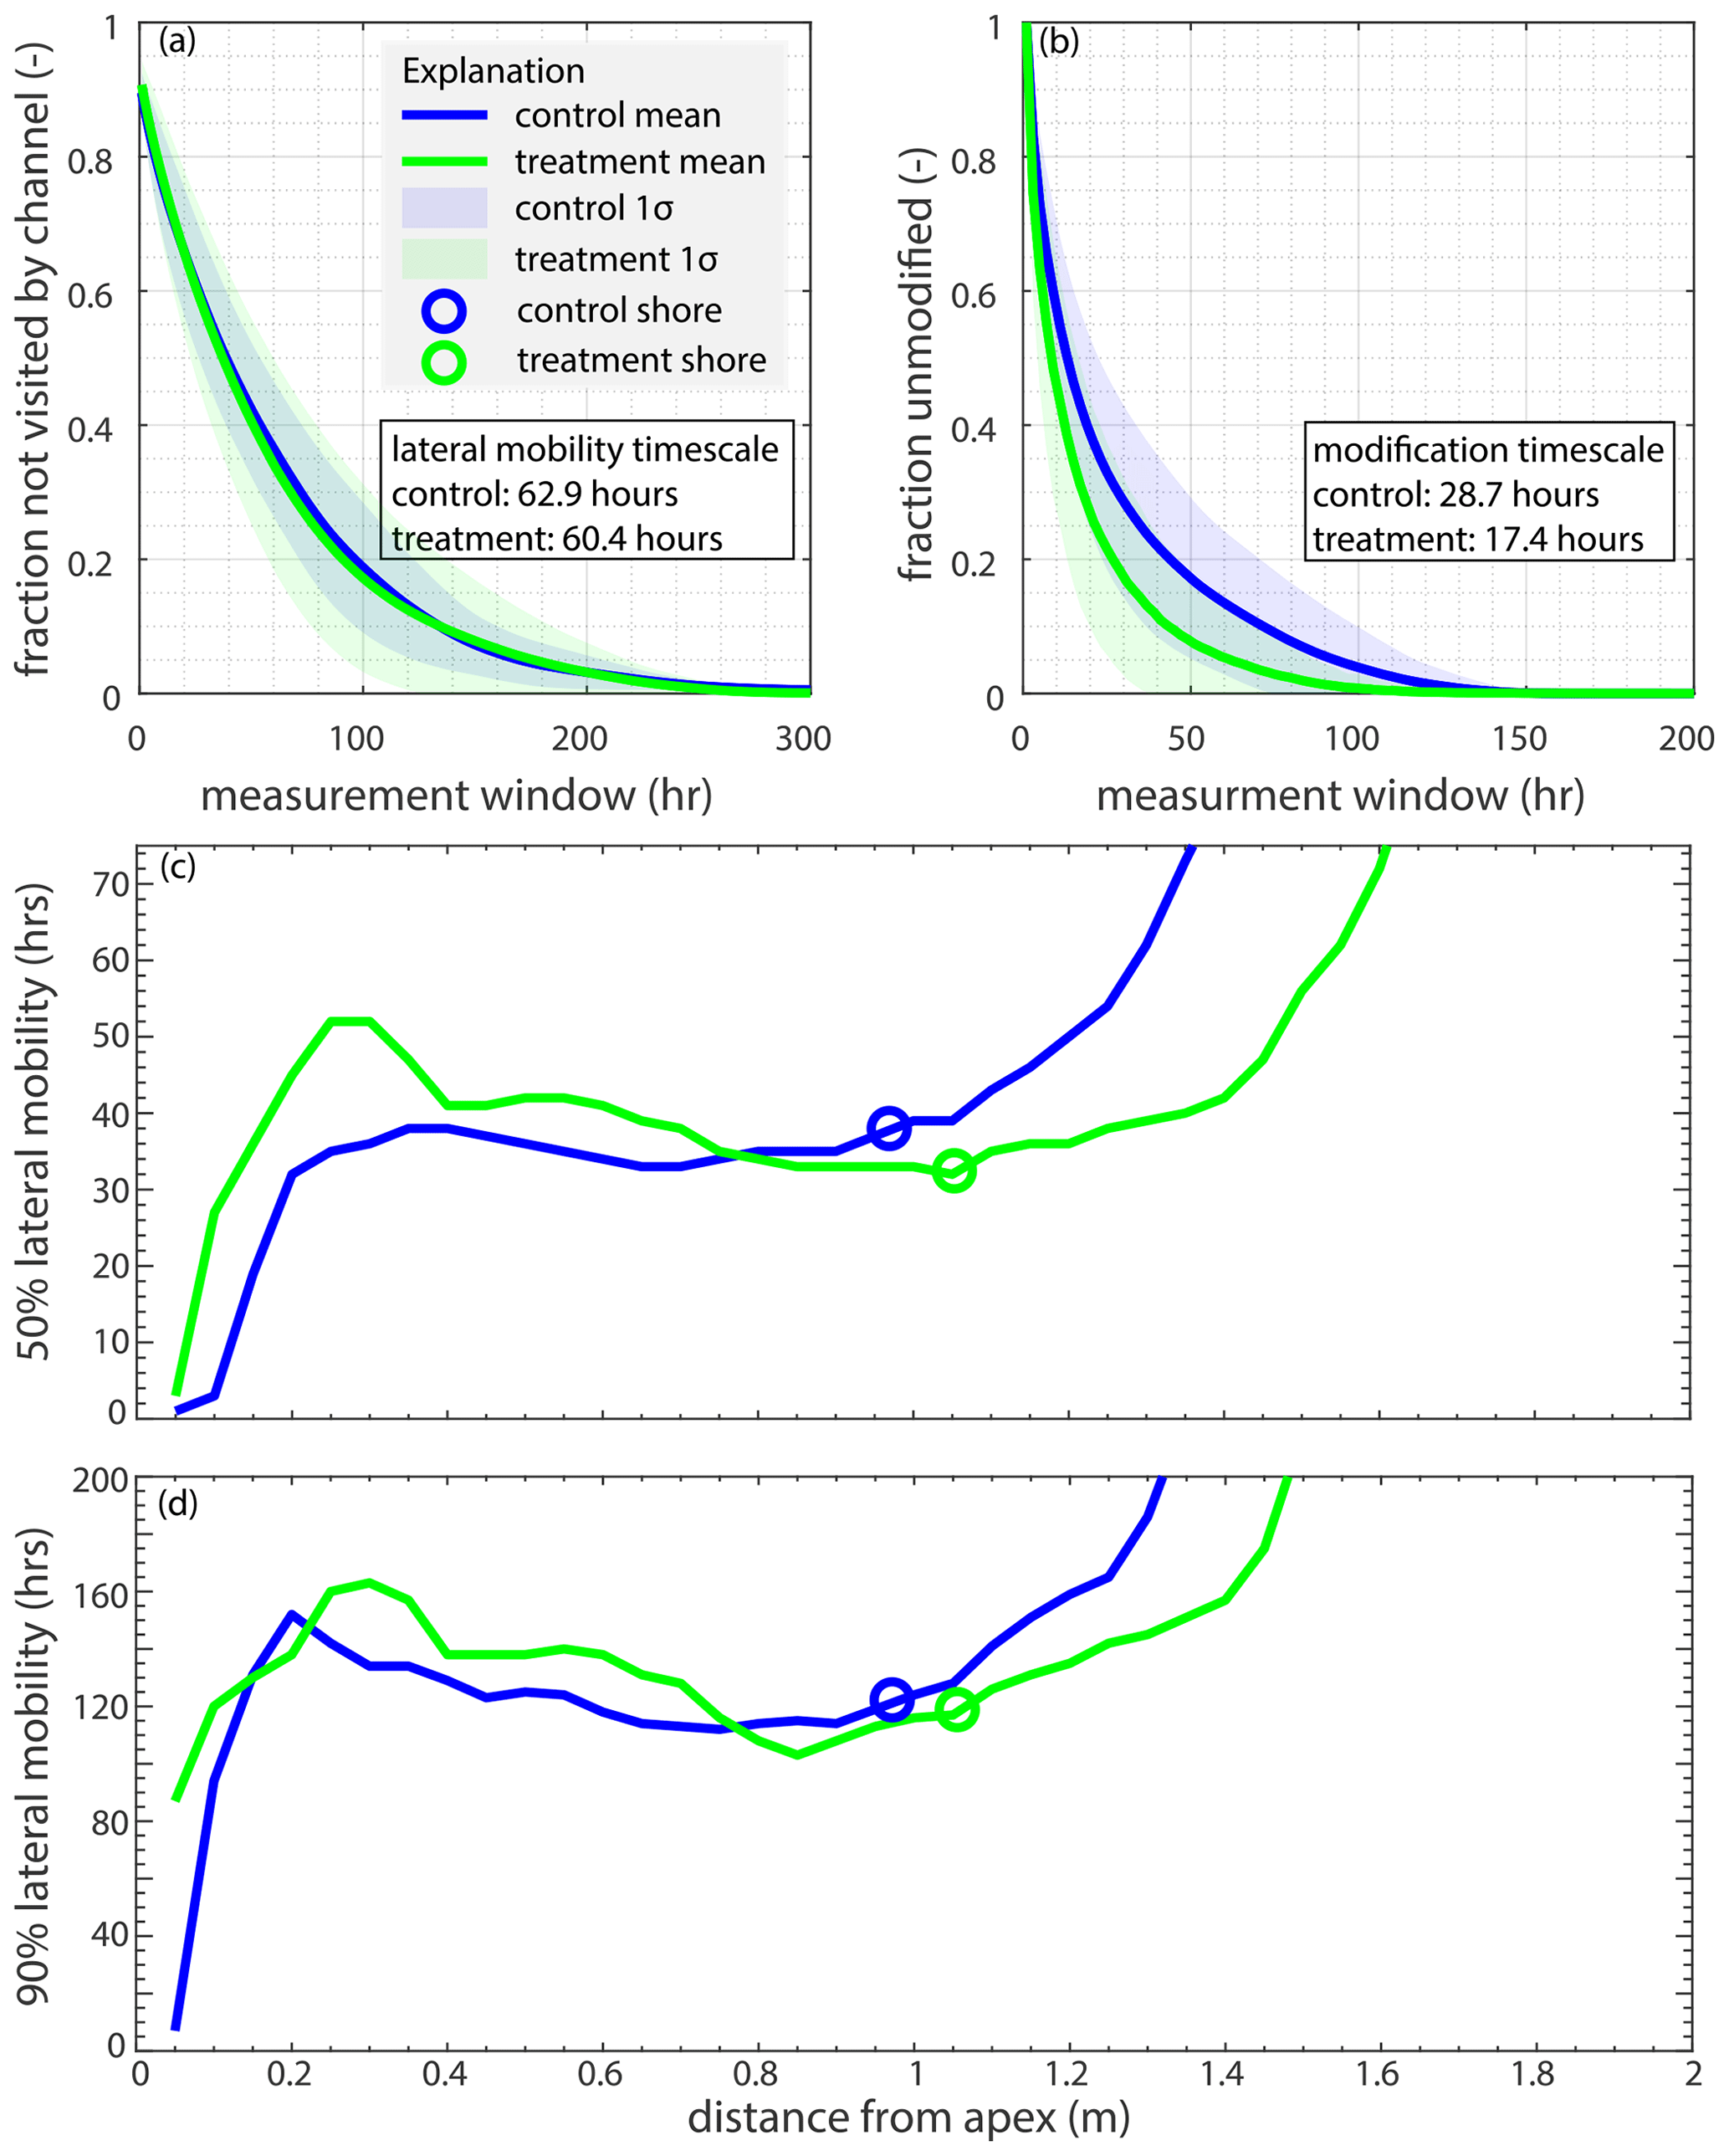
Figure 7(a) The fraction of the delta not visited by a channel for the control (blue) and treatment (green) experiments versus time in run hours. (b) The fraction of the delta top that has not accumulated at least 1 mm of sediment for the control (blue) and treatment (green) experiments versus time in run hours. (c) The 50 % lateral channel mobility (h), or how long it takes the channels to visit 50 % of the radial transect, as a function of radial distance from the apex (m) for both experiments is shown. (d) The 90 % lateral channel mobility (h), or how long it takes the channels to visit 90 % of the radial transect, as a function of radial distance from the apex (m) for both experiments is shown.
4.1 The impact of non-fluvial deposition on deltaic channel evolution
The impact of the non-fluvial deposition on deltas is the making of longer channels that must traverse a slope break and a large platform near sea level (Figs. 4 and 8). The channels in the control experiment are wider on average but typically turn into sheet flow before they reach the ocean basin (Fig. 8a; Appendix B; Fig. B3). Near the shoreline, the delta top is usually dominated by one steeply sloping channel that contains a large amount of overbank flow. As such, we observe topographic flow expansions (Sittoni et al., 2014) and distally increasing deposition rates (Fig. 6a), indicating a morphodynamic backwater control on channel filling and migration. Because of the high deposition rates in the lobes, the channels lose confinement before they reach the local shoreline, leading to abrupt backstepping. The flow expansions occur in the distal channel lobes but impact (i.e., decrease) the channelization of the entire system, leading to 60 % of the terrestrial delta being covered with flow on average. This mechanism of channel movement and fluvial sedimentation produces channels that only reach the local shoreline about 24 % of the time. The resulting overbank flow has channel beds that remain above sea level to the shoreline, producing a backwater length that is often effectively zero. Thus, topographic flow expansions are the primary control on channel kinematics in the control experiment, which is similar to previous physical experiments without variable discharge (e.g., Li et al., 2017; Hoyal and Sheets, 2009).
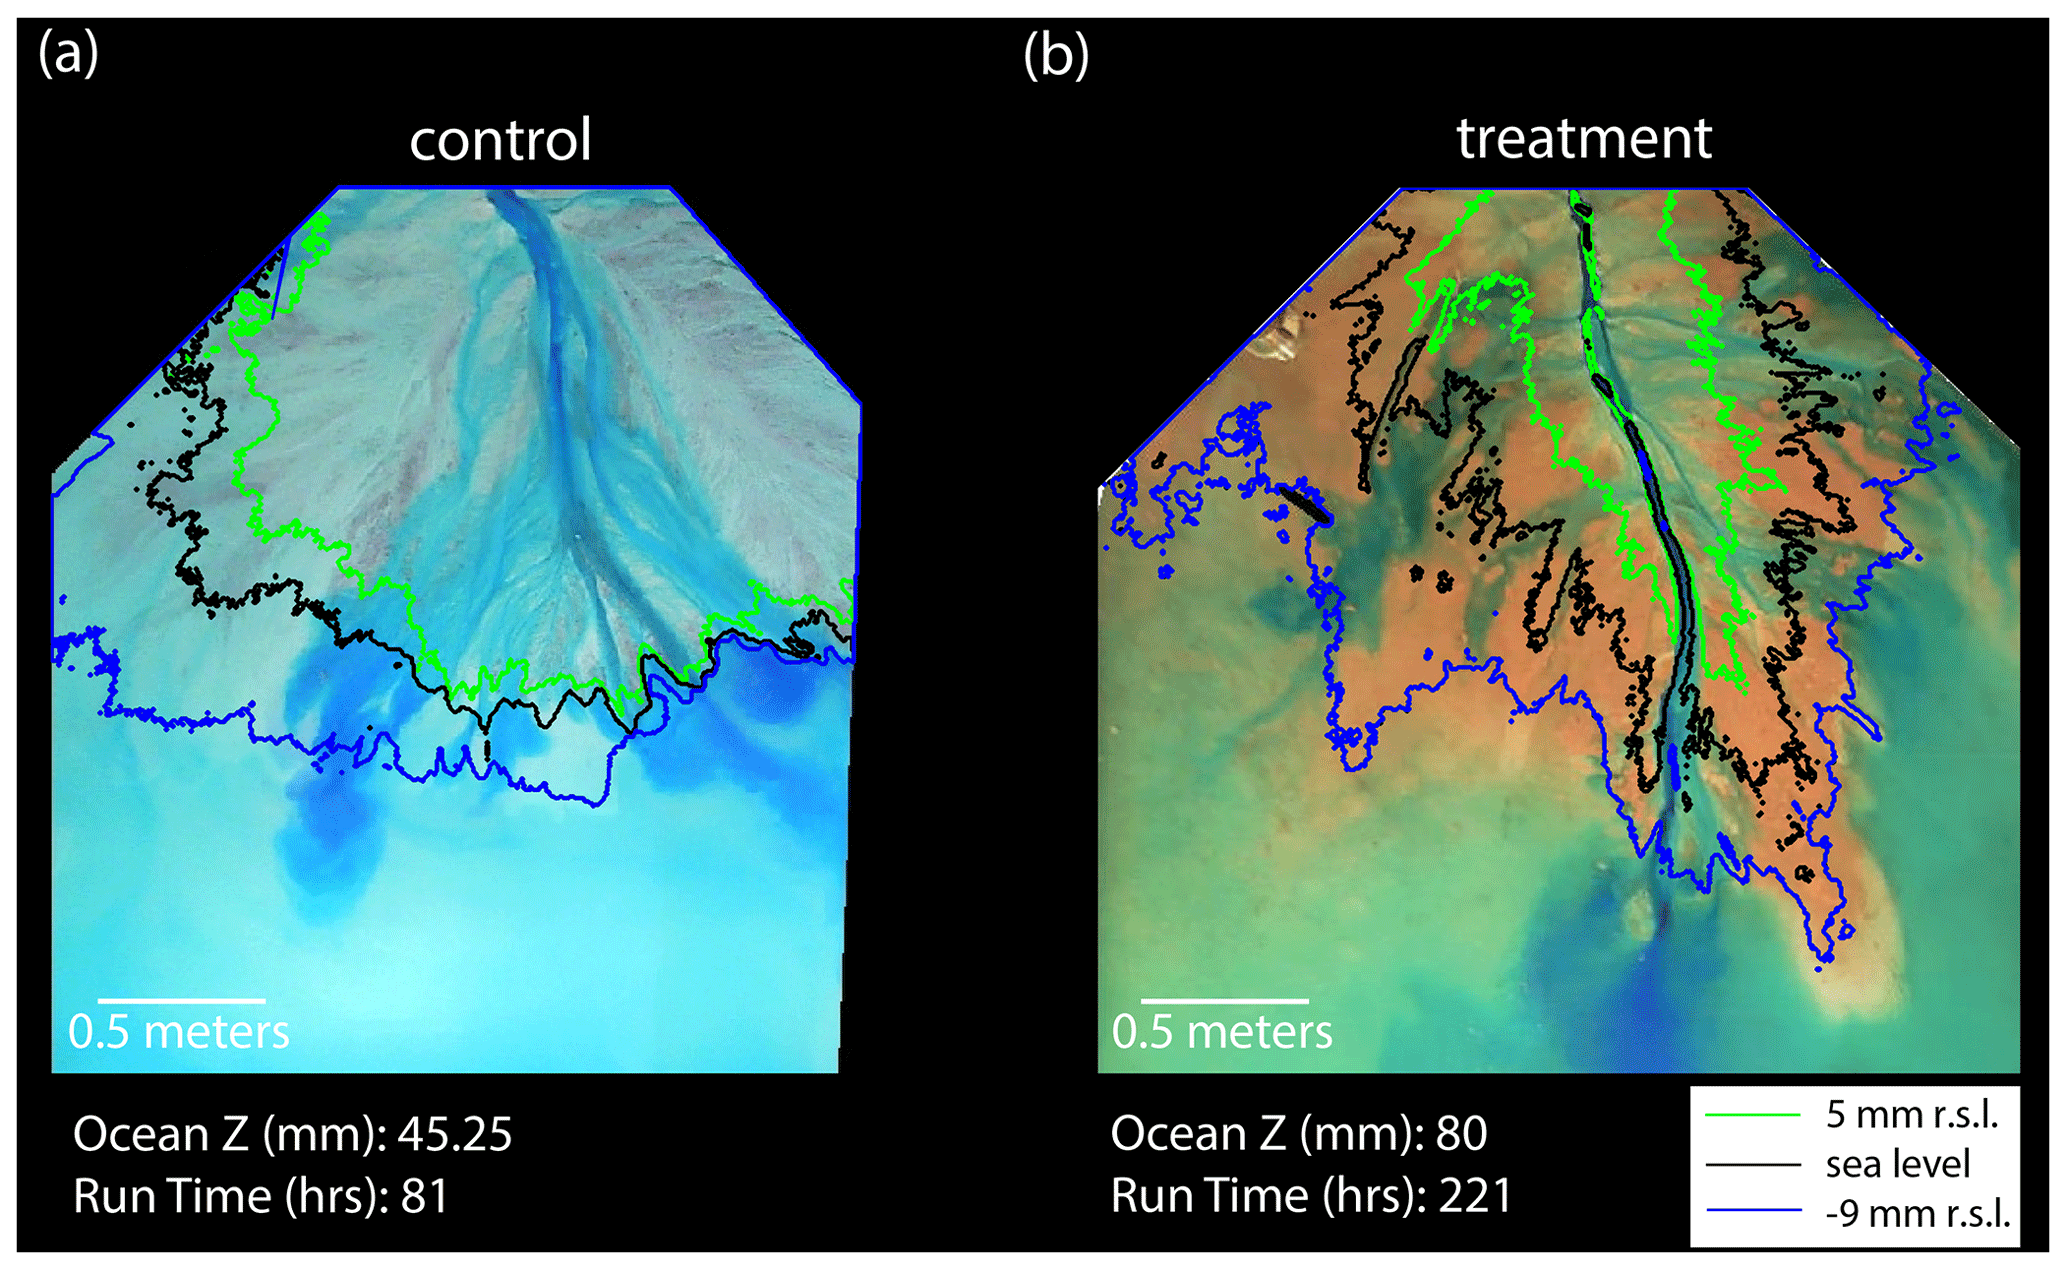
Figure 8Control and treatment channel comparison. (a) Aerial image of the control delta top at run hour 81, with contour lines at 5 mm (green) relative to sea level (r.s.l.), sea level (black), and −9 mm r.s.l. (blue). (b) Aerial image of the treatment experiment at run hour 221, with contour lines at 5 mm r.s.l. (green), sea level (black), and −9 mm r.s.l. (blue). Note that the experiments are run in equilibrium, so both the control and treatment experiments shown here are in the same phase of evolution, despite being at different experimental run hours. We choose these two images to highlight the difference in the channel morphology.
A dynamic network of feedbacks created from the deposition of non-fluvial sediment allows the treatment experiment to exist in dynamic equilibrium with constant relative sea level rise but with a very different morphology than the control experiment. Near the shoreline, the treatment channels are gently sloping and contain less overbank flow than the control experiment. This leads to a significant decrease in channel deposition rate near the shoreline compared to the control (Fig. 6a). We observe a long hydrodynamic backwater reach during 95 % of the treatment experiment, despite constant water discharge (Fig. 5). Enhanced lobe progradation has been previously shown to increase backwater length (Moodie et al., 2019; Brooke et al., 2022), which agrees with our finding that non-fluvial deposition creates channels that extend further past the mean shoreline (creating elongated lobes) and increases the hydrodynamic backwater length. As such, the non-fluvial deposition, the reduced distal channel deposition rates, and the presence of a significant hydrodynamic backwater reach appear to be intimately related.
The treatment channels are also narrower (Fig. 4b), deeper (Fig. 6b), and longer (Fig. 4c) than the control channels. The treatment channels are narrower because the flow is partitioned between a larger number of distributaries. Though some flow is lost to overbank flooding in the distal portion of the delta (Fig. 3b), to conserve flow that becomes distributed over an increasing number of channels, the channels must become shallower and narrower with increasing distance from the apex (Figs. 4b, c and 6b). These findings agree with previous studies that show that deltas with vegetation and/or increased fine sediment fraction have increased channelization and narrower, longer, and deeper channels (Lauzon and Murray, 2018; Caldwell and Edmonds, 2014). While these studies primarily focus the hydrodynamic effects of vegetation-induced drag, we show that the extra mass accumulating in these vast wetland platforms impacts the channel morphology in similar ways. The formation of more distributary channels offsets the narrower channels in the treatment experiment to keep the channelized area similar between the two experiments. Furthermore, flow is more constrained to the channels (Fig. 3b), indicating channel aggradation as being the primary form of fluvial sedimentation.
Interestingly, the addition of non-fluvial sediment in the low-lying overbank regions of the treatment delta top creates channels that have a long backwater reach. It is often suggested that variable discharge is necessary to create such conditions (e.g., Lamb et al., 2012; Ganti et al., 2016a). Though we cannot rule out an influence of variable discharge in other settings, it was not the control on hydrodynamic backwater here. While these constant discharge experiments both show increases in channel aggradation rate and decreases in avulsion timescale with distance downstream, the treatment experiment lacks the significant increase in aggradation rate near the local shoreline that produced classic topographic flow expansions in the control experiment (Fig. 6a). These results suggest that the channel avulsions triggered by a peak in channel sedimentation occur less frequently in the treatment experiment compared to the control. Recent research shows that avulsion locations may occur because of geometric constraints (e.g., a break in slope) and can be determined without backwater hydrodynamics (Ratliff et al., 2021; Prasojo et al., 2022). Unlike the control, the treatment experiment exhibits a channel slope break near the local shoreline (Fig. 4a), and the channels usually extend past the local shoreline, creating significant backwater lengths often > 0.5 m (Fig. 8). Hence, we propose the following new control on the hydrodynamic backwater: non-fluvial sedimentation (i.e., wetland accretion). Thus, the hydrodynamic backwater promoted by non-fluvial deposition has a strong control on channel kinematics in the treatment experiment, which is similar to global deltas (e.g., Ratliff et al., 2021; Chatanantavet et al., 2012; Lamb et al., 2012). This has important implications for controls on avulsions and channel movement in field-scale deltas. Both experiments have temporal variability in backwater length that is roughly equivalent to the compensation and lateral channel movement timescales. Though outside the scope of this work, this is an area for further discovery.
Despite the widely recognized relationship between avulsion locations and backwater length, the experiments have vastly different backwater lengths and channel in-filling (avulsion) timescales (Table 2), with no clear difference in avulsion location or long-term channel mobility. From this, we can only conclude that mass balance and compensation are what control the long-term channel mobility here, as the mass balance (Sanks et al., 2022) and compensation (Table 2) were nearly identical between the experiments. The basin-wide timescale of lateral channel movement (Tmob) is similar in both experiments (Fig. 7a; Table 2). Previous research has shown that vegetation decreases the lateral mobility of channels, effectively slowing channel migration in experimental and field systems (Wickert et al., 2013; Tal and Paola, 2010; Ielpi and Lapôtre, 2020), due to increased channelization and enhanced bank stability. For this reason, we hypothesized that the treatment experiment would have a longer Tmob, but this is not the case. Two processes are likely at play here. First, the river sediment mixture includes a polymer for added cohesion, which was created to simulate the cohesive properties of vegetation (Hoyal and Sheets, 2009). As such, the proxy wetland (non-riverine) sediment does not add a considerable amount of cohesion to the system. Second, the volume of sediment that accumulates on the terrestrial delta top is similar in the two experiments (Sanks et al., 2022). Combined with the systems evolving under the same base level rise rates (Table 1), the long-term distribution of fluvial sediment needs to be similar. In other words, lateral mobility and channel movement is driven by the compensation timescale, so the systems cannot have long-term, basin-wide lateral mobility timescales that are much longer than the compensation timescale. Because the control experiment was stable in its channel dynamics (i.e., the lateral mobility timescale was longer than the compensation timescale), this limits the ability for the wetland sediment proxy to further decrease channel mobility. This is supported by the long-lasting (∼ 250 h) channel at the beginning of the treatment experiment that led to increased mobility in the remainder of the treatment experiment, which helped fill the accommodation and counteract the effects of the initial long-lasting channel (Fig. B8). Though we observe a smaller ratio of far-field aggradation to channel aggradation in the treatment experiment than the control experiment (by ∼ 50 %), and the maximum channel aggradation is significantly reduced, compaction and a set base level rise rate create two systems with a similar terrestrial mass balance over their lifespans (Sanks et al., 2022). Thus, it is actually unsurprising that the basin-wide Tmob is similar. If the proxy wetland material were added to an experimental delta, where the riverine material did not have added cohesion via a polymer, and if the lateral mobility timescale were considerably shorter than the compensation timescale, then the slower channel in-filling timescale in the treatment suggests that the proxy material may decrease the lateral mobility compared to a non-cohesive delta without proxy material. This is an avenue for further exploration. Despite these results, we observe subtle changes in lateral mobility as a function of distance from the apex (Fig. 7c and d), which shows that non-fluvial deposition in the treatment experiment decreases channel movement slightly for area of the delta that is less than 0.8 m from the apex compared to the control, leading to longer timescales necessary to reach 50 % and 90 % of this area. While interesting, more work is needed to fully understand lateral mobility as a function of distance in experimental-, numerical-, and field-scale river deltas.
We note again that our non-riverine sediment proxy is a simple proxy simulating the effect of mass that accumulates in river deltas through non-riverine processes in the coastal zone. We adapt a model tying primary production in wetlands to elevation relative to mean high tide (Morris et al., 2002) and deposit the proxy material in situ as a function of delta-top elevation relative to sea level. Though we neglect the effects of vegetation on hydrodynamics, vegetation has been shown to increase sediment trapping, slow down overbank flow, and create channel confinement (Nardin and Edmonds, 2014; Beltrán-Burgos et al., 2023). We observe similar results here without an explicit stem density. For example, the amount of overbank flow decreased in the treatment compared to the control, the channels extended further into the basin in the treatment compared to the control, and the channel in-filling rate decreased in the treatment compared to the control. While it is clear that ecological changes can profoundly affect the coastal zone, these results stress that the presence of marshes or tidal flats in the coastal zones of deltas exert a fundamental control on the delta's channel dynamics.
4.2 Implications
Planned river diversions are a critical management strategy for river deltas threatened by sea level rise. New river channels will be formed, and their morphology and kinematics will determine sediment deposition and accumulation; thus, understanding the interaction of fluvial and non-fluvial sedimentation is important for successful river diversions. While the distribution of fluvial sediment is extremely important on short timescales in these scenarios, the movement of the channels will control the long-term success of these engineering strategies. Our study suggests that channel and floodplain aggradation rates depend on the non-fluvial sedimentation occurring in the system. For example, wetland aggradation appears to decrease the rate of maximum channel aggradation and amount of overbank flow, so it is important to incorporate this into management plans.
We also show that non-fluvial sedimentation in the low-lying region of the delta top changes the morphology of the channels and is the primary control of hydrodynamic backwater effects in this experimental setting. Wetlands are deteriorating in many coastal deltas worldwide (e.g., Couvillion et al., 2017; Morton et al., 2015; Kirwan et al., 2010; Reed, 1995). If marshes are no longer present in the deltaic system, then it is possible that the morphology of the entire delta and its channels will change. Thus, we suggest that channel sediment deposition in a field-scale delta without marshes may be influenced more by topographic flow expansions and morphodynamic backwater effects than the hydrodynamic backwater effects that currently dominate most global deltas.
Furthermore, river avulsions are potentially catastrophic for communities (e.g., Slingerland and Smith, 2004), which may lead to the eventual regulation of hydrodynamics (e.g., flood stages) to control the avulsion location and river slope break location in deltaic systems, similar to engineered avulsions based on river sedimentation proposed by Moodie and Nittrouer (2021). We show that the marsh platform and its floodplain deposition produce the slope break and subsequent “hydrodynamic” backwater effect without unsteady hydrodynamics; thus, controlling the hydrodynamics of rivers may not be necessary.
The addition of the marsh proxy in the experimental setting produced some surprising dynamics. The channel morphology of the two systems varies greatly. We show that the in situ accumulation of sediment in wetland platforms and tidal flats increases the trunk channel depth and number of distributary channels in deltaic systems, which allows the channels to extend further into the basin. This non-fluvial deposition decreases the tendency for unchannelized (overbank) flow in the floodplain, effectively concentrating flow to the channels. In turn, the channels deposit sediment more consistently along the channel length, significantly decreasing the channel aggradation peak near the shoreline that occurs in a control experiment and is characteristic of morphodynamic backwater effects. Importantly, the presence of non-fluvial sedimentation in the treatment experiment creates a long hydrodynamic backwater reach without inducing variable discharge. Even though we observe these very clear differences in the channel morphology, the basin-wide timescale of lateral channel movement remains similar because it is fundamentally controlled by compensation and mass balance. The non-fluvial (marsh) sedimentation proxy produces a channel morphology of the treatment experiment more akin to that observed in global deltas, and thus the treatment experiment can be used to better understand the kinematics and long-term suitability of planned river diversions, avulsions, and general management strategies.
Channel morphology and kinematics provide key insight into the life cycle and fate of a river delta (e.g., Edmonds et al., 2009). To determine the channel morphology and kinematics in an experimental river delta, binary channel maps are needed. We use a software called ImageJ to hand map the channels in the experiments, as it retains basin coordinates. First, we load the RGB (red, green, and blue) image (collected every hour from the wet lidar scans) into the software (Fig. A1a) and then use the freehand selection tool to trace the outline of the channel map (Fig. A1b). Once the entire channel has been mapped, we export the channel map as a binary TIFF file (Edit → Selection → Create Mask). We use the resulting channel maps (Fig. A1c) to analyze the various properties and kinematics of both the control and treatment experiments. The control experiment channels were mapped by Ripul Dutt, and the treatment experiment channels were mapped by Kelly Sanks.
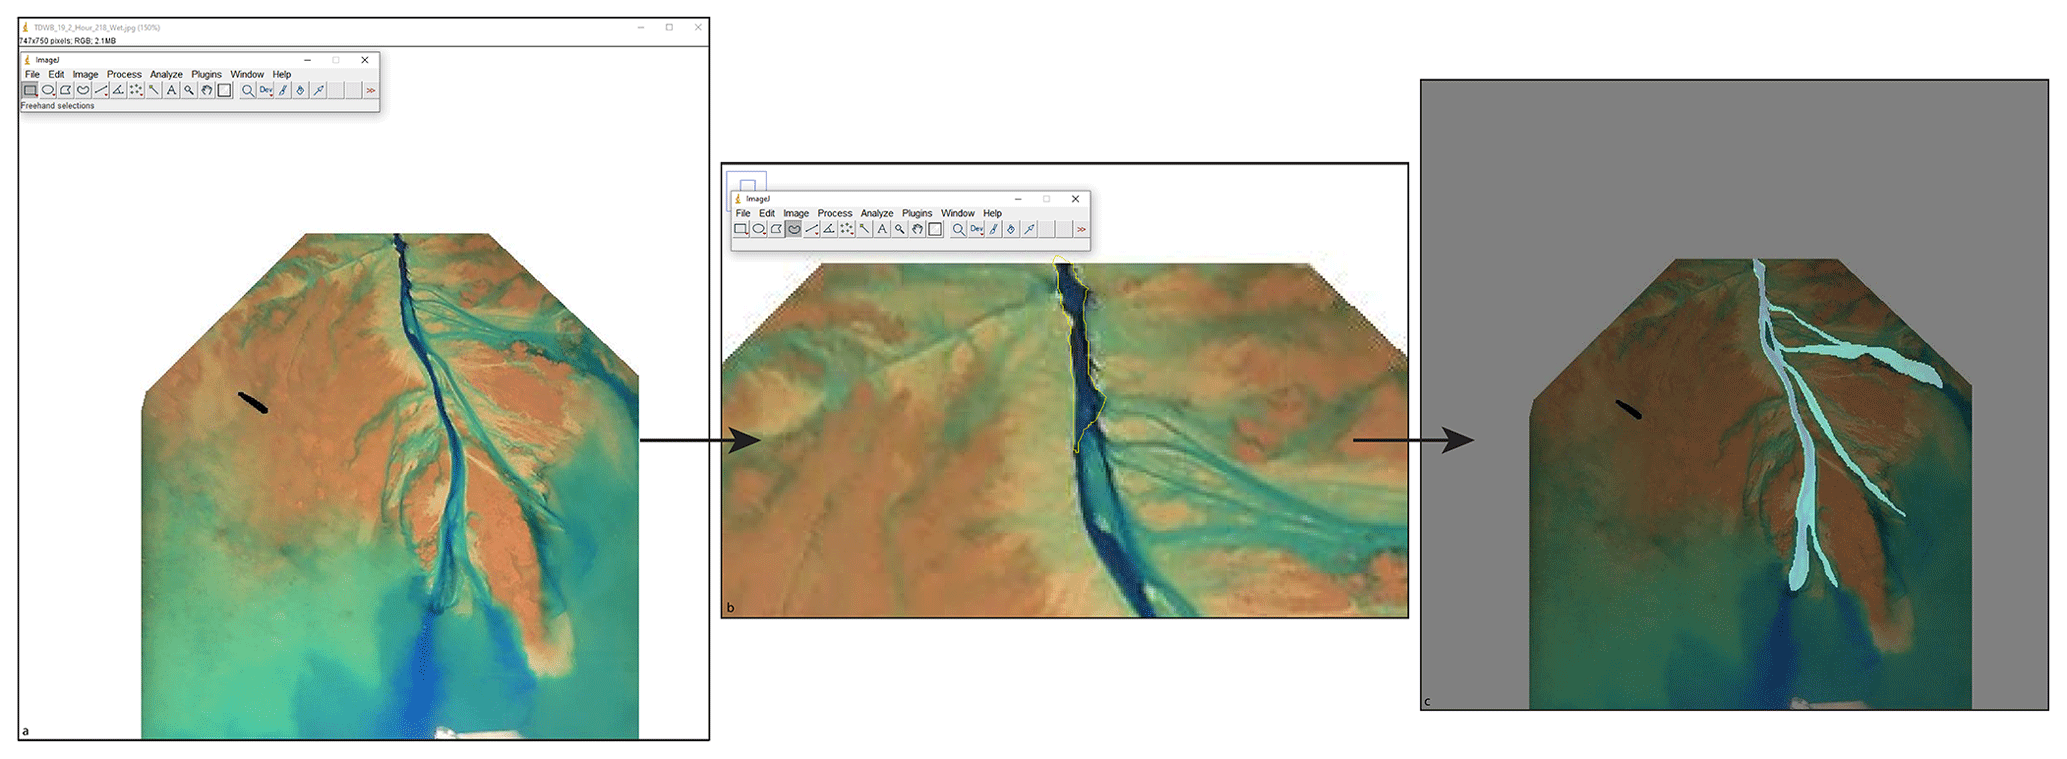
Figure A1(a) An RGB image from hour 218 of the treatment experiment loaded into ImageJ. Note that the image size is 750×747 in the top-right corner, which shows the pixel dimensions of the lidar scans from the treatment experiment. (b) The yellow outline around the beginning of the channel illustrates one portion of channel map created using the freehand selection tool. The polygons were created by zooming into the channel and creating a polygon around the channel. (c) The resulting channel map overlain on the RGB image for hour 218 of the treatment experiment.
We use pland as the delta area for most channel metric calculations, which describes the delta area that is above sea level for at least 50 % of the experiment. This area is smaller in the treatment experiment (∼ 2.0 m2) than the control (∼ 2.2 m2), but the size and locations at which the delta is above sea level in the treatment experiment are more variable (Fig. B1).
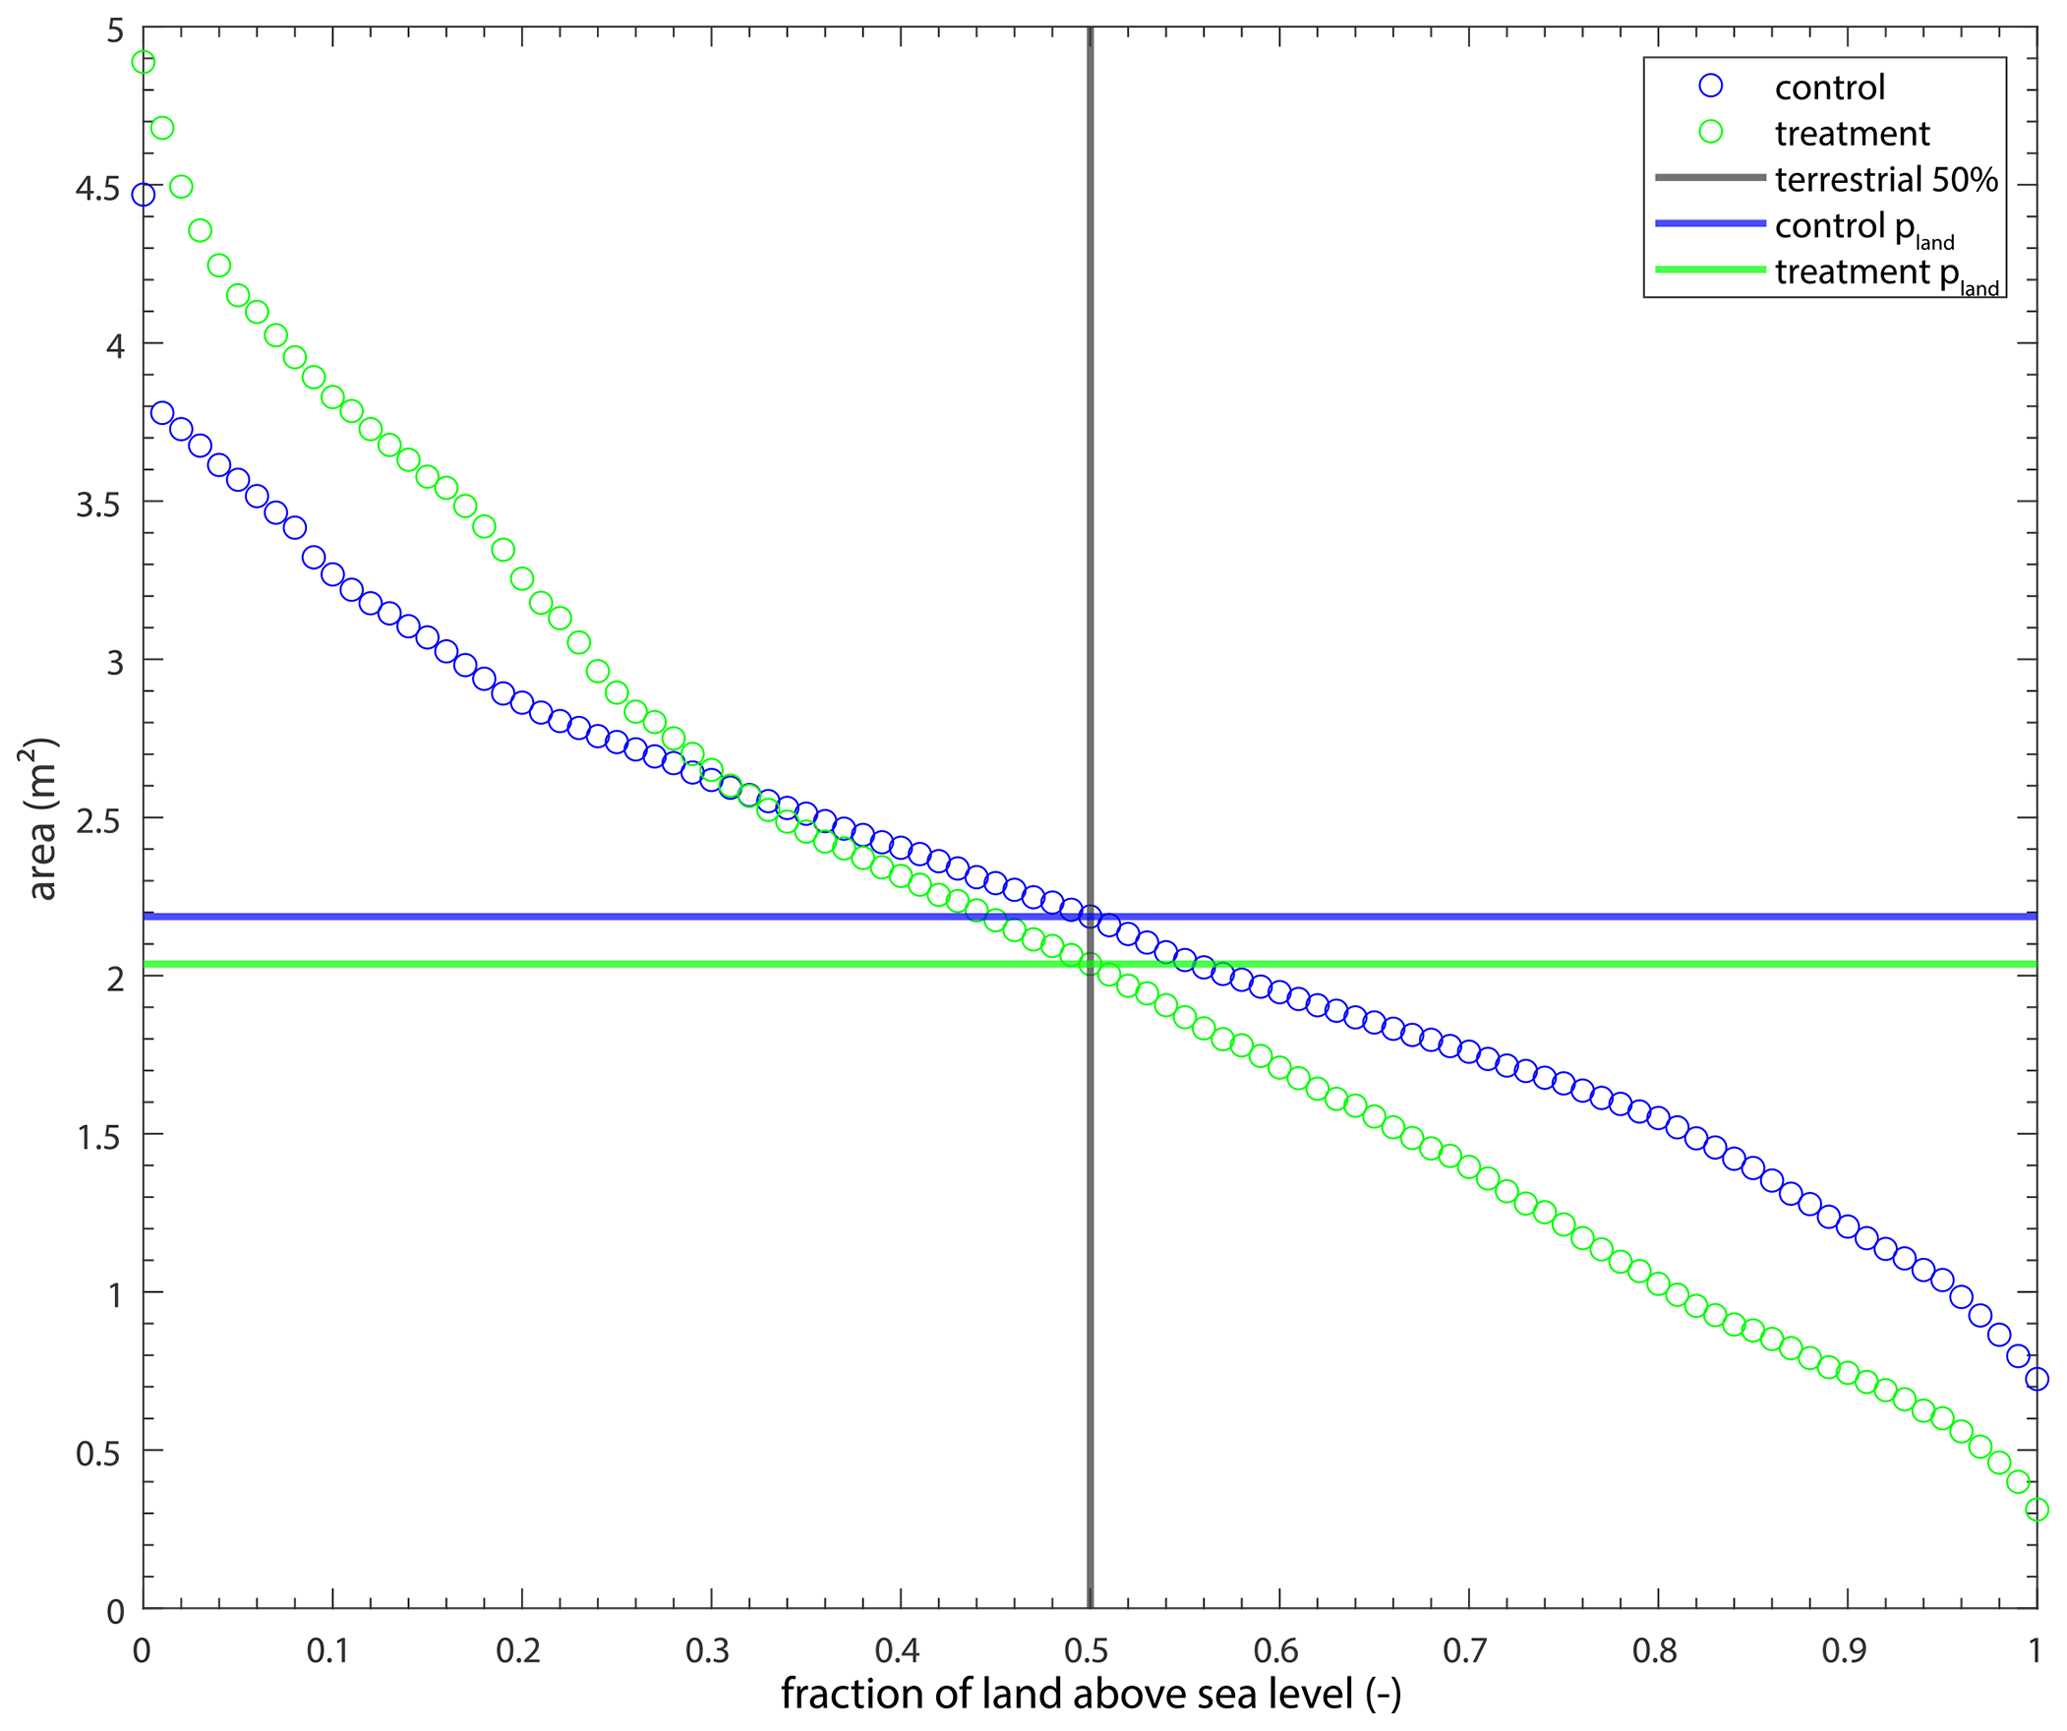
Figure B1The area of land that is above sea level for various amounts of time for the experiments. The intersection of the black and blue line indicates the area of land (2.2 m2) that was above sea level for at least 50 % of the control experiment (pland). Similarly, the intersection of the black and green line indicates pland (2.0 m2) for the treatment experiment.
The lateral mobility and modification timescales come from the exponential decay function that describe how quickly the delta top (pland) is visited by channels and how quickly the delta top accumulates sediment (Fig. B2). See Table 1 and Fig. 7a and b for the lateral mobility and modification in linear space.
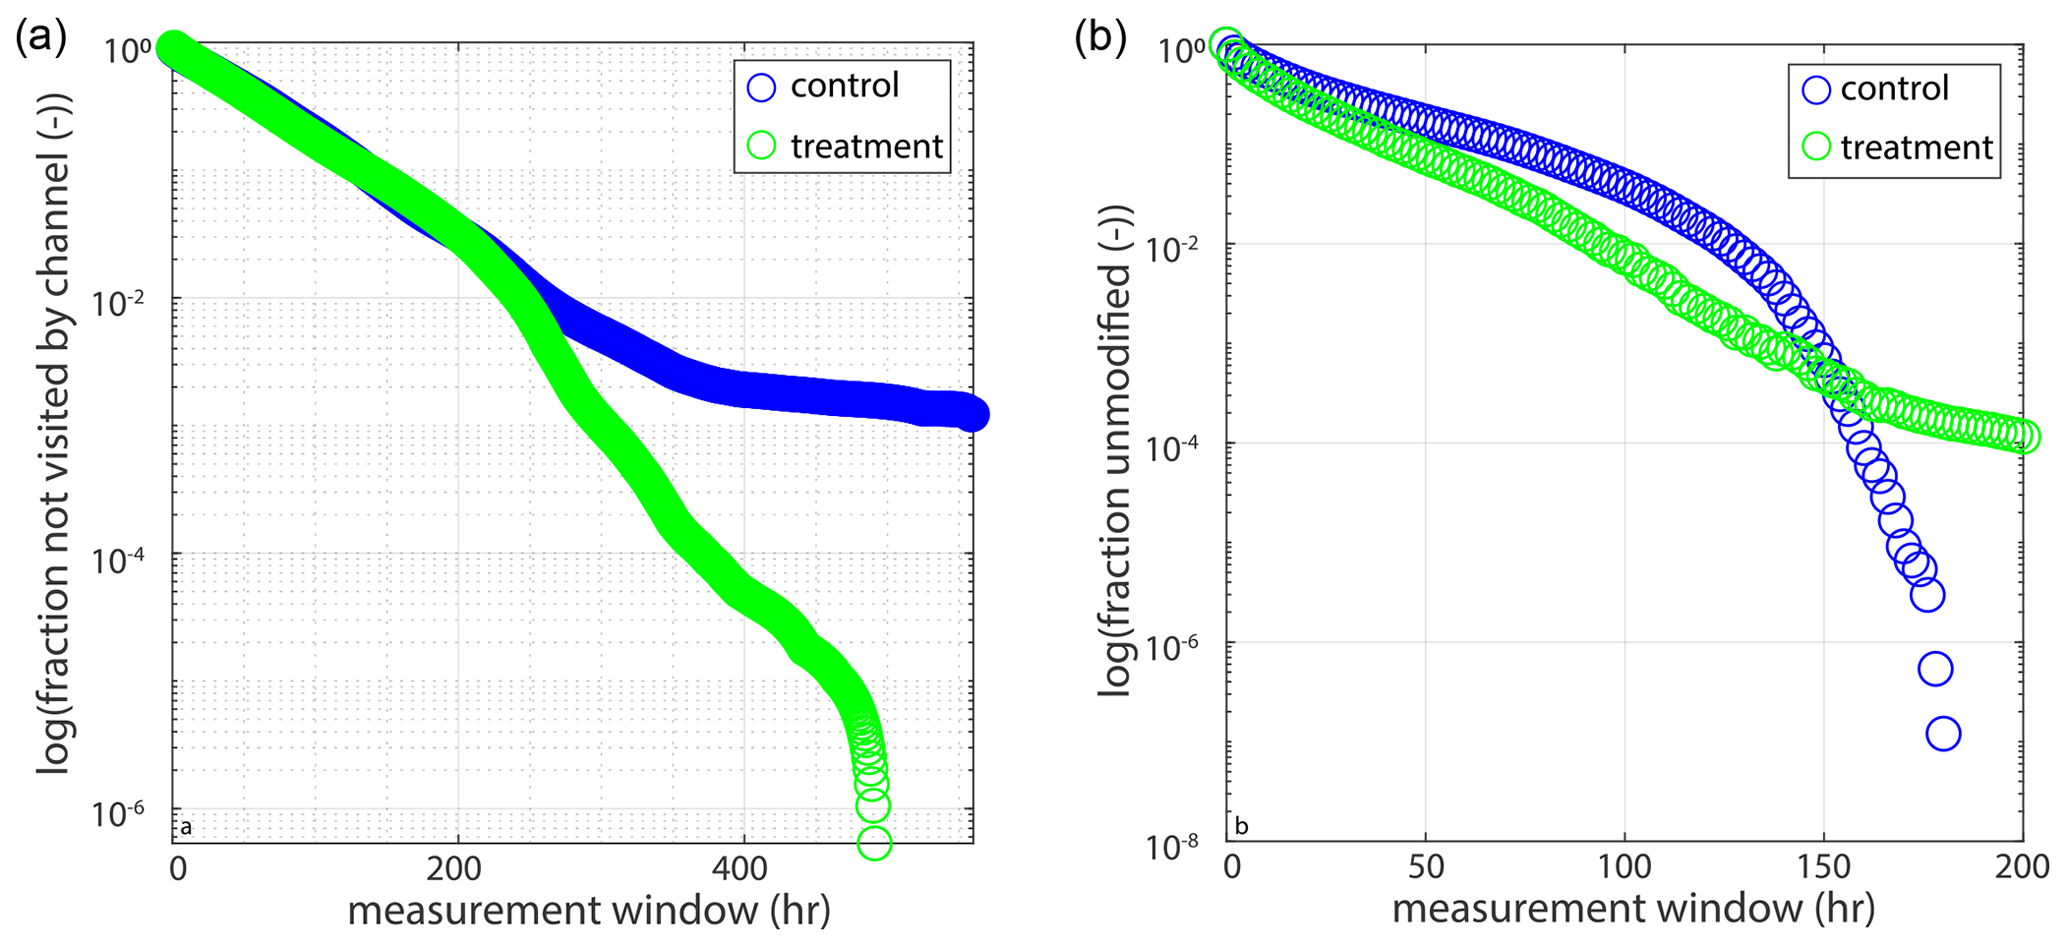
Figure B2(a) Fraction of the delta that has not been visited by a channel versus the measurement window in semilogy space (see Fig. 7a for linear space). (b) Fraction of the delta that has not accumulated at least 1 mm of sediment versus measurement window in semilogy space (see Fig. 7b for linear space).
We discuss two different channel movement styles in the results. These are the topographic flow expansions associated with a morphodynamic backwater and lateral movement associated with channel mouth extension and a hydrodynamic backwater. Topographic flow expansions are characterized by the mouth of the channel becoming unchannelized sheet flow over the entire depositional lobe (Sittoni et al., 2014). The control experiment is mostly characterized by topographic flow expansions, which lead to channel avulsions, likely because the channel beds are super elevated above relative sea level (Fig. B3). We see that the topographic flow expansions, which happen often in the control experiment and sometimes in the treatment experiment, are characterized by the formation of a main channel with some distributary flow. The distributary flow then begins to expand over the entire mouth bar (sheet flow), causing the main channel to recede, and the main channel begins to look for a new path at the final point of recession (avulsion location).
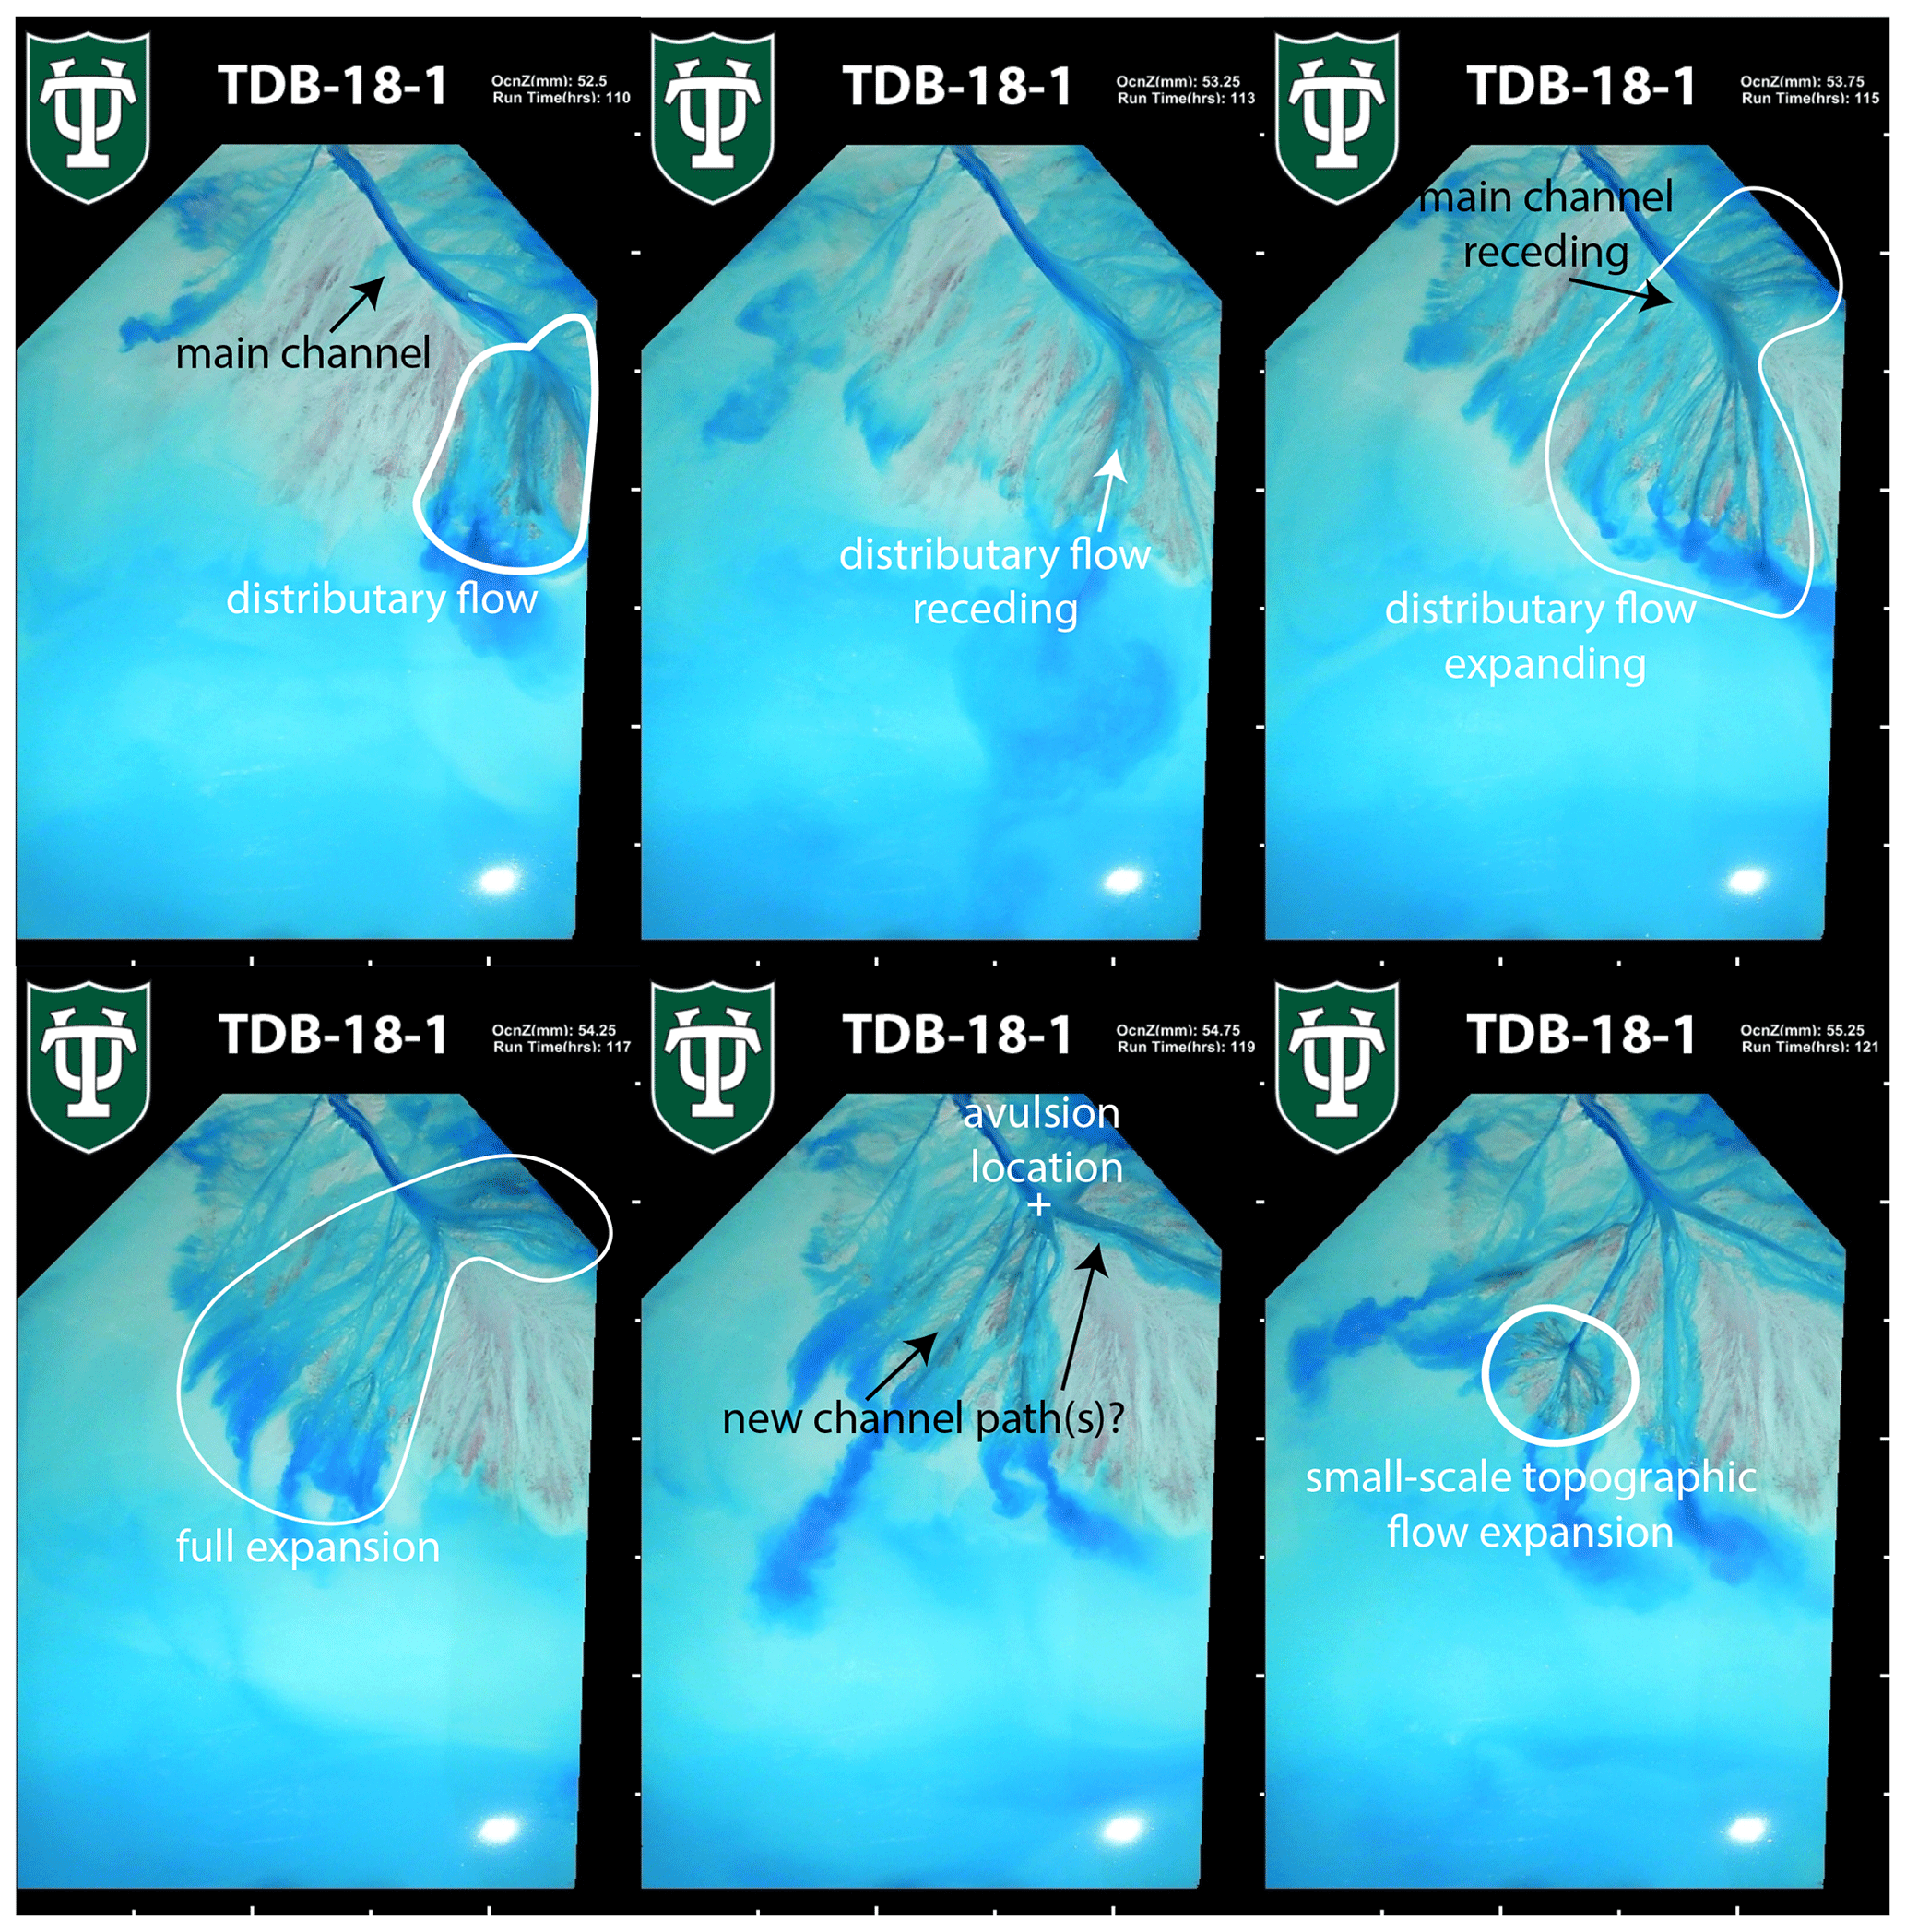
Figure B3Topographic flow expansion from the control experiment displayed in hours 110, 113, 115, 117, 119, and 121. In this instance, it takes 11 h for the topographic flow expansion to occur.
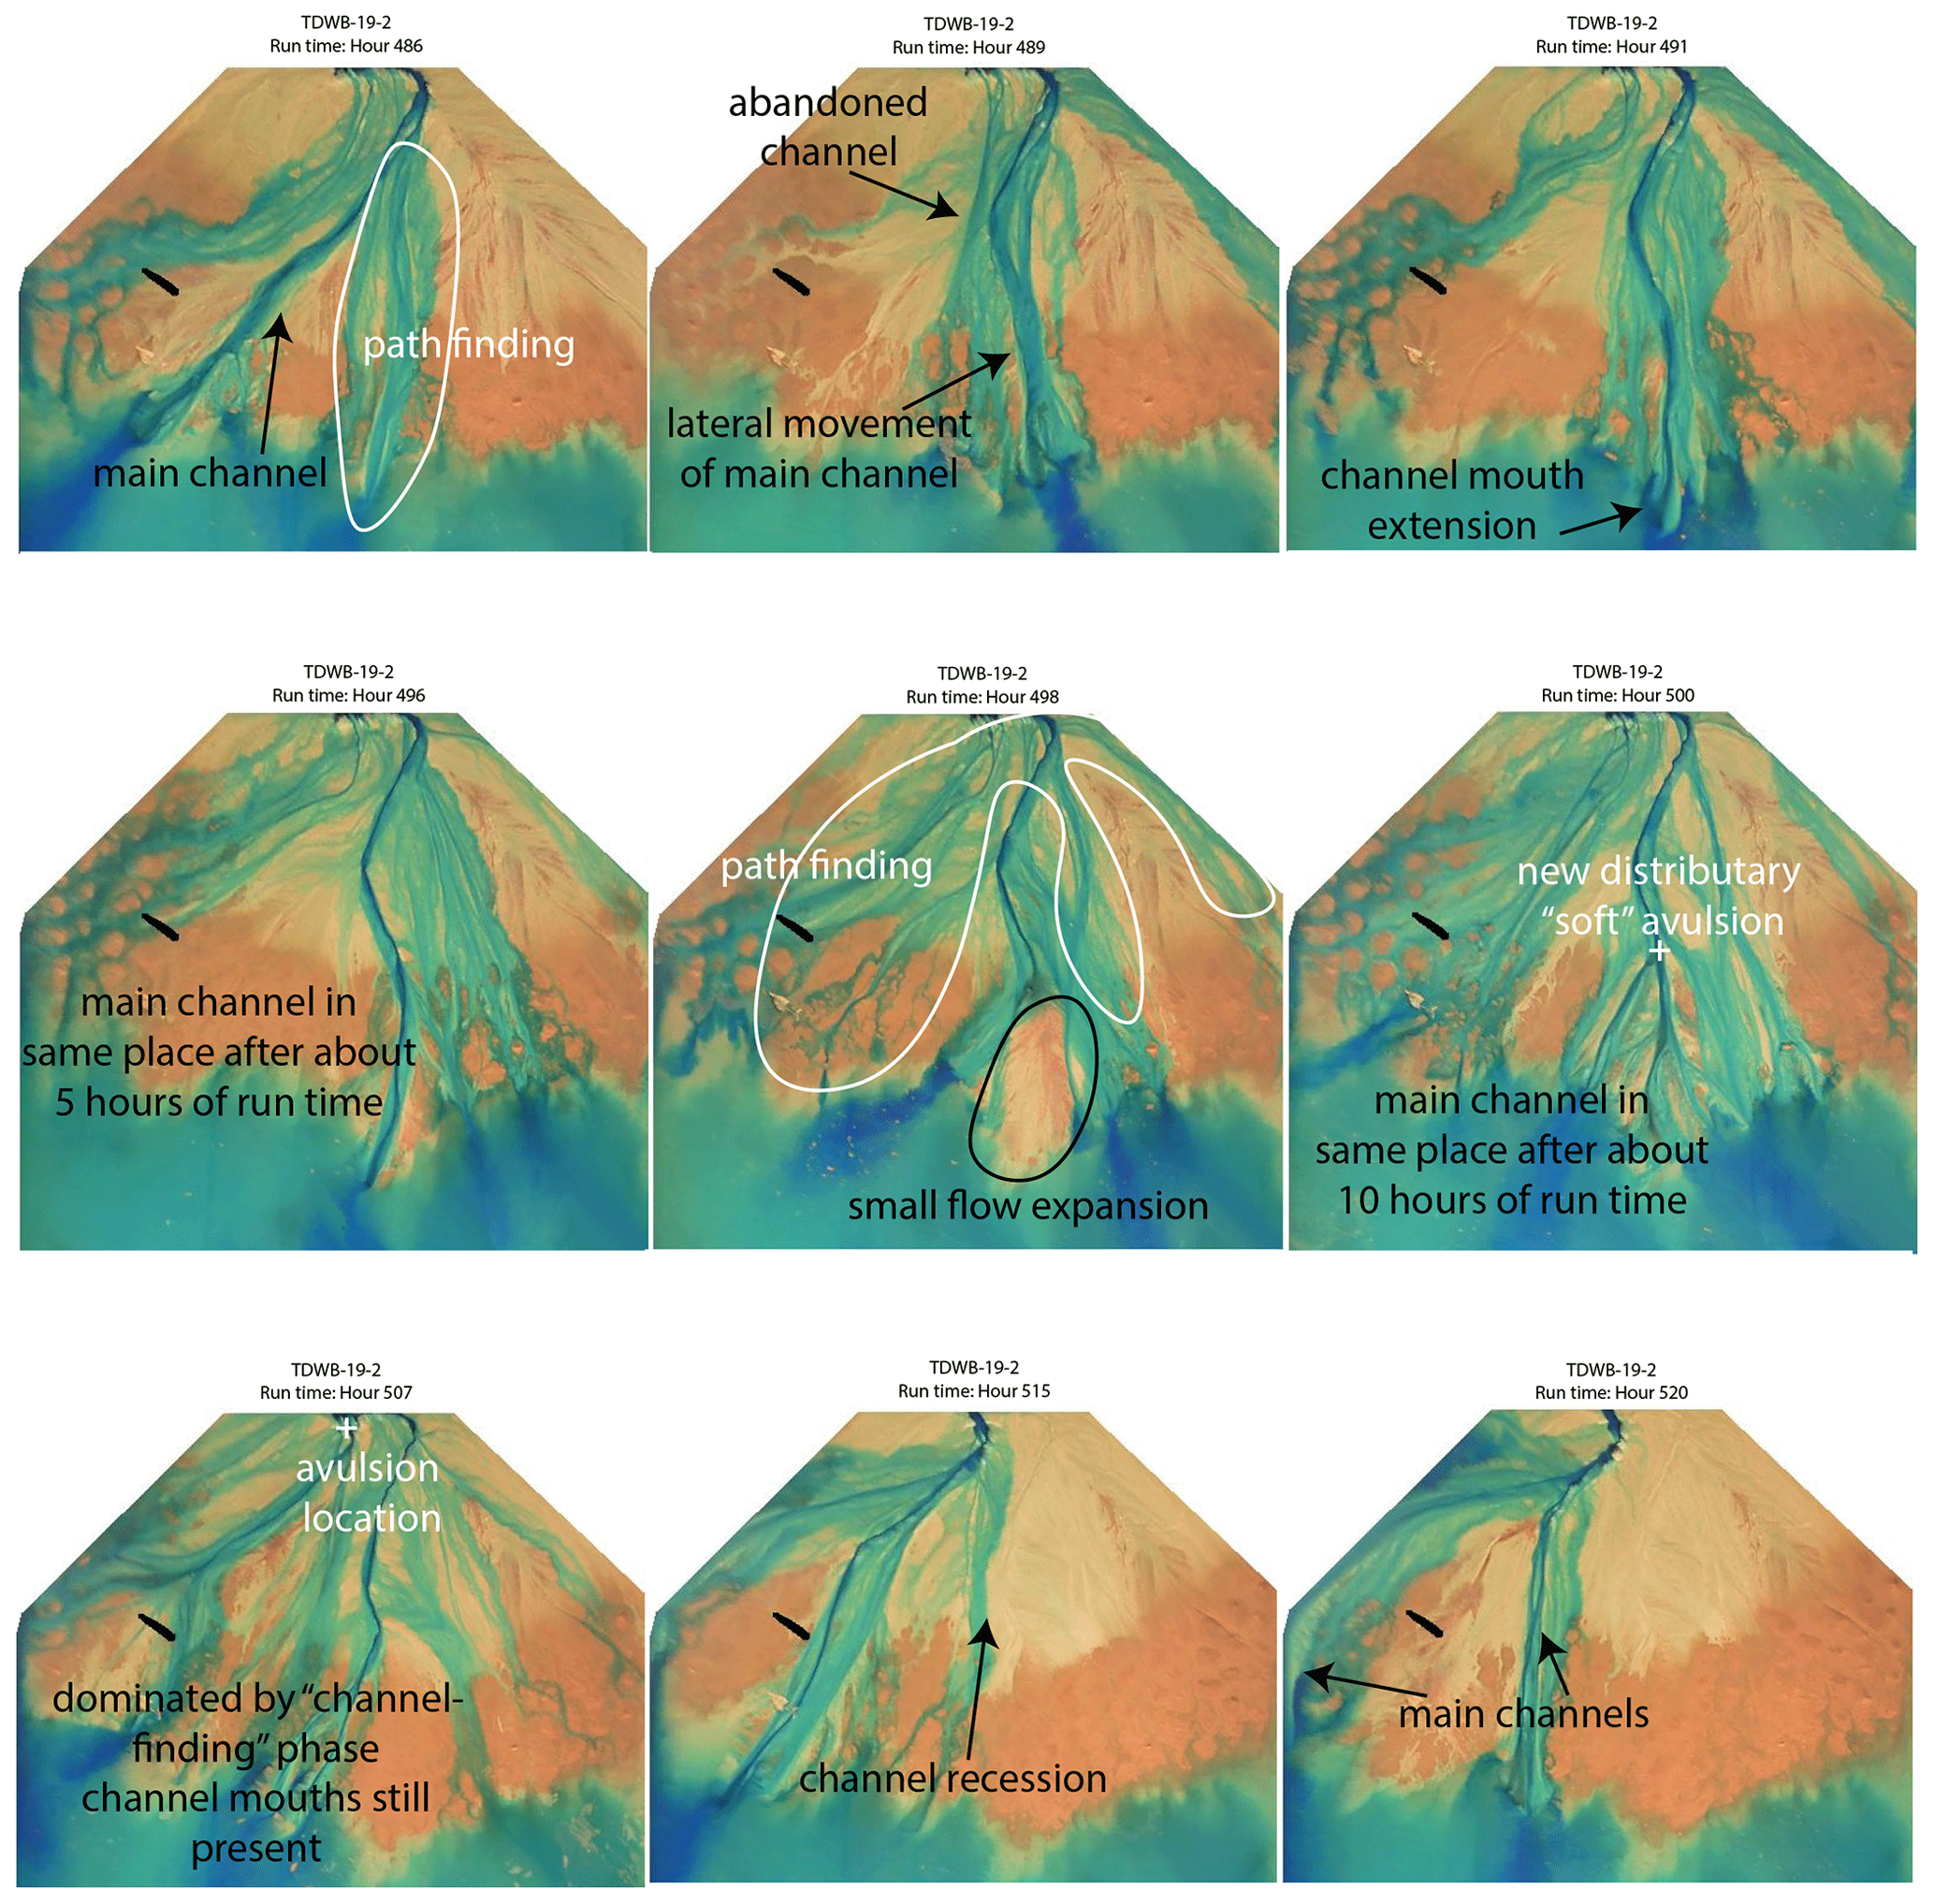
Figure B4Channel mouth bar formation and lateral switching from the treatment experiment displayed in hours 486, 489, 491, 496, 498, 500, 507, 515, and 520. In this example, it takes about 34 h for lateral movement of main channel.
While the treatment experiment does have topographic flow expansions, the channel movement is mostly characterized by the formation of long-lasting channel mouth bars and lateral switching of the channel paths (Fig. B4). We see the formation of a main channel, which occurred due to channel path finding and then lateral movement of the main channel to the new channel location. Upon the initiation of the main channel, it begins to extend further into the basin and past the mean shoreline and, in this example, stays in place for about 10 h. During this time, smaller channels form on the delta top in the “path-finding” phase. A small topographic flow expansion leads to the formation of two distributary channels over the mouth bar (not sheet flow like in the control), but ultimately, the real avulsion takes place near the entrance channel, where the main channel switches laterally, and the old channel is abandoned almost immediately. This process takes longer than the topographic flow expansion, but because of the path-finding phase, much of the delta is visited during this time (even though the main channel stays the same).
We look at the following channel kinematic metrics: lateral mobility (Li et al., 2017) and fraction of the delta unmodified (Li et al., 2017). We present the findings for the lateral mobility and fraction unmodified in Sect. 3. However, we describe three more channel movement metrics here. This includes the planform overlap metric (Wickert et al., 2013), the number of times a specific location (pixel) on the delta top was channelized, and the longest consecutive channelization for each pixel on the delta top.
We use the planform overlap as a check for the lateral mobility of the two systems (treatment and control). The planform overlap is similar to lateral mobility, as it is another commonly used proxy for the avulsion timescale in experimental settings (Wickert et al., 2013). The planform overlap is calculated by determining the time it takes for the channel maps to decorrelate from each other. To calculate this, we first calculate the number of changed pixels (channelized to unchannelized or unchannelized to channelized) for each time step (all 1 h time steps, all 2 h time steps, etc.). We see that there are fewer channel pixels changed in the treatment experiment (Fig. B5a). Following methods from Wickert et al. (2013), we scale the number of changed pixels by the number of pixels that would change via random scatter, which gives us ϕ (phi; Fig. B5b). We again see that there are fewer changed pixels in the treatment versus the control. We use this change to then determine essentially how long it takes for channel maps to decorrelate from each other. However, we see that the planform overlap tappers off at roughly the same time in both the control and treatment experiments. The planform overlap exhibits the same exponential decay trend shown by the lateral mobility metrics we used. Thus, we conclude that the lateral mobility of the two systems is similar (Fig. B5c).
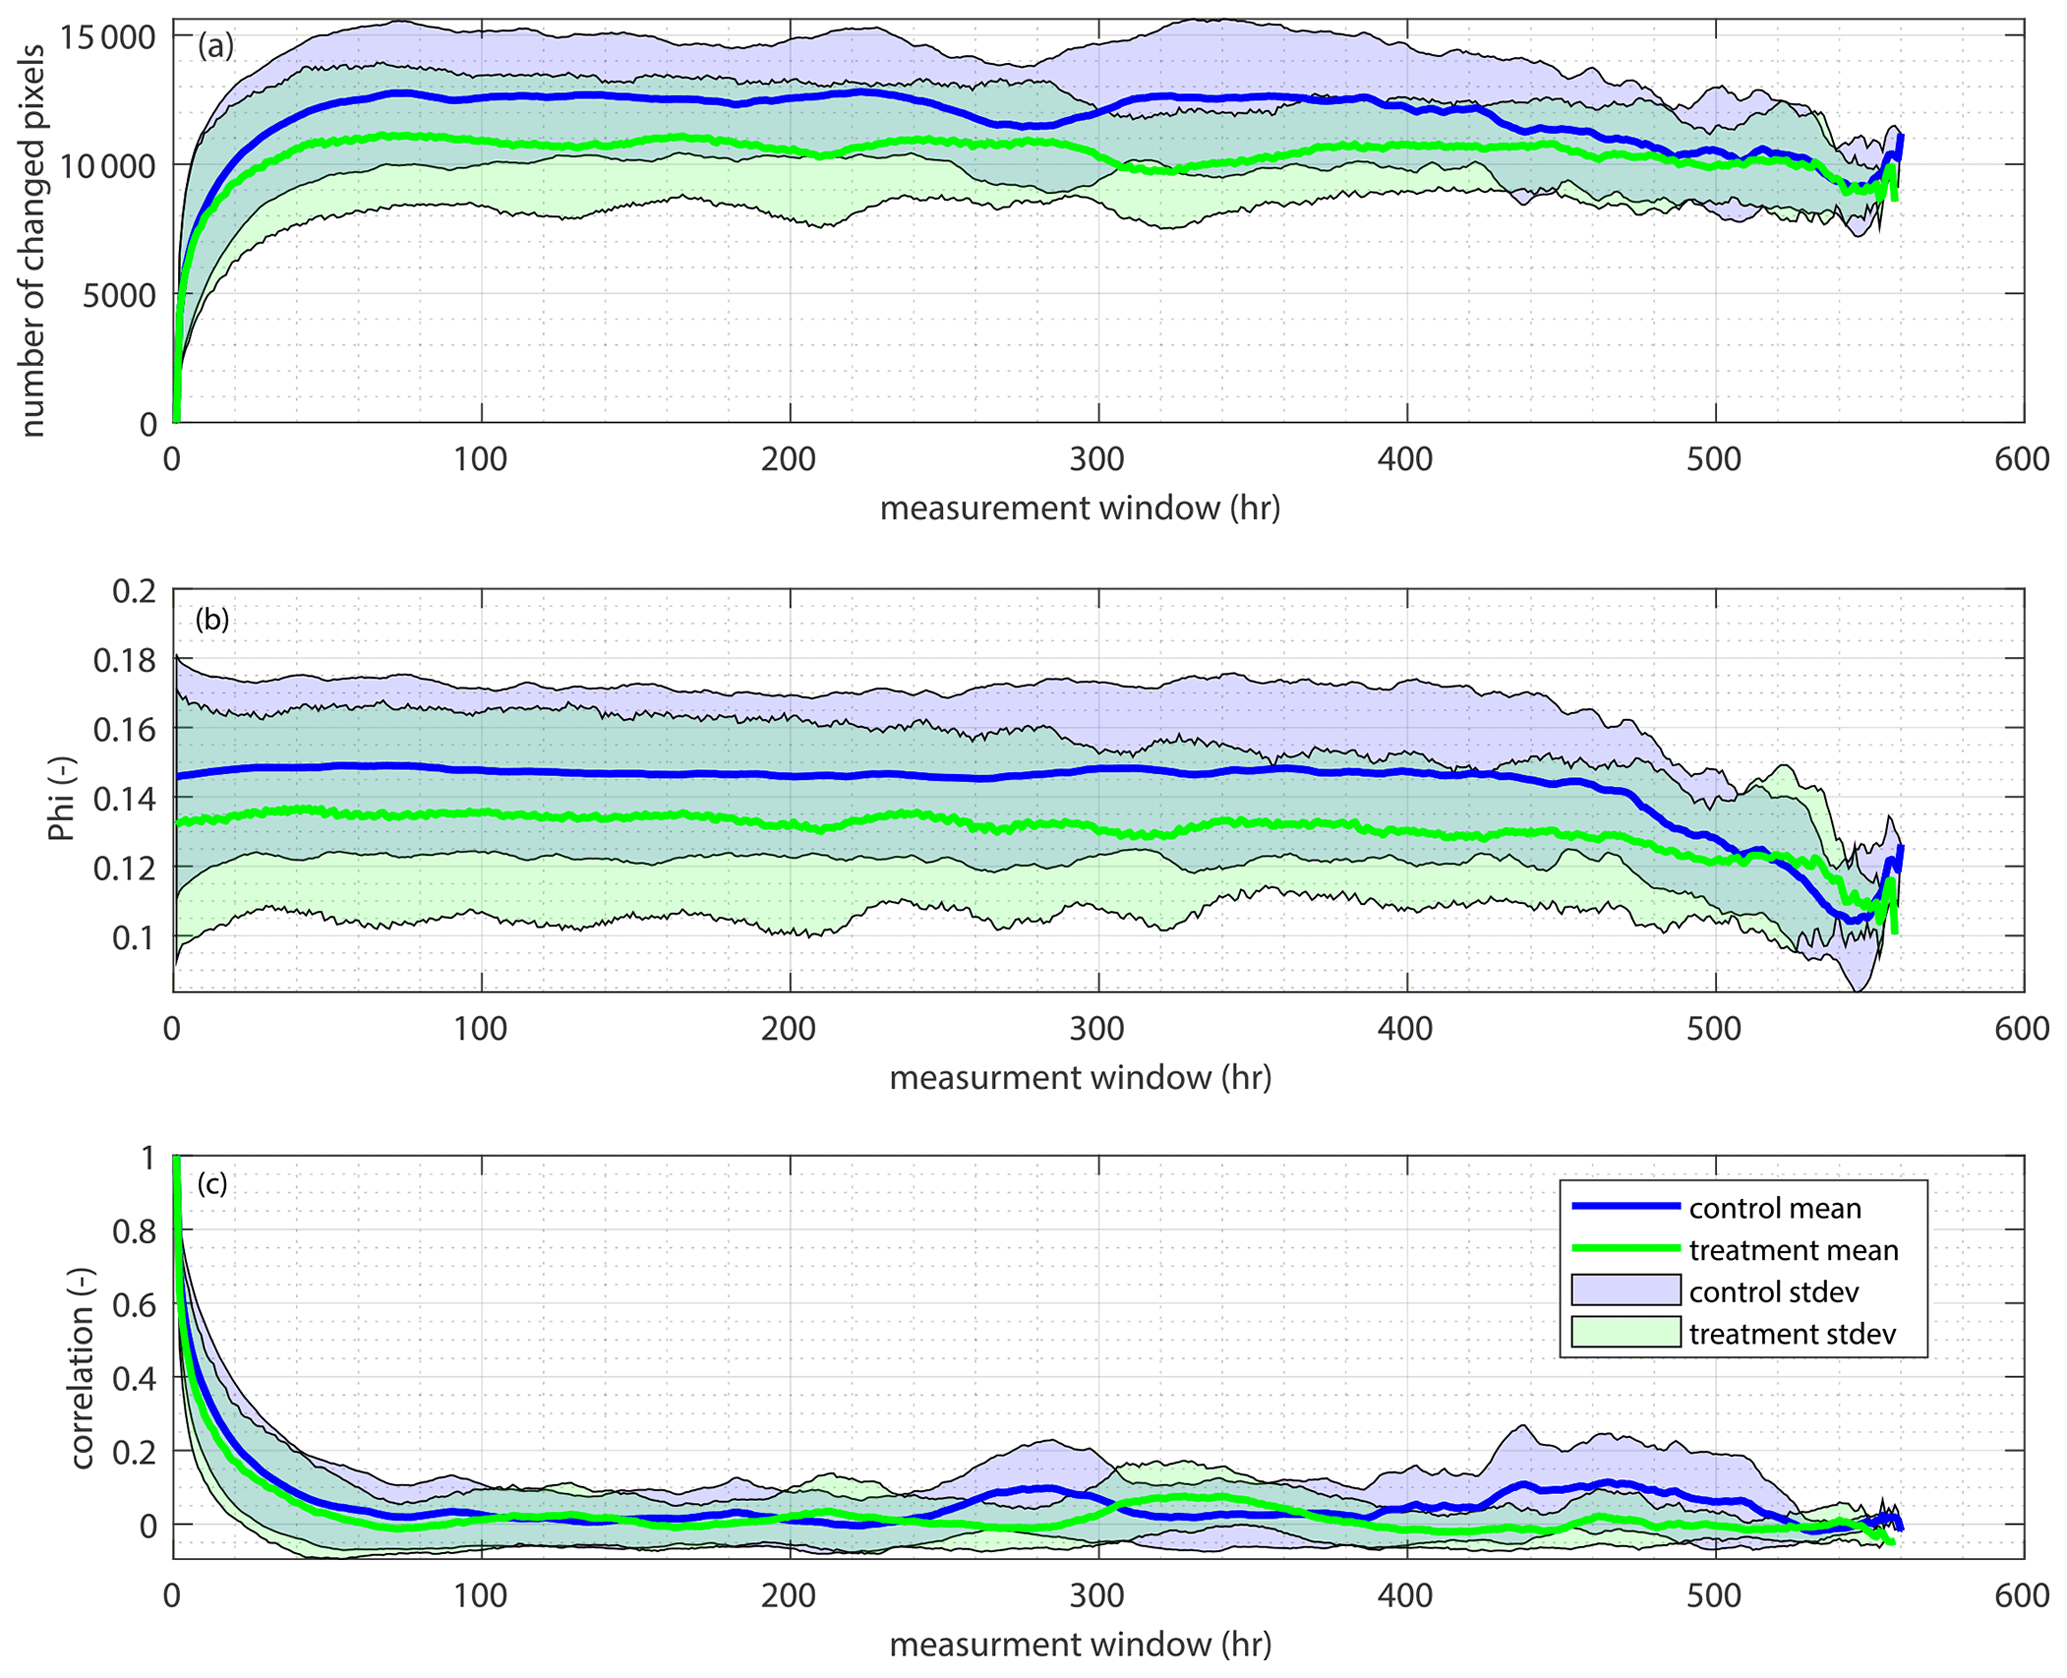
Figure B5Channel planform change. (a) The mean number of changed channel pixels (y) for various time steps (x) for the control (blue) and treatment (green). The standard deviation is shown as the light blue (control) and light green (treatment) polygons around the mean. (b) The mean number of changed pixels scaled by the number of changed pixels produced via random scatter for the control (blue) and treatment (green). The standard deviation about the mean is shown in light blue for the control and light green for the treatment. (c) The mean time it takes for the channel maps to decorrelate from each other for various time steps for both the control (blue) and treatment (green). The standard deviation about the mean is shown as the light blue (control) and light green (treatment) polygons.
While the lateral mobility timescales do not differ, we do see some subtle differences in channel mobility between the two experiments (Fig. B6). We see that there are more areas on the delta top in the treatment experiment that are rarely visited by a channel, which can be seen by the presence of more dark blue (less visited) areas on the delta top in Fig. B6b (treatment) than in Fig. B6a (control). This is supported by the probability distribution of the amount of time that each pixel was visited by a channel for the control and treatment experiments (Fig. B6c). The median time a pixel in the control experiment is visited by a channel is 37 h, but it is slightly shorter in the treatment experiment at 32 h. Furthermore, we see that more pixels are rarely visited by a channel in the treatment experiment than the control. This suggests that the treatment channels may have some amount of preferential flow (i.e., channels are more likely to reoccupy areas they have already visited), or that there is decreased lateral channel mobility combined with the efficient sweeping of the channels (supported by the longer channel in-filling timescale in the treatment), even though there is not a decrease in the time it takes the channels to move across the delta top over the delta's life cycle. We also observe a decrease in the channel mobility timescale in the treatment experiment due to the presence of a long-lasting channel at the beginning of the experiment (Fig. B8). It is possible that the long-lasting channel at the beginning of the treatment experiment impacted the average lateral mobility timescale, as the channels had to speed up to fill in the accommodation created by RSLRb.
There is also no clear difference in the amount of consecutive time that channels occupied a specific area (Fig. B7a and b). The main distinction is that channels were able to consecutively occupy an area further from the entrance channel in the treatment experiment than the control experiment. When normalized by the total amount of time a channel occupied that pixel, we again show no significant difference. This normalization shows us that the channel tips tend to be only occupied once, whereas areas near the entrance tend to be occupied many different times (Fig. B7c and d). Finally, we see that a similar pattern emerges in the probability distribution of consecutive channelization (hours; Fig. B7e) compared to total channelization (hours) at a pixel (Fig. B6c). There is more area that is not visited by a channel often in the treatment experiment than the control but roughly the same amount of area visited by a channel for 50 consecutive hours or more (control = ∼ 3800 pixels and treatment = ∼ 3000 pixels; area not shown in Fig. B7e).
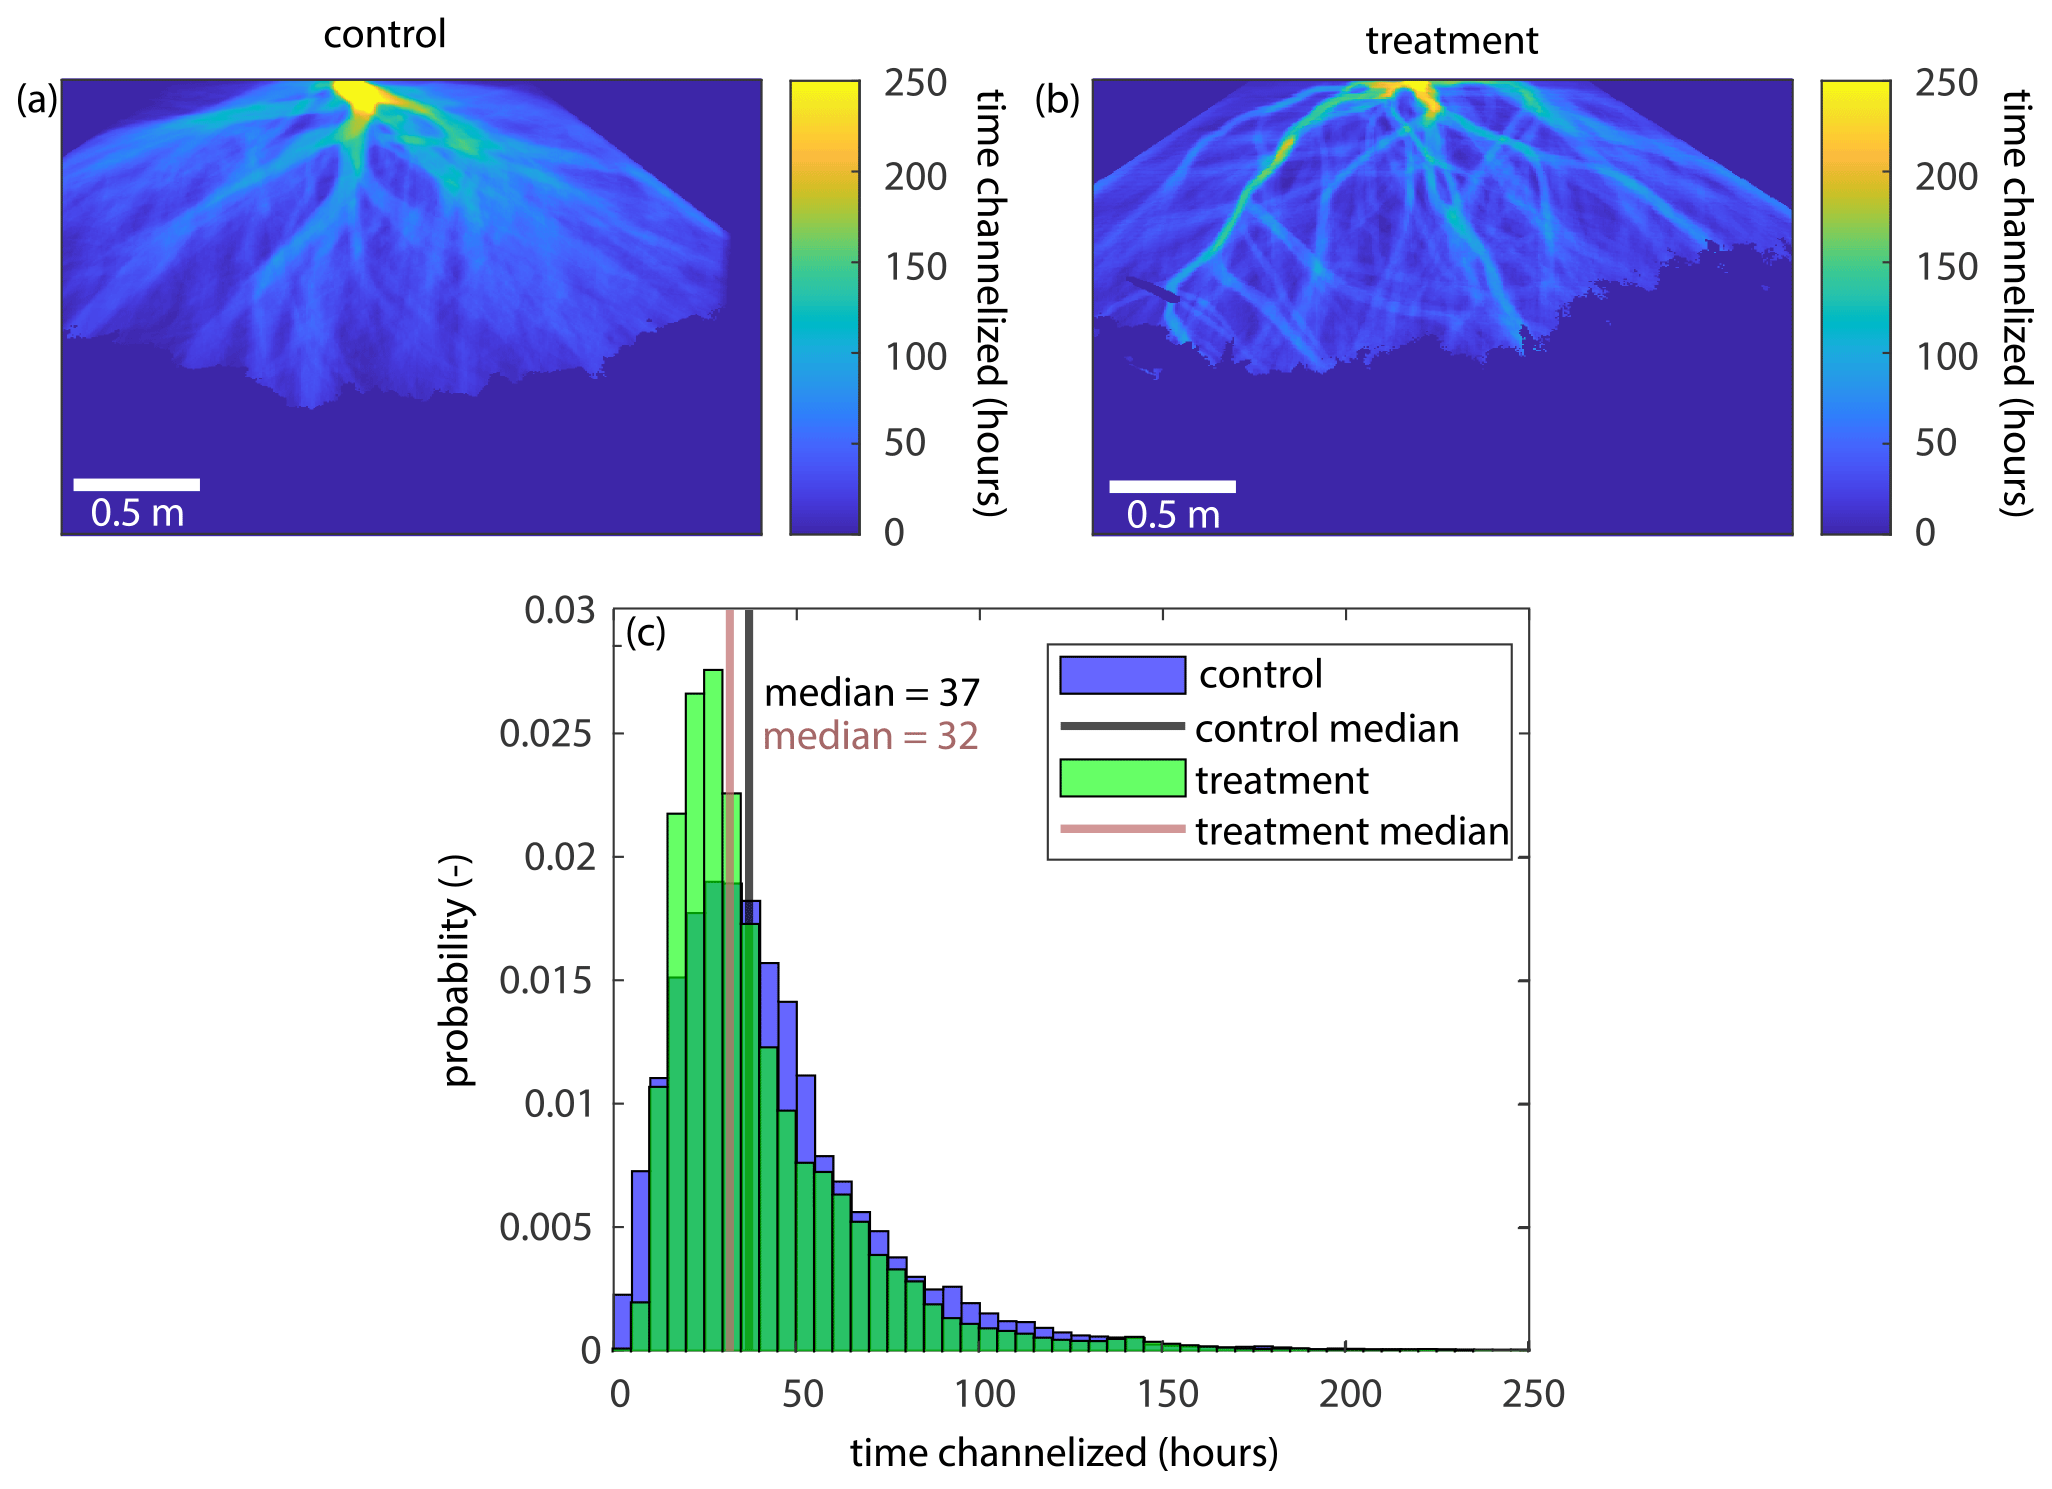
Figure B6The time that each pixel in pland is occupied by a channel. (a, b) The time that each pixel in the control (a) and treatment (b) experiments is occupied by a channel. (c) Probability distribution showing the time each pixel is visited by a channel for the control (blue) and treatment (green) experiments.
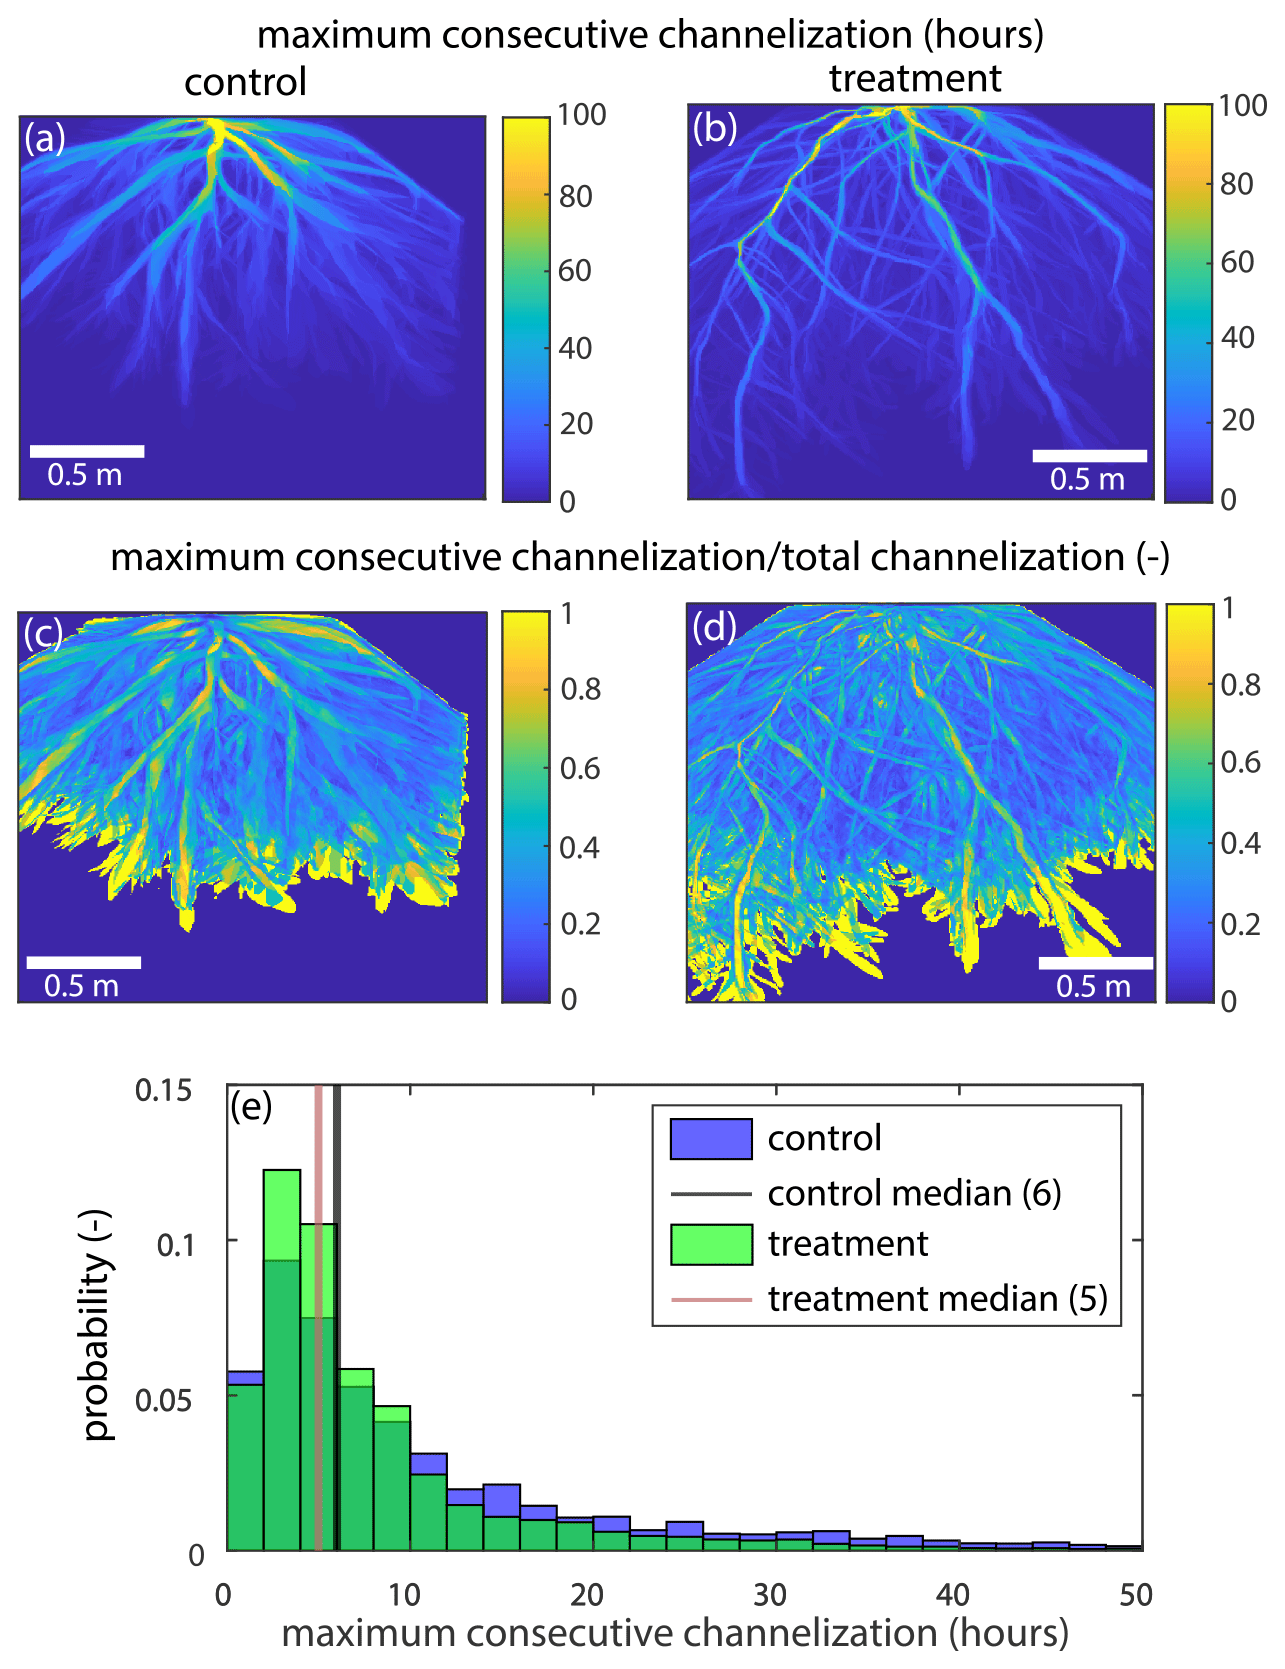
Figure B7(a, b) The maximum amount of time each pixel in the (a) control and (b) treatment experiments was consecutively channelized (hours) for the entire channelized portion of the delta top. (c, d) The maximum amount of time each pixel in the control experiment was consecutively channelized (hours) divided by the total time each pixel was channelized in the (c) control and (d) treatment for the entire channelized portion of the delta top. (e) The probability distribution for the maximum consecutive time channelized (hours) for the control (blue) and treatment (green).
Last, we determine the time it takes to approach one e-folding reduction in non-channelized area from each run hour. The average fraction of the unchannelized area on the terrestrial delta in the control experiment is ∼ 0.91 (). To obtain the e-folding reduction, we divide the unchannelized fraction by e (2.71828), which is ∼ 0.34. Thus, we calculate the time it takes for channels to visit 66 % (1–0.34) of the control pland. Similarly, the fraction of unchannelized area in the treatment experiment is ∼ 0.89. When reducing by an e-fold, we obtain 0.33, so we calculate the time it takes for channels to visit 67 % of the treatment pland. We do this in order to normalize the channel visitation for differences in the channel and delta area in the control and treatment experiments. We see that the control experiment oscillates between about 50 and 100 h. Interestingly, the first ∼ 200 h of the treatment experiment have very slow channel mobility (e.g., taking between 80 and 150 h to visit 67 % of the pland), but the last ∼ 300 h have very fast lateral channel mobility (e.g., taking between 20 and 60 h to visit 67 % of the pland; Fig. B8). We see that the long-lasting channel(s) at the beginning of the treatment experiment significantly impacted the channel mobility in the second half of the experiment, potentially speeding up the channel motion, so that the delta top could stay in equilibrium.
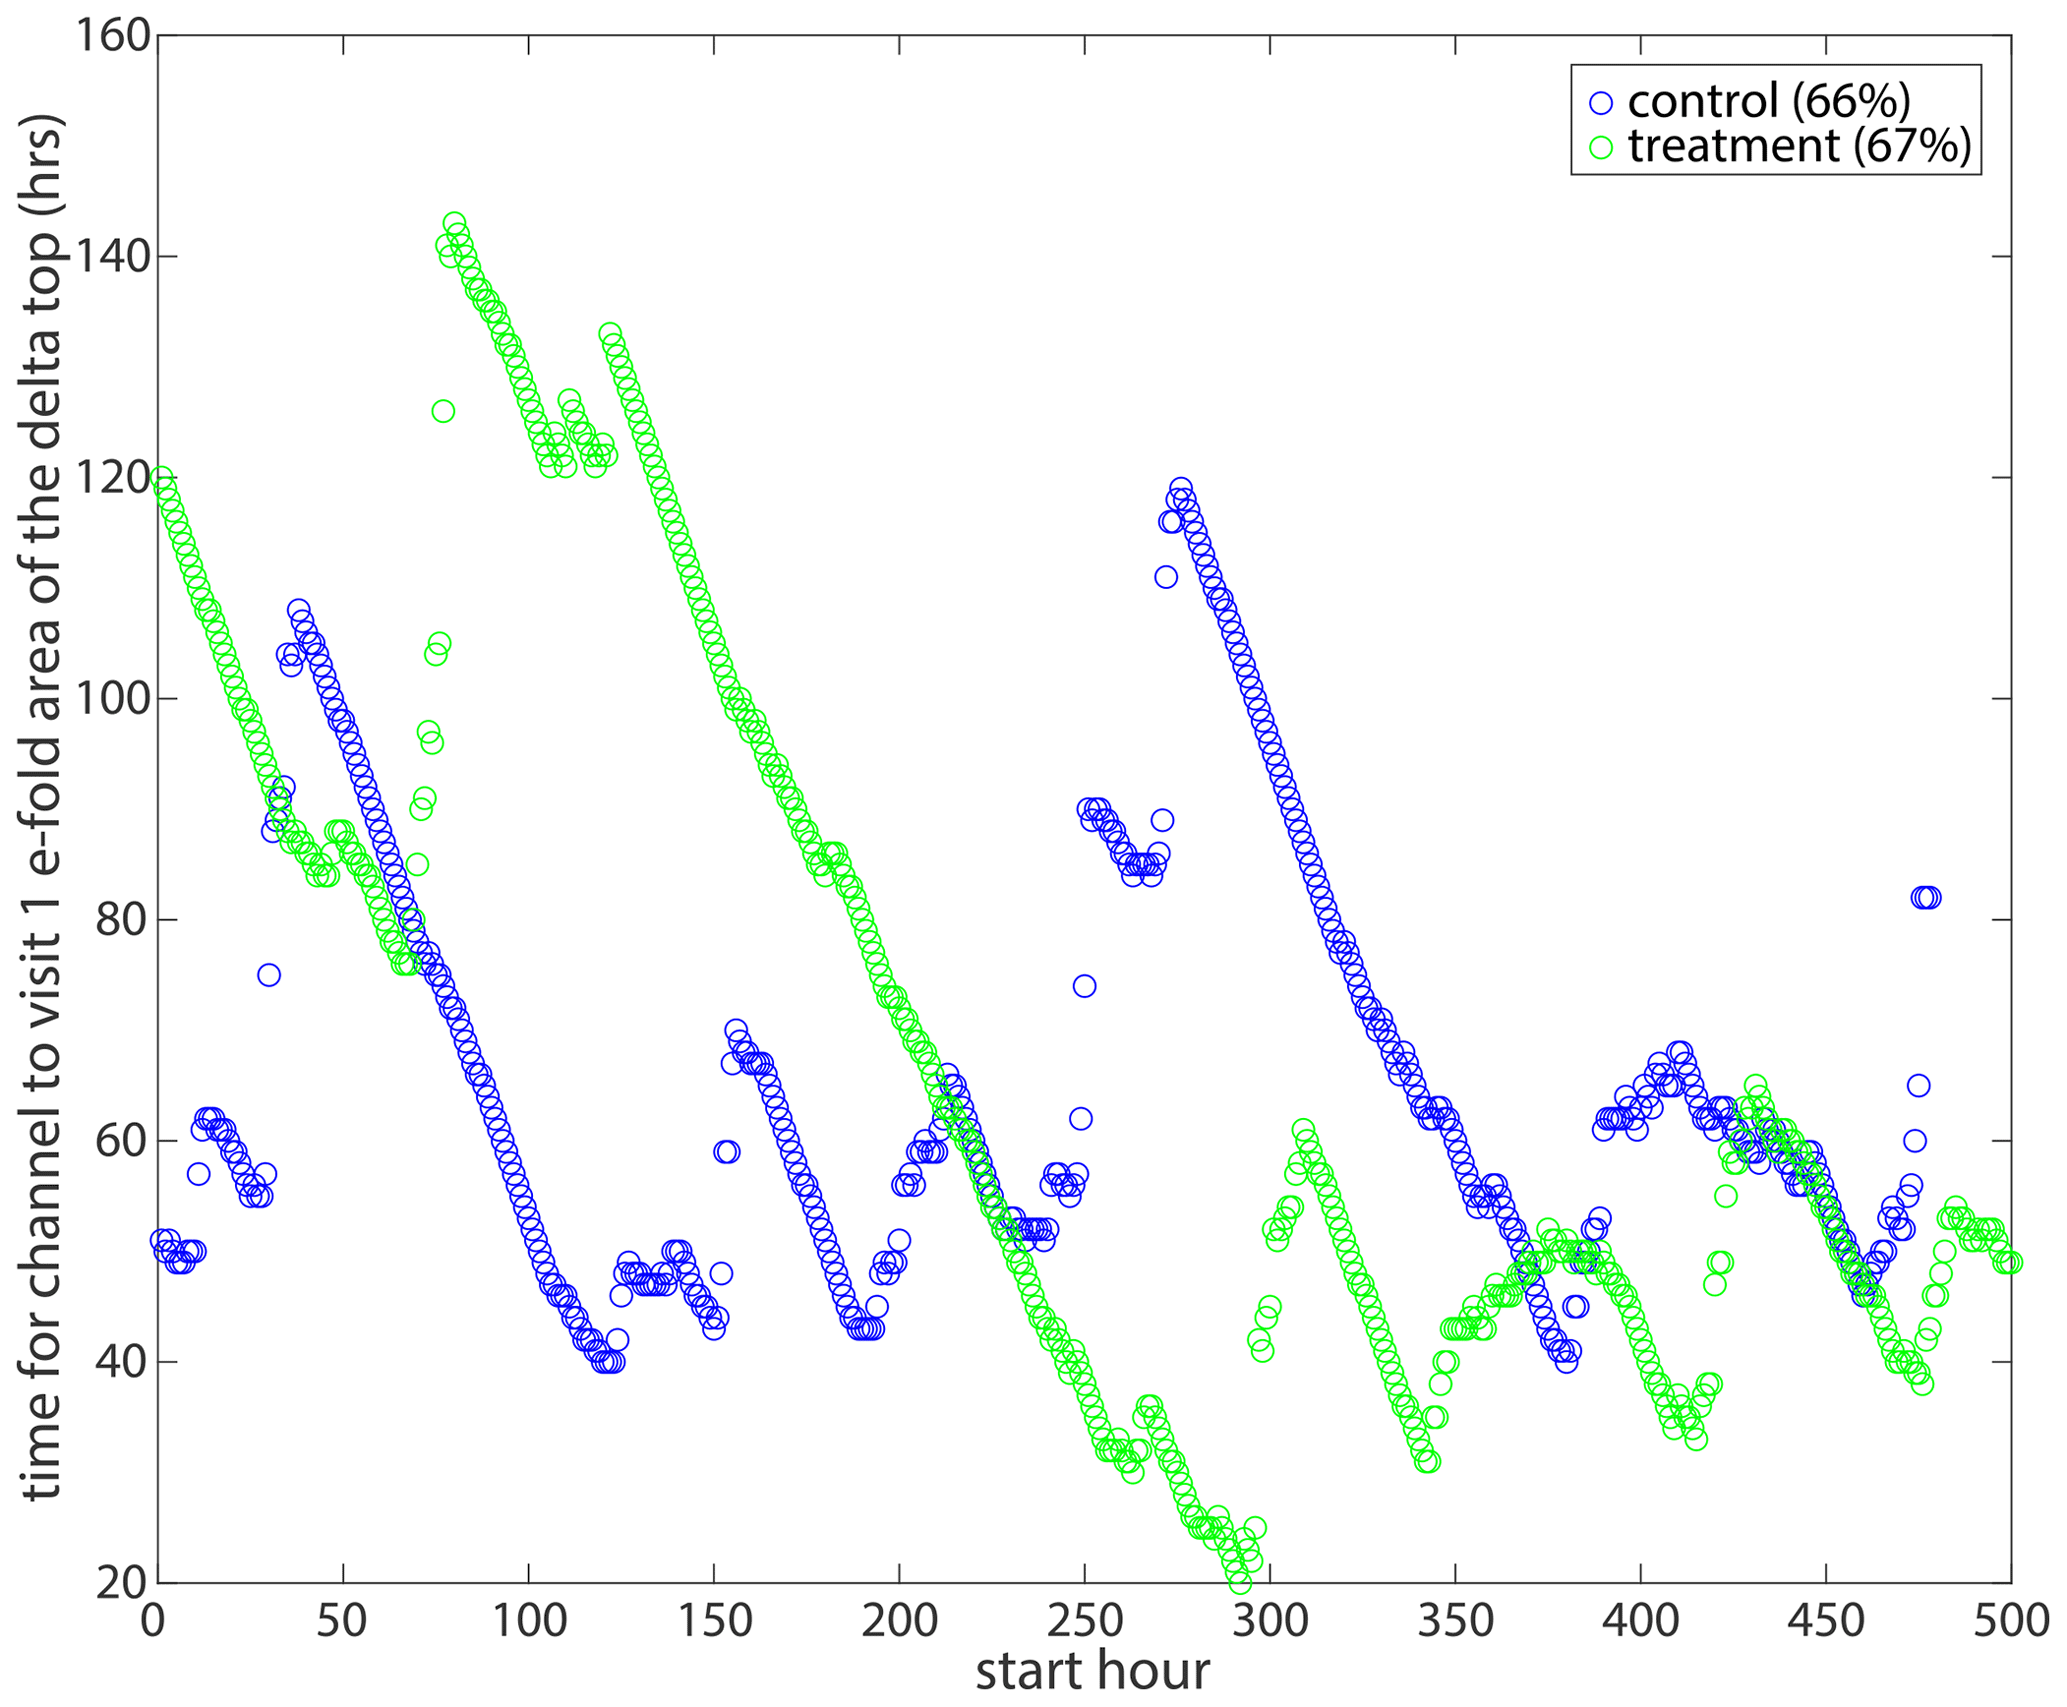
Figure B8The time to reach an e-folding reduction in a non-channelized area of the terrestrial delta in the control (blue) and treatment (green) from each run hour.
Below, we show Fig. 6 with all data. We note that control channel aggradation rate that is > 7 mm h−1 (Fig. C1a) is likely a result of not many channels reaching that distance from the apex (Fig. 4c). This is also the case for the control channel in-filling rate that is > 7 mm h−1 (Fig. C1c).
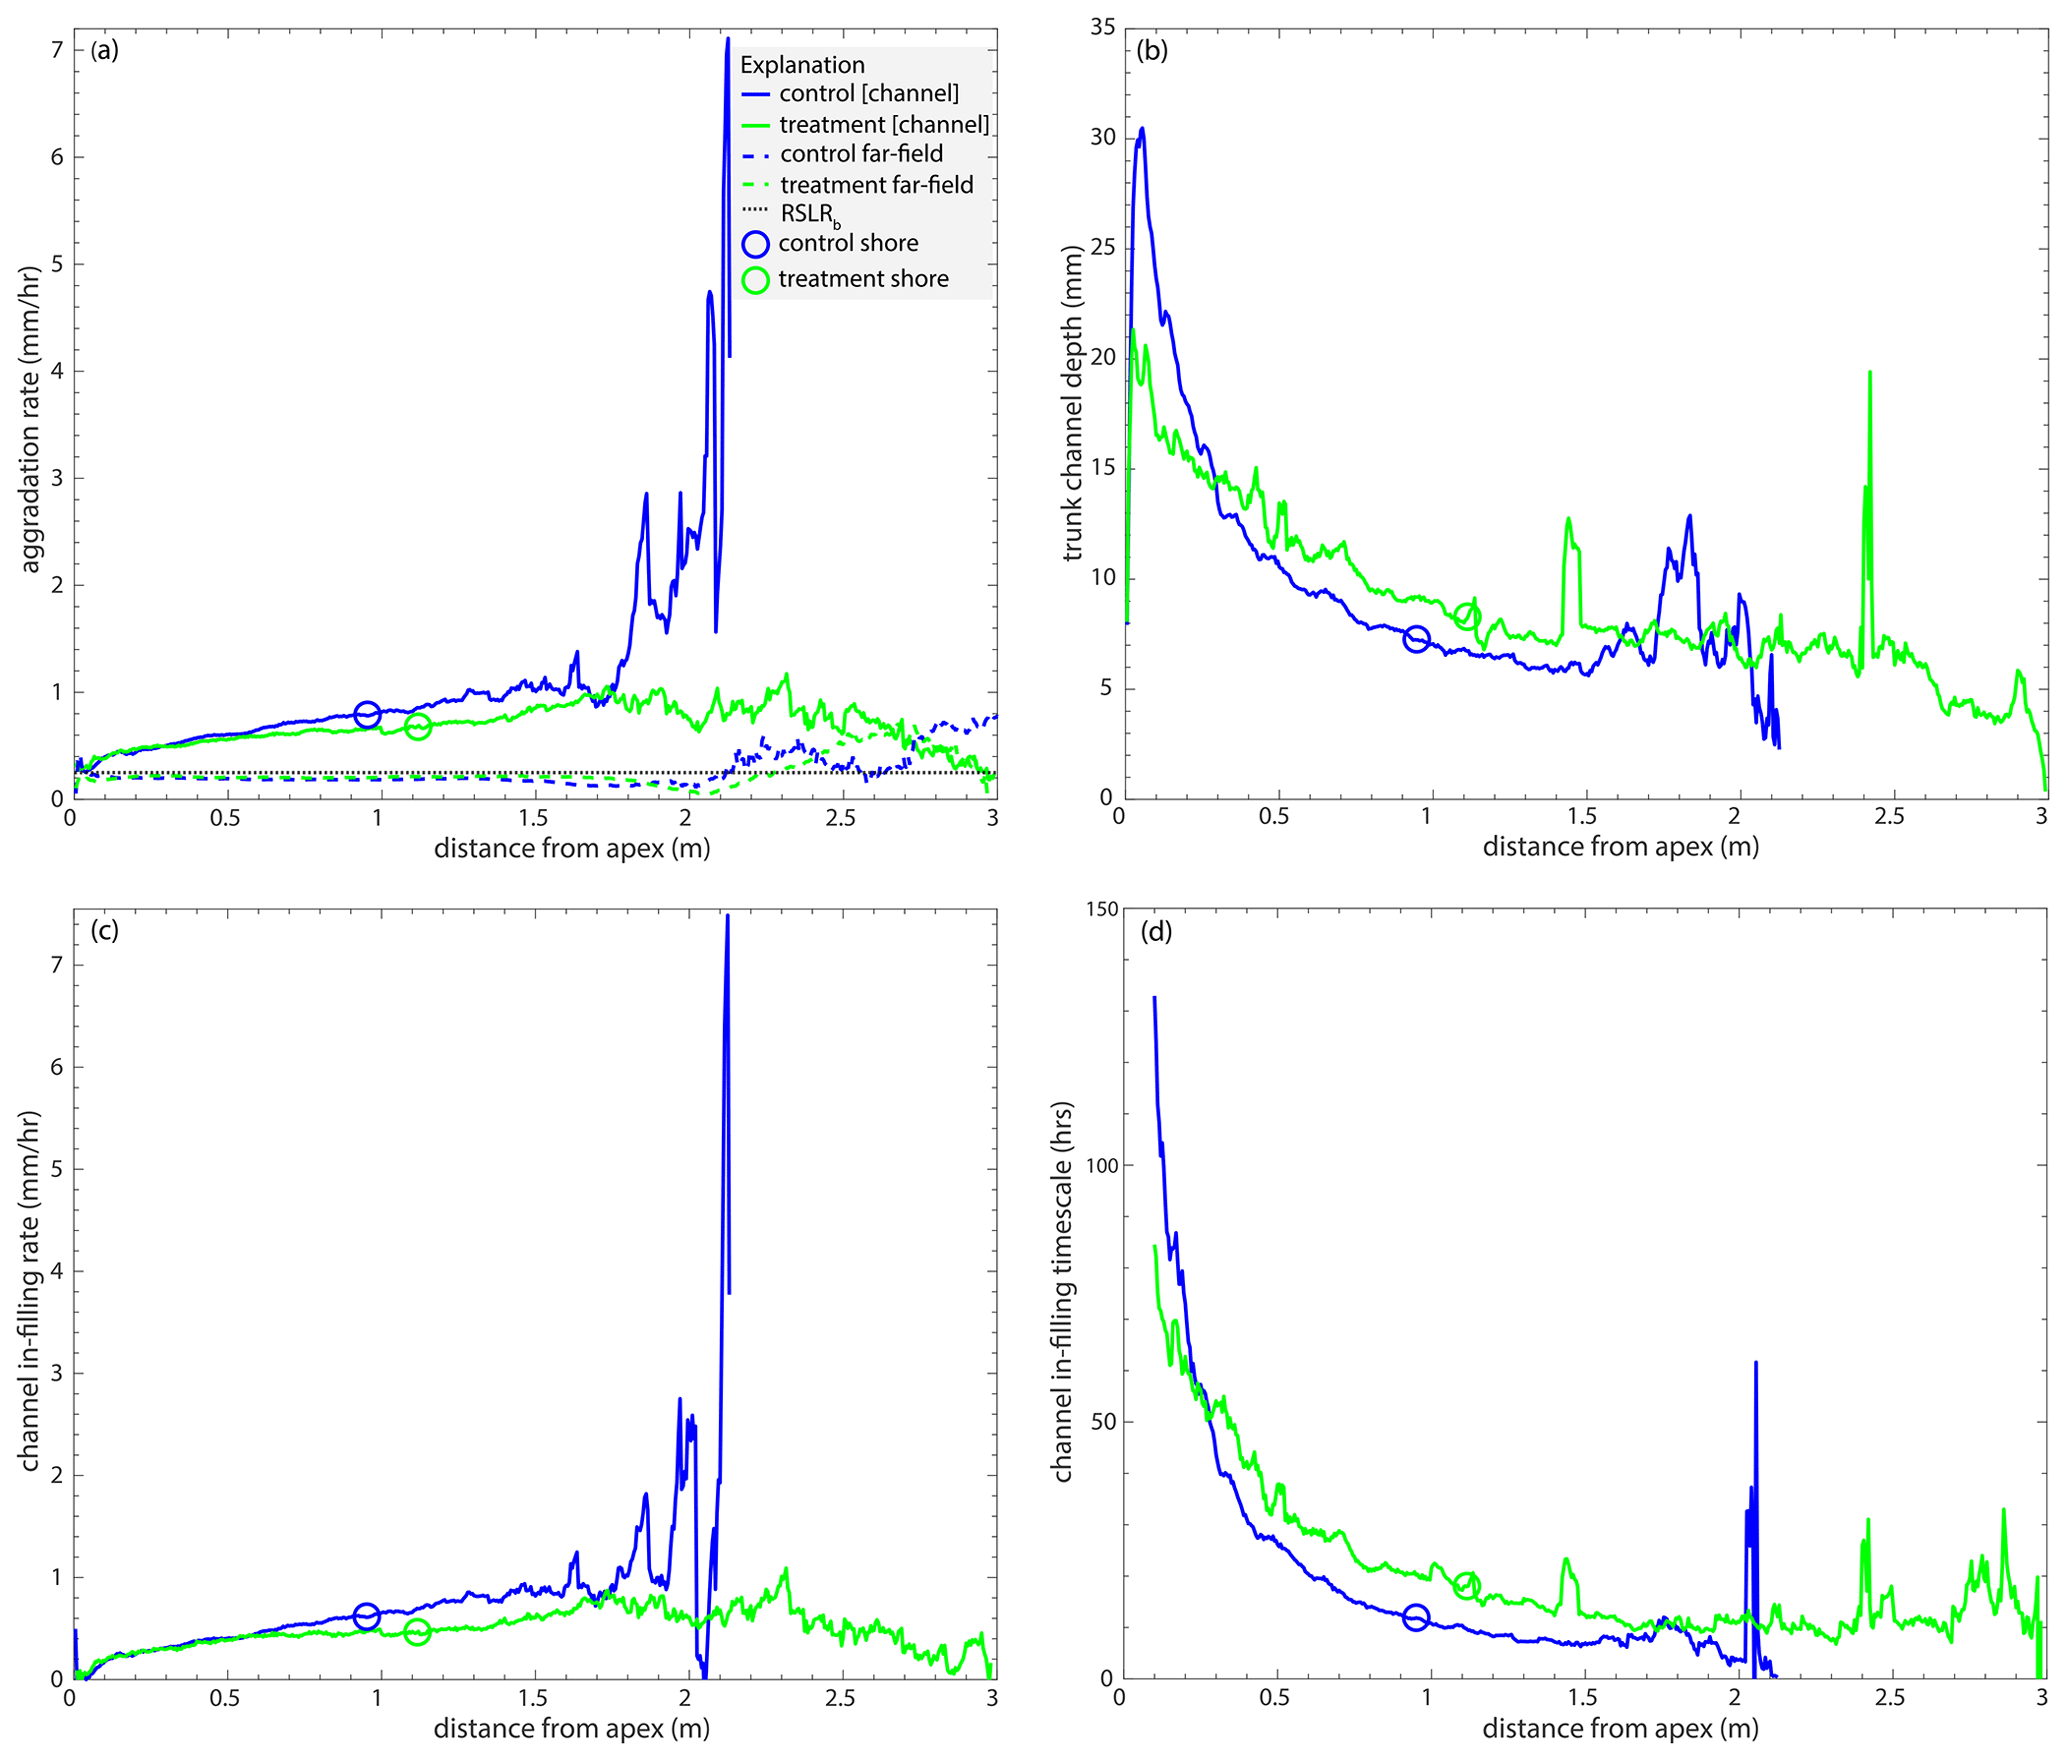
Figure C1(a) The mean channel (solid line) and far-field (dashed line) aggradation rates (mm h−1) in the control (blue) and treatment (green) experiments as a function of radial distance from the apex (m). (b) The mean trunk channel depth (mm) as a function of radial distance from the apex (m). (c) The aggradation difference (mm h−1; i.e., the channel in-filling rate) between far-field and channel aggradation rates as a function of radial distance downstream (m). (d) The channel in-filling timescale (h) as a function of radial distance downstream (m).
Data used to reproduced the results of this study are available on Figshare (https://doi.org/10.6084/m9.figshare.22320811, Sanks, 2023a). The software used to reproduce the results of this study is hosted on both GitHub (https://github.com/kmsanks/TDWB_19_2_Channels/tree/v1.0.2, last access: 24 October 2023) and Zenodo (https://doi.org/10.5281/zenodo.8360176, Sanks, 2023b. The data archive of the raw experimental data is available in the TDWB-19-2-Surface-Processes project space at https://sead2.ncsa.illinois.edu/datasets/61f19591e4b0eb58dc6fbd93 (Sanks et al., 2022). Note that these data are not needed to reproduce any results from the study but may be of interest for other researchers.
KeMS performed analysis, created the figures, and wrote the paper, with guidance from JBS and KyMS. KeMS, SMZ, JS, JBS, and KyMS designed and conducted the treatment experiment and processed various portions of the data. RD and KyMS designed, conducted, and processed data from the control experiment. JBS and KyMS acquired funding for the experimental work. All authors reviewed and edited the paper.
The contact author has declared that none of the authors has any competing interests.
Publisher's note: Copernicus Publications remains neutral with regard to jurisdictional claims made in the text, published maps, institutional affiliations, or any other geographical representation in this paper. While Copernicus Publications makes every effort to include appropriate place names, the final responsibility lies with the authors.
The project was funded by a National Science Foundation (NSF) grant to the principal investigators Kyle M. Straub and John B. Shaw. One NSF grant (grant no. EAR-1848994) funded the time of Kyle M. Straub and José Silvestre and many of the experimental costs. Another NSF grant (grant no. EAR-1848993) funded the time of John B. Shaw and Samuel M. Zapp and some of the experimental costs. We would like to thank Eric Barefoot for his monumental help in automating the treatment experiment.
This research has been supported by the National Science Foundation (grant nos. EAR-1848993 and EAR-1848994).
This paper was edited by Paola Passalacqua and reviewed by two anonymous referees.
Aslan, A., Autin, W. J., and Blum, M. D.: Causes of River Avulsion: Insights from the Late Holocene Avulsion History of the Mississippi River, U.S.A., J. Sediment. Res., 75, 650–664, https://doi.org/10.2110/jsr.2005.053, 2005. a
Barefoot, E. A., Nittrouer, J. A., and Straub, K. M.: Non-Monotonic Floodplain Responses to Changes in Flooding Intensity, J. Geophys. Res.-Earth, 126, e2021JF006310, https://doi.org/10.1029/2021JF006310, 2021. a
Beltrán-Burgos, M., Esposito, C. R., Nepf, H. M., Baustian, M. M., and Di Leonardo, D. R.: Vegetation-Driven Seasonal Sediment Dynamics in a Freshwater Marsh of the Mississippi River Delta, J. Geophys. Res.-Biogeo., 128, e2022JG007143, https://doi.org/10.1029/2022JG007143, 2023. a
Bhattacharya, J. P.: Delta: Facies Models Revisited, Soc. Sediment. Geol., 84, 237–292, 2006. a
Brooke, S., Chadwick, A. J., Silvestre, J., Lamb, M. P., Edmonds, D. A., and Ganti, V.: Where rivers jump course, Science, 376, 987–990, https://doi.org/10.1126/science.abm1215, 2022. a
Bull, W. B.: Alluvial Fans, J. Geol. Educ., 16, 101–106, https://doi.org/10.5408/0022-1368-XVI.3.101, 1968. a
Caldwell, R. L. and Edmonds, D. A.: The effects of sediment properties on deltaic processes and morphologies: A numerical modeling study, J. Geophys. Res.-Earth, 119, 961–982, https://doi.org/10.1002/2013JF002965, 2014. a, b
Carlson, B., Piliouras, A., Muto, T., and Kim, W.: Control of Basin Water Depth On Channel Morphology and Autogenic Timescales in Deltaic Systems, J. Sediment. Res., 88, 1026–1039, https://doi.org/10.2110/jsr.2018.52, 2018. a
Carlson, B. N., Nittrouer, J. A., Swanson, T. E., Moodie, A. J., Dong, T. Y., Ma, H., Kineke, G. C., Pan, M., and Wang, Y.: Impacts of Engineered Diversions and Natural Avulsions on Delta-Lobe Stability, Geophys. Res. Lett., 48, e2021GL092438, https://doi.org/10.1029/2021GL092438, 2021. a
Chadwick, A. J., Lamb, M. P., Moodie, A. J., Parker, G., and Nittrouer, J. A.: Origin of a Preferential Avulsion Node on Lowland River Deltas, Geophys. Res. Lett., 46, 4267–4277, https://doi.org/10.1029/2019GL082491, 2019. a, b
Chadwick, A. J., Lamb, M. P., and Ganti, V.: Accelerated river avulsion frequency on lowland deltas due to sea-level rise, P. Natl. Acad. Sci. USA, 117, 17584–17590, https://doi.org/10.1073/pnas.1912351117, 2020. a
Chatanantavet, P. and Lamb, M. P.: Sediment transport and topographic evolution of a coupled river and river plume system: An experimental and numerical study, J. Geophys. Res.-Earth, 119, 1263–1282, https://doi.org/10.1002/2013JF002810, 2014. a
Chatanantavet, P., Lamb, M. P., and Nittrouer, J. A.: Backwater controls of avulsion location on deltas, Geophys. Res. Lett., 39, GL050197, https://doi.org/10.1029/2011GL050197, 2012. a, b, c, d, e
Coleman, J. M.: Dynamic changes and processes in the Mississippi River delta, Geol. Soc. Am. Bull., 100, 999–1015, 1988. a, b
Couvillion, B. R., Beck, H., Schoolmaster, D., and Fischer, M.: Land area change in coastal Louisiana (1932 to 2016), USGS Numbered Series 3381, U.S. Geological Survey, Reston, VA, https://doi.org/10.3133/sim3381, 2017. a
CPRA: Louisiana's Comprehensive Master Plan for a Sustainable Coast, Coastal Protection and Restoration Authority (CPRA), http://coastal.la.gov/wp-content/uploads/2017/04/2017-Coastal-Master-Plan_Web-Book_CFinal-with-Effective-Date-06092017.pdf (last access: 24 October 2023), 2017. a
Edmonds, D. A. and Slingerland, R. L.: Mechanics of river mouth bar formation: Implications for the morphodynamics of delta distributary networks, J. Geophys. Res.-Earth Surface, 112, JF000574, https://doi.org/10.1029/2006JF000574, 2007. a
Edmonds, D. A. and Slingerland, R. L.: Significant effect of sediment cohesion on delta morphology, Nat. Geosci., 3, 105–109, https://doi.org/10.1038/ngeo730, 2010. a
Edmonds, D. A., Hoyal, D. C. J. D., Sheets, B. A., and Slingerland, R. L.: Predicting delta avulsions: Implications for coastal wetland restoration, Geology, 37, 759–762, https://doi.org/10.1130/G25743A.1, 2009. a, b, c
Elsey-Quirk, T., Graham, S. A., Mendelssohn, I. A., Snedden, G., Day, J. W., Twilley, R. R., Shaffer, G., Sharp, L. A., Pahl, J., and Lane, R. R.: Mississippi river sediment diversions and coastal wetland sustainability: Synthesis of responses to freshwater, sediment, and nutrient inputs, Estuarine, Coast. Shelf Sci., 221, 170–183, https://doi.org/10.1016/j.ecss.2019.03.002, 2019. a, b
Esposito, C. R., Shen, Z., Törnqvist, T. E., Marshak, J., and White, C.: Efficient retention of mud drives land building on the Mississippi Delta plain, Earth Surf. Dynam., 5, 387–397, https://doi.org/10.5194/esurf-5-387-2017, 2017. a
Fagherazzi, S., Carniello, L., D'Alpaos, L., and Defina, A.: Critical bifurcation of shallow microtidal landforms in tidal flats and salt marshes, P. Natl. Acad. Sci. USA, 103, 8337–8341, https://doi.org/10.1073/pnas.0508379103, 2006. a
Ganti, V., Chadwick, A. J., Hassenruck-Gudipati, H. J., Fuller, B. M., and Lamb, M. P.: Experimental river delta size set by multiple floods and backwater hydrodynamics, Sci. Adv., 2, e1501768, https://doi.org/10.1126/sciadv.1501768, 2016a. a
Ganti, V., Chadwick, A. J., Hassenruck Gudipati, H. J., and Lamb, M. P.: Avulsion cycles and their stratigraphic signature on an experimental backwater-controlled delta, J. Geophys. Res.-Earth, 121, 1651–1675, https://doi.org/10.1002/2016JF003915, 2016b. a, b, c
Hajek, E. A. and Wolinsky, M. A.: Simplified process modeling of river avulsion and alluvial architecture: Connecting models and field data, Sediment. Geol., 257–260, 1–30, https://doi.org/10.1016/j.sedgeo.2011.09.005, 2012. a
Holmquist, J. R., Windham-Myers, L., Bliss, N., Crooks, S., Morris, J. T., Megonigal, J. P., Troxler, T., Weller, D., Callaway, J., Drexler, J., Ferner, M. C., Gonneea, M. E., Kroeger, K. D., Schile-Beers, L., Woo, I., Buffington, K., Breithaupt, J., Boyd, B. M., Brown, L. N., Dix, N., Hice, L., Horton, B. P., MacDonald, G. M., Moyer, R. P., Reay, W., Shaw, T., Smith, E., Smoak, J. M., Sommerfield, C., Thorne, K., Velinsky, D., Watson, E., Grimes, K. W., and Woodrey, M.: Accuracy and Precision of Tidal Wetland Soil Carbon Mapping in the Conterminous United States, Sci. Rep.-UK, 8, 9478, https://doi.org/10.1038/s41598-018-26948-7, 2018. a
Holmquist, J. R., Brown, L. N., and MacDonald, G. M.: Localized Scenarios and Latitudinal Patterns of Vertical and Lateral Resilience of Tidal Marshes to Sea-Level Rise in the Contiguous United States, Earth's Future, 9, e2020EF001804, https://doi.org/10.1029/2020EF001804, 2021. a
Hopkinson, C. S., Morris, J. T., Fagherazzi, S., Wollheim, W. M., and Raymond, P. A.: Lateral Marsh Edge Erosion as a Source of Sediments for Vertical Marsh Accretion, J. Geophys. Res.-Biogeo., 123, 2444–2465, https://doi.org/10.1029/2017JG004358, 2018. a
Hoyal, D. C. J. D. and Sheets, B. A.: Morphodynamic evolution of experimental cohesive deltas, J. Geophys. Res.-Earth, 114, JF000882, https://doi.org/10.1029/2007JF000882, 2009. a, b, c, d, e, f, g
Ielpi, A. and Lapôtre, M. G. A.: A tenfold slowdown in river meander migration driven by plant life, Nat. Geosci., 13, 82–86, https://doi.org/10.1038/s41561-019-0491-7, 2020. a
Jerolmack, D. J. and Swenson, J. B.: Scaling relationships and evolution of distributary networks on wave-influenced deltas, Geophys. Res. Lett., 34, GL031823, https://doi.org/10.1029/2007GL031823, 2007. a
Jobe, Z. R., Howes, N. C., Straub, K. M., Cai, D., Deng, H., Laugier, F. J., Pettinga, L. A., and Shumaker, L. E.: Comparing Aggradation, Superelevation, and Avulsion Frequency of Submarine and Fluvial Channels, Front. Earth Sci., 8, 53, https://doi.org/10.3389/feart.2020.00053, 2020. a, b
Kelsall, M., Quirk, T., Wilson, C., and Snedden, G. A.: Sources and chemical stability of soil organic carbon in natural and created coastal marshes of Louisiana, Sci. Total Environ., 867, 161415, https://doi.org/10.1016/j.scitotenv.2023.161415, 2023. a, b
Khan, N. S., Horton, B. P., McKee, K. L., Jerolmack, D., Falcini, F., Enache, M. D., and Vane, C. H.: Tracking sedimentation from the historic A.D. 2011 Mississippi River flood in the deltaic wetlands of Louisiana, USA, Geology, 41, 391–394, https://doi.org/10.1130/G33805.1, 2013. a
Kirwan, M. L. and Megonigal, J. P.: Tidal wetland stability in the face of human impacts and sea-level rise, Nature, 504, 53–60, https://doi.org/10.1038/nature12856, 2013. a
Kirwan, M. L., Guntenspergen, G. R., D'Alpaos, A., Morris, J. T., Mudd, S. M., and Temmerman, S.: Limits on the adaptability of coastal marshes to rising sea level: ecogeomorphic limits to wetland survival, Geophys. Res. Lett., 37, JF002079, https://doi.org/10.1029/2010GL045489, 2010. a
Kosters, E. C., Chmura, G. L., and Bailey, A.: Sedimentary and botanical factors influencing peat accumulation in the Mississippi Delta, J. Geol. Soc., 144, 423–434, https://doi.org/10.1144/gsjgs.144.3.0423, 1987. a
Lamb, M. P., Nittrouer, J. A., Mohrig, D., and Shaw, J.: Backwater and river plume controls on scour upstream of river mouths: Implications for fluvio-deltaic morphodynamics, J. Geophys. Res.-Earth, 117, GL045489, https://doi.org/10.1029/2011JF002079, 2012. a, b, c
Lauzon, R. and Murray, A. B.: Comparing the Cohesive Effects of Mud and Vegetation on Delta Evolution, Geophys. Res. Lett., 45, 10437–10445, https://doi.org/10.1029/2018GL079405, 2018. a, b
Leonardi, N., Mei, X., Carnacina, I., and Dai, Z.: Marine sediment sustains the accretion of a mixed fluvial-tidal delta, Mar. Geol., 438, 106520, https://doi.org/10.1016/j.margeo.2021.106520, 2021. a
Li, Q., Benson, W. M., Harlan, M., Robichaux, P., Sha, X., Xu, K., and Straub, K. M.: Influence of Sediment Cohesion on Deltaic Morphodynamics and Stratigraphy Over Basin-Filling Time Scales, J. Geophys. Res.-Earth, 122, 1808–1826, https://doi.org/10.1002/2017JF004216, 2017. a, b, c, d, e, f, g, h, i
Mohrig, D., Heller, P. L., Paola, C., and Lyons, W. J.: Interpreting avulsion process from ancient alluvial sequences: Guadalope-Matarranya system (northern Spain) and Wasatch Formation (western Colorado), GSA Bulletin, 112, 1787–1803, https://doi.org/10.1130/0016-7606(2000)112<1787:IAPFAA>2.0.CO;2, 2000. a
Moodie, A. J. and Nittrouer, J. A.: Optimized river diversion scenarios promote sustainability of urbanized deltas, P. Natl. Acad. Sci. USA, 118, e2101649118, https://doi.org/10.1073/pnas.2101649118, 2021. a, b, c, d
Moodie, A. J., Nittrouer, J. A., Ma, H., Carlson, B. N., Chadwick, A. J., Lamb, M. P., and Parker, G.: Modeling Deltaic Lobe-Building Cycles and Channel Avulsions for the Yellow River Delta, China, J. Geophys. Res.-Earth, 124, 2438–2462, https://doi.org/10.1029/2019JF005220, 2019. a, b
Morris, J. T., Sundareshwar, P. V., Nietch, C. T., Kjerfve, B., and Cahoon, D. R.: Responses of Coastal Wetlands to Rising Sea Level, Ecology, 83, 2869–2877, https://doi.org/10.1890/0012-9658(2002)083[2869:ROCWTR]2.0.CO;2, 2002. a, b, c, d
Morton, R. A., Bernier, J., Barras, J., and F. Ferina, N.: Historical Subsidence and Wetland Loss in the Mississippi Delta Plain, Transactions of the Gulf Coast Association of Geological Societies, 55, 555–571, 2015. a
Mudd, S. M., Howell, S. M., and Morris, J. T.: Impact of dynamic feedbacks between sedimentation, sea-level rise, and biomass production on near-surface marsh stratigraphy and carbon accumulation, Estuar. Coast. Shelf S., 82, 377–389, https://doi.org/10.1016/j.ecss.2009.01.028, 2009. a
Nardin, W. and Edmonds, D. A.: Optimum vegetation height and density for inorganic sedimentation in deltaic marshes, Nat. Geosci., 7, 722–726, https://doi.org/10.1038/ngeo2233, 2014. a, b
NASA: How a Delta Forms Where River Meets Lake, https://www.jpl.nasa.gov/images/pia19071-how-a-delta-forms-where-river-meets-lake (last access: 24 October 2023), 2014. a
Nittrouer, J. A., Mohrig, D., and Allison, M.: Punctuated sand transport in the lowermost Mississippi River, J. Geophys. Res., 116, JF002026, https://doi.org/10.1029/2011JF002026, 2011. a, b
Nittrouer, J. A., Best, J. L., Brantley, C., Cash, R. W., Czapiga, M., Kumar, P., and Parker, G.: Mitigating land loss in coastal Louisiana by controlled diversion of Mississippi River sand, Nat. Geosci., 5, 534–537, https://doi.org/10.1038/ngeo1525, 2012. a, b
Nyman, J. A., Walters, R. J., Delaune, R. D., and Patrick, W. H.: Marsh vertical accretion via vegetative growth, Estuarine, Coast. Shelf Sci., 69, 370–380, https://doi.org/10.1016/j.ecss.2006.05.041, 2006. a
Paola, C. and Mohrig, D.: Palaeohydraulics revisited: palaeoslope estimation in coarse‐grained braided rivers, Basin Res., 8, 243–254, https://doi.org/10.1046/j.1365-2117.1996.00253.x, 1996. a
Paola, C., Straub, K., Mohrig, D., and Reinhardt, L.: The “unreasonable effectiveness” of stratigraphic and geomorphic experiments, Earth-Sci. Rev., 97, 1–43, https://doi.org/10.1016/j.earscirev.2009.05.003, 2009. a
Paola, C., Twilley, R. R., Edmonds, D. A., Kim, W., Mohrig, D., Parker, G., Viparelli, E., and Voller, V. R.: Natural processes in delta restoration: application to the Mississippi Delta, Annu. Rev. Mar. Sci., 3, 67–91, https://doi.org/10.1146/annurev-marine-120709-142856, 2011. a, b, c
Peyronnin, N. S., Caffey, R. H., Cowan, J. H., Justic, D., Kolker, A. S., Laska, S. B., McCorquodale, A., Melancon, E., Nyman, J. A., Twilley, R. R., Visser, J. M., White, J. R., and Wilkins, J. G.: Optimizing Sediment Diversion Operations: Working Group Recommendations for Integrating Complex Ecological and Social Landscape Interactions, Water, 9, 368, https://doi.org/10.3390/w9060368, 2017. a
Piliouras, A., Kim, W., and Carlson, B.: Balancing Aggradation and Progradation on a Vegetated Delta: The Importance of Fluctuating Discharge in Depositional Systems, J. Geophys. Res.-Earth, 122, 1882–1900, https://doi.org/10.1002/2017JF004378, 2017. a
Prasojo, O. A., Hoey, T. B., Owen, A., and Williams, R. D.: Slope Break and Avulsion Locations Scale Consistently in Global Deltas, Geophys. Res. Lett., 49, e2021GL093656, https://doi.org/10.1029/2021GL093656, 2022. a, b
Ratliff, K. M., Hutton, E. W. H., and Murray, A. B.: Modeling long-term delta dynamics reveals persistent geometric river avulsion locations, Earth Planet. Sc. Lett., 559, 116786, https://doi.org/10.1016/j.epsl.2021.116786, 2021. a, b, c, d, e
Reed, D. J.: The response of coastal marshes to sea-level rise: Survival or submergence?, Earth Surf. Proc. Land., 20, 39–48, https://doi.org/10.1002/esp.3290200105, 1995. a
Reitz, M. D., Pickering, J. L., Goodbred, S. L., Paola, C., Steckler, M. S., Seeber, L., and Akhter, S. H.: Effects of tectonic deformation and sea level on river path selection: Theory and application to the Ganges-Brahmaputra-Meghna River Delta, J. Geophys. Res.-Earth, 120, 671–689, https://doi.org/10.1002/2014JF003202, 2015. a
Sadler, P. M.: Sediment Accumulation Rates and the Completeness of Stratigraphic Sections, J. Geol., 89, 569–584, https://doi.org/10.1086/628623, 1981. a
Sanks, K.: TDWB_19_2_Channels, figshare [data set], https://doi.org/10.6084/m9.figshare.22320811.v1, 2023a. a
Sanks, K. M.: kmsanks/TDWB_19_2_Channels, Zenodo [code], https://doi.org/10.5281/zenodo.8360176, 2023b. a
Sanks, K. M., Shaw, J. B., and Naithani, K.: Field-Based Estimate of the Sediment Deficit in Coastal Louisiana, J. Geophys. Res.-Earth, 125, e2019JF005389, https://doi.org/10.1029/2019JF005389, 2020. a, b, c
Sanks, K. M., Zapp, S. M., Silvestre, J. R., Shaw, J. B., Dutt, R., and Straub, K. M.: Marsh sedimentation controls delta top morphology, slope, and mass balance, Geophys. Res. Lett., 49, e2022GL098513 https://doi.org/10.1029/2022GL098513, 2022. a, b, c, d, e, f, g, h, i, j, k
Sanks, K., Zapp, S., Silvestre, J., Shaw, J., and Straub, K. TDWB-19-2-Surface-Processes, SEAD [data set], https://sead2.ncsa.illinois.edu/datasets/61f19591e4b0eb58dc6fbd93, last access: 24 October 2023. a
Shaw, J. B. and McElroy, B.: Backwater number scaling of alluvial bed forms, J. Geophys. Res.-Earth, 121, 1436–1455, https://doi.org/10.1002/2016JF003861, 2016. a
Shaw, J. B., Mohrig, D., and Wagner, R. W.: Flow patterns and morphology of a prograding river delta, J. Geophys. Res.-Earth, 121, 372–391, https://doi.org/10.1002/2015JF003570, 2016. a
Shaw, J. B., Miller, K., and McElroy, B.: Island Formation Resulting From Radially Symmetric Flow Expansion, J. Geophys. Res.-Earth, 123, 363–383, https://doi.org/10.1002/2017JF004464, 2018. a
Shaw, J. B., Mason, K. G., Ma, H., and McCain III, G. W.: Influences on Discharge Partitioning on a Large River Delta: Case Study of the Mississippi-Atchafalaya Diversion, 1926–1950, Water Resour. Res., 57, e2020WR028090, https://doi.org/10.1029/2020WR028090, 2021. a
Sittoni, L., Paola, C., and Voller, V.: Geometry, Flow, and Sediment Transport of Alluvial Deposits Induced By Topographically Driven Flow Expansions, J. Sediment. Res., 84, 122–135, https://doi.org/10.2110/jsr.2014.11, 2014. a, b, c, d
Slingerland, R. and Smith, N. D.: River Avulsions and Their Deposits, Annu. Rev. Earth Pl. Sci., 32, 257–285, https://doi.org/10.1146/annurev.earth.32.101802.120201, 2004. a, b
Smith, J. E., Bentley, S. J., Snedden, G. A., and White, C.: What Role do Hurricanes Play in Sediment Delivery to Subsiding River Deltas?, Sci. Rep.-UK, 5, 17582, https://doi.org/10.1038/srep17582, 2015. a
Straub, K. M., Paola, C., Mohrig, D., Wolinsky, M. A., and George, T.: Compensational Stacking of Channelized Sedimentary Deposits, J. Sediment. Res., 79, 673–688, https://doi.org/10.2110/jsr.2009.070, 2009. a, b
Straub, K. M., Paola, C., Kim, W., and Sheets, B.: Experimental Investigation of Sediment-Dominated Vs. Tectonics-Dominated Sediment Transport Systems In Subsiding Basins, J. Sediment. Res., 83, 1162–1180, https://doi.org/10.2110/jsr.2013.91, 2013. a
Straub, K. M., Li, Q., and Benson, W. M.: Influence of sediment cohesion on deltaic shoreline dynamics and bulk sediment retention: A laboratory study, Geophys. Res. Lett., 42, 2015GL066131, https://doi.org/10.1002/2015GL066131, 2015. a
Tal, M. and Paola, C.: Effects of vegetation on channel morphodynamics: results and insights from laboratory experiments, Earth Surf. Proc. Land., 35, 1014–1028, https://doi.org/10.1002/esp.1908, 2010. a
Törnqvist, T. E. and Bridge, J. S.: Spatial variation of overbank aggradation rate and its influence on avulsion frequency, Sedimentology, 49, 891–905, https://doi.org/10.1046/j.1365-3091.2002.00478.x, 2002. a
Valentine, K., Herbert, E. R., Walters, D. C., Chen, Y., Smith, A. J., and Kirwan, M. L.: Climate-driven tradeoffs between landscape connectivity and the maintenance of the coastal carbon sink, Nat. Commun., 14, 1137, https://doi.org/10.1038/s41467-023-36803-7, 2023. a
Wang, Y., Straub, K. M., and Hajek, E. A.: Scale-dependent compensational stacking: An estimate of autogenic time scales in channelized sedimentary deposits, Geology, 39, 811–814, https://doi.org/10.1130/G32068.1, 2011. a
White, E. D., Meselhe, E., Reed, D., Renfro, A., Snider, N. P., and Wang, Y.: Mitigating the Effects of Sea-Level Rise on Estuaries of the Mississippi Delta Plain Using River Diversions, Water, 11, 2028, https://doi.org/10.3390/w11102028, 2019. a
Wickert, A. D., Martin, J. M., Tal, M., Kim, W., Sheets, B., and Paola, C.: River channel lateral mobility: metrics, time scales, and controls, J. Geophys. Res.-Earth, 118, 396–412, https://doi.org/10.1029/2012JF002386, 2013. a, b, c, d, e, f
Wilson, C. A. and Goodbred, S. L.: Construction and Maintenance of the Ganges-Brahmaputra-Meghna Delta: Linking Process, Morphology, and Stratigraphy, Annu. Rev. Mar. Sci., 7, 67–88, https://doi.org/10.1146/annurev-marine-010213-135032, 2015. a
Xu, K., Bentley, S. J., Day, J. W., and Freeman, A. M.: A review of sediment diversion in the Mississippi River Deltaic Plain, Estuar. Coast. Shelf Sci., 225, 106241, https://doi.org/10.1016/j.ecss.2019.05.023, 2019. a
Zapp, S. M., Sanks, K. M., Silvestre, J., Shaw, J. B., Dutt, R., and Straub, K. M.: Exploring Sediment Compaction in Experimental Deltas: towards a meso-scale understanding of coastal subsidence patterns, ESS Open Archive, https://essopenarchive.org/doi/full/10.1002/essoar.10512776.1 (last access: 30 October 2023), 2022. a