the Creative Commons Attribution 4.0 License.
the Creative Commons Attribution 4.0 License.
 | 09 May 2023
Impacts of human modifications on material transport in deltas
Jayaram Hariharan
Kyle Wright
Andrew Moodie
Nelson Tull
Paola Passalacqua
As humans continue to inhabit and modify river deltas, the natural processes governing material transport through these landscapes are altered. Two common engineering projects undertaken on deltas are the dredging of channels to enable shipping and the construction of embankments to reduce flooding. While the impact of these topographic modifications has been studied at a local level for specific sites, there is a gap in our generalized understanding of how these landscape modifications impact material transport. To narrow this gap, we conduct exploratory numerical modeling to develop deltaic landscapes with different input sediment compositions, modify their topography to mimic dredging and embankments, simulate different flow conditions, and then model the transport of passive particles. We find that human modification of topography lowers hydrological connectivity by reducing the area visited by fluvial inputs. The amount of time particles spend within the delta is reduced by the construction of polders and is lengthened by dredging. Material buoyancy has a greater impact on nourishment areas and exposure times than flow regime or topographic modification, with positively buoyant particles spending longer and visiting a greater area of the delta than neutral and negatively buoyant material. The results of this study can help guide the design of future engineering projects by providing estimates of their likely impact on transport processes.
- Article
(13872 KB) - Full-text XML
- BibTeX
- EndNote


Humans have chosen to inhabit delta landscapes for centuries due to their coastal locations and nutrient-rich soils (Day et al., 2007; Edmonds et al., 2020). To increase the habitability of these dynamic landscapes, humans have enacted a number of topographic modifications, such as levee construction and channel dredging, to promote stability. Not unlike upstream construction (e.g., dams, Higgins et al., 2018), these efforts to control nature alter the processes occurring on the landscape (e.g., Simeoni and Corbau, 2009; Renaud et al., 2013; Wilson et al., 2017) and reduce long-term sustainability (Passalacqua et al., 2021). These disruptions to natural transport mechanisms within deltas can result in the loss of flora and fauna (e.g., Ohimain, 2004; Ellery and McCarthy, 1998).
Embankments, or levees, are constructed to limit erosion and prevent low-lying land from flooding (e.g., Samuelson, 1917; Le et al., 2007; Renaud et al., 2013; Olson and Wright Morton, 2018). Unfortunately, embankments also prevent the delivery of sediment to the floodplains and interiors of deltaic islands, which in the presence of land subsidence and in-channel sedimentation can lead to geomorphically unstable situations wherein the adjacent channel bed is higher than the land behind the embankment (e.g., Auerbach et al., 2015). This type of instability has resulted in a number of alternative practices, including “soft” flood risk management (Wesselink et al., 2015) and the adoption of nature-based engineering solutions (Temmerman and Kirwan, 2015). In Bangladesh, for example, the intentional breaching of embankments to allow sedimentation to occur, a process called tidal river management, partially restores the landscape by allowing water and sediment to flood the island interior during the rainy season (e.g., Khadim et al., 2013; Masud et al., 2018; Al Masud et al., 2020).
The artificial deepening of channels via dredging to enable shipping and commerce is another typical human engineering practice (e.g., Ohimain, 2004; Day et al., 2000; Yuan and Zhu, 2015). This channel deepening can promote imbalance between shallow and deep parts of the system leading to decreased channel dynamics (van Dijk et al., 2021). These morphological changes can lead to the destruction of aquatic fauna (Ellery and McCarthy, 1998), as well as the enhancement of pre-existing oxygen deficiencies (Kerner, 2007). Dredging can also change flow behavior, altering the partitioning of flow at upstream junctions (e.g., Yuan and Zhu, 2015), as well as increasing the tidal range (Cai et al., 2012; Yuan and Zhu, 2015; Zhu et al., 2015), thus making coastal areas more vulnerable to storm surge (Cai et al., 2012).
The movement of water and sediment between channels and their floodplains is more broadly a type of hydrological connectivity. Hydrological connectivity describes the water-mediated transport of material between landscape elements (Pringle, 2003; Tetzlaff et al., 2007; Lexartza-Artza and Wainwright, 2009). Beyond water and sediment, the concept of hydrological connectivity can be applied to nutrients, pollutants, or any other material being transported through a landscape (Passalacqua, 2017). Within natural river deltas, hydrological connectivity has been found to be both significant (Hiatt and Passalacqua, 2015) and important to the natural functioning of the landscape (Hiatt et al., 2018; Christensen et al., 2020; Olliver and Edmonds, 2021). Hydrological connectivity in deltaic landscapes has been found to control nitrate removal (e.g., Knights et al., 2021), affect water exposure time distributions (e.g., Hiatt et al., 2018), and, via feedbacks with vegetation, influence sediment deposition and retention (e.g., Nardin and Edmonds, 2014).
Deltas themselves can have drastically varied morphologies due to differences in fluvial inputs of water and sediment, wave environments, tidal signals, and climatic conditions (e.g., Galloway, 1975; Caldwell and Edmonds, 2014; Anthony, 2015; Piliouras et al., 2021). These environmental conditions lead to variations in morphology, which subsequently create unique hydrodynamic and sediment transport behavior (e.g., Sassi et al., 2011). Sediment composition, for example, influences both delta morphology and dynamics. Finer-grained cohesive sediments lengthen avulsion timescales, resulting in the formation of rugose shorelines, while coarser-grained sediments have more mobile channels and smoother, fan-like, shorelines (Hoyal and Sheets, 2009; Edmonds and Slingerland, 2010; Caldwell and Edmonds, 2014; Straub et al., 2015). Consequently, material transport through natural river deltas is expected to vary based on morphology and environmental forcings. Human modifications to these natural systems may alter transport behavior leading to reduced or increased connectivity between landscape elements. For example, the embankment of land has been shown to lead to amplification of local tidal signals, changing both the morphology of tidal channels and the connectivity of the landscape (Pethick and Orford, 2013; Auerbach et al., 2015; Bain et al., 2019).
Numerical simulation of different coastal locations, ports, and channels, has enabled some quantification of material transport in the face of human modifications (e.g., Proehl et al., 2004; Banas et al., 2009; Vale and Dias, 2011). Sometimes these studies are performed in advance of a proposed engineering project to assess its environmental impact (e.g., Valseth et al., 2021). Other times studies are done after engineering projects are complete, providing an evaluation of their impact (e.g., Day et al., 2000; Monge-Ganuzas et al., 2013; Yuan and Zhu, 2015). The generic impact of human topography modifications on material transport through river delta landscapes, however, is relatively understudied. Developing this type of generalized knowledge about the changes in transport behavior due to topographic modifications can be applied to inform future studies.
In this work, we explore the impact that embankment construction and channel dredging have on material transport in river delta environments via the use of numerical models. First, we simulate the evolution of natural river deltas with different input sediment compositions over a period of 150 years. Next, we modify the modeled “natural” topography to mimic channel dredging and island embankment and evaluate changes to flow and transport over timescales on the order of days. We simulate bankfull discharge at the inlet flowing into a receiving basin with and without a micro-tidal signal and use a Lagrangian framework to simulate the transport of material through the different landscapes under the modeled flow conditions. We compare model results to understand how different natural conditions (sediment composition), topographic modifications (dredging, poldering), and flow conditions (no tides, tides), influence the transport of material through the landscape.
2.1 Landscape modeling
To generate deltaic landscapes, we use the reduced-complexity model pyDeltaRCM (Moodie et al., 2021).
Based on the original DeltaRCM model (Liang et al., 2015), pyDeltaRCM simulates the inception and growth of a river delta from an inlet channel through which a steady flow of water and sediment enters a receiving basin.
We simulate reduced-complexity hydrodynamics and sediment transport processes using discrete quantities of water and sediment which move through the domain via a series of weighted random walks, with weights calculated based on physically based rules (Liang et al., 2015).
This methodology enables deltaic evolution to be simulated over hundreds of years under different forcing conditions (e.g., Liang et al., 2016b, a; Lauzon and Murray, 2018; Lauzon et al., 2019; Piliouras et al., 2021; Hariharan et al., 2021; Moodie and Passalacqua, 2021).
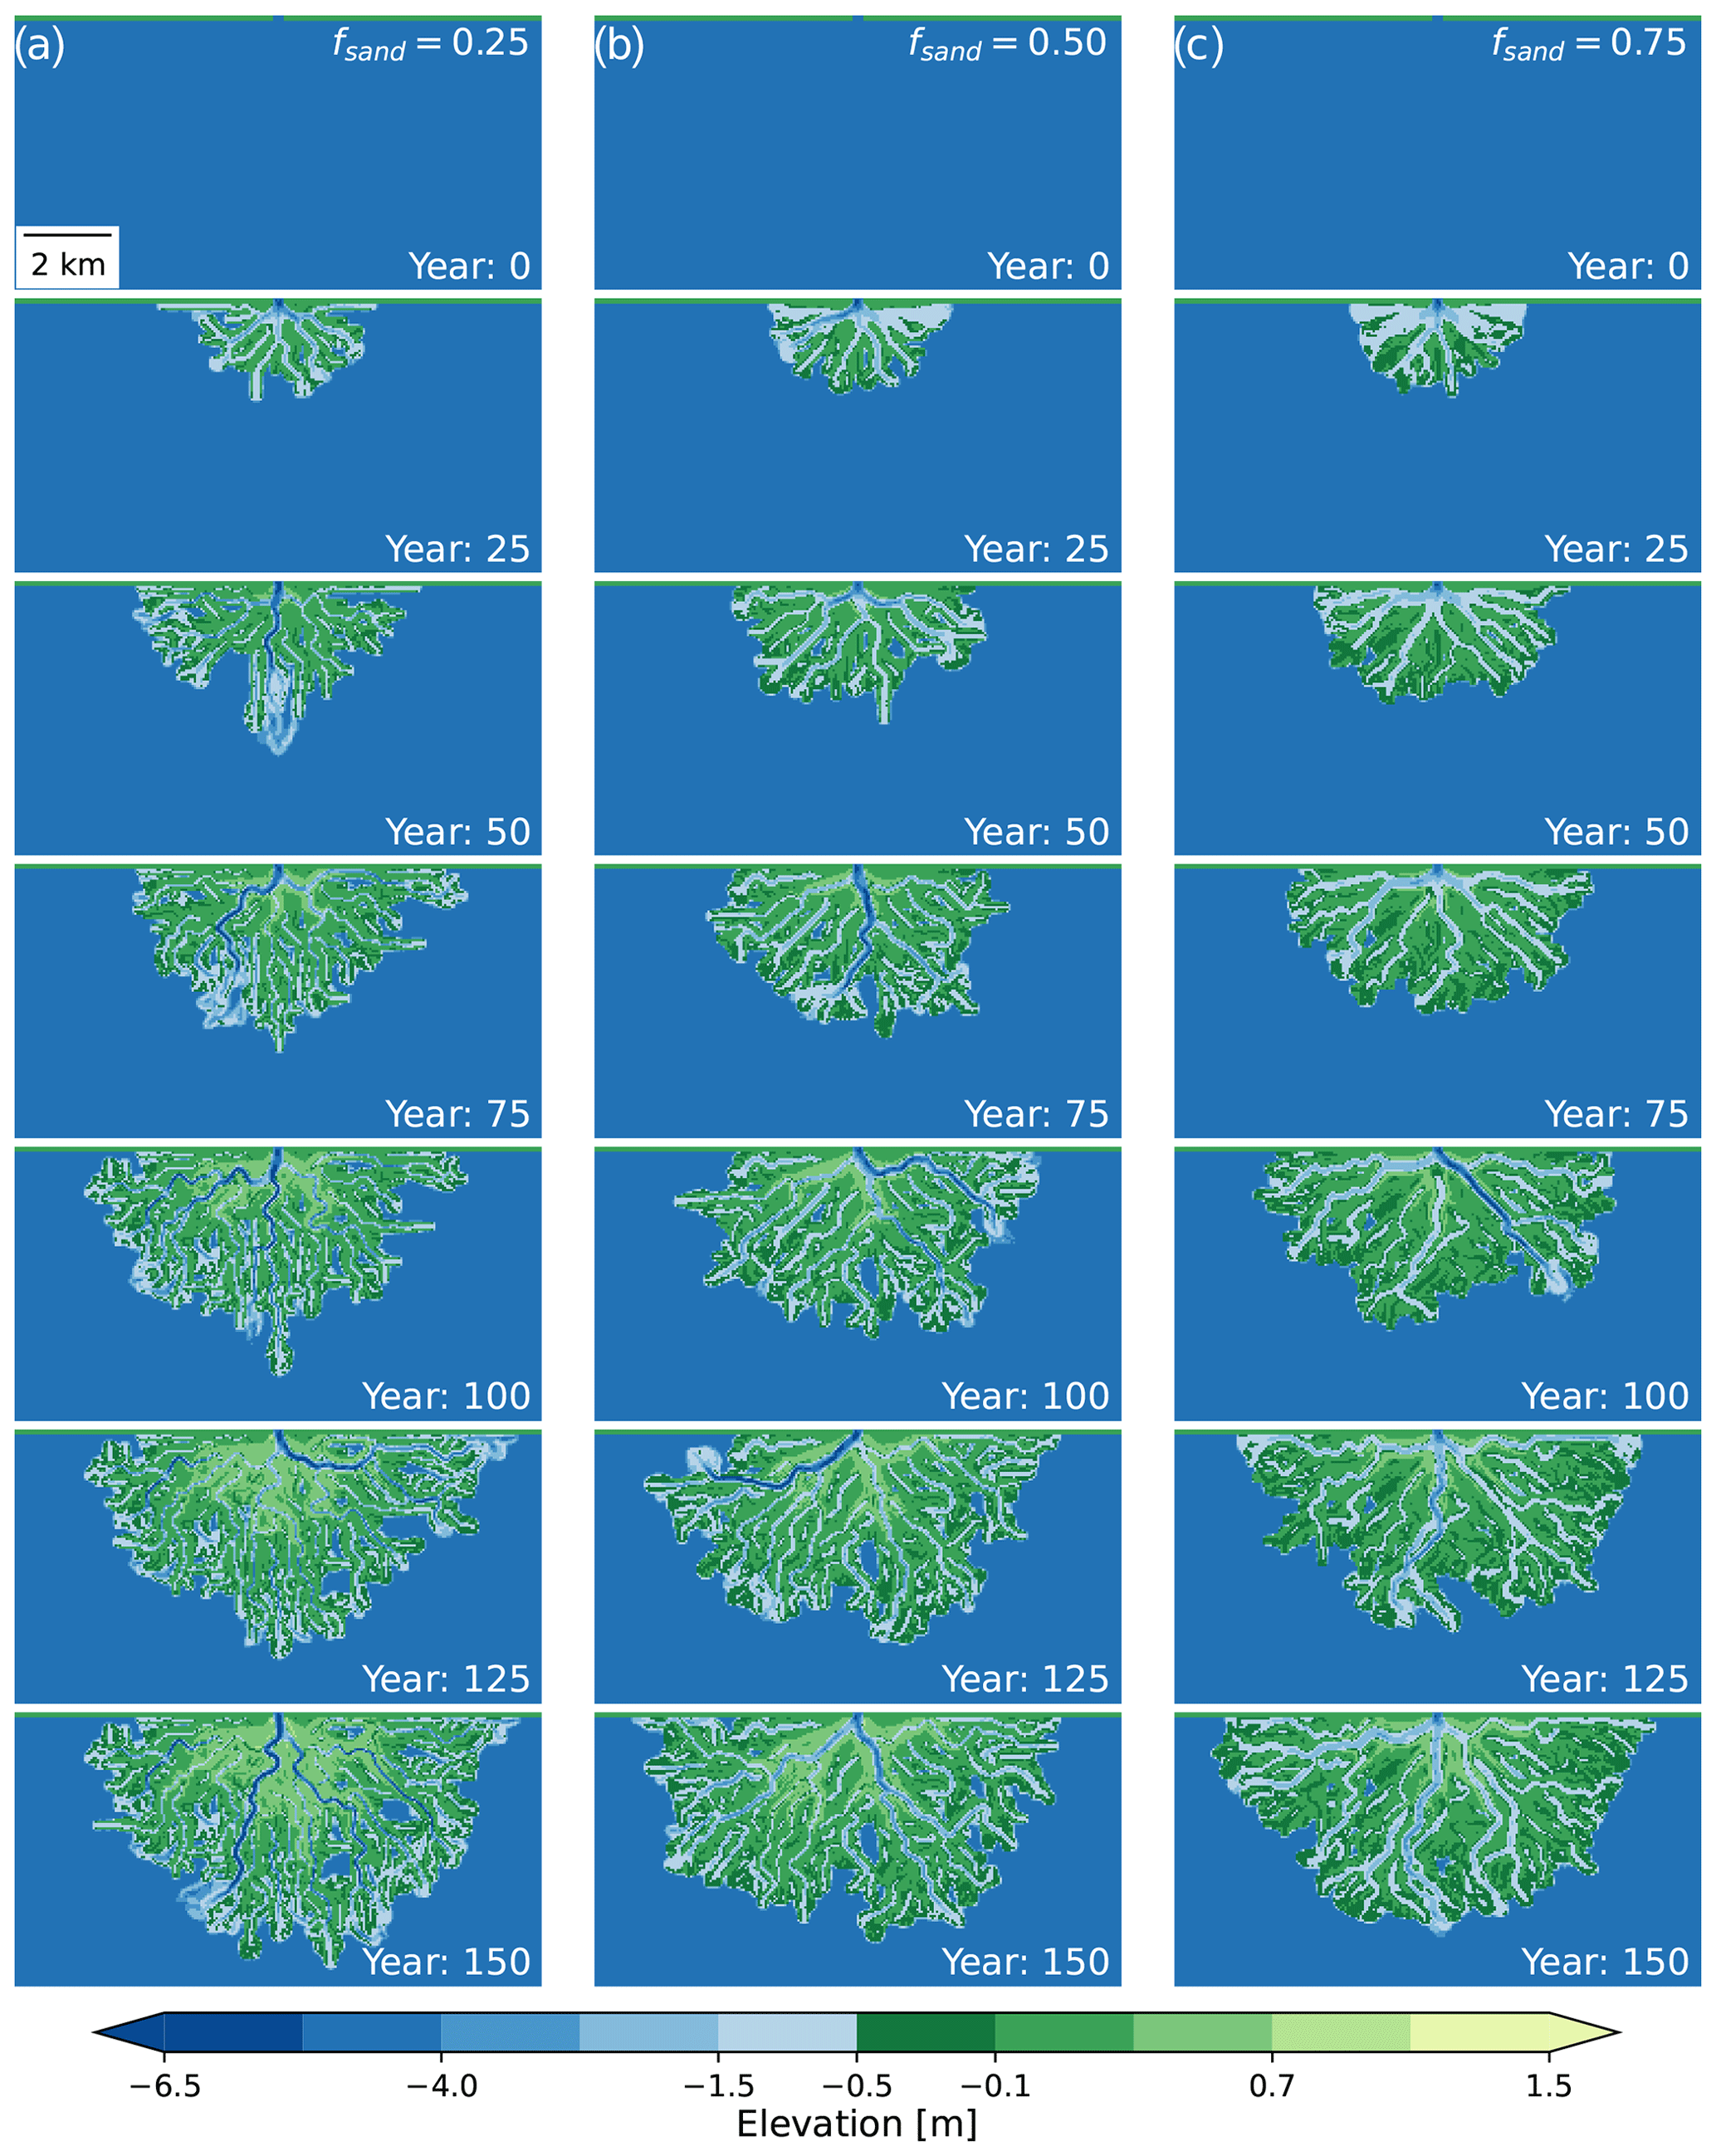
Figure 1Example time series of delta evolution for each of the sand fraction scenarios before any topographic modification: (a) 25 % input sand, (b) 50 % input sand, and (c) 75 % input sand.
In this work we simulate delta evolution over a period of 150 years (Fig. 1). We scale modeled bankfull time using an assumption of 10 bankfull days per year to obtain an equivalent scaled time of 150 years (Caldwell and Edmonds, 2014; Liang et al., 2016b; Lauzon and Murray, 2018; Lauzon et al., 2019). The basin dimensions (Fig. 2a), model parameters, and simulation duration are based on Liang et al. (2016b) and have been applied in other studies that use the same modeling approach (e.g., Lauzon and Murray, 2018; Lauzon et al., 2019). These modeling parameters, in particular the input flow velocity (1 m s−1) and resulting delta size (∼41 km2), are designed to be similar to the Wax Lake Delta (Liang et al., 2016b), which has flow velocities of roughly 1 m s−1 (Shaw et al., 2013) and a cumulative subaerial island area of ∼50 km2 (Olliver and Edmonds, 2017). The model simplifies both the inflow discharge and basin depth as constant values of 1250 m3 s−1 and 5 m, respectively. The real Wax Lake Delta in contrast has a variable discharge at the inlet, with an average value of 2800 m3 s−1 and a basin that grows deeper with distance from the river mouth (Wright et al., 2022b).

Figure 2(a) The pyDeltaRCM computational domain. (b) The ANUGA computational domain. (c) An example of deltaic topography. (d) The extracted delta extents for that topography. (e) The extracted regions of channels and land, defined by topography, within the delta.
Sediment is divided into two classes in the pyDeltaRCM model: sand, representative of coarse-grain material, and mud, representative of fine-grain material.
The composition of sediment introduced to the system, expressed as a sand fraction (fsand), influences surface morphology, channel mobility, and sediment arrangement in the subsurface (Liang et al., 2016b; Hariharan et al., 2021).
In this work we simulate three input sand fractions (0.25, 0.5, and 0.75) and repeat each numerical experiment six times to obtain results representative of average ensemble behavior (Moodie and Passalacqua, 2021).
2.2 Human modifications to topography
To capture the influence of human modifications on transport processes within deltaic landscapes, we develop two automated workflows to modify the final pyDeltaRCM topography (Fig. 3).
The first deepens the primary active channel to simulate the dredging of a shipping or navigation channel (e.g., Fig. 4d–f).
The second raises the land of the largest contiguous island on the delta surface to mimic the effect of embanking or poldering a region for human habitation, agriculture, or industrial activities (e.g., Fig. 4g–i).
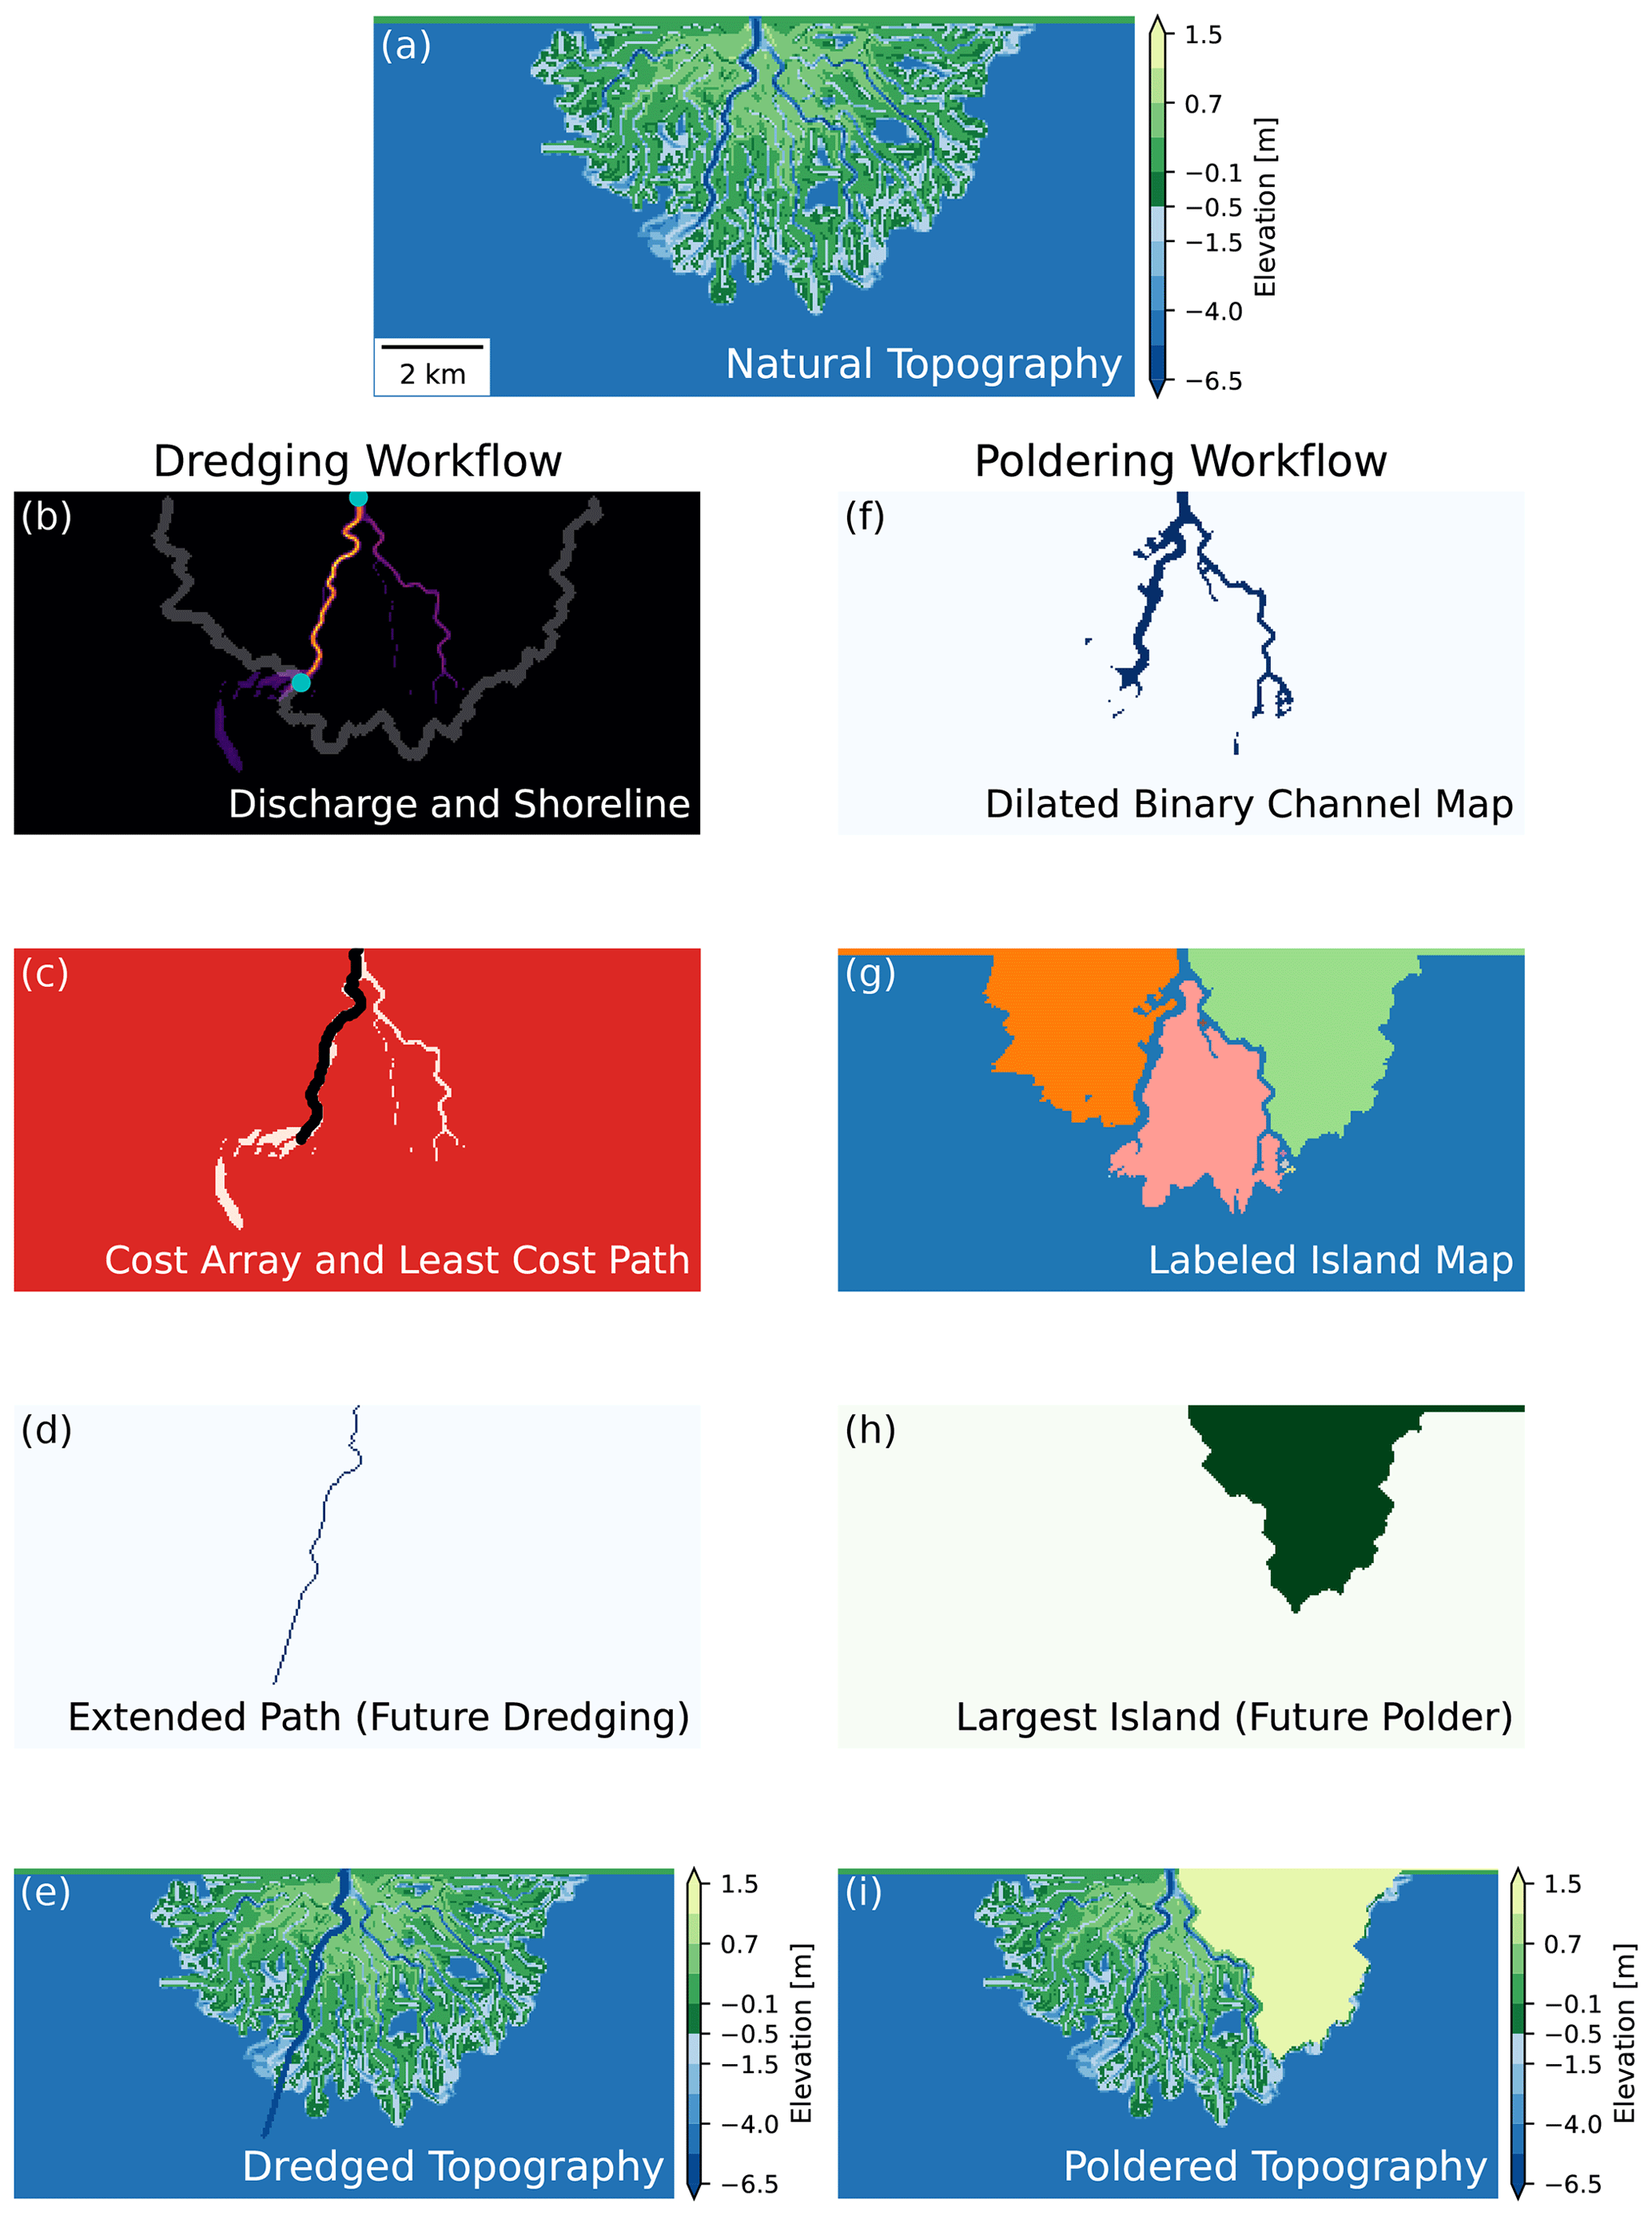
Figure 3Examples of the two topography modification workflows starting from one final topography (a). (b–e) The dredging workflow. (f–i) The poldering workflow.
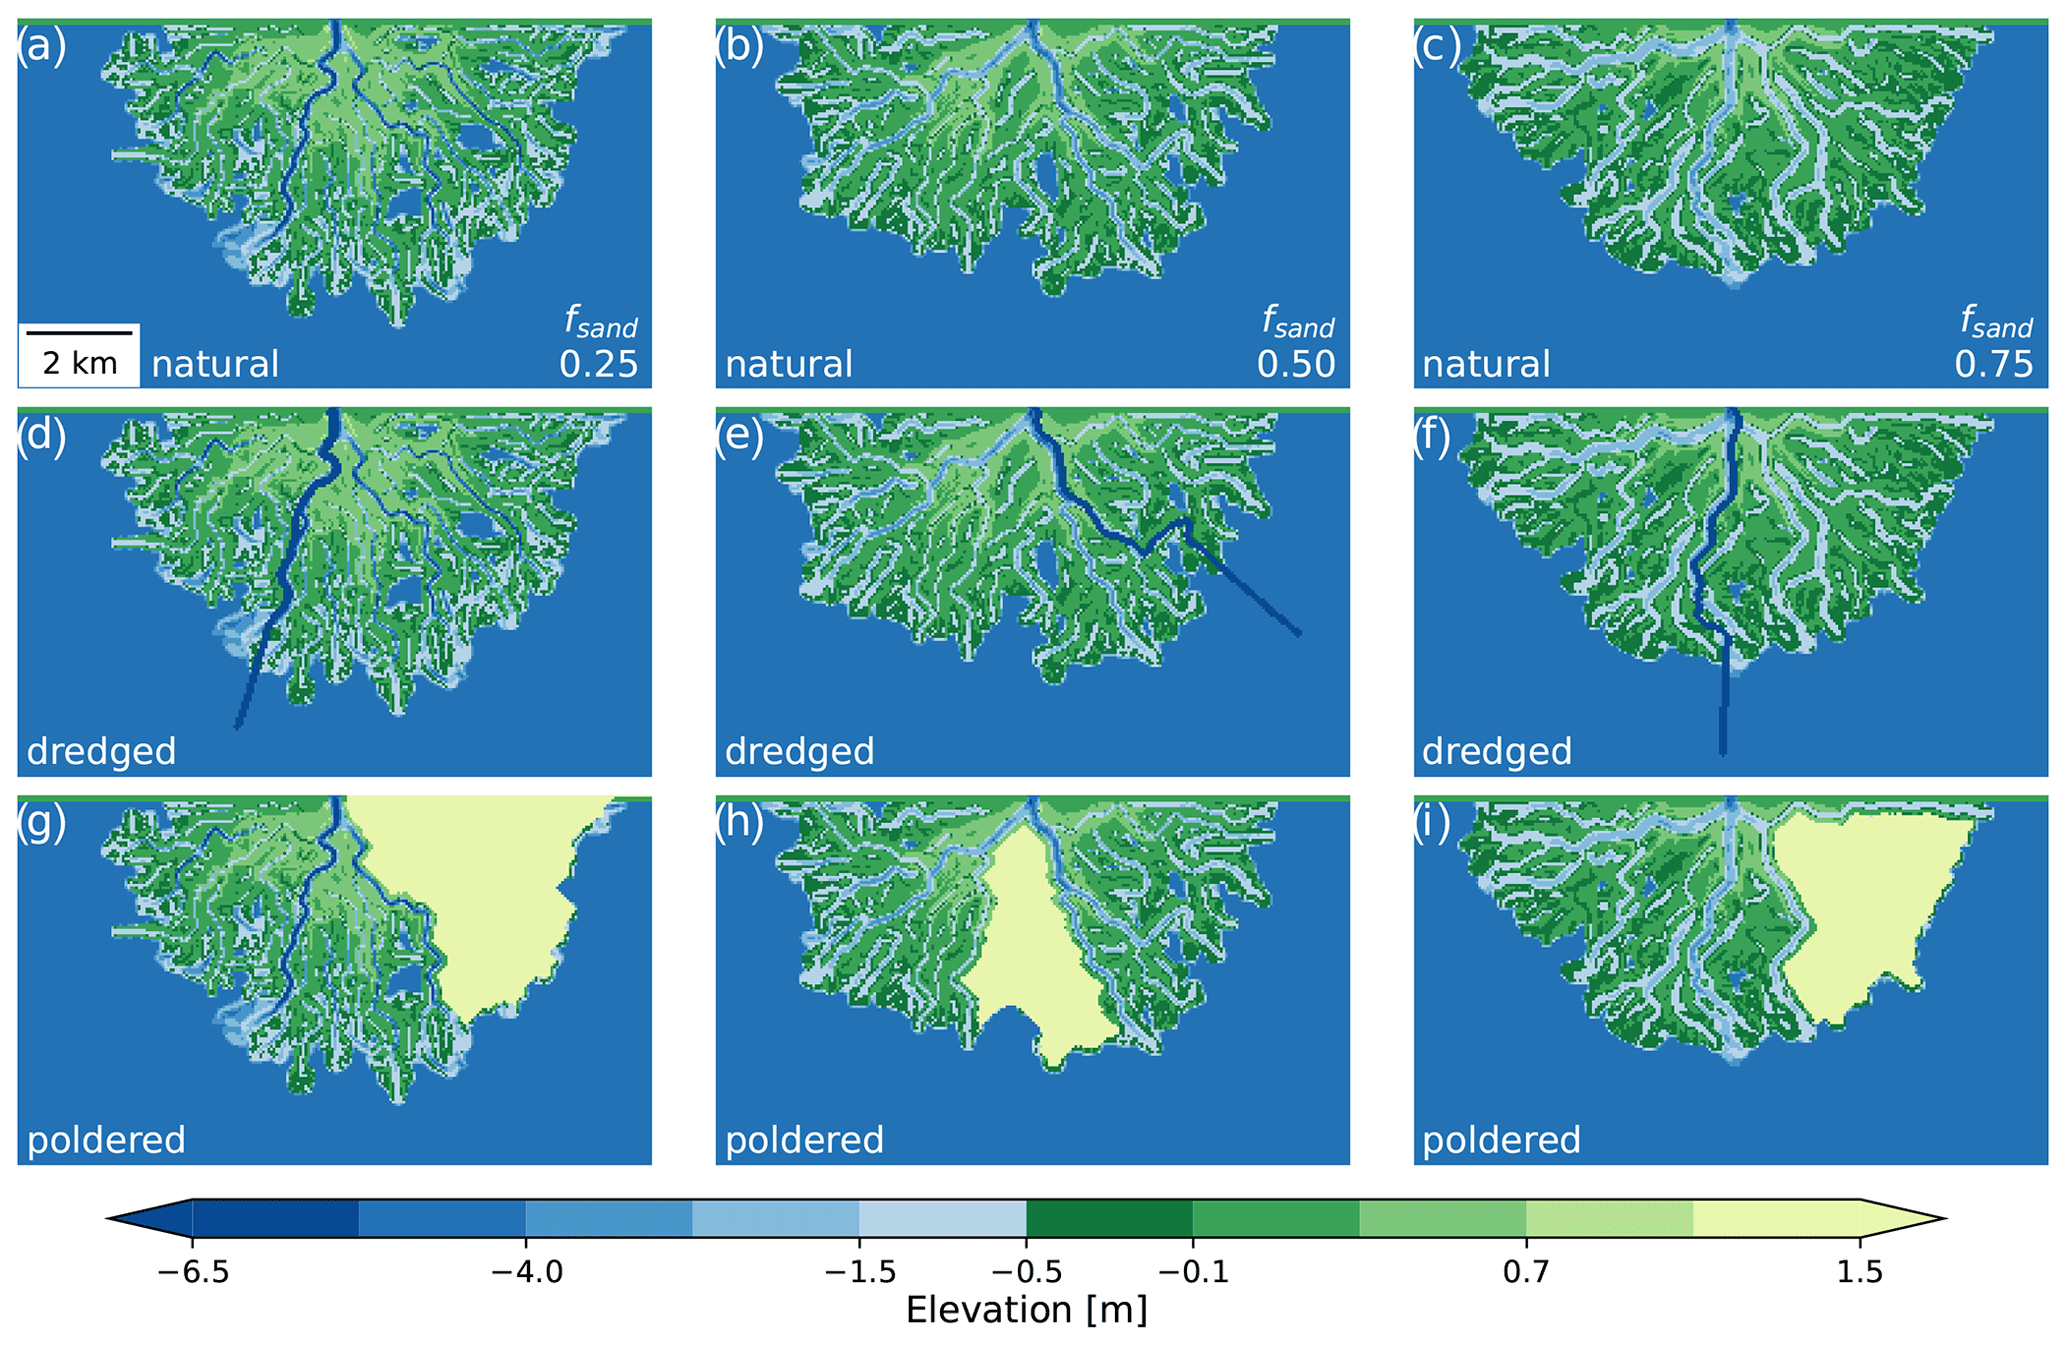
Figure 4Examples of the different topography modifications. (a–c) “Natural” delta topographies with no human modifications. (d–f) “Dredged” delta topographies where the dominant channel has been dredged to a depth of 10 m b.s.l. (g–i) “Poldered” delta topographies where the largest island is identified and raised to an elevation of 10 m a.s.l.
2.2.1 Channel dredging
We identify and artificially deepen the channel conveying the most flow at the end of the pyDeltaRCM simulation to simulate dredging.
First, we identify the position of the deltaic shoreline using the
opening angle method (Shaw et al., 2008) using the largest three view angles
(p=3 per Shaw et al., 2008; see their Appendix A),
a threshold angle of 75∘, and an elevation threshold of 0.5 m below sea level (m b.s.l.) to include the low-lying shallow marine environment (Liang et al., 2016b). Next, we morphologically dilate this shoreline twice using a square structuring element with a connectivity of 1, effectively widening it by two pixels in both directions. We then intersect this dilated shoreline with the array of water discharge values (Fig. 3b). From this shoreline–discharge intersection we identify the location of maximum discharge along the shoreline and define the minimum cost path (van der Walt et al., 2014) connecting the inlet to this point along a cost array, which we define using the discharge array, assigning values of −1 where discharge exceeds 1 m3 s−1 and 100 elsewhere (Fig. 3c). This routine identifies the largest channel on the delta. We further extend this path 2 km into the receiving basin in the direction of the vector connecting the inlet and the channel outlet previously identified along the shoreline (Fig. 3d). We morphologically dilate this single-pixel path once to mimic a dredged channel wide enough for shipping, producing a three-pixel-wide (150 m) dredged channel. Then, we lower the topography along the entire channel path to an elevation of −10 m, 5 m below the inlet channel depth and deeper than natural channels in the delta (Fig. 3e). We choose −10 m as our dredged channel depth as this is similar to dredged depths in real navigational channels, such as those in the Western Scheldt estuary (14.5 m, van Dijk et al., 2021) and the Corpus Christi Ship Channel (14.33 m, Valseth et al., 2021).
In this simplified dredging scheme we do not account for spoil material.
2.2.2 Island poldering
We conduct simplified poldering, or embanking, of the largest island in the simulated deltas by raising its elevation to 10 m above sea level (m a.s.l.). First, we use the previously identified shoreline to delineate the land extents of the delta (Fig. 2d). Then, we threshold the water velocity array using a value of 0.3 m s−1, the modeled sediment mobility threshold, to identify channelized pixels (Liang et al., 2016b). We perform a morphological closing operation on the array of channelized pixels to connect some of the smaller channel features (Fig. 3f). A morphological closing operation is a morphological dilation, followed by a morphological erosion, a process which filters out single-pixel “noise” (Serra, 1982), in this case removing individual land pixels present in the middle of channels, whose presence can artificially reduce connectivity in small channels in the model. Next, we subtract the array of channelized pixels from the land extents to isolate the individual islands (Fig. 3g). From these individual island objects, we identify the largest by area as the one which will be raised (Fig. 3h). We apply a morphological closing operation to this island area to close off any small channels and embayments, and then we perform a morphological erosion operation twice using a square structuring element with a connectivity of 1, effectively shrinking it by two pixels, to prevent the poldered landmass from encroaching on adjacent active channels. Finally, we raise the topography in the location of this modified island footprint to an elevation of 10 m, an elevation representative of some of the highest embankments found in real deltas (Wang et al., 2021), well above the sea level of 0 m (Fig. 3i). In this simplified poldering scheme we assume the embankment material has been sourced off site. We design our simplified embankments such that they will not be overtopped, a common practice in numerical studies (e.g., Angamuthu et al., 2018); so whether or not the interior is raised does not influence the results.
2.3 Hydrodynamic modeling
We simulate sub-annual hydrodynamics using the ANUGA model (Nielsen et al., 2005; Roberts et al., 2015).
ANUGA provides a finite-volume solution to the shallow-water equations over an unstructured triangular mesh, enabling the simulation of unsteady and tidal-flow conditions that the pyDeltaRCM reduced-complexity solution does not provide.
We chose the ANUGA model because it has been previously used in coastal environments (e.g., Kain et al., 2020; Wright et al., 2022b), is fully parallelizable via the Message Passing Interface (Roberts et al., 2007), and is open source (Roberts et al., 2015). We define an unstructured mesh with variable cell resolution, such that the high-resolution area encompassing the original pyDeltaRCM computational domain has a maximum triangle area of 1250 m2, which is half the area of a pyDeltaRCM cell, to ensure that all topographic features simulated on the regular grid are captured (Fig. 2b; see Table A3 for mesh edge length statistics). In the areas of the ANUGA computational domain that extend beyond the pyDeltaRCM domain, we apply a coarser resolution and set the elevation of the triangles based on the receiving pyDeltaRCM basin (−5 m). Within the delta, we apply a k-nearest-neighbor interpolation using an inverse-distance weighting to the three nearest neighbors (Maneewongvatana and Mount, 1999; Virtanen et al., 2020) to translate topography values from the pyDeltaRCM model grid to the ANUGA mesh.
We use the interpolated topography information from pyDeltaRCM to initialize the ANUGA model for the steady-flow simulations.
We initialize the domain by filling cells with elevations below sea level (0 m) with water and then impose a small flow of 0.01 m3 s−1 in the direction of the inflow channel across the domain to accelerate model convergence to steady state.
Friction in the model is set as a constant Manning's n value of 0.04 across the domain, chosen to strike a balance between the lower values expected in channels and higher values expected in the floodplains (Chow, 1959).
In all ANUGA simulations we use the second-order temporal resolution numerical solver with the “low Froude” setting to reduce flux damping (Roberts et al., 2015; Wright et al., 2022b).
For the steady-state simulations we apply the same inlet discharge used in the pyDeltaRCM model (1250 m3 s−1) and define the boundary conditions on the top, left, and right sides of the domain as no-flow (reflective) boundaries and the bottom (bay-side) boundary as a Dirichlet boundary with a fixed water surface elevation of 0 m (Wright et al., 2022b).
We simulate steady-state bankfull discharge by running the model for 1 d (24 h) of simulated time using a 15 min yield step, which is the time interval at which model information is written to the output file.
By the end of the 24 h, the flow in the model has converged and has an average difference in stage values of 𝒪(10−5 m) for locations within and near the delta between the final two recorded time points for all scenarios.
For the unsteady tidal simulations we use the final steady-state flow information to initialize the model.
At the bottom (bay side) boundary, we define a semidiurnal tidal signal using a sine wave with an amplitude of 0.25 m, a period of 12 h, and a mean value of 0 m (sea level) based on numerical models developed for the Wax Lake Delta (Olliver et al., 2020; Wright et al., 2022b), a system of similar size and basin properties to our pyDeltaRCM-simulated landscapes (Liang et al., 2015, 2016b).
We run the unsteady simulations for a total of 24 h, capturing two full tidal cycles, with a yield step of 15 min, a temporal resolution which has been found to be sufficient for capturing time-varying dynamics in ANUGA simulations of both deltas (Wright et al., 2022b) and river–floodplain systems (Tull et al., 2022).
Comparisons of stage values in the region in and near the delta for all simulations reveal average differences of 𝒪(10−4–10−5 m) when comparing across five equivalent time points between the two tidal cycles.
2.4 Particle routing
We transform the unstructured ANUGA output data back to a rectilinear grid with 50 m×50 m cells using the same inverse-distance interpolation based on the three nearest neighbors to each grid cell. On the gridded hydrodynamic flow fields, we perform Lagrangian particle routing using the passive particle package dorado (Hariharan et al., 2020). dorado adapts the DeltaRCM weighted random walk scheme to move passive particles through a flow field while tracking the transport time associated with each individual particle movement, as well as its location. For each “step” a particle takes, dorado computes its transport time (Tt) using the harmonic average of velocity values taken from the origin (o) and destination (i) locations,
where deq is the distance the particle travels along the mean flow path, dc is a diffusivity coefficient (set to the default value of 0.2), and is a uniform distribution centered at 0. For the tidal hydrodynamic simulation results, because our tidal signal is periodic, we loop the final full semidiurnal ANUGA output data (12–24 h) for 7 d to create the set of flow fields over which we route the particles. To ensure that the unsteady particle results are not influenced by the point within the tidal cycle at which they were injected, we inject 250 particles at the apex every 15 min over the first full tidal cycle (Wright et al., 2022a), for a total of 12 000 particles. We match this process for the steady hydrodynamic simulation results, except we use the final ANUGA flow information (Fig. A1), as the flow fields are unchanging in time. In both the steady and unsteady cases, we route the particles through the domain for the remainder of the 7 d at a 15 min increment, matching the yield step of the ANUGA simulation results (Figs. A2 and A3).
We configure dorado to consider cells with water depths below 1 cm to be impassable to particles and define the dorado dispersion parameter (γ) using the default value of 0.05 (Liang et al., 2015; Hariharan et al., 2020; Tull et al., 2022). In dorado, the weighted random walk taken by the particles involves a combination of the water surface slope and discharge to determine the downstream direction from any given point, F∗ (Liang et al., 2015; Hariharan et al., 2020). Using this downstream direction, the weight for adjacent cell i is computed as
where di is the downstream unit vector, Δi is the distance downstream, and hi is the water depth of the downstream cell and is raised to the user-defined parameter θ (Liang et al., 2015; Hariharan et al., 2020). In the DeltaRCM framework, this θ parameter is varied to mimic the behavior of different sediments, as it controls the dependence the random walk weights have on water depth. Wright et al. (2022a) suggest that θ can be varied to simulate the transport behavior of different material types. For example, positively buoyant material would be modeled using θ<1, while negatively buoyant material would use θ>1 (Wright et al., 2022a). In this work we select three θ values, 0, 1, and 2, to simulate the movement of positively, neutrally, and negatively buoyant material, respectively (Fig. A4).
2.5 Topographic Delineation of Channels and Islands
To quantify particle behavior within different regions of the broader landscape, we divide the delta into active channels and islands (land) based on topography. We elect to threshold the individual models by topography rather than any aspects of the flow behavior, as the anthropogenic modifications alter the flow through the landscape, potentially confounding any particle results calculated using flow-based delineations. To quantify the bulk behavior of particles within the delta channels and islands, we threshold the topography at an elevation of −0.5 m (after Liang et al., 2016b; Lauzon and Murray, 2018), and identify the largest contiguous set of cells with elevations below −0.5 m. We define those cells as the combination of the channel network and the ocean cells and mask them using the delta extents (Fig. 2d) to determine the topographic channel area within the delta (Fig. 2e). Next we invert this map of the topographic channels to identify the delta islands (Fig. 2e). Using these two classes it becomes possible to disentangle particle behavior within the delta landscape to distinguish between the behavior of particles within channels and those within islands, which is important to understand as significantly greater amounts of biogeochemical processing occur within deltaic islands than channels (e.g., Hiatt et al., 2018; Knights et al., 2020).
2.6 Nourishment areas
We apply the idea of nourishment areas for distributary networks (Edmonds et al., 2011) to capture the area of the delta surface visited by the passive particles. In addition to capturing the locations visited by particles, we quantify the normalized visit frequency for every location within the delta (Fig. 5; Wright et al., 2022a). For all nourishment area metrics, we clip the particle paths to the land extents of the delta (as defined in Sect. 2.2.2; Fig. 2d).
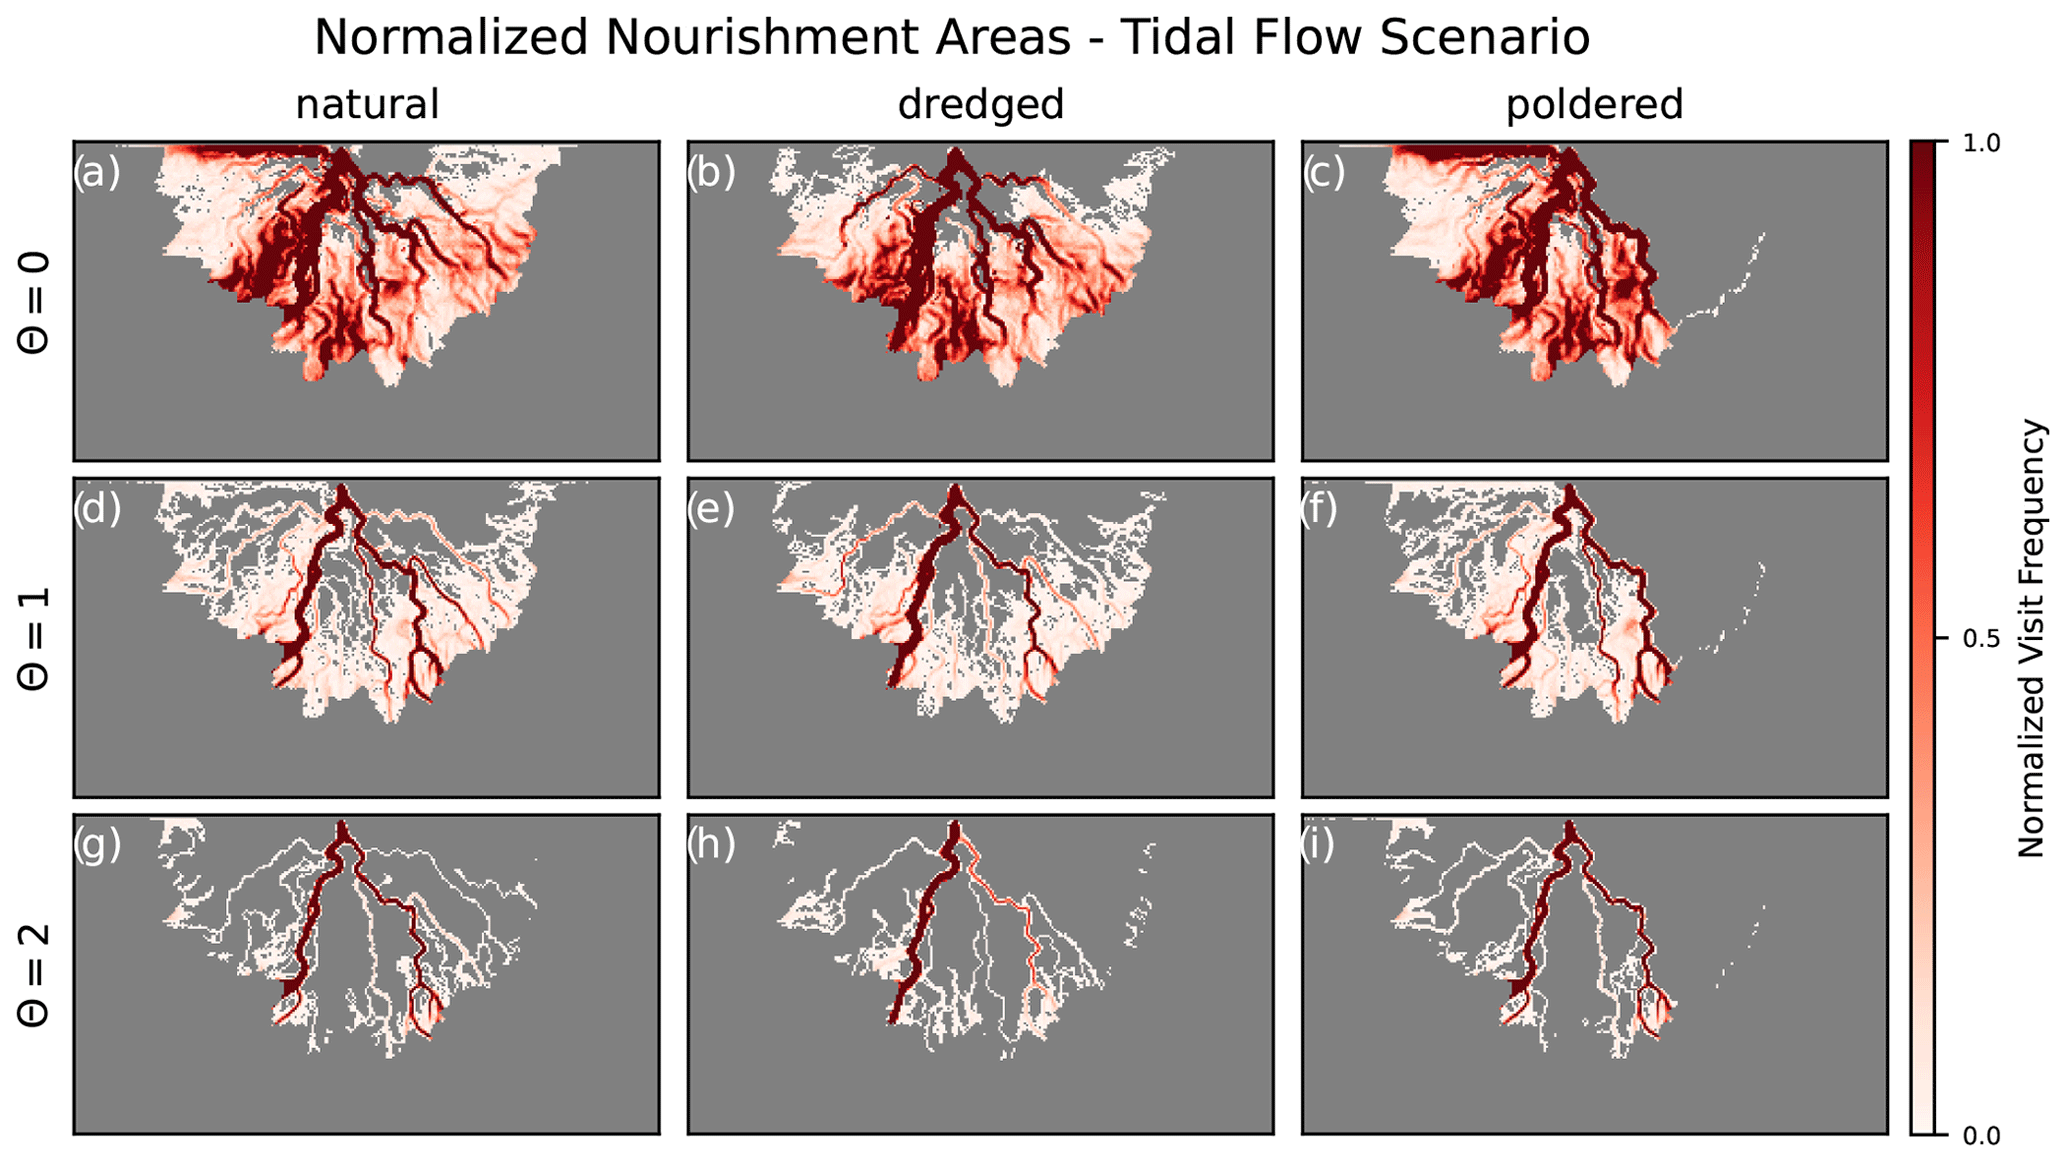
Figure 5Examples of normalized nourishment frequencies for particles routed for 7 d in the tidal scenario over the topographies shown in Fig. 4a, d, and g (fsand=0.25) with different θ parameters to simulate the transport of material through different locations of the water column.
2.7 Exposure times
We calculate exposure times for individual particles within a defined area by summing the amount of time a particle spends within that region. A particle's individual exposure time reflects the total amount of time the particle spends within the defined area of interest, even if the particle enters and exits the region multiple times over the course of its travel (Hiatt et al., 2018). Using this methodology, we define exposure time distributions for groups of particles across all modeled scenarios for the different hydrodynamic scenarios simulated (Sect. 2.3) to compare the influence that sediment composition, flow conditions, and topographic modifications have on the transport of different kinds of material. While we do not explicitly consider any particular nutrients or chemicals in this study, exposure times are commonly used to estimate nutrient removal and other eco-geomorphic processing taking place within the landscape (e.g., de Brauwere et al., 2011; Viero and Defina, 2016; Hiatt et al., 2018).
3.1 Influence of anthropogenic modifications on hydrodynamics
Anthropogenic modifications alter the flow through the delta, both increasing and reducing flow velocities in various locations by as much as ∼0.5 m s−1 (Fig. 6), a significant magnitude relative to the inlet channel flow velocity of 1 m s−1. The artificial deepening of a channel via dredging increases the flow velocity in the dredge channel while simultaneously decreasing velocities across the rest of the delta relative to the unaltered natural conditions (Fig. 6h). Poldering prevents water from entering and flowing through the embanked island, and this topographic modification increases the flow velocities in the non-poldered regions (Fig. 6i). When comparing flow velocities between the two anthropogenic modification scenarios, the dredged channel has higher flow velocities than the same channel in the poldered scenario, while the rest of the non-poldered areas of the delta have lower flow velocities than the poldered case (Fig. 6g). The extension of the dredge channel 2 km beyond the delta shoreline (Fig. 3) causes higher flow velocities along that channel even beyond the shoreline of the delta (Fig. 6g and h). These high flow velocities in the dredged channel enable material to travel faster through the delta and then rapidly travel some distance offshore (Figs. A2 and A3).
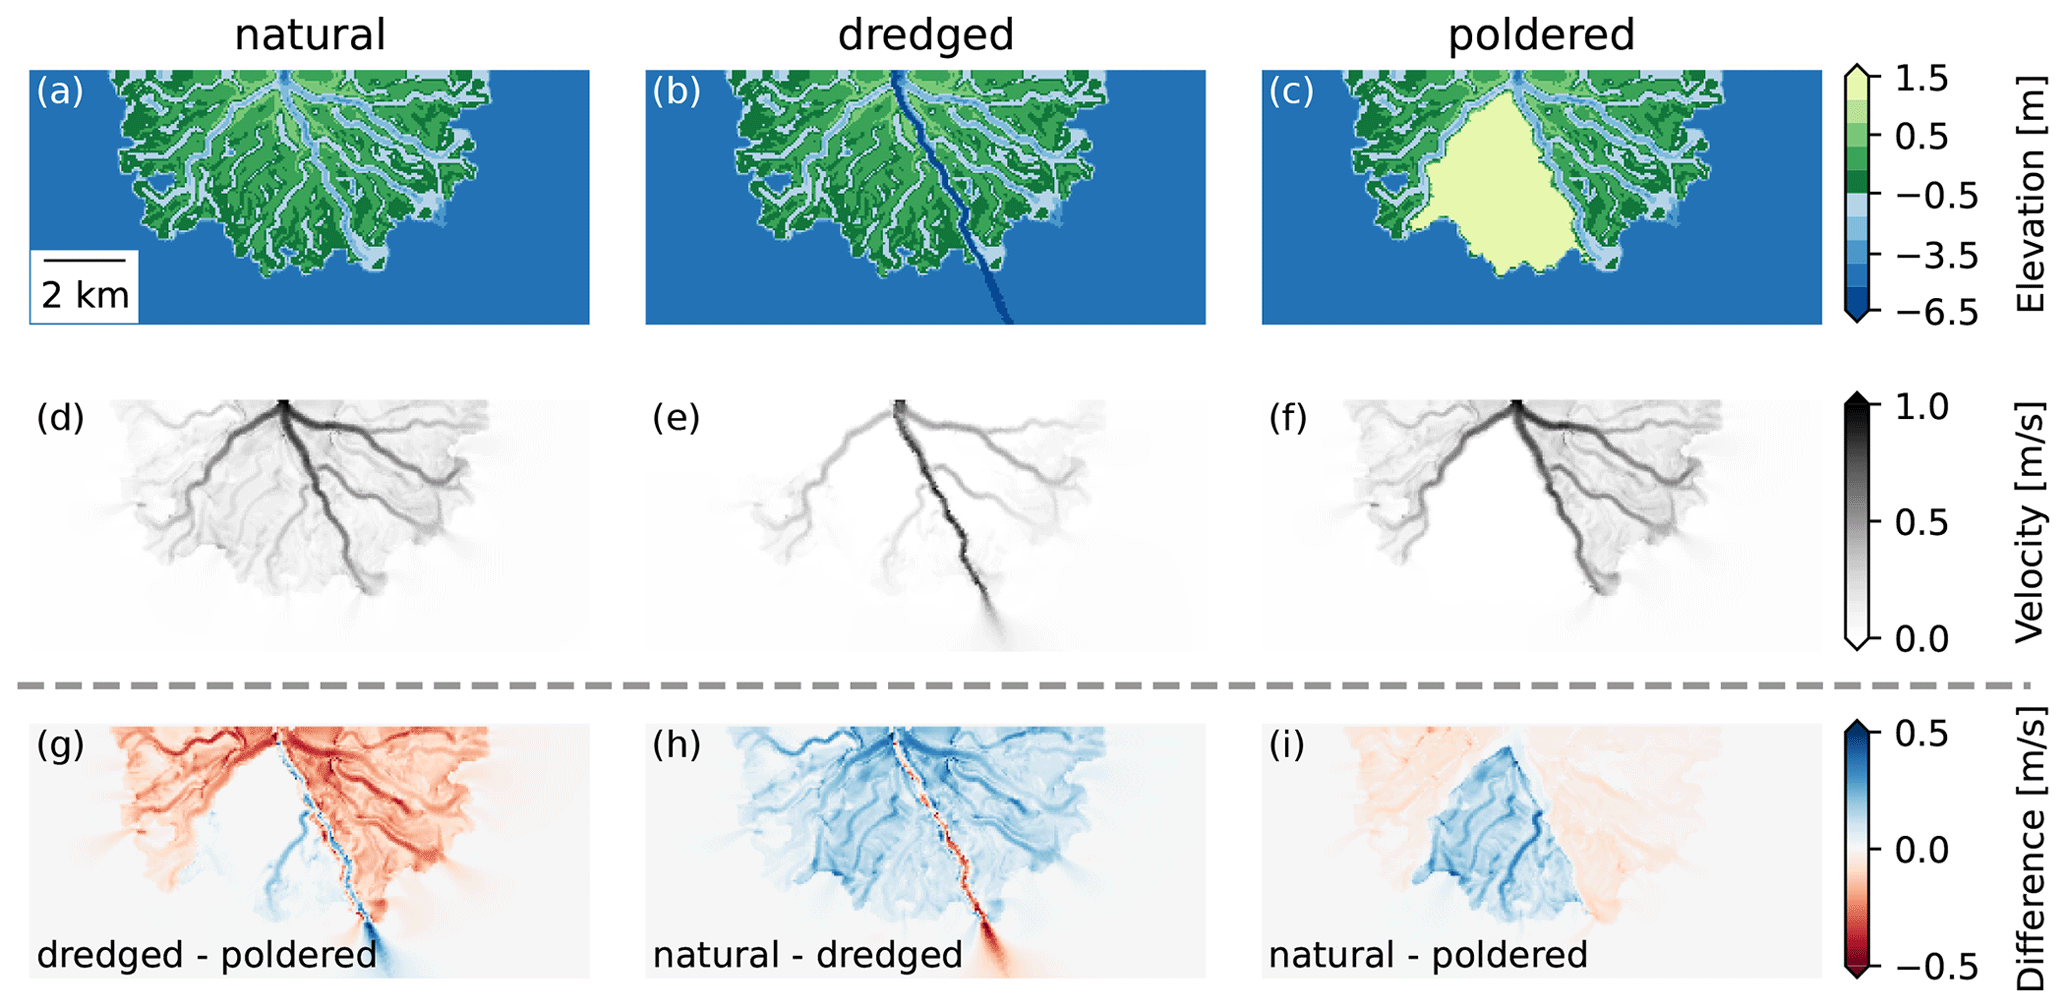
Figure 6Visualizations of steady-state hydrodynamics (Sect. 2.3). (a–c) Example model topographies. (d–f) Corresponding ANUGA steady-flow velocities. (g–i) Difference maps between flow velocities from the scenarios shown in panels (d–f).
3.2 Area nourished
We find that the θ parameter, conceptually linked to the vertical position within the water column of the material being transported, has a significant impact on the deltaic area nourished by particles. When θ=0 (positively buoyant material), the majority of the wetted delta surface is visited by particles (Fig. 5a–c). Conversely, when θ=2 (negatively buoyant material), the particles stay predominantly within the larger channels of the system (Fig. 5g–i). The first-order differences in transport behavior associated with the type of material and its dependence on water depth for transport can be seen across deltas formed by different input sediment loads and those with different topographic modifications (Fig. 7).
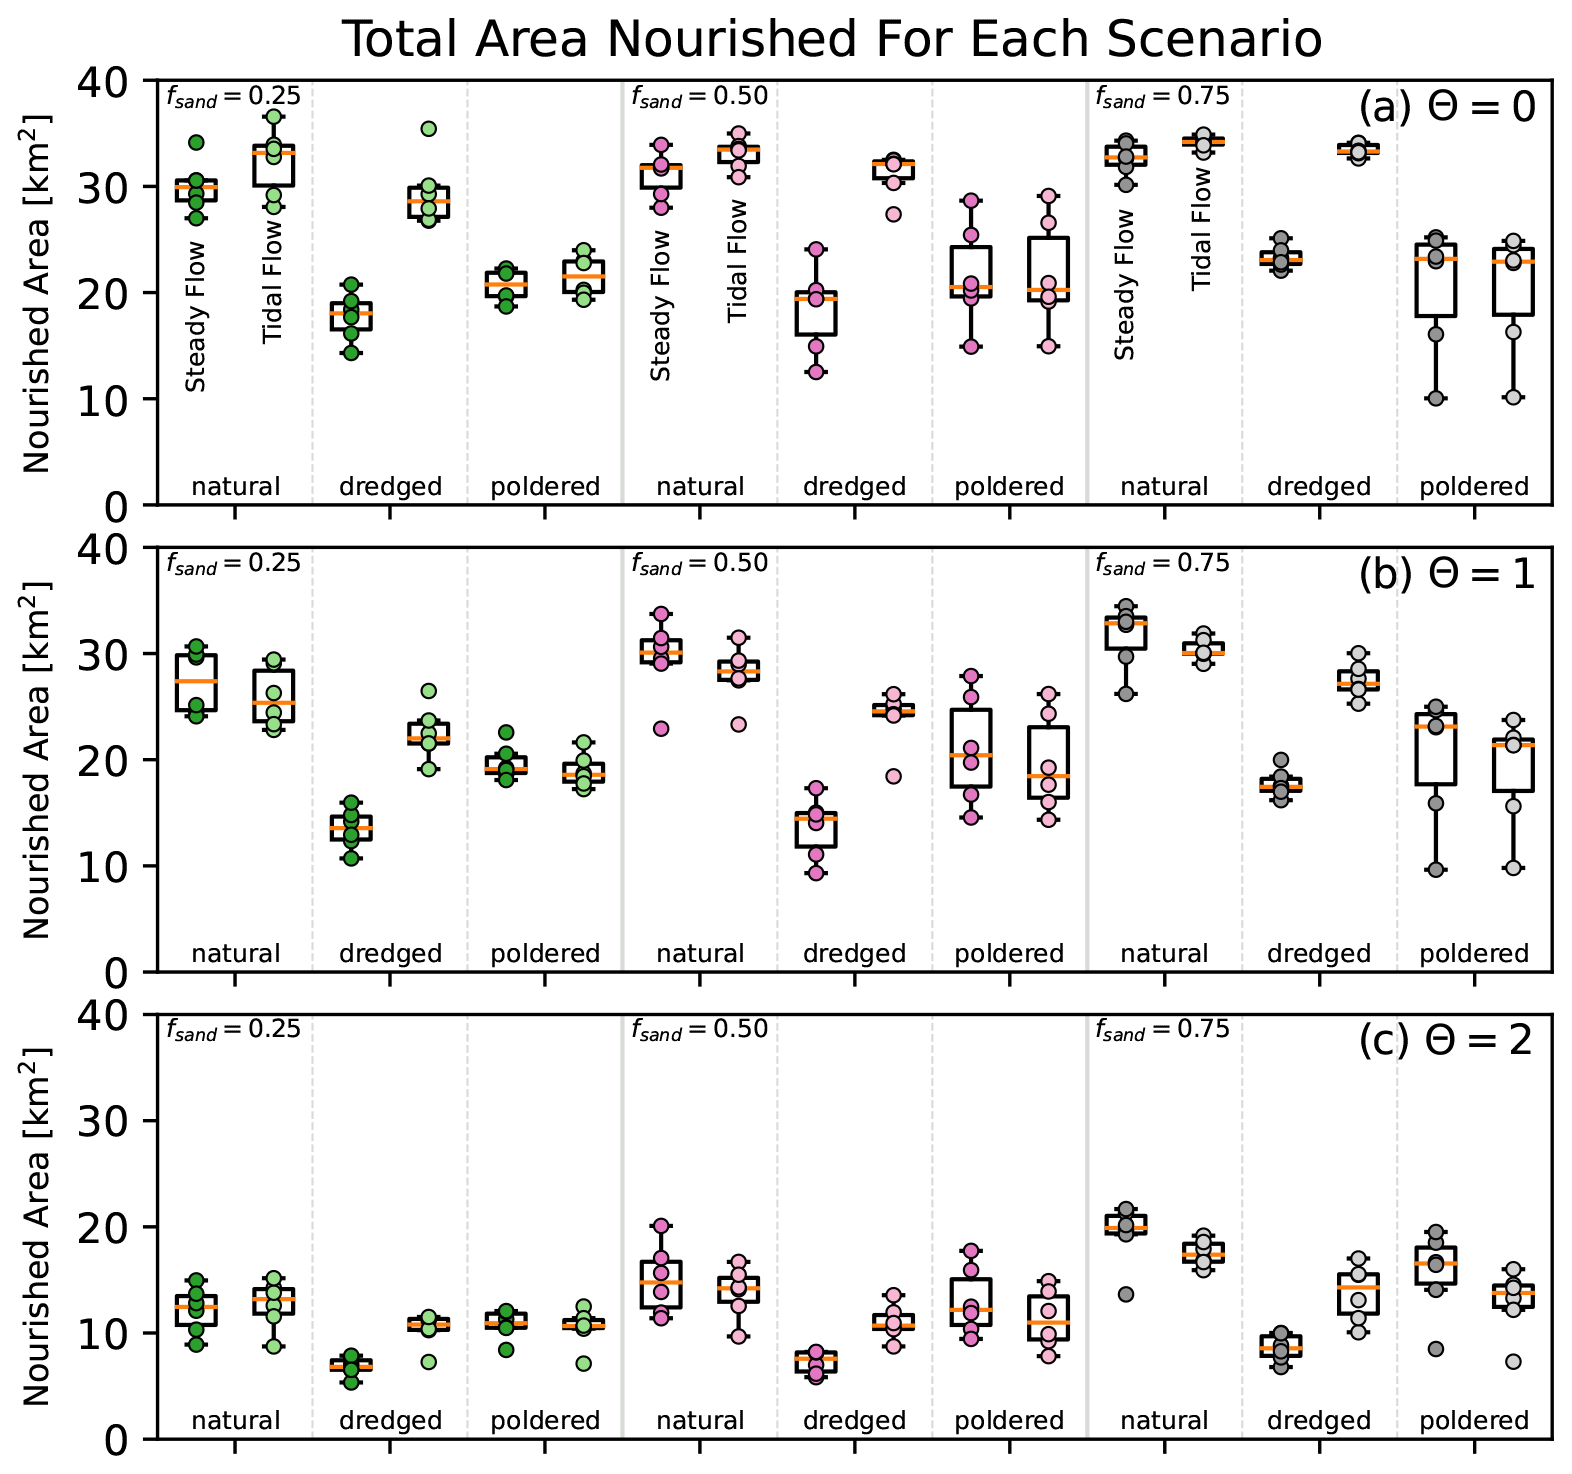
Figure 7Total area nourished (visited) by particles for each scenario. Individual model replicate results shown as points overlaid on boxplots of the same data. Data are identified by input sand fraction, flow regime, and topographic modification and further organized on separate axes by the θ parameter with (a) θ=0, (b) θ=1, and (c) θ=2. For select individual particle paths, see Figs. A5 and A6.
The flow regime has minimal influence on the total area nourished by particles in the natural and poldered scenarios. In the dredging scenario, however, the presence of tides consistently results in greater particle nourishment areas than the steady-flow simulations. This result holds true across all sediment compositions and particle material types when the main channel has been dredged (Fig. 7).
Human modification of delta topography reduces the area visited by particles in both the cases of channel dredging and island poldering (Fig. 7). Across the six model replicates per scenario, there is greater variability in the nourishment area of poldered topographies than the dredged topographies (Fig. 7). This result is consistent with the greater variability in polder areas compared to dredged channel areas (Tables A1 and A2); we do not normalize nourishment area values based on the area of the embanked island or dredged channel.
The input sediment composition responsible for forming deltas also impacts the area nourished. Sediment composition is known to influence the morphology of natural deltas (e.g., Caldwell and Edmonds, 2014; Liang et al., 2016b; Lauzon and Murray, 2018; Hariharan et al., 2021). These morphological differences translate into differences in nourishment area, with the sandier deltas, known to have shallower channels (Liang et al., 2016b), having greater nourishment areas than the muddier systems (Fig. 7).
3.3 Particle island visitation
The fraction of particles within deltaic islands reveals an early pulse of island occupancy as particles are introduced to the system (0–12 h) followed by a decay for all materials and scenarios as particles exit the delta and enter the ocean (Fig. 8). Material type (θ) exerts a greater control over the fraction of particles within islands than the flow regime or topographic modification across all times and all scenarios (Fig. 8). Behavior between the natural and poldered topographies is similar across the different material and flow cases; however, the proportion of particles within islands is most reduced for the dredged topographies (Fig. 8). The tidal cases show the effect of tides either pushing particles upstream or accelerating their transport downstream based on the time. The tidal signal itself is visible in the time series plots when θ=0 (positively buoyant material). The sand fraction responsible for creating the underlying topography exerts some control over the overall fraction of particles able to visit the islands (Fig. 7), and this is further apparent in the time series plots as higher peaks (Fig. 8).
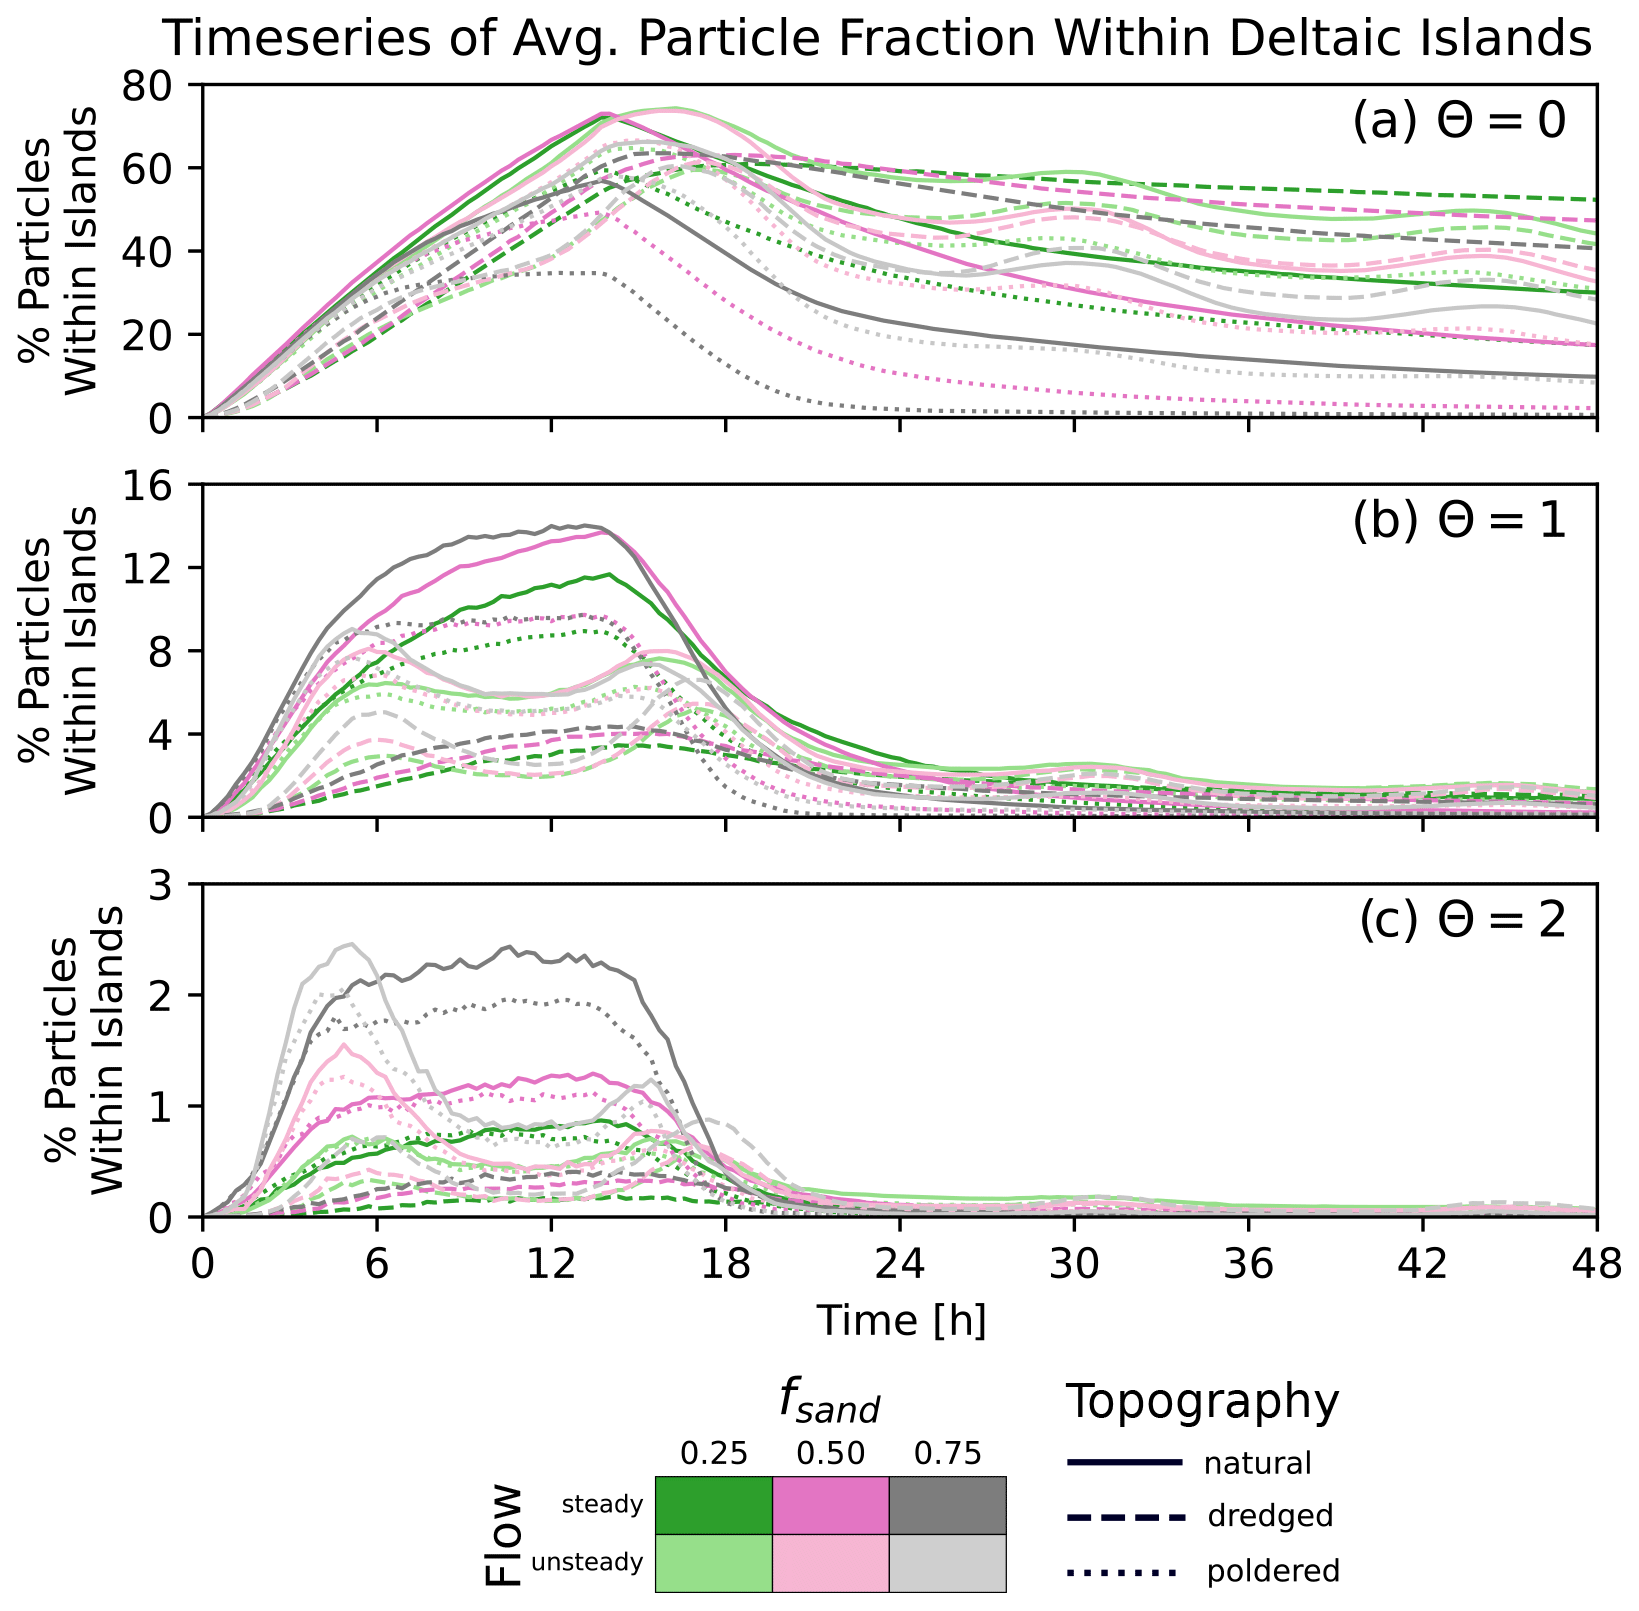
Figure 8Time series of the average percentage of particles to be within deltaic islands for the first 48 h over which the particles are routed for each modeled scenario. Data are grouped by θ value, with (a) θ=0, (b) θ=1, and (c) θ=2. In all of the unsteady (tidal) scenarios (pale colors) the influence of the tidal signal is visible. For θ=1 and θ=2 the local maxima in the plots correspond to the flood tide peaks at 3 and 15 h. In (a), the natural topographies with 25 % and 50 % input sand fractions experience the highest fraction of particles visiting islands, while the poldered cases have the lowest values. In (b) and (c) higher input sand fractions correspond to higher fractions of particles entering islands, while the dredged topographies experience markedly low fractions of particles in islands across all time. Note that individual panels have different y-axis limits, in (a) these values are near 80 %, in (b) they only approach 15 %, and in (c) they only near 3 %.
3.4 Particle exposure times
We plot the cumulative distribution functions for particle exposure times (Fig. 9) calculated over the full delta extents (e.g., Fig. 2d). To the first order, exposure times are controlled by the type of material being transported, with positively buoyant material (θ=0) spending more time within the delta than negatively buoyant material (θ=2, Fig. 9). Across all material types the exposure times appear to be longer for muddier landscapes. Dredging lengthens exposure times, while poldering shortens them relative to the distributions associated with natural systems for all θ parameter values considered. When θ is zero (positively buoyant), tidal-flow conditions visibly lengthen exposure times of particles, while this trend is both less consistent and less visible for higher values of θ (less buoyant material).
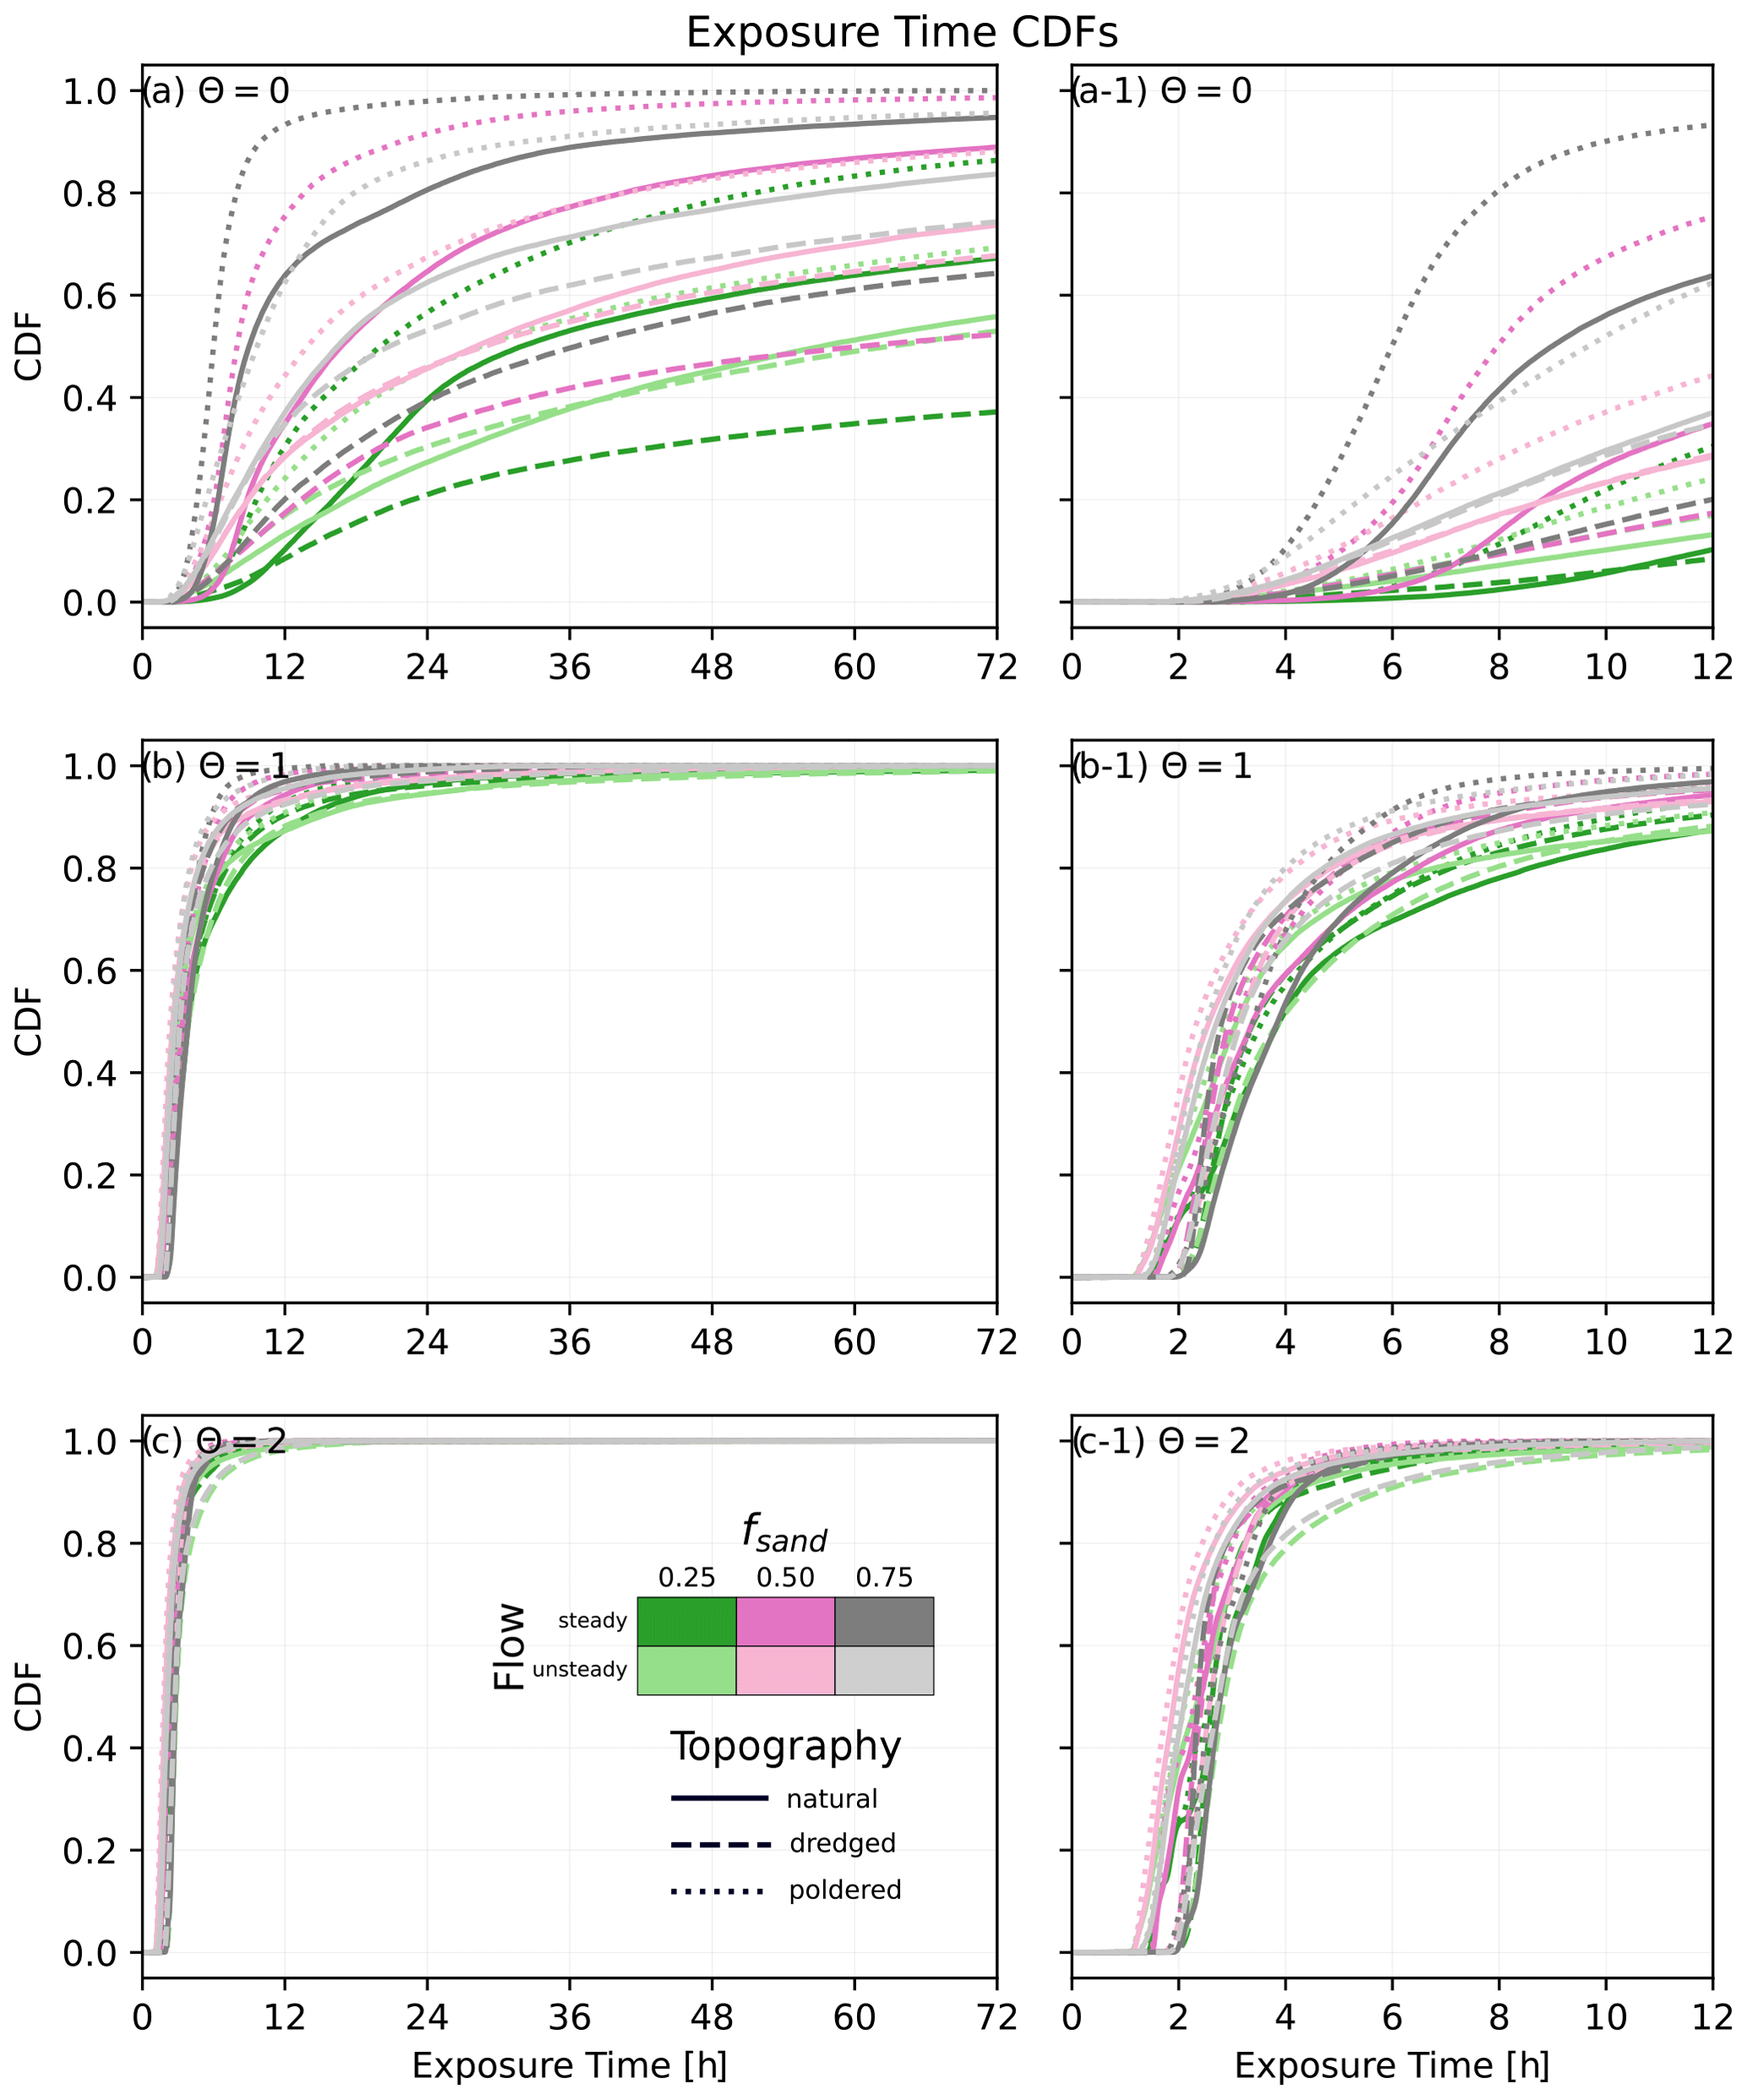
Figure 9Exposure time cumulative distribution functions (CDFs) for the different scenarios calculated over the full delta extents (e.g., Fig. 2d). Data are grouped by θ value, with (a) θ=0, (b) θ=1, and (c) θ=2, with the (a-1, b-1, c-1) designations for zoomed in plots of the same data.
When exposure time distributions are calculated within the topographically delineated channel and island regions (e.g., Fig. 2e), the results are varied (Fig. 10). For θ values of 1 (neutrally buoyant) and 2 (negatively buoyant), exposure times for particles within channels (Fig. 10c and e) are similar to the overall exposure times of particles across the entire delta extents (Fig. 9b and c), which is to be expected given the relatively small fraction of particles that enter the deltaic islands (Fig. 8b and c). Exposure times for θ=0 (positively buoyant) particles within channels (Fig. 10a) are shorter compared to those computed across the full delta areas (Fig. 9a), as a majority of those particles enter the delta islands (Fig. 8a). For exposure times computed within the islands, the results for θ=0 (Fig. 10b) are similar to the overall exposure times (Fig. 9a), while the exposure times computed for θ values of 1 and 2 within islands (Fig. 10d and f) are shorter than those computed for the channels (Fig. 10c and e) or the entire delta extent (Fig. 9b and c).
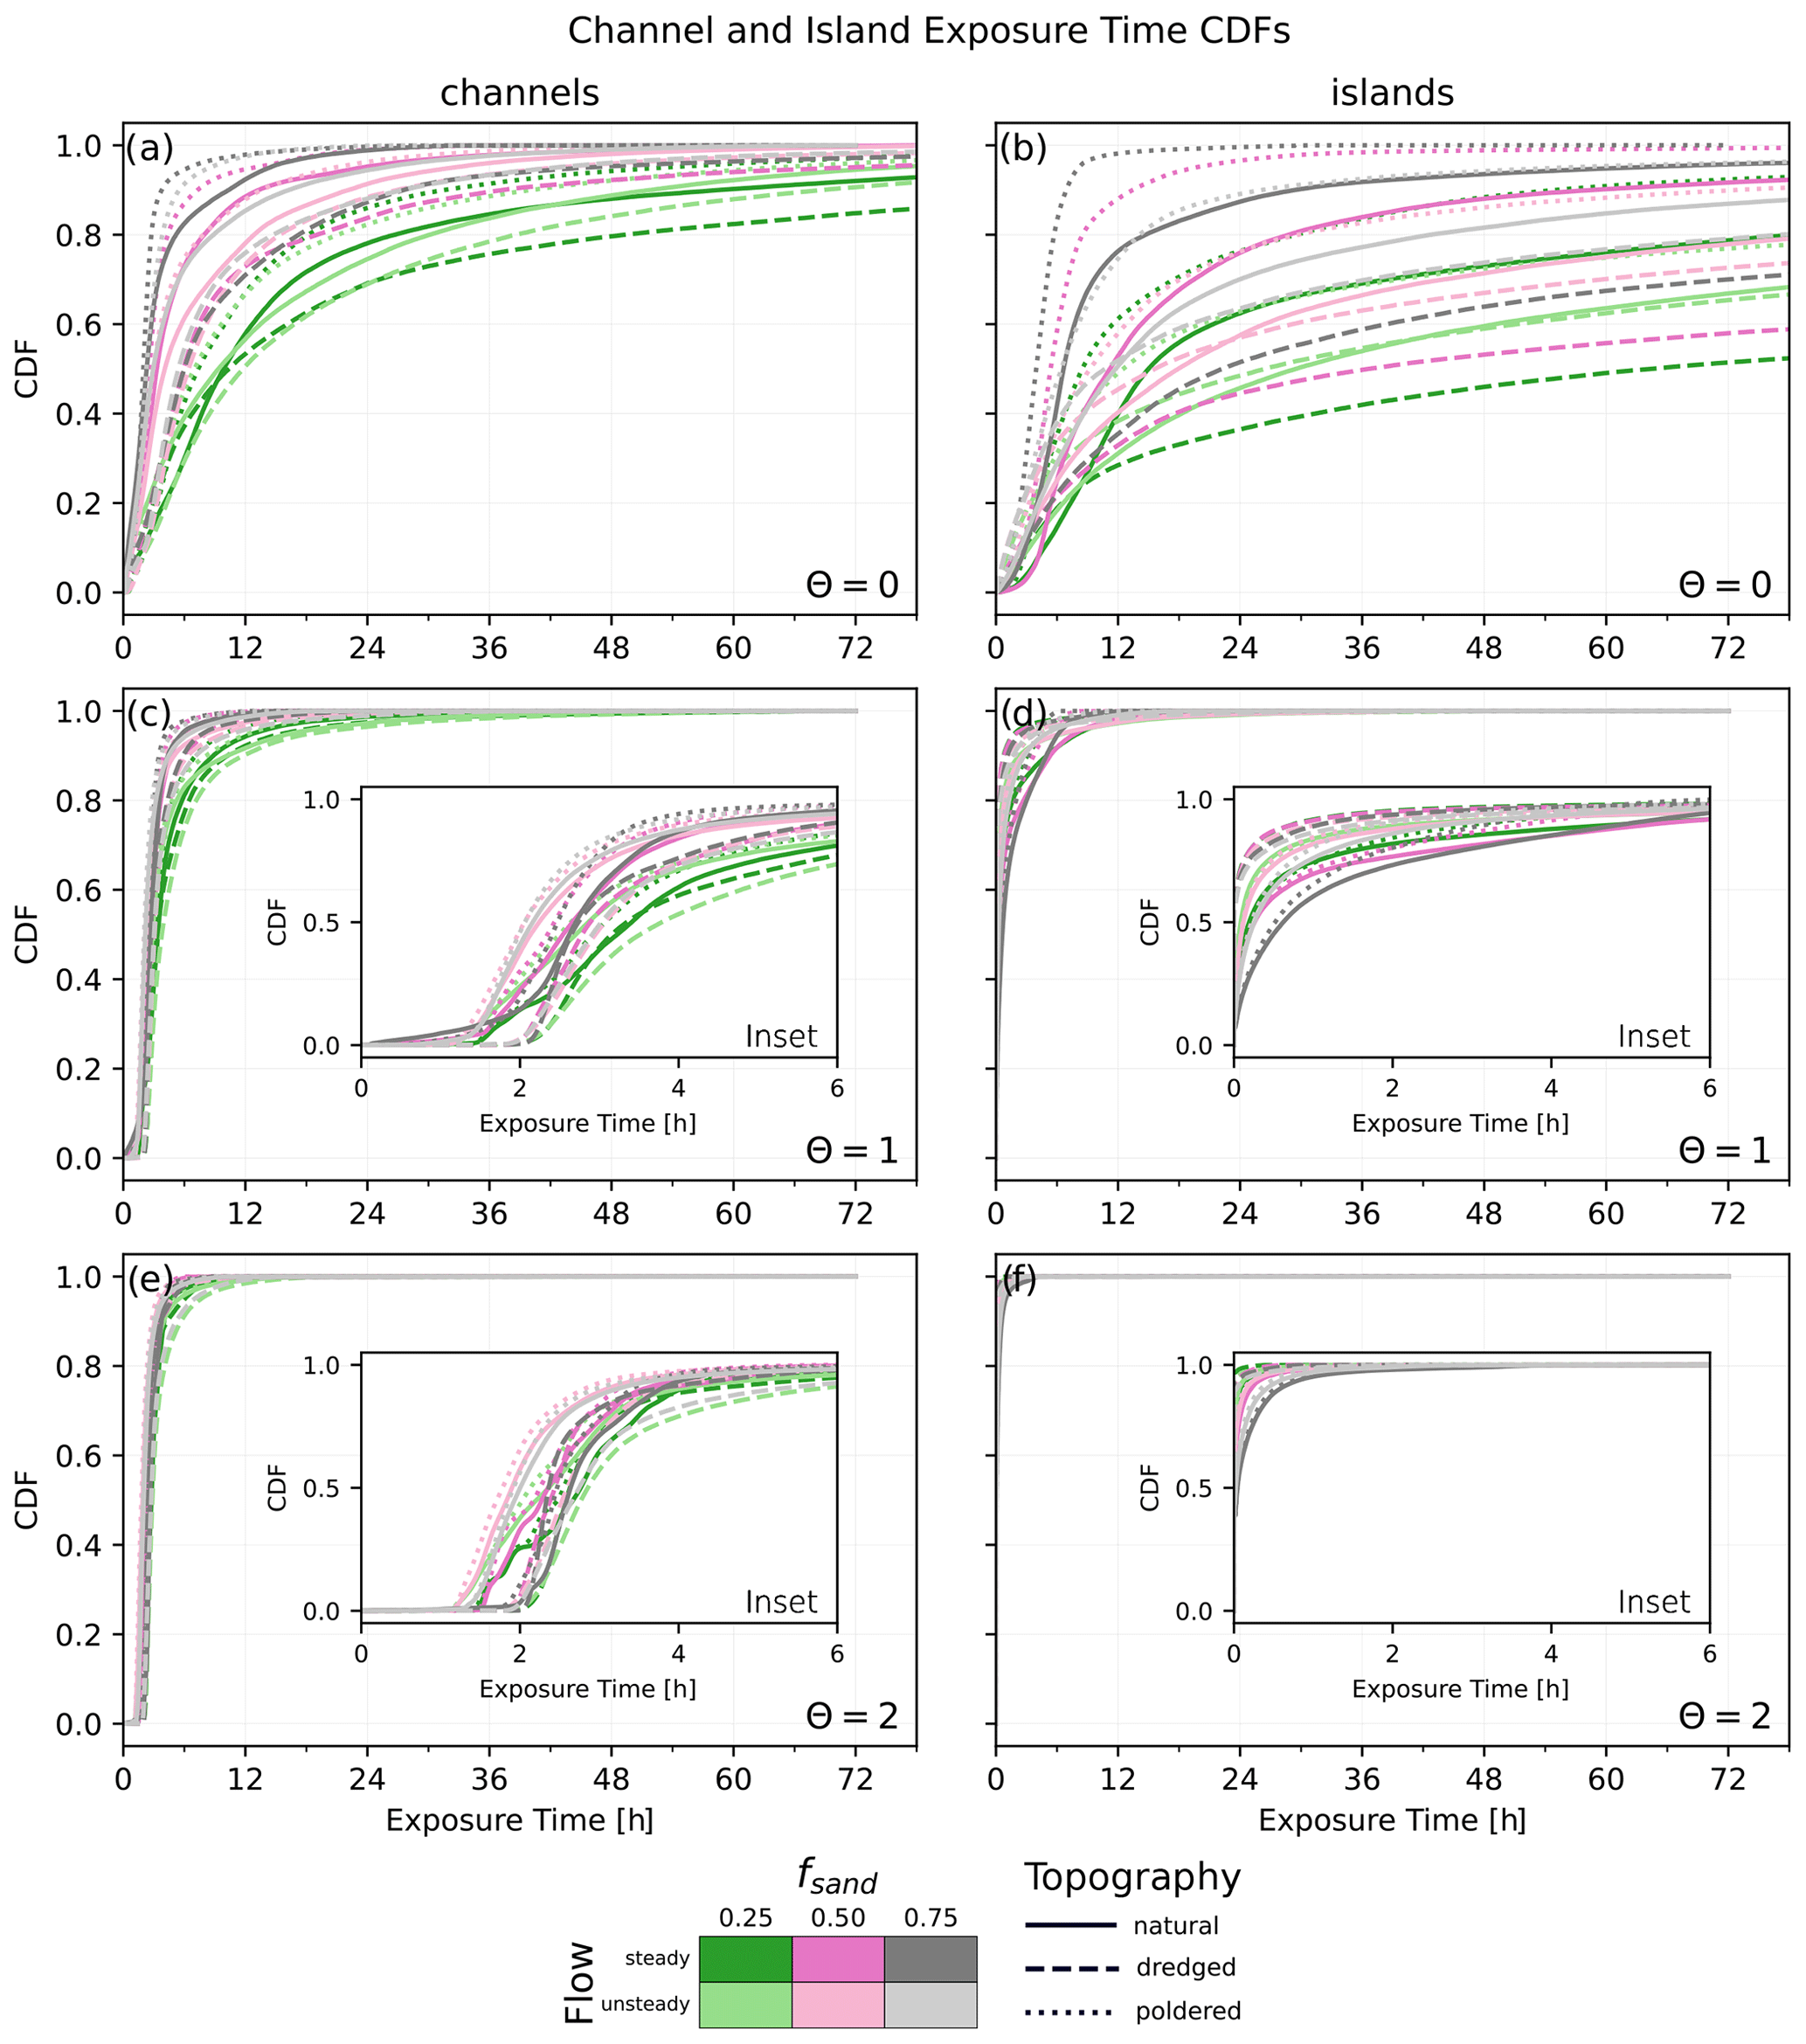
Figure 10Exposure time cumulative distribution functions (CDFs) for the delta channels and islands (columns). Each row contains results from a different θ value, with (a and b) θ=0, (c and d) θ=1, and (e and f) θ=2. Inset plots focused on exposure time CDFs between 0–6 h shown for (c–f).
4.1 Natural variability
We find that there are differences in material transport behavior solely due to differences in the input sediment composition responsible for forming the landscapes. This is true for both the total area visited by particles (Fig. 7) and the amount of time particles spend within the delta itself (Fig. 9). The finding that sandier deltas tend to have greater nourishment areas (Fig. 7) is consistent with studies that have found sandy deltas to have a greater number of channels than muddy systems (Caldwell and Edmonds, 2014; Liang et al., 2016a; Hariharan et al., 2021). When channels are the primary conduit for material transport, it follows logically that a greater number and areal proportion of channels should translate to a higher nourishment area. Exposure time distributions, which reveal that sandier deltas have shorter exposure times than muddier systems (Fig. 9), suggest that the presence of a greater number of channels enables the more rapid distribution of material offshore. This finding is also consistent with prior work, which has established that higher mud content (higher sediment cohesion) leads to greater channel sinuosity (Geleynse et al., 2011; Liang et al., 2016b) and higher values of shoreline roughness (Edmonds and Slingerland, 2010; Straub et al., 2015), increasing the length along a channel from the apex to the shoreline. When the distance particles travel from the apex to the shoreline is increased, it is likely they will take a longer time to travel to the ocean than if a shorter path were available. The deposition of sediment within the delta is key to land building (Kim et al., 2009). Channel properties are not the only factor controlling sediment deposition. A number of studies have shown that the type, structure, presence, and organization of deltaic vegetation can have substantial influences on the deposition of sediment within the delta itself (e.g., Nardin and Edmonds, 2014; Nardin et al., 2016; Wright et al., 2018; Lauzon and Murray, 2018).
4.2 Impact of human modifications on transport
Human modifications appear to reduce the connectivity between channels and islands within deltas (Figs. 7 and 8). Both channel dredging and island poldering reduce the total area nourished by particles under both steady and tidal-flow conditions (Fig. 7). This reduction in connectivity is consistent with other studies on modified landscapes (e.g., Angamuthu et al., 2018; van Dijk et al., 2021) and should be expected when projects which significantly modify deltaic topography are undertaken. In coastal environments, altering the topography can change the distribution of salinity in the system, leading to adverse ecological impacts (e.g., Ohimain, 2004; Durand, 2017; Wilson et al., 2017). While we do not model salinity, mixing, or density-driven flows directly in this work, we do simulate the transport of neutrally buoyant, negatively buoyant, and positively buoyant material from the apex of the delta. These particle paths and visitation to islands (Fig. 8) may thus be indicative of freshwater flow through the system. The island exposure times (Fig. 10b, d, and f) more directly provide a measure of the expected water age for the islands and how it may change as a result of human modifications to the topography. The exposure of particles to islands may be of particular importance for biogeochemical processing occurring on the delta (e.g., Hiatt et al., 2018; Knights et al., 2020; Christensen et al., 2020).
Our finding that exposure times within islands are shorter than those within channels, for θ values of 1 and 2, is a counterintuitive result (Fig. 10), for which one possible explanation is related to the topographic delineation of channels and islands (Fig. 2e). While topographic lows within islands are still defined as part of the island, the definition of the channels using the largest contiguous area below −0.5 m (Sect. 2.5) results in a number of relic channels near the shoreline being counted as channels in our exposure time analysis (Fig. 2e). Given that the channels become shallower near the coastline and that the tides re-circulate particles near the coast in the tidal scenarios, this may be the reason the particle exposure times appear to be longer in the channels than in the islands. Another potential explanation is that particles may take short incursions onto the island pixels for only one or two time steps, limiting their exposure to the island areas and staying within fast-moving flows. The overarching pattern of exposure times with respect to the material type (θ value), however, matches our findings for the exposure times computed over the entire delta extents (Fig. 9), with higher θ values (less-buoyant material) having shorter exposure times.
4.3 Transport differences due to material properties
Despite adopting a reduced-complexity approach for simulating the transport of different materials, we see marked differences in their transport behavior (Figs. 5 and 7–9). Material buoyancy has a greater impact on both nourishment area (Fig. 7) and exposure time (Fig. 9) than the flow regime or any modifications made to the topography. This result highlights the importance of simulating attributes of the material(s) of interest when performing a more detailed site or case-specific study. For example, positively buoyant materials might represent flotsam, neutrally buoyant material could be suspended sediment, and negatively buoyant material may be more akin to bedload; these three materials occupy different vertical positions in the water column, and therefore they will not follow the same transport paths. Interestingly, the relative transport behavior between different flow conditions and topographies does not necessarily transfer across different material types. For example, particles on the poldered topographies with θ=0 (positively buoyant) appear to spend the least amount of time in the channels and islands. In contrast, it is the dredged topographies that have the shortest exposure times in the islands when the θ parameter is 1 (neutrally buoyant) or 2 (negatively buoyant; see Fig. 10).
4.4 Study Limitations and implications for future studies
As we adopted a reduced-complexity numerical modeling approach to this study, we were able to isolate the effects of sediment composition, topographic modifications, flow conditions, and material type on transport through deltaic environments.
While this exploratory approach is informative, there are a number of limitations associated with the methods we chose to employ.
The pyDeltaRCM morphodynamic model, used to create the delta landscapes, is capable of producing realistic river-dominated delta landforms (Liang et al., 2016b), but there are a number of other forcings that shape delta morphology that we do not account for, such as waves, vegetation, wind, variable discharge, ice, subsidence, and other environmental factors (e.g., Galloway, 1975; Sassi et al., 2012; Anthony, 2015; Piliouras et al., 2017; Lauzon and Murray, 2018; Zoccarato et al., 2018; Chamberlain et al., 2021).
Furthermore, our simplified approach to modifying the topography to reflect channel dredging and island embanking does not account for the sourcing or dumping of the material used to make those changes.
In the case of channel dredging, for example, it is common to use the adjacent land as the spoil location for dredge material (e.g., Mossa and Chen, 2021).
These types of local morphological changes can alter the hydrodynamics and morphodynamics of the system (Wilson et al., 2017; Bain et al., 2019).
In this work we do not conduct any morphodynamic modeling after modifying the topography, although we know that sediment transport continues to occur, often infilling channels (Wilson et al., 2017).
When we simulate short-term hydrodynamics, we move to a more complex model by using ANUGA to resolve the shallow-water equations over our domain; however, in doing so, we explicitly do not consider vertical flow behavior and are limited by the spatial resolution of our mesh.
When we vary the θ parameter for the dorado simulations, we are adding a reduced-complexity representation of vertical sorting back into our simulation (Wright et al., 2022a), but this is not as rigorous as a full 3-D flow and particle tracking approach (e.g., Dagestad et al., 2018).
However, limited data often prevent 3-D hydrodynamic models from being more accurate than 2-D solutions (Bates, 2022).
Despite these limitations, we believe the results presented here have important implications for future studies. The delta landscapes simulated are generated over 150 years of simulated time and are similar in scale to the Wax Lake Delta (Liang et al., 2015, 2016b). Consequently, these findings can inform future river diversion and land building projects and complement prior studies done on connectivity and material transport in similar environments (e.g., Hiatt and Passalacqua, 2015; Sendrowski and Passalacqua, 2017; Hiatt et al., 2018; Esposito et al., 2020). Uniquely, numerical models of delta landscapes provide us with a degree of control over input sediment characteristics, flow scenarios, and topographic modifications, unachievable for studies conducted on real landscapes. We find that maps of particle nourishment (e.g., Fig. 5) are qualitatively similar to numerical results, tracer studies, and remotely sensed streak lines presented in studies of specific deltas (Shaw et al., 2016; Hiatt et al., 2018; Wright et al., 2022a).
From these results, we establish that flow conditions and topography can exert large influences over the transport and behavior of material traveling near the top of the water column (Figs. 5a–c, 9a, and 10). Conversely, if the primary material of interest travels low in the water column, then perhaps there may be less of a need to conduct rigorous analysis of the impact dredging or embankment construction will have on transport, as the majority of material remains within the channels (Figs. 5g–i, 7c, and 10). Furthermore, by testing these different flow regimes and topographic modifications on different natural topographies, we show that the antecedent conditions also influence the connectivity of a landscape, and topographic modifications can alter that connectivity. These results present approximate magnitudes of expected changes to transport behavior for a number of scenarios and may help delta managers prior to commissioning a detailed study on the effects of proposed modifications.
In this work we provide a comprehensive look at the influence of natural topography, channel dredging, island embankment, and flow conditions on the transport of material through river deltas.
To do this, we applied a series of three numerical models, pyDeltaRCM, ANUGA, and dorado to simulate a deltaic landscape, model hydrodynamic flow fields, and route passive Lagrangian particles, respectively.
We came to the following conclusions.
-
The properties of the material itself (simulated here by varying the θ parameter) act as a first-order control on the total area nourished by particles and their exposure time distributions.
-
Human modifications to delta topography reduce the area nourished by passive particles.
-
The construction of polders reduces the exposure times of particles within the delta, while the dredging of channels increases exposure times relative to exposure times calculated over the natural topography.
We qualitatively find the overall patterns of nourishment behavior to be quite similar to results from site-specific studies (Wright et al., 2022a), supporting our belief that these exploratory results can be applied to inform and guide future studies on material transport through coastal deltas.

Figure A1Example of ANUGA steady-flow fields over three topographies.
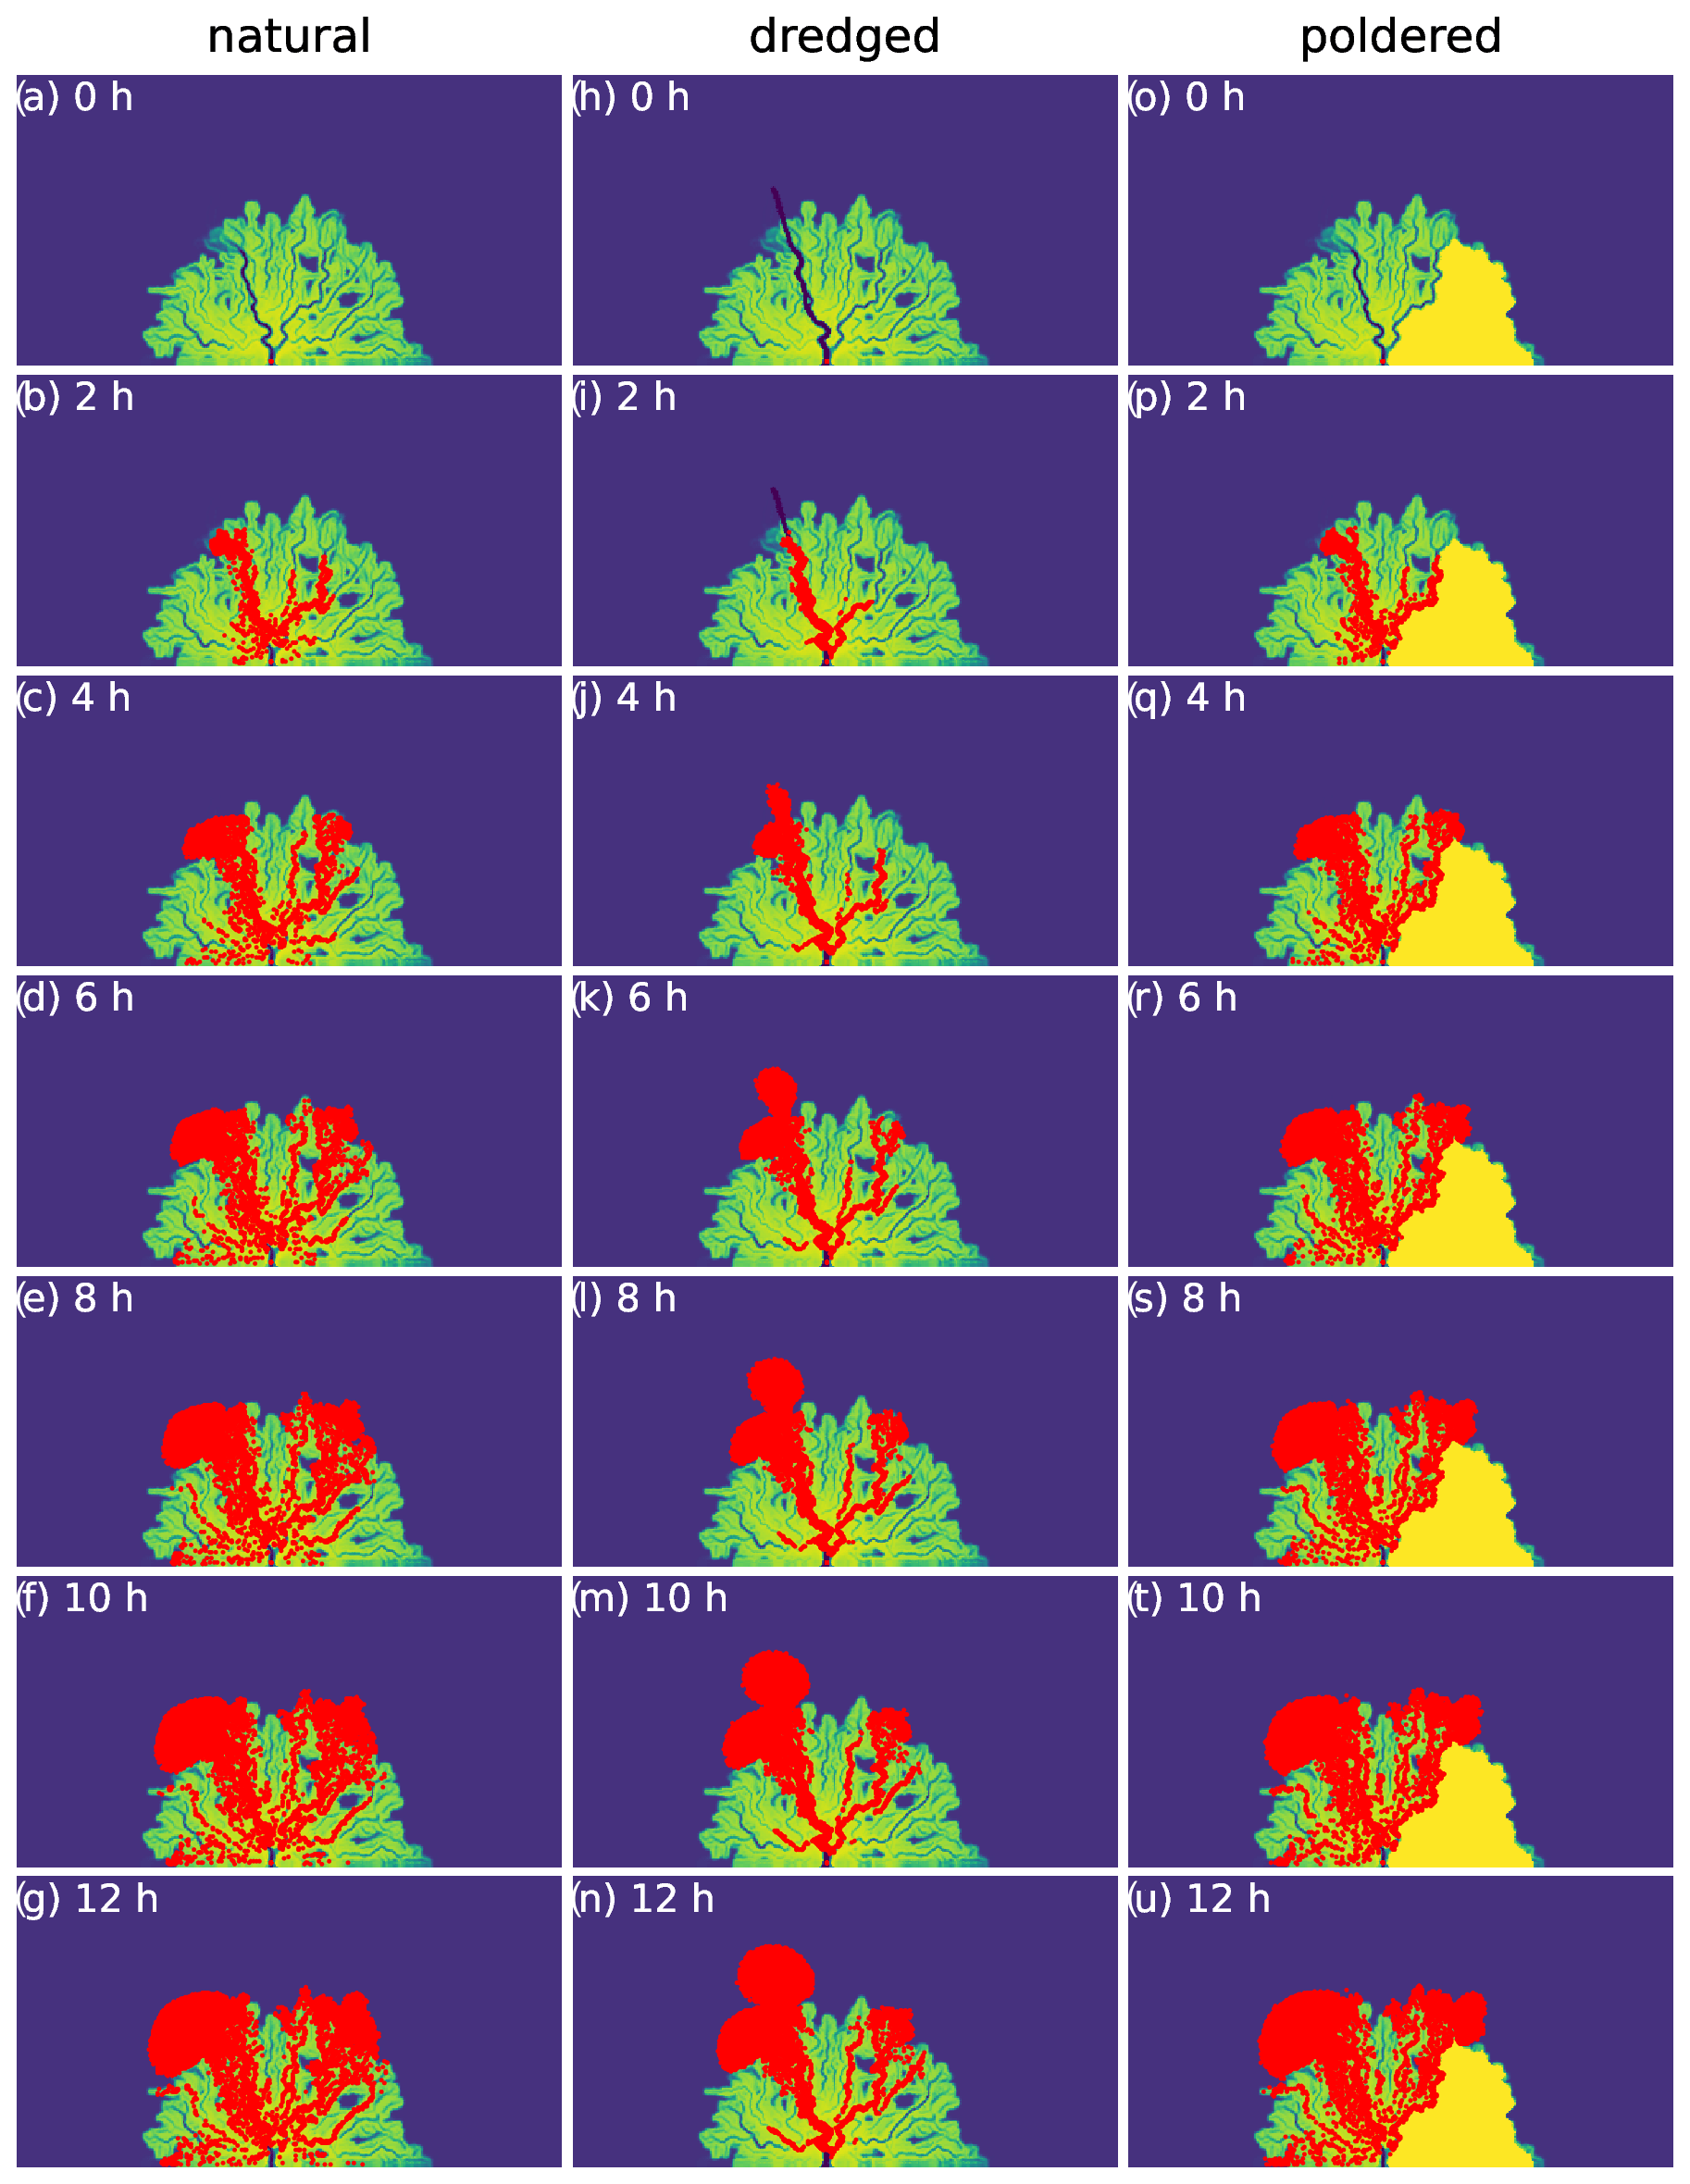
Figure A2Examples of particle movement (θ=1) across three topographies shown as still images every 2 h for the first 12 h of their movement under steady-flow conditions.
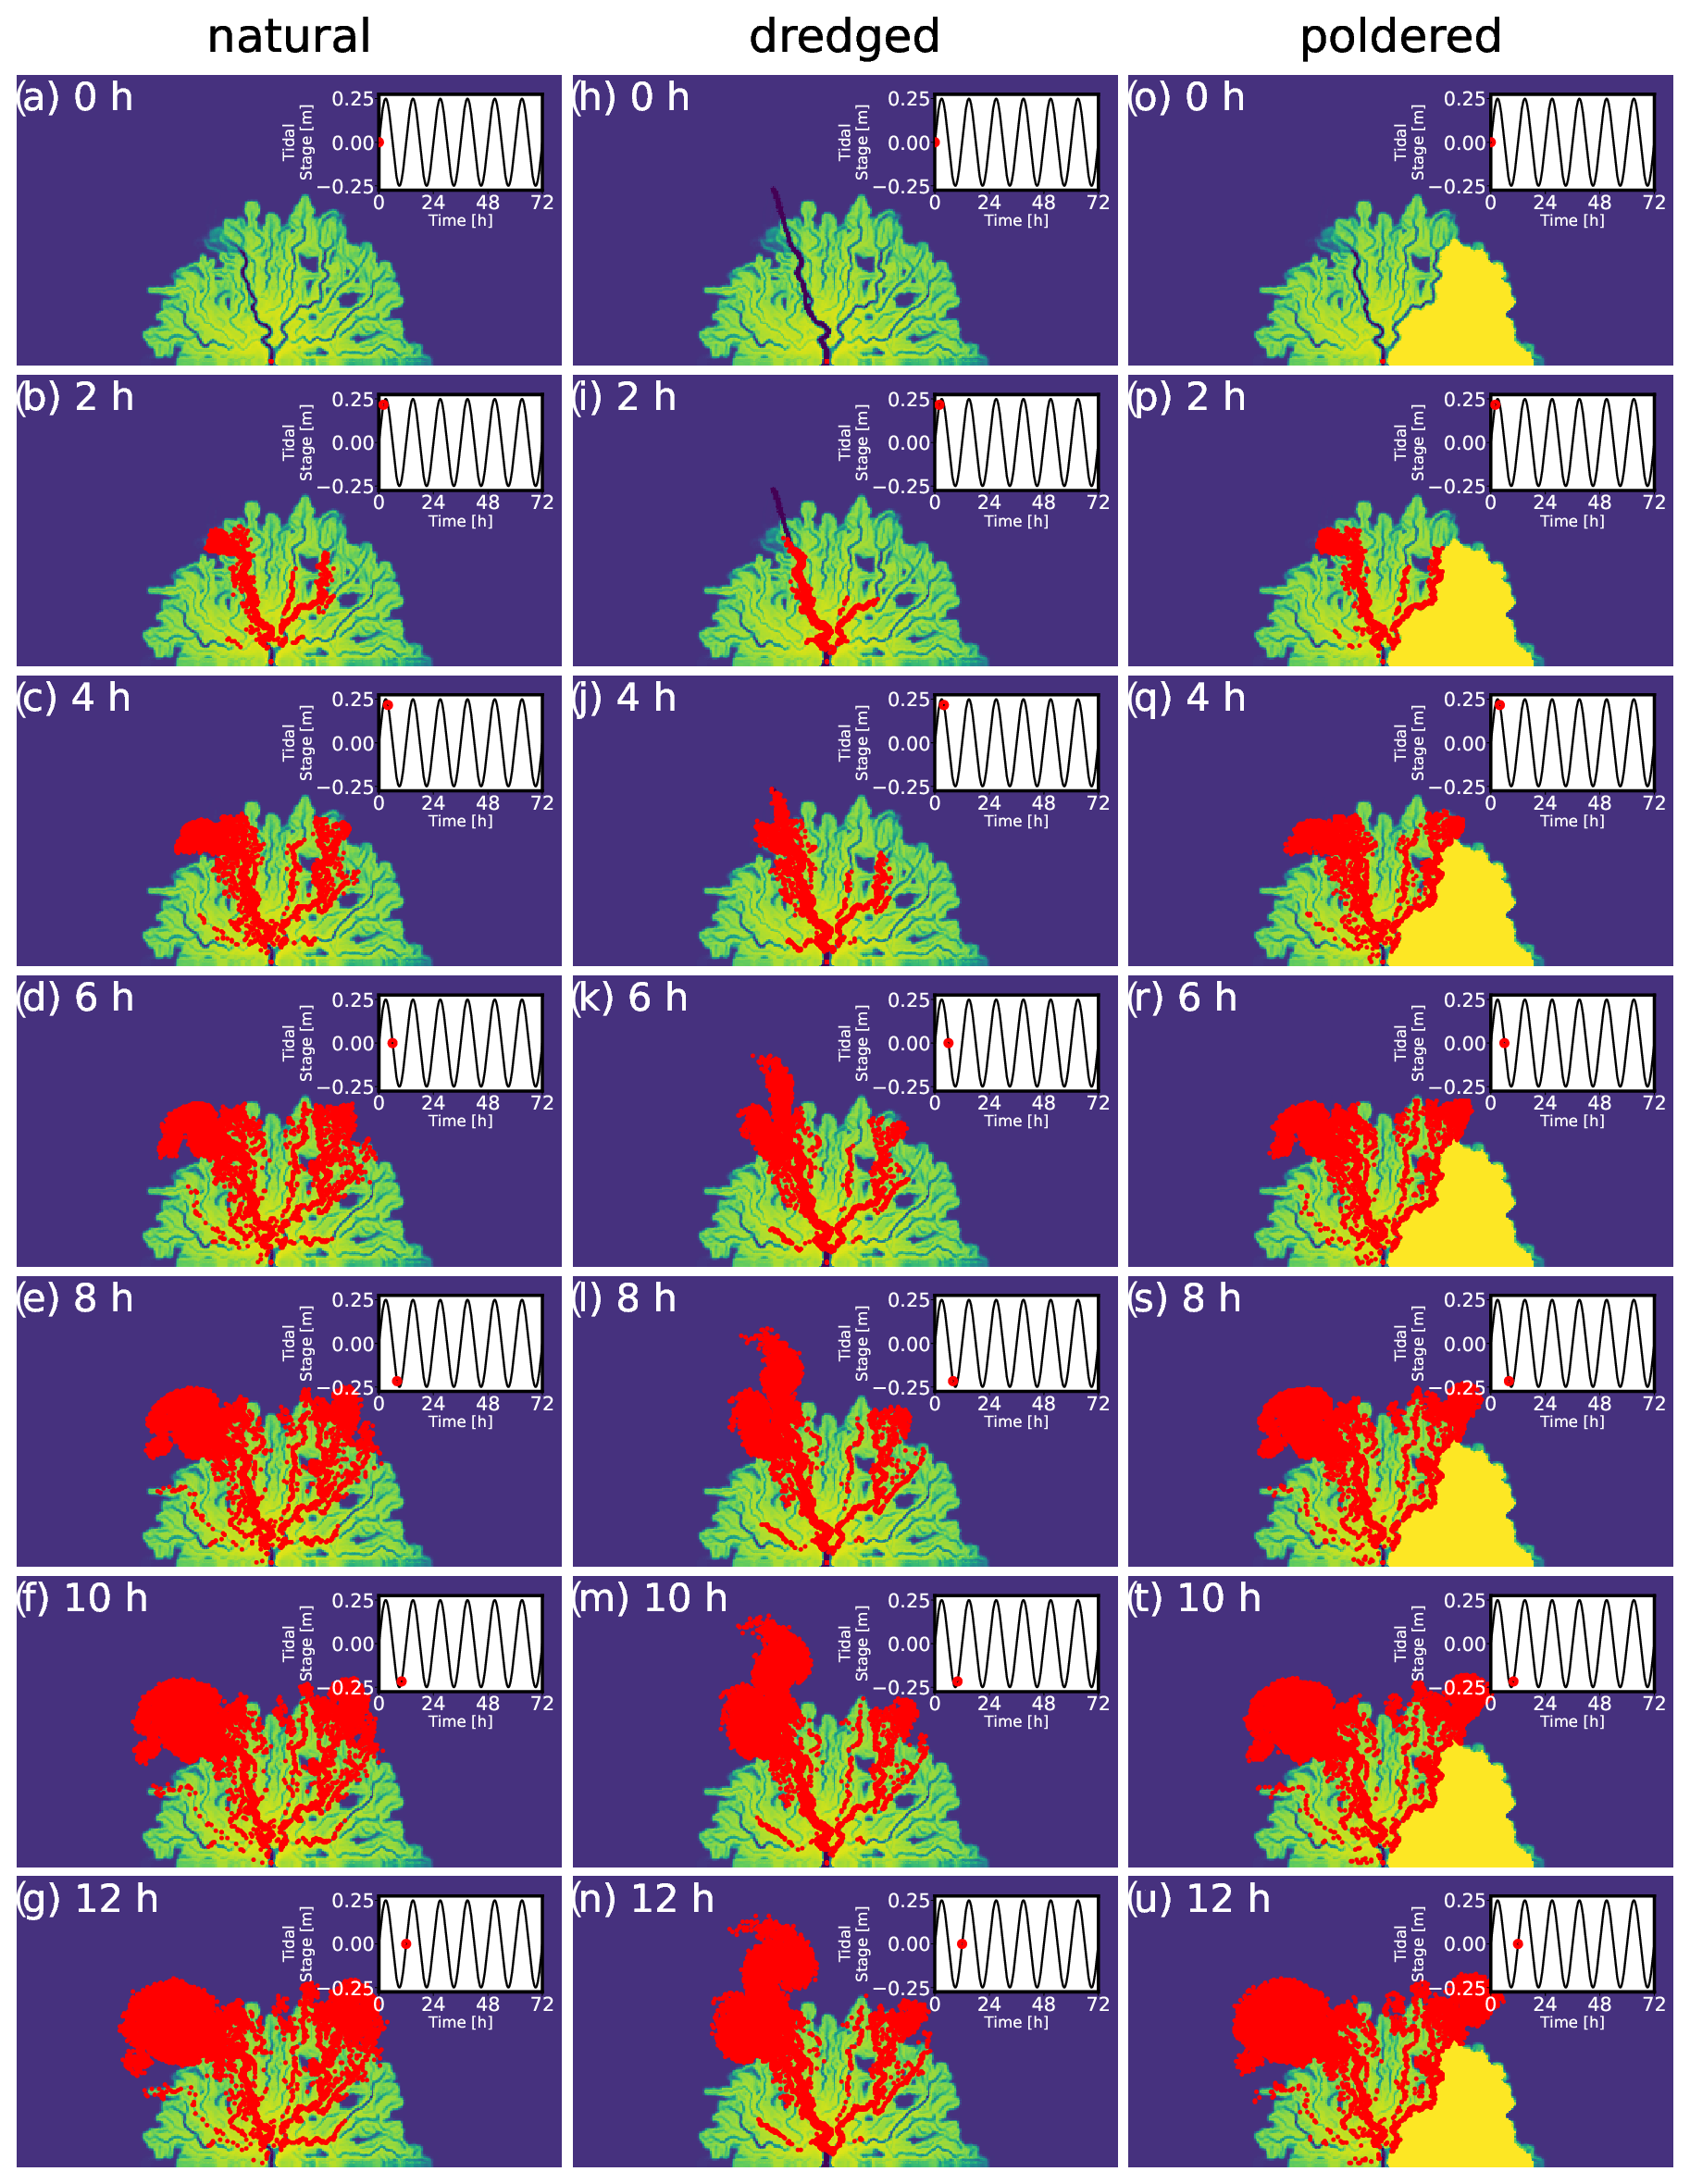
Figure A3Examples of particle movement (θ=1) across three topographies shown as still images every 2 h for the first 12 h of their movement under unsteady (tidal) conditions.

Figure A4Examples of particle movement with three different θ values across natural topography shown as still images every 2 h for the first 12 h of their movement under steady-flow conditions.
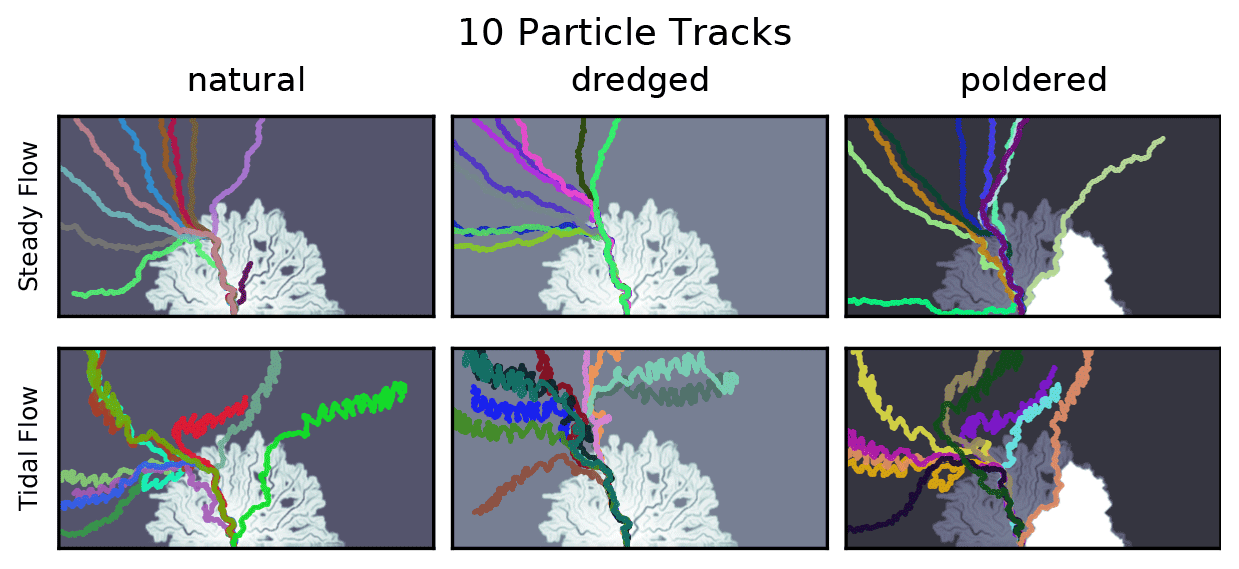
Figure A5Examples of 10 particle tracks over three different topographies under steady and tidal-flow conditions.

Figure A6Examples of 10 particle tracks with different θ values over a natural topography under steady and tidal-flow conditions.
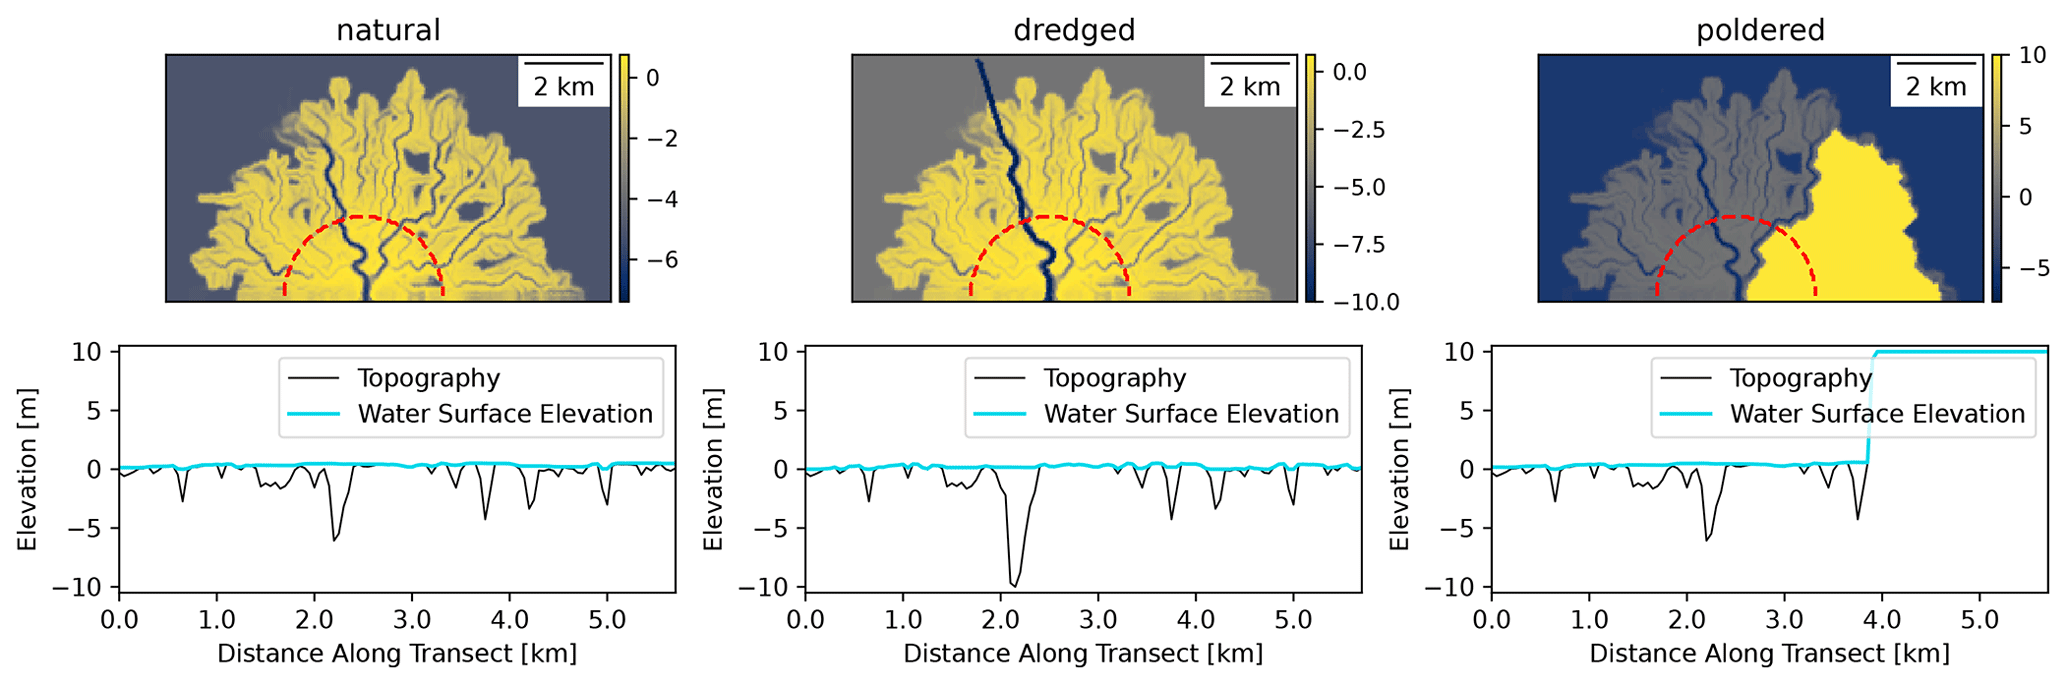
Figure A7Example circular sections with radii of 2 km through natural, dredged, and poldered topographies for a single model run (fsand=0.25).
Table A1Polder areas in square kilometers for each of the six model replicates for each of the three input sand scenarios.
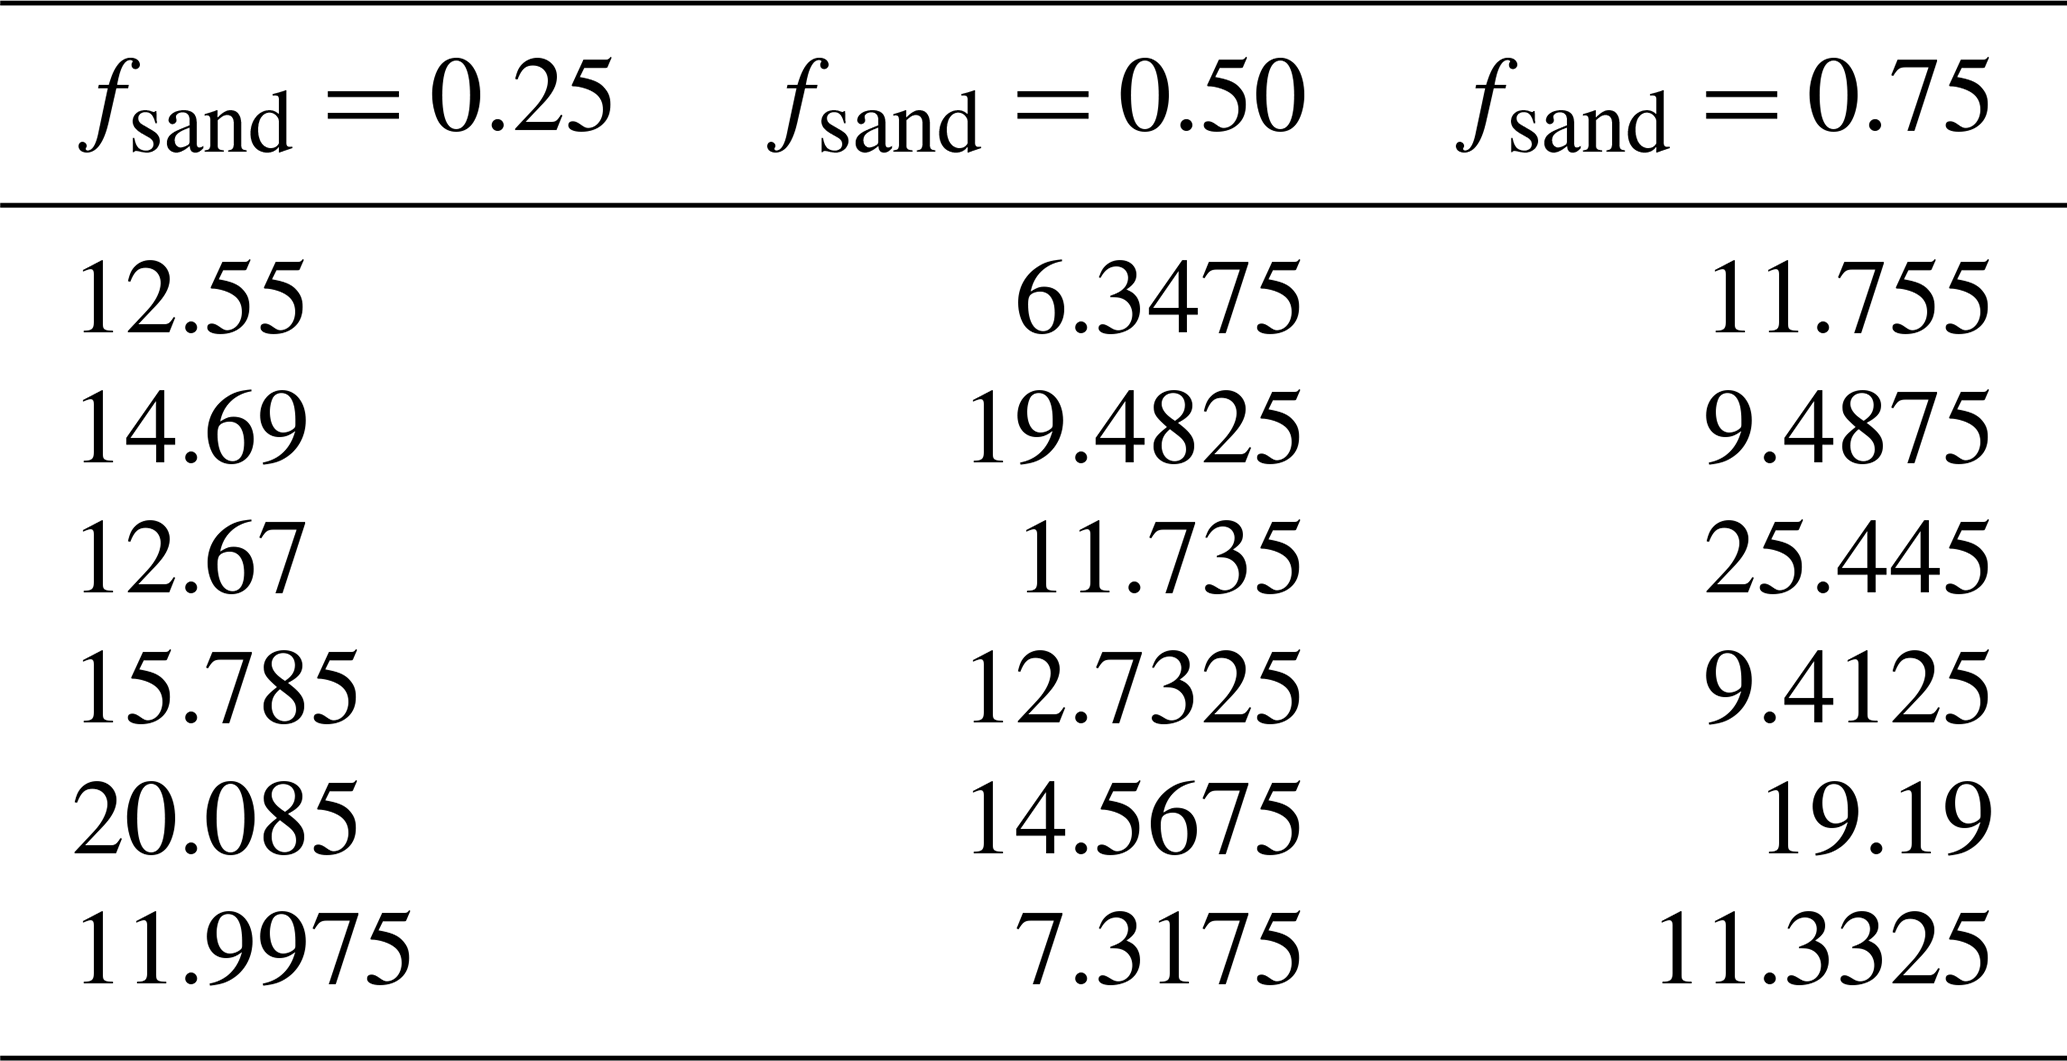
Table A2Dredge channel areas in square kilometers for each of the six model replicates for each of the three input sand scenarios.
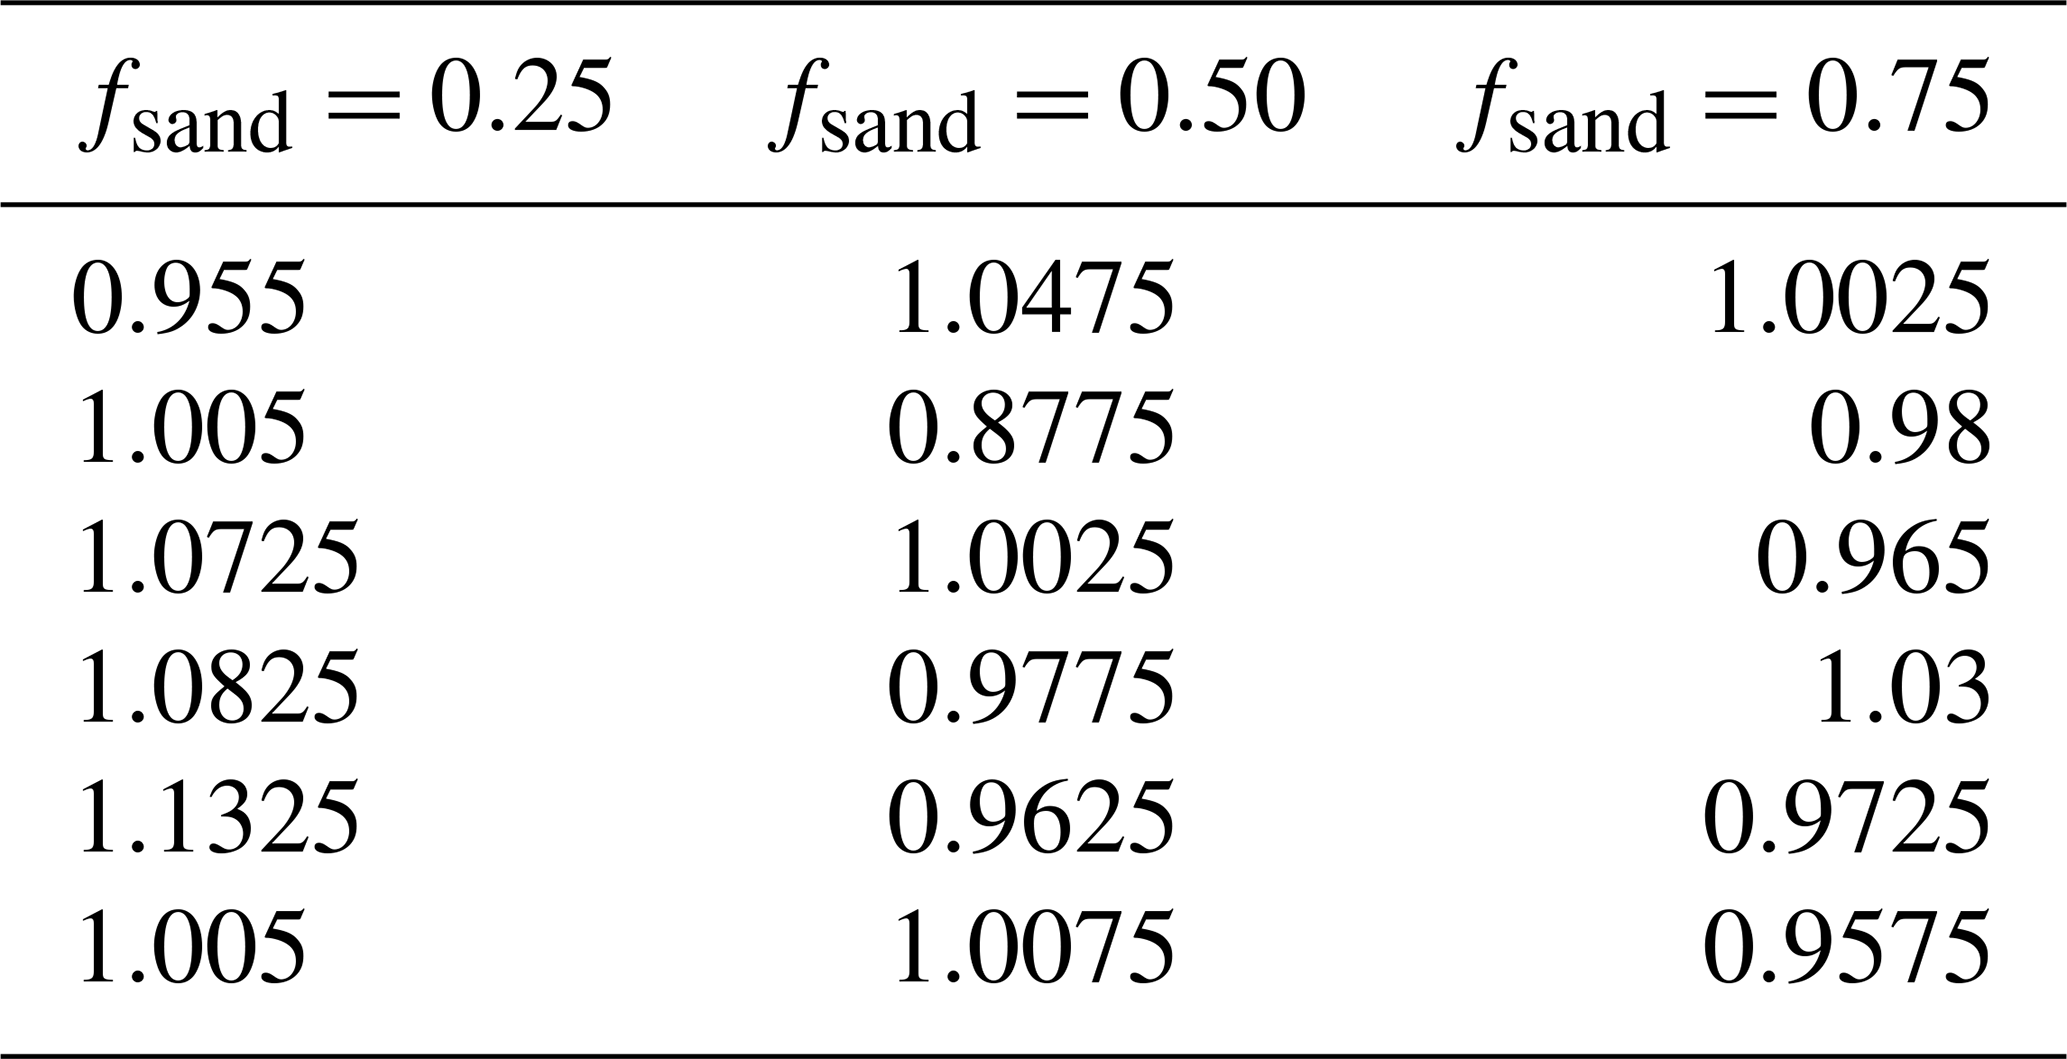
Table A3Edge length statistics (minimum, percentile values in increments of 10, and maximum, in meters) for the triangles in the ANUGA mesh.

Models used in this work are all open source and freely available. pyDeltaRCM (Moodie et al., 2021) is available at https://github.com/DeltaRCM/pyDeltaRCM/releases/tag/v2.1.4 (Moodie et al., 2022); ANUGA (Nielsen et al., 2005; Roberts et al., 2015) is available at https://github.com/GeoscienceAustralia/anuga_core/releases/tag/3.1.3 (Roberts, 2022); and dorado (Hariharan et al., 2020) is available at https://doi.org/10.5281/zenodo.6454729 (Hariharan et al., 2022a).
Videos of the pyDeltaRCM model evolution, as well as dorado particle results for both the steady and unsteady cases, are available via the Open Science Framework (OSF) at https://doi.org/10.17605/OSF.IO/D95ZN (Hariharan et al., 2022b).
JH and PP designed and conceived of the research project. JH and AM developed the pyDeltaRCM modeling approach. JH, KW, and NT developed the ANUGA modeling approach. All authors designed and developed the dorado particle-routing methods. JH performed the analysis and wrote the first draft. All authors reviewed and edited the original draft.
At least one of the (co-)authors is a member of the editorial board of Earth Surface Dynamics. The peer-review process was guided by an independent editor, and the authors also have no other competing interests to declare.
Publisher's note: Copernicus Publications remains neutral with regard to jurisdictional claims in published maps and institutional affiliations.
This research has been supported by the Directorate for Geosciences, Division of Earth Sciences (grant nos. EAR-1719670, EAR-1952772, and NSF GRFP, DGE-1610403), the Earth Sciences Division (Delta-X, Earth Venture Suborbital-3 Program NNH17ZDA001N-EVS3), and the University of Texas at Austin, Graduate School, University of Texas, Austin.
This paper was edited by Orencio Duran Vinent and reviewed by Joris Beemster and one anonymous referee.
Al Masud, M. M., Gain, A. K., and Azad, A. K.: Tidal river management for sustainable agriculture in the Ganges-Brahmaputra delta: Implication for land use policy, Land Use Policy, 92, 104443, https://doi.org/10.1016/j.landusepol.2019.104443, 2020. a
Angamuthu, B., Darby, S. E., and Nicholls, R. J.: Impacts of natural and human drivers on the multi-decadal morphological evolution of tidally-influenced deltas, P. Roy. Soc. A-Math. Phy., 474, 20180396, https://doi.org/10.1098/rspa.2018.0396, 2018. a, b
Anthony, E. J.: Wave influence in the construction, shaping and destruction of river deltas: A review, Mar. Geol., 361, 53–78, https://doi.org/10.1016/j.margeo.2014.12.004, 2015. a, b
Auerbach, L. W., Goodbred Jr., S. L., Mondal, D. R., Wilson, C. A., Ahmed, K. R., Roy, K., Steckler, M. S., Small, C., Gilligan, J. M., and Ackerly, B. A.: Flood risk of natural and embanked landscapes on the Ganges–Brahmaputra tidal delta plain, Nat. Clim. Change, 5, 153–157, https://doi.org/10.1038/nclimate2472, 2015. a, b
Bain, R. L., Hale, R. P., and Goodbred, S. L.: Flow Reorganization in an Anthropogenically Modified Tidal Channel Network: An Example From the Southwestern Ganges-Brahmaputra-Meghna Delta, J. Geophys. Res.-Earth, 124, 2141–2159, https://doi.org/10.1029/2018JF004996, 2019. a, b
Banas, N. S., MacCready, P., and Hickey, B. M.: The Columbia River plume as cross-shelf exporter and along-coast barrier, Cont. Shelf Res., 29, 292–301, https://doi.org/10.1016/j.csr.2008.03.011, 2009. a
Bates, P. D.: Flood Inundation Prediction, Annu. Rev. Fluid Mech., 54, 287–315, https://doi.org/10.1146/annurev-fluid-030121-113138, 2022. a
Cai, H., Savenije, H. H. G., Yang, Q., Ou, S., and Lei, Y.: Influence of River Discharge and Dredging on Tidal Wave Propagation: Modaomen Estuary Case, J. Hydraul. Eng., 138, 885–896, https://doi.org/10.1061/(asce)hy.1943-7900.0000594, 2012. a, b
Caldwell, R. L. and Edmonds, D. A.: The effects of sediment properties on deltaic processes and morphologies: A numerical modeling study, J. Geophys. Res.-Earth, 119, 961–982, https://doi.org/10.1002/2013JF002965, 2014. a, b, c, d, e
Chamberlain, E. L., Shen, Z., Kim, W., McKinley, S., Anderson, S., and Törnqvist, T. E.: Does Load-Induced Shallow Subsidence Inhibit Delta Growth?, J. Geophys. Res.-Earth, 126, e2021JF006153, https://doi.org/10.1029/2021JF006153, 2021. a
Chow, V. T.: Open-channel hydraulics, McGraw-Hill civil engineering series, McGraw-Hill, 1959. a
Christensen, A., Twilley, R. R., Willson, C. S., and Castañeda-Moya, E.: Simulating hydrological connectivity and water age within a coastal deltaic floodplain of the Mississippi River Delta, Estuar. Coast. Shelf S., 245, 106995, https://doi.org/10.1016/j.ecss.2020.106995, 2020. a, b
Dagestad, K.-F., Röhrs, J., Breivik, Ø., and Ådlandsvik, B.: OpenDrift v1.0: a generic framework for trajectory modelling, Geosci. Model Dev., 11, 1405–1420, https://doi.org/10.5194/gmd-11-1405-2018, 2018. a
Day, J. W., Britsch, L. D., Hawes, S. R., Shaffer, G. P., Reed, D. J., and Cahoon, D.: Pattern and process of land loss in the Mississippi Delta: A spatial and temporal analysis of wetland habitat change, Estuaries, 23, 425–438, https://doi.org/10.2307/1353136, 2000. a, b
Day, J. W., Gunn, J. D., Folan, W. J., Yáñez-Arancibia, A., and Horton, B. P.: Emergence of complex societies after sea level stabilized, Eos T. Am. Geophys. Un., 88, 169–170, https://doi.org/10.1029/2007EO150001, 2007. a
de Brauwere, A., de Brye, B., Blaise, S., and Deleersnijder, E.: Residence time, exposure time and connectivity in the Scheldt Estuary, J. Marine Syst., 84, 85–95, https://doi.org/10.1016/j.jmarsys.2010.10.001, 2011. a
Durand, J. R.: Evaluating the aquatic habitat potential of flooded polders in the Sacramento-San Joaquin Delta, San Francisco Estuary and Watershed Science, 15, 4, https://doi.org/10.15447/sfews.2017v15iss4art4, 2017. a
Edmonds, D. A. and Slingerland, R. L.: Significant effect of sediment cohesion on deltamorphology, Nat. Geosci., 3, 105–109, https://doi.org/10.1038/ngeo730, 2010. a, b
Edmonds, D. A., Paola, C., Hoyal, D. C., and Sheets, B. A.: Quantitative metrics that describe river deltas and their channel networks, J. Geophys. Res.-Earth, 116, F04022, https://doi.org/10.1029/2010JF001955, 2011. a
Edmonds, D. A., Caldwell, R. L., Brondizio, E. S., and Siani, S. M.: Coastal flooding will disproportionately impact people on river deltas, Nat. Commun., 11, 1–8, https://doi.org/10.1038/s41467-020-18531-4, 2020. a
Ellery, W. N. and McCarthy, T. S.: Environmental change over two decades since dredging and excavation of the lower Boro River, Okavango Delta, Botswana, J. Biogeogr., 25, 361–378, https://doi.org/10.1046/j.1365-2699.1998.252168.x, 1998. a, b
Esposito, C. R., Georgiou, I. Y., and Straub, K. M.: Flow Loss in Deltaic Distributaries: Impacts on Channel Hydraulics, Morphology, and Stability, Water Resour. Res., 56, e2019WR026463, https://doi.org/10.1029/2019WR026463, 2020. a
Galloway, W. E.: Process framework for describing the morphologic and stratigraphic evolution of deltaic systems, in: Deltas, Models for Exploration, Houston Geological Society, 87–98, 1975. a, b
Geleynse, N., Storms, J. E., Walstra, D. J. R., Jagers, H. R., Wang, Z. B., and Stive, M. J.: Controls on river delta formation; insights from numerical modelling, Earth Planet. Sc. Lett., 302, 217–226, https://doi.org/10.1016/j.epsl.2010.12.013, 2011. a
Hariharan, J., Wright, K., and Passalacqua, P.: dorado: A Python package for simulating passive particle transport in shallow-water flows, Journal of Open Source Software, 5, 2585, https://doi.org/10.21105/joss.02585, 2020. a, b, c, d, e
Hariharan, J., Xu, Z., Michael, H. A., Paola, C., Steel, E., and Passalacqua, P.: Linking the Surface and Subsurface in River Deltas – Part 1: Relating Surface and Subsurface Geometries, Water Resour. Res., 57, e2020WR029282, https://doi.org/10.1029/2020WR029282, 2021. a, b, c, d
Hariharan, J., Wright, K., and Passalacqua, P.: dorado v2.5.1, Zenodo [code], https://doi.org/10.5281/zenodo.6454729, 2022a. a
Hariharan, J., Wright, K., Moodie, A., Tull, N., and Passalacqua, P.: Videos For Impacts of Human Modifications on Material Transport in Deltas, OSF [video supplement], https://doi.org/10.17605/OSF.IO/D95ZN, 2022b. a
Hiatt, M. and Passalacqua, P.: Hydrological connectivity in river deltas: The first-order importance of channel-island exchange, Water Resour. Res., 51, 2264–2282, https://doi.org/10.1002/2014WR016149, 2015. a, b
Hiatt, M., Castañeda-Moya, E., Twilley, R., Hodges, B. R., and Passalacqua, P.: Channel-Island Connectivity Affects Water Exposure Time Distributions in a Coastal River Delta, Water Resour. Res., 54, 2212–2232, https://doi.org/10.1002/2017WR021289, 2018. a, b, c, d, e, f, g, h
Higgins, S. A., Overeem, I., Rogers, K. G., and Kalina, E. A.: River linking in India: Downstream impacts on water discharge and suspended sediment transport to deltas, Elementa, 6, 20, https://doi.org/10.1525/elementa.269, 2018. a
Hoyal, D. C. and Sheets, B. A.: Morphodynamic evolution of experimental cohesive deltas, J. Geophys. Res.-Earth, 114, 2009, https://doi.org/10.1029/2007JF000882, 2009. a
Kain, C. L., Lewarn, B., Rigby, E. H., and Mazengarb, C.: Tsunami Inundation and Maritime Hazard Modelling for a Maximum Credible Tsunami Scenario in Southeast Tasmania, Australia, Pure Appl. Geophys., 177, 1549–1568, https://doi.org/10.1007/s00024-019-02384-0, 2020. a
Kerner, M.: Effects of deepening the Elbe Estuary on sediment regime and water quality, Estuar. Coast. Shelf S., 75, 492–500, https://doi.org/10.1016/j.ecss.2007.05.033, 2007. a
Khadim, F. K., Kar, K. K., Halder, P. K., Rahman, M. A., and Morshed, A. M.: Integrated Water Resources Management (IWRM) Impacts in South West Coastal Zone of Bangladesh and Fact-Finding on Tidal River Management (TRM), Journal of Water Resource and Protection, 5, 953–961, https://doi.org/10.4236/jwarp.2013.510098, 2013. a
Kim, W., Mohrig, D., Twilley, R. R., Paola, C., and Parker, G.: Is it feasible to build new land in the Mississippi River delta?, Eos T. Am. Geophys. Un., 90, 373–374, 2009. a
Knights, D., Sawyer, A. H., Barnes, R. T., Piliouras, A., Schwenk, J., Edmonds, D. A., and Brown, A. M.: Nitrate Removal Across Ecogeomorphic Zones in Wax Lake Delta, Louisiana (USA), Water Resour. Res., 56, e2019WR026867, https://doi.org/10.1029/2019WR026867, 2020. a, b
Knights, D., Sawyer, A. H., Edmonds, D. A., Olliver, E. A., and Barnes, R. T.: The relationship between delta form and nitrate retention revealed by numerical modeling experiments, Water Resour. Res., 57, e2021WR030974, https://doi.org/10.1029/2021WR030974, 2021. a
Lauzon, R. and Murray, A. B.: Comparing the Cohesive Effects of Mud and Vegetation on Delta Evolution, Geophys. Res. Lett., 45, 10437–10445, https://doi.org/10.1029/2018GL079405, 2018. a, b, c, d, e, f, g
Lauzon, R., Piliouras, A., and Rowland, J. C.: Ice and Permafrost Effects on Delta Morphology and Channel Dynamics, Geophys. Res. Lett., 46, 6574–6582, https://doi.org/10.1029/2019GL082792, 2019. a, b, c
Le, T. V. H., Nguyen, H. N., Wolanski, E., Tran, T. C., and Haruyama, S.: The combined impact on the flooding in Vietnam's Mekong River delta of local man-made structures, sea level rise, and dams upstream in the river catchment, Estuar. Coast. Shelf S., 71, 110–116, https://doi.org/10.1016/j.ecss.2006.08.021, 2007. a
Lexartza-Artza, I. and Wainwright, J.: Hydrological connectivity: Linking concepts with practical implications, Catena, 79, 146–152, https://doi.org/10.1016/j.catena.2009.07.001, 2009. a
Liang, M., Voller, V. R., and Paola, C.: A reduced-complexity model for river delta formation – Part 1: Modeling deltas with channel dynamics, Earth Surf. Dynam., 3, 67–86, https://doi.org/10.5194/esurf-3-67-2015, 2015. a, b, c, d, e, f, g
Liang, M., Kim, W., and Passalacqua, P.: How much subsidence is enough to change the morphology of river deltas?, Geophys. Res. Lett., 43, 10266–10276, https://doi.org/10.1002/2016GL070519, 2016a. a, b
Liang, M., Van Dyk, C., and Passalacqua, P.: Quantifying the patterns and dynamics of river deltas under conditions of steady forcing and relative sea level rise, J. Geophys. Res.-Earth, 121, 465–496, https://doi.org/10.1002/2015JF003653, 2016b. a, b, c, d, e, f, g, h, i, j, k, l, m, n
Maneewongvatana, S. and Mount, D. M.: Analysis of approximate nearest neighbor searching with clustered point sets, arXiv [preprint], https://doi.org/10.48550/arXiv.cs/9901013, 1999. a
Masud, M. M. A., Moni, N. N., Azadi, H., and Van Passel, S.: Sustainability impacts of tidal river management: Towards a conceptual framework, Ecol. Indic., 85, 451–467, https://doi.org/10.1016/j.ecolind.2017.10.022, 2018. a
Monge-Ganuzas, M., Cearreta, A., and Evans, G.: Morphodynamic consequences of dredging and dumping activities along the lower Oka estuary (Urdaibai Biosphere Reserve, southeastern Bay of Biscay, Spain), Ocean Coast. Manage., 77, 40–49, https://doi.org/10.1016/j.ocecoaman.2012.02.006, 2013. a
Moodie, A., Hariharan, J., Barefoot, E., and Passalacqua, P.: pyDeltaRCM: a flexible numerical delta model, Journal of Open Source Software, 6, 3398, https://doi.org/10.21105/joss.03398, 2021. a, b
Moodie, A. J. and Passalacqua, P.: When Does Faulting-Induced Subsidence Drive Distributary Network Reorganization?, Geophys. Res. Lett., 48, e2021GL095053, https://doi.org/10.1029/2021GL095053, 2021. a, b
Moodie, A. J., Hariharan, J., Barefoot, E., and Passalacqua, P.: pyDeltaRCM v2.1.4, GitHub [code], https://github.com/DeltaRCM/pyDeltaRCM/releases/tag/v2.1.4 (last access: August 2022), 2022. a
Mossa, J. and Chen, Y. H.: Geomorphic insights from eroding dredge spoil mounds impacting channel morphology, Geomorphology, 376, 107571, https://doi.org/10.1016/j.geomorph.2020.107571, 2021. a
Nardin, W. and Edmonds, D. A.: Optimum vegetation height and density for inorganic sedimentation in deltaic marshes, Nat. Geosci., 7, 722–726, 2014. a, b
Nardin, W., Edmonds, D. A., and Fagherazzi, S.: Influence of vegetation on spatial patterns of sediment deposition in deltaic islands during flood, Adv. Water Resour., 93, 236–248, https://doi.org/10.1016/j.advwatres.2016.01.001, 2016. a
Nielsen, O., Roberts, S., Gray, D., McPherson, A., and Hitchman, A.: Hydrodynamic modelling of coastal inundation, MODSIM 2005 International Congress on Modelling and Simulation, December 2005, 518–523, ISBN 0-9758400-0-2, 2005. a, b
Ohimain, E. I.: Environmental impacts of dredging in the Niger Delta, Terra et Aqua, 97, 9–19, 2004. a, b, c
Olliver, E. A. and Edmonds, D. A.: Defining the ecogeomorphic succession of land building for freshwater, intertidal wetlands in Wax Lake Delta, Louisiana, Estuar. Coast. Shelf S., 196, 45–57, 2017. a
Olliver, E. A. and Edmonds, D. A.: Hydrological Connectivity Controls Magnitude and Distribution of Sediment Deposition Within the Deltaic Islands of Wax Lake Delta, LA, USA, J. Geophys. Res.-Earth, 126, e2021JF006136, https://doi.org/10.1029/2021JF006136, 2021. a
Olliver, E. A., Edmonds, D. A., and Shaw, J. B.: Influence of Floods, Tides, and Vegetation on Sediment Retention in Wax Lake Delta, Louisiana, USA, J. Geophys. Res.-Earth, 125, e2019JF005316, https://doi.org/10.1029/2019JF005316, 2020. a
Olson, K. R. and Wright Morton, L.: Polders, dikes, canals, rice, and aquaculture in the Mekong Delta, Journal of Soil and Water Conservation, 73, 83A–89A, https://doi.org/10.2489/jswc.73.4.83A, 2018. a
Passalacqua, P.: The Delta Connectome: A network-based framework for studying connectivity in river deltas, Geomorphology, 277, 50–62, https://doi.org/10.1016/j.geomorph.2016.04.001, 2017. a
Passalacqua, P., Giosan, L., Goodbred, S., and Overeem, I.: Stable ≠ Sustainable: Delta dynamics versus the human need for stability, Earths Future, e2021EF002121, https://doi.org/10.1029/2021EF002121, 2021. a
Pethick, J. and Orford, J. D.: Rapid rise in effective sea-level in southwest Bangladesh: Its causes and contemporary rates, Global Planet. Change, 111, 237–245, https://doi.org/10.1016/j.gloplacha.2013.09.019, 2013. a
Piliouras, A., Kim, W., and Carlson, B.: Balancing Aggradation and Progradation on a Vegetated Delta: The Importance of Fluctuating Discharge in Depositional Systems, J. Geophys. Res.-Earth, 122, 1882–1900, https://doi.org/10.1002/2017JF004378, 2017. a
Piliouras, A., Lauzon, R., and Rowland, J. C.: Unraveling the Combined Effects of Ice and Permafrost on Arctic Delta Morphodynamics, J. Geophys. Res.-Earth, 126, e2020JF005706, https://doi.org/10.1029/2020JF005706, 2021. a, b
Pringle, C.: The need for a more predictive understanding of hydrologic connectivity, Aquat. Conserv., 13, 467–471, https://doi.org/10.1002/aqc.603, 2003. a
Proehl, J. A., Bilgili, A., Lynch, D. R., Smith, K., and Robinson Swift, M.: The use of Lagrangian particle methods to investigate ocean-estuary exchange in well-mixed estuaries, Dev. Water Sci., 55, 1825–1837, https://doi.org/10.1016/S0167-5648(04)80188-6, 2004. a
Renaud, F. G., Syvitski, J. P., Sebesvari, Z., Werners, S. E., Kremer, H., Kuenzer, C., Ramesh, R., Jeuken, A., and Friedrich, J.: Tipping from the Holocene to the Anthropocene: How threatened are major world deltas?, Curr. Opin. Env. Sust., 5, 644–654, https://doi.org/10.1016/j.cosust.2013.11.007, 2013. a, b
Roberts, S.: ANUGA, GitHub [code], https://github.com/GeoscienceAustralia/anuga_core/releases/tag/3.1.3 (last access: August 2022), 2022. a
Roberts, S., Nielsen, O., Gray, D., Sexton, J., and Davies, G.: ANUGA User Manual, GitHub [software], https://github.com/anuga-community/anuga_core/raw/main/doc/anuga_user_manual.pdf (last access: August 2022), 2015. a, b, c, d
Roberts, S. G., Stals, L., and Nielsen, O. M.: Parallelisation of a finite volume method for hydrodynamic inundation modelling, ANZIAM J., 49, 558, https://doi.org/10.21914/anziamj.v48i0.153, 2007. a
Samuelson, B. M.: The Effect of Flood Embankments on the River-Levels in the Irrawaddy Delta (ABRIDGES), in: Minutes of the Proceedings of the Institution of Civil Engineers, vol. 203, Thomas Telford-ICE Virtual Library, 362–370, https://doi.org/10.1680/imotp.1917.15886, 1917. a
Sassi, M. G., Hoitink, A. J., De Brye, B., Vermeulen, B., and Deleersnijder, E.: Tidal impact on the division of river discharge over distributary channels in the Mahakam Delta, Ocean Dynam., 61, 2211–2228, https://doi.org/10.1007/s10236-011-0473-9, 2011. a
Sassi, M. G., Hoitink, A. J., De Brye, B., and Deleersnijder, E.: Downstream hydraulic geometry of a tidally influenced river delta, J. Geophys. Res.-Earth, 117, 4022, https://doi.org/10.1029/2012JF002448, 2012. a
Sendrowski, A. and Passalacqua, P.: Process connectivity in a naturally prograding river delta, Water Resour. Res., 53, 1841–1863, https://doi.org/10.1002/2016WR019768, 2017. a
Serra, J. P.: Image analysis and mathematical morphology, Academic Press, London, https://doi.org/10.1002/cyto.990040213, 1982. a
Shaw, J. B., Wolinsky, M. A., Paola, C., and Voller, V. R.: An image-based method for shoreline mapping on complex coasts, Geophys. Res. Lett., 35, https://doi.org/10.1029/2008GL033963, 2008. a, b
Shaw, J. B., Mohrig, D., and Whitman, S. K.: The morphology and evolution of channels on the Wax Lake Delta, Louisiana, USA, J. Geophys. Res.-Earth, 118, 1562–1584, 2013. a
Shaw, J. B., Mohrig, D., and Wagner, R. W.: Flow patterns and morphology of a prograding river delta, J. Geophys. Res.-Earth, 121, 372–391, https://doi.org/10.1002/2015JF003570, 2016. a
Simeoni, U. and Corbau, C.: A review of the Delta Po evolution (Italy) related to climatic changes and human impacts, Geomorphology, 107, 64–71, https://doi.org/10.1016/j.geomorph.2008.11.004, 2009. a
Straub, K. M., Li, Q., and Benson, W. M.: Influence of sediment cohesion on deltaic shoreline dynamics and bulk sediment retention: A laboratory study, Geophys. Res. Lett., 42, 9808–9815, https://doi.org/10.1002/2015GL066131, 2015. a, b
Temmerman, S. and Kirwan, M. L.: Building land with a rising sea, Science, 349, 588–589, 2015. a
Tetzlaff, D., Soulsby, C., Bacon, P. J., Youngson, A. F., Gibbins, C., and Malcolm, I. A.: Connectivity between landscapes and riverscapes – A unifying theme in integrating hydrology and ecology in catchment science?, Hydrol. Process., 21, 1385–1389, https://doi.org/10.1002/hyp.6701, 2007. a
Tull, N., Passalacqua, P., Hassenruck-Gudipati, H. J., Rahman, S., Wright, K., Hariharan, J., and Mohrig, D.: Bidirectional River-Floodplain Connectivity During Combined Pluvial-Fluvial Events, Water Resour. Res., 58, e2021WR030492, https://doi.org/10.1029/2021wr030492, 2022. a, b
Vale, L. M. and Dias, J. M.: Coupling of a Lagrangian particle tracking module to a numerical hydrodynamic model: Simulation of pollution events inside an estuarine port area, J. Coastal Res., 64, 1609–1613, 2011. a
Valseth, E., Loveland, M. D., Dawson, C., and Buskey, E. J.: A study of the potential impact of dredging the corpus christi ship channel on passive particle transport, Journal of Marine Science and Engineering, 9, 935, https://doi.org/10.3390/jmse9090935, 2021. a, b
van der Walt, S., Schönberger, J. L., Nunez-Iglesias, J., Boulogne, F., Warner, J. D., Yager, N., Gouillart, E., Yu, T., and the scikit-image contributors. scikit-image: Image processing in Python, Peer J., 2, e453 , https://doi.org/10.7717/peerj.453, 2014. a
van Dijk, W. M., Cox, J. R., Leuven, J. R., Cleveringa, J., Taal, M., Hiatt, M. R., Sonke, W., Verbeek, K., Speckmann, B., and Kleinhans, M. G.: The vulnerability of tidal flats and multi-channel estuaries to dredging and disposal, Anthropocene Coasts, 4, 36–60, https://doi.org/10.1139/anc-2020-0006, 2021. a, b, c
Viero, D. P. and Defina, A.: Water age, exposure time, and local flushing time in semi-enclosed, tidal basins with negligible freshwater inflow, J. Marine Syst., 156, 16–29, https://doi.org/10.1016/j.jmarsys.2015.11.006, 2016. a
Virtanen, P., Gommers, R., Oliphant, T. E., Haberland, M., Reddy, T., Cournapeau, D., Burovski, E., Peterson, P., Weckesser, W., Bright, J., van der Walt, S. J., Brett, M., Wilson, J., Millman, K. J., Mayorov, N., Nelson, A. R. J., Jones, E., Kern, R., Larson, E., Carey, C. J., Polat, I., Feng, Y., Moore, E. W., VanderPlas, J., Laxalde, D., Perktold, J., Cimrman, R., Henriksen, I., Quintero, E. A., Harris, C. R., Archibald, A. M., Ribeiro, A. H., Pedregosa, F., van Mulbregt, P., and SciPy 1.0 Contributors: SciPy 1.0: Fundamental Algorithms for Scientific Computing in Python, Nat. Methods, 17, 261–272, https://doi.org/10.1038/s41592-019-0686-2, 2020. a
Wang, X., Zhang, W., Yin, J., Wang, J., Ge, J., Wu, J., Luo, W., and Lam, N. S.: Assessment of coastal erosion vulnerability and socio-economic impact along the Yangtze River Delta, Ocean Coast. Manage., 215, 105953, https://doi.org/10.1016/j.ocecoaman.2021.105953, 2021. a
Wesselink, A., Warner, J. F., Syed, M. A., Chan, F., Tran, D. D., Huq, H., Huthoff, F., Le Thuy, N., Pinter, N., van Staveren, M. F., Wester, P., and Zegwaard, A.: Trends in flood risk management in deltas around the world: Are we going “soft”?, International Journal of Water Governance, 3, 25–46, 2015. a
Wilson, C., Goodbred, S., Small, C., Gilligan, J., Sams, S., Mallick, B., and Hale, R.: Widespread infilling of tidal channels and navigable waterways in the human-modified tidal deltaplain of southwest Bangladesh, Elementa, 5, 78, https://doi.org/10.1525/elementa.263, 2017. a, b, c, d
Wright, K., Hiatt, M., and Passalacqua, P.: Hydrological Connectivity in Vegetated River Deltas: The Importance of Patchiness Below a Threshold, Geophys. Res. Lett., 45, 10416–10427, https://doi.org/10.1029/2018GL079183, 2018. a
Wright, K., Hariharan, J., Passalacqua, P., Salter, G., and Lamb, M. P.: From Grains to Plastics: Modeling Nourishment Patterns and Hydraulic Sorting of Fluvially Transported Materials in Deltas, J. Geophys. Res.-Earth, 127, e2022JF006769, https://doi.org/10.1029/2022JF006769, 2022a. a, b, c, d, e, f, g
Wright, K., Passalacqua, P., Simard, M., and Jones, C. E.: Integrating Connectivity Into Hydrodynamic Models: An Automated Open-Source Method to Refine an Unstructured Mesh Using Remote Sensing, J. Adv. Model. Earth Sy., 14, e2022MS003025, https://doi.org/10.1029/2022MS003025, 2022b. a, b, c, d, e, f
Yuan, R. and Zhu, J.: The Effects of Dredging on Tidal Range and Saltwater Intrusion in the Pearl River Estuary, J. Coastal Res., 31, 1357–1362, https://doi.org/10.2112/JCOASTRES-D-14-00224.1, 2015. a, b, c, d
Zhu, J., Weisberg, R. H., Zheng, L., and Han, S.: Influences of Channel Deepening and Widening on the Tidal and Nontidal Circulations of Tampa Bay, Estuar. Coast., 38, 132–150, https://doi.org/10.1007/s12237-014-9815-4, 2015. a
Zoccarato, C., Minderhoud, P. S., and Teatini, P.: The role of sedimentation and natural compaction in a prograding delta: insights from the mega Mekong delta, Vietnam, Sci. Rep.-UK, 8, 1–12, https://doi.org/10.1038/s41598-018-29734-7, 2018. a