the Creative Commons Attribution 4.0 License.
the Creative Commons Attribution 4.0 License.
 | 27 Jul 2023
Development of a machine learning model for river bed load
Hossein Hosseiny
Jedidiah E. Dale
Colin B. Phillips
Prediction of bed load sediment transport rates in rivers is a notoriously difficult problem due to inherent variability in river hydraulics and channel morphology. Machine learning (ML) offers a compelling approach to leverage the growing wealth of bed load transport observations towards the development of a data-driven predictive model. We present an artificial neural network (ANN) model for predicting bed load transport rates informed by 8117 measurements from 134 rivers. Inputs to the model were river discharge, flow width, bed slope, and four bed surface sediment sizes. A sensitivity analysis showed that all inputs to the ANN model contributed to a reasonable estimate of bed load flux. At individual sites, the ANN model was able to reproduce observed sediment rating curves with a variety of shapes without site-specific calibration. This ANN model has the potential to be broadly applied to predict bed load fluxes based on discharge and reach properties alone.
- Article
(2537 KB) - Full-text XML
-
Supplement
(1325 KB) - BibTeX
- EndNote


Bed load transport in rivers is a stochastic (Ancey, 2010; Paintal, 1971), nonlinear (Meyer-Peter and Müller, 1948; Wong and Parker, 2006) phenomenon with high dimensionality (Goldstein et al., 2019). Further, direct measurements of bed load transport are often challenging to collect reliably, especially for large, rare floods or over long periods of time. In lieu of continuous measurement, accurate estimation of bed load transport rates with minimal site-specific calibration has a number of applications (Wilcock, 2001), including but not limited to quantifying channel conveyance (Slater and Singer, 2013), informing river restoration efforts (East et al., 2015; Warrick et al., 2015), and approximating bedrock incision rates (Beer and Turowski, 2021). As such, there has been a long legacy of scientific inquiry towards accurate quantitative prediction of bed load transport rates, beginning in the early 1900s (Gilbert, 1914) and continuing to today (Einstein, 1937; Wilcock and Crowe, 2003; Lajeunesse et al., 2010; and recently Zhao and Nepf, 2021, among many others). A number of models of fluvial sediment transport have been developed based on semi-empirical regressions fit to flume (Meyer-Peter and Müller, 1948; Wong and Parker, 2006) and field (Recking, 2010, 2013b; Rickenmann, 1991) data, probabilistic approaches (Einstein, 1950; Furbish et al., 2012), and physics-based models (Lajeunesse et al., 2010; Parker, 1990; Wilcock and Crowe, 2003). Multi-model comparisons demonstrate that few models consistently perform well for large, multi-region datasets, partly due to limitations in addressing site-specific variability or due to temporal and spatial averaging (Barry et al., 2008; Gomez and Church, 1989; Recking, 2010, 2013a). As such, existing bed load flux models are not versatile enough to be applied across the range of observed river reaches without extensive regional or site-specific calibration (Goldstein et al., 2019; Kitsikoudis et al., 2015). Thus, predicting rates of bed load sediment transport remains a persistent challenge, with predictions within 1 order of magnitude of direct measurements generally considered to be reasonable model performance (Recking, 2013a; Recking et al., 2012).
This inherent variability in bed load transport observations, and the associated need for site-specific calibration efforts, has led to recent suggestions that the reliable and consistent prediction of bed load transport from reach-scale parameters may be intractable (Gomez and Soar, 2022). Indeed, there are a number of factors that give rise to variability in bed load transport rates across sites or through time at a single site, including but not limited to spatial variability in both turbulent stresses and bed heterogeneity (Monsalve and Yager, 2017; Monsalve et al., 2016); grain protrusion, compaction, and structural arrangement of the bed (Church et al., 1998; Houssais et al., 2015; Marquis and Roy, 2012; Masteller and Finnegan, 2017; Masteller et al., 2019); intermittency in flux and sampling times (Bunte and Abt, 2005; Singh et al., 2009; Recking et al., 2012); upstream sediment supply (Recking, 2012; Singer, 2010; Gomez and Soar, 2022); and interactions between grain size fractions on the surface and within the bed (Wilcock, 1998; Ferdowsi et al., 2017).
Results from laboratory flume experiments and long-term field monitoring demonstrate that much of this variability may be collapsed or understood under controlled conditions. Grain protrusion within mixed grain size distributions can be accounted for through the use of hiding functions and relative reference critical shear stresses (Einstein, 1950; Ashida and Michiue, 1972; Parker and Klingeman, 1982; Wilcock and Crowe, 2003). The challenge of vertical sorting and differing grain sizes between the riverbed surface and subsurface was circumnavigated through the development of surface-based transport relations (Parker, 1990). Even grain-scale complexity in the particle shape can be unraveled by accounting for relative changes in fluid drag and friction (Deal et al., 2023). Field and laboratory experiments demonstrate that the impact of a hydrograph with floods of different magnitudes and shapes on bed load flux can be understood cumulatively and is linearly related to the integral of the excess shear stress (Phillips and Jerolmack, 2014; Phillips et al., 2018). These selected demonstrations indicate that while there may be significant variability in raw measurements of bed load flux, this variability is not such that the development of a model which accurately captures patterns in bed load flux is intractable. Wholesale field application of a physically based model will continue to remain data-limited; however, the introduction of longer-term monitoring stations indicates that a more nuanced physical model may be on the horizon (Rickenmann and McArdell, 2007; Rickenmann, 2018; Gomez et al., 2022).
The known complexity of natural river processes combined with the amount of available bed load data across many sites and settings (Hinton et al., 2017; King et al., 2004; Recking, 2019) suggests that this process may be predictable from a data science approach (Geron, 2019). Machine learning (ML) approaches leverage available data to train computers to, through an automated process, determine the relative contribution of individual input variables to a measured output (Geron, 2019). In the learning process, the ML algorithm iteratively discovers patterns and relations within the data and uses them for future predictions, given similar input data. Many ML approaches do not consider the physics behind any specified problem directly but excel at predicting nonlinear relationships with high dimensionality, given sufficient training data (Hosseiny, 2021; Hosseiny et al., 2020). Machine learning approaches can leverage variability aggregated from many existing datasets in order to improve site-specific bed load transport predictions across a range of fluvial environments. ML approaches have been previously exploited in a variety of geoscience problems including the identification of vulnerability in Antarctica's ice sheet (Lai et al., 2020), global-scale soil salinization predictions (Hassani et al., 2021), and landslide susceptibility mapping (Zhou et al., 2021). In particular, an artificial neural network (ANN) approach may be particularly well-suited for bed load prediction. The ANN is a well-tested and powerful method which, through an iterative and automated training process, determines the weighted contribution of numerous input parameters towards a specified output (Haykin, 2009). This iterative approach allows ANN to parse nonlinear relations between numerous input parameters, making it a flexible tool for solving a wide range of problems, including optimization (Haykin, 2001) and data classification (Saravanan and Sasithra, 2014). Relevant to geoscience applications, ANNs have shown to be versatile tools towards more accurate descriptions of rainfall–runoff processes (Hsu et al., 1995; Han and Morrison, 2022), the prediction of riverbed porosity (Bui et al., 2019), and flood prediction (Hosseiny et al., 2020).
Despite publicly available, high-quality observational data, the application of ML tools to sediment transport in rivers has, to our knowledge, remained limited. Kitsikoudis et al. (2015) used sediment concentration data from flume and field studies, for sand- (median grain size, D50=0.062–2.0 mm) bed rivers (Brownlie, 1981), to evaluate the performance of ML approaches: (a) ANN, (b) symbolic regression (SR), and (c) adaptive-network-based fuzzy inference (ANFIS) models. Their results show that models trained solely on flume data perform worse than those trained on field data with root mean squared errors (RMSEs) of flume-trained predictions between 85 % and 97 % more than field-trained models. This study also found that the ANN model trained on field data performed best, with RMSE values of 7.5 % and 11.1 % less than ANFIS and SR, respectively. Aseghi and Hosseini (2020) trained an ANN using 102 measurements of discharge, velocity, water surface slopes, flow depth, and median grain size to develop a prediction model for bed load transport for a single site – the Main Red Fork River in Idaho. They found that the trained ANN captured bed load flux measurements more accurately than existing empirical equations. However, the wider applicability of the study may be limited because the ANN was trained using data from only a single site. Kitsikoudis et al. (2015) focuses on bed load transport within gravel-bed rivers; however, the dataset is primarily drawn from a limited geographic region of the United States (Idaho, King et al., 2004). These data are generally of high quality, and while they integrate measurements from a number of rivers, they occupy only a limited portion of the gravel-bed river parameter space. These rivers tend to be steeper, coarser grained, and shallower than average, limiting relations derived from these data to similar geographic locations (see Phillips and Jerolmack, 2019). Bhattacharya et al. (2007) used an ANN approach using the Gomez and Church (1989) sediment flux database for sand- and gravel- (D50=0.062–64 mm) bed rivers in subcritical flow to predict bed load and total load transport rates as a function of a combination of measured and derived input parameters. These input parameters include velocity, depth, particle diameter, slope, nondimensional shear stress, critical shear stress, and stream power. They concluded that the RMSE of the model trained based on field data (407 observations) was on average 33.6 % less than those derived from flume data and 16.4 % to 249.6 % less than several empirical and physically based models (Bhattacharya et al., 2007).
While these previous studies have demonstrated that ML models can improve upon existing sediment transport models, this suite of ML models have been trained with limited data (less than 500 observations) and under a relatively narrow range of the full parameter space which gravel-bed rivers occupy globally. Despite the increasing availability of bed load datasets, the application of ML in generating a versatile, data-driven model for predicting bed load transport across a wide range of fluvial settings has not yet been investigated. To fill this gap, this paper develops a new ML model for predicting river bed load using an ANN approach and over 8000 measurements from over 100 unique field sites. The performance of the proposed model is then shown to outperform four existing sediment transport models using only the publicly available data (Einstein, 1950; Recking, 2013b; Wilcock and Crowe, 2003; Wong and Parker, 2006). We finally demonstrate the utility of a broadly trained ANN model by producing bed load transport rating curves for discharge without the need for additional site-specific calibration.
2.1 Data summary and preparation
We use a compilation of bed load transport rates downloaded from BedloadWeb (http://en.bedloadweb.com, last access: 25 April 2022), a publicly available online platform that hosts both previously published field and laboratory bed load datasets compiled from scientific literature or official reports and databases (Recking, 2019). Our study focused on field-collected datasets only as these cover a greater range of variability in terms of the key variables associated with bed load transport (e.g., discharge, grain size, slope). The database includes 10 056 individual measurements of bed load transport from more than 134 unique field sites across the globe. Each reported bed load transport data point, qs (g s−1 m−1), in our study has an associated measurement of river discharge, Q (m3 s−1), bed slope, S (m m−1), flow width, W (m), and the 16th, 50th, 84th, and 90th percentiles of the bed surface grain size distribution (D16, D50, D84, D90). An additional advantage of these specific input parameters is that the static parameters (slope and grain size) can be directly measured between transport events and used to predict sediment flux from available hydrograph data (discharge and width). An important advantage of using a multi-site dataset, such as the BedloadWeb database, for model training is to encompass a broader parameter space than would be present at any individual river location. These data span a wide range of bed slopes (0.018–0.136 m m−1), widths (0.3–306 m), grain sizes (D50 0.00013–0.22 m), and discharges (0.00005–427.5 m3 s−1). As such, an ANN model trained using this dataset will have significantly wider applicability than one trained on a dataset covering a smaller range. Within this database, slope and grain size are largely static variables for each site describing the river reach, while flow width and discharge are dynamic and vary in time at each site. Grain size data are a mixture of direct measurements and interpolated data under the assumption that bed surface sizes are log-normally distributed. Interpolated data are used in cases where specific percentiles of the grain size distribution have not been directly measured or reported by the original studies. In our compiled database, we used measured grain sizes whenever they are available. In five cases, D16 values are not reported, and interpolated data are used (Recking, 2019). In 53 cases, both D16 and D90 were not reported, and similarly, interpolated values were used as input parameters in these instances. In the initial training of the ANN, all reported variables are used as input parameters to train the model and predict qs, as we expect that a model informed by all available parameters (knowledge) will have the strongest predictive power (Haykin, 2009).
Prior to model training, the data were inspected for overall quality and outliers were removed. The presence of extreme values and outliers generally degrades the overall performance of the resulting model (Geron, 2019). As such, following procedures used in prior studies, we chose to first remove transport measurements with associated discharge values exceeding the 95th percentile (Dovoedo and Chakraborti, 2013; Kennedy et al., 1992) of all reported discharges in the database (Q>430 m3 s−1; a total of 504 points), followed by removing extreme qs values above the 95th percentile of the remaining data (qs>401.4 g s−1 m−1; 478 data points) as well as those below the 10th percentile (Kennedy et al., 1992) of remaining data (qs<0.1 g s−1 m−1; 957 data points). Following removal of these points, the total sample number was reduced from 10 056 to 8117 measurements across 134 rivers. This screening process did not eliminate any individual site from the database, such that neither large nor small rivers are selectively removed during this data preparation step. While this removal of more extreme values is an important step to ensure model quality, we acknowledge that this step preferentially removes the most extreme flow and sediment transport events from the dataset. While there is significant interest in predicting sediment transport rates for extreme flow events, these largest events are the least frequently occurring in the dataset and more data would be needed to train an ANN model to reliably predict bed load flux under these conditions. Following this screening, we maintain 134 distinct datasets, emphasizing that the training data do encompass more frequently occurring small and intermediate floods across all available sites in the database. Thus, while the trained model presented here may not be appropriate to predict bed load flux in response to exceptional events in larger rivers, it can still be applied over many orders of magnitude of discharge, as described above. Following this screening process, the median number of samples across all sites is n=50. For larger rivers with maximum discharges exceeding 300 m3 s−1 (n=17), the median number of samples is reduced to n=23. However, five of these largest rivers have sample sizes exceeding the median sample size of n=50, with a maximum sample size of n=146 for the Mondego River (1.8 % of the full database). Thus, following the screening process, large rivers remain adequately represented in the training dataset. The 25th percentile for sample sizes is n=18 and the 75th percentile is n=83, with 82 % of the sample sizes within 1 order of magnitude. Only 22 sites have more than 100 samples. The largest dataset is from Goodwin Creek, which has 307 samples and comprises < 4 % of the full database. Given this, we do not expect that any individual dataset should overly bias model training. Data were then log-transformed (base 10) such that each parameter distribution would more closely follow a normal distribution (see Supplement). Data were then scaled by minimum and maximum measurement values, such that the transformed range of values for each variable ranged from 0 to 1 (Geron, 2019; Haykin, 2009). Data were shuffled and randomly divided into two populations: a training population (80 %) and a test population (20 %) with equivalent distributions consistent with the full dataset.
2.2 Machine learning structure and implementation
Following previous applications of ML to sediment transport (e.g., Bhattacharya et al., 2007; Goldstein et al., 2019; Kitsikoudis et al., 2015), we employ an artificial neural network (ANN) approach. The ANN framework is based on a network of connected units (neurons), most commonly comprised of single input and output layers, and multiple hidden layers, where each layer contains a set of neurons (Geron, 2019; Haykin, 2009) (Fig. 1a). The ANN presented here was developed using Keras (Chollet, 2015), an application programming interface in the Python programming language. The structure of the ANN was informed by available bed load transport data and associated measurements of discharge, channel morphology (slope and width), and grain size (4 measurements). The input and output layers of the ANN were set to seven (Q, S, W, D16, D50, D84, D95) and one (qs), respectively. The functions that guide the model in identifying nonlinear relations (activation functions) were set to the rectified linear unit (ReLU), except one function associated with the output layer, which was set to be a sigmoid function. The ReLU(x) returns the maximum (0, x) and sigmoid(x) returns . To avoid overfitting in the training process, each input segment was normalized (batch normalization) and a subset of the neurons in each layer were temporarily ignored (dropout) to add additional noise to data (Geron, 2019). The training process of the ANN model uses 80 % of the bed load transport data to determine the weight coefficients of the neurons' connections that minimize prediction error. During each iteration of the ANN during the training process, the mean standard error (MSE) is computed between the model-predicted data and the observational training data (Fig. 1b). We select MSE over root mean square error (RMSE) because it more heavily penalizes larger errors compared to RMSE, which is the square root of MSE, or the coefficient of determination (R2). This penalization of large errors by MSE is particularly helpful in the efficient optimization of the ANN across multiple training epochs. To assess whether the model may be over-fit to the training data, we also perform a validation test of the model at every iteration of the ANN. The validation of the ML model in each iteration (epoch) was carried out by calculating the MSE on a random subset of the training dataset that is not used in that epoch. For this application, 10 % of the training dataset was used within the epoch model validation step. Once the MSE of the training dataset has reached a stable minimum across many iterations (Fig. 1b), and the MSE on the validation data is consistent with this minimum, we consider the model to be sufficiently trained.
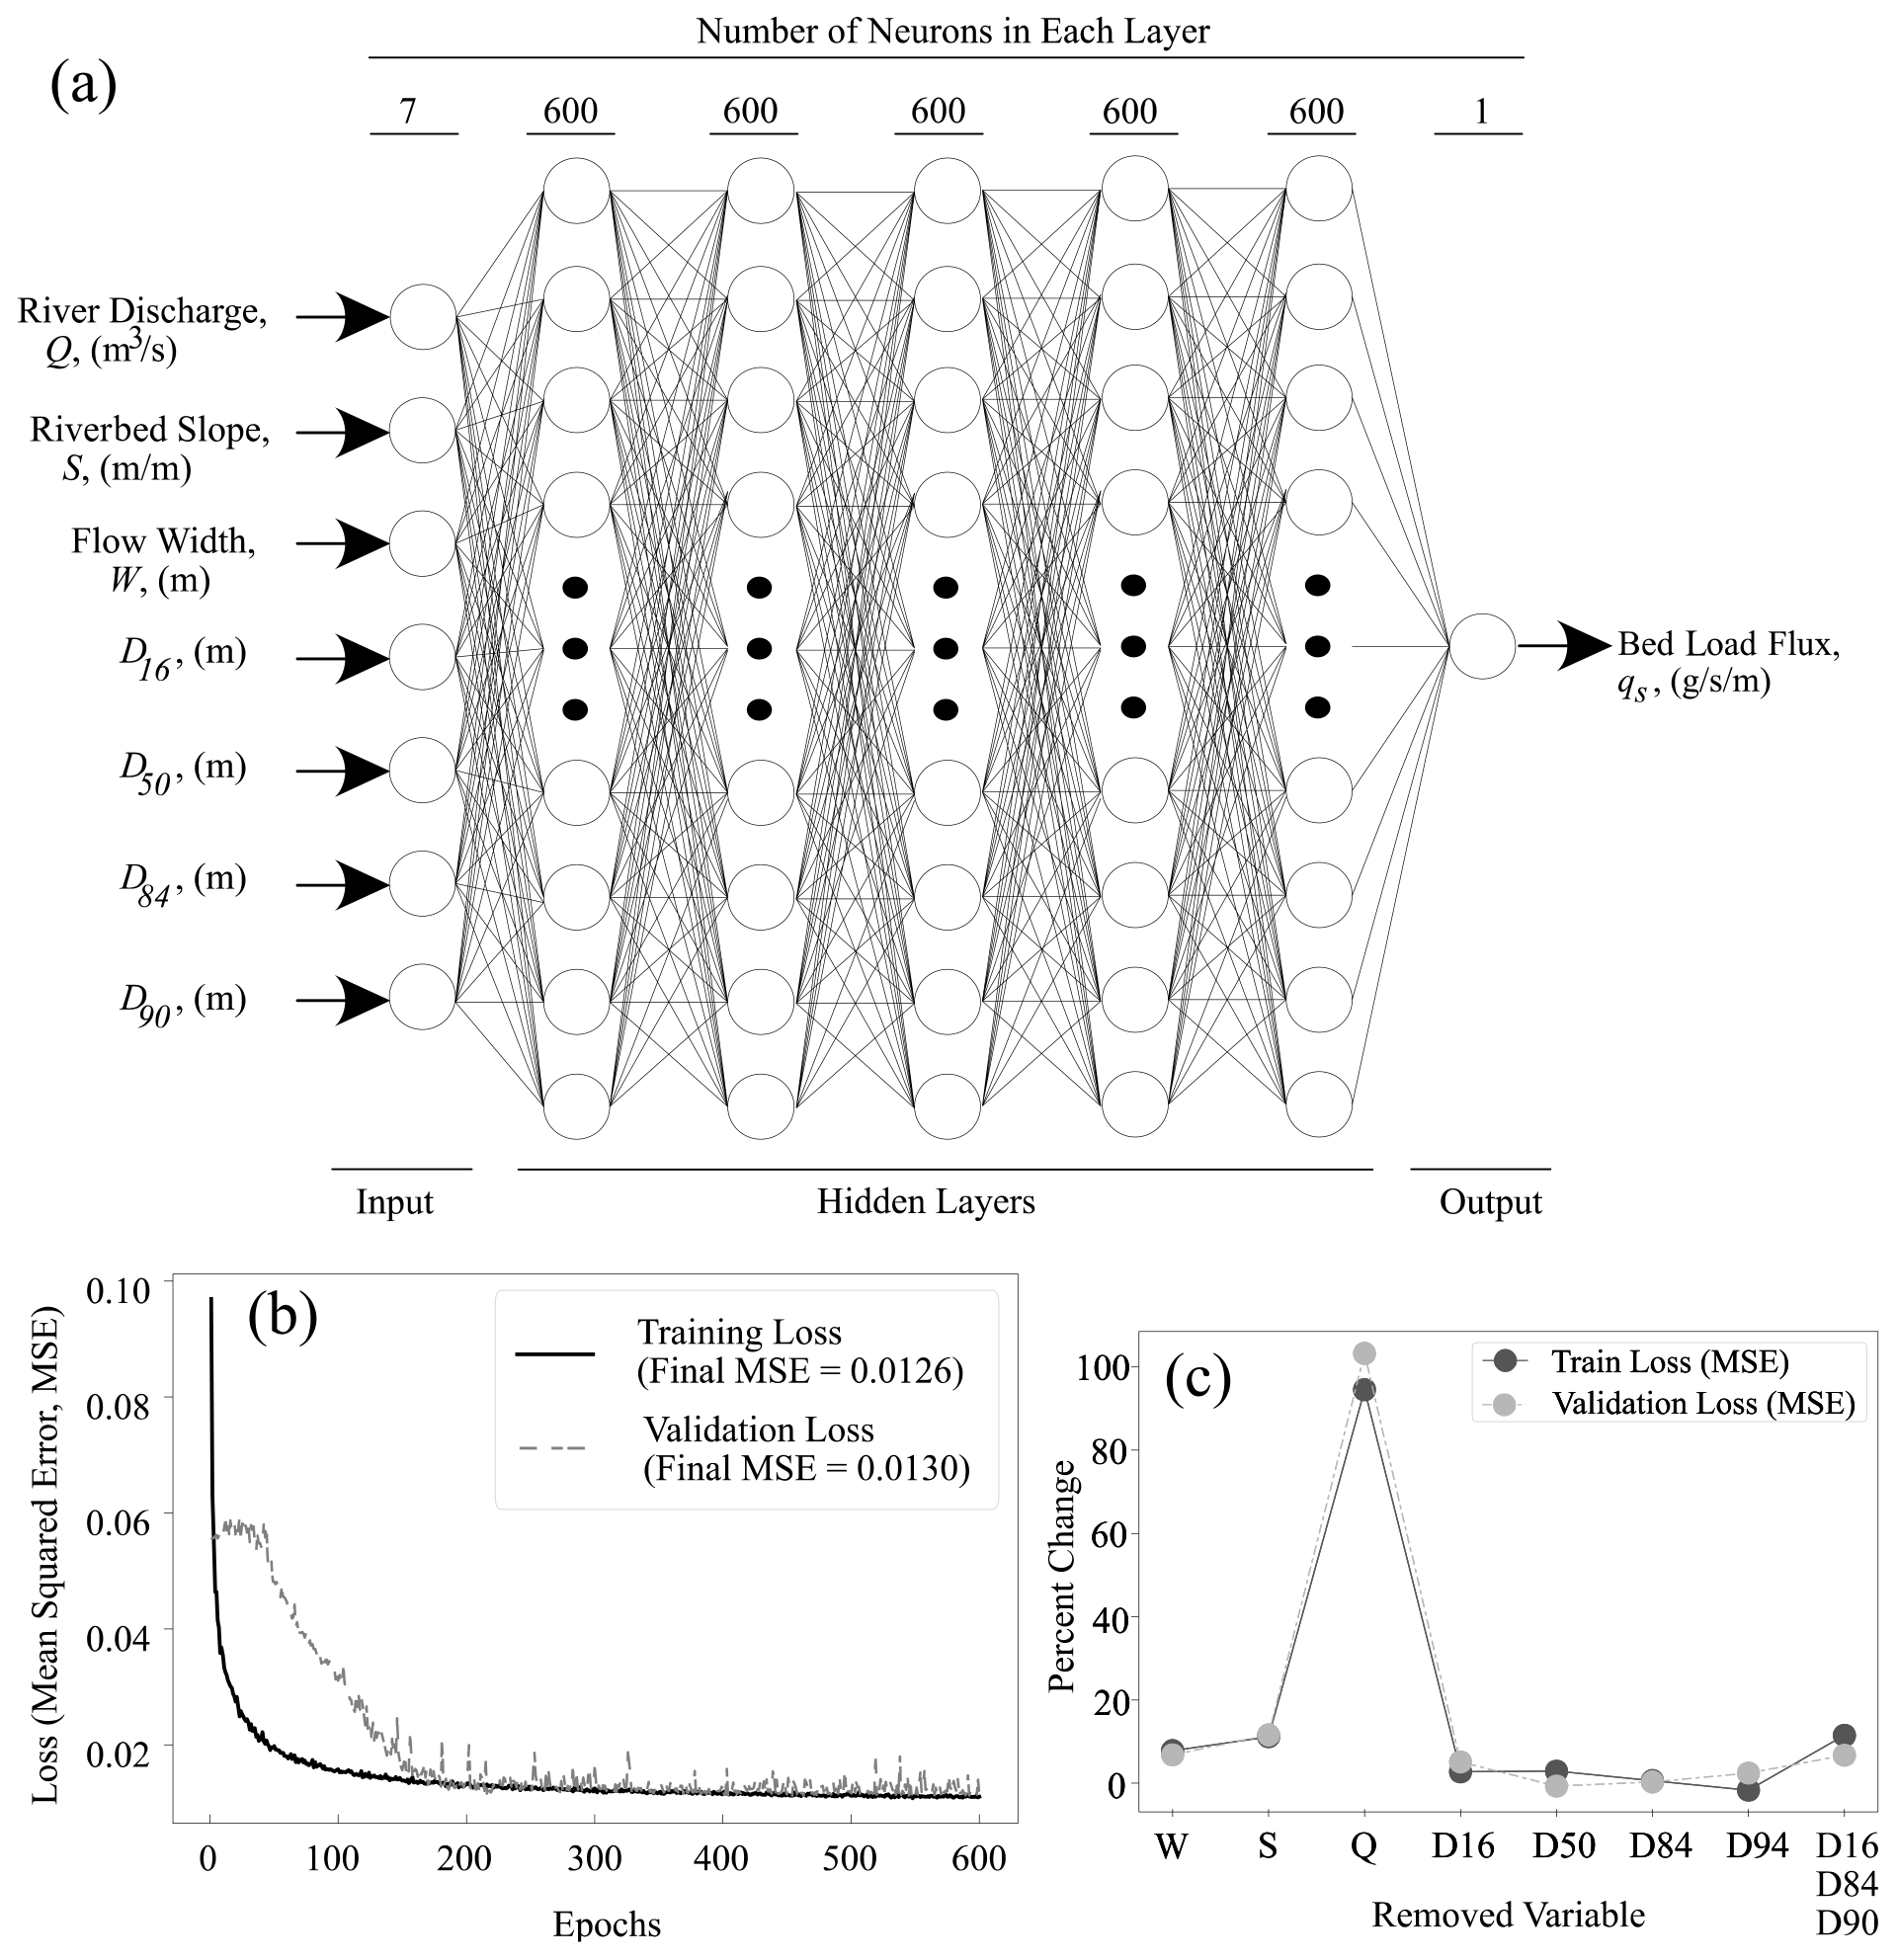
Figure 1(a) Structure of the ANN model developed in this study with seven input parameters. (b) Learning curves illustrate the decline in mean squared errors (MSEs) for training and validation. (c) Variations in ML model performance in training and validation due to changes in model input variables.
2.3 Comparison of ANN performance with previous bed load models
We selected four bed load transport models with varying approaches and degrees of complexity to compare to and build intuition for the predictions of the ANN model. We selected the following: (1) a probabilistic model developed by Einstein (1950), (2) a physics-based model developed by Wilcock and Crowe (2003), and (3, 4) two empirical models from Wong and Parker (2006) and Recking (2013b). We acknowledge that these physics-based bed load transport equations could likely be calibrated to fit the available data as many of the equation coefficients are in practice tuneable to the data at hand. However, the need for site-specific sediment flux measurements to calibrate a relation severely limits the application of these bed load transport equations to most natural settings as the accurate measurement of bed load transport remains a challenging and time-consuming endeavor. Given that the aim of this contribution is to develop a predictive model that does not require any site-specific calibration, we do not undertake any additional tuning of the existing equations for bed load transport across sites prior to comparison with the ANN predictions. Within this analysis, the purpose of utilizing these four different bed load transport equations is to provide a comparison with and build intuition for the ANN approach.
We compared bed load flux measurements to predictions from these four bed load transport models and the trained ANN model (Fig. 2). All predictions were made using the 20 % of data excluded from the ANN training process (test data, n=1624). The ANN model utilizes all available data from the bed load database (7 inputs), while the bed load transport models have varying degrees of complexity, ranging from requiring four input parameters (Einstein, 1950; Wong and Parker, 2006) to five input parameters (Wilcock and Crowe, 2003) (see Table S3). Selected previously developed models are valid for sand- and gravel-bed rivers, and therefore, the comparison is restricted to these rivers. A further description of these models is provided in the Supplement.
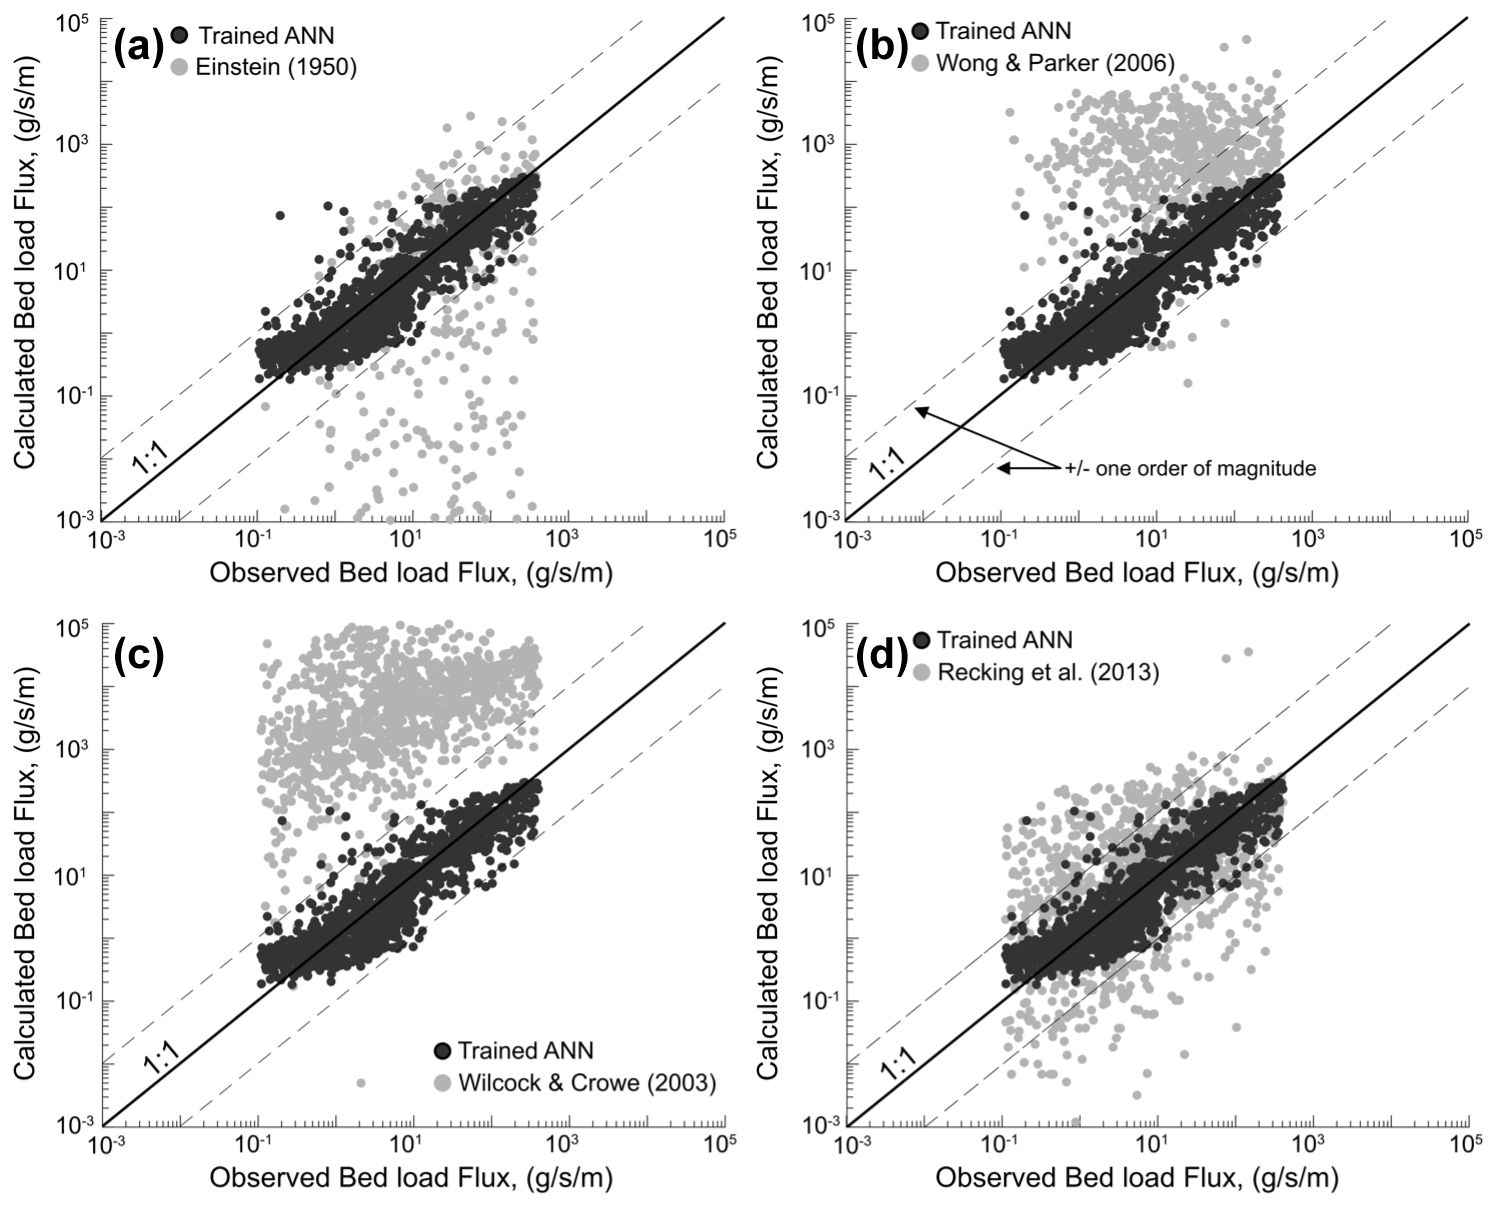
Figure 2Comparison between ANN prediction for the test data (gravel- and sand-bed rivers) and previous models of (a) Einstein (1950), (b) Wong and Parker (2006), (c) Wilcock and Crowe (2003), and (d) Recking (2013). Note that calculated Einstein values below g s−1 m−1 are not shown in the plot for legibility.
2.3.1 Einstein (1950)
The Einstein (1950) model assumes that bed load flux is related to the probability of a particle being eroded as a function of changes in turbulent intensity rather than the average fluid forces acting on the particle. As such, the model relates the probability of erosion (as a function of flow intensity) to the intensity of bed load transport (Eq. 1). This method does not require a critical shear stress for incipient motion since the movement of the grain is based on probabilistic estimates. The Einstein equation tends to perform well for estimating local bed load in large rivers with uniform sand and gravel (Garcia, 2007). The implicit form of the Einstein equation is described as
where τ* is the dimensionless shear stress for uniform flow (Shields stress), t is the integral parameter, and q* is the dimensionless bed load transport rate (or Einstein bed load number).
2.3.2 Wong and Parker (2006)
Wong and Parker (2006) reanalyzed the data used to develop the foundational Meyer-Peter and Muller (MPM) equation (Meyer-Peter and Müller, 1948) and found a better fit to data resulting in the following equation:
where the exponent is fixed at and is the dimensionless threshold of sediment entrainment. The MPM equation is similar in form but tends to overpredict bed load at higher discharges (Barry et al., 2004). Experimentally, bed load flux is well-described by Eq. (5) and similar models employing excess shear stress raised to a power (see Lajeunesse et al., 2010); however, application within different rivers and flumes typically requires that both the coefficient and threshold shear stress be treated as fitting parameters (Mueller et al., 2005; Phillips and Jerolmack, 2019). Here, for the sake of comparison, we have applied this equation using fixed coefficient and thresholds as it was not possible to estimate these parameters at each site in the database. The difficulty in estimating the threshold shear stress is a significant hurdle in the application of bed load transport equations (Buffington and Montgomery, 1997, Phillips et al., 2022).
2.3.3 Wilcock and Crowe (2003)
Wilcock and Crowe (2003) presented a sophisticated transport model for mixed gravel and sand based on 48 laboratory experiments with 5 different sediments sizes. The fractional transport discharge in this model is estimated based on a reference parameter informed by the sediment distribution of the bed surface. This model represents a major advance by incorporating the nonlinear effects of sand content on the mobility of gravel and the overall transport rate (Wilcock and Crowe, 2003). We applied this model to the available testing dataset by estimating sand fractions from sediment grain size data followed by estimating the reference shear stress for the geometric mean grain size. More information about this method and the steps undertaken in this study is presented in the Supplement (Sect. S1).
2.3.4 Recking (2013b)
The Recking (2013b) model is a single continuous function from two equations previously developed in Recking (2010). The model can be used for sand and gravel mixtures and was developed based on 6319 field observations and 1317 flume measurements (Recking, 2010). The model considers sediment mobility based on D84, as this size was observed to impact bed material mobility, flow resistance, hiding, surface armoring, and bed shear stress (Recking, 2013b). The critical mobility parameter () is set to a constant for sand, and as a function of the ratio of and the river slope, S.
2.3.5 Quantitative comparison of ANN performance and bed load models
In order to evaluate the performance of the ANN relative to these existing models, we calculated MAE for the four previous bed load transport models and the ANN model based on the direct measurements of bed load flux from the BedloadWeb database within the portion of the dataset reserved for the test (n=1624). MAE is calculated as
We selected MAE as the primary criteria to assess the average model performance because it is less sensitive to extreme values (Willmott and Matsuura, 2005). To better compare the under- and overprediction of each model across multiple orders of magnitude, we log-transformed all bed load transport observations and predictions. This is because, based on Eq. (3), predicted values that fall multiple orders of magnitude below observed values will result in very small differences between predicted and observed values, which, result, by definition, in very small MAE values. In extreme cases, MAE values computed for models that, on average, underpredict the observed data by multiple orders of magnitude (e.g., Fig. 2a) can be less than MAE values for models that equally over- and underpredict the observed data within the same order of magnitude (e.g., Fig. 2d). In this case, computing MAE on log-transformed observations and model predictions more equally weights underpredictions of each model relative to model overpredictions. Further, given that the observations of bed load transport span 4 orders of magnitude and are not normally distributed, this procedure helps to more equally account for model errors across the full range of the dataset.
3.1 Model training
We found that five hidden layers, each with 600 neurons, could adequately reflect dataset measurements with minimum error (Fig. 1b). The fine-tuning of the ANN model showed that the optimum model had a batch size of 1200, a learning rate of 0.6, a dropout rate of 0.1, incorporated the mean squared error (MSE) as a loss function, and an “Adadelta” optimizer for minimizing the error in the training process (Chollet, 2015; Geron, 2019). The training process began with initial training and validation losses with MSE of 0.094 and MSE of 0.058 (Fig. 1b) and final values with MSE of 0.0126 and MSE of 0.013 after 600 iterations (epochs). Minimal improvements in error occurred between 300 and 600 epochs, indicating that the ANN model had captured the relationships between the inputs and output adequately, and further iteration would not improve performance. The ANN model performed similarly on the validation dataset (Fig. 1b), which reveals that overfitting is not an issue since the difference between training and validation errors is relatively constant and minimal (Geron, 2019; Haykin, 2009).
3.2 Model performance against observations
Following model training, the model with the weighting coefficients determined during training was applied to the remaining 20 % of the dataset (test data) to independently predict bed load transport rates. The ANN prediction resulted in a very close prediction of the mean observed flux per unit width ( g s−1 m−1 compared to g s−1 m−1) (Fig. 2). We also performed a sensitivity test of the ANN model by training and testing a set of additional models in the same fashion as described for the full ANN model but removed a single input parameter each time (Fig. 1c). We also trained and tested an ANN model with three of the observed grain sizes (D16, D84, D94) being removed. We found that the performance of the ANN was most sensitive to the removal of discharge leading to a 95 % increase in model error (MSE) during training (Fig. 1c) and an associated 65 % increase in model error when the trained model was applied to test data.
We compared site-specific, mean absolute error (MAE) values using site-specific ANN predictions to both the interquartile range (IQR) and the full range of observed bed load transport rates at each site (see Supplement). We found that, on average, MAE values are less than both the IQR and the full range of qs values across 134 sites. We found 11 instances where the MAE exceeds the IQR and only 1 instance where the MAE exceeded the full range of observed values at a site, comprising less than 10 % of sites in the database. However, the median number of samples in these cases was 17, relative to a median of 50 samples across all sites. In addition to this, we looked at functional relationships between the site-specific model MAE for the test data versus the total number of samples at each site. We did this to ascertain whether the model was biased towards differences in sample size. We did not find any systematic or significant relationships between the sample size at any individual site and the computed errors between the ANN output and our test data. Because some of the input parameters to the ANN are dynamic (e.g., discharge, width), we also explored the absolute error between every individual observation in our database and the model input parameters. We found that there is no systematic or significant relationship between the absolute error across all data points and any individual input parameter. We did find that the lowest measured transport rates result in increased errors at some sites, which is consistent with most bed load flux models as bed load transport is often within the partial or intermittent transport regime very close to the threshold for motion (Wilcock and McArdell, 1997).
3.3 Comparison of ANN to previous bed load transport models
In direct comparison, the ANN model outperforms all four previous models, regardless of their complexity. The ANN prediction of bed load transport rates across the test data results in a MAE of 0.704, which is 2.5–16.8 times less than the calculated MAE for the other considered models. In addition, the standard deviation for the test predictions by the ANN model was 48.2 g s−1 m−1 and the minimum amongst all models. Among the four previous bed load equations chosen for comparison, Recking (2013b), an empirical model with five input parameters, performed markedly better than all other previous models with an MAE of 1.81 when compared to measured data (Fig. 2d). Einstein (1950), a probabilistic model with four inputs, performed substantially worse, with an MAE of 11.84 for the log-transformed bed load predictions. It is worth noting that the mean error ratio of −0.07, calculated for the Einstein (1950) model, is less than the other three existing bed load transport models (see Table S4). This is due to the tendency of the Einstein (1950) model to underpredict observed bed load transport rates relative to the other models. Einstein (1950) underpredicts measured bed load transport rates for more than 82 % of observations, often by multiple orders of magnitude, resulting in the largest MAE when calculated using the log-transformed data (Fig. 2a). In contrast, bed load flux predictions made using Wong and Parker (2006) and Wilcock and Crowe (2003) lead to considerable overpredictions in bed load fluxes across sites (Fig. 2b and c). Wong and Parker (2006) resulted in an average qs of 855.7 g s−1 m−1 with a standard deviation of 2318 g s−1 m−1 and a mean error ratio of 202.52. Wilcock and Crowe (2003) resulted in an average qs of 13 278.45 g s−1 m−1 with a standard deviation of 24 011.43 g s−1 m−1 and the maximum calculated error ratios across all models, with a mean error ratio of 5555.7. The model generally overpredicts the observed data, with the 25th percentile of the estimated values for the test data being 1294-fold larger than reported measurements. In addition, high positive skewness in the predictions (skewness = 4.57) by Wilcock and Crowe (2003) showed that without independent calibration, the model could not reflect the distribution of the measured data. However, MAE calculations on the log-transformed results from Wong and Parker (2006) and Wilcock and Crowe (2003) yield an MAE of 2.23 and 6.59, respectively, demonstrating that while these uncalibrated models may lead to overprediction, the scale of these overpredictions is multiple orders of magnitude less than the potential underprediction of the uncalibrated Einstein (1950) approach.
We find that, without site-specific calibration, the trained ANN developed in this contribution most reliably reflects the distribution of the measured bed load data in the training dataset. Of the uncalibrated existing bed load transport models, the approach of Recking (2013b) most reliably reflects the measured test data.
We demonstrate that the trained ANN model provides a robust prediction of available test data. This is particularly encouraging because the model is trained using a dataset with wide parameter ranges compiled from many sites across the world, suggesting that it may be readily applied to any site which falls within the existing distributions of the training dataset with fairly good results (see Supplement). Caution should be applied in the application of this ANN for input parameters outside of the parameter distributions for which it was trained. Admittedly, the ANN model leverages all seven available inputs from the BedloadWeb database, whereas previous models only utilize a subset (Table S3) and as such, it is not entirely surprising that the ANN outperforms existing models. However, it is worth noting that, to our knowledge, there is no available empirical or theoretical bed load model that would similarly leverage all of these input parameters. ANN model sensitivity testing revealed that each of the seven parameters aides in the final prediction; however, the removal of discharge produced the largest errors by far. This result is also unsurprising, and it is consistent with findings from other recently developed sediment transport models (e.g., Cohen et al., 2022). Bed load flux is chiefly a function of the fluid stress applied to the bed in excess of the threshold for motion and thus primarily dependent on how channel discharge maps to stress through the channel cross section (Meyer-Peter and Müller, 1948; Wong and Parker, 2006). It is worth noting, however, that the trained ANN model which does not include discharge only has an MAE of 21.1 g s−1 m−1 compared to the full ANN MAE of 15.8 g s−1 m−1, which is still less than those from all previous models (Table S5). It should be noted that all four existing bed load transport models require some form of discharge (or shear stress) data to make predictions. All other ANN models trained on only a subset of the input parameters showed an increase in model error (MSE) in the test phase of up to 12 % relative to the full ANN model. Across these sensitivity runs, the ANN model error was most sensitive to the removal of the channel width (MSE increase of 12 %) and least sensitive to the removal of D90 (MSE increase of 0.8 %). These findings are consistent with those from a sensitivity analysis of the global-scale model WBMSed (Cohen et al., 2022) and recent sediment transport models developed using a stream power approach (Lammers and Bledsoe, 2018). Across all cases, increases in total error of this class of ANN models (average MSE = 1546.0 g2 s−2 m−2) is still significantly less than the four uncalibrated bed load models (minimum MSE = 6215.1 g2 s−2 m−2).
We suggest that the relative insensitivity of ANN performance reflects the inherent self-organization of alluvial river systems (Leopold et al., 1960; Parker, 1978; Phillips and Jerolmack, 2016). Alluvial rivers evolve towards a stable geometry that reflects a condition at which the bankfull flood will only slightly exceed the threshold for motion and initiate bed load transport (Dunne and Jerolmack, 2020; Parker, 1990). By extension, if a river is at or near this stable state, its width, slope, and surface grain size distribution all hold information about channel size and therefore discharge required to transport sediment. We suggest that the machine learning approach, which incorporates all these inputs, better captures the covariation between channel characteristics and their influence on bed load transport rates in natural systems when compared to more deterministic models. This is, in part, due to the model training, which is explicitly aimed at parsing the functional relationships between these covaried input parameters.
The robust performance of the trained ANN across many sites also demonstrates that potential sources of variability may be absent in a particular site and that the ANN successfully captures an expected average behavior. Alternatively, these effects may be embedded within correlations between model input parameters. For example, it has been demonstrated experimentally that decreased sediment supply can result in coarsening of the bed surface (Dietrich et al., 1989). Thus, the effect of relative differences in sediment supply may be implicitly accounted for in the ANN results due to differences in the grain size input parameters relative to channel width and slope measurements. If so, this only reinforces the critical importance of river self-organization in setting bed load transport rates (Phillips and Jerolmack, 2019) and the ability of the ANN to parse this organization through a data-driven approach. The ANN cannot explicitly define the sources of potential variability given the available input parameters, but this is also beyond the scope of this contribution.
Inspection of the model predictions (Fig. 3) shows that the models of Wong and Parker (2004) and Wilcock and Crowe (2003) tend to overpredict observed fluxes but generally capture the correct shape of the observed data and therefore could likely be calibrated to match the observed data. Calibration of bed load transport functions through adjustments to the leading coefficient and/or the threshold term can generally increase their utility (Hinton et al., 2017). However, these calibration parameters are not always easy to estimate and usually require direct measurements of bed load flux. Phillips and Jerolmack (2019) specifically analyzed field sites to investigate channel geometry and the threshold of motion and were only able to reliably calibrate bed load functions for 68 of the 134 sites (51.5 %). Application of empirical functions can require additional derived or calculated parameters such as shear stress. Shear stress is not necessarily challenging to derive by assuming steady, uniform flow; however, even shear stress data are rarely available at the majority of stream-monitoring sites and can require a complicated set of processing routines for gaged sites (see Phillips and Jerolmack, 2016). More notably, the generally poor predictions from the physically based and semi-empirical bed load transport models (Fig. 2) highlight the challenge in utilizing any bed load transport equation to predict or construct a rating curve without existing site-specific flux measurements. A primary advantage of this ANN model is that it utilizes either parameters that are directly and consistently measured at stream gages (flow), measured from high-resolution topography (slope, width), or can be measured during low- or no-flow periods (grain size). For the majority of sites, both slope and grain size are static site variables and this presents a major advantage of this ANN model for predicting bed load transport at gaged sites where direct measurements of bed load are not available to develop empirical rating curves or to calibrate other existing bed load functions.
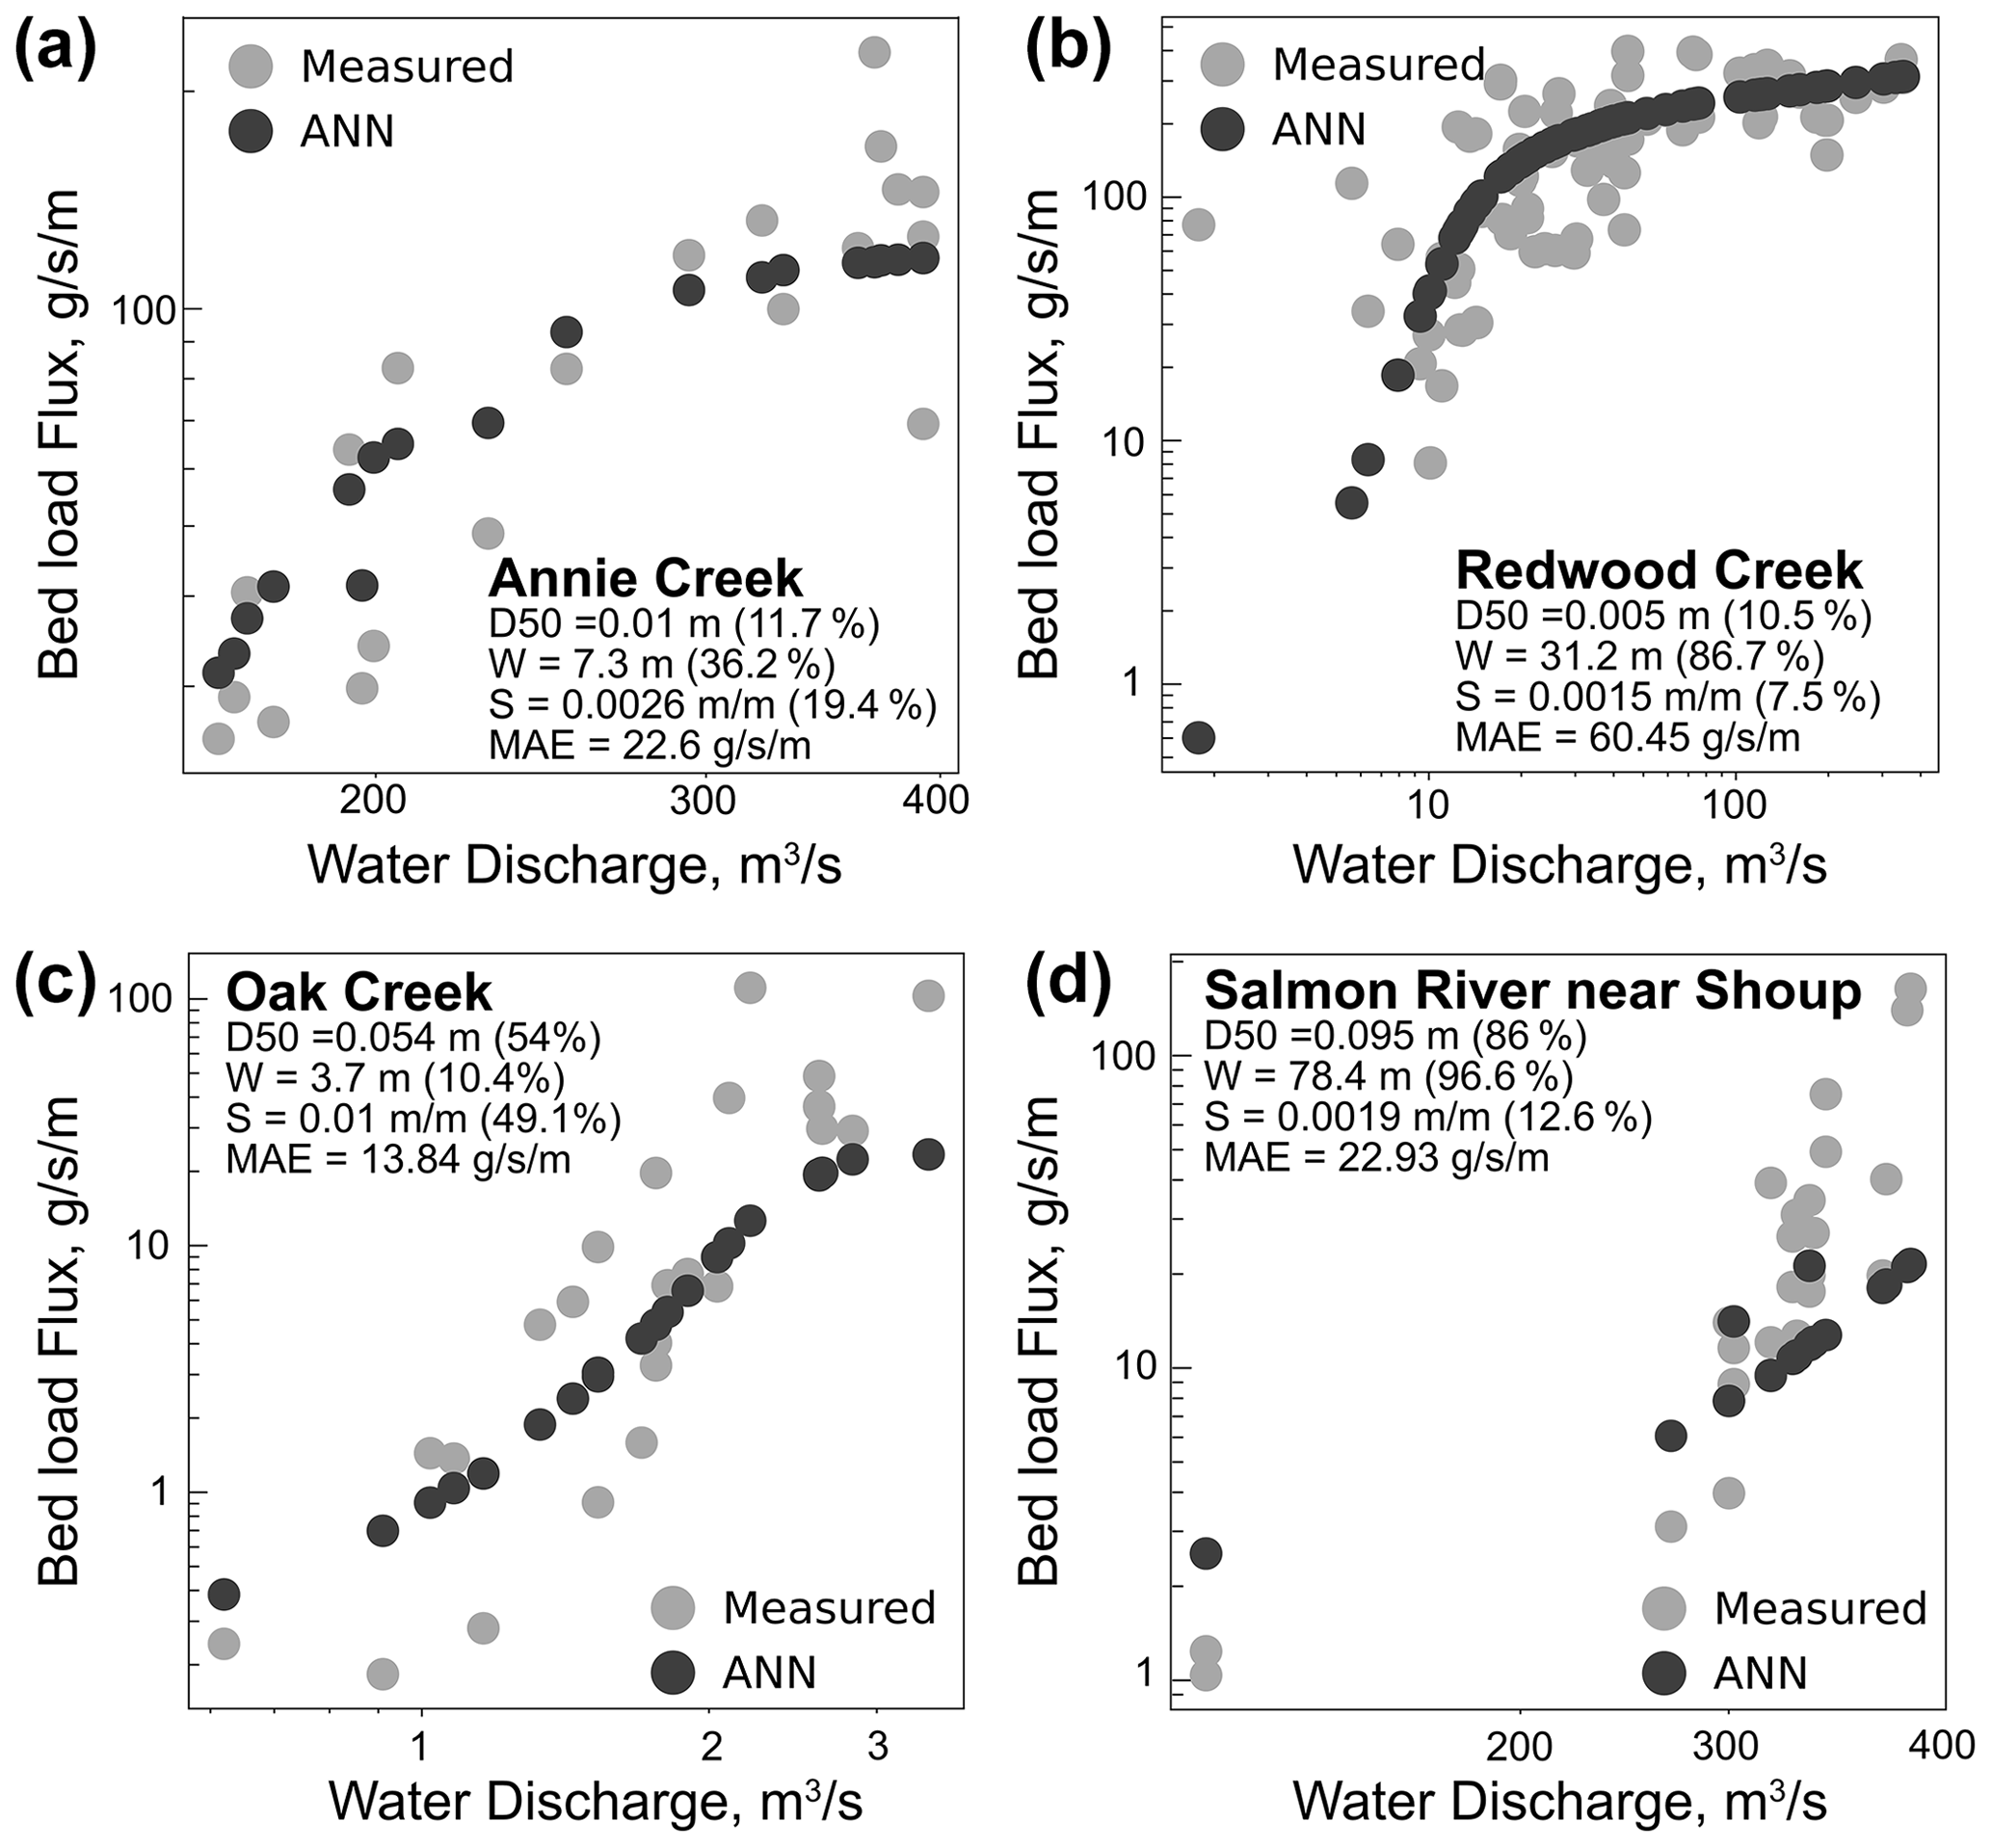
Figure 3Example of the ANN model developed in this study applied to construct bed load transport rating curves for several sites. The numbers in parentheses show the percentiles of each variable relative to the whole dataset.
One application of the ANN model developed here is to construct bed load transport rating curves for a broad range of gaged rivers. We selected a small subset of rivers that cover a wide range of parameters from the dataset used in this study to highlight the ANN model output (Fig. 3). These simple results highlight how the ANN approach can be used for the prediction of bed load transport at gaged sites without additional site-specific calibration. The strength of the ANN model should allow for this approach to be adapted relatively easily to any gaged catchment with similar parameters or site without prior transport measurements to estimate bed load flux based on a hydrograph and reach-scale estimates of bed grain size and slope. Within the US Geological Survey National Water Information System, there are thousands of potential gages. Furthermore, this model could be paired with spatially distributed hydrologic models if sufficient grain size measurements could be made and could also be readily applied within global-scale sediment flux models (such as WBMSed; see Cohen et al., 2022) or in Earth system models (e.g., Tan et al., 2021; Li et al., 2022) where additional necessary parameters can be modeled or estimated from global compilations (Tan et al., 2021; Li et al., 2022; Cohen et al., 2022).
This paper presented an artificial neural network (ANN) model for predicting river bed load. To do that, a large, measured bed load dataset, including 8117 data points from 134 rivers, was gathered from the BedloadWeb, a free public online platform. The structure of the ANN included an input layer, an output layer, and five hidden layers with 600 neurons. The inputs to the model included temporally variable river discharge, flow width, and static measurements of bed slope and grain size (specifically D16, D50, D84, and D90). A sensitivity analysis was carried out to show the sensitivity of the model with the input parameters. The results showed that the ANN model was most sensitive to the river discharge and least sensitive to the largest grain size (D90). Our analysis suggests that including all available parameters in the ANN model better captures the covariations between the input and output parameters. Further, the ANN model provides robust prediction of the test (unseen) bed load data (n=1624) within the bounds of 1 order of magnitude. We highlight that an advantage of this ANN model is that it was developed on a broad range of rivers and appears to accurately capture the variation in the data, making this model a good candidate for predicting bed load fluxes at gaged sites. The proposed machine learning model in this research lays the foundations for efficient and accurate predictions of river bed load within the broadest array of rivers to date.
Original bed load datasets are available at https://en.bedloadweb.com/ (Recking, 2019). Input data as used in this contribution are also published on Zenodo under a GNU General Public License at https://doi.org/10.5281/zenodo.7641313 (Hosseiny et al., 2023), in additional to the trained ANN model, and all associated model output described in this paper.
The Supplement for this contribution provides additional details on the methods used for calculation of bed load transport rates with previous models, as well as additional summary statistics associated with the original datasets and model-predicted values. The supplement related to this article is available online at: https://doi.org/10.5194/esurf-11-681-2023-supplement.
HH conceptualized the research and led the processing of the data, developing machine learning algorithms, visualizations, and writing the initial draft. CCM and CBP developed the idea, provided feedback, and contributed to the editing and writing of the paper. JED assisted with additional data analysis during manuscript revision and preparation of the supplementary code. All authors were responsible for critical contributions and passing the final paper.
The contact author has declared that none of the authors has any competing interests.
Publisher's note: Copernicus Publications remains neutral with regard to jurisdictional claims in published maps and institutional affiliations.
We would like to thank the associated editor Rebecca Hodge for her thoughtful review and handling of this manuscript. We thank Basil Gomez and three anonymous reviewers for their solicited reviews and Xingyu Chen for their community comment.
This paper was edited by Rebecca Hodge and reviewed by Basil Gomez and three anonymous referees.
Ancey, C.: Stochastic modeling in sediment dynamics: Exner equation for planar bed incipient bed load transport conditions, J. Geophys. Res.-Earth, 115, 1–21, https://doi.org/10.1029/2009jf001260, 2010.
Asheghi, R. and Hosseini, S. A.: Prediction of bed load sediments using different artificial neural network models, Front. Struct. Civ. Eng., 14, 374–386, https://doi.org/10.1007/s11709-019-0600-0, 2020.
Ashida, K. and Michiue, M.: Hydraulic Resistance of Flow in an Alluvia Bed and Bed Load Transport Rate, Proc. JSCE, 206, 59–69, https://doi.org/10.2208/jscej1969.1972.206_59 1972 (in Japanese).
Barry, J. J., Buffington, J. M., and King, J. G.: A general power equation for predicting bed load transport rates in gravel bed rivers, Water Resour. Res., 40, 1–22, https://doi.org/10.1029/2004WR003190, 2004.
Barry, J. J., Buffington, J. M., Goodwin, P., King, J. G., and Emmett, W. W.: Performance of Bed-Load Transport Equations Relative to Geomorphic Significance: Predicting Effective Discharge and Its Transport Rate, Hydraul. Eng., 134, 601–615, 2008.
Beer, A. R. and Turowski, J. M.: From process to centuries: Upscaling field-calibrated models of fluvial bedrock erosion, Geophys. Res. Lett., 48, 093415, https://doi.org/10.1029/2021GL093415, 2021.
Bhattacharya, B., Price, R. K., and Solomatine, D. P.: Machine Learning Approach To Modeling Sediment Transport, J. Hydraul. Eng., 133, 776–793, https://doi.org/10.1061/(ASCE)0733-9429(2007)133:4(440), 2007.
Brownlie, W. R.: Compilation of alluvial channel data: Laboratory and field, W. M. Keck Laboratory of Hydraulics and Water Resources Report, 43B, California Institute of Technology, https://resolver.caltech.edu/CaltechKHR:KH-R-43B (last access: 25 Aprril 2022), 1981.
Buffington, J. M. and Montgomery, D. R.: A systematic analysis of eight decades of incipient motion studies, with special reference to gravel-bedded rivers, Water Resour. Res., 33, 1993–2029, https://doi.org/10.1029/96WR03190, 1997.
Bui, V. H., Bui, M. D., and Rutschmann, P.: Combination of Discrete Element Method and Artificial Neural Network for Predicting Porosity of Gravel-Bed River, Water, 11, 1461, https://doi.org/10.3390/w11071461, 2019.
Bunte, K. and Abt, S. R.: Effect of sampling time on measured gravel bed load transport rates in a coarse-bedded stream, Water Resour. Res., 41, W11405, https://doi.org/10.1029/2004WR003880, 2005.
Chollet, F.: Keras, Keras [code], https://keras.io/ (last access: 25 April 2022), 2015.
Church, M., Hassan, M. A., and Wolcott, J. F.: Stabilizing self-organized structures in gravel-bed stream channels: Field and experimental observations, Water Resour. Res., 34, 3169–3179, https://doi.org/10.1029/98WR00484, 1998.
Cohen, S., Syvitski, J., Ashley, T., Lammers, R., Fekete, B., and Li, H.-Y.: Spatial trends and drivers of bedload and suspended sediment fluxes in global rivers, Water Resour. Res., 58, 2021 031583, https://doi.org/10.1029/2021WR031583, 2022.
Deal, E., Venditti, J. G., Benavides, S. J., Bradley, R., Zhang, Q., Kamrin, K., and Perron, J. T.: Grain shape effects in bed load sediment transport, Nature, 613, 298–302, https://doi.org/10.1038/s41586-022-05564-6, 2023.
Dietrich, W. E., Kirchner, J. W., Ikeda, H., and Iseya, F.: Sediment supply and the development of the coarse surface layer in gravel-bedded rivers, Nature, 340, 215–217, https://doi.org/10.1038/340215a0, 1989.
Dovoedo, Y. H. and Chakraborti, S.: Outlier detection for multivariate skew-normal data: A comparative study, Stat. Comput. Simul., 83, 773–783, https://doi.org/10.1080/00949655.2011.636364, 2013.
Dunne, K. B. J. and Jerolmack, D. J.: What sets river width?, Sci. Adv., 6, 1–9, https://doi.org/10.1126/sciadv.abc1505, 2020.
East, A. E., Pess, G. R., Bountry, J. A., Magirl, C. S., Ritchie, A. C., and Logan, J. B.: Large-scale dam removal on the Elwha River, Geomorphology, 228, 765–786, https://doi.org/10.1016/j.geomorph.2014.08.028, 2015.
Einstein, A. H.: The Bed-Load Function for Sediment Transportation in Open Channel Flows, Technical Bulletin, Soil Conservation Series, US Dept. of Agriculture, https://naldc.nal.usda.gov/catalog/43419 (last access: 25 April 2022), 1950.
Einstein, H. A.: Bed load transport as a probability problem, in: Sedimentation: 746 Symposium to Honor Professor H. A. Einstein, 1972 (translation from 747 German of H. A. Einstein doctoral thesis), Originally presented to Federal Institute of Technology, Zurich, Switzerland, C1–C105, https://lib.ugent.be/catalog/rug01:002054080 (last access: 25 April 2022), 1937.
Ferdowsi, B., Ortiz, C. P., Houssais, M., and Jerolmack, D. J.: River-bed armouring as a granular segregation phenomenon, Nat. Commun., 8, 1363, https://doi.org/10.1038/s41467-017-01681-3, 2017.
Furbish, D. J., Ball, A. E., and Schmeeckle, M. W.: A probabilistic description of the bed load sediment flux: 4. Fickian diffusion at low transport rates, J. Geophys. Res.-Earth, 117, F03034, https://doi.org/10.1029/2012JF002356, 2012.
Garcia, M. H. (Ed.): Sedimentation Engineering: Processes, Measurements, Modeling, and Practice, ASCE, Reston, Virginia, https://doi.org/10.1061/9780784408148.ch02, 2007.
Geron, A.: Hands-on Machine Learning with Scikit-Learn, Keras & TensorFlow, in: 2nd Edn., O'Reilly, Sebastopol, Canada, 2019.
Gilbert, G. K.: The transportation of debris by running water, US Geological Survey Professional Paper 86, US Geological Survey, 263 pp., https://doi.org/10.3133/pp86, 1914.
Goldstein, E. B., Coco, G., and Plant, N. G.: Corresponding Author, Earth-Sci. Rev., 194, 97–108, https://doi.org/10.1016/j.earscirev.2019.04.022, 2019.
Gomez, B. and Church, M.: An assessment of bed load sediment transport formulae for gravel bed rivers, Water Resour. Res., 25, 1161–1186, https://doi.org/10.1029/WR025i006p01161, 1989.
Gomez, B. and Soar, P. J.: Bedload transport: beyond intractability, Roy. Soc. Open Sci., 9, 211932, https://doi.org/10.1098/rsos.211932, 2022.
Gomez, B., Soar, P. J., and Downs, P. W.: Good vibrations: Big data impact bedload research, Earth Surf. Proc. Land., 47, 129–142, https://doi.org/10.1002/esp.5304, 2022.
Han, H. and Morrison, R. R.: Data-driven approaches for runoff prediction using distributed data, Stoch. Env. Res. Risk A., 36, 2153–2171, https://doi.org/10.1007/s00477-021-01993-3, 2022.
Hassani, A., Azapagic, A., and Shokri, N.: Global predictions of primary soil salinization under changing climate in the 21st century, Nat. Commun., 12, 1–17, https://doi.org/10.1038/s41467-021-26907-3, 2021.
Haykin, S.: Kalman Filters, in: Kalman Filtering and Neural Networks, John Wiley & Sons, Ltd, 1–21, https://doi.org/10.1002/0471221546.ch1, 2001.
Haykin, S.: Neural Networks and Learning Machines, Third Edition, Pearson Education, Inc., McMaster University, Hamilton, ISBN 0131471392, 2009.
Hinton, D., Hotchkiss, R., and Ames, D. P.: Comprehensive and Quality-Controlled Bedload Transport Database, J. Hydraul. Eng., 143, 06016024, https://doi.org/10.1061/(asce)hy.1943-7900.0001221, 2017.
Hosseiny, H.: A Deep Learning Model for Predicting River Flood Depth and Extent, Environ. Model. Softw., 145, 105186, https://doi.org/10.1016/j.envsoft.2021.105186, 2021.
Hosseiny, H., Nazari, F., Smith, V., and Nataraj, C.: A Framework for Modeling Flood Depth Using a Hybrid of Hydraulics and Machine Learning, Sci. Rep., 10, 1–14, https://doi.org/10.1038/s41598-020-65232-5, 2020.
Hosseiny, H., Masteller, C. C., Dale, J. E., and Phillips, C. B.: Development of a machine learning model for river bedload – Data, Model, and Scripts (Version 1), Zenodo [data set], https://doi.org/10.5281/zenodo.7641313, 2023.
Houssais, M., Ortiz, C. P., Durian, D. J., and Jerolmack, D. J.: Onset of sediment transport is a continuous transition driven by fluid shear and granular creep, Nat. Commun. 6, 6527, https://doi.org/10.1038/ncomms7527, 2015.
Hsu, K., Gupta, H. V., and Sorooshian, S.: Artificial Neural Network Modeling of the Rainfall-Runoff Process, Water Resour. Res., 31, 2517–2530, https://doi.org/10.1029/95WR01955, 1995a.
Kennedy, D., Lakonishok, J., and Shaw, W. H.: Accommodating Outliers and Nonlinearity in Decision Models, J. Account. Audit. Financ., 7, 161–190, https://doi.org/10.1177/0148558X9200700205, 1992.
King, J. G., Emmett, W. W., Whiting, P. J., Kenworthy, R. P., and Barry, J. J.: Sediment Transport Data and Related Information for Selected Coarse-Bed Streams and Rivers in Idaho, Gen. Tech. Rep. RMRS-GTR-131. Fort Collins, CO: U.S. Department of Agriculture, Forest Service, Rocky Mountain Research Station, 26 pp., https://doi.org/10.2737/RMRS-GTR-131 2004.
Kitsikoudis, V., Sidiropoulos, E., and Hrissanthou, V.: Assessment of sediment transport approaches for sand-bed rivers by means of machine learning, Hydrolog. Sci. J., 60, 1566–1586, https://doi.org/10.1080/02626667.2014.909599, 2015.
Lai, C. Y., Kingslake, J., Wearing, M. G., Chen, P. H. C., Gentine, P., and Li, H.: Vulnerability of Antarctica's ice shelves to meltwater-driven fracture, Nature, 584, 574–578, https://doi.org/10.1038/s41586-020-2627-8, 2020.
Lajeunesse, E., Malverti, L., and Charru, F.: Bed load transport in turbulent flow at the grain scale: Experiments and modeling, J. Geophys. Res.-Earth, 115, F04001, https://doi.org/10.1029/2009JF001628, 2010.
Lammers, R. W. and Bledsoe, B. P.: Parsimonious sediment transport equations based on Bagnold's stream power approach, Earth Surf. Proc. Land., 43, 242–258, 2018.
Leopold, L. B., Bagnold, R. A., Wolman, M. G., and Brush Jr., L. M.: Flow resistance in sinuous or irregular channels, in: Geological Survey Professional Paper, Geological Survey, Washington, DC, https://doi.org/10.3133/pp282D, 1960.
Li, H.-Y., Tan, Z., Ma, H., Zhu, Z., Abeshu, G. W., Zhu, S., Cohen, S., Zhou, T., Xu, D., and Leung, L. R.: A new large-scale suspended sediment model and its application over the United States, Hydrol. Earth Syst. Sci., 26, 665–688, https://doi.org/10.5194/hess-26-665-2022, 2022.
Marquis, G. A. and Roy, A. G.: Using multiple bed load measurements: Toward the identification of bed dilation and contraction in gravel-bed rivers, J. Geophys. Res.-Earth, 117, F01014, https://doi.org/10.1029/2011JF002120, 2012.
Masteller, C. C. and Finnegan, N. J.: Interplay between grain protrusion and sediment entrainment in an experimental flume, J. Geophys. Res.-Earth, 122, 274–289, https://doi.org/10.1002/2016JF003943, 2017.
Masteller, C. C., Finnegan, N. J., Turowski, J. M., Yager, E. M., and Rickenmann, D.: History-Dependent Threshold for Motion Revealed by Continuous Bedload Transport Measurements in a Steep Mountain Stream, Geophys. Res. Lett., 46, 2583–2591, https://doi.org/10.1029/2018GL081325, 2019.
Meyer-Peter, E. and Müller, R.: Formulas for Bed-Load transport, in: appendix 2, IAHSR 2nd meeting, Stockholm, https://repository.tudelft.nl/islandora/object/uuid:4fda9b61-be28-4703-ab06-43cdc2a21bd7?collection=research (last access: 25 April 2022), 1948.
Monsalve, A. and Yager, E. M.: Bed Surface Adjustments to Spatially Variable Flow in Low Relative Submergence Regimes: Bed Surface Adjustments in LRS, Water Resour. Res., 53, 9350–9367, https://doi.org/10.1002/2017WR020845, 2017.
Monsalve, A., Yager, E. M., Turowski, J. M., and Rickenmann, D.: A probabilistic formulation of bed load transport to include spatial variability of flow and surface grain size distributions, Water Resour. Res., 52, 3579–3598, https://doi.org/10.1002/2015WR017694, 2016.
Mueller, E. R., Pitlick, J., and Nelson, J. M.: Variation in the reference Shields stress for bed load transport in gravel-bed streams and rivers, Water Resour. Res., 41, W04006, https://doi.org/10.1029/2004WR003692, 2005.
Paintal, A. S.: A Stochastic Model Of Bed Load Transport, J. Hydraul. Res., 9, 527–554, https://doi.org/10.1080/00221687109500371, 1971.
Parker, G.: Self-formed straight rivers with equilibrium banks and mobile bed. Part 2, The gravel river, J. Fluid Mech., 89, 127–146, https://doi.org/10.1017/S0022112078002505, 1978.
Parker, G.: Surface-based bedload transport relation for gravel rivers, J. Hydraul. Res., 28, 417–436, https://doi.org/10.1080/00221689009499058, 1990.
Parker, G. and Klingeman, P. C.: On why gravel bed streams are paved, Water Resour. Res., 18, 1409–1423, https://doi.org/10.1029/WR018i005p01409, 1982.
Phillips, C. B. and Jerolmack, D. J.: Dynamics and mechanics of bed-load tracer particles, Earth Surf. Dynam., 2, 513–530, https://doi.org/10.5194/esurf-2-513-2014, 2014.
Phillips, C. B. and Jerolmack, D. J.: Self-organization of river channels as a critical filter on climate signals, Science, 352, 694–697, https://doi.org/10.1126/science.aad3348, 2016.
Phillips, C. B. and Jerolmack, D. J.: Bankfull Transport Capacity and the Threshold of Motion in Coarse-Grained Rivers, Water Resour. Res., 55, 11316–11330, https://doi.org/10.1029/2019WR025455, 2019.
Phillips, C. B., Hill, K. M., Paola, C., Singer, M. B., and Jerolmack, D. J.: Effect of Flood Hydrograph Duration, Magnitude, and Shape on Bed Load Transport Dynamics, Geophys. Res. Lett., 45, 8264–8271, https://doi.org/10.1029/2018GL078976, 2018.
Phillips, C. B., Masteller, C. C., Slater, L. J., Dunne, K. B. J., Francalanci, S., Lanzoni, S., Merritts, D. J., Lajeunesse, E., and Jerolmack, D. J.: Threshold constraints on the size, shape and stability of alluvial rivers, Nat. Rev. Earth Environ., 3, 406–419, https://doi.org/10.1038/s43017-022-00282-z, 2022.
Recking, A.: A comparison between flume and field bed load data and consequences for surface-based bed load transport prediction, Water Resour. Res., 46, W03518, https://doi.org/10.1029/2009WR008007, 2010.
Recking, A.: Influence of sediment supply on mountain streams bedload transport, Geomorphology, 175–176, 139–150, https://doi.org/10.1016/j.geomorph.2012.07.005, 2012.
Recking, A.: An analaysis of nonlinearity effects on bed load transport prediction, J. Geophys. Res.-Earth, 118, 1264–1281, https://doi.org/10.1002/jgrf.20090, 2013a.
Recking, A.: Simple Method for Calculating Reach-Averaged Bed-Load Transport, J. Hydraul. Eng., 139, 70–75, https://doi.org/10.1061/(asce)hy.1943-7900.0000653, 2013b.
Recking, A.: BedloadWeb, https://en.bedloadweb.com/ (last access: 25 April 2022), 2019.
Recking, A., Liébault, F., Peteuil, C., and Jolimet, T.: Testing bedload transport equations with consideration of time scales, Earth Surf. Proc. Land., 37, 774–789, https://doi.org/10.1002/esp.3213, 2012.
Rickenmann, D.: Hyperconcentrated Flow and Sediment, Hydraul. Eng., 117, 1419–1439, https://doi.org/10.1061/(ASCE)0733-9429(1991)117:11(1419), 1991.
Rickenmann, D.: Variability of Bed Load Transport During Six Summers of Continuous Measurements in Two Austrian Mountain Streams (Fischbach and Ruetz, Water Resour. Res., 54, 107–131, https://doi.org/10.1002/2017WR021376, 2018.
Rickenmann, D. and McArdell, B. W.: Continuous measurement of sediment transport in the Erlenbach stream using piezoelectric bedload impact sensors, Earth Surf. Proc. Land., 32, 1362–1378, https://doi.org/10.1002/esp.1478, 2007.
Saravanan, K. and Sasithra, S.: Review on Classification Based on Artificial Neural Networks, Int. J. Ambient Syst. Appl., 2, 11–18, https://doi.org/10.5121/ijasa.2014.2402, 2014.
Singer, M. B.: Transient response in longitudinal grain size to reduced gravel supply in a large river, Geophys. Res. Lett., 37, L18403, https://doi.org/10.1029/2010GL044381, 2010.
Singh, A., Fienberg, K., Jerolmack, D. J., Marr, J., and Foufoula-Georgiou, E.: Experimental evidence for statistical scaling and intermittency in sediment transport rates, J. Geophys. Res.-Earth, 114, F01025, https://doi.org/10.1029/2007JF000963, 2009.
Slater, L. J. and Singer, M. B.: Imprint of climate and climate change in alluvial riverbeds: Continental United States, 1950–2011, Geology, 41, 595–598, https://doi.org/10.1130/G34070.1, 2013.
Tan, Z., Leung, L. R., Li, H.-Y., and Cohen, S.: Representing global soil erosion and sediment flux in Earth System Models, J. Adv. Model. Earth Sy., 14, e2021MS002756, https://doi.org/10.1029/2021MS002756, 2022.
Warrick, J. A., Bountry, J. A., East, A. E., Magirl, C. S., Randle, T. J., and Gelfenbaum, G.: Large-scale dam removal on the Elwha River, sediment budget and synthesis, Geomorphology, 246, 729–750, https://doi.org/10.1016/j.geomorph.2015.01.010, 2015.
Wilcock, P. R.: Two-Fraction Model of Initial Sediment Motion in Gravel-Bed Rivers, Science, 280, 410–412, https://doi.org/10.1126/science.280.5362.410, 1998.
Wilcock, P. R.: Toward a practical method for estimating sediment-transport rates in gravel-bed rivers, Earth Surf. Proc. Land., 26, 1395–1408, 2001.
Wilcock, P. R. and Crowe, J. C.: Surface-based Transport Model for Mixed-Size Sediment Surface-based Transport Model for Mixed-Size Sediment, J. Hydraul. Eng., 129, 120–128, https://doi.org/10.1061/(ASCE)0733-9429(2003)129:2(120), 2003.
Wilcock, P. R. and McArdell, B. W.: Partial transport of a sand/gravel sediment, Water Resour. Res., 33, 235–245, https://doi.org/10.1029/96WR02672, 1997.
Willmott, C. J. and Matsuura, K.: Advantages of the mean absolute error (MAE) over the root mean square error (RMSE) in assessing average model performance, Clim. Res., 30, 79–82, https://doi.org/10.3354/cr030079, 2005.
Wong, M. and Parker, G.: Reanalysis and Correction of Bed-Load Relation of Meyer-Peter and Müller Using Their Own Database, J. Hydraul. Eng., 132, 1159–1168, https://doi.org/10.1061/(asce)0733-9429(2006)132:11(1159), 2006.
Zhao, T. and Nepf, H. M.: Turbulence Dictates Bedload Transport in Vegetated Channels Without Dependence on Stem Diameter and Arrangement, Geophys. Res. Lett., 48, e2021GL095316, https://doi.org/10.1029/2021GL095316, 2021.
Zhou, X., Wu, W., Qin, Y., and Fu, X.: Geoinformation-based landslide susceptibility mapping in subtropical area, Sci. Rep., 11, 24325, https://doi.org/10.1038/s41598-021-03743-5, 2021.