the Creative Commons Attribution 4.0 License.
the Creative Commons Attribution 4.0 License.
 | 23 Jan 2024
Scaling between volume and runout of rock avalanches explained by a modified Voellmy rheology
Stefan Hergarten
Rock avalanches reach considerably greater runout lengths than predicted by Coulomb friction. While it has been known for a long time that runout length increases with volume, explaining the increase qualitatively is still a challenge. In this study, the widely used Voellmy rheology is reinterpreted and modified. Instead of adding a Coulomb friction term and a velocity-dependent term, the modified rheology assigns the two terms to different regimes of velocity. While assuming a transition between Coulomb friction and flow at a given velocity is the simplest approach, a reinterpretation of an existing model for the kinetic energy of random particle motion predicts a dependence of the crossover velocity on the thickness of the rock avalanche. Analytical solutions for a lumped mass on a simple 1D topography reveal the existence of a slope-dominated and a height-dominated regime within the regime of flow. In the slope-dominated regime, the kinetic energy at the foot of the slope depends mainly on the slope angle, while the absolute height relative to the valley floor has little effect, and vice versa. Both regimes can be distinguished by the ratio of a length scale derived from the rheology and the length scale of the topography. Long runout occurs in the height-dominated regime. In combination with empirical relations between volume, thickness, and height, the approach based on the random kinetic energy model reproduces the scaling of runout length with volume observed in nature very well.
- Article
(2193 KB) - Full-text XML
- BibTeX
- EndNote


The long runout of rock avalanches has puzzled scientists for decades. Rapid mass movements with volumes V⪆106 m3 achieve a considerably greater runout length than a solid block under Coulomb friction. Theoretically, a lumped mass slowly sliding downward along a topographic profile comes to rest when the ratio of total height drop H and traveled horizontal distance L equals the coefficient of friction μ (e.g., de Blasio, 2011). This ratio is often referred to as Heim's ratio. Huge rock avalanches with volumes of some cubic kilometers even reach ratios , while typical values of μ for Coulomb friction are between 0.5 and 1. The biggest landslides of Olympus Mons on Mars even reach (Crosta et al., 2018), which would even correspond to the friction of steel on ice.
Although the lumped-mass model is oversimplified, the occurrence of ratios much lower than μ suggests a transition from Coulomb friction to a more fluid-like behavior with a lower effective friction. Since L refers to a straight line, movement along a curved track even increases . The same holds for the effect of centrifugal forces due to profile curvature. Practically, longitudinal spreading is the only process that may reduce considerably. While the definition of refers to the highest point of the detachment area and the most distant point of the deposits, lumped-mass models rather describe the center of mass. Davies (1982) proposed a relation between runout length and volume based on longitudinal spreading. However, this relation becomes geometrically inconsistent if the runout length exceeds twice the respective length for the center of mass and thus cannot predict a strong decrease in compared to the lumped-mass model. Furthermore, an analysis of landslides in various environments by Legros (2002) revealed that the center-to-center ratio may also be considerably smaller than typical values of μ. So long runout and longitudinal spreading of rock avalanches are probably facets of a fluid-like behavior, but longitudinal spreading cannot be considered the primary reason for the long runout.
In turn, there is no consensus about the mechanism behind the fluid-like behavior of rock avalanches. It is even unclear whether it can be attributed to a unique mechanism. Water is present in many rock avalanches (Iverson, 2016) and may play a part as well as air (Shreve, 1968; Kesseler et al., 2020). Frictional heating may also have a strong effect on the mechanical properties (Erismann, 1979; de Blasio and Elverhøi, 2008; Lucas et al., 2014). Dynamic fragmentation (Davies et al., 1999) and acoustic fluidization (Johnson et al., 2016) were also proposed. For deeper insights into the physics of the different mechanisms, readers are referred to de Blasio (2011).
Alternatively, the increase in runout length with volume may be an inherent property of granular flow without any specific process beyond the interaction of particles. Numerical simulations of discrete particles are able to reproduce the observed decrease in effective friction with volume (Campbell et al., 1995; Johnson et al., 2016) at least qualitatively.
However, discrete models involving a large number of particles are numerically costly, in particular in 3D (e.g., Mead and Cleary, 2015). Therefore, depth-averaged continuum models are still preferred for large-scale simulations and for hazard assessment. Such models are typically based on the theory of granular flow proposed by Savage and Hutter (1989). As a major advantage over lumped-mass models, continuum models are able to predict the morphology of the deposits, which allows for better constraining the parameter values. Similarly to lumped-mass models, depth-averaged continuum models require only a model for the shear stress at the bed and no further parameters. This parsimony is an advantage over 3D simulations beyond the lower numerical complexity and also over depth-averaged multi-phase flow models (e.g., Pudasaini and Mergili, 2019).
The most widely used relation for the basal shear stress in depth-averaged models of granular flow dates back to work on snow avalanches of Voellmy (1955) and assumes a shear stress of
The first term describes Coulomb friction with a coefficient μ, where σ is the normal stress. The second term was introduced as an effective friction term for turbulent flow of snow, where ρ, g, and v are density, gravity, and vertically averaged velocity, respectively. The parameter ξ refers to the roughness of the bed.
As a central property of Voellmy's rheology, the velocity-dependent contribution to friction does not increase with normal stress. In the simplest case, the normal stress is σ=ρghcos β, where h is the thickness of the layer and β the slope angle. Then the effective coefficient of friction,
decreases with increasing thickness and thus also with volume. So Voellmy's approach predicts an increase in runout length with volume.
Voellmy (1955) explicitly referred to turbulent flow of snow and adopted the respective relations for turbulent flow of water in rough channels. In particular when transferred to rock avalanches, however, the idea of turbulent flow is questionable. Turbulence causes strong mixing of the particles and is thus incompatible with the preservation of the stratigraphy often found in the deposits (Dufresne et al., 2016).
However, this apparent issue was already clarified by Salm (1993). The lowermost particles are deflected by collisions with the rough bed. Assuming that the bed-parallel component of the velocity is reduced by a given factor f in each collision results in a loss in kinetic energy of . If we further assume that collisions take place after traveling a given distance δx, the effective friction force is
per particle of the lowermost layer. This simple argument explains the v2 dependence in Eq. (1). Some of the energy taken from the bed-parallel velocity is transformed into vertical motion of particles in the body of the avalanche. Up to this point, the mechanism is even the same as for turbulent flow of water, which explains the identical relation for the basal shear stress. The difference arises from the way the energy transferred from the bed into the body is dissipated. Owing to its low viscosity, water can only dissipate this energy by turbulent flow. In contrast, collisions between rock fragments are strongly inelastic and consume kinetic energy easily without the need for a turbulent flow pattern. So the mechanism of energy conversion at the bed and thus also the basal shear stress basically follows the same relation as for turbulent flow of water, but the way the energy is finally dissipated in the body is different. In this sense, the occurrence of the same relation for the basal shear stress as for turbulent flow is not coincidence but does not imply that the flow must be turbulent.
Another issue of Voellmy's rheology, however, is not resolved so easily. Since μeff≥μ for any values of v and h, long runout can only be achieved by assuming values of μ much lower than typical coefficients for Coulomb friction. As an example, the best-fit values of all events analyzed by Aaron et al. (2022) are lower than 0.25, with some even lower than 0.1. Furthermore, the individual values of μ and ξ are often not constrained well since different combinations yield similar results, in particular with regard to the runout length. The alternative rheology proposed by Jop et al. (2005, 2006) also predicts μeff > μ and thus also suffers from the problem that μ is not the same as for Coulomb friction.
The random kinetic energy (RKE) model (Buser and Bartelt, 2009; Bartelt and Buser, 2010) seems to be the only approach to overcome this limitation that has drawn attention. This approach takes into account that the energy converted at the rough bed causes a random movement of the particles in the body of the avalanche. It is assumed that the respective kinetic energy R is transported with the depth-averaged velocity v and dissipated by particle collisions. Finally, all friction (both terms in Eq. 1) is multiplied by a factor , where R0 is considered an activation energy.
The RKE model is available as an option in the model RAMMS (Christen et al., 2010). While the RKE model was developed for snow avalanches, it was also applied to rock avalanches (Preuth et al., 2010). In turn, Issler et al. (2018) pointed out several shortcomings of the RKE model. Owing to the exponential factor, the RKE model even predicts a decrease in friction with velocity at high velocities so that the velocity increases more and more on a straight slope once a threshold velocity is exceeded. Furthermore, the velocity-dependent reduction of the friction term is not consistent with Salm's explanation of Voellmy's rheology in its spirit. Given that the v2 term describes the conversion of kinetic energy at the rough bed into RKE, which is then dissipated in the avalanche body, there is no reason why the conversion should become weaker at high velocities.
Developing some kind of minimum Voellmy-type rheology that is able to explain the long runout at large volumes without these inconsistencies is the subject of this paper.
The ideas of Voellmy (1955) and Salm (1993) focus on the v2 term in Eq. (1), which dominates the rheology at high velocities. In turn, the Coulomb friction term describes the well-constrained behavior at low velocities. Without this term, friction would approach zero in the limit v→0. Then avalanches would continue moving and spreading forever unless the mass is captured in topographic depressions.
Adding the two terms in Eq. (1) is elegant since the correct term automatically becomes dominant in the respective regime of velocities. However, this approach is not unique and does not necessarily describe the behavior at intermediate velocities well. Given that the behavior at small and large velocities is captured well, the inability to reproduce the long runout of rock avalanches without reducing the coefficient μ artificially must arise from a wrong behavior at intermediate velocities.
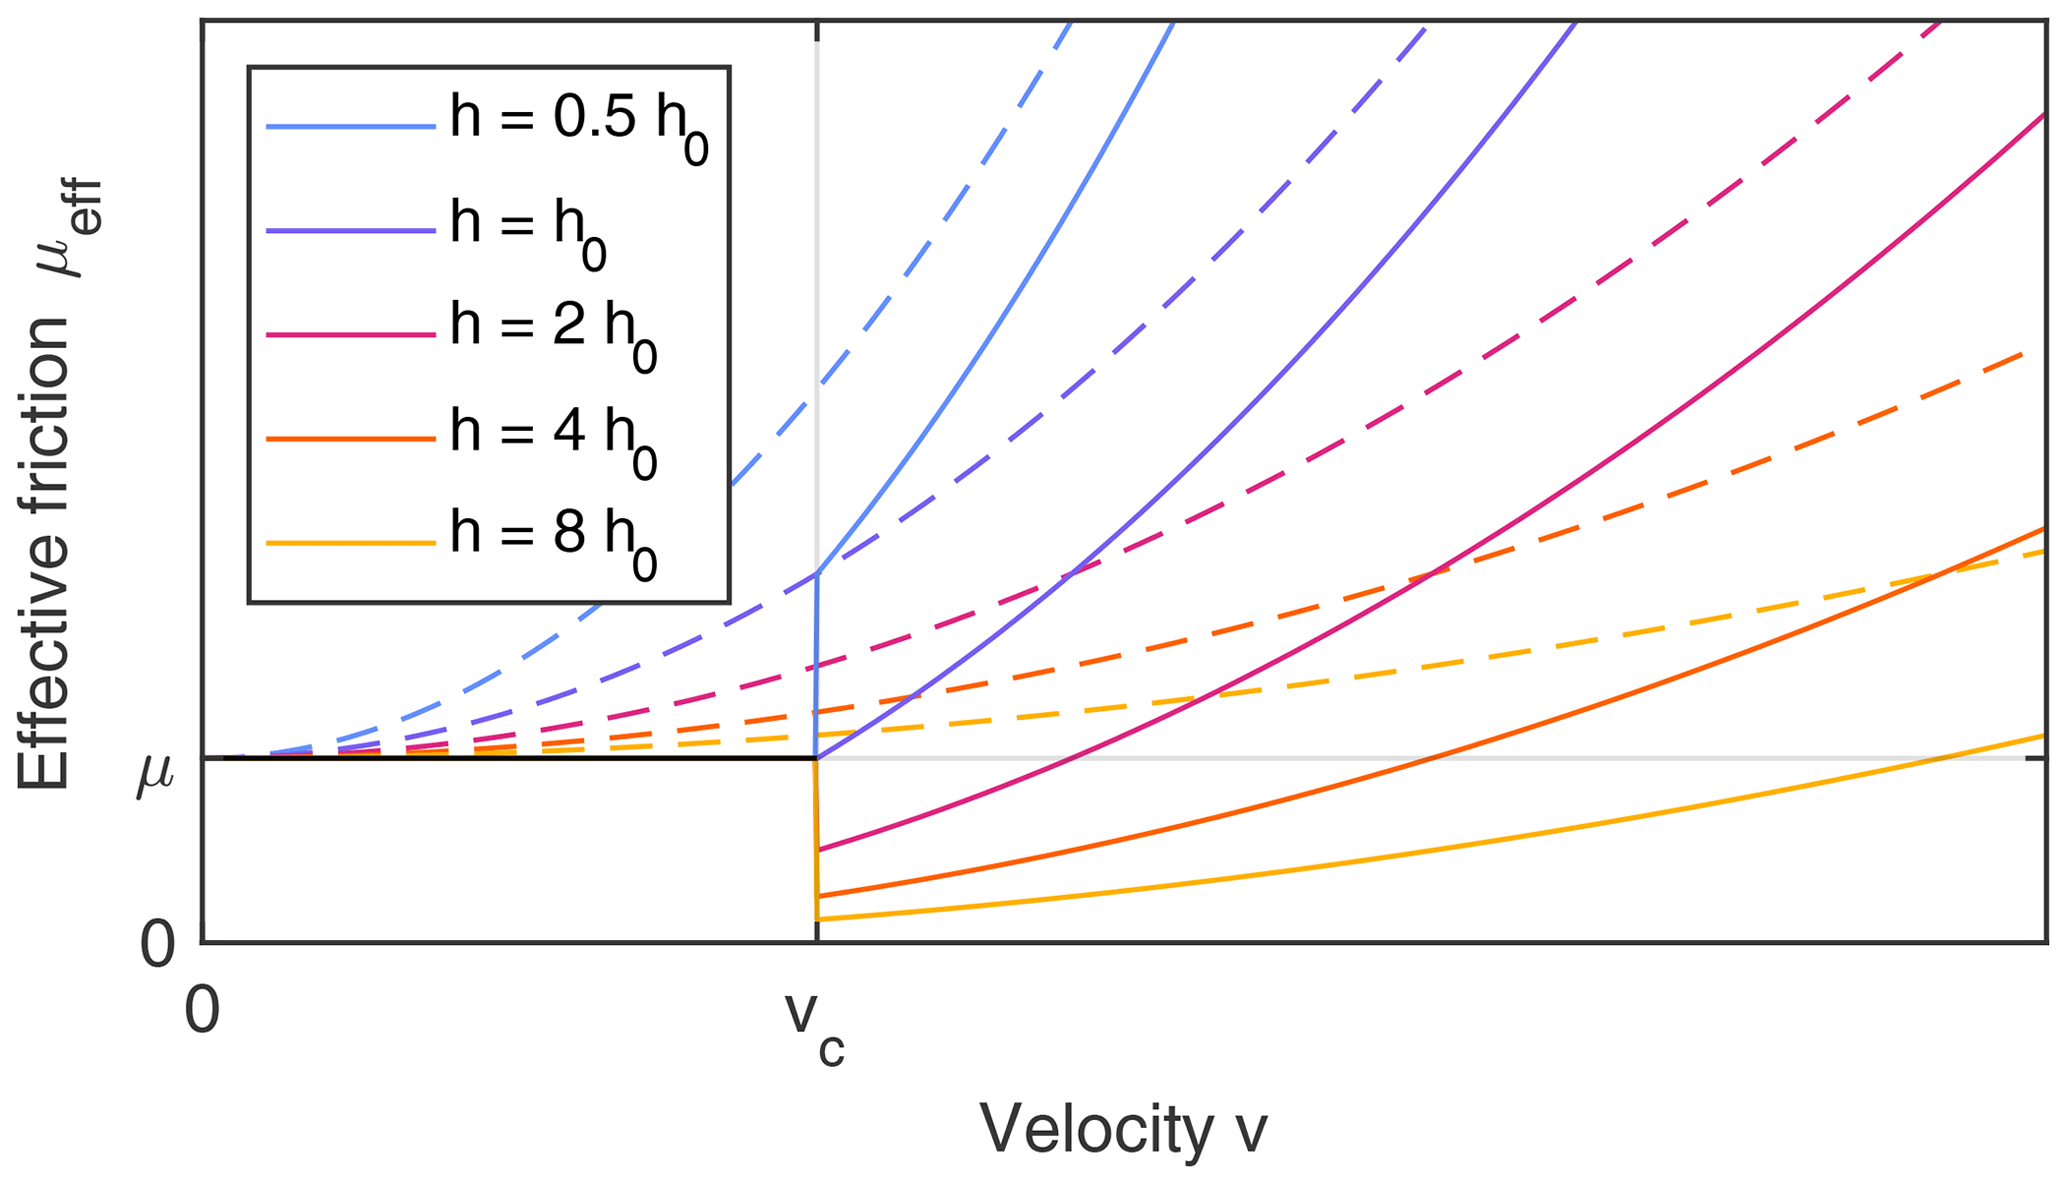
In this paper, a complementary approach is proposed by assuming a sharp transition between two distinct regimes of movement in the form
For the moment, it is assumed that the transition takes place at a given crossover velocity vc.
Figure 1 illustrates the difference of the sharp transition (Eq. 4) towards the sum (Eq. 1) in terms of the effective coefficient of friction (Eq. 2), which turns into
A fundamental difference occurs if the moving layer is so thick that , so if
Then μeff decreases instantaneously if v exceeds vc. If the decrease is sufficiently strong, μeff < μ over a considerable range in v. In this case, Heim's ratio may decrease below the coefficient of friction μ so that a long runout can occur without decreasing μ artificially.
In the following, the framework is reduced to the minimum that is necessary for investigating the new approach in the context of velocity and runout. The movement of a point-like mass on a given topographic profile is considered, and it is assumed that the thickness h is constant. Since the normal stress only affects the shear stress at low velocities (v<vc), dynamic effects (centrifugal forces) on the normal stress can be neglected. Then σ=ρgcos β can be assumed, and the total acceleration parallel to the topography is
As already pointed out by Perla et al. (1980), considering the velocity v as a function of the position s (arc length along the profile) is simpler than considering s and v as functions of time. The governing equation becomes particularly simple if the kinetic energy per unit mass, , is considered, since
Inserting Eq. (7) yields
with
The differential equation is linear in both regimes. It is easily recognized that the solution for a straight slope (constant β) is
for v≥vc, where
is the kinetic energy in equilibrium (). The kinetic energy approaches Ee downslope and λ is the respective e-folding distance.
So λ has two different meanings beyond its definition in terms of the parameters ξ and h (Eq. 10). First, it controls the equilibrium velocity via the respective kinetic energy (Eq. 12). This kinetic energy is the same as the potential energy corresponding to a height drop λsin β. So the maximum kinetic energy is the potential energy obtained by falling a height of λsin β, equivalent to traveling a distance λ along the slope. More important, however, it defines the length scale of adjustment of the velocity to the slope. According to Eq. (11), the actual kinetic energy approaches the respective equilibrium value Ee exponentially, and λ is the length over which the difference decreases by a factor of . The combination of this length scale with the length scale of the topography will be the basis of the scaling properties investigated in Sect. 4.
Voellmy (1955) estimated ξ≈500 ms−2 for snow avalanches on a rough bed. Typical best-fit values for rock avalanches are slightly lower (ξ≈300 ms−2, e.g., Aaron et al., 2022; Argentin et al., 2022), leading to an estimate of λ≈15 h.
In the following, a straight slope is combined with a horizontal plane (Fig. 2), although other geometries such as the cycloidal or parabolic profiles considered by Gauer (2018) may be more realistic. As a major advantage beyond the simple analytical solution, the slope length l defines a unique length scale here, and the ratio of the length scales λ (rheology) and l (topography) will turn out to be the main control on the behavior.
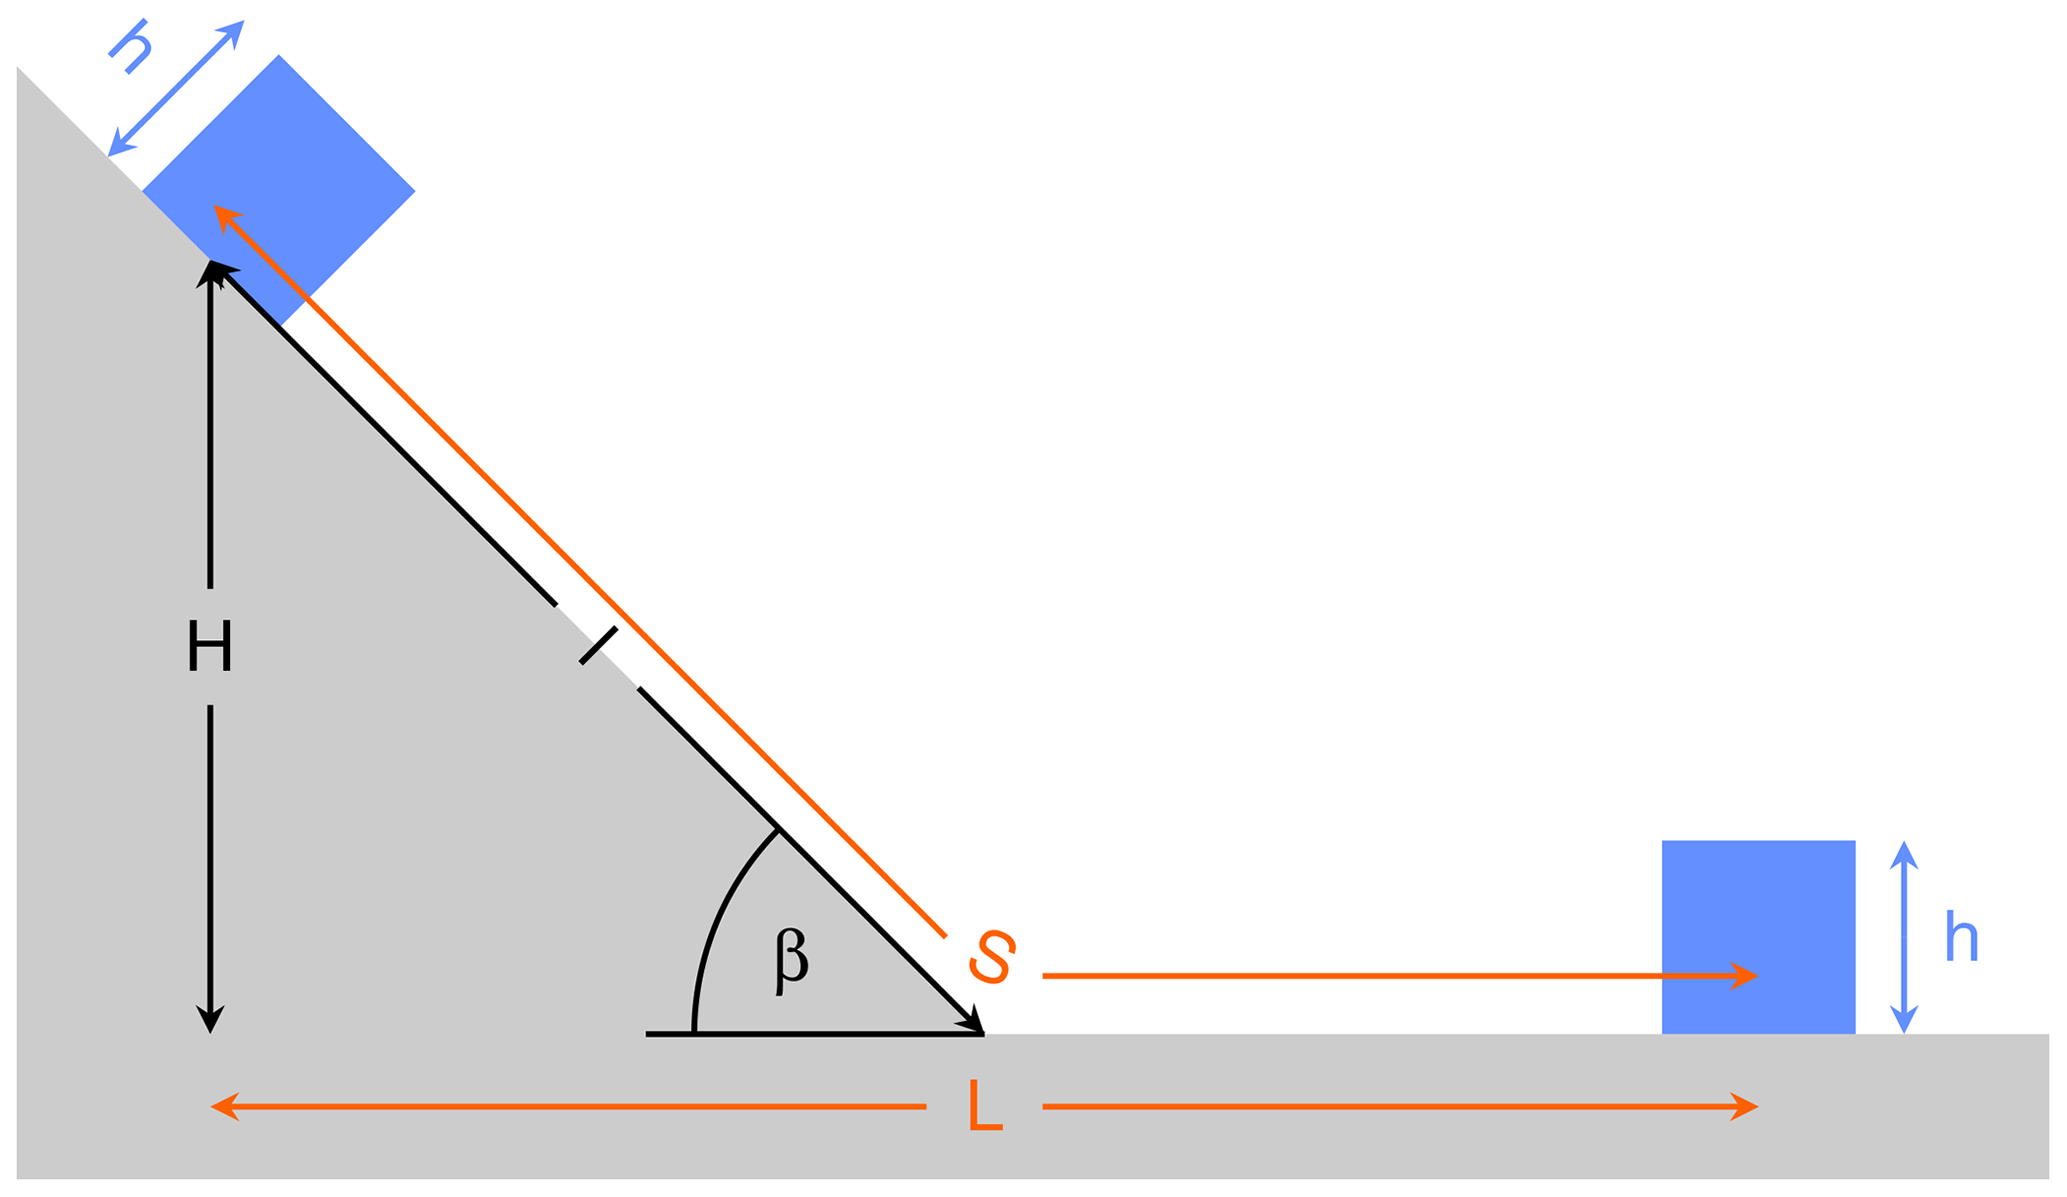
Figure 2Geometry used for investigating the scaling properties. Black symbols (H, l, β) refer to the topography. The size of the mobile mass is characterized by its (constant) thickness h (blue). The runout length (either S measured along the track or L measured horizontally) is to be predicted by the model.
The velocity at each point is easily composed from Eq. (11) for each of the two segments and the respective solution for Coulomb friction. The latter is even independent of the specific topography and is readily obtained in terms of the horizontal coordinate x instead of the arc length s,
where z(x) is the topography and the relations and were used. Then,
which recovers the widely used energy-line approach.
Figure 3 shows phase space trajectories (v vs. s) for β=45∘, l=1000 m, μ=0.75, and vc=15 m s−1. The total height is m. Pure Coulomb friction (vc→∞) is used as a reference scenario (black line).
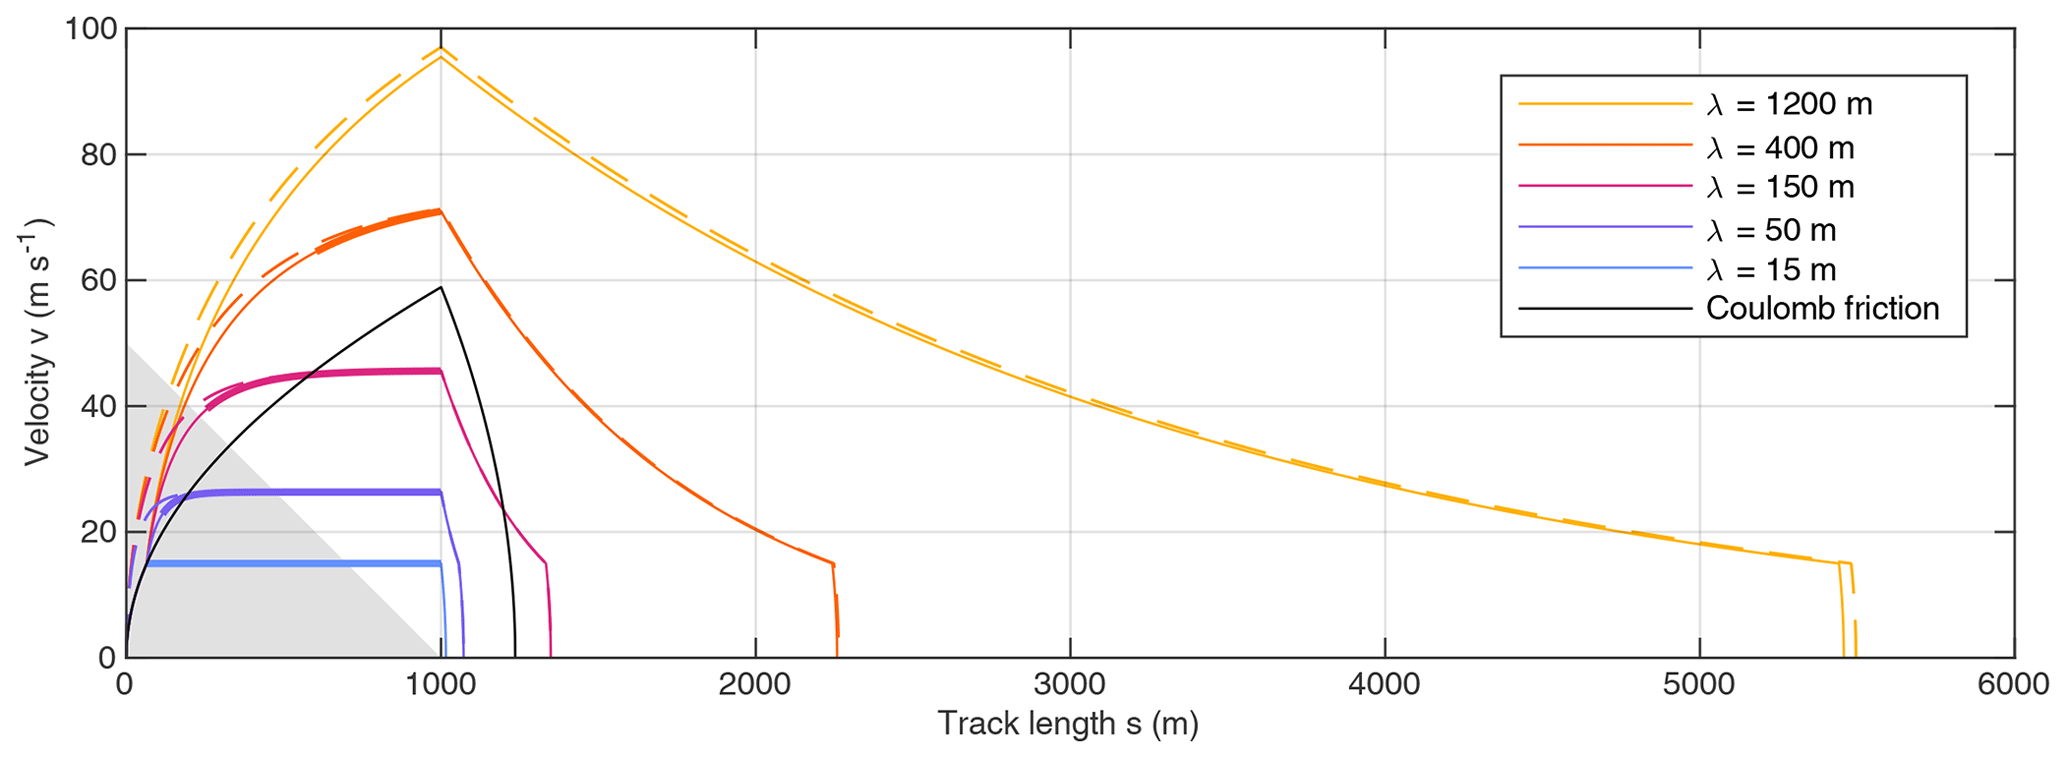
Figure 3Phase space trajectories for , l=1000 m, μ=0.75, and vc=15 m s−1. Solid lines start with Coulomb friction as long as v < vc. Dashed lines correspond to a simplified scenario which immediately starts with flow instead of Coulomb friction. Thick line segments describe the range where flow is less efficient than Coulomb friction.
For all considered scenarios except for λ=15 m, the transition to flow at v=vc reduces friction. However, this condition does not guarantee an increase in runout length compared to Coulomb friction. Since the advantage is lost at high velocities (see Fig. 1), flow is less efficient than Coulomb friction for part of the track, except for the highest value λ=1200 m.
So the value of λ at which the runout length exceeds that of Coulomb friction is considerably higher than that where flow is more efficient than Coulomb friction at v=vc. This value of λ, however, is less important than the occurrence of two different regimes. For small values of λ (here λ≤150 m), v approaches the equilibrium velocity (Eq. 12) along the slope, and the runout length is finally not much larger than for Coulomb friction. In turn, the mass is still accelerated considerably at the foot of the slope for large values of λ (here λ≥400 m). The runout length increases rapidly with λ in this regime, resulting in low values of Heim's ratio. The runout reaches almost 5.5 km for λ=1200 m in terms of arc length, corresponding to almost L=5.2 km of horizontal distance and to . This value of Heim's ratio is more than 5 times smaller than the coefficient of friction μ=0.75 assumed here. The two different regimes will be investigated in detail in Sect. 4.
The dashed lines in Fig. 3 describe a simplified scenario which neglects the initial Coulomb friction phase. Here it is assumed that the movement already starts with the flow rheology, although v<vc in the beginning. As a consequence, friction is low during the initial phase, which results in higher velocities. For low values of λ, however, v approaches the equilibrium velocity rapidly. Then the additional kinetic energy is consumed before the mass reaches the foot of the slope so that its effect on the runout length is negligible.
In turn, some of the additional kinetic energy is preserved for large values of λ, which leads to a longer runout. However, the effect is of an order of magnitude of only 1 % for λ=1200 m and thus still negligible. The same holds for the phase of deceleration after falling back to Coulomb friction. The respective length is m here, which is also negligible. So the transition to Coulomb friction if the velocity drops below vc is important, but the coefficient of friction μ is irrelevant compared to the parameters λ and vc.
The transition between Coulomb friction and flow at a given velocity vc was an ad hoc assumption in Sect. 2. Let us now find out whether this assumption can be substantiated by the RKE model. For simplicity, the lumped-mass model is considered here.
The energy per area and time dissipated at the bed is τv. Following the idea of the RKE model, a fraction ϕ of this energy is converted into RKE and then dissipated according to a linear decay model with a decay constant k. Accordingly, the average RKE per unit mass R follows the differential equation
and thus
for v≥vc with τ from Eq. (4) and λ from Eq. (10). At constant velocity, R approaches an equilibrium value:
Assuming that this adjustment is much faster than changes in velocity as already proposed by Issler et al. (2018), it can be assumed that R always follows Eq. (17).
The above considerations are just a simplification of the original RKE model. Introducing a dependence of friction on R would be the next step. This step, however, is questionable, as discussed in Sect. 1. Instead, assuming that R controls the transition between the two regimes of friction is almost straightforward. This means that a given minimum amount of RKE per mass Rc is required for maintaining flow and a fallback to Coulomb friction occurs as soon as R<Rc. In combination with Eq. (17), this concept predicts a crossover velocity of
Similarly to the friction term itself, vc does not depend on h and ξ individually, but only on their product via the length scale λ. For the lumped-mass model, this implies that the entire solution only depends on the product ξh and not on the individual values, which will simplify the analysis of the scaling properties in Sect. 4.
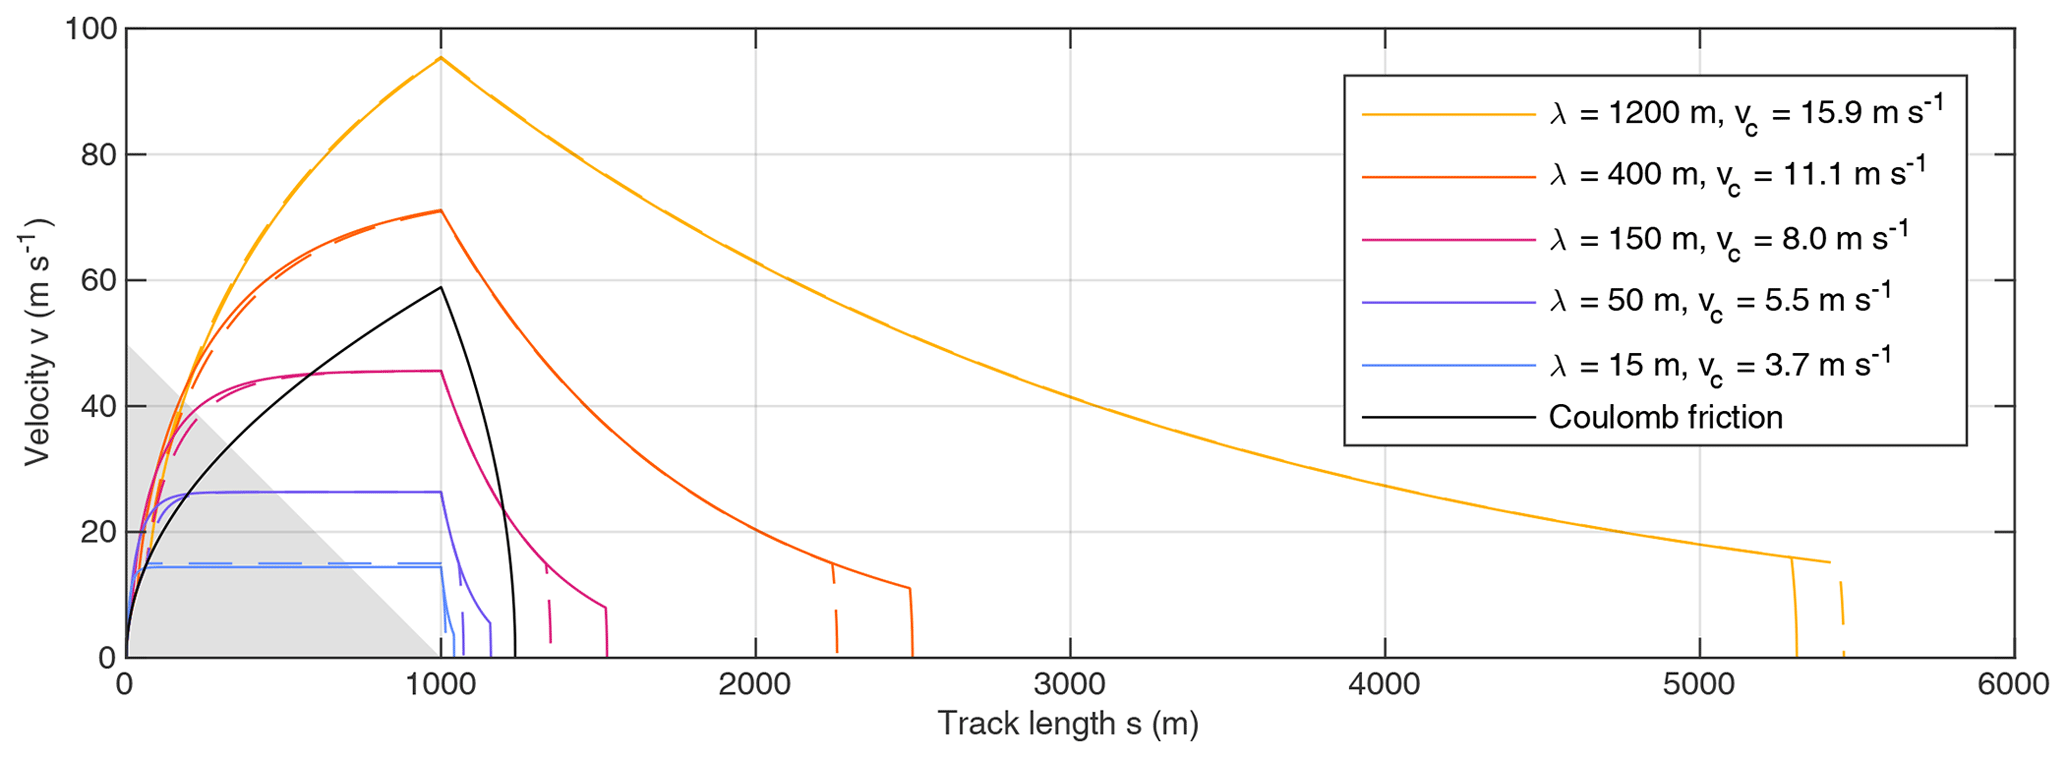
Figure 4 compares the phase space trajectories from Fig. 3 to those obtained with a given minimum RKE per mass. The respective relation (Eq. 18) was implemented in the form m s−1. As discussed in Sect. 2, the initial phase has no big effect so that the trajectories mainly differ at the end when the flowing medium falls back to Coulomb friction. The crossover velocity vc is greater than in Fig. 3 for λ>l and vice versa. Accordingly, the runout length is reduced for λ>l and vice versa. The increase in runout length with increasing λ persists but becomes weaker. This effect will be investigated further in the following.
The findings from Sect. 2 suggest considering a simplified model neglecting the two phases of Coulomb friction. So let us assume that the movement immediately starts with flow and stops suddenly when the velocity drops below vc. Then the kinetic energy at the foot of the slope is obtained from Eqs. (11) and (12):
with the total height H=lsin β. For any position s>l, the kinetic energy is
The runout (arc) length S is then defined by the condition
which yields
with the nondimensional energy ratio
The energy ratio is the ratio of the total available potential energy and the minimum kinetic energy required to maintain flow.
If we consider scenarios with different values of λ on the same topography (as in Figs. 3 and 4), it makes sense to divide Eq. (23) by l. Then the runout length S relative to the slope length l is a function of the ratio and ϵ. For the simplest model with a constant threshold velocity vc, the energy ratio ϵ is even constant (ϵ≈60 for the scenario from Fig. 3). In turn, the RKE concept introduces a dependence of ϵ on λ. Since vc∝λ⅓ (Eq. 18), if the other parameters are constant. Using the energy ratio at λ=l (so ϵ(l,l)) as a reference, this dependence can be written in the form
Figure 5a shows the dependence of on . Since both S and l refer to arc length, these properties were converted to the height H=lsin β and the horizontal distance in Fig. 5b. This plot is not as universal as the original plot since it depends on the slope angle ( here). However, the plot of the inverse of Heim's ratio, , is in principle similar to that of .
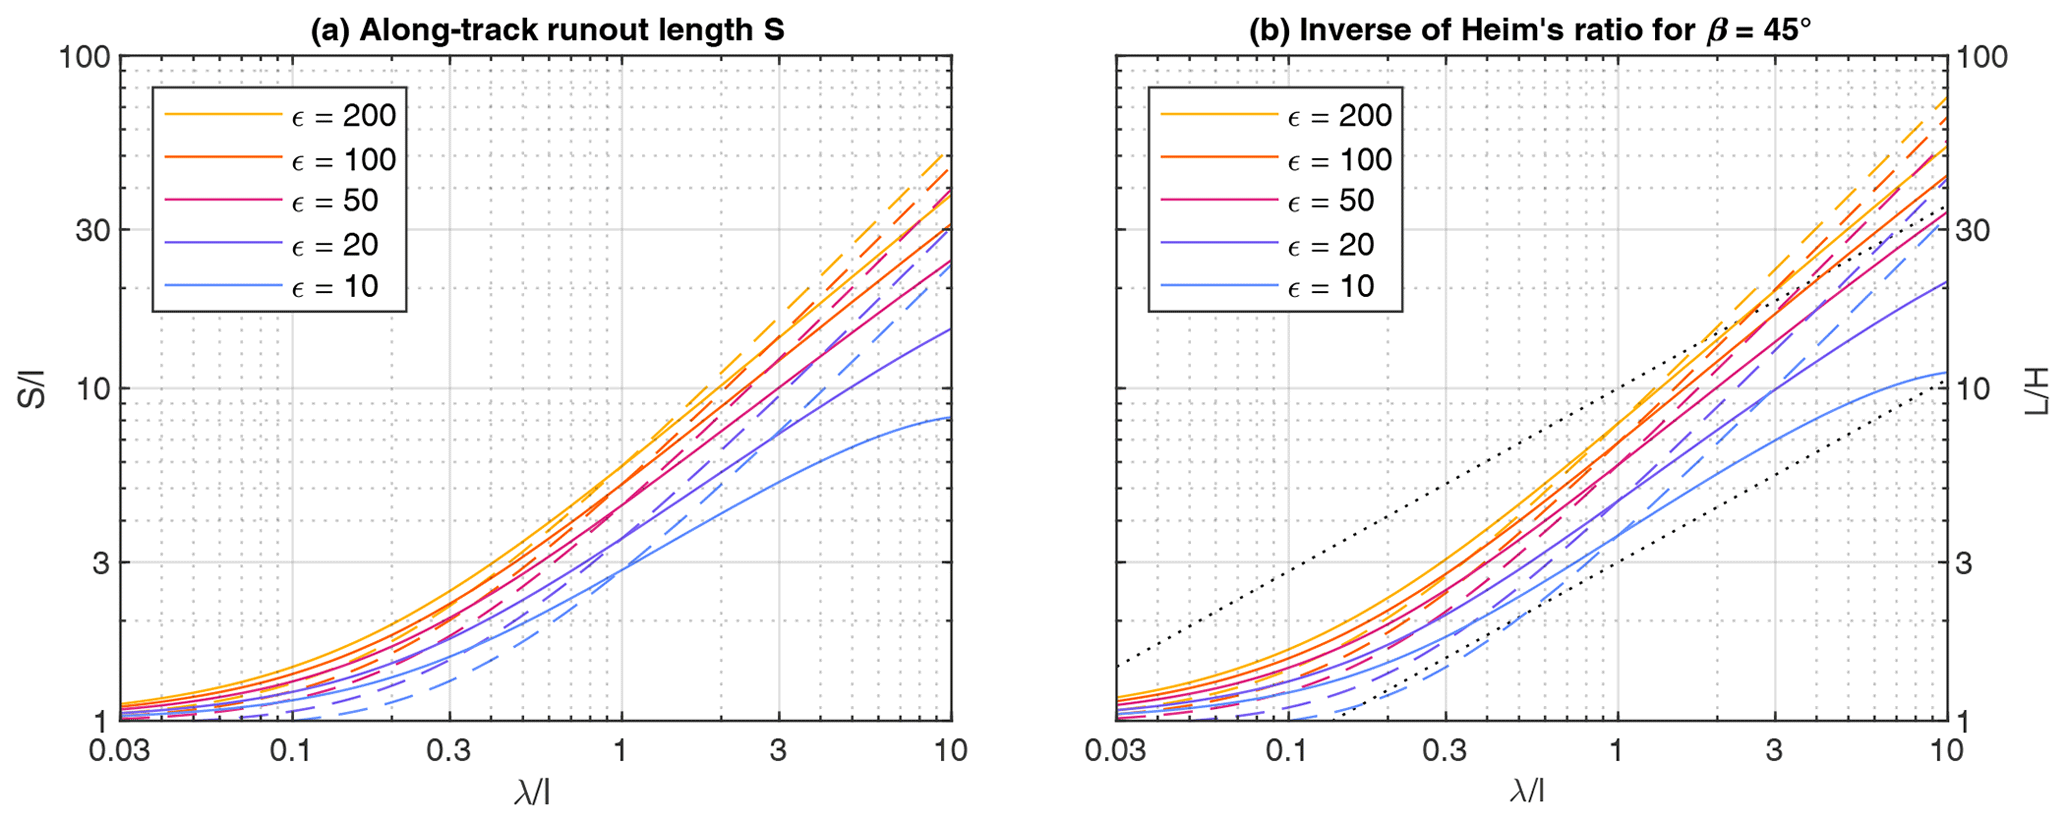
Figure 5Runout length as a function of λ on the same topography (constant l and β for each curve). Dashed lines refer to the model with constant vc (constant ϵ along each curve). Solid lines refer to the RKE model, where ϵ is the energy ratio for λ=l (ϵ(l,l) in Eq. 25). The dotted lines reflect the power law with an exponent γ=0.55 expected from real rock avalanches.
The shape of the curves suggests that scaling changes somewhere in the middle of the plotted range. If is small, runout length increases only weakly with λ, while the increase apparently approaches a power law for greater ratios . The difference in scaling is already recognized in the kinetic energy at the foot of the slope. For λ≪l, Eq. (19) yields
which depends only on λ and on the slope angle β, but not on the absolute slope length l and height H individually. In turn, Eq. (19) yields
for λ≫l, which means that the initial potential energy is converted almost completely into kinetic energy. Then the kinetic energy at the foot of the slope depends on the height, but not on the slope angle β.
These results suggest a subdivision of the parameter space into a slope-dominated regime (E(l) depends mainly on β) and a height-dominated regime (E(l) depends mainly on H). In the form λ≫l, however, the height-dominated regime is just a mathematical limit. Using the estimate λ≈15h, would already require h=l, which is geometrically unrealistic. This is also the reason why Fig. 3 is limited to .
The two regimes can be defined beyond the mathematical limits by comparing the dependence of E(l) on l at constant β (making the slope longer) and at constant H (making the slope less steep). Equation (19) yields
It is found easily graphically or numerically that for . In this sense, the regime with is height-dominated and the regime with slope-dominated.
Approximating the term by for λ≫l in Eq. (23) yields
The dashed lines in Fig. 5 show that this linear increase in runout length holds reasonably well for the model with constant vc over the height-limited range. After transforming the arc length S to the horizontal distance L, the curves even follow the linear increase slightly better.
For the model based on RKE (solid lines in Fig. 5), however, the decrease in ϵ with λ causes a weaker increase in runout length. Theoretically, the runout length would even decrease for λ≫l since then (Eq. 25). While this effect is visible for the lowest energy ratio ϵ=10, the other curves can be described reasonably well by a power law with an exponent lower than 1 in the height-limited regime.
The exponent γ of the power-law relation
is the most important criterion for testing the approach against real-world data. About 50 years ago, Scheidegger (1973) found a power-law relation in terms of volume,
although referring to the original definition of H and L and not to the center of mass. This relation was confirmed later by Legros (2002). Larsen et al. (2010) found the relation V∝A1.40 between volume and area for the deposits of bedrock landslides. This leads to the relation
so that the exponent in Eq. (31) should be
The dotted lines in Fig. 5b illustrate the expected power-law relation. In particular, the linear increase (γ=1) in found for constant vc is way too strong. The results based on RKE are closer to the expected power law, in particular for small energy ratios. For larger values of ϵ, however, the increase is still too strong, e.g., γ≈0.75 for ϵ=50. These findings lead to the conclusion that considering different volumes on the same topography overestimates the increase in runout length with volume.
Figure 6 shows the complementary scenario, which considers the same volume on different topographies. Accordingly, λ is assumed to be constant now and defines the characteristic length scale, while the slope length l varies. Assuming a constant slope angle, the energy ratio depends on l according to the relation
for both models of vc then since only the dominator of Eq. (24) is proportional to l. As expected, the runout length increases with increasing slope length (Fig. 6a). However, the increase is weaker than linear except for small values of in combination with small energy ratios. As a consequence, the ratio mostly decreases with (Fig. 6b). So the ratio decreases with increasing slope length if the volume is constant.
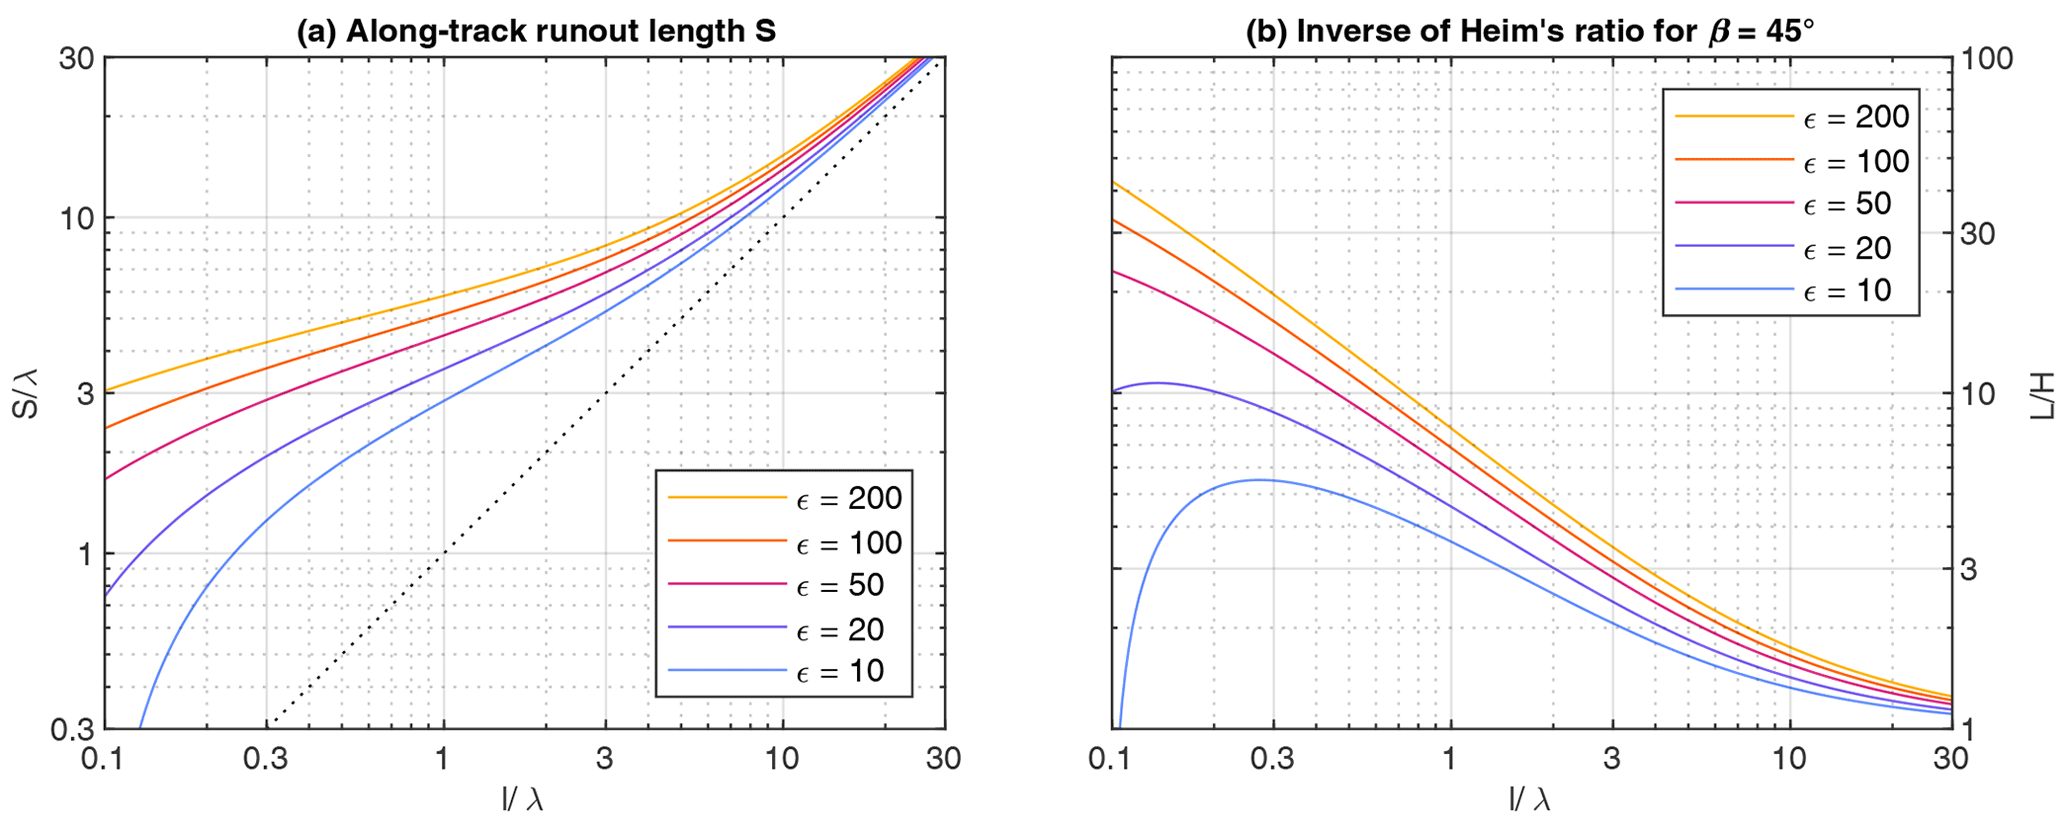
Figure 6Runout length as a function of the slope length l for the same volume (constant λ) and the same slope angle β. Since λ is constant here, there is no difference between the version based on RKE and the version with constant vc. The parameter ϵ is the energy ratio for l=λ (ϵ(λ,λ) in Eq. 35). The dotted line illustrates runout to the foot of the slope (S=l).
These findings suggest that the power-law increase in with volume observed in nature may arise from a combination of the rheology and a positive correlation of volume and slope length (or height). Testing this hypothesis quantitatively requires additional empirical data. Legros (2002) found a power-law relation H∝V0.09 for the maximum height. Assuming that this relation also holds for the center of mass, combining it with the above scaling relation between volume and thickness yields
with for constant slope angle.
Since λ and l are no longer independent here, we cannot use either of them as a characteristic length scale. Instead, it is convenient to define the slope length l0 at which λ=l as a characteristic length scale, so
Then the energy ratio (Eq. 24) scales like
where the term in the exponent occurs only in the version based on RKE. The runout length is then obtained by inserting ϵ into Eq. (23), which leads to
Figure 7 reveals that the increase in runout length is still way too strong for the version with constant vc. For the version based on RKE, however, the increase reproduces that of natural rock avalanches strikingly well for .
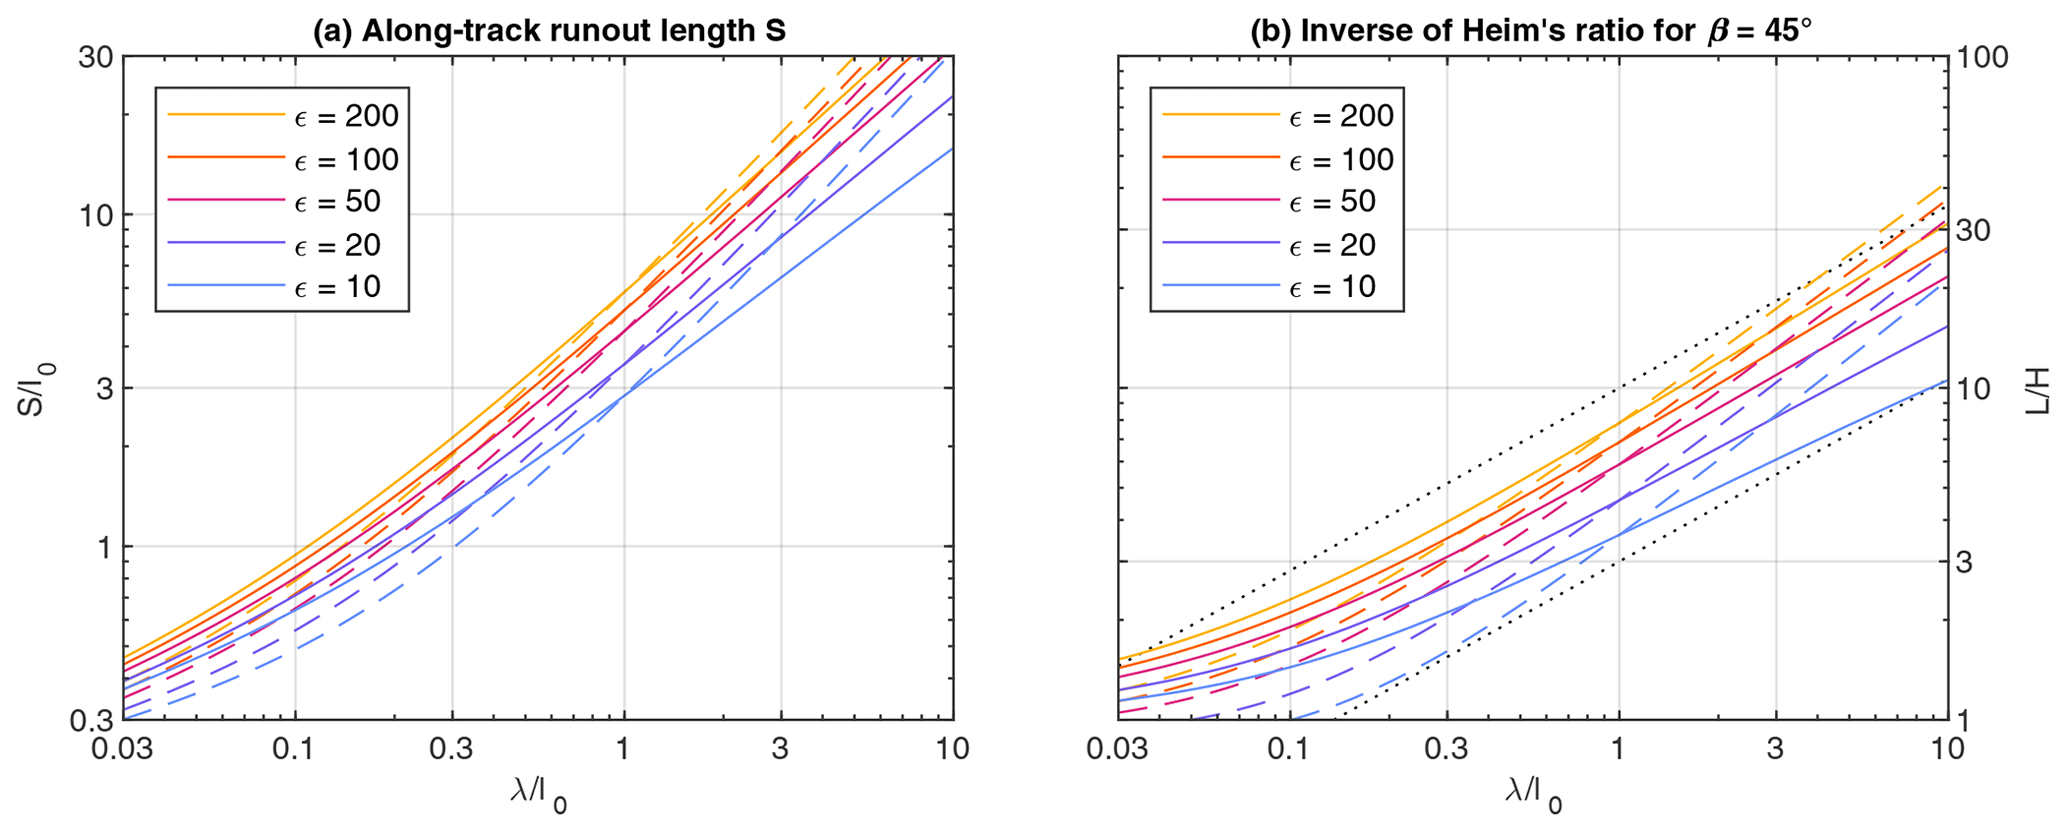
Figure 7Runout length as a function of λ for slope length and height increasing with volume (Eq. 37 with χ=0.31). Dashed lines refer to the model with constant vc and solid lines to the RKE model. The energy ratio in the legend refers to (ϵ(l0,l0) in Eq. 38). The dotted lines reflect the power law with an exponent γ=0.55 expected from real rock avalanches.
These findings strongly support the idea of two distinct regimes of friction with a transition controlled by the amount of RKE per mass. Furthermore, it becomes clear that the relation is considerably affected by the correlation of volume and height. Given that the results including this correlation (Fig. 7) fit the real-world relation well for , the respective exponent in the scenario without this correlation (Fig. 5) is not lower than 0.75. Calculated back to the volume, the exponent in the power law would be 0.22 or even larger instead of 0.16.
Assuming a constant thickness h during the movement is the most obvious limitation of the approach. While the lumped-mass approach neglects spatial variations in thickness, the approach used here also neglects the systematic decrease in thickness due to longitudinal and lateral spreading. Larsen et al. (2010) found basically the same scaling relation between volume and area for the landslide scars and the deposits, but with different factors. Deposits are typically about 3 times less thick than the respective scars, regardless of the volume. So friction (at given velocity) increases systematically during the movement. If the factor of thinning is indeed independent of volume, the scaling between and V might be unaffected. While it would in principle be possible to test this hypothesis with an improved lumped-mass model, it might be better to switch to numerical models of distributed masses here. Such models would also allow for investigating the effect of the topography in more detail, e.g, lateral confinement in valleys.
In this study, the widely used Voellmy rheology was reinterpreted and modified. Instead of adding a Coulomb friction term to the v2 term that describes the processes at a rough bed, both terms were assigned to different regimes. It was assumed that Coulomb friction applies to low flow velocities and the v2 term to high velocities. The effective friction at high velocities can be parameterized by a single length scale λ, which is proportional to the thickness and to the parameter ξ of Voellmy's rheology.
Two different model versions were tested. The simplest form assumes a transition at a given threshold velocity vc. The alternative approach adopts some ideas from the RKE model. While the original RKE model assumes that the kinetic energy of random particle motion reduces the effective friction, it is assumed here that it controls the transition from Coulomb friction to flow (so vc) without affecting friction itself. In a simplified form, the RKE model predicts an increase in vc with the cube root of the length scale λ.
Using a lumped-mass model on a straight slope combined with a horizontal plane, two different scaling regimes were found. The transition is controlled by the ratio of λ and the slope length l. For , the slope angle is more important than the height since the mass approaches a constant velocity along the slope. In turn, Heim's ratios much lower than typical Coulomb friction coefficients occur in the height-dominated regime, where the mass is still accelerated at the foot of the slope.
The decrease in Heim's ratio of height and runout length with volume observed in nature was used for testing the two versions of the model. While the simple version with a constant threshold velocity vc overestimates this decrease under all conditions, the version based on RKE turned out to be much better. However, the predicted decrease in Heim's ratio is still stronger than observed in nature if different volumes are considered on the same topography. If we take into account the correlation that large volumes are typically released from larger slopes than small volumes, the observed dependence of Heim's ratio on volume is reproduced strikingly well.
These findings strongly support the modified version of Voellmy's rheology in combination with a threshold velocity vc derived from the concept of RKE. Furthermore, the results suggest that the observed decrease in Heim's ratio with volume arises from a combination of rheology and the positive correlation between height and volume.
As a limitation, the lumped-mass considerations take into account neither the increase in runout length by longitudinal spreading nor the respective reduction in thickness and its effect on friction. Whether the relations found here hold with continuum models has to be tested. Larsen et al. (2010) found that the scaling relations between thickness and volume are the same for the detached volume and for the deposits. This would mean that longitudinal spreading reduces Heim's ratio systematically but would not affect its dependence on volume fundamentally. Following this argument, it can be expected that the lumped-mass approach already captures the fundamental behavior quite well.
To what extent the new approach can improve numerical continuum simulations of rock avalanches and finally hazard assessment has to be tested. As a technical aspect, the strong correlation between the parameters of the original Voellmy rheology may be reduced. This may allow for better constraining the parameters and make estimates more consistent across different simulations. Scientifically, the sudden fallback from flow to Coulomb friction may improve our understanding of the occurrence of hummocky deposit morphologies.
All figures and further results were obtained by evaluating the respective formulas without using any numerical methods.
All data used in this study can be found in the text.
The author has declared that there are no competing interests.
Publisher's note: Copernicus Publications remains neutral with regard to jurisdictional claims made in the text, published maps, institutional affiliations, or any other geographical representation in this paper. While Copernicus Publications makes every effort to include appropriate place names, the final responsibility lies with the authors.
The author would like to thank two anonymous reviewers and Matthias Rauter for their constructive comments and Xuanmei Fan for the editorial handling.
This open-access publication was funded by the University of Freiburg.
This paper was edited by Xuanmei Fan and reviewed by two anonymous referees.
Aaron, J., McDougall, S., Kowalski, J., Mitchell, A., and Nolde, N.: Probabilistic prediction of rock avalanche runout using a numerical model, Landslides, 19, 2853–2869, https://doi.org/10.1007/s10346-022-01939-y, 2022. a, b
Argentin, A.-L., Hauthaler, T., Liebl, M., Robl, J., Hergarten, S., Prasicek, G., Salcher, B., Hölbling, D., Pfalzner-Gibbon, C., Mandl, L., Maroschek, M., Abad, L., and Dabiri, Z.: Influence of rheology on landslide-dammed lake impoundment and sediment trapping: Back-analysis of the Hintersee landslide dam, Geomorphology, 414, 108363, https://doi.org/10.1016/j.geomorph.2022.108363, 2022. a
Bartelt, P. and Buser, O.: Frictional relaxation in avalanches, Ann. Glaciol., 51, 98–104, https://doi.org/10.3189/172756410791386607, 2010. a
Buser, O. and Bartelt, P.: Production and decay of random kinetic energy in granular snow avalanches, J. Glaciol., 55, 3–12, https://doi.org/10.3189/002214309788608859, 2009. a
Campbell, C. S., Cleary, P. W., and Hopkins, M.: Large‐scale landslide simulations: Global deformation, velocities and basal friction, J. Geophys. Res.-Sol. Ea., 100, 8267–8283, https://doi.org/10.1029/94JB00937, 1995. a
Christen, M., Kowalski, J., and Bartelt, P.: RAMMS: Numerical simulation of dense snow avalanches in three-dimensional terrain, Cold Reg. Sci. Technol., 63, 1–14, https://doi.org/10.1016/j.coldregions.2010.04.005, 2010. a
Crosta, G. B., Frattini, P., Valbuzzi, E., and de Blasio, F. V.: Introducing a new inventory of large Martian landslides, Earth Space Sci., 5, 89–119, https://doi.org/10.1002/2017EA000324, 2018. a
Davies, T. R., McSaveney, M. J., and Hodgson, K. A.: A fragmentation-spreading model for long-runout rock avalanches, Can. Geotech. J., 36, 1096–1110, https://doi.org/10.1139/t99-067, 1999. a
Davies, T. R. H.: Spreading of rock avalanche debris by mechanical fluidization, Rock Mech., 15, 9–24, https://doi.org/10.1007/BF01239474, 1982. a
de Blasio, F. V.: Introduction to the Physics of Landslides, Springer, Dordrecht, Heidelberg, London, New York, https://doi.org/10.1007/978-94-007-1122-8, 2011. a, b
de Blasio, F. V. and Elverhøi, A.: A model for frictional melt production beneath large rock avalanches, J. Geophys. Res.-Earth, 113, F02014, https://doi.org/10.1029/2007JF000867, 2008. a
Dufresne, A., Bösmeier, A., and Prager, C.: Sedimentology of rock avalanche deposits – Case study and review, Earth Sci. Rev., 163, 234–259, https://doi.org/10.1016/j.earscirev.2016.10.002, 2016. a
Erismann, T. H.: Mechanisms of large landslides, Rock Mech., 12, 15–46, https://doi.org/10.1007/BF01241087, 1979. a
Gauer, P.: Considerations on scaling behavior in avalanche flow along cycloidal and parabolic tracks, Cold Reg. Sci. Technol., 151, 34–46, https://doi.org/10.1016/j.coldregions.2018.02.012, 2018. a
Issler, D., Jenkins, J. T., and McElwaine, J. N.: Comments on avalanche flow models based on the concept of random kinetic energy, J. Glaciol., 64, 148–164, https://doi.org/10.1017/jog.2017.62, 2018. a, b
Iverson, R. M.: Comment on “The reduction of friction in long-runout landslides as an emergent phenomenon” by Brandon C. Johnson et al., J. Geophys. Res.-Earth, 121, 2238–2242, https://doi.org/10.1002/2016JF003979, 2016. a
Johnson, B. C., Campbell, C. S., and Melosh, H. J.: The reduction of friction in long runout landslides as an emergent phenomenon, J. Geophys. Res.-Earth, 121, 881–889, https://doi.org/10.1002/2015JF003751, 2016. a, b
Jop, P., Forterre, Y., and Pouliquen, O.: Crucial role of sidewalls in granular surface flows: consequences for the rheology, J. Fluid Mech., 541, 167–192, https://doi.org/10.1017/S0022112005005987, 2005. a
Jop, P., Forterre, Y., and Pouliquen, O.: A constitutive law for dense granular flows, Nature, 441, 727–730, https://doi.org/10.1038/nature04801, 2006. a
Kesseler, M., Heller, V., and Turnbull, B.: Grain Reynolds number scale effects in dry granular slides, J. Geophys. Res.-Earth, 125, e2019JF005347, https://doi.org/10.1029/2019JF005347, 2020. a
Larsen, I. J., Montgomery, D. R., and Korup, O.: Landslide erosion controlled by hillslope material, Nat. Geosci., 3, 247–251, https://doi.org/10.1038/ngeo776, 2010. a, b, c
Legros, F.: The mobility of long-runout landslides, Eng. Geol., 63, 301–331, https://doi.org/10.1016/S0013-7952(01)00090-4, 2002. a, b, c
Lucas, A., Mangeney, A., and Ampuero, J. P.: Frictional velocity-weakening in landslides on Earth and on other planetary bodies, Nat. Commun., 5, 3417, https://doi.org/10.1038/ncomms4417, 2014. a
Mead, S. R. and Cleary, P. W.: Validation of DEM prediction for granular avalanches on irregular terrain, J. Geophys. Res.-Earth, 120, 1724–1741, https://doi.org/10.1002/2014JF003331, 2015. a
Perla, R., Cheng, T. T., and McClung, D.: A two-parameter model of snow-avalanche motion, J. Glaciol., 26, 197–207, https://doi.org/10.3189/S002214300001073X, 1980. a
Preuth, T., Bartelt, P., Korup, O., and McArdell, B. W.: A random kinetic energy model for rock avalanches: Eight case studies, J. Geophys. Res.-Earth, 115, F03036, https://doi.org/10.1029/2009JF001640, 2010. a
Pudasaini, S. P. and Mergili, M.: A multi-phase mass flow model, J. Geophys. Res.-Earth, 124, 2920–2942, https://doi.org/10.1029/2019JF005204, 2019. a
Salm, B.: Flow, flow transition and runout distances of flowing avalanches, Ann. Glaciol., 18, 221–226, https://doi.org/10.3189/S0260305500011551, 1993. a, b
Savage, S. B. and Hutter, K.: The motion of a finite mass of granular material down a rough incline, J. Fluid Mech., 199, 177–215, https://doi.org/10.1017/S0022112089000340, 1989. a
Scheidegger, A. E.: On the prediction of the reach and velocity of catastrophic landslides, Rock Mech., 5, 231–236, https://doi.org/10.1007/BF01301796, 1973. a
Shreve, R. L.: The Blackhawk landslide, vol. 108 of GSA Special Papers, Geological Society of America, https://doi.org/10.1130/SPE108-p1, 1968. a
Voellmy, A.: Über die Zerstörungskraft von Lawinen, Schweiz. Bauzeitung, 73, 212–217, https://doi.org/10.5169/seals-61891, 1955. a, b, c, d