the Creative Commons Attribution 4.0 License.
the Creative Commons Attribution 4.0 License.
 | 22 Jul 2025
Modeling memory in gravel-bed rivers: a flow-history-dependent relation for evolving thresholds of motion
Joel P. L. Johnson
Dieter Rickenmann
Jens M. Turowski
Thresholds of motion () strongly control bedload transport in gravel-bed rivers. Uncertainty in limits the accuracy of predictions of transport and morphologic change. To improve our quantitative understanding of morphodynamic feedbacks in rivers, we propose a flow-history-dependent model where evolves temporally as a function of bed shear stress. Relatively low shear stresses strengthen the bed, increasing and reducing transport. Larger floods rapidly weaken the bed, decreasing and increasing transport. We calibrate the model to a 23-year record of flow and bedload transport from the Erlenbach torrent, Switzerland, and find that the model predicts the field-based record more accurately than assuming a constant . Calibrated parameters describing strengthening are more tightly distributed than weakening parameters, which suggests that magnitudes of bed weakening may be more variable and difficult to accurately predict as a function of flood characteristics than bed strengthening during lower flows.
- Article
(1733 KB) - Full-text XML
-
Supplement
(555 KB) - BibTeX
- EndNote


Erosion, deposition, and morphological change in gravel-bed rivers result from bedload transport. Gravel transport rates are notoriously difficult to accurately predict in natural rivers because they are influenced by a wide variety of factors including water discharge, local channel morphology, and upstream sediment supply. These factors can vary both spatially and temporally. Nonetheless, most equations to predict bedload flux simplify this complexity using a deterministic parameterization which only considers flow intensity and a transport threshold. For example, the classic Meyer-Peter and Müller (1948) equation (MPM) can be expressed simply as for (Wong and Parker, 2006), where is dimensionless sediment flux per unit channel width (Einstein number), τ∗ is nondimensional shear stress (Shields stress), and threshold parameter is the critical Shields stress. Shields stress is , where τ, ρs,ρ, g, and D are dimensional bed shear stress (Pa), sediment density (kg m−3), water density (kg m−3), gravitational acceleration (m s−2), and median sediment diameter (m). Einstein number is defined as , where qs is the volumetric bedload transport rate per unit width (m3 s−1 m−1). While the threshold parameter ( describes the nondimensional shear stress at the onset of sediment motion, it is also often used as a physically meaningful, but empirically determined, fitting parameter in bedload transport models (e.g., Engelund and Fredsoe, 1976; Luque and Van Beek, 1976; Meyer-Peter and Müller, 1948; Wong and Parker, 2006; Shields, 1936; Wiberg and Smith, 1987; Wilcock and Crowe, 2003). For bedload equations such as the MPM, is a lumped parameter that implicitly accounts for alłof the factors that influence bedload transport rates apart from τ∗.
Even during large floods, bedload transport often occurs at shear stresses only slightly exceeding threshold conditions, making transport rate predictions particularly sensitive to threshold values (e.g., Parker, 1978; Phillips and Jerolmack, 2016; Phillips et al., 2022; Pretzlav et al., 2020). Transport thresholds also strongly influence gravel-bed channel reach morphologies (e.g., Parker, 1978; Phillips et al., 2022) and modulate the mapping of climate onto fluvial processes, informing short- and long-term sediment fluxes and the relative importance (or unimportance) of extreme events for channel evolution (e.g., Blom et al., 2017; DiBiase and Whipple, 2011; Lague et al., 2005; Shobe et al., 2018; Tucker and Bras, 2000). For these reasons, improving our ability to calculate thresholds of motion is critical not only for predicting transport rates but also for predicting mountain river morphodynamics and channel stability.
Early work assumed that thresholds were primarily controlled by grain weight relative to the fluid. By accounting for these variables through nondimensionalization, was initially thought to be approximately constant for typical conditions in gravel-bed rivers (e.g., Buffington and Montgomery, 1997; Shields, 1936 ). However, Buffington and Montgomery (1997) showed that varied systematically with the ratio of the median grain size to flow depth, independently of shear stress. More recent work has explored how both flow and grain interactions lead to inherent variability in . Thresholds vary spatially with the surrounding grain size distribution (Parker, 1990; Chen and Stone, 2008), reach slope (Lamb et al., 2008; Mueller et al., 2005), bed morphology (Dietrich et al., 1989; Gran et al., 2006; Powell et al., 2016; Monsalve and Yager, 2017; Powell and Ashworth, 1995; Roberts et al., 2020), and changes in riverbed microtopography (Brayshaw, 1985; Hodge et al., 2019; Kirchner et al., 1990; Masteller and Finnegan, 2017; Yager et al., 2018).
Thresholds for motion also evolve over time. For example, hysteresis in bedload transport rates is often observed between the rising and falling limbs of individual floods (Hsu et al., 2011; Mao, 2018; Mao et al., 2014; Pretzlav et al., 2020; Reid et al., 1985; Roth et al., 2017). Predicting hysteresis using the MPM and similar bedload models requires the threshold parameter to evolve over the course of a flood event (assuming that the prefactor and exponent remain constant). Changes in over multiple events have also been observed, and, in most cases, values remain correlated across events, indicating a memory of past conditions (Downs and Soar, 2021; Hassan et al., 2020; Johnson, 2016; Lenzi et al., 2004; Mao, 2018; Masteller et al., 2019; Rickenmann, 2018, 2020; Saletti et al., 2015; Turowski et al., 2011).
Variable flow strength influences threshold evolution through time. Reid et al. (1985) first suggested the influence of antecedent flows based on field-based bedload transport monitoring, hypothesizing that longer inter-flood durations led to increases in and reduced sediment transport rates. Experiments have confirmed that the magnitude of inter-event flow affects evolution (Haynes and Pender, 2005; Masteller and Finnegan, 2017; Monteith and Pender, 2005; Ockelford et al., 2019; Ockelford and Haynes, 2013; Paphitis and Collins, 2005). With little to no active sediment transport, grain-scale changes in interlocking and surface reorganization increase particle resistance to motion (Masteller and Finnegan, 2017; Ockelford and Haynes, 2013; Yager et al., 2018). Pretzlav et al. (2020) documented systematic discharge-dependent increases and decreases in motion thresholds and associated diurnal transport hysteresis during several weeks of snowmelt flooding, using instrumented “smartrocks” to measure transport. Reduction in following larger floods has been attributed to significant reorganization of the riverbed (Lenzi et al., 2004; Turowski et al., 2009).
Sediment supply also influences threshold evolution. Hysteresis can be caused by sediment supply variations through time (Moog and Whiting, 1998; Mao et al., 2014), changing thresholds. Increased sediment supply from channel banks and hillslopes can be important in destabilizing the bed surface or introducing mobile unconsolidated material, reducing thresholds of motion (Turowski et al., 2011; Recking et al., 2012; Rickenmann, 2020). Building on observations by Recking et al. (2012), Johnson (2016) developed a model in which evolves as a function of net erosion or deposition, which are controlled by sediment supply in relation to transport capacity. After calibration to laboratory experiments, the evolving model successfully predicted how transport rates responded to pulses in sediment supply.
Decades of monitoring data from the Erlenbach torrent in Switzerland similarly provide evidence for transport thresholds evolving with both sediment supply and discharge variability. Rickenmann (2020) showed that variations in sediment availability on the bed correlated with sediment transport rate fluctuations and evolving thresholds, suggesting that thresholds depend on upstream sediment supply. For the same stream, Masteller et al. (2019) showed that the magnitude of antecedent flows also influenced the evolution of for individual years. Consistent with experiments, Masteller et al. (2019) observed that the start of transport events showed increases in critical Shields stress with increasing inter-event flow magnitude (herein termed “strengthening”) for an intermediate range of flows spanning inter-event periods and floods with observable sediment transport. However, following even higher magnitude flows, the threshold for motion decreased (herein termed “weakening”). Masteller et al. (2019) hypothesized that the transition from bed strengthening to bed weakening was associated with a transition from local rearrangement of particles to more intense transport disrupting bed structure via particle collisions, and/or enhanced upstream sediment supply through upstream bed erosion (Yager et al., 2012), and/or enhanced hillslope–channel coupling (Golly et al., 2017). Thus, both flow strength and sediment supply likely influence thresholds of motion in the Erlenbach torrent (Rickenmann, 2020; Masteller et al., 2019; Turowski et al., 2011).
The ability to accurately predict threshold evolution through time – thereby improving bedload transport rate predictions – remains elusive due to a lack of validated models. Equations have been proposed to describe temporal bed strengthening as a function of the duration of bed exposure to a constant inter-event flow magnitude and an initial based on experimental data (e.g., Ockelford et al., 2019; Paphitis and Collins, 2005). However, because these models only focus on inter-event strengthening effects, they cannot capture decreases in . The model of Johnson (2016) predicts evolution as a function of changing sediment supply. Nonetheless, this model is an incomplete description of evolution because it does not account for riverbed strengthening or weakening directly caused by the flow. Notably, to our knowledge, none of these equations have been used to describe field observations of temporally varying .
Our goals in the present work are (i) to propose a new model in which evolves as a function of flow magnitude and encapsulates some memory of past shear stresses as reflected in the changing state of the riverbed and (ii) to evaluate whether this discharge-dependent model can capture annual strengthening and weakening trends observed in Erlenbach field data (Masteller et al., 2019). While sediment supply variations can also influence threshold evolution in general (Johnson, 2016), and in the Erlenbach in particular (Rickenmann, 2020), we explore how well threshold evolution can be predicted using only a time series of river discharge.
Johnson (2016) argued that is a “state variable” for gravel-bed river morphodynamics because it simultaneously controls transport rates and evolves due to feedbacks with fluid shear stresses and transport rates. Our new equations take a similar form to Johnson (2016), where changes in depend not only on discharge-dependent shear stress but also on the current state of the transport system as characterized by itself. The rate of change in depends on two terms, which both evolve as a function of the transport capacity, . Conceptually, the first right-hand-side term (starting with k1) represents strengthening processes that increase , while the second term (starting with k2) represents weakening processes that reduce :
where t is time, and
The scaling factor k1 and exponent γ influence the form and magnitude of the strengthening term, while k2 and ε do the same for the weakening term (Fig. 1); these parameters are empirically calibrated below. Both k1 and k2 have units of 1/time, where the units of time will depend on the time step of the discharge time series used as model input. H is the Heaviside step function ( for ; for ) such that weakening only occurs when transport occurs () (Fig. 1a). B is called the “feedback parameter,” described below. and are upper and lower bounds imposed on , representing physical limits for how loosely packed and mobile, or tightly packed and immobile, the bed surface can become (Johnson, 2016).
The strengthening and weakening terms combine to cause increases and decreases in (Eq. 1; Fig. 1). The strengthening term is generally sigmoidal for γ>1; it goes to zero as τ∗ approaches zero, and asymptotes to a value of k1B for (Fig. 1a). We chose a sigmoidal form to allow strengthening over a wide range of flows but also limit the amount of incremental strengthening that can result from changes in grain organization at higher transport capacities. When , flow causes the bed to become stronger but not weaker, consistent with previous observations (Haynes and Pender, 2005; Masteller et al., 2019; Masteller and Finnegan, 2017; Monteith and Pender, 2005; Ockelford et al., 2019). Strengthening increases as approaches 1, consistent with some (Paphitis and Collins, 2005) but not all previous work (Haynes and Pender, 2007). Strengthening increases further for , consistent with protrusion-dependent thresholds (Masteller and Finnegan, 2017, Yager et al., 2018; Masteller et al., 2019) and with coarse grain clustering, which increases bed stability and requires transport to develop (Brayshaw, 1985; Church et al., 1998; Hassan et al., 2020; Johnson, 2017; Strom et al., 2004).
At the same time, as exceeds 1, the weakening term becomes increasingly important (Eq. 1; Fig. 1). In the absence of other constraints on the functional form of weakening with increasing , we chose a power-law relation for simplicity. It seems likely to us that beds rapidly lose their strength as transport rate increases and fewer grains are interlocked through intergranular friction (Yager et al., 2018). Higher shear stresses capable of mobilizing more sediment grains can destabilize a larger fraction of the bed. Impacts from transported grains may also directly contribute to destabilization (Ancey and Heyman, 2014; Heyman et al., 2014; Lee and Jerolmack, 2018; Martin et al., 2014). Nonetheless, we note that Eq. (1) is agnostic towards any specific processes driving strengthening and weakening. The combination of terms results in the transition from strengthening to weakening occurring at different , depending on γ, ε, k1, k2, and (Fig. 1b).
B is considered a “feedback parameter” because it contributes to being a function of (Johnson, 2016). B has a value between 0 and 1, and changes the importance of the strengthening and weakening terms, depending on the current value of relative to and . A loosely packed bed, with close to and B close to 1, can strengthen significantly in a low flow (increasing ), but a high flow would not cause a significant decrease in because the bed is already relatively weak. Conversely, a bed that was nearly as tightly packed as physically possible, with close to and B close to 0, will minimally increase in response to a low flow, but a destabilizing flood would cause a significant decrease in (Johnson, 2016).
To estimate the range of possible and values, we use a compilation of as a function of channel reach slope (Johnson, 2016; Lamb et al., 2008; Prancevic and Lamb, 2015). A best-fit power-law regression of the compiled data gives , with R2=0.41 where S is channel reach slope (an approximation of energy or water surface slope). The constant is included so that the function asymptotes to a physically reasonable value (i.e., ) as slope approaches zero. Field and flume data were weighted equally in the nonlinear best-fit regression, removing possible bias from there being ∼3.5 times more flume data points. We then visually determined the following minimum and maximum bounds to accommodate almost all compilation data points, assuming the same best-fit exponent (0.7).
These empirical and relations capture the slope dependence of gravel thresholds of motion compiled in both flume and field settings. Equations (1) and (2) assume that and are limits that the threshold can approach but does not reach due to the feedbacks implemented by the B parameter. Equations (1) and (2) are only defined between these bounds. We acknowledge that many factors beyond slope may influence the possible range of at a given site, including grain size distributions (e.g., Parker, 1990) and differences in relative roughness (Buffington and Montgomery, 1997; Schneider et al., 2015). In the absence of independent constraints on and that could be used to describe a particular field site, the compilation should reasonably represent the range of possible values.
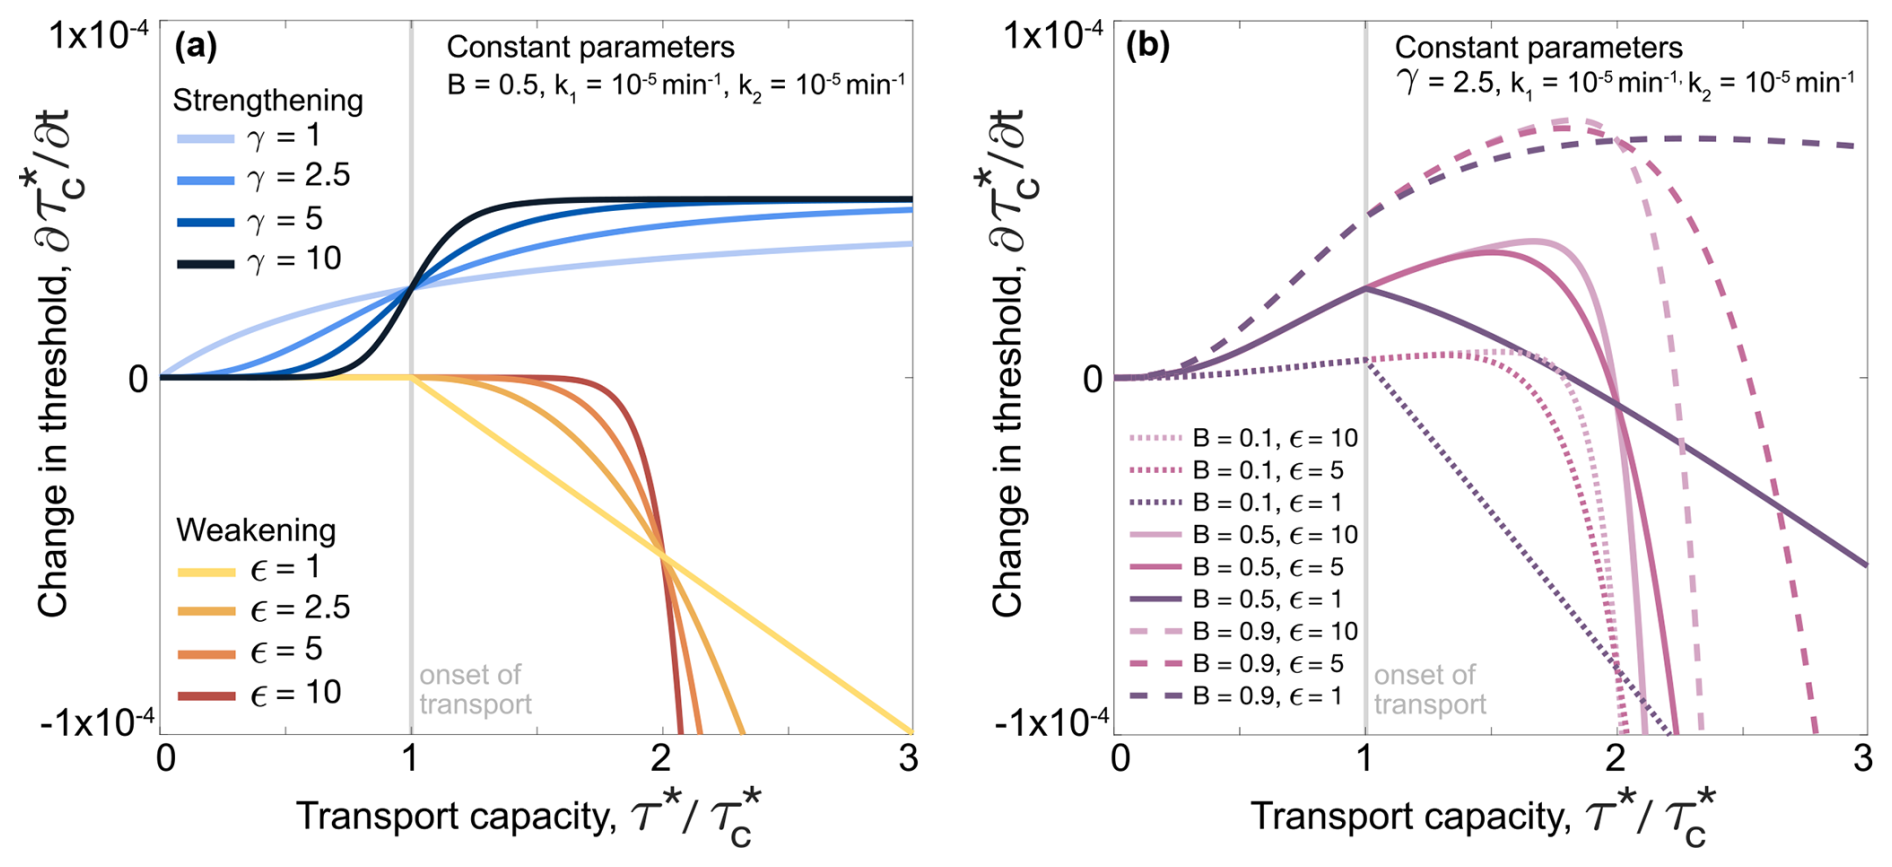
Figure 1(a) Predicted change in threshold for strengthening (blue) and weakening (red) terms for a range of γ and ε values. k1, k2, and B are constant. (b) Predicted change in threshold for the full model for different B and ε. k1, k2, and γ are held constant. This example uses Erlenbach values calculated as and using Eqs. (3) and (4).
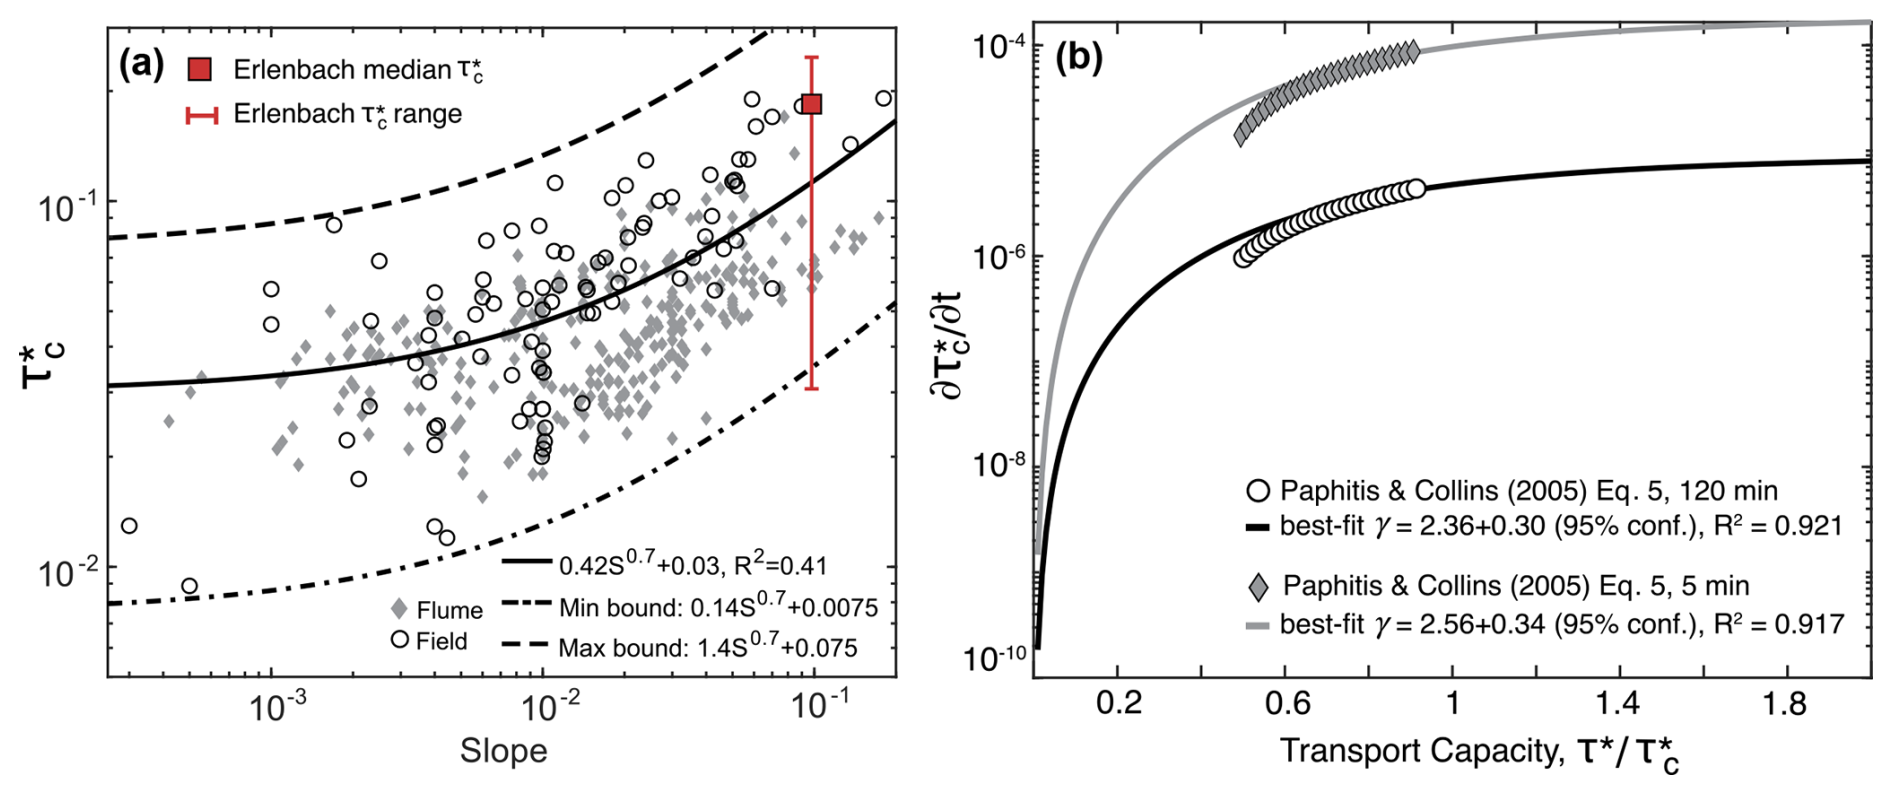
Figure 2(a) Compiled data as a function of slope from both field studies (gray diamonds) and flume experiments (open circles). The range of from the Erlenbach field site is plotted in red. Compiled data are limited to slopes S<0.2 and median grain sizes D50≥2 mm. Most data were compiled by Prancevic and Lamb (2015), building on Buffington and Montgomery (1997), with additional data from Olinde (2015) and Lenzi et al. (2006). (b) Calibration of strengthening term exponent, γ, based on Paphitis and Collins (2005) for both the shortest conditioning time (5 min) and the longest conditioning time (120 min) spanned by the Paphitis and Collins (2005) data. Regressions to their best-fit empirical equation give gamma exponents within uncertainty of each other.
We calibrated γ using experimental data from Paphitis and Collins (2005) to reduce the number of free parameters in the model (i.e., γ, ε, k1, k2). Paphitis and Collins (2005) conducted experiments using fine, medium, and coarse sand, in which they systematically varied the conditioning time (ED, the duration of flow below the threshold condition) between 5 and 120 min and the ratio of shear velocity (uτ) to initial critical shear velocity (uτci). The ratios of shear velocities they explored were between 70 % and 95 % of critical, which corresponds to conditioning flow shear stresses between 50 % and 90 % of the initial critical shear stress. Based on their experimental results, they presented the following equation to describe their data:
for and ED≤120 min, where uτc(t) is the critical shear velocity following low-flow conditioning. Paphitis and Collins (2005) reported that this function fit their experimental data with a correlation coefficient of 0.83 (i.e., R2=0.69).
To calibrate γ, we calculate , for a range of ED and uτ, using values of uτci reported for their coarse sand (D=0.774 mm) experiments, corresponding to an initial critical shear velocity of uτci=0.0195 m s−1. We then square to convert to a Shields stress ratio (i.e., , where the i subscript indicates the initial value and τc and evolve through time). We then numerically calculate the partial derivative of Eq. (5) with respect to time, . Figure 2b shows a nonlinear regression (using MATLAB's cftool) of the strengthening term in our model (Eq. 1) to calculated from Eq. (5). This regression provides a best-fit estimate of γ, including empirical regression uncertainties. For below-threshold conditions explored in the Paphitis and Collins (2005) experiments, the weakening term in Eq. (1) is zero. Given this, the calibration of γ described here is not influenced by other model parameters, particularly the weakening exponent ε. Our reported 95 % confidence interval on γ only represents the empirical regression uncertainty when fitting our function to Eq. (5). Therefore, it is likely that a somewhat wider range of γ may be able to fit the range of the experimental data from Paphitis and Collins (2005), and the true range of possible values may be somewhat larger than 2.5±0.32.
We use the data and fitting function of Paphitis and Collins (2005) to calibrate γ because it is the most complete and internally consistent dataset that we are aware of with sufficient constraints to describe the evolution of as a function of both transport capacity and time. Nonetheless, a possible limitation of applying these experimental data to calibrate our model is that the Paphitis and Collins (2005) experiments were conducted with unimodal sand. Specifically, boundary Reynolds numbers in their experiments are transitional between hydraulically smooth and hydraulically rough flow. For the coarsest grains they use (D50=0.0774 mm), the boundary Reynolds number , where ks is a roughness length scale assumed to be D50 and υ is the kinematic viscosity of water. If ks were instead assumed to be a multiple of D50 (such as ks=3.5D84), then Rew would be closer to the hydraulically rough flow criteria of Rew≥100. It is also worth noting that grain size did not explicitly factor into Eq. (5) beyond its implicit control on uτci. The insensitivity of their results to grain size suggests that the results may not depend significantly on grain size or on hydraulically rough flow being fully developed. Furthermore, converting critical shear velocities from their coarse sand experiments to critical Shields stress yields , consistent with typical critical Shields stresses reported at low slopes (consistent with their experiments) for gravel river datasets (Fig. 2a).
The Erlenbach is a small (0.7 km2 watershed), steep (10 % grade) channel in the Swiss Prealps. Bedload transport has been actively monitored for over 30 years by a variety of methods (Beer et al., 2015; Rickenmann, 2020; Rickenmann et al., 2012; Rickenmann and McArdell, 2007). Previous analyses have shown that the threshold for motion varies over 1 order of magnitude across the span of the record (Masteller et al., 2019; Turowski et al., 2011). Masteller et al. (2019) demonstrated that seasonal trends in were unlikely to be random and that threshold evolution depends, in part, on the magnitude of past flows.
Our goal is to evaluate how well discharge-dependent Shields stress variations alone (Eqs. 1 and 2) capture first-order seasonal trends in evolving from well-constrained field data. We utilize publicly available 10 min interval discharge and bedload transport records from the Erlenbach over the last 23 years (Rickenmann et al., 2020). To calculate thresholds of motion for model comparison, we measure the discharge when the in-channel impact plate system registers grain collisions near the beginning of a flow event, following Turowski et al. (2011). Thus, the threshold data are independent of any bedload transport model. Using a rating curve from discharge to shear stress developed by Yager (2006) and a median grain size, D50=8 cm (Wyss et al., 2016), the flow and transport time series were nondimensionalized to Shields stress. The median grain size is assumed not to have changed systematically across the Erlenbach record (as discussed by Masteller et al., 2019), although hillslope sediment supply may cause grain size variability both during and in between transporting events.
Critical Shields stresses at the start of transport vary by almost 1 order of magnitude in (0.03 to 0.26). The temporal variability in observed at the Erlenbach is equivalent to the full range of observed in flume and field data for equivalent slopes (Fig. 2a). Strengthening (i.e., a systematic increase in for at least some portion of a given year) is dominant in 10 of the 23 years (see Masteller et al., 2019) and weakening is dominant in 3 years (1992, 2014, 2015), while the remaining 10 years show both behaviors (Fig. 3e–h).
We implement the model separately to each year's flow time series, from the first transporting event in the spring through the fall (following Masteller et al., 2019). We do not calibrate to the single continuous multi-year discharge and transport record because the bulk of landsliding occurs during the winter months, supplying largely unconstrained amounts of sediment to the channel bed from hillslope processes (Schuerch et al., 2006). Hillslope sediment supply variations also occur during the rest of the year and likely influence thresholds and transport rates both during and in between the transporting events we consider (e.g., Rickenmann, 2020, 2024). As possible evidence of sediment supply effects during inter-event periods, Turowski et al. (2011) found that threshold discharges were often, though not always, lower at the start of a given flow event compared to the discharge at the cessation of bedload transport at the end of the previous event. This inter-event weakening cannot be captured by the model. Because the model cannot predict every trend in the field data, we focus on the start of events only to evaluate how well discharge variations alone can improve transport predictions over seasons, consistent with the analysis of Masteller et al. (2019). Future analyses could focus on threshold evaluation and model calibration during individual flood events.
Equation (1) has four free parameters: k1, k2, γ, and ε. We assign γ=2.5 based on our calibration to Paphitis and Collins (2005) (Fig. 2b). This leaves three parameters that require calibration. For each year, we explored a range of parameter combinations for k1 ( to min−1, n=40), k2 ( to min−1, n=40), and ε (1 to 10, n=10). k1 and k2 were varied with log-spacing to explore all orders of magnitude equivalently. For each year of the dataset, we ran 16 000 forward simulations, reflecting all unique parameter combinations of k1, k2, and ε. For each year, we assign an initial value as equal to the observed at the first transport event and calculate changes in based on 10 min discharge data until the end of the final observed transport event.
We determined the best-fit parameter combinations that minimized mean absolute error (MAE) to data for each year. We use MAE (rather than RMSE) to reduce the influence of any single large difference between the continuous model predictions and field-based data points which exhibit large amounts of scatter. The field data points only represent the discrete start of each event. “Annual” calibrations represent the best-fit parameters for each year. The “combined” calibration represents the single best-fit k1, k2, and ε values which minimize MAE when MAE is averaged across all sample years, with each year weighted equally. We compare both the annual and combined best-fit model to a constant (mean Erlenbach , SE = 0.0014).
The annual calibrations show that, for all 23 years, Eq. (1) provides a better fit to the data (lower MAE) than the mean Erlenbach threshold, (Fig. 3a). Annual best-fit MAE ranges from 0.0046 (2015) to 0.0293 (1990). The mean MAE = 0.0149 from the annual calibrations is less than the mean MAE = 0.0254 when applying a constant . Annual best-fit values for k1 ranged from to min−1 with a mean value of min−1 (Fig. 3b). In contrast, annual best-fit k2 values spanned the entire parameter range ( to 10−2 min−1) with mean min−1 (Fig. 3c). Best-fit annual ε values also spanned the full range of parameter values explored (1 to 10) (Fig. 2c), with mean ε=6 when calculated with each year weighted equally.
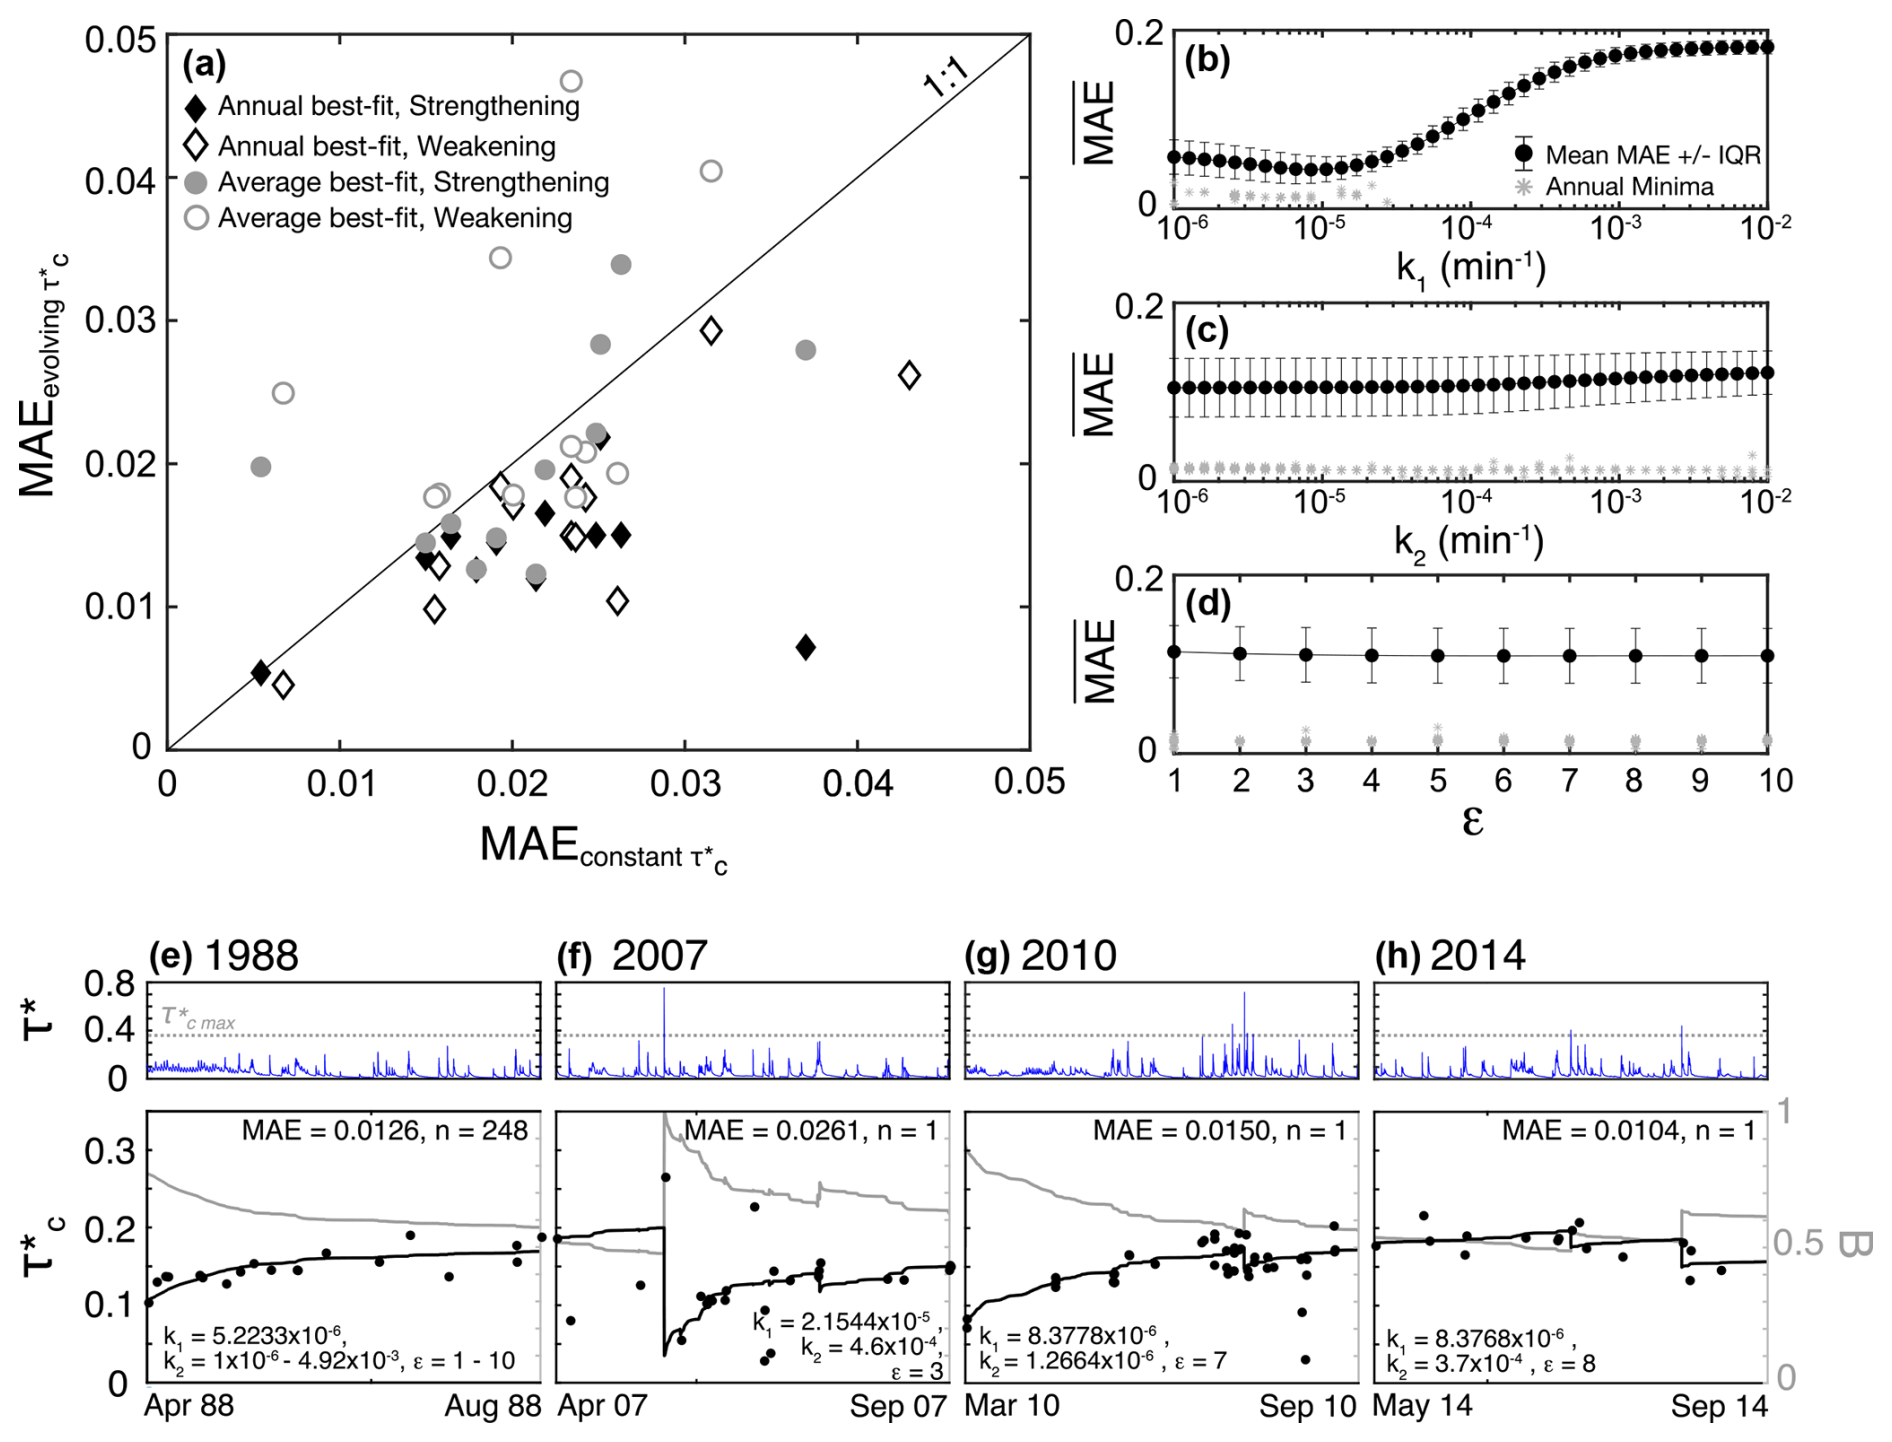
Figure 3(a) Comparison of MAE fits for constant and evolving values compared to data from the Erlenbach for both annually calibrated and combined calibration models. (b–d) Median and interquartile range of MAE for model runs binned by (b) k1, (c) k2, and (d) ε parameters. All annual minimum MAE values and associated parameters are indicated by gray stars. In the event of multiple parameter combinations yielding the minimum MAE (see Discussion), all parameter combinations are plotted. (e–h) Comparison of field data (black dots represent at the start of each transporting event) to the best-fit model(s). Example years with (e) strengthening only (1988); (f) dominantly weakening, with strengthening as well (2007); (g) dominantly strengthening, with weakening as well (2010); and (h) dominantly weakening (2014). Upper panels show the flow time series for each year in blue; the model parameter is also indicated. The feedback parameter B is shown for each year (right-hand y axis). “n” gives the number of models (i.e., parameter combinations) that minimize MAE and provide an equivalent best fit to the data. Annual best-fit parameters are also specified.
The single best-fit value from the combined MAE analysis was also ε=6, with best-fit min−1 and min−1. These best-fit ε, k1, and k2 values are consistent when averaging MAE across all years and when only averaging for the 8 years with predicted weakening behavior (defined as years with step drops in %). Model runs using the combined best-fit parameters only perform better than the constant assumption in 12 out of 23 sample years (mean MAE = 0.217) (Fig. 3a). Both annual and combined model performance are generally better for years which only have strengthening, as evidenced by annual mean MAE = 0.0135 (combined mean MAE = 0.0202) for these years compared to years with observed weakening (annual mean MAE = 0.0163; combined mean MAE = 0.0301). In 11 years, multiple combinations of parameters resulted in the same minimum MAE value. Most of these years only have systematic strengthening, not weakening, so models are relatively insensitive to k2 and ε values, allowing a range of best-fit model parameterizations. The field data tend to be more variable in years with weakening; nonetheless, the calibrated model captures first-order annual trends across a range of scenarios (Figs. 3e–h, S1 in the Supplement). Across all examples, the dominance of the strengthening effects is demonstrated by B>0.5.
Comparison of mean MAE values of all model runs as a function (k1, k2, and ε) elucidates the relative sensitivity of model performance to each parameter (Fig. 3b–d). Model performance was most sensitive to k1 for the parameter space we explored, with mean MAE values ranging from a minimum value of MAE = 0.0438 at min−1 to MAE = 0.181 at min−1, reflecting the clustering of best-fit k1 values (Fig. 3b). We note that γ=2.5 was independently calibrated; it is possible that, if our analysis also explored a range of γ values, the range of acceptable k1 may be broader. In contrast, mean MAE values are higher and less variable when binned by k2 (MAE = 0.105–0.122) and ε (MAE = 0.109–0.114), suggesting that annual model performance is less sensitive to variations in these parameters (Fig. 3b, c).
6.1 Model performance
Our flow history model for (Eqs. 1, 2) performs better than a constant entrainment threshold, as indicated by lower MAE between data and model (Fig. 3a). The model captures both first-order strengthening and weakening trends seen in the field data. These include progressive increases in from lower discharges (Fig. 3e), to sudden decreases in following a large flood early in the season (Fig. 3f), to a smaller decrease in following a late-season flood after the riverbed may have had more time to strengthen (Fig. 3g), to intermittent but repeated weakening events across a season (Fig. 3h). When each year is calibrated separately (“annual” calibration), the model unsurprisingly performs better than when using the single set of parameters that minimizes MAE averaged across all years (“combined” calibration). Nonetheless, the “combined” best-fit parameters still outperformed a constant assumption in a majority of years – particularly those with seasonal strengthening trends.
Calibrated model performance varies most with k1, which governs the efficacy of strengthening processes (Fig. 3b, Eq. 1). γ also influences strengthening but was independently calibrated and held constant in our analysis (γ=2.5; Fig. 2b). At the Erlenbach, sediment-transporting flood events only comprise about 2 % of the discharge record (Masteller et al., 2019). Thus, weakening parameters k2 and ε can only influence evolution during this portion of the record, when (Eq. 1). More generally, the transport capacity ( at which the model terms combine to transition from overall strengthening to weakening varies for different parameter combinations (Fig. 1). In years without large floods, the strengthening term of Eq. (1) dominates for most of the year, resulting in steady increases in , such as in 1988, when floods did not exceed (Fig. 3e). Therefore, best-fit models for 1988 were insensitive to k2 and ε, resulting in 248 parameter combinations that minimized MAE (Fig. 3e).
Bedload is transported infrequently in gravel-bed rivers because transport thresholds are rarely exceeded. Much of bedload transport occurs during discharges that are often relatively close to bankfull and when shear stresses only slightly to moderately exceed (e.g., Emmett and Wolman, 2001; Parker, 1978; Phillips and Jerolmack, 2016; Pretzlav et al., 2020; Whiting et al., 1999). Therefore, weakening processes, which in our model only occur when , can only reduce for a limited fraction of the full discharge record. Thus, we may expect more generally that strengthening processes are dominant for most of the time in gravel riverbeds relative to weakening processes that may only occur during floods. However, despite strengthening being active for the vast majority of the discharge record, the approximately normal distribution of suggests that weakening processes must act more rapidly than strengthening processes to maintain values of intermediate between and . Future work could further explore the consequences of this difference in the total time over which strengthening and weakening processes may occur and their resultant impact on the time-averaged state of the riverbed, as reflected by distributions of . At the Erlenbach, the model is largely successful in matching annual strengthening trends (Fig. 3a, e–h) with a narrow distribution of best-fit k1 values and a single, independently calibrated value of γ=2.5. This suggests that the physical processes that are encapsulated in the strengthening term of Eq. (1) may lead to predictable changes in similar field settings (e.g., Church et al., 1998; Masteller and Finnegan, 2017; Ockelford and Haynes, 2013).
In contrast, calibrations of weakening parameters find much more variability in best-fit ε and k2, and MAE is higher for weakening years (Fig. 2a). Annual best-fit results span the full range of both parameters (Fig. 3c, d). High-magnitude floods that cause weakening are relatively rare and short-lived. It is possible that a dataset with many more discharge-driven weakening events could more narrowly constrain these variables. However, a simpler interpretation consistent with our analysis is that weakening is inherently less deterministic than strengthening and therefore more difficult to predict accurately. Weakening events can be de-coupled from flow, for example, if hillslopes supply sediment to the channel during inter-event periods, leading to a reduction in at low discharge. Indeed, Masteller et al. (2019) identified a minimum discharge for inter-event strengthening, below which becomes uncorrelated with flow magnitude. This loss of correlation could reflect instances where supply effects introduce event-scale variability in . While we focus on evaluating a discharge-driven model for , it is not intended to fully address all factors influencing variability in . The discrepancies between observed and model predictions may highlight conditions where sediment supply significantly alters bed mobility, outweighing the flow history effects that are addressed here.
Figure 3e–h illustrates how feedback parameter B controls how changes in response to a given shear stress. Low (such as at the starts of 1988 and 2010 and following the large 2007 flood) corresponds to high B, which increases the strengthening term and reduces the weakening term (Eqs. 1, 2). As relatively smaller shear stresses lead to progressive strengthening, increases, B decreases, and less strengthening occurs for a given increment of Shields stress, resulting in a gradual rollover in the rate of strengthening through time (e.g., Fig. 3e). Model response (i.e., ) is also influenced by through changes in transport capacity. For example, under strengthening conditions, even if τ∗ remains constant, increasing would cause a gradual decrease in , slowing the rate of strengthening.
Thus, the “memory” in this model is represented by the value of , which integrates the effects of the history of both flow conditions and channel bed conditions. Model memories tend to be asymmetric through time in the sense that floods large enough to cause significant weakening will rapidly reset the memory to lower values; strengthening can only occur gradually, as it requires the cumulative effects of lower discharges over time. Conceptually, these memory effects relate to being a state variable for gravel-bed channels (Johnson, 2016). For the Erlenbach, our results using the calibrated model demonstrate that knowing prior to a given flood improves the prediction of transport during that flood. We view this model as a step towards a more complete understanding of mountain river morphodynamics. Our calibrated equation should be useful for improved modeling of channel transport and evolution and as a component of landscape evolution modeling. When high-resolution discharge data are available for field sites, incorporation of a flow-dependent may improve quantitative predictions of transport in gravel-bed rivers, although calibration to local conditions is likely necessary.
6.2 Model implementation beyond the Erlenbach
The calibration that we have performed here leverages an extensive dataset of direct measurements of . While similar datasets are available for a small subset of rivers (e.g., Turowski et al., 2011), most gravel-bed rivers lack time series data of . However, we find that the range of temporal variability observed in our calibration dataset is consistent with the existing data compilations of across a range of slopes (Fig. 2a), suggesting that these data compilations may provide reasonable preliminary constraints of minimum and maximum bounds on in future applications of the model. Reach-averaged starting values of could be estimated based on bed grain size and bankfull geometry. Additional model calibration will vary depending on the intended application of the equation. Calibration of the model over approximately 30 transport events may be needed to reliably capture the expected variability in . This assumes that are normally distributed, as observed at the Erlenbach by Masteller et al. (2019). However, the commonly used minimum sample size of 30 to characterize normal distributions also assumes independent observations, which does not apply here. An alternative approach could be to calibrate the model based on the number of subsequent events over which remains correlated. Masteller et al. (2019) also found a loss of correlation between values after 10–13 transport events. This number of events may be sufficient to calibrate the model to capture the trajectory of over time. We recognize that requiring 10–30 measurements of may not always be feasible. Future studies should assess the necessary level of calibration for different applications. Further research is needed to evaluate the potential variability in the k1, k2, and ε parameters especially.
Perhaps the biggest mechanistic limitation of our model is that it only accounts for discharge controls on evolving thresholds, even though sediment supply has also been shown to explicitly influence transport rates in the Erlenbach data (Turowski et al., 2011, Rickenmann, 2020, 2024). In flumes, it is straightforward to impose the upstream sediment supply, measure the flux exiting the flume, and simultaneously measure changes along the flume bed (e.g., surface grain size distributions), allowing thresholds to be evaluated through time as a function of supply (e.g., Johnson, 2016). While it is possible to constrain temporal variations in upstream sediment supply in field settings (e.g., Hassan and Church, 2001; Rickenmann, 2020), these data are far more difficult to measure and less widely available than discharge time series for gravel-bed rivers. We are unaware of field monitoring sites that directly measure comparable time series of transport data in sequential channel reaches, making it difficult to directly isolate supply controls on threshold evolution in gravel-bed rivers. Some sources of sediment supply into a given channel reach, such as shallow landslides a short distance upstream not triggered by recent precipitation, may be uncorrelated with channel discharge. However, the timing and magnitude of many processes that supply sediment to channels, such as bank failures, debris flows, and shallow landslides driven by recent precipitation, are likely correlated with time series of channel discharge (Turowski et al., 2013). In addition, sediment supplied from farther upstream in a watershed is transported into a given reach by channel flow. Seasonal trends in supply (such as from increased hillslope deposition during winter months), followed by subsequent snowmelt or storm flow that progressively transports the sediment (e.g., Moog and Whiting, 1998; Mao et al., 2014), may cause threshold evolution that correlates with cumulative seasonal discharge (e.g., Pretzlav et al., 2020). In other words, discharge and upstream sediment supply are not entirely independent over the timescales of threshold evolution due to floods. Given these correlations between sediment supply delivered to a channel reach from upstream and discharge, the local discharge time series may be able to implicitly account for some temporal variations in local supply and therefore may be able to explain some supply-dependent variability. The degree of correlation between supply time series and discharge time series would likely vary among watersheds based on dominant processes. Future work should attempt to disentangle how sediment supply influences parameter calibrations.
Nonlocal controls on sediment transport will fundamentally limit how well local discharge time series can explain local sediment transport rate. Previous work demonstrates that bedload transport is a nonlocal process because the flux at a location within the channel reflects not only local conditions but also spatial and temporal variations in the flow and sediment flux from upstream (e.g., Foufoula-Georgiou and Stark, 2010; Furbish et al., 2017; Martin et al., 2012). Variability from nonlocality limits the accuracy of all models for calculating bedload flux at a specific location based on local shear stress. This challenge is not unique to our threshold evolution equation. Local flux models also cannot capture spatial and temporal grain dispersion, which is as important as advection for understanding bedload transport through river networks and responses to perturbations (e.g., Bradley, 2017; Pretzlav et al., 2021; Fan et al., 2016). Our model could be applied to better determine the extent to which threshold variability (and associated transport rate variability) is a deterministic function of discharge (as Eq. 1 attempts to represent) and how much of the local transport rate signal is stochastic variability, influenced by a variety of interrelated factors including nonlocality and sediment supply. Future work could also explore how the “memory” of past conditions at a given location, imperfectly encoded in , depends on both local discharge variability and nonlocal supply effects.
Our study presents a flow-history-dependent model for critical Shields stress (Eqs. 1, 2). Calibrated using a 23-year record of river flow and the onset of sediment transport events, our model successfully captures observed trends in evolution at our field site, including seasonal strengthening, rapid weakening following large floods, and gradual riverbed recovery over time. While strengthening processes appear to be relatively predictable across different years, weakening mechanisms exhibit greater variability, likely due to the stochastic nature of high-magnitude floods and external sediment supply effects. Despite these uncertainties, our results demonstrate that accounting for flow history effects by evolving has the potential to significantly improve predictions of sediment mobility and bedload transport compared to a constant transport threshold.
Building on the development and calibration of the model described in this contribution, the best-fit model parameter values found in our study could be used as specific predictions to be independently tested using other field and flume data; we do not yet know how consistent model parameters may be across gravel-bed channels. Model performance could also be assessed at the scale of individual events using continuous bedload measurements, rather than just thresholds at the start of events as done here. The model does not try to isolate granular interaction-based processes that likely cause strengthening and weakening but rather lumps processes together using empirical parameters. Quantifying the systematics, inherent variability, and dominant processes involved in bed weakening warrants additional study. We suggest that a combination of discharge-based controls on (as explored here) and sediment supply controls on (e.g., Recking, 2012; Johnson, 2016; Rickenmann, 2020; Rickenmann, 2024) may be able to explain much of the deterministic variability in threshold evolution and sediment transport rates in gravel-bed rivers.
A working version of the code used to complete the model runs and associated best-fit model runs and a summary of MAE values for all model runs produced during this research are publicly available on Zenodo (https://doi.org/10.5281/zenodo.15178239; Masteller, 2025). Due to the file upload limits of Zenodo, additional model runs are available by request to the corresponding author.
The discharge and sediment transport time series data from the Erlenbach are publicly available at https://doi.org/10.16904/envidat.459 (Rickenmann et al., 2020).
The supplement related to this article is available online at https://doi.org/10.5194/esurf-13-593-2025-supplement.
JJ and CM formulated the concept of the study and the state function, with input from JMT and DR. CM completed the model runs, calibration, and error analysis. Field data were collected and provided by DR and JMT. The article was written by CM with contributions from all authors.
At least one of the (co-)authors is a member of the editorial board of Earth Surface Dynamics.
Publisher's note: Copernicus Publications remains neutral with regard to jurisdictional claims made in the text, published maps, institutional affiliations, or any other geographical representation in this paper. While Copernicus Publications makes every effort to include appropriate place names, the final responsibility lies with the authors.
Figure 1 utilizes perceptually uniform scientific color maps (Crameri et al., 2020). We greatly appreciate thoughtful reviews by Elowyn Yager and Shawn Chartrand.
This paper was edited by Anne Baar and reviewed by Elowyn Yager and Shawn Chartrand.
Ancey, C. and Heyman, J.: A microstructural approach to bed load transport: mean behaviour and fluctuations of particle transport rates, J. Fluid Mech., 744, 129–168, https://doi.org/10.1017/jfm.2014.74, 2014.
Beer, A. R., Turowski, J. M., Fritschi, B., and Rieke-Zapp, D. H.: Field instrumentation for high-resolution parallel monitoring of bedrock erosion and bedload transport, Earth Surf. Process. Landf., 40, 530–541, https://doi.org/10.1002/esp.3652, 2015.
Blom, A., Arkesteijn, L., Chavarrías, V., and Viparelli, E.: The equilibrium alluvial river under variable flow and its channel-forming discharge, J. Geophys. Res.-Earth Surf., 122, 1924–1948, https://doi.org/10.1002/2017JF004213, 2017.
Bradley, D. N.: Direct observation of heavy-tailed storage times of bed load tracer particles causing anomalous superdiffusion, Geophys. Res. Lett., 44, 12227–12235, https://doi.org/10.1002/2017GL075045, 2017.
Brayshaw, A. C.: Bed microtopography and entrainment thresholds in gravel-bed rivers, GSA Bulletin, 96, 218–223, https://doi.org/10.1130/0016-7606(1985)96<218:BMAETI>2.0.CO;2, 1985.
Buffington, J. M. and Montgomery, D. R.: A systematic analysis of eight decades of incipient motion studies, with special reference to gravel-bedded rivers, Water Resour. Res., 33, 1993–2029, https://doi.org/10.1029/96WR03190, 1997.
Chen, L. and Stone, M. C.: Influence of bed material size heterogeneity on bedload transport uncertainty, Water Resour. Res., 44, W01405, https://doi.org/10.1029/2006WR005483, 2008.
Church, M., Hassan, M. A., and Wolcott, J. F.: Stabilizing self-organized structures in gravel-bed stream channels: Field and experimental observations, Water Resour. Res., 34, 3169–3179, https://doi.org/10.1029/98WR00484, 1998.
Crameri, F., Shephard, G. E., and Heron, P. J.: The misuse of colour in science communication, Nat. Commun., 11, 5444, https://doi.org/10.1038/s41467-020-19160-7, 2020.
DiBiase, R. A. and Whipple, K. X.: The influence of erosion thresholds and runoff variability on the relationships among topography, climate, and erosion rate, J. Geophys. Res., 116, F04036, https://doi.org/10.1029/2011JF002095, 2011.
Dietrich, W. E., Kirchner, J. W., Ikeda, H., and Iseya, F.: Sediment supply and the development of the coarse surface layer in gravel-bedded rivers, Nature, 340, 215–217, https://doi.org/10.1038/340215a0, 1989.
Downs, P. W. and Soar, P. J.: Beyond Stationarity: Influence of Flow History and Sediment Supply on Coarse Bedload Transport, Water Resour. Res., 57, e2020WR027774, https://doi.org/10.1029/2020WR027774, 2021.
Emmett, W. W. and Wolman, M. G.: Effective discharge and gravel-bed rivers, Earth Surf. Process. Landf., 26, 1369–1380, https://doi.org/10.1002/esp.303, 2001.
Engelund, F. and Fredsoe, J.: A Sediment Transport Model for Straight Alluvial Channels, Nord. Hydrol., 7, 293–306, https://doi.org/10.2166/nh.1976.0019, 1976.
Fan, N., Singh, A., Guala, M., Foufoula-Georgiou, E., and Wu, B.: Exploring a semimechanistic episodic Langevin model for bed load transport: Emergence of normal and anomalous advection and diffusion regimes, Water Resour. Res., 52, 2789–2801, https://doi.org/10.1002/2015WR018023, 2016.
Foufoula-Georgiou, E. and Stark, C.: Introduction to special section on Stochastic Transport and Emergent Scaling on Earth's Surface: Rethinking geomorphic transport – Stochastic theories, broad scales of motion and nonlocality, J. Geophys. Res., 115, F00A01, https://doi.org/10.1029/2010JF001661, 2010.
Furbish, D. J., Fathel, S. L., and Schmeeckle, M. L.: Particle Motions and Bedload Theory: The Entrainment Forms of the Flux and the Exner Equation, in: Gravel-bed rivers, Wiley-Blackwell, 97–120, https://doi.org/10.1002/9781118971437.ch4, 2017.
Golly, A., Turowski, J. M., Badoux, A., and Hovius, N.: Controls and feedbacks in the coupling of mountain channels and hillslopes, Geology, 45, 307–310, https://doi.org/10.1130/G38831.1, 2017.
Gran, K. B., Montgomery, D. R., and Sutherland, D. G.: Channel bed evolution and sediment transport under declining sand inputs, Water Resour. Res., 42, W10407, https://doi.org/10.1029/2005WR004306, 2006.
Hassan, M. A. and Church, M.: Sensitivity of bed load transport in Harris Creek: Seasonal and spatial variation over a cobble-gravel bar, Water Resour. Res., 37, 813–825, https://doi.org/10.1029/2000WR900346, 2001.
Hassan, M. A., Saletti, M., Johnson, J. P. L., Ferrer-Boix, C., Venditti, J. G., and Church, M.: Experimental Insights Into the Threshold of Motion in Alluvial Channels: Sediment Supply and Streambed State, J. Geophys. Res.-Earth Surf., 125, e2020JF005736, https://doi.org/10.1029/2020JF005736, 2020.
Haynes, H. and Pender, G.: Flume investigation into the influence of shear stress history, Water Resour. Res., 41, W12401, https://doi.org/10.1029/2005WR004297, 2005.
Haynes, H. and Pender, G.: Stress History Effects on Graded Bed Stability, J. Hydraul. Eng., 133, 343–349, https://doi.org/10.1061/(ASCE)0733-9429(2007)133:4(343), 2007.
Heyman, J., Ma, H. B., Mettra, F., and Ancey, C.: Spatial correlations in bed load transport: Evidence, importance, and modeling, J. Geophys. Res.-Earth Surf., 119, 1751–1767, https://doi.org/10.1002/2013JF003003, 2014.
Hodge, R. A., Sear, D. A., and Leyland, J.: Spatial variations in surface sediment structure in riffle-pool sequences: a preliminary test of the Differential Sediment Entrainment Hypothesis (DSEH): Spatial Variations in Sediment Structure in Riffle-Pool Sequences, Earth Surf. Process. Land., 38, 449–465, https://doi.org/10.1002/esp.3290, 2013.
Hodge, R. A., Voepel, H., Leyland, J., Sear, D. A., and Ahmed, S.: X-ray computed tomography reveals that grain protrusion controls critical shear stress for entrainment of fluvial gravels, Geology, 48, 149–153, https://doi.org/10.1130/G46883.1, 2019.
Hsu, L., Finnegan, N. J., and Brodsky, E. E.: A seismic signature of river bedload transport during storm events, Geophys. Res. Lett., 38, L13407, https://doi.org/10.1029/2011GL047759, 2011.
Johnson, J. P. L.: Gravel threshold of motion: a state function of sediment transport disequilibrium?, Earth Surf. Dynam., 4, 685–703, https://doi.org/10.5194/esurf-4-685-2016, 2016.
Johnson, J. P. L.: Clustering statistics, roughness feedbacks, and randomness in experimental step-pool morphodynamics, Geophys. Res. Lett., 44, 3653–3662, https://doi.org/10.1002/2016GL072246, 2017.
Kirchner, J. W., Dietrich, W. E., Iseya, F., and Ikeda, H.: The variability of critical shear stress, friction angle, and grain protrusion in water-worked sediments, Sedimentology, 37, 647–672, https://doi.org/10.1111/j.1365-3091.1990.tb00627.x, 1990.
Lague, D., Hovius, N., and Davy, P.: Discharge, discharge variability, and the bedrock channel profile, J. Geophys. Res., 110, F04006, https://doi.org/10.1029/2004JF000259, 2005.
Lamb, M. P., Dietrich, W. E., and Venditti, J. G.: Is the critical Shields stress for incipient sediment motion dependent on channel-bed slope?, J. Geophys. Res., 113, F02008, https://doi.org/10.1029/2007JF000831, 2008.
Lee, D. B. and Jerolmack, D.: Determining the scales of collective entrainment in collision-driven bed load, Earth Surf. Dynam., 6, 1089–1099, https://doi.org/10.5194/esurf-6-1089-2018, 2018.
Lenzi, M. A., Mao, L., and Comiti, F.: Magnitude-frequency analysis of bed load data in an Alpine boulder bed stream, Water Resour. Res., 40, W07201, https://doi.org/10.1029/2003WR002961, 2004.
Lenzi, M. A., Mao, L., and Comiti, F.: Effective discharge for sediment transport in a mountain river: Computational approaches and geomorphic effectiveness, J. Hydrol., 326, 257–276, https://doi.org/10.1016/j.jhydrol.2005.10.031, 2006.
Luque, F. R. and Van Beek, R.: Erosion And Transport Of Bed-Load Sediment, J. Hydraul. Res., 14, 127–144, https://doi.org/10.1080/00221687609499677, 1976.
Mao, L., Dell'Agnese, A., Huincache, C., Penna, D., Engel, M., Niedrist, G., and Comiti, F.: Bedload hysteresis in a glacier-fed mountain river, Earth Surf. Process. Landf., 39, 964–976, https://doi.org/10.1002/esp.3563, 2014.
Mao, L.: The effects of flood history on sediment transport in gravel-bed rivers, Geomorphology, 322, 196–205, https://doi.org/10.1016/j.geomorph.2018.08.046, 2018.
Martin, R. L., Jerolmack, D. J., and Schumer, R.: Correction to “The physical basis for anomalous diffusion in bed load transport”, J. Geophys. Res., 117, F01018, https://doi.org/10.1029/2011JF002075, 2012.
Martin, R. L., Purohit, P., and Jerolmack, D.: Sedimentary Bed Evolution as a Mean-Reverting Random Walk: Implications for Tracer Statistics, Geophys. Res. Lett., 6152–6159, https://doi.org/10.1002/2014GL060525, 2014.
Masteller, C.: Supporting code and datasets for “Modeling memory in gravel-bed rivers: A flow history-dependent relation for evolving thresholds of motion” (Version 1), Zenodo [code], https://doi.org/10.5281/zenodo.15178239, 2025.
Masteller, C. C. and Finnegan, N. J.: Interplay between grain protrusion and sediment entrainment in an experimental flume, J. Geophys. Res.-Earth Surf., 122, 274–289, https://doi.org/10.1002/2016JF003943, 2017.
Masteller, C. C., Finnegan, N. J., Turowski, J. M., Yager, E. M., and Rickenmann, D.: History-Dependent Threshold for Motion Revealed by Continuous Bedload Transport Measurements in a Steep Mountain Stream, Geophys. Res. Lett., 46, 2583–2591, https://doi.org/10.1029/2018GL081325, 2019.
Meyer-Peter, E. and Müller, R.: Formulas for bed-load transport, Proceedings of the 2nd Congress, International Association for Hydraulic Structures Research, Stockholm, 7–9 June 1948, 39– 64, 1948.
Monsalve, A. and Yager, E. M.: Bed Surface Adjustments to Spatially Variable Flow in Low Relative Submergence Regimes, Water Resour. Res., 53, 9350–9367, https://doi.org/10.1002/2017WR020845, 2017.
Monteith, H. and Pender, G.: Flume investigations into the influence of shear stress history on a graded sediment bed, Water Resour. Res., 41, W12401, https://doi.org/10.1029/2005WR004297, 2005.
Moog, D. B. and Whiting, P. J.: Annual hysteresis in bed load rating curves, Water Resour. Res., 34, 2393–2399, https://doi.org/10.1029/98WR01658, 1998.
Mueller, E. R., Pitlick, J., and Nelson, J. M.: Variation in the reference Shields stress for bed load transport in gravel-bed streams and rivers, Water Resour. Res., 41, W04006, https://doi.org/10.1029/2004WR003692, 2005.
Ockelford, A., Woodcock, S., and Haynes, H.: The impact of inter-flood duration on non-cohesive sediment bed stability, Earth Surf. Process. Landf., 44, 2861–2871, https://doi.org/10.1002/esp.4713, 2019.
Ockelford, A.-M. and Haynes, H.: The impact of stress history on bed structure, Earth Surf. Process. Landf., 38, 717–727, https://doi.org/10.1002/esp.3348, 2013.
Olinde, L. and Johnson, J. P. L.: Using RFID and accelerometer-embedded tracers to measure probabilities of bed load transport, step lengths, and rest times in a mountain stream, Water Resour. Res., 51, 7572–7589, https://doi.org/10.1002/2014WR016120, 2015.
Paphitis, D. and Collins, M. B.: Sand grain threshold, in relation to bed “stress history”: An experimental study, Sedimentology, 52, 827–838, https://doi.org/10.1111/j.1365-3091.2005.00710.x, 2005.
Parker, G.: Self-formed straight rivers with equilibrium banks and mobile bed. Part 2, The gravel river, J. Fluid Mechan., 89, 127–146, https://doi.org/10.1017/S0022112078002505, 1978.
Parker, G.: Surface-based bedload transport relation for gravel rivers, J. Hydraul. Res., 28, 417–436, https://doi.org/10.1080/00221689009499058, 1990.
Phillips, C. B. and Jerolmack, D. J.: Self-organization of river channels as a critical filter on climate signals, Science, 352, 694–697, https://doi.org/10.1126/science.aad3348, 2016.
Phillips, C. B., Masteller, C. C., Slater, L. J., Dunne, K. B. J., Francalanci, S., Lanzoni, S., Merritts, D. J., Lajeunesse, E., and Jerolmack, D. J.: Threshold constraints on the size, shape and stability of alluvial rivers, Nat. Rev. Earth Environ., 1–14, https://doi.org/10.1038/s43017-022-00282-z, 2022.
Powell, D. M., Ockelford, A., Rice, S. P., Hillier, J. K., Nguyen, T., Reid, I., Tate, N. J., and Ackerley, D.: Structural properties of mobile armors formed at different flow strengths in gravel-bed rivers: Mobile Armor Structure, J. Geophys. Res.-Earth Surf., 121, 1494–1515, https://doi.org/10.1002/2015JF003794, 2016.
Powell, M. and Ashworth, P.: Spatial Pattern of Flow Competence and Bed Load Transport in a Divided Gravel Bed River, Water Resour. Res., 31, 741–752, https://doi.org/10.1029/94WR02273, 1995.
Prancevic, J. P. and Lamb, M. P.: Particle friction angles in steep mountain channels, J. Geophys. Res.-Earth Surf., 120, 242–259, https://doi.org/10.1002/2014JF003286, 2015.
Pretzlav, K. L. G., Johnson, J. P. L., and Bradley, D. N.: Smartrock Transport in a Mountain Stream: Bedload Hysteresis and Changing Thresholds of Motion, Water Resour. Res., 56, e2020WR028150, https://doi.org/10.1029/2020WR028150, 2020.
Pretzlav, K. L. G., Johnson, J. P. L., and Bradley, D. N.: Smartrock transport from seconds to seasons: Shear stress controls on gravel diffusion inferred from hop and rest scaling, Geophys. Res. Lett., 48, e2020GL091991, https://doi.org/10.1029/2020GL091991, 2021.
Recking, A., Liébault, F., Peteuil, C., and Jolimet, T.: Testing bedload transport equations with consideration of time scales, Earth Surf. Process. Landf., 37, 774–789, https://doi.org/10.1002/esp.3213, 2012.
Reid, I., Frostick, L. E., and Layman, J. T.: The incidence and nature of bedload transport during flood flows in coarse-grained alluvial channels, Earth Surf. Process. Landf., 10, 33–44, https://doi.org/10.1002/esp.3290100107, 1985.
Rickenmann, D.: Variability of Bed Load Transport During Six Summers of Continuous Measurements in Two Austrian Mountain Streams (Fischbach and Ruetz), Water Resour. Res., 54, 107–131, https://doi.org/10.1002/2017WR021376, 2018.
Rickenmann, D.: Effect of Sediment Supply on Cyclic Fluctuations of the Disequilibrium Ratio and Threshold Transport Discharge, Inferred From Bedload Transport Measurements Over 27 Years at the Swiss Erlenbach Stream, Water Resour. Res., 56, e2020WR027741, https://doi.org/10.1029/2020WR027741, 2020.
Rickenmann, D.: Bedload transport fluctuations, flow conditions, and disequilibrium ratio at the Swiss Erlenbach stream: results from 27 years of high-resolution temporal measurements, Earth Surf. Dynam., 12, 11–34, https://doi.org/10.5194/esurf-12-11-2024, 2024.
Rickenmann, D. and McArdell, B. W.: Continuous measurement of sediment transport in the Erlenbach stream using piezoelectric bedload impact sensors, Earth Surf. Process. Landf., 32, 1362–1378, https://doi.org/10.1002/esp.1478, 2007.
Rickenmann, D., Turowski, J. M., Fritschi, B., Klaiber, A., and Ludwig, A.: Bedload transport measurements at the Erlenbach stream with geophones and automated basket samplers, Earth Surf. Process. Landf., 37, 1000–1011, https://doi.org/10.1002/esp.3225, 2012.
Rickenmann, D., Antoniazza, G., Nicollier, T., Wyss, C., Boss, S., Fritschi, B., Steeb, N., and Badoux, A.: Sediment transport observations in Swiss mountain streams, EnviDat [data set], https://doi.org/10.16904/envidat.459, 2020.
Roberts, M. O., Renshaw, C. E., Magilligan, F. J., and Brian Dade, W.: Field Measurement of the Probability of Coarse-Grained Sediment Entrainment in Natural Rivers, J. Hydraul. Eng., 146, 04020024, https://doi.org/10.1061/(ASCE)HY.1943-7900.0001694, 2020.
Roth, D. L., Finnegan, N. J., Brodsky, E. E., Rickenmann, D., Turowski, J. M., Badoux, A., and Gimbert, F.: Bed load transport and boundary roughness changes as competing causes of hysteresis in the relationship between river discharge and seismic amplitude recorded near a steep mountain stream, J. Geophys. Res.-Earth Surf., 122, 1182–1200, https://doi.org/10.1002/2016JF004062, 2017.
Saletti, M., Molnar, P., Zimmermann, A., Hassan, M. A., and Church, M.: Temporal variability and memory in sediment transport in an experimental step-pool channel, Water Resour. Res., 51, 9325–9337, https://doi.org/10.1002/2015WR016929, 2015.
Schneider, J. M., Rickenmann, D., Turowski, J. M., Bunte, K., and Kirchner, J. W.: Applicability of bed load transport models for mixed-size sediments in steep streams considering macro-roughness, Water Resour. Res., 51, 5260–5283, https://doi.org/10.1002/2014WR016417, 2015.
Schuerch, P., Densmore, A. L., McArdell, B. W., and Molnar, P.: The influence of landsliding on sediment supply and channel change in a steep mountain catchment, Geomorphology, 78, 222–235, https://doi.org/10.1016/j.geomorph.2006.01.025, 2006.
Shields, A.: Awendung der Aehnlichkeitsmechanik und der Turbulenzforschung auf die Geschiebebewegung, Mitt. Preuss. Versuchsanst., Wasserbau Schiffbau, 26, 26, 1936.
Shobe, C. M., Tucker, G. E., and Rossi, M. W.: Variable-Threshold Behavior in Rivers Arising From Hillslope-Derived Blocks, J. Geophys. Res.-Earth Surf., 123, 1931–1957, https://doi.org/10.1029/2017JF004575, 1931.
Shobe, C. M., Tucker, G. E., and Rossi, M. W.: Variable‐Threshold Behavior in Rivers Arising From Hillslope‐Derived Blocks, J. Geophys. Res.-Earth Surf., 123, 1931–1957, https://doi.org/10.1029/2017JF004575, 2018.
Strom, K., Papanicolaou, A. N., Evangelopoulos, N., and Odeh, M.: Microforms in Gravel Bed Rivers: Formation, Disintegration, and Effects on Bedload Transport, J. Hydraul. Eng., 130, 554–567, https://doi.org/10.1061/(ASCE)0733-9429(2004)130:6(554), 2004.
Tucker, G. E. and Bras, R. L.: A stochastic approach to modeling the role of rainfall variability in drainage basin evolution, Water Resour. Res., 36, 1953–1964, https://doi.org/10.1029/2000WR900065, 1953.
Tucker, G. E. and Bras, R. L.: A stochastic approach to modeling the role of rainfall variability in drainage basin evolution, Water Resour. Res., 36, 1953–1964, https://doi.org/10.1029/2000WR900065, 2000.
Turowski, J. M., Yager, E. M., Badoux, A., Rickenmann, D., and Molnar, P.: The impact of exceptional events on erosion, bedload transport and channel stability in a step-pool channel, Earth Surf. Process. Landf., 34, 1661–1673, https://doi.org/10.1002/esp.1855, 2009.
Turowski, J. M., Badoux, A., and Rickenmann, D.: Start and end of bedload transport in gravel-bed streams, Geophys. Res. Lett., 38, L04401, https://doi.org/10.1029/2010GL046558, 2011.
Turowski, J. M., Böckli, M., Rickenmann, D., and Beer, A. R.: Field measurements of the energy delivered to the channel bed by moving bed load and links to bedrock erosion, J. Geophys. Res.-Earth Surf., 118, 2438–2450, https://doi.org/10.1002/2013JF002765, 2013.
Whiting, P. J., Stamm, J. F., Moog, D. B., and Orndorff, R. L.: Sediment-transporting flows in headwater streams, GSA Bull., 111, 450–466, https://doi.org/10.1130/0016-7606(1999)111<0450:STFIHS>2.3.CO;2, 1999.
Wiberg, P. L. and Smith, J. D.: Calculations of the critical shear stress for motion of uniform and heterogeneous sediments, Water Resour. Res., 23, 1471–1480, https://doi.org/10.1029/WR023i008p01471, 1987.
Wilcock, P. R. and Crowe, J. C.: Surface-based Transport Model for Mixed-Size Sediment, J. Hydraul. Eng., 129, 120–128, https://doi.org/10.1061/(ASCE)0733-9429(2003)129:2(120), 2003.
Wong, M. and Parker, G.: Reanalysis and Correction of Bed-Load Relation of Meyer-Peter and Müller Using Their Own Database, J. Hydraul. Eng., 132, 1159–1168, https://doi.org/10.1061/(ASCE)0733-9429(2006)132:11(1159), 2006.
Wyss, C. R., Rickenmann, D., Fritschi, B., Turowski, J. M., Weitbrecht, V., Travaglini, E., Bardou, E., and Boes, R. M.: Laboratory flume experiments with the Swiss plate geophone bed load monitoring system: 2. Application to field sites with direct bed load samples, Water Resour. Res., 52, 7760–7778, https://doi.org/10.1002/2016WR019283, 2016.
Yager, E. M.: Prediction of sediment transport in steep, rough streams, (PhD thesis), 2006.
Yager, E. M., Turowski, J. M., Rickenmann, D., and McArdell, B. W.: Sediment supply, grain protrusion, and bedload transport in mountain streams, Geophys. Res. Lett., 39, L10402, https://doi.org/10.1029/2012GL051654, 2012.
Yager, E. M., Schmeeckle, M. W., and Badoux, A.: Resistance Is Not Futile: Grain Resistance Controls on Observed Critical Shields Stress Variations, J. Geophys. Res.-Earth Surf., 123, 3308–3322, https://doi.org/10.1029/2018JF004817, 2018.