
the Creative Commons Attribution 4.0 License.
the Creative Commons Attribution 4.0 License.
 | 01 Sep 2026
Seasonal thermo-hydro-mechanical dynamics of permafrost rockwalls revealed by automated electrical resistivity monitoring

Ingo Hartmeyer
Samuel Weber
Markus Keuschnig
Michael Krautblatter
Permafrost warming in rock slopes and the associated long-term increase in slope instability have been intensively studied in recent years, with most interpretations of electrical resistivity tomography (ERT) focusing on the thermal regime while assuming homogeneous rock conditions. Seasonal forcing by water and ice in fractures has often been neglected, even though hydrostatic and cryostatic processes are increasingly recognised as key mechanical drivers in the conditioning and initiation of permafrost rock instabilities. In contrast to previous studies, we applied automated ERT monitoring to decipher temporary phases of massive hydrostatic water injection into previously frozen joints and the development of cryostatic pressures related to ice formation processes. ERT monitoring was performed at the north face of the Kitzsteinhorn (Hohe Tauern range, Austria) year-round from April 2024 to April 2025. These measurements incorporated reciprocal error estimation and a resistivity–temperature relation calibrated using in situ borehole temperature data and laboratory experiments. The ERT data set was complemented by observations of the rockwall's hydro-mechanical response derived from load cells of two 25 m-long anchors and from piezometric measurements at 16.85 m depth. We identified five characteristic phases of seasonal forcing on permafrost rockwalls, driven by subsurface temperature, snow pack, and piezometric pressure: stable freezing from April–May (phase I), snow melt and subsurface warming from May–July (phase II), maximum active layer thickness from July–September (phase III), superficial cooling from September–November (phase IV), and deep freezing from November–April (phase V). Among these identified phases, two emerged as potentially conditioning rock slope destabilisation and were temporally constrained using the ERT data. During peak meltwater infiltration from May to July (phase II), drastic decreases in resistivity from 140 to 9 kΩm and enhanced piezometric levels of up to 1.2 bar indicated high hydrostatic pressures, while simultaneous declines in anchor loads from 576 to 519 kN indicated stress redistribution within the jointed rock mass. A second critical phase was marked by increased resistivity in deeper layers and rising anchor loads during subsurface cooling from November to January (phase V), suggesting the onset of ice formation processes and high cryostatic pressures. Here, we show that temperature-calibrated automated ERT monitoring in high-alpine permafrost rockwalls can offer new insights into the coupled thermo-hydro-mechanical response of rock masses to seasonal forcing, potentially controlling rock mass stability.
- Article
(11546 KB) - Full-text XML
- BibTeX
- EndNote


The frequency and magnitude of rockfall and rock slope failures in periglacial environments are projected to increase under ongoing climate warming (Jacquemart et al., 2024). These mass movements pose a direct hazard to mountaineers and high-alpine infrastructure (Ravanel et al., 2013; Duvillard et al., 2019), and increasingly threaten downstream valleys through large-scale cascading processes with long run-out distances (e.g. Huggel et al., 2005; Walter et al., 2020). In general, failures occur when driving forces exceed resisting strengths. In addition to the control exerted by the geological structure (Stead and Wolter, 2015), frost weathering- and erosion-driven fracture propagation (Matsuoka and Murton, 2008; Mayer et al., 2024), long-term seismic loading (Gischig et al., 2016), glacial changes (Hartmeyer et al., 2020a; Pfluger et al., 2025) and permafrost degradation (Gruber and Haeberli, 2007; Savi et al., 2021), hydrostatic and cryostatic pressure play a crucial role in conditioning planes of weakness. Although the importance of water and ice dynamics within fractures has been emphasised in theoretical concepts (Krautblatter et al., 2013; Draebing et al., 2014), numerical modelling (Magnin and Josnin, 2021; Ben-Asher et al., 2023; Scandroglio et al., 2025b), laboratory experiments (Hasler et al., 2011; Mamot et al., 2018), and post-failure back-analyses (Walter et al., 2020; Cathala et al., 2024; Weber et al., 2025a), field evidence of hydrostatic and cryostatic pressure in permafrost environments remains scarce. Direct piezometric observations at greater depths (> 10 m) have so far only been reported from a single rock glacier (Phillips et al., 2023; Bast et al., 2024), where interpretation is constrained by ice-rich, high-porosity medium, and from the north-facing rockwall of the Kitzsteinhorn (Offer et al., 2025), where measurements were limited to a short time series of a few months. Thermo-cryogenic processes, arising from thermal gradients, volumetric expansion of ice-filled fractures and ice segregation, contribute to the mechanical weakening and fracture kinematics in permafrost rock mass (Walder and Hallet, 1985; Matsuoka and Murton, 2008). Although ice formation processes have been widely discussed, existing interpretations predominantly rely on crackmeter measurements at the terrain surface (Wegmann and Gudmundsson, 1999; Hasler et al., 2012; Draebing et al., 2017; Weber et al., 2017), passive seismic monitoring (Girard et al., 2013; Weber et al., 2018), and laboratory experiments (Duca et al., 2014; Murton et al., 2006). Direct measurements of stress changes occurring at depth within fractured bedrock, however, have to the author's knowledge only been reported by Pläsken et al. (2026).
Observing hydrological and cryogenic processes is inherently challenging due to spatially variable ice content, spatio-temporal snow cover variability (Gisnås et al., 2016; Haberkorn et al., 2017), and the three-dimensional hydrological pathways of water infiltration and drainage (Ben-Asher et al., 2026; Moser et al., 2025; Scandroglio et al., 2025b). At the slope scale, geophysical methods can provide insights into the physical properties of the subsurface structure and substrate. Electrical resistivity tomography (ERT) has become an established technique for detecting permafrost warming in periglacial environments over the past two decades (Herring et al., 2023), owing to the pronounced resistivity contrast between unfrozen and frozen ground. In the context of climate warming, active layer dynamics, long-term permafrost evolution, and associated preconditioning effects (Hauck and Hilbich, 2024) have been inferred from repeated ERT measurements, typically conducted at multi-year to annual intervals (e.g. Kneisel et al., 2014; Magnin et al., 2015; Mollaret et al., 2019; Buckel et al., 2023; Scandroglio et al., 2021). Monthly monitoring by Krautblatter et al. (2010) and Scandroglio et al. (2025a) has revealed indications of liquid water in fractures; however, a substantially higher temporal resolution and the integration of complementary methods are required to capture the complex non-linear hydrothermal dynamics in steep rockwalls. Higher-frequency (daily) monitoring has been reported so far only for a few study sites, but these automated ERT monitoring systems are either restricted to a borehole axis (Bast et al., 2024), conducted in different landforms in the Arctic and Antarctic (e.g. Uhlemann et al., 2021; Farzamian et al., 2024), shown only in monthly resolution (Mollaret et al., 2019; Abdulsamad et al., 2026), or their detailed analysis has been discontinued (Hilbich et al., 2011).
Keuschnig et al. (2017) initiated the first automated ERT monitoring at a steep permafrost rockwall at the Kitzsteinhorn. However, severe software damage during the summer months resulted in substantial data gaps, and the lack of borehole temperature measurements or laboratory calibrations prevented quantitative interpretation. Monthly repeated ERT surveys conducted in 2023 by Offer et al. (2025) partially bridged this data gap and, combined with complementary rock temperature data, revealed first indications of pressurised water flow during summer. Despite this knowledge gain, constraining the timing and duration of seasonal phases characterised by high hydrostatic and cryostatic pressures, potentially preconditioning rock instabilities, remains challenging. Therefore, we conducted daily automated ERT monitoring, which is quantitatively interpreted using borehole temperature and laboratory calibrations, and combined it with piezometer borehole data and anchor load measurements to enhance the understanding of the coupled thermo-hydro-mechanical responses of permafrost rockwalls to seasonal forcing. The following three research questions are addressed in this paper:
-
How effectively can automated ERT monitoring detect seasonal dynamics of water and ice within fractures in permafrost-affected rockwalls?
-
How do temporal variations in electrical resistivity relate to concurrent mechanical responses of the rock mass, as indicated by anchor load measurements, and to hydrological forcing observed through piezometric pressure?
-
Can automated ERT monitoring contribute to the constraining of seasonal phases that predispose rock instabilities by capturing phases of high hydrostatic and cryostatic pressure, and thereby enhance the understanding of thermo-hydro-mechanical response of permafrost rockwalls to seasonal forcing?
Our study site, the north-facing rockwall in the summit region of the Kitzsteinhorn, located in the Hohe Tauern range (Austria, Fig. 1) provides an ideal setting for such observations due to (i) the presence of permafrost, (ii) a significant degree of fracturing, (iii) year-round accessibility via a cable car for maintenance reasons, and (iv) a high density of complementary long-term monitoring data. Previous research within this project has yielded key insights, which include (i) characterisation of the thermal regime of the rock mass using borehole temperature measurements (Hartmeyer and Otto, 2024) and electrical resistivity surveys (Keuschnig et al., 2017; Offer et al., 2025); (ii) documentation of varying water levels from piezometric observations (Offer et al., 2025); (iii) assessment of rockfall activity through terrestrial laser scanning campaigns (Hartmeyer et al., 2020a, b); (iv) modelling of active layer thickness (Aumer et al., 2025); and (v) quantification of rock stress variations using rock-anchor load loggers (Pläsken et al., 2026).
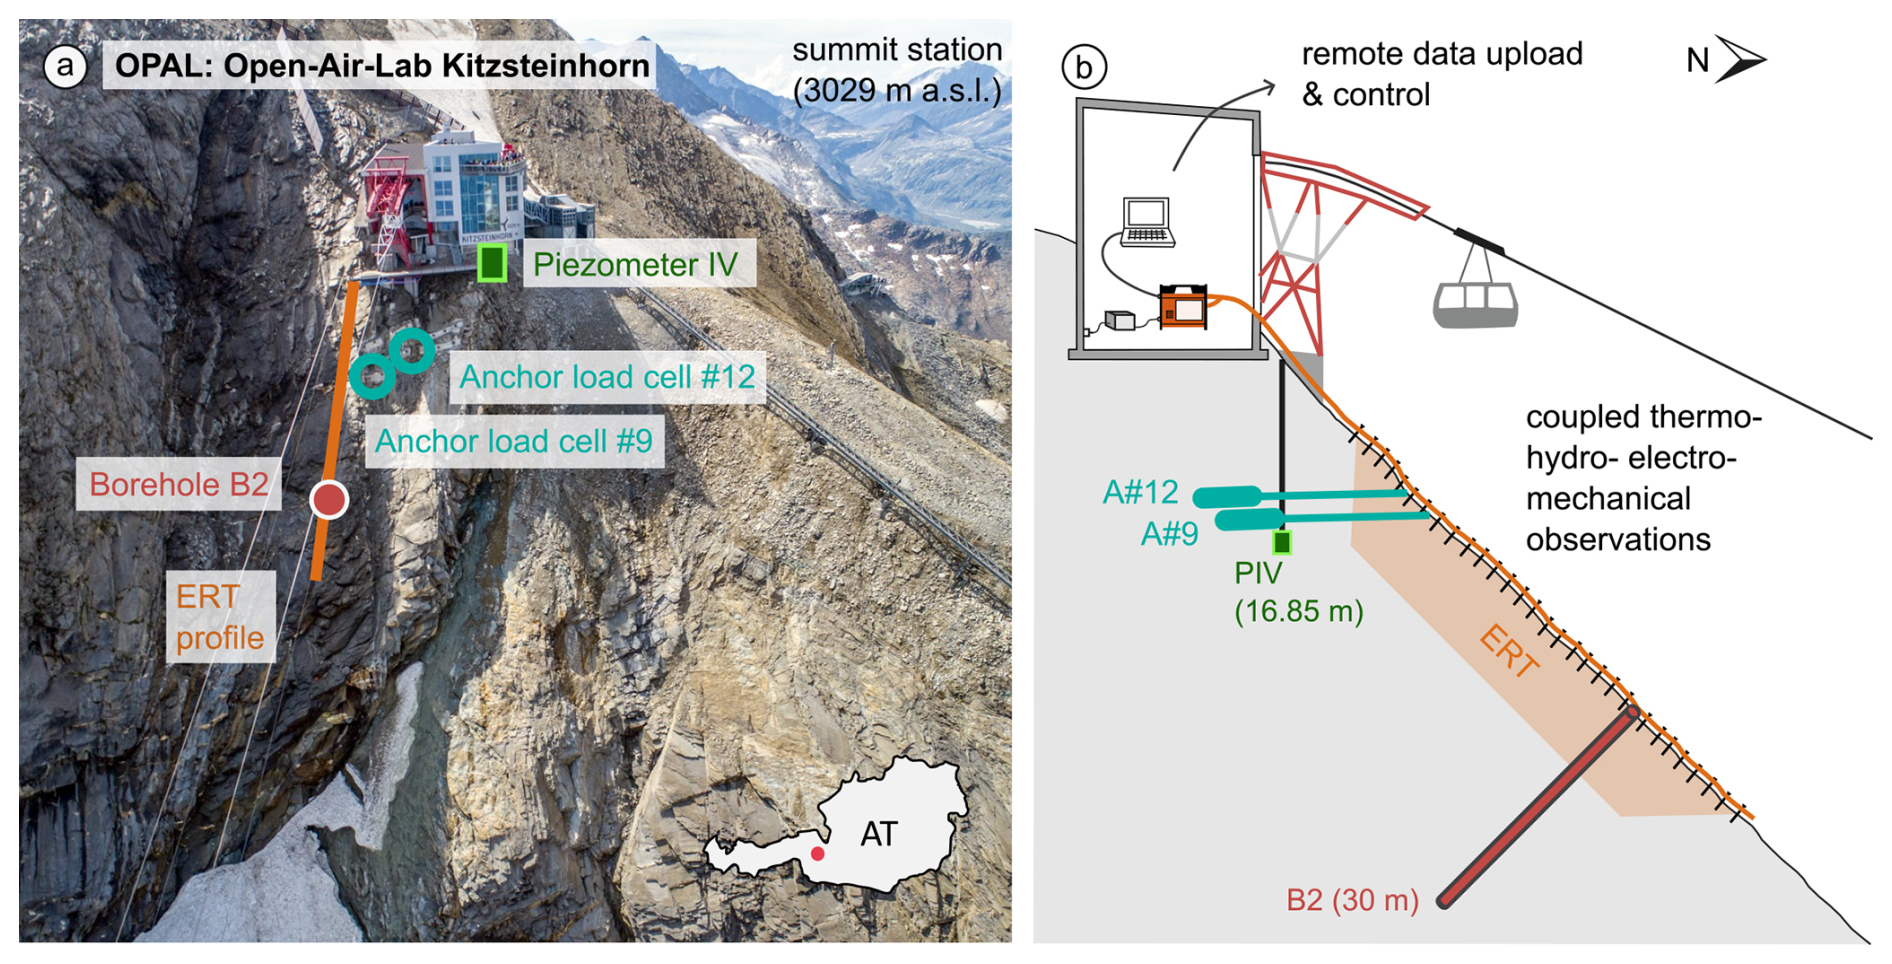
Figure 1(a) Overview of the position of the instruments installed on the north flank of the Kitzsteinhorn: automated ERT setup at surface along the orange line, borehole temperature along the red profile, anchor load cells in turquoise, and piezometric measurements along a vertical borehole in green. (b) Schematic illustration of the vertical cross-section through the investigated rockwall from south to north, indicating the depths and inclinations of the monitoring systems.
2.1 Geology
The study area consists of fractured rock of the Penninic Bündner schist formation within the Glockner Nappe, comprising calcareous mica schist, prasinite, amphibolite, phyllite, marble and serpentinite (Cornelius and Clar, 1935; Hoeck et al., 1994). The investigated rockwall is mainly composed of calcareous mica schist, traversed by a scaly serpentinite belt. The rock mass is characterised by a well-developed schistosity dipping in a north-northeast direction, parallel to the slope (∼ 45°), forming an open interface structure that provides pathways for water flow. In addition, optical borehole scanning indicates a high degree of fracturing in the upper meters, with joint openings of up to several centimetres (Fig. A2), likely facilitated by stress release and intense frost weathering (Hartmeyer et al., 2012). The interface set is dominated by two main joint sets (Schober et al., 2012; Offer et al., 2025): K1, dipping steeply towards the west, and K2, dipping medium-steeply towards the southwest. Less pronounced sets include K3, dipping medium-steeply to flat to south-southeast, and K4, dipping steeply towards northwest. The interaction between the differently oriented joint sets with the schistosity forms cubic to rhomboidal rock blocks, which are predisposed to destabilisation under changing stress conditions. Numerous open fractures, also observed along the ERT profile (Keuschnig et al., 2017), act as preferential pathways for water infiltration and are partly filled with fine-grained material that retains water within the discontinuities.
2.2 ERT installation
Electrical resistivity tomography is an indirect geophysical method widely used in permafrost research to characterise the subsurface properties, described for example in detail in Herring et al. (2023). At the Kitzsteinhorn north-flank, the investigated ERT profile begins at the north terrace of the cable car station (3016 m a.s.l.) and extends 58 m down-slope (Fig. A1). The measurement transect consisted of 30 stainless-steel expansion anchors (each 90 mm in length and 10 mm in diameter), permanently bolted into the rockwall at 2 m intervals. These bolts served as electrodes, offering good electrical contact and long-term durability. Compared to the approach described by Keuschnig et al. (2017), the set-up for automated ERT monitoring was improved through increased mechanical stabilisation of the connections between the take-outs and electrodes, as well as additional protection of the measurement cable from rockfall activity and snow avalanches by encasing it in multiple layers of HDPE and PE tubing.
The automated ERT data set was acquired using the terrameter LS measurement device housed in the summit station to shield it from harsh weather conditions and enable a continuous power supply. The instrument was connected to a laptop, allowing for remote control, monitoring, and immediate interaction in case of errors. As ERT measurements in permafrost bedrock often encounter high contact resistances and, consequently, a low signal-to-noise ratio, all measurements were conducted using the Wenner configuration to ensure maximal signal strength (Hauck and Mühll, 2003). Additionally, reciprocal measurements were performed to estimate measurement errors and subsequently used for data weighting and determining inversion parameters. Both Wenner and reciprocal measurements were repeated daily during daytime hours (08:00 am–04:00 pm CET) over one year, starting in April 2024.
2.3 Anchor load monitoring
To increase local ground stability, fifteen boreholes were drilled nearly horizontally (−3°) with a diameter of 150 mm below the cable car station. Each borehole was equipped with 25 m long corrosion-protected rock anchors with a diameter of 57 mm, whereby the upper 18 m section represents the free anchor length, and the lower 7 m section is friction-locked and grouted. The anchors were designed for a load capacity of 1.513 kN and were pretensioned to 600 kN during installation. However, within a few hours, the load decreased to 500 kN due to anchor relaxation and the mechanical response of the rock wall.
In the vicinity of the ERT profile, three anchor heads were instrumented with hydraulic anchor load cells (Glötzl KK 1600 A 75 VW 4, Fig. A1) to monitor load at hourly intervals since December 2015. For this study, we analysed data from the two closest anchor load cells (A#9 and A#12 in Fig. 1), located 5–15 m from the ERT profile, covering the automated ERT monitoring period from April 2024 to April 2025.
The load monitoring operates on a hydraulic measurement principle, where a vibrating wire measures pressure. This pressure is then converted into anchor loads based on individual laboratory calibration of the vibrating wires by the manufacturer and the well-defined force application surface of the load cell. The change in anchor loads is linked to variations in the mechanical stress regime of the rockwall, since anchor loading represents the relative strain between the activated rock mass and the free anchor length itself.
2.4 Borehole temperature
Rock temperature data are available to a depth of 30 m. The borehole mouth is located between electrode 22 (x=42 m) and 23 (x=44 m). The borehole, which was drilled perpendicular to the surface with a diameter of 90 mm at 2970 m a.s.l. (Fig. 1), has been recording rock temperature since December 2015. For the purpose of this study, the borehole temperature data were analysed according to the temporal and spatial resolution of the automated ERT measurements. Specifically, datasets from thermistors at depths of 0.1, 1, 2, 3, 5 and 15 m, covering the period from April 2024 to April 2025, were considered. The former data series (2016–2023) of bedrock temperature over the entire measuring depth of 30 m is shown in Aumer et al. (2025). The innovative measuring principle and system is described in detail in Offer et al. (2025). The active layer thickness was defined as the maximum depth of the 0 °C isotherm, derived from a spline interpolation of the borehole temperatures.
2.5 Piezometric pressure
A vertical borehole ( mm, 20.5 m depth) was drilled close to the summit station (Fig. 1) in October 2023. A GEOKON 4500S piezometer sensor (accuracy ±0.1 % from 0–7 bar) was installed at a depth of 16.85 m exactly at the stratigraphic boundary between calcareous mica schists and the underlaying scaly band of serpentinite, as determined by optical borehole scanning. To prevent water percolation along the borehole, the lower section of the borehole was filled with impermeable cement. The piezometric sensor was placed inside a bag of filter sand ( mm, ∼ 30 cm length) to create an isolated, water-permeable collection zone and positioned at the desired tip location. The upper part of the borehole was sealed similarly to the lower section using impermeable bentonite and cement. The measuring principle of the piezometer and data transmission is explained in Offer et al. (2025). Here, we analysed the piezometric pressure data from April 2024 to April 2025, whereby the entire dataset was corrected for temperature and barometric effects.
2.6 Meteorological monitoring
Meteorological conditions were assessed using two nearby weather stations. Air temperature and snow depth were obtained from the Gletscherplateau station (2920 m a.s.l., ∼ 500 m distance), while precipitation data were taken from the Alpincenter station (2450 m a.s.l., < 2 km distance). In addition, webcam images taken near the Gletschershuttle (2928 m a.s.l.) were used to analyse the subsurface conditions at the rockwall.
3.1 Data pre-processing
The ERT dataset contains up to 135 measured data points per day for each Wenner configuration, provided that electrical coupling was sufficient and no electrodes were excluded before the respective measurement, resulting in a total of 20 148 measured data points over the entire observation period. Due to the size of the dataset, manual filtering procedures and quality controls of each individual observation are impractical, making automated filtering and inversion procedures essential for consistent data processing. With the growing number of automated ERT monitoring sites in recent years, various filtering approaches have been developed, differing in complexity and criteria for identifying and defining data outliers. Some filtering procedures rely on data point correlation over time by incorporating regularisation within the time-lapse inversion scheme (e.g., Karaoulis et al., 2014; Lesparre et al., 2017). However, as indicated by Keuschnig et al. (2017), rapid spatial changes in resistivity occurring within a few hours in the snowmelt period could be filtered out by these time constraints, potentially leading to over-filtering in our dataset.
Therefore, we only applied a technical filter before the datasets were inverted to remove physically implausible and low-reliable data points. Each individual quadrupole was evaluated according to the criteria proposed by Rosset et al. (2013), with a slightly higher minimum threshold for apparent resistivity to exclude unrealistic values typical of low-porosity bedrock. Specifically, data points were retained only if they fulfilled the following conditions: (i) Apparent resistivity values: ρa > 0.5 kΩm, (ii) injected current flow: I > 0.02 mA, and (iii) stacking variance within repeated quadrupole measurements (minimum: 2, maximum: 4) CV < 10 %. Quadrupole measurements that did not fulfil one or more of these criteria were excluded from further processing. Compared to other ERT filtering methods (e.g., Hilbich et al., 2011; Rosset et al., 2013; Mollaret et al., 2019; Herring et al., 2023), we did not implement additional filtering steps due to the specific characteristics of our datasets. During the summer months, resistivity values decreased over more than one order of magnitude (Offer et al., 2025). Applying a filter based on a fixed standard deviation factor across the dataset would have been overly strict for the summer measurements, excluding plausible data points, or insufficiently sensitive in winter, failing to identify anomalously high resistivity values. Applying a moving median filter along each depth level would exclude data points showing rapid spatial changes in resistivity values. However, these variations, attributed to water infiltration or freezing corridors along fractures (Offer et al., 2025), should be preserved in the dataset. Our conservative filtering approach, which is based solely on technical limitations, may not detect all poor-quality data points, particularly during freezing periods with poor galvanic contact. To address this, only datasets retaining more than 80 % of data points (n = 108) after technical filtering were inverted.
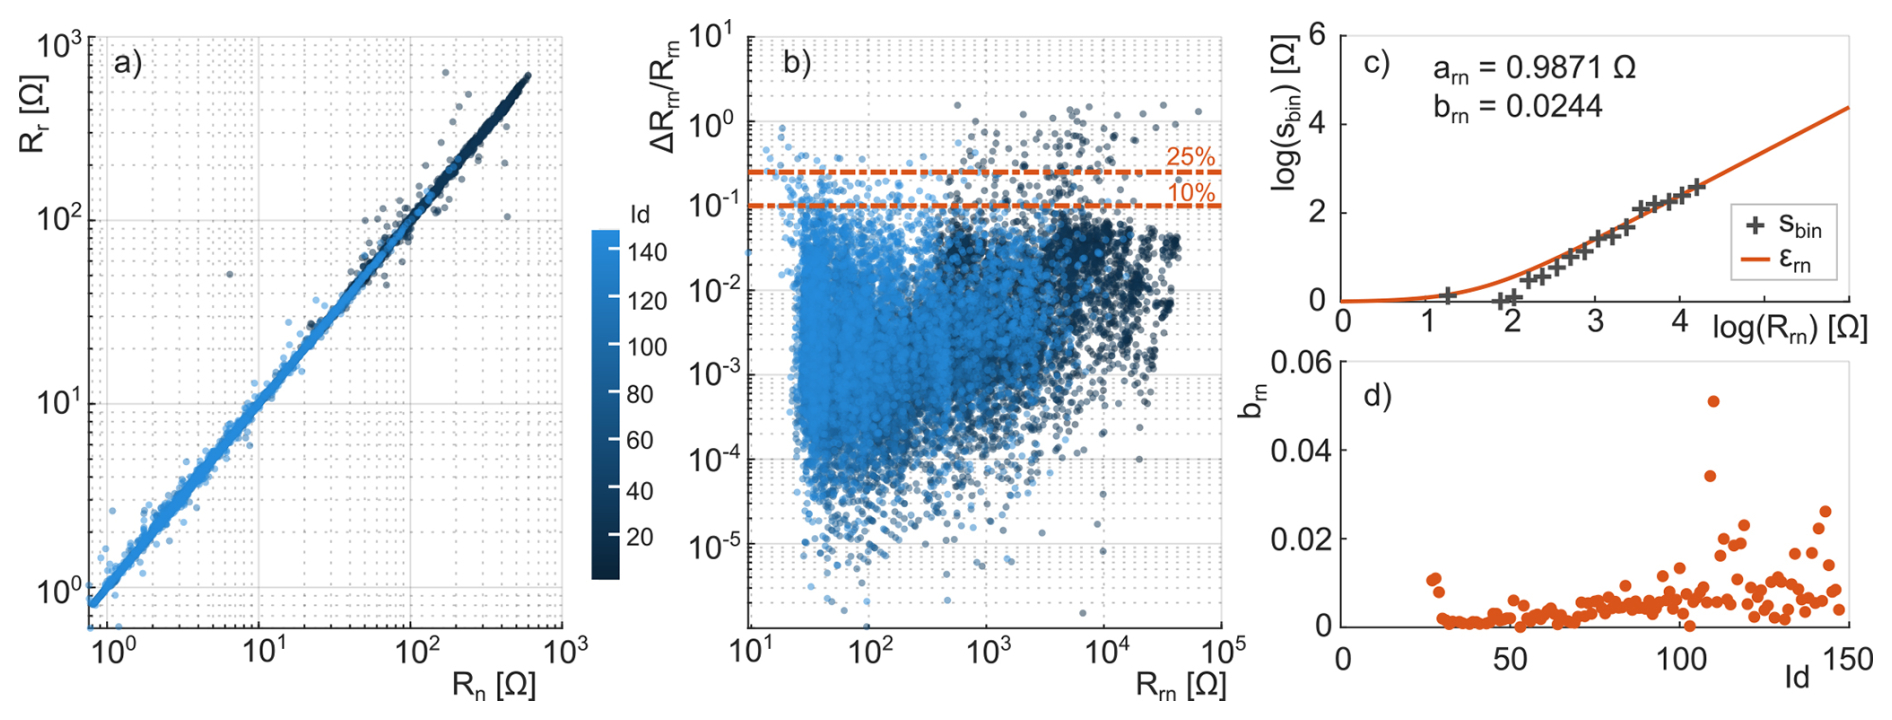
Figure 2(a) Crossplot of normal and reciprocal resistance measurements of 18 018 data point pairs, showing a strong alignment along the 1 : 1 gradient with only a few outliers. (b) Relative reciprocal error (), indicating that only isolated data points exceed the 10 % or 25 % thresholds, confirming the high quality of the raw data set. Measurements conducted during the winter and early spring months (Id = 0–60) exhibited higher relative reciprocal errors compared to summer observations (Id > 60), likely caused by increased contact resistance. (c) Determination of error model parameters arn and brn based on bin analysis of the standard deviation of the misfit between normal and reciprocal resistances (ΔRrn) and the mean resistance (Rrn). (d) Temporal variation of the model parameter brn across the time series, analysed separately for each ERT observation.
Before performing the inversion routines, we assessed the quality of the raw data set and accurately quantified the measurement error (noise) on the basis of the filtered data sets. The crossplot of normal (Rn) and reciprocal (Rr) measurements suggests a negligible occurrence of systematic and random errors (Fig. 2a). In previous studies, outliers were defined, for example, over a relative reciprocal error exceeding 10 % (Slater et al., 2000) or 25 % (Flores Orozco et al., 2018). Due to technical constraints, mainly related to high-resistivity measurements at very low currents, reciprocal measurements could not fully cover the entire normal data set. Nevertheless, applying these thresholds to the available reciprocal pairs shows that only 100 data points (0.5 % of the total data) would be classified as outliers using the 25 % threshold, and 266 data points (1.4 %) using the 10 % threshold, confirming the overall high quality of the data set (Fig. 2b).
3.2 Inversion routines
Precise error quantification is crucial to avoid misinterpretations of the inversion models (LaBrecque et al., 1996). Overestimating the error can result in low-resolution, overly smoothed models, whereas underestimating may lead to overfitting and to the introduction of artefacts. In inversion processes, error models typically assume a normal distribution (Gaussian noise), where the reciprocal error (εrn) is described as a linear function of the mean resistance (Rrn) from normal and reciprocal readings (Slater et al., 2000; Koestel et al., 2008):
To determine the error model parameters arn and brn, data points with a relative reciprocal error () exceeding 25 % or a resistance above the 99th percentile (Rrn > 19.193 Ω) were excluded. Following the approach of Koestel et al. (2008), the resistance range was logarithmically divided into equal-sized bins (n = 20). For each bin, the mean resistance and standard deviations were calculated and subsequently fitted to the linear model of Eq. (1) (Fig. 2c). The fitting yields arn = 0.9871 Ω (minimum absolute resistance error) and brn = 2.44 % (relative increase in error). The error can change over time-lapse observations (e.g. Koestel et al., 2008; Lesparre et al., 2017), which is pronounced by increased values during freezing periods (beginning and towards the end of the observation period, see Fig. 2d). However, previous ERT studies in permafrost environments have reported elevated data uncertainties (e.g. Krautblatter et al., 2010; Bast et al., 2024). To account for this and address the sensitivity to high-resistivity conditions, we applied a fixed relative magnitude error of brn = 8 % within the inversion framework, which exceeds the empirically calculated data errors across the entire time series (Fig. 2d). We preferred a constant error level rather than scaling brn per seasonal phase, to avoid applying different degrees of smoothing to the individual datasets, which could introduce or suppress resistivity contrasts between the seasonal phases.
The ERT data sets were inverted using the Python-based software ResIPy (version 3.6.2; Blanchy et al., 2020), which interfaces with the finite-element forward and inverse modelling code R2. An unstructured triangular mesh was employed, whereby the mesh element size increases with distance from the electrodes and was generated using the meshing code Gmsh (Geuzaine and Remacle, 2009). The inversion follows a regularised, smoothness-constrained (Occam-type) least-squares scheme, minimising an objective function that combines the data misfit with a model roughness term, both evaluated in the L2 norm. The data were log-transformed and weighted according to the reciprocal error model (Eq. 1). A time-lapse algorithm was applied, implementing regularisation relative to the previous data sets following the difference inversion approach of LaBrecque and Yang (2001).
Rockwalls in high-alpine environments are subjected to pronounced seasonal variations in environmental forcing. To investigate the mechanical response of the rockwall to associated changes in hydrostatic and cryostatic conditions, we analysed air temperature, snow height, piezometric pressure, and subsurface temperature. Based on distinct shifts in these parameters (rectangles and arrows in Fig. 3a), five characteristic seasonal phases were defined, which subsequently served as a framework for analysing the ERT and anchor load datasets.
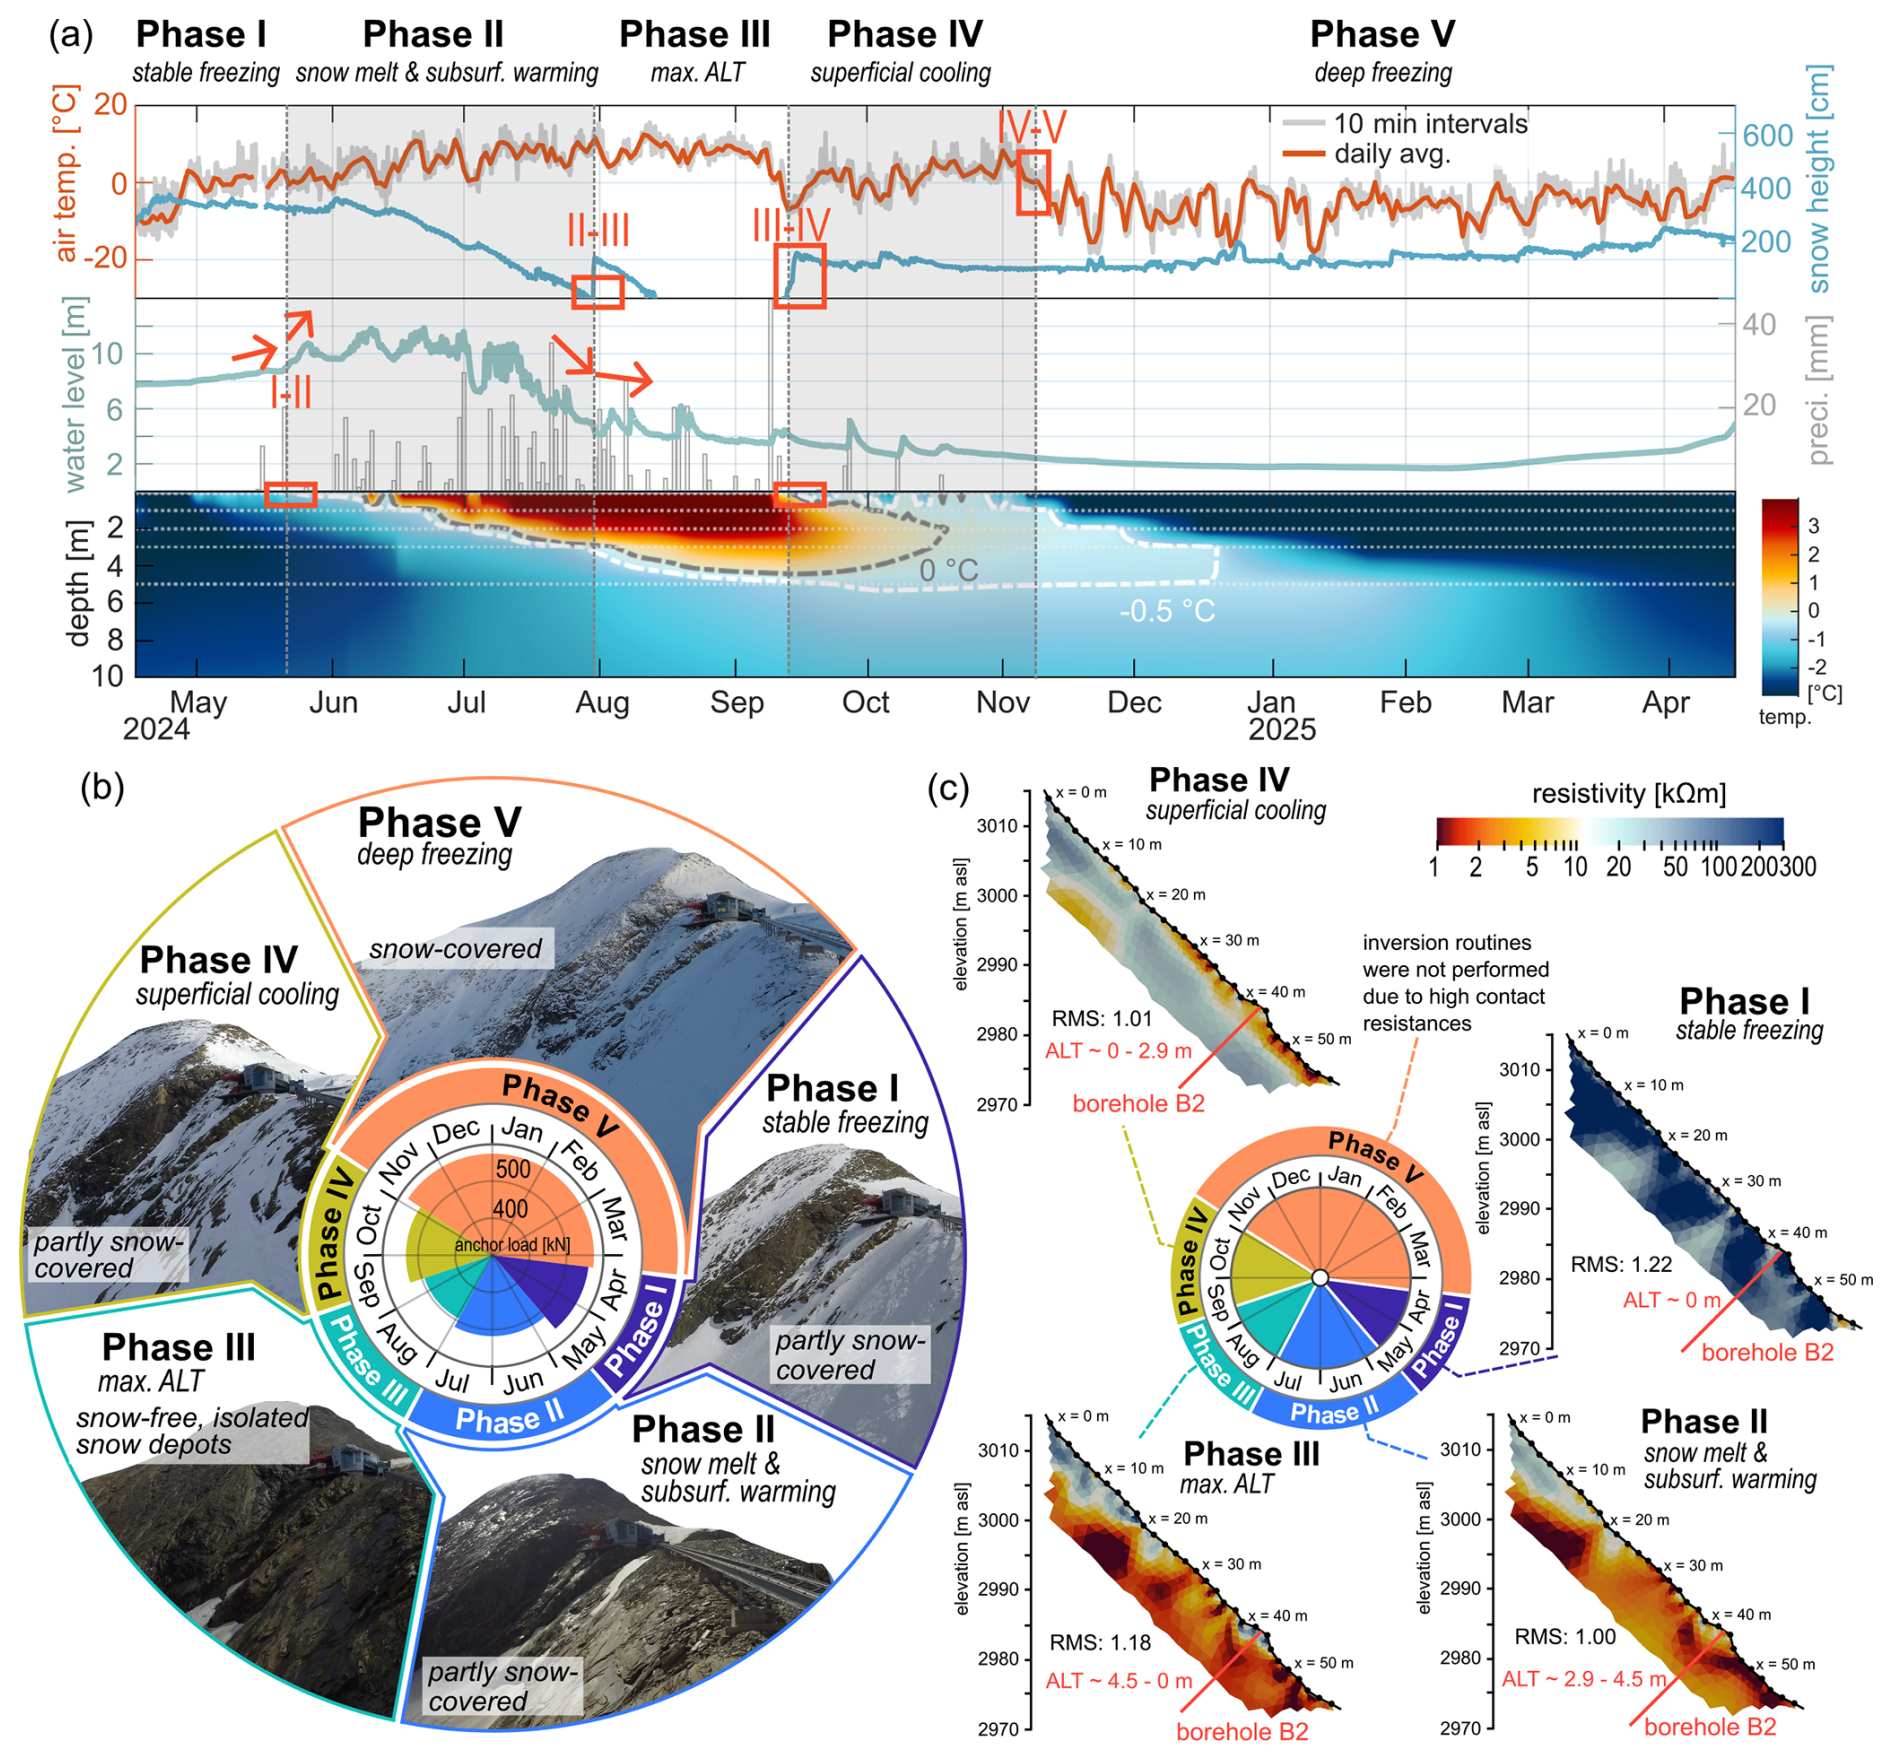
Figure 3(a) Seasonal phases delineated by temporal shifts in environmental forcing (red rectangles and arrows), shown through air temperature, snow height (smoothed over 2 h), water levels from piezometric measurements, daily sum of precipitation on days with mean air temperatures > 2 °C (rainfall events), and spline-interpolated rock temperature with indicated thermistor depths. (b) Mean anchor loads (centre) and webcam images of the rockwall from 2 May, 11 July, 8 August, 29 October, and 11 December 2024. (c) Representative ERT models for phases I–IV with indicated active layer thickness (ALT) range; inversions were not performed for phase V due to the limited number of measuring points. The colour scale of the ERT models is based on laboratory calibrations from Offer et al. (2025).
- Phase I – stable freezing.
-
During stable freezing conditions between 17 April to 20 May 2024, rock temperature remained constantly below −0.5 °C (Fig. 3a), suggesting that fractures were predominantly ice-filled, and a continuous snow cover (Fig. 3b) insulated the rockwall. Air temperature fluctuated around the freezing point (Fig. 3a) with a mean daily value of −2.7 °C, which caused occasional snow melt or accumulation events. However, the infiltration of snowmelt water was likely impeded and damped by basal ice layers at the snow–rock interface, as observed at the Gemsstock by Phillips et al. (2016). The presence of ice-sealed fractures can result in the formation of perched water tables (Magnin and Josnin, 2021); in our study, this was evidenced by a gradual increase in hydraulic heads from 0.78 to 0.88 bar observed by the piezometer, which corresponds to water levels between 7.8 and 8.8 m (Fig. 3a).
- Phase II – snow melt & subsurface warming.
-
During late spring and early summer (21 May to 30 July 2024), mean daily air temperature increased to 5.2 °C and snowmelt peaked, leading to surface runoff and deep percolation along discontinuities, which in turn results in high hydrostatic pressures, with water levels reaching up to 12 m (Fig. 3a). The pronounced daily fluctuations in piezometric pressure point to a strong correlation with diurnal snowmelt cycles driven by air temperature variations. In contrast, observed rainfall contributes only marginally to these pressure changes during ongoing snowmelt, a pattern also observed in discharge measurements inside a tunnel at the Zugspitze (Scandroglio et al., 2025b). The piezometric data indicate sustained high piezometric pressure (> 10 m water levels) with distinct diurnal fluctuations, even after the snow cover on the rockwall had completely disappeared by mid-July (Fig. 3b). This indicates ongoing meltwater infiltration from upslope sources. We suggest that a longer-persisting snow deposit behind the summit station, situated on a more gently inclined slope (topographically consistent with the location of the weather station), acts as the main source of meltwater. This water likely infiltrates the subsurface and is redirected downslope along surface-parallel schistosity of the local calcareous mica schists and fracture networks toward the rockwall. The active layer extended progressively and reached a thickness of 2.8 m.
- Phase III – maximum active layer thickness.
-
During the summer months (31 July–13 September 2024), the air temperature reached its seasonal maximum, with a mean daily value of 7.2 °C. The rockwall remained predominantly snow-free (Fig. 3b) and enabling efficient heat transfer to the subsurface. As a result, the active layer thickness reached a maximum thickness of 4.5 m, and the −0.5 °C isotherm progressed to a depth of 4.9 m (Fig. 3a). Due to the decrease in the intensity of snowmelt infiltration, only short-term peaks in fracture water flow occurred shortly after precipitation events (Fig. 3a). Active layer thaw can support the water delivery and increase the water availability at the base of the active layer; however, in our case, the gradual decline in piezometric pressure after the main snowmelt period suggests only a marginal contribution to the overall discharge.
- Phase IV – superficial cooling.
-
With decreasing air temperatures in late summer and early winter (14 September to 4 November 2024), mean daily values dropped to 1.4 °C, initiating superficial cooling of the rockwall. From mid-October onward, the entire rock mass exhibited subzero temperatures. A thin, patchy snow cover formed intermittently (Fig. 3b), which enhanced surface cooling through increased albedo, intensified long-wave radiation loss, and latent heat effects (Keller and Gubler, 1993; Luetschg et al., 2008). Precipitation events occasionally caused short-term rises in piezometric pressure; however, overall water levels declined to approximately 0.25 bar by the end of this phase, likely due to the water retention capacity of the snow cover (Draebing et al., 2014).
- Phase V – deep freezing.
-
During the winter months (5 November 2024 to 16 April 2025), daily air temperatures remained predominantly below 0 °C, reaching a mean daily minimum of −5.6 °C (Fig. 3a). This sustained subsurface cooling drove a gradual downward propagation of the thermal freezing front, likely initiating the phase transition from water to ice within discontinuities, which can promote ice segregation. The rockwall remained continuously snow-covered (Fig. 3b), while piezometric pressures stayed low and stable (approximately 0.17 bar) due to the absence of rainfall and snow melt.
It is important to note that the analysed measurements are subject to uncertainties due to their spatial context. The piezometric sensor provides point-scale information within a heterogeneous rock environment and only captures pressure levels in the rock discontinuities above its installation depth. Consequently, the actual hydrostatic pressures might exceed the observed values. However, the piezometric signal is considered representative of the hydrological dynamics of the rockwall, as its temporal evolution coincides with the resistivity decrease observed across the entire ERT profile (Fig. 3). This agreement between a localised pressure measurement and the profile-scale geophysical response indicates that the piezometer captures a system-wide forcing rather than a local anomaly. In addition, snow heights measured at the weather station on the Schmiedingerkees glacier (distance: ∼ 500 m, elevation: 2940 m a.s.l.) do not accurately represent snow conditions on the steep, investigated rockwall. Due to the inverse relationship between snow accumulation and rock slope angle (Sommer et al., 2015; Ben-Asher et al., 2023), as well as additional redistribution of snow by wind (Sokratov and Sato, 2001; Mott et al., 2010) and gravity on steep terrain, significantly lower snow heights on the rockwall are expected.
4.1 Seasonal variations in electrical resistivity and anchor loads
The ERT dataset was subdivided according to the defined seasonal phases I-V, with the first measurement of each phase used as background models in the inversion (see Sect. 3.2). To account for the pronounced decrease in resistivity observed during the snowmelt period (phase II), this time period was further divided into two sub-periods to enable the development of appropriate reference models. The selected baseline dates and corresponding final RMS misfit were as follows: phase I – 17 April 2024 (RMS 1.01), phase IIa – 22 May 2024 (RMS 1.02) and 20 June 2024 (RMS 1.17), phase IIb – 31 July 2024 (RMS 1.01), and phase IIIa – 14 September 2024 (RMS 1.00).
The mean anchor load was calculated for each defined seasonal phase, and one representative ERT data set with minimal outlier filtering was inverted (Fig. 3a, b). To better relate the ERT models to the prevailing environmental conditions, the inversion dates were aligned with the corresponding webcam images of the rockwall shown in Fig. 3b.
During stable freezing conditions (phase I), anchor loads reached a mean value of 562 kN, while the mean value of the resistivities of the corresponding model was 170 kΩm. The ERT model showed predominantly high resistivity values (> 20 kΩm), with isolated low-resistivity zones. In phase II (snow melt & subsurface warming), mean anchor load decreased to 518 kN and mean resistivity dropped to 6 kΩm. The tomogram showed extensive low-resistivity zones (< 10 kΩm) within the upper layer (∼ 2–3 m depth) from the central to lower section of the profile (x = 24–58 m). During late summer (phase III), mean anchor loads (493 kN) and resistivity (2.5 kΩm) dropped to their seasonal minimum. Almost the entire ERT model exhibited values below 10 kΩm, except for a localised zone near the surface (∼ 2.5 m depth) in the upper part of the profile (x = 0–18 m). This anomaly might be attributed to limited water infiltration, potentially due to shielding by the summit station and the presence of relatively intact rock with fewer discontinuities compared to the lower section of the profile. With the onset of superficial cooling (phase IV), resistivity in this near-surface zone and in a rock outcrop adjacent to borehole B2 (x = 40–46 m) further decreased. Despite this, mean resistivity remained low at 3.4 kΩm, while anchor loads moderately increased to an average of 533 kN. During the deep freezing period (phase V), mean anchor load peaked at 574 kN.
To assess whether the stress dynamics observed from April 2024 to April 2025 reflect typical seasonal patterns, long-term anchor load trends are shown in Fig. A3. Across all observation years, anchor loads exhibit a distinct seasonal pattern: high stress levels during phase I, followed by a pronounced decrease throughout phases II and III, and minimum loads typically occurring during late summer (phase IV). Subsequently, loads increase again during phase V. This seasonal variation was evident for both monitored anchors #9 and #12. The overall long-term decline in maximum and minimum anchor loads is assumed to be attributed to progressive deepening of the active layer over the years, where ice melt at the base of the active layer acts as the primary driver (Pläsken et al., 2026).
4.2 Coupled electrical, mechanical, and thermal response of the rockwall to seasonal forcing
To examine the interrelation between electrical resistivity, anchor loads, and rock temperature across the defined seasonal phases, these parameters were analysed at high temporal resolution (daily scale), as shown in Fig. 4. For comparison of relative changes, we focus on apparent resistivity from deep-reaching signals (DOI 5–9; electrode distances 10–18 m), as the rock mass mechanically affected by the anchors reached an effective perpendicular depth of 13 m.
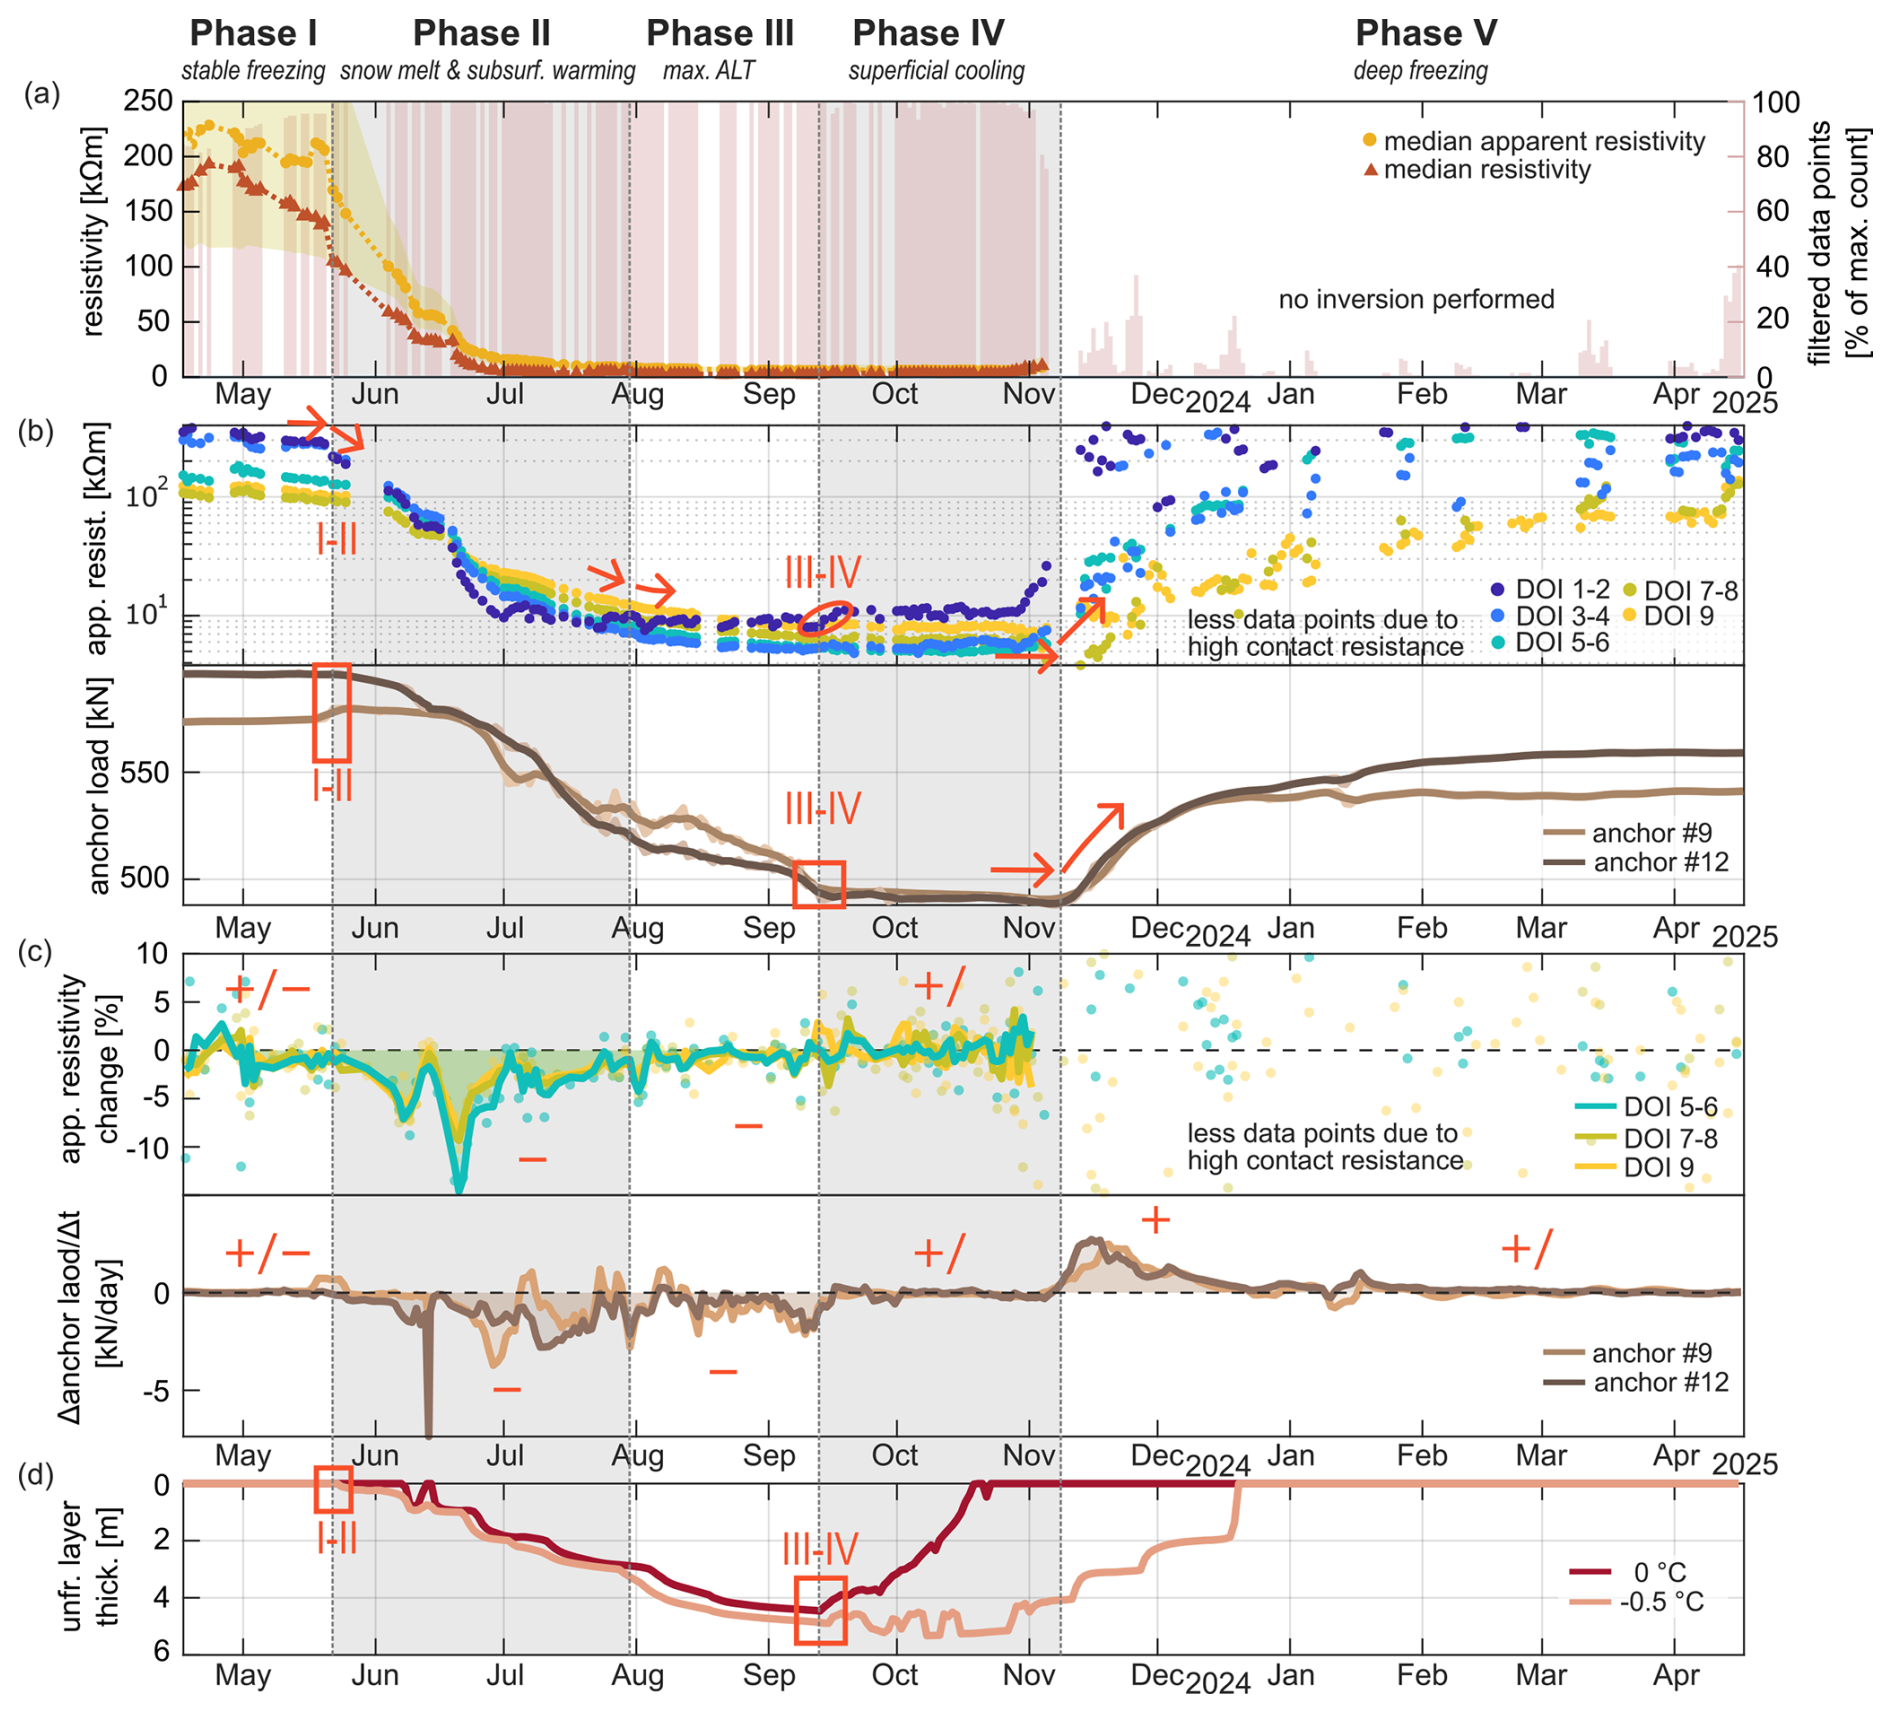
Figure 4(a) Median apparent resistivity with interquartile range (yellow shading). Salmon bars indicate the percentage of available data points (n = 135) after filtering. (b) Median apparent resistivity for specific depths of investigation (DOI) and raw as well as one-week-smoothed anchor load variations. (c) Relative changes in median apparent resistivity from deep-reaching ERT signals (DOI 5–9), smoothed over one week, and the rate of change (first derivative) of anchor loads. (d) Evolution of the unfrozen layer thickness based on the 0 and −0.5 °C isotherms. Red rectangles and arrows indicate the shifts in the parameter's pattern between the seasonal phases.
During phase I (stable freezing), high resistivity values (> 19 kΩm, indicative for frozen conditions; Offer et al., 2025) and high anchor loads correspond well with borehole temperature data, collectively indicating a rock mass predominantly controlled by frozen conditions. All monitored parameters (resistivity, anchor load, and freezing front depth) remained largely stable throughout this time period.
A sharp decline in resistivity to below 10 kΩm occurred during snow melt and subsurface warming (phase II, Fig. 4a, b). The continuous apparent resistivity gradient (DOI 3–9) suggests that individual precipitation events had negligible effects, contrasting with automated ERT observations at the Schilthorn in the Swiss Alps by Hilbich et al. (2011). The onset of decreasing anchor loads and resistivity coincided with the initial development of the active layer (Fig. 4d).
During summer (phase III), the ongoing subsurface warming maintained low resistivity values, while anchor loads continued to decline in response to progressive active layer thickening (Fig. 4). While resistivity primarily reflected the presence of water-filled discontinuities and multilayered flow near the surface, melting of ice in deep-reaching fractures proceeded more slowly due to latent heat consumption, resulting in delayed anchor load responses. At the point of maximum active layer thickness (transition between phases III–IV), cleft ice melt is likely most advanced, coinciding with minimum (stable) anchor loads.
With persistently negative air temperature and the onset of a snow cover (phase IV), superficial ground cooling initiated a slight increase in resistivity observed in the upper layers (DOI 1–2, Fig. 4b). Freezing of water in deep-reaching fractures likely commenced in the subsequent phase V (deep freezing), as both resistivity and anchor loads increased with the downward propagation of the −0.5 °C isotherm (freezing front).
4.3 Temperature-resistivity relation
Figure 5 shows scatter plots of electrical resistivity versus borehole temperature for selected depths ranging from 0.5 to 4.5 m. Borehole temperature data were interpolated at discrete depth levels (0.5, 1.5, 2.5, 3.5, and 4.5 m) using adjacent thermistor measurements. Corresponding median resistivity values were extracted from depth-specific zones of interest, defined as rectangular areas with a vertical extent of 1 m and a horizontal width equivalent to one electrode spacing, bounded laterally by the adjacent electrodes of the borehole (E22 and E23, Fig. 5). Between 0.5 and 3.5 m depth, a seasonal pattern of freezing and thawing was evident, whereas at 4.5 m depth, the temperature remained below 0 °C throughout the entire observation period despite notable variations in resistivity over more than an order of magnitude. During the thawing season (phase II and III), pressurised water flow with hydraulic heads of up to 1.2 bar was observed (Fig. 3a). The observed decrease in resistivity at temperatures down to approximately −2 °C at depths of 2.5–4.5 m may result from the freezing point depression of water and the opening of hydraulic fractures (Offer et al., 2025), which allows fluid water flow to persist below the nominal freezing point. This suggests that substantial amounts of liquid water may be present even under sub-zero conditions, significantly lowering electrical resistivity despite nearly stable temperatures. Such pressurised, water-saturated discontinuities explain the pronounced discrepancies between field and laboratory temperature–resistivity relations during snowmelt and thaw periods (phases II and III, Fig. 5). Laboratory experiments by Offer et al. (2025), conducted on seven saturated core samples with a pore water conductivity of 0.058 ± 0.002 S m−1, comparable to local snowmelt water (0.014 S m−1), captured the temperature–resistivity relation under both frozen and unfrozen conditions but did not replicate the influence of transient water flow in discontinuities observed in the field ERT measurements.
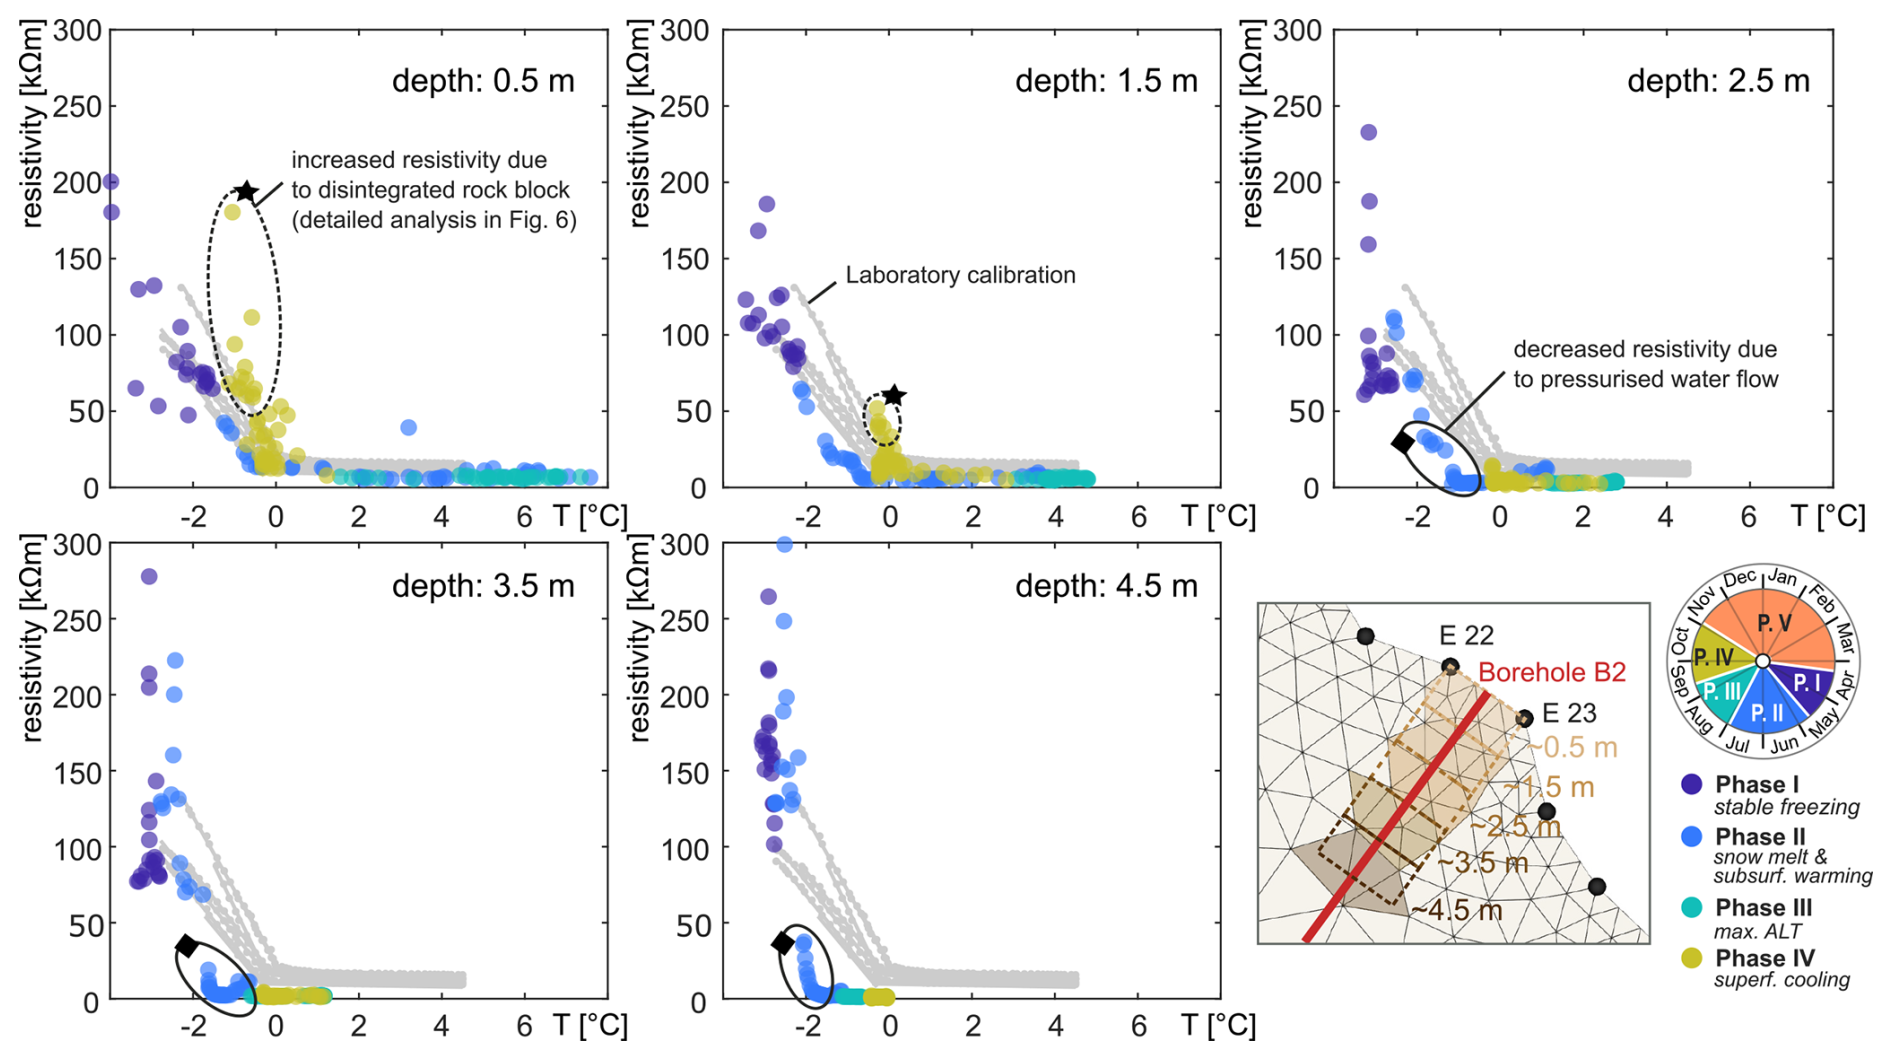
Figure 5Seasonal and depth-dependent temperature–resistivity relationship combining (i) laboratory-derived resistivity experiments on core samples from the study site (grey lines, see Offer et al., 2025 for details) and (ii) field observations. Field data are plotted as median resistivity values for defined zones of interest along the borehole B2. Data points that deviate markedly from the laboratory relations are highlighted: deviations near the surface are attributed to likely high electrode contact resistance caused by surface drying or cooling of a disintegrated rock block, whereas high discrepancies at greater depths (2.5–4.5 m) coincide with periods of pressurised water flow.
At shallower depths (0.5–1.5 m), a hysteresis loop in the temperature-resistivity relation was observed (Fig. 5), likely due to increased contact resistance during the initial surface cooling process and differing electrical behaviours between the freezing and thawing phases (Krautblatter et al., 2010; Mollaret et al., 2019). During the onset of freezing (phase IV), resistivity values remained low at first, as liquid water was still present in the pore spaces. The transition from liquid to frozen pore water increases the ion concentration in the remaining liquid phase, lowering the freezing point and enhancing electrolytic conduction within the pore space. Once the pore spaces were completely frozen, as observed in phase I (stable freezing), resistivity values increased gradually as temperatures decreased. Despite this hysteresis in phase IV (deep freezing), a generally good match between field and laboratory data was found in the upper layers (0.5–1.5 m), as shown in Fig. 5.
The discrepancy in phase IV is likely due to electrode placement on a disintegrated rock outcrop (Fig. 3), where near-surface rock is subject to more rapid drying and freezing. This interpretation is supported by a comparison of apparent resistivity values involving electrodes E22/E23 near the borehole and equivalent electrode spacing at the profile centre (Fig. 6a), which shows substantial deviations during superficial cooling (phase IV). Thus, near-surface resistivity appears to be more strongly influenced by rapid changes in conditions (e.g. saturation, drying, or freezing) associated with local rock surface heterogeneity, while rock temperature responses are delayed and moderated due to thermal damping.
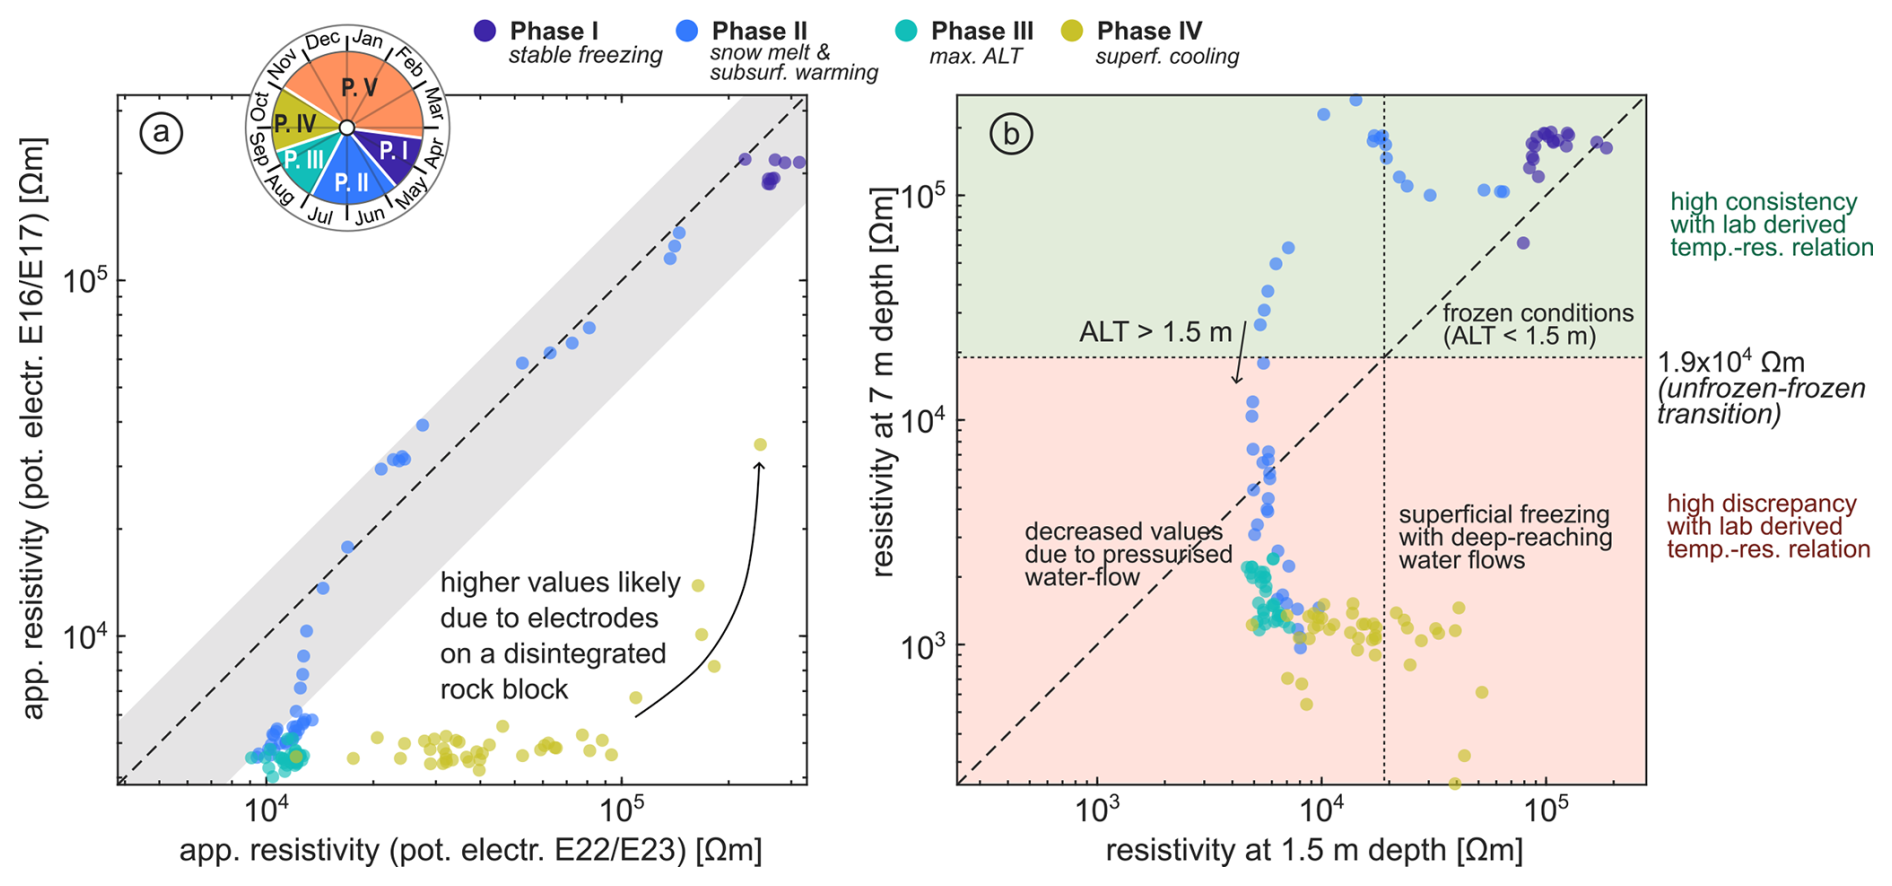
Figure 6(a) Influence of small-scale rock heterogeneity on apparent resistivity, illustrated by a log–log plot comparing quadrupole measurements using potential electrodes E22/E23 (positioned on a disintegrated rock block) with E16/E17 (located at the profile centre). The grey band indicates a ±50 % deviation from the 1 : 1 line. (b) Median resistivity values at depths representative of permafrost conditions (7 m) and seasonally unfrozen conditions (1.5 m). The timing at which the active layer depth exceeds 1.5 m is marked. The transition between the unfrozen and frozen conditions at ∼ 19 kΩm is derived from laboratory experiments, see Offer et al. (2025) and Fig. 5.
Hauck and Hilbich (2024) emphasised that the resistivity gradient between the upper (active) and lower layer is a key indicator for identifying the presence and temporal evolution of permafrost. In our study, the comparison of resistivity values at 7 m depth (borehole temperature confirmed a permafrost body, Fig. 3a) and 1.5 m depth (seasonally unfrozen) further supports the hypothesis of pronounced water flow in discontinuities even in greater depths (Fig. 6b). When the active layer remained shallower than 1.5 m, resistivity at 7 m depth consistently exceeded 19 kΩm, indicating frozen conditions according to the laboratory calibrations of Offer et al. (2025). However, as the active layer deepened beyond 1.5 m during the thawing season, resistivity values in the deeper permafrost zone dropped by more than two orders of magnitude and remained at low levels even when superficial cooling was initiated.
5.1 Seasonal preconditioning of rock instabilities by high hydrostatic and cryostatic pressures
The combined approach of automated ERT, anchor load, and piezometric monitoring revealed seasonal phases of high hydrostatic and cryostatic pressures, which contribute to the conditioning of planes of weakness and subsequent rock instabilities. High hydrostatic pressures increase the effective stress on the rock mass, potentially promoting fracture displacement (Weber et al., 2017; Leinauer et al., 2024) or intensified rockfall activity after rainfall events (Krautblatter and Moser, 2009; Helmstetter and Garambois, 2010). Additionally, percolating water also transports heat more efficiently from the surface to deeper layers than conductive heat transfer (Weber et al., 2025a). This non-conductive heat transport can lead to rapid changes in subsurface temperatures, as indicated by thermal anomalies in borehole temperature (Phillips et al., 2016; Weber et al., 2025b; Offer et al., 2025), potentially forming thaw corridors, accelerating permafrost warming and ice erosion in fractures. When the infiltrating water reaches frozen contact surface, initial ice aggregation can occur, releasing latent heat and thereby rapidly warming the surrounding cold bedrock (Hasler et al., 2011).
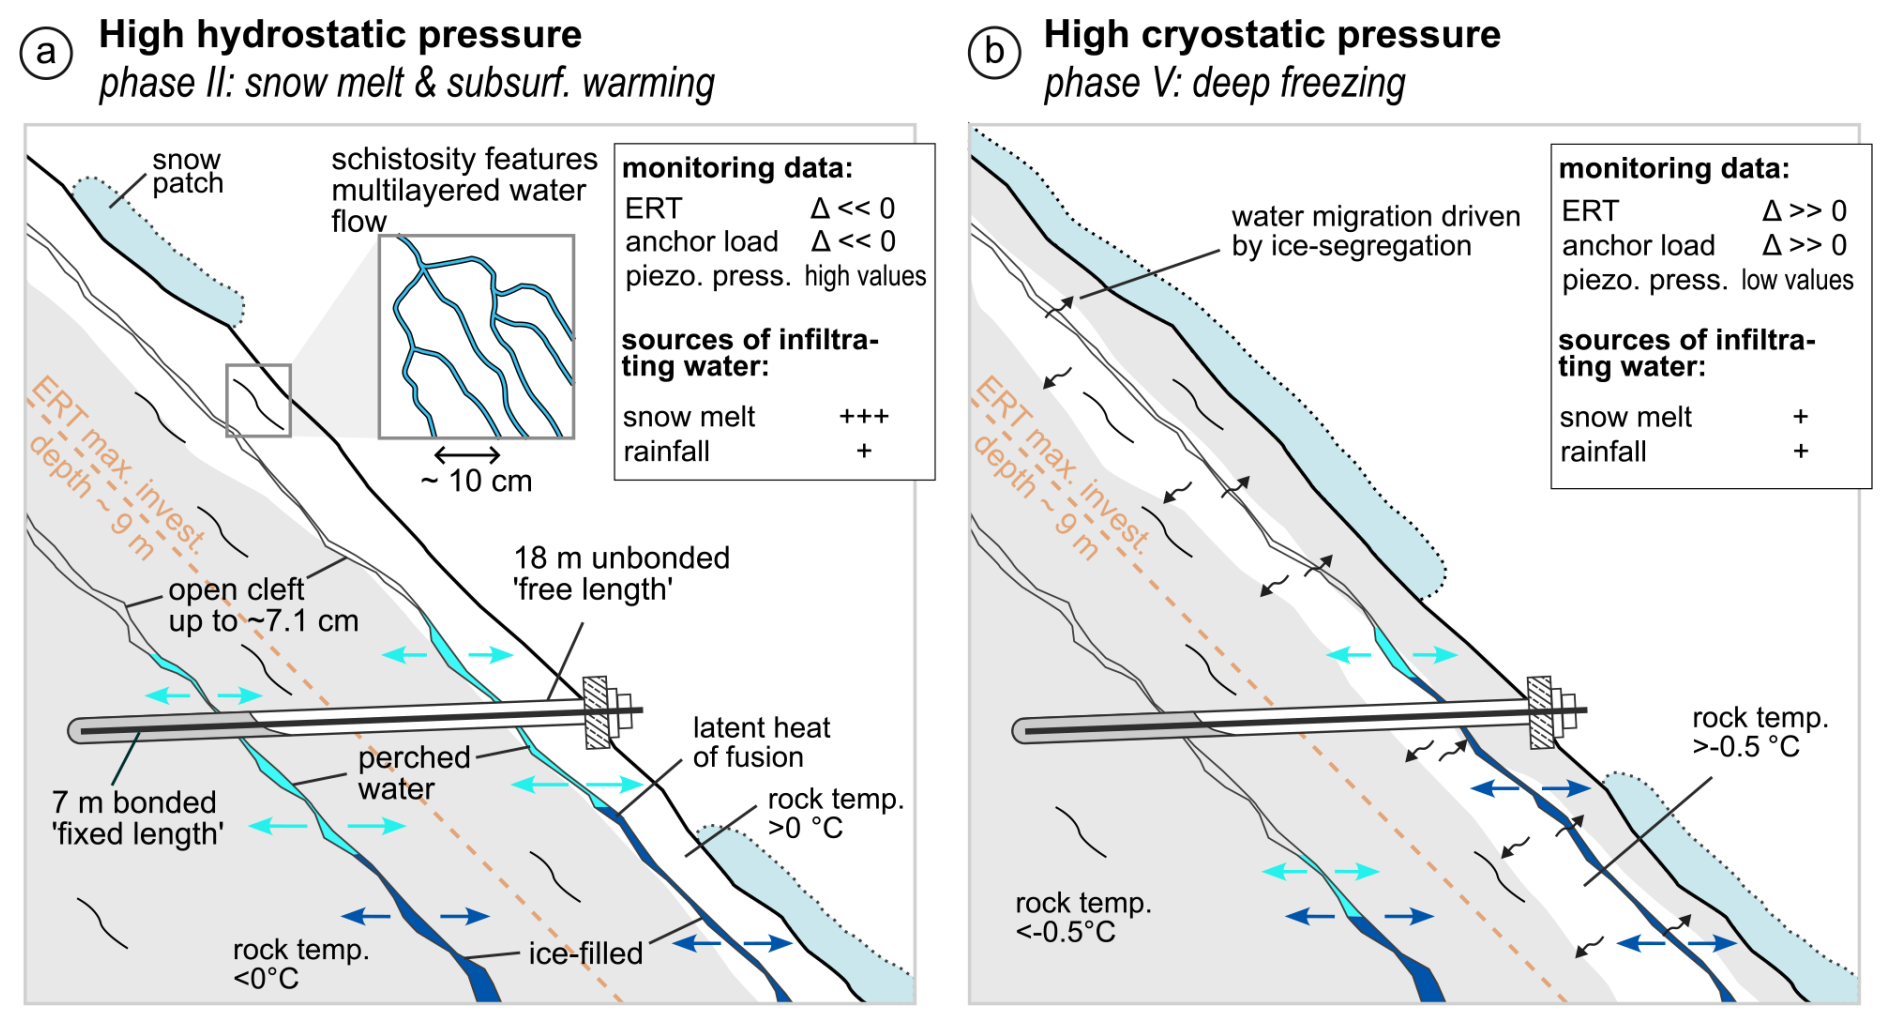
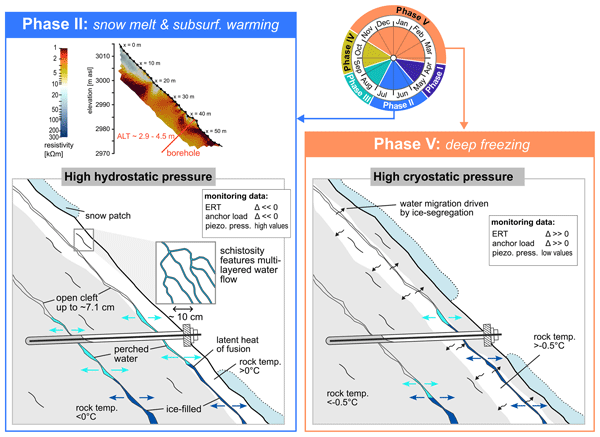
Figure 7Schematic illustration of seasonal phases associated with high (a) hydrostatic and (b) cryostatic pressures that might predispose permafrost rockwalls to instability: (a) During snowmelt and subsurface warming (phase II), high hydrostatic pressure can develop above sealed fractures, leading to mechanically widening of fractures. (b) During deep freezing in winter (phase V), ice formation within discontinuities promotes ice segregation and associated cryostatic pressure build-up, resulting in stress redistribution within the rock mass.
During snow melting and subsurface warming (phase II), increased pore water content, water-filled discontinuities and multilayered water flow along schistosity reduced the median resistivity values rapidly by more than one order of magnitude from 140 to 3.2 kΩm (Fig. 4) and across all investigated depths (Fig. 7a). The pattern of enhanced subsurface electrical conductivity during snowmelt is also reported in other automated monitoring studies in similar settings (Hilbich et al., 2011; Kneisel et al., 2014). As borehole temperature data indicate that subsurface conditions exceeding 4.5 m depth remained frozen throughout snow melting and subsurface warming (phase II), snow melt water is likely perched above ice-filled fissures (Fig. 7a), which exhibit lower hydraulic permeability than unfrozen ones (Pogrebiskiy and Chernyshev, 1977). As a consequence, the pressurised water flow can mechanically widen fractures (Ji et al., 2013), which increases hydraulic conductivity and thus enhances the flux per unit drop in hydraulic head (). Based on Darcy's law, laminar flow through a planar and equally spaced fracture, while accounting for surface roughness (f) and a constant for the flow field geometry (C), is proportional to the cube of the fracture aperture (2b), and described by
The onset of the decline in resistivity values coincided with a reduction in anchor load (Fig. 4), the latter being indicative of stress redistribution within the rock mass. This stress response was likely triggered by the initial development and subsequent deepening of the active layer (Fig. 3) and the associated melting of segregated pore and fracture ice (Pläsken et al., 2026).
During this time window of snow melting and subsurface warming (phase II), shear strength may decrease to the point where it is exceeded by shear forces, potentially leading to slope failures. Recent examples include the collapse of a rock pillar on the Matterhorn (Weber et al., 2025a), a rockslide at the Bliggspitze (Pfluger et al., 2025), and a rock slope failure at the Piz Scerscen (Pierhöfer et al., 2025) and at the Fluchthorn (Krautblatter et al., 2024).
The initiation of autumnal superficial cooling (phase IV) is reflected by increasing electrical resistivity values in the shallow subsurface (DOI 1 and 2; Figs. 4, A4). Although rock temperatures dropped below 0 °C from mid-October onward (Fig. 3a), resistivity values in deeper layers and anchor loads remained stable at low levels (Fig. 4), suggesting that the transition from water- to ice-filled discontinuities at depth and refreezing of the water at the base of the active layer had not yet initiated (Fig. 7b). This can be explained by a depression of the freezing point below 0 °C, caused by rock properties, salinity, or pore pressure (Arenson et al., 2022). Therefore, a rise in hydrostatic pressure is prevented by the water storage capacity of the snow cover (Draebing et al., 2014), and cryostatic pressure remains low due to the absence of ice-crystal formation within cracks and pores, while the cooling increases shear resistance of the rock mass (Krautblatter et al., 2013).
With the ongoing cooling of the subsurface in winter (phase V), the phase transition from water to ice in discontinuities is initiated, releasing latent heat, while cryostatic pressure develops through volumetric expansion and ice segregation. The density change and resulting volume increase (∼ 9 %) during the transition from liquid pore water to ice can theoretically generate ice-induced pressures of up to 207 MPa (Matsuoka and Murton, 2008), sufficient to fracture rock. However, the development of high ice-induced pressures, which requires fully water-saturated conditions (Walder and Hallet, 1986) and rapid, spatially uniform freezing (Matsuoka, 1990; Matsuoka and Murton, 2008), is unlikely at the investigated flank, where freezing proceeds only from one side due to the rockwall geometry and often occurs in unconfined spaces.
In contrast, crystallisation pressure might develop during this time window, as water migration through the porous rock is promoted by the freezing of the water within cracks and pores (Everett, 1961; Walder and Hallet, 1985). The slow freezing rates and sustained subzero rock temperatures observed in winter (Fig. 3a) fulfil the conditions needed for ice segregation (Matsuoka and Murton, 2008). Cooling at both the rock surface and the base of the active layer (Fig. 3a) indicates bidirectional freezing, which promotes the flow of water toward the permafrost table and the rock surface, favouring the formation of segregated ice.
Laboratory tests on metamorphic rocks, including mica schist samples from the Austrian Alps, indicate that the upper thermal limit for ice segregation is close to the pore freezing point (Draebing and Krautblatter, 2019), provided that temperature-gradient-driven suction can develop and sufficient liquid water is available. Theoretical models (Walder and Hallet, 1985) and field measurements (Girard et al., 2013) suggest a lower limit of the ice segregation window between −15 and −6 °C, which depends strongly on site-specific conditions and rock type (Mayer et al., 2023). As the thermal regime of the Kitzsteinhorn north flank lies within this range during the deep freezing in winter (Fig. 3a), ice segregation is likely an effective process at the investigated site. Water supply for ice segregation is probably governed by discontinuities, as the effective porosity of the local calcareous mica schist is low (0.3 %–0.4 %; Aumer et al., 2025). Optical scanning of borehole B1 revealed clefts with apertures up to 71 mm (Fig. A2), which could act as preferential pathways for rapid water movement.
According to Sneddon and Lowengrub (1971), the stress on the rock mass caused by internal ice pressure pi can be described by a stress intensity factor KI, depending on crack length c and assuming a narrow crack width w with
whereby ice lenses must grow spatially independently and uniformly, governed only by internal ice pressure as well as the solid, elastic–brittle properties of the rock mass. At the investigated rockwall, increasing anchor loads (Fig. 4) provided evidence for rising stresses on the rock mass induced by ice segregation (Fig. 7b). This process was triggered by rockwall cooling, indicated by the downward shift of the −0.5 °C isotherm and supported by the increase in resistivity values observed with larger electrode spacings (DOI 5–9, Fig. 4). While the shear strength of rock, ice, and rock–ice contacts increases with cooling, shear forces induced by cryostatic pressure might rise even faster than the shear resistances, potentially preparing rock instabilities (Draebing and Krautblatter, 2019).
5.2 Resistivity-temperature relation: Influence of pressurised water flow and rock characteristics
The bulk electrical resistivity of water-saturated rock reflects several conduction mechanisms: electrolytic conduction through the pore fluid, electronic conduction through the rock matrix, and surface conduction along mineral grain surfaces (e.g. Klein and Santamarina, 2003; Glover, 2010). Beyond these intrinsic rock and pore-water properties, the bulk resistivity of a fractured rockwall is further governed by the distribution and orientation of open cracks and fractures (Zisser et al., 2007).
In our case, pressurised water flow through discontinuities plays a decisive role by reducing the overall electrical resistance, which is further supported by the hydraulic opening of fractures. This mechanism processes lowered resistivity during snow melt infiltration, and in combination with the contrasting resistivity responses during freezing and thawing, produced characteristic hysteresis cycles (Fig. 5); a phenomenon also reported from the Schilthorn by Mollaret et al. (2019). In contrast to the homogeneous lithological conditions and less jointed rock mass investigated by Krautblatter et al. (2010) inside a tunnel, our dataset indicates a stronger influence of heterogeneous rock conditions such as disintegrated blocks, which result in differential behaviour of freezing and drying of the rock subsurface. Despite these challenges of transferring laboratory-scale results to field observations, our dataset shows generally good agreement between the bilinear temperature–resistivity relation derived in the laboratory experiments and the field data, particularly in the upper layer (Fig. 5).
5.3 Operational advices, data reliability, limitations, and benefits of automated ERT monitoring
The maintenance of an automated ERT monitoring system in steep, permafrost-affected rockwalls requires substantial effort due to harsh weather conditions and natural hazards such as rockfalls, avalanches, and lightning strikes. These factors make the system time-consuming to maintain and require ongoing repairs to ensure high-quality data acquisition. To the author's knowledge, similar automated ERT applications in steep permafrost rockwalls have only been reported from two case studies: the same profile at the Kitzsteinhorn (Keuschnig et al., 2017) and at the Aiguille du Midi (Abdulsamad et al., 2026), both of which reported significant data gaps. In contrast, damages to cables in the present study were effectively mitigated through protective tubing (e.g. HDPE or PE), short-distance fixation to the rock surface, and careful alignment of the profile along a stable rock rib. In addition, manually disconnecting the cables from the measuring instruments during lightning storms prevented severe damage to the equipment.
Beyond interpreting ERT results, a key aim of this study is to assess the benefits of automated ERT monitoring in light of the associated technical challenges, operational demands, and maintenance efforts. While manual ERT surveys generally yield lower uncertainties due to individual electrode checks, targeted improvement of contact resistance, manual outlier filtering, and optimised inversion settings, the temporal consistency of resistivity values in the time series (Fig. 4) and the overall low deviation between normal and reciprocal measurements (Fig. 2) offer promising reliability. Consequently, continuous ERT measurements with short time intervals should prioritise the detection of transient phenomena such as infiltration of snowmelt water in spring (phase II), active layer deepening (phase III), and the onset of freezing in autumn (phase IV), all of which are key for understanding coupled thermo-hydro-mechanical interactions rather than focusing on analysing individual datasets. While most long-term assessments of alpine permafrost rely solely on annual end-of-summer measurements without direct temperature borehole validation (e.g. Scandroglio et al., 2021; Buckel et al., 2023), our ERT data exhibit stable median electrical apparent resistivity values during late summer (Fig. 4), confirming the general feasibility of this approach. Nevertheless, identifying the optimal time window to capture extreme thawing-freezing events or maximum active layer thickness remains a challenge (Hilbich et al., 2011), although such periods are crucial for accurately resolving long-term permafrost evolution.
As mentioned above, automated ERT data are more susceptible to uncertainties arising from high contact resistance, random data errors and model-data misfits. While Flores Orozco et al. (2019) removed data points affected by seasonal changes in water and ice content to minimise systematic errors, our study explicitly aims to capture such changes driven by seasonal environmental forcing (Fig. 3a). Therefore, instead of filtering these temporal variations, we only applied a technical filter for identifying data outliers and used the time-lapse inversion approach of LaBrecque and Yang (2001), which effectively mitigated systematic errors and coherent data noise while enabling the detection of small temporal resistivity changes (Yang et al., 2015). Standard reliability assessment methods for manual ERT surveys, such as resolution (e.g Friedel, 2003; Hilbich et al., 2009) and sensitivity matrices (e.g. Hauck et al., 2003) or the DOI index (Oldenburg and Li, 1999; Deceuster et al., 2014), are typically not applied for large datasets of automated ERT studies (e.g., Keuschnig et al., 2017; Mollaret et al., 2019; Bast et al., 2024; Farzamian et al., 2024; Abdulsamad et al., 2026). However, to reduce uncertainties associated with inversion artefacts, incorporating complementary observations and previously acquired geophysical data can be beneficial. Borehole temperature records showed a generally good match between active layer thickness and resistivity data during seasons without pronounced pressurised water flow (Fig. 3), indicated by a consistent temperature–resistivity relation observed in field and laboratory experiments (Fig. 5). Previous ERT surveys with single-inversion routines in 2013 (Keuschnig et al., 2017) and 2023 (Offer et al., 2024, 2025) revealed a similar seasonal pattern of drastic resistivity decrease in summer. The similarity between measured and inverted resistivity trends (Fig. 4a) further supports the minor influence of inversion artefacts relative to the significant temporal variations in the time-series. Other automated ERT studies in alpine regions have reported seasonal variability in electrode contact resistances (e.g. Mollaret et al., 2019; Abdulsamad et al., 2026), which can help identify and filter unreliable data. While technical constraints in our system prevented electrode contact resistance checks before each measurement, earlier ERT surveys at the investigated rockwall indicated acceptable, low contact resistances (< 190 kΩ) in summer (Offer et al., 2025).
While soil moisture information can support the quantification of ground ice when combined with ERT measurements in coarse-debris layers (e.g., Hilbich et al., 2011; Pellet et al., 2016; Morard et al., 2024), new approaches are required to characterise hydrological conditions at greater depths (> 10 m), particularly within fractured permafrost bedrock. Piezometric pressure measurements indicated that during late spring and summer snowmelt, water-saturated conditions are not limited to near-surface layers; instead, liquid water is capable of percolating into deep-reaching fractures, resulting in water level build-up of up to 12 m (Fig. 3a). These hydrological dynamics are essential to interpret the substantial decrease in electrical resistivity observed across the entire depth range of ERT measurements (∼ 10 m, Figs. 3b, 4), while borehole temperatures still indicated permafrost conditions below a depth of 4.5 m (Fig. 3a). Water-saturated conditions with additional hydraulic opening of fractures might trap electrical current, resulting in attenuated current penetration into deeper subsurface layers.
In this study, we resolved the hydrothermally driven mechanical forcing in a permafrost rock slope by combining automated ERT data with anchor-load measurements, borehole temperature records, and piezometer observations collected throughout an entire year (63 % ERT data coverage). The dataset was analysed within a framework of five characteristic phases of seasonal forcing on permafrost rockwalls, derived from temporal shifts in air and rock temperature, snow cover, and water levels: stable freezing (phase I), snow melt and subsurface warming (phase II), maximum active layer thickness (phase III), superficial cooling (phase IV), and deep freezing (phase V). Seasonal variations in the automated ERT data revealed phases of elevated hydrostatic pressures caused by snowmelt water flow through fractures (phase II) and cryostatic forcing linked to ice segregation (phase V), which were further supported by coincident anchor load changes indicating stress redistribution within the jointed rock mass. Resistivity-temperature relations derived from laboratory experiments and field observations highlighted the pronounced reduction in resistivity values caused by pressurised water flow, as additionally evidenced by piezometer observations. Our findings from the automated ERT monitoring highlight its potential to decipher the seasonal phases of increased mechanical forcing in permafrost rockwalls, which are of particular interest for understanding the preconditioning of rock instabilities.
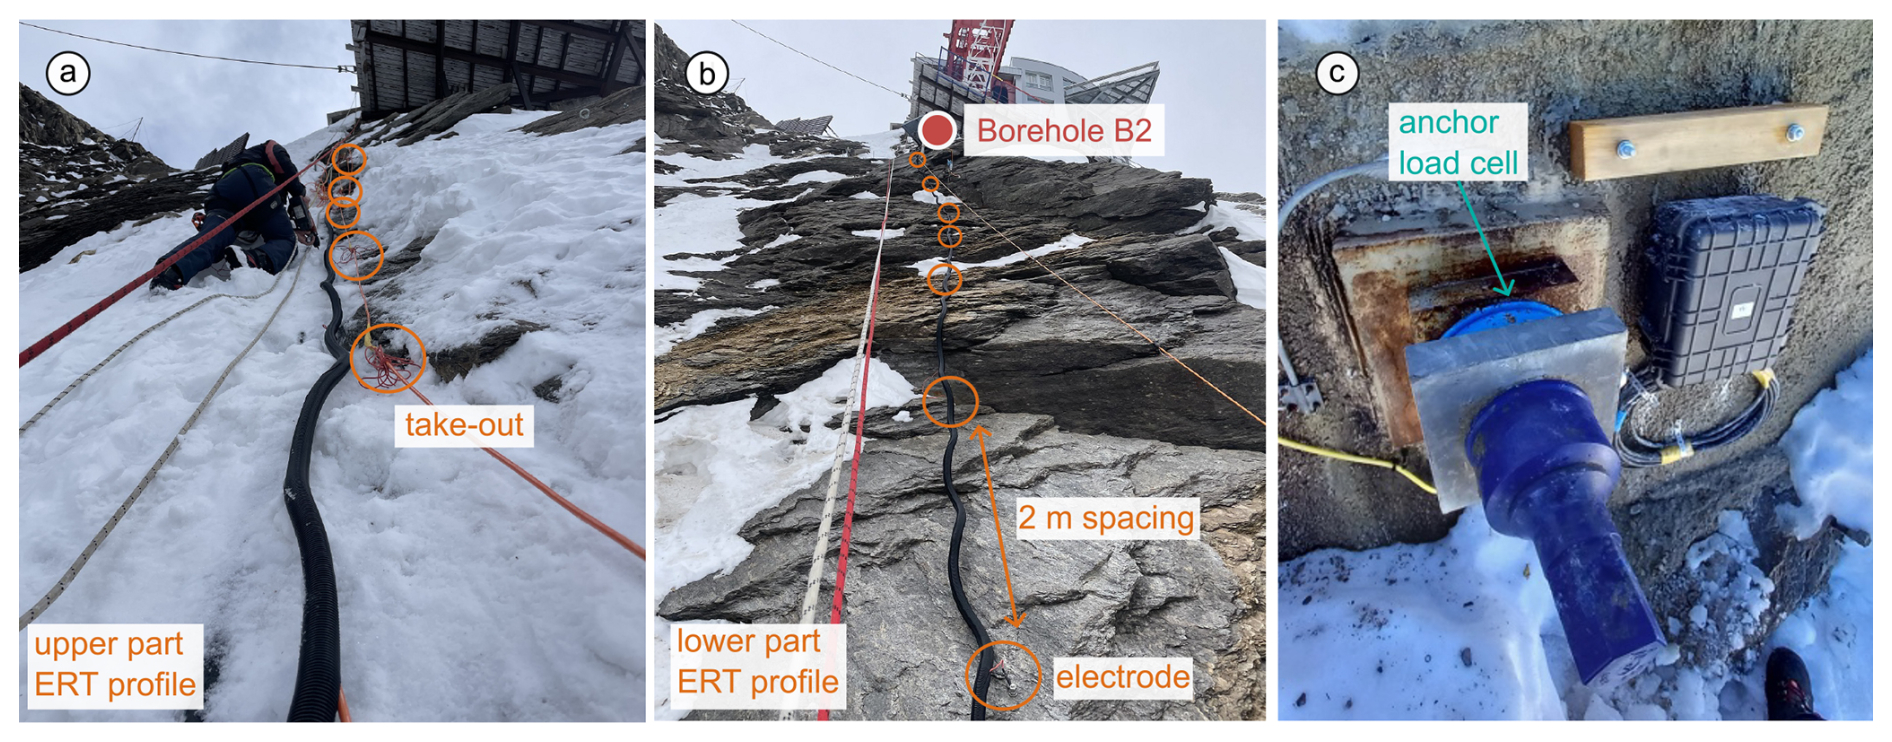
Figure A1(a, b) Installation of the automated ERT monitoring with 2 m electrode spacing at the steep rockwall. The rock mass is characterised by pronounced discontinuities, including slope-parallel schistosity and several joint sets, which are particularly developed in the lower section of the profile. Borehole B2 is positioned along the ERT transect and was drilled through a disintegrated rock block. (c) Load-cell installation at the head of a 25 m long corrosion-protected anchor (18 m free length, 7 m friction-locked grouted), which primarily captures the relative strain variations between the activated rock mass and the free anchor length.
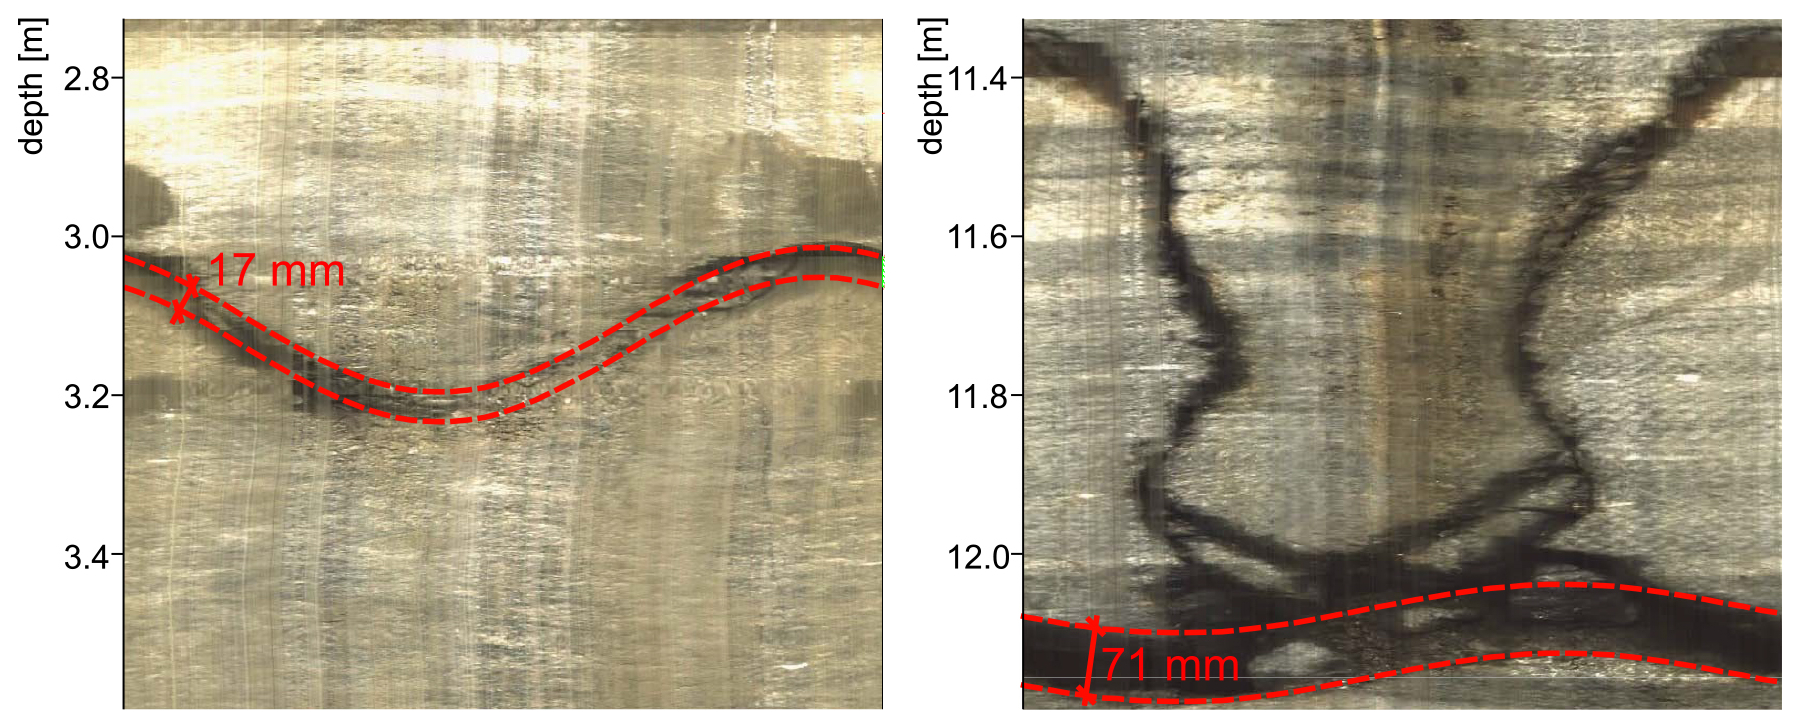
Figure A2The high degree of fracturing of the rockwall is shown by an optical scan of a vertical drilled borehole located within < 2 m of electrode 1 (x = 0 m). The upper meters of the borehole scan revealed open discontinuities with apertures of 17 and 71 mm, providing effective pathways for water infiltration or ice formation.
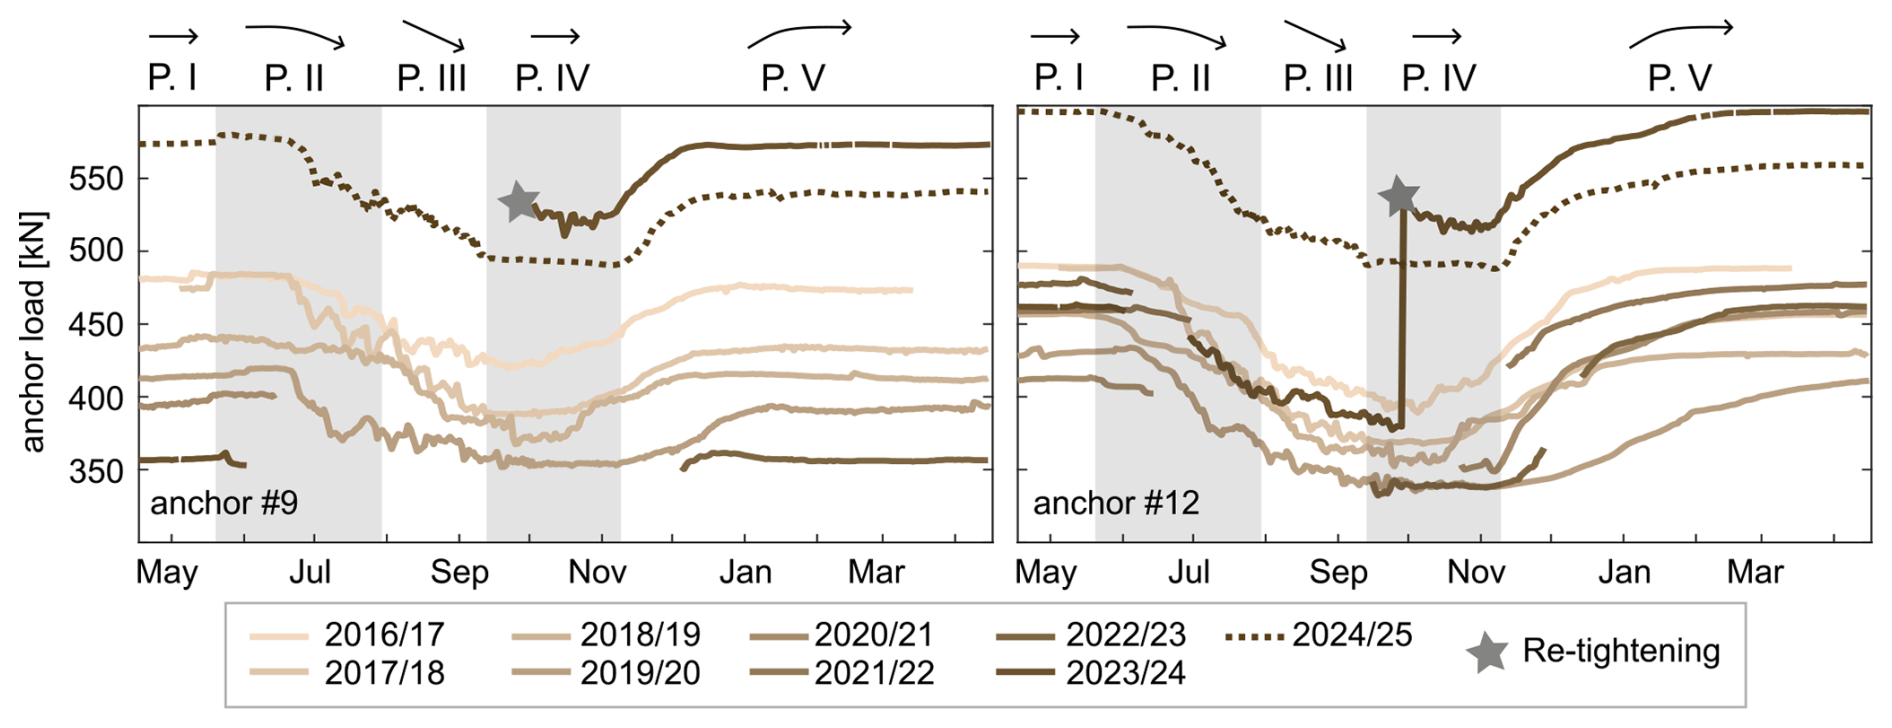
Figure A3Seasonal patterns in anchor loads since the start of monitoring in 2016. High loads during phase I (stable freezing) are followed by a progressive decrease through phases II (snow melt and subsurface warming) and III (maximum active layer thickness), with minimum values typically observed in late summer in phase IV (superficial cooling). Loads increase again during phase V (deep freezing). The period of automated ERT monitoring between April 2024 and April 2025 is highlighted by a dashed line. Anchor re-tightening events are indicated.
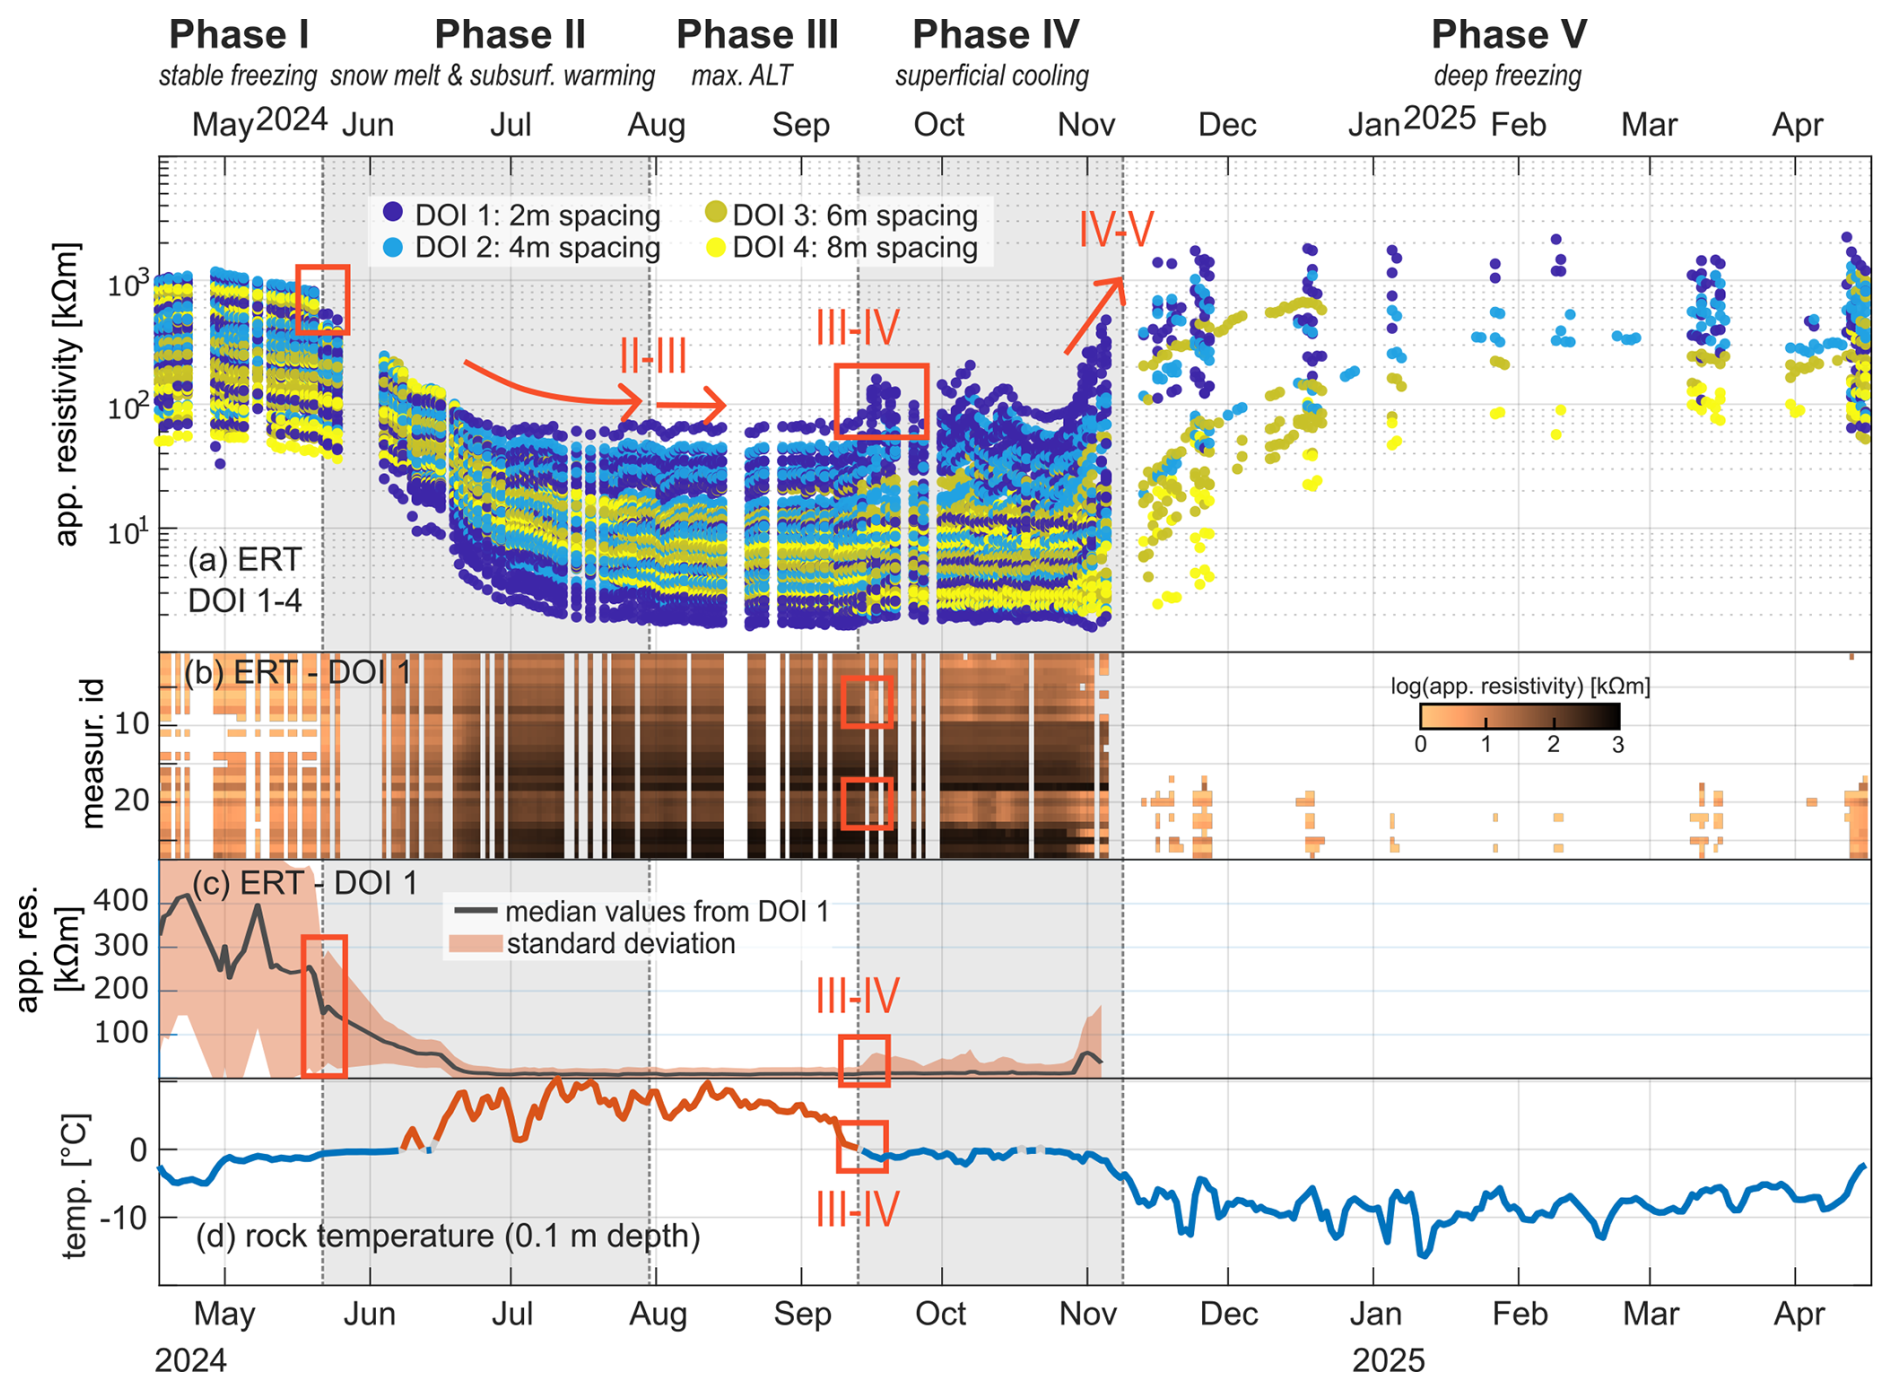
Figure A4Apparent electrical resistivity and near-surface rock temperature: (a) Apparent resistivity in the upper subsurface layer measured with electrode spacing between 2 to 8 m (DOI 1–4). (b, c) Apparent resistivity near the rock surface with 2 m electrode spacing. (d) Rock temperature at 0.1 m depth in borehole B2, showing positive temperatures between early June and mid-September 2024. Red rectangles and arrows highlight shifts in parameter patterns corresponding to different seasonal phases.
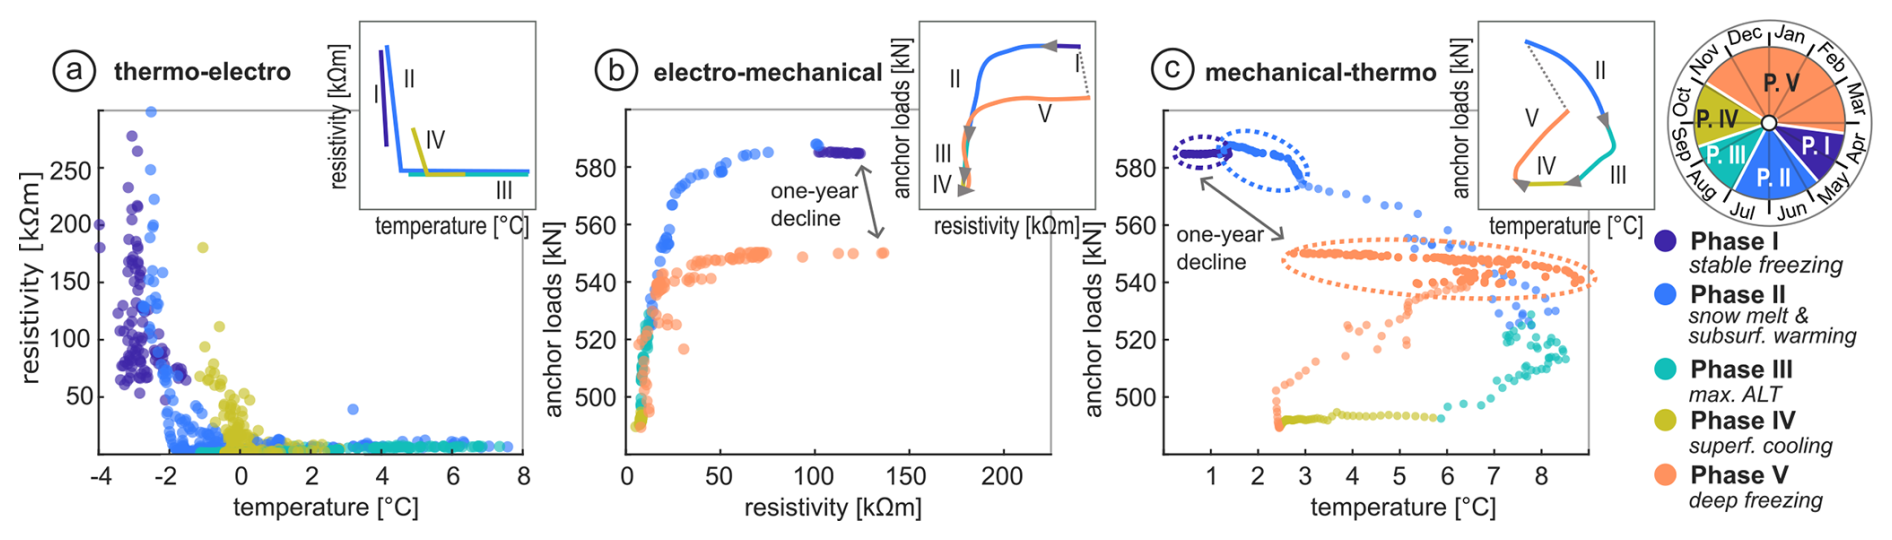
Figure A5Electro-thermo-mechanical interaction of the rockwall with schematic representations for phases I–V: (a) Temperature–resistivity relation along borehole B2 down to 5 m depth, (b) resistivity–load relation based on the median apparent resistivity (from DOI 9, corresponding to a maximum electrode spacing of 18 m) and the mean load of both anchors, (c) temperature-load relation, represented by the mean anchor load and the temperature range (minimum to maximum) measured along the perpendicular anchor length (0–13 m). Dashed-line circles indicate periods when temperatures were entirely below 0 °C, making cryosuction unlikely. The one-year decline in anchor load is marked accordingly.
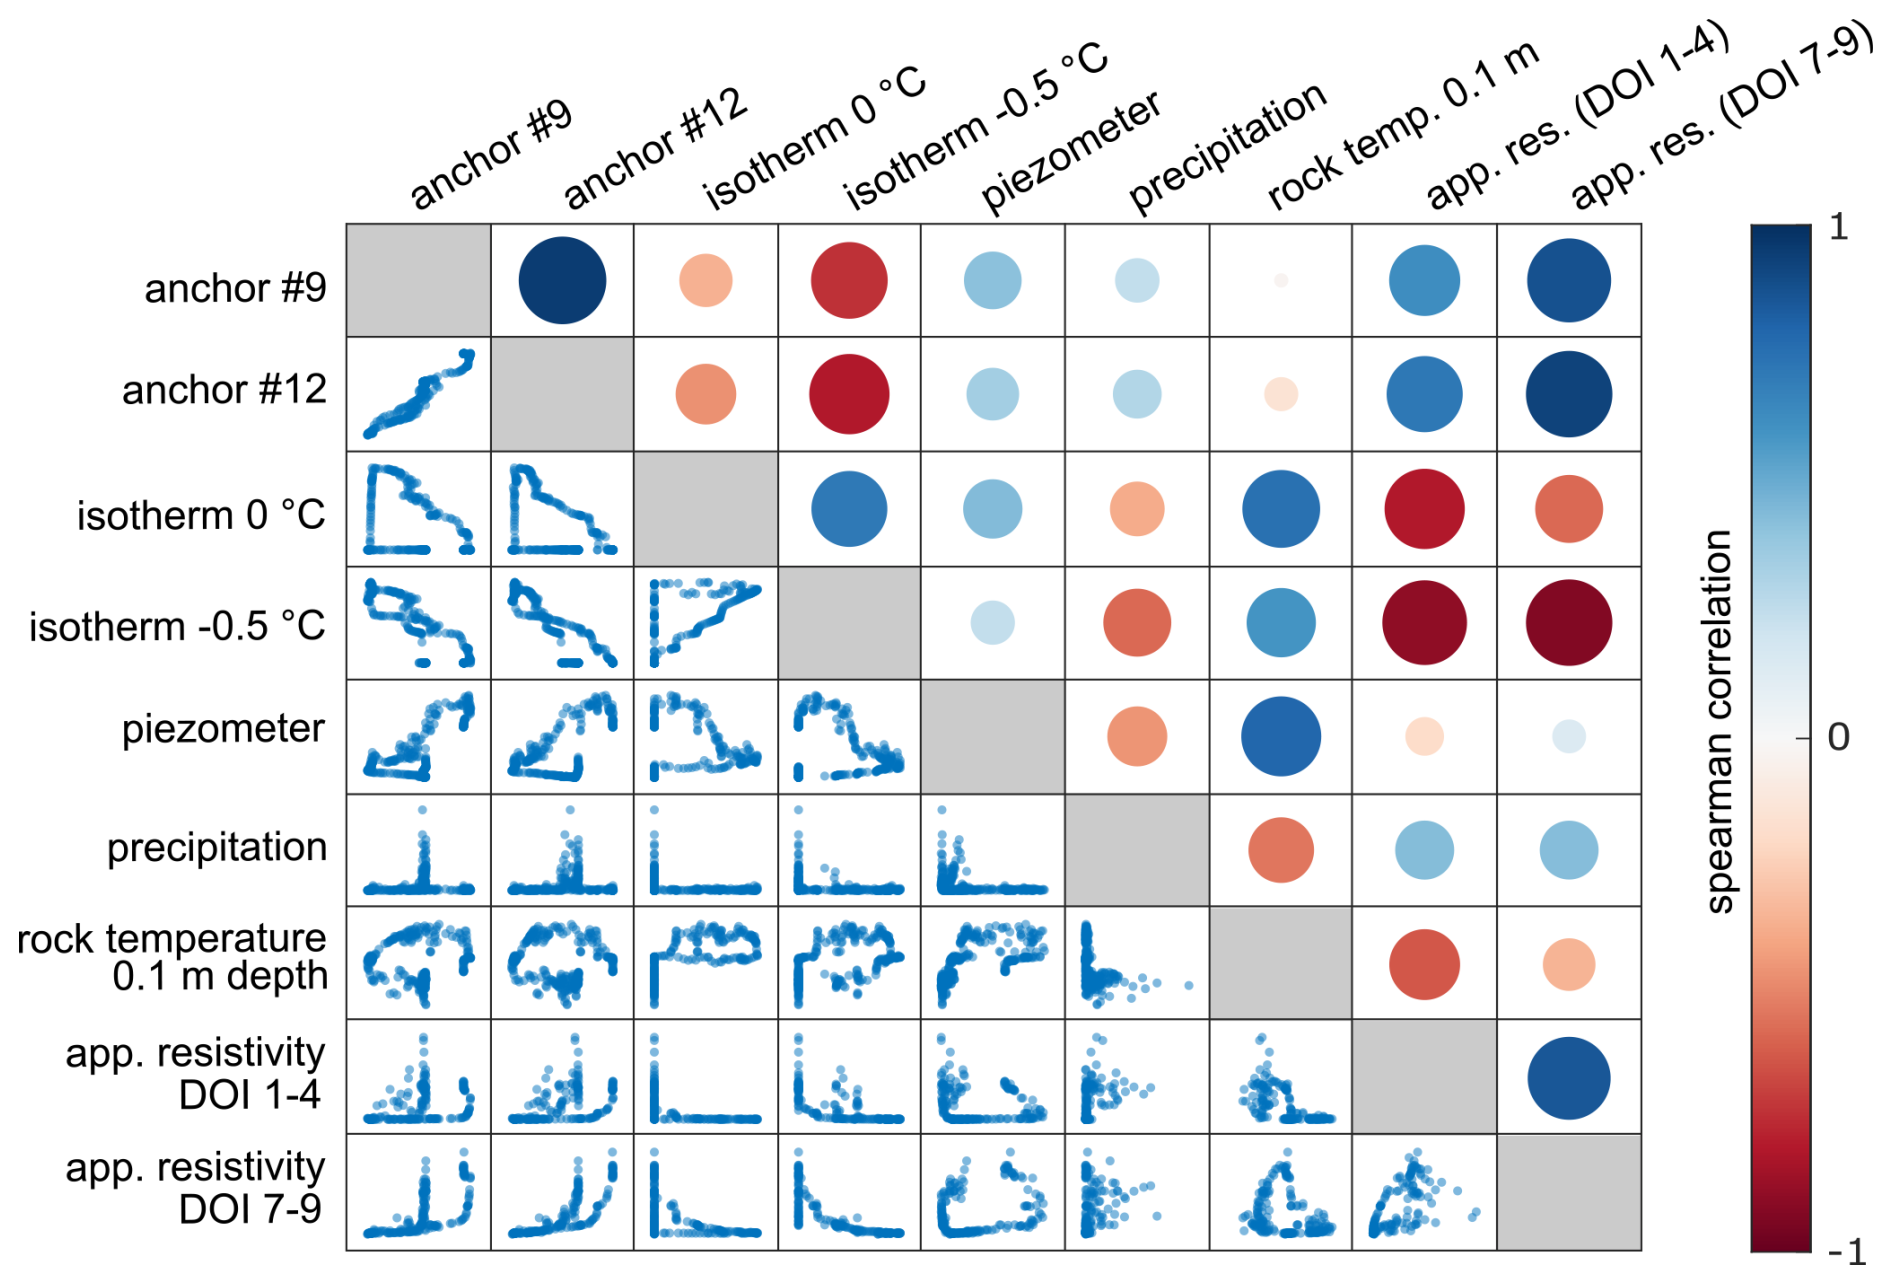
Figure A6Correlation matrix based on Spearman's rank correlation coefficient: the lower triangle shows bivariate scatterplots. The upper triangle displays correlation coefficients as colored circles, where color represents the direction and strength of the correlation and the circle's diameter is proportional to the absolute correlation value.
Data will be made available on request.
MO conducted the ERT measurements and performed the data analysis. IH carried out our fieldwork related to borehole temperature, piezometer and anchor loads measurements. MO and SW developed the concept of the study. MO prepared the manuscript with revision and final approval from all authors.
At least one of the (co-)authors is a member of the editorial board of Earth Surface Dynamics. The peer-review process was guided by an independent editor, and the authors also have no other competing interests to declare.
Publisher's note: Copernicus Publications remains neutral with regard to jurisdictional claims made in the text, published maps, institutional affiliations, or any other geographical representation in this paper. The authors bear the ultimate responsibility for providing appropriate place names. Views expressed in the text are those of the authors and do not necessarily reflect the views of the publisher.
This study is part of the “Open-Air Lab Kitzsteinhorn” (OpAL), a high alpine observatory dedicated to the long-term monitoring of climate change effects at multiple scales. We thank the Gletscherbahnen Kaprun AG for financial, technical and logistical support. We would also like to acknowledge Maximilian Rau, Carolin Kiefer, Simon Mühlbauer, and Verena Stammberger for their excellent support during field work. We further thank the editor, Tom Coulthard, as well as Lukas U. Arenson and one anonymous referee for their constructive comments, which helped to improve the manuscript.
Maike Offer acknowledged PhD funding from the Deutsche Bundesstiftung Umwelt (DBU). In addition, this research has been supported by the Gletscherbahnen Kaprun AG and was co-funded by the European Union through the Interreg VI-A Italy-Austria 2021–2027 programme (Project: FROST.INI, ITAT-24-005).
This paper was edited by Tom Coulthard and reviewed by Lukas U. Arenson and one anonymous referee.
Abdulsamad, F., Bock, J., Magnin, F., Malet, E., Revil, A., Ben-Asher, M., Richard, J., Duvillard, P.-A., Karaoulis, M., Condom, T., Ravanel, L., and Deline, P.: Rockwall permafrost dynamics evidenced by repeated and Automated Electrical Resistivity Tomography at Aiguille du Midi (3842 m a.s.l., French Alps), The Cryosphere, 20, 2181–2207, https://doi.org/10.5194/tc-20-2181-2026, 2026. a, b, c, d
Arenson, L. U., Harrington, J. S., Koenig, C. E. M., and Wainstein, P. A.: Mountain Permafrost Hydrology-A Practical Review Following Studies from the Andes, Geosciences, 12, 48, https://doi.org/10.3390/geosciences12020048, 2022. a
Aumer, W., Hartmeyer, I., Görres, C.-M., Uteau, D., Offer, M., and Peth, S.: Modeling active layer thickness in permafrost rock walls based on an analytical solution of the heat transport equation, Kitzsteinhorn, Hohe Tauern Range, Austria, Earth Surf. Dynam., 13, 473–493, https://doi.org/10.5194/esurf-13-473-2025, 2025. a, b, c
Bast, A., Kenner, R., and Phillips, M.: Short-term cooling, drying, and deceleration of an ice-rich rock glacier, The Cryosphere, 18, 3141–3158, https://doi.org/10.5194/tc-18-3141-2024, 2024. a, b, c, d
Ben-Asher, M., Magnin, F., Westermann, S., Bock, J., Malet, E., Berthet, J., Ravanel, L., and Deline, P.: Estimating surface water availability in high mountain rock slopes using a numerical energy balance model, Earth Surf. Dynam., 11, 899–915, https://doi.org/10.5194/esurf-11-899-2023, 2023. a, b
Ben-Asher, M., Chabas, A., Josnin, J.-Y., Bock, J., Malet, E., Poulain, A., Perrette, Y., and Magnin, F.: Water flow timing, quantity, and sources in a fractured high mountain permafrost rock wall, Hydrol. Earth Syst. Sci., 30, 1735–1754, https://doi.org/10.5194/hess-30-1735-2026, 2026. a
Blanchy, G., Saneiyan, S., Boyd, J., McLachlan, P., and Binley, A.: ResIPy, an intuitive open source software for complex geoelectrical inversion/modeling, Comput. Geosci., 137, 104423, https://doi.org/10.1016/j.cageo.2020.104423, 2020. a
Buckel, J., Mudler, J., Gardeweg, R., Hauck, C., Hilbich, C., Frauenfelder, R., Kneisel, C., Buchelt, S., Blöthe, J. H., Hördt, A., and Bücker, M.: Identifying mountain permafrost degradation by repeating historical electrical resistivity tomography (ERT) measurements, The Cryosphere, 17, 2919–2940, https://doi.org/10.5194/tc-17-2919-2023, 2023. a, b
Cathala, M., Bock, J., Magnin, F., Ravanel, L., Ben Asher, M., Astrade, L., Bodin, X., Chambon, G., Deline, P., Faug, T., Genuite, K., Jaillet, S., Josnin, J.-Y., Revil, A., and Richard, J.: Predisposing, triggering and runout processes at a permafrost–affected rock avalanche site in the French Alps (Étache, June 2020), Earth Surf. Process. Landf., https://doi.org/10.1002/esp.5881, 2024. a
Cornelius, H. P. and Clar, E.: Erläuterungen zur geologischen Karte des Glocknergebietes (1 : 25 000), Geologische BundesanstaltWien III, 1935. a
Deceuster, J., Etienne, A., Robert, T., Nguyen, F., and Kaufmann, O.: A modified DOI-based method to statistically estimate the depth of investigation of dc resistivity surveys, J. Appl. Geophys., 103, 172–185, https://doi.org/10.1016/j.jappgeo.2014.01.018, 2014. a
Draebing, D. and Krautblatter, M.: The Efficacy of Frost Weathering Processes in Alpine Rockwalls, Geophys. Res. Lett., 46, 6516–6524, https://doi.org/10.1029/2019GL081981, 2019. a, b
Draebing, D., Krautblatter, M., and Dikau, R.: Interaction of thermal and mechanical processes in steep permafrost rock walls: A conceptual approach, Geomorphology, 226, 226–235, https://doi.org/10.1016/j.geomorph.2014.08.009, 2014. a, b, c
Draebing, D., Krautblatter, M., and Hoffmann, T.: Thermo–cryogenic controls of fracture kinematics in permafrost rockwalls, Geophys. Res. Lett., 44, 3535–3544, https://doi.org/10.1002/2016GL072050, 2017. a
Duca, S., Occhiena, C., Mattone, M., Sambuelli, L., and Scavia, C.: Feasibility of Ice Segregation Location by Acoustic Emission Detection: A Laboratory Test in Gneiss, Permafr. Periglac. Process., 25, 208–219, https://doi.org/10.1002/ppp.1814, 2014. a
Duvillard, P.-A., Ravanel, L., Marcer, M., and Schoeneich, P.: Recent evolution of damage to infrastructure on permafrost in the French Alps, Reg. Environ. Change, 19, 1281–1293, https://doi.org/10.1007/s10113-019-01465-z, 2019. a
Everett, D. H.: The thermodynamics of frost damage to porous solids, Trans. Faraday Soc., 57, 1541–1551, https://doi.org/10.1039/tf9615701541, 1961. a
Farzamian, M., Herring, T., Vieira, G., de Pablo, M. A., Yaghoobi Tabar, B., and Hauck, C.: Employing automated electrical resistivity tomography for detecting short- and long-term changes in permafrost and active-layer dynamics in the maritime Antarctic, The Cryosphere, 18, 4197–4213, https://doi.org/10.5194/tc-18-4197-2024, 2024. a, b
Flores Orozco, A., Bücker, M., Steiner, M., and Malet, J.-P.: Complex-conductivity imaging for the understanding of landslide architecture, Eng. Geol., 243, 241–252, https://doi.org/10.1016/j.enggeo.2018.07.009, 2018. a
Flores Orozco, A., Kemna, A., Binley, A., and Cassiani, G.: Analysis of time-lapse data error in complex conductivity imaging to alleviate anthropogenic noise for site characterization, Geophysics, 84, B181–B193, https://doi.org/10.1190/geo2017-0755.1, 2019. a
Friedel, S.: Resolution, stability and efficiency of resistivity tomography estimated from a generalized inverse approach, Geophys. J. Int., 153, 305–316, https://doi.org/10.1046/j.1365-246X.2003.01890.x, 2003. a
Geuzaine, C. and Remacle, J.-F.: Gmsh: A 3–D finite element mesh generator with built–in pre– and post–processing facilities, Int. J. Numer. Methods Eng., 79, 1309–1331, https://doi.org/10.1002/nme.2579, 2009. a
Girard, L., Gruber, S., Weber, S., and Beutel, J.: Environmental controls of frost cracking revealed through in situ acoustic emission measurements in steep bedrock, Geophys. Res. Lett., 40, 1748–1753, https://doi.org/10.1002/grl.50384, 2013. a, b
Gischig, V., Preisig, G., and Eberhardt, E.: Numerical Investigation of Seismically Induced Rock Mass Fatigue as a Mechanism Contributing to the Progressive Failure of Deep-Seated Landslides, Rock Mech. Rock Eng., 49, 2457–2478, https://doi.org/10.1007/s00603-015-0821-z, 2016. a
Gisnås, K., Westermann, S., Schuler, T. V., Melvold, K., and Etzelmüller, B.: Small-scale variation of snow in a regional permafrost model, The Cryosphere, 10, 1201–1215, https://doi.org/10.5194/tc-10-1201-2016, 2016. a
Glover, P. W. J.: A generalized Archie's law for n phases, Geophysics, 75, E247–E265, https://doi.org/10.1190/1.3509781, 2010. a
Gruber, S. and Haeberli, W.: Permafrost in steep bedrock slopes and its temperature-related destabilization following climate change, J. Geophys. Res., 112, https://doi.org/10.1029/2006JF000547, 2007. a
Haberkorn, A., Wever, N., Hoelzle, M., Phillips, M., Kenner, R., Bavay, M., and Lehning, M.: Distributed snow and rock temperature modelling in steep rock walls using Alpine3D, The Cryosphere, 11, 585–607, https://doi.org/10.5194/tc-11-585-2017, 2017. a
Hartmeyer, I. and Otto, J.-C.: Rockfall, glacier recession, and permafrost degradation: long-term monitoring of climate change impacts at the Open-Air-Lab Kitzsteinhorn, Hohe Tauern, DEUQUA Spec. Pub., 5, 3–12, https://doi.org/10.5194/deuquasp-5-3-2024, 2024. a
Hartmeyer, I., Keuschnig, M., and Schrott, L.: A scale-oriented approach for the long-term monitoring of ground thermal conditions in permafrost-affected rock faces, Kitzsteinhorn, Hohe Tauern Range, Austria, Austrian J. Earth Sci., 128–139, 2012. a
Hartmeyer, I., Delleske, R., Keuschnig, M., Krautblatter, M., Lang, A., Schrott, L., and Otto, J.-C.: Current glacier recession causes significant rockfall increase: the immediate paraglacial response of deglaciating cirque walls, Earth Surf. Dynam., 8, 729–751, https://doi.org/10.5194/esurf-8-729-2020, 2020a. a, b
Hartmeyer, I., Keuschnig, M., Delleske, R., Krautblatter, M., Lang, A., Schrott, L., Prasicek, G., and Otto, J.-C.: A 6-year lidar survey reveals enhanced rockwall retreat and modified rockfall magnitudes/frequencies in deglaciating cirques, Earth Surf. Dynam., 8, 753–768, https://doi.org/10.5194/esurf-8-753-2020, 2020b. a
Hasler, A., Gruber, S., Font, M., and Dubois, A.: Advective Heat Transport in Frozen Rock Clefts: Conceptual Model, Laboratory Experiments and Numerical Simulation, Permafr. Periglac. Process., 22, 378–389, https://doi.org/10.1002/ppp.737, 2011. a, b
Hasler, A., Gruber, S., and Beutel, J.: Kinematics of steep bedrock permafrost, J. Geophys. Res., 117, https://doi.org/10.1029/2011JF001981, 2012. a
Hauck, C. and Hilbich, C.: Preconditioning of mountain permafrost towards degradation detected by electrical resistivity, Environ. Res. Lett., 19, 064010, https://doi.org/10.1088/1748-9326/ad3c55, 2024. a, b
Hauck, C. and Mühll, D. V.: Inversion and interpretation of two–dimensional geoelectrical measurements for detecting permafrost in mountainous regions, Permafr. Periglac. Process., 14, 305–318, https://doi.org/10.1002/ppp.462, 2003. a
Hauck, C., Vonder Mühll, D., and Maurer, H.: Using DC resistivity tomography to detect and characterize mountain permafrost, Geophys. Prospect., 51, 273–284, https://doi.org/10.1046/j.1365-2478.2003.00375.x, 2003. a
Helmstetter, A. and Garambois, S.: Seismic monitoring of Séchilienne rockslide (French Alps): Analysis of seismic signals and their correlation with rainfalls, J. Geophys. Res., 115, https://doi.org/10.1029/2009JF001532, 2010. a
Herring, T., Lewkowicz, A. G., Hauck, C., Hilbich, C., Mollaret, C., Oldenborger, G. A., Uhlemann, S., Farzamian, M., Calmels, F., and Scandroglio, R.: Best practices for using electrical resistivity tomography to investigate permafrost, Permafr. Periglac. Process., 34, 494–512, https://doi.org/10.1002/ppp.2207, 2023. a, b, c
Hilbich, C., Marescot, L., Hauck, C., Loke, M. H., and Mäusbacher, R.: Applicability of electrical resistivity tomography monitoring to coarse blocky and ice–rich permafrost landforms, Permafr. Periglac. Process., 20, 269–284, https://doi.org/10.1002/ppp.652, 2009. a
Hilbich, C., Fuss, C., and Hauck, C.: Automated Time–lapse ERT for Improved Process Analysis and Monitoring of Frozen Ground, Permafr. Periglac. Process., 22, 306–319, https://doi.org/10.1002/ppp.732, 2011. a, b, c, d, e, f
Hoeck, V., Pestal, G., Brandmaier, P., Clar, E., Cornelius, H., Frank, W., Matl, H., Neumayr, P., Petrakakis, K., Stadlmann, T., and Steyrer, H.: Geologische Karte der Republik Österreich: Blatt 153 Großglockner, Geologische Bundesanstalt, Vienna, 1994. a
Huggel, C., Zgraggen-Oswald, S., Haeberli, W., Kääb, A., Polkvoj, A., Galushkin, I., and Evans, S. G.: The 2002 rock/ice avalanche at Kolka/Karmadon, Russian Caucasus: assessment of extraordinary avalanche formation and mobility, and application of QuickBird satellite imagery, Nat. Hazards Earth Syst. Sci., 5, 173–187, https://doi.org/10.5194/nhess-5-173-2005, 2005. a
Jacquemart, M., Weber, S., Chiarle, M., Chmiel, M., Cicoira, A., Corona, C., Eckert, N., Gaume, J., Giacona, F., Hirschberg, J., Kaitna, R., Magnin, F., Mayer, S., Moos, C., van Herwijnen, A., and Stoffel, M.: Detecting the impact of climate change on alpine mass movements in observational records from the European Alps, Earth-Sci. Rev., 258, 104886, https://doi.org/10.1016/j.earscirev.2024.104886, 2024. a
Ji, S.-H., Koh, Y.-K., Kuhlman, K. L., Lee, M. Y., and Choi, J. W.: Influence of Pressure Change During Hydraulic Tests on Fracture Aperture, Groundwater, 51, 298–304, https://doi.org/10.1111/j.1745-6584.2012.00968.x, 2013. a
Karaoulis, M., Tsourlos, P., Kim, J.-H., and Revil, A.: 4D time–lapse ERT inversion: introducing combined time and space constraints, Near Surf. Geophys., 12, 25–34, https://doi.org/10.3997/1873-0604.2013004, 2014. a
Keller, F. and Gubler, H. U.: Interaction between snowcover and high mountain permafrost at Murtèl/Corvatsch, Swiss Alps, in: Sixth International Conference on Permafrost, Beijing, 1, 332–337, 1993. a
Keuschnig, M., Krautblatter, M., Hartmeyer, I., Fuss, C., and Schrott, L.: Automated electrical resistivity tomography testing for early Warning in unstable permafrost rock walls around alpine infrastructure, Permafr. Periglac. Process., 28, 158–171, https://doi.org/10.1002/ppp.1916, 2017. a, b, c, d, e, f, g, h
Klein, K. A. and Santamarina, J. C.: Electrical Conductivity in Soils: Underlying Phenomena, J. Environ. Eng. Geophys., 8, 263–273, https://doi.org/10.4133/jeeg8.4.263, 2003. a
Kneisel, C., Rödder, T., and Schwindt, D.: Frozen ground dynamics resolved by multi–year and year–round electrical resistivity monitoring at three alpine sites in the Swiss Alps, Near Surf. Geophys., 12, 117–132, https://doi.org/10.3997/1873-0604.2013067, 2014. a, b
Koestel, J., Kemna, A., Javaux, M., Binley, A., and Vereecken, H.: Quantitative imaging of solute transport in an unsaturated and undisturbed soil monolith with 3–D ERT and TDR, Water Resour. Res., 44, https://doi.org/10.1029/2007WR006755, 2008. a, b, c
Krautblatter, M. and Moser, M.: A nonlinear model coupling rockfall and rainfall intensity based on a four year measurement in a high Alpine rock wall (Reintal, German Alps), Nat. Hazards Earth Syst. Sci., 9, 1425–1432, https://doi.org/10.5194/nhess-9-1425-2009, 2009. a
Krautblatter, M., Verleysdonk, S., Flores-Orozco, A., and Kemna, A.: Temperature-calibrated imaging of seasonal changes in permafrost rock walls by quantitative electrical resistivity tomography (Zugspitze, German/Austrian Alps), J. Geophys. Res.-Earth, 115, https://doi.org/10.1029/2008JF001209, 2010. a, b, c, d
Krautblatter, M., Funk, D., and Günzel, F. K.: Why permafrost rocks become unstable: a rock-ice-mechanical model in time and space, Earth Surf. Process. Landf., 38, 876–887, https://doi.org/10.1002/esp.3374, 2013. a, b
Krautblatter, M., Weber, S., Dietze, M., Keuschnig, M., Stockinger, G., Brückner, L., Beutel, J., Figl, T., Trepmann, C., Hofmann, R., Rau, M., Pfluger, F., Barbosa Mejia, L., and Siegert, F.: The 2023 Fluchthorn massive permafrost rock slope failure analysed, EGU General Assembly 2024, Vienna, Austria, 14–19 April 2024, EGU24-20989, https://doi.org/10.5194/egusphere-egu24-20989, 2024. a
LaBrecque, D. J. and Yang, X.: Difference Inversion of ERT Data: a Fast Inversion Method for 3-D In Situ Monitoring, J. Environ. Eng. Geophys., 6, 83–89, https://doi.org/10.4133/JEEG6.2.83, 2001. a, b
LaBrecque, D. J., Miletto, M., Daily, W., Ramirez, A., and Owen, E.: The effects of noise on Occam's inversion of resistivity tomography data, Geophysics, 61, 538–548, https://doi.org/10.1190/1.1443980, 1996. a
Leinauer, J., Dietze, M., Knapp, S., Scandroglio, R., Jokel, M., and Krautblatter, M.: How water, temperature, and seismicity control the preconditioning of massive rock slope failure (Hochvogel), Earth Surf. Dynam., 12, 1027–1048, https://doi.org/10.5194/esurf-12-1027-2024, 2024. a
Lesparre, N., Nguyen, F., Kemna, A., Robert, T., Hermans, T., Daoudi, M., and Flores-Orozco, A.: A new approach for time-lapse data weighting in electrical resistivity tomography, Geophysics, 82, E325–E333, https://doi.org/10.1190/geo2017-0024.1, 2017. a, b
Luetschg, M., Lehning, M., and Haeberli, W.: A sensitivity study of factors influencing warm/thin permafrost in the Swiss Alps, J. Glaciol., 54, 696–704, https://doi.org/10.3189/002214308786570881, 2008. a
Magnin, F. and Josnin, J.-Y.: Water Flows in Rock Wall Permafrost: A Numerical Approach Coupling Hydrological and Thermal Processes, J. Geophys. Res.-Earth, 126, https://doi.org/10.1029/2021JF006394, 2021. a, b
Magnin, F., Krautblatter, M., Deline, P., Ravanel, L., Malet, E., and Bevington, A.: Determination of warm, sensitive permafrost areas in near–vertical rockwalls and evaluation of distributed models by electrical resistivity tomography, J. Geophys. Res.-Earth, 120, 745–762, https://doi.org/10.1002/2014JF003351, 2015. a
Mamot, P., Weber, S., Schröder, T., and Krautblatter, M.: A temperature- and stress-controlled failure criterion for ice-filled permafrost rock joints, The Cryosphere, 12, 3333–3353, https://doi.org/10.5194/tc-12-3333-2018, 2018. a
Matsuoka, N.: Mechanisms of rock breakdown by frost action: An experimental approach, Cold Reg. Sci. Technol., 17, 253–270, https://doi.org/10.1016/S0165-232X(05)80005-9, 1990. a
Matsuoka, N. and Murton, J.: Frost weathering: recent advances and future directions, Permafr. Periglac. Process., 19, 195–210, https://doi.org/10.1002/ppp.620, 2008. a, b, c, d, e
Mayer, T., Eppes, M., and Draebing, D.: Influences Driving and Limiting the Efficacy of Ice Segregation in Alpine Rocks, Geophys. Res. Lett., 50, e2023GL102951, https://doi.org/10.1029/2023GL102951, 2023. a
Mayer, T., Deprez, M., Schröer, L., Cnudde, V., and Draebing, D.: Quantifying frost-weathering-induced damage in alpine rocks, The Cryosphere, 18, 2847–2864, https://doi.org/10.5194/tc-18-2847-2024, 2024. a
Mollaret, C., Hilbich, C., Pellet, C., Flores-Orozco, A., Delaloye, R., and Hauck, C.: Mountain permafrost degradation documented through a network of permanent electrical resistivity tomography sites, The Cryosphere, 13, 2557–2578, https://doi.org/10.5194/tc-13-2557-2019, 2019. a, b, c, d, e, f, g
Morard, S., Hilbich, C., Mollaret, C., Pellet, C., and Hauck, C.: 20-year permafrost evolution documented through petrophysical joint inversion, thermal and soil moisture data, Environ. Res. Lett., 19, 074074, https://doi.org/10.1088/1748-9326/ad5571, 2024. a
Moser, C., Morra di Cella, U., Hauck, C., and Flores Orozco, A.: Spectral induced polarization survey for the estimation of hydrogeological parameters in an active rock glacier, The Cryosphere, 19, 143–171, https://doi.org/10.5194/tc-19-143-2025, 2025. a
Mott, R., Schirmer, M., Bavay, M., Grünewald, T., and Lehning, M.: Understanding snow-transport processes shaping the mountain snow-cover, The Cryosphere, 4, 545–559, https://doi.org/10.5194/tc-4-545-2010, 2010. a
Murton, J. B., Peterson, R., and Ozouf, J.-C.: Bedrock fracture by ice segregation in cold regions, Science, 314, 1127–1129, https://doi.org/10.1126/science.1132127, 2006. a
Offer, M., Weber, S., Keuschnig, M., Hartmeyer, I., and Krautblatter, M.: Water flow in fractured bedrock permafrost: a potential hazard for high alpine infrastructure, in: Conference Proceedings, edited by: International Research Society Interpraevent, 734–737, ISBN 978-3-901164-32-3, 2024. a
Offer, M., Weber, S., Krautblatter, M., Hartmeyer, I., and Keuschnig, M.: Pressurised water flow in fractured permafrost rocks revealed by borehole temperature, electrical resistivity tomography, and piezometric pressure, The Cryosphere, 19, 485–506, https://doi.org/10.5194/tc-19-485-2025, 2025. a, b, c, d, e, f, g, h, i, j, k, l, m, n, o, p, q, r, s
Oldenburg, D. W. and Li, Y.: Estimating depth of investigation in dc resistivity and IP surveys, Geophysics, 64, 403–416, https://doi.org/10.1190/1.1444545, 1999. a
Pellet, C., Hilbich, C., Marmy, A., and Hauck, C.: Soil Moisture Data for the Validation of Permafrost Models Using Direct and Indirect Measurement Approaches at Three Alpine Sites, Front. Earth Sci., 3, https://doi.org/10.3389/feart.2015.00091, 2016. a
Pfluger, F., Weber, S., Steinhauser, J., Zangerl, C., Fey, C., Fürst, J., and Krautblatter, M.: Massive permafrost rock slide under a warming polythermal glacier deciphered through mechanical modeling (Bliggspitze, Austria), Earth Surf. Dynam., 13, 41–70, https://doi.org/10.5194/esurf-13-41-2025, 2025. a, b
Phillips, M., Haberkorn, A., Draebing, D., Krautblatter, M., Rhyner, H., and Kenner, R.: Seasonally intermittent water flow through deep fractures in an Alpine Rock Ridge: Gemsstock, Central Swiss Alps, Cold Reg. Sci. Technol., 125, 117–127, https://doi.org/10.1016/j.coldregions.2016.02.010, 2016. a, b
Phillips, M., Buchli, C., Weber, S., Boaga, J., Pavoni, M., and Bast, A.: Brief communication: Combining borehole temperature, borehole piezometer and cross-borehole electrical resistivity tomography measurements to investigate seasonal changes in ice-rich mountain permafrost, The Cryosphere, 17, 753–760, https://doi.org/10.5194/tc-17-753-2023, 2023. a
Pierhöfer, L., Bartelt, P., Bühler, Y., Hafner, E., Kenner, R., Walter, F., and Phillips, M.: Bergsturz vom 14. April 2024 am Piz Scerscen, Graubünden, WSL-Institut für Schnee- und Lawinenforschung SLF, https://doi.org/10.55419/wsl:38392, 2025. a
Pläsken, R., Hartmeyer, I., Krautblatter, M., and Keuschnig, M.: Seasonal ground temperature variation controls stress regime and rock anchor tension in warming permafrost rock slopes, SSRN Preprint, https://doi.org/10.2139/ssrn.6331710, 2026. a, b, c, d
Pogrebiskiy, M. and Chernyshev, S.: Determination of the permeability of the frozen fissured rock massif in the vicinity of the Kolyma hydroelectric power station, Cold Regions Research and Engineering Laboratory, 634, 1–13, 1977. a
Ravanel, L., Deline, P., Lambiel, C., and Vincent, C.: Instability of a high alpine rock ridge: the lower arête des cosmiques, mont blanc massif, france, Geogr. Ann. Ser. Phys. Geogr., 95, 51–66, https://doi.org/10.1111/geoa.12000, 2013. a
Rosset, E., Hilbich, C., Schneider, S., and Hauck, C.: Automatic filtering of ERT monitoring data in mountain permafrost, Near Surf. Geophys., 11, 423–434, https://doi.org/10.3997/1873-0604.2013003, 2013. a, b
Savi, S., Comiti, F., and Strecker, M. R.: Pronounced increase in slope instability linked to global warming: A case study from the eastern European Alps, Earth Surf. Process. Landf., 46, 1328–1347, https://doi.org/10.1002/esp.5100, 2021. a
Scandroglio, R., Draebing, D., Offer, M., and Krautblatter, M.: 4D quantification of alpine permafrost degradation in steep rock walls using a laboratory–calibrated electrical resistivity tomography approach, Near Surf. Geophys., 19, 241–260, https://doi.org/10.1002/nsg.12149, 2021. a, b
Scandroglio, R., Weber, S., Limbrock, J. K., and Krautblatter, M.: Field-validated imaging of decadal and seasonal changes in permafrost bedrock using quantitative electrical resistivity tomography (Zugspitze, Germany/Austria), EGUsphere [preprint], https://doi.org/10.5194/egusphere-2025-5552, 2025a. a
Scandroglio, R., Weber, S., Rehm, T., and Krautblatter, M.: Decadal in situ hydrological observations and empirical modeling of pressure head in a high-alpine, fractured calcareous rock slope, Earth Surf. Dynam., 13, 295–314, https://doi.org/10.5194/esurf-13-295-2025, 2025b. a, b, c
Schober, A., Bannwart, C., and Keuschnig, M.: Rockfall modelling in high alpine terrain – validation and limitations/Steinschlagsimulation in hochalpinem Raum – Validierung und Limitationen, Geomechanics and Tunnelling, 5, 368–378, https://doi.org/10.1002/geot.201200025, 2012. a
Slater, L., Binley, A., Daily, W., and Johnson, R.: Cross-hole electrical imaging of a controlled saline tracer injection, J. Appl. Geophys., 44, 85–102, https://doi.org/10.1016/S0926-9851(00)00002-1, 2000. a, b
Sneddon, I. N. and Lowengrub, M.: Crack problems in the classical theory of elasticity. john wiley & sons, inc., Z. Angew. Math. Mech., 51, 238–239, https://doi.org/10.1002/zamm.19710510317, 1971. a
Sokratov, S. A. and Sato, A.: The effect of wind on the snow cover, Ann. Glaciol., 32, 116–120, https://doi.org/10.3189/172756401781819436, 2001. a
Sommer, C. G., Lehning, M., and Mott, R.: Snow in a Very Steep Rock Face: Accumulation and Redistribution During and After a Snowfall Event, Front. Earth Sci., 3, https://doi.org/10.3389/feart.2015.00073, 2015. a
Stead, D. and Wolter, A.: A critical review of rock slope failure mechanisms: The importance of structural geology, J. Struct. Geol., 74, 1–23, https://doi.org/10.1016/j.jsg.2015.02.002, 2015. a
Uhlemann, S., Dafflon, B., Peterson, J., Ulrich, C., Shirley, I., Michail, S., and Hubbard, S. S.: Geophysical Monitoring Shows that Spatial Heterogeneity in Thermohydrological Dynamics Reshapes a Transitional Permafrost System, Geophys. Res. Lett., 48, https://doi.org/10.1029/2020GL091149, 2021. a
Walder, J. and Hallet, B.: A theoretical model of the fracture of rock during freezing, Geol. Soc. Am. Bull., 96, 336–346, https://doi.org/10.1130/0016-7606(1985)96<336:ATMOTF>2.0.CO;2, 1985. a, b, c
Walder, J. S. and Hallet, B.: The physical basis of frost weathering: Toward a more fundamental and unified perspective, Arctic Alpine Res., 18, 27–32, https://doi.org/10.1080/00040851.1986.12004060, 1986. a
Walter, F., Amann, F., Kos, A., Kenner, R., Phillips, M., de Preux, A., Huss, M., Tognacca, C., Clinton, J., Diehl, T., and Bonanomi, Y.: Direct observations of a three million cubic meter rock-slope collapse with almost immediate initiation of ensuing debris flows, Geomorphology, 351, 106933, https://doi.org/10.1016/j.geomorph.2019.106933, 2020. a, b
Weber, S., Beutel, J., Faillettaz, J., Hasler, A., Krautblatter, M., and Vieli, A.: Quantifying irreversible movement in steep, fractured bedrock permafrost on Matterhorn (CH), The Cryosphere, 11, 567–583, https://doi.org/10.5194/tc-11-567-2017, 2017. a, b
Weber, S., Fäh, D., Beutel, J., Faillettaz, J., Gruber, S., and Vieli, A.: Ambient seismic vibrations in steep bedrock permafrost used to infer variations of ice-fill in fractures, Earth Planet. Sci. Lett., 501, 119–127, https://doi.org/10.1016/j.epsl.2018.08.042, 2018. a
Weber, S., Beutel, J., Dietze, M., Bast, A., Kenner, R., Phillips, M., Leinauer, J., Mühlbauer, S., Pfluger, F., and Krautblatter, M.: Progressive destabilization of a freestanding rock pillar in permafrost on the Matterhorn (Swiss Alps): Hydro-mechanical modeling and analysis, Earth Surf. Dynam., 13, 1157–1179, https://doi.org/10.5194/esurf-13-1157-2025, 2025a. a, b, c
Weber, S., Vieli, A., Phillips, M., and Cicoira, A.: Thermal diffusivity of mountain permafrost derived from borehole temperature data in the Swiss Alps, The Cryosphere, 19, 6727–6748, https://doi.org/10.5194/tc-19-6727-2025, 2025b. a
Wegmann, M. and Gudmundsson, G. H.: Thermally induced temporal strain variations in rock walls observed at subzero temperatures, in: Advances in Cold-Region Thermal Engineering and Sciences, edited by: Hutter, K., Wang, Y., and Beer, H., Springer Berlin Heidelberg, Berlin, Heidelberg, 511–518, ISBN 978-3-540-48410-3, 1999. a
Yang, X., Lassen, R. N., Jensen, K. H., and Looms, M. C.: Monitoring CO2 migration in a shallow sand aquifer using 3D crosshole electrical resistivity tomography, Int. J. Greenh. Gas Control., 42, 534–544, https://doi.org/10.1016/j.ijggc.2015.09.005, 2015. a
Zisser, N., Nover, G., Dürrast, H., and Siegesmund, S.: Relationship between electrical and hydraulic properties of sedimentary rocks, Z. Dtsch. Ges. Geowiss., 158, 883–894, https://doi.org/10.1127/1860-1804/2007/0158-0883, 2007. a