the Creative Commons Attribution 4.0 License.
the Creative Commons Attribution 4.0 License.
 | 26 Mar 2019
Dating and morpho-stratigraphy of uplifted marine terraces in the Makran subduction zone (Iran)
Raphaël Normand
Guy Simpson
Frédéric Herman
Rabiul Haque Biswas
Abbas Bahroudi
Bastian Schneider
The western part of the Makran subduction zone (Iran) is currently experiencing active surface uplift, as attested by the presence of emerged marine terraces along the coast. To better understand the uplift recorded by these terraces, we investigated seven localities along the Iranian Makran and we performed radiocarbon, 230Th∕U and optically stimulated luminescence (OSL) dating of the layers of marine sediments deposited on top of the terraces. This enabled us to correlate the terraces regionally and to assign them to different Quaternary sea-level highstands. Our results show east–west variations in surface uplift rates mostly between 0.05 and 1.2 mm yr−1. We detected a region of anomalously high uplift rate, where two MIS 3 terraces are emerged, but we are uncertain how to interpret these results in a geologically coherent context. Although it is presently not clear whether the uplift of the terraces is linked to the occurrence of large megathrust earthquakes, our results highlight rapid surface uplift for a subduction zone context and heterogeneous accumulation of deformation in the overriding plate.
- Article
(13431 KB) - Full-text XML
-
Supplement
(1801 KB) - BibTeX
- EndNote


Surface uplift at the coastline of convergent margins can occur continuously (i.e., by aseismic creep) and/or in response to large earthquakes (King et al., 1988; Lajoie, 1986; Matsu'ura and Sato, 1989; Segall, 2010; Simpson, 2015; Wesson et al., 2015). Regardless of the mode, on a timescale far longer than the duration of a seismic cycle, permanent uplift of subduction zone margins is typically expressed by the occurrence of exposed marine terraces or emerged sequences of wave-cut shore platforms (e.g., Burbank and Anderson, 2001; Henry et al., 2014; Keller and Pinter, 2002; Pedoja et al., 2014; Pirazzoli, 1994). Because the shoreline angle (i.e., the intersection between a subhorizontal platform and a steep coastal cliff) of these platforms is a good approximation of zero sea level at the time of platform development, their current altitude can be used to quantify the relative sea-level fall (Lajoie, 1986). A key aspect of the study of marine terrace sequences is the dating of the geomorphic surfaces and/or deposits of the successive terraces. Dating results provide a morpho-stratigraphic framework for the interpretation of the terraces (i.e., correlation to past sea-level highstands), and ultimately, they permit the calculation of surface uplift rates using the shoreline angle altitudes (e.g., Jara-Muñoz et al., 2015; Lajoie, 1986; Meschis et al., 2018; Pedoja et al., 2018a; Regard et al., 2017; Roberts et al., 2013; Saillard et al., 2011).
The Makran subduction zone (MSZ) of southern Iran and Pakistan hosts spectacular examples of recently uplifted marine terraces. These were described as early as the 1940s (Falcon, 1947; Harrison, 1941) but have remained largely unstudied in the last few decades. Most dating attempts of the Makran terraces were performed by 14C dating, which has the inconvenience of being limited to ∼50 ka though is uncertain beyond ca. 20 ka (Murray-Wallace and Woodroffe, 2014). Therefore, the attribution of the different Makran terrace levels to past sea-level highstands has not yet been attempted. Indeed, amongst the various subduction zones hosting marine terraces, the MSZ is one of the few cases where knowledge of the altitude of the Marine Isotopic Stage (MIS) 5e benchmark (considered a global geodynamic marker) is still lacking (Pedoja et al., 2014).
Here, we investigate 10 sequences of marine terraces along the western Makran using modern dating techniques combined with remote sensing. We present seven terrace maps, resulting from extensive fieldwork, with the help of satellite imagery and a 12 m resolution digital elevation model (DEM). We dated 13 radiocarbon, 3 230Th∕U and 12 optically stimulated luminescence (OSL) samples from the marine sedimentary layer covering the lower (younger) terraces in order to correlate the dated terraces of the sequences to past sea-level highstands, calculate uplift rates and, based on these rates, to estimate the age of the older mapped terraces. We were then able to identify the MIS 5e benchmark along the 200 km long studied segment of the MSZ, improving the database on Cenozoic sequences of paleoshorelines (Pedoja et al., 2014). Moreover, we observe uplift variations alongstrike of the subducting trench, which we discuss in the context of subduction zone upper plate deformation.
2.1 Geodynamics and seismicity of the Makran subduction zone (MSZ)
Our study is focused on the coastal plain of the MSZ, southeast Iran (Fig. 1). This coastal strip is located near the middle of a large active accretionary complex, part of which is offshore and part of which lies behind the studied area further to the north (Farhoudi and Karig, 1977; White and Ross, 1979) (Fig. 1a). The Makran trench strikes roughly in an east–west direction, and the slab dips to the north at a shallow angle of less than 10∘ (Kopp et al., 2000; Manaman et al., 2011; White and Louden, 1982). The subduction zone is bounded on the west and east by strike-slip fault zones linking the Makran trench to the neighboring continental collisional systems that are the Zagros and Himalaya, respectively. The Eurasian overriding plate is divided into two micro-continental blocks (Lut and Helmand blocks) separated by the Sistan suture zone, a dextral transitional region, reflecting the differential relative motion between the two blocks (Fig. 1a). The record from GPS surveys around the Oman Sea indicates active convergence between the subducting Arabian and overriding Eurasian plates of about 20 mm yr−1 (Fig. 1a) (Bayer et al., 2006; Frohling and Szeliga, 2016; Khan et al., 2008; Masson et al., 2007; Penney et al., 2017; Peyret et al., 2009; Vernant et al., 2004; Walpersdorf et al., 2014). Although most of this convergence seems to be accommodated by reverse faults within the prism, margin-parallel normal faulting is predominant in the coastal region (Back and Morley, 2016; Burg et al., 2012; Dolati and Burg, 2012; Ghorashi, 1978; Harms et al., 1984; Hosseini-Barzi and Talbot, 2003; Little, 1972; Platt and Leggett, 1986; Samadian et al., 1994, 1996, 2004; Snead, 1993).
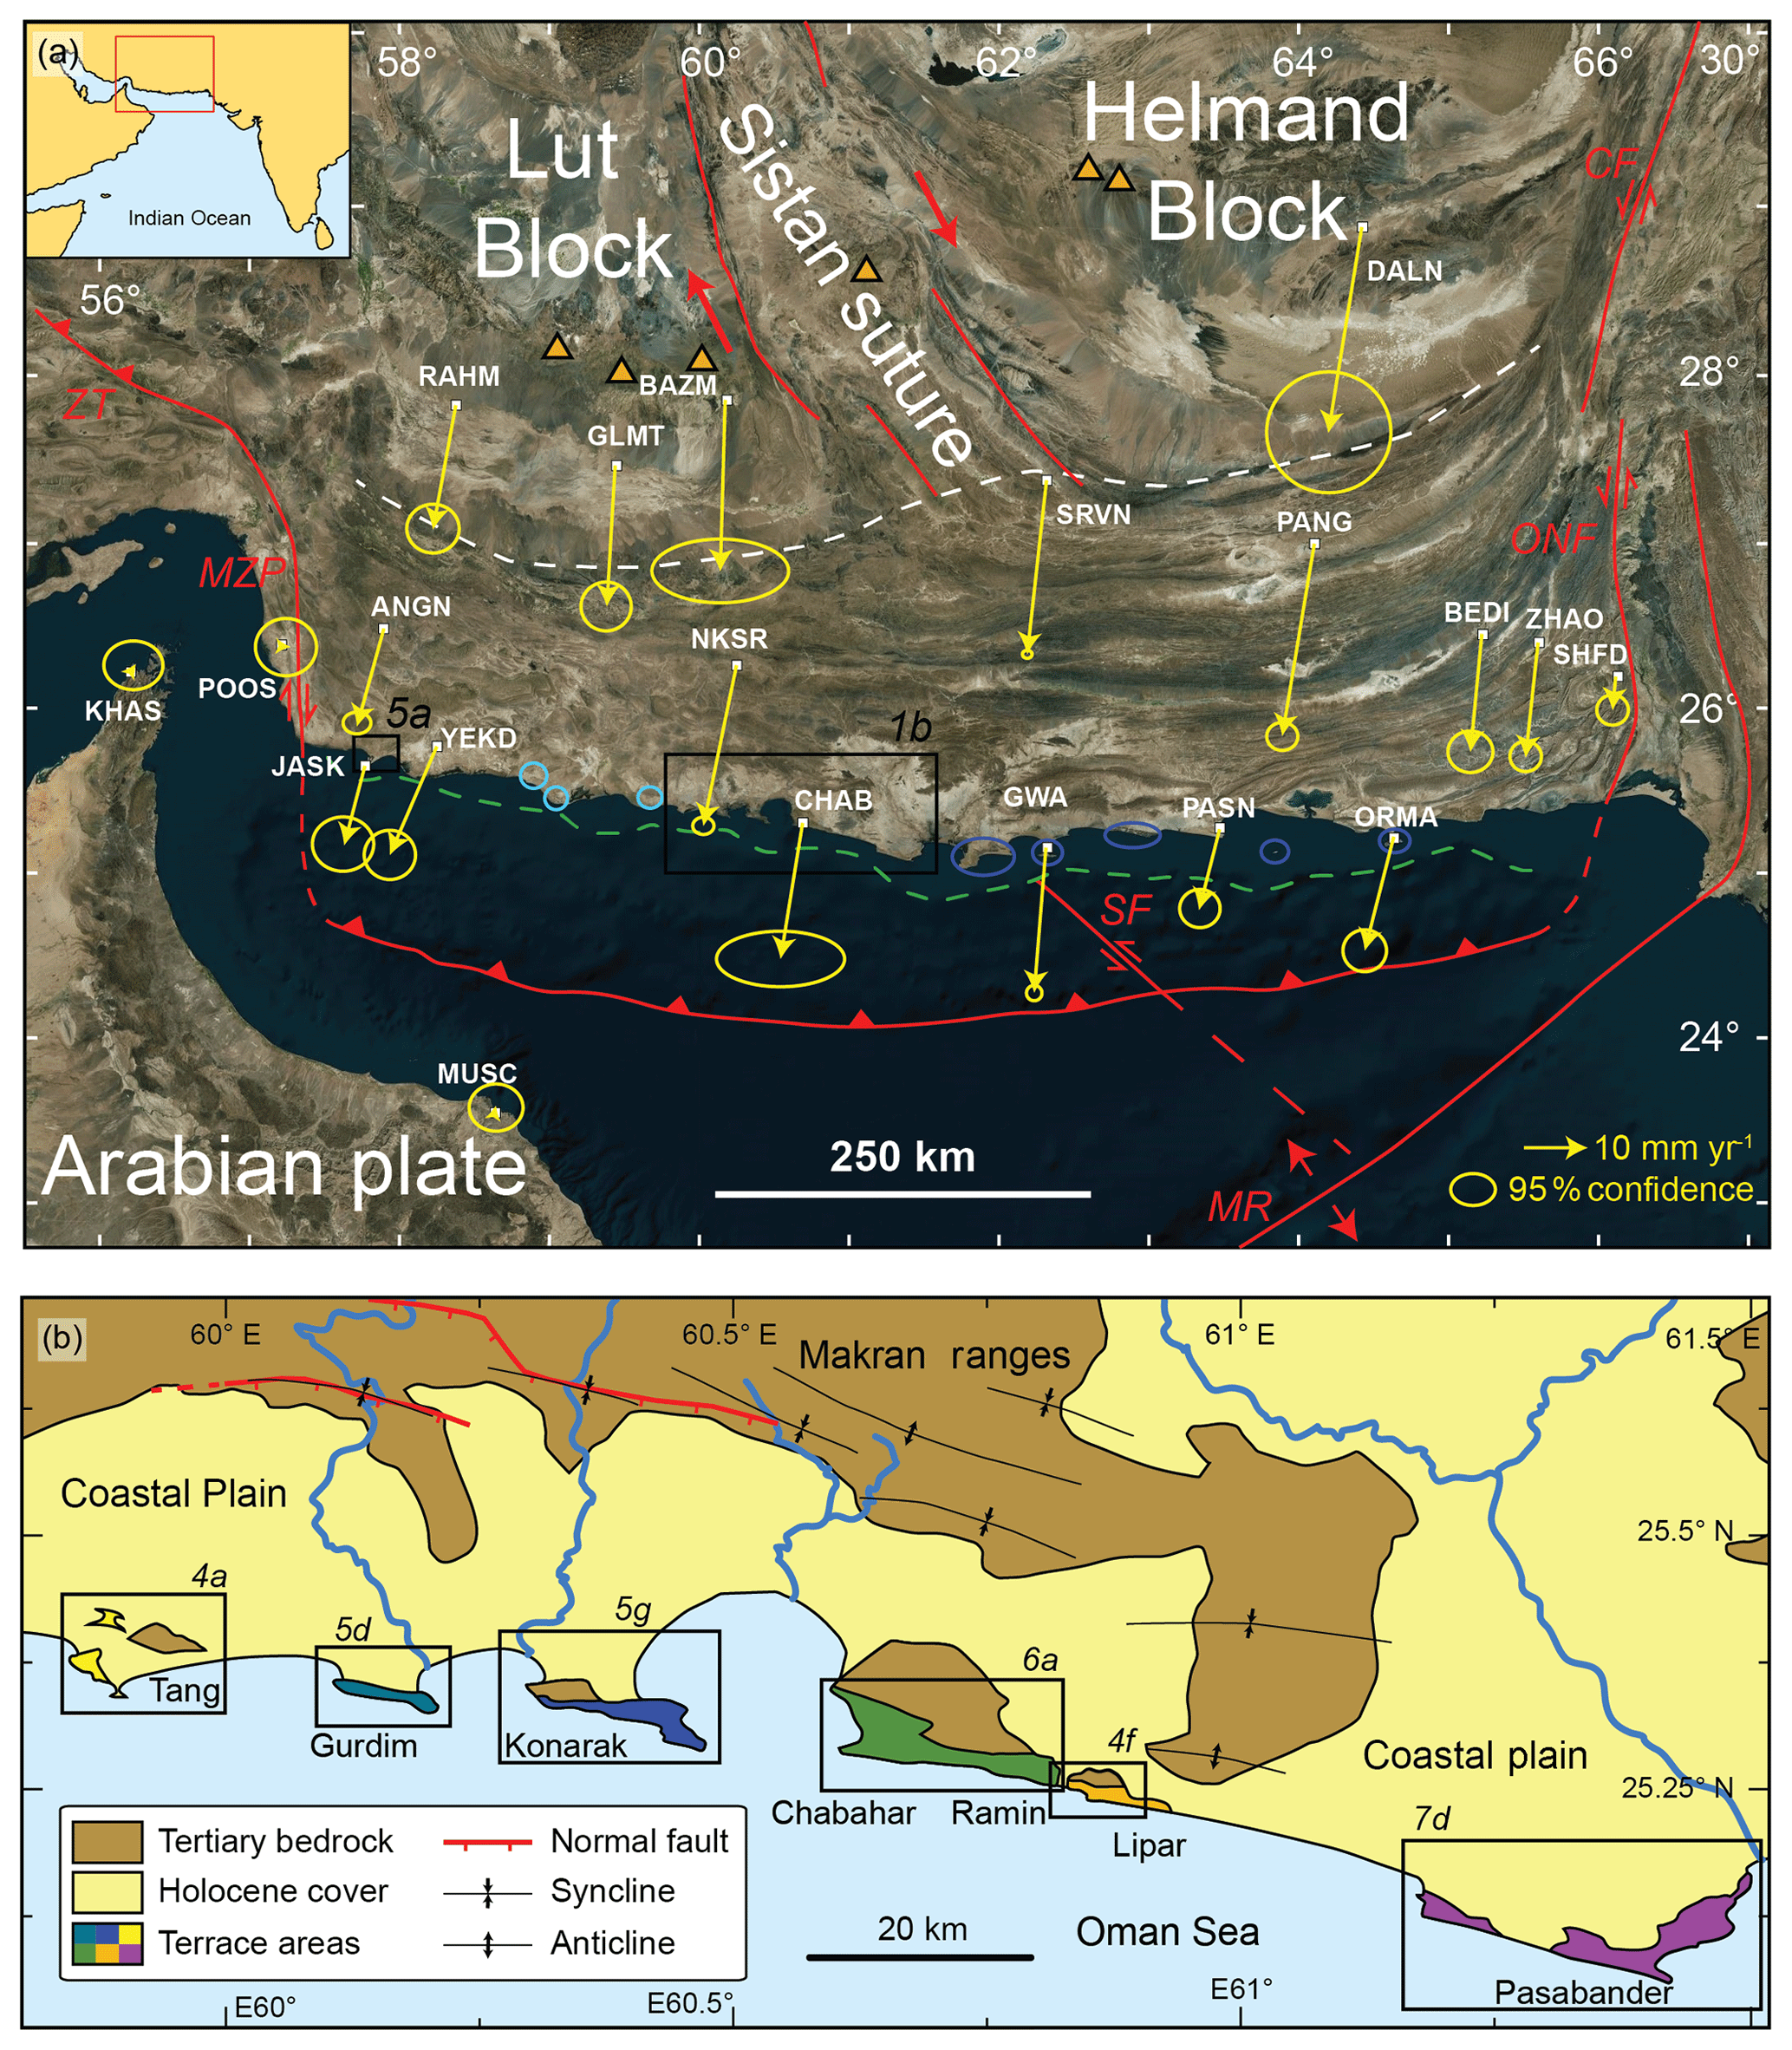
Figure 1Map of the studied areas. Black squares: terraces studied, visited and mapped in this paper (Figs. 4–7, italic numbers). (a) Tectonic framework on a satellite image (Bing). Yellow arrows and circles represent GPS velocities and 95 % confidence ellipses, with a fixed Arabian plate reference, compiled by Penney et al. (2017) from the literature (Bayer et al., 2006; Frohling and Szeliga, 2016; Khan et al., 2008; Masson et al., 2007; Penney et al., 2017; Peyret et al., 2009; Vernant et al., 2004; Walpersdorf et al., 2014). Red lines and arrows: simplified major fault structures and relative motions. White dashed line: rough northern limit of the sedimentary accretionary prism. Green dashed line: shelf break. Blue circles: other occurrences of marine terraces along the Iranian (light blue) and Pakistani (dark blue) Makran. ZT: Zagros thrust; MZP: Minab–Zendan–Palami fault zone; SF: Sonne fault; MR: Murray Ridge; ONF: Ornach–Nal fault; CF: Chaman fault. Orange triangles: active volcanoes. (b) Simplified map of the studied region. Faults and folds from the geological maps of Iran; 1:100 000 (Kahir and Peersohrab sheets, Samadian et al., 1994, 2004).
The seismic activity of the MSZ is low compared to other subduction zones around the globe, although most studies agree that the potential for tsunamigenic megathrust earthquakes exists (e.g., Heidarzadeh et al., 2008; Hoffmann et al., 2013a; Pararas-Carayannis, 2006; Penney et al., 2017; Shah-Hosseini et al., 2011; Smith et al., 2013). The Middle East earthquake catalog from Zare et al. (2014), ranging from 1220 BCE to 2006, shows that earthquakes of Mw > 5 are less densely clustered in the MSZ than in other seismically active regions of the Middle East, like the Zagros or Caucasus. Byrne et al. (1992) pointed out that the eastern and the western segment of the MSZ seem to have a different seismic behavior, which they link to the segmentation of the overriding plate (Fig. 1a). The eastern part is more active, with several thrust earthquakes occurring in the region of Pasni, notably the Mw 8.1 event of 1945 (Byrne et al., 1992; Hoffmann et al., 2013b; Quittmeyer and Jacob, 1979) and a recent event of Mw 6.3 in 2017 (Penney et al., 2017). In the western Makran, the two last great earthquakes are historical events from 1008 and 1483 (Ambraseys and Melville, 1982; Heidarzadeh et al., 2008), though their exact magnitude, position and focal mechanism are poorly known (Musson, 2009). The sinistral strike-slip Sonne Fault that obliquely crosses the wedge off Gwadar city (Fig. 1a) has been proposed as the limit between the eastern and western segments of the MSZ (Kukowski et al., 2000; Rajendran et al., 2013). Moreover, tomographic studies have pinpointed contrasting seismic wave propagation velocities in the two segments (Al-Lazki et al., 2014; Manaman et al., 2011). Although the western MSZ is seismically quiet, evidence of past earthquakes, activity in the eastern segment and ongoing plate convergence indicate that the plate boundary might have been accumulating elastic strain for more than 500 years. Thus, the western MSZ has the potential to produce a catastrophic earthquake (Penney et al., 2017; Rajendran et al., 2013; Smith et al., 2013).
2.2 Geological and geomorphological setting
Along the western Makran coast, the bedrock lithology is dominated by highly erodible Neogene to recent fine-grained marls, deposited in a slope environment, forming a wide flat coastal plain (Blanford, 1872; Burg et al., 2012; Falcon, 1947; Ghorashi, 1978; Harms et al., 1984; Harrison, 1941; McCall, 2002; Page et al., 1979; Snead, 1967; Stiffe, 1874). The coastal plain is locally interrupted and overlooked by prominent rocky headlands, 10 to 30 km in length, hosting emerged sequences of marine terraces. The basement lithology of these headlands alternates between coarse coastal (calcareous sandstones, hereafter referred to as “sandstones”, for simplicity) and fine slope deposits, similar to those found in the Makran ranges, northwards of the coastal plain (Harms et al., 1984). The headlands are separated by wide omega-shaped bays that exhibit sequences of Holocene prograding beach ridges up to 10 km long (Gharibreza, 2016; Shah-Hosseini et al., 2018) (Fig. 1b).
The Makran coast faces the Oman Sea, situated in the northern part of the Indian Ocean, and has a tide range between 1.8 and 4 m (Sanlaville et al., 1991; Snead, 1993). The studied area of Chabahar receives waves coming mostly from the SSE and SW, with significant wave height of 1 to 3 m and periods between 4 and 8 s (Saket and Etemad-shahidi, 2012). The climate is arid to semiarid and vegetation is sparse. Precipitation rates remain low (mean annual precipitation: ∼120 mm), which implies low erosion rates on sandstone rocks (Haghipour et al., 2012; Page et al., 1979), although fine-grained bedrock is strongly eroded during the yearly intense rainfall events (Falcon, 1947; Ghorashi, 1978; Harrison, 1941; Snead, 1967; Stiffe, 1874).
2.3 Previous work on the sequences of Makran marine terraces
The uplifting nature of the MSZ coastline was recognized as early as the 1940s (Falcon, 1947; Harrison, 1941). Since then, the Pleistocene marine terraces have been the focus of several studies (e.g., Little, 1972; Page et al., 1979; Reyss et al., 1998; Snead, 1967, 1993, Vita-Finzi, 1975, 1980, 1981, 1982, 2002). The marine terraces of the Makran have been described as flat-topped, isolated hills, with a wave-cut unconformity capped by a shelly sandstone layer of shoreface to foreshore deposits (Falcon, 1947; Little, 1972; Page et al., 1979; Snead, 1993). This layer of marine sediment is an important characteristic of the Makran marine terraces and will hereafter be referred to as “terrace deposits”. Since the marine terraces are built on top of the Tertiary sedimentary sequences of the Makran accretionary prism, the bedrock sandstones units can be misinterpreted as terrace deposits. Snead (1993) has defined the term “structural terrace” which refers to those subhorizontal Tertiary sandstone beds, resistant to erosion, that are not necessarily formed by wave erosion and therefore do not correspond to a paleo sea-level altitude. Maps of the terraces have been published by a few authors (Little, 1972; Page et al., 1979; Snead, 1993) and give valuable spatial information on their extent. Some sequences of terraces have been described (Page et al., 1979; Reyss et al., 1998), although the linking of the successive marine terraces of a sequence to former sea-level highstands (Lajoie, 1986) has not yet been attempted.
Dating of the MSZ marine terrace deposits has been undertaken by several authors (Haghipour et al., 2014; Little, 1972; Page et al., 1979; Rajendran et al., 2013; Reyss et al., 1998; Vita-Finzi, 1975, 1980, 1981) in order to infer surface uplift rates. Due to the lack of coral reefs in the MSZ, most of these results come from 14C dating of mollusk shells. Ages are either from the second half of the Holocene (< 6 ka) or older than 20 ka. Some authors have argued that results older than 20 ka should be minimum ages, due to the limitations of the 14C method (Haghipour et al., 2014; Page et al., 1979; Rajendran et al., 2013; Reyss et al., 1998; Vita-Finzi, 1975, 1980, 1981). The only dated terraces older than the last glacial period are from Page et al. (1979), who dated mollusk shells with a combination of 230Th∕234U and 231Pa∕235U methods. They dated the Jask terrace and one level of the Konarak terraces with these methods, both yielding an age coeval within errors to the last maximum interglacial (MIS 5e). These ages are considered reliable by the authors. We compiled a summary of previously published ages of the Makran terraces (and beaches) in Supplement Table S1.
2.4 Pleistocene sea-level curve
A key aspect of the study of uplifted marine terraces is a good knowledge of past variations in eustatic sea level (Caputo, 2007). Numerous works aimed at reconstructing eustatic sea-level curves for the late Quaternary have been performed. While the general trends are known, uncertainties concerning the timing and, especially, the magnitude of sea-level fluctuations are still significant. The most popular proxies used to reconstruct eustatic sea-level curves are the δ18O record of benthic foraminifera (e.g., Arz et al., 2007; Rohling et al., 2009, 2014; Siddall et al., 2003, 2006; Waelbroeck et al., 2002) and dating of constructional coral reef terraces on uplifted coasts (e.g., Bard et al., 1990; Bloom et al., 1974; Chappell, 2002; Chappell et al., 1996; Cutler et al., 2003; Esat and Yokoyama, 2006; Fairbanks, 1989; Hibbert et al., 2016; Medina-Elizalde, 2013; Yokoyama et al., 2001). Coral-based sea-level reconstructions are sensitive to global uncertainties such as coral dating precision and coral growth depth distribution, as well as uncertainties inherent to each locality, such as uplift rate variations through time and glacial–isostatic adjustment (GIA) (Creveling et al., 2017; Hibbert et al., 2016; Medina-Elizalde, 2013; Murray-Wallace and Woodroffe, 2014). δ18O records are more continuous through time, but their accuracy is also limited by dating and measurement errors, local variations in seawater temperature and salinity, and uncertainties regarding the relation between the δ18O record, ice volume and eustatic sea level (in magnitude as well as in timing) (Spratt and Lisiecki, 2016; Waelbroeck et al., 2002). Because of these uncertainties, many different eustatic sea-level curves have been published, and it is not straightforward to choose any one curve as a reference (Caputo, 2007).
3.1 Mapping
Three field campaigns of 1 month each were performed in the coastal area of the Iranian Makran. Outcrops from Jask to the west until Pasabander in the east were visited (Fig. 1b). Spatial information was also gained from the study of satellite images (sparse vegetation cover) and from the TanDEM-X DEM (0.4 m resolution and 2 m vertical error) (Rizzoli et al., 2017). Terrace maps were digitalized using the ToolMap 2.6.2035 (MEYRIN) software based on the TanDEM-X DEM and satellite images from Bing satellite and Google Earth (< 1 m resolution).
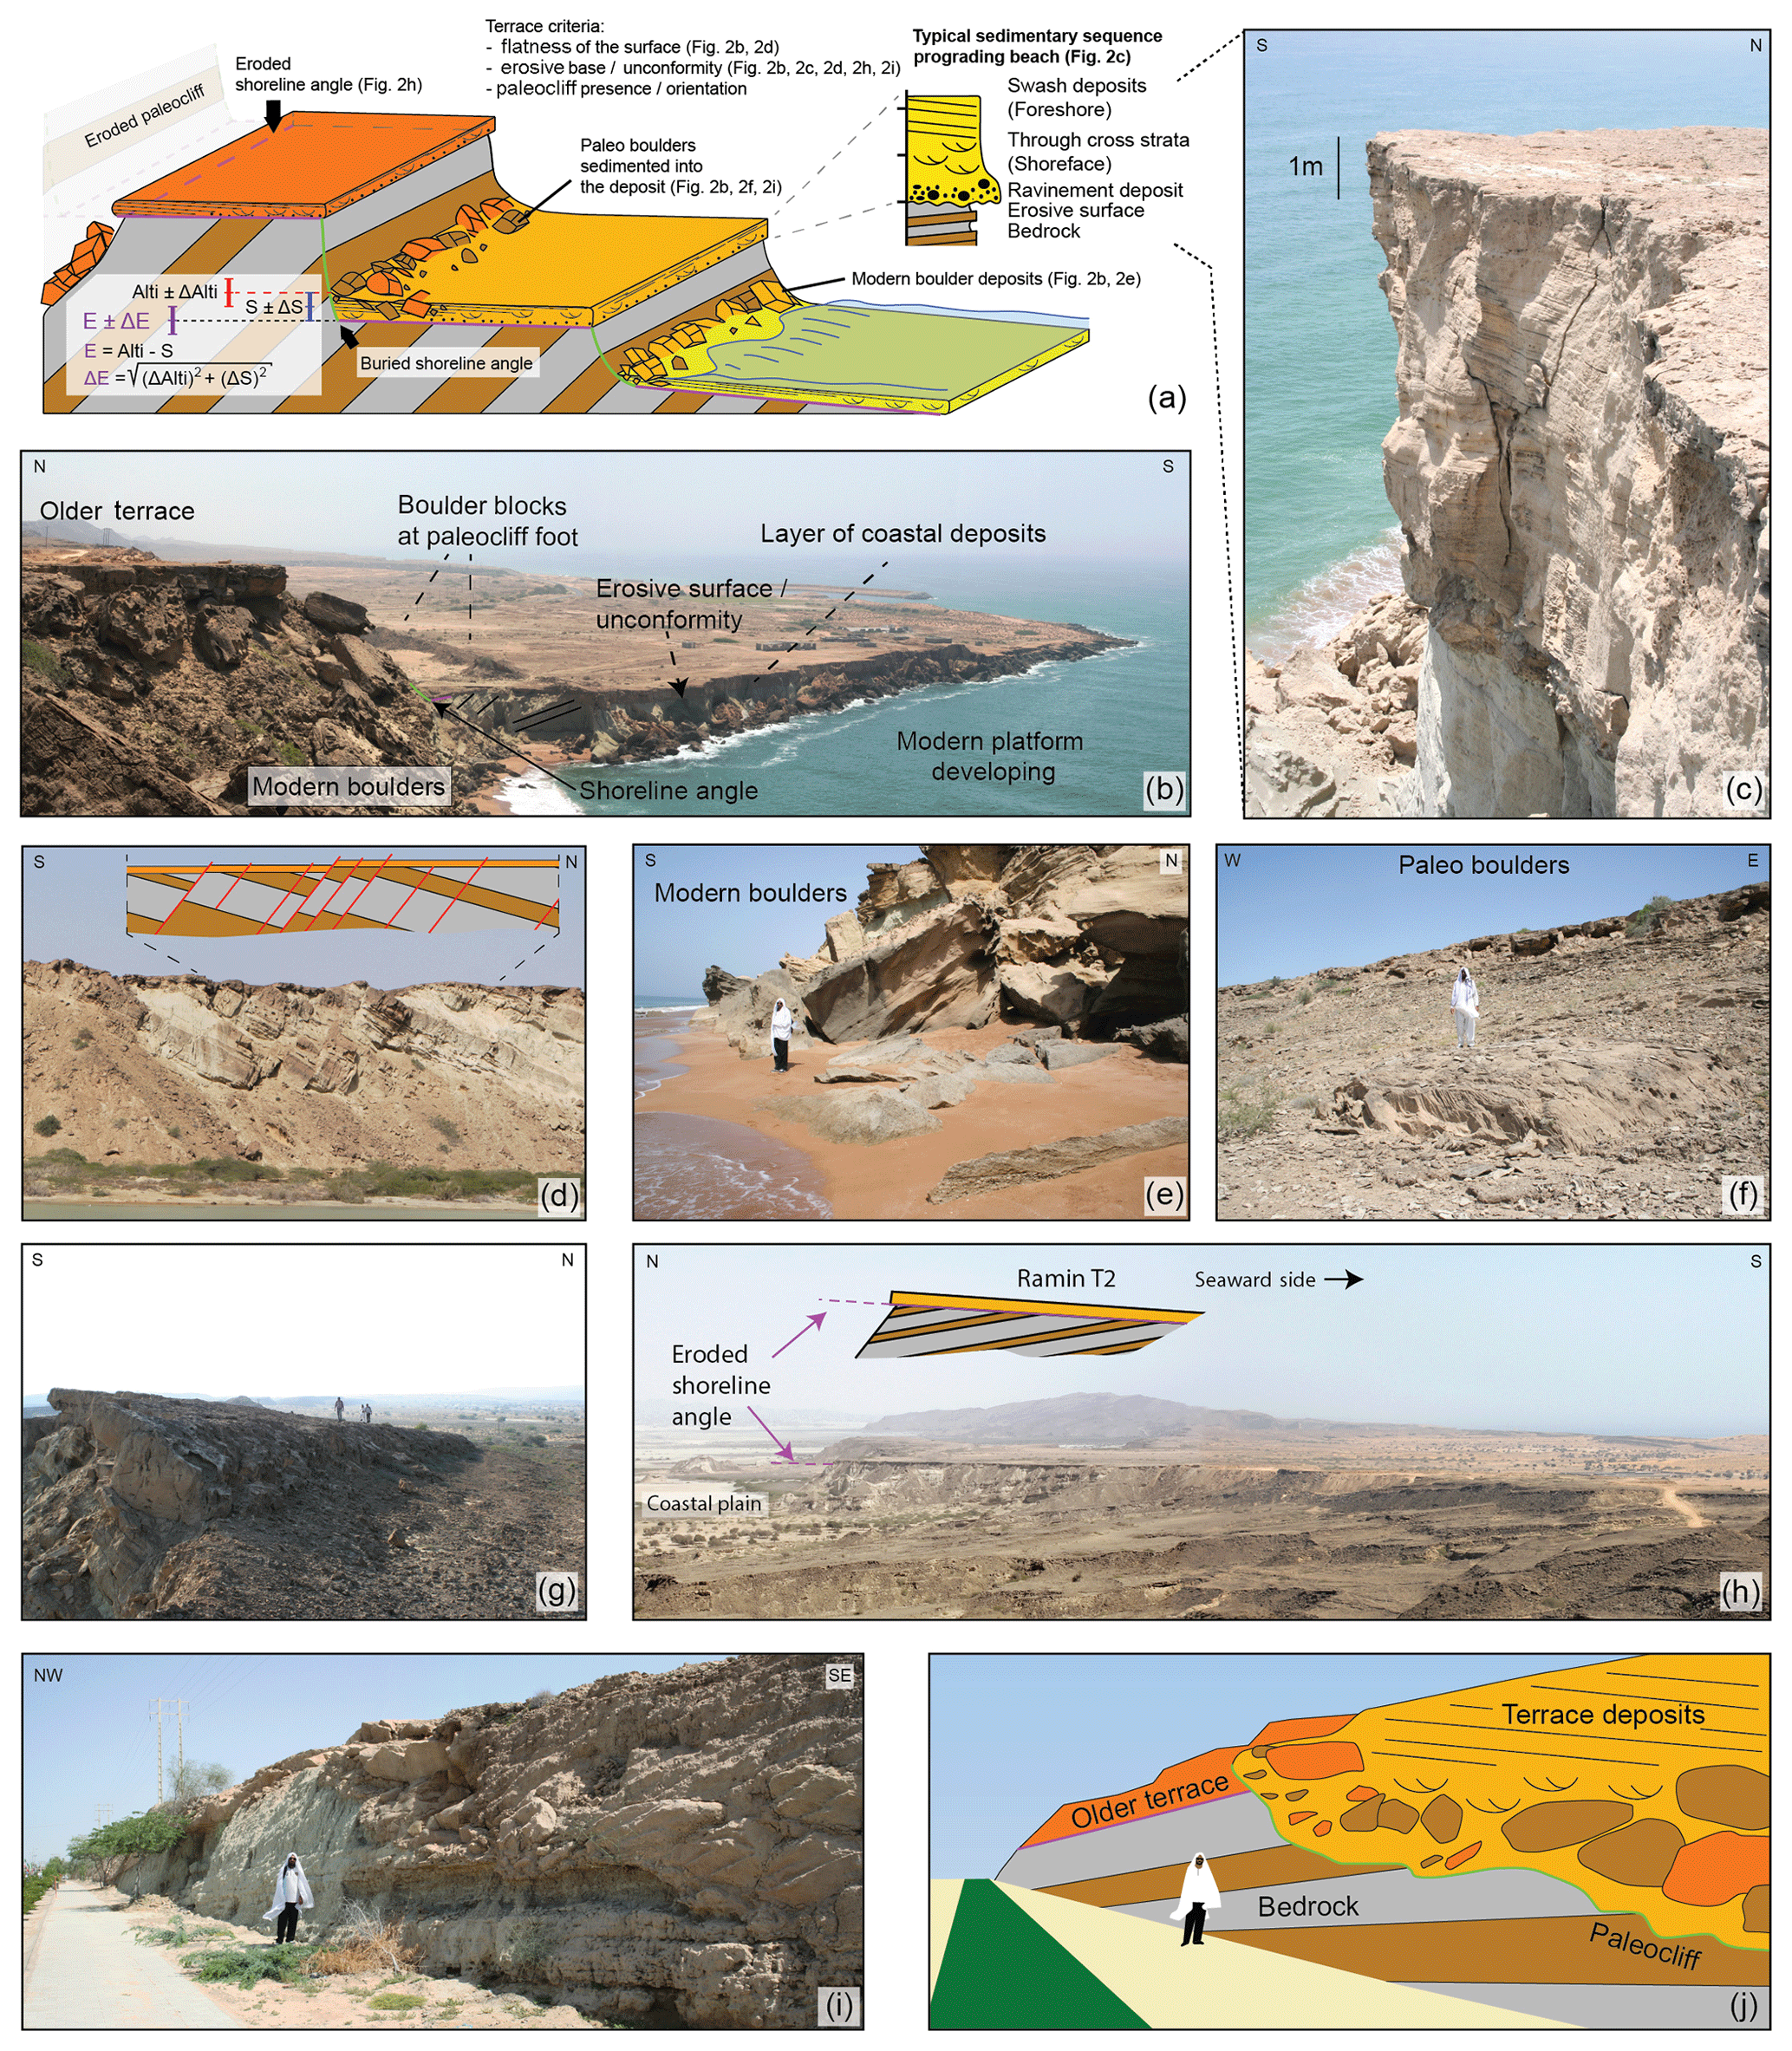
Figure 2Pictures and sketches presenting the terrace geomorphology and sedimentology. Additional field pictures can be found in Normand et al. (2018). (a) Sketch of the general morphology of Makran terraces and the different criteria of recognition. Method used to calculate E±ΔE: Alti ± ΔAlti is the altitude obtained from the DEM or the GPS measurement in the field, S±ΔS is the sediment thickness obtained from field observations, or we used 6±4 m as a general value when the real sediment thickness was not directly observed. (b) View of Lipar T1 (lower) and T3 (upper) (shot from 25.247924∘ N, 60.846619∘ E, looking southeast). We can see the waves carving the current terrace into both T1 and T3. Boulders of terrace deposits and bedrock origin are being sedimented within the beach deposits at the feet of the cliff. (c) Close-up of the terrace deposit of Lipar T2 (25.249823∘ N, 60.839074∘ E). The associated stratigraphic log is the number 1, reported in Fig. 4i. Notice the boulders at the base and the prograding sequence from shoreface to the foreshore parallel lamination at the top. (d) Outcrop at Lipar lake, showing numerous south-dipping normal faults crosscutting the tertiary bedrock and sometimes even the topping horizontal layer of terrace deposit (Ramin T1) (25.260840∘ N, 60.830019∘ E). (e) Modern boulders, i.e., boulders of bedrock and terrace deposit material being sedimented in modern beach deposits at the feet of the cliff (25.253043∘ N, 60.811024∘ E). (d) Their paleo equivalent, at 150 m of altitude, now buried in cemented beach deposits (25.335013∘ N, 60.640952∘ E). Notice the sedimentary structures indicating that the boulder is tilted, similar to the modern boulders (rockfall). (g) Surficial expression of a northward-dipping normal fault, conjugate to those showed in Fig. 2d (25.258126∘ N, 60.824896∘ E). (h) View of the back of Ramin T2 and its eroded shoreline angle (shot from 25.286121∘ N, 60.769900∘ E, looking east). Notice the angular unconformity with the tertiary bedrock, which composes most of the foreground. The main surface visible on the right of the picture is Ramin T1. Lipar headland is visible in the background. (i) and (j) Road cut cross section through a paleocliff (25.332877∘ N, 60.621057∘ E). We can see the unconformity with the bedrock bedding (paleocliff – green line) and the rockfall boulders sedimented within the terrace deposits.
Throughout the field campaigns, we used a series of criteria that helped to differentiate actual marine terraces from other flat surfaces, such as structural terraces (Table B.1 in Supplement S2). These criteria were determined from the observation of marine terraces as well as their modern equivalent along the coast of the Iranian Makran (Fig. 2). Not all criteria were met in each mapped terrace due to variability in factors such as bedrock lithology, erosion and anthropogenic disturbances. Terrace levels were attributed to an MIS based on our dating results. Undated terraces have been assigned to successive highstands based on their shoreline angle altitude profile. We tried to fit them best to a constant uplift scenario, keeping in mind that some terraces of the sequence might have been completely eroded. Moreover, the attribution of terraces to a correct MIS was also complicated by the action of normal faults. To illustrate the reliability of our terrace maps, we provide arbitrary confidence indexes to our terrace boundaries and our MIS attribution (1: low confidence; 5: high confidence). This information is available within the GIS files of the terrace maps (Normand et al., 2018).
3.2 Dating
3.2.1 Dating target
The dating techniques used in this paper focus on marine materials deposited above the wave-cut platform of the marine terraces (Fig. 2a, c, i). Therefore, the time relationship between the platform formation by wave erosion (i.e., our sea-level reference for uplift calculation) and the deposition of sediments (OSL dating) or shells (radiometric dating) above this erosive surface needs to be clarified. We studied the stratigraphy of the terrace deposits, whose logs are reported in Figs. 4i, 5j, 6e and 7b. All studied logs show a similar general trend consisting of a wave-cut surface overlain by a prograding sequence of shoreface to foreshore facies (Fig. 2a, c). Numerical modeling results indicate that platform carving usually happens at the beginning of the highstand, until the platform becomes too wide and the wave energy too dissipated to carry out effective cliff erosion (Anderson et al., 1999; Trenhaile, 2000). The occurrence of ravinement deposits at the base of the terrace deposits also supports the idea of platform carving during the transgressive event (Fig. 2c) (Catuneanu et al., 2011). We interpret the prograding terrace deposits to have been deposited on the platform after the erosive period; during the sea-level stillstand and the start of the sea-level fall (e.g., Jara-Muñoz and Melnick, 2015). Hence, we believe that in the Makran, terrace carving and sediment deposition both occur within the same highstand. This is true for the Makran Holocene beaches, which have been deposited since the mid-Holocene highstand (Gharibreza, 2016; Gharibreza and Motamed, 2006; Sanlaville et al., 1991; Shah-Hosseini et al., 2018).
3.2.2 14C dating
Shell samples were collected from the terrace deposits. We analyzed mostly calcitic mollusk shells (like oysters) but also three aragonitic mollusks. Samples were sent to Beta Analytics Inc., where they were prepared, bleached and analyzed with the traditional accelerator mass spectrometry (AMS) counting method. In parallel, samples were observed with the scanning electron microscope (SEM) and analyzed with X-ray diffraction (XRD) to estimate their state of recrystallization. XRD is a useful tool for this task since an aragonitic shell should not contain calcite unless it is recrystallized. Unfortunately, we could not apply this method to calcitic shells. 14C ages were calibrated to calendar ages using Oxcal 4.2 (Bronk Ramsey and Lee, 2013), with the calibration curves IntCal 13 and Marine 13 (Reimer et al., 2013), and a reservoir correction (delta_R value) of 236±31, as calculated from the website http://calib.org/marine/ (last access: 25 July 2018) based on the local values of von Rad et al. (1999) and Southon et al. (2002). Dating results, analytical information, XRD results and SEM images of shells are provided in Table 1 and Normand et al. (2018).
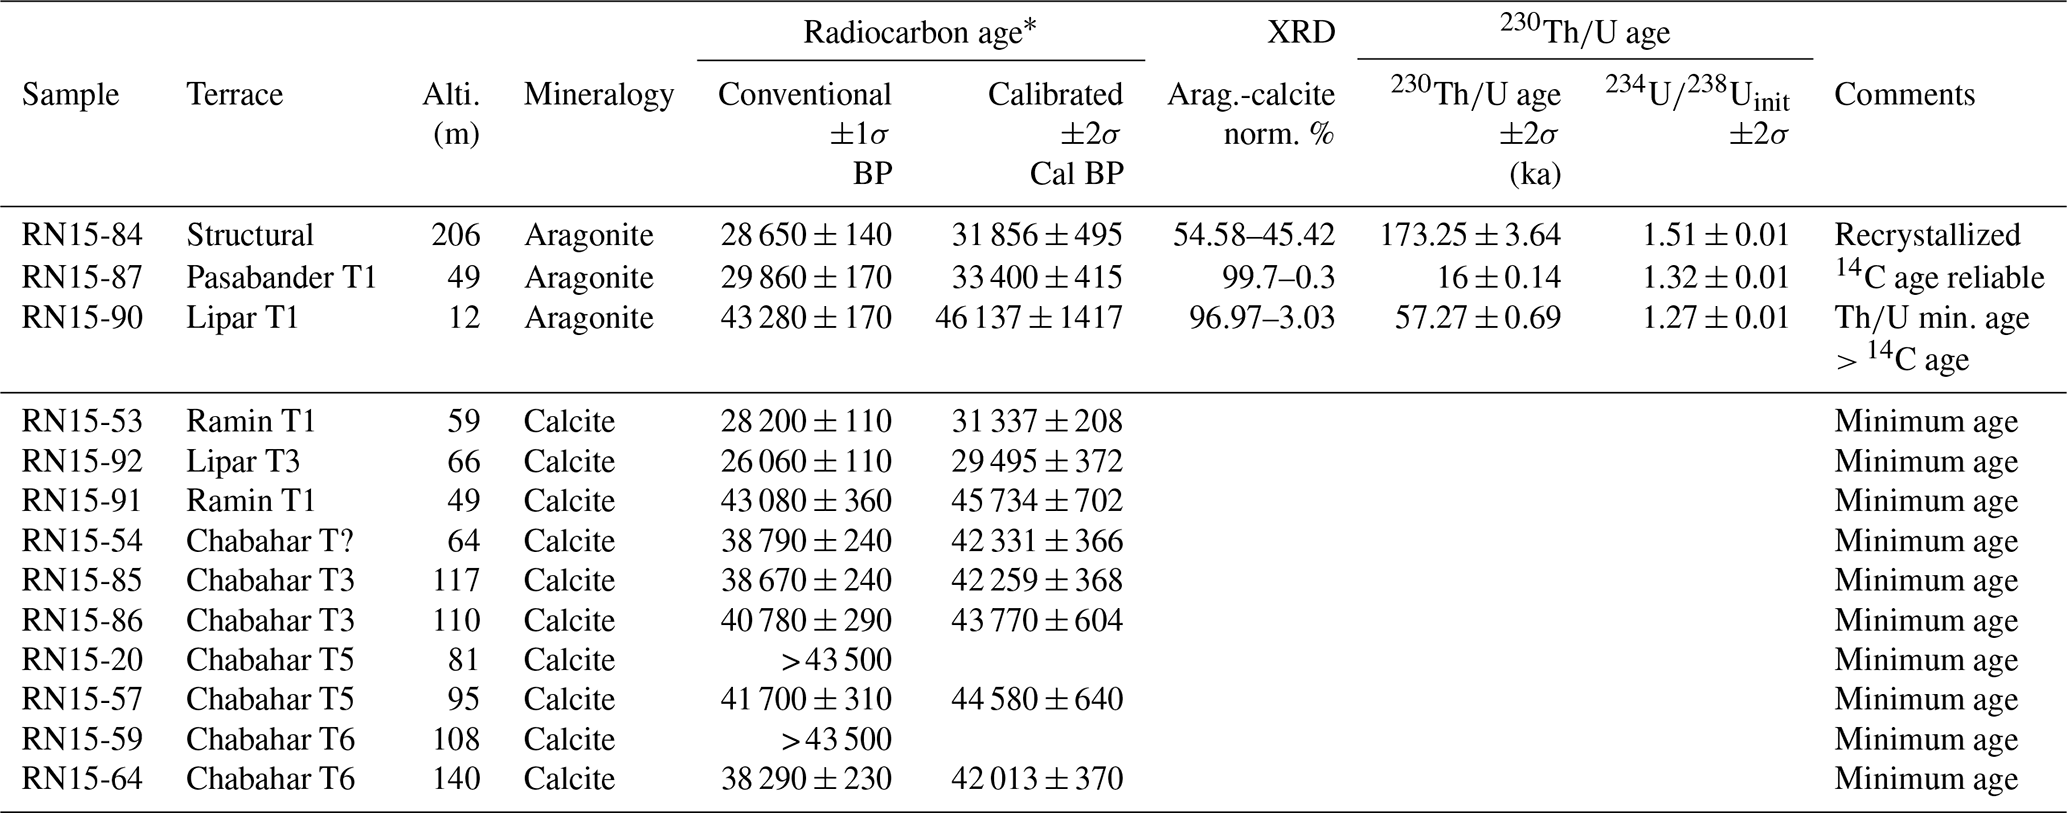
Table 1Results of radiometric dating.
* Calibrated using Oxcal 4.2 (Bronk Ramsey and Lee,
2013), with the curves IntCal 13 and Marine 13 (Reimer et al.,
2013). Reservoir correction Delta_R = 236±31 years for
Makran
according to the website, http://calib.org/marine/ (last access: 25 July 2018).
All Calcitic shells have ages close to the 14C limit.
It is not possible to check the
recrystallisation stage of the calcitic
shells using XRD; therefore, all these ages have to be considered to be a minimum
age.
3.2.3 230Th∕U dating
Because most 14C ages are close to the limit of the method (20–50 kyr), we performed 230Th∕U dating on the three aragonitic mollusk shells previously dated by 14C to test the validity of the 14C results. 230Th∕U dating on mollusk shells is uncommon because the Th∕U system is known to be easily reopened during diagenesis (Hillaire-Marcel et al., 1996; Kaufman et al., 1971). To account for this, 234U∕238U activity ratios were also measured. If this ratio is close to that of seawater (1.14±0.014; Arslanov et al., 2002), the system is interpreted to have been closed shortly after shell crystallization and the age can be interpreted as true. However, if the ratio is higher, then the system was probably contaminated by uranium from the groundwater and the measured age can only be interpreted as a minimum age (Arslanov et al., 2002; Causse et al., 2003; Hillaire-Marcel et al., 1996; Kaufman et al., 1996). Samples were analyzed in the Geotop lab of radiochronology at the University of Montreal. Analytical information are provided in Table 1 and Normand et al. (2018).
3.2.4 OSL dating
We sampled rocks of foreshore and shoreface facies from the terrace deposits, which are known to be good candidates for OSL dating because sediments deposited in such conditions have a high chance of complete bleaching before burial (Lamothe, 2016; Murray and Olley, 2002). Samples are 10–15 cm sized rock blocks, from which we extracted the core under dim red light. We treated the samples with the usual preparation methods to isolate 90–150 µm feldspar and quartz grains through sequential treatment with HCl and H2O2, sodium polytangstate density separation, Frantz magnetic separation, and HF treatment to quartz grains. Although both the minerals – quartz and feldspar – were separated, we ended up rejecting quartz due to its OSL signal being contaminated by feldspar inclusion (e.g., Lawson et al., 2015), and focused on the infrared stimulated luminescence (IRSL) method on feldspar grains.
To determine the burial dose or equivalent dose (De), we measured the luminescence signals on 12 aliquots (each containing ∼100 grain) per sample using the Risø TL/OSL-DA-20 reader at the Institute of Earth Surface Dynamics, University of Lausanne. To minimize the effect of anomalous fading (Wintle, 1973), commonly observed in IRSL of feldspar, we measured the elevated-temperature (225 ∘C) post-IR IRSL single-aliquot regenerative-dose (SAR) protocol (Buylaert et al., 2009). Results were processed with the Analyst 4.31.7 software (Duller, 2015). Each aliquot was evaluated according to the following acceptance criteria: recycling ratios at 10 %, maximum test dose error at 10 %, maximum recuperation at 10 % of the natural signal and maximum paleodose error at 20 %. De values were assessed using the central age model (Galbraith et al., 1999). The environmental dose was calculated with the DRAC software (Durcan et al., 2015) after measuring the radioactive elements (U, Th, K and Rb) using inductively coupled plasma mass spectrometry (ICPMS) (from ActLabs, Canada). The reliability of the protocol and zeroing of clock at the time of deposition was assessed with a dose-recovery test (Murray and Wintle, 2003; Wallinga et al., 2000) on four representative samples. We exposed the samples to natural light for 48 continuous hours before measuring the natural signals (to check the residual dose) and recovery of an artificially given dose of 300 s (∼36 Gyr) on the top of artificially bleached sample using the same pIR-IRSL protocol. Dose recovery ratios (recovered dose/given dose) are 0.9 to 1.1.
Although the post-IR IRSL of feldspar at elevated temperature is less prone to anomalous fading (Buylaert et al., 2009; Thomsen et al., 2008), we performed a fading test on all samples to correct this effect. We measured four aliquots per sample following the procedure of Buylaert et al. (2009) to determine the fading rate (g-values; Auclair et al., 2003) of each sample. Ages were then corrected accordingly, using Eq. (A5) of Huntley and Lamothe (2001), except for two samples (RN17-14 and RN17-24), which did not show any fading behavior. Although this fading correction method is appropriate to younger sample, where the equivalent dose is in the linear part of dose response curve, we applied this method to all samples (some are in the nonlinear part of dose response curve), considering that the fading rate of pIR-IRSL225 signal is generally small.
Table 2Results and details of OSL dating and assigned MIS. RSD: relative standard deviation; OD: overdispersion.
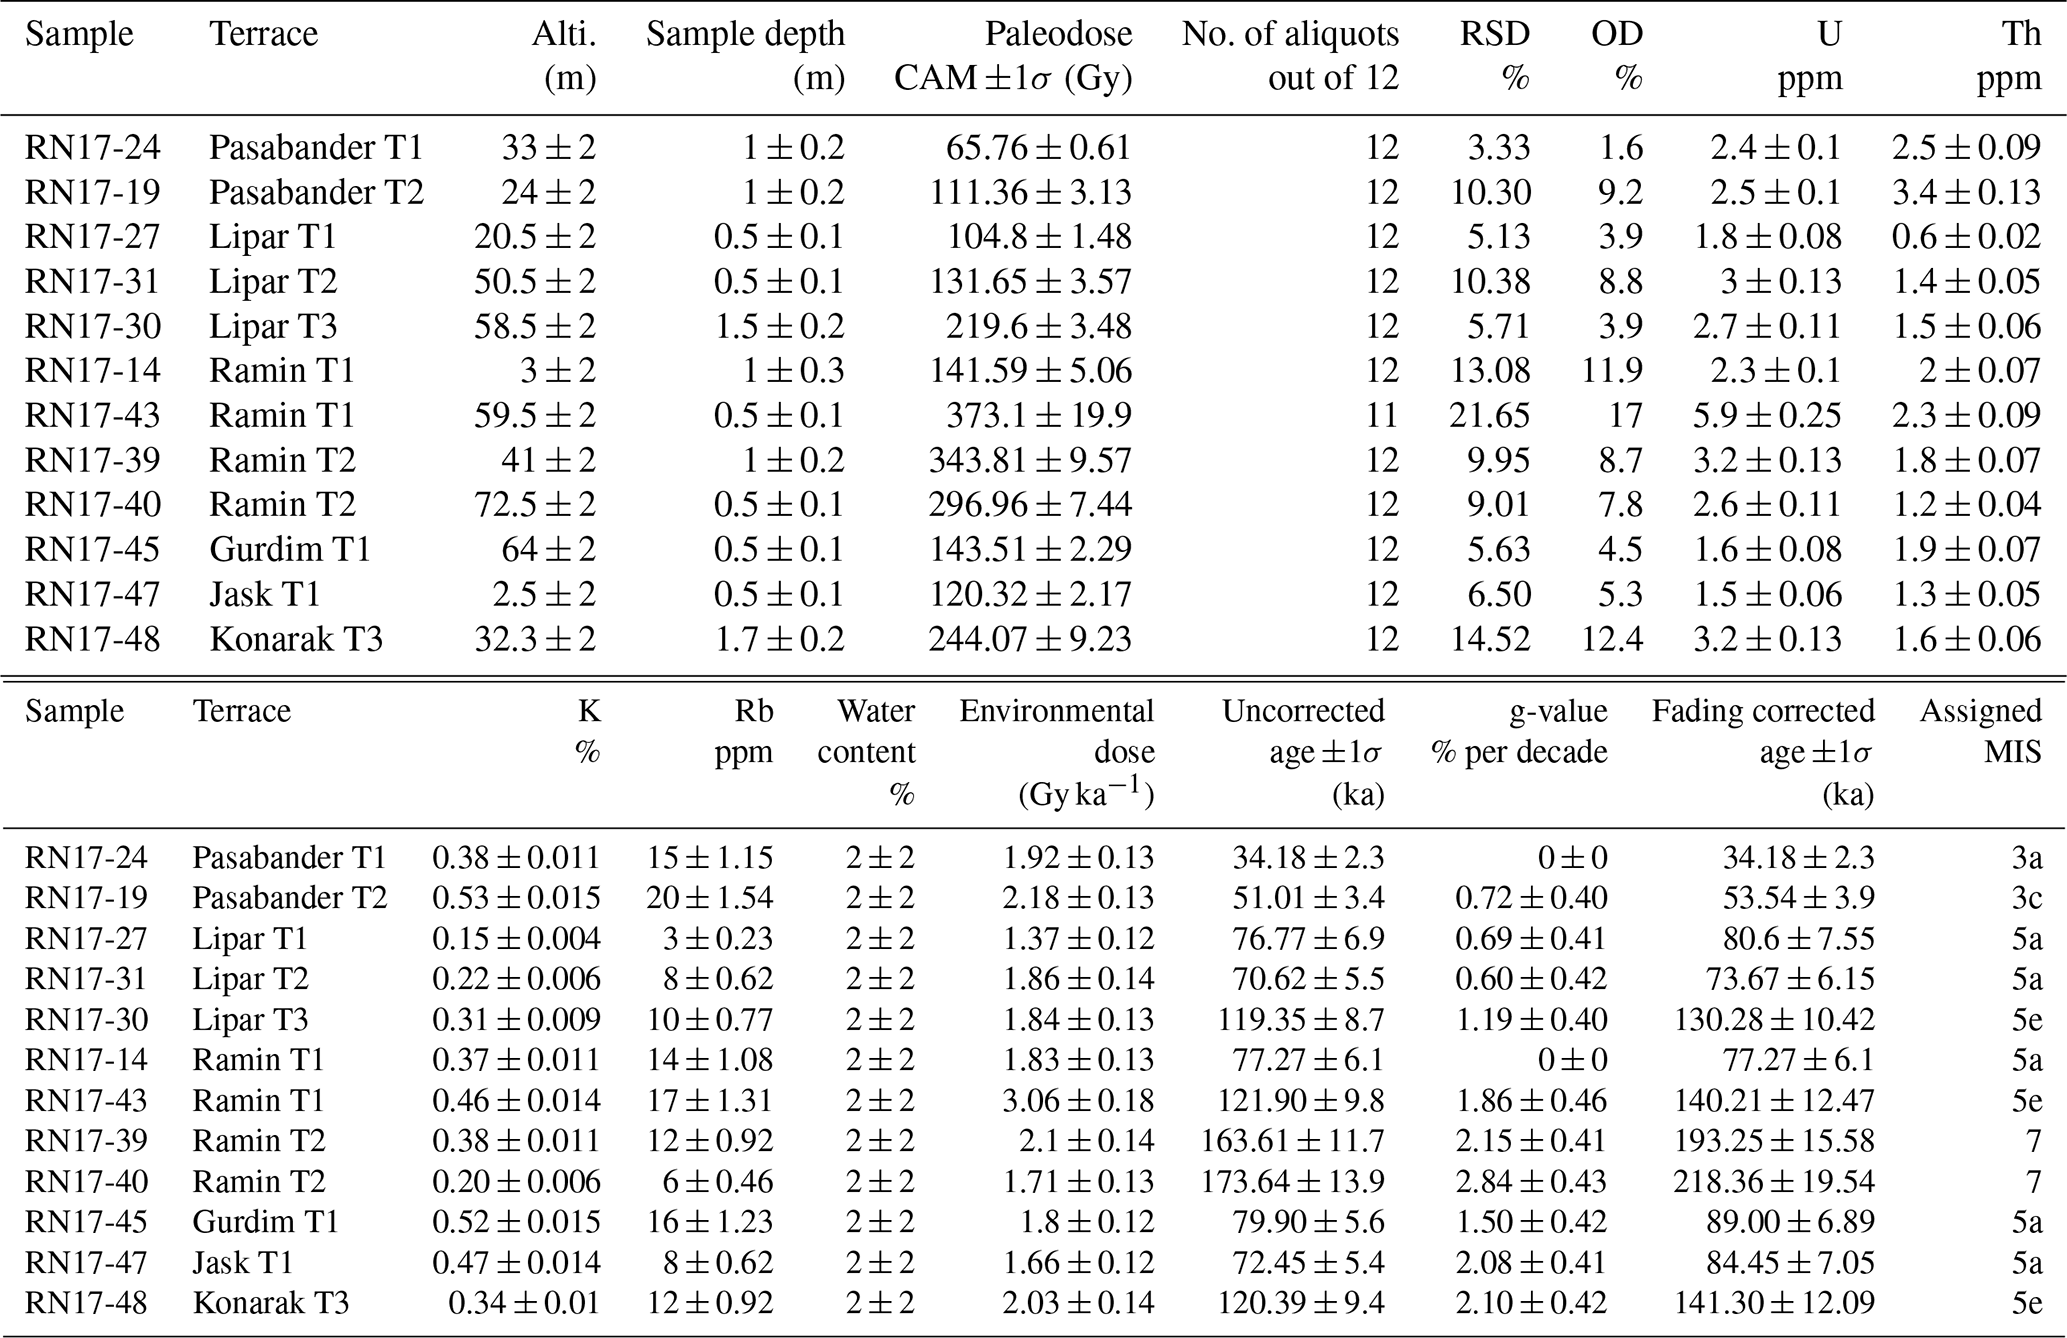
Results are presented in Table 2. More details on sample measurements, environmental dose and age calculations are presented in Normand et al. (2018).
3.3 Calculation of surface uplift rate
The sequence of uplifted marine terraces observed in the landscape is assumed to be the geomorphic record of Quaternary sea-level highstands (Lajoie, 1986) which happened during odd-numbered MIS. In general, the age and altitude of the sampled material is not used to calculate uplift rates. Instead, the age of the nearest previous sea-level highstand and the elevation of the shoreline angle (Fig. 2a) of the terrace is used (e.g., Jara-Muñoz et al., 2015; Pedoja et al., 2018a, b; Roberts et al., 2013; Saillard et al., 2009). Uplift rates (U) are then calculated using the terrace shoreline angle elevation (E), eustatic sea-level estimates (e) and age (A) of the correlated highstand (from the literature), with the formula (Fig. 3) (Lajoie, 1986):
Uplift rates may vary over time, whereas Eq. (1) considers only the mean uplift rate from today until the age A. To gain more insight on uplift variations though time, different terrace levels within the same profile must be investigated and their individual uplift rates compared (e.g., Saillard et al., 2009).
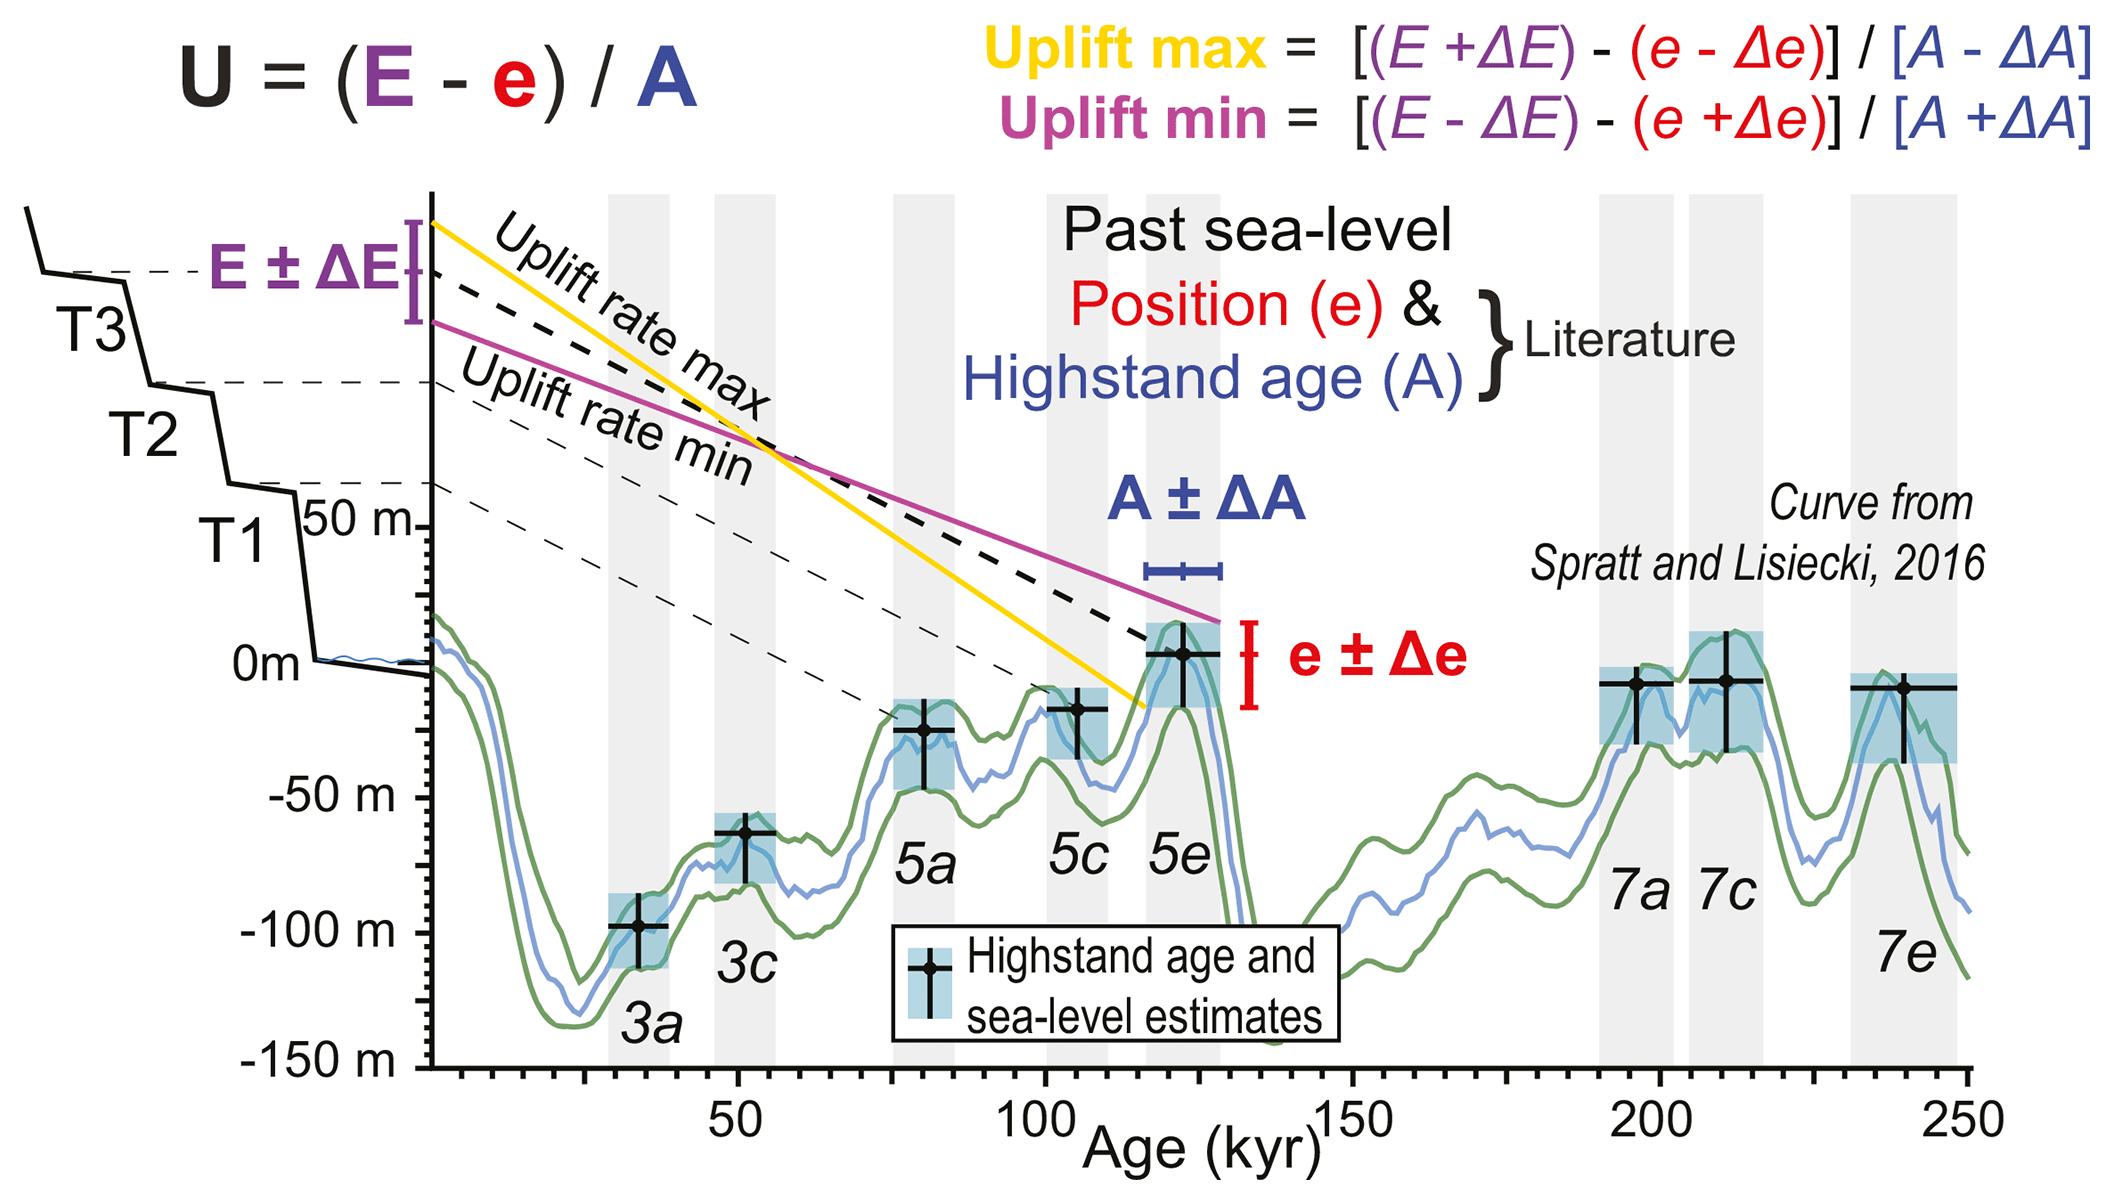
Figure 3Uplift calculation method. The curve shown is PC 1 with bootstrapping 2.5th and 97.5th percentile from Spratt and Lisiecki (2016). Light gray bands are the MIS ages from the literature reported in Table B.2 in Supplement S2.
Although this equation is simple, it is difficult to obtain precise uplift rates because of the errors on the different terms, especially on the eustatic sea-level curve (e) (see Sect. 2.4). Therefore, the calculation of a precise uplift rate value is complicated and we focus on obtaining uplift rate ranges including the different uncertainties using a modified version of Eq. (1) (Fig. 3; Table 3):
where the delta symbols represent the estimated variability in the different parameters. This method, used in previous marine terrace studies (e.g., Pedoja et al., 2018a, b), fully incorporates the uncertainties on the terms, resulting in broader error values than the usual error propagation calculations (Tables B.3 and B.4 in Supplement S2). In an age vs. height diagram, Umin represents the curve with the lowest slope and Umax that with the steepest (Fig. 3). U is the mean uplift rate, as calculated using Eq. (1). We also computed apparent uplift rates (Ua), calculated without any eustatic correction (e.g., Pedoja et al., 2018b), which is a means of comparing terraces globally, without considering the choice of the eustatic component.
Table 3Uplift rate calculation at the shoreline angle situated directly northwards of each sample. We present here the results calculated with two sea-level curves (Shakun et al., 2015; Spratt and Lisiecki, 2016), though any other curve could be used in the same manner, following the method described in Sect. 3.3. Notice that these uplift rates are only relevant locally for tilted terraces; thus, a record of spatial uplift rate variation is reported as a graph below each terrace map (Figs. 4–7).
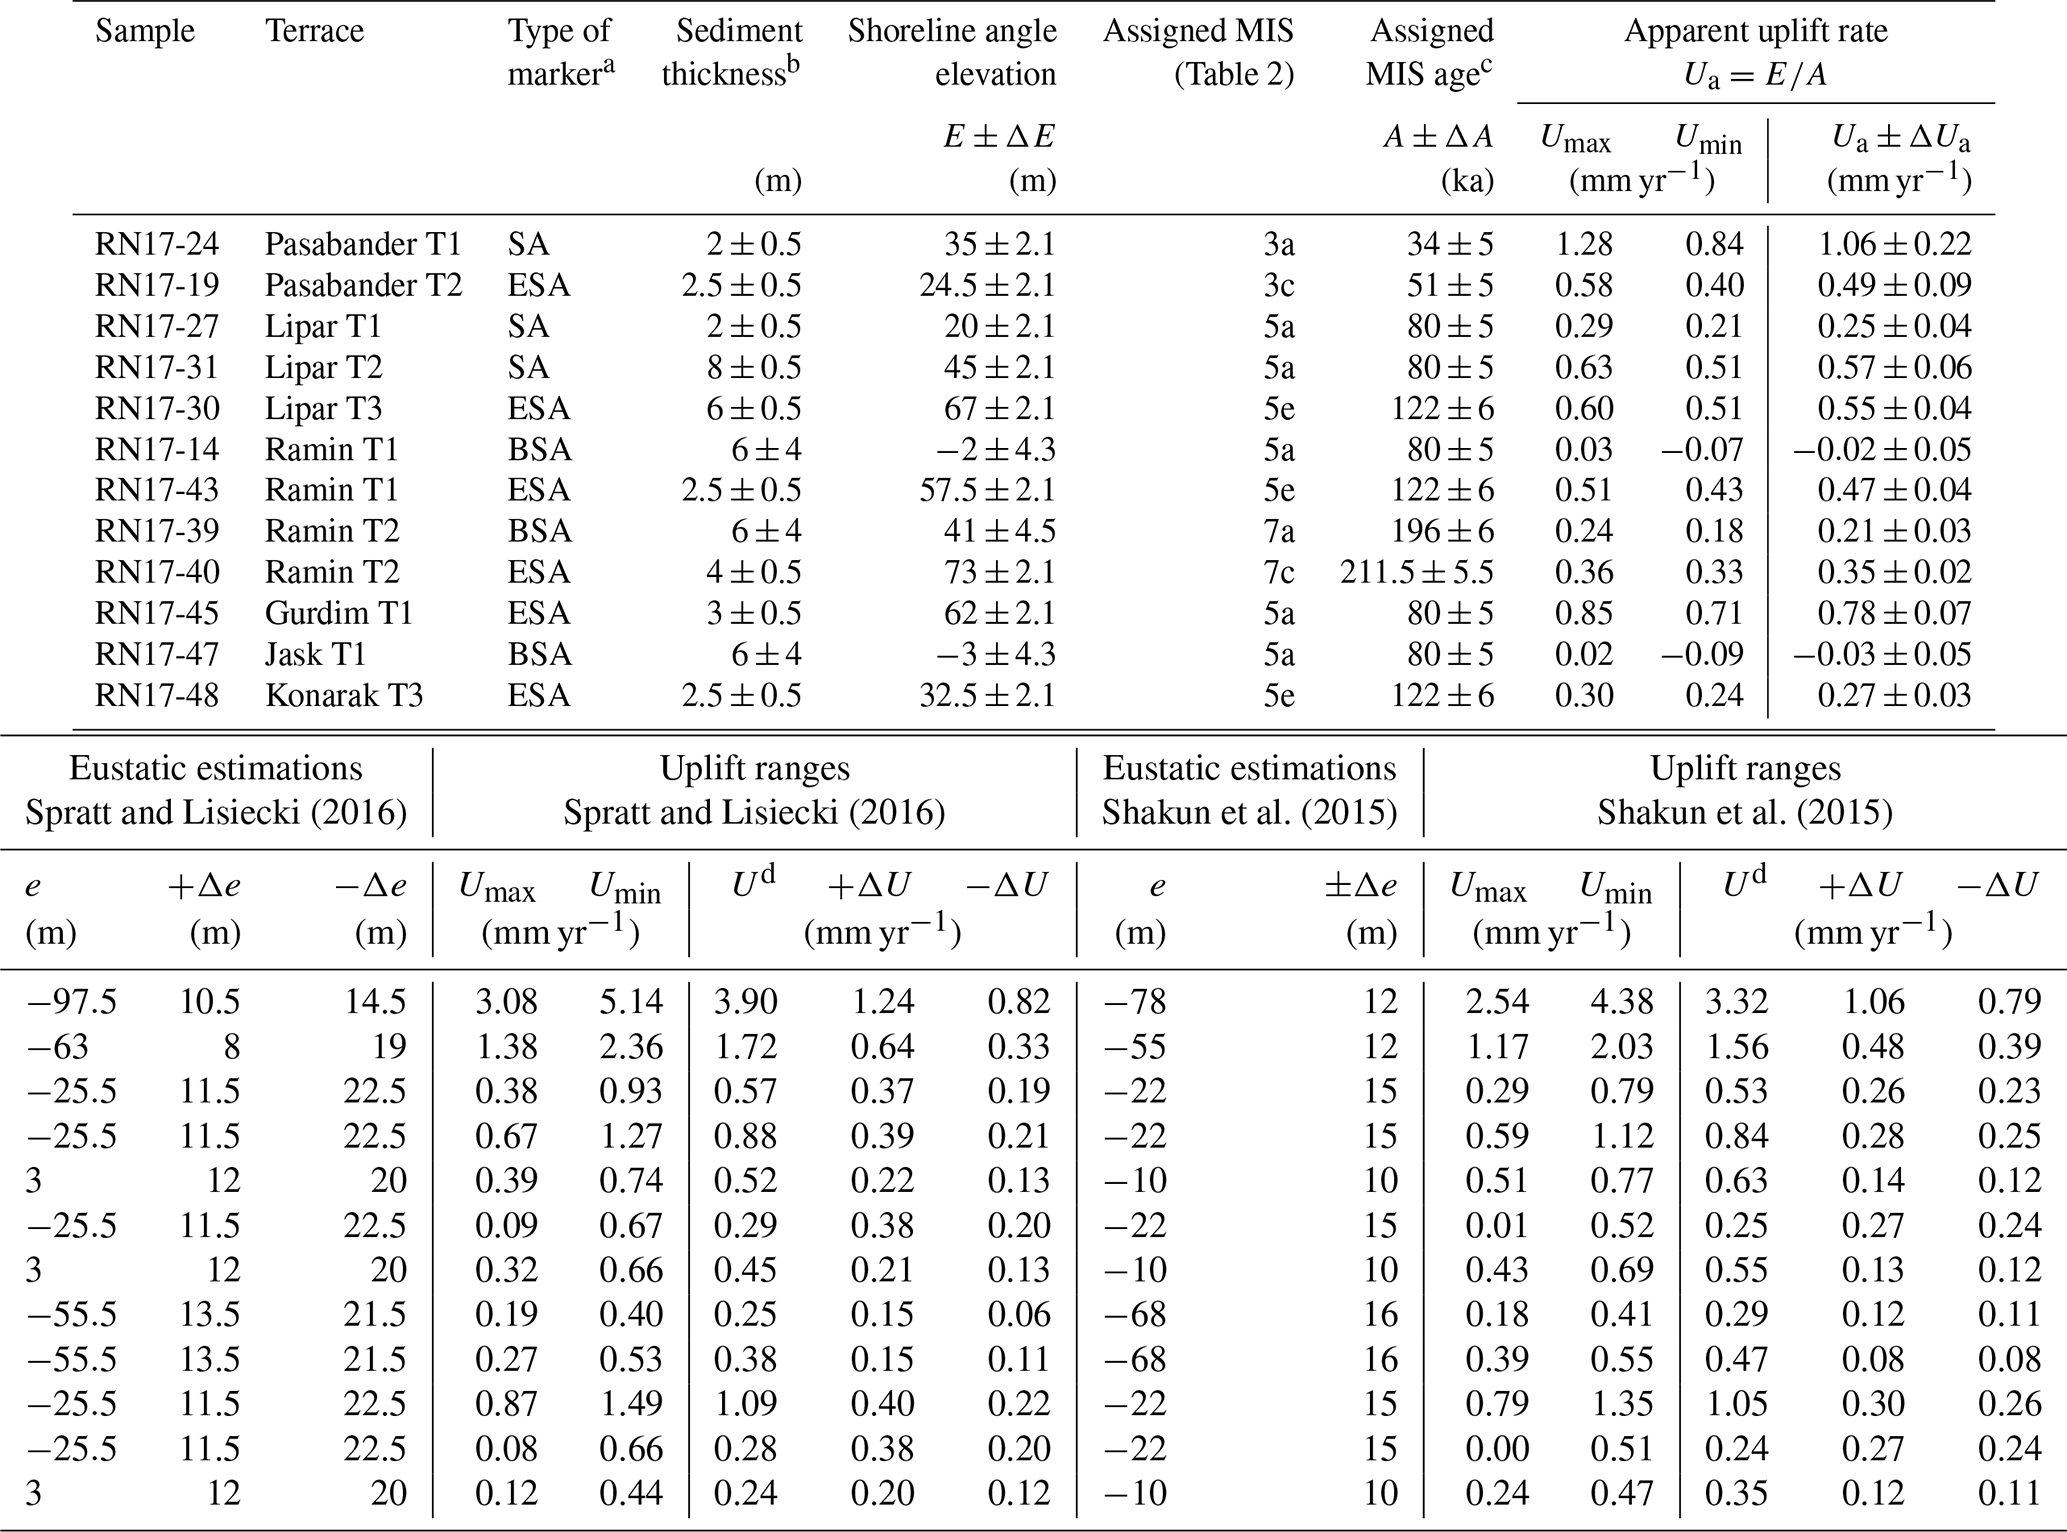
a SA: shoreline angle. ESA: eroded shoreline angle. BSA: buried shoreline angle; shoreline angle position and altitude unknown – uplift rates calculated from sample elevation. b Sediment thickness at the shoreline angle, as observed in the field; 6±4 m is set when the thickness could not be determined. c See Table B.2 in Supplement S2. d Using Eq. (1): (Lajoie, 1986).
3.3.1 Past highstand age and eustatic sea level
In this paper, we calculate uplift rates based on the eustatic curves from two recent papers, namely Shakun et al. (2015) and Spratt and Lisiecki (2016) (sea-level estimates used are reported in Table B.2 in Supplement S2). We chose these curves because they are built from a multitude of different δ18O records from all around the globe, using statistical tools, and therefore we feel that they could potentially be a good approximation of global sea-level change. Moreover, they also provide error ranges, which are useful to calculate uplift rate errors.
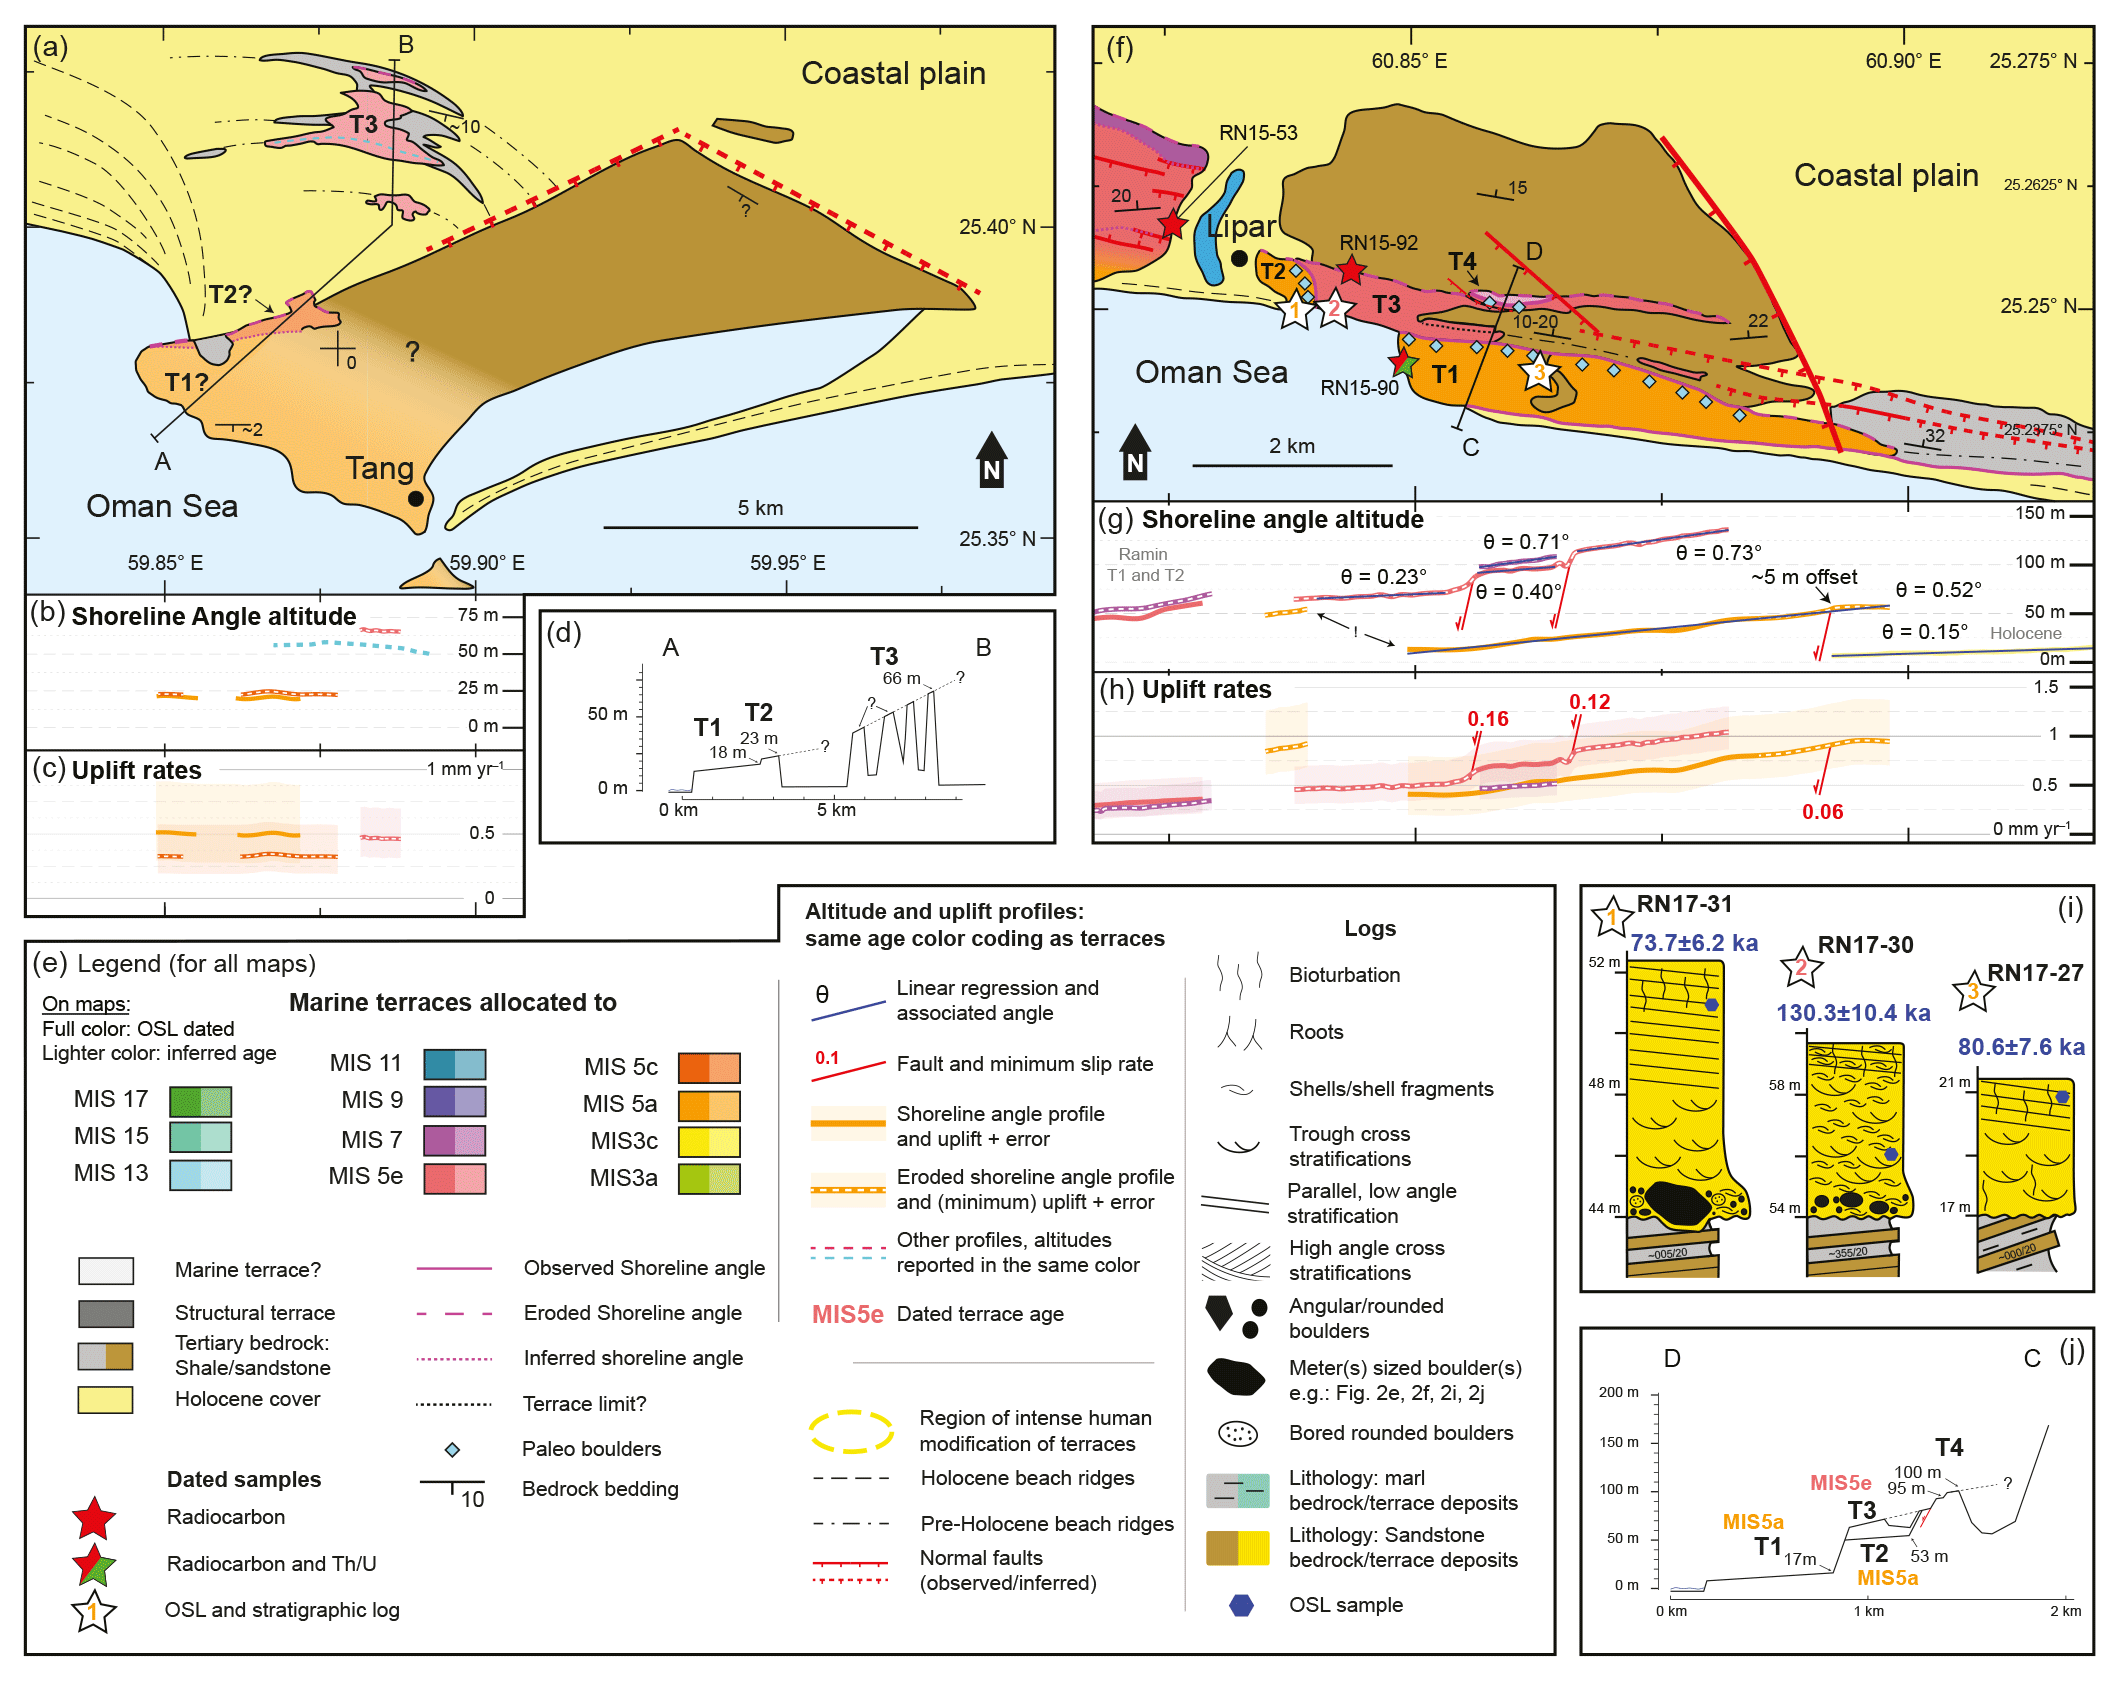
Figure 4Terrace maps of the Tang and Lipar regions (see Fig. 1). (a) Terrace map of Tang. (b) Shoreline angle altitude in an east–west profile. (c) Uplift rates. (d) Altitude profile through the terraces (profile A–B). (e) Legend for all terrace maps, sedimentary logs and altitude/uplift profiles. (f) Terrace map. (g) Shoreline angle altitude in an east–west profile. (h) Uplift rates. (i) Sedimentary log at sampling locations and sample OSL age (blue). (j) Altitude profile through the terraces (profile C–D).
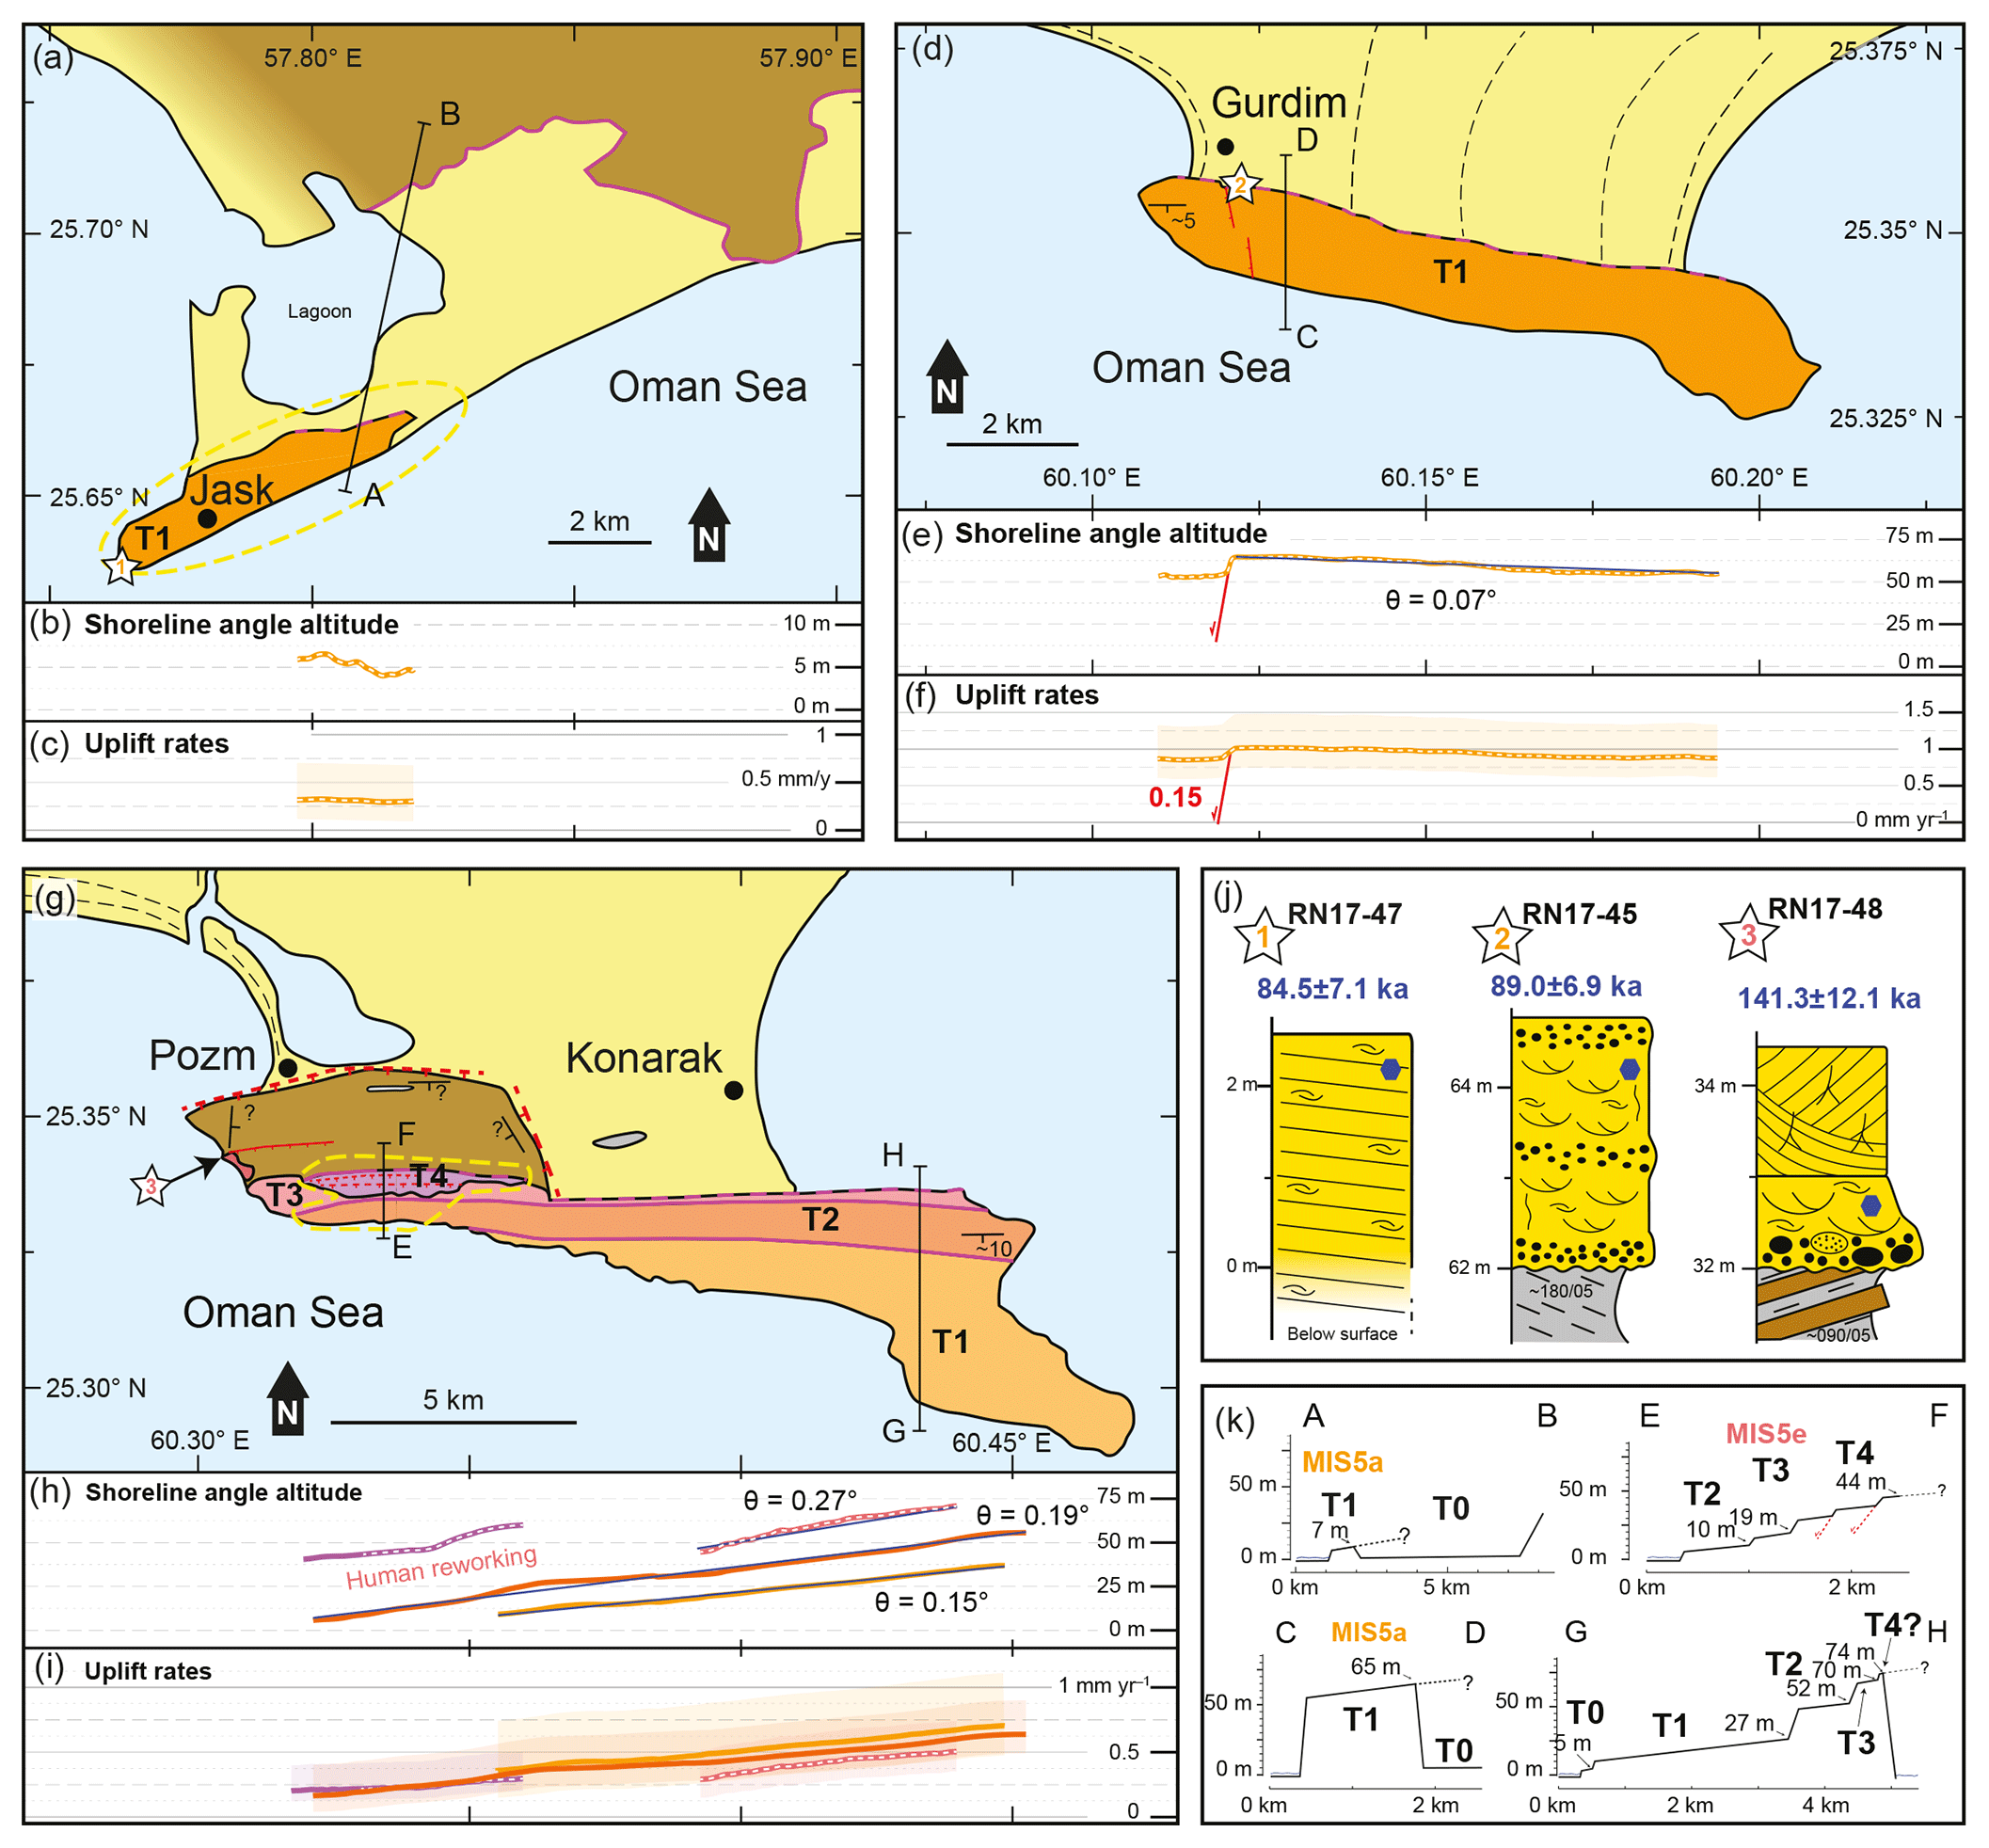
Figure 5Terrace maps of the Jask, Gurdim and Konarak regions (see Fig. 1). (a) Terrace map of Jask. (b) Shoreline angle altitude in an east–west profile. (c) Uplift rates. (d) Terrace map of Gurdim. (e) Shoreline angle altitude in an east–west profile. (f) Uplift rates. (g) Terrace map of Konarak. (h) Shoreline angle altitude in an east–west profile. (i) Uplift rates. (j) Sedimentary log at sampling locations and sample OSL age (blue). (k) Altitude profiles through the terraces.
Due to the age uncertainties of the δ18O records, the timing of the chosen sea-level curves is not well constrained (Shakun et al., 2015; Spratt and Lisiecki, 2016). We use the MIS numbering proposed by Railsback et al. (2015) and MIS ages compiled from the literature as reference (Dutton et al., 2009; Murray-Wallace and Woodroffe, 2014; Stirling et al., 1998, 2001) (Table B.2 in Supplement S2). If sea-level reconstructions become more precise in the future, it is always possible and easy to modify the ages and eustatic values and recalculate the uplift rates.
3.3.2 Shoreline angle
Although it is not perfect as zero sea-level indicator (Rovere et al., 2016), the shoreline angle of each terrace (see Fig. 2a) is a good approximation of sea level during the peak of a highstand (Burbank and Anderson, 2001; Lajoie, 1986). In the Makran, precise measurement of the shoreline angle altitude is complicated for the following reasons.
-
At most sites, the shoreline angle is buried below a sedimentary layer (Fig. 2a, i).
-
The fine-grained marl bedrock above which some Makran marine terraces are built is easily degraded by surficial erosion during the yearly heavy rain events, if not covered by indurated rocks (Snead, 1967). Hence, the paleocliff at the back of the terrace is sometimes eroded down to the coastal plain level (Fig. 2h; see also Fig. H in Normand et al., 2018). Therefore, the exact position and especially the altitude of the shoreline angle is unknown because marine terraces, as their modern counterparts (rocky shore platforms), generally slope at a shallow angle towards the sea. In this case, the wave-cut surface at the back of the terrace was used as an approximation for the shoreline angle. This type of shoreline angle will hereafter be referred to as “eroded shoreline angle”, and uplift rates calculated using their altitudes are to be regarded as minimum values.
-
Most terraces are tilted parallel to the subduction trench; therefore, the altitude of the shoreline angle (and the uplift rate) varies from east to west.
We calculated punctual uplift rates at the longitude of each sample using the terrace shoreline angle situated directly northwards of the sample (Table 3) (i.e., perpendicular to the trench). For most samples, we were able to visit the aforementioned shoreline angle in the field and exactly measure the thickness of the terrace deposits. Because the shoreline angle refers to a wave-cut surface and not a terrace deposit, we subtracted the sediment thickness from the surface altitude to obtain our E±ΔE values (Fig. 3) (Table B.3 in Supplement S2). However, because the terraces are tilted, these punctual uplift values are only relevant locally.
To illustrate regional terrace tilting, we calculated lateral variation in uplift rate using the shoreline angle altitude extracted from the TanDEM-X DEM (DEM vertical error, ΔAlti = 2 m) (Figs. 4b, g, 5b, e, h, 6b, 7e). We used the TanDEM-X for its increased spatial resolution (∼12 m), compared to the others available DEMs (ASTER = 30 m; SRTM = 30∕90 m) (Rizzoli et al., 2017). A greater resolution allowed for a better estimation of the shoreline angle position and altitude. Moreover, after being corrected to orthometric height values, the altitude of the TanDEM-X data were comparable to those of ASTER (though both are systematically lower than SRTM; see Table B.5 in Supplement S2). We could not visit the whole range of shoreline angles to measure the thickness of the terrace layers, so we subtracted a general value for the thickness of the sediments. Based on our field observations of the Makran terraces, the sediment layer can vary from 2 to 10 m, so we used m. We chose the sea-level curve of Spratt and Lisiecki (2016) for a eustatic reference (Table B.2 in Supplement S2) and calculated uplift rates and their errors following the method described previously (Sect. 3.3) (Figs. 4c, h, 5c, f, i, 6c, 7f).
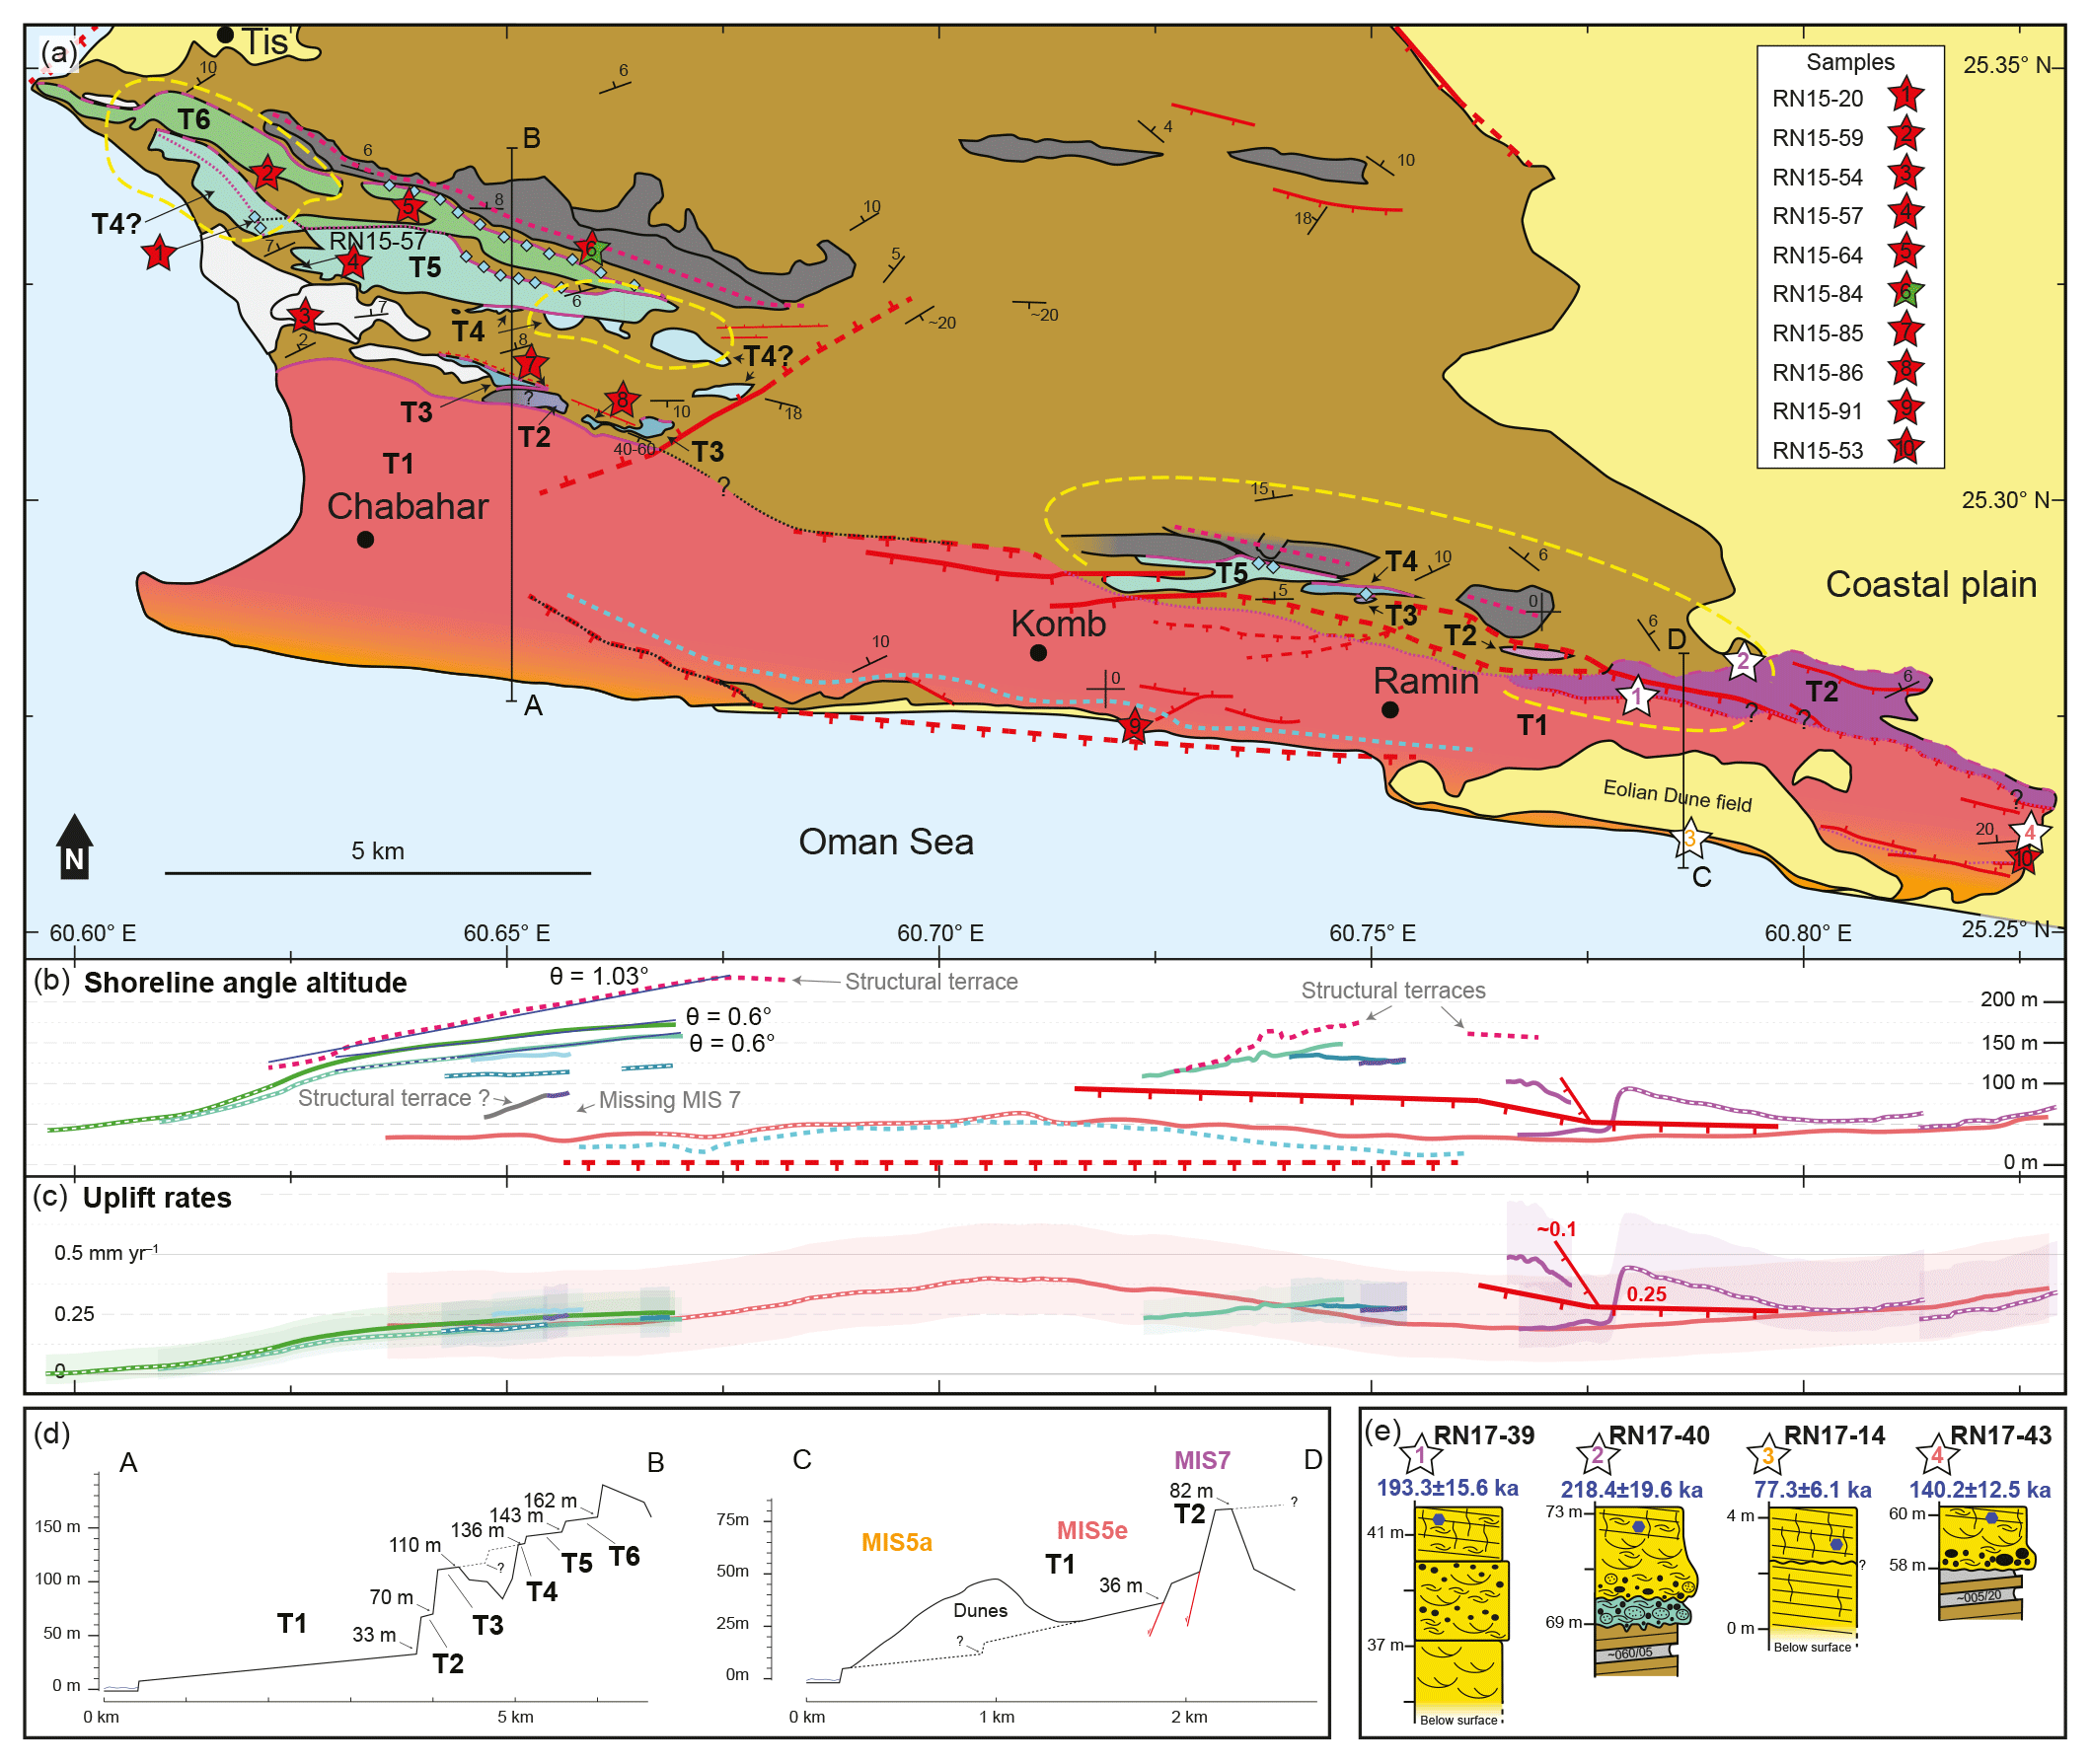
Figure 6Terrace map of the Chabahar and Ramin regions (see Fig. 1). (a) Terrace map. (b) Shoreline angle altitude in an east–west profile. (c) Uplift rates. (d) Altitude profile through the terraces. (e) Sedimentary log at sampling locations and sample OSL age (blue).
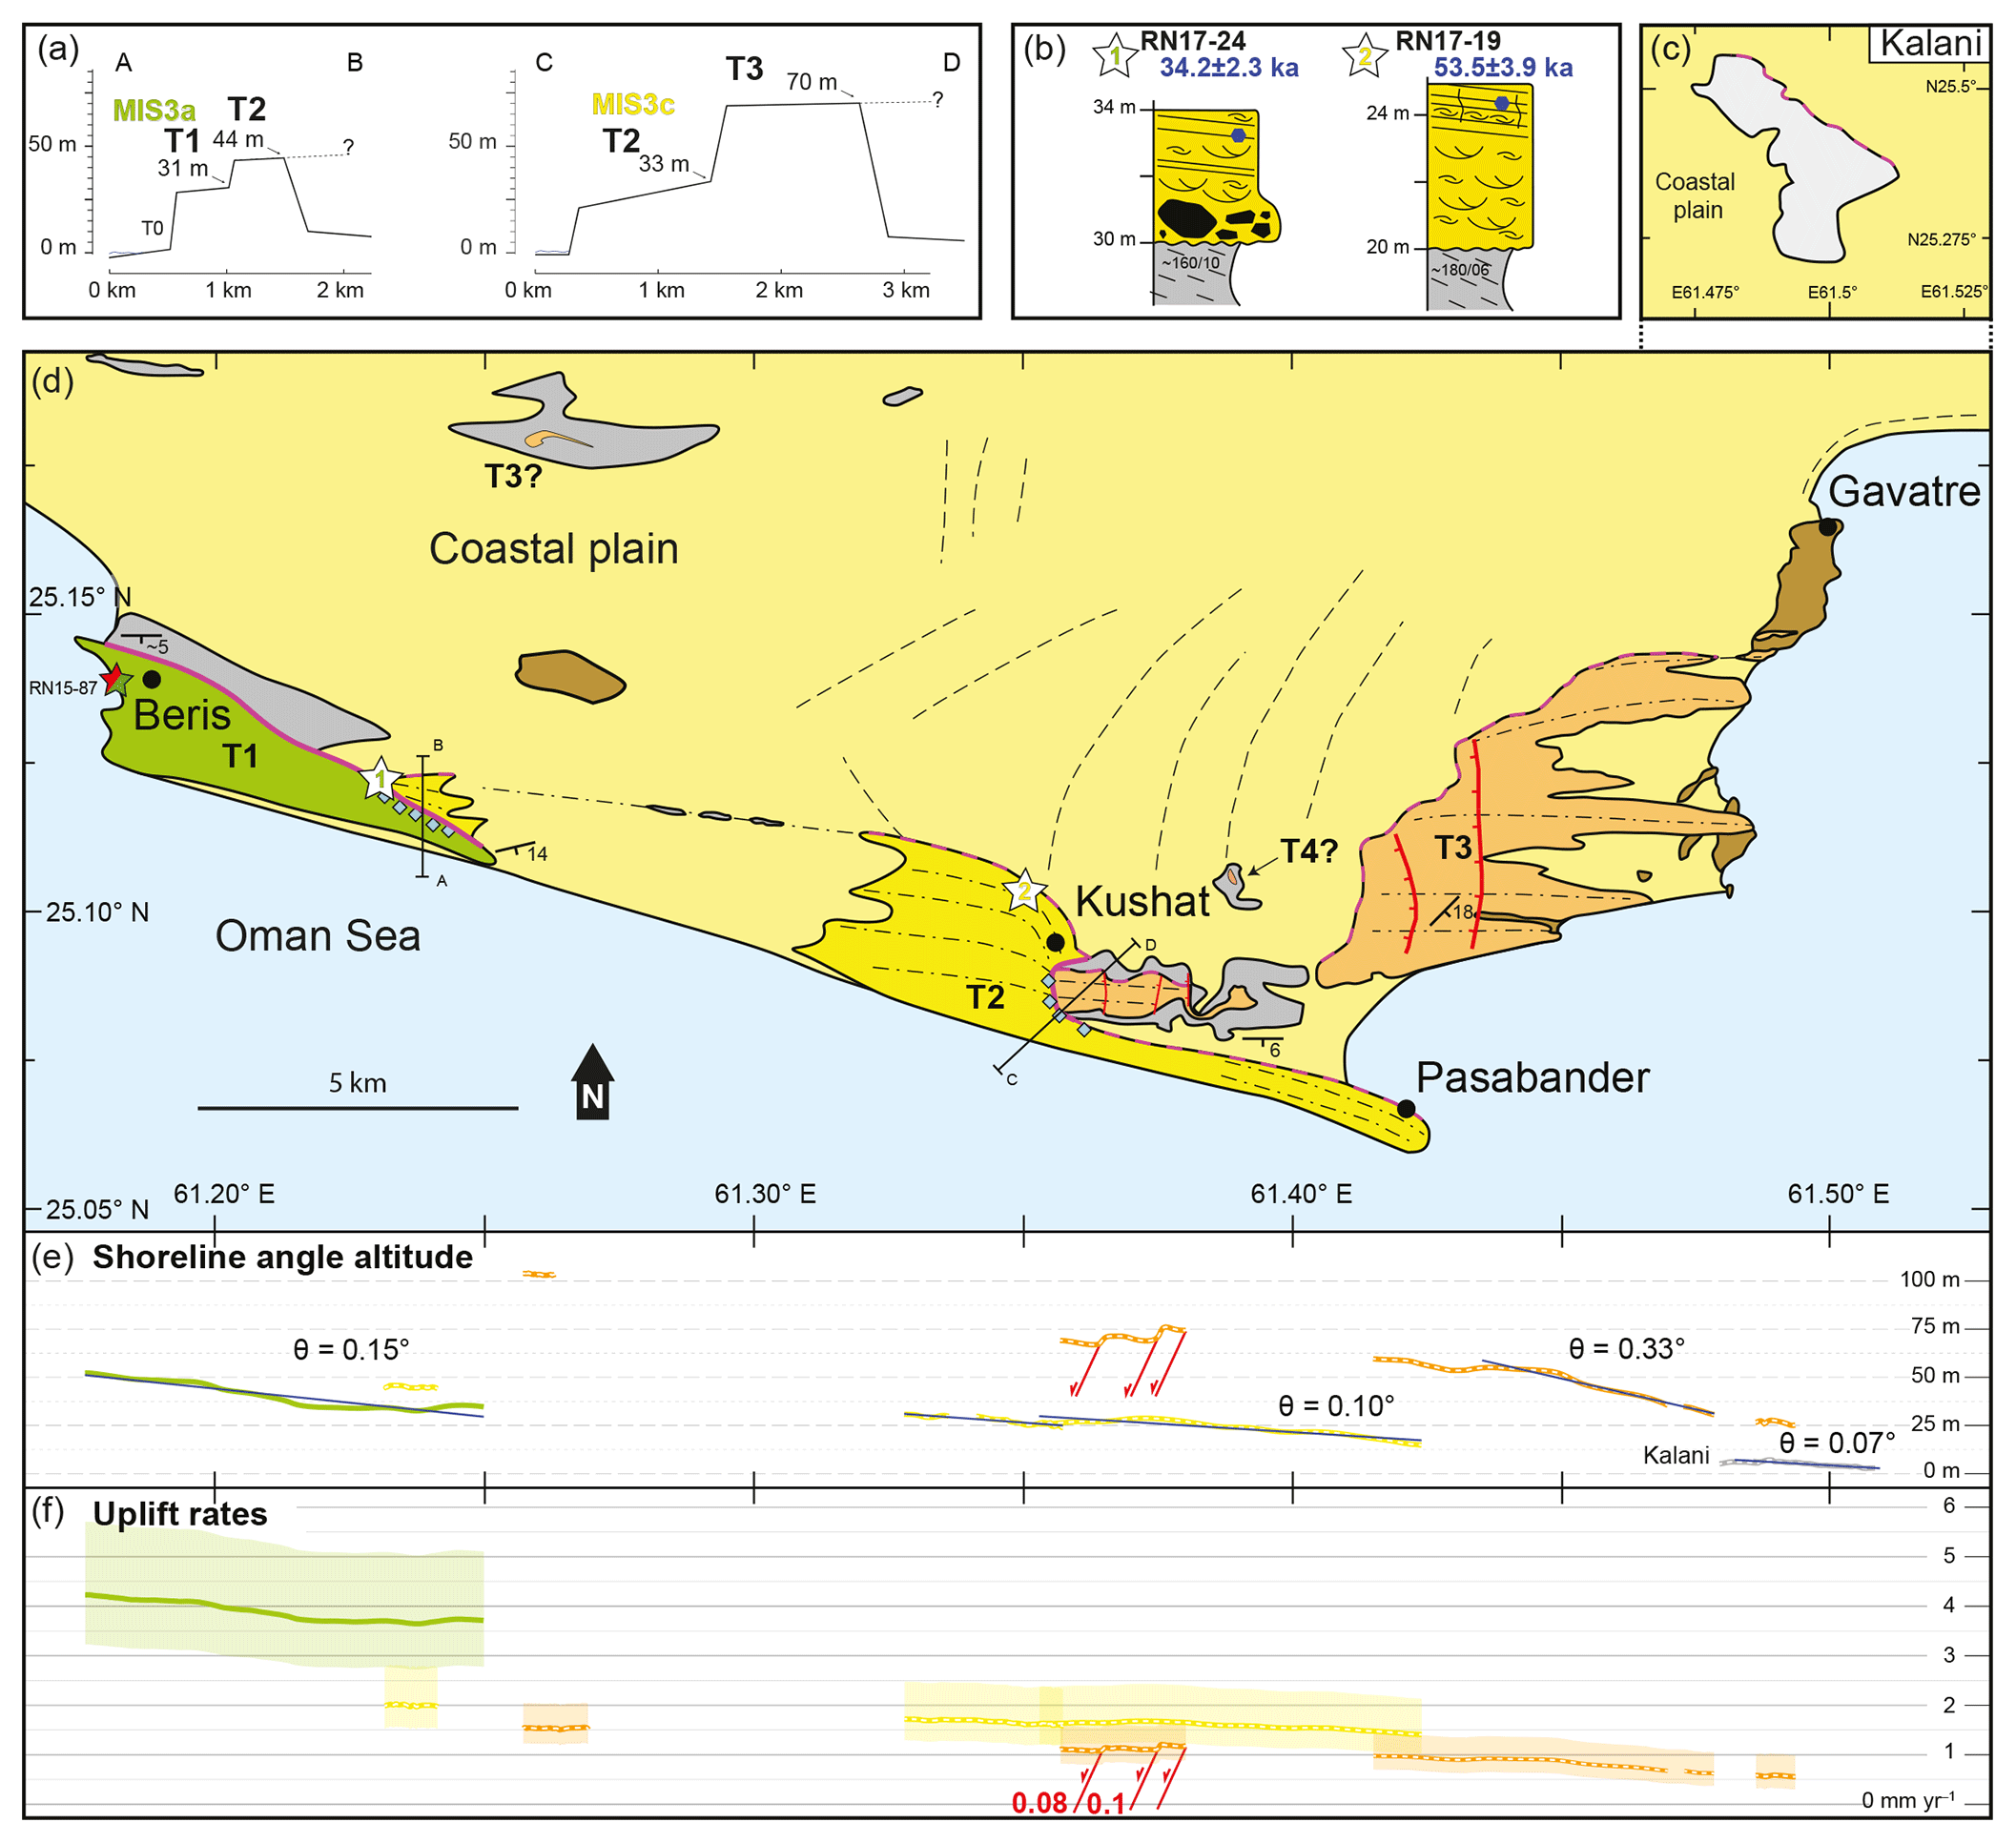
Figure 7Terrace map of the Pasabander region (see Fig. 1). (a) Altitude profile through the terraces. (b) Sedimentary log at sampling locations and sample OSL age (blue). (c) Terrace map of the Kalani terrace, situated a few kilometers northwards of Gavatre. (d) Terrace map of Pasabander. (e) Shoreline angle altitude in an east–west profile. (f) Uplift rates.
4.1 Field observations
The Makran marine terraces are not continuous along the coast and correlation of terraces between each separated region is intricate without geochronological data (Fig. 1b). This is further complicated by the fact that many terraces are locally tilted eastward or westward by up to 0.73∘ (i.e., ∼13 m altitude difference every kilometer). This trend seems to continue eastward to Pakistan where the tilt of the Jiwani terraces mirrors that of those in Pasabander. A good appreciation of terrace tilting can be seen in the shoreline angle altitude profiles reported below each terrace map (Figs. 4–7). In some cases, terraces tilting is not obviously related to specific normal faults (e.g., Fig. 5h), whereas in other cases the two are clearly linked (eastern region of Fig. 6).
Our field observations and conclusions on terrace spatial extend are reported in the form of seven maps of the terrace regions (from east to west: Jask, Tang, Gurdim, Koanrak, Chabahar–Ramin, Lipar, Beris and Pasabander) (Figs. 4–7), supplemented by metadata contained within the GIS layers in the data repository (see Sect. 3.1) (Normand et al., 2018). Map legends are found in Fig. 4e. The maps are accompanied by topographical, sedimentological and geodynamical data which are (1) the reports of selected north–south topographic profiles through the terraces, illustrating the 10 different terrace sequences observed; (2) a report of the shoreline angle altitude per latitude value (i.e., alongstrike the subducting trench); (3) a report of the uplift rates calculated based on these shoreline angle altitudes (see Sect. 3.3.2); (4) sedimentary logs of the terrace deposits at the OSL sampling sites, illustrating the prograding sedimentary successions of the terrace deposits (Sect. 3.2.1). All maps are also provided as KMZ and shapefiles with a metadata description (Normand et al., 2018).
Hereafter, we briefly describe the different marine terrace areas mapped. More in-depth descriptions can be found as Supplement S3, while 37 selected field pictures are compiled in Normand et al. (2018). The Jask terrace (Fig. 5a) is a small isolated platform lying at low elevation (∼5 m a.s.l.). It has no paleocliff and the northern limits of the terrace are difficult to ascertain due to its high degree of urbanization. The Tang terraces (Fig. 4a) are composed of at least three levels. The two lowest terraces (T1 and T2) have uncertain northern limits and are built on subhorizontal sandstone Tertiary layers. Hence, they might be structural terraces. The upper level (T3) is an obvious isolated platform, 65 m high, built on marl bedrock (that outcrops as badland around the terrace). Unfortunately, recent human extraction of terrace deposit material has degraded most of the original layer. The Gurdim terrace (Fig. 5d) is a single platform, 50–65 m high, slightly titled towards the east (0.07∘). The ∼10 m offset of the western end of the terrace is attributed to the action of a west-dipping normal fault. The paleocliff of this terrace is completely eroded such that the marine terrace has the peculiar morphology of an isolated high platform bounded by cliffs. We could not visit Konarak terraces (Fig. 5g) as it is a restricted area, except at its western tip. However, we base our mapping on remote sensing and a previously published maps (Little, 1972; Page et al., 1979). The eastern side of the peninsula hosts three wide and well-delineated terraces (possibly a fourth terrace at the northeasternmost tip), culminating at 73 m. These marine terraces are clearly tilted towards the west, their tilt angle increasing with age (Fig. 5h). The western relief is mainly made of Tertiary bedrock, covered in the south by highly degraded marine terraces (due to human activity). The Chabahar marine terraces (Fig. 6a) are built on the seaward side of a large (> 200 km2) rocky headland of resistant Tertiary bedrock. The terrace sequence there is the most complete of the whole Iranian Makran, with at least six levels ranging up to 165 m altitude. However, the terrace levels host the city of Chabahar (∼ 100 000 inhabitants); hence, the original geomorphology of the marine terraces is not always preserved. The lower terrace (T1), where most of the city is located, consists of a wide (1.5–4 km) and long (20 km) flat area. This lower terrace (T1) is shared with the Ramin terrace sequence (Fig. 6), found 10 km east of Chabahar and built on the footwall of a normal fault system. It was difficult to differentiate these marine terraces from neighboring structural terraces as they have been heavily exploited for sandstone blocks since 2005. Hence, mapping in this area was challenging and the results are subject to uncertainties. The Lipar terraces (Fig. 4f) are separated from the Ramin terraces by a fluvial valley. The sequence of marine terraces there comprises four levels, strongly tilted towards the west, built on the southern side of a headland made of north-dipping Tertiary sandstone layers. Finally, the area of Pasabander (Fig. 7d) has three major terrace levels with large surficial extension (9–20 km2) and two small isolated platforms (< 0.2 km2), a possible relic of a fourth level. These large terraces are built on soft marl bedrock and form strongly eroded flat-topped platforms tilted towards the east.
4.2 Dating
4.2.1 Radiometric dating
The results of radiocarbon dating span 20–50 ka, similar to previous radiocarbon dates in the Makran (Table 1) (see Supplement Table S1). There does not seem to be any kind of relationship between the altitude and radiocarbon age of the dated terraces (Fig. 8). However, radiocarbon results are close to the limit of the method (> 20 ka), and therefore caution should be taken in the interpretation of such ages.
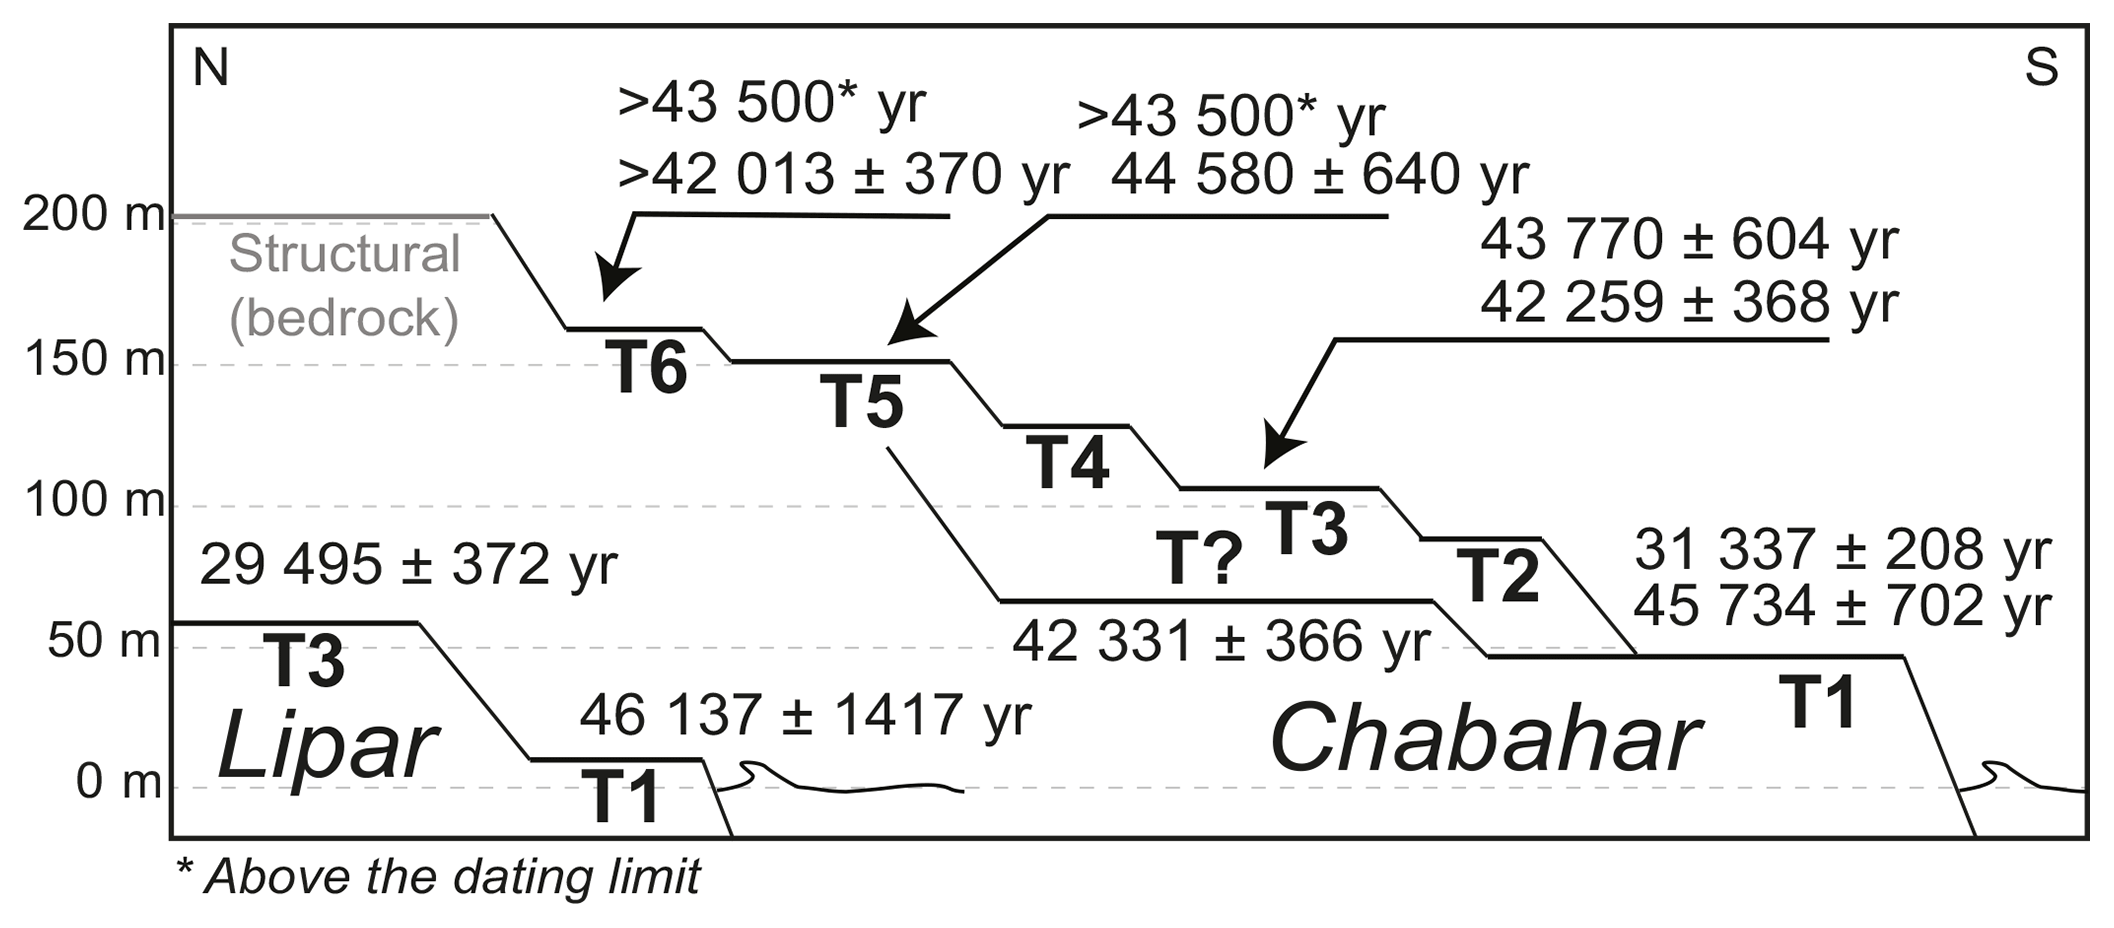
Figure 814C dating on Chabahar–Ramin and Lipar terraces. There is no morpho-stratigraphic relationship between the terrace ages and altitude if we consider the 14C ages to be finite.
230Th∕U dating results have to be considered as minimum ages because the corresponding 234U∕238U ratio is greater than that of seawater, indicating post-sedimentary uranium incorporation from groundwater (Sect. 3.2.3) (Table 1). In the case of RN15-84 and RN15-90, 230Th∕U ages are greater than 14C ages; therefore, 14C ages do not represent true ages for these two samples. Sample RN15-87 is dated > 16±0.14 ka with 230Th∕U (minimum age) and 33.4±0.415 ka with 14C; in this case, the 14C age is more relevant.
XRD on the aragonite samples showed that RN15-84 is undoubtedly recrystallized (∼45 % calcite), and therefore we rejected it. The two others contain more than 97 % of Aragonite and in conjuncture with SEM images observations are considered reliable (Normand et al., 2018).
4.2.2 OSL dating
The results of OSL dating are presented in Table 2. The low values of overdispersion show that the aliquot measurements for each sample are consistent with each other. On the other hand, the effect of fading is quite significant for samples older than 100 kyr, with a correction of the age of up to 20 %.
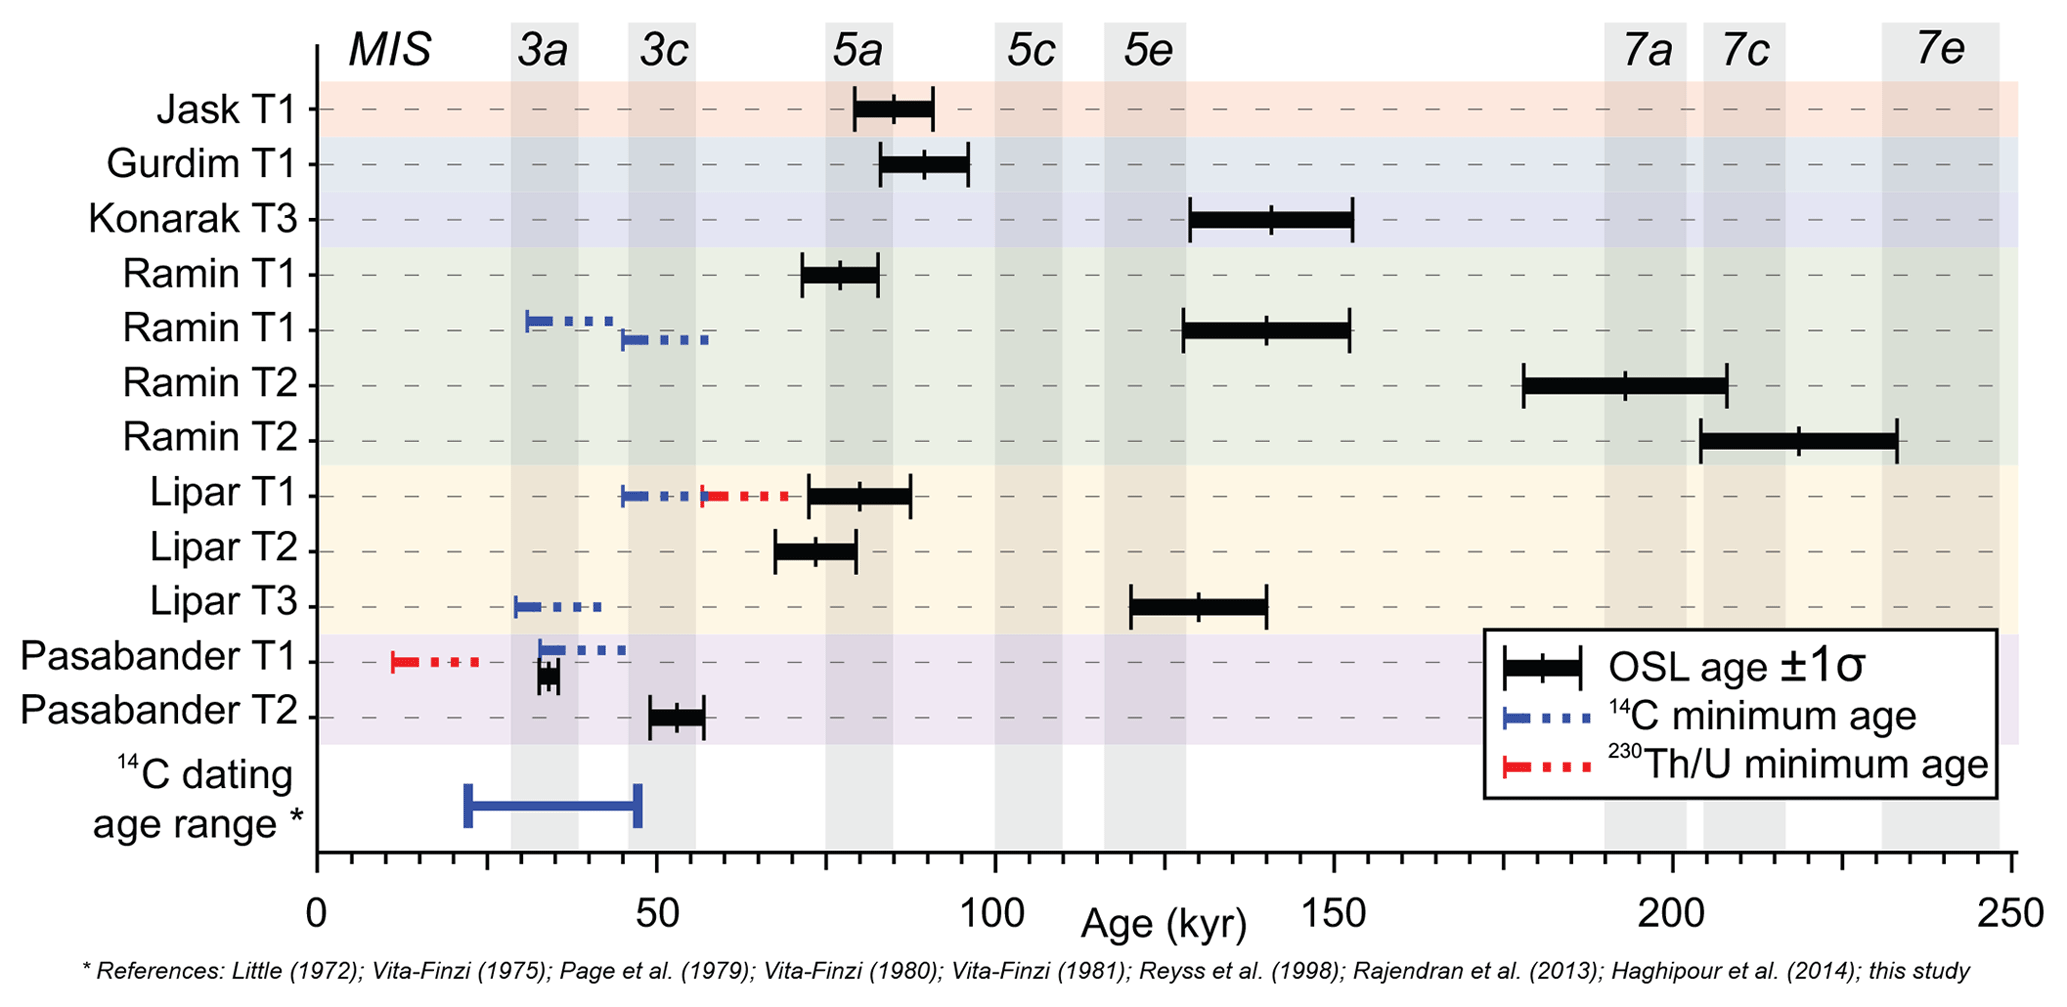
Figure 9Comparison of age results for the different Makran marine terraces. Gray vertical bands: age extent of the different sea-level highstands (Table B.2 in Supplement S2). For the list of previous 14C dating in the Iranian Makran, see Table A in Supplement S1.
All results of OSL dating fall within, or close to a period of sea-level highstand (Fig. 9). Two samples are correlated to MIS 3, five samples fall within MIS 5a, three samples are correlated to MIS 5e, although slightly older (which we attribute to uncertainties in fading corrections; see Sect. 3.2.4), and finally two samples are from MIS 7. At Lipar, two different levels at different altitude are both correlated to MIS 5a (Lipar T1 and T2). The main Chabahar–Ramin T1 terrace, sampled at different locations, yielded an MIS 5a age at the coastline and MIS 5e in the middle of the terrace (Fig. 6a), possibly implying reoccupation of the terrace during the different substages of the last interglacial. The two northern Ramin samples (RN17-39 and RN17-40) are separated by an escarpment, but both fall within MIS 7. The Jask T1 terrace was dated at MIS 5a, which differs from the previous MIS 5e assignment of Page et al. (1979). The youngest terrace (Pasabander T1, samples RN17-24 and RN15-87) is dated 34.18±2.32 ka with OSL, which is coeval to its 14C age of 33.4±0.42 ka.
4.3 Uplift rates
We focus on data from the eastern part of the Iranian Makran (from Tang to Pasabander) (Fig. 10), which is where most of the studied Iranian marine terraces are located. The terrace record is not spatially continuous along the coast, and we will discuss the possible missing links between the different terrace regions in Sect. 5.2. From the record of the studied terraces, we observe that the uplift rates vary spatially (in a roughly sinusoidal manner) between 0.2 and 1.5 mm yr−1, with a period of 20–30 km. An exceptionally high uplift rate (∼ 3–5 mm yr−1) is observed in the easternmost portion of Iran (Pasabander), where MIS 3 terraces are emerged (Fig. 10). These rates are amongst the fastest in the world for a subduction zone setting, which usually uplift at rates of less than 1 mm yr−1 (Henry et al., 2014; Pedoja et al., 2011). The lowest rates obtained from our results are in Jask, situated close to the active strike-slip Minab fault zone, bounding the westernmost side of the MSZ. To illustrate terrace uplift variation due to terrace tilting, a detailed summary of calculated uplift rates and their errors, based on shoreline angle altitudes extracted from the DEM and the eustatic curve of Spratt and Lisiecki (2016), are presented as a graph below each terrace map (Figs. 4c, h, 5c, f, i, 6c, 7f). Uplift curves overlapping each other indicate that a constant uplift scenario would fit through the terrace profile.
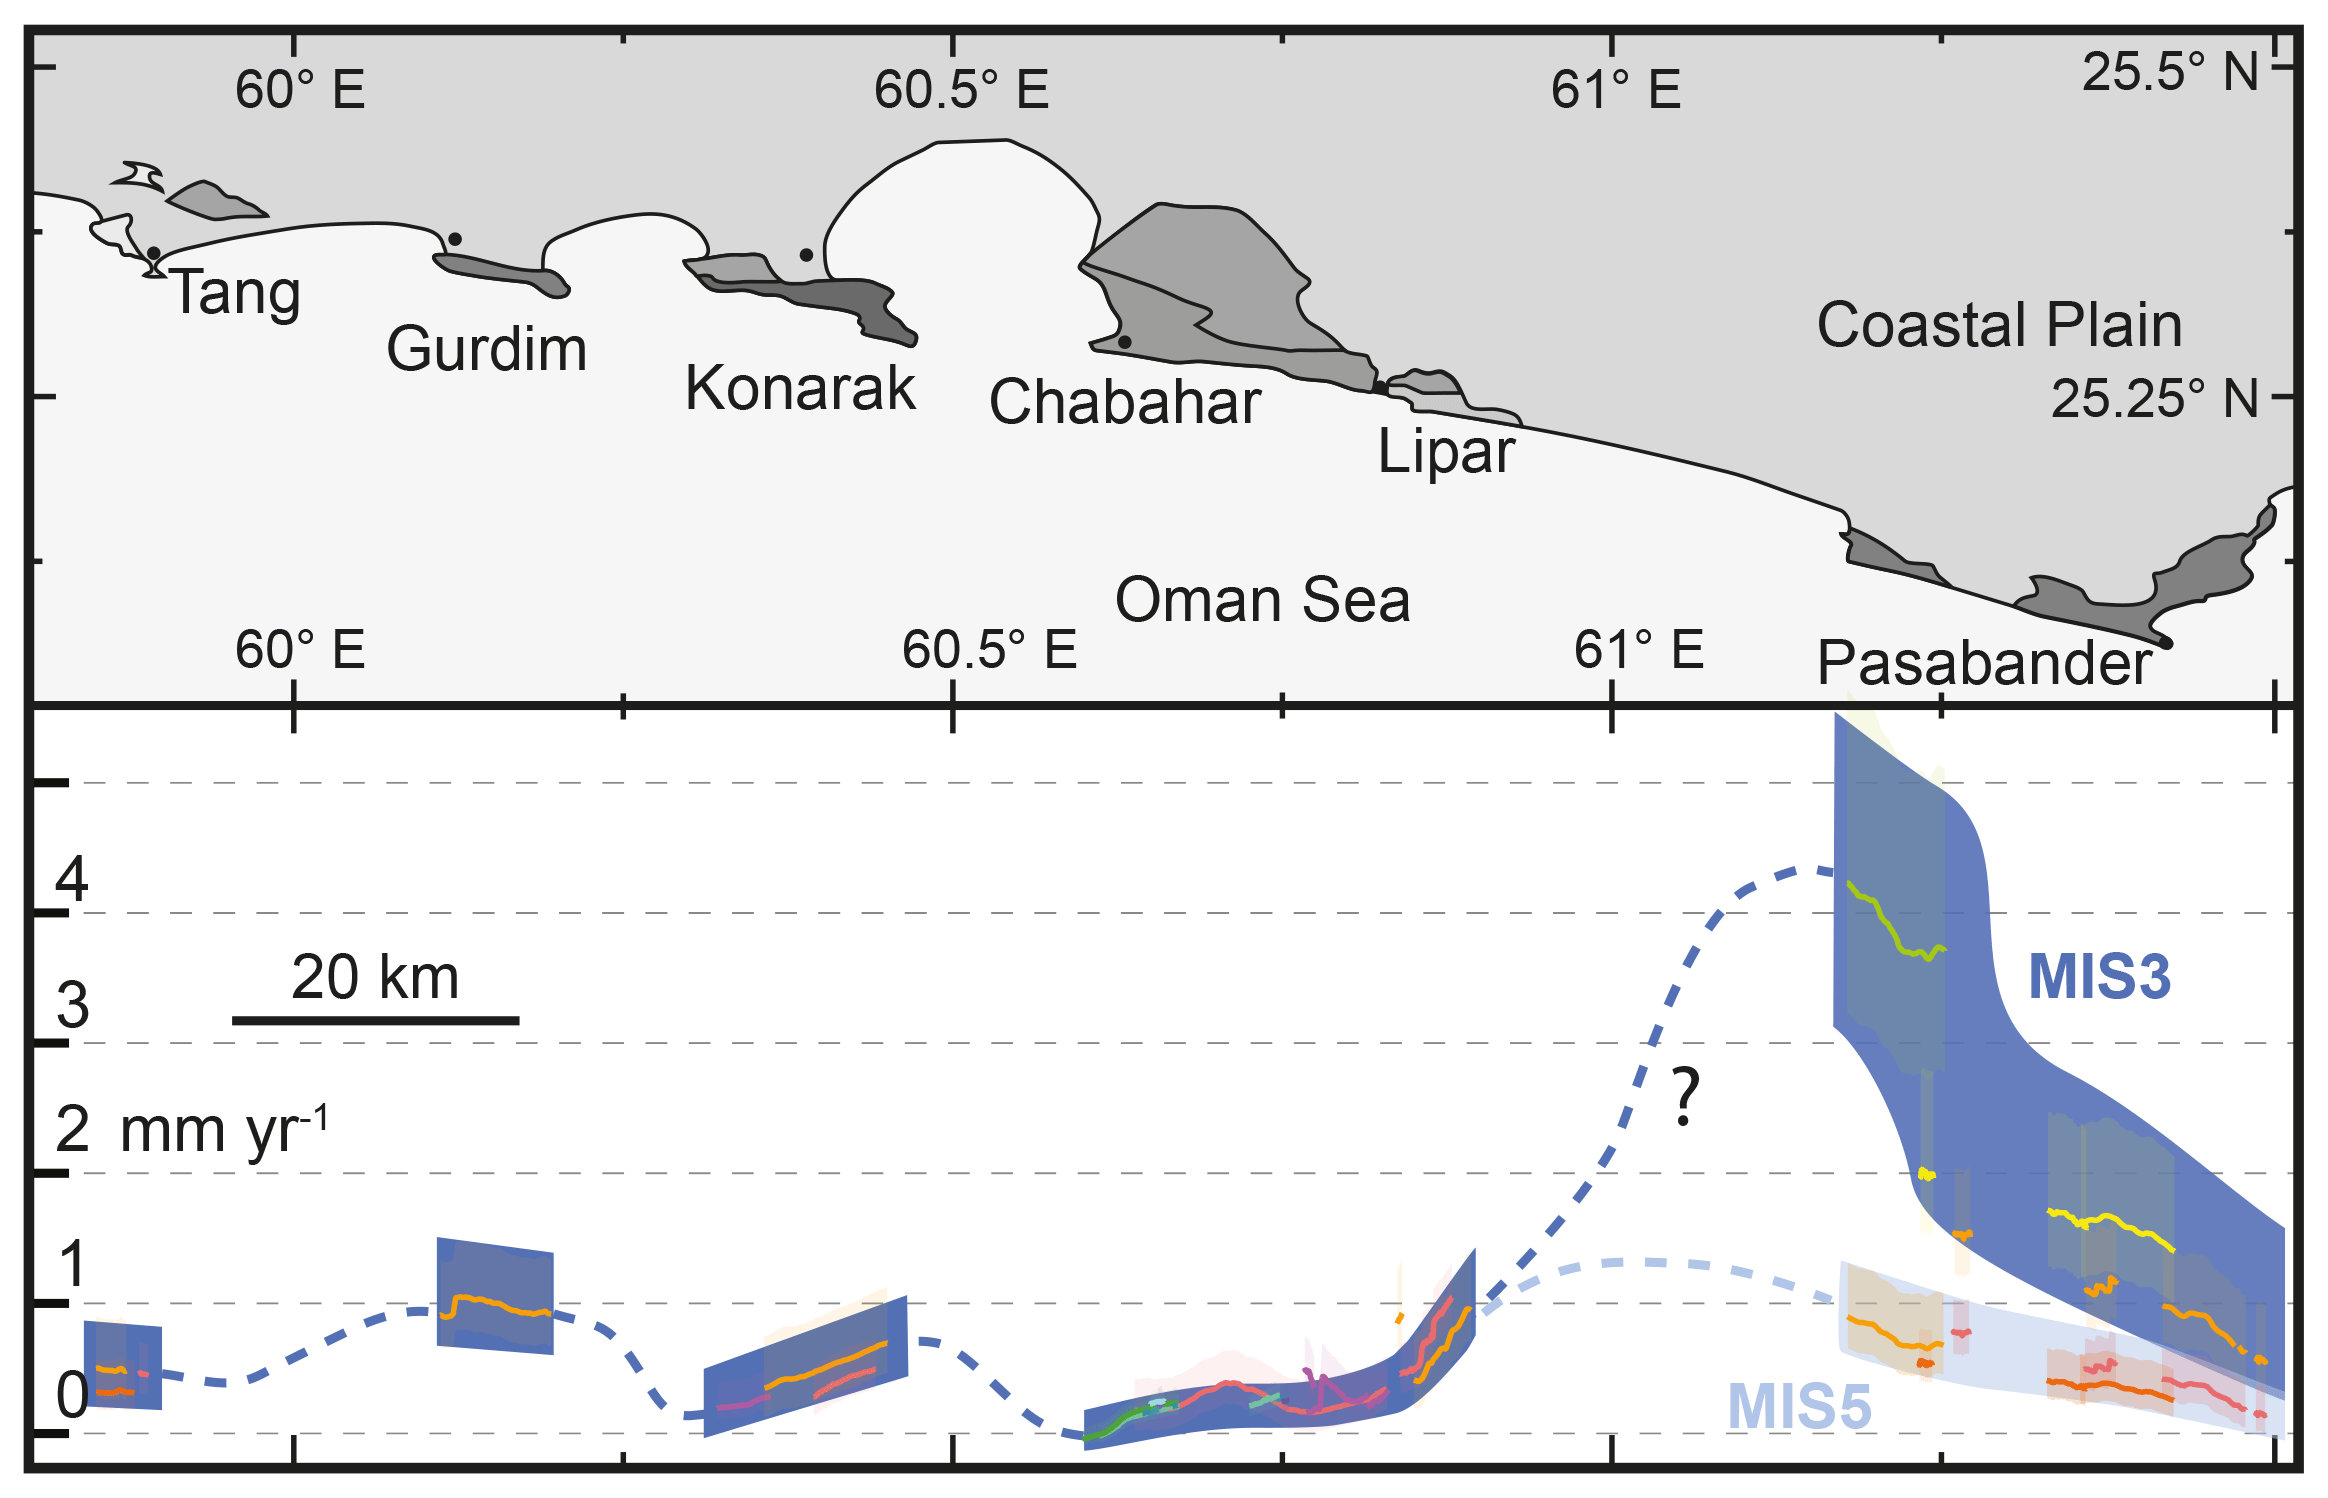
Figure 10Uplift rate spatial variation along the studied region. Colored lines are uplift rates reported from the different maps (Figs. 4–7). Dark blue polygons are uplift rates and associated errors in regions where marine terraces outcrop. Blue dashed lines are inferred uplift rate behavior between terrace areas. Between Lipar and Pasabander, the change in uplift rates is strong and thus subject to uncertainty. Light blue line and polygon are the uplift at Pasabander considering an age of MIS 5a, 5c and 5e for the three lowest terraces.
On the Makran coast, multiple normal faults offset terrace deposits (Fig. 2d, g). These normal faults presumably contribute to regional subsidence of the coastal plain, although locally they may result in differential uplift and tilting. Heavily faulted regions include the Ramin terraces (which seem to be built on the footwall of a ∼15 km long south-dipping normal fault system; Fig. 6a, b) and the Lipar terraces (where southwest-dipping normal faults offset several terraces; Fig. 4f, g). Although some isolated normal faults also offset the terraces at Pasabander (T3) and Gurdim, the remaining studied regions do not seem to be obviously influenced by normal faulting. Minimum fault slip rates (based on the age of the terrace they offset) are reported in the uplift profiles (Figs. 4h, 5f, 6c, 7f) but are slow (0.06–0.25 mm yr−1) in comparison to the uplift rates of the margin.
5.1 Geochronological issues
A comparison between the results from the different dating methods is presented in Fig. 9. Within the same terrace, 230Th∕U minimum ages are in good correlation with the OSL dating, the latter being systematically older. However, 14C ages are considerably younger than results obtained with OSL or 230Th∕U, with one exception (Pasabander T1), discussed below. Moreover, we find no suitable morpho-stratigraphic interpretation based on radiocarbon ages, since there is no relationship between the 14C age and the altitude of the terraces within a sequence (Fig. 8). Cross-correlating and comparing results from several dating methods advocates caution when interpreting shell 14C ages older than 20 ka, even if the shell is not seemingly recrystallized (e.g., Sample RN15-90) (e.g., Bezerra et al., 2000; Busschers et al., 2014). Therefore, we consider our 14C ages to be minimum ages. We suggest that future marine terraces studies should avoid the radiocarbon method on shells for terraces suspected to be older than the Holocene or at least corroborate radiocarbon ages greater than 20 ka with other methods, more suitable for longer timescales.
In the case of Pasabander T1, both 14C and OSL agree with an MIS 3a age, which is also compatible with the minimum 230Th∕U age of 16 ka (Fig. 9). Moreover, it is corroborated by the age of the overriding terrace (Pasabander T2, Sample RN17-19), which was dated to a slightly older age of MIS 3c (53.54±2.3 ka; see Table 2). Therefore, we consider an MIS 3 age for these two terraces to be reliable. MIS 3 terraces are scare and controversial (Chappell, 2002; Hemming, 2004; Murray-Wallace and Woodroffe, 2014; Siddall et al., 2008) for the three reasons given below.
-
During this period, the sea level was much lower than today (−50 to −110 m), implying that high uplift rates are needed to find them emerged today.
-
Due to the scarcity of MIS 3 terraces, our knowledge of sea-level behavior during this period is still lacking. For instance, the effect of Heinrich and Dansgaard–Oeschger events on sea-level variation is still uncertain (Chappell, 2002; Hemming, 2004; Murray-Wallace and Woodroffe, 2014; Siddall et al., 2008).
-
Many 14C dated terraces can be wrongly assigned to this period because it coincides with the limit of this method (Murray-Wallace and Woodroffe, 2014), as seen from the 14C dating results reported in this paper and from previous work in the Makran (Fig. 9, Supplement Table S1).
5.2 Geological implications
The presence of MIS 3 terraces at Pasabander raises several geological issues. First, the region of Pasabander has an anomalously high uplift rate compared to the rest of Makran and compared to uplift rates along other subduction zones in the world (Henry et al., 2014; Pedoja et al., 2011). We will discuss the possible reasons for this anomaly in Sect. 5.2. Second, a high uplift rate does not fit with the terraces' altitude profiles. Considering that all antecedent terraces in a profile are also uplifting at the same time as the youngest terrace, it is difficult to fit our altitude profile with a straightforward uplift history, unless we imply a subsidence event between MIS 3c and 3a (Fig. 11a), which seems unlikely. Similarly, by extrapolating an uplift rate of ∼3.7 mm yr−1 calculated from the shoreline angle of T1, we should expect T2 (MIS 3c) and T3 (MIS 5a) shoreline angles to be at heights of 130 and 270 m, respectively (north of Beris village) (Fig. 11a), which is not observed. Third, the assignment of T3 to MIS5a (the next logical suitable highstand) is dubious because the altitude difference between the two terraces is small compared to the relative sea-level drop between the two highstands. On the other hand, hypothesizing an age of MIS 5a, 5c and 5e for the three lower Pasabander terraces would imply a constant uplift rate varying from east to west between 0.1 and 1.2 mm yr−1, which is much more in line with other values of the western Makran (Fig. 10, light blue). Therefore, although our data strongly support the existence of emerged MIS 3 terraces in Pasabander, the results are problematic and further work is required.
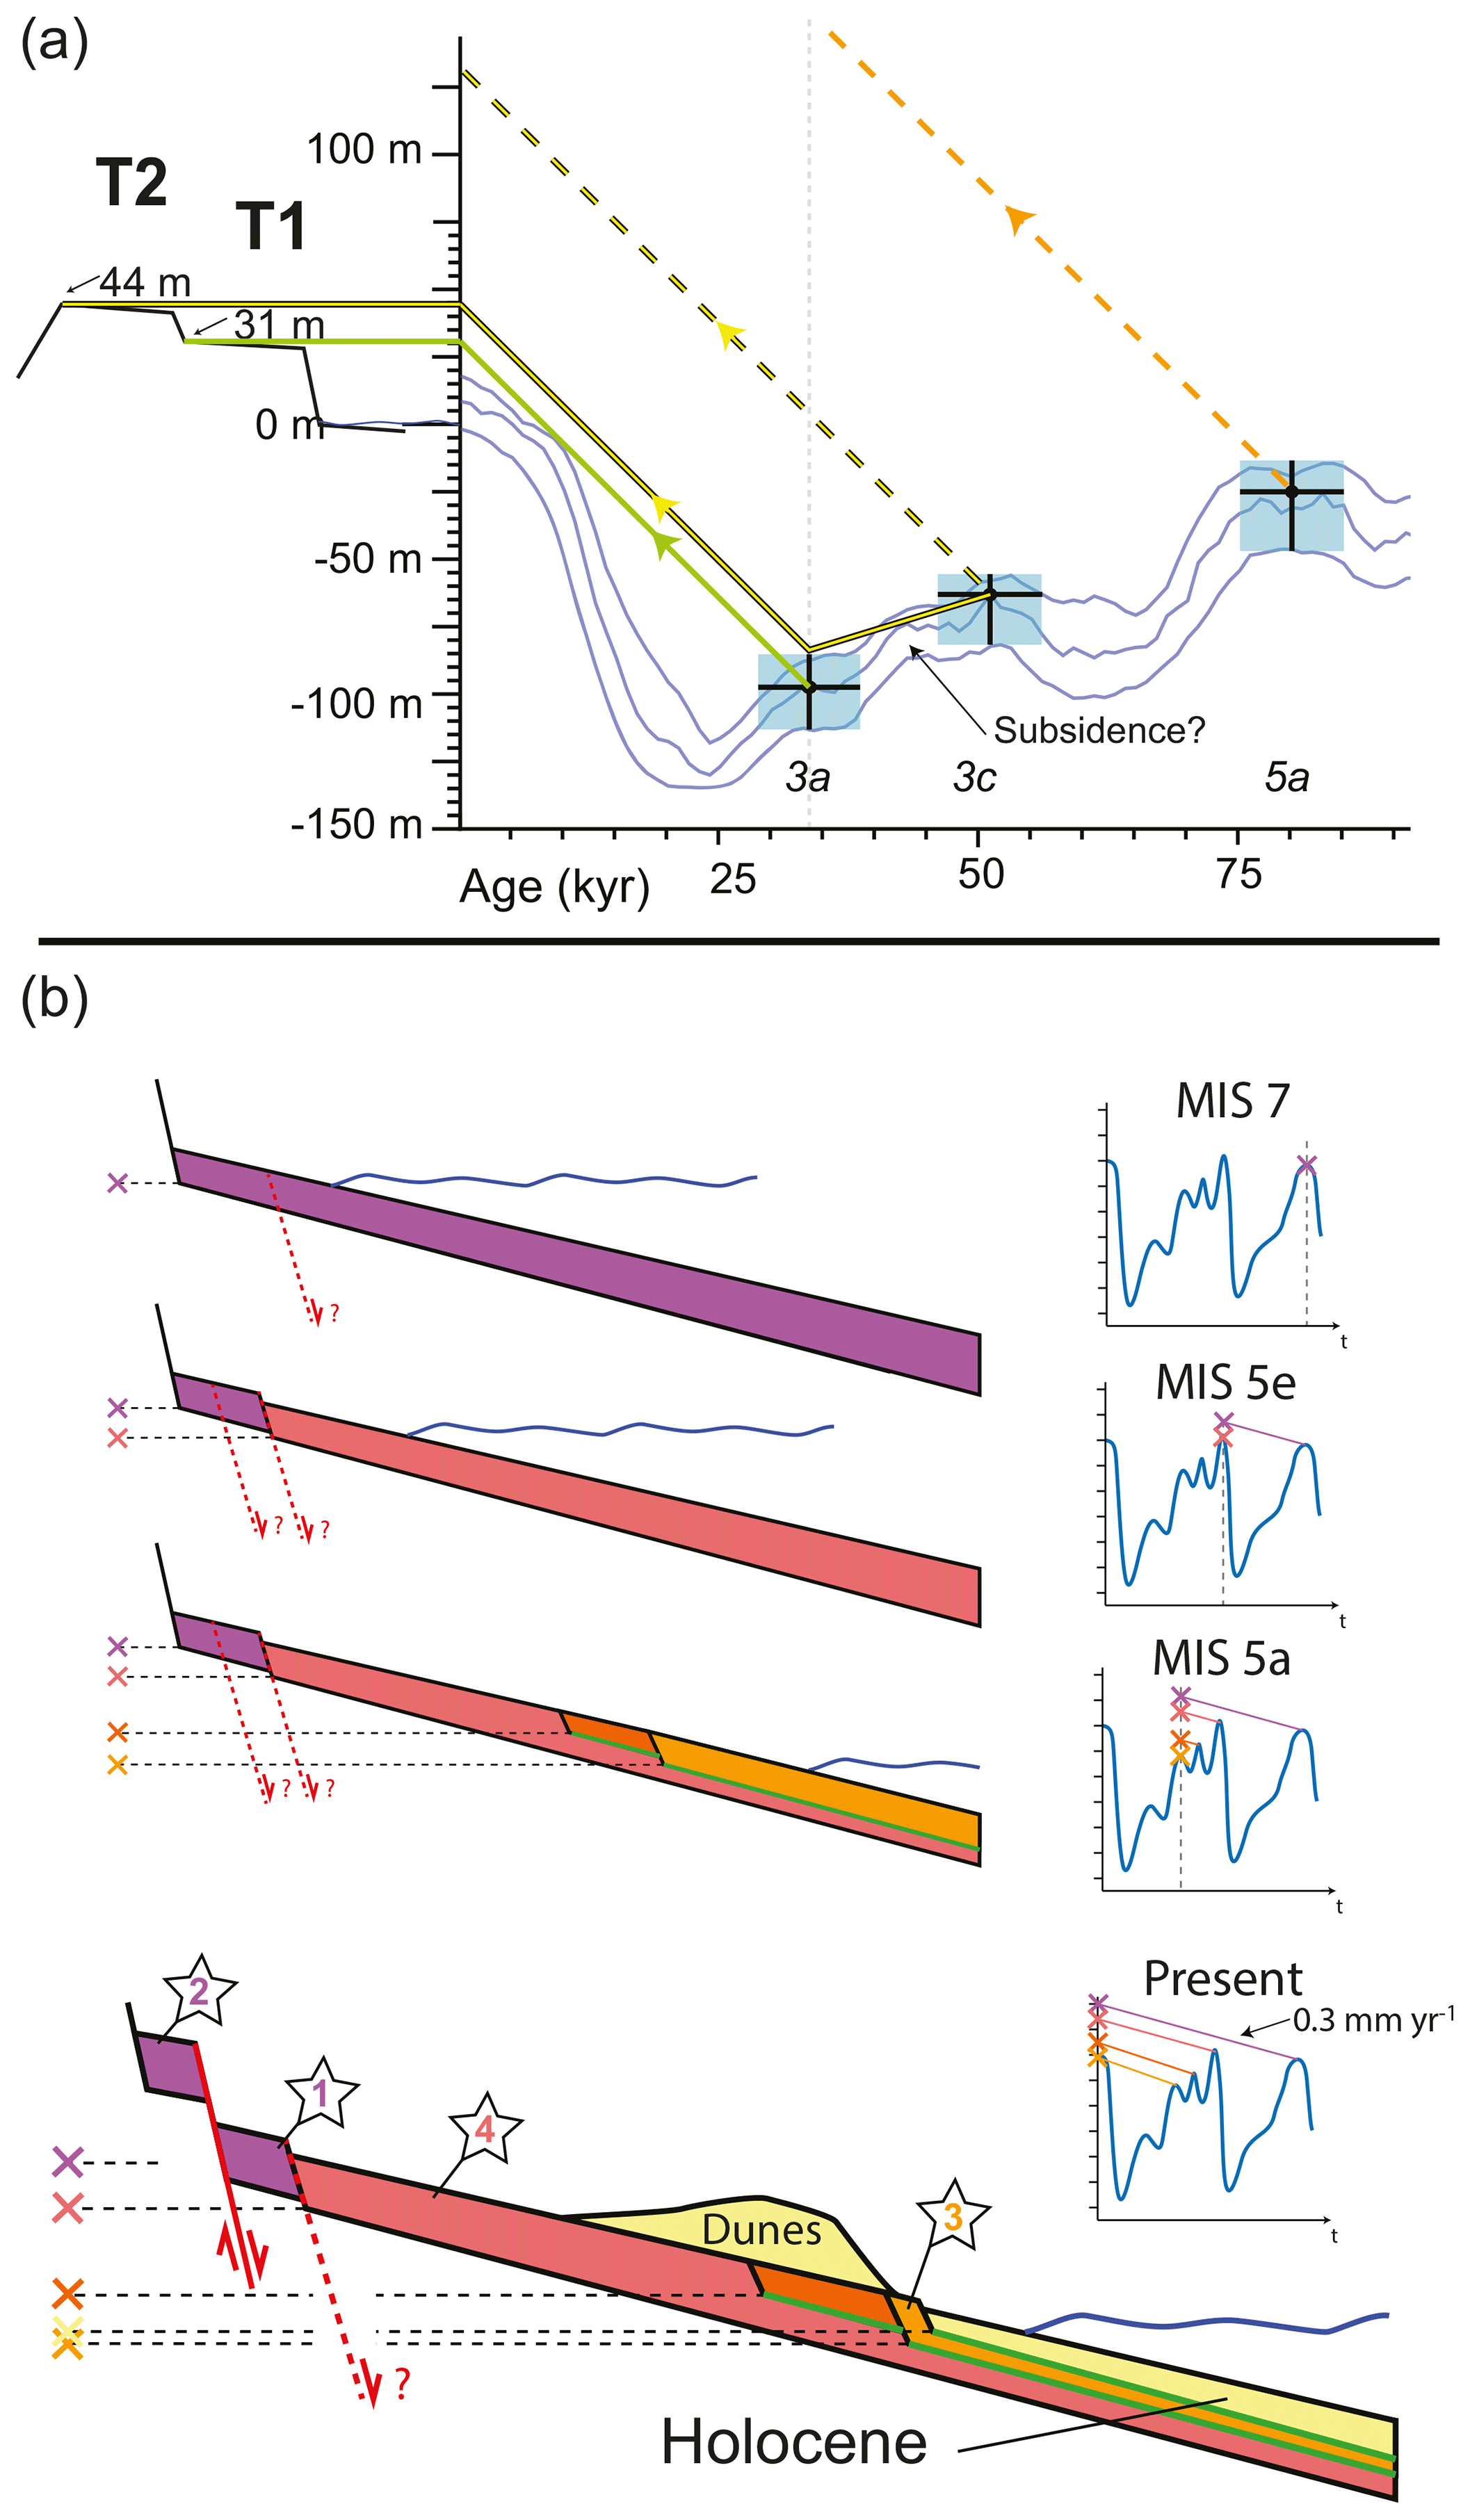
Figure 11Geological implications and issues associated with the dating results. (a) Uplift rate history of Pasabander T1 and T2 at Beris village (profile A–B in Fig. 7a) (see text). Sea-level curve from Spratt and Lisiecki (2016). (b) Sketch of a possible terrace carving/reoccupation and sediment deposition scenario for the main Chabahar–Ramin T1 (profile C–D, Fig. 6d), with an uplift rate of ∼0.3 mm yr−1. Inset: sea-level history. Throughout the successive highstands, the sea reoccupies only the lower portion of the terrace as the land uplifts. The position of the samples and sedimentary logs presented in Fig. 6e is added. Flooding surfaces within the sedimentary deposits are represented as green lines. Vertical scale exaggerated.
At Lipar, two terraces at different altitudes (T1 and T2) have both been dated to MIS 5a (samples RN17-27 and RN17-31, respectively) (Fig. 4f, j). In this region, several terraces are offset by normal faults, so it could be that both T1 and T2 are the same terrace offset by a normal fault. However, we have not observed any indication of the presence of such a fault in the field. Moreover, it is difficult to fit a fault into this geographical context without affecting the other terraces, which fit a constant uplift scenario (Fig. 4h). Although both measures do not present any analytical abnormality, we believe that the age of the Lipar T2 sample (RN17-31) is questionable because the Lipar T2 uplift rate does not match the surrounding dated terraces (Fig. 4h). If assigned to MIS 5c (as can be expected from a terrace situated between two terraces dated MIS 5a and MIS 5e), its uplift rate would be compatible with other rates in the region (∼0.5 mm yr−1).
Our results from the Ramin samples imply that the wide Chabahar–Ramin T1 was built and reoccupied during the three substages of MIS 5 (Fig. 11b). We believe that the episodes of reoccupation during MIS 5e, 5c and 5a should be expressed by the succession of associated deposits, separated by flooding surfaces, as proposed by Jara-Muñoz and Melnick (2015). Unfortunately, we only have access to natural cross sections of the terrace deposits at the terrace borders, and we lack information from the center of Ramin T1 (also due to the presence of a large eolian field). Because the relative sea level was lower during MIS 5c and 5a than during MIS 5e, we hypothesize that only the lower, seaward portion of the terrace was reoccupied (Fig. 11b). That would explain why the samples become younger towards the sea.
Another interesting point for Ramin T1 is its concave topographic profile (pink line, Fig. 6b, c). We believe this is due to the presence of a fault offshore from Komb village (Fig. 6a). We mapped it as a potential southward-dipping normal fault, but we did not observe it in the field. Note that a northward-dipping reverse fault would produce a similar deformation pattern and is also compatible with the MSZ convergence context, though we observed no reverse faults in the coastal plain. We believe that this deformation is only relevant locally, and it should not be considered when analyzing the general trends of lateral uplift variations along the Makran (Fig. 10).
5.3 Tectonic implications
In the Makran, alongstrike variations in uplift rates are evidenced by east–west terrace tilting. We infer that this process has been ongoing at least since the development of the oldest terraces of each sequences. In those regions of the Iranian Makran where several terraces of the same sequence are tilted (Konarak, Chabahar, Lipar, Pasabander), the shoreline angle altitude profiles become more and more steeply tilted as the terraces get older, while the uplift profiles stay roughly parallel (constant uplift through time) (Figs. 4g–h, 5h–i, 6b–c, 7e–f). This is similar to what can be predicted to happen if tilting forces have been continuous through time (Fig. 12a) (Lajoie, 1986). We can therefore conclude that although the forces responsible for terrace uplift vary spatially, they are roughly steady through the Late Pleistocene (evidenced by constant uplift rates) and have been continuously active throughout the buildup of the Makran sequences of marine terraces (evidenced by terrace tilting increasing with age).
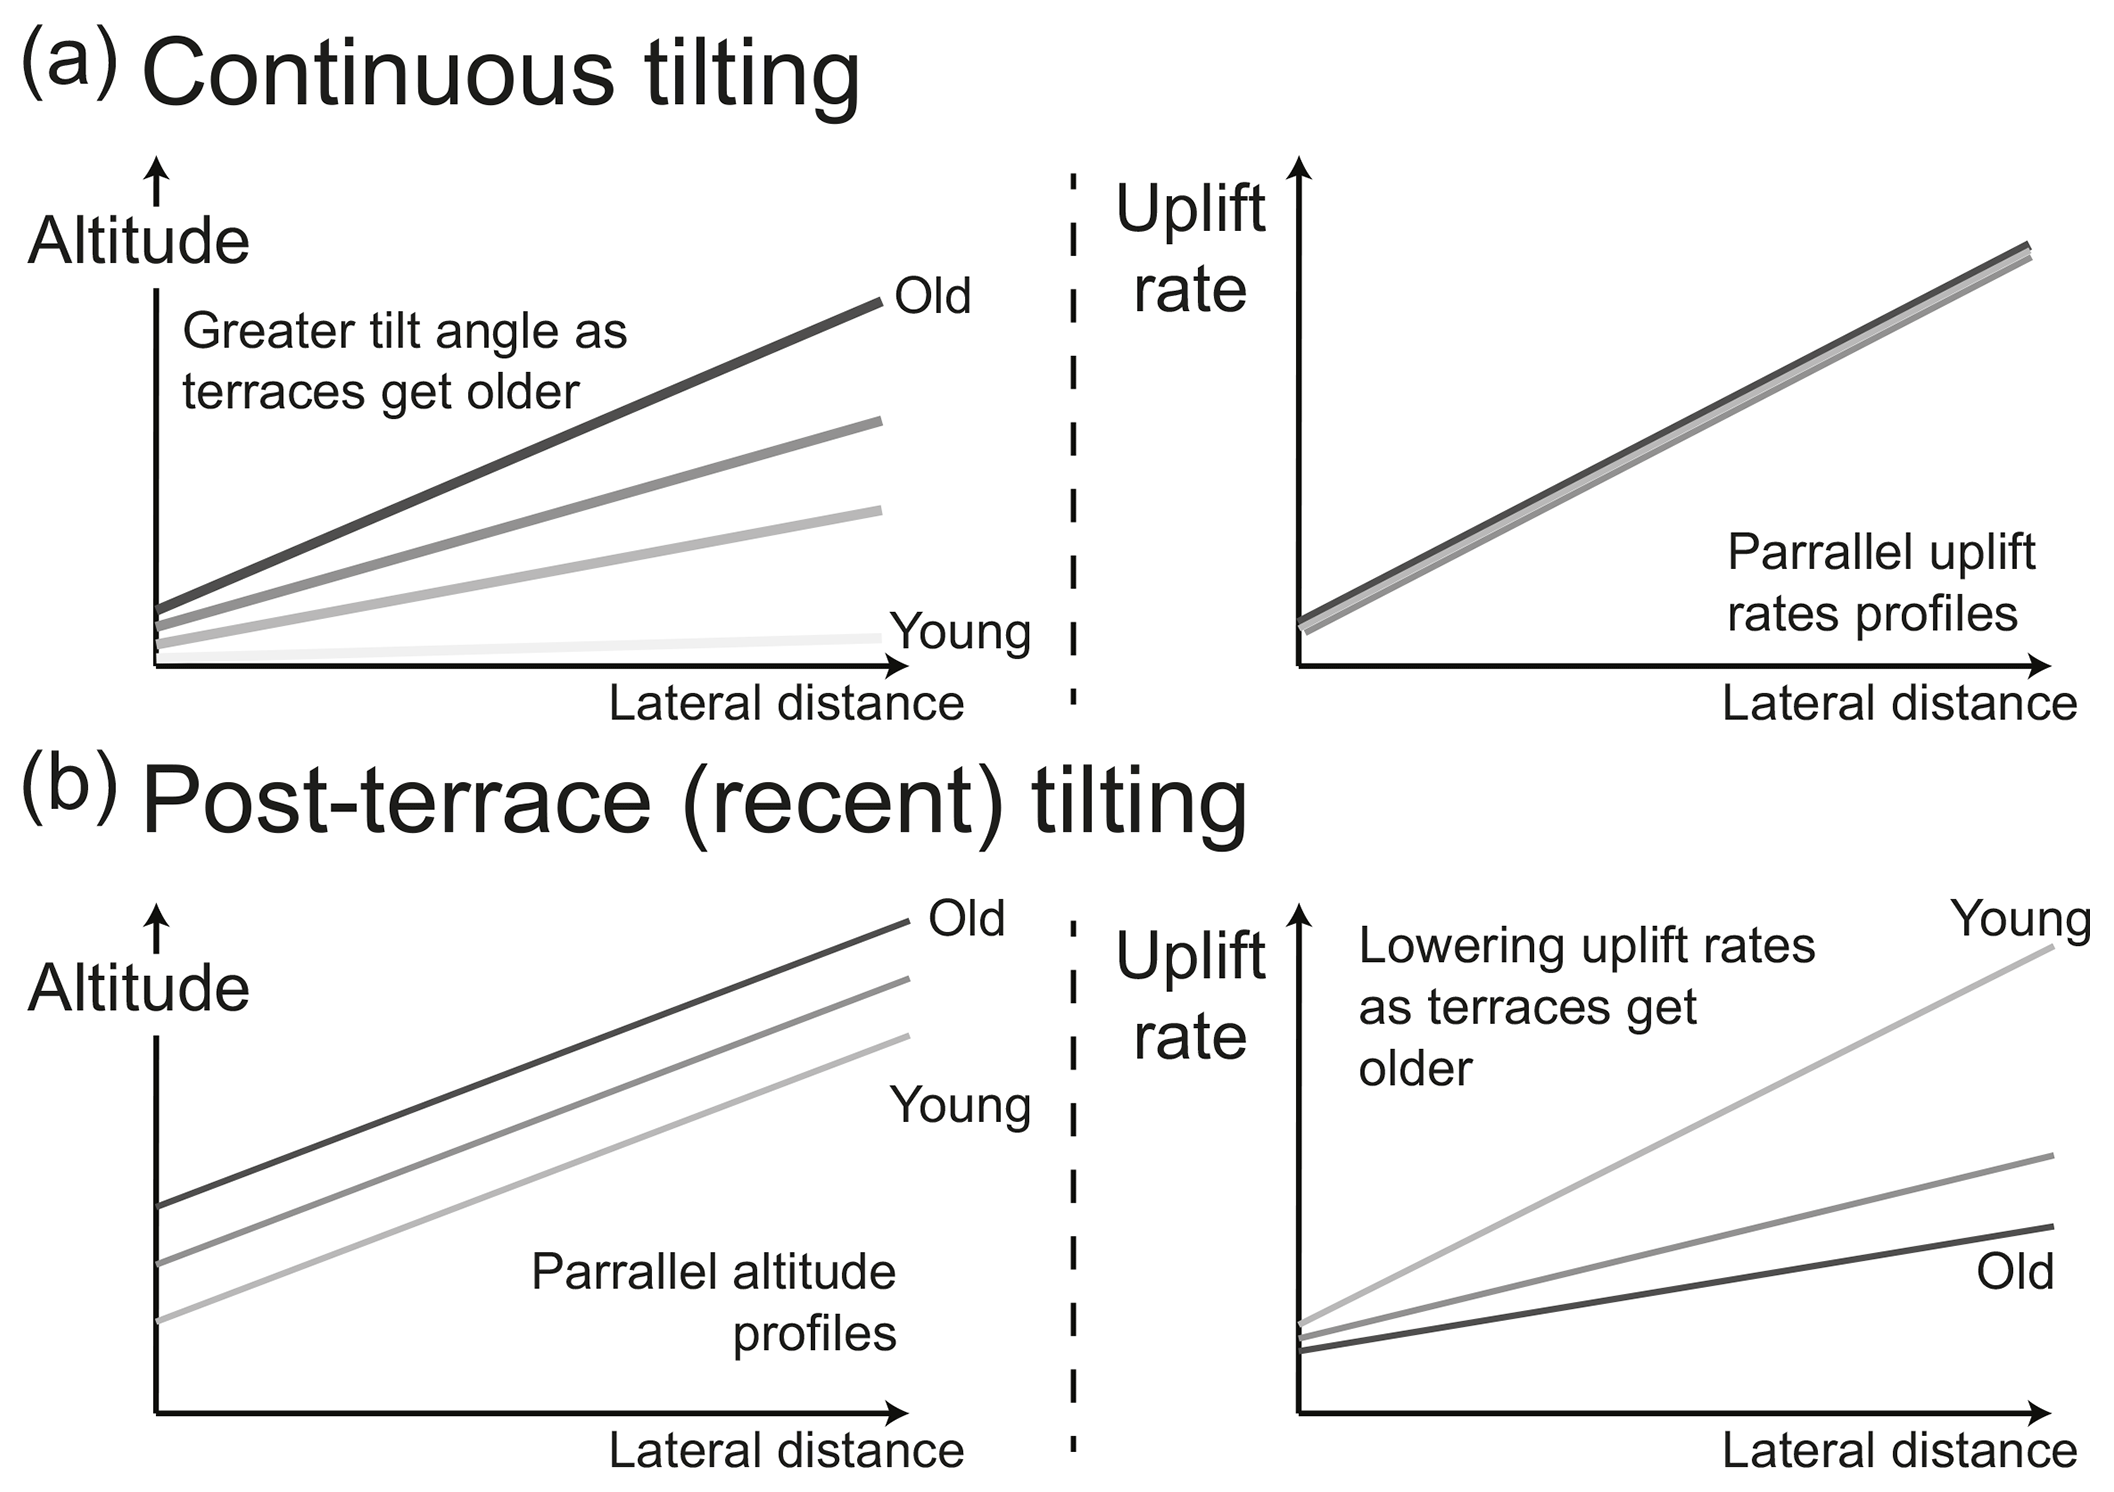
Figure 12Terrace tilting scenarios. Expected shoreline angle altitude and uplift profiles in the scenarios of (a) continuous tilting before and after terrace emplacement (as in Makran) and (b) recent tilting, after the youngest terrace emplacement (not observed in Makran).
Although the mechanisms responsible for local variability in uplift rates in the studied region is often unclear, it is reasonable to suggest that because the wavelength of this deformation is relatively short (on the order of 20–40 km, Fig. 10), it is probably linked to upper crustal deformation (e.g., folding and/or faulting in the upper crust). In contrast, deformation with a deeper origin (e.g., subduction of topographic anomalies or geometry of the subduction interface) is expected to generate variability on longer wavelengths (Bonnardot et al., 2008; Jara-Muñoz et al., 2015; Macharé and Ortlieb, 1992; Spikings and Simpson, 2014).
In some cases, deformation of the Makran terraces is clearly linked to normal faulting (Figs. 4g, 6). Although we observe no reverse faulting in the coastal region, reverse faults are observed north of the studied region (and offshore, near the front of the accretionary prism) (Burg et al., 2012; Ghorashi, 1978; Grando and McClay, 2007; Smith et al., 2012). Also observed to the north are numerous E–W striking, double-plunging anticlines and synclines (Fig. 1b), which have wavelengths comparable to the wavelength of terrace tilting. In more internal parts of the Makran, these folds and faults are clearly responsible for gentle deformation of Quaternary fluvial terraces (Haghipour et al., 2012). We expect that a similar style of deformation accounts for the tilting of the marine terraces exposed along the coastal plane.
We have expressed concerns regarding the presence of MIS 3 terraces at Pasabander; however, it is necessary to discuss the possible origins of such high uplift rates, if these results are indeed valid. From the outset, we note that these anomalously high uplift rates are unlikely to have a “deep” origin (e.g., on the subduction interface or below) on the basis of the arguments mentioned above, namely that any mechanism that has a deep origin will tend to generate a long wavelength response at the surface, which is not observed (Fig. 10). A positive correlation between distance to the trench and uplift rates has been pointed out from regional (e.g., Jara-Muñoz et al., 2015; Saillard et al., 2017) as well as worldwide uplift data (Henry et al., 2014) and in models (Simpson, 2015). However, while the Pasabander area lies 10–20 km closer to the trench than any of the other studied localities, this distance is considered unlikely to be able to account for the order of magnitude jump in uplift rates observed (on the basis of previously published data; Henry et al., 2014; Jara-Muñoz et al., 2015).
Although it is not the subject of this study, the predominance of normal faulting at the coastline of the Makran is intriguing. Modern GPS measurements show that the coastal region is currently undergoing N–S shortening, as would be expected as the Indian plate subducts northward beneath Eurasia (Fig. 1a). However, the normal faults indicate N–S extension. Our current hypothesis to explain this discrepancy in kinematics is that the region undergoes N–S convergence during the interseismic period (i.e., now), whereas it experiences rare and brief episodes of N–S extension in response to large ruptures on the subduction interface. Similar coupling between compression and extension was observed following the 2011 Tohoku (Japan) megathrust earthquake (e.g., Hardebeck, 2012; Kato et al., 2011).
We have studied the uplifted marine terraces of the Iranian Makran using a combination of field mapping, remote sensing and dating with the 14C, 230Th∕U and OSL methods. The dating results indicate that radiocarbon dating on shells greater than 20 ka does not always coincide with the other methods, and therefore we recommend future marine terrace studies to supplement similar results with other dating techniques. The studied terrace ages suggest that they formed between marine isotope stages 3 and 7. Undated terraces might date back to MIS 17 at Chabahar, where the most complete terrace sequence is situated. We also identified the global geodynamic marker, the MIS 5e benchmark, along the 200 km long coastal strip between Pasabander and Tang. Surface uplift rates for the terraces mostly range from 0.05 to 1.2 mm yr−1, with substantial alongstrike variability on wavelengths of 20–40 km. These rates are high in comparison to other subduction zones in the world, indicating that the upper plate has been accumulating considerable permanent deformation during the late Quaternary. At this stage, it is not clear exactly how this deformation is being accommodated and whether, for example, it is associated with large earthquakes. Emerged terraces at the easternmost boundary of Iran have been dated to MIS 3, implying an anomalously high surface uplift rate of up to 3–5 mm yr−1. However, we have reservations about the validity of these dates, which need to be addressed in future research.
Supplementary data for this paper are found in the following repository: https://doi.org/10.5281/zenodo.2560950 (Normand et al., 2018). They come in four forms. (a) Terrace maps GIS, including mapping information and confidence indexes (data model description is also included). Both KMZ and SHP files are available for Google Earth and other GIS software. (b) Supplements for the radiocarbon and 230Th∕U dating method (such as analytical details, XRD results and SEM images of shell samples). (c) Supplements for the OSL dating method (such as analytical details, environmental dose calculation, fading tests results). (d) Additional field pictures supplementing Fig. 2.
The supplement related to this article is available online at: https://doi.org/10.5194/esurf-7-321-2019-supplement.
RN did the fieldwork, lab work, wrote the paper and created the figures. GS accompanied him in the field and had substantial input on the tectonic and geodynamic aspects. FH and RHB contributed to OSL dating, sample preparation, lab work, and results processing. AB provided his input on Iranian geology and tectonics and organized field campaigns. BS provided the tan-DEM of the studied region and contributed to the discussion on terrace morphologies.
The authors declare that they have no conflict of interest.
This work was funded by the Swiss National Science Foundation, project
no. 200021_155904. We thank Kevin Pedoja for his
input and all the fruitful and interesting discussions. We are also grateful
to Reza Ensani, Feisal Arjomandi, Nurrudin Mazarzehi, Yousef Adeeb and
Gholamreza Hosseinyar for helping us with logistics in Iran and accompanying
us in the field. We also would like to thank the analytical assistance of
Bassam Ghaleb for 230Th∕U dating, Agathe Martignier for SEM, and Annette
Süssenberger and Emanuelle Ricchi for XRD analysis.
Edited by: Simon Mudd
Reviewed by: Vincent Regard, Julius Jara Muñoz, and one anonymous referee
Al-Lazki, A., Al-Damegh, K. S., El-Hadidy, S. Y., Ghods, A., and Tatar, M.: Pn-velocity structure beneath Arabia-Eurasia Zagros collision and Makran subduction zones, Geol. Soc. London Spec. Publ., 392, 45–60, https://doi.org/10.1144/SP392.3, 2014.
Ambraseys, N. N. and Melville, C. P.: A history of Persian earthquakes, Cambridge University Press, Cambridge, 1982.
Anderson, R. S., Densmore, A. L., and Ellis, M. A.: The generation and degradation of marine terraces, Basin Res., 11, 7–19, https://doi.org/10.1046/j.1365-2117.1999.00085.x, 1999.
Arslanov, K. A., Tertychny, N. I., Kuznetsov, V. Y., Chernov, S. B., Lokshin, N. V., Gerasimova, S. A., Maksimov, F. E. and Dodonov, A. E.: Th∕U and 14C Dating of mollusc shells from the coasts of the Caspian, Barents, White and Black Seas, Geochronometria, 21, 49–56, 2002.
Arz, H. W., Lamy, F., Ganopolski, A., Nowaczyk, N., and Pätzold, J.: Dominant Northern Hemisphere climate control over millennial-scale glacial sea-level variability, Quat. Sci. Rev., 26, 312–321, https://doi.org/10.1016/j.quascirev.2006.07.016, 2007.
Auclair, M., Lamothe, M., and Huot, S.: Measurement of anomalous fading for feldspar IRSL using SAR, Radiat. Meas., 37, 487–492, https://doi.org/10.1016/S1350-4487(03)00018-0, 2003.
Back, S. and Morley, C. K.: Growth faults above shale e Seismic-scale outcrop analogues from the, Mar. Pet. Geol., 70, 144–162, https://doi.org/10.1016/j.marpetgeo.2015.11.008, 2016.
Bard, E., Hamelin, B., and Fairbanks, R. G.: U-Th ages obtained by mass spectrometry in corals from Barbados: sea level during the past 130 000 years, Nature, 346, 456–458, https://doi.org/10.1038/346456a0, 1990.
Bayer, R., Chery, J., Tatar, M., Vernant, P., Abbassi, M., Masson, F., Nilforoushan, F., Doerflinger, E., Regard, V., and Bellier, O.: Active deformation in Zagros-Makran transition zone inferred from GPS measurements, Geophys. J. Int., 165, 373–381, https://doi.org/10.1111/j.1365-246X.2006.02879.x, 2006.
Bezerra, F. H. R., Vita-finzi, C., Pinheiro, F., and Filho, L.: The Use of Marine Shells for Radiocarbon Dating of Coastal Deposits, Rev. Bras. Geociências, 30, 211–213, 2000.
Blanford, W. T.: Note on the geological formations seen along the coasts of Bilúchístán and Persia from Karáchí to the head of the Persian Gulf, and on some of the Gulf Islands, Rec. Geol. Surv. India, 5, 41–45, 1872.
Bloom, A. L., Broecker, W., Chappell, J., Matthews, R. K., and Mesolella, K. J.: Quaternary Sea Level Fluctuations on a Tectonic Coast?: New 230Th∕234U Dates from the Huon Peninsula, New Guinea, Quat. Res., 4, 185–205, https://doi.org/10.1016/0033-5894(74)90007-6, 1974.
Bonnardot, M.-A., Hassani, R., Tric, E., Ruellan, E. and Régnier, M.: Effect of margin curvature on plate deformation in a 3-D numerical model of subduction zones, Geophys. J. Int., 173, 1084–1094, https://doi.org/10.1111/j.1365-246X.2008.03752.x, 2008.
Bronk Ramsey, C. and Lee, S.: Recent and Planned Developments of the Program OxCal, Radiocarbon, 55, 720–730, https://doi.org/10.2458/azu_js_rc.55.16215, 2013.
Burbank, D. W. and Anderson, R. S.: Tectonic Geomorphology, 2nd edn., Wiley-Blackwell, Oxford, 2001.
Burg, J.-P., Dolati, A., Bernoulli, D., and Smit, J.: Structural style of the Makran Tertiary accretionary complex in SE-Iran, in: Lithosphere Dynamics and Sedimentary Basins: The Arabian Plate and Analogues, edited by: Al Hosani, K., Roure, F., Ellison, R., and Lokier, S., 239–259, Springer, Heidelberg, 2012.
Busschers, F. S., Wesselingh, F. P., Kars, R. H., Versluijs-Helder, M., Wallinga, J., Bosch, J. H. A., Timmner, J., Nierop, K. G. J., Meijer, T., Bunnik, F. P. M., and De Wolf, H.: Radiocarbon dating of Late Pleistocene marine shells from the southern North Sea, Radiocarbon, 56, 1151–1166, https://doi.org/10.2458/56.16505, 2014.
Buylaert, J. P., Murray, A. S., Thomsen, K. J., and Jain, M.: Testing the potential of an elevated temperature IRSL signal from K-feldspar, Radiat. Meas., 44, 560–565, https://doi.org/10.1016/j.radmeas.2009.02.007, 2009.
Byrne, D. E., Sykes, L. R., and Davis, D. M.: Great Thrust Earthquakes and Aseismic Slip Along the Plate Boundary of the Makran Subduction Zone, J. Geophys. Res.-Earth, 97, 449–478, https://doi.org/10.1029/91JB02165, 1992.
Caputo, R.: Sea-level curves: Perplexities of an end-user in morphotectonic applications, Global Planet. Change, 57, 417–423, https://doi.org/10.1016/j.gloplacha.2007.03.003, 2007.
Catuneanu, O., Galloway, W. E., Kendall, C. G. S. C., Miall, A. D., Posamentier, H. W., Strasser, A., and Tucker, M. E.: Sequence Stratigraphy?: Methodology and Nomenclature, Newsletters Stratigr., 44, 173–245, https://doi.org/10.1127/0078-0421/2011/0011, 2011.
Causse, C., Ghaleb, B., Chkir, N., Zouari, K., Ouezdou, H. Ben, and Mamou, A.: Humidity changes in southern Tunisia during the Late Pleistocene inferred from U-Th dating of mollusc shells, Appl. Geochem., 18, 1691–1703, https://doi.org/10.1016/S0883-2927(03)00043-X, 2003.
Chappell, J.: Sea level changes forced ice breakouts in the Last Glacial cycle: New results from coral terraces, Quat. Sci. Rev., 21, 1229–1240, https://doi.org/10.1016/S0277-3791(01)00141-X, 2002.
Chappell, J., Omura, A., Esat, T., McCulloch, M., Pandolfi, J., Ota, Y., and Pillans, B.: Reconciliation of late Quaternary sea levels derived from coral terraces at Huon Peninsula with deep sea oxygen isotope records, Earth Planet. Sc. Lett., 141, 227–236, https://doi.org/10.1016/0012-821X(96)00062-3, 1996.
Creveling, J. R., Mitrovica, J. X., Clark, P. U., Waelbroeck, C., and Pico, T.: Predicted bounds on peak global mean sea level during marine isotope stages 5a and 5c, Quat. Sci. Rev., 163, 193–208, https://doi.org/10.1016/j.quascirev.2017.03.003, 2017.
Cutler, K. B., Edwards, R. L., Taylor, F. W., Cheng, H., Adkins, J., Gallup, C. D., Cutler, P. M., Burr, G. S., and Bloom, A. L.: Rapid sea-level fall and deep-ocean temperature change since the last interglacial period, Earth Planet. Sc. Lett., 206, 253–271, https://doi.org/10.1016/S0012-821X(02)01107-X, 2003.
Dolati, A. and Burg, J.-P.: Preliminary fault analysis and paleostress evolution in the Makran Fold-and-Thrust Belt in Iran, in: Lithosphere Dynamics and Sedimentary Basins: The Arabian Plate and Analogues, edited by: Al Hosani, K., Roure, F., Ellison, R., and Lokier, S., 261–277, Springer, Heidelberg, 2012.
Duller, G. A. T.: The Analyst software package for luminescence data: overview and recent improvements, Anc. TL, 33, 35–42, 2015.
Durcan, J. A., King, G. E., and Duller, G. A. T.: DRAC: Dose Rate and Age Calculator for trapped charge dating, Quat. Geochronol., 28, 54–61, https://doi.org/10.1016/j.quageo.2015.03.012, 2015.
Dutton, A., Bard, E., Antonioli, F., Esat, T. M., Lambeck, K., and McCulloch, M. T.: Phasing and amplitude of sea-level and climate change during the penultimate interglacial, Nat. Geosci., 2, 355–359, https://doi.org/10.1038/ngeo470, 2009.
Esat, T. M. and Yokoyama, Y.: Growth patterns of the last ice age coral terraces at Huon Peninsula, Global Planet. Change, 54, 216–224, https://doi.org/10.1016/j.gloplacha.2006.06.020, 2006.
Fairbanks, R. G.: A 17 000-year glacio-eustatic sea level record: influence of glacial melting rates on the Younger Dryas event and deep-ocean circulation, Nature, 342, 637–642, https://doi.org/10.1038/342637a0, 1989.
Falcon, N. L.: Raised beaches and terraces of the Iranian Makran coast, Geogr. J., 109, 149–151, 1947.
Farhoudi, G. and Karig, D. E.: Makran of Iran and Pakistan as an active arc system, Geology, 5, 664–668, https://doi.org/10.1130/0091-7613(1977)5<664:MOIAPA>2.0.CO;2, 1977.
Frohling, E. and Szeliga, W.: GPS constraints on interplate locking within the Makran subduction zone, Geophys. J. Int., 205, 67–76, https://doi.org/10.1093/gji/ggw001, 2016.
Galbraith, R. F., Roberts, R. G., Laslett, G. M., Yoshida, H., and Olley, J. M.: Optical dating of single and multiple grains of quartz from Jinmium rock shelter, Northern Australia: Part I, Experimetal design and statistical models, Archaeometry, 41, 339–364, https://doi.org/10.1111/j.1475-4754.1999.tb00987.x, 1999.
Gharibreza, M.: Evolutionary trend of paleoshorelines in the Coastal Makran zone (Southeast Iran) since the mid-Holocene, Quat. Int., 392, 203–212, https://doi.org/10.1016/j.quaint.2015.06.030, 2016.
Gharibreza, M. R. and Motamed, A.: Late Quaternary Paleoshorelines and Sedimentary Sequences in Chabahar Bay (Southeast of Iran), J. Coast. Res., 226, 1499–1504, https://doi.org/10.2112/05A-0020.1, 2006.
Ghorashi, M.: Late Cainozoic faulting in S.E. Iran, PhD Thesis, University College London, London, 1978.
Grando, G. and McClay, K.: Morphotectonics domains and structural styles in the Makran accretionary prism, offshore Iran, Sediment. Geol., 196, 157–179, https://doi.org/10.1016/j.sedgeo.2006.05.030, 2007.
Haghipour, N., Burg, J. P., Kober, F., Zeilinger, G., Ivy-Ochs, S., Kubik, P. W., and Faridi, M.: Rate of crustal shortening and non-Coulomb behaviour of an active accretionary wedge: The folded fluvial terraces in Makran (SE, Iran), Earth Planet. Sc. Lett., 355–356, 187–198, https://doi.org/10.1016/j.epsl.2012.09.001, 2012.
Haghipour, N., Burg, J. P., Ivy-Ochs, S., Hajdas, I., Kubik, P., and Christl, M.: Correlation of fluvial terraces and temporal steady-state incision on the onshore Makran accretionary wedge in southeastern Iran: Insight from channel profiles and 10Be exposure dating of strath terraces, Bull. Geol. Soc. Am., 127, 560–583, https://doi.org/10.1130/B31048.1, 2014.
Hardebeck, J. L.: Coseismic and postseismic stress rotations due to great subduction zone earthquakes, Geophys. Res. Lett., 39, 1–6, https://doi.org/10.1029/2012GL053438, 2012.
Harms, J. C., Cappel, H. N., and Francis, D. C.: The Makran Coast of Pakistan: It's Stratigraphy and Hydrocarbon Potential, in: Marine Geology and Oceanography of Arabian Sea and Coastal Pakistanography of Arabian Sea and Coastal Pakistan, edited by: Haq, B. U. and Milliman, J. D., 3–26, Van Nostrand Reinhold Company Inc., New York, 1984.
Harrison, J. V.: Coastal Makran: Discussion, Geogr. J., 97, 1–15, 1941.
Heidarzadeh, M., Pirooz, M. D., Zaker, N. H., Yalciner, A. C., Mokhtari, M., and Esmaeily, A.: Historical tsunami in the Makran Subduction Zone off the southern coasts of Iran and Pakistan and results of numerical modeling, Ocean Eng., 35, 774–786, https://doi.org/10.1016/j.oceaneng.2008.01.017, 2008.
Hemming, S. R.: Heinrich events: Massive late Pleistocene ditritus layers of the North Atlanitc and their global cliamate imprint, Rev. Geophys., 42, 1–43, https://doi.org/10.1029/2003RG000128, 2004.
Henry, H., Regard, V., Pedoja, K., Husson, L., Martinod, J., Witt, C., and Heuret, A.: Upper Pleistocene uplifted shorelines as tracers of (local rather than global) subduction dynamics, J. Geodyn., 78, 8–20, https://doi.org/10.1016/j.jog.2014.04.001, 2014.
Hibbert, F. D., Rohling, E. J., Dutton, A., Williams, F. H., Chutcharavan, P. M., Zhao, C., and Tamisiea, M. E.: Coral indicators of past sea-level change: A global repository of U-series dated benchmarks, Quat. Sci. Rev., 145, 1–56, https://doi.org/10.1016/j.quascirev.2016.04.019, 2016.
Hillaire-Marcel, C., Gariépy, C., Ghaleb, B., Goy, J.-L., Zazo, C., and Barcelo, J. C.: U-series measurements in tyrrhenian deposits from mallorca – Further evidence for two last-interglacial high sea levels in the Balearic Islands, Quat. Sci. Rev., 15, 53–62, https://doi.org/10.1016/0277-3791(95)00079-8, 1996.
Hoffmann, G., Reicherter, K., Wiatr, T., Grützner, C., and Rausch, T.: Block and boulder accumulations along the coastline between Fins and Sur (Sultanate of Oman): tsunamigenic remains?, Nat. Hazards, 65, 851–873, https://doi.org/10.1007/s11069-012-0399-7, 2013a.
Hoffmann, G., Rupprechter, M., Al Balushi, N., Grützner, C., and Reicherter, K.: The impact of the 1945 Makran tsunami along the coastlines of the Arabian Sea (Northern Indian Ocean) – a review, Z. Geomorphol. Suppl. Issues, 57, 257–277, https://doi.org/10.1127/0372-8854/2013/S-00134, 2013b.
Hosseini-Barzi, M. and Talbot, C. J.: A tectonic pulse in the Makran accretionary prism recorded in Iranian coastal sediments, J. Geol. Soc. London., 160, 903–910, https://doi.org/10.1144/0016-764903-005, 2003.
Huntley, D. J. and Lamothe, M.: Ubiquity of anomalous fading in K-feldspars and the measurement and correction for it in optical dating, Can. J. Earth Sci., 38, 1093–1106, https://doi.org/10.1139/cjes-38-7-1093, 2001.
Jara-Muñoz, J. and Melnick, D.: Unraveling sea-level variations and tectonic uplift in wave-built marine terraces, Santa María Island, Chile, Quat. Res., 83, 216–228, https://doi.org/10.1016/j.yqres.2014.10.002, 2015.
Jara-Muñoz, J., Melnick, D., Brill, D., and Strecker, M. R.: Segmentation of the 2010 Maule Chile earthquake rupture from a joint analysis of uplifted marine terraces and seismic-cycle deformation patterns, Quat. Sci. Rev., 113, 171–192, https://doi.org/10.1016/j.quascirev.2015.01.005, 2015.
Kato, A., Sakai, S., and Obara, K.: A normal-faulting seismic sequence triggered by the 2011 off the Pacific coast of Tohoku Earthquake: Wholesale stress regime changes in the upper plate, Earth Planets Space, 63, 745–748, https://doi.org/10.5047/eps.2011.06.014, 2011.
Kaufman, A., Broecker, W. S., Ku, T.-L., and Thurber, D. L.: The status of U-series methods of mollusk dating, Geochim. Cosmochim. Acta, 35, 1155–1183, https://doi.org/10.1016/0016-7037(71)90031-7, 1971.
Kaufman, A., Ghaleb, B., Wehmiller, J. F., and Hillaire-Marcel, C.: Uranium concentration and isotope ratio profiles within Mercenaria shells: Geochronological implications, Geochim. Cosmochim. Acta, 60, 3735–3746, https://doi.org/10.1016/0016-7037(96)00190-1, 1996.
Keller, E. A. and Pinter, N.: Active Tectonics: Earthquakes, Uplift, and Landscape, 2nd edn, Prentice Hall, New Jersey, 2002.
Khan, M. A., Bendick, R., Bhat, M. I., Bilham, R., Kakar, D. M., Khan, S. F., Lodi, S. H., Qazi, M. S., Singh, B., Szeliga, W., and Wahab, A.: Preliminary geodetic constraints on plate boundary deformation on the western edge of the Indian plate from TriGGnet (Tri-University GPS Geodesy Network), J. Himal. Earth Sci., 41, 71–87, 2008.
King, G. C. P., Stein, R. S., and Rundle, J. B.: The Growth of Geological Structures by Repeated Earthquakes 1. Conceptual framework, J. Geophys. Res.-Sol. Ea., 93, 13307–13318, https://doi.org/10.1029/JB093iB11p13319, 1988.
Kopp, C., Fruehn, J., Flueh, E. R., Reichert, C., Kukowski, N., Bialas, J., and Klaeschen, D.: Structure of the makran subduction zone from wide-angle and reflection seismic data, Tectonophysics, 329, 171–191, https://doi.org/10.1016/S0040-1951(00)00195-5, 2000.
Kukowski, N., Schillhorn, T., Flueh, E. R., and Huhn, K.: Newly identified strike-slip plate boundary in the northeastern Arabian Sea, Geology, 28, 355–358, https://doi.org/10.1130/0091-7613(2000)28<355:NISPBI>2.0.CO;2, 2000.
Lajoie, K. R.: Coastal Tectonics, in: Active Tectonics: Impact on Society, edited by: Wallace, R., 95–124, National Academy Press, Washington DC, 1986.
Lamothe, M.: Luminescence dating of interglacial coastal depositional systems: Recent developments and future avenues of research, Quat. Sci. Rev., 146, 1–27, https://doi.org/10.1016/j.quascirev.2016.05.005, 2016.
Lawson, M. J., Daniels, J. T. M., and Rhodes, E. J.: Assessing Optically Stimulated Luminescence (OSL) signal contamination within small aliquots and single grain measurements utilizing the composition test, Quat. Int., 362, 34–41, https://doi.org/10.1016/j.quaint.2014.05.017, 2015.
Little, R. D.: Terraces of the Makran Coast of Iran and parts of West Pakistan, PhD Thesis, University of Southern California, ProQuest LLC, Ann Arbor, Michigan, 1972.
Macharé, J. and Ortlieb, L.: Plio-Quaternary vertical motions and the subduction of the Nazca Ridge, central coast of Peru, Tectonophysics, 205, 97–108, https://doi.org/10.1016/0040-1951(92)90420-B, 1992.
Manaman, N. S., Shomali, H., and Koyi, H.: New constraints on upper-mantle S-velocity structure and crustal thickness of the Iranian plateau using partitioned waveform inversion, Geophys. J. Int., 184, 247–267, https://doi.org/10.1111/j.1365-246X.2010.04822.x, 2011.
Masson, F., Anvari, M., Djamour, Y., Walpersdorf, A., Tavakoli, F., Daignières, M., Nankali, H., and Van Gorp, S.: Large-scale velocity field and strain tensor in Iran inferred from GPS measurements: New insight for the present-day deformation pattern within NE Iran, Geophys. J. Int., 170, 436–440, https://doi.org/10.1111/j.1365-246X.2007.03477.x, 2007.
Matsu'ura, M. and Sato, T.: A dislocation model for the earthquake cycle at convergent plate boundaries, Geophys. J. Int., 96, 23–32, https://doi.org/10.1111/j.1365-246X.1989.tb05247.x, 1989.
McCall, G. J. H.: A summary of the geology of the Iranian Makran, Geol. Soc. London Spec. Publ., 195, 147–204, https://doi.org/10.1144/GSL.SP.2002.195.01.10, 2002.
Medina-Elizalde, M.: A global compilation of coral sea-level benchmarks: Implications and new challenges, Earth Planet. Sc. Lett., 362, 310–318, https://doi.org/10.1016/j.epsl.2012.12.001, 2013.
Meschis, M., Roberts, G. P., Robertson, J., and Briant, R. M.: The Relationships Between Regional Quaternary Uplift, Deformation Across Active Normal Faults, and Historical Seismicity in the Upper Plate of Subduction Zones: The Capo D'Orlando Fault, NE Sicily, Tectonics, 37, 1–25, https://doi.org/10.1029/2017TC004705, 2018.
Murray-Wallace, C. V. and Woodroffe, C. D.: Quaternary Sea-Level Changes: A Global Perspective, Cambridge University Press, Cambridge, 2014.
Murray, A. S. and Olley, J. M.: Precision and accuracy in the optically stimulated luminescence dating of sedimentary quartz: A status review, Geochronometria, 21, 1–16, 2002.
Murray, A. S. and Wintle, A. G.: The single aliquot regenerative dose protocol: Potential for improvements in reliability, Radiat. Meas., 37, 377–381, https://doi.org/10.1016/S1350-4487(03)00053-2, 2003.
Musson, R. M. W.: Subduction in the Western Makran: the historian's contribution, J. Geol. Soc. London., 166, 387–391, https://doi.org/10.1144/0016-76492008-119, 2009.
Normand, R., Simpson, G., Herman, F., Biswas, R. H., Bahroudi, A., and Schneider, B.: Data from: Dating and morphostratigraphy of uplifted marine terraces in the Makran subduction zone (Iran), data set, https://doi.org/10.5281/zenodo.2560950, 2018.
Page, W. D., Alt, J. N., Cluff, L. S., and Plafker, G.: Evidence for the recurrence of large-magnitude earthquake along the Makran coast of Iran and Pakistan, Tectonophysics, 52, 533–547, https://doi.org/10.1016/0040-1951(79)90269-5, 1979.
Pararas-Carayannis, G.: The Potential of Tsunami Generation along the Makran Subduction, Sci. Tsunami hazards, 24, 358–384, 2006.
Pedoja, K., Husson, L., Regard, V., Cobbold, P. R., Ostanciaux, E., Johnson, M. E., Kershaw, S., Saillard, M., Martinod, J., Furgerot, L., Weill, P., and Delcaillau, B.: Relative sea-level fall since the last interglacial stage: Are coasts uplifting worldwide?, Earth-Sci. Rev., 108, 1–15, https://doi.org/10.1016/j.earscirev.2011.05.002, 2011.
Pedoja, K., Husson, L., Johnson, M. E., Melnick, D., Witt, C., Pochat, S., Nexer, M., Delcaillau, B., Pinegina, T., Poprawski, Y., Authemayou, C., Elliot, M., Regard, V., and Garestier, F.: Coastal staircase sequences reflecting sea-level oscillations and tectonic uplift during the Quaternary and Neogene, Earth-Sci. Rev., 132, 13–38, https://doi.org/10.1016/j.earscirev.2014.01.007, 2014.
Pedoja, K., Jara-Muñoz, J., De Gelder, G., Robertson, J., Meschis, M., Fernandez-Blanco, D., Nexer, M., Poprawski, Y., Dugué, O., Delcaillau, B., Bessin, P., Benabdelouahed, M., Authemayou, C., Husson, L., Regard, V., Menier, D., and Pinel, B.: Neogene-Quaternary slow coastal uplift of Western Europe through the perspective of sequences of strandlines from the Cotentin Peninsula (Normandy, France), Geomorphology, 303, 338–356, https://doi.org/10.1016/j.geomorph.2017.11.021, 2018a.
Pedoja, K., Husson, L., Bezos, A., Pastier, A., Imran, A. M., Arias-Ruiz, C., Sarr, A., Elliot, M., Pons-Branchu, E., Nexer, M., Regard, V., Hafidz, A., Robert, X., Benoit, L., Delcaillau, B., Authemayou, C., Dumoulin, C., and Choblet, G.: On the long-lasting sequences of coral reef terraces from SE Sulawesi (Indonesia): Distribution, formation, and global significance, Quat. Sci. Rev., 188, 37–57, https://doi.org/10.1016/j.quascirev.2018.03.033, 2018b.
Penney, C., Tavakoli, F., Saadat, A., Nankali, H. R., Sedighi, M., Khorrami, F., Sobouti, F., Rafi, Z., Copley, A., Jackson, J., and Priestley, K.: Megathrust and accretionary wedge properties and behaviour in the Makran subduction zone, Geophys. J. Int., 209, 1800–1830, https://doi.org/10.1093/gji/ggx126, 2017.
Peyret, M., Djamour, Y., Hessami, K., Regard, V., Bellier, O., Vernant, P., Daignières, M., Nankali, H., Van Gorp, S., Goudarzi, M., Chéry, J., Bayer, R., and Rigoulay, M.: Present-day strain distribution across the Minab-Zendan-Palami fault system from dense GPS transects, Geophys. J. Int., 179, 751–762, https://doi.org/10.1111/j.1365-246X.2009.04321.x, 2009.
Pirazzoli, P. A.: Tectonic shorelines, in: Coastal evolution, edited by: Carter, W. and Woodroffe, C. D., 451–476, Cambridge University Press, Cambridge, 1994.
Platt, J. P. and Leggett, J. K.: Stratal Extension in Thrust Footwalls, Makran Accretionary Prism: Implications for Thrust Tectonics., Am. Assoc. Pet. Geol. Bull., 70, 191–203, 1986.
Quittmeyer, R. C. and Jacob, K. H.: Historical and Modern seismicity of Pakistan, Afghanistan, Northwestern India, and Southeastern Iran, Bull. Seismol. Soc. Am., 69, 773–823, 1979.
Railsback, L. B., Gibbard, P. L., Head, M. J., Voarintsoa, N. R. G., and Toucanne, S.: An optimized scheme of lettered marine isotope substages for the last 1.0 million years, and the climatostratigraphic nature of isotope stages and substages, Quat. Sci. Rev., 111, 94–106, https://doi.org/10.1016/j.quascirev.2015.01.012, 2015.
Rajendran, C. P., Rajendran, K., Shah-hosseini, M., Beni, A. N., Nautiyal, C. M., and Andrews, R.: The hazard potential of the western segment of the Makran subduction zone, northern Arabian Sea, Nat. Hazards, 65, 219–239, https://doi.org/10.1007/s11069-012-0355-6, 2013.
Regard, V., Pedoja, K., De La Torre, I., Saillard, M., Cortés-Aranda, J., and Nexer, M.: Geometrical trends within sequences of Pleistocene marine terraces: Selected examples from California, Peru, Chile and New-Zealand, Z. Geomorphol., 61, 53–73, https://doi.org/10.1127/zfg/2017/0389, 2017.
Reimer, P., Bard, E., Bayliss, A., Beck, J. W., Blackwell, P. G., Bronk Ramsey, C., Buck, C. E., Cheng, H., Edwards, R. L., Friedrich, M., Grootes, P. M., Guilderson, T. P., Haflidason, H., Hajdas, I., Hatté, C., Heaton, T. J., Hoffmann, D. L., Hogg, A. G., Hughen, K. A., Kaiser, K. F., Kromer, B., Manning, S. W., Niu, M., Reimer, R. W., Richards, D. A., Scott, E. M., Southon, J. R., Staff, R. A., Turney, C. S. M., and van der Plicht, J.: IntCal13 and Marine13 Radiocarbon Age Calibration Curves 0–50 000 Years cal BP, Radiocarbon, 55, 1869–1887, https://doi.org/10.2458/azu_js_rc.55.16947, 2013.
Reyss, J. L., Pirazzoli, P. A., Haghipour, A., Hatté, C., and Fontugne, M.: Quaternary marine terraces and tectonic uplift rates on the south coast of Iran, Geol. Soc. London Spec. Publ., 146, 225–237, https://doi.org/10.1144/GSL.SP.1999.146.01.13, 1998.
Rizzoli, P., Martone, M., Gonzalez, C., Wecklich, C., Tridon, D. B., Bräutigam, B., Bachmann, M., Schulze, D., Fritz, T., Huber, M., Wessel, B., Krieger, G., Zink, M., and Moreira, A.: ISPRS Journal of Photogrammetry and Remote Sensing Generation and performance assessment of the global TanDEM-X digital elevation model, ISPRS J. Photogramm. Remote Sens., 132, 119–139, https://doi.org/10.1016/j.isprsjprs.2017.08.008, 2017.
Roberts, G. P., Meschis, M., Houghton, S., Underwood, C., and Briant, R. M.: The implications of revised Quaternary palaeoshoreline chronologies for the rates of active extension and uplift in the upper plate of subduction zones, Quat. Sci. Rev., 78, 169–187, https://doi.org/10.1016/j.quascirev.2013.08.006, 2013.
Rohling, E. J., Grant, K., Bolshaw, M., Roberts, A. P., Siddall, M., Hemleben, C., and Kucera, M.: Antarctic temperature and global sea level closely coupled over the past five glacial cycles, Nat. Geosci., 2, 500–504, https://doi.org/10.1038/ngeo557, 2009.
Rohling, E. J., Foster, G. L., Grant, K. M., Marino, G., Roberts, A. P., Tamisiea, M. E., and Williams, F.: Sea-level and deep-sea-temperature variability over the past 5.3 million years, Nature, 508, 477–482, https://doi.org/10.1038/nature13230, 2014.
Rovere, A., Raymo, M. E., Vacchi, M., Lorscheid, T., Stocchi, P., Gómez-Pujol, L., Harris, D. L., Casella, E., O'Leary, M. J., and Hearty, P. J.: The analysis of Last Interglacial (MIS 5e) relative sea-level indicators: Reconstructing sea-level in a warmer world, Earth-Sci. Rev., 159, 404–427, https://doi.org/10.1016/j.earscirev.2016.06.006, 2016.
Saillard, M., Hall, S. R., Audin, L., Farber, D. L., Hérail, G., Martinod, J., Regard, V., Finkel, R. C., and Bondoux, F.: Non-steady long-term uplift rates and Pleistocene marine terrace development along the Andean margin of Chile (31∘ S) inferred from 10 Be dating, Earth Planet. Sc. Lett., 277, 50–63, https://doi.org/10.1016/j.epsl.2008.09.039, 2009.
Saillard, M., Hall, S. R., Audin, L., Farber, D. L., Regard, V., and Hérail, G.: Andean coastal uplift and active tectonics in southern Peru: 10Be surface exposure dating of differentially uplifted marine terrace sequences (San Juan de Marcona, ∼15.4∘ S), Geomorphology, 128, 178–190, https://doi.org/10.1016/j.geomorph.2011.01.004, 2011.
Saillard, M., Audin, L., Rousset, B., Avouac, J. P., Chlieh, M., Hall, S. R., Husson, L., and Farber, D. L.: From the seismic cycle to long-term deformation: linking seismic coupling and Quaternary coastal geomorphology along the Andean megathrust, Tectonics, 36, 241–256, https://doi.org/10.1002/2016TC004156, 2017.
Saket, A. and Etemad-shahidi, A.: Wave energy potential along the northern coasts of the Gulf of Oman, Iran, Renew. Energy, 40, 90–97, https://doi.org/10.1016/j.renene.2011.09.024, 2012.
Samadian, M. R., Ghomashi, A., Jamshidi, K., Afsharianzadeh, A., Sharifian, M. I., Abdolahi, M. R., Eghlimi, B., and Ahmadzadeh Heravi, M.: Geological map of Iran 1:100 000: Kahir sheet, Geological Survey of Iran, 1994.
Samadian, M. R., Ghomashi, A., Mohebbi, A. R., Jafarian, M. B., Abdoli, M., and Ahmadzadeh Heravi, M.: Geological map of Iran 1:100 000: Chabahar sheet, Geological Survey of Iran, 1996.
Samadian, M. R., Ghomashi, A., Chaichi, Z., Eshraghi, S. A., Kholghi, M. H., Abdollahi, M. R., Sohaili, M., and Korei, M. T.: Geological map of Iran 1:100 000: Peersohrab sheet, Geological Survey of Iran, 2004.
Sanlaville, P., Besenval, R., Evin, J., and Prieur, A.: Evolution de la région littorale du Makran pakistanais à l'Holocène, Paléorient, 17, 3–18, https://doi.org/10.3406/paleo.1991.4536, 1991.
Segall, P.: Earthquake and Volcano Deformation, Princeton University Press, Princeton, New Jersey, 2010.
Shah-Hosseini, M., Morhange, C., Naderi Beni, A., Marriner, N., Lahijani, H., Hamzeh, M., and Sabatier, F.: Coastal boulders as evidence for high-energy waves on the Iranian coast of Makran, Mar. Geol., 290, 17–28, https://doi.org/10.1016/j.margeo.2011.10.003, 2011.
Shah-Hosseini, M., Ghanavati, E., Morhange, C., Naderi Beni, A., Lahijani, H. A., and Hamzeh, M. A.: The evolution of Chabahar beach ridge system in SE Iran in response to Holocene relative sea level changes, Geomorphology, 318, 139–147, https://doi.org/10.1016/j.geomorph.2018.06.009, 2018.
Shakun, J. D., Lea, D. W., Lisiecki, L. E., and Raymo, M. E.: An 800-kyr record of global surface ocean δ18O and implications for ice volume-temperature coupling, Earth Planet. Sc. Lett., 426, 58–68, https://doi.org/10.1016/j.epsl.2015.05.042, 2015.
Siddall, M., Rohling, E., Almogi-Labin, A., Hemleben, C., Meischner, D., Schmelzer, I., and Smeed, D. A.: Sea-level fluctuations during the last glacial cycle, Nature, 423, 853–858, https://doi.org/10.1038/nature01690, 2003.
Siddall, M., Chappell, J., and Potter, E.-K.: Eustatic Sea Level During Past Interglacials, in: The Climate of Past Interglacials, edited by: Sirocko, F., Claussen, M., Sanchez Goñi, M. F., and Litt, T., 75–92, Elsevier, Amsterdam, 2006.
Siddall, M., Rohling, E. J., Thompson, W. G., and Waelbroeck, C.: Marine Isotopic Stage 3 sea level fluctuations: Data synthesis and new outlook, Rev. Geophys., 46, 1–29, https://doi.org/10.1029/2007RG000226, 2008.
Simpson, G.: Accumulation of permanent deformation during earthquake cycles on reverse faults, J. Geophys. Res.-Sol. Ea., 120, 1958–1974, https://doi.org/10.1002/2014JB011442, 2015.
Smith, G., McNeill, L., Henstock, I. J., and Bull, J.: The structure and fault activity of the Makran accretionary prism, J. Geophys. Res.-Sol. Ea., 117, 1–17, https://doi.org/10.1029/2012JB009312, 2012.
Smith, G. L., McNeill, L. C., Wang, K., He, J., and Henstock, T. J.: Thermal structure and megathrust seismogenic potential of the Makran subduction zone, Geophys. Res. Lett., 40, 1528–1533, https://doi.org/10.1002/grl.50374, 2013.
Snead, R. J.: Recent Morphological changes along the coast of West Pakistan, Ann. Assoc. Am. Geogr., 57, 550–565, https://doi.org/10.1111/j.1467-8306.1967.tb00621.x, 1967.
Snead, R. J.: Uplifted Marine Terraces along the Makran coast of Pakistan and Iran, in: Himalaya to the Sea, edited by Shroder, J. F. J., 327–362, Routledge, London, 1993.
Southon, J., Kashgarian, M., Fontugne, M., Metivier, B., and Yim, W. W.-S.: Marine reservoir correction for the Indian Ocean an Southeast Asia, Radiocarbon, 44, 167–180, https://doi.org/10.1017/S0033822200064778, 2002.
Spikings, R. and Simpson, G.: Rock uplift and exhumation of continental margins by the collision, accretion, and subduction of buoyant and topographically prominent oceanic crust, Tectonics, 33, 635–655, https://doi.org/10.1002/2013TC003425, 2014.
Spratt, R. M. and Lisiecki, L. E.: A Late Pleistocene sea level stack, Clim. Past, 12, 1079–1092, https://doi.org/10.5194/cp-12-1079-2016, 2016.
Stiffe, A. W.: On the Mud-craters and Geological Structure of the Mekran Coast, Q. J. Geol. Soc. London, 30, 50–53, https://doi.org/10.1144/GSL.JGS.1874.030.01-04.24, 1874.
Stirling, C. H., Esat, T. M., Lambeck, K., and McCulloch, M. T.: Timing and duration of the Last Interglacial: evidence for a restricted interval of widespread coral reef growth, Earth Planet. Sc. Lett., 160, 745–762, https://doi.org/10.1016/S0012-821X(98)00125-3, 1998.
Stirling, C. H., Esat, T. M., Lambeck, K., McCulloch, M. T., Blake, S. G., Lee, D.-C., and Halliday, A. N.: Orbital Forcing of the Marine Isotope Stage 9 Interglacial, Science, 291, 290–293, https://doi.org/10.1126/science.291.5502.290, 2001.
Thomsen, K. J., Murray, A. S., Jain, M., and Bøtter-jensen, L.: Laboratory fading rates of various luminescence signals from feldspar-rich sediment extracts, Radiat. Meas., 43, 1474–1486, https://doi.org/10.1016/j.radmeas.2008.06.002, 2008.
Trenhaile, A. S.: Modeling the development of wave-cut shore platforms, Mar. Geol., 166, 163–178, https://doi.org/10.1016/S0025-3227(00)00013-X, 2000.
Vernant, P., Nilforoushan, F., Hatzfeld, D., Abbassi, M. R., Vigny, C., Masson, F., Nankali, H., Martinod, J., Ashtiani, A., Bayer, R., Tavakoli, F., and Chéry, J.: Present-day crustal deformation and plate kinematics in the Middle East constrained by GPS measurements in Iran and northern Oman, Geophys. J. Int., 157, 381–398, https://doi.org/10.1111/j.1365-246X.2004.02222.x, 2004.
Vita-Finzi, C.: Quaternary Deposits in the Iranian Makran, Geogr. J., 141, 415–420, https://doi.org/10.2307/1796475, 1975.
Vita-Finzi, C.: 14C Dating of recent crustal movements in the Persian Gulf and Iranian Makran, Radiocarbon, 22, 763–773, https://doi.org/10.1017/S0033822200010134, 1980.
Vita-Finzi, C.: Late Quaternary deformation on the Makran coast of Iran, Z. Geomorphol. Suppl. Issues, 40, 213–226, 1981.
Vita-Finzi, C.: Recent coastal deformnation near the Strait of Hormuz, Proc. R. Soc. Lond., 382, 441–457, https://doi.org/10.1098/rspa.1982.0111, 1982.
Vita-Finzi, C.: Neotectonics in the Arabian Sea coasts, Geol. Soc. London, Spec. Publ., 195, 87–96, https://doi.org/10.1144/GSL.SP.2002.195.01.06, 2002.
von Rad, U., Schaaf, M., Michels, K. H., Schulz, H., Berger, W. H., and Sirocko, F.: A 5000-yr Record of Climate Change in Varved Sediments from the Oxygen Minimum Zone off Pakistan, Northeastern Arabian Sea, Quat. Res., 51, 39–53, https://doi.org/10.1006/qres.1998.2016, 1999.
Waelbroeck, C., Labeyrie, L., Michel, E., Duplessy, J. C., McManus, J. F., Lambeck, K., Balbon, E., and Labracherie, M.: Sea-level and deep water temperature changes derived from benthic foraminifera isotopic records, Quat. Sci. Rev., 21, 295–305, https://doi.org/10.1016/S0277-3791(01)00101-9, 2002.
Wallinga, J., Murray, A., and Duller, G.: Underestimation of equivalent dose in single-aliquot optical dating of feldspars caused by preheating, Radiat. Meas., 32, 691–695, https://doi.org/10.1016/S1350-4487(00)00127-X, 2000.
Walpersdorf, A., Manighetti, I., Mousavi, Z., Tavakoli, F., Vergnolle, M., Jadidi, A., Hatzfeld, D., Aghamohammadi, A., Bigot, A., Djamour, Y., Nankali, H., and Sedighi, M.: Present-day kinematics and fault slip rates in eastern Iran, derived from 11 years of GPS data, J. Geophys. Res.-Sol. Ea., 119, 1359–1383, https://doi.org/10.1002/2013JB010620, 2014.
Wesson, R. L., Melnick, D., Cisternas, M., Moreno, M., and Ely, L. L.: Vertical deformation through a complete seismic cycle at Isla Santa María, Chile, Nat. Geosci., 8, 547–553, https://doi.org/10.1038/NGEO2468, 2015.
White, R. S. and Louden, K. E.: The Makran continental margin: structure of a thickly sedimented convergent plate boundary, in: AAPG Special Volumes, Studies in Continental Margin Geology, vol. 34, edited by: Watkins, C. L. and Drake, J. S., 499–518, 1982.
White, R. S. and Ross, D. A.: Tectonics of the Western Gulf of Oman, J. Geophys. Res., 84, 3479–3489, https://doi.org/10.1029/JB084iB07p03479, 1979.
Wintle, A. G.: Anomalous fading of thermo-luminescence in mineral samples, Nature, 245, 143–144, https://doi.org/10.1038/245143a0, 1973.
Yokoyama, Y., Esat, T. M., and Lambeck, K.: Last glacial sea-level change deduced from uplifted coral terraces of Huon Peninsula, Papua New Guinea, Quat. Int., 83–85, 275–283, https://doi.org/10.1016/S1040-6182(01)00045-3, 2001.
Zare, M., Amini, H., Yazdi, P., Sesetyan, K., Demircioglu, M. B., Kalafat, D., Erdik, M., Giardini, D., Khan, M. A., and Tsereteli, N.: Recent developments of the Middle East catalog, J. Seismol., 18, 749–772, https://doi.org/10.1007/s10950-014-9444-1, 2014.