the Creative Commons Attribution 4.0 License.
the Creative Commons Attribution 4.0 License.
 | 18 Jan 2019
Environmental signal shredding on sandy coastlines
Mitchell D. Harley
Chris E. Blenkinsopp
Ian L. Turner
How storm events contribute to long-term shoreline change over decades to centuries remains an open question in coastal research. Sand and gravel coasts exhibit remarkable resilience to event-driven disturbances, and, in settings where sea level is rising, shorelines retain almost no detailed information about their own past positions. Here, we use a high-frequency, multi-decadal observational record of shoreline position to demonstrate quantitative indications of morphodynamic turbulence – “signal shredding” – in a sandy beach system. We find that, much as in other dynamic sedimentary systems, processes of sediment transport that affect shoreline position at relatively short timescales may obscure or erase evidence of external forcing. This suggests that the physical effects of annual (or intra-annual) forcing events, including major storms, may convey less about the dynamics of long-term shoreline change – and vice versa – than coastal researchers might wish.
- Article
(2444 KB) - Full-text XML
-
Supplement
(4658 KB) - BibTeX
- EndNote


Quantifying magnitudes and rates of shoreline change is fundamental to understanding the dynamics of coastlines: not only how they behave over time, but also how they may respond to future changes in environmental forcing. From a coastal-management perspective, shoreline change may constitute a coastal hazard – either event-driven, like the impact of a major storm, or chronic, like persistent shoreline erosion from a net-negative sediment budget. Long-term, continuous measurement of shoreline position observed at a given location will record changes arising from event-driven and chronic forcing alike. But how punctuated storm events contribute to long-term shoreline change over decades to centuries remains an open question, particularly in the context of shoreline-change prediction (Morton et al., 1994; Fenster et al., 2001; Houser and Hamilton, 2009; Anderson et al., 2010; Masselink and van Heteren, 2014; Brooks et al., 2016; Masselink et al., 2016; Scott et al., 2016; Burvingt et al., 2017).
Evidence of coastal storm frequency and magnitude over centuries to millennia may be stored in the sedimentary stratigraphy of beach ridges (Tamura, 2012) and washover into back-barrier lagoons (Donnelly and Woodruff, 2007). Ridge and washover stratigraphy offers a window into climatic forcing conditions in the recent geologic past but is not a direct measure of shoreline position. Indeed, in transgressive settings (in which relative sea level is rising), the shoreline itself retains almost no detailed information about its own past positions. Sand and gravel coastlines, especially, reflect remarkable resilience to event-driven disturbances – even to tsunamis (Choowong et al., 2009). Storm-driven shoreline excursions on the order of ∼101–102 m may be obscured within days to months, and effectively erased within years (Birkemeir, 1979; Egense, 1989; Thom and Hall, 1991; Morton et al., 1994; Douglas and Crowell, 2000; Honeycutt et al., 2001; Zhang et al., 2002; List et al., 2006; Lazarus et al., 2012; Lentz et al., 2013; Coco et al., 2014; Masselink and van Heteren, 2014; Phillips et al., 2017).
This coastal context exemplifies a unifying challenge in geomorphology: determining how dynamic sedimentary systems – especially source-to-sink pathways – respond to rapid external forcing. Processes of sediment transport tend to rework upstream/upslope inputs so completely that their downstream/downslope outputs may bear no resemblance to the original pattern of forcing that drove them. In their essential synthesis of the problem, Jerolmack and Paola (2010) call this phenomenon the “shredding” of environmental signals. They offer that shredding – or, more formally, “morphodynamic turbulence” – behaves much like fluid turbulence, in that “energy injected at one frequency is smeared across a range of scales”. High-frequency signals of external forcing are especially likely to be shredded. Drawing on the physics of turbulent fluid flows (Frisch and Kolmogorov, 1995), Jerolmack and Paola (2010) used time series of sediment flux from physical and numerical experiments – bedload transport in a flume channel (Singh et al., 2009), a canonical rice-pile experiment (Frette et al., 1996), and a numerical rice-pile model – to illustrate their argument. Beyond source-to-sink sedimentary systems (Romans et al., 2016), signal shredding has since been extended to spatio-temporal changes in lake levels (Williams and Pelletier, 2015) and methane release from peatlands (Ramirez et al., 2015).
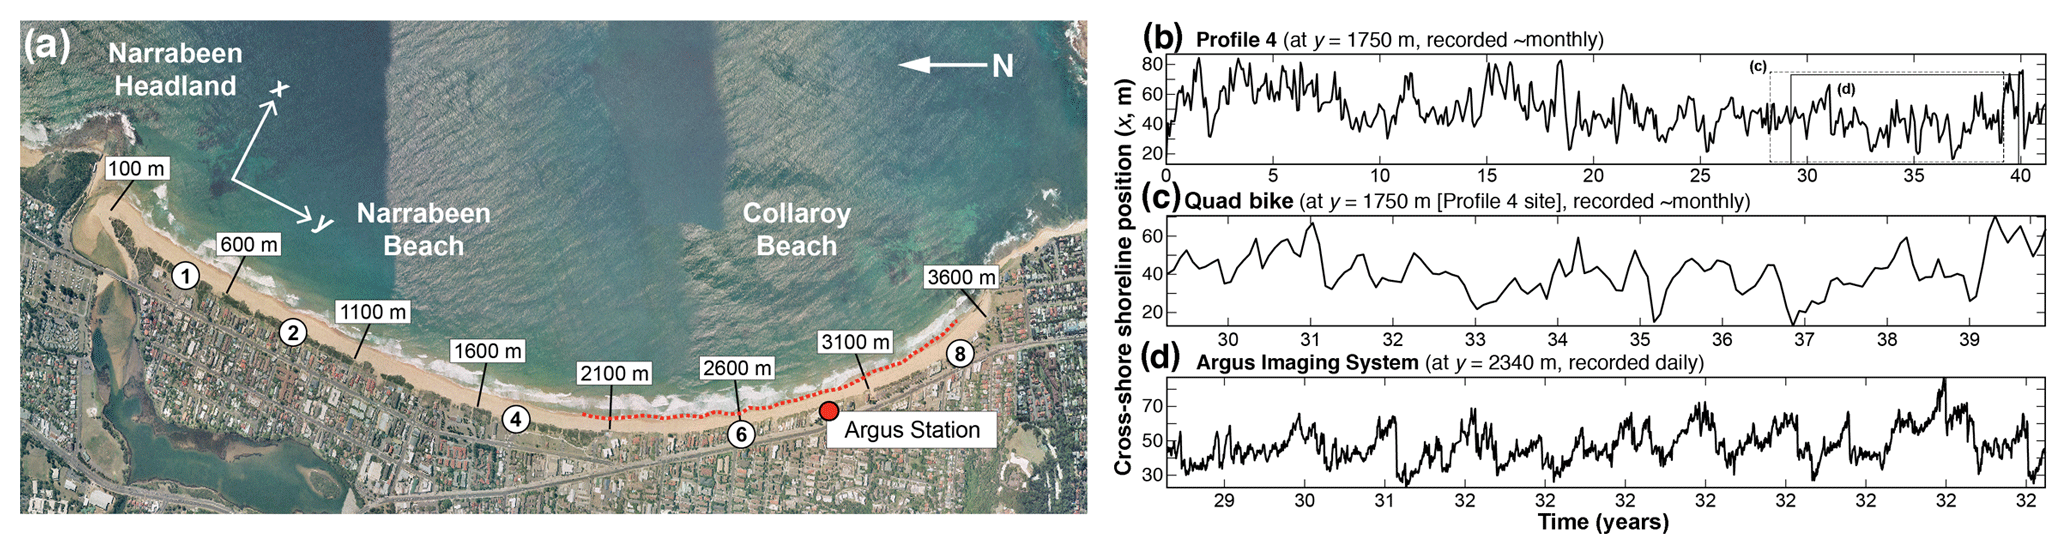
Figure 1(a) Narrabeen–Collaroy beach, with locations of long time-series profiles (circled numbers) and Argus Imaging System coverage. Alongshore coordinates (y) are relative to the northern end, below Narrabeen Headland. (b) Long-term time series of cross-shore shoreline position (0.7 m contour) at Profile 4, measured approximately monthly between 1976 and 2017. Time axis is in years since first measurement (27 April 1976). (c) Time series of cross-shore shoreline position at alongshore location y=1750 m (aligned with Profile 4), measured by quad bike approximately monthly between 2005 and 2017. (d) Time series of cross-shore shoreline position at alongshore location y=2340 m, measured daily by an Argus Imaging System between 2005 and 2016. Boxes (dotted, solid) in panel (b) frame the temporal coverages for the time series in panels (c) and (d).
Here, we investigate signal shredding in an altogether different sediment-transport system: that of a sandy beach. Although previous studies of sandy shoreline dynamics have invoked signal shredding conceptually (Lazarus et al., 2011a, 2012; Williams et al., 2013), none have used observations of shoreline position to demonstrate quantitative signatures of signal shredding empirically. Following Jerolmack and Paola (2010), we find the hallmarks of morphodynamic turbulence in time series of shoreline position measured at Narrabeen–Collaroy Beach, in southeast Australia (Short and Trembanis, 2004; Harley et al., 2011a, 2015; Turner et al., 2016; Phillips et al., 2017). The potential for beaches to “shred” large-magnitude changes in shoreline position forced at relatively short (∼ intra-annual) timescales complicates the reconciliation of short-term beach dynamics and long-term, spatio-temporal patterns of shoreline variability and evolution.
The Narrabeen–Collaroy embayment (Fig. 1a) holds a sandy beach 3.6 km long and is one of only a few sites worldwide where ongoing beach monitoring has been regular, frequent, and uninterrupted for multiple decades (Turner et al., 2016). Cross-shore profiles at five locations along the beach (Fig. 1a) have been measured approximately monthly (Fig. 1b) since 1976 (Turner et al., 2016). In addition, continuous alongshore shoreline positions derived from real-time kinematic GPS (RTK-GPS) quad-bike surveys of the full three-dimensional subaerial beach have been recorded approximately monthly (Fig. 1c) between 2005 and 2017 (Harley and Turner, 2008; Harley et al., 2011a, b, 2015). Daily-averaged shoreline position in the southern half of the embayment (Fig. 1a) has also been captured by an Argus Coastal Imaging system (Fig. 1d) for over a decade (Phillips et al., 2017). In each of these datasets we used the 0.7 m AHD (Australian Height Datum) elevation contour to define the cross-shore shoreline position (x) at all positions alongshore (y), commensurate with mean high water (Harley et al., 2011a, b). Data gaps in the profiles and time series were filled by linear interpolation. We also used deep-water wave data compiled from hourly records logged between 2005 and 2017 by the Sydney waverider buoy, located approximately 11 km offshore of the study area.
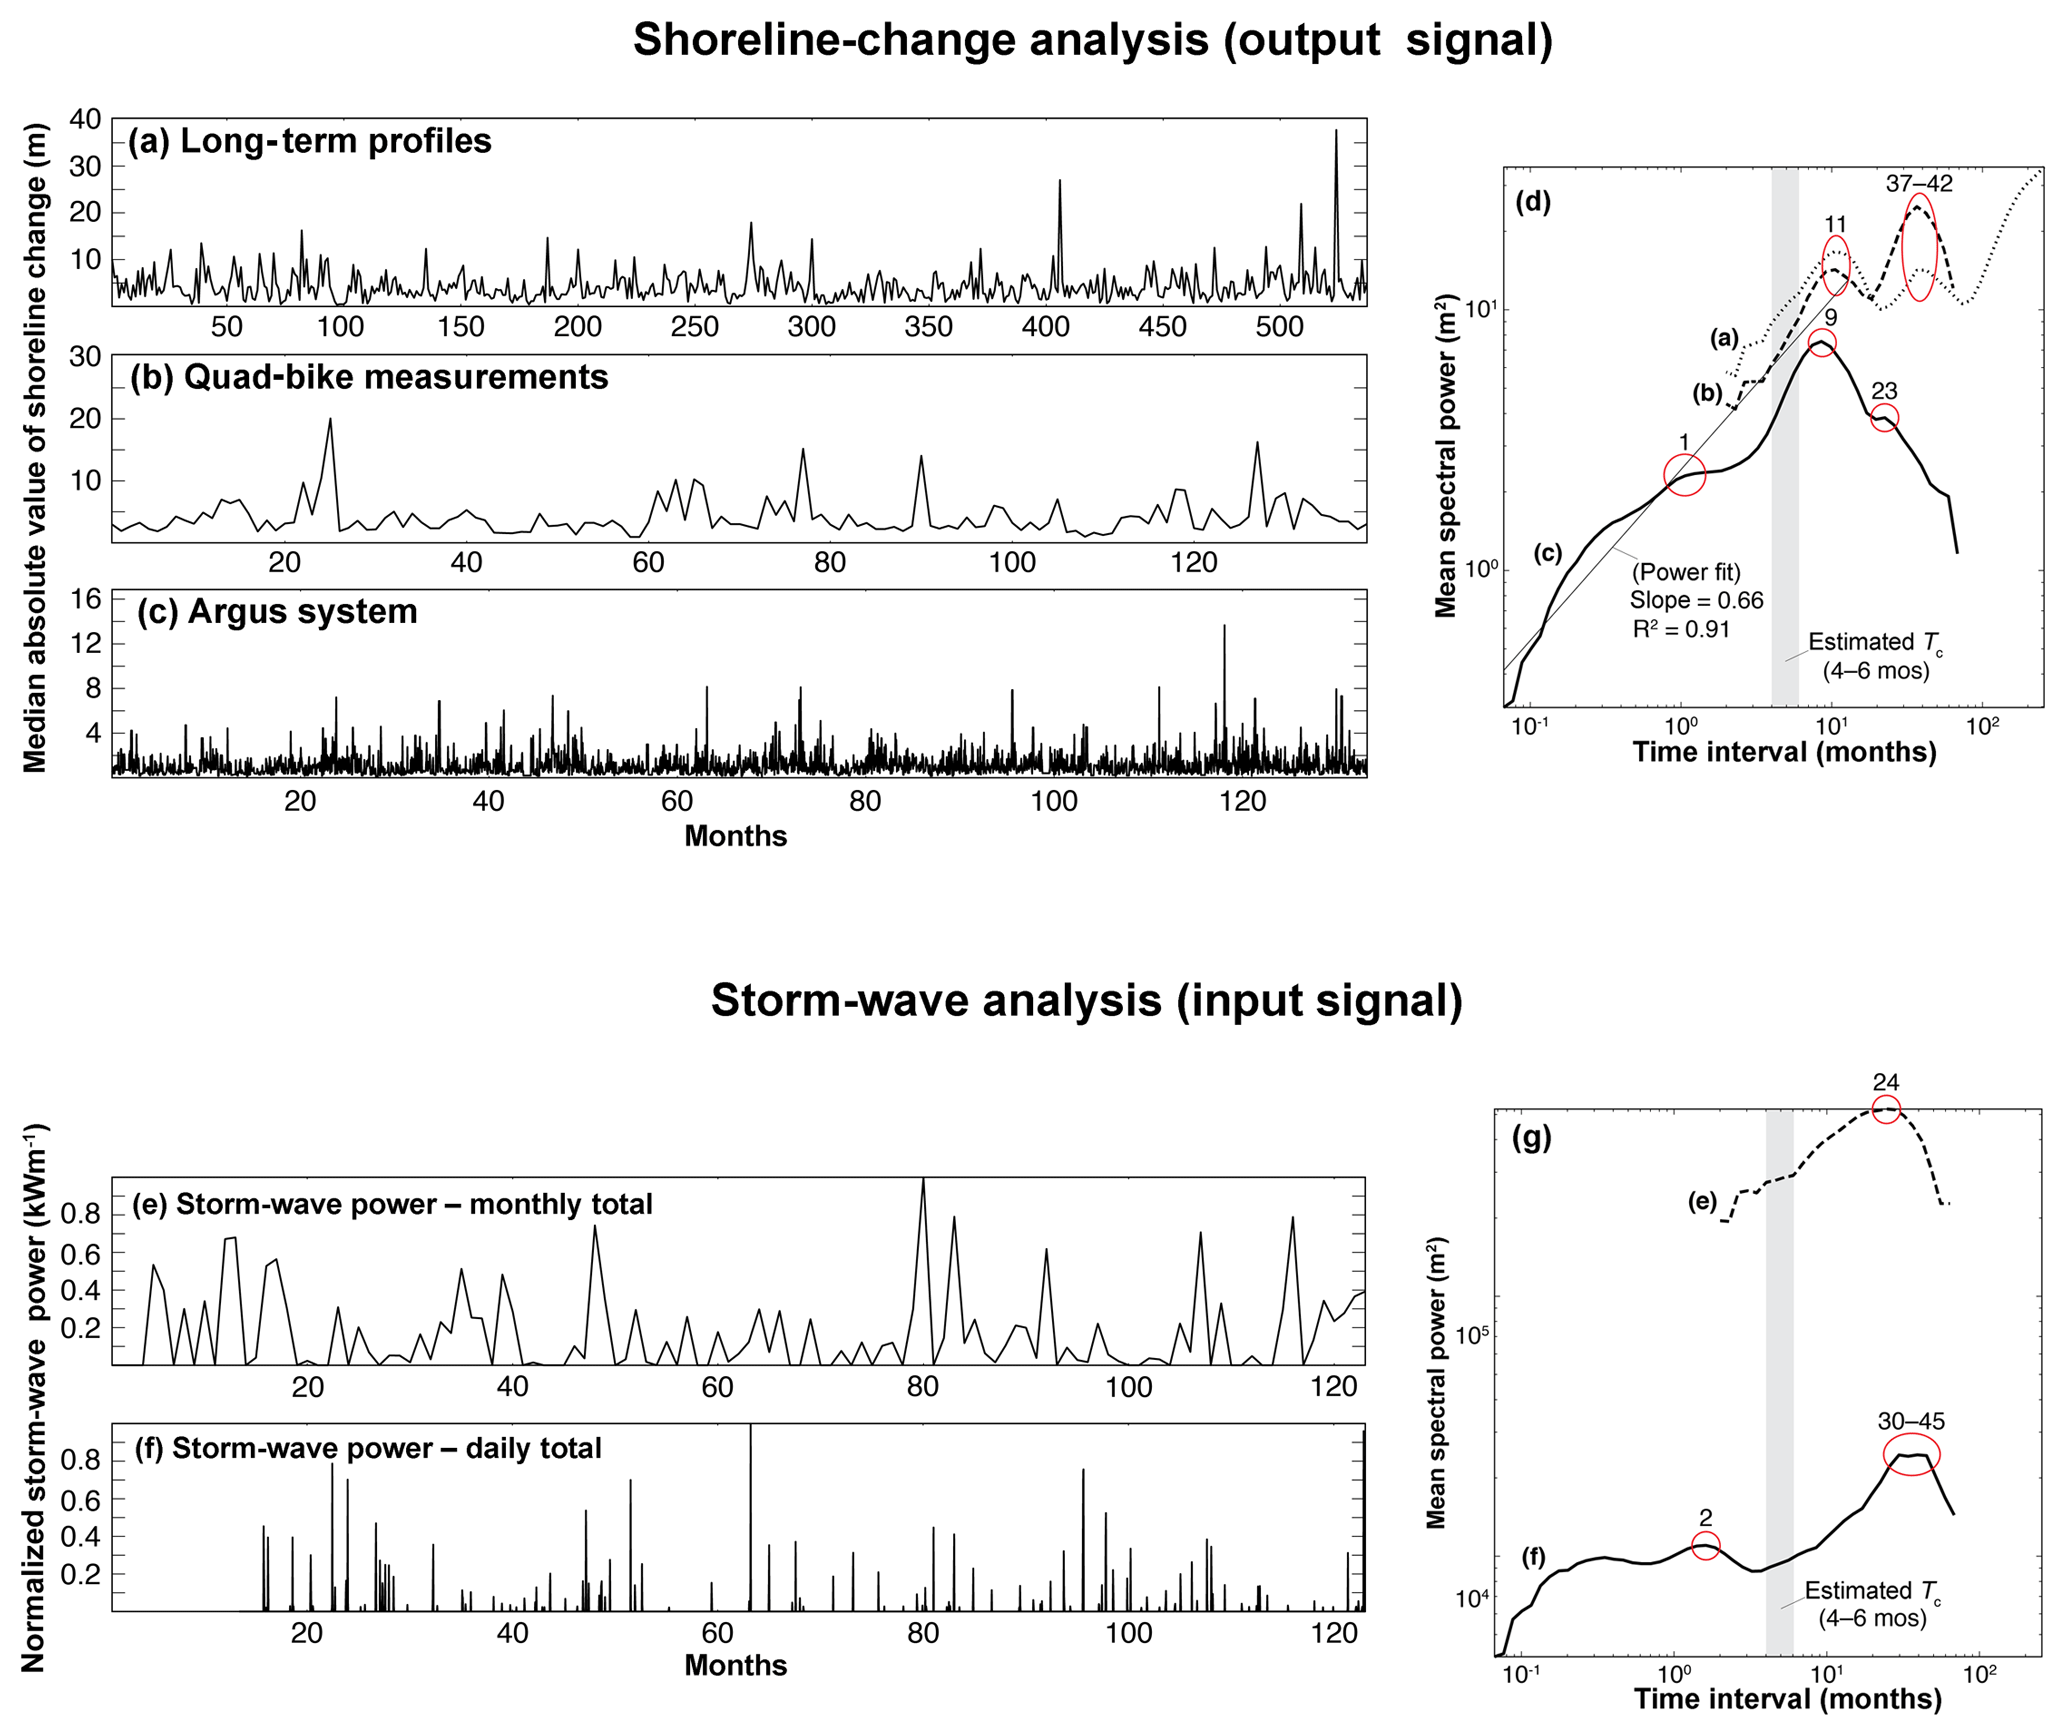
Figure 2Shoreline-change analysis (upper panels): alongshore median of the absolute value of monthly shoreline change from (a) long-term Profiles 1, 2, 4, 6, and 8, (b) monthly shoreline position from the RTK-GPS quad-bike surveys, and (c) a 850 m reach of the Argus coverage (y=1950–2800 m). (d) Wavelet-derived power spectra for the three shoreline-change signals, respectively, showing a transition from non-stationary to stationary at timescales ∼101 months. A power function fitted to the three spectra, combined, for scales up to ∼12 months, returns a scaling exponent =0.66. Storm-wave analysis (lower panels): (e) monthly and (f) daily total storm wave-energy flux between 2005 and 2017 (normalized to their respective maxima), used here to represent forcing input. (g) Power spectra for the storm-wave energy flux in panels (e) and (f). Labelled circles emphasize major peaks in spectral density at various timescales. Grey bar in panels (d) and (g) indicates an estimated characteristic timescale Tc=4–6 months, based on normalized beach width relative to mean normalized wave-energy forcing.
3.1 Patterns in power spectra
In their bedload and rice-pile examples, Jerolmack and Paola (2010) collapsed these physical systems into one dimension – a time series of sediment flux past a single point. In our beach example, rather than considering sediment flux directly, we tracked the change in shoreline position, dx (in m), between consecutive time steps at a given position alongshore (y). In a generic source-to-sink system in which sediment only moves downstream, sediment flux is unidirectional and positive. By contrast, in a one-dimensional treatment of a beach system, shoreline movement (dx) is bidirectional, as wave-driven cross-shore sediment transport shifts the shoreline at any location onshore and offshore over time. To therefore include both onshore (negative) and offshore (positive) movement, we worked with the absolute value of shoreline change and calculated the power spectrum of the time series using wavelet analysis, following the method described by Lazarus et al. (2011a, 2012). We show results based on the median absolute value of shoreline change for all positions alongshore at a given time step (Fig. 2a–c). To confirm that this simplification is representative, we also analysed the spectral density of the shoreline-change time series at each position alongshore (Fig. S1 in the Supplement).
This application of wavelet analysis functions much like a Fourier transform (Lazarus et al., 2011a, 2012). We first convolved the time series (the absolute value of shoreline change) with a second-order Daubechies wavelet in a continuous wavelet transform. Taking the mean transform variance at temporal scales up to approximately half the overall length of the signal produced a measure of spectral power. We chose a wavelet with a small number of vanishing moments – a measure of how much the wavelet shape undulates – because simple wavelets tend to have better sensitivity over a greater range of scales. The general pattern of spectral density was insensitive to different wavelets with low vanishing moments and was comparable to spectra generated by a fast Fourier transform (Fig. S2).
Like the sedimentary systems described by Jerolmack and Paola (2010), the spectral density of the one-dimensional shoreline-change term dx(t) yields a pattern with two regimes (Fig. 2d). A non-stationary regime extends over shorter timescales, such that spectral density and timescale are correlated by a power law. This relationship transitions at ∼9–11 months into a comparatively stationary (uncorrelated) regime over longer intervals. (A power function fitted to the three spectra, combined, for scales up to ∼12 months, returns a scaling exponent =0.66, but the physical significance of this slope value remains unclear.) This two-regime pattern in the power spectrum (Jerolmack and Paola, 2010) serves as an initial indication that signal shredding may be inherent in the dynamics of sandy beach systems.
But what environmental signal is being shredded at the shoreline? Consider again a unidirectional source-to-sink system, driven by some input flux at the upstream end. That input flux might be constant; it might fluctuate quasi-periodically; it might spike with large-magnitude events. In a controlled physical experiment or a numerical model, input flux (of sediment and/or fluid) is a known quantity, set by the researcher. Whatever its pattern in time, input flux embodies the environmental signal that is susceptible to shredding by sediment-transport processes internal to the system. Here, for the beach system, we treated energy flux from incident storm waves as the external environmental signal that shoreline behaviour may destroy or preserve.
Previous work on Narrabeen–Collaroy has demonstrated that the relationship between wave-energy flux and shoreline change is strongest for storm waves (Harley et al., 2009; Phillips et al., 2017). By isolating storm waves, we do not mean to suggest that lower-energy waves do not move sediment. However, changes in nearshore bar and beach morphology tend to emerge far more slowly than the high-frequency variability of low-energy wave forcing (Plant et al., 2006), and, in this case, we are interested in the conditions under which an input flux could be preserved in the shoreline response signal. We defined storm-wave conditions by a threshold corresponding to the 95th percentile of deep-water significant wave height (Hs, m), which for this region is Hs>3 m (Harley, 2017). Much like flow discharge in a fluvial system, deep-water wave-energy flux (E, kW per metre wavefront) may serve as a useful proxy for input flux to the beach:
where ρ (kg m−3) is water density, g (m s−2) is acceleration by gravity, Hs (m) is significant deep-water wave height, and Pw (s) is wave period (Herbich, 2000).
We calculated monthly and daily total storm-wave energy fluxes corresponding to the monthly and daily shoreline time series (Fig. 2e, f) and transformed them into power spectra to demonstrate that the forcing (input) and response (output) spectra are not the same (Fig. 2d, g). Where the spectral density of shoreline change is non-stationary (correlated) over a range of relatively short timescales (Fig. 2d), the spectral density of wave forcing is comparatively stationary (uncorrelated) over the same range (Fig. 2g). The monthly wave-energy time series shows a peak in spectral density at ∼24 months but with no clear comparator in the shoreline-change spectra. The daily wave-energy spectrum rises at the long-interval end of its range to a broad peak at ∼30–45 months (Fig. 2g), which overlaps with a local maximum in the shoreline-change spectra at ∼37–42 months (Fig. 2d).
Even in this one-dimensional representation, the sediment-transport processes of shoreline change have transformed an input signal into a quantitatively distinct output signal. To place these input–output spectral patterns in the context of physical processes that might explain them, we explored characteristic timescales of key embayed-beach dynamics.
3.2 Characteristic timescale from system size and input flux
Jerolmack and Paola (2010) showed in their exemplars that the transition from non-stationary to stationary (correlated to uncorrelated) in the spectral density of the output signal occurs at an intrinsic, characteristic timescale Tc. Theoretically, Tc is set by the system size L relative to the constant (∼ mean) signal input. While those parameters can be dictated for experimental systems, they are less clear for an open sandy coastline. To independently estimate Tc in the Narrabeen–Collaroy system and compare the results to the timescale (or range of timescales) at which the shoreline-change power spectra transition from non-stationary to stationary, we tested two different approaches.
The first approach is a back-of-the-envelope exercise. We assumed that the system size L is equivalent to maximum cross-shore beach width, defined here as the cross-shore distance from a fixed landward reference point to mean sea level (Harley and Turner, 2008; Harley et al., 2011b). This assumption extends from having collapsed the system into only the cross-shore (x) dimension: at any alongshore position (y), the theoretical maximum cross-shore (x) extent to which the beach can ever erode is the full width of the beach L, independent of embayment length. (We call L the “theoretical maximum” because historical records of shoreline change are necessarily of finite duration and therefore may never reflect this full width.) We normalized L relative to its maximum value, such that the theoretical maximum L=1. For the input flux, we took the mean normalized monthly (and daily) total wave-energy flux over the full span of the dataset, which here serves the purpose for a rough estimate of Tc. Using monthly total storm-wave energy flux (Fig. 2e), L∕E (where L and E are both normalized) yields Tc=4–6 months; using the daily total storm-wave energy flux (Fig. 2f), Tc=5–6 months. (These ranges come from excluding and including, respectively, zero values in the total wave-energy time series, which increases or decreases the mean normalized E.) Note that this estimate aligns with a detailed analysis of timescales for beach recovery at Narrabeen–Collaroy (Phillips et al., 2017). Plotted in relation to the power spectra for shoreline change (Fig. 2d), the characteristic timescale marks approximately where the spectral density “rolls over” from non-stationary to stationary (correlated to uncorrelated), just ahead of the distinct local maximum at ∼9–11 months.
3.3 Characteristic timescale from modes of embayed beach dynamics
The second approach to estimate one or more characteristic timescales Tc for the Narrabeen–Collaroy system derives from shoreline behaviours typical of this site and of embayed beaches more generally (Short and Trembanis, 2004; Ranasinghe et al., 2004; Harley et al., 2011a, 2015; Ratliff and Murray, 2014).

Figure 3(a) Detrended (in time) shoreline position, measured approximately monthly by quad bike, with north at left (corresponding to Fig. 1a). (b) Orthogonal PCA modes (or empirical orthogonal function (EOF) modes), representing variance about the mean shoreline position, and (c) wavelet-derived power spectra of each mode, where the first local maximum indicates the characteristic timescale for that mode.
Although they vary in detail between specific locations, approximately four modes of shoreline behaviour tend to describe how sediment moves within embayed beach systems. One mode represents sediment cycling offshore and onshore as a quasi-coherent unit at the full scale of the embayment: imagine a narrow beach during stormier times of the year and a wide beach during calmer intervals. Another common mode is termed “rotation” and occurs when prevailing wave conditions or a storm event shifts a significant volume of sediment inside the embayment alongshore to form a wider beach at one end and a narrower beach at the other (Ranasinghe et al., 2004). Related to rotation is what has been described as a “breathing” mode, a kind of shoreline resonance that hinges near the centre of the beach and characterizes changes in shoreline curvature, as sand moves between the middle and ends of an embayment (Ratliff and Murray, 2014). An additional mode of shoreline dynamics reflects patterns of shoreline variability introduced by rhythmic movements of sandbars, sandwaves, mega-cusps, and inlet processes, where applicable (Harley et al., 2011a, 2015). These four modes are not necessarily hierarchical: their relative dominance can change as a function of wave conditions (Harley et al., 2011a, 2015). More importantly, these modes of shoreline behaviour likely manifest intrinsic timescales.
To find characteristic timescales corresponding to the modes of shoreline behaviour at Narrabeen–Collaroy, we followed steps described by Ratliff and Murray (2014). From the monthly shorelines derived from RTK-GPS quad-bike surveys, at each position alongshore we detrended the series of shoreline position (not shoreline-position change) in time (Fig. 3a). To calculate the empirical orthogonal modes in the alongshore dimension through time and thus characterize shoreline variation around its mean position (Fig. 3b), we applied principal-component analysis (PCA) (Winant et al., 1975; Aubrey, 1979; Clarke and Eliot, 1982; Hsu et al., 1994; Dail et al., 2000; Short and Trembanis, 2004). Each mode in sequence explains a smaller percentage of variation in the data. We then used a continuous wavelet transform, again finding the mean transform variance over a range of time intervals (Lazarus et al., 2011a), to examine the spectral signatures of the first four behavioural modes in the temporal dimension. In the resulting power spectrum, peaks represent the characteristic timescale for each behavioural mode (Ratliff and Murray, 2014). We take Tc (Fig. 3c) as the first local maximum in the power spectrum (Ratliff and Murray, 2014), using a Ricker–Marr wavelet. (Other Gaussian-type wavelets yielded similar power spectra and characteristic timescales.)
The first two modes in these data are both rotational (Fig. 3b). The first, a rotation toward the north, accounts for 51 % of the observed shoreline variability with a peak timescale at ∼21 months (and a local saddle at ∼12 months). The second, a rotation toward the south, accounts for 32 % (∼6–7 months) and agrees closely with the Tc calculated independently from the normalized storm wave-energy flux. In previous applications of PCA to >25 years of long-term profile data (Short and Trembanis, 2004) and 5 years of quad-bike measurements (Harley et al., 2011a, 2015) at Narrabeen–Collaroy, rotational behaviour was secondary (26 % of shoreline variability around its mean position) to a dominant mode (∼60 %) of quasi-coherent, off- and onshore sand movement within the embayment. In the extended quad-bike dataset used here (Fig. 3a), bi-directional rotation appears to become the predominant mode after ∼2010. The third and fourth modes account for 5.4 % (∼10–11 months) and 2.5 % (∼10–11 months) of observed shoreline variability, respectively, and might reflect breathing behaviour at the fulcrum and both ends of the beach, perhaps with influences from other sources of shoreline variability, including an ephemeral inlet near Narrabeen Headland (Fig. 1a). Approach angles of deep-water waves associated with different types of storm system likely control the occurrence and relative strengths of the various modes (Harley et al., 2011a, 2015).
Although resolved in two dimensions, these shoreline behaviours nevertheless inform our one-dimensional simplification of shoreline change (Fig. 2). The spatial analysis shows that at each position alongshore, shoreline position is moving onshore and offshore with a few dominant modes of sediment-transport dynamics that rework the embayed beach at characteristic timescales. The “closed” system of the embayment makes the beach behave as a roughly conserved physical quantity. This means that rotation-driven shoreline change is spatially correlated, such that one side accretes approximately as much as the other side erodes. The spectral density of shoreline change over time at any position (y) is insensitive to this spatial correlation because the absolute value of shoreline change makes the magnitudes at one end of the embayment approximately equal to those at the other, and thus their power spectra quantitatively similar, in turn.
Jerolmack and Paola (2010) showed that morphodynamic turbulence will tend to shred (strongly modify) input perturbations with timescales shorter than the characteristic timescale of the system (T<Tc). Only input perturbations with timescales T>Tc are likely to be preserved (or only weakly modified) in the output signal. The various characteristic timescales that we estimated for the Narrabeen–Collaroy system (Fig. 4; Table 1) suggest that input perturbations (i.e. wave-energy events) with timescales on the order of months are subject to distortion by morphodynamic turbulence, and their effects on shoreline change will tend to get “smeared” across a range of temporal scales in the output signal (Fig. 4).
By extension, irregular but multi-annual forcings, such as the El Niño–Southern Oscillation (ENSO), might have a timescale sufficiently long enough to avoid erasure by annual cycling (Barnard et al., 2015). The power spectra for the shoreline-change and daily-resolution storm-wave energy flux register a peak near a time interval of ∼3–4 years, consistent with ENSO forcing. Moreover, if climate-related drivers were to increase future forcing at the annual timescale (T≈Tc), perhaps through storm frequency or intensity or both (Emanuel, 2013), there is potential for system resonance (Binder et al., 1995; Cadot et al., 2003; Jerolmack and Paola, 2010) that could amplify corresponding shoreline changes.
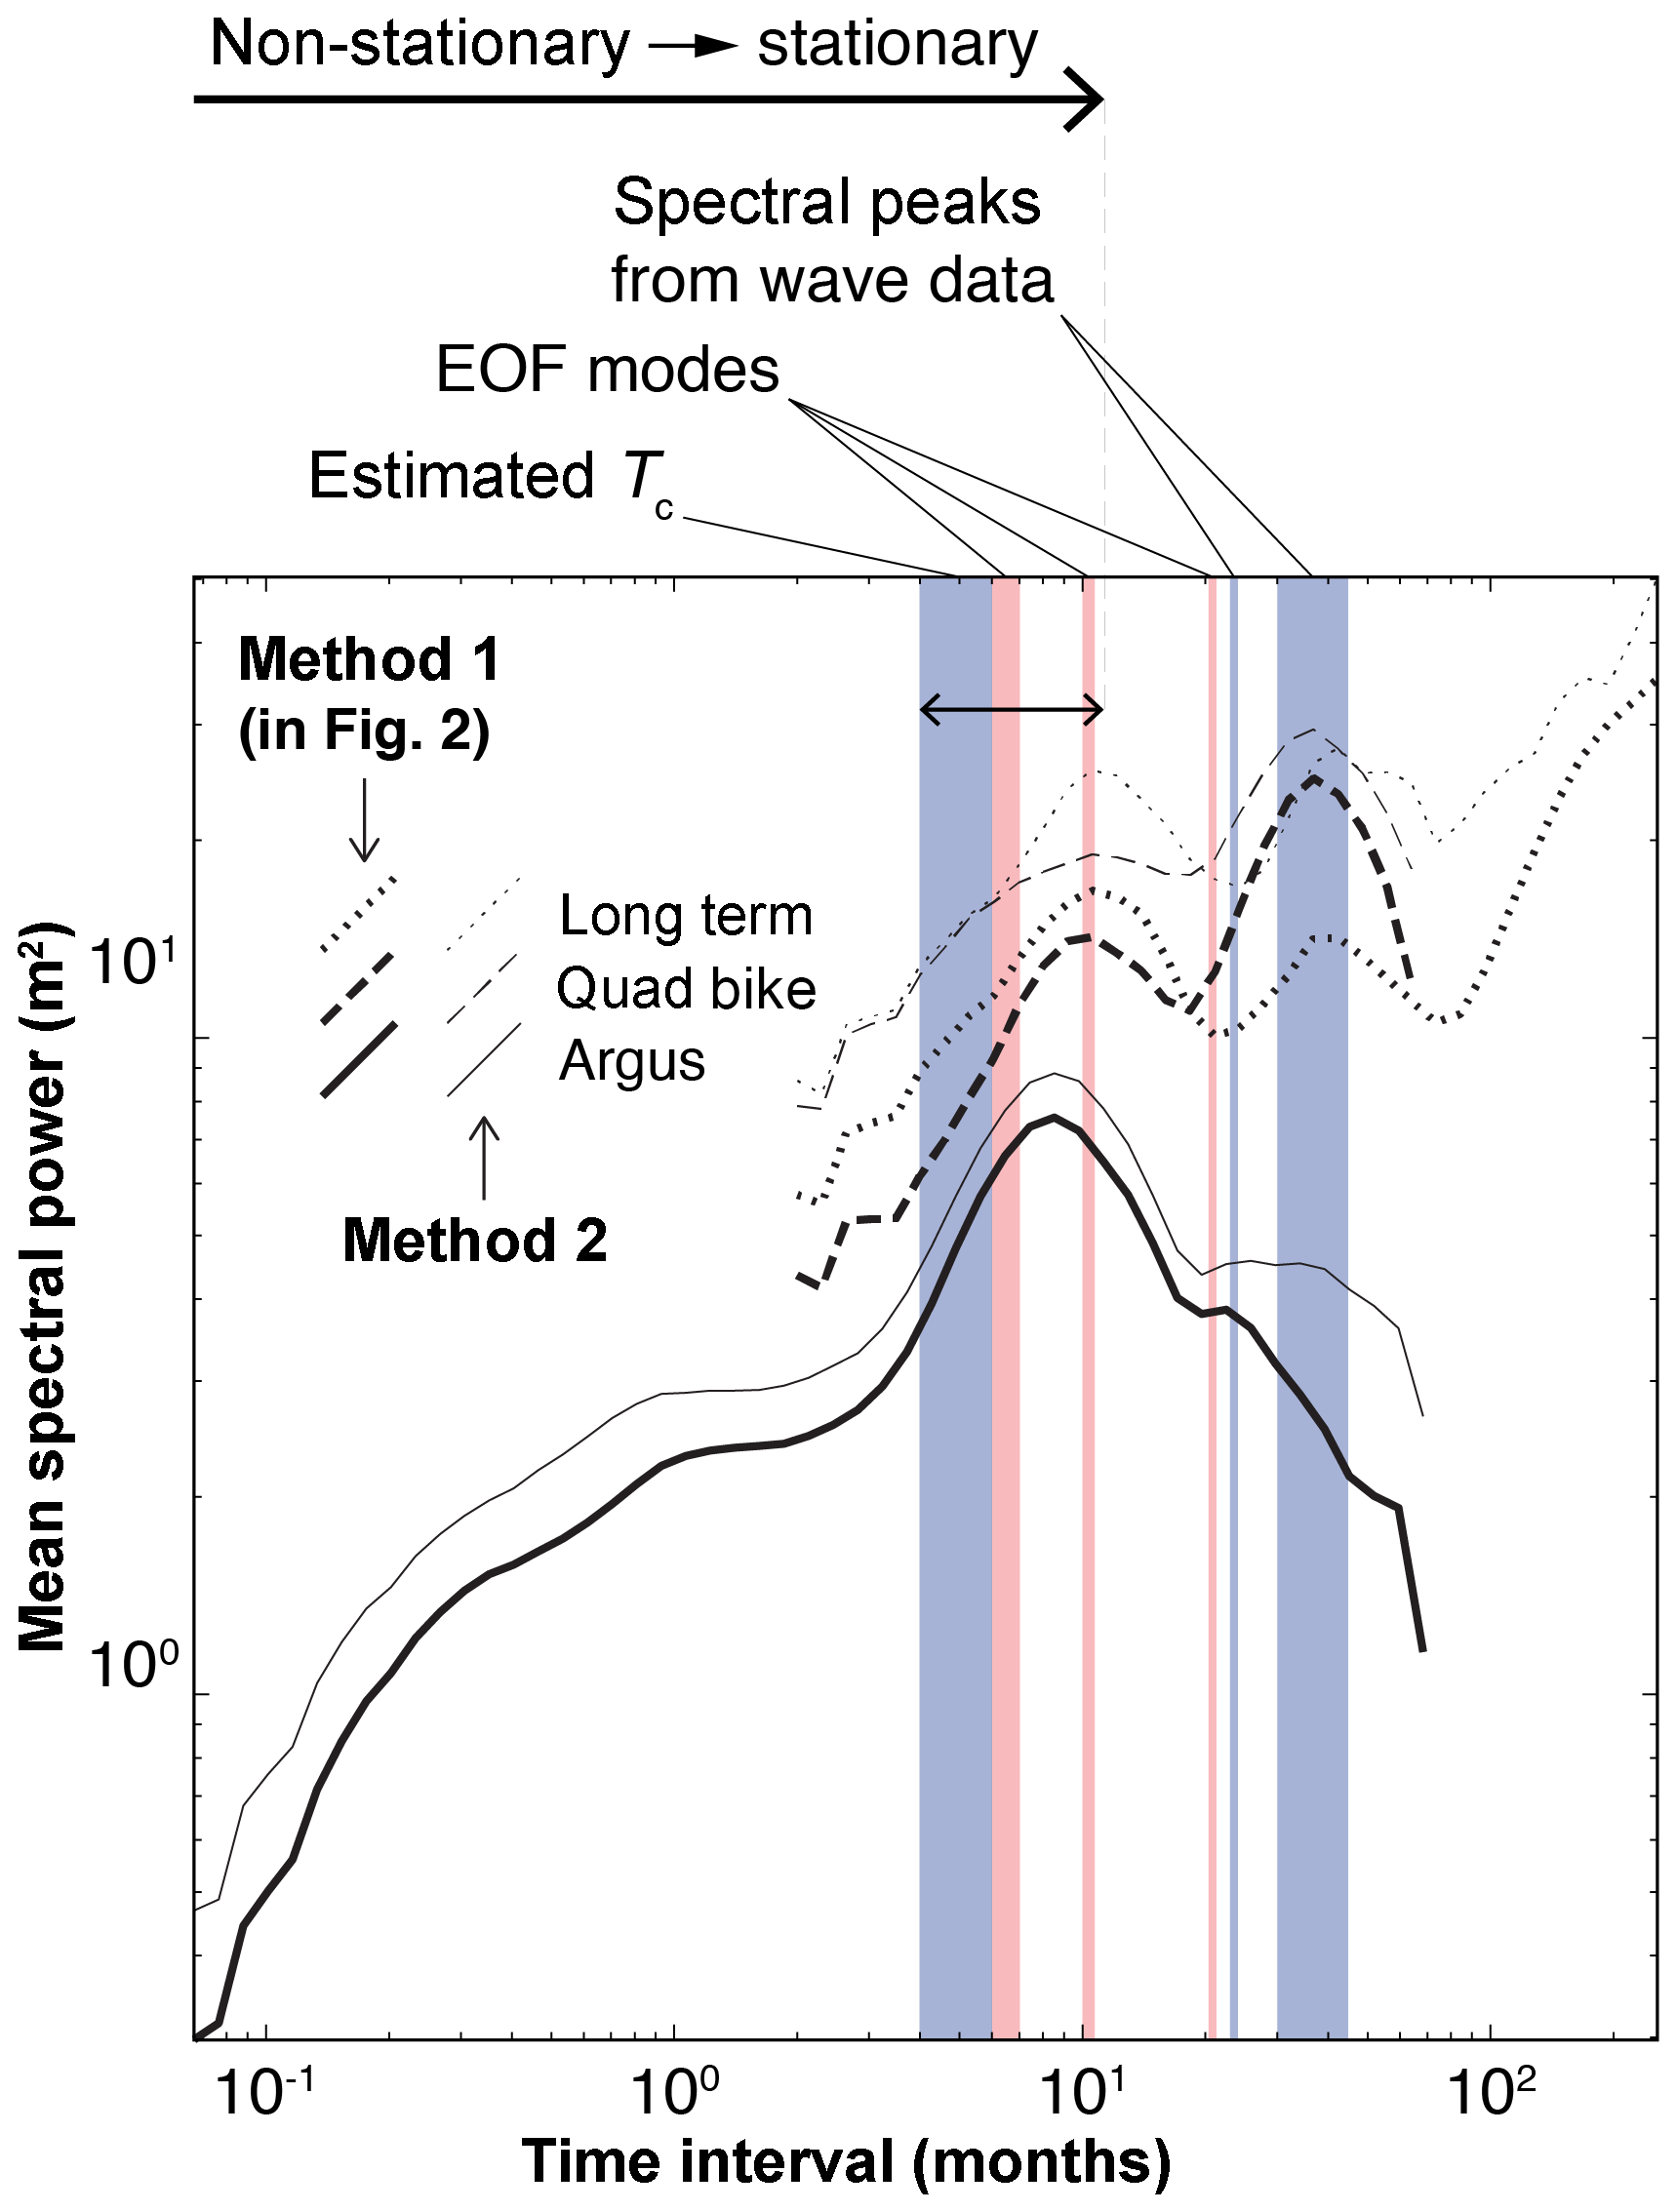
Figure 4Compilation of power spectra from shoreline-change data in relation to different characteristic timescales for environmental forcing (blue/dark bars) and intrinsic physical processes (red/light bars). Thick black lines indicate power spectra shown in Fig. 2d, derived from the alongshore median absolute value of shoreline change through time (“method 1”). Thin grey lines show the median spectral densities of power spectra of shoreline change through time (detrended, absolute value) at each position alongshore for the three survey types (“method 2”), shown in Fig. S1. We plot them together here to demonstrate their comparability. Double-ended arrow indicates transition zone in the spectral density from non-stationary to stationary by a temporal interval on the order of ∼101 months.
Table 1Compilation of characteristic timescales in Figs. 2 and 4.

However, the collective effect of these various and variable characteristic timescales is to make storm-driven perturbations difficult to isolate in sparsely sampled records of shoreline change. If cross-shore beach recovery is rapid – that is, if most of the sediment shifted off a beach during a storm is stored in a nearshore bar and then swept back onshore in a matter of days to weeks afterward (Birkemeier, 1979; List et al., 2006; Phillips et al., 2017), then the magnitude of shoreline change driven by a storm event may appear damped even in a monthly survey of beach position. When such large fluctuations are so ephemeral, only high-frequency sampling can hope to capture their fullest extents (Splinter et al., 2013; Phillips et al., 2017). And even then, nearshore beach dynamics may still ultimately obscure the magnitude of direct environmental forcing because of the complex transformation that offshore wave energy undergoes across the surf zone (Plant et al., 2006; Coco et al., 2014).
Intrinsic timescales for behavioural modes of beach change along open coastlines may be different from those for embayed settings. Where alongshore spatial scales are large (∼101–102 km), the cumulative, diffusive effect of alongshore sediment transport is an especially effective shredder (Lazarus et al., 2011a, 2012). Ratliff and Murray (2014) suggest that the diffusive scaling evident in their modelling results implies that characteristic timescales increase nonlinearly with embayment length alongshore. They list other factors that could likewise change the characteristic timescales, such as wave height, sediment type, and the aspect ratio of headlands relative to the bay (which would affect local wave height through wave shadowing). Broadly posed, where the influence of alongshore sediment transport is significant and the beach system is “open” (rather than “closed” by headlands that make sand a conserved quantity), then the longer the beach, the more effective the system will be at shredding high-frequency signals. Were the same high-resolution spatio-temporal data available for ∼104 m of open sandy coastline as they are for Narrabeen–Collaroy, a comparable analysis might highlight a series of progressively larger characteristic timescales for reversing erosion hotspots, alongshore sand waves, and fluctuations in alongshore curvature (List et al., 2006; Lazarus and Murray, 2007, 2011; Lazarus et al., 2011a, 2012). Signal shredding may be strongest when coupled to human manipulations of natural shoreline behaviour (McNamara and Werner, 2008a, b; Williams et al., 2013; Lazarus et al., 2011b, 2016).
In an ideal source-to-sink sedimentary system with perfect storage, output flux would be faithfully recorded in the sink stratigraphy. The majority of work in morphodynamic turbulence and signal shredding comes from efforts to puzzle out what information stratigraphic records do and do not convey about environmental forcing (Paola et al., 2018). For beach systems, that may mean large forcing events like major coastal storms, even when we can record their effects, probably tell us less about the dynamics of long-term shoreline change – and vice versa – than we would wish to know. Empirical evidence of signal shredding in the shoreline-position data from the Narrabeen–Collaroy system demonstrates how, and suggests why, signatures of individual storm impacts can be obscured or erased in long-term observational records, even those recorded at a reasonably high temporal resolution. Jerolmack and Paola (2010) recommend using controlled experiments to gain vital mechanistic insight into morphodynamic turbulence. Here, the effects of system size, input flux, the magnitudes of major disturbance events and potential resonant amplification (T≈Tc) could be tested systematically across a broad parameter space for coastal systems. In exploring the dynamics of signal shredding, controlled experiments would also illuminate characteristic timescales for fundamental processes of sediment transport in coastal environments.
See Turner et al. (2016) for a detailed description of datasets for the Narrabeen–Collaroy system. Data are available at http://narrabeen.wrl.unsw.edu.au/download/narrabeen/ (UNSW Australia Water Research Laboratory, 2019).
The supplement related to this article is available online at: https://doi.org/10.5194/esurf-7-77-2019-supplement.
EDL conceived the idea and conducted the analysis. MDH and ILT provided processed data. All authors (EDL, MDH, CEB, and ILT) contributed to the data interpretation and to writing the manuscript.
The authors declare that they have no conflict of interest.
Eli D. Lazarus thanks Andrew Ashton and Dylan McNamara for discussions about signal shredding
in shoreline data, dating back to the publication of Jerolmack and Paola (2010). This work was supported by funding (to Eli D. Lazarus) from the NERC BLUEcoast
project (NE/N015665/2) and a University of Southampton Global Partnerships
Award. Since 2004, the ongoing beach monitoring program at
Narrabeen–Collaroy has been funded by the Australian Research Council
(Discovery and Linkage), Warringah and Northern Beaches Councils, the NSW Office
of Environment and Heritage (OEH), the SIMS foundation, and the UNSW Faculty of
Engineering (see Turner et al., 2016). We are grateful to Katherine Ratliff, Andrew Ashton, and an anonymous reviewer for constructive comments that improved
the paper.
Edited by: Sebastien Castelltort
Reviewed by: Katherine Ratliff and one anonymous referee
Anderson, T. R., Frazer L. N., and Fletcher C. H.: Transient and persistent shoreline change from a storm, Geophys. Res. Lett., 37, L08401, https://doi.org/10.1029/2009GL042252, 2010.
Aubrey, D. G.: Seasonal patterns of onshore-offshore sediment movement, J. Geophys. Res., 84, 6347–6354, 1979.
Barnard, P. L., Short, A. D., Harley, M. D., Splinter, K. D., Vitousek, S., Turner, I. L., Allen, J., Banno, M., Bryan, K. R., Doria, A., Hansen, J. E., Kato, S., Kuriyama, Y., Randall-Goodwin, E., Ruggiero, P., Walker, I. J., and Heathfield, D. K.: Coastal vulnerability across the Pacific dominated by El Niño/Southern Oscillation, Nat. Geosci., 8, 801–807, 2015.
Binder, G., Tardu, S., and Vezin, P.: Cyclic modulation of Reynolds stresses and length scales in pulsed turbulent channel flow, P. Roy. Soc. Lond. A, 451, 121–139, 1995.
Birkemeier, W. A.: The effects of the 19 December 1977 coastal storm on beaches in North Carolina and New Jersey, USACE Coastal Engineering Research Center, Duck, North Carolina, USA, 1979.
Brooks, S. M., Spencer, T., McIvor, A., and Möller, I: Reconstructing and understanding the impacts of storms and surges, southern North Sea, Earth Surf. Proc. Land., 41, 855–864, 2016.
Burvingt, O., Masselink, G., Russell, P., and Scott, T.: Classification of beach response to extreme storms, Geomorphology, 295, 722–737, 2017.
Cadot, O., Titon, J. H., and Bonn, D.: Experimental observation of resonances in modulated turbulence, J. Fluid Mech., 485, 161–170, 2003.
Choowong, M., Phantuwongraj, S., Charoentitirat, T., Chutakositkanon, V., Yumuang, S., and Charusiri, P.: Beach recovery after 2004 Indian Ocean tsunami from Phang-nga, Thailand, Geomorphology, 104, 134–142, 2009.
Clarke, D. J. and Eliot, I.: Description of littoral, alongshore sediment movement from empirical eigen-function analysis, J. Geol. Soc. Aust., 29, 327–341, 1982.
Coco, G., Senechal, N., Rejas, A., Bryan, K. R., Capo, S., Parisot, J. P., Brown, J. A., and MacMahan, J. H. M.: Beach response to a sequence of extreme storms, Geomorphology, 204, 493–501, 2014.
Dail, H. J., Merrifield, M. A., and Bevis, M.: Steep beach morphology changes due to energetic wave forcing, Mar. Geol., 162, 443–458, https://doi.org/10.1016/S0025-3227(99)00072-9, 2000.
Donnelly, J. P. and Woodruff, J. D.: Intense hurricane activity over the past 5,000 years controlled by El Niño and the West African monsoon, Nature, 447, 465–468, 2007.
Douglas, B. C. and Crowell, M.: Long-term shoreline position prediction and error propagation, J. Coastal Res., 16, 145–152, 2000.
Egense, A. K.: Southern California beach changes in response to extraordinary storm, Shore and Beach, 57, 14–17, 1989.
Emanuel, K. A.: Downscaling CMIP5 climate models shows increased tropical cyclone activity over the 21st century, P. Natl. Acad. Sci. USA, 110, 12219–12224, 2013.
Fenster, M. S., Dolan, R., and Morton, R. A.: Coastal storms and shoreline change: signal or noise?, J. Coastal Res., 17, 714–720, 2001.
Frette, V., Christensen, K., Malthe-Sorenssen, A., and Feder, J.: Avalanche dynamics in a pile of rice, Nature, 379, 49–52, 1996.
Frisch, U. and Kolmogorov, A. N.: Turbulence: The legacy of A. N. Kolmogorov, Cambridge Univ. Press, Cambridge, UK, 1995.
Harley, M. D.: Coastal storm definition, in: Coastal Storms: Processes and Impacts, edited by: Ciavola, P. and Coco, G., John Wiley and Sons, Chichester, UK, 1–21, 2017.
Harley, M. D. and Turner, I. L.: A simple data transformation technique for pre-processing survey data at embayed beaches, Coast. Eng., 55, 63–68, 2008.
Harley, M. D., Turner, I. L., Short, A. D., and Ranasinghe, R.: An empirical model of beach response to storms – SE Australia, in: Coasts and Ports 2009: In a Dynamic Environment (Engineers Australia), Wellington, New Zealand, 600–606, 2009.
Harley, M. D., Turner, I. L., Short, A. D., and Ranasinghe, R.: A reevaluation of coastal embayment rotation: The dominance of cross-shore versus alongshore sediment transport processes, Collaroy-Narrabeen Beach, southeast Australia, J. Geophys. Res.-Earth, 116, F04033, https://doi.org/10.1029/2011JF001989, 2011a.
Harley, M. D., Turner, I. L., Short, A. D., and Ranasinghe, R.: Assessment and integration of conventional, RTK-GPS and image-derived beach survey methods for daily to decadal coastal monitoring, Coast. Eng., 58, 194–205, 2011b.
Harley, M. D., Turner, I. L., and Short, A. D.: New insights into embayed beach rotation: The importance of wave exposure and cross-shore processes, J. Geophys. Res.-Earth, 120, 1470–1484, 2015.
Herbich, J. B.: Handbook of Coastal Engineering, McGraw-Hill, New York, USA, 2000.
Honeycutt, M. G., Crowell, M., and Douglas, B. C.: Shoreline-position forecasting: impact of storms, rate-calculation methodologies, and temporal scales, J. Coastal Res., 17, 721–730, 2001.
Houser, C. and Hamilton, S.: Sensitivity of post-hurricane beach and dune recovery to event frequency, Earth Surf. Proc. Land., 34, 613–628, 2009.
Hsu, T. W., Ou, S. H., and Wang, S. K.: On the prediction of beach changes by a new 2-D empirical eigenfunction model, Coast. Eng., 23, 255–270, https://doi.org/10.1016/0378-3839(94)90005-1, 1994.
Jerolmack, D. J. and Paola, C.: Shredding of environmental signals by sediment transport, Geophys. Res. Lett., 37, L19401, https://doi.org/10.1029/2010GL044638, 2010.
Lazarus, E. D. and Murray, A. B.: Process signatures in regional patterns of shoreline change on annual to decadal time scales, Geophys. Res. Lett., 34, L19402, https://doi.org/10.1029/2007GL031047, 2007.
Lazarus, E. D. and Murray, A. B.: An integrated hypothesis for regional patterns of shoreline change along the Northern North Carolina Outer Banks, USA, Mar. Geol., 281, 85–90, 2011.
Lazarus, E., Ashton, A., Murray, A. B., Tebbens, S., and Burroughs, S.: Cumulative versus transient shoreline change: Dependencies on temporal and spatial scale, J. Geophys. Res.-Earth, 116, F02014, https://doi.org/10.1029/2010JF001835, 2011a.
Lazarus, E. D., McNamara, D. E., Smith, M. D., Gopalakrishnan, S., and Murray, A. B.: Emergent behavior in a coupled economic and coastline model for beach nourishment, Nonlin. Processes Geophys., 18, 989–999, https://doi.org/10.5194/npg-18-989-2011, 2011b.
Lazarus, E. D., Ashton, A. D., and Murray, A. B.: Large-scale patterns in hurricane-driven shoreline change, in: Extreme events and natural hazards: the complexity perspective, edited by: Sharma, A. S., Bunde, A., Dimri, V. P., and Baker, D. N., AGU Geophysical Monograph Series, 196, 127–138, 2012.
Lazarus, E. D., Ellis, M. A., Murray, A. B., and Hall, D. M.: An evolving research agenda for human–coastal systems, Geomorphology, 256, 81–90, 2016.
Lentz, E. E., Hapke, C. J., Stockdon, H. F., and Hehre, R. E.: Improving understanding of near-term barrier island evolution through multi-decadal assessment of morphologic change, Mar. Geol., 337, 125–139, 2013.
List, J. H., Farris, A. S., and Sullivan, C.: Reversing storm hotspots on sandy beaches: spatial and temporal characteristics, Mar. Geol., 226, 261–279, 2006.
Masselink, G. and van Heteren, S.: Response of wave-dominated and mixed-energy barriers to storms, Mar. Geol., 352, 321–347, 2014.
Masselink, G., Castelle, B., Scott, T., Dodet, G., Suanez, S., Jackson, D., and Floc'h, F.: Extreme wave activity during 2013/2014 winter and morphological impacts along the Atlantic coast of Europe, Geophys. Res. Lett., 43, 2135–2143, 2016.
McNamara, D. E. and Werner, B. T.: Coupled barrier island–resort model: 1. Emergent instabilities induced by strong human-landscape interactions, J. Geophys. Res.-Earth, 113, F01016, https://doi.org/10.1029/2007JF000840, 2008a.
McNamara, D. E. and Werner, B. T.: Coupled barrier island–resort model: 2. Tests and predictions along Ocean City and Assateague Island National Seashore, Maryland, J. Geophys. Res.-Earth, 113, F01017, https://doi.org/10.1029/2007JF000841, 2008b.
Morton, R. A., Paine, J. G., and Gibeaut, J. C.: Stages and durations of post-storm beach recovery, southeastern Texas coast, USA, J. Coastal Res., 10, 884–908, 1994.
Paola, C., Ganti, V., Mohrig, D., Runkel, A. C., and Straub, K. M.: Time not our time: Physical controls on the preservation and measurement of geologic time, Annu. Rev. Earth Pl. Sc., 46, 409–438, 2018.
Phillips, M. S., Harley, M. D., Turner, I. L., Splinter, K. D., and Cox, R. J.: Shoreline recovery on wave-dominated sandy coastlines: the role of sandbar morphodynamics and nearshore wave parameters, Mar. Geol., 385, 146–159, 2017.
Plant, N. G., Holland, K. T., and Holman, R. A.: A dynamical attractor governs beach response to storms, Geophys. Res. Lett., 33, L17607, https://doi.org/10.1029/2006GL027105, 2006.
Ramirez, J. A., Baird, A. J., Coulthard, T. J., and Waddington, J. M.: Ebullition of methane from peatlands: Does peat act as a signal shredder? Geophys. Res. Lett., 42, 3371–3379, 2015.
Ranasinghe, R., McLoughlin, R., Short, A., and Symonds, G.: The Southern Oscillation Index, wave climate, and beach rotation, Mar. Geol., 204, 273–287, 2004.
Ratliff, K. M. and Murray, A. B.: Modes and emergent time scales of embayed beach dynamics, Geophys. Res. Lett., 41, 7270–7275, 2014.
Romans, B. W., Castelltort, S., Covault, J. A., Fildani, A., and Walsh, J. P.: Environmental signal propagation in sedimentary systems across timescales, Earth-Sci. Rev., 153, 7–29, 2016.
Scott, T., Masselink, G., O'Hare, T., Saulter, A., Poate, T., Russell, P., Davidson, M., and Conley, D.: The extreme 2013/2014 winter storms: Beach recovery along the southwest coast of England, Mar. Geol., 382, 224–241, 2016.
Short, A. D. and Trembanis, A. C.: Decadal scale patterns in beach oscillation and rotation Narrabeen Beach, Australia: time series, PCA and wavelet analysis, J. Coastal Res., 20, 523–532, 2004.
Singh, A., Fienberg, K., Jerolmack, D. J., Marr, J., and Foufoula-Georgiou, E.: Experimental evidence for statistical scaling and intermittency in sediment transport rates, J. Geophys. Res.-Earth, 114, F01025, https://doi.org/10.1029/2007JF000963, 2009.
Splinter, K. D., Turner, I. L., and Davidson, M. A.: How much data is enough? The importance of morphological sampling interval and duration for calibration of empirical shoreline models, Coast. Eng., 77, 14–27, 2013.
Tamura, T.: Beach ridges and prograded beach deposits as palaeoenvironment records, Earth-Sci. Rev., 114, 279–297, 2012.
Thom, B. G. and Hall, W.: Behaviour of beach profiles during accretion and erosion dominated periods, Earth Surf. Proc. Land., 16, 113–127, 1991.
Turner, I. L., Harley, M. D., Short, A. D., Simmons, J. A., Bracs, M. A., Phillips, M. S., and Splinter, K. D.: A multi-decade dataset of monthly beach profile surveys and inshore wave forcing at Narrabeen, Australia, Scientific Data, 3, 160024, https://doi.org/10.1038/sdata.2016.24, 2016.
UNSW Australia Water Research Laboratory: Narrabeen-Collaroy Beach Survey Program, available at: http://narrabeen.wrl.unsw.edu.au/download/narrabeen/, last access: 17 January 2019.
Williams, Z. C. and Pelletier, J. D.: Self-affinity and surface-area-dependent fluctuations of lake-level time series, Water Resour. Res., 51, 7258–7269, 2015.
Williams, Z. C., McNamara, D. E., Smith, M. D., Murray, A. B., and Gopalakrishnan, S.: Coupled economic-coastline modeling with suckers and free riders, J. Geophys. Res.-Earth, 118, 887–899, 2013.
Winant, C. D., Inman, D. L., and Nordstrom, C. E.: Description of seasonal beach changes using empirical eigenfunctions, J. Geophys. Res., 80, 1979–1986, 1975.
Zhang, K., Douglas, B., and Leatherman, S.: Do storms cause long-term beach erosion along the US East Barrier Coast?, J. Geol., 110, 493–502, 2002.
signal shredding– when sediment transport erases any signature of outside driving forces. Our results suggest that major storm impacts may tell us little about long-term shoreline change and vice versa.