the Creative Commons Attribution 4.0 License.
the Creative Commons Attribution 4.0 License.
 | 23 Oct 2020
Ice sheet and palaeoclimate controls on drainage network evolution: an example from Dogger Bank, North Sea
David M. Hodgson
Natasha L. M. Barlow
Jonathan L. Carrivick
Carol J. Cotterill
Janet C. Richardson
Ruza F. Ivanovic
Claire L. Mellett
Submerged landscapes on continental shelves archive drainage networks formed during periods of sea-level lowstand. The evolution of these postglacial drainage networks also reveals how past climate changes affected the landscape. Ice-marginal and paraglacial drainage networks on low-relief topography are susceptible to reorganisation of water supply, forced by ice-marginal rearrangement, precipitation and temperature variations, and marine inundation. A rare geological archive of climate-driven landscape evolution during the transition from ice-marginal (ca. 23 ka) to a fully submerged marine environment (ca. 8 ka) is preserved at Dogger Bank, in the southern North Sea.
In this study, our analysis of high-resolution seismic reflection and cone penetration test data reveal a channel network over a 1330 km2 area that incised glacial and proglacial lake-fill sediments. The channel network sits below coastal and shallow marine sediments and is therefore interpreted to represent a terrestrial drainage network. When mapped out, the channel form morphology reveals two distinct sets. The first set comprises two low-sinuosity, wide (>400 m) channels that contain macroforms of braid and side bars. These channels are interpreted to have originated as proglacial rivers, which drained the ice-sheet margin to the north. The second set of channels (75–200 m wide, with one larger, ∼400 m wide) has higher sinuosity and forms a subdendritic network of tributaries to the proglacial channels.
The timing of channel formation lacks chronostratigraphic control. However, the proglacial rivers must have formed as the ice sheet was still on Dogger Bank, before 23 ka, to supply meltwater to the rivers. Ice-sheet retreat from Dogger Bank led to reorganisation of meltwater drainage and abandonment of the proglacial rivers. Palaeoclimate simulations show a cold and dry period at Dogger Bank between 23 and 17 ka. After 17 ka, precipitation increased, and drainage of precipitation formed the second set of channels. The second set of rivers remained active until marine transgression of Dogger Bank at ca. 8.5–8 ka. Overall, this study provides a detailed insight into the evolution of river networks across Dogger Bank and highlights the interplay between external (climate) and internal (local) forcings in drainage network evolution.
- Article
(30412 KB) - Full-text XML
- BibTeX
- EndNote


Postglacial drainage patterns in the North Sea have become a focus of interest in recent years since the growth in archaeological exploration of the submerged landscapes of the northwest European continental shelf (Bailey et al., 2017; Coles, 1998; Flemming et al., 2017). The adoption of seismic reflection data acquired for oil and gas exploration by the archaeological community has allowed mapping of extensive terrestrial drainage networks throughout the southern North Sea (Fitch et al., 2005; Gaffney et al., 2007, 2009; Hepp et al., 2017, 2019; van Heteren et al., 2014; Prins and Andresen, 2019; Tappin et al., 2011). These subsurface mapping projects focused on rivers as they are likely sites of human occupation. Core- and sediment-based palaeoenvironmental research has augmented seismic mapping studies (Brown et al., 2018; Gearey et al., 2017; Tappin et al., 2011) and put human–landscape interaction into the wider context of Late Quaternary landscape evolution of the North Sea during a period of changing climate (Bicket et al., 2016; Bicket and Tizzard, 2015; Phillips et al., 2017; Tizzard et al., 2014).
Previous explorations of submerged landscapes have used low-resolution 2D or 3D seismic reflection surveys designed to target deeper oil and gas reservoirs (Fitch et al., 2005; Gaffney et al., 2007, 2009) or combine oil and gas datasets with sparse high-resolution 2D seismic reflection data (Coughlan et al., 2018; Hepp et al., 2017, 2019; Prins and Andresen, 2019). Whilst this enables drainage networks to be identified, there is little information to constrain sedimentary and geomorphic processes and therefore the controls on landscape evolution. The availability of new, high-resolution datasets from wind-farm site investigation allows more detailed investigation of shallower submerged landscapes (Cotterill et al., 2012, 2017a). Dogger Bank is covered by a large (1500 km2), 2D seismic reflection data grid and geotechnical logs acquired as a site investigation for the Forewind wind-farm projects.
The evolution of the terrestrial landscape of Dogger Bank over 10 kyr timescales, during a period of marked climate and far-field base-level change, has mainly focused on glacial (Cotterill et al., 2017b; Emery et al., 2019a; Phillips et al., 2018) and coastal stratigraphy (Emery et al., 2019a). Prins and Andresen (2019) established a transition from subglacial channel to terrestrial drainage in a study area 150 km northeast of Dogger Bank, but detail of the terrestrial landscape evolution at Dogger Bank during and after ice-sheet retreat has yet to be established. Furthermore, the link between external, climatic changes at Dogger Bank and the internal processes of drainage reorganisation, such as river piracy (Bishop, 1995; Shugar et al., 2017) and landscape evolution, is explored for the first time in this study with the integration of palaeoclimate model simulations.
In this study, our aim is to describe in detail the timing and processes of formation of channel networks observed in the seismic reflection data using stratigraphic relationships, alongside palaeoclimate model simulations, to identify changes in temperature and precipitation at Dogger Bank. We identify, for the first time, the evolution of a low-gradient terrestrial drainage network on the low-relief topography at Dogger Bank under changing climate and global mean sea-level rise. We explore the role of ice-sheet meltwater and subsequent precipitation changes in forming a well-developed channel network on a land surface with low topographic relief. This regional picture of changing drainage patterns in the North Sea during the Late Pleistocene and Holocene has implications for human populations and migration during this period of climatic warming and global mean sea-level rise.
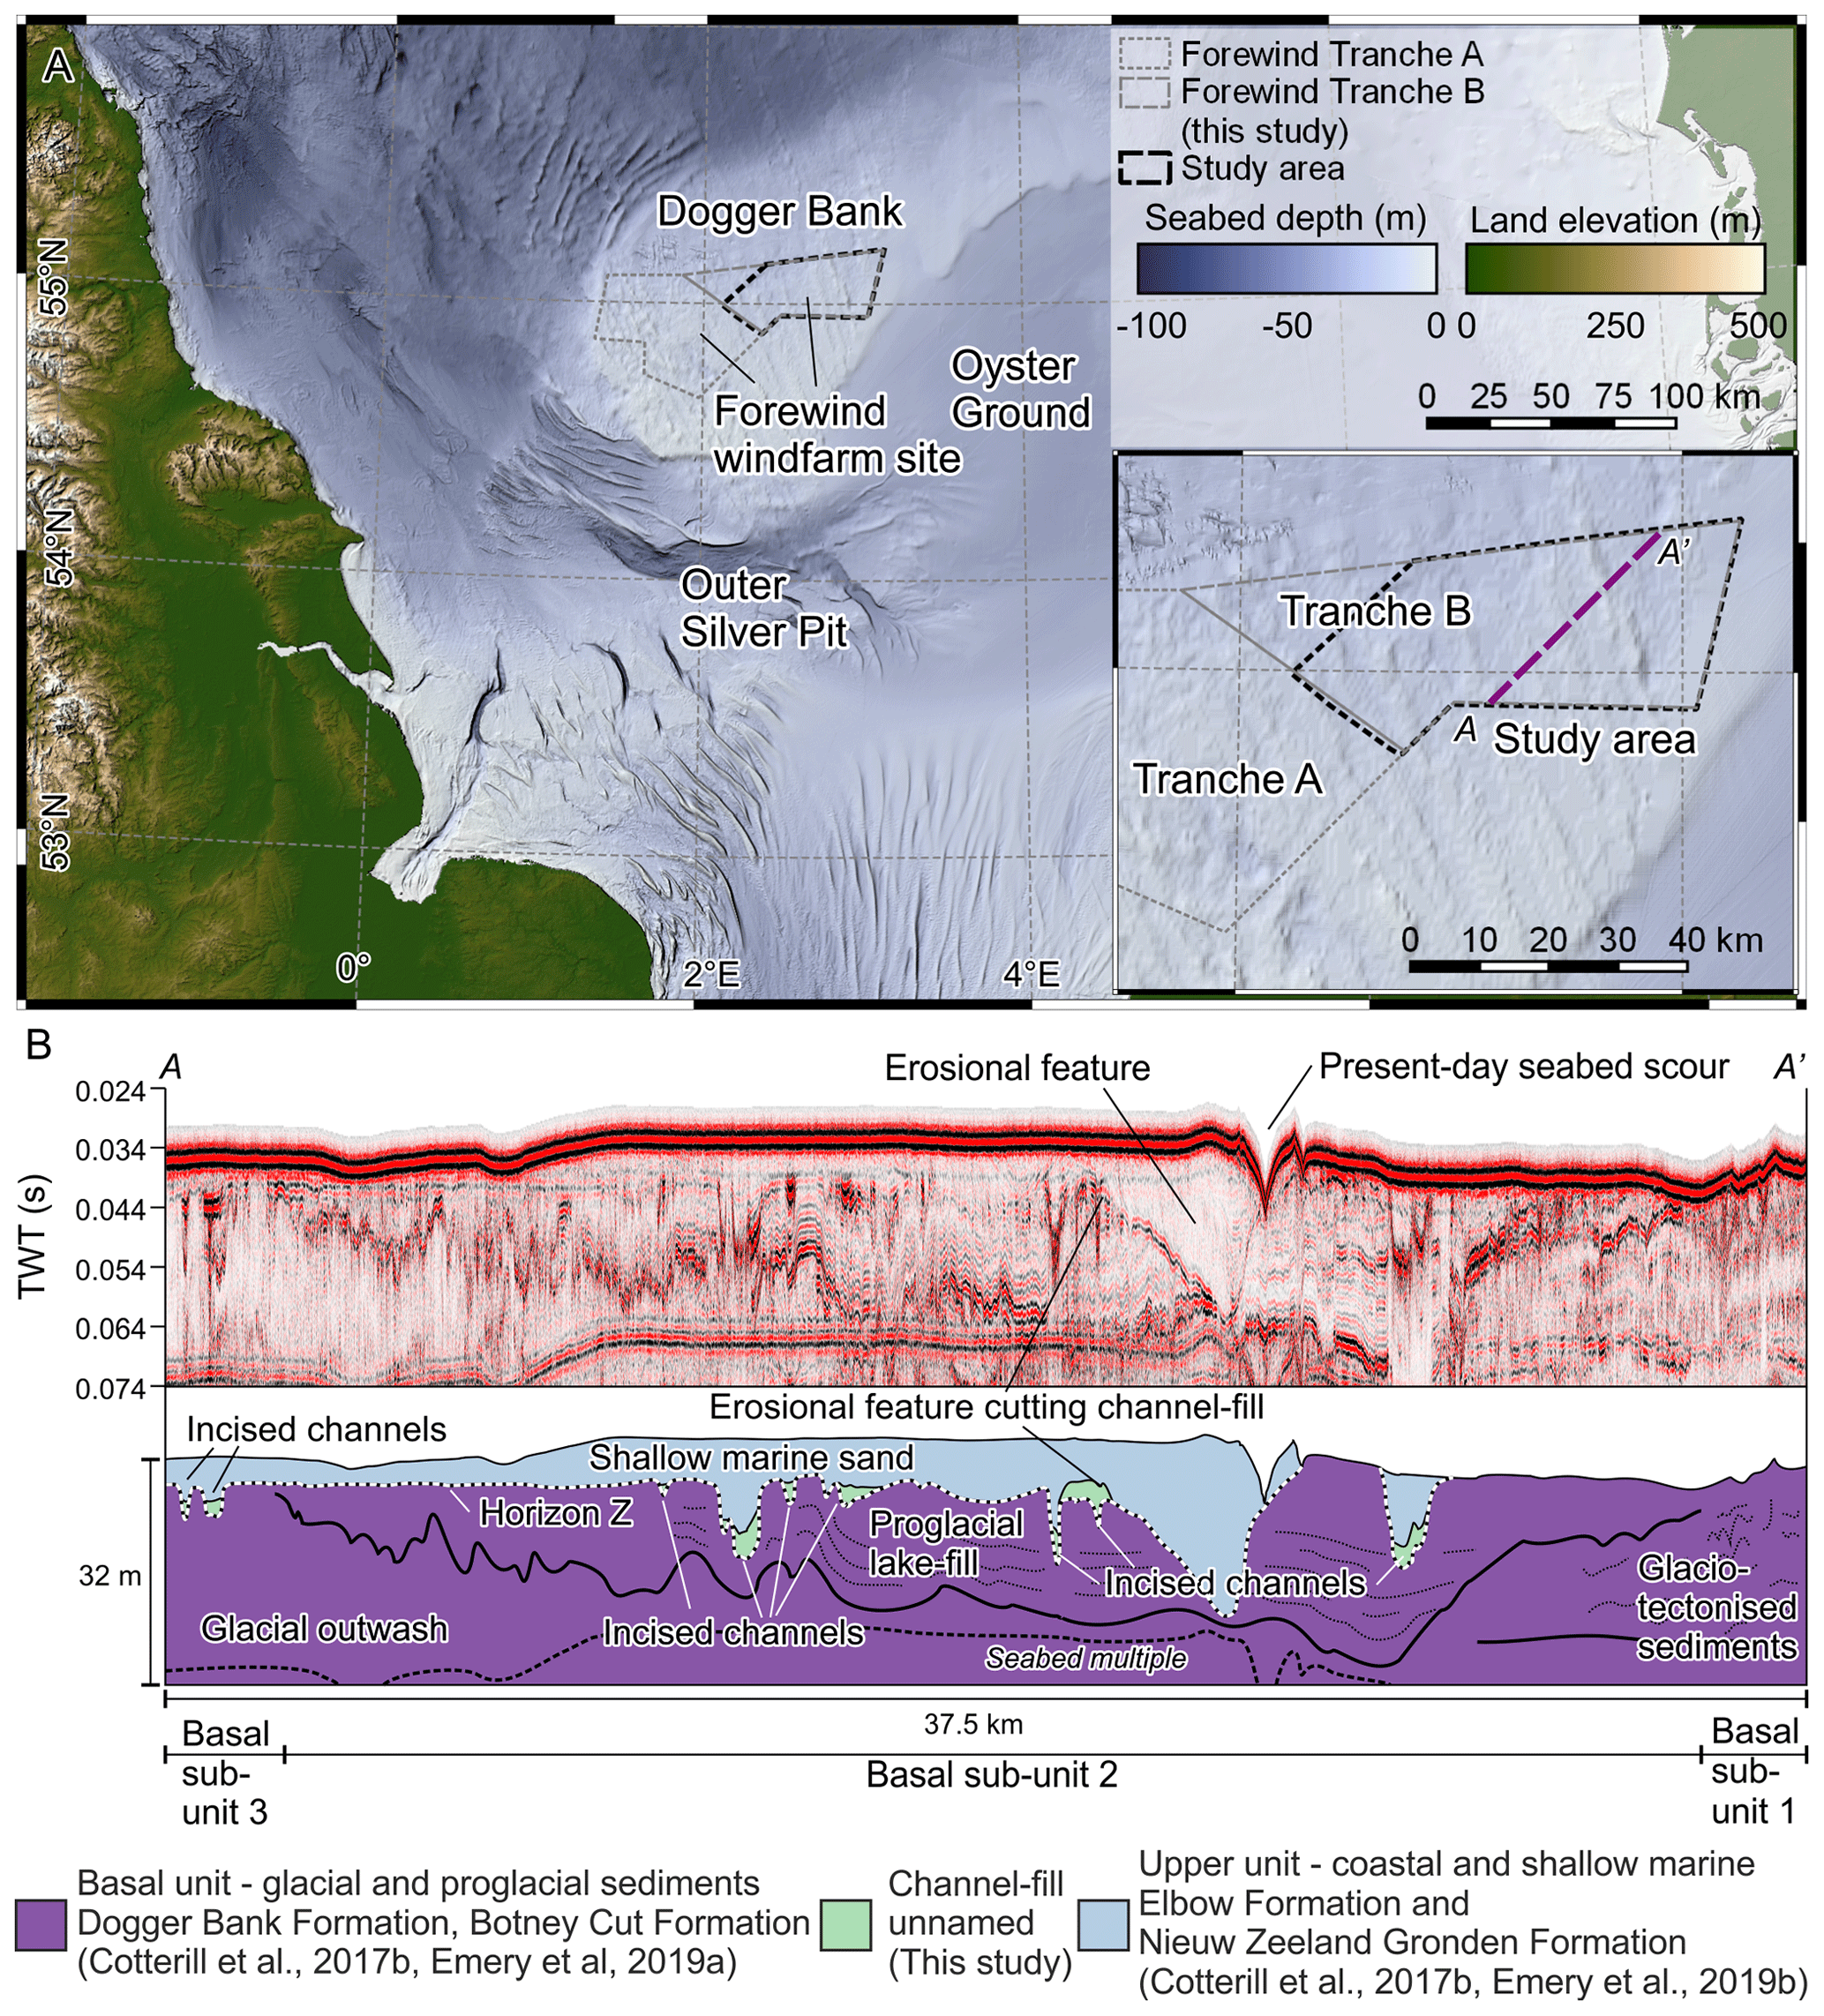
Figure 1(a) Location of the study area and other geographical features of the southern North Sea basin. (b) Seismic section showing the stratigraphic architecture established in previous studies (Cotterill et al., 2017b; Emery et al., 2019a, b), with the incised channels and Horizon Z observed in this study.
Dogger Bank, in the southern North Sea (Fig. 1), is a present-day bathymetric high (15–30 m b.m.s.l. – below mean sea level) surrounded by deeper water (>50 m b.m.s.l.). Site investigations for wind-farm construction on Dogger Bank (Fig. 1) have provided a wealth of high-resolution 2D seismic reflection data and geotechnical boreholes, split into two tranches: A and B. Tranche B is the focus of this study (Fig. 1). Dogger Bank comprises a stratigraphically complex archive of environmental change from at least the last interglacial period (Marine Isotope Stage (MIS) 5e, ca. 125 ka) through to the present day (Cameron et al., 1987, 1992; Cotterill et al., 2017b; Gibbard et al., 1991). The onset of glaciation at Dogger Bank was likely to have been during MIS 3, around 30 ka (Carr et al., 2006; Clark et al., 2012; Hughes et al., 2016; Phillips et al., 2017; Roberts et al., 2018; Sejrup et al., 2000), with Dogger Bank fully deglaciated before approximately 23 (±2) ka (Emery et al., 2019a; Roberts et al., 2018). A large proglacial lake was present during deglaciation, which initially filled with sediment and then was subaerially exposed, along with thrust-block moraine complexes and outwash fans, after the ice retreated (Cotterill et al., 2017b; Emery et al., 2019a; Fig. 1). Channels incised into the glaciogenic sediments formed during this period of subaerial exposure (Cotterill et al., 2017b). These channels form part of the extensive networks of post-Last Glacial Maximum North Sea channel fills mapped by the North Sea Palaeolandscape Project (Fitch et al., 2005; Gaffney et al., 2007, 2009) and other studies (Cameron et al., 1987; Coughlan et al., 2018; Hepp et al., 2017, 2019; van Heteren et al., 2014; Hijma et al., 2012; Prins and Andresen, 2019; Salomonsen, 1993). The channel network was buried during subsequent marine transgression which began at around 10 ka at Dogger Bank, with complete inundation occurring around 8.5–8 ka (Brooks et al., 2011; Emery et al., 2019b; Shennan et al., 2000; Sturt et al., 2013). Shallow marine sand, varying in thickness from 0 m up to 25 m, was then deposited during the Late Holocene (Cotterill et al., 2017b; Emery et al., 2019b).The stratigraphy provides an archive of the transition from MIS 5 marine sediments, through to glacial and terrestrial environments, followed by a return to marine conditions during MIS 1, 11.7 ka to present (Cotterill et al., 2017a, b; Emery et al., 2019a, b; Phillips et al., 2018). These new high-resolution data have helped to constrain the timing and extent of glaciation and subsequent landscape evolution at Dogger Bank. From oldest to youngest, the lithostratigraphic formations encountered in the study area belong to the Dogger Bank formation (glaciotectonised and glacial outwash sediments), the Botney Cut formation (proglacial lake-fill sediments, an unnamed formation (the channel fills), and the Nieuw Zeeland Gronden Formation (shallow marine sand; Cotterill et al., 2017b; Emery et al., 2019a; Stoker et al., 2011).
A large, integrated subsurface dataset of 2D seismic reflection profiles and geotechnical logs acquired for site investigation of Tranche B of the Forewind wind-farm project (Fig. 1) was used in this study.
3.1 Seismic reflection data and interpretation
A dense, 2D grid of shallow, single-channel seismic reflection data was available to this study, totalling 17 000 line kilometres in Tranche B (Cotterill et al., 2017b); 629 NE–SW-oriented lines (mainlines) are spaced at 100 m intervals, and 75 NW–SE-oriented lines (crosslines) are spaced at 500–1000 m intervals. Two ships were used, employing the same 1.6 kJ sparker source. Data were recorded in StrataView, then imported to ProMAX for processing, where a bandpass filter with a 100 Hz low cut and an 800 Hz high cut was applied, followed by F–k filtering and time migration, then exported to SEG-Y. The sparker source has a maximum vertical resolution of approximately 1.25 ms, which gives a vertical resolution of ∼1 m at 1600 m s−1 in the shallow section. Reflections are resolvable until 180 ms (∼150 m), below which the signal becomes too weak to resolve.
Seismic reflection data were interpreted using IHS Kingdom Suite. Maps were generated from interpreting seismic grid lines in two-way time (TWT). P-wave velocities derived from local geotechnical data were used to convert TWT to depth (Cotterill et al., 2017a). Seawater velocity was taken to be 1505 m s−1, and a sediment velocity of 1600 m s−1 was used (Cotterill et al., 2017a). Seismic horizons were gridded to maps with a 10 m grid square using the flex gridding algorithm in Kingdom Suite, then exported to QGIS for interpretation and display. A 10 m grid was chosen as a compromise to maintain the necessary level of detail from the high horizontal resolution (0.73 m at 1600 m s−1) along the seismic lines whilst maintaining a reasonable correlation between data points on lines spaced at 100 m.
Seismic interpretation was undertaken by identifying distinct seismic facies and major bounding surfaces between them. Seismic facies were identified and named based on Mitchum et al. (1977), with interpretation of glacial sediments using terminology based on Emery et al. (2019a). Seismic facies were correlated to sedimentary facies interpreted from geotechnical logs to establish a seismic stratigraphic framework for the study area. This framework was used to identify the transition from glacial to terrestrial to marine and to map the major bounding surfaces between the different sedimentary environments.
3.2 Geotechnical logs
Eighty-three cone penetration tests (CPTs; Fig. 3), up to 50 m below seabed, were acquired throughout Tranche B (Cotterill et al., 2017b). These tests provide cone resistance (qc) measurements that were used, uncorrected, as a grain-size proxy through the sediments, with low resistance corresponding to clay and high resistance corresponding to sand, as used by Emery et al. (2019a). CPTs were used to calibrate sedimentary information to seismic facies observed in the seismic reflection data to constrain sedimentary environment. CPT depth was converted to TWT by using the sediment velocity of 1600 m s−1.
3.3 Geomorphic interpretation
Channel networks were digitised from the gridded seismic horizon interpretation to polygon shapefiles in QGIS by mapping channel forms where underlying reflections are truncated. Each channel or channel network was ascribed an individual shapefile. Centre lines for each of the channels were digitised as line shapefiles. The shapefiles were projected in WGS84/UTM 31N. Centre-line shapefiles were then imported into a Python script (Grieve, 2020) that measured centre-line length and the straight-line distance from the shapefile start to end from UTM coordinates. These two lengths were used to calculate sinuosity. Centre-line shapefiles were also used to extract the channel base long profiles from the depth-converted seismic horizons. As the seismic horizon was gridded at 10 m long profile points were automatically extracted by the QGIS Profile Tool plugin every 10 m, then visually smoothed to remove effects of seismic line mistie and any interpolation bias.
3.4 Palaeoclimate modelling
Palaeoclimate simulations provide an estimate of changing climate at Dogger Bank since the Last Glacial Maximum. These equilibrium-type simulations were run with the coupled ocean–atmosphere–vegetation general circulation model, the Hadley Centre Coupled Model version 3 (HadCM3; Gordon et al., 2000; Pope et al., 2000; Valdes et al., 2017). They broadly follow the protocol described by Ivanovic et al. (2016), opting for a melt-uniform freshwater scenario that conserves water across the deglaciation in accordance with the prescribed ice sheets. Two sets of simulations were analysed; one uses the global ICE-6G_C ice sheet reconstruction (Peltier et al., 2015) performed at 1000-year intervals from 26 to 21 ka and 500-year intervals from 21 to 0 ka (the same simulations are described in more detail by Morris et al. (2018) in their Supplementary Materials and Methods), and the other uses the GLAC-1D global ice-sheet reconstruction (Briggs et al., 2014; Ivanovic et al., 2016; Tarasov et al., 2012, 2014; Tarasov and Peltier, 2002) at 500-year intervals from 26 ka to present that are otherwise identical to the ICE-6G_C set. From these simulations, we extracted 50-year climate means for annual precipitation, total annual evaporation, and annual temperature for the ∘ model grid square centred at 55∘ N, 3.75∘ E, which covers Dogger Bank.
4.1 Seismic stratigraphic interpretation
Three seismic stratigraphic units were established based on previous investigation of the stratigraphic architecture of the study area (Cotterill et al., 2017b; Emery et al., 2019a, b). The basal unit (basal seismic unit) is separated from the younger two units (channel-fill unit, upper seismic unit) by a major unconformable surface (Horizon Z) that is mapped across the study area.
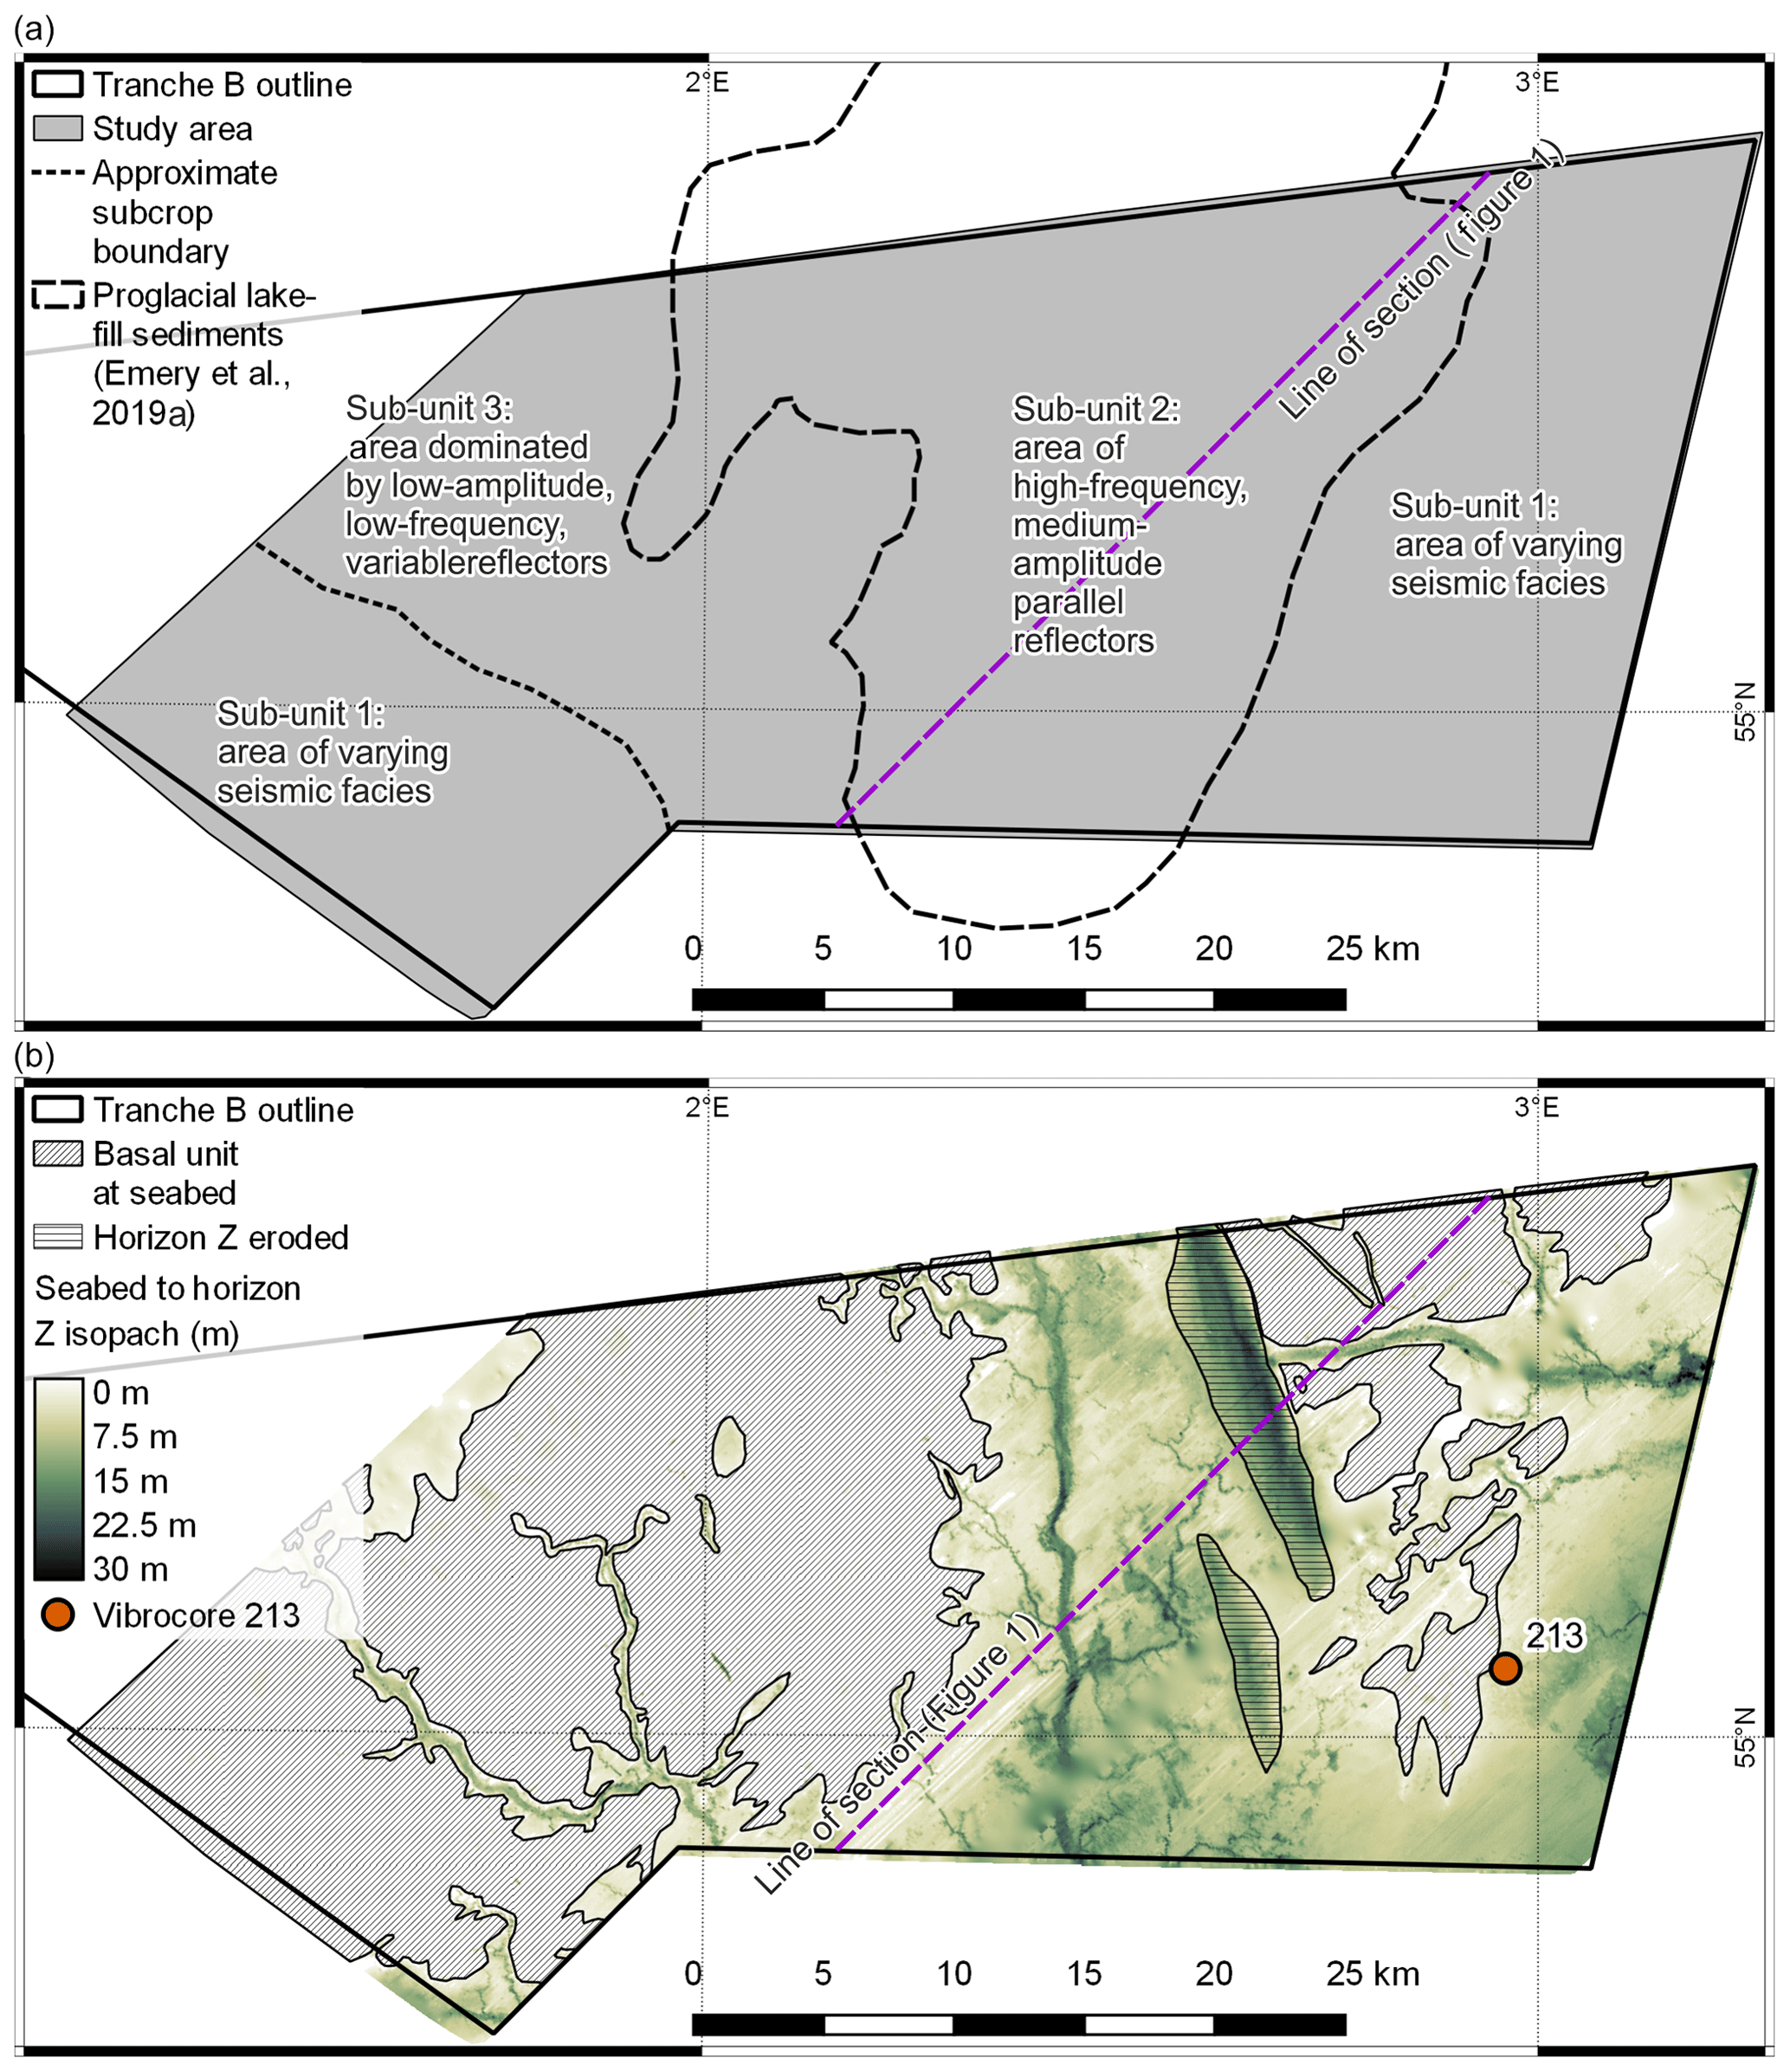
Figure 2(a) Seismic facies of the basal seismic unit subcropping Horizon Z. (b) Isopach map of the upper seismic unit. Areas of grey hatching are areas where Horizon Z (top basal seismic unit) has been subsequently eroded and/or is coincident with the seabed.
4.1.1 Basal seismic unit
The basal seismic unit comprises three main seismic facies, with minor contributions of other seismic facies. Generally, the area east and southwest of the study area is characterised by high-amplitude, varying frequency reflections and asymmetric and symmetric serrate, inclined, patchy and sporadic reflections (see Emery et al., 2019b, for description of terminology), termed sub-unit 1 (Fig. 2a). The central study area is dominated by high-frequency, medium-amplitude parallel reflections that onlap or drape previous stratigraphy, infilling a depocentre (Fig. 1), termed sub-unit 2 (Fig. 2a). The northwest of the study area mainly comprises low-amplitude, low-frequency variable to transparent seismic facies, termed sub-unit 3 (Fig. 2a). The basal seismic unit is bounded above by Horizon Z.
4.1.2 Horizon Z – unconformable surface
Horizon Z is present across the study area and truncates the underlying basal seismic unit and, therefore, represents an unconformity (Figs. 1 and 2b). Channel forms mantle Horizon Z and incise the basal seismic unit. Commonly, Horizon Z is coincident with the seabed (Figs. 1, 2, and 5b). The depth to Horizon Z, relative to mean sea level, is shown in Fig. 3. In seismic section, Horizon Z is generally identified by a continuous, medium- to high-amplitude reflection, especially where coincident with the seabed. In the north of the study area, Horizon Z loses reflectivity and can only be interpreted by differences in seismic facies above and below. In some areas, Horizon Z is high-amplitude and overlain by a thin unit of further high-amplitude reflections (e.g. centre of Fig. 3b).
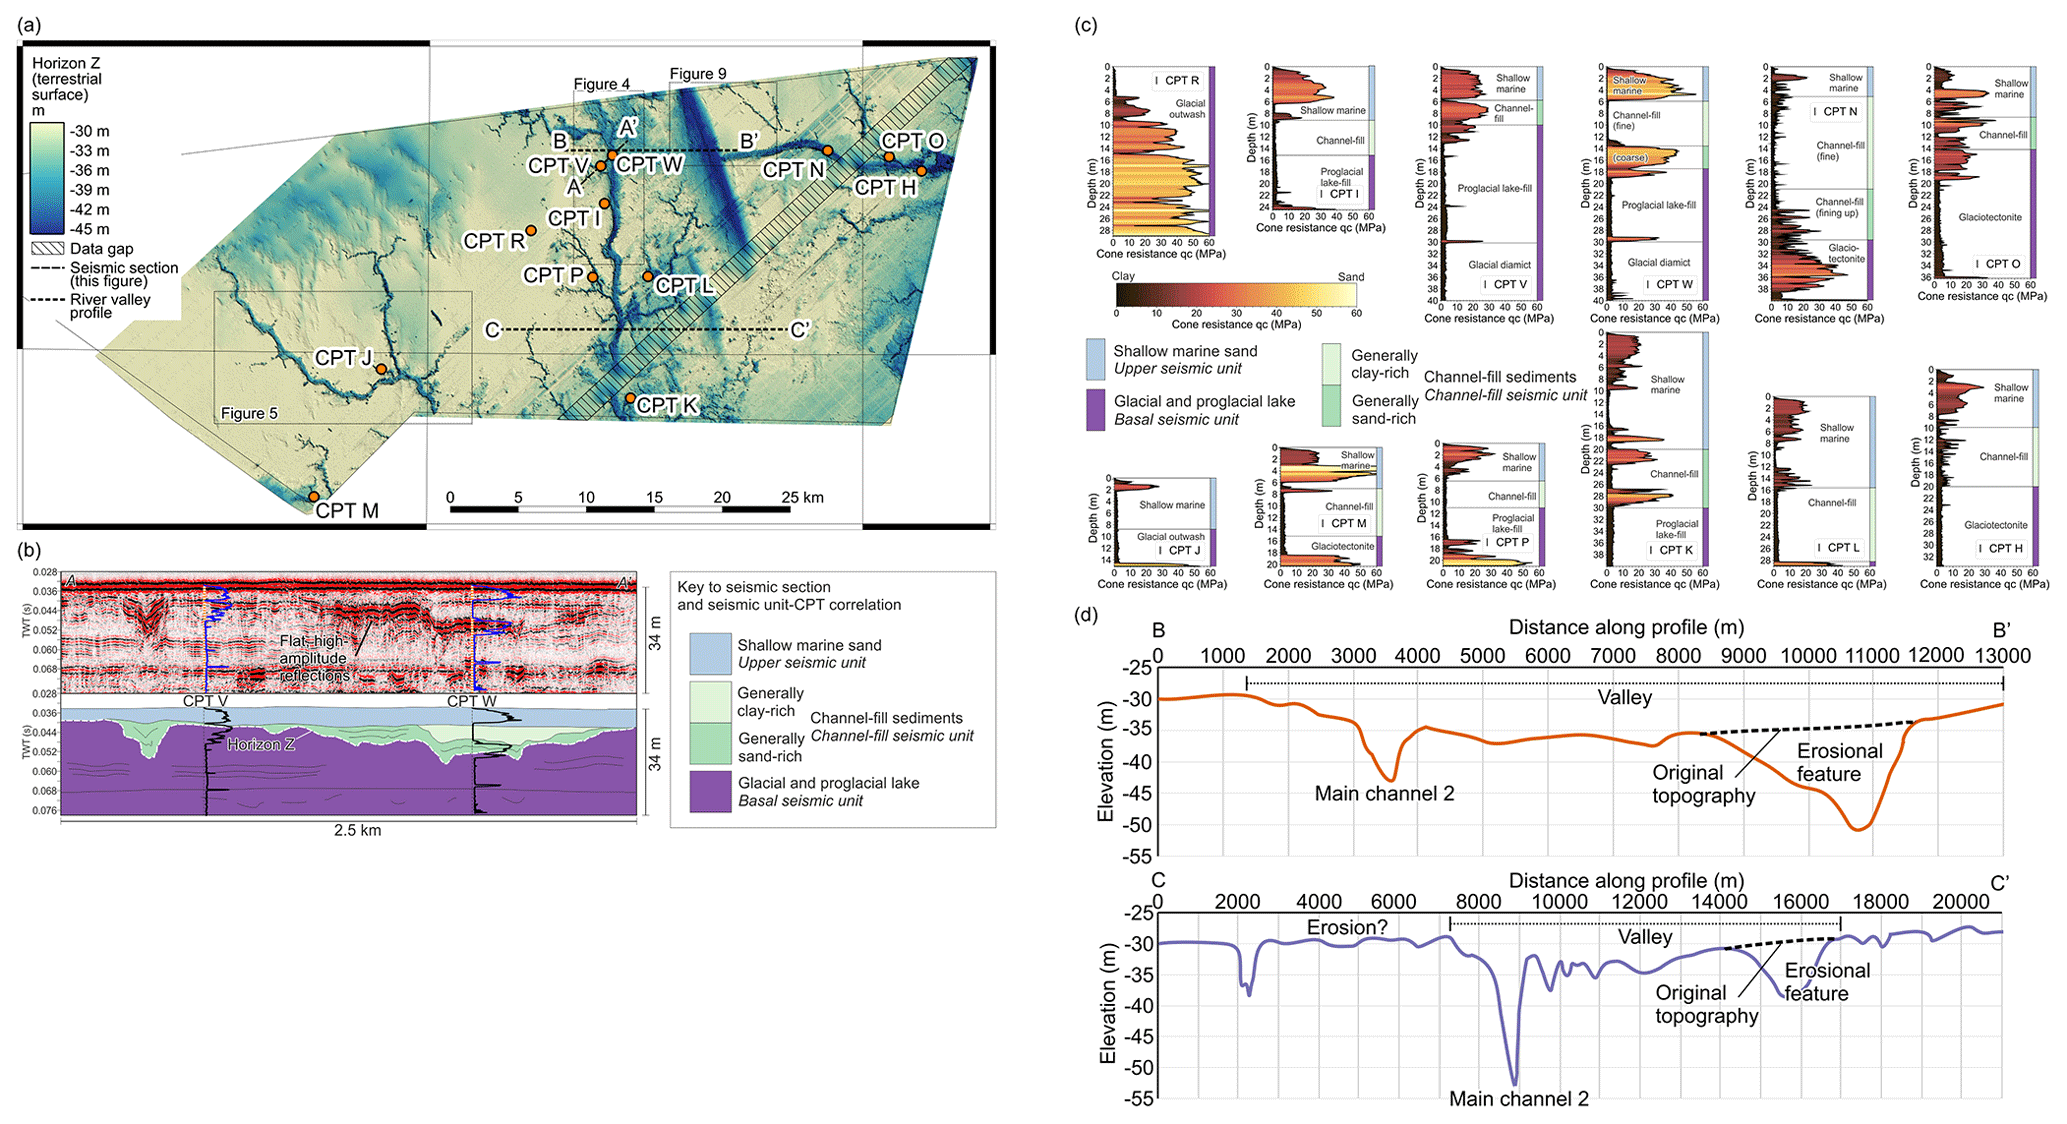
Figure 3(a) Depth map of Horizon Z showing locations of CPTs penetrating the channel network. Data gap refers to some seismic lines missing from the dataset. (b) Seismic section shows the correlation between seismic facies, Horizon Z, and CPTs. CPT logs shown with the seismic unit they correlate to (purple). (c) CPT profiles for CPTs shown on (a), running clockwise around the map from CPT R in the west. Logs shown with equal scales. Colour bar for CPT logs “lajolla” (Crameri, 2018). (d) Profiles through Horizon Z showing low-amplitude valleys and large erosional features.
4.1.3 Channel-fill seismic unit
The channel fills above Horizon Z comprise varying seismic facies. Channel forms vary in size and morphology, as described further in Sect. 4.4. Larger channel fills often cause acoustic blanking of the underlying seismic reflections (Fig. 9). Channel-fill architecture is variable. The dominant channel-fill seismic facies comprise high-frequency, high-amplitude, continuous reflections that are generally subparallel to the base of the channel, or horizontal, which varies in thickness between and along channels (Figs. 4b and 5b). High-amplitude reflections can also be mounded externally with parallel to tangential oblique reflections internally (Fig. 4b). Typically, above this high-amplitude fill is a low-amplitude to transparent, low-frequency fill with parallel and horizontal, draped, or sigmoidal reflections (Figs. 4b and 5b and c). In some cases, the fill is divergent in the high-amplitude section and comprise stacked channel fills (Fig. 4b). Prograding fill is observed in the low-amplitude, low-frequency section of some of the channel-fill seismic facies (Fig. 4c). In other channels, the fill pattern is divergent in the basal high-amplitude reflections, which are overlain by low-amplitude to transparent fills (Fig. 5b and c).
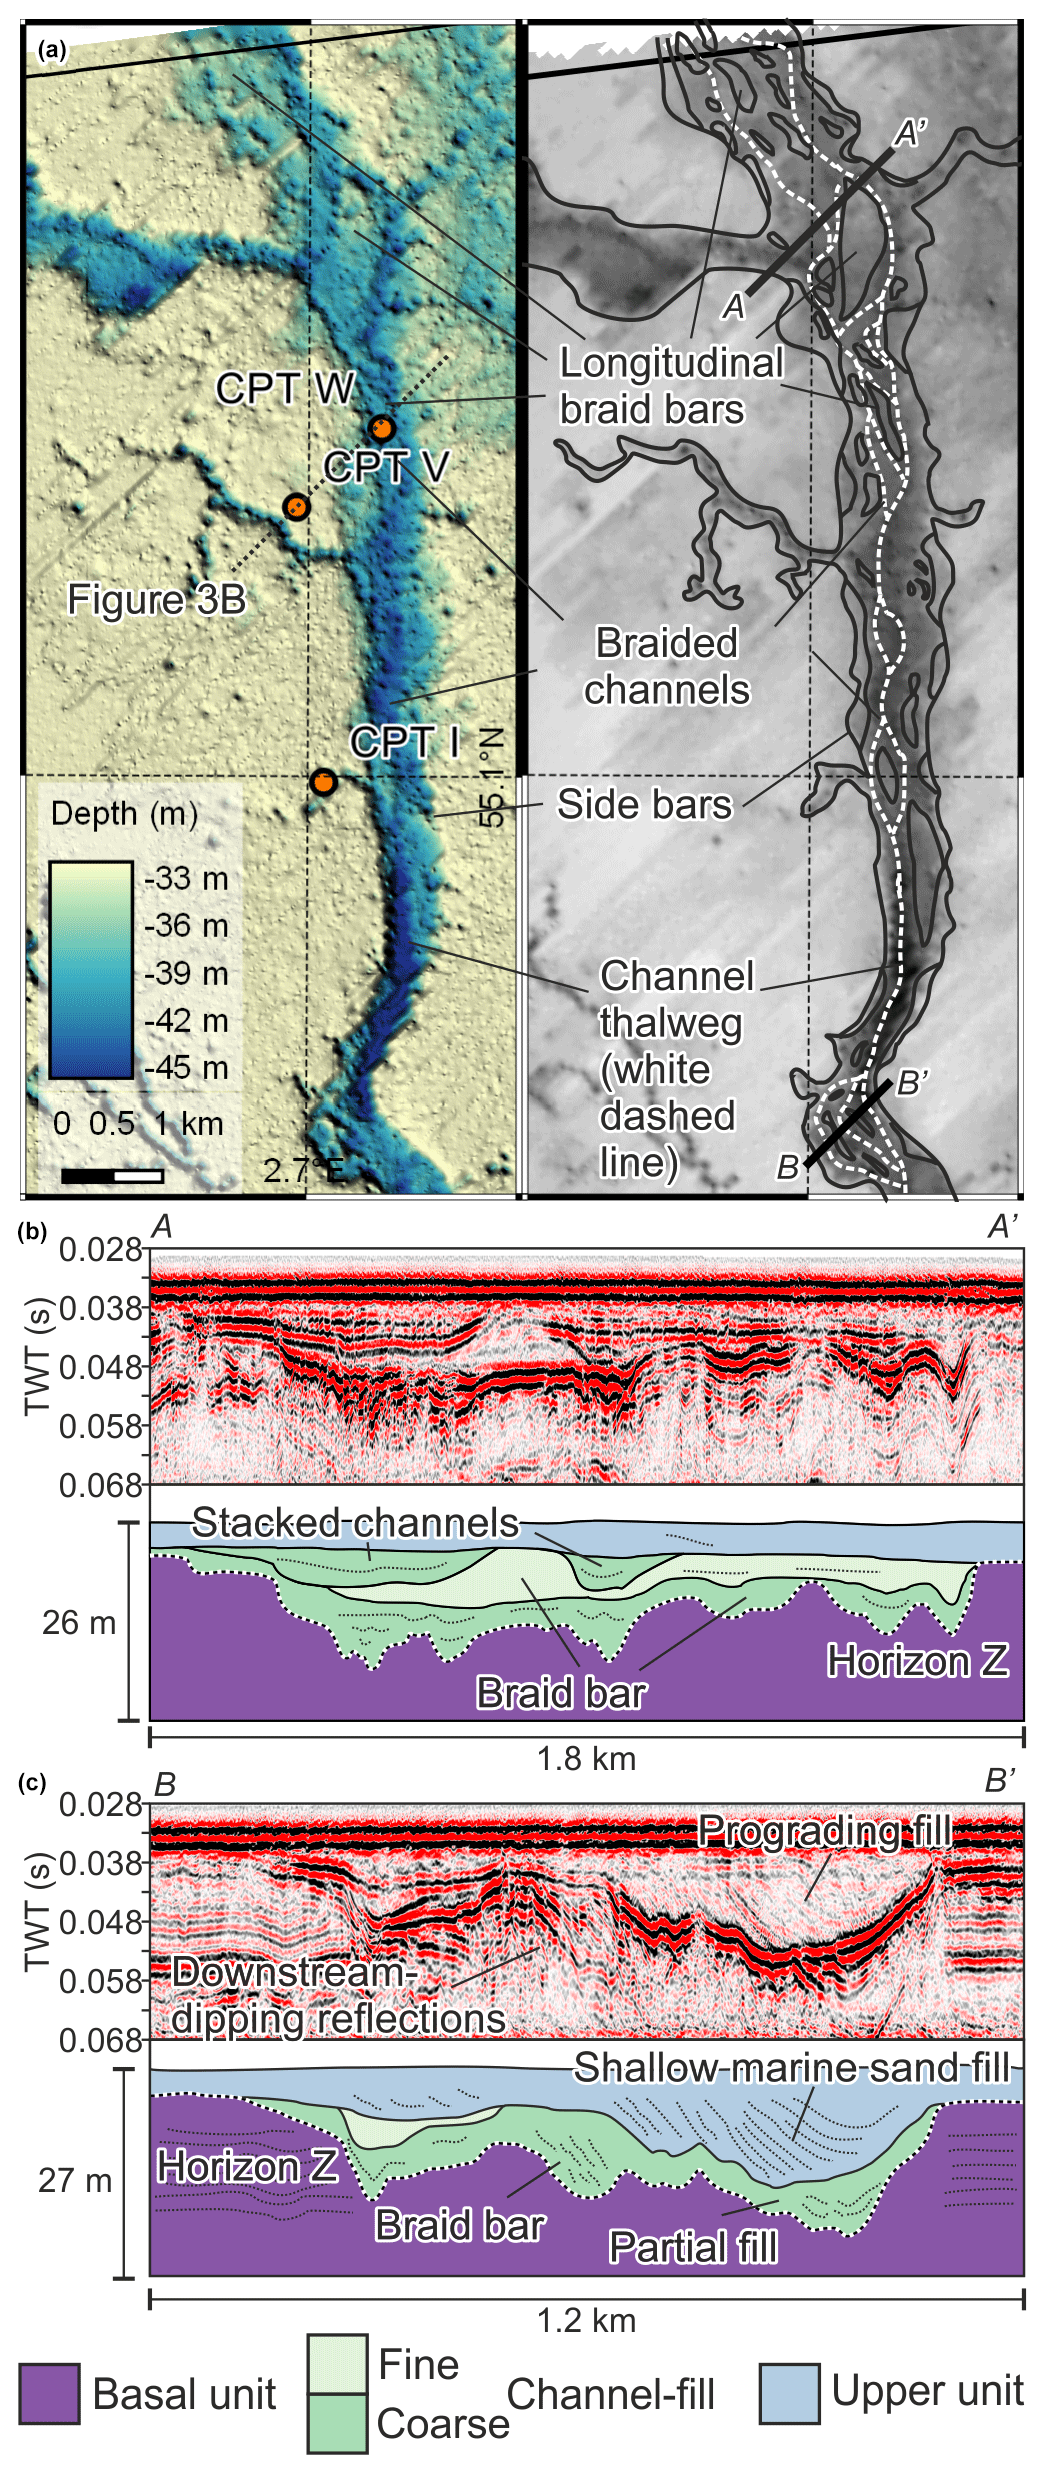
Figure 4(a) Detailed map of Horizon Z covering main river channel 2, showing the channel morphology, with braid bars and braided channels. Seismic sections (b, c) show examples of the vertical channel morphology, with stacked channels and braid bars, and seismic units implying differing sediment fills.
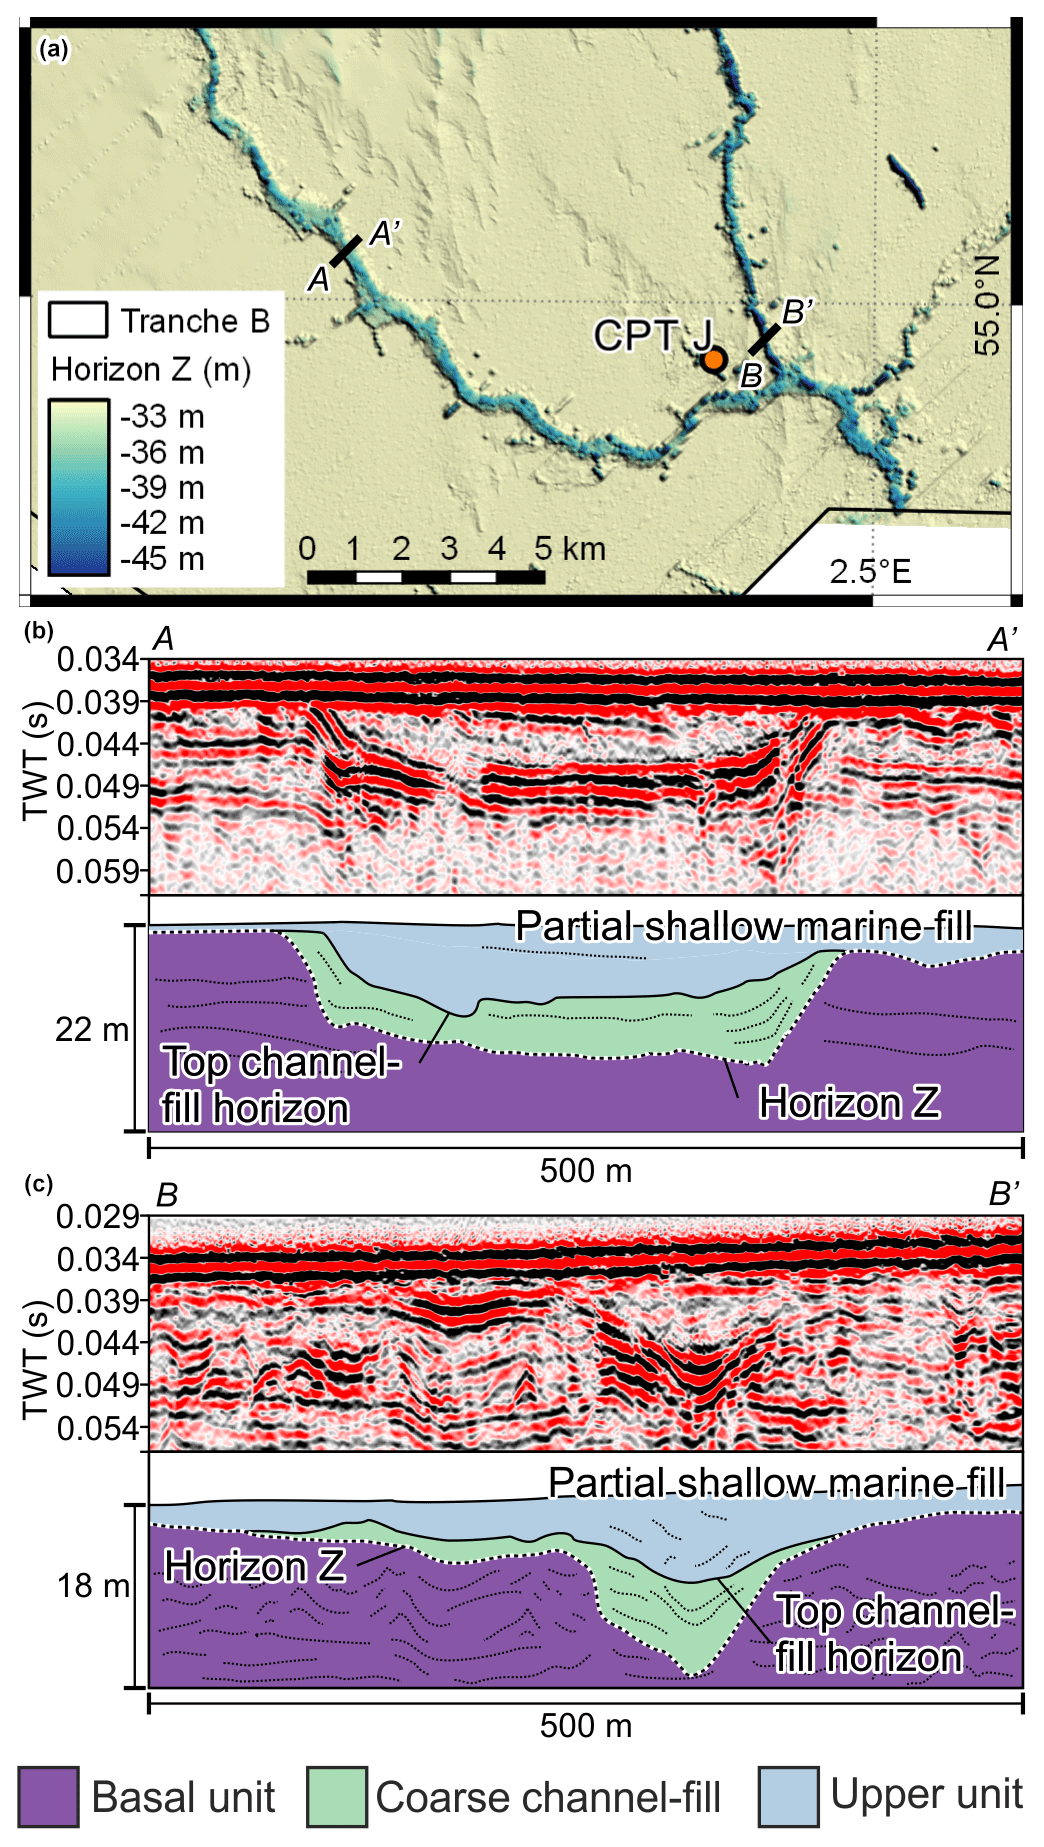
Figure 5(a) Detailed map of main river channel 3, showing the more sinuous morphology of the channel and its tributaries. Seismic sections (b, c) show the more simple, single-channel morphology of the rivers.
4.1.4 Top channel-fill horizon
The horizon separating the channel-fill seismic unit from the overlying upper seismic unit is variable. Typically, this horizon comprises a single medium- to high-amplitude horizontal reflection (Figs. 3b and 4b) but can also be draped over the partial channel fill (Figs. 4c and 5b and c). Where channels are absent, this horizon is coincident with Horizon Z.
4.1.5 Upper seismic unit
The youngest seismic unit is present between the seabed and Horizon Z and sometimes partially fills the channels (Figs. 1b, 3b, 4c and 5b and c). This upper seismic unit comprises low-amplitude to transparent seismic facies. In central and northern parts of the study area, where the upper seismic unit is thickest (Fig. 2b), low-frequency, low-amplitude, west- or southwest-dipping sigmoidal-to-tangential oblique and shingled reflections are present. The upper seismic unit is absent where Horizon Z is coincident with the seabed.
Two large, elongate features, oriented approximately NNW–SSE, up to 2.5 km wide and 15 km long, are also present in the centre of the study area that incises into Horizon Z and the basal seismic unit (Fig. 2). In the north of the study area, the largest elongate feature can be observed to incise through the channel-fill unit and into the basal seismic unit (Fig. 9c), suggesting that these erosive features are younger than the channel-fill unit.
4.2 Geotechnical log interpretation
Ten CPTs intersect the channel fills of Horizon Z (Fig. 3). Low cone resistance correlates to clay, and high cone resistance correlates to sand (Robertson, 1990). CPT facies of each of these 10 geotechnical logs, plus two logs that did not penetrate channel fills, were interpreted for each seismic unit by correlating CPTs to the seismic reflection data. This correlation was made by converting CPT depth to TWT using the sediment velocity of 1600 m s−1 (Cotterill et al., 2017a).
The upper seismic unit has high cone resistance values, as seen in CPTs H, I, K, M, V, and W (Fig. 3), which implies a sand-rich unit. The basal seismic unit is highly variable depending on which sub-unit is encountered. Sub-unit 1 has mostly low cone resistance values, suggesting it is clay-rich (CPTs H and O) but can also be interbedded with more sand-rich layers (CPT N; Fig. 3). Sub-unit 2 is dominated by clay-rich sediments with rare thin layers of coarser material (CPTs I, K, P, V, and W; Fig. 3). Sub-unit 3 is variable but dominated by high cone resistances intercalated with intermediate responses, implying silty and sandy sediments (CPT R; Fig. 3, Robertson, 1990).
The channel-fill signatures differ between each CPT, varying from clay-rich to sand-rich, and are commonly interbedded. In CPT W, the channel fill is clay-rich at the top, between 6 and 14 m, and sand-rich to the base of the channel fill at 19 m. This correlates to the difference in seismic facies within the channel-fill seismic unit, where the clay-rich unit correlates to low-frequency, transparent seismic facies, and the sand-rich unit correlates to high-amplitude, parallel reflections (Fig. 3). In contrast, CPT V contains no clay-rich layers, solely comprising intermediate cone resistances, implying a silty to sandy fill. CPTs I, L, M, and P comprise low cone resistance responses, implying clay-rich facies. CPTs H and N are also dominated by clay but have irregularly spaced, 10–40 cm thick, intercalated silts. The general trend within CPT N shows fining upwards. CPTs K and O are highly variable in cone resistance throughout the channel-fill seismic unit, with a sandy base, a clay-rich middle, and a sandy top.
4.3 Sedimentary environments
The three seismic units and Horizon Z, when correlated to CPT log facies, suggest a transition between three distinct sedimentary environments.
4.3.1 Glacial and proglacial deposits
The wide range of seismic and CPT facies within the basal seismic unit implies a complicated depositional setting. Sub-unit 1 has varying seismic facies that include serrate, patchy, inclined, and sporadic reflections and correlates to fine-grained, clay-rich facies with siltier interbeds and some sand, such as in CPTs H, O, V, and W (Fig. 3). The nature of the reflections implies deformation of this sub-unit, which is interpreted to be glaciotectonic compression of subglacial and glacial outwash sediments deposited at the margin of an ice sheet (Cotterill et al., 2017b; Emery et al., 2019a; Phillips et al., 2018). The rhythmic, parallel, high-frequency reflections within sub-unit 2 correlate to clay-rich CPT facies in CPT I, P, L, V, and W (Fig. 3). The fine-grained, rhythmic deposits suggest deposition in a low-energy environment, and the basin-filling geometry of the sub-unit supports an interpretation that these are lake-fill sediments. The third sub-unit is characterised by low-amplitude reflections whose geometry implies aggradation at low angles. CPT R (Fig. 3) has a variable but generally high cone resistance, implying interbedding of sand and siltier units. Sub-unit 3 has varying thickness; it is thicker in the west of the study area, thinning to a lobate geometry to the east, where it overlies sub-unit 1, and is onlapped by sub-unit 2. Sub-unit 3 is interpreted to be glacial outwash deposited subaerially in outwash fans during ice-sheet retreat. A full description of these glacial and proglacial sedimentary environments and their implication for landscape evolution during ice-sheet advance and retreat is provided in Emery et al. (2019b).
4.3.2 Terrestrial and fluvial
Horizon Z is an unconformable surface, into which channel forms have incised. These channel forms vary in length and width but form a connected network of channels (Fig. 6). There are three main channels, which generally have smaller tributary channels joining them. The high aspect ratio channel fills (50:1 up to 100:1) are shallow (up to 15 m deep) but wide (up to 1 km width). Where Horizon Z is not coincident with the seabed, the channel forms are observed to run parallel to the centre line of low-relief valleys (Fig. 3d).
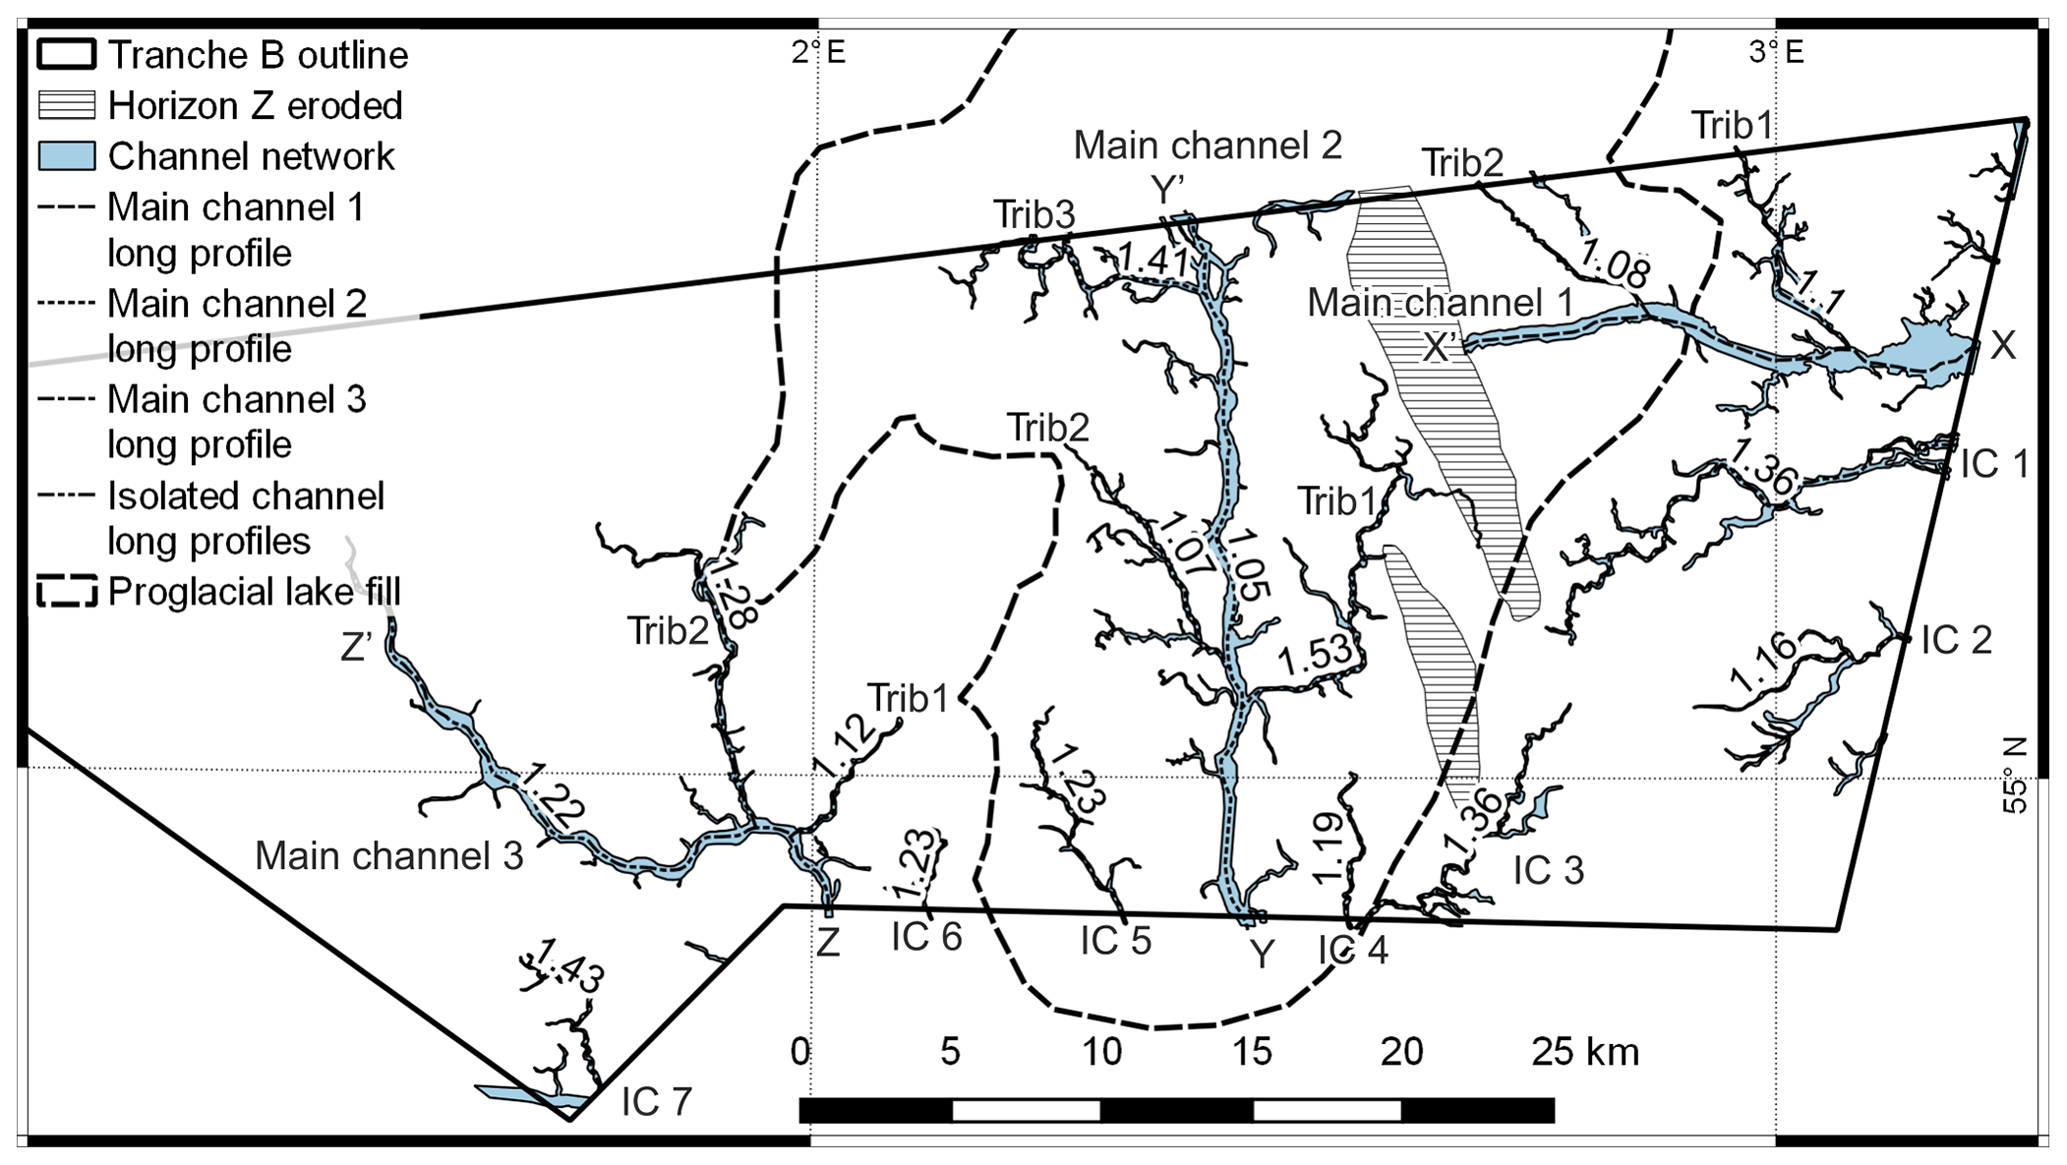
Figure 6Map of channel network interpreted from Horizon Z showing the three main channels, seven smaller streams, and their tributaries. Numbers correspond to the sinuosity of each individual channel. The outline of the proglacial lake-fill sediment subcrop is shown. IC − isolated channel, trib − tributary.
Horizon Z is interpreted to represent a composite terrestrial surface that formed after retreat of the ice sheet and infilling of the proglacial lake (Cotterill et al., 2017b; Emery et al., 2019a). The channels might have originated as a tunnel valley network, such as that interpreted to the east of Dogger Bank (Prins and Andresen, 2019). Tunnel valleys are generally much deeper than the channels observed incising Horizon Z, with lower aspect ratios (10:1) and highly undulating thalwegs (Livingstone and Clark, 2016; Ó Cofaigh, 1996; Ottesen et al., 2020; Prins et al., 2020). Furthermore, if the channels were of a tunnel-valley origin, their stratigraphic position would require a late-stage ice-sheet readvance over the proglacial lake-fill sediments. However, no evidence of deformation related to readvance is recorded within the proglacial lake-fill sediments or anywhere else throughout Tranche B, and there are no glaciogenic deposits or glacial geomorphology at the stratigraphic level of the channel network (Emery et al., 2019a). Subglacial channels in the Dogger Bank area are either smaller than (tens of metres wide; Emery et al., 2019a) or of a similar width to these channels but markedly deeper, up to 100 m deep (Fig. 9). Therefore, we favour a fluvial origin for these channels that incised into Horizon Z.
The CPT logs have mixed responses within the channel-fill seismic unit, implying different infill histories. Sandy and silty channel-fill sediments are frequently encountered towards the base of the channels (CPTs K, N, O, V, and W), implying a moderate- to high-energy sedimentary environment. Fining upwards is also apparent in CPTs K, N, and W, which is characteristic of bar deposits in channel fills. Clay-dominated facies (CPTs H, I, L, M, P, and the upper section of CPT W) suggest a low-energy sedimentary environment. The clay-dominated facies could also represent brackish or marine deposition during marine transgression. Without detailed sedimentary information provided by cores, and palaeoenvironmental analyses, such as microfossil assemblages, it is not possible to confirm the depositional environment of these clay-rich facies.
4.3.3 Shallow marine
The generally low-amplitude to transparent seismic facies of the upper seismic unit imply a relatively homogeneous sediment. The CPT logs that correlate to the upper seismic unit, such as CPTs V and W, have high cone resistance values (∼30–50 MPa), suggesting the unit is sand-rich. The homogeneous sand and generally eastward-dipping sigmoidal reflections are interpreted to represent progradation of sand in a shallow marine depositional environment across Horizon Z after marine transgression. This interpretation is further corroborated by shallow marine sands recovered from vibrocores in the southeast of this study area, such as vibrocore 213 (Fig. 2), as shown in Emery et al. (2019a).
4.4 Geomorphology
Three main channel fills are identified above Horizon Z, whose widths are greater than 400 m and up to 1000 m wide and 15 m deep (Fig. 6). Main channel fill 1 runs from west to east and is located in the east of the study area. Main channel fill 2 runs from north to south in the centre of the study area. Main channel fill 3 runs from northwest to southeast in the west of the study area (Fig. 6). A tributive network of smaller channel fills associated with the large channel fills also exists, whose widths are up to 250 m and depths up to 10 m. Longer, isolated channel fills of a similar scale are also observed within the study area.
Two forms of channel cross section are observed. The first form corresponds to main channel fills 1 and 2, with a wide channel incision that comprises numerous smaller erosion surfaces separated by shallower and generally horizontal sections at its base (Fig. 4). The second form, corresponding to the tributaries, main channel 3, and the isolated channels, is generally U- or V-shaped with a single deep incision (Fig. 5).
The bases of main channels 1 and 2 show cross-channel depth variations (Fig. 4) from narrow, deep channel sections separated by wider, flat-topped, mounded shallow sections elongated parallel to the channel with internal oblique reflections that dip downstream (Fig. 4c). The deeper sections split and rejoin, with between one and three deep channel sections across the main channel width (Fig. 4). The main channels 1 and 2 have low sinuosity (channel 1=1.06, channel 2=1.05; Fig. 7). The tributaries, main channel 3, and isolated channels observed have similar sinuosity (mean of 1.25) and average channel widths (100–150 m; Fig. 7), which differ from those of main channels 1 and 2. The tributaries are between 2 and 4 times smaller than main channels. There is a large variation in sinuosity of the tributaries, ranging from 1.07 to 1.53, and the isolated channels are straighter, with sinuosity between 1.16 and 1.43. Main channel 3 has a sinuosity of 1.22. The tributaries join the main channels at angles around 90∘ (Fig. 6), implying a perpendicular flow direction to the main channels.
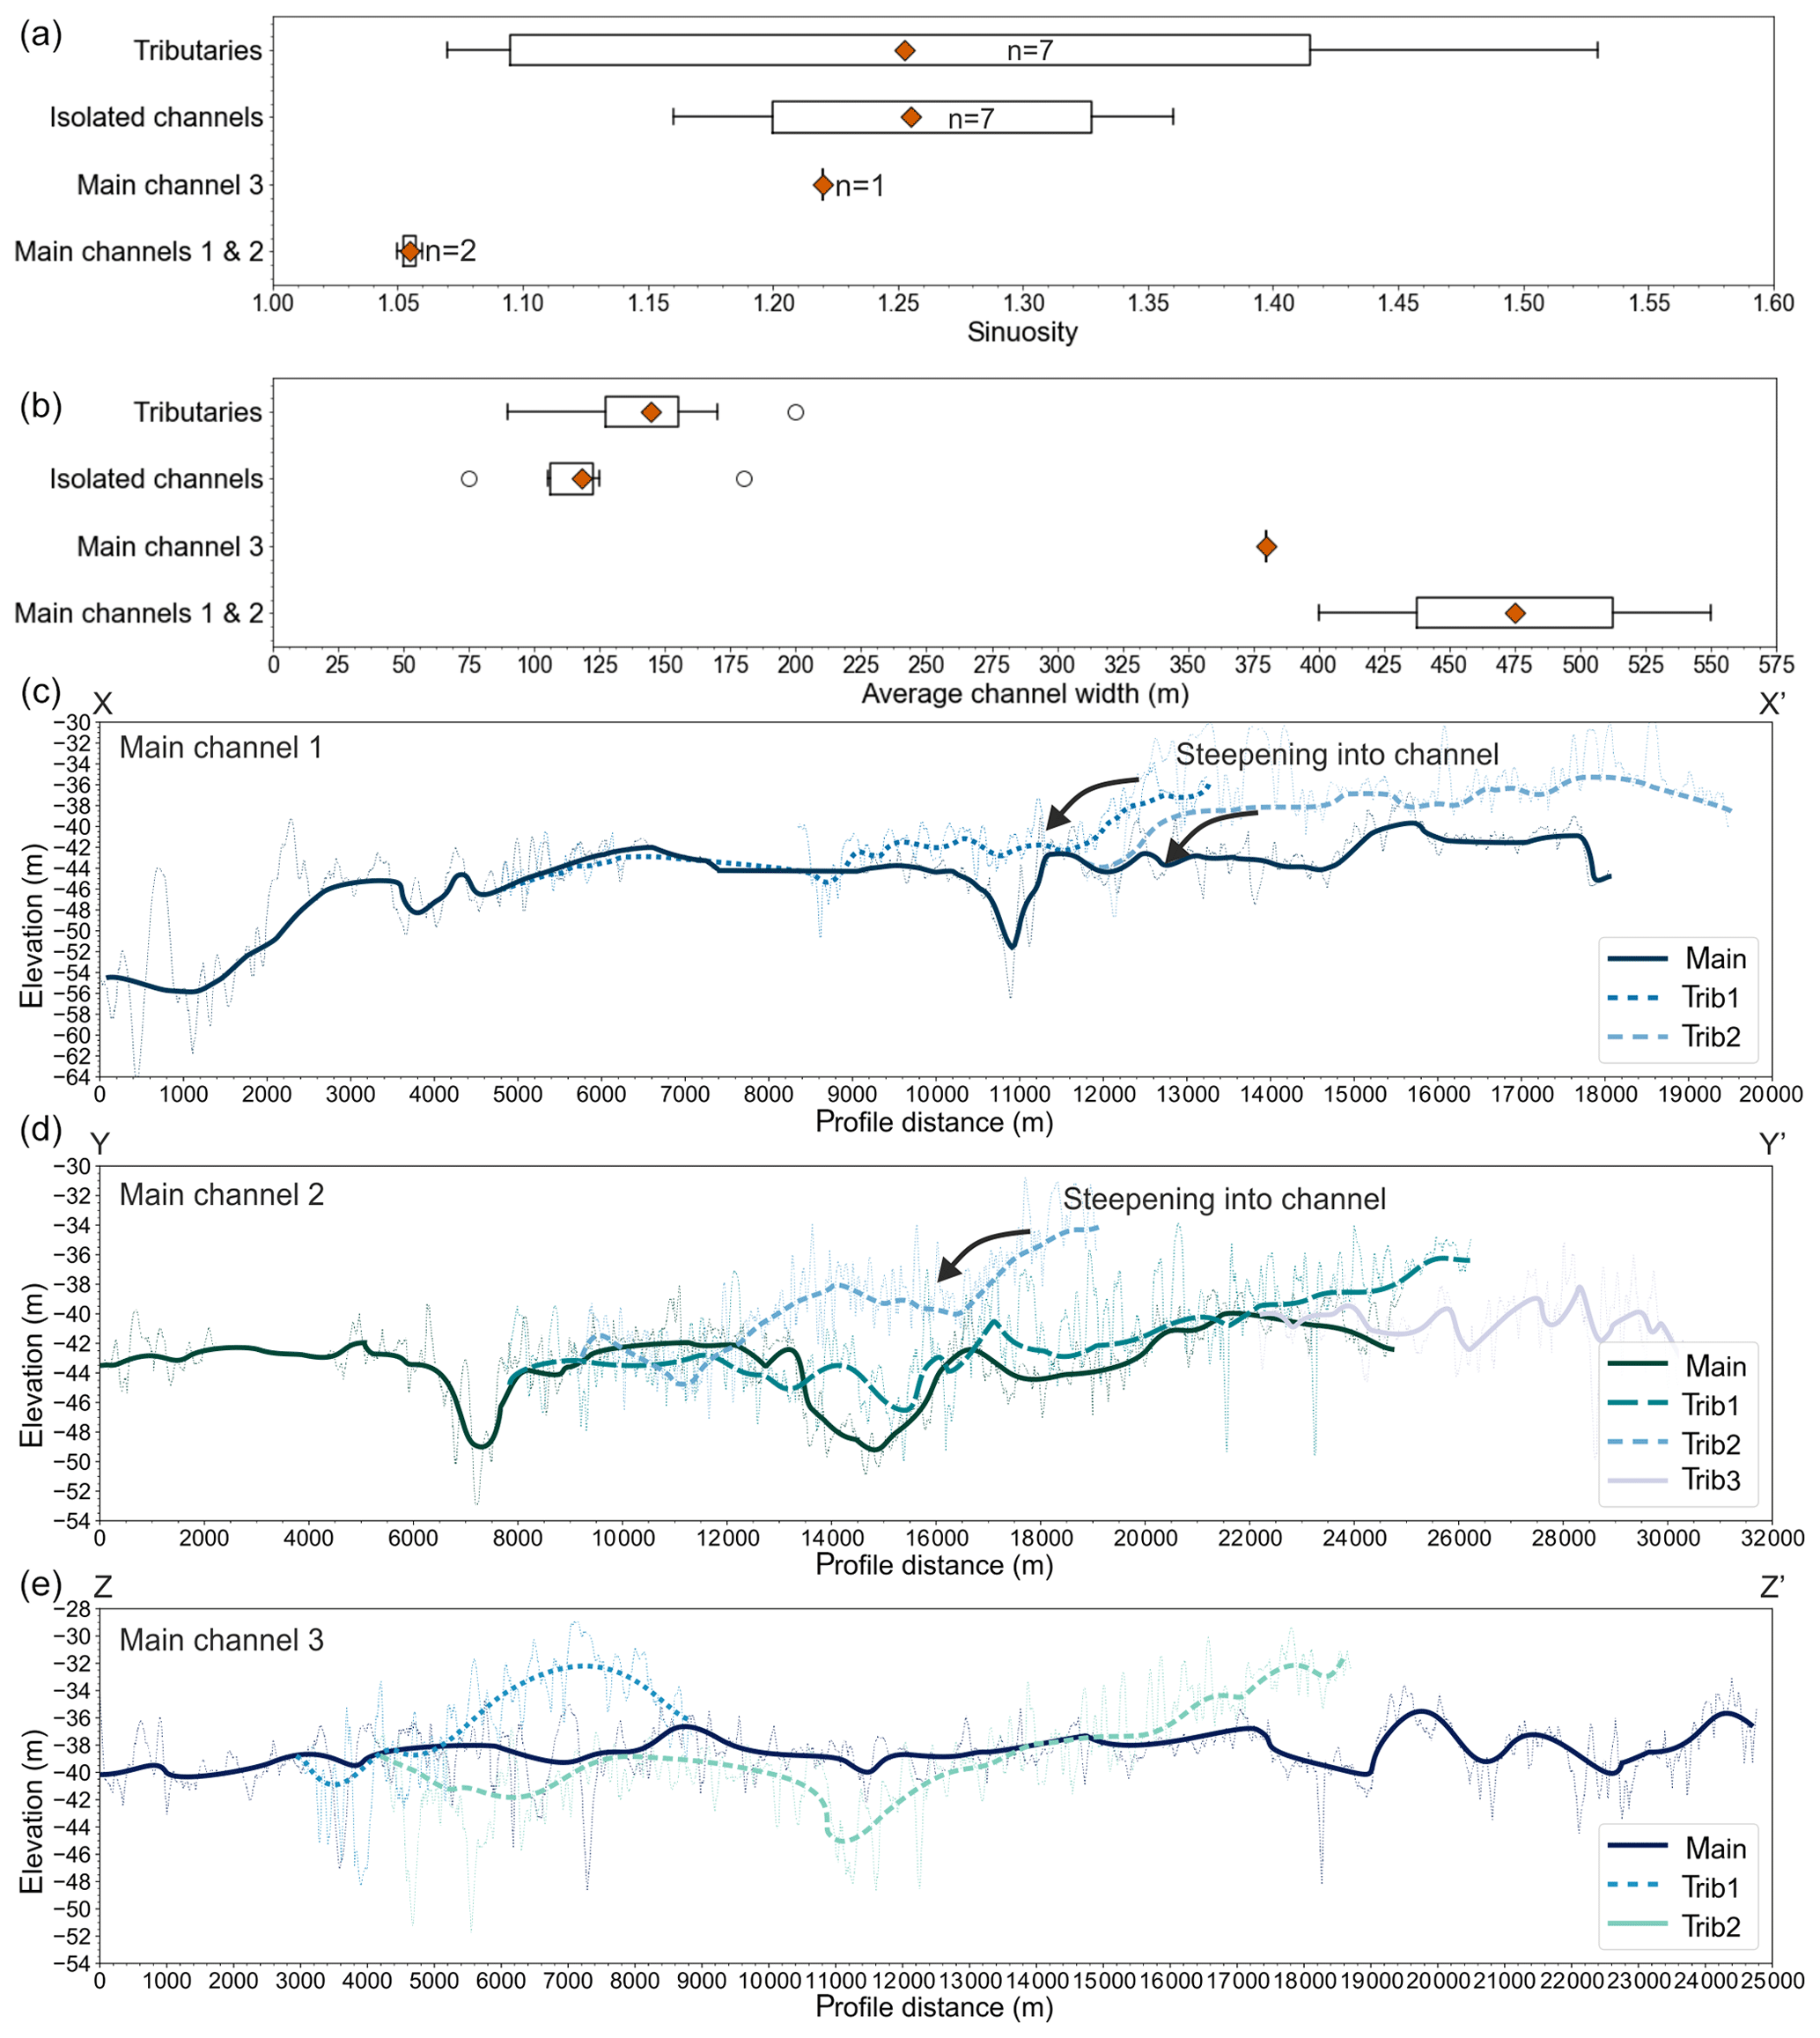
Figure 7(a) Sinuosity and (b) average channel width for the main categories of channels. Main channels 1 and 2 have a distinct morphology when compared to the other channels. Long profiles for channels 1 (c), 2 (d), and 3 (e) show the direction of flow from right to left, and the interaction of tributaries, cutting down and steepening into the main channels. X–X′, Y–Y′ and Z–Z′ are shown in Fig. 6.
Long profiles of the three main channels and their longest tributaries were drawn from the centre lines of the deepest point of the channel base relative to the channel edge and smoothed to reduce issues of seismic mistie and interpolation bias (Fig. 7). The profiles undulate but show overall decrease in elevation towards the east (channel 1), south (channel 2), and southeast (channel 3). The tributary channel bases also decrease in elevation (Fig. 7) and sometimes become steeper from the tributary head to the confluence with main channels, such as in main channel 1 (Fig. 7), implying these channels were cutting down to the main channels. The flow direction of the rivers is interpreted to be the same as the direction of decrease in elevation (Fig. 7). Therefore, the network of channels is a dendritic to subdendritic river drainage network (Zernitz, 1932) draining from tributaries into main channels, then out of the study area. The maximum elevation of this drainage network is −32 m, and the minimum elevation is −56 m. The average gradient for the main channels ranges from 0.2 to 0.9 m km−1 (0.01 to 0.05∘).
4.5 Palaeoclimate modelling
The palaeoclimate simulation outputs for the two model runs using GLAC-1D and ICE-6G_ C ice sheet reconstructions for the time span of 26 ka to present are shown in Fig. 10. Generally, the climate simulations show similar trends through the Holocene but differ through the Late Pleistocene. The climate simulation using GLAC-1D has much higher precipitation than the equivalent simulation with ICE-6G_C between 26 and 18 ka, but the climate with ICE-6G_C shows much higher precipitation than with GLAC-1D between 18 and 11 ka. The temperature profiles are largely similar between the GLAC-1D and ICE-6G_C runs, except between 26 and 20 ka, where the ICE-6G_C run gives temperatures consistently 5 ∘C higher.
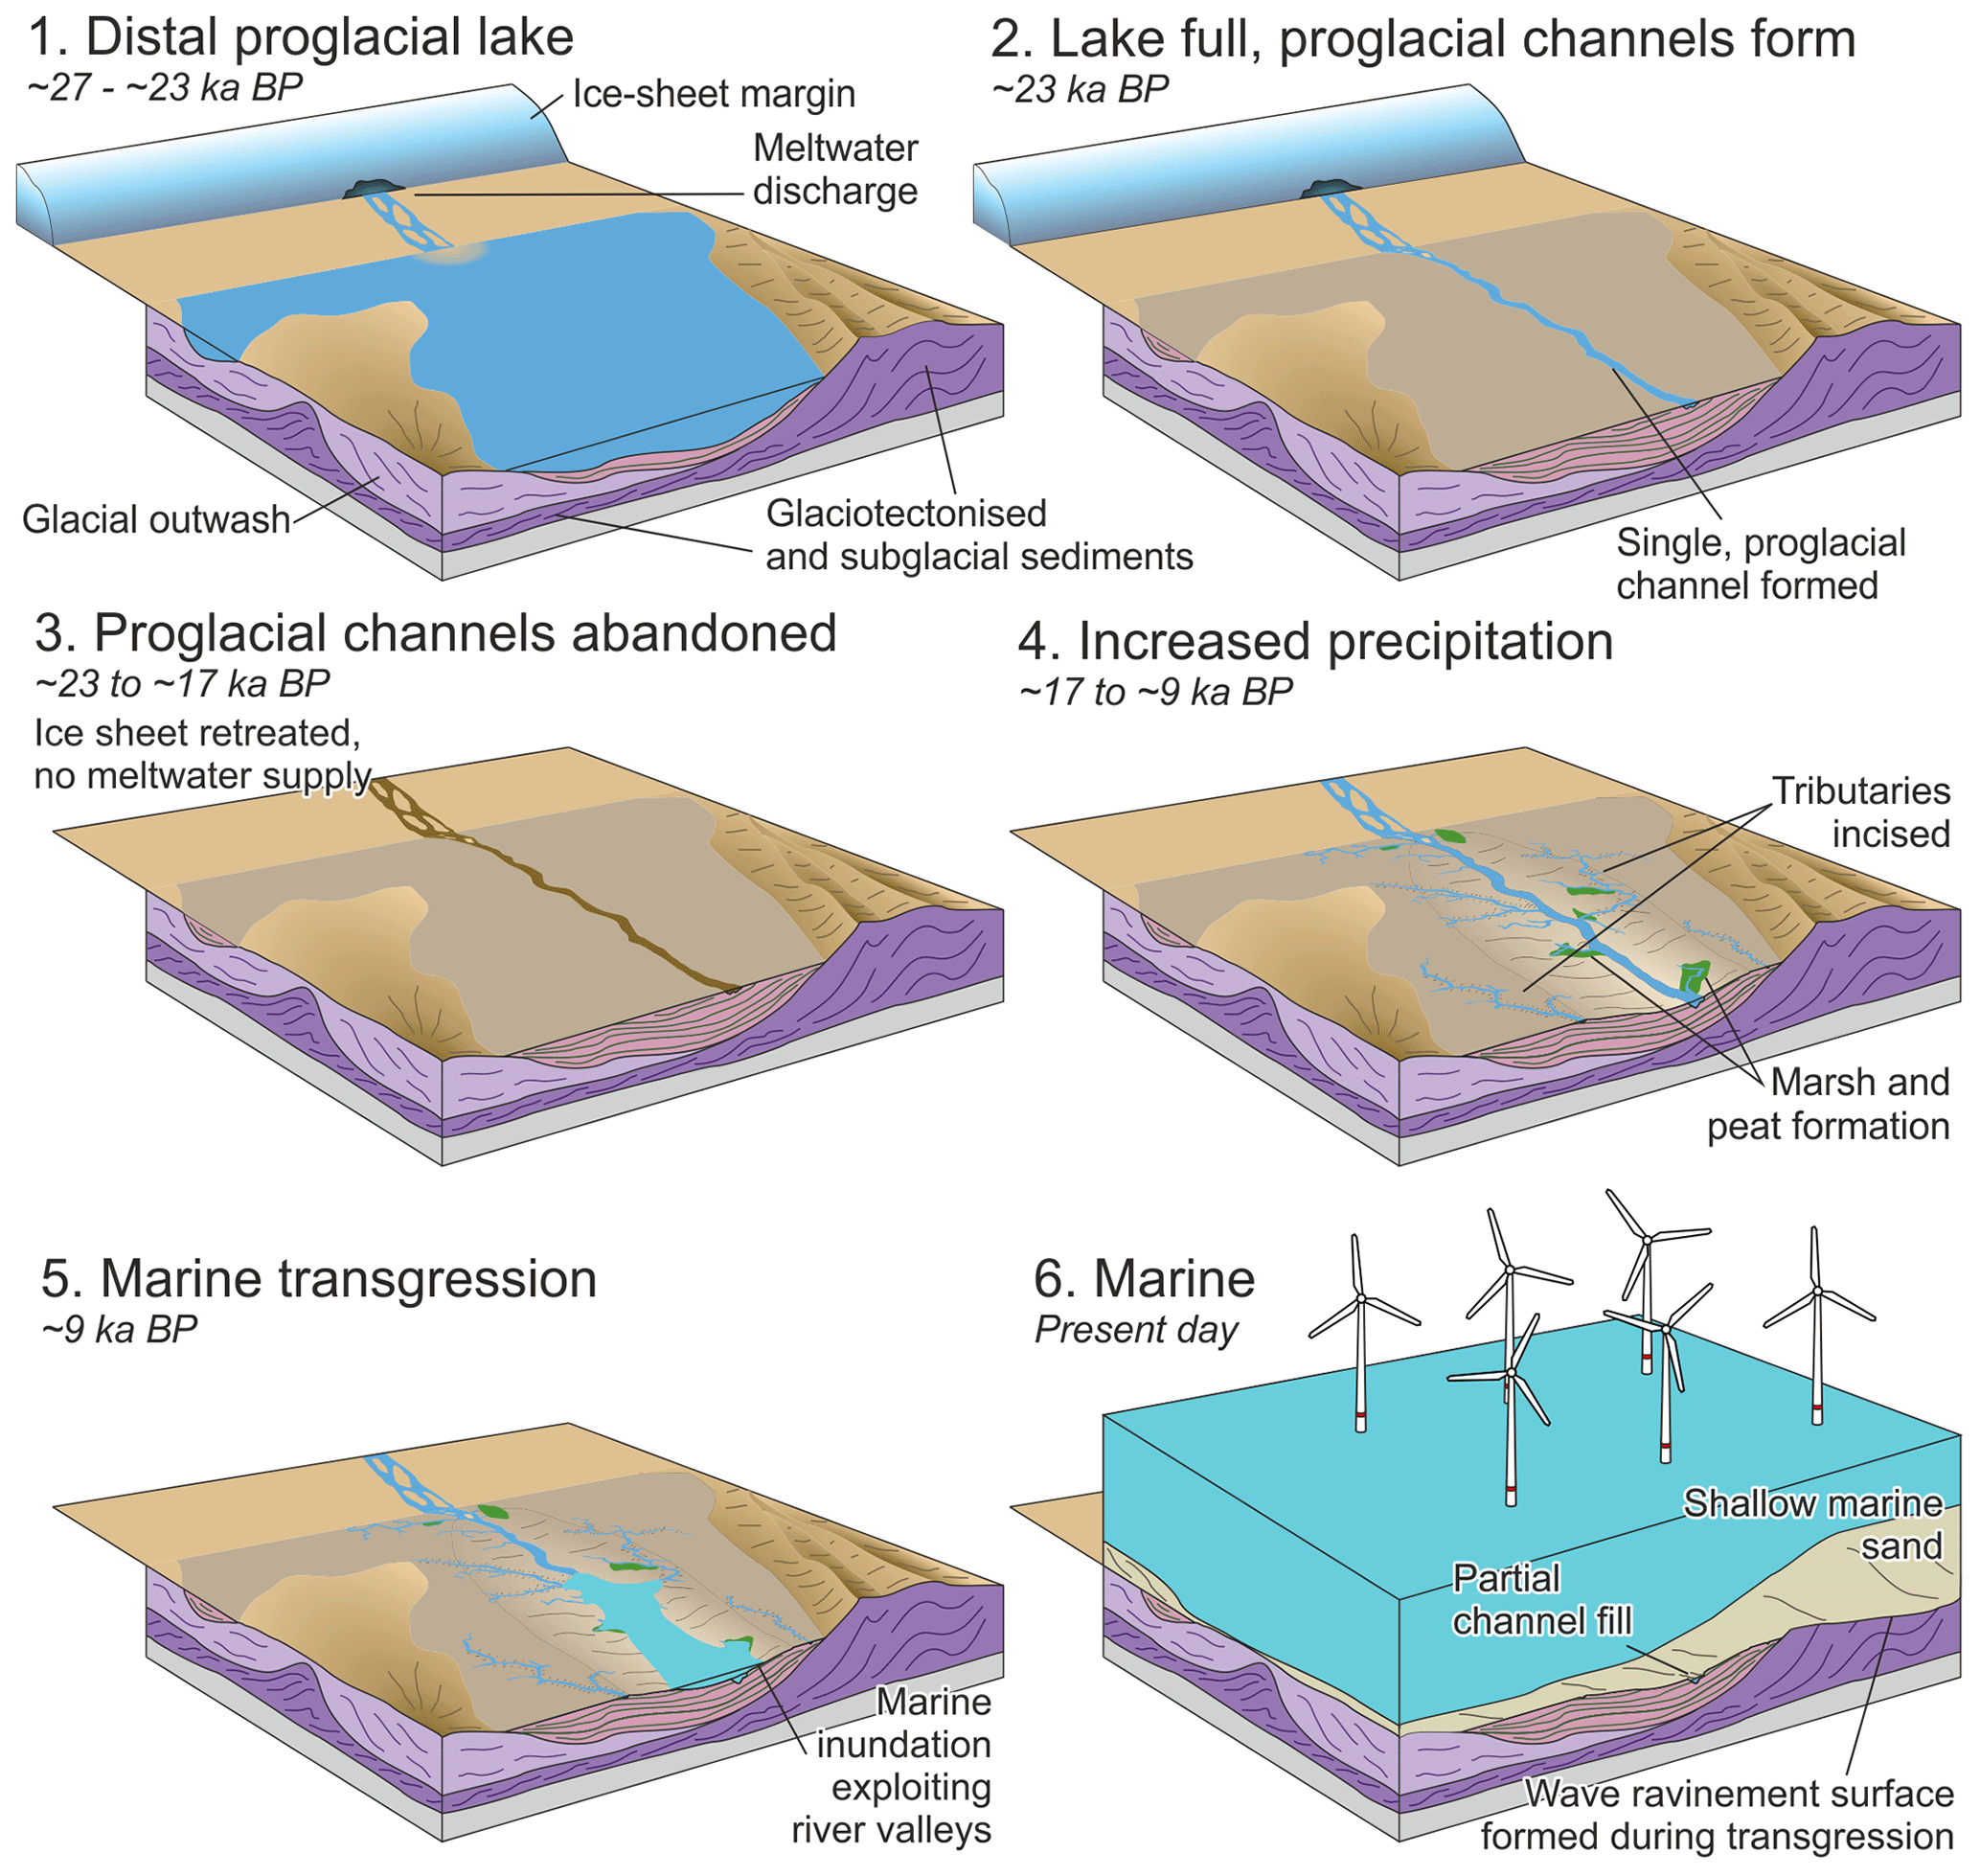
Figure 8Conceptual landscape evolution model for the study area, showing a single, representative proglacial channel. (1) Initial drainage of meltwater into the proglacial lake. (2) Proglacial lake gradually infilled with fine, draped sediments. Subsequently, proglacial lake accommodation filled, proglacial river channel incises into the fill. (3) Ice-sheet retreat and drainage reorganisation abandons the proglacial river channels. (4) Temperature and precipitation increase, tributaries incised. (5) Marine transgression floods the river channels first. (6) Final inundation, with wave ravinement, followed by deposition of shallow marine sand.
5.1 Landscape evolution
The northward retreat of the ice sheet from Dogger Bank left a landscape of glaciotectonites, glacial outwash, and proglacial lake-fill sediments (Cotterill et al., 2017b; Emery et al., 2019a; Roberts et al., 2018). The resulting landscape surface is likely to have been modified where the seabed and Horizon Z are coincident, and therefore reconstructing the original topographic template is challenging, although it is likely that the topography was low relief, as part of this land surface beyond the channels is planar (Fig. 3). This is in contrast to the landscape exposed in Tranche A of the Dogger Bank Forewind wind-farm project, to the west of this study area, which had an undulating surface of moraine highs and drainage channel lows (Cotterill et al., 2017b; Phillips et al., 2018). During this period of exposure, the land surface would have been a periglacial tundra with limited vegetation (Cotterill et al., 2017b), resulting in desiccation and overconsolidation of the sediments (Cotterill et al., 2017b; Emery et al., 2019a; Mesri and Ali, 1999).
The morphology and low sinuosity of main channels 1 and 2 reflects modern proglacial braided river channels (Carrivick and Russell, 2013), such as Icelandic glacial outlet rivers, e.g. Jökulsá á Fjöllum (Alho et al., 2005; Bristow and Best, 1993; Carrivick et al., 2007; Maizels, 1989; Marren, 2005; Marren and Toomath, 2014; Vandenberghe, 2001). Braided river channels often form in cold climates, such as proglacial settings, with a high sediment throughput, where there is little vegetation and the channels are unconfined (Bristow and Best, 1993; Marren, 2005). The individual Dogger Bank channels within the main channel body are separated by shallower sections, interpreted as braided channels separated by mounded braid bars with internal cross-bedding implying downstream accretion (Fig. 4c). Given the similarities in morphology to modern systems, we interpret that these channels formed in a proglacial setting, with meltwater containing a high sediment supply from the retreating ice sheet to the north, leading to erosion of tundra-plain surface (Fig. 8, stages 1 and 2). However, the width of the braid plains (400–1000 m) is modest and remains constant, which is in contrast to unconfined braid plains from modern day settings, such as Skeiðarársandur, Iceland, which are generally wider (>1000 m) and distributive. This relatively constant width implies the existence of a topographic constraint, such as the low-relief valleys (Fig. 3d), with the possibility that these valleys were once deeper, and the surrounding higher topography has been subsequently removed through wave ravinement during marine transgression (Emery et al., 2019b). It is difficult to test whether significant erosion has taken place due to the lack of a stratigraphic datum to correlate within the proglacial lake sediments, and such a correlation would require high vertical and spatial resolution of stratigraphic detail from borehole logs and seismic data that are beyond the capability of this dataset.
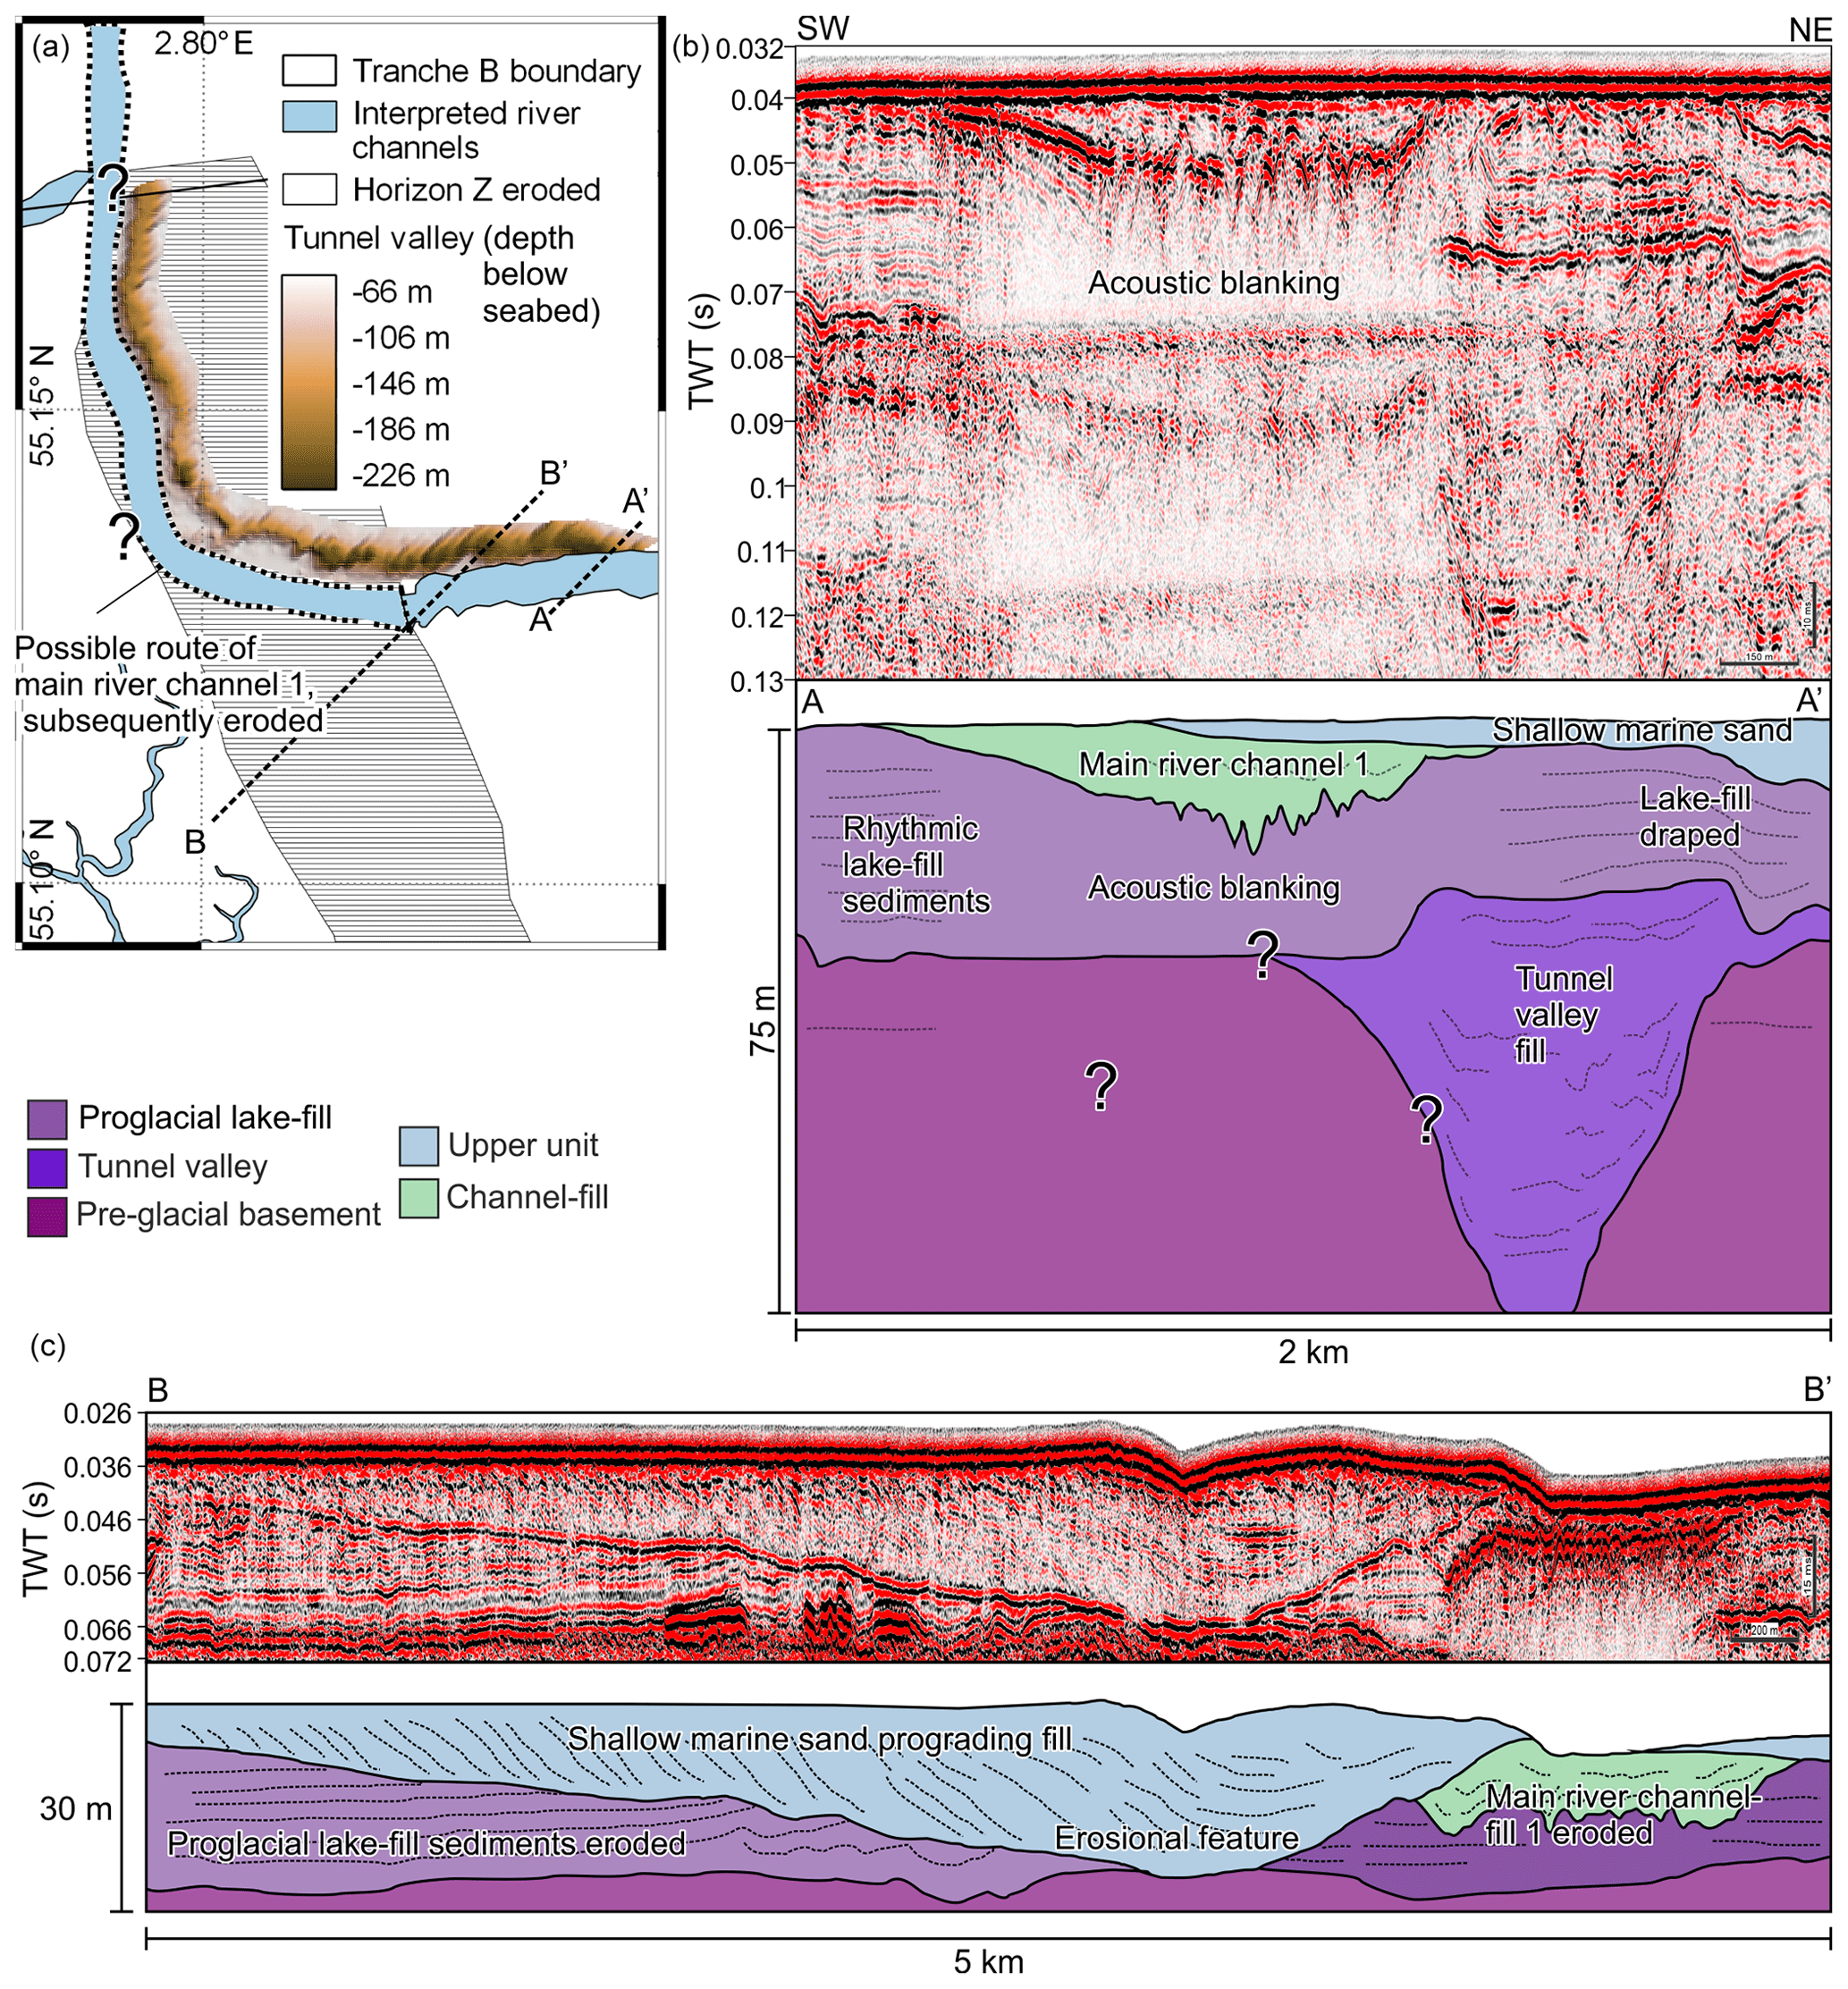
Figure 9(a) Tunnel valley observed underneath draped proglacial lake sediments and its possible control on the route of proglacial river channel 1. The proglacial river disappears and cannot be followed under the later erosional feature (grey hatching). (b) Seismic cross section through the tunnel valley, the draped proglacial lake sediments, and main river channel 1. Although they are a similar width, the tunnel valley is far deeper, approaching a 1:1 width-to-depth ratio. (c) Seismic cross section through erosional feature, showing the relationship to main river channel 1. The erosive feature erodes the channel-fill sediments.
The location of the proglacial channels was influenced by antecedent topography. The location of channel 1 parallels a subtle topographic high formed by a tunnel valley fill overlain by proglacial lake-fill sediments (Fig. 9). The tunnel valley fill has a ∼90∘ bend (from N–S to W–E trend) directly underneath an erosional feature that removes the head of channel 1. We suggest that channel 1 also changed trend here from flowing north–south to flowing west–east, to explain why channel 1 does not reappear beyond the erosional feature (Fig. 9). These features eroded to a deeper point than the base of the channel reaches, implying the channel was removed, as opposed to not being visible below the erosional features. Antecedent topography also affected the location of channel 2, which flowed down the axis of the former proglacial lake, and is located at the base of a shallow valley (Fig. 3d). This location implies there was a topographic constraint formed by the top surface of the former proglacial lake-fill sediments, which limited lateral migration and development of a distributive character. The topographic control may have been exacerbated by the clay-rich, overconsolidated, cohesive lake-fill sediments, which would reduce the ability of channels to migrate laterally.
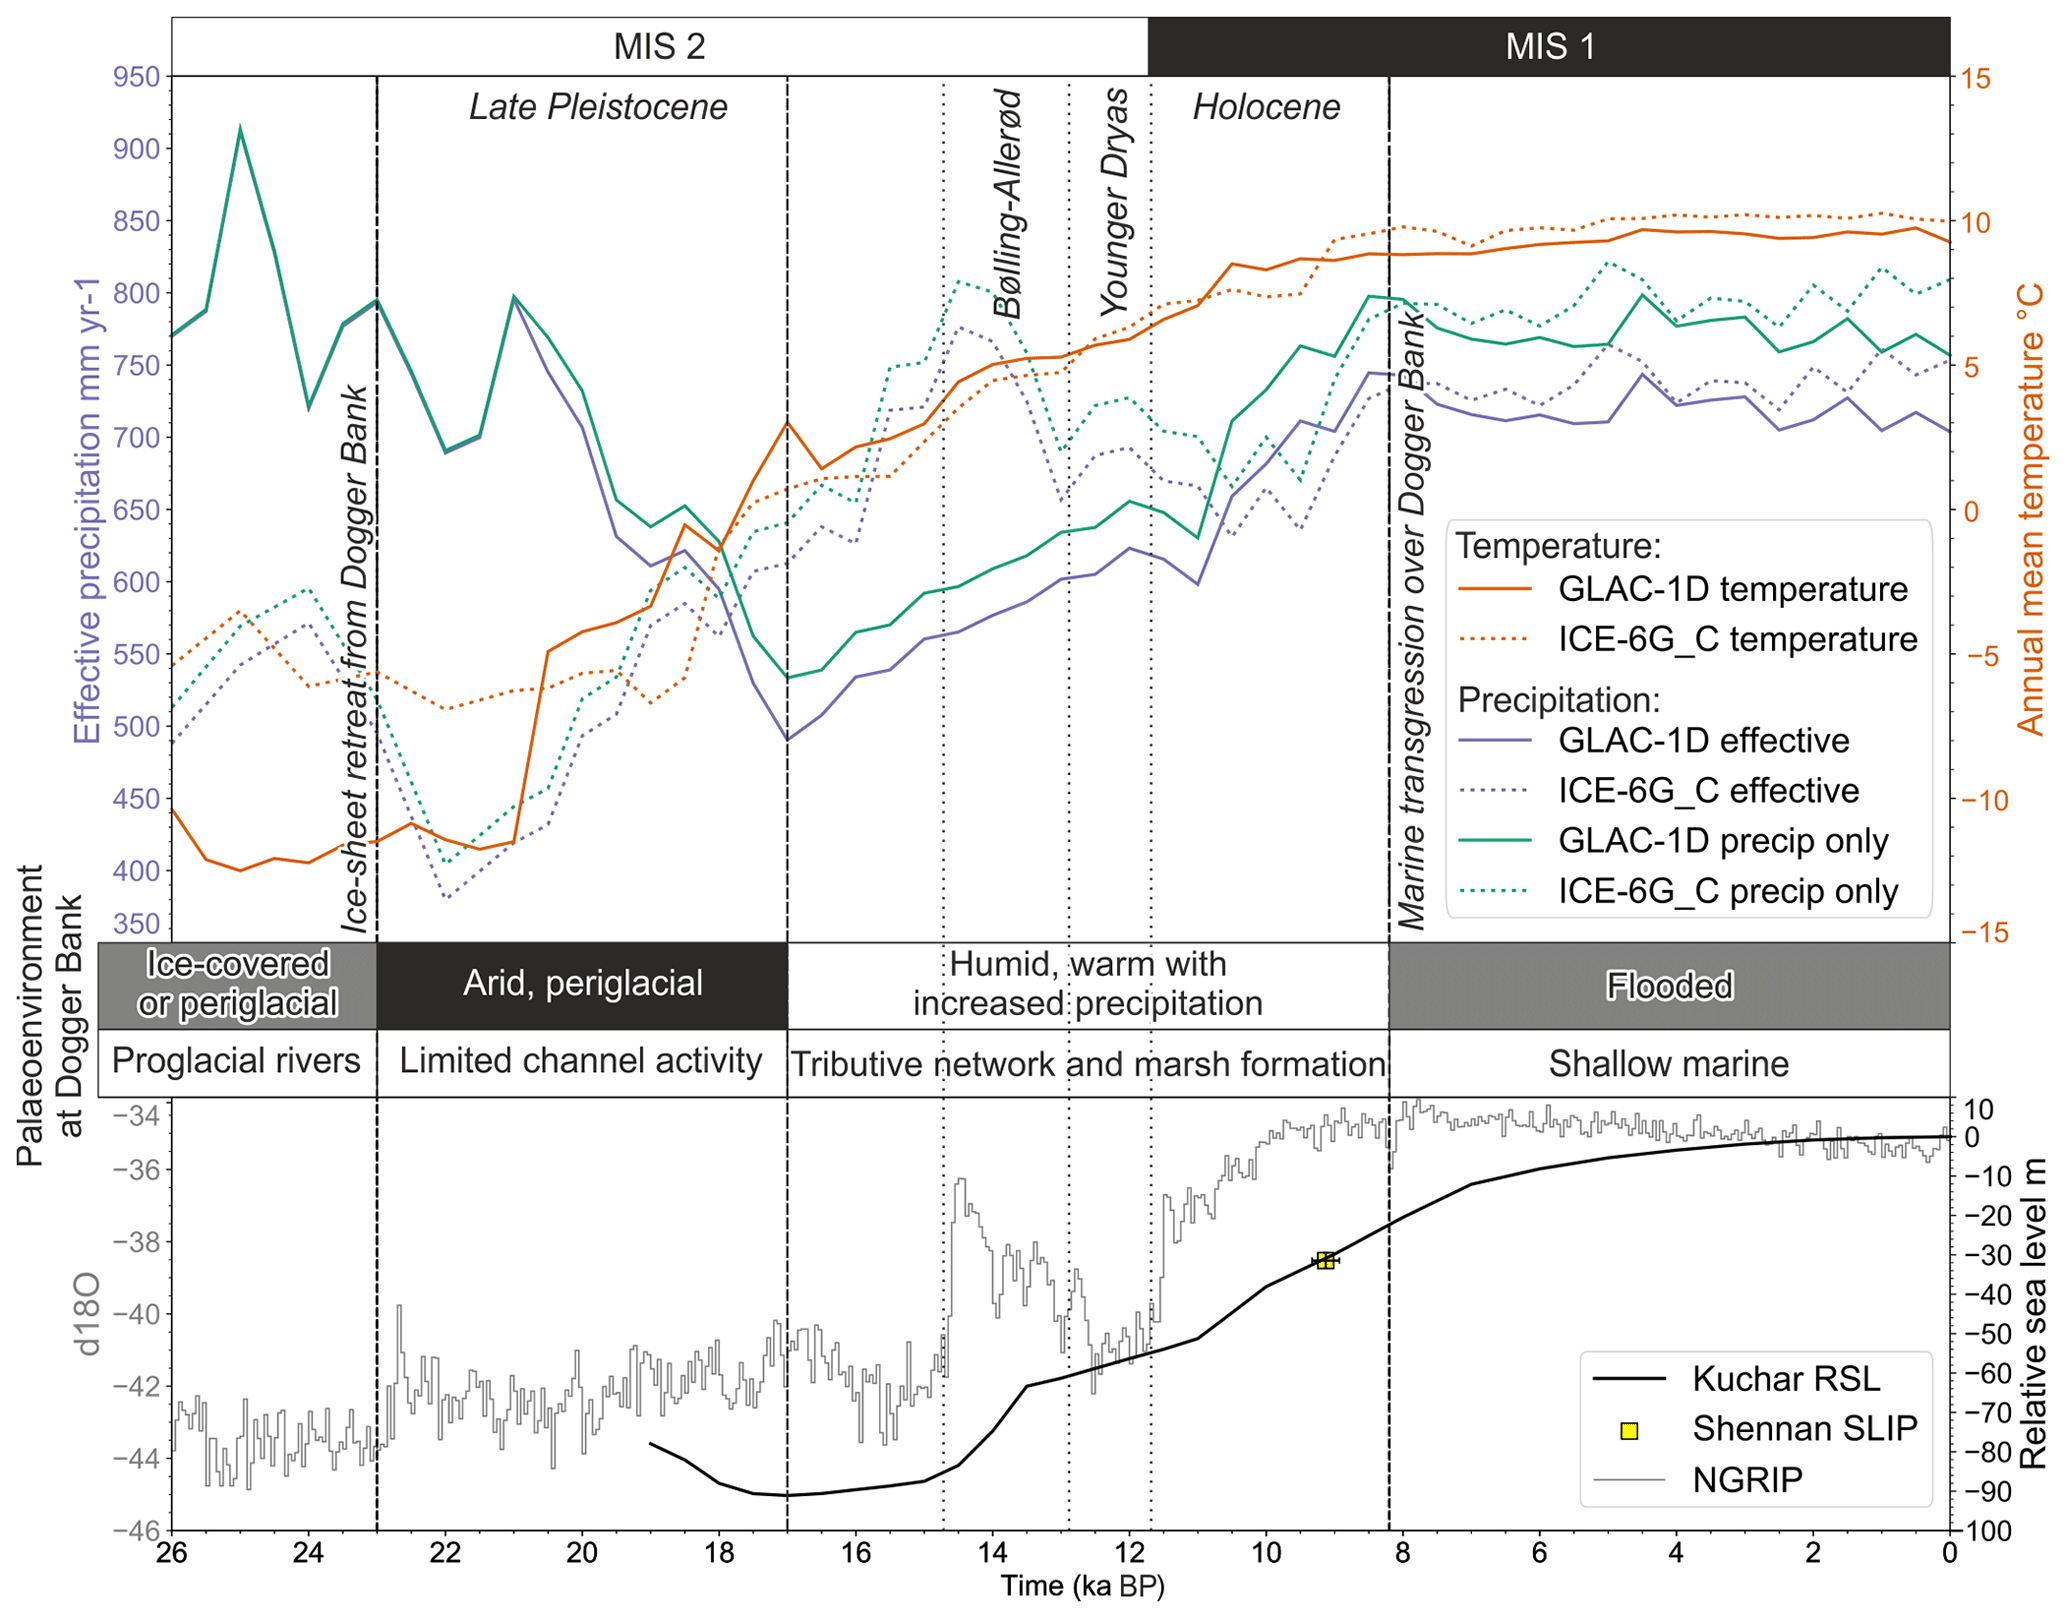
Figure 10Palaeoclimate model outputs showing temperature and effective precipitation for GLAC-1D and ICE-6G_C model runs. The interpretation of the palaeoenvironmental conditions at Dogger Bank is a distinct transition from cold and dry to warmer and wetter at approximately 17 ka. Also shown is the relative sea-level curve from Kuchar et al. (2012) and the sea-level index point from Shennan et al. (2000), plotted alongside the NGRIP ice core climate record (Andersen et al., 2004). RSL − relative sea level. SLIP − sea-level index point.
The braided proglacial rivers must have formed prior to the retreat of the ice sheet down from Dogger Bank. Retreat of the ice down the retrograde, northern slope of Dogger Bank lowered the ice-sheet basal elevation from −60 to −110 m (Emery et al., 2019a), therefore preventing meltwater from flowing onto and over Dogger Bank. The proglacial rivers formed when the retreating ice sheet was still on the topographic high of Dogger Bank, but after its retreat off the topographic high, the meltwater and sediment supply would have been insufficient to form rivers of this size and type. The ice sheet retreated from Dogger Bank prior to 23 ka (Emery et al., 2019a; Roberts et al., 2018), implying that the lake filled and the proglacial river channels developed prior to this date (Figs. 8 and 11). The ice sheet retreating northwards down the retrograde slope would have resulted in drainage capture by the northern slope of Dogger Bank. A similar situation of drainage reorganisation due to glacial retreat has been observed in the present day over decadal timescales (Bishop, 1995; Carter et al., 2013; Shugar et al., 2017). Meltwater would have rerouted parallel to the ice sheet margin and along the northern slope of Dogger Bank, resulting in ponding of meltwater in a ribbon lake to the north of Dogger Bank, supported by observations of proglacial lake-fill sediment accumulation to the north of Dogger Bank (Roberts et al., 2018). The topographic control on drainage and reduction of meltwater supply to the proglacial rivers on Dogger Bank would have resulted in flows that were underfit to the size of the proglacial river channels or their abandonment in the case of total meltwater switch-off. These proglacial rivers were therefore likely short-lived (possibly less than 1 kyr) as major conduits, between the proglacial lake filling and ice sheet retreat off the Dogger Bank topographic high. This short lifespan of the river highlights the interplay between ice-sheet retreat and stream reorganisation in controlling the hydrological evolution of a proglacial landscape.
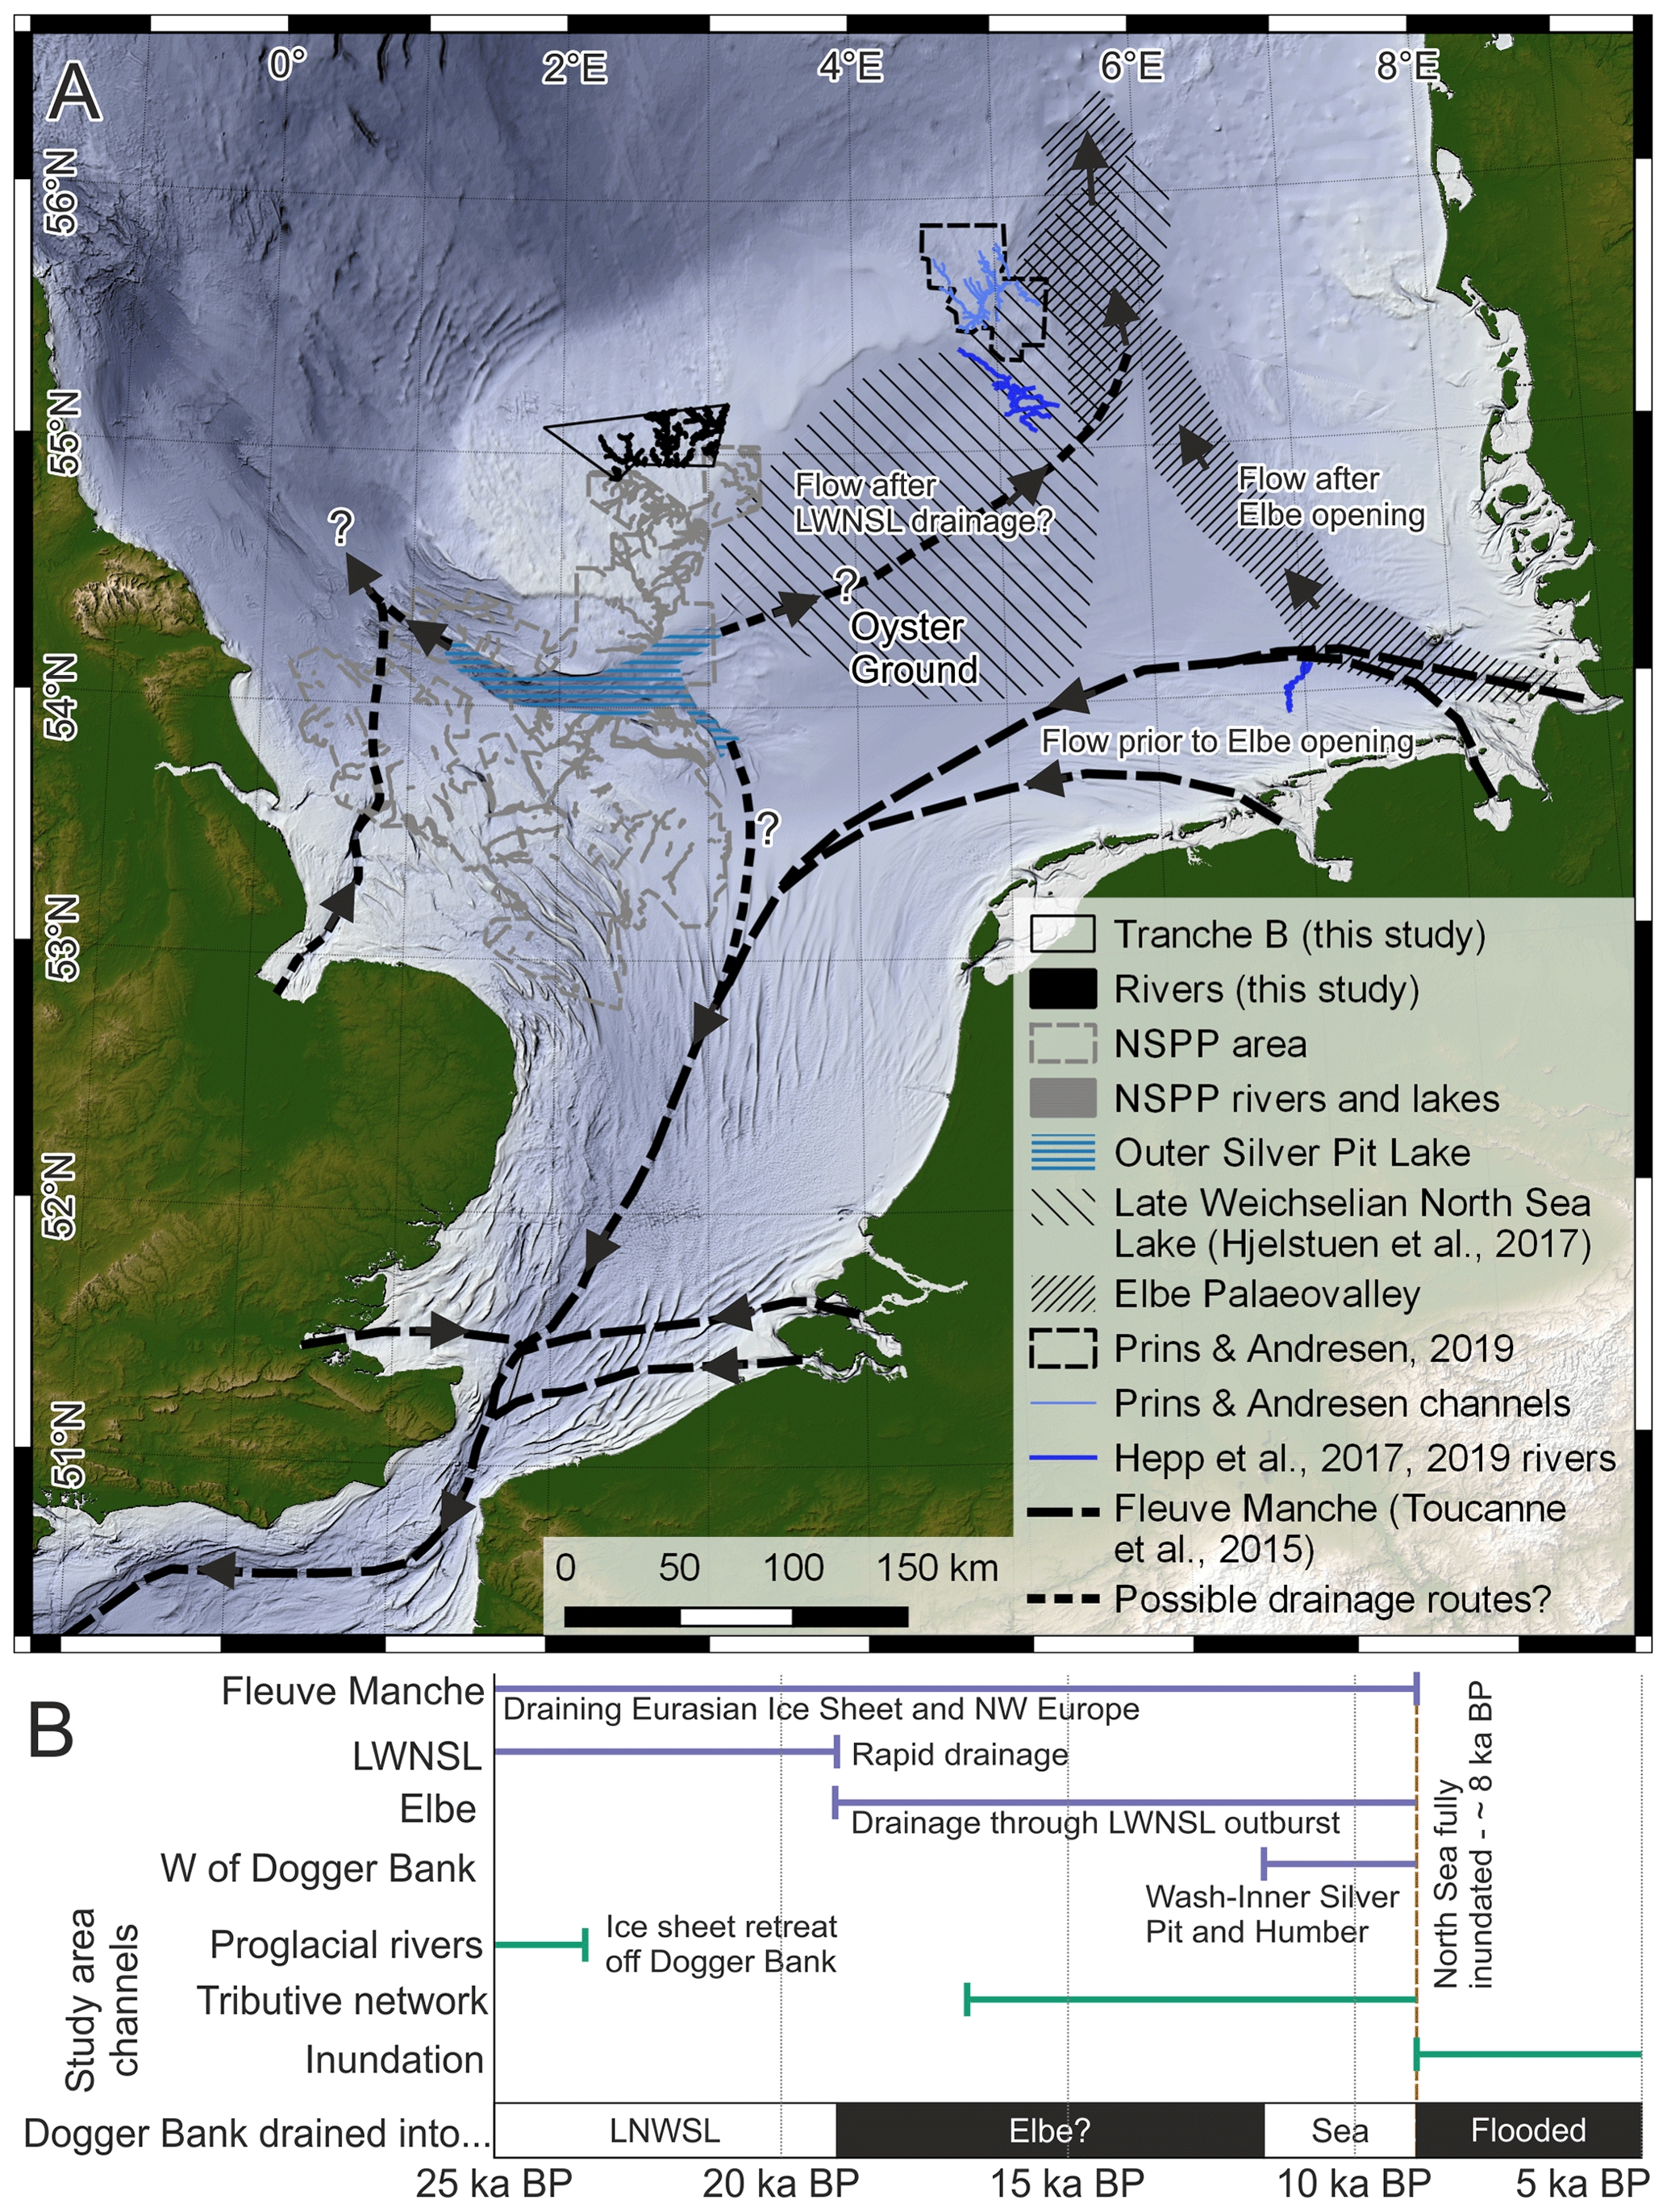
Figure 11(a) Compilation of the Late Pleistocene and Holocene lakes and drainage routes of the terrestrial southern North Sea basin. The map represents possible drainage routes at different times, where drainage may have been blocked by an ice sheet or ice-sheet retreat opened new drainage routes. The question marks represent the spatial and temporal uncertainty in drainage of the postglacial North Sea terrestrial area. LWNSL − Late Weichselian North Sea lake. NSPP − North Sea Palaeolandscape Project (Gaffney et al., 2007, 2009). (b) Timings of the existence of the features and the drainage route out of Dogger Bank.
Discharge variability fundamentally controls the geomorphology of river channels (Fielding et al., 2018; Nicholas et al., 2016). The coefficient of variance (CVQp) of a river system depends on the ratio of annual peak discharge divided by the mean peak discharge. Generally, in modern river systems with highly variable peak discharges (high CVQp), macroform structures such as braid bars are not formed or preserved (Amos et al., 2004; Fielding et al., 2009, 2018). In contrast, low-CVQp rivers readily form and preserve large macroforms with cross-bedding also well preserved. Cross-bedding is rarely seen in the seismic facies as it is likely to be below seismic resolution but is occasionally present (Fig. 4c). However, large braid bars are well-preserved and visible in the seismic data (Fig. 4), with some evidence of interbedding in CPT logs (e.g. CPTs H, K, O, and W; Fig. 3), and therefore appear to have been stable with limited reworking during the lifespan of the river. This preservation and bedform scale suggests that the river had a steady meltwater supply and low discharge variability, but preservation may have been enhanced by the sudden reduction in discharge when meltwater supply was switched off during northward ice-sheet retreat. It may be expected that rivers experiencing jökulhlaup flood events will have high CVQp values compared to annual peak discharge in non-jökulhlaup years (Russell et al., 2006). The steady meltwater supply implies that this sector of the retreating ice sheet did not produce jökulhlaups, whose discharge variability results in geomorphological characteristics similar to those of rivers with high CVQp (Carrivick et al., 2004b; Carrivick and Rushmer, 2006, 2009; Guan et al., 2015; Maizels, 1989, 1997; Marren, 2005; Marren et al., 2009; Staines et al., 2015). However, the relationship between CVQp and geomorphological characteristic has not yet been tested in rivers experiencing jökulhlaups (Fielding et al., 2018) and remains a topic for future research. There is no evidence within the preserved proglacial river channels or surrounding landscape of glacial outburst floods from the ice-sheet margin at this time (Carrivick et al., 2004a, 2013), which may support the interpretation of macroform and geomorphic preservation being a result of low discharge variability, implying a lack of outburst flood activity. Furthermore, limited aggradation of proglacial sediments contrasts with the transient landscape and associated sediment accumulations of proglacial forelands of jökulhlaup glaciers (Duller et al., 2014). A lack of outburst activity implies a well-ordered, efficient subglacial drainage system, and this is supported by evidence presented by Emery et al. (2019a) from ice streaming and small-scale subglacial meltwater channel morphology. It also may explain why there is a lack of Late Weichselian (MIS 2) tunnel valleys in the Dogger Bank area, contrasting with the tunnel valleys formed during previous episodes of ice sheets in this section of North Sea (Cotterill et al., 2017b; Lonergan et al., 2006; Praeg, 2003; Stewart et al., 2013; Stewart and Lonergan, 2011). The tunnel valley adjacent to, and controlling the location of, channel 1 (Fig. 9) is of unknown age but predates stratigraphy related to MIS 2 ice-sheet retreat and may be related to ice-sheet advance during MIS 3.
The isolated channels and tributaries, and main channel 3, have different morphologies to the two proglacial river channels (1 and 2). The isolated channels are all very similar and are therefore interpreted to have the same origin as tributaries that joined the main channels outside of the study area. The higher sinuosity (Fig. 7) of these smaller channels suggests formation under different conditions to the proglacial channels. The direction of drainage of the tributaries and streams is often perpendicular to the flow of the main channels (Fig. 6), following pre-existing slopes, such as the valley to the main proglacial channels (Fig. 3d). These smaller channels also have heads within the study area, unlike the proglacial channels, which suggests that they did not form due to meltwater. The long profiles of these tributaries show them to cut down to the base of the main channels (Fig. 7). The subdendritic pattern of these smaller channels, combined with their smaller size and higher sinuosity, and that they steepen into the main channels, suggests they formed later (Fig. 8, stage 4). The increase in sinuosity is interpreted to represent a warmer climate, with a more erodible substrate no longer bound by permafrost. The large, flat areas of high seismic amplitude (e.g. centre of Fig. 3b) are interpreted to represent marshy areas with the same seismic character as areas from which marshy plant macrofossils have been recovered (Wessex Archaeology, 2014). These marshy areas mainly occur over the proglacial lake-fill sediments, implying a low-permeability substrate that would have prevented groundwater flow of rainwater (Fig. 8). This in turn led to the development of the subdendritic drainage network, which is most developed and best preserved over the proglacial lake-fill sediments (Fig. 6), except for main channel 3, which developed over basal sub-unit 1, which consists of glaciotectonised and overconsolidated clays.
Only the proglacial river channels show evidence for aggradation of sediment within the channels (Fig. 4), with little evidence in the tributaries or overbank deposits (Fig. 5). These smaller river channels are only partially infilled by alluvial sediments, with the rest of the infill being shallow marine sand (Fig. 5). Models of relative sea-level rise suggest that inundation of the North Sea basin began around 16 ka (Brooks et al., 2011; Kuchar et al., 2012), resulting in a base-level rise for the drainage network (Fig. 10), which should result in aggradation within the drainage network. The lack of aggradation may be due to low discharge and sediment flux, with only a small local supply, or due to the drainage network being distant from the base-level rise, draining into a local depocentre, i.e. the previously abandoned proglacial river channels.
Marine transgression occurred in the study area between 9.5 and 8.5 ka (Cotterill et al., 2017b; Emery et al., 2019b; Shennan et al., 2000), inundating the incisional channel network first (Fig. 8). The small size and limited drainage basin area would not have been sufficient for aggradation under a rising base level to outpace the inundation by marine waters. This may explain the fine-grained channel-fill sediments observed in some CPTs (e.g. CPT L, CPT W; Fig. 3), as marine transgression would have modified the sedimentary environment in the sheltered estuaries to low-energy tidal mudflats, as observed elsewhere in the North Sea during Holocene marine transgression (Coughlan et al., 2018; Gaffney et al., 2009; Hepp et al., 2017, 2019; Prins and Andresen, 2019). The final stage of regional landscape evolution was continued marine transgression, with associated ravinement of the pre-existing topography (Figs. 3 and 8; Cotterill et al., 2017b; Emery et al., 2019a). The large, elongate features that incise into Horizon Z, the channel fills, and underlying basal seismic unit are interpreted to have formed at this stage as large tidal scours (Fig. 9c). Continued relative sea-level rise and the transport of sediment, shown by the broadly west to east dip direction of sigmoidal to oblique reflections in the upper seismic unit (Fig. 4c), resulted in the deposition of shallow marine sand that completed the infill of the channels and the tidal scour features.
5.2 Impact of changing palaeoclimate on terrestrial landscape evolution
Between deglaciation of Dogger Bank (> ca. 23 ka) and marine transgression at ca. 8 ka, the landscape was subaerially exposed for a 15 kyr period during which the channel network formed. By linking palaeoclimate model data to the stratigraphic observations, it is possible to infer climatic changes that led to the formation of the channels in the absence of age constraints. The overconsolidation of the proglacial lake-fill sediments in the study area has been interpreted as a response to desiccation during subaerial exposure, rather than loading by ice-sheet readvance, as supported by their stratigraphic position above subglacial and glaciotectonised sediments, and the lack of glaciotectonic deformation within the lake fill (Cotterill et al., 2017b; Emery et al., 2019a). The desiccation would have required low precipitation, most likely under periglacial conditions. However, the presence of the more sinuous, dendritic channel network incising into the desiccated lake-fill sediments suggests an increase in precipitation. Radiocarbon dates from waterlogged marshland plant remains in boreholes in Tranche B give Bølling–Allerød Interstadial dates (14 890–14 010 and 13 810–13 480 cal BP), which contain cold-temperate plant pollen such as transitional Pinus and dwarf birch Betula nana species and sedge, rush, and bogbean recovered in the same sample (Wessex Archaeology, 2014). These plant and pollen assemblages are similar to those observed to the east at Slotseng, Denmark (Mortensen et al., 2011). This is in line with observations from records throughout the North Sea basin (Brown et al., 2018; Gearey et al., 2017; Smith et al., 2007; Tappin et al., 2011). The pollen suggests a transition from arid, periglacial conditions responsible for desiccation of the glacial sediments to a wetter climate that allowed formation of marshes and river channels, at some point prior to 15 ka (Bølling–Allerød Interstadial).
Two palaeoclimate simulations using the GLAC-1D and ICE-6G_C ice-sheet models were run, giving differing results. The GLAC-1D ice-sheet model uses the DATED-1 chronological database for the Eurasian Ice Sheet (Hughes et al., 2016), which gives a realistic reconstruction of the ice sheet and palaeogeography of the British Isles, and thus provides the more up-to-date chronology for Eurasian Ice Sheet evolution. However, the DATED-1 database shows Dogger Bank to be glaciated until 19 ka, as opposed to deglaciated by 23 ka (Emery et al., 2019a; Roberts et al., 2018). Therefore, the climate evolution simulated in the Dogger Bank area may be biased and simulated as too young during this early time window (23–19 ka). Nevertheless, it should provide a more faithful representation of climate thereafter.
Effective precipitation (precipitation minus evaporation) trends from the GLAC-1D simulations show a general decrease in precipitation from 26 to 17 ka, whereas the ICE-6G_C runs show an increase from 22 ka to a maximum at 14 ka (Fig. 10). The fluctuating, high precipitation outputs from GLAC-1D may be related to the local presence of a modelled ice sheet during this time, when it should have been largely deglaciated. During the same time period, mean annual temperature (MAT) increased from −12 ∘C at 21 ka to 0∘ C at around 17.5 ka (Fig. 10), driven by rising atmospheric CO2 and increasing summer insolation. Between 17 ka and marine transgression at ca. 8 ka, MAT and precipitation continued to increase to 10 ∘C and ∼750 mm yr−1, respectively. Notably, the large climate excursions documented for the Bølling–Allerød and Younger Dryas periods (e.g. as recorded in the NGRIP ice core record; Fig. 10; Andersen et al., 2004) are not captured by either set of simulations due to the nature of the experiment design. These are equilibrium-type simulations spaced at 500-year intervals, and therefore the simulations do not have the temporal resolution to capture abrupt climate events and meltwater pulses from ice melt (such as have been used to simulate these events in the past, e.g. Liu et al., 2009). Nonetheless, the ICE-6G_C model run shows a peak in rainfall during the Bølling–Allerød period, when the North American ice sheet undergoes rapid deglaciation in the ICE-6G_C reconstruction, represented by the removal of large segments of the ice sheet between time steps in the reconstruction, which is captured by the climate model, affecting surface energy balance and atmospheric circulation (e.g. Löfverström and Lora, 2017). Important for the Dogger Bank region, the GLAC-1D runs, which have the more accurate local deglaciation history after 19 ka (see Sect. 3.4), show a steady increase in precipitation from 17 to 11 ka, followed by a rapid increase in precipitation during the Early Holocene.
We interpret the time period from deglaciation at 23 ka to MAT reaching 0 ∘C and precipitation increase at 17 ka, as an arid, periglacial environment. During these 6000 years, desiccation of the glacial sediments occurred, with limited tributive channel development (Fig. 10). After 17 ka, rising CO2 and summer insolation along with the strong climatic influence of the deglaciating Northern Hemisphere ice sheets drives increased precipitation and temperature, which would have resulted in elevated humidity and the onset of ponding and drainage of precipitation on Dogger Bank, as recorded by the marshy, waterlogged areas in borehole records, and the incision of the channel network and drainage into the previously abandoned large channels over ca. 9 kyr (Fig. 10). The uncertainty in the early part of the palaeoclimate simulations due to ice-sheet models, from 26 to 17 ka, could potentially allow for a change to a more humid, higher-precipitation climate from earlier than 17 ka. This would allow more time for the dendritic drainage channel network to form but less time, with little precipitation, for the desiccation of the glaciogenic sediments. On the balance of these two factors, we prefer the interpretation of 17 ka being the onset of a warmer climate with more precipitation, which initiated marshland and the drainage network on top of desiccated proglacial lake-fill and glacial outwash sediments.
5.3 Where did the water go? Palaeogeography of the southern North Sea
Numerous studies have identified Late Pleistocene to Holocene channel networks of a similar stratigraphic position to those in this study (Busschers et al., 2007; Fitch et al., 2005; Gaffney et al., 2007, 2009; Hepp et al., 2017, 2019; Hijma and Cohen, 2011; Prins and Andresen, 2019). During this period, main channels 1 and 2 were active as proglacial channels draining the margin of the Eurasian Ice Sheet into the Late Weichselian North Sea lake, a large proglacial lake proposed to have existed to the south of Dogger Bank (Becker et al., 2018; Hjelstuen et al., 2017; Jansen et al., 1979; Murton and Murton, 2012; Roberts et al., 2018; Sejrup et al., 2016; Toucanne et al., 2010). The proglacial channels would have drained directly into this lake (Fig. 11), until the ice retreated off the topographic high at ca. 23 ka to cut off the meltwater and sediment supply. The Late Weichselian North Sea lake drained rapidly ca. 18.7 ka through the Elbe Palaeovalley mouth (Becker et al., 2018; Hjelstuen et al., 2017), leaving the Oyster Ground subaerially exposed. After lake drainage, there were two drainage outlets to the ocean: (i) the Fleuve Manche system draining south and westwards (Bourillet et al., 2003; Gibbard et al., 1988; Mellett et al., 2013; Toucanne et al., 2010, 2015), which drained the Rhine–Meuse and Thames, and (ii) the Elbe Palaeovalley, which drained the Elbe, Weser, and Ems rivers (Figge, 1980; Gibbard et al., 1988; Hepp et al., 2017; Toucanne et al., 2015) into the Norwegian Trough (Fig. 11). A third outlet opened after marine transgression inundated the lower-elevation areas north and west of Dogger Bank, eventually inundating the Outer Silver Pit between 12 and 10 ka (Brooks et al., 2011; Shennan et al., 2000; Sturt et al., 2013).
The large areas that remain uncovered by similar datasets, especially in relation to the area formerly covered by the Late Weichselian North Sea lake, make the location of where the rivers in the study area drained challenging to constrain (Fig. 11). Most rivers interpreted from seismic data during the North Sea Palaeolandscape Project (Fitch et al., 2005; Gaffney et al., 2007, 2009) drain into the Outer Silver Pit lake (separate to the Late Weichselian North Sea lake), but it is not known in what direction. The present-day bathymetry of the Oyster Ground shows little topography, with no evidence of transgressed drainage networks expressed at the seabed. The rivers of Dogger Bank may have drained into the Outer Silver Pit lake. Then, it drained northwards into the gradually transgressing northern North Sea via the Wash–Inner Silver Pit and Humber rivers, southwards into the Fleuve Manche system, or eastwards into the Elbe Palaeovalley (Fig. 11). The general direction of palaeoriver flow identified east of Dogger Bank (Hepp et al., 2017, 2019; Prins and Andresen, 2019) is towards the Elbe Palaeovalley, similar to that observed in our study area and the northern area of the North Sea Palaeolandscape Project, south of Dogger Bank (Fitch et al., 2005; Gaffney et al., 2007, 2009). We propose that the proglacial rivers initially drained into the Late Weichselian North Sea lake. After the drainage network began to form at ca. 17 ka, the Elbe Palaeovalley became the mostly likely outlet for the palaeorivers of Dogger Bank (Fig. 11). Further investigation of seismic reflection data over a wider area will permit the postglacial stratigraphic evolution of the drainage networks in the southern North Sea basin to be better constrained, with implications for understanding human interaction and migration through the landscape during the Late Pleistocene.
Investigation of the high-resolution, integrated dataset of the 2D seismic reflection grid lines and CPT logs has revealed an environment in transition from glacial through terrestrial to marine conditions, marked by Horizon Z, a prominent unconformity present across the area. Mapping of Horizon Z revealed a network of channels that incise and therefore postdate glaciogenic and proglacial lake sediments but are buried under shallow marine sand. These channels, along with Horizon Z, are interpreted to represent the terrestrial landscape at Dogger Bank that developed during the period between ice sheet retreat and marine transgression.
Two different types and generations of river channels with distinct morphologies have been defined. The first channel set comprises two ∼400 m wide, low-sinuosity braided rivers. These braided rivers are interpreted to have formed as proglacial meltwater-fed rivers, which drained the margin of the ice sheet prior to its retreat from Dogger Bank at 23 ka. Good preservation of macroforms and evidence of cross-bedding may imply that annual mean discharge variability was low or were preserved either partly or entirely due to sudden abandonment. Potential low discharge variability may suggest a lack of glacial outburst floods, although modern-day analogues have not been studied in terms of discharge variability in rivers susceptible to outburst floods. Furthermore, there is no evidence of outburst floods for the ice-sheet margin at this time. The second set of river channels is more sinuous and generally narrower (∼200 m), forms a subdendritic network, and cuts down perpendicular to the larger river channels, implying they formed later. Palaeoclimate modelling showed a cold, arid period between ice sheet retreat at 23 and 17 ka, after which the climate became increasingly warm and wet, which correlates to marsh environments at Dogger Bank ca. 14.9–13.5 ka. The second channel set formed during the time period from 17 ka prior to marine transgression at ca. 8 ka, during a period of increased precipitation. The first channel set is likely to have drained into the Late Weichselian North Sea lake, which drained rapidly through the Elbe Palaeovalley at 18.7 ka. The second set of channels is likely to have drained through the former Late Weichselian North Sea lake basin and out through the Elbe Palaeovalley. Overall, this transition from proglacial rivers to terrestrial drainage with increased precipitation, and the subsequent preservation of the channels, is rarely observed in sedimentary archives and offers a valuable insight into the controls of topography and climate on landscape evolution. The evolution of the Late Pleistocene drainage system also provides an opportunity to target submerged sites that can help to improve understanding of how humans interacted with this low-relief landscape.
The data used in this article are not publicly available as they are commercially sensitive site investigation datasets.
ARE undertook the research and wrote the article. DMH, NLMB, JLC, CJC, and CLM provided input on the article and supported the original research. JCR provided input on fluvial geomorphometric methods. RFI designed and undertook palaeoclimate modelling.
The authors declare that they have no conflict of interest.
The authors thank the Forewind wind-farm project for supplying the data. Thanks to Bartosz Kurjanski, Brice Rea, and Nick Schofield at the University of Aberdeen for software support. Thanks to Niall Gandy for NetCDF support. We thank Stuart Grieve for providing the Python script used to calculate sinuosity. Daniel Hepp and Lasse Prins are thanked for their provision of shapefiles of channels in the North Sea. Nigel Mountney and Colm Ó Cofaigh are thanked for their discussions on an earlier version of this manuscript. Carol J. Cotterill publishes with permission of the director of the British Geological Survey. The two anonymous reviewers, Associate Editor Susan Conway, and Editor Andreas Lang are thanked for handling of the manuscript and extensive, constructive reviews, which greatly improved this article.
Andy R. Emery was funded by the Leeds Anniversary Research Scholarship. The contribution from RFI was supported by NERC grant NE/K008536/1 and UKRI grant no. MR/S016961/1.
This paper was edited by Susan Conway and reviewed by two anonymous referees.
Alho, P., Russell, A. J., Carrivick, J. L., and Käyhkö, J.: Reconstruction of the largest Holocene jökulhlaup within Jökulsá á Fjöllum, NE Iceland, Quaternary Sci. Rev., 24, 2319–2334, https://doi.org/10.1016/j.quascirev.2004.11.021, 2005.
Amos, K. J., Alexander, J., Horn, A., Pocock, G. D., and Fielding, C. R.: Supply limited sediment transport in a high-discharge event of the tropical Burdekin River, North Queensland, Australia, Sedimentology, 51, 145–162, https://doi.org/10.1111/j.1365-3091.2004.00616.x, 2004.
Andersen, K. K., Azuma, N., Barnola, J.-M., Bigler, M., Biscaye, P., Caillon, N., Chappellaz, J., Clausen, H. B., Dahl-Jensen, D., Fischer, H., Flückiger, J., Fritzsche, D., Fujii, Y., Goto-Azuma, K., Grønvold, K., Gundestrup, N. S., Hansson, M., Huber, C., Hvidberg, C. S., Johnsen, S. J., Jonsell, U., Jouzel, J., Kipfstuhl, S., Landais, A., Leuenberger, M., Lorrain, R., Masson-Delmotte, V., Miller, H., Motoyama, H., Narita, H., Popp, T., Rasmussen, S. O., Raynaud, D., Rothlisberger, R., Ruth, U., Samyn, D., Schwander, J., Shoji, H., Siggard-Andersen, M.-L., Steffensen, J. P., Stocker, T., Sveinbjörnsdóttir, a E., Svensson, A., Takata, M., Tison, J.-L., Thorsteinsson, T., Watanabe, O., Wilhelms, F., and White, J. W. C.: High-resolution record of Northern Hemisphere climate extending into the last interglacial period, Nature, 431, 147–151, https://doi.org/10.1038/nature02805, 2004.
Bailey, G. N., Harff, J., and Sakellariou, D.: Under the Sea: Archaeology and Palaeolandscapes of the Continental Shelf, edited by: Bailey, G. N., Harff, J., and Sakellariou, D., Springer International Publishing, Cham, 2017.
Becker, L. W. M., Sejrup, H. P., Hjelstuen, B. O., Haflidason, H., and Dokken, T. M.: Ocean-ice sheet interaction along the SE Nordic Seas margin from 35 to 15 ka BP, Mar. Geol., 402, 99–117, https://doi.org/10.1016/j.margeo.2017.09.003, 2018.
Bicket, A. and Tizzard, L.: A review of the submerged prehistory and palaeolandscapes of the British Isles, Proc. Geol. Assoc., 126, 643–663, https://doi.org/10.1016/j.pgeola.2015.08.009, 2015.
Bicket, A. R., Mellett, C. L., Tizzard, L., and Waddington, C.: Exploring Holocene palaeogeography in the `white ribbon': a Mesolithic case study from the Northumberland coast, J. Quaternary Sci., 32, 311–328, https://doi.org/10.1002/jqs.2897, 2016.
Bishop, P.: Drainage rearrangement by river capture, beheading and diversion, Prog. Phys. Geogr., 19, 449–473, https://doi.org/10.1177/030913339501900402, 1995.
Bourillet, J.-F., Reynaud, J. Y., Baltzer, A., and Zaragosi, S.: The “Fleuve Manche”: The submarine sedimentary features from the outer shelf to the deep-sea fans, J. Quaternary Sci., 18, 261–282, https://doi.org/10.1002/jqs.757, 2003.
Briggs, R. D., Pollard, D., and Tarasov, L.: A data-constrained large ensemble analysis of Antarctic evolution since the Eemian, Quaternary Sci. Rev., 103, 91–115, https://doi.org/10.1016/j.quascirev.2014.09.003, 2014.
Bristow, C. S. and Best, J. L.: Braided rivers: perspectives and problems, Geol. Soc. London, Spec. Publ., 75, 1–11, https://doi.org/10.1144/GSL.SP.1993.075.01.01, 1993.
Brooks, A. J., Bradley, S. L., Edwards, R. J., and Goodwyn, N.: The Palaeogeography of Northwest Europe during the last 20,000 years, J. Maps, 5647, 573–587, https://doi.org/10.4113/jom.2011.1160, 2011.
Brown, A., Russell, J., Scaife, R. G., Tizzard, L., Whittaker, J., and Wyles, S. F.: Lateglacial/early Holocene palaeoenvironments in the southern North Sea Basin: new data from the Dudgeon offshore wind farm, J. Quaternary Sci., 33, 597–610, https://doi.org/10.1002/jqs.3039, 2018.
Busschers, F. S., Kasse, C., van Balen, R. T., Vandenberghe, J., Cohen, K. M., Weerts, H. J. T., Wallinga, J., Johns, C., Cleveringa, P., and Bunnik, F. P. M.: Late Pleistocene evolution of the Rhine-Meuse system in the southern North Sea basin: imprints of climate change, sea-level oscillation and glacio-isostacy, Quaternary Sci. Rev., 26, 3216–3248, https://doi.org/10.1016/j.quascirev.2007.07.013, 2007.
Cameron, T. D. J., Stoker, M. S., and Long, D.: The history of Quaternary sedimentation in the UK sector of the North Sea Basin, J. Geol. Soc. Lond., 144, 43–58, https://doi.org/10.1144/gsjgs.144.1.0043, 1987.
Cameron, T. D. J., Crosby, A., Balson, P., Jeffery, D. H., Lott, G. K., Bulat, J., and Harrison, D. J.: United Kingdom offshore regional report: the geology of the southern North Sea, HMSO, London, 1992.
Carr, S. J., Holmes, R., van der Meer, J. J. M., and Rose, J.: The Last Glacial Maximum in the North Sea Basin: Micromorphological evidence of extensive glaciation, J. Quaternar Sci., 21, 131–153, https://doi.org/10.1002/jqs.950, 2006.
Carrivick, J. L. and Rushmer, E. L.: Understanding high-magnitude outburst floods, Geol. Today, 22, 60–65, https://doi.org/10.1111/j.1365-2451.2006.00554.x, 2006.
Carrivick, J. L. and Rushmer, E. L.: Inter- And intra-catchment variations in proglacial Geomorphology: An example from Franz Josef glacier and fox glacier, New Zealand, Arct. Antarct. Alp. Res., 41, 18–36, https://doi.org/10.1657/1523-0430-41.1.18, 2009.
Carrivick, J. L. and Russell, A. J.: Glaciofluvial Landforms of Deposition, in: Encyclopedia of Quaternary Science, 2nd Edn., Elsevier, Amsterdam, 6–17, 2013.
Carrivick, J. L., Russell, A. J., and Tweed, F. S.: Geomorphological evidence for jökulhlaups from Kverkfjöll volcano, Iceland, Geomorphology, 63, 81–102, https://doi.org/10.1016/j.geomorph.2004.03.006, 2004a.
Carrivick, J. L., Russell, A. J., Tweed, F. S., and Twigg, D.: Palaeohydrology and sedimentary impacts of jökulhlaups from Kverkfjöll, Iceland, Sediment. Geol., 172, 19–40, https://doi.org/10.1016/j.sedgeo.2004.07.005, 2004b.
Carrivick, J. L., Pringle, J. K., Russell, A. J., and Cassidy, N. J.: GPR-derived sedimentary architecture and stratigraphy of outburst flood sedimentation within a bedrock valley system, Hraundalur, Iceland, J. Environ. Eng. Geophys., 12, 127–143, https://doi.org/10.2113/JEEG12.1.127, 2007.
Carrivick, J. L., Tweed, F. S., Carling, P., Alho, P., Marren, P. M., Staines, K., Russell, A. J., Rushmer, E. L. and Duller, R.: Discussion of “Field evidence and hydraulic modeling of a large Holocene jökulhlaup at Jökulsá á Fjöllum channel, Iceland” by Douglas Howard, Sheryl Luzzadder-Beach and Timothy Beach, 2012, Geomorphology, 201, 512–519, https://doi.org/10.1016/j.geomorph.2012.10.024, 2013.
Carter, S. P., Fricker, H. A., and Siegfried, M. R.: Evidence of rapid subglacial water piracy under Whillans Ice Stream, West Antarctica, J. Glaciol., 59, 1147–1162, https://doi.org/10.3189/2013JoG13J085, 2013.
Clark, C. D., Hughes, A. L. C., Greenwood, S. L., Jordan, C., and Sejrup, H. P.: Pattern and timing of retreat of the last British-Irish Ice Sheet, Quaternary Sci. Rev., 44, 112–146, https://doi.org/10.1016/j.quascirev.2010.07.019, 2012.
Coles, B. J.: Doggerland: a Speculative Survey, Proc. Prehist. Soc., 64, 45–81, https://doi.org/10.1017/S0079497X00002176, 1998.
Cotterill, C. J., Dove, D., Long, D. and James, L.: Dogger Bank – A Geo Challenge, in: Proceedings of the seventh international conference, 12–14 September 2012, Royal Geographical Society, London, 127–134, 2012.
Cotterill, C. J., Phillips, E. R., James, L., Forsberg, C. F., and Tjelta, T. I.: How understanding past landscapes might inform present-day site investigations: A case study from Dogger Bank, southern central North Sea, Near Surf. Geophys., 15, 403–413, https://doi.org/10.3997/1873-0604.2017032, 2017a.
Cotterill, C. J., Phillips, E. R., James, L., Forsberg, C. F., Tjelta, T. I., Carter, G. and Dove, D.: The evolution of the Dogger Bank, North Sea: A complex history of terrestrial, glacial and marine environmental change, Quaternary Sci. Rev., 171, 136–153, https://doi.org/10.1016/j.quascirev.2017.07.006, 2017b.
Coughlan, M., Fleischer, M., Wheeler, A. J., Hepp, D. A., Hebbeln, D., and Mörz, T.: A revised stratigraphical framework for the Quaternary deposits of the German North Sea sector: a geological-geotechnical approach, Boreas, 47, 80–105, https://doi.org/10.1111/bor.12253, 2018.
Crameri, F.: Geodynamic diagnostics, scientific visualisation and StagLab 3.0, Geosci. Model Dev., 11, 2541–2562, https://doi.org/10.5194/gmd-11-2541-2018, 2018.
Duller, R. A., Warner, N. H., McGonigle, C., De Angelis, S., Russell, A. J. and Mountney, N. P.: Landscape reaction, response, and recovery following the catastrophic 1918 Katla jökulhlaup, southern Iceland, Geophys. Res. Lett., 41, 4214–4221, https://doi.org/10.1002/2014GL060090, 2014.
Emery, A. R., Hodgson, D. M., Barlow, N. L. M., Carrivick, J. L., Cotterill, C. J., and Phillips, E.: Left High and Dry: Deglaciation of Dogger Bank, North Sea, Recorded in Proglacial Lake Evolution, Front. Earth Sci., 7, 1–27, https://doi.org/10.3389/feart.2019.00234, 2019a.
Emery, A. R., Hodgson, D. M., Barlow, N. L. M., Carrivick, J. L., Cotterill, C. J., Mellett, C. L., and Booth, A. D.: Topographic and hydrodynamic controls on barrier retreat and preservation: An example from Dogger Bank, North Sea, Mar. Geol., 416, 105981, https://doi.org/10.1016/j.margeo.2019.105981, 2019b.
Fielding, C. R., Allen, J. P., Alexander, J., and Gibling, M. G.: Facies model for fluvial systems in the seasonal tropics and subtropics, Geology, 37, 623–626, https://doi.org/10.1130/G25727A.1, 2009.
Fielding, C. R., Alexander, J., and Allen, J. P.: The role of discharge variability in the formation and preservation of alluvial sediment bodies, Sediment. Geol., 365, 1–20, https://doi.org/10.1016/j.sedgeo.2017.12.022, 2018.
Figge, K.: Das Elbe–Urstromtal im Bereich der Deutschen Bucht (Nordsee), Eiszeitalter Gegenwart, 30, 203–211, https://doi.org/10.23689/fidgeo-911, 1980.
Fitch, S., Thomson, K., and Gaffney, V.: Late Pleistocene and Holocene depositional systems and the palaeogeography of the Dogger Bank, North Sea, Quatern. Res., 64, 185–196, https://doi.org/10.1016/j.yqres.2005.03.007, 2005.
Flemming, N. C., Harff, J., Moura, D., Burgess, A. and Bailey, G. N.: Submerged Landscapes of the European Continental Shelf, edited by: Flemming, N. C., Harff, J., Moura, D., Burgess, A., and Bailey, G. N., Wiley, Oxford, 2017.
Gaffney, V., Thomson, K., and Fitch, S.: Mapping Doggerland: the Mesolithic landscapes of the southern North Sea, Archaeopress, Oxford, 2007.
Gaffney, V., Fitch, S., and Smith, D. E.: Europe's Lost World: the Rediscovery of Doggerland, Council for British Archaeology, York, 2009.
Gearey, B. R., Hopla, E.-J., Boomer, I., Smith, D. E., Marshall, P., Fitch, S., Griffiths, S., and Tappin, D. R.: Multi-proxy palaeoecological approaches to submerged landscapes: a case study from “Doggerland”, in the southern North Sea, in the Archaeological and Forensic Applications of Microfossils: A Deeper Understanding of Human History, The Geological Society of London on behalf of The Micropalaeontological Society, London, 35–53, 2017.
Gibbard, P. L., Rose, J., and Bridgland, D. R.: The History of the Great Northwest European Rivers During the Past Three Million Years [and Discussion], Philos. T. Roy. Soc. B, 318, 559–602, https://doi.org/10.1098/rstb.1988.0024, 1988.
Gibbard, P. L., West, R. G., Zagwijn, W. H., Balson, P. S., Burger, A. W., Funnell, B. M., Jeffery, D. H., de Jong, J., van Kolfschoten, T., Lister, A. M., Meijer, T., Norton, P. E. P., Preece, R. C., Rose, J., Stuart, A. J., Whiteman, C. A., and Zalasiewicz, J. A.: Early and early Middle Pleistocene correlations in the Southern North Sea basin, Quaternary Sci. Rev., 10, 23–52, https://doi.org/10.1016/0277-3791(91)90029-T, 1991.
Gordon, C., Cooper, C., Senior, C. A., Banks, H., Gregory, J. M., Johns, T. C., Mitchell, J. F. B., and Wood, R. A.: The simulation of SST, sea ice extents and ocean heat transports in a version of the Hadley Centre coupled model without flux adjustments, Clim. Dynam., 16, 147–168, https://doi.org/10.1007/s003820050010, 2000.
Grieve, S. W. D.: Sinuosity Script, Zenodo, https://doi.org/10.5281/ZENODO.3835970, 2020.
Guan, M., Wright, N. G., Sleigh, P. A., and Carrivick, J. L.: Assessment of hydro-morphodynamic modelling and geomorphological impacts of a sediment-charged jökulhlaup, at Sólheimajökull, Iceland, J. Hydrol., 530, 336–349, https://doi.org/10.1016/j.jhydrol.2015.09.062, 2015.
Hepp, D. A., Warnke, U., Hebbeln, D., and Mörz, T.: Tributaries of the Elbe Palaeovalley: Features of a Hidden Palaeolandscape in the German Bight, North Sea, in: Under the Sea: Archaeology and Palaeolandscapes of the Continental Shelf, edited by: Bailey, G., Harff, J., and Sakellariou, D., Springer, Cham, 211–222, 2017.
Hepp, D. A., Romero, O. E., Mörz, T., de Pol-Holz, R., and Hebbeln, D.: How a river submerges into the sea: a geological record of changing a fluvial to a marine paleoenvironment during early Holocene sea level rise, J. Quaternary Sci., 34, 581–592, https://doi.org/10.1002/jqs.3147, 2019.
Hijma, M. P. and Cohen, K. M.: Holocene transgression of the Rhine river mouth area, The Netherlands/Southern North Sea: palaeogeography and sequence stratigraphy, Sedimentology, 58, 1453–1485, https://doi.org/10.1111/j.1365-3091.2010.01222.x, 2011.
Hijma, M. P., Cohen, K. M., Roebroeks, W., Westerhoff, W. E., and Busschers, F. S.: Pleistocene Rhine-Thames landscapes: Geological background for hominin occupation of the southern North Sea region, J. Quaternary Sci., 27, 17–39, https://doi.org/10.1002/jqs.1549, 2012.
Hjelstuen, B. O., Sejrup, H. P., Valvik, E., and Becker, L. W. M.: Evidence of an ice-dammed lake outburst in the North Sea during the last deglaciation, Mar. Geol., 402, 118–130, https://doi.org/10.1016/j.margeo.2017.11.021, 2017.
Hughes, A. L. C., Gyllencreutz, R., Lohne, Ø. S., Mangerud, J., and Svendsen, J. I.: The last Eurasian ice sheets – a chronological database and time-slice reconstruction, DATED-1, Boreas, 45, 1–45, https://doi.org/10.1111/bor.12142, 2016.
Ivanovic, R. F., Gregoire, L. J., Kageyama, M., Roche, D. M., Valdes, P. J., Burke, A., Drummond, R., Peltier, W. R., and Tarasov, L.: Transient climate simulations of the deglaciation 21–9 thousand years before present (version 1) – PMIP4 Core experiment design and boundary conditions, Geosci. Model Dev., 9, 2563–2587, https://doi.org/10.5194/gmd-9-2563-2016, 2016.
Jansen, J. H. F., van Weering, T. C. E., and Eisma, D.: Late Quaternary sedimentation in the North Sea, in: The Quaternary history of the North Sea, edited by: Oele, E., Schüttenhelm, R. T. E., and Wiggers, A. J., Symposia Universitatis Upsaliensis Annum Quingentesimum Celebrantis, 2, 175–187, 1979.
Kuchar, J., Milne, G. A., Hubbard, A. L., Patton, H., Bradley, S. L., Shennan, I., and Edwards, R.: Evaluation of a numerical model of the British-Irish ice sheet using relative sea-level data: implications for the interpretation of trimline observations, J. Quaternary Sci., 27, 597–605, https://doi.org/10.1002/jqs.2552, 2012.
Liu, Z., Otto-Bliesner, B. L., He, F., Brady, E. C., Tomas, R., Clark, P. U., Carlson, A. E., Lynch-Stieglitz, J., Curry, W., Brook, E., Erickson, D., Jacob, R., Kutzbach, J., and Cheng, J.: Transient simulation of last deglaciation with a new mechanism for bolling-allerod warming, Science, 325, 310–314, https://doi.org/10.1126/science.1171041, 2009.
Livingstone, S. J. and Clark, C. D.: Morphological properties of tunnel valleys of the southern sector of the Laurentide Ice Sheet and implications for their formation, Earth Surf. Dynam., 4, 567–589, https://doi.org/10.5194/esurf-4-567-2016, 2016.
Löfverström, M. and Lora, J. M.: Abrupt regime shifts in the North Atlantic atmospheric circulation over the last deglaciation, Geophys. Res. Lett., 44, 8047–8055, https://doi.org/10.1002/2017GL074274, 2017.
Lonergan, L., Maidment, S. C. R., and Collier, J. S.: Pleistocene subglacial tunnel valleys in the central North Sea basin: 3-D morphology and evolution, J. Quaternary Sci., 21, 891–903, https://doi.org/10.1002/jqs.1015, 2006.
Maizels, J.: Sedimentology, Paleoflow Dynamics and Flood History of Jökulhlaup Deposits: Paleohydrology of Holocene Sediment Sequences in Southern Iceland Sandur Deposits, SEPM J. Sediment. Res., 59, 204–223, https://doi.org/10.1306/212F8F4E-2B24-11D7-8648000102C1865D, 1989.
Maizels, J.: Jökulhlaup deposits in proglacial areas, Quaternary Sci. Rev., 16, 793–819, https://doi.org/10.1016/S0277-3791(97)00023-1, 1997.
Marren, P. M.: Magnitude and frequency in proglacial rivers: A geomorphological and sedimentological perspective, Earth-Sci. Rev., 70, 203–251, https://doi.org/10.1016/j.earscirev.2004.12.002, 2005.
Marren, P. M. and Toomath, S. C.: Channel pattern of proglacial rivers: Topographic forcing due to glacier retreat, Earth Surf. Proc. Land., 39, 943–951, https://doi.org/10.1002/esp.3545, 2014.
Marren, P. M., Russell, A. J., and Rushmer, E. L.: Sedimentology of a sandur formed by multiple jökulhlaups, Kverkfjöll, Iceland, Sediment. Geol., 213, 77–88, https://doi.org/10.1016/j.sedgeo.2008.11.006, 2009.
Mellett, C. L., Hodgson, D. M., Plater, A. J., Mauz, B., Selby, I., and Lang, A.: Denudation of the continental shelf between Britain and France at the glacial-interglacial timescale, Geomorphology, 203, 79–96, https://doi.org/10.1016/j.geomorph.2013.03.030, 2013.
Mesri, G. and Ali, S.: Undrained shear strength of a glacial clay overconsolidated by desiccation, Geotechnique, 49, 181–198, https://doi.org/10.1680/geot.1999.49.2.181, 1999.
Mitchum, R. M., Vail, P. R., and Sangree, J. B.: Seismic Stratigraphy and Global Changes of Sea Level: Part 6. Stratigraphic Interpretation of Seismic Reflection Patterns in Depositional Sequences: Section 2. Application of Seismic Reflection Configuration to Stratigraphic Interpretation, in: M 26: Seismic Stratigraphy – Applications to Hydrocarbon Exploration, AAPG Special Volumes, Tulsa, OK, 117–133, 1977.
Morris, P. J., Swindles, G. T., Valdes, P. J., Ivanovic, R. F., Gregoire, L. J., Smith, M. W., Tarasov, L., Haywood, A. M., and Bacon, K. L.: Global peatland initiation driven by regionally asynchronous warming, P. Natl. Acad. Sci. USA, 115, 4851–4856, https://doi.org/10.1073/pnas.1717838115, 2018.
Mortensen, M. F., Birks, H. H., Christensen, C., Holm, J., Noe-Nygaard, N., Odgaard, B. V., Olsen, J., and Rasmussen, K. L.: Lateglacial vegetation development in Denmark – New evidence based on macrofossils and pollen from Slotseng, a small-scale site in southern Jutland, Quaternary Sci. Rev., 30, 2534–2550, https://doi.org/10.1016/j.quascirev.2011.04.018, 2011.
Murton, D. K. and Murton, J. B.: Middle and Late Pleistocene glacial lakes of lowland Britain and the southern North Sea Basin, Quatern. Int., 260, 115–142, https://doi.org/10.1016/j.quaint.2011.07.034, 2012.
Nicholas, A. P., Sambrook Smith, G. H., Amsler, M. L., Ashworth, P. J., Best, J. L., Hardy, R. J., Lane, S. N., Orfeo, O., Parsonsm, D. R., Reesink, A. J. H., Sandbach, S. D., Simpson, C. J., and Szupiany, R. N.: The role of discharge variability in determining alluvial stratigraphy, Geology, 44, 3–6, https://doi.org/10.1130/G37215.1, 2016.
Ó Cofaigh, C.: Tunnel valley genesis, Prog. Phys. Geogr., 20, 1–19, https://doi.org/10.1177/030913339602000101, 1996.
Ottesen, D., Stewart, M., Brönner, M., and Batchelor, C. L.: Tunnel valleys of the central and northern North Sea (56∘ N to 62∘ N): Distribution and characteristics, Mar. Geol., 425, 106199, https://doi.org/10.1016/j.margeo.2020.106199, 2020.
Peltier, W. R., Argus, D. F., and Drummond, R.: Space geodesy constrains ice age terminal deglaciation: The global ICE-6G_C (VM5a) model, J. Geophys. Res.-Solid, 120, 450–487, https://doi.org/10.1002/2014JB011176, 2015.
Phillips, E., Cotterill, C. J., Johnson, K., Crombie, K., James, L., Carr, S., and Ruiter, A.: Large-scale glacitectonic deformation in response to active ice sheet retreat across Dogger Bank (southern central North Sea) during the Last Glacial Maximum, Quaternary Sci. Rev., 179, 24–47, https://doi.org/10.1016/j.quascirev.2017.11.001, 2018.
Phillips, E. R., Hodgson, D. M., and Emery, A. R.: The Quaternary geology of the North Sea basin, J. Quaternary Sci., 32, 117–126, https://doi.org/10.1002/jqs.2932, 2017.
Pope, V. D., Gallani, M. L., Rowntree, P. R., and Stratton, R. A.: The impact of new physical parametrizations in the Hadley Centre climate model: HadAM3, Clim. Dynam., 16, 123–146, https://doi.org/10.1007/s003820050009, 2000.
Praeg, D.: Seismic imaging of mid-Pleistocene tunnel-valleys in the North Sea Basin-high resolution from low frequencies, J. Appl. Geophys., 53, 273–298, https://doi.org/10.1016/j.jappgeo.2003.08.001, 2003.
Prins, L. T. and Andresen, K. J.: Buried late Quaternary channel systems in the Danish North Sea – Genesis and geological evolution, Quaternary Sci. Rev., 223, 105943, https://doi.org/10.1016/j.quascirev.2019.105943, 2019.
Prins, L. T., Andresen, K. J., Clausen, O. R., and Piotrowski, J.: Formation and widening of a North Sea tunnel valley – The impact of slope processes on valley morphology, Geomorphology, 368, 107347, https://doi.org/10.1016/j.geomorph.2020.107347, 2020.
Roberts, D. H., Evans, D. J. A., Callard, S. L., Clark, C. D., Bateman, M. D., Medialdea, A., Dove, D., Cotterill, C. J., Saher, M., Cofaigh, C. Ó., Chiverrell, R. C., Moreton, S. G., Fabel, D. and Bradwell, T.: Ice marginal dynamics of the last British-Irish Ice Sheet in the southern North Sea: Ice limits, timing and the influence of the Dogger Bank, Quaternary Sci. Rev., 198, 181–207, https://doi.org/10.1016/j.quascirev.2018.08.010, 2018.
Robertson, P. K.: Soil classification using the cone penetration test, Can. Geotech. J., 27, 151–158, https://doi.org/10.1139/t90-014, 1990.
Russell, A. J., Roberts, M. J., Fay, H., Marren, P. M., Cassidy, N. J., Tweed, F. S., and Harris, T.: Icelandic jökulhlaup impacts: Implications for ice-sheet hydrology, sediment transfer and geomorphology, Geomorphology, 75, 33–64, https://doi.org/10.1016/j.geomorph.2005.05.018, 2006.
Salomonsen, I.: A seismic stratigraphic analysis of Lower Pleistocene deposits in the western Danish sector of the North Sea, Geol. en Mijnb., 72, 349–361, 1993.
Sejrup, H. P., Clark, C. D., and Hjelstuen, B. O.: Rapid ice sheet retreat triggered by ice stream debuttressing: Evidence from the North Sea, Geology, 44, 355–358, https://doi.org/10.1130/G37652.1, 2016.
Sejrup, H. P., Larsen, E., Landvik, J., King, E. L., Haflidason, H., and Nesje, A.: Quaternary glaciations in southern Fennoscandia: Evidence from southwestern Norway and the northern North Sea region, Quaternary Sci. Rev., 19, 667–685, https://doi.org/10.1016/S0277-3791(99)00016-5, 2000.
Shennan, I., Lambeck, K., Flather, R., Horton, B., McArthur, J., Innes, J., Lloyd, J. M., Rutherford, M., and Wingfield, R.: Modelling western North Sea paleogeographies and tidal changes during the Holocene, in: Holocene Land-Ocean Interaction and Environmental Change around the North Sea, vol. 166, Special Publications, Geological Society, London, 299–319, 2000.
Shugar, D. H., Clague, J. J., Best, J. L., Schoof, C., Willis, M. J., Copland, L., and Roe, G. H.: River piracy and drainage basin reorganization led by climate-driven glacier retreat, Nat. Geosci., 10, 370–375, https://doi.org/10.1038/ngeo2932, 2017.
Smith, D. E., Fitch, S., Gearey, B., Hill, T., Holford, S., Howard, A., and Jolliffe, C.: The Potential of the Organic Archive for Environmental Reconstruction: An Assessment of Selected Borehole Sediments from the North Sea, in: Mapping Doggerland: the Mesolithic landscapes of the southern North Sea, edited by: Gaffney, V., Thomson, K., and Fitch, S., 93–102, Archaeopress, Oxford, 2007.
Staines, K. E. H., Carrivick, J. L., Tweed, F. S., Evans, A. J., Russell, A. J., Jóhannesson, T., and Roberts, M.: A multi-dimensional analysis of pro-glacial landscape change at Sólheimajökull, Southern Iceland, Earth Surf. Proc. Land., 40, 809–822, https://doi.org/10.1002/esp.3662, 2015.
Stewart, M. A. and Lonergan, L.: Seven glacial cycles in the middle-late Pleistocene of northwest Europe: Geomorphic evidence from buried tunnel valleys, Geology, 39, 283–286, https://doi.org/10.1130/G31631.1, 2011.
Stewart, M. A., Lonergan, L., and Hampson, G.: 3D seismic analysis of buried tunnel valleys in the central North Sea: Morphology, cross-cutting generations and glacial history, Quaternary Sci. Rev., 72, 1–17, https://doi.org/10.1016/j.quascirev.2013.03.016, 2013.
Stoker, M. S., Balson, P. S., Long, D., and Tappin, D. R.: An overview of the lithostratigraphical framework for the Quaternary deposits on the United Kingdom continental shelf, British Geological Survey Research Report RR/11/03, British Geological Survey, Keyworth, Nottingham, 2011.
Sturt, F., Garrow, D., and Bradley, S. L.: New models of North West European Holocene palaeogeography and inundation, J. Archaeol. Sci., 40, 3963–3976, https://doi.org/10.1016/j.jas.2013.05.023, 2013.
Tappin, D. R., Pearce, B,. Fitch, S., Dove, D., Gearey, B., Hill, J. M., Chambers, C., Bates, R., Pinnion, J., Diaz Doce, D., Green, M., Gallyot, J., Georgiou, L., Brutto, D., Marzialetti, S., Hopla, E., Ramsay, E., and Fielding, H.: The Humber Regional Environmental Characterisation, Open Report OR/10/54, British Geological Survey, Keyworth, Nottingham, 357 pp., 2011.
Tarasov, L. and Peltier, W. R.: Greenland glacial history and local geodynamic consequences, Geophys. J. Int., 150, 198–229, https://doi.org/10.1046/j.1365-246X.2002.01702.x, 2002.
Tarasov, L., Dyke, A. S., Neal, R. M., and Peltier, W. R.: A data-calibrated distribution of deglacial chronologies for the North American ice complex from glaciological modeling, Earth Planet. Sc. Lett., 315–316, 30–40, https://doi.org/10.1016/j.epsl.2011.09.010, 2012.
Tarasov, L., Hughes, A. L. C., Gyllencreutz, R., Lohne, O. S., Mangerud, J. and Svendsen, J.-I.: The global GLAC-1c deglaciation chronology, melwater pulse 1-a, and a question of missing ice, in: IGS Symposium on Contribution of Glaciers and Ice Sheets to Sea-Level Change, 25–30 May 2014, Chamonix, 2014.
Tizzard, L., Bicket, A. R., Benjamin, J. and De Loecker, D.: A Middle Palaeolithic site in the southern North Sea: Investigating the archaeology and palaeogeography of Area 240, J. Quaternary Sci., 29, 698–710, https://doi.org/10.1002/jqs.2743, 2014.
Toucanne, S., Zaragosi, S., Bourillet, J.-F., Marieu, V., Cremer, M., Kageyama, M., Van Vliet-Lanoë, B., Eynaud, F., Turon, J.-L., and Gibbard, P. L.: The first estimation of Fleuve Manche palaeoriver discharge during the last deglaciation: Evidence for Fennoscandian ice sheet meltwater flow in the English Channel ca 20–18 ka ago, Earth Planet. Sc. Lett., 290, 459–473, https://doi.org/10.1016/j.epsl.2009.12.050, 2010.
Toucanne, S., Soulet, G., Freslon, N., Silva Jacinto, R., Dennielou, B., Zaragosi, S., Eynaud, F., Bourillet, J.-F., and Bayon, G.: Millennial-scale fluctuations of the European Ice Sheet at the end of the last glacial, and their potential impact on global climate, Quaternary Sci. Rev., 123, 113–133, https://doi.org/10.1016/j.quascirev.2015.06.010, 2015.
Valdes, P. J., Armstrong, E., Badger, M. P. S., Bradshaw, C. D., Bragg, F., Crucifix, M., Davies-Barnard, T., Day, J., Farnsworth, A., Gordon, C., Hopcroft, P. O., Kennedy, A. T., Lord, N. S., Lunt, D. J., Marzocchi, A., Parry, L. M., Pope, V., Roberts, W. H. G., Stone, E. J., Tourte, G. J. L., and Williams, J. H. T.: The BRIDGE HadCM3 family of climate models: HadCM3@Bristol v1.0, Geosci. Model Dev., 10, 3715–3743, https://doi.org/10.5194/gmd-10-3715-2017, 2017.
Vandenberghe, J.: A typology of Pleistocene cold-based rivers, Quatern. Int., 79, 111–121, https://doi.org/10.1016/S1040-6182(00)00127-0, 2001.
van Heteren, S., Meekes, J. A. C., Bakker, M. A. J., Gaffney, V., Fitch, S., Gearey, B. R., and Paap, B. F.: Reconstructing North Sea palaeolandscapes from 3D and high-density 2D seismic data: An overview, Neth. J. Geosci. – Geol. en Mijnb., 93, 31–42, https://doi.org/10.1017/njg.2014.4, 2014.
Wessex Archaeology: Teesside A & B – Environmental Statement Chapter 18 Appendix A – Archaeology and Cultural History Technical Report, available at: https://subseacablesuk.org.uk/ftp/Dogger Bank Teesside A& B Offshore Wind Farm/6. Environmental Statement/Environmental StatementChapter Appendices/Chapter 18 Appendices/6.18.1 ES Chapter 18 AppendixA.pdf (last access: 22 October 2020), 2014.
Zernitz, E. R.: Drainage Patterns and Their Significance, J. Geol., 40, 498–521, https://doi.org/10.1086/623976, 1932.