the Creative Commons Attribution 4.0 License.
the Creative Commons Attribution 4.0 License.
 | 09 Sep 2021
A temperature-dependent mechanical model to assess the stability of degrading permafrost rock slopes
Philipp Mamot
Samuel Weber
Saskia Eppinger
Michael Krautblatter
Over the last 2 decades, permafrost degradation has been observed to be a major driver of enhanced rock slope instability and associated hazards in high mountains. While the thermal regime of permafrost degradation in high mountains has been addressed in several modelling approaches, no mechanical models that thoroughly explain rock slope destabilisation controls in degrading permafrost have been developed. Meanwhile, recent laboratory studies have shown that degrading permafrost affects both, rock and ice mechanical strength parameters as well as the strength of rock–ice interfaces. This study presents a first general approach for a temperature-dependent numerical stability model that simulates the mechanical response of a warming and thawing permafrost rock slope. The proposed procedure is exemplified using a rockslide at the permafrost-affected Zugspitze summit crest. Laboratory tests on frozen and unfrozen rock joint and intact rock properties provide material parameters for discontinuum models developed with the Universal Distinct Element Code (UDEC). Geophysical and geotechnical field surveys reveal information on permafrost distribution and the fracture network. This model can demonstrate how warming decreases rock slope stability to a critical level and why thawing initiates failure. A generalised sensitivity analysis of the model with a simplified geometry and warming trajectory below 0 ∘C shows that progressive warming close to the melting point initiates instability above a critical slope angle of 50–62∘, depending on the orientation of the fracture network. The increase in displacements intensifies for warming steps closer to 0 ∘C. The simplified and generalised model can be applied to permafrost rock slopes (i) which warm above −4 ∘C, (ii) with ice-filled joints, (iii) with fractured limestone or probably most of the rock types relevant for permafrost rock slope failure, and (iv) with a wide range of slope angles (30–70∘) and orientations of the fracture network (consisting of three joint sets). Here, we present a benchmark model capable of assessing the future destabilisation of degrading permafrost rock slopes.
Please read the corrigendum first before continuing.
-
Notice on corrigendum
The requested paper has a corresponding corrigendum published. Please read the corrigendum first before downloading the article.
-
Article
(22337 KB)
- Corrigendum
-
Supplement
(4217 KB)
-
The requested paper has a corresponding corrigendum published. Please read the corrigendum first before downloading the article.
- Article
(22337 KB) - Full-text XML
- Corrigendum
-
Supplement
(4217 KB) - BibTeX
- EndNote


Rock slope failures in high-mountain areas endanger human lives, settlements and infrastructure. The stability of alpine rock slopes can be considerably affected by the climate-induced degradation of bedrock permafrost (Fischer et al., 2006; Gruber et al., 2004; Gruber and Haeberli, 2007; Ravanel and Deline, 2015). The best empirical trends are provided by the well-monitored rock slope failures in the Mont Blanc Massif that have been linked to the degradation of bedrock permafrost and ice-filled joints (Ravanel et al., 2010; Ravanel and Deline, 2008, 2011).
Mountain permafrost warmed globally by 0.19 ∘C between 2007 and 2016 (Biskaborn et al., 2019). Simulations of long-term permafrost evolution in Swiss, German or Norwegian mountain ranges show an overall warming of permafrost and thaw layer deepening up to the end of the century (Gallemann et al., 2017; Hipp et al., 2012; Marmy et al., 2016). Rock slope failures influenced by permafrost degradation are expected to become more frequent as a result of the warming climate (Gobiet et al., 2014; Huggel et al., 2012).
Most rock slope failures develop along discontinuities, whose patterns predetermine potential critical paths of failures (Wyllie, 2018). Fractures and fractured zones in mountain bedrock permafrost contain massive ice to depths of several tens of metres or more (Deline et al., 2015; Gruber and Haeberli, 2007). The majority of failure events in permafrost-affected rock exposed ice-filled joints as potential shear and detachment planes at different volumetric scales all over the world. Some prominent examples are the 2003 Matterhorn block fall (0.002×10⁶ m3; Weber et al., 2019), the 2014 Piz Kesch rock slope failure (0.15×10⁶ m3; Phillips et al., 2017) and the 2017 Pizzo Cengalo failure with eight fatalities (3–4×10⁶ m3; Walter et al., 2020; Mergili et al., 2020) in Switzerland; the 1987 Val Pola debris avalanche in the Italian Alps (33×106 m3; Dramis et al., 1995); the 2005 Mount Steller rock–ice avalanche in Alaska (40–60×106 m3; Huggel et al., 2010); and the 2002 Kolka–Karmadon rock–ice avalanche with 140 fatalities in the Russian Caucasus (100×106 m3; Huggel et al., 2005).
The warming of permafrost in rock slopes reduces the shear resistance along rock joints by (i) reducing the fracture toughness of cohesive rock bridges, (ii) lowering the friction along rock–rock contacts, (iii) altering the creep of ice infillings, and (iv) reducing the fracture toughness of ice fillings and of rock–ice contacts (Krautblatter et al., 2013). Ice fillings contribute to higher rock joint shear strengths in terms of interlocking and adhesion along the rock–ice interface and increase the stability of a rock slope. The strength of ice in fractures decreases when the temperature approaches the melting point (Davies et al., 2001; Gruber and Haeberli, 2007; Mamot et al., 2018). Several laboratory test series have demonstrated the influence of warming or thawing on the mechanical properties of rock and ice: the ductile temperature- and stress-dependent creep of ice and ice-rich soils has been investigated in studies such as Arenson and Springman (2005), Bray (2013) and Sanderson (1988). Whilst the brittle failure and creep of ice-filled rock joints have been observed by Davies et al. (2000) and Günzel (2008), Mamot et al. (2018) proposed a new failure criterion that demonstrates the loss of ice friction and cohesion in rock fractures dependent on normal stress and temperature. The mechanics of frozen and unfrozen intact rock have been studied in works such as Dwivedi et al. (2000), Inada and Yokota (1984), Kodama et al. (2013), Mellor (1973), Plaesken et al. (2020) and Voigtländer et al. (2014). The friction along frozen and unfrozen rock joints was measured by Krautblatter et al. (2013). Table 1 summarises the temperature-dependent strength reduction for all of these investigated mechanical parameters.
Table 1A systematic survey of previous laboratory studies on the thaw-dependent strength reduction of mechanical properties of rock, rock joints and ice.
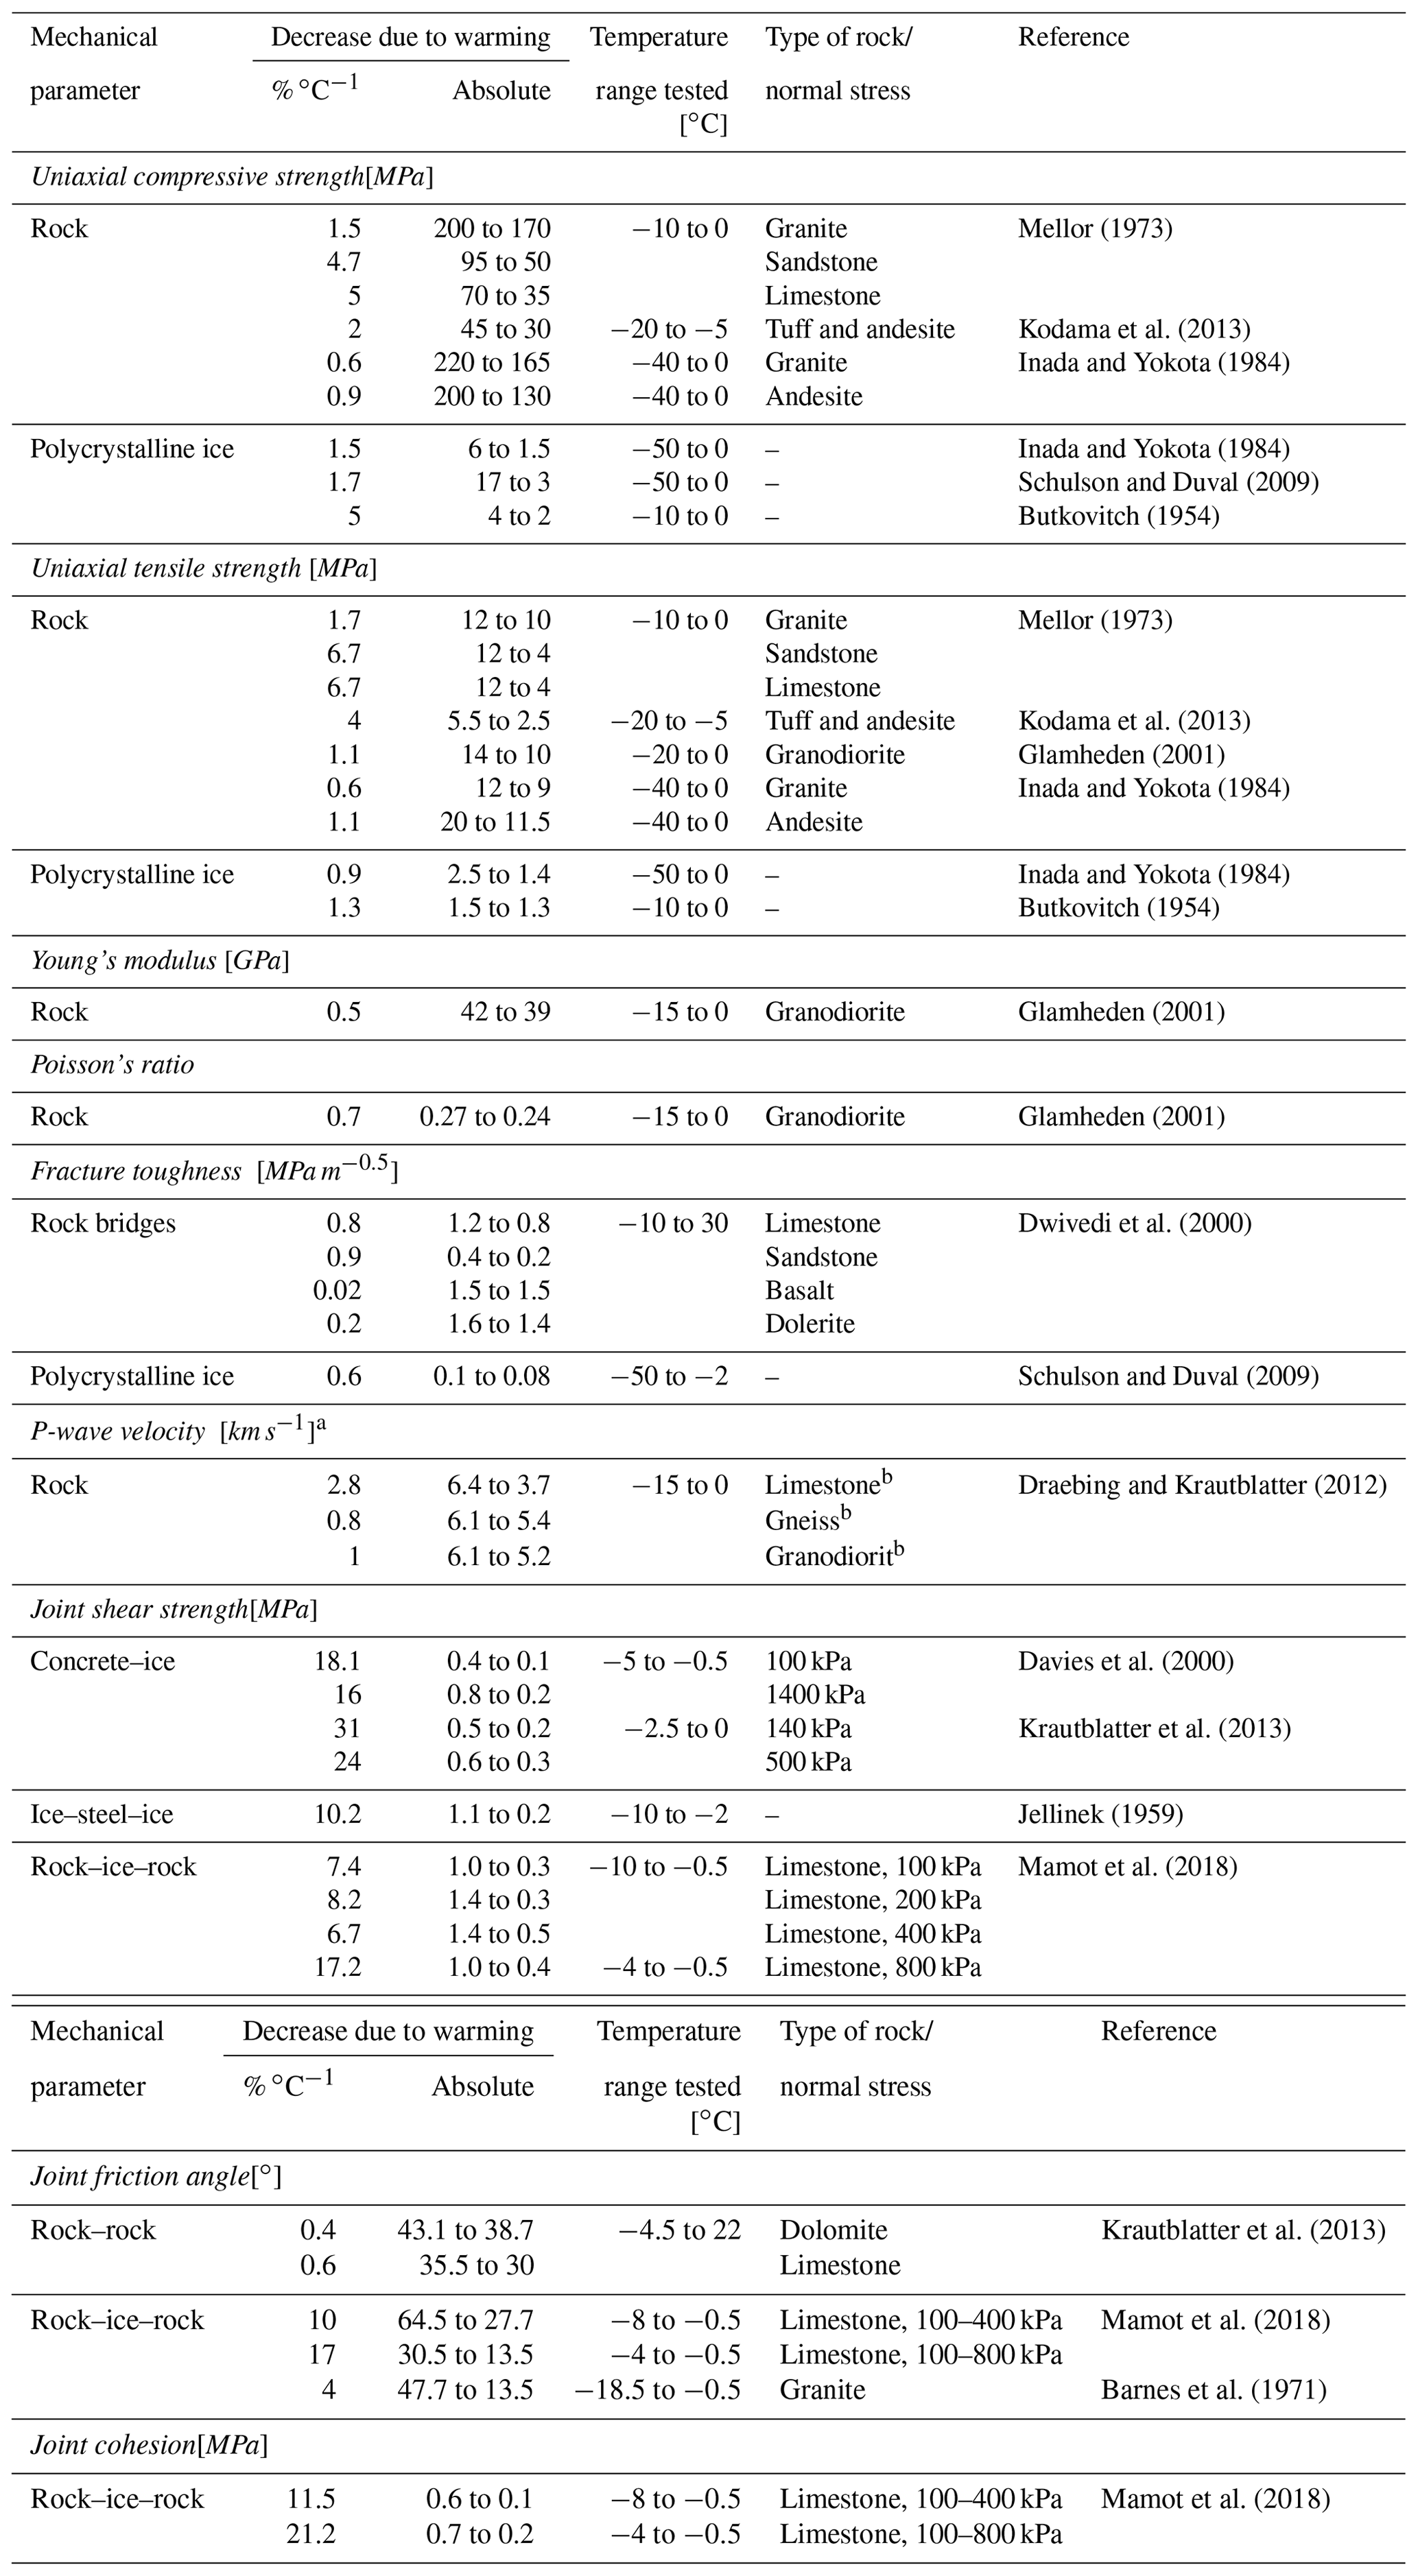
a The P-wave velocity of rock correlates highly to Mode I fracture toughness which relates closely to Mode II fracture toughness (Chang et al., 2002). b The P-wave velocities are parallel to cleavage/bedding.
The necessity to better link permafrost degradation and rock slope stability has been stated several times (Etzelmüller, 2013; Harris et al., 2009; Krautblatter et al., 2012). However, the attempt to study the effect of warming or thawing on the mechanical response of a rock slope has been realised only once: Davies et al. (2001) simulated the warming of a simplified, full rock slope in a laboratory centrifuge model and estimated factors of safety for unfrozen and ice-filled joints at temperatures close to the melting point using mechanical properties from prior laboratory shear tests by Davies et al. (2000). Numerical modelling is an established method to (i) mechanically assess rock slope stability and characterise failure, deformation and influencing factors (Stead et al., 2006), and (ii) thermally analyse the spatial distribution and evolution of permafrost in a mountain or rock slope (Haberkorn et al., 2017; Moore et al., 2011; Myhra et al., 2017; Noetzli and Gruber, 2009). However, no temperature-dependent mechanical numerical model has been developed yet that implements the deformation and strength reduction of permafrost bedrock and ice-filled discontinuities upon warming or thawing. To anticipate failure in a warming climate, we need to understand how the mechanical components of rock and ice control rock slope destabilisation and how failure in warming permafrost rocks can be mechanically expressed in models.
Discontinuum discrete element codes simulate the deformation behaviour of fractured rock masses and consider the influence of jointing (Stead et al., 2006). Among these codes, UDEC (Universal Distinct Element Code) is one of the most commonly used modelling tools for distinct element modelling of jointed and blocky material in 2D and has been applied in numerous published stability analyses on unfrozen rock slopes (Bhasin and Kaynia, 2004; Fischer et al., 2010; Gischig et al., 2011a, b, c; Glamheden and Lindblom, 2002; Kveldsvik et al., 2008; Welkner et al., 2010).
In this paper, we present the first numerical model that calculates the influence of warming and thawing of frozen rock and rock joints on the mechanical strength and deformation behaviour of a rock slope. The proposed model is applied to a rockslide at the permafrost-affected Zugspitze summit which is one of the highest peaks of the Northern Calcareous Alps, located in the Eastern Alps. In this context, we address the following research questions:
-
How can mechanical and thermal data from the field and from the laboratory be combined to develop a numerical stability model for a warming and thawing permafrost rock slope?
-
Is the numerical stability model of the Zugspitze summit crest capable of simulating the warming-dependent changes in stability observed at the laboratory scale?
-
How is the generic stability of a warming permafrost rock slope dependent on the slope angle and the orientation of the fracture network?
A slowly moving rockslide at the Zugspitze summit crest (2900 m a.s.l.), Germany, with extensive monitoring data on kinematics and degrading permafrost bedrock was chosen to develop a close-to-nature rock slope instability model for degrading permafrost rock slopes (Fig. 1; see also Mamot et al., 2018). Homogeneous lithology, well-known permafrost degradation history for the Zugspitze summit area and the accessibility to an ice-filled rock sliding surface (Fig. 1c) made it an ideal benchmark for the mechanical model development. The model profile and the characteristics of the fracture network for the numerical model were taken from the study site. Rock specimens collected in close proximity to the rockslide were used for a unique set of mechanical laboratory tests on a broad spectrum of frozen and unfrozen intact rock and rock joint properties. Intact rock properties were converted to rock mass characteristics using internationally standardised mathematical equations. Electrical resistivity tomography (ERT) was applied to identify current frozen and unfrozen slope sections. These were implemented in the numerical model to spatially assign frozen or unfrozen rock mass and joint parameters to the corresponding model sections and to derive a rough spatial warming pattern. Considering the numerous laboratory-based observations of the strength reduction of the mechanical properties of rock and ice at warming/thawing (Table 1), we expect to model a significant effect on the slope stability. For this, we set up a discontinuum model in 2D with UDEC 7. In a first step, we modelled the numerical impact of warming and thawing on the stability of the Zugspitze summit crest with ice-filled joints. In a second step, we applied the same model to a frozen rock slope with simplified geometry to study the numerical impact of rising sub-zero temperature on the rock slope stability for varying slope angles and orientations of the joint set configuration.
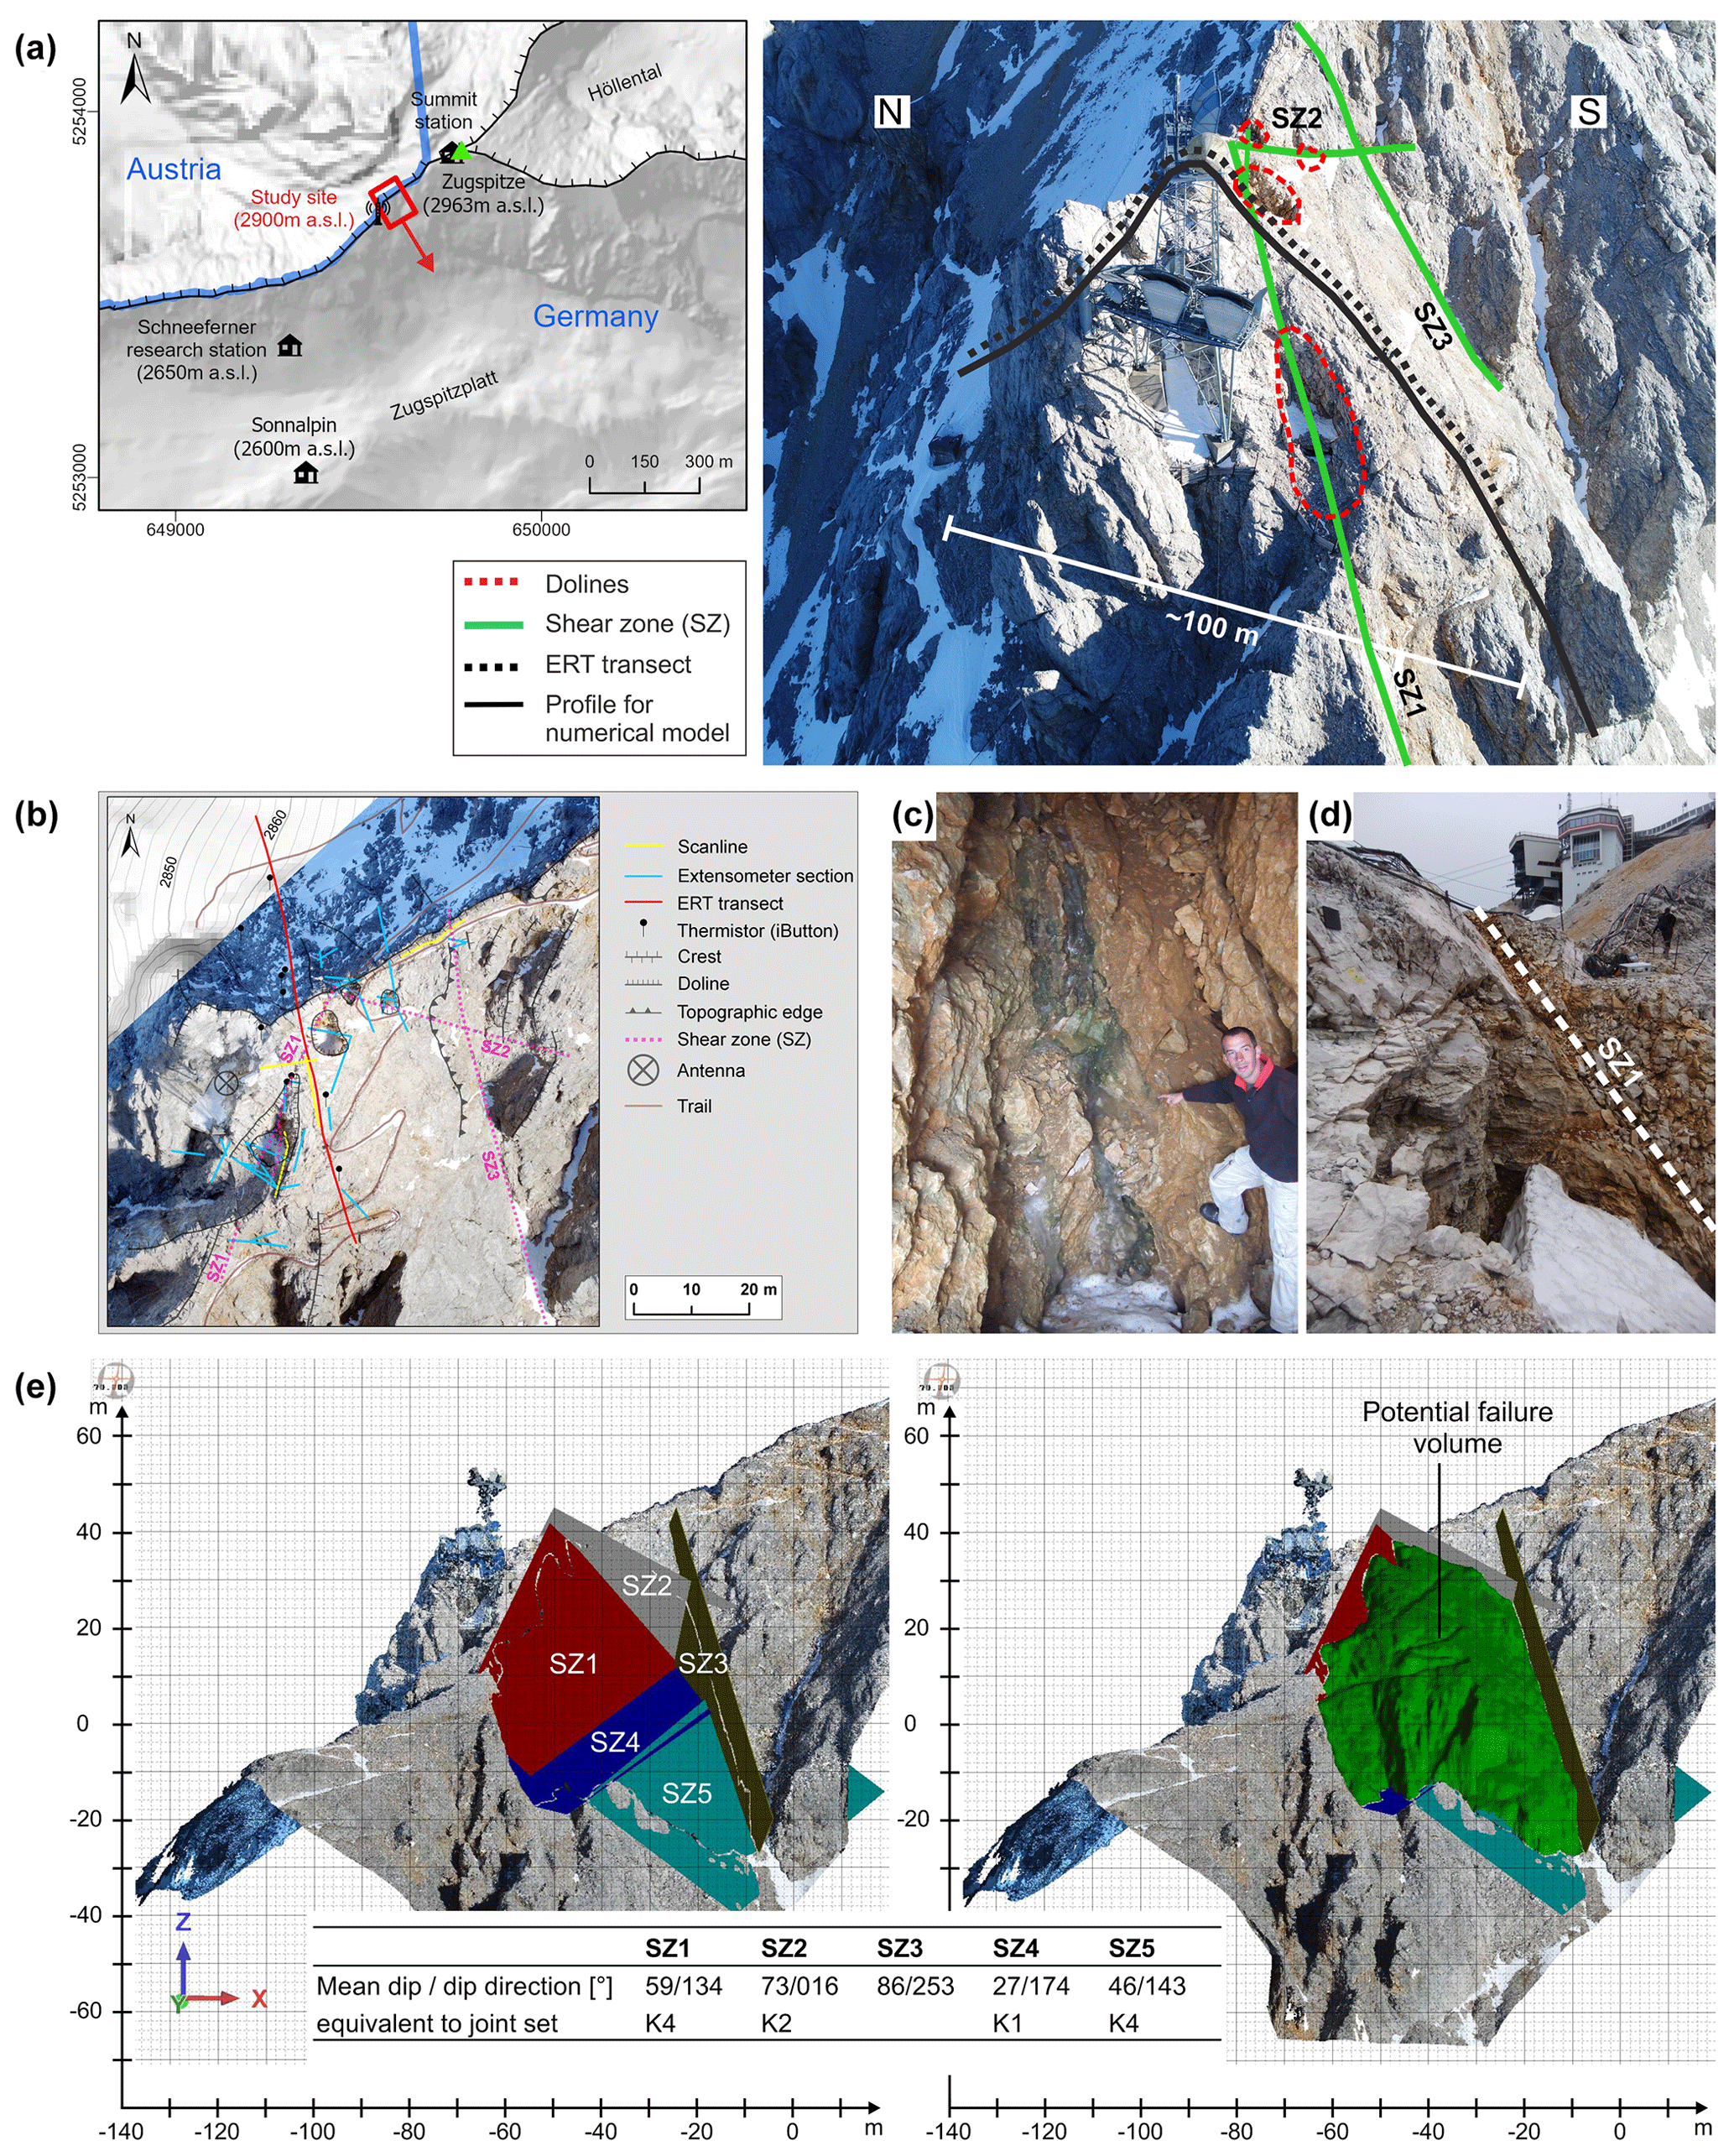
Figure 1The left side of panel (a) shows the location of the study site (red box) in the Zugspitze summit area, ca. 60 m below the peak (2963 m a.s.l.). The red arrow points in the sliding direction of the unstable rock mass. The hillshade is calculated from a digital elevation model with a cell size of 10 m for Austria and 5 m for Germany (Bavarian Agency for Digitisation, High-Speed Internet and Surveying, 2006). Coordinates are given in ETRS 1989 UTM Zone 32N. The right side of panel (a) is the view from above down on the study site, including dolines, the assumed main shear zones of the upper part of the rockslide, the profile used for the numerical model and the transect for the electrical resistivity survey. Panel (b) displays the network of geophysical and geotechnical measurements at the study site, including reference to geomorphologic and anthropogenic features. The orthophoto is derived from UAV-based photogrammetry. Panels (c) and (d) display the shear zone SZ1 filled with ice or with fine material, exposed at the inner wall of dolines. Panel (e) outlines the intersecting main shear zones which delineate the unstable rock mass at the south face of the Zugspitze summit crest both with (right) and without (left) the potential failure volume.
Figure 2 demonstrates a general procedure to develop a numerical discontinuum model to calculate the influence of warming and thawing on the mechanical strength and deformation behaviour of a (partially) frozen rock slope. Here, we present one exemplary way of applying the set-up of the model and the modelling procedure to a real-world example of alpine rock slope instability potentially affected by permafrost degradation. For instance, the detection of bedrock permafrost can also be performed using other techniques like seismic refraction tomography; similarly, the conversion of the intact rock properties to those of the rock mass can also be done using the Q-value (and not by the geological strength index (GSI) scheme, as presented in this article).
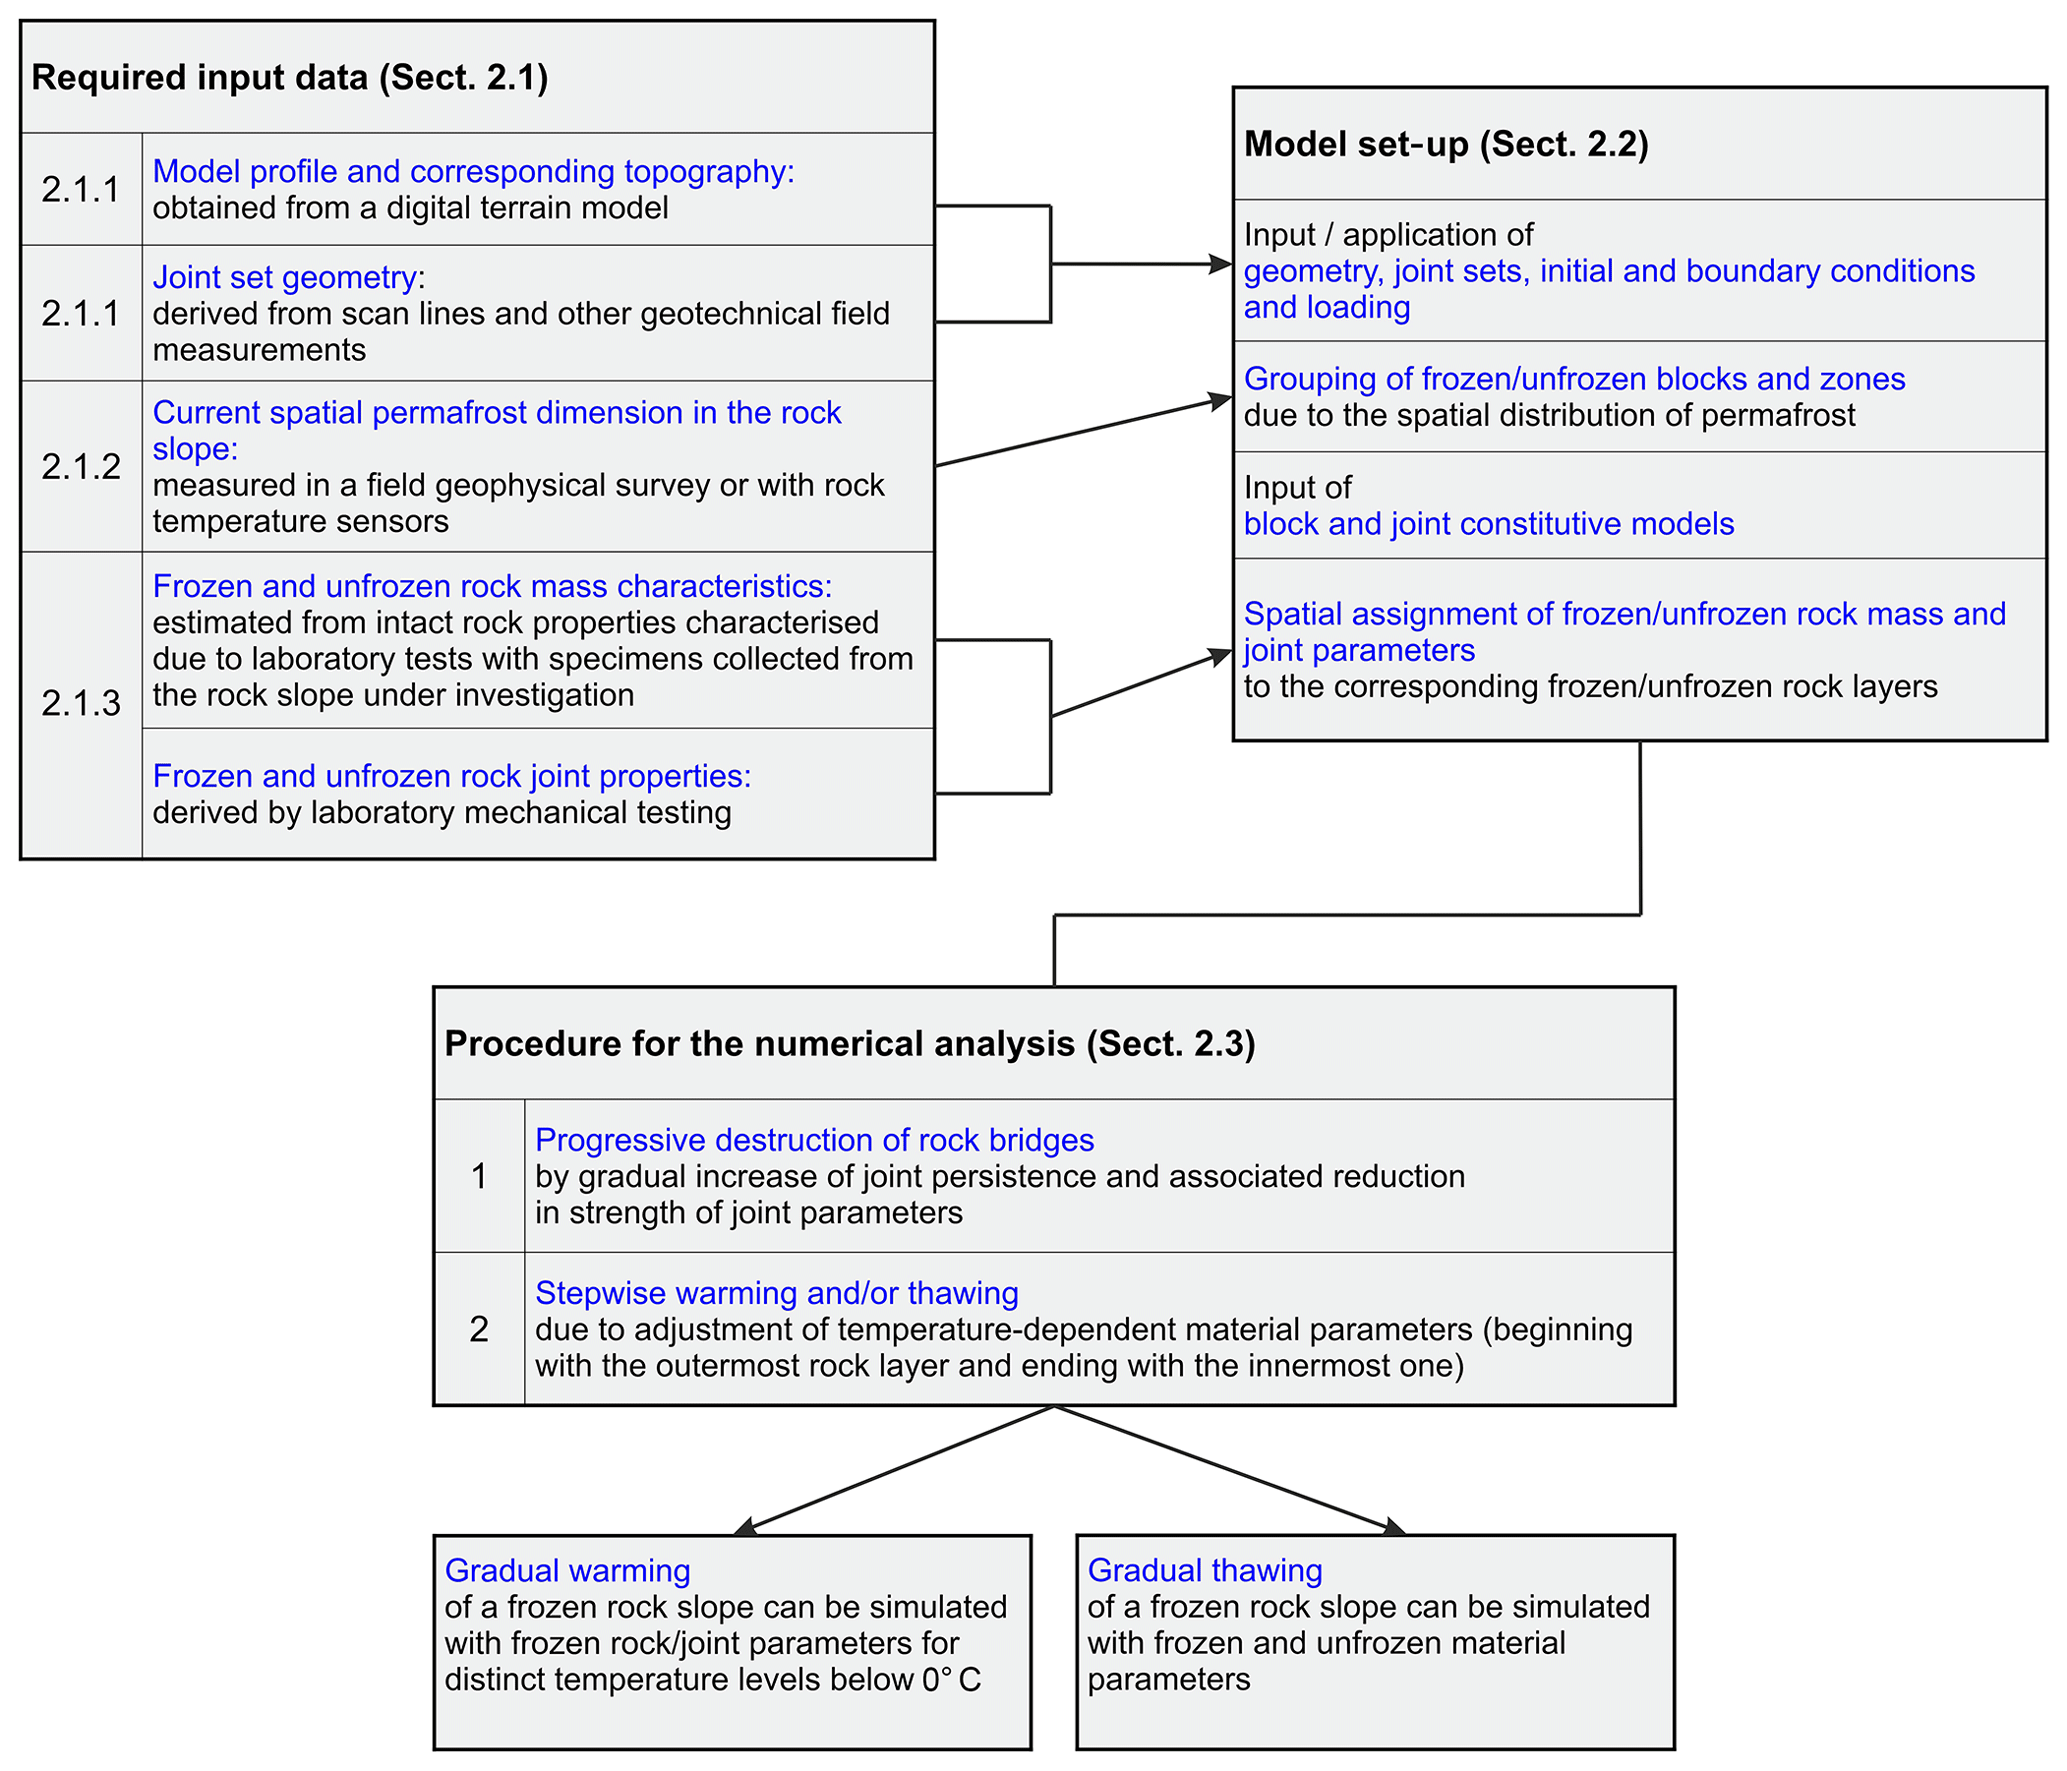
Figure 2General procedure for a temperature-dependent mechanical discontinuum model for the stability of a warming or thawing permafrost rock slope. The procedure is embedded as a methodological approach in this paper and, hence, is linked to specific sections.
2.1 Characterisation of the mechanical and thermal setting
2.1.1 Model profile, rock joint geometry and kinematic analysis
The numerical model was set up in 2D and, thus, required a cross section of the summit crest. This profile covers a distance of 100 m; it runs from the north face, across the crest line, to the south face; and it crosses one of the main shear zones of the rockslide (Fig. 1a, b).
Four discontinuity sets (K1–K4) were identified in scan lines and field mapping (Fig. 3a). The profile for the mechanical model strikes at 146∘, which is in the direction of the assumed movement and follows the dip of the southern slope face (). K2 () was excluded from the numerical analysis, as the dip direction deviated by 66.5∘ from the model profile. The remaining joint sets deviating by 20–33∘ were implemented in the model, as the standard deviations of their dip directions ranged between 5 and 20∘, falling within the tolerable range of 30∘ deviation (Table 2). Joint set K1 represents the bedding planes and daylights in the south face at an angle of 24∘ (Fig. 3b).

Figure 3(a) Orientations of field-measured discontinuities in a stereographic projection, calculated with Dips 7.0 (Rocscience). Great circles with red labels represent the joint sets (K) implemented in the numerical model. Contours depict the Fisher concentrations (density) of the poles. (b) Fracture network, extent and topography of the 2D numerical model. Shear zones (SZs) included in the model are marked with thick grey lines. The dashed line represents the assumed prolongation of the potential failure plane in the lower slope sections.
Table 2Geotechnical characteristics of the joint sets.
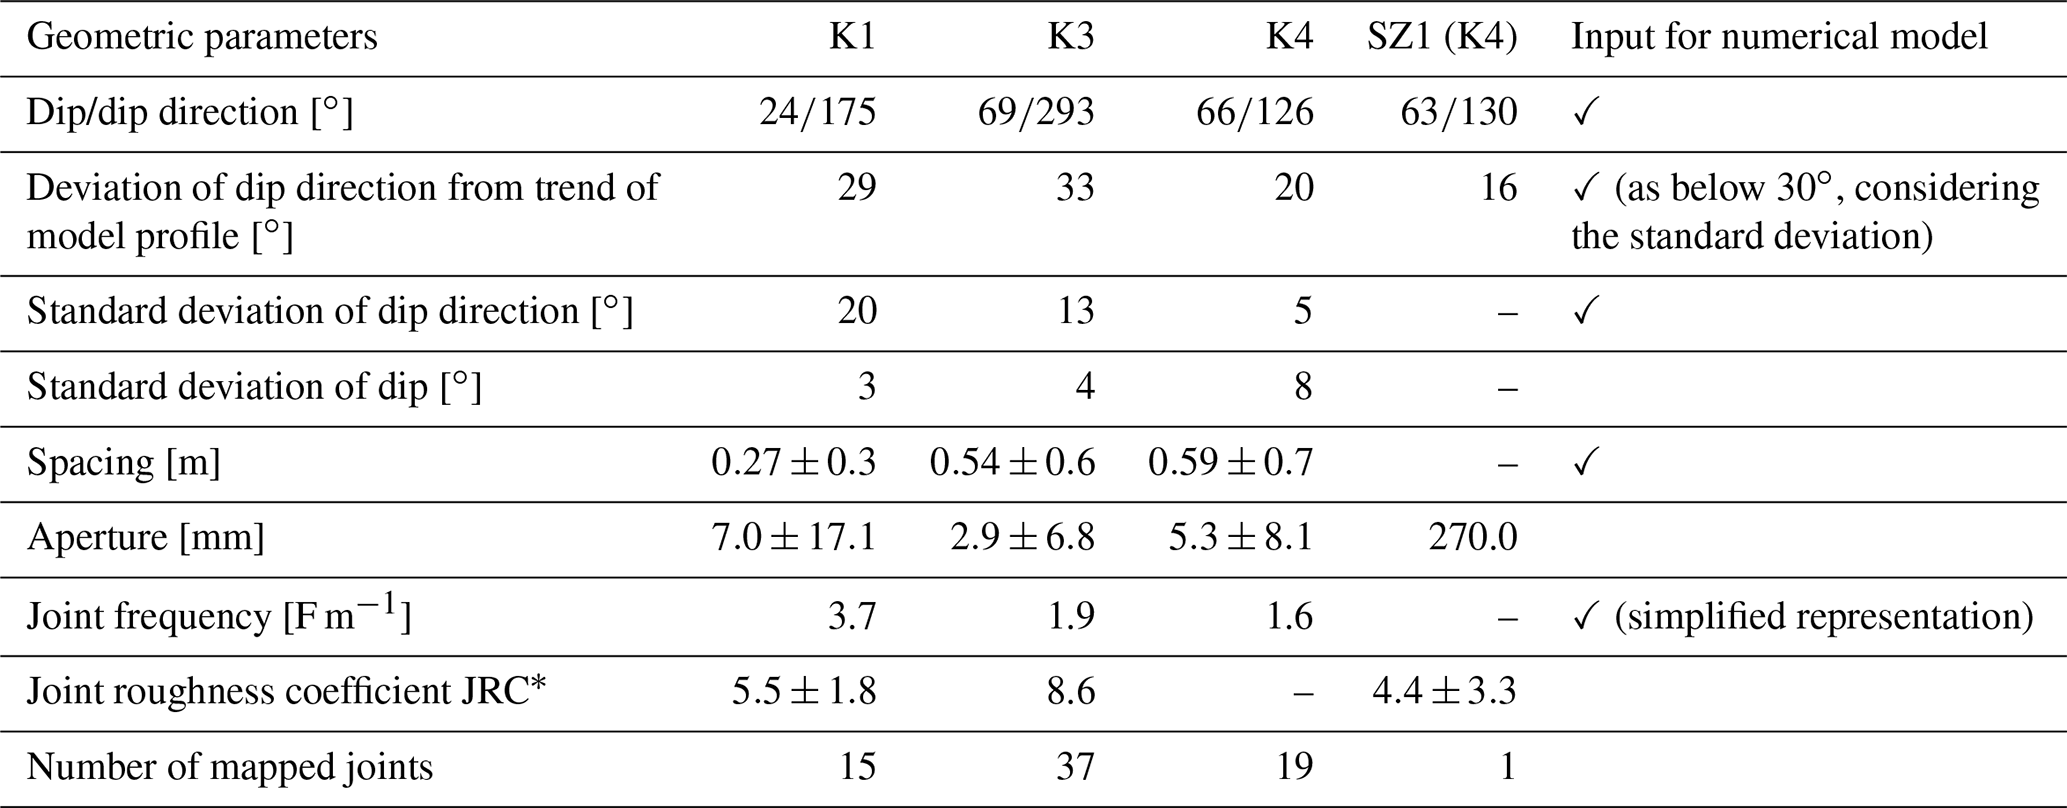
Standard deviations are only given for measured parameters. K1 to K4 are joint sets. SZ denotes shear zone. F denotes frequency. * The JRC was measured along joints not included in the scan lines.
The possible failure mechanism and shear zones which delimit the currently observed unstable rock mass were assessed manually with a 3D point cloud of the Zugspitze summit crest line derived by UAV-based (UAV – unmanned aerial vehicle) photogrammetry (Fig. 1e) and with a kinematic analysis of a potential plane and wedge failure (Fig. S1 in the Supplement). The latter was conducted with Dips 7.0 (Rocscience) for the southern slope face and along the main shear zones identified due to field mapping and the preceding analysis of the point cloud. The instability is driven by a complex combination of a plane and a wedge failure, although planar sliding is the dominant kinematic failure mode that affects the major left part of the unstable rock mass (Figs. 1a, e and S1). Planar sliding mainly occurs along shear zone SZ1, while wedge failure supports the displacement along SZ1 and SZ3 including a tension crack SZ2 in the upper part of the slope instability. Two further shear zones (SZ4 and SZ5) form the assumed downslope boundary of the unstable rock mass in the lower slope sections. Planar sliding can occur along SZ4 and SZ5, while wedge failure potentially enhances the failure process along SZ3 and the planes SZ4 and SZ5.
The geophysical transect and the numerical model profile run along the stepped planar failure part of the unstable rock mass (shear zones SZ1, SZ4 and SZ5; left part in Fig. 1e). Shear zone SZ1 (equivalent to K4) and shear zone SZ4 (corresponding to K1) were included in the numerical model (Fig. 3b) to allow simplification and a representation in 2D. We assume the slope instability to be significantly dominated by shear zone SZ1. Observed maximum displacements along the upper part of SZ1 lie in the range of decimetres and point to a high level of joint persistence. Further, three karst dolines with a depth of several metres were mapped along SZ1 and at the intersection of shear zone SZ1 with SZ2 (Figs. 1a, S2). SZ1 has a trace length of approximately 70 m, runs in a maximum depth of 10–15 m and dips to the southeast. It is highly fractured and displays joint opening of several decimetres filled with fine material which ranges from clay to gravel in size (Fig. 1d).
The 3D point cloud analysis was used to assess the unstable rock mass at the south face of the summit crest to a volume of approximately 2.9×10⁴ m3 (Fig. 1e). Measured fracture displacements between 2013 and 2019 show that the rock mass creeps slowly at an average of 2.1 mm yr−1 (Fig. S3). Between October and May, deformation rates are 84 % lower than in the remaining summer months. Details on the volume estimation and the measurement of the crack displacements are given in the Supplement.
2.1.2 Spatial permafrost distribution
In the 1960s and 1990s, permafrost at the Zugspitze summit was found in deep and permanently ice-filled fractures with a maximum aperture of 0.1 m (Körner and Ulrich, 1965; Ulrich and King, 1993). Current borehole temperatures at the peak of the Zugspitze average −1.1 ∘C within the permafrost core area (20–25 m away from the rock walls). At the margin to the active layer (ca. 5 m away from the north face), the temperatures approach a minimum of −6 ∘C during winter (Böckli et al., 2011; Gallemann et al., 2017; Krautblatter et al., 2010; Noetzli et al., 2010). A model for the permafrost evolution at the Zugspitze peak by Gallemann et al. (2017) shows that the permafrost decreased by 2 m at the north face and by 7 m at the south face between 1915 and 2015, with an increase in the permafrost temperature of approximately 1 ∘C.
To accurately assess the current distribution of permafrost along the model profile at the study site, we applied laboratory-calibrated electrical resistivity tomography (ERT). This technique has been used to characterise and monitor the spatial variability and evolution of mountain bedrock permafrost in steep rock walls (Keuschnig et al., 2017; Krautblatter et al., 2010; Magnin et al., 2015; Murton et al., 2016; Scandroglio et al., 2021). The outlined procedure of the measuring set-up in the field was similarly applied to the Zugspitze summit crest. Two surveys were conducted at the end of August 2014 and 2015, which corresponds to the time that the active layer at the Zugspitze peak usually reaches its maximum extent (Gallemann et al., 2017). Data processing and inversions were performed with Res2DInv (see the Supplement for the measuring set-up, data acquisition and analysis of the field surveys).
To assign the measured ERT of the summit crest to frozen or unfrozen slope sections, we used the resistivity of saturated frozen and unfrozen Wetterstein limestone in the laboratory, defined (i) by Krautblatter et al. (2010) in the same lithology, and (ii) in the context of this study based on two rock blocks from the field site. For the laboratory tests, we followed the suggested procedure by Krautblatter et al. (2010), although it was limited to a single cooling and subsequent freezing trajectory of the samples from 10 down to −6 ∘C. The rock samples (both with a size of 0.02 m3) were kept in a custom-built, temperature-controlled cooling box for the duration of the tests. Rock temperature was measured simultaneous to resistivity with two Pt100 sensors (Greisinger GMH 3750, with a 0.03 ∘C precision) inserted in the rock samples (Fig. 4a). Measurements were performed along 34 different Wenner arrays installed parallel to each other.
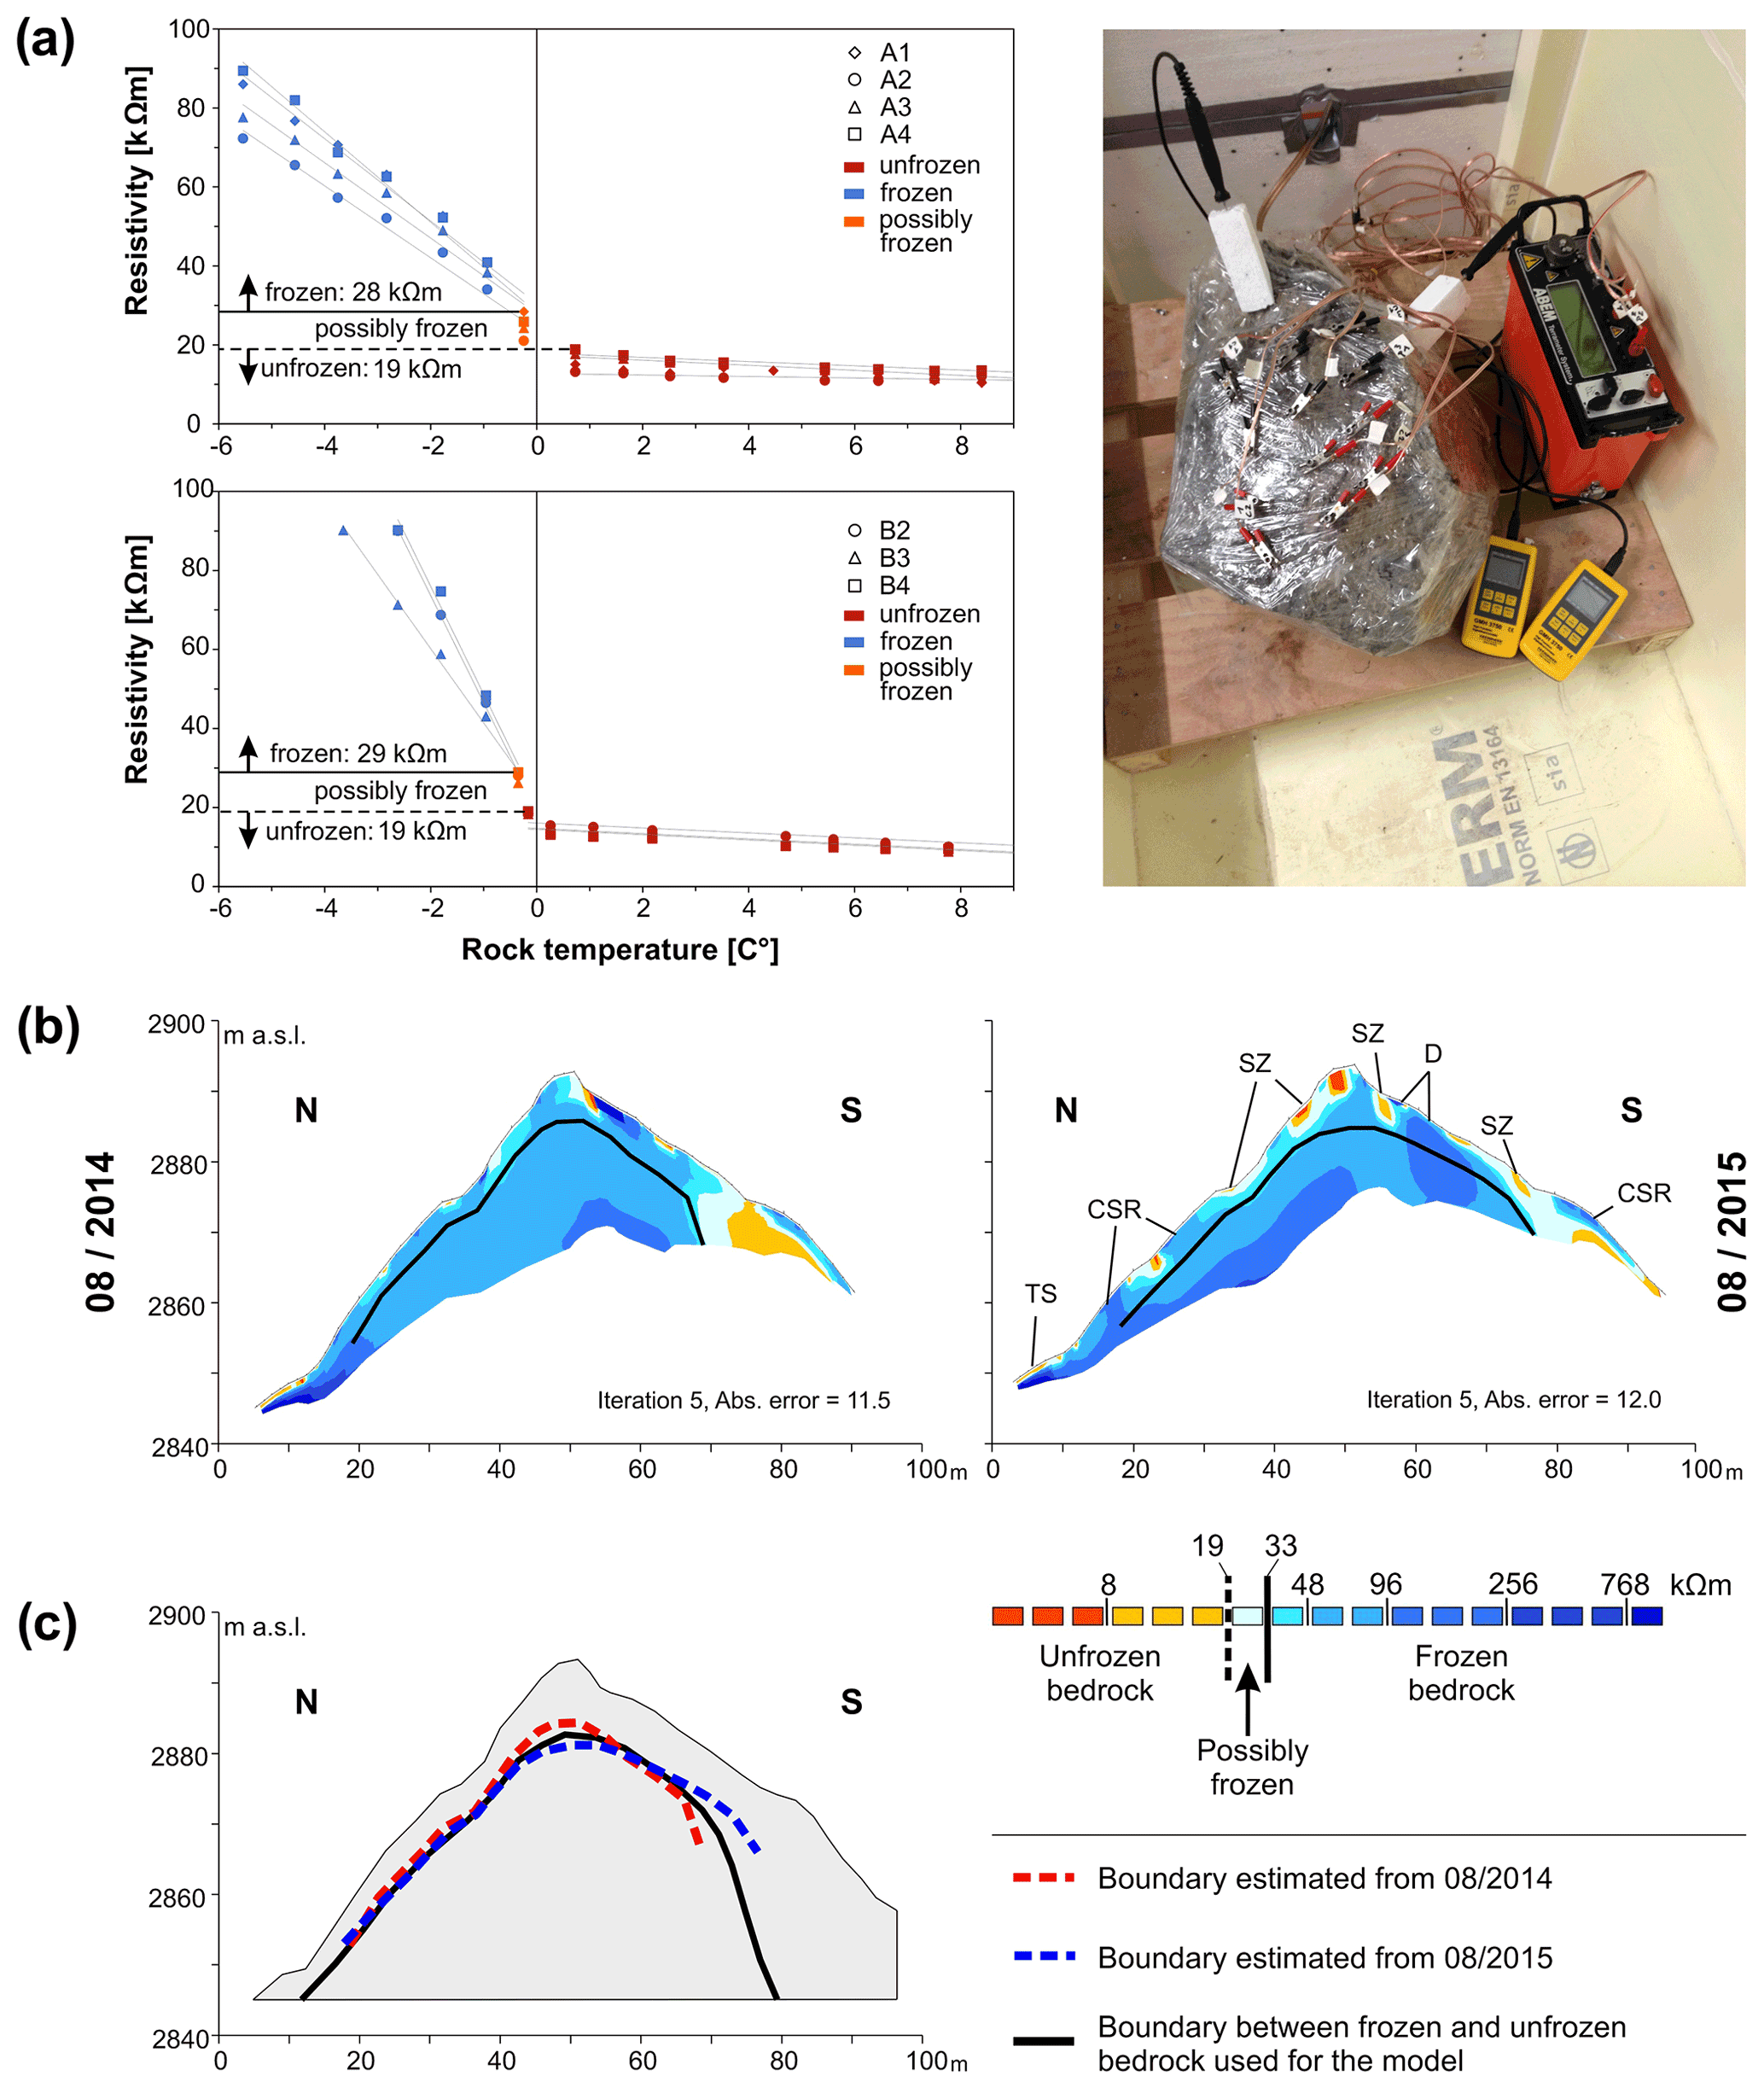
Figure 4The left side of panel (a) shows the laboratory-tested electrical resistivity of frozen and unfrozen Wetterstein limestone collected at the study site. The definition of frozen (blue symbols), unfrozen (red symbols) and possibly frozen (orange symbols) electrical resistivity is based on the freezing trajectories of two rock samples. Measurements were performed along different Wenner arrays (i.e. A1–A4 or B2–B4) installed parallel to each other. The right side of panel (a) outlines the test set-up in the laboratory cooling box. (b) The distribution of frozen and unfrozen bedrock in the Zugspitze summit crest was derived from two ERT surveys in August 2014 and August 2015. TS represents the Talus slope; CSR stands for compact solid unfrozen rock; SZ corresponds to the shear zone; D represents doline. Panel (c) displays the current spatial extent of bedrock permafrost, which was estimated from the ERT campaigns and used for the numerical model.
The laboratory electrical resistivity (ER) clearly showed values lower than 19 kΩm for unfrozen rock and values higher than 28–29 kΩm for frozen rock (Fig. 4a). The equilibrium freezing point at −0.2 to −0.4 ∘C is indicated by a 21- to 37-fold increase in the frozen temperature–resistivity gradient. This pattern of ER versus rock temperature is similar to the one demonstrated by Krautblatter et al. (2010): here, the ER measures 30±3 kΩm at the equilibrium freezing point (−0.5 ∘C). Overall, we defined ER values lower than 19 kΩm and higher than 33 kΩm as unfrozen or frozen respectively, and the range of values between the above-mentioned thresholds are defined as possibly frozen rock.
The ERT results from 2014 and 2015 are interpreted as follows (Fig. 4b, c):
-
The shallow rock layer is almost continuously unfrozen on both aspects of the crest. This assumption is confirmed by (i) borehole rock temperatures at the Zugspitze peak which show a 2–4 m thick active layer on the north face (Gallemann et al., 2017), and (ii) thermistor-based rock temperatures measured along the ERT transect at a depth of 10–80 cm below the ground surface. The corresponding thermistors (specially modified iButtons in rods) show that the rock temperatures do not remain below 0 ∘C throughout the year and are positive at the moment of the ERT surveys (Figs. 1b, S4).
-
Due to this evidence, the current boundary to permafrost on the north face and at the upper part of the south face was set to a continuous depth of approximately 5 m (black line in Fig. 4b, c).
-
Most near-surface interstitial patches of resistivity > 33 kΩm relate to massive ice visible in the metre-deep karst doline close to the crest line and surficial drying of rock usually limited to the upper decimetre (Hauck and Kneisel, 2008; Sass, 2005).
-
On the lower south slope, the unfrozen bedrock becomes thicker with decreasing altitude and can be found down to a depth of 10 m or more indicated by resistivity values < 19 kΩm.
-
Other individual patches of low electrical resistivity (<19 kΩm) refer to major shear zones or to the highly porous talus slope below the northern rock wall filled with air or with unfrozen, saturated and fine material (Hauck and Kneisel, 2008; Supper et al., 2014). Zones of high conductivity can be promoted by precipitation or water from snowmelt which easily infiltrates along unfrozen fine fillings or fractures (Keuschnig et al., 2017).
-
The resulting spatial extent of permafrost relates to the core of the crest and rock layers below 5 m at the north face.
2.1.3 Mechanical properties
The Zugspitze summit crest consists of Triassic Wetterstein limestone which has a thickness of 1000 m and constitutes the majority of the Zugspitze Massif and the Wetterstein mountains (Gallemann et al., 2017; Miller, 1962). The limestone is massy, fine-grained and dolomised and shows little heterogeneity in terms of lithological properties (Krautblatter et al., 2010). Its porosity ranges between 1.9 % (Draebing and Krautblatter, 2012) and 4.4 % (Krautblatter et al., 2010).
The distinct element method in UDEC enables one to simulate the mechanical behaviour of a discontinuous medium: the assemblage of discrete rock blocks separated from each other by discontinuities. We extensively investigated frozen and unfrozen rock and joint properties in the laboratory to assess the effect of thawing on the mechanical strength and deformability, and to determine the required material parameters for the model. All tests were performed with fully water-saturated Wetterstein limestone samples collected at the study site. Frozen rock samples had a mean temperature of −5 ∘C, whereas unfrozen rock specimens were tested at room temperature (∼22 ∘C). Detailed information on the preparation of the rock samples, the test set-ups and the conditions can be found in the Supplement (see Sect. S6).
The strength and deformability of the model blocks and zones within the blocks were represented by the Mohr–Coulomb plasticity constitutive model with a tension cut-off. At the slope scale, material properties of the rock mass instead of intact rock are needed, as discontinuities reduce rock mass strength and induce non-linearities and anisotropy in the stress–strain behaviour (Hoek et al., 2002; Wyllie, 2018). Hence, blocks and zones were allocated rock mass properties. The intact rock data were transferred to rock mass characteristics and switched to field-scale properties following the GSI (geological strength index) rock mass classification system by Hoek and Brown (1997). The GSI system is directly linked to Mohr–Coulomb or Hoek–Brown strength parameters and rock mass deformation moduli (Cai et al., 2004). The deformation modulus of the rock mass Em can be described based on a field survey of the rock mass including description and measurement of block volumes and joint characteristics (Hoek et al., 2002):
where GSI is the geological strength index for the rock mass, D is the disturbance factor and σc is the uniaxial compressive strength of the intact rock. The latter was tested in the laboratory and is a function of temperature (Table 3). Following Cai et al. (2004), a GSI value of 65 was derived which relates to an interlocked, mostly blocky to very blocky rock mass formed by four joint sets with a mean spacing of 56 cm (Table 2) and to rough slightly weathered surfaces. The disturbance factor D was set to 0 as the near surroundings of the profile are not affected by significant blast damage or excavating actions.
Values for the elastic rock mass shear and bulk moduli Gm and Km respectively were derived according to the equations presented by Tipler and Mosca (2015) for intact rock:
and
where the Poisson's ratio υ, measured in this study (Table 3), describes the ratio of the transverse strain to the longitudinal strain under conditions of uniaxial stress (Jaeger et al., 2007). For Gm and Km, the dynamic Young's modulus Edyn was substituted by Em (see Eq. 1). The mass density ρ (g cm−3) and dilatational wave velocity VD (m s−1) were measured in additional tests (Table 3) and utilised to calculate the dynamic Young's modulus Edyn for intact rock (Rentsch and Krompholz, 1961):
Edyn and G were later used to determine the joint stiffness parameters. The rock mass internal friction angle φm and cohesion cm were estimated with the GSI and the Hoek–Brown constant mi according to Cai et al. (2004). It should be noted that while rock mass cohesion could be determined for both thermal conditions (as it is based on the temperature dependent uniaxial compressive strength), the unfrozen friction angle value was used for all thermal conditions (as the respective relation is not temperature dependent). The uniaxial tensile strength was calculated using the following relation:
where mb and s are constants for the rock mass (Hoek and Brown, 1997).
All mechanical properties of the intact rock and the rock mass, either tested in the laboratory or calculated, decrease in a temperature-dependent fashion with 0.3 % ∘C−1 to 0.8 % ∘C−1 (absolutely 8 %–22 %) upon thawing (see Tables 3 and 4); this pattern corresponds to other mechanical studies (see Table 1). While the increase in deformability is more pronounced for intact rock (0.8 % ∘C−1; 20.4 %–20.5 %) than for rock mass (0.3 % ∘C−1; 8.3 %–8.9 %), the tensile strength decreases by a similar amount when comparing intact rock with rock mass. This difference can be explained by the small variation in frozen and unfrozen Em values caused by the similar frozen and unfrozen intact rock uniaxial compressive strength (see Eq. 1).
Table 3Laboratory-tested strength reduction of intact dolomised Wetterstein limestone due to thawing. Standard deviations (indicated with ±) are given for measured parameters, and they were used for the determination of minimum and maximum values (given in parentheses) of the calculated parameters. RMC refers to parameters that are used for rock mass characterisation.

Table 4Estimated and calculated strength reduction of Wetterstein limestone rock mass due to thawing, derived from the GSI scheme after Hoek and Brown (1997). Minimum and maximum values of calculated parameters are given in parentheses. These were determined with the standard deviations of the measured parameters (Table 3). IP denotes that the parameter was used as an input parameter for the numerical model.
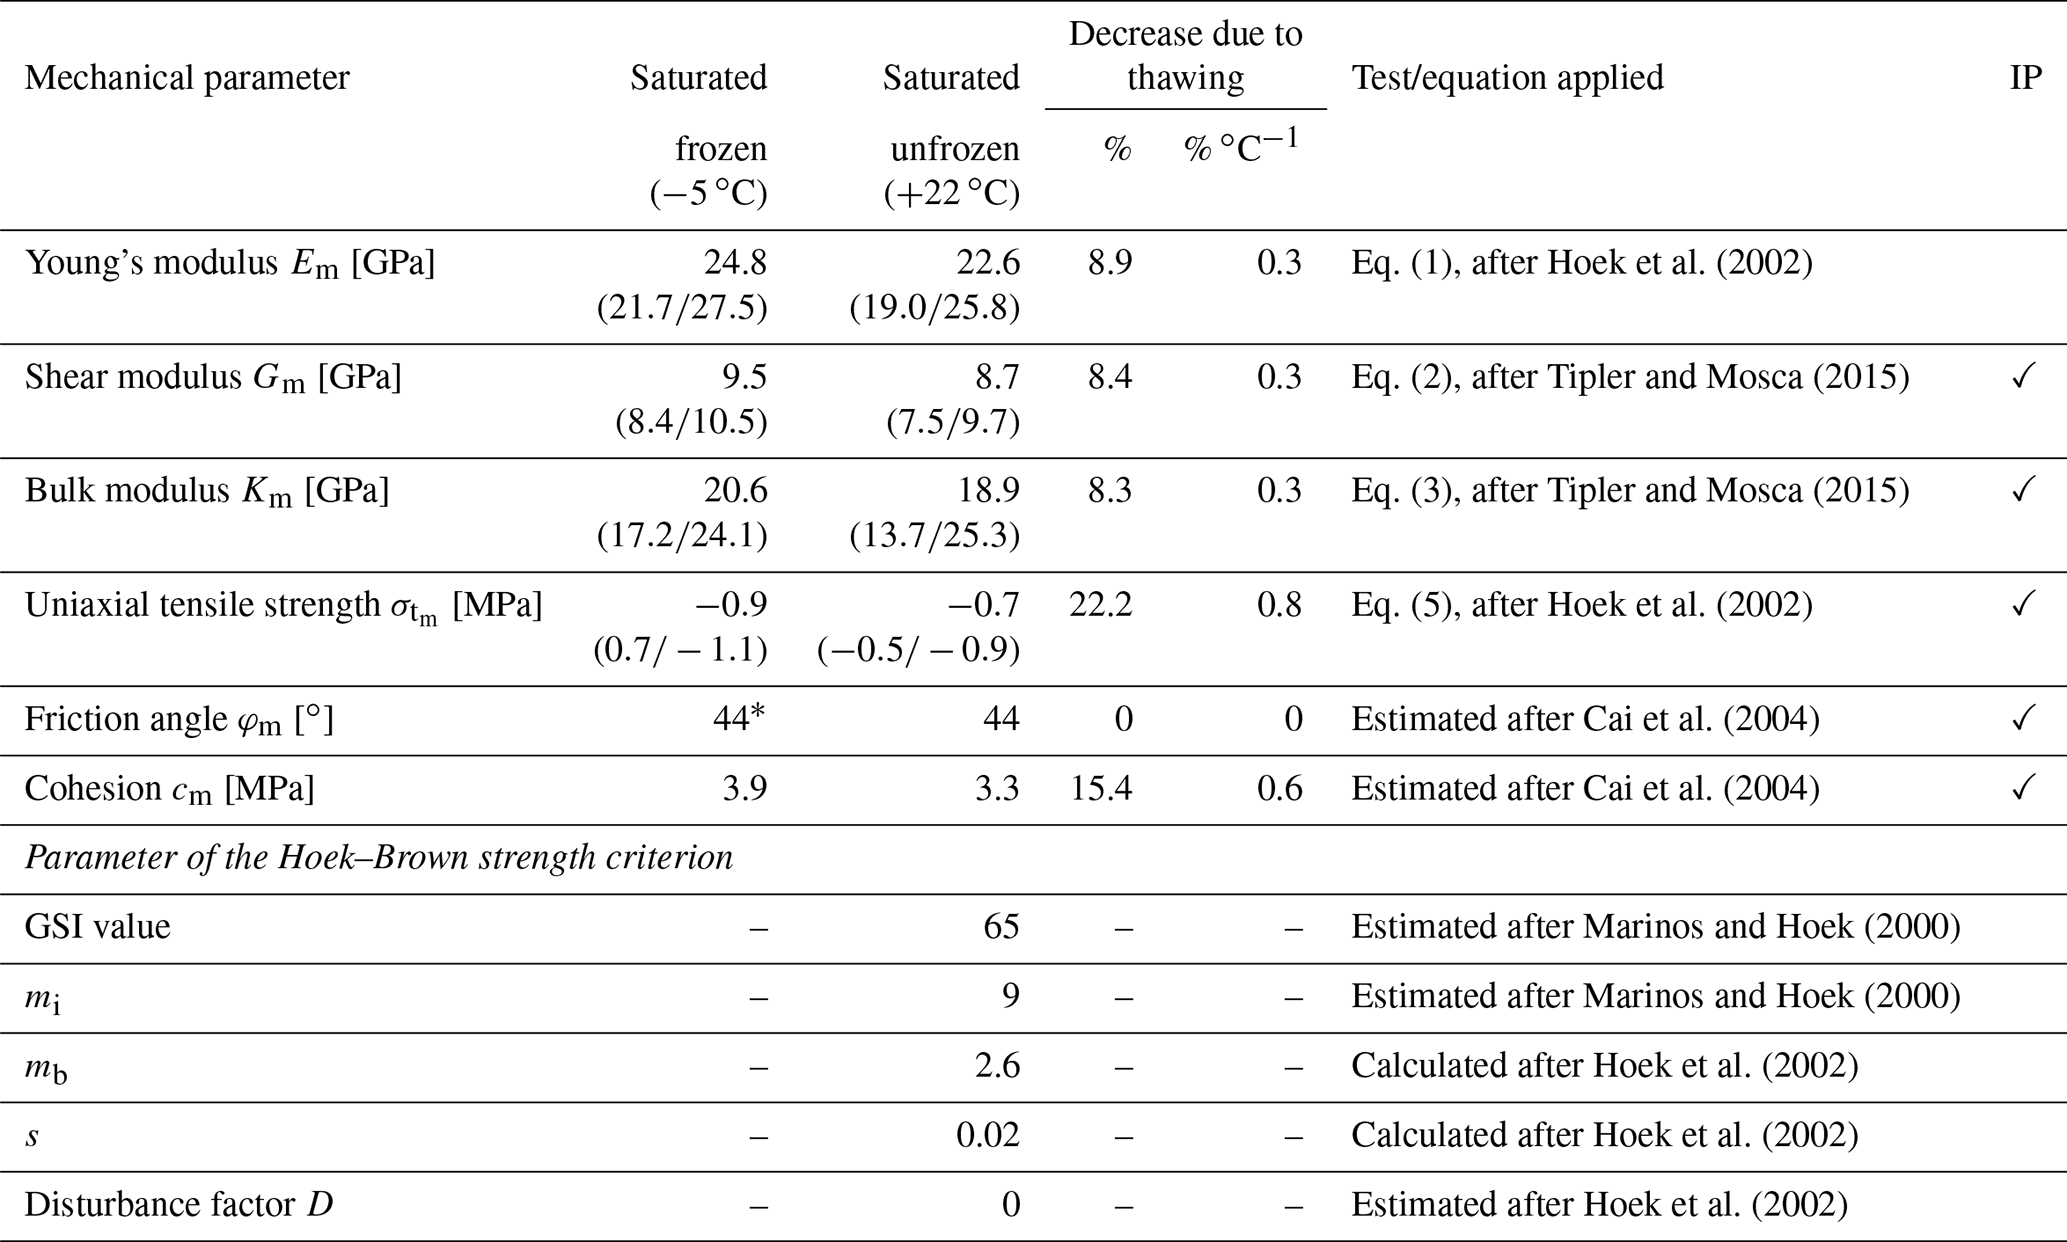
* The frozen rock mass friction angle was given the same value as for the unfrozen friction angle, resulting in a decrease in thawing of zero.
In UDEC, the deformability and strength of rock discontinuities were simulated by the Mohr–Coulomb area contact constitutive model. Rock joint parameters for ice-free and ice-filled joints were considered in the presented stability analyses. The deformability of the joints is described by the joint normal stiffness kn,
and the joint shear stiffness ks,
where s is the joint spacing (m), Em and E are the Young's moduli (GPa) for rock mass and intact rock respectively (Barton, 1972), and Gm and G are the shear moduli (GPa) for rock mass and intact rock respectively (Glamheden and Lindblom, 2002; Itasca Consulting Group, 2019). Finally, temperature (T) dependent cohesion c,
and friction φ,
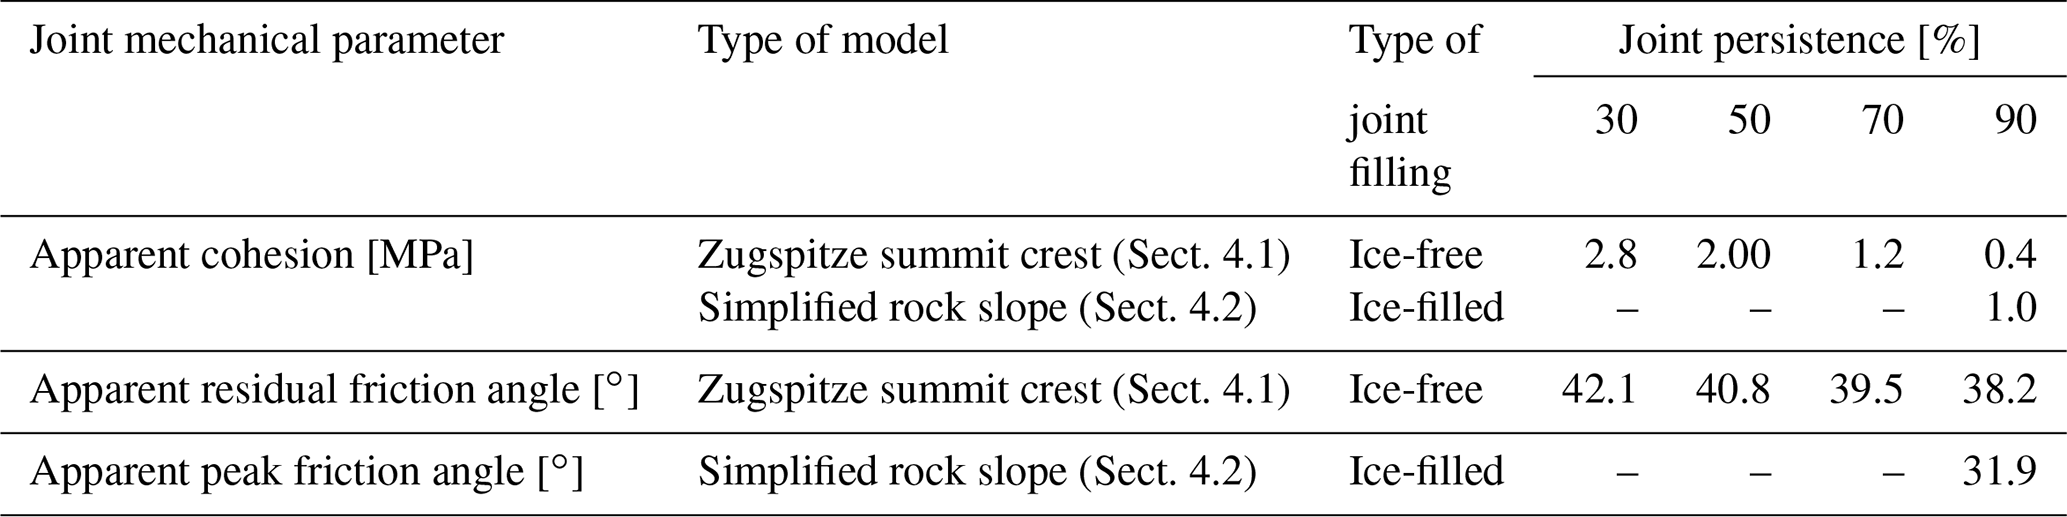
of frozen ice-filled rock joints are determined based on the failure criterion presented by Mamot et al. (2018), which is valid for temperatures ranging from −4 to −0.5 ∘C and normal stresses between 100 and 800 kPa. Therefore, the cohesion and friction angle were calculated for temperatures of −4, −3, −2, −1 and −0.5 ∘C, which are currently measured in the frozen sections of the Zugspitze summit (Gallemann et al., 2017). The stress range of 100–800 kPa corresponds to the rock overburden represented by the model of the Zugspitze summit crest (Fig. 3b).
Values for the cohesion of frozen and unfrozen, ice-free rock joints were roughly estimated from Krautblatter et al. (2013). As initial displacements lead to the destruction of asperities and smoothing of joint surfaces, the frictional strength of rock–rock contacts was represented by the residual friction angle φr, estimated following Barton and Choubey (1977):
where φb is the basic friction angle; r is the Schmidt hammer rebound value of weathered surfaces; and R is the Schmidt hammer rebound value of unweathered, sawn surfaces. Rebound hardness values of weathered frozen and unfrozen Wetterstein limestone surfaces were collected with the Schmidt hammer (N-type) following the proposed method of Aydin and Basu (2005) and Ulusay (2015). In contrast, the basic friction angle was determined by tilt tests of frozen and unfrozen joint surfaces as recommended by Barton (2013).
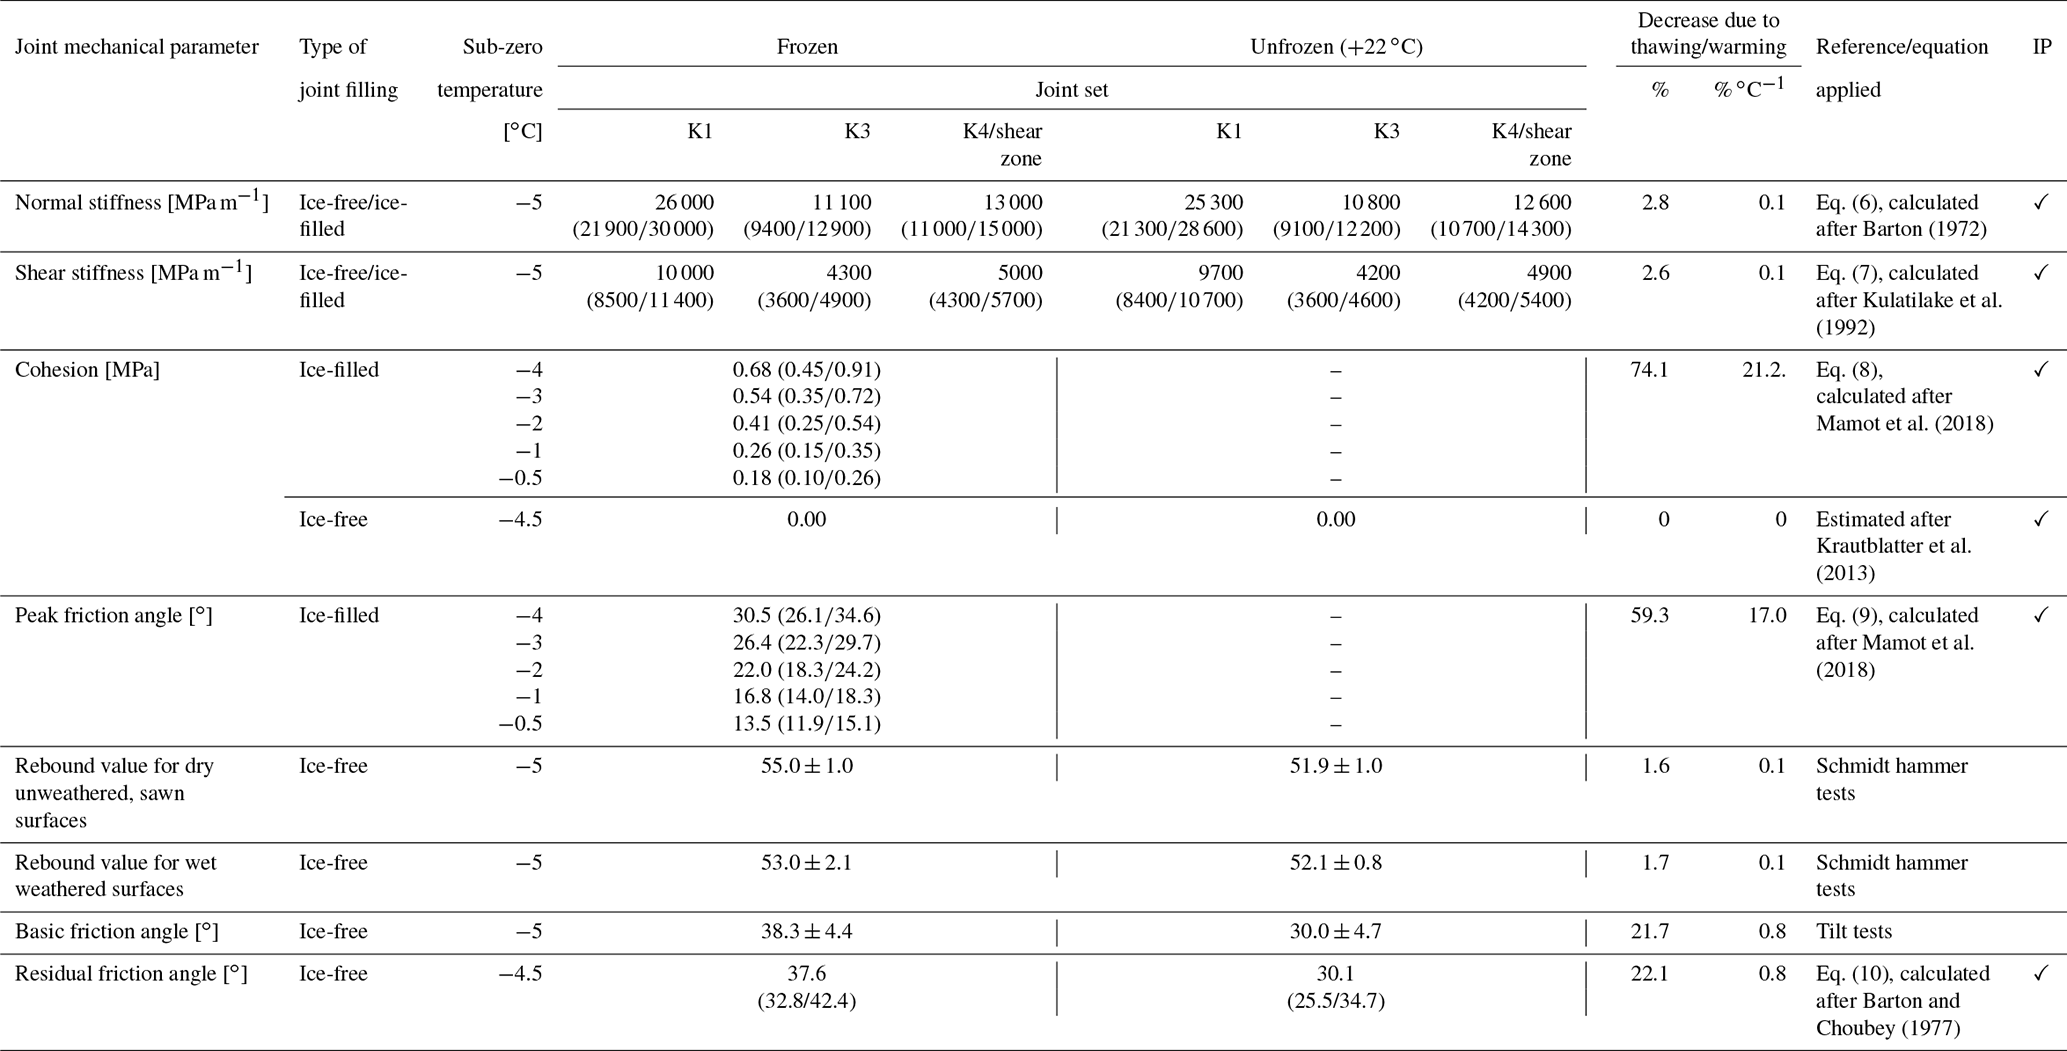
The investigated and calculated joint deformation and mechanical strength properties decrease absolutely by 2 % to 22 % upon thawing (0.1 % ∘C−1 to 0.8 % ∘C−1; Table 5). The small variation between frozen and unfrozen Em values results in a small difference between frozen and unfrozen kn and ks (0.1 % ∘C−1; 2.6 %–2.8 %). In contrast, the stiffness values vary more strongly between the various joint sets which are also dependent on the joint spacing. In general, the estimated unfrozen kn and ks lie well within the range of values proposed by the UDEC database (Itasca Consulting Group, 2019) and Kulatilake et al. (1992), or measured by Barton (1972) and Bandis et al. (1983). Similarly, the measured unfrozen φb corresponds well to the values listed in studies such as Barton and Choubey (1977) or Ulusay and Karakul (2016).
Table 5Laboratory-tested and calculated strength reduction of saturated Wetterstein limestone discontinuities due to warming or thawing. Standard deviations (indicated with ±) are given for measured parameters, and they were used for the determination of minimum and maximum values (given in parentheses) of the calculated parameters. IP denotes that the parameter was used as an input parameter for the model.
2.2 Model set-up
The topography of the rock slope used in the model was derived from a digital terrain model of the Zugspitze summit area. Three fully persistent joint sets (K1, K3 and K4) and the dominant shear zone were included (Fig. 3b). For simplification and shorter computation time, the joint spacing was scaled up in the model by a factor of 5. The presence of intact rock bridges was accounted for according to the approach by Jennings (1970). After this, the joint cohesion and friction angle were proportionately increased by the respective rock mass cohesion and friction angle depending on the estimated percentages of the surface areas of rock bridges and joints within the rock slope.
The blocks in the model are supposed to be deformable and were subdivided into a mesh of finite difference elements with a size of 1.5 m. The stress field was initialised according to the varying density of overburden which depends on the topography of the slopes. We assumed a horizontal to vertical stress ratio of 0.5. Roller boundary conditions were implemented at the sides of the model (i.e. vertical movements were allowed), whereas vertical and horizontal displacements were suppressed along the base.
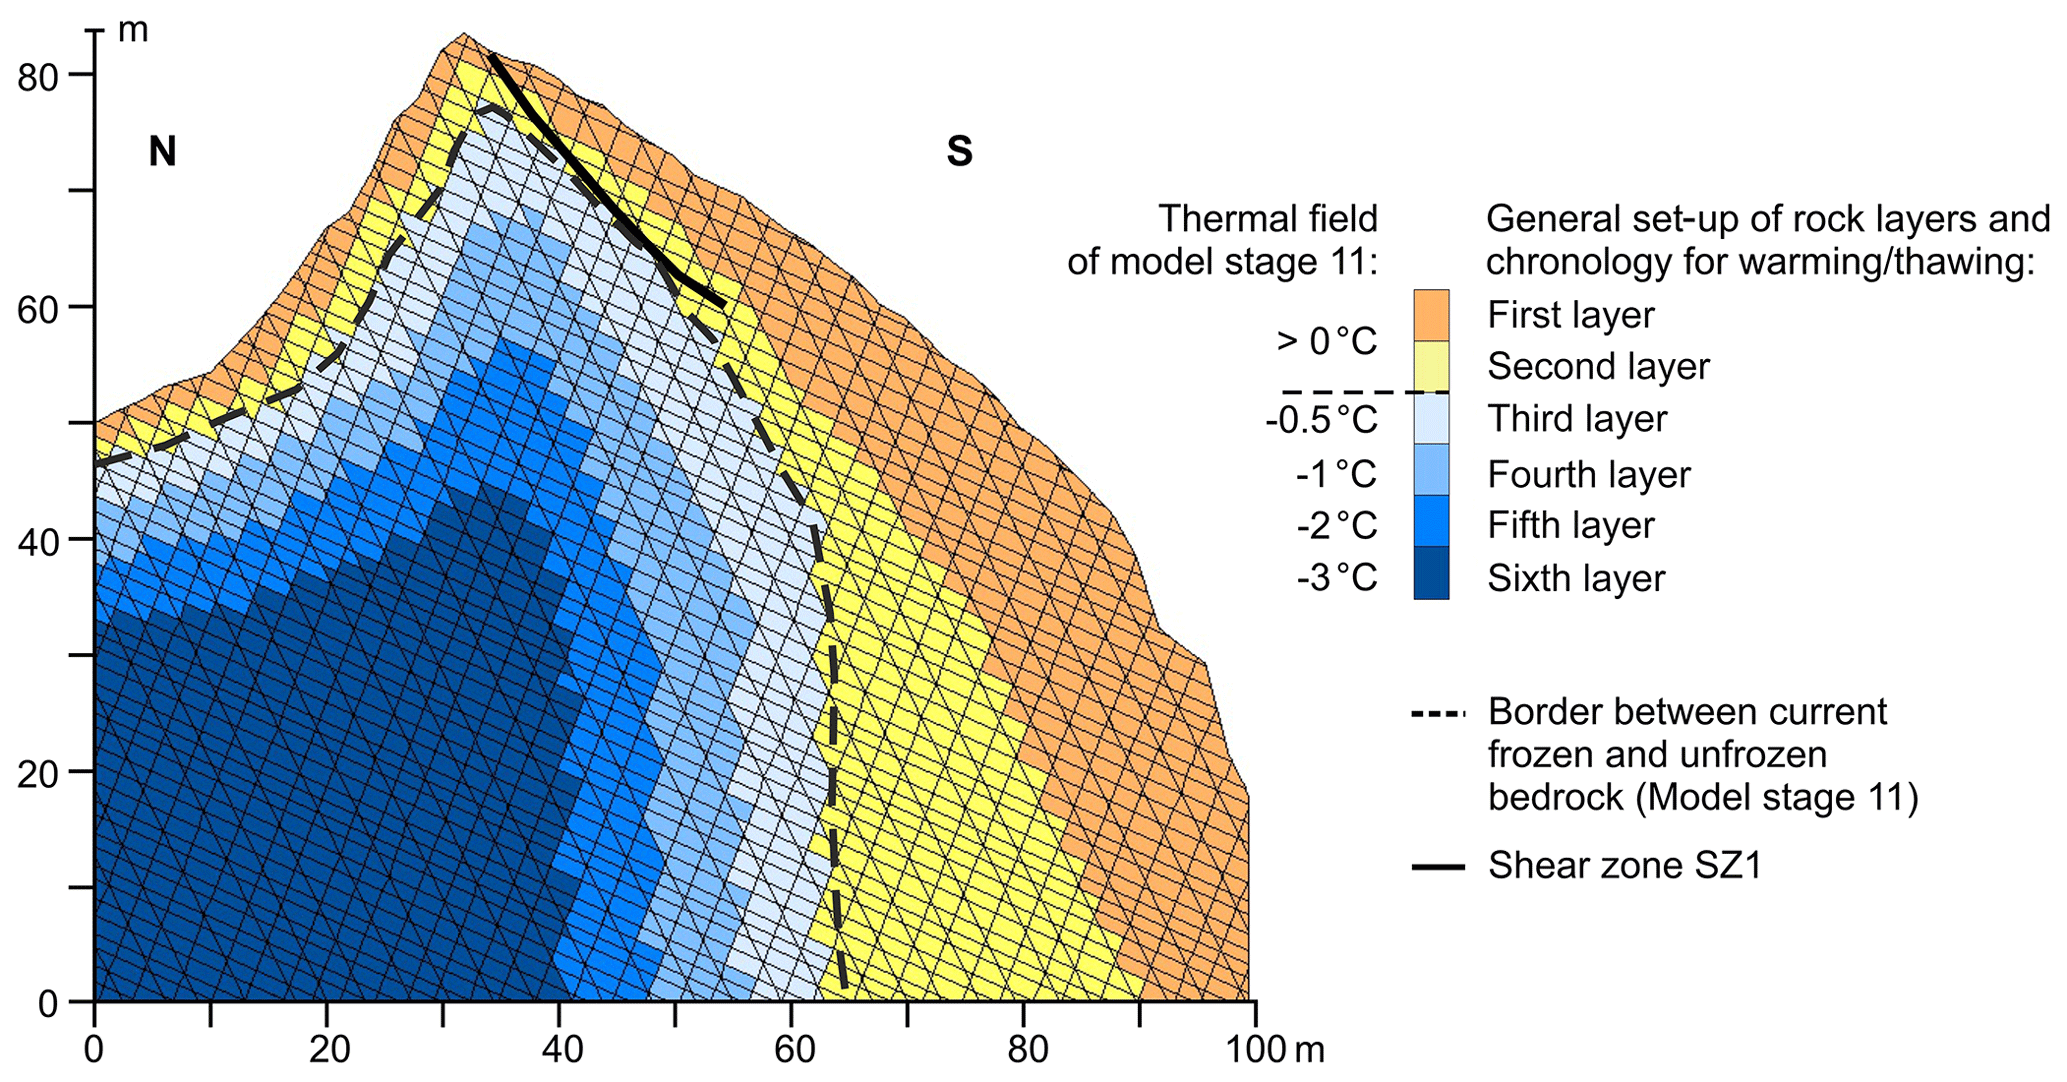
Figure 5Spatial warming/thawing pattern for the numerical model of the Zugspitze summit crest. For each warming/thawing step, the six rock layers (coloured areas) are assigned an individual temperature with a characteristic set of mechanical parameters. Warming or thawing proceeds from the outside to the inside of the crest. The dashed black line marks the current boundary between frozen and unfrozen rock, derived in Sect. 2.4. The presented thermal field is estimated and refers to model stage 11 in Table 6 (current state of permafrost distribution in the crest).
The combined boundary of bedrock permafrost within the summit ridge, derived from ERT measurements from 2014 and 2015 (Fig. 4b), was used to define the current frozen and unfrozen sections of the numerical model. We then introduced six subsurface layers to simulate a stepwise warming or thawing from the slope surface to the core of the crest by adjusting the temperature-dependent material parameters for a specific temperature level and subsequent numeric cycling. The layers are oriented parallel to the derived permafrost boundary and account for a stronger warming signal directed from the south slope (Fig. 5). The defined current permafrost boundary and the estimated spatial pattern of layers for warming are both in accordance with modelled current and future thermal fields of arbitrary mountain ridge geometries (Noetzli et al., 2007) and, in particular, of the Zugspitze (Böckli et al., 2011; Noetzli, 2008).
Table 6Modelling strategy for the Zugspitze summit crest. The model was run with varying rock mass temperature, joint persistency and filling. The temperature levels for gradual warming were as follows: −4, −3, −2, −1 and −0.5 ∘C.
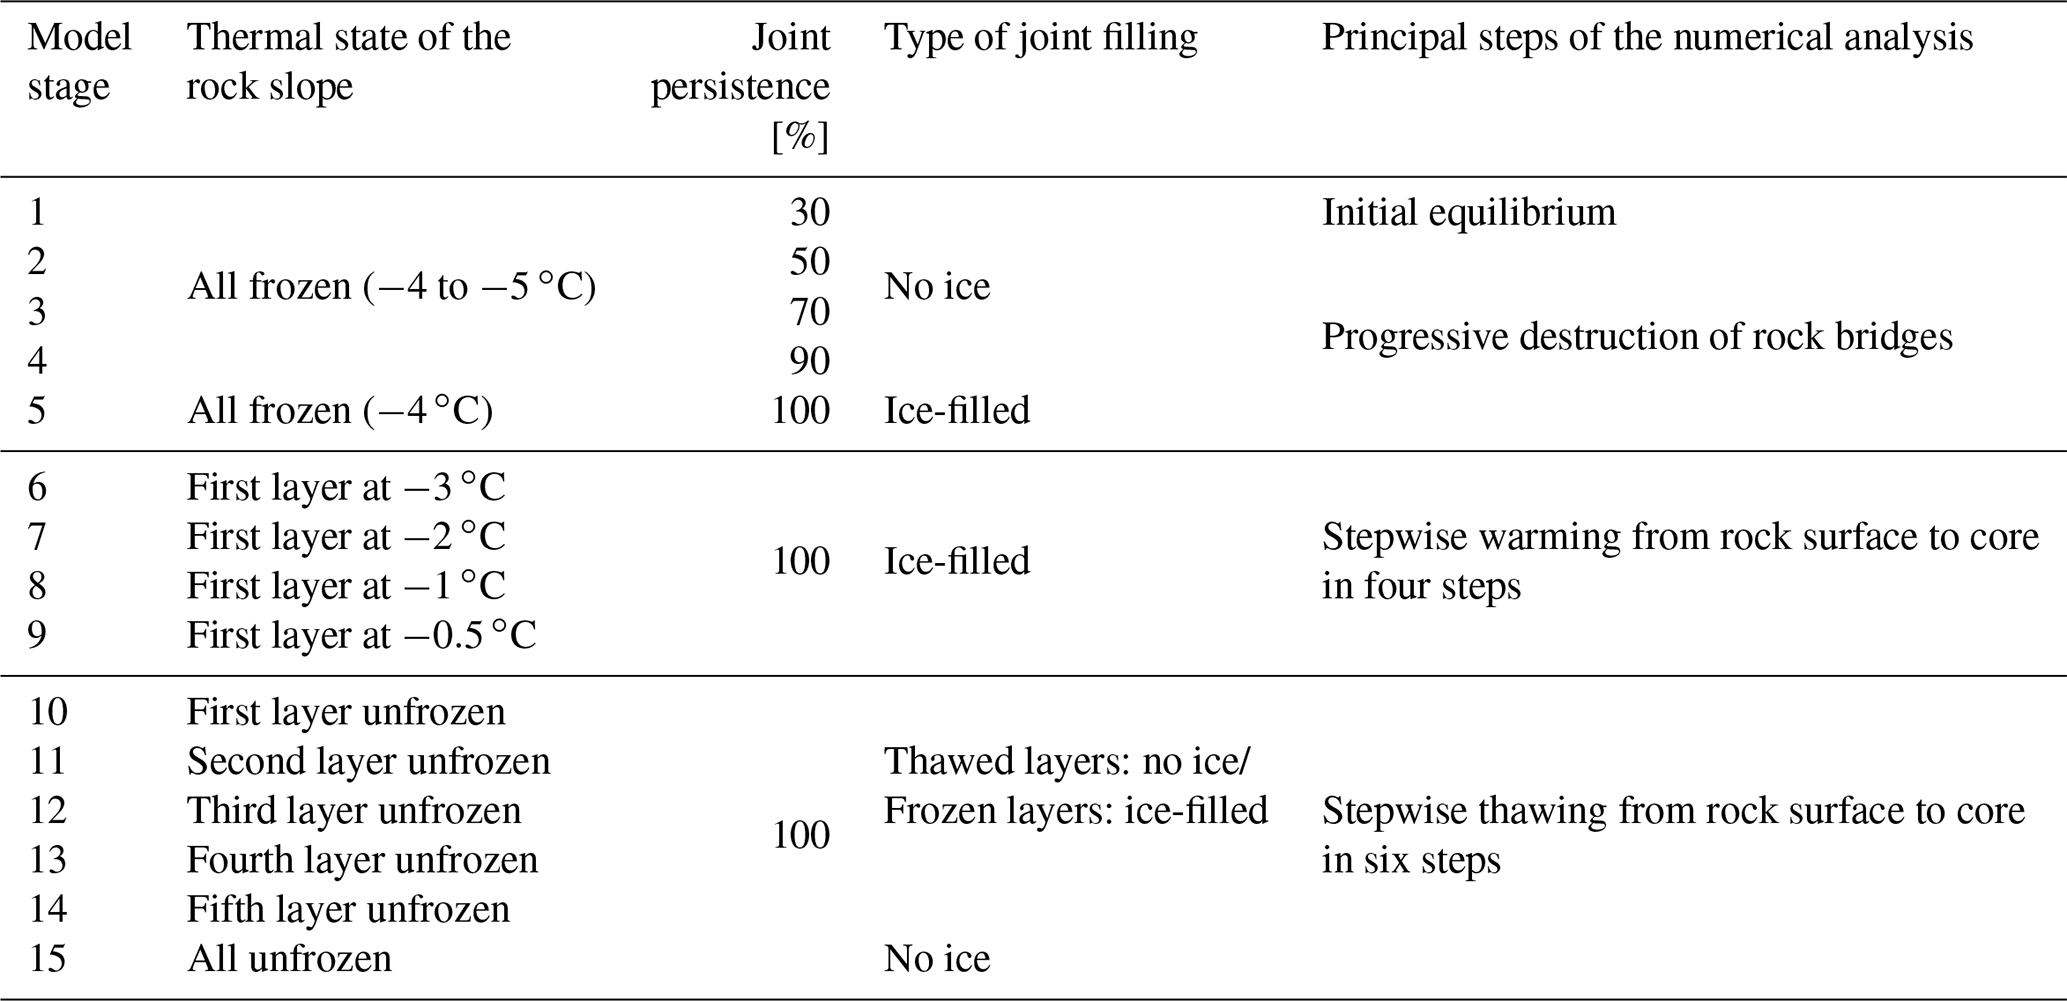
Table 7Implemented strength properties for ice-filled and frozen ice-free joints during the initial stage of rock bridge destruction, represented by a joint persistence of 30 % to 90 %. The different cohesion and friction values are calculated after Jennings (1970) and depend on the estimated relative percentage of rock bridges and joints. The corresponding values at a joint persistence of 100 % are shown in Table 5.
2.3 Procedure for the numerical analysis
The general modelling procedure consists of four steps – the calculation of an initial equilibrium and three successive steps of potential destabilisation which include the progressive destruction of intact rock bridges, the warming and the thawing of a permafrost rock slope:
-
Initial state – the numerical analysis was started by developing an initial equilibrium with a low joint persistence of 30 % (Model stage 1 in Table 6). The summit crest is assumed to be fully frozen representing an undefined moment in the past.
-
The progressive loss of rock bridges – the destabilisation of a permafrost-affected rock slope is initiated by the progressive destruction of cohesive intact rock bridges which prepare new shear planes along which displacement can take place (Krautblatter et al., 2013). The current overall joint persistence was assessed to be 90 %–100 %, as we observed a high trace length of the discontinuities and a displacement of several decimetres along the main shear zone, indicating that most of the rock bridges are lost. The past destruction of rock bridges was simulated by a reduction in the apparent joint cohesion and friction angle in three steps which represents a progressive increase in the joint persistence from 30 % to 90 % (stages 1–4 in Tables 6 and 7; for more details, see Sect. S7). Joints may be partly filled with ice during the loss of rock bridges. However, joints were assigned properties of ice-free joints as, according to Krautblatter et al. (2013), deformation and shear strength are mainly controlled by rock mechanical processes at this early stage of destabilisation. As long as a certain part of intact rock bridges and asperities along joint surfaces are present, stresses are supposed to concentrate at these locations while the softer ice fillings may be squeezed away (in particular, at greater depths).
Following Krautblatter et al. (2013), the advanced stage of accelerated displacements in a permafrost-affected rock slope begins as soon as most of the rock bridges are broken. Ice mechanics (fracturing of rock–ice contacts and ice, as well as the creep of ice) will then increasingly replace rock mechanics (friction of rock–rock contacts and fracture of rock bridges) in controlling displacements along discontinuities and their potential acceleration. To introduce this stage of destabilisation, the joint persistence was further increased to 100 % and rock joints were simulated to be ice-filled (Stage 5 in Table 6). For simplification and due to data availability, the joint shear resistance was solely given by the fracture of ice or rock–ice contacts, whereas the creep of ice was neglected.
-
Warming permafrost – the frozen crest was gradually warmed from the slope surface to the core from −4 to −0.5 ∘C (stages 6–9 in Table 6). This was applied to the six rock layers defined in Fig. 5. Firstly, the outermost (orange) section was warmed to −3 ∘C, while the inner sections remained at −4 ∘C (Stage 6). After that, the outermost section was warmed to −2 ∘C and the adjacent inner section (yellow layer in Fig. 5) was warmed to −3 ∘C, while the inner sections remained unchanged (Stage 7). This procedure was continued until the outermost layer was at −0.5 ∘C (Stage 9). Each warming step was characterised by adjusting the temperature-dependent material parameters to the warmer temperature and by subsequent numeric cycling. The simulated temperature range of the rock mass is consistent with currently monitored borehole temperatures in permafrost rock walls across the European Alps (Gallemann et al., 2017; Noetzli et al., 2019).
-
Thawing from the slope surface to the core was implemented in the same way as warming (stages 10–15 in Table 6), until all subsurface layers of the summit ridge were unfrozen. The spatial pattern of thawing is illustrated in Fig. 5.
To assess the level of a potential slope stability loss due to warming or thawing, we calculated the factor of safety (FS) by using the common strength reduction technique (Wyllie, 2018). Using this approach, the cohesion and frictional strength of the rock mass and the joints are reduced simultaneously and gradually by increasing trial factors in a series of numerical simulations until failure occurs. A bracketing solution approach was applied to progressively reduce the bracket between stable and unstable solutions until it falls below a specified threshold (Itasca Consulting Group, 2019). The resulting FS is a single indicator of minimum stability which globally refers to the entire slope.
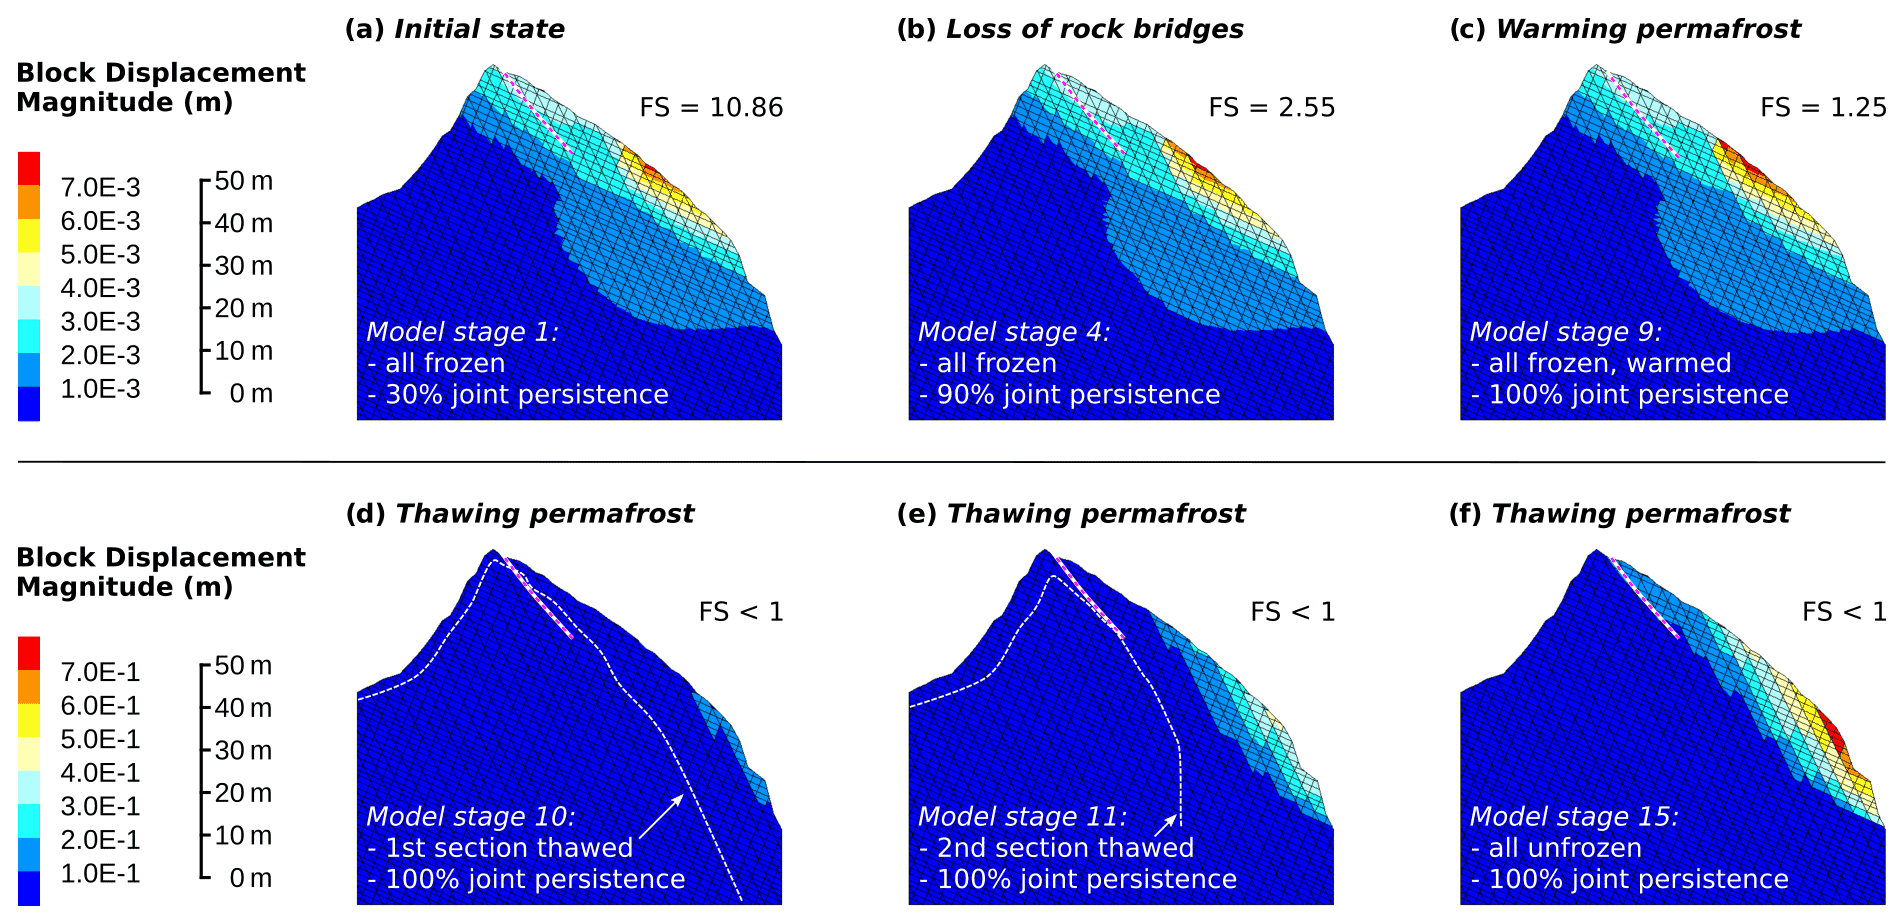
Figure 6Calculated spatial distribution and magnitude of displacements for the Zugspitze summit ridge. (a–c) Factors of safety (FS) are given for stages 1, 4 and 9, which refer to the loss of rock bridges and warming. (d–f) Stages 10, 11 and 15 correspond to thawing with FS below 1. The prominent shear zone is marked by a white and red dashed line. The permafrost boundary in panels (d) and (e) is highlighted by a white dashed line.
The relation between the dip of the joint sets, especially the bedding, and the slope face is a crucial factor for rock slope stability (Cruden, 2003; Wyllie, 2018). Thus, we performed a sensitivity analysis on the numerical impact of varying (i) slope angles and (ii) orientations of the fracture network on rock slope stability. For this, we transferred the Zugspitze model to a rock slope with a simplified topography, and warming steps were applied to the entire model domain without spatial differentiation. The topography of the Zugspitze south face was modified to a straight line. In accordance with the dimensions of the crest geometry, the height of the slope and the width of the upper face were standardised to 84 and 32 m respectively (Fig. 7).
Modelling was applied to 12 different slope angles between 30 and 69∘. For inclinations of 70∘ and higher, no initial equilibriums could be calculated as cycling exceeded the maximum computation time. The joint set orientations were kept constant. In a first step, an initial equilibrium was calculated for a frozen rock slope with ice-filled joints and a joint persistence of 90 %. In a second step, the joint persistence was increased to 100 %, and the rock slope was then warmed in four steps from −4 to −0.5 ∘C (by reducing the rock joint strength equivalent to the Zugspitze model). However, each warming step to the next degree centigrade was applied to the entire rock slope and not just to a single rock layer. Reducing the complexity of the model facilitates the transferability to other frozen rock slopes.
We also remodelled the stability for 12 different dip angles of the fracture network with reference to the slope. The positioning of the three model joint sets to each other was held constant while rotating them counterclockwise in steps of 15∘ for each of the 12 slope angles used for the first sensitivity test. The analysed orientations of the fracture network represented anaclinal and cataclinal slopes after Cruden (2003; Fig. 3). Hereafter, cataclinal slopes have a slope face and bedding with the same dip direction, whereas for anaclinal slopes, the dips of both planes have the opposite direction. The orientation and dip of the fracture network was represented by the bedding and then applied to the scheme after Cruden (2003). The simulated temperature of the rock mass was constantly at −4 ∘C as a stepwise warming was not applied.
4.1 Stability of the warming/thawing Zugspitze crest
Figure 6 shows the cross section of the Zugspitze summit crest with a factor of safety for different model states. While an increase in joint persistence or warming hardly lead to a rising block displacement magnitude (indicated by colours – note that panels a–c and d–f use different scales), thawing causes a drastic increase in displacements. As soon as thawing starts, the south face becomes unstable and maximum displacements increase to 0.14 m (Stage 10, Fig. 6d). Rock deformations rise to 0.42 m when the dimension of thawed bedrock reaches the current state (Stage 11, Fig. 6e) and measure 0.78 m for the whole rock slope thawed (Stage 15, Fig. 6f). The highest deformations (>0.4 m) concentrate on the upper 5–7 m of rock in the most inclined lower part of the slope (with a mean angle of 49∘). While warming brings the factor of safety close to unity, it lies below 1 for stages 10–15, which all refer to thawing.
4.2 Stability of a simplified permafrost rock slope with rising temperature
4.2.1 Sensitivity to the slope angle
The model results for exemplary slope inclinations between 60 and 64∘ are shown in Fig. 7. The block displacements increase and the related factors of safety decrease with higher slope angles and temperatures below the melting point. The factor of safety falls below unity at temperatures above −1 ∘C when a rock slope with a slope angle of 62∘ or more is warmed up. A 60∘ steep rock slope becomes unstable at temperatures above −0.5 ∘C.

Figure 7Numerically calculated block displacements (on a log scale) for a simplified rock slope geometry with exemplary inclinations of 60, 62 and 64∘, and five temperatures between −4 and −0.5 ∘C.
The interaction between slope gradient, maximum displacements and temperature can be separated into three domains (Fig. 8a):
-
Domain 1 (30–50∘) – “Stable slope” – the maximum displacements increase slightly by 0.4 mm per degree of slope angle. The correlations for all temperatures are significant with p values ≤ 0.04.
-
Domain 2 (55–62∘) – “First onset of instability” – slope destabilisation sets in for rock slopes at −0.5 ∘C and above an inclination of 50∘. This becomes obvious due to the abrupt increase in displacements, and the p value > 0.05. For rock slopes at −1 ∘C and below, the onset of instability is visible above an inclination of 55∘. Note that all displacements are 1 order of magnitude higher than in Domain 1.
-
Domain 3 (64–69∘) – “Accelerating slope destabilisation” – the displacements increase suddenly with a further increase in the p value and a corresponding decrease in the R2 value for a slope angle of 64∘ and for all rock temperatures. This points to a second stage of accelerating slope destabilisation. The displacements are 1 order of magnitude higher than in Domain 2.
The displacements are sensitive to the sub-zero temperatures at all slope gradients. However, the intensity of rock slope destabilisation is increased by higher rock temperatures close to the melting point (Fig. 8b): a warming from −4 to −2 ∘C leads to an increase in absolute displacements, which are low in Domain 1 (0.2 mm ∘C−1) but high in Domain 3 (7 mm ∘C−1). A respective warming from −2 to −0.5 ∘C also shows an increasing trend with higher slope gradients but is more pronounced with a massive increase from Domain 1 (0.6 mm ∘C−1) to Domain 3 (45 mm ∘C−1). Nevertheless, the highest temperature-dependent relative increase in displacements is observed in Domain 2 (Fig. 8b): values increase from 9.2 % ∘C−1 (Domain 1) to 38.5 % ∘C−1 (Domain 2) and fall to 25 % ∘C−1 for slopes steeper than 62∘ (Domain 3), which is valid for a warming from −2 to −0.5 ∘C. Again, the same pattern is less pronounced for a warming from −4 to −2 ∘C.
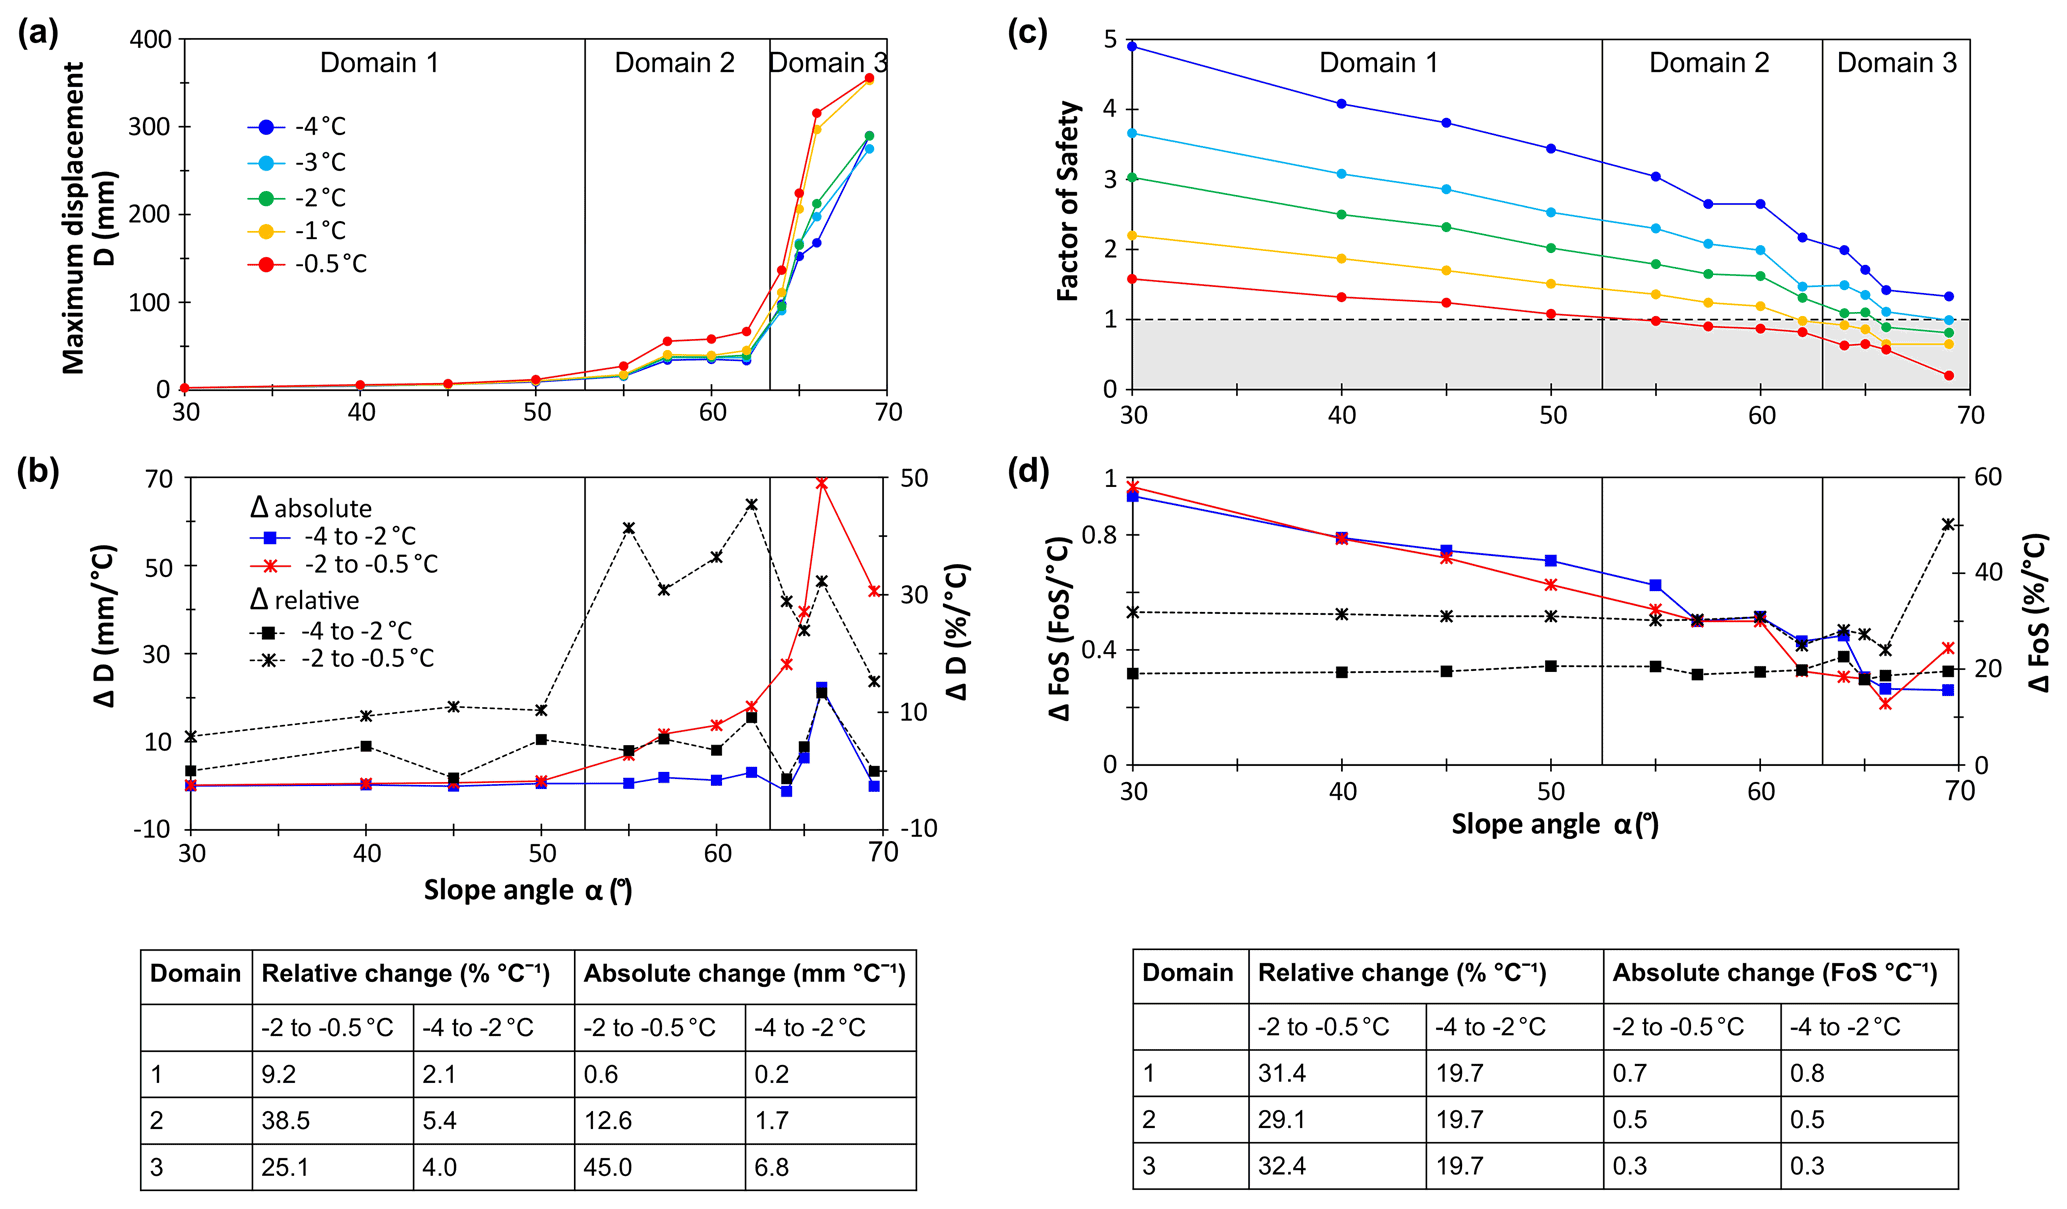
Figure 8The above figure provides critical slope angles and rock temperatures beyond which instability is introduced. (a) Calculated maximum displacements against slope angle for temperatures between −4 and −0.5 ∘C. The curves are assigned to three distinct domains depending on the slope gradient, with domain divisions above 50∘ and above 62∘ respectively, where the curves point to a sudden onset of instability. (b) Absolute and relative increase in displacements versus slope angle for a warming from −4 to −2 ∘C and from −2 to −0.5 ∘C. (c) Calculated factor of safety (FS) against slope angle for different sub-zero temperatures. (d) Absolute and relative decrease in FS versus slope angle for a warming from −4 to −2 ∘C and from −2 to −0.5 ∘C.
In contrast to the displacements, the factor of safety also depends on the slope angle and the temperature (Fig. 8c): for a rising steepness from 30 to 69∘, the calculated FS decreases inversely and is always lower for higher temperatures. Warming from −4 to −0.5 ∘C reduces the FS of a permafrost rock slope by a mean factor of 3.3. The pattern of the domains in Fig. 8a can be easily applied to the relation between FS, temperature and slope angle (Fig. 8c): the mean relative reduction of the FS per degree of the slope angle is low in Domain 1 (−1.8 % ± 0.4) and becomes higher over Domain 2 (−4.5 % ± 3.3), until it reaches a maximum in Domain 3 (−9.8 % ± 8.3). Correspondingly, rock slopes are stable for all modelled temperatures in Domain 1. When shifting to Domain 2, the FS falls below unity at −0.5 and −1 ∘C which coincides with an abrupt increase in displacements. Rock slopes at −4 ∘C remain stable over the whole range of slope gradients.
As we did for the maximum block displacements, we tested if warming closer to the melting point led to a distinct diminishing pattern of the FS (Fig. 8d): the absolute decrease is very similar for both warming steps from −4 to −2 ∘C and from −2 to −0.5 ∘C. However, the relative decrease from −4 to −2 ∘C is always lower than the one at higher temperatures.
4.2.2 Sensitivity to the fracture network orientation
Modelling resulted in 8 out of 12 orientations of the fracture network that show a significant displacement acceleration and initiating slope instability above a critical slope inclination (Fig. 9a): for anaclinal slopes, the critical angles range between 50 and 62∘, and for cataclinal slopes, they range between 55 and 62∘. Cataclinal rock slopes with a bedding dip of 84 and 69∘ do not indicate a significant knick point in the displacement curves. As such, the corresponding critical slope angles were set to the maximum of the investigated values (69∘). Fracture networks rotated counterclockwise by 30 and 75∘ from the joint set of the Zugspitze summit crest showed very noisy model data and were not used for the analysis.
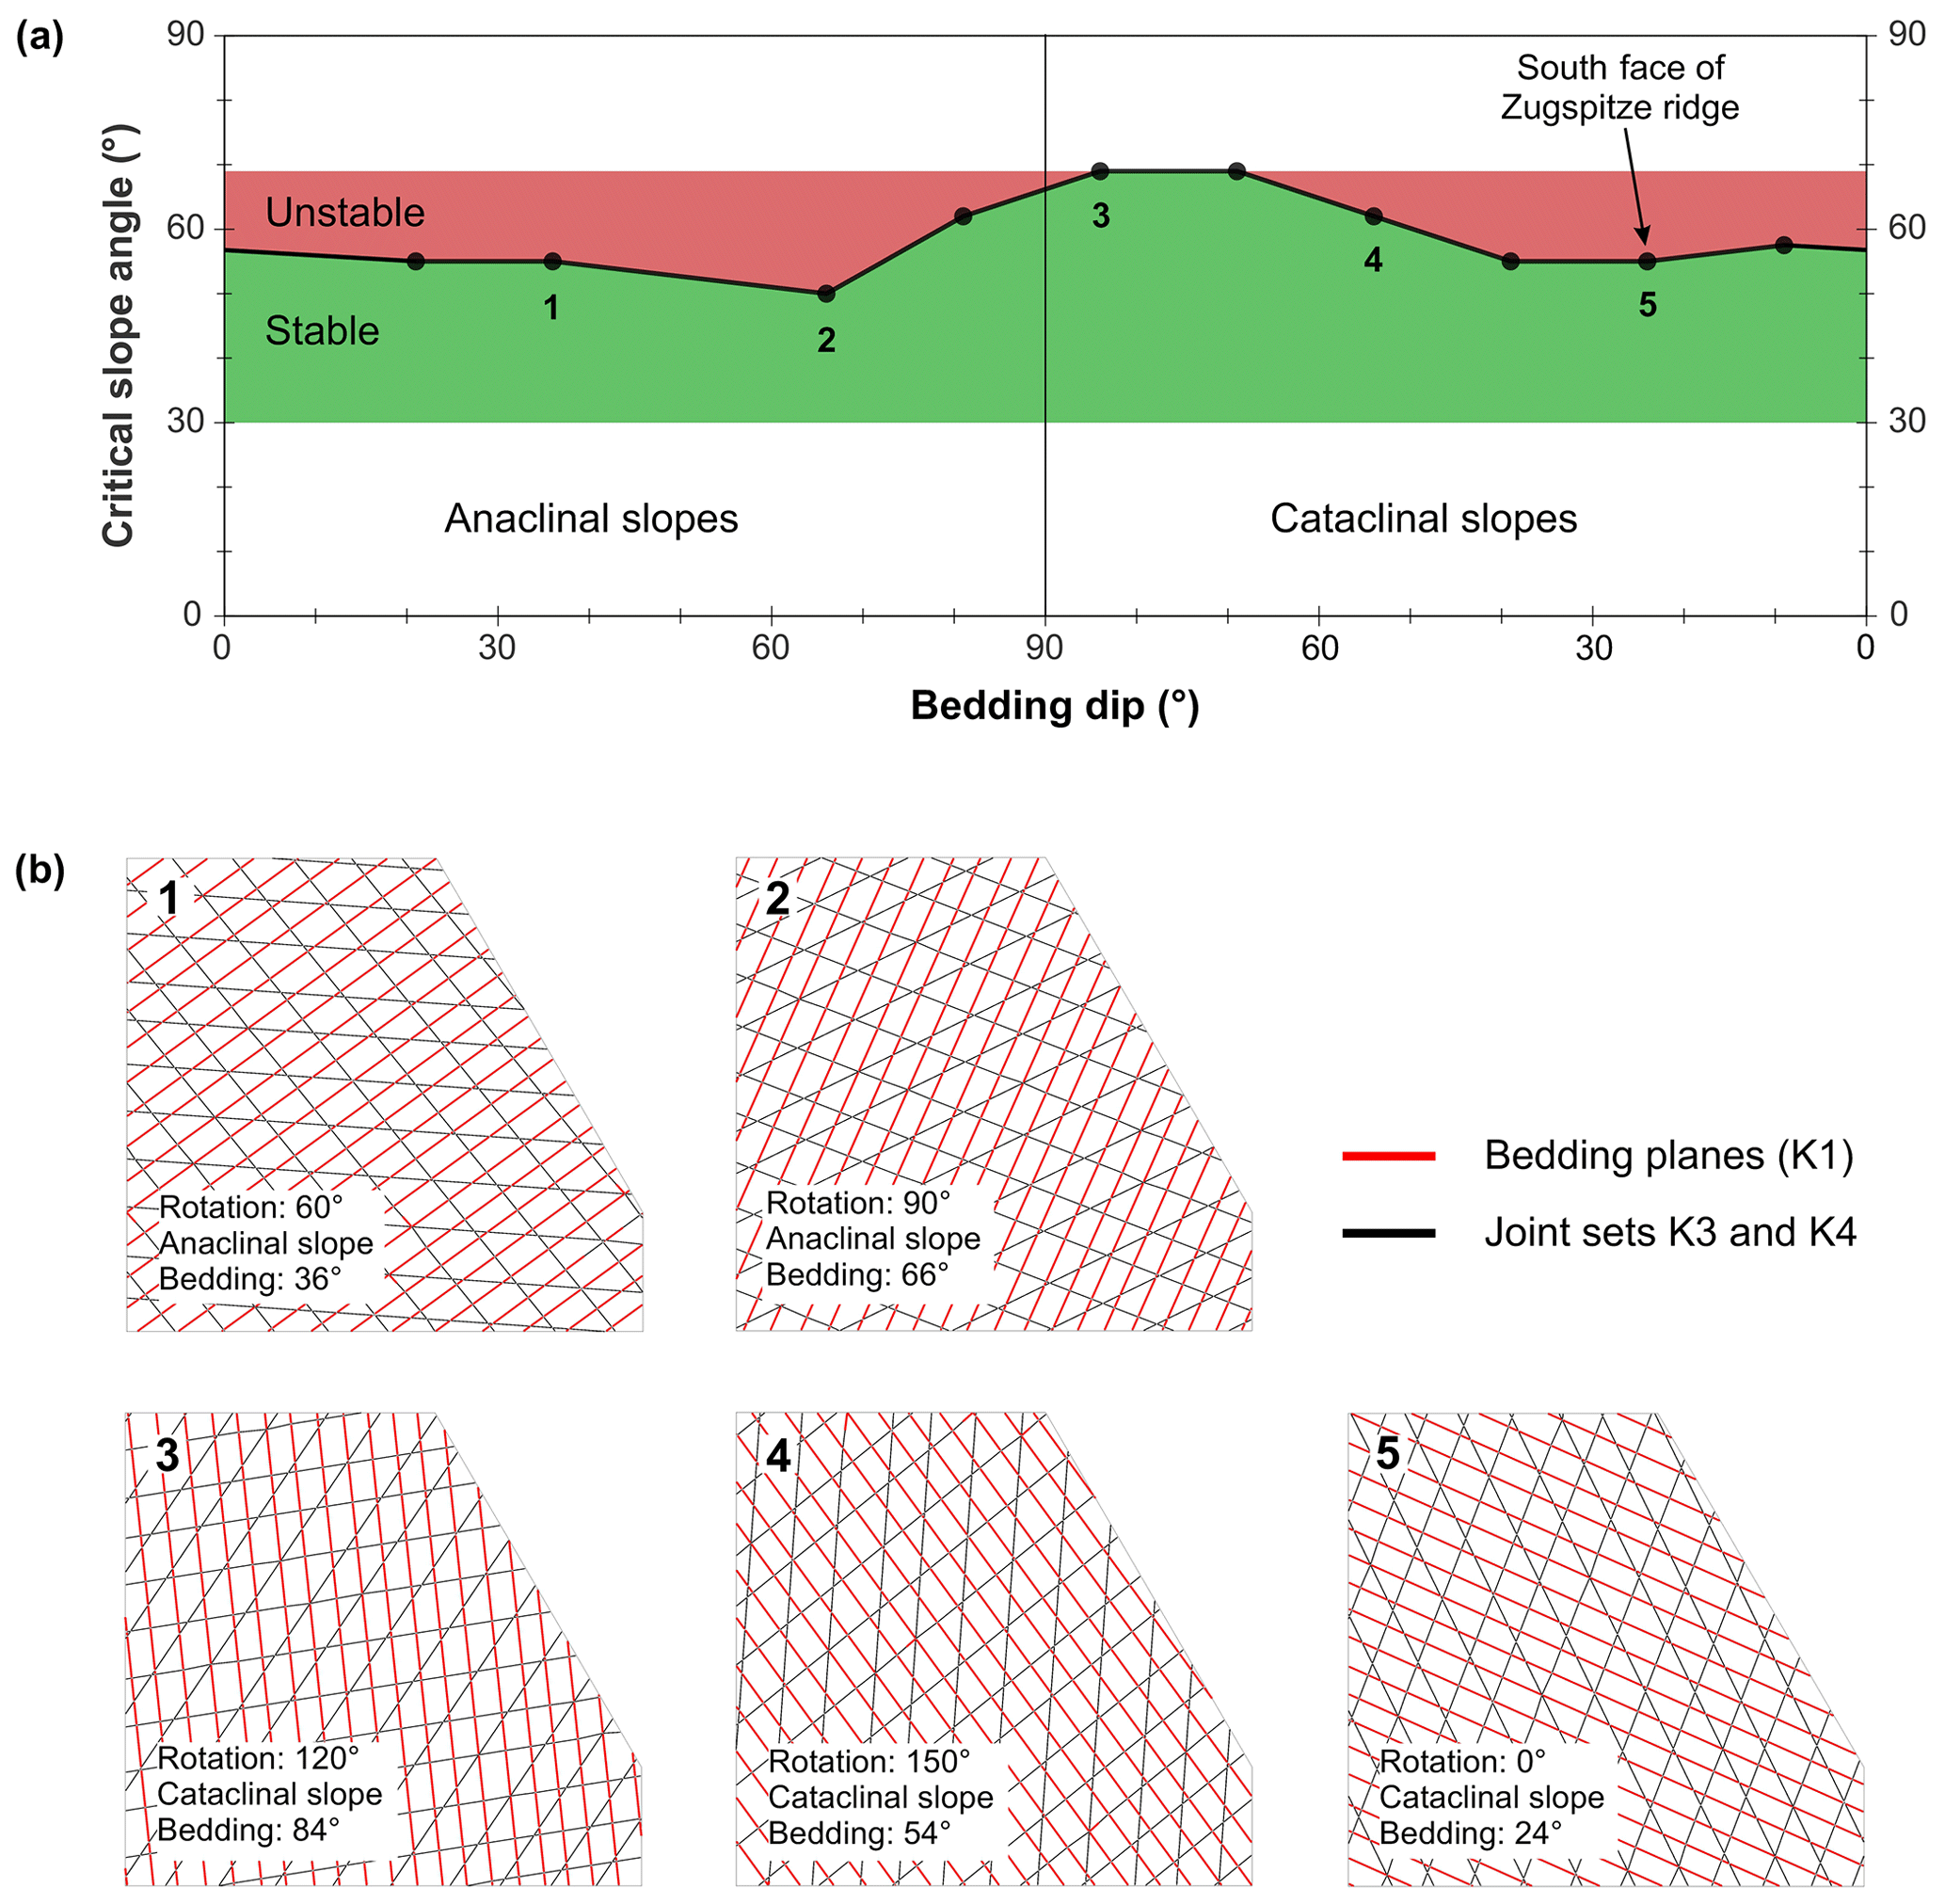
Figure 9(a) A rule of thumb for critical slope gradients and fracture network orientations of anaclinal and cataclinal permafrost rock slopes. For cataclinal slopes, both the slope face and the bedding have the same dip direction, but for anaclinal slopes, the dips of both are oriented oppositely (Cruden, 2003). The green area refers to stable rock slopes, whereas the red area refers to unstable ones. For simplification, the fracture network is represented by the bedding dip. The coloured areas indicate the studied range of slope angles. (b) Five exemplary joint set constellations for cataclinal and anaclinal slopes with an inclination of 60∘. The numbers of the rock slopes correspond to the numbers in panel (a). The joint spacing is 10 times bigger than in reality and is only applied for illustration. Example 5 refers to the Zugspitze summit crest.
This study successfully simulated the mechanical response of a warming and thawing permafrost rock slope using a temperature-dependent numerical model. The following sections show the general limitations of the presented models and critically discuss the site-specific model, the model of the generalised permafrost rock slope and its transferability to other high-mountain conditions.
5.1 Limitations
Mechanical models are sensitive to material parameters. However, the availability of these parameters and the technical opportunities to establish them are limited. Therefore, the presented mechanical model of the Zugspitze summit crest is based on a few simplifications. First, the knowledge of the subsurface structure (i.e. joint spacing and joint persistence) is limited and has to be estimated by inspection of the rock surface. Second, mechanical parameters were not determined for the specific joint sets. Only the joint normal and shear stiffness varied between the joint sets due to their different joint spacing. Third, a standardised recommendation for the disturbance factor D for an unstable rock slope (without blast damage) does not exist; such a recommendation should be validated numerically and include a classification of various degrees of instability. Therefore, D was set to 0, but the potential influence of a higher D on the slope stability was analysed by additional model runs with the geometry of the Zugspitze crest (Fig. S6); a modified D approaching 1 leads to higher displacements, but the factor of safety remains unchanged. Fourth, it is crucial to consider the temperature dependency of the material parameters, as freezing can increase rock mass strength. However, the influence of freezing effects is mostly ignored in the GSI rock mass classification system (see also Gambino and Harrison, 2017). In our model, the friction angle after Cai et al. (2004; Fig. 5) applies the temperature-independent Hoek–Brown constant mi and the GSI value, defined for the unfrozen rock mass. To our knowledge, the friction angle of a frozen rock mass and its change due to thawing have hardly been investigated and are not yet described by a general law. Model test runs with very low to unrealistically high values of the mechanical rock mass properties demonstrated that the displacements in the rock slope mostly remained within the same order of magnitude (Fig. S9). Therefore, the rock mass internal friction angle was derived by the GSI scheme, and its unfrozen value was assigned to both the frozen and the unfrozen rock mass.
Furthermore, the implementation of the numerical model implies a few limitations which are addressed with the following approaches:
-
When implementing non-persistent joints, UDEC discards those that do not split a block. An irregular joint and block pattern may be formed that does not correspond to reality. Therefore, discontinuities were constructed as fully persistent, but joint strength parameters were increased according to Jennings (1970) in order to omit the potential result of favoured higher displacements and velocities along persistent joints.
-
The size of the Zugspitze model domain was constrained to a local section of the rock slope ending in a steep part at the south face. The model domain fully incorporates the unstable rock mass under investigation, thereby perfectly accounting for the simulated spatial conditions of the mechanical processes of rock and ice. To investigate the slope angle at the domain boundary, we rerun the model with a bigger domain size ending in a flatter section of the south slope (Fig. S6): the results demonstrated that a change in the size of the model domain does not significantly change the overall stability of the slope.
-
The initial temperature of the frozen rock slope does not affect the displacement magnitudes and the general pattern of dependency between maximum displacements and slope inclination. The potential effect of a lower strength on the calculation of the initial equilibrium and on the resulting maximum displacement values was proven by reiterating the generalised model with an initial temperature at −2 ∘C and comparing it with the original −4 ∘C (Fig. S7).
-
Warming to the next degree centigrade was, by default, calculated with 3000 cycles, which was a compromise between a representative number of cycles for potentially reaching a numerical equilibrium (for stable rock slopes) and a reasonable, not overly time-consuming, calculation. Computations for low/intermediate slope angles and temperatures reached an equilibrium prior to 3000 cycles, whereas calculations for higher slope angles and temperatures mostly failed to reach an equilibrium (for unstable rock slopes) or scarcely required >3000 cycles. Hence, the numerical calculation was repeated with warming steps with 6000 cycles to test a potential cut-off effect of cycles required for the rock slope to react to a change in stress–strain due to a modification of material parameters. However, the results coincide well with the model runs with 3000 cycles, as displacements significantly accelerate above slope angles of 50 and 62∘, and they are higher for temperatures closer to melting (Fig. S8).
We are at the beginning of developing numerical models for the mechanical response of a rock mass to warming/thawing. Therefore, there is a huge potential for improvements. For instance, more mechanical laboratory tests are necessary to improve process understanding and to extend the number of frozen and unfrozen material parameters for modelling. Future numerical models should be based on further sensitivity analyses or should include water pressure or the creep of ice at lower displacement rates within the advanced stage of rock slope destabilisation. Time-dependent cycling is not yet implemented in most of the numerical models nor in the presented ones. Hence, they are not suited to forecast a precise time of rock slope failure. Further, the spatial warming pattern for the Zugspitze model is simplified and is based on a static temperature field derived from ERT, rock thermistors and published thermal models. For a more accurate characterisation of the warming pattern, future mechanical models should include a subsurface temperature field based on a combination of geophysics and a heat flow model for different time steps.
5.2 Stability assessment of the warming/thawing Zugspitze summit crest based on the factor of safety
The numerical model for the Zugspitze summit ridge simulates the strength reduction at warming and thawing based on laboratory tests of this and of previous studies (Table 1). Warming of ice-filled joints takes the slope close to a critical level of stability (FS = 1.3), but it does not initiate instability. As soon as thawing sets in and the ice is lost, the south face becomes massively destabilised as displacements increase by 2 orders of magnitude and the factor of safety falls below unity. The reduction in joint stability is significantly influenced by a loss of the joint cohesion from 0.18 MPa (at −0.5 ∘C) to 0 MPa (Table 5), even though the joint friction angle is increased from 13.5 to 29.3∘. In contrast to our numerical analysis, Davies et al. (2001) postulate that the FS of a permafrost-affected rock slope is higher for unfrozen joints than for ice-filled joints between approximately −1.5 ∘C and 0 ∘C. The differing observations on the stability upon thaw may be explained as follows: (i) our model assumes a lower joint roughness and uses the residual friction angle which is lower than the peak friction angle taken for the centrifuge model. We suppose that the simulated rock slope has already been moving for a long time and joint surfaces are flattened due to the progressive destruction of asperities along joints. In contrast, the sliding surface in the centrifuge model is not affected by any previous displacements. (ii) The calculated FS by Davies et al. (2001) corresponds to an independent moment in time, whereas the FS in the Zugspitze model is path-dependent and affected by the history of the previous numerical calculations.
The permafrost evolution model by Gallemann et al. (2017) predicts permafrost at the Zugspitze peak to be lost within the second half of the 21st century which may result in an elevated occurrence of rock slope instability. This scenario is related to a projected increase in the mean air temperature by 3.2 ∘C until the end of the century. Stages 11 to 15 of the mechanical model represent the same time period (current state until second half of the century) and simulate progressive thawing of the summit crest that leads to the continuation of increasing displacements and the preparation of final slope failure (Fig. 6).
The factors of safety for all stages with one or more thawed rock layers, including the current extent of permafrost (Stage 11, Fig. 6e), lie below unity, which indicates slope instability. This is consistent with the observations of the current displacements and characteristics of the main shear zone at the field site. However, the high values calculated by the model are not comparable with the measured displacement rates at the field site (2.1 mm yr−1) for the following reasons: (i) the numerically calculated displacements are maximum values and refer to local sections in the model. (ii) Cycling in UDEC was not linked to specific time steps. As such, we could not assign specific periods of time to the distinct, non-linear steps of warming or thawing. This did not permit us to estimate the approximate time period required for the calculated displacements to occur. (iii) Absolute displacements are path-dependent and affected by the history of calculations, including input and alteration of parameters as well as the stress–strain behaviour in the system.
Based on the 3D kinematic analysis (Sect. 2.1.1), we postulate that the most likely mechanism controlling the slope instability is a combination of a plane and a wedge failure. However, for the 2D numerical model and at the scale of the failure plane, we consider various possible complex mechanisms: (i) sliding of several rock blocks along a polygonal shear zone SZ1 and SZ4 that is constituted by joint sets K1, K3 and K4. This complex type of failure is provided by antithetic fractures which enable shear displacements between the moving blocks (Eberhardt et al., 2004; Poisel and Preh, 2004). (ii) Shear or tensile failure along joint sets K3 or K4 may favour shear displacements along K1 by supplying additional stress onto the blocks and inducing “step-path” failure (Huang et al., 2015; Mejía Camones et al., 2013). (iii) Failure at the scale of single blocks can be induced by forward block toppling with K1 and K3 or backward block toppling with K1 and K4 (Itasca Consulting Group, 2019). Both options will only work for higher columns subdivided by surfaces of K1 which stick together due to locally higher frictional or cohesive strength. (iv) The two joint sets K1 and K4 favour the displacements to concentrate on the south face. The highest deformations concentrate on the lower slope section with a mean gradient of 49∘, but they are not coupled to the prominent shear zone. This can be the result of (i) the dominating influence of the slope angle on the stability of the system and (ii) the lack of variation in the joint properties of the shear zone and the remaining joint sets (Table 5).
5.3 The stability of a simplified permafrost rock slope with rising temperature
A permafrost rock slope with ice-filled joints as well as a fracture network and rock/joint properties similar to the Zugspitze south face can become unstable at a slope gradient > 50 or 55∘ (transition from Domain 1 to Domain 2 in Fig. 8). This range of inclinations seems to be the most critical in terms of slope destabilisation, as it is characterised by the highest relative increase in displacements per degree of the slope angle. Interestingly, this could be confirmed by the study of the critical slope angle for varying orientations of the fracture network (Fig. 9): 50 % of the studied orientations have a critical slope angle of 50 or 55∘, which corresponds to the transition from Domain 1 to Domain 2; 30 % of the orientations lead to instability with angles of between 57.5 and 62∘; and 20 % remain stable within the studied range of slope gradients. The relevance of slope angles at the described transition from Domain 1 to Domain 2, identified by the numerical model, is in accordance with documented rock slope failures in the Swiss Alps, adjacent areas in France and Italy (Fischer et al., 2012), and in the Mont Blanc Massif (Ravanel et al., 2010), which are mostly attributed to the degradation of bedrock permafrost: the mean slope gradient of the detachment zones in the Mont Blanc Massif was 54∘, whereas the highest percentage of detachment zones in the Swiss Alps and adjacent areas had slope angles of between 40 and 60∘, leading to a postulated lower slope gradient threshold of between 40 and 45∘ for rock slope failures.
We further demonstrate that the factor of safety falls below 1 when a rock slope with a gradient ≥ 50∘ is warmed from −4 ∘C to a temperature of between −3 and −0.5 ∘C. This sensitive temperature range corresponds well to (i) the temperatures currently monitored in boreholes in permafrost rock walls in the European Alps (Gallemann et al., 2017; Noetzli et al., 2019) and (ii) the temperatures which are characteristic for warm permafrost areas or the lower permafrost boundary (−5 to 0 ∘C). The latter posed the release zones for most of the rock slope failure events documented by Fischer et al. (2012) and Ravanel et al. (2010).
The model results also demonstrate that the increase in displacements becomes more pronounced when approaching the melting point which indicates a non-linear relation (Fig. 8b): the relative and the absolute increase are always higher for a warming from −2 to −0.5 ∘C than for a warming from −4 to −2 ∘C. The relation between rising sub-zero temperature and reduced stability was also observed by Davies et al. (2000, 2001). However, on the basis of our model results, we propose complementing the conclusions of Davies et al. (2001) in the following way: (i) the temperature of critical stability is highly dependent on the inclination of the main fractures versus the slope angle; (ii) it is of crucial importance to consider the stress conditions in a rock slope when extrapolating the results from the laboratory scale to the field scale; and (iii) the use of rock instead of concrete samples for the laboratory determination of joint parameters results in a closer reproduction of the real conditions along rock joints in the field.
5.4 Transferability and implications for other field sites
The general procedure for a temperature-dependent mechanical stability model (Fig. 1) can be applied to any warming or thawing permafrost rock slope. However, the results of the sensitivity analysis with input data from the Zugspitze summit ridge (Sect. 4.2) are valid for rock slopes with increasing sub-zero temperatures, consisting of fractured limestone, with strength and deformability similar to the Wetterstein limestone tested in this study. A transfer to permafrost rock slopes with a different lithology is possible, but it requires more laboratory calibration tests and modelling. A provisional transfer may be possible with the following justification:
Mamot et al. (2018, 2020) studied the shear strength of ice-filled permafrost rock joints and developed a resilient temperature- and stress-dependent failure criterion which is valid for the majority of the rocks that are relevant for observed permafrost rock slope failures in the Alps. As this failure criterion was used to calculate the cohesion and the friction of the ice-filled joints in the presented model, the numerical description of them may also be applied to other lithologies. However, the joint stiffness and the mechanical parameters of the rock mass still vary among different rock types and may lead to different model results. To get a first impression of this potential effect, we performed a couple of model test runs with varying values for the mechanical properties of the rock mass ranging from very low to unrealistically high. As the displacements remained within the same order of magnitude (Fig. S9), we infer that the model results will not be significantly influenced by other rock types with distinct properties of strength and deformability. Nevertheless, we strongly recommend verifying the effect of different rock types by thorough modelling in the future.
The transferability of the numerical results is also limited to rock slopes with a similar joint set configuration as in this article because the rule of thumb for critical slope angles and fracture network orientations (Fig. 9) is valid for a specific constellation of three joint sets and not only for the bedding, as presented by Cruden (2003). Considering the constraints above, the simplified model, developed by the sensitivity analysis (Sect. 4.2), can be transferred to warming permafrost rock slopes with ice-filled discontinuities and slope gradients smaller than 70∘. In addition, these rock slopes consist of limestone (and probably mostly all rock types relevant for permafrost rock slope failures in the Alps), and they contain three joint sets separated from each other by an angle of 45∘.
This study presents the first numerical model which is capable of performing comprehensive mechanical stability analyses of degrading permafrost rock slopes. In this context, we provide (i) a universal procedure for the input of thermal and mechanical data, the model set-up and the modelling strategy; (ii) a numerical benchmark application to a specific test site at the Zugspitze peak; and (iii) the first numerically derived critical stability thresholds related to the slope angle, rock mass temperature and orientation of the fracture network. The related main findings are summarised as follows:
- i.
The proposed instruction for the temperature-dependent mechanical stability model can be used for any permafrost-affected rock slope across the globe that is subjected to climatic warming.
- ii.
Laboratory tests and field reconnaissance of the benchmark site Zugspitze exemplify thermal, geometrical and mechanical input data for the numerical model. Frozen and unfrozen bedrock material properties were assigned to specific sections in the model and changed due to warming/thawing. The modelling procedure was divided into three stages: rock bridge destruction, warming with ice-filled joints and thawing. Process-specific and temperature-dependent input parameters were modified when switching from one stage to the next.
- iii.
The Zugspitze model demonstrates a stability decrease towards a critical level as a result of (a) rock bridge destruction and (b) gradual warming of frozen rock and ice-filled joints from −4 to −0.5 ∘C. Surficial rock slope failure starts coincident to thawing of the outermost rock layer. Upon full thaw of the summit crest, expected within the next 5 decades, the model predicts an increase in displacements which potentially lead to final slope failure.
- iv.
We developed a framework to generalise and upscale the Zugspitze model. A sensitivity analysis with simplified geometry and warming pattern was performed to calculate three critical stability thresholds. The first of these was the dependence between instability and the slope angle which can be classified into a stable first domain (≤50∘), a second domain with a first onset of instability (55–62∘) and a third domain characterised by an accelerated slope destabilisation (≥64∘). The greatest relative increase in displacements is observed in the second domain. The second was the warming from −4 ∘C to a temperature between −3 and −0.5 ∘C which initiates instability for rock slopes ≥50∘. Destabilisation is more pronounced for warming closer to the melting point (from −2 to −0.5 ∘C) than for warming from −4 to −2 ∘C. This difference becomes greatest in the second domain. Finally, for anaclinal slopes, the critical slope angles range between 50 and 62∘, and for cataclinal slopes, they range between 55 and 62∘.
- v.
The calculated critical slope angles and rock mass temperatures correspond well to the characteristics of documented rock slope failures in permafrost areas in the European Alps, which often showed large amounts of residual ice in their scars.
- vi.
The critical thresholds can be applied to warming permafrost rock slopes with (a) ice-filled joints; (b) limestone equivalent to Wetterstein limestone, or probably most of the rock types relevant for permafrost rock slope failure in the Alps; (c) slope angles smaller than 70∘; and (d) various orientations of the fracture network consisting of three joint sets.
- vii.
The critical thresholds can be used to detect rock slopes which are susceptible to fail in the future and potentially endanger human life and mountain infrastructure. For this, it is a prerequisite to have data on the fracture network, lithology, geometry and the thermal field of the investigated rock slopes. In contrast, a detailed stability assessment of a single rock slope requires a number of further site-specific input data.
All obtained data from the model, laboratory tests, and geotechnical and geophysical surveys in the field as well as the numerical code are accessible via the zipped folder enclosed in the Supplement.
The supplement related to this article is available online at: https://doi.org/10.5194/esurf-9-1125-2021-supplement.
PM, SW and MK developed the general modelling approach. PM performed the geotechnical and geophysical surveys at the study site and analysed the related data. The set-up and the procedure of the laboratory experiments was designed by PM and MK. The rock samples were prepared by SE, who also executed the laboratory tests and analysed the data with support from PM. PM developed the numerical discontinuum code with the Universal Distinct Element Code and performed modelling. The modelling strategy was designed by PM, MK and SW. Analysis of the model results was done by PM and SW. The paper was prepared by PM, with a substantial contribution from SW and MK.
The authors declare that they have no conflict of interest.
Publisher's note: Copernicus Publications remains neutral with regard to jurisdictional claims in published maps and institutional affiliations.
The work for this article was funded by the Technical University of Munich. The authors wish to thank the colleagues of the Chairs of Landslide Research and Engineering Geology of the Technical University of Munich as well as all of the motivated students, who either supported the realisation of the laboratory campaigns or helped to perform the field surveys at the Zugspitze. The authors are particularly grateful for the valuable contributions from their colleagues Benjamin Jacobs, Andreas Dietrich, Riccardo Scandroglio, Bettina and Florian Menschik, who helped to collect and to analyse the data. Finally, the Fritz and Lotte Schmidtler Foundation is acknowledged for financing the TUFF fellowship that was held by Samuel Weber.
This paper was edited by Andreas Lang and reviewed by two anonymous referees.
Arenson, L. U. and Springman, S. M.: Triaxial constant stress and constant strain rate tests on ice-rich permafrost samples, Can. Geotech. J., 42, 412–430, https://doi.org/10.1139/t04-111, 2005.
Aydin, A. and Basu, A.: The Schmidt hammer in rock material characterization, Eng. Geol., 81, 1–14, 2005.
Bandis, S. C., Lumsden, A. C., and Barton, N. R.: Fundamentals of rock joint deformation, Int. J. Rock Mech. Min., 20, 249–268, 1983.
Barnes, P., Tabor, D., and Walker, J. C. F.: The friction and creep of polycrystalline ice, P. Roy. Soc. Lond. A, 324, 127–155, 1971.
Barton, N. R.: A model study of rock-joint deformation, Int. J. Rock Mech. Min., 9, 579–582, https://doi.org/10.1016/0148-9062(72)90010-1, 1972.
Barton, N. R.: Shear strength criteria for rock, rock joints, rockfill and rock masses: Problems and some solutions, J. Rock Mech. Geotech. Eng., 5, 249–261, https://doi.org/10.1016/j.jrmge.2013.05.008, 2013.
Barton, N. R. and Choubey, V.: The shear strength of rock joints in theory and practice, Rock Mech., 10, 1–54, 1977.
Bavarian Agency for Digitisation, High-Speed Internet and Surveying: Digital elevation model of the Zugspitze summit area, Bavarian Agency for Digitisation, High-Speed Internet and Surveying, Munich, 2006.
Bhasin, R. and Kaynia, A. M.: Static and dynamic simulation of a 700-m high rock slope in western Norway, Eng. Geol., 71, 213–226, https://doi.org/10.1016/S0013-7952(03)00135-2, 2004.
Biskaborn, B. K., Smith, S. L., Noetzli, J., Matthes, H., Vieira, G., Streletskiy, D. A., Schoeneich, P., Romanovsky, V. E., Lewkowicz, A. G., Abramov, A., Allard, M., Boike, J., Cable, W. L., Christiansen, H. H., Delaloye, R., Diekmann, B., Drozdov, D., Etzelmüller, B., Grosse, G., Guglielmin, M., Ingeman-Nielsen, T., Isaksen, K., Ishikawa, M., Johansson, M., Johannsson, H., Joo, A., Kaverin, D., Kholodov, A., Konstantinov, P., Kröger, T., Lambiel, C., Lanckman, J.-P., Luo, D., Malkova, G., Meiklejohn, I., Moskalenko, N., Oliva, M., Phillips, M., Ramos, M., Sannel, A. Britta K., Sergeev, D., Seybold, C., Skryabin, P., Vasiliev, A., Wu, Q., Yoshikawa, K., Zheleznyak, M., and Lantuit, H.: Permafrost is warming at a global scale, Nat. Commun., 10, 264, https://doi.org/10.1038/s41467-018-08240-4, 2019.
Böckli, L., Nötzli, J., and Gruber, S.: PermaNET-BY: Untersuchung des Permafrosts in den Bayerischen Alpen, Teilprojekt PermaNET (EU Alpine Space Interreg IVb), Glaciology, Geomorphodynamics & Geochronology, Department of Geography, University of Zurich, Zürich, 60 pp., 2011.
Bray, M. T.: Secondary creep approximations of ice-rich soils and ice using transient relaxation tests, Cold. Reg. Sci. Technol., 88, 17–36, https://doi.org/10.1016/j.coldregions.2012.12.011, 2013.
Butkovitch, T. R.: The ultimate strength of ice, Report on the Snow, Ice and Permafrost Research Establishment Project, Res. paper 15, Corps of Engineers, U. S. Army, Wilmette, Illinois, 1954.
Cai, M., Kaiser, P. K., Uno, H., Tasaka, Y., and Minami, M.: Estimation of rock mass deformation modulus and strength of jointed hard rock masses using the GSI system, Int. J. Rock Mech. Min., 41, 3–19, https://doi.org/10.1016/S1365-1609(03)00025-X, 2004.
Chang, S.-H., Lee, C.-I., and Jeon, S.: Measurement of rock fracture toughness under modes I and II and mixed-mode conditions by using disc-type specimens, Eng. Geol., 66, 79–97, https://doi.org/10.1016/S0013-7952(02)00033-9, 2002.
Cruden, D. M.: The shapes of cold, high mountains in sedimentary rocks, Geomorphology, 55, 249–261, https://doi.org/10.1016/S0169-555X(03)00143-0, 2003.
Davies, M. C. R., Hamza, O., Lumsden, B. W., and Harris, C.: Laboratory measurement of the shear strength of ice-filled rock joints, Ann. Glaciol., 31, 463–467, https://doi.org/10.3189/172756400781819897, 2000.
Davies, M. C. R., Hamza, O., and Harris, C.: The effect of rise in mean annual temperature on the stability of rock slopes containing ice-filled discontinuities, Permafrost Periglac., 12, 137–144, https://doi.org/10.1002/ppp.378, 2001.
Deline, P., Gruber, S., Delaloye, R., Fischer, L., Geertsema, M., Giardino, M., Hasler, A., Kirkbride, M., Krautblatter, M., Magnin, F., McColl, S., Ravanel, L., and Schoeneich, P.: Ice Loss and Slope Stability in High-Mountain Regions, in: Snow and Ice-Related Hazards, Risks and Disasters, Academic Press, Boston, 521–561, 2015.
Draebing, D. and Krautblatter, M.: P-wave velocity changes in freezing hard low-porosity rocks: a laboratory-based time-average model, The Cryosphere, 6, 1163–1174, https://doi.org/10.5194/tc-6-1163-2012, 2012.
Dramis, F., Govi, M., Guglielmin, M., and Mortara, G.: Mountain permafrost and slope instability in the Italian Alps. The Val Pola Landslide, Permafrost Periglac., 6, 73–81, https://doi.org/10.1002/ppp.3430060108, 1995.
Dwivedi, R. D., Soni, A. K., Goel, R. K., and Dube, A. K.: Fracture toughness of rocks under sub-zero temperature conditions, Int. J. Rock Mech. Min., 37, 1267–1275, 2000.
Eberhardt, E., Stead, D., and Coggan, J. S.: Numerical analysis of initiation and progressive failure in natural rock slopes – the 1991 Randa rockslide, Int. J. Rock Mech. Min., 41, 69–87, https://doi.org/10.1016/S1365-1609(03)00076-5, 2004.
Etzelmüller, B.: Recent Advances in Mountain Permafrost Research, Permafrost Periglac., 24, 99–107, https://doi.org/10.1002/ppp.1772, 2013.
Fischer, L., Kääb, A., Huggel, C., and Noetzli, J.: Geology, glacier retreat and permafrost degradation as controlling factors of slope instabilities in a high-mountain rock wall: the Monte Rosa east face, Nat. Hazards Earth Syst. Sci., 6, 761–772, https://doi.org/10.5194/nhess-6-761-2006, 2006.
Fischer, L., Amann, F., Moore, J. R., and Huggel, C.: Assessment of periglacial slope stability for the 1988 Tschierva rock avalanche (Piz Morteratsch, Switzerland), Eng. Geol., 116, 32–43, https://doi.org/10.1016/j.enggeo.2010.07.005, 2010.
Fischer, L., Purves, R. S., Huggel, C., Noetzli, J., and Haeberli, W.: On the influence of topographic, geological and cryospheric factors on rock avalanches and rockfalls in high-mountain areas, Nat. Hazards Earth Syst. Sci., 12, 241–254, https://doi.org/10.5194/nhess-12-241-2012, 2012.
Gallemann, T., Haas, U., Teipel, U., von Poschinger, A., Wagner, B., Mahr, M., and Bäse, F.: Permafrost-Messstation am Zugspitzgipfel: Ergebnisse und Modellberechnungen, Geolog. Bavar., 115, 1–77, 2017.
Gambino, G. F. and Harrison, J. P.: Rock Engineering Design in Frozen and Thawing Rock. Current Approaches and Future Directions, Proced. Eng., 191, 656–665, https://doi.org/10.1016/j.proeng.2017.05.229, 2017.
Gischig, V., Amann, F., Moore, J. R., Loew, S., Eisenbeiss, H., and Stempfhuber, W.: Composite rock slope kinematics at the current Randa instability, Switzerland, based on remote sensing and numerical modeling, Eng. Geol., 118, 37–53, https://doi.org/10.1016/j.enggeo.2010.11.006, 2011a.
Gischig, V. S., Moore, J. R., Evans, K. F., Amann, F., and Loew, S.: Thermomechanical forcing of deep rock slope deformation. 1. Conceptual study of a simplified slope, J. Geophys. Res.-Earth, 116, F04010, https://doi.org/10.1029/2011JF002006, 2011b.
Gischig, V. S., Moore, J. R., Keith, F. E., Amann, F., and Loew, S.: Thermomechanical forcing of deep rock slope deformation: 2. The Randa rock slope instability, J. Geophys. Res., 116, F04011, https://doi.org/10.1029/2011JF002007, 2011c.
Glamheden, R.: Thermo-mechanical behaviour of refrigerated caverns in hard rock, Chalmers University of Technology, Göteborg, 2001.
Glamheden, R. and Lindblom, U.: Thermal and mechanical behaviour or refrigerated caverns in hard rock, Tunn. Undergr. Sp. Tech., 17, 341–353, 2002.
Gobiet, A., Kotlarski, S., Beniston, M., Heinrich, G., Rajczak, J., and Stoffel, M.: 21st century climate change in the European Alps – A review, Sci. Total Environ., 493, 1138–1151, https://doi.org/10.1016/j.scitotenv.2013.07.050, 2014.
Gruber, S. and Haeberli, W.: Permafrost in steep bedrock slopes and its temperature-related destabilization following climate change, J. Geophys. Res., 112, 1–10, https://doi.org/10.1029/2006JF000547, 2007.
Gruber, S., Hoelzle, M., and Haeberli, W.: Permafrost thaw and destabilization of Alpine rock walls in the hot summer of 2003, Geophys. Res. Lett., 31, L13504, https://doi.org/10.1029/2004GL020051, 2004.
Günzel, F. K.: Shear strength of ice-filled rock joints, in: 9th International Conference on Permafrost, 28 June–3 July 2008, Fairbanks, Alaska, 2008.
Haberkorn, A., Wever, N., Hoelzle, M., Phillips, M., Kenner, R., Bavay, M., and Lehning, M.: Distributed snow and rock temperature modelling in steep rock walls using Alpine3D, The Cryosphere, 11, 585–607, https://doi.org/10.5194/tc-11-585-2017, 2017.
Harris, C., Arenson, L. U., Christiansen, H. H., Etzelmüller, B., Frauenfelder, R., Gruber, S., Haeberli, W., Hauck, C., Hölzle, M., Humlum, O., Isaksen, K., Kääb, A., Kern-Lütschg, M. A., Lehning, M., Matsuoka, N., Murton, J. B., Nötzli, J., Phillips, M., Ross, N., Seppälä, M., Springman, S. M., and Mühll, D. Vonder: Permafrost and climate in Europe. Monitoring and modelling thermal, geomorphological and geotechnical responses, Earth-Sci. Rev., 92, 117–171, https://doi.org/10.1016/j.earscirev.2008.12.002, 2009.
Hauck, C. and Kneisel, C. (Eds.): Applied Geophysics in Periglacial Environments, Cambridge University Press, Cambridge, 2008.
Hipp, T., Etzelmüller, B., Farbrot, H., Schuler, T. V., and Westermann, S.: Modelling borehole temperatures in Southern Norway – insights into permafrost dynamics during the 20th and 21st century, The Cryosphere, 6, 553–571, https://doi.org/10.5194/tc-6-553-2012, 2012.
Hoek, E. and Brown, E. T.: Practical estimates of rock mass strength, Int. J. Rock Mech. Min., 34, 1165–1186, https://doi.org/10.1016/S1365-1609(97)80069-X, 1997.
Hoek, E., Carranza-Torres, C., and Corkum, B.: Hoek-Brown failure criterion – 2002 Edition, Proceedings of the 5th North American Rock Mechanics Symposium (NARMS), edited by: Hammah, R., Bawden, W., Curran, J., and Telesnicki, M., University of Toronto Press, Toronto, Ont., Canada, 1, 267–273, 2002.
Huang, D., Cen, D., Ma, G., and Huang, R.: Step-path failure of rock slopes with intermittent joints, Landslides, 12, 911–926, https://doi.org/10.1007/s10346-014-0517-6, 2015.
Huggel, C., Zgraggen-Oswald, S., Haeberli, W., Kääb, A., Polkvoj, A., Galushkin, I., and Evans, S. G.: The 2002 rock/ice avalanche at Kolka/Karmadon, Russian Caucasus: assessment of extraordinary avalanche formation and mobility, and application of QuickBird satellite imagery, Nat. Hazards Earth Syst. Sci., 5, 173–187, https://doi.org/10.5194/nhess-5-173-2005, 2005.
Huggel, C., Salzmann, N., Allen, S., Caplan-Auerbach, J., Fischer, L., Haeberli, W., Larsen, C., Schneider, D., and Wessels, R.: Recent and future warm extreme events and high-mountain slope stability, Philos. T. Roy. Soc. A, 368, 2435–2459, https://doi.org/10.1098/rsta.2010.0078, 2010.
Huggel, C., Allen, S., Deline, P., Fischer, L., Noetzli, J., and Ravanel, L.: Ice thawing, mountains falling – are alpine rock slope failures increasing?, Geol. Today, 28, 98–104, https://doi.org/10.1111/j.1365-2451.2012.00836.x, 2012.
Inada, Y. and Yokota, K.: Some studies of low temperature rock strength, Int. J. Rock Mech. Min., 21, 145–153, https://doi.org/10.1016/0148-9062(84)91532-8, 1984.
Itasca Consulting Group: UDEC – Universal Distinct Element Code, User's Manual, Minneapolis, 2019.
Jaeger, J. C., Cook, N. G., and Zimmerman, R. W.: Fundamentals of rock mechanics, 4th edn., Blackwell Publishing Ltd, Malden, USA, Oxford, UK, Carlton, Australia, 2007.
Jellinek, H. H. G.: Adhesive properties of ice, J. Coll. Sci., 14, 268–280, 1959.
Jennings, J.: A mathematical theory for the calculation of the stability of open cast mines, Symposium on the theoretical background to the planning of open pit mines, Johannesburg, Republic of South Africa, 1970.
Keuschnig, M., Krautblatter, M., Hartmeyer, I., Fuss, C., and Schrott, L.: Automated Electrical Resistivity Tomography Testing for Early Warning in Unstable Permafrost Rock Walls Around Alpine Infrastructure, Permafrost Periglac., 28, 158–171, https://doi.org/10.1002/ppp.1916, 2017.
Kodama, J., Goto, T., Fujii, Y., and Hagan P.: The effects of water content, temperature and loading rate on strength and failure process of frozen rocks, Int. J. Rock Mech. Min., 62, 1–13, 2013.
Körner, H. and Ulrich, R.: Geologische und felsmechanische Untersuchungen für die Gipfelstation der Seilbahn Eibsee-Zugspitze, Geol. Bavar., 55, 404–421, 1965.
Krautblatter, M., Verleysdonk, S., Flores-Orozco, A. and Kemna, A.: Temperature-calibrated imaging of seasonal changes in permafrost rock walls by quantitative electrical resistivity tomography (Zugspitze, German/Austrian Alps), J. Geophys. Res.-Earth, 115, 1–15, 2010.
Krautblatter, M., Huggel, C., Deline, P., and Hasler, A.: Research Perspectives on Unstable High-alpine Bedrock Permafrost. Measurement, Modelling and Process Understanding, Permafrost Periglac., 23, 80–88, https://doi.org/10.1002/ppp.740, 2012.
Krautblatter, M., Funk, D., and Günzel, F. K.: Why permafrost rocks become unstable: a rock-ice-mechanical model in time and space, Earth Surf. Proc. Land., 38, 876–887, 2013.
Kulatilake, P. H. S. W., Ucpirti, H., Wang, S., Radberg, G., and Stephansson, O.: Use of the distinct element method to perform stress analysis in rock with non-persistent joints and to study the effect of joint geometry parameters on the strength and deformability of rock masses, Rock Mech. Rock Eng., 25, 253–274, https://doi.org/10.1007/BF01041807, 1992.
Kveldsvik, V., Einstein, H. H., Nilsen, B., and Blikra, L. H.: Numerical Analysis of the 650,000 m2 Åknes Rock Slope based on Measured Displacements and Geotechnical Data, Rock Mech. Rock Eng., 42, 689–728, https://doi.org/10.1007/s00603-008-0005-1, 2008.
Magnin, F., Krautblatter, M., Deline, P., Ravanel, L., Malet, E., and Bevington, A.: Determination of warm, sensitive permafrost areas in near-vertical rockwalls and evaluation of distributed models by electrical resistivity tomography, J. Geophys. Res.-Earth, 120, 745–762, https://doi.org/10.1002/2014JF003351, 2015.
Mamot, P., Weber, S., Schröder, T., and Krautblatter, M.: A temperature- and stress-controlled failure criterion for ice-filled permafrost rock joints, The Cryosphere, 12, 3333—3353, https://doi.org/10.5194/tc-12-3333-2018, 2018.
Mamot, P., Weber, S., Lanz, M., and Krautblatter, M.: Brief communication: The influence of mica-rich rocks on the shear strength of ice-filled discontinuities, The Cryosphere, 14, 1849–1855, https://doi.org/10.5194/tc-14-1849-2020, 2020.
Marinos, P. and Hoek, E.: Gsi: A Geologically Friendly Tool for Rock Mass Strength Estimation, in: ISRM International Symposium, Int. Soc. Rock Mech. Rock Eng., Melbourne, Australia, 2000.
Marmy, A., Rajczak, J., Delaloye, R., Hilbich, C., Hoelzle, M., Kotlarski, S., Lambiel, C., Noetzli, J., Phillips, M., Salzmann, N., Staub, B., and Hauck, C.: Semi-automated calibration method for modelling of mountain permafrost evolution in Switzerland, The Cryosphere, 10, 2693–2719, https://doi.org/10.5194/tc-10-2693-2016, 2016.
Mejía Camones, L. A., Vargas, E. D. A., de Figueiredo, R. P., and Velloso, R. Q.: Application of the discrete element method for modeling of rock crack propagation and coalescence in the step-path failure mechanism, Eng. Geol., 153, 80–94, https://doi.org/10.1016/j.enggeo.2012.11.013, 2013.
Mellor, M.: Mechanical properties of rocks at low temperatures, in: 2nd International Conference on Permafrost, 13–28 July 1973, Yakutsk, Siberia, 1973.
Mergili, M., Jaboyedoff, M., Pullarello, J., and Pudasaini, S. P.: Back calculation of the 2017 Piz Cengalo–Bondo landslide cascade with r.avaflow: what we can do and what we can learn, Nat. Hazards Earth Syst. Sci., 20, 505–520, https://doi.org/10.5194/nhess-20-505-2020, 2020.
Miller, H.: Der Bau des westlichen Wettersteingebirges, Z. Deutsch. Geolog. Gesell., 113, 409–425, 1962.
Moore, J. R., Gischig, V., Katterbach, M., and Loew, S.: Air circulation in deep fractures and the temperature field of an alpine rock slope, Earth Surf. Proc. Land., 36, 1985–1996, https://doi.org/10.1002/esp.2217, 2011.
Murton, J., Kuras, O., Krautblatter, M., Cane, T., Tschofen, D., Uhlemann, S., Schober, S., and Watson, P.: Monitoring rock freezing and thawing by novel geoelectrical and acoustic techniques, J. Geophys. Res.-Eart, 121, 2309–2332, https://doi.org/10.1002/2016JF003948, 2016.
Myhra, K. S., Westermann, S., and Etzelmüller, B.: Modelled Distribution and Temporal Evolution of Permafrost in Steep Rock Walls Along a Latitudinal Transect in Norway by CryoGrid 2D, Permafrost Periglac., 28, 172–182, https://doi.org/10.1002/ppp.1884, 2017.
Nötzli, J.: Modeling transient three-dimensional temperature fields in mountain permafrost, Dissertation, University of Zurich, Zurich, 2008.
Nötzli, J. and Gruber, S.: Transient thermal effects in Alpine permafrost, The Cryosphere, 3, 85–99, https://doi.org/10.5194/tc-3-85-2009, 2009.
Nötzli, J., Gruber, S., Kohl, T., Salzmann, N., and Haeberli, W.: Three-dimensional distribution and evolution of permafrost temperatures in idealized high-mountain topography, J. Geophys. Res.-Earth, 112, F02S13, https://doi.org/10.1029/2006JF000545, 2007.
Nötzli, J., Gruber, S., and von Poschinger, A.: Modellierung und Messung von Permafrosttemperaturen im Gipfelgrat der Zugspitze, Deutschland, Geogr. Helv., 65, 113–123, https://doi.org/10.5194/gh-65-113-2010, 2010.
Nötzli, J., Pellet, C., and Staub, B. (Eds.): PERMOS 2019, Permafrost in Switzerland 2014/2015 to 2017/2018, Glaciological Report (Permafrost) No. 16–19, Cryospheric Commission of the Swiss Academy of Sciences, 104 pp., https://doi.org/10.13093/permos-rep-2019-16-19, 2019.
Phillips, M., Wolter, A., Lüthi, R., Amann, F., Kenner, R., and Bühler, Y.: Rock slope failure in a recently deglaciated permafrost rock wall at Piz Kesch (Eastern Swiss Alps), February 2014, Earth Surf. Proc. Land., 42, 426–438, https://doi.org/10.1002/esp.3992, 2017.
Plaesken, R., Keuschnig, M., and Krautblatter, M.: Permafrost rocks and high-alpine infrastructure. Interrelated, interconnected, interacting, Geomech. Tunnel., 13, 628–633, https://doi.org/10.1002/geot.202000028, 2020.
Poisel, R. and Preh, A.: Rock slope initial failure mechanisms and their mechanical models, Felsbau, 22, 40–45, 2004.
Ravanel, L. and Deline, P.: La face ouest des Drus (massif du Mont-Blanc): évolution de l'instabilité d'une paroi rocheuse dans la haute montagne alpine depuis la fin du petit age glaciaire, Géomorphologie, 4, 261–272, 2008.
Ravanel, L. and Deline, P.: Climate influence on rockfalls in high-Alpine steep rockwalls. The north side of the Aiguilles de Chamonix (Mont Blanc massif) since the end of the `Little Ice Age', Holocene, 21, 357–365, https://doi.org/10.1177/0959683610374887, 2011.
Ravanel, L. and Deline, P.: Rockfall Hazard in the Mont Blanc Massif Increased by the Current Atmospheric Warming, in: Engineering Geology for Society and Territory – Volume 1: Climate Change and Engineering Geology, Springer International Publishing, Cham, 425–428, 2015.
Ravanel, L., Allignol, F., Deline, P., Gruber, S., and Ravello, M.: Rock falls in the Mont Blanc Massif in 2007 and 2008, Landslides, 7, 493–501, 2010.
Rentsch, W. and Krompholz, G.: Zur Bestimmung elastischer Konstanten durch Schallgeschwindigkeitsmessungen, Bergakademie – Zeitschrift für Bergbau, Hüttenwesen und verwandte Wissenschaften, 13, 492–504, 1961.
Sanderson, T. J. O.: Ice Mechanics. Risks to offshore structures, Graham & Trotman, London, 1988.
Sass, O.: Rock moisture measurements. Techniques, results, and implications for weathering, Earth Surf. Proc. Land., 30, 3, 359–374, https://doi.org/10.1002/esp.1214, 2005.
Scandroglio, R., Draebing, D., Offer, M., and Krautblatter, M.: 4D quantification of alpine permafrost degradation in steep rock walls using a laboratory-calibrated electrical resistivity tomography approach, Near Surf. Geophys., 19, 241–260, https://doi.org/10.1002/nsg.12149, 2021.
Schulson, E. M. and Duval, P.: Creep and Fracture of Ice, Cambridge University Press, Cambridge, 2009.
Stead, D., Eberhardt, E., and Coggan, J. S.: Developments in the characterization of complex rock slope deformation and failure using numerical modelling techniques, Eng. Geol., 83, 217–235, https://doi.org/10.1016/j.enggeo.2005.06.033, 2006.
Supper, R., Ottowitz, D., Jochum, B., Römer, A., Pfeiler, S., Kauer, S., Keuschnig, M., and Ita, A.: Geoelectrical monitoring of frozen ground and permafrost in alpine areas. Field studies and considerations towards an improved measuring technology, Near Surf. Geophys., 12, 93–115, https://doi.org/10.3997/1873-0604.2013057, 2014.
Tipler, P. A. and Mosca, G.: Physik für Wissenschaftler und Ingenieure, in: Springer Spektrum, 7th Edn., Springer, Berlin, 2015.
Ulrich, R. and King, L.: Influence of mountain permafrost on construction in the Zugspitze mountains, Bavarian Alps, Germany, 6th International Conference on Permafrost, 5–9 July 1993, Beijing, China, Chinese Soc. Glaciol. and Geocryol., 1993.
Ulusay, R.: The ISRM Suggested Methods for Rock Characterization, Testing and Monitoring: 2007–2014, Springer International Publishing, Cham, Heidelberg, New York, Dordrecht, London, 2015.
Ulusay, R. and Karakul, H.: Assessment of basic friction angles of various rock types from Turkey under dry, wet and submerged conditions and some considerations on tilt testing, Bull. Int. Assoc. Eng. Geol., 75, 1683–1699, https://doi.org/10.1007/s10064-015-0828-4, 2016.
Voigtländer, A., Scandroglio, R., and Krautblatter, M.: Entwicklung geotechnischer Felsparameter des Kitzsteinhorner Kalkglimmerschiefers, Abschlussbericht zum Forschungs- und Entwicklungsvertrag der TU München und AlpS-GmbH, Munich, 2014.
Walter, F., Amann, F., Kos, A., Kenner, R., Phillips, M., de Preux, A., Huss, M., Tognacca, C., Clinton, J., Diehl, T., and Bonanomi, Y.: Direct observations of a three million cubic meter rock-slope collapse with almost immediate initiation of ensuing debris flows, Geomorphology, 351, 106933, https://doi.org/10.1016/j.geomorph.2019.106933, 2020.
Weber, S., Beutel, J., Da Forno, R., Geiger, A., Gruber, S., Gsell, T., Hasler, A., Keller, M., Lim, R., Limpach, P., Meyer, M., Talzi, I., Thiele, L., Tschudin, C., Vieli, A., Vonder Mühll, D., and Yücel, M.: A decade of detailed observations (2008–2018) in steep bedrock permafrost at the Matterhorn Hörnligrat (Zermatt, CH), Earth Syst. Sci. Data, 11, 1203–1237, https://doi.org/10.5194/essd-11-1203-2019, 2019.
Welkner, D., Eberhardt, E., and Hermanns, R. L.: Hazard investigation of the Portillo Rock Avalanche site, central Andes, Chile, using an integrated field mapping and numerical modelling approach, Eng. Geol., 114, 278–297, https://doi.org/10.1016/j.enggeo.2010.05.007, 2010.
Wyllie, D. C.: Rock slope engineering, in: Civil applications, Taylor & Francis Group, Boca Raton, 2018.
- Abstract
- Introduction
- A general approach applied to the Zugspitze summit crest
- Sensitivity analysis for a simplified, warming permafrost rock slope
- Numerical model results
- Discussion
- Conclusion
- Code and data availability
- Author contributions
- Competing interests
- Disclaimer
- Acknowledgements
- Review statement
- References
- Supplement
The requested paper has a corresponding corrigendum published. Please read the corrigendum first before downloading the article.
- Article
(22337 KB) - Full-text XML
- Corrigendum
-
Supplement
(4217 KB) - BibTeX
- EndNote
- Abstract
- Introduction
- A general approach applied to the Zugspitze summit crest
- Sensitivity analysis for a simplified, warming permafrost rock slope
- Numerical model results
- Discussion
- Conclusion
- Code and data availability
- Author contributions
- Competing interests
- Disclaimer
- Acknowledgements
- Review statement
- References
- Supplement