the Creative Commons Attribution 4.0 License.
the Creative Commons Attribution 4.0 License.
 | 14 Oct 2021
Relationship between meteoric 10Be and NO3− concentrations in soils along Shackleton Glacier, Antarctica
Lee B. Corbett
Paul R. Bierman
Byron J. Adams
Diana H. Wall
Ian D. Hogg
Noah Fierer
W. Berry Lyons
Outlet glaciers that flow through the Transantarctic Mountains (TAM) experienced changes in ice thickness greater than other coastal regions of Antarctica during glacial maxima. As a result, ice-free areas that are currently exposed may have been covered by ice at various points during the Cenozoic, complicating our understanding of ecological succession in TAM soils. Our knowledge of glacial extent on small spatial scales is limited for the TAM, and studies of soil exposure duration and disturbance, in particular, are rare. We collected surface soil samples and, in some places, depth profiles every 5 cm to refusal (up to 30 cm) from 11 ice-free areas along Shackleton Glacier, a major outlet glacier of the East Antarctic Ice Sheet. We explored the relationship between meteoric 10Be and in these soils as a tool for understanding landscape disturbance and wetting history and as exposure proxies. Concentrations of meteoric 10Be spanned more than an order of magnitude across the region (2.9×10⁸ to 73×108 atoms g−1) and are among the highest measured in polar regions. The concentrations of were similarly variable and ranged from ∼1 µg g−1 to 15 mg g−1. In examining differences and similarities in the concentrations of 10Be and with depth, we suggest that much of the southern portion of the Shackleton Glacier region has likely developed under a hyper-arid climate regime with minimal disturbance. Finally, we inferred exposure time using 10Be concentrations. This analysis indicates that the soils we analyzed likely range from recent exposure (following the Last Glacial Maximum) to possibly >6 Myr. We suggest that further testing and interrogation of meteoric 10Be and concentrations and relationships in soils can provide important information regarding landscape development, soil evolution processes, and inferred exposure durations of surfaces in the TAM.
- Article
(12860 KB) - Full-text XML
-
Supplement
(907 KB) - BibTeX
- EndNote


One of the most intriguing questions in biogeography concerns the relationship between the evolution of terrestrial organisms and landscape disturbance (e.g., glacial overriding, soil wetting), particularly in Antarctica. Current data indicate that organism lineages have survived in some Antarctic soils for possibly millions of years, despite multiple glaciations throughout the Pleistocene (Convey et al., 2008; Fraser et al., 2012; Stevens and Hogg, 2003). It is still unclear how and where these organisms found suitable glacial refugia given the high salt concentrations in high-elevation soils (Lyons et al., 2016). The most biodiverse soils in the Ross Sea sector are at low elevations near the coast, where the Ross Ice Shelf or sea ice meets the Transantarctic Mountains (TAM) (Collins et al., 2020). These soils are also those which are most susceptible to glacial overriding during glacial maxima, though the timing of retreat and glacial extent is still unknown on local scales (Golledge et al., 2012; Mackintosh et al., 2011).
Outlet glaciers are among the most responsive cryospheric components in Antarctica, and changes in their extents over time are recorded in nearby sedimentary deposits (Golledge et al., 2013; Jones et al., 2015; Scherer et al., 2016; Spector et al., 2017). However, only scattered information exists on TAM soil processes, ages, chronosequences, and their implications for terrestrial and ecosystem history (Bockheim, 2002; Dickinson et al., 2012; Graham et al., 1997, 2002; Lyons et al., 2016; Scarrow et al., 2014; Schiller et al., 2009). Shackleton Glacier, an outlet glacier of the East Antarctic Ice Sheet (EAIS), flows between several exposed peaks of the central Transantarctic Mountains (CTAM), and ice-free areas are present at both low and high elevations. We report concentrations of meteoric 10Be and nitrate () in soils from 11 ice-free areas and investigate their distributions at depth to explore 10Be and relationships. The sampling methodology was designed to capture a range of soils which have low salt concentrations due to recent exposure from glacial retreat following the Last Glacial Maximum (LGM) and soils that were likely exposed since at least the last glacial period. These data include some of the only meteoric 10Be and concentration data from the CTAM (Claridge and Campbell, 1968b, 1977; Graham et al., 1997; Lyons et al., 2016), inform knowledge of landscape disturbance and wetting history, may potentially be used to infer soil exposure duration, and are useful in understanding Antarctic terrestrial biogeography.
2.1 Brief overview of Antarctic glacial and wetting history
Antarctica is believed to have maintained a persistent ice sheet since at least the Eocene epoch; paleorecords indicate that the East and West Antarctic Ice Sheets (EAIS and WAIS, respectively) have waxed and waned since at least the Miocene (Gasson et al., 2016; Gulick et al., 2017). Sediment core records collected from the Ross Sea and ice cores from the Antarctic interior indicate that the EAIS and WAIS underwent dozens of glacial and interglacial cycles throughout the Cenozoic (Augustin et al., 2004; Talarico et al., 2012). The WAIS is a marine-terminating ice sheet defined by a grounding line below sea level, which decreases the stability of the ice sheet and results in more rapid advance and retreat compared to the EAIS (Pollard and DeConto, 2009). The EAIS is grounded above sea level and is therefore generally more stable. The EAIS and WAIS were at their most recent greatest extent about 14 ka during the LGM (Clark et al., 2009). During the LGM, the EAIS expanded along its margins, and some of the greatest increases in height occurred at outlet glaciers which flow through exposed peaks of the TAM and drain into the Ross and Weddell seas (Anderson et al., 2002; Golledge et al., 2012; Mackintosh et al., 2014). As a result, many of the currently exposed TAM soils were overrun by ice during the LGM, and some may have only recently been exposed.
Much of the Antarctic continent is a polar desert, and geomorphological data from ice-free soils in the McMurdo Dry Valleys indicate that some regions have likely been hyper-arid for as long as 15 Myr (Marchant et al., 1996; Valletta et al., 2015). As such, atmospherically derived constituents, including salts and metals, can accumulate in exposed Antarctic soils at concentrations similar to those from the Atacama and Namib deserts (Diaz et al., 2020; Lyons et al., 2016; Reich and Bao, 2018). Using soil concentrations from the Meyer Desert in the Beardmore Glacier region and fluxes calculated from a Dominion Range ice core, Lyons et al. (2016) estimated that at least 750 000 years have passed since the Meyer Desert had widespread soil wetting. It is likely that other high-elevation and inland locations in the TAM also have high concentrations of salts and similarly old “wetting ages”, though this has not been thoroughly investigated.
2.2 Meteoric 10Be systematics in Antarctic soils
10Be is a cosmogenic radionuclide with a half-life of 1.39 Myr (Korschinek et al., 2010) that is produced in both the atmosphere (meteoric) and in situ in mineral grains. In the atmosphere, N and O gases are bombarded by high-energy cosmic radiation to produce meteoric 10Be. Particle-reactive 10BeO or 10Be(OH)2 is produced and removed from the atmosphere by wet and dry deposition (McHargue and Damon, 1991). At the Earth's surface, meteoric 10Be sorbs onto clay particles and is insoluble in most natural waters of pH greater than 4 (Brown et al., 1992; You et al., 1989). The clay particles can be redistributed to lower depths in soils due to particle migration or can be transported by wind. As such, the total number of 10Be atoms in a soil profile, its inventory, is a function of surface exposure duration, erosion, clay particle translocation, solubility, and sedimentation. If delivery rates can be determined, meteoric 10Be can be used as a tool to determine exposure ages, erosion rates, and soil residence times (see Willenbring and Von Blanckenburg, 2010, and references within). Regarding terrestrial exposure ages, there are scattered exposure age studies from across the CTAM using a variety of in situ produced cosmogenic nuclides (Ackert and Kurz, 2004; Balter-Kennedy et al., 2020; Bromley et al., 2010; Kaplan et al., 2017; Spector et al., 2017), and previously reported exposure ages of CTAM moraines and boulders from these studies range from <10 kyr to >14 Myr.
The measurement of meteoric 10Be in soil has enabled researchers to date surfaces (soils) and features in Antarctica. Previous studies have measured meteoric 10Be in the McMurdo Dry Valleys (MDV) and Victoria Land soils and sediments to calculate exposure ages and to determine the onset of the current polar desert regime (Dickinson et al., 2012; Graham et al., 2002; Schiller et al., 2009; Valletta et al., 2015). In general, these previous studies found that high-elevation, northern fringe regions along the Ross Embayment have been ice-free and possibly hyper-arid since at least the Pliocene. Few meteoric 10Be data have been previously published from the CTAM (Graham et al., 1997), which represent ice sheet dynamics and climatic conditions closer to the Polar Plateau.
2.3 Nitrate systematics in Antarctic soils
The nitrogen cycle in Antarctica differs greatly from the nitrogen cycle in temperate regions, primarily due to scarce biomass and few vascular plants (Cary et al., 2010; Michalski et al., 2005). Nitrogen in CTAM soils primarily exists as and is sourced from the atmosphere, with varying contributions from the troposphere and stratosphere (Diaz et al., 2020; Lyons et al., 2016; Michalski et al., 2005). Similar to meteoric 10Be, is deposited on exposed soils; however, nitrate salts are highly water-soluble. Once deposited on the surface, nitrate salts can be dissolved and transported down-gradient or eluted to depth when wetted (i.e., during ice–snow melt events). However, the hyper-arid climate of the CTAM can allow to accumulate at high concentrations in soils (Claridge and Campbell, 1968a; Diaz et al., 2020; Lyons et al., 2016). Soil concentrations have the potential to inform our knowledge of wetting history and possibly glacial history in the CTAM due to the relatively high solubility of nitrate salts, though uncertainties regarding heterogeneous deposition and post-depositional alteration (such as re-volatilization and photolysis) require further investigation (Diaz et al., 2020; Frey et al., 2009; Graham et al., 2002).
Shackleton Glacier (∼84.5 to 86.4∘ S; ∼130 km long and ∼10 km wide) is a major outlet glacier of the EAIS that drains north into the Ross Embayment with other CTAM outlet glaciers to form the Ross Ice Shelf (RIS) (Fig. 1). The ice flows between exposed surfaces of the Queen Maud Mountains, which range from elevations of ∼150 m a.s.l. near the RIS to >3500 m a.s.l. further inland. The basement geology of the Shackleton Glacier region is comprised of igneous and metamorphic rocks that formed from intruded and metamorphosed sedimentary and volcanic strata during the Ross Orogeny (450–520 Ma) (Elliot and Fanning, 2008). The southern portion of the region consists of the Devonian–Triassic Beacon Supergroup and the Jurassic Ferrar Group, while the northern portion consists of pre-Devonian granitoids and the early to mid-Cambrian Taylor Group (Elliot and Fanning, 2008; Paulsen et al., 2004). These rocks serve as primary parent material for soil formation (Claridge and Campbell, 1968b). Deposits of the Sirius Group, the center of the stable vs. dynamic EAIS debate (Barrett, 2013; Sugden et al., 1993; Webb et al., 1984; Wilson, 1995), have been previously identified in the southern portion of the Shackleton Glacier region, particularly at Roberts Massif (Fig. 2) and Bennett Platform, with a small exposure at Schroeder Hill (Hambrey et al., 2003).
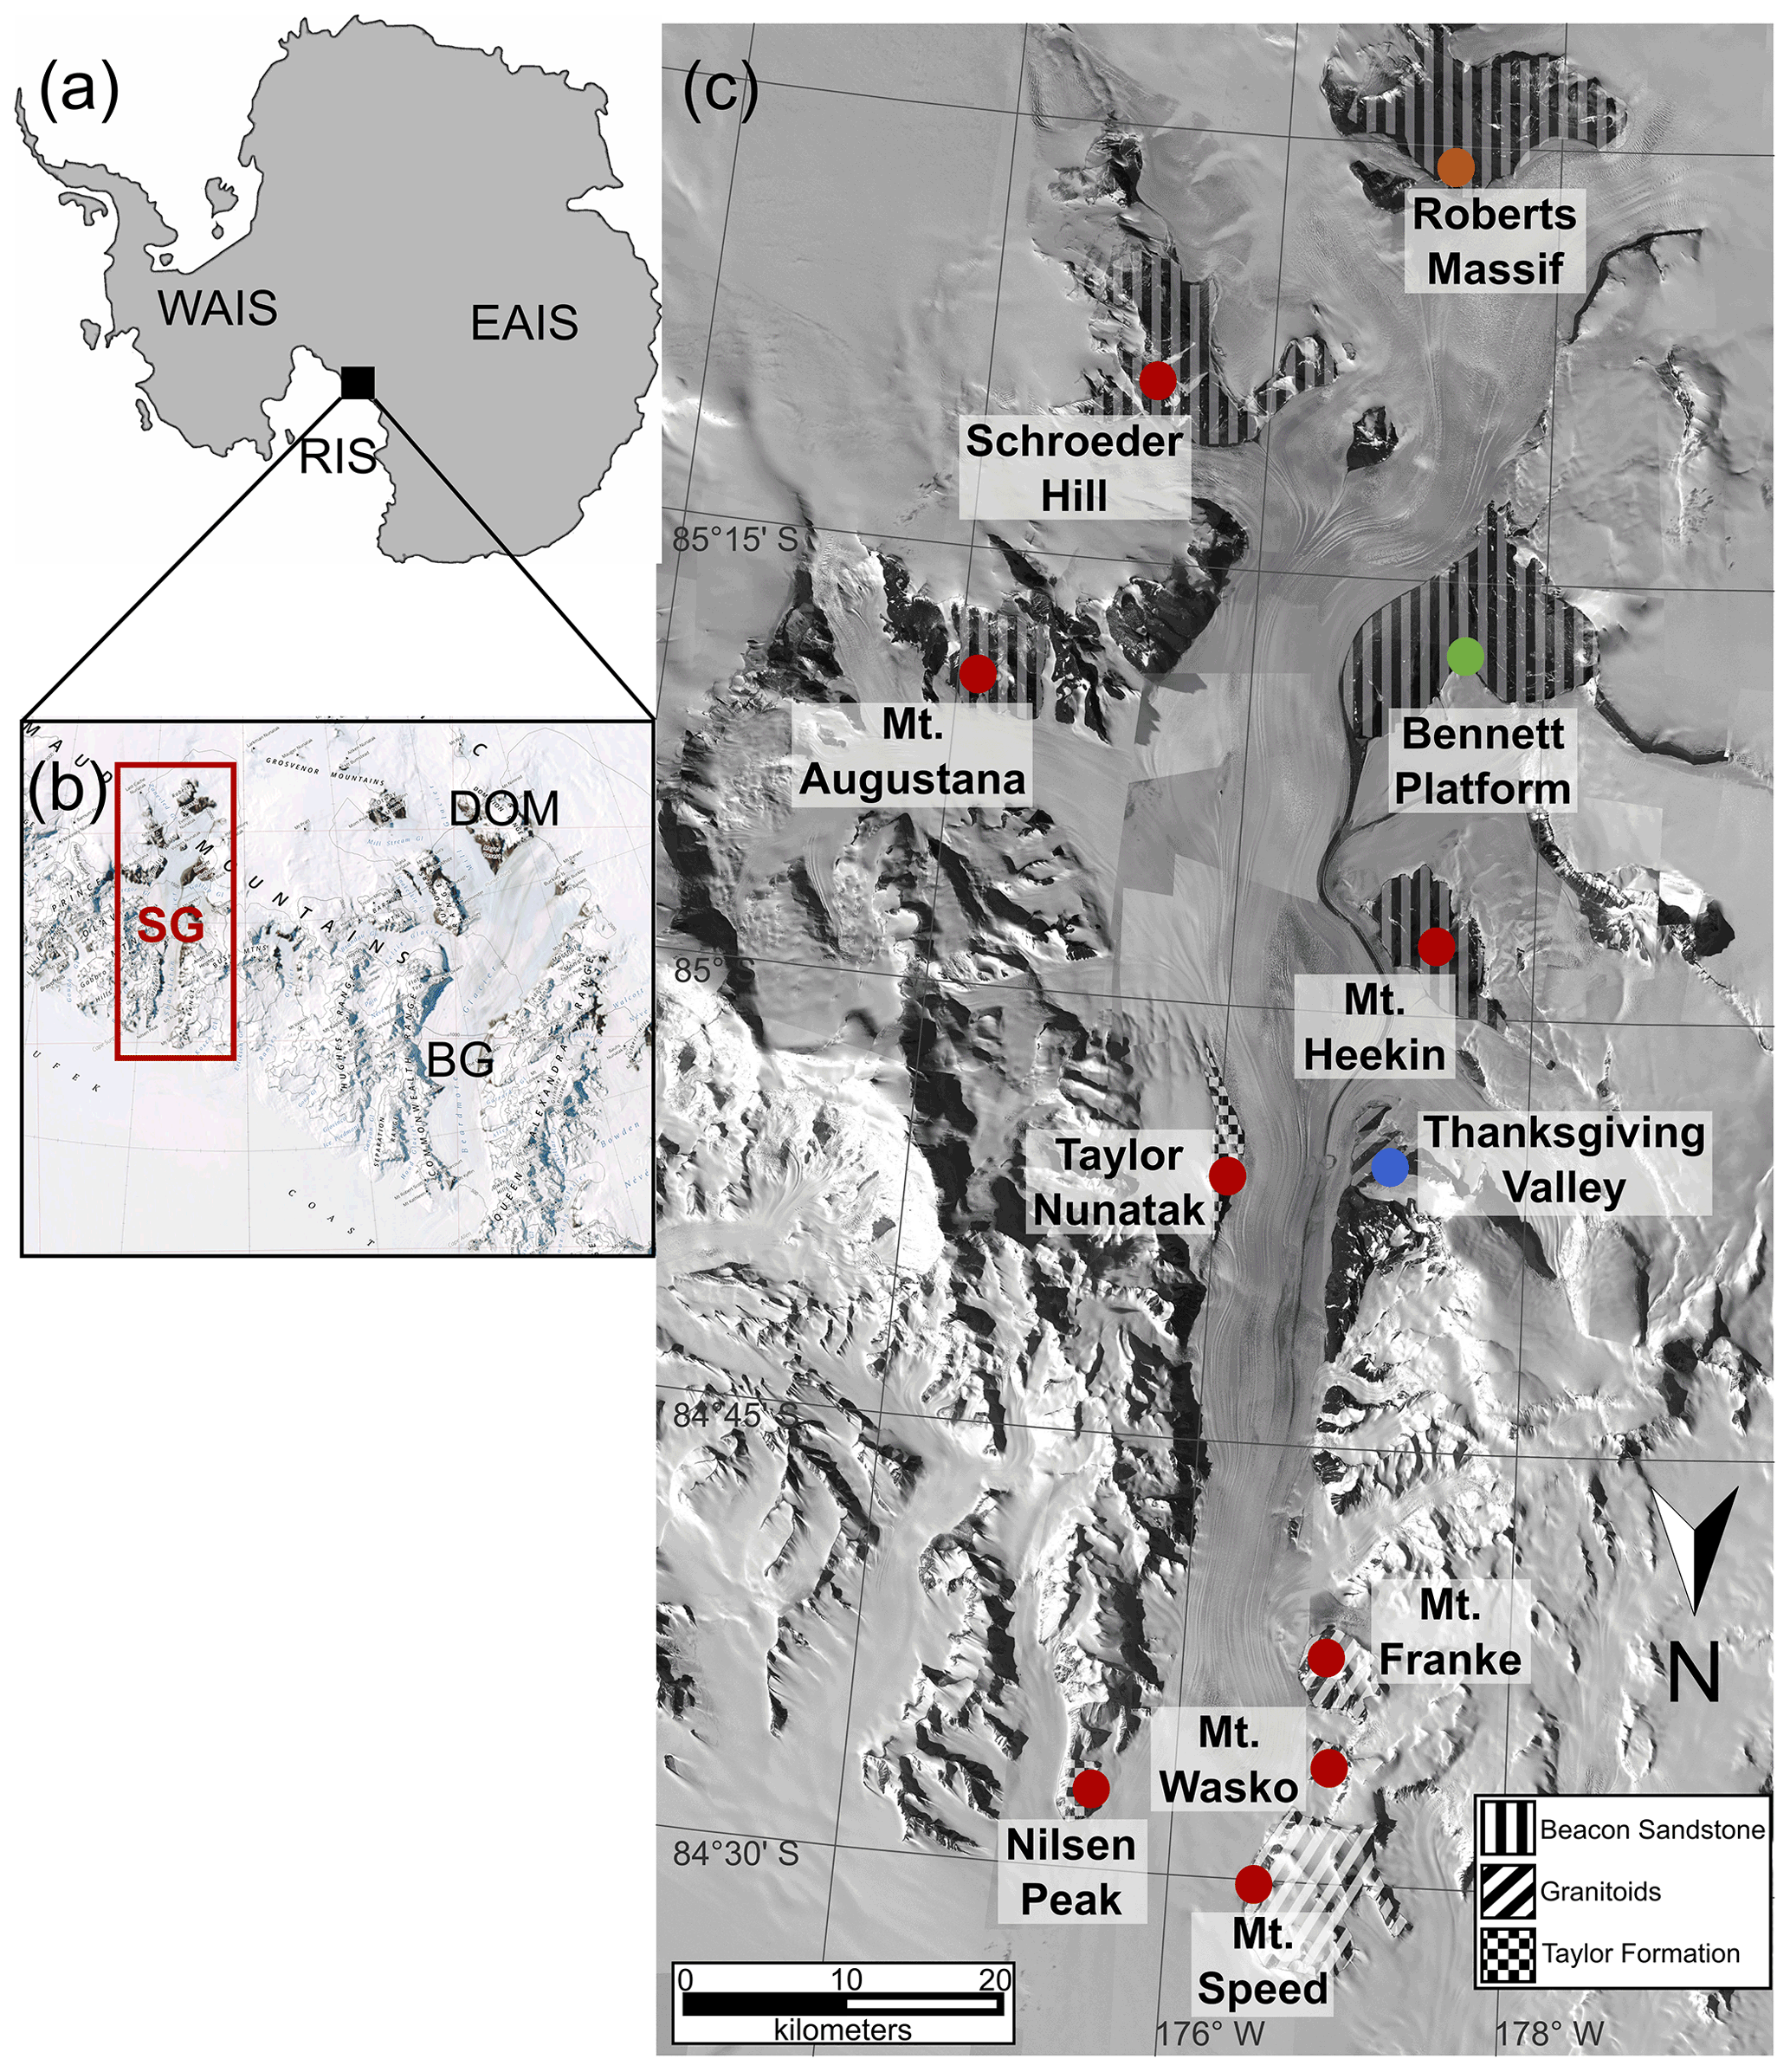
Figure 1Outline map of the Antarctic continent (a), the Shackleton Glacier (SG) and Beardmore Glacier (BG) regions (b), and an overview map of Shackleton Glacier (c). The red box in (b) encapsulates the Shackleton Glacier region. The red circles in (c) represent our 11 sampling locations, with an emphasis on Roberts Massif (orange), Bennett Platform (green), and Thanksgiving Valley (blue), which have the most comprehensive dataset in this study. The bedrock serves as the primary weathering product for soil formation (Elliot and Fanning, 2008; Paulsen et al., 2004). For reference, the East Antarctic Ice Sheet (EAIS), West Antarctic Ice Sheet (WAIS), Ross Ice Shelf (RIS), and Dominion Range are labeled (a, b). Base maps were provided by the Polar Geospatial Center.
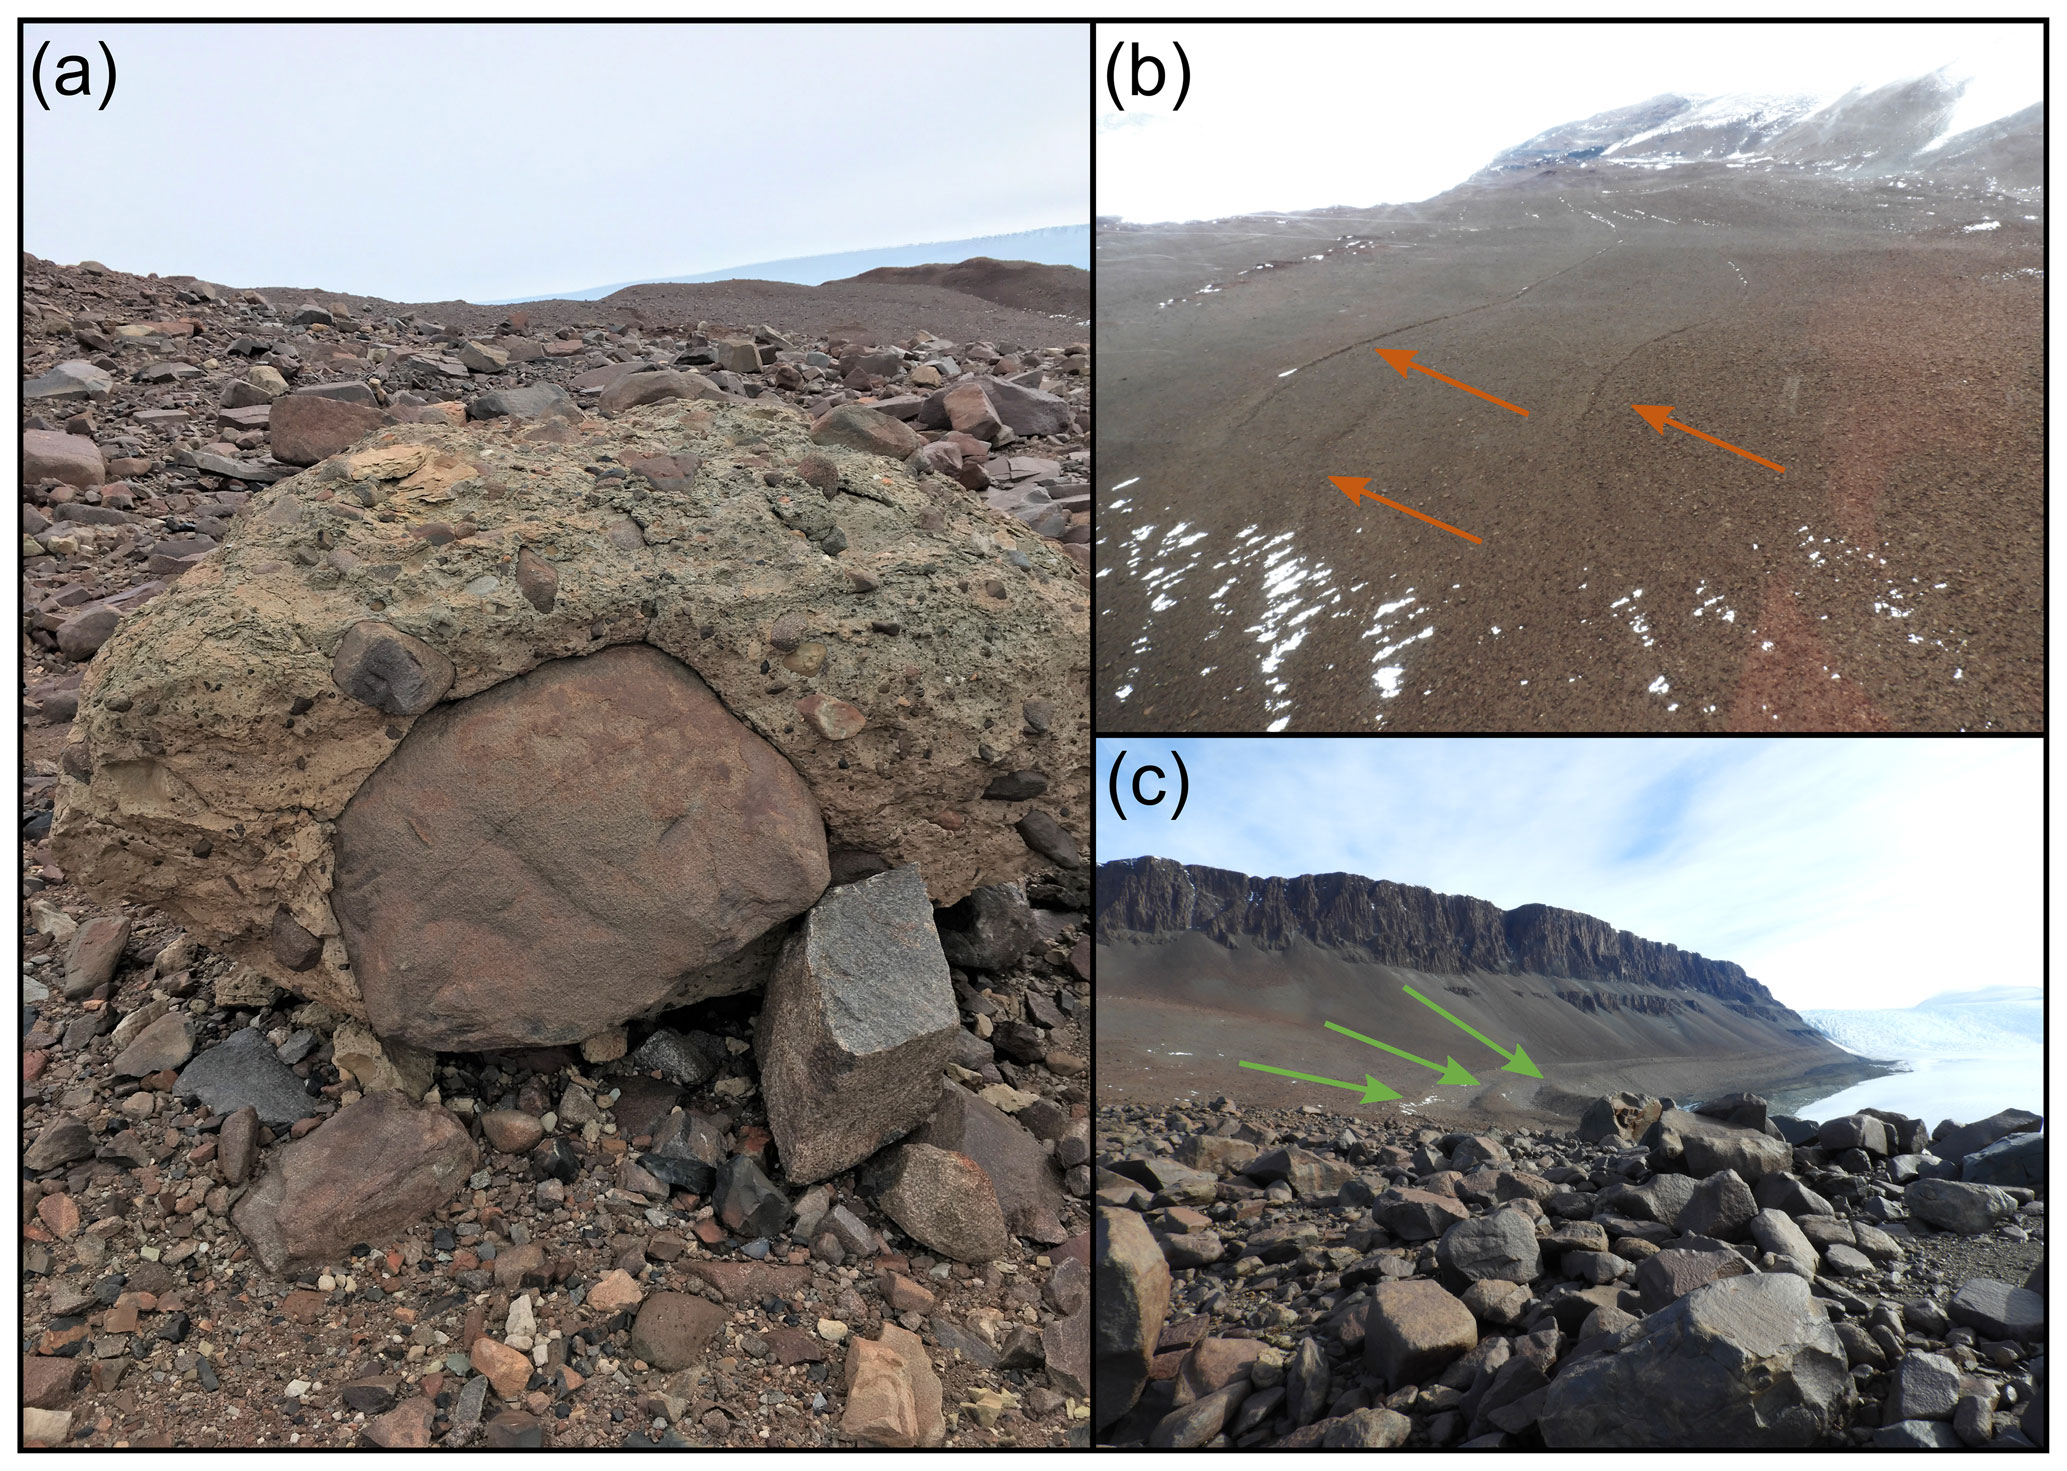
Figure 2The Sirius Group was documented at Roberts Massif near the RM2-8 sampling location (a). Small moraines were observed at Roberts Massif (b) and large moraines at Bennett Platform (c).
The valleys and other ice-free areas within the region have been modified by the advance and retreat of Shackleton Glacier, smaller tributary glaciers, and alpine glaciers. Similar to the Beardmore Glacier region, the Shackleton Glacier region is a polar desert, which results in the high accumulation of salts in soils. The surface is comprised primarily of till, weathered primary bedrock, and scree, which ranges in size from small boulders and cobbles to sand and silt. Clay minerals have been previously identified in all samples from Roberts Massif and are likely ubiquitous throughout the region (Claridge and Campbell, 1968b). The clays are a mixture of those derived from sedimentary rocks and contemporaneous weathering (Claridge and Campbell, 1968b). Thin, boulder belt moraines, characteristic of cold-based glaciers, were deposited over bedrock and tills at Roberts Massif, while large moraines were deposited at Bennett Platform (Fig. 2; Balter-Kennedy et al., 2020; Claridge and Campbell, 1968b). Most soils appeared to be dry, though some small ponds and water tracks have been documented near Mt. Heekin and Thanksgiving Valley (Elliot et al., 1996). Additional information on the sample locations and surface features is provided in Tables 1 and 2.
Table 1Concentrations of meteoric 10Be and water-soluble nitrate () in Shackleton Glacier region surface soils and depth profiles. Additional information on 10Be corrections is located in Table S2.
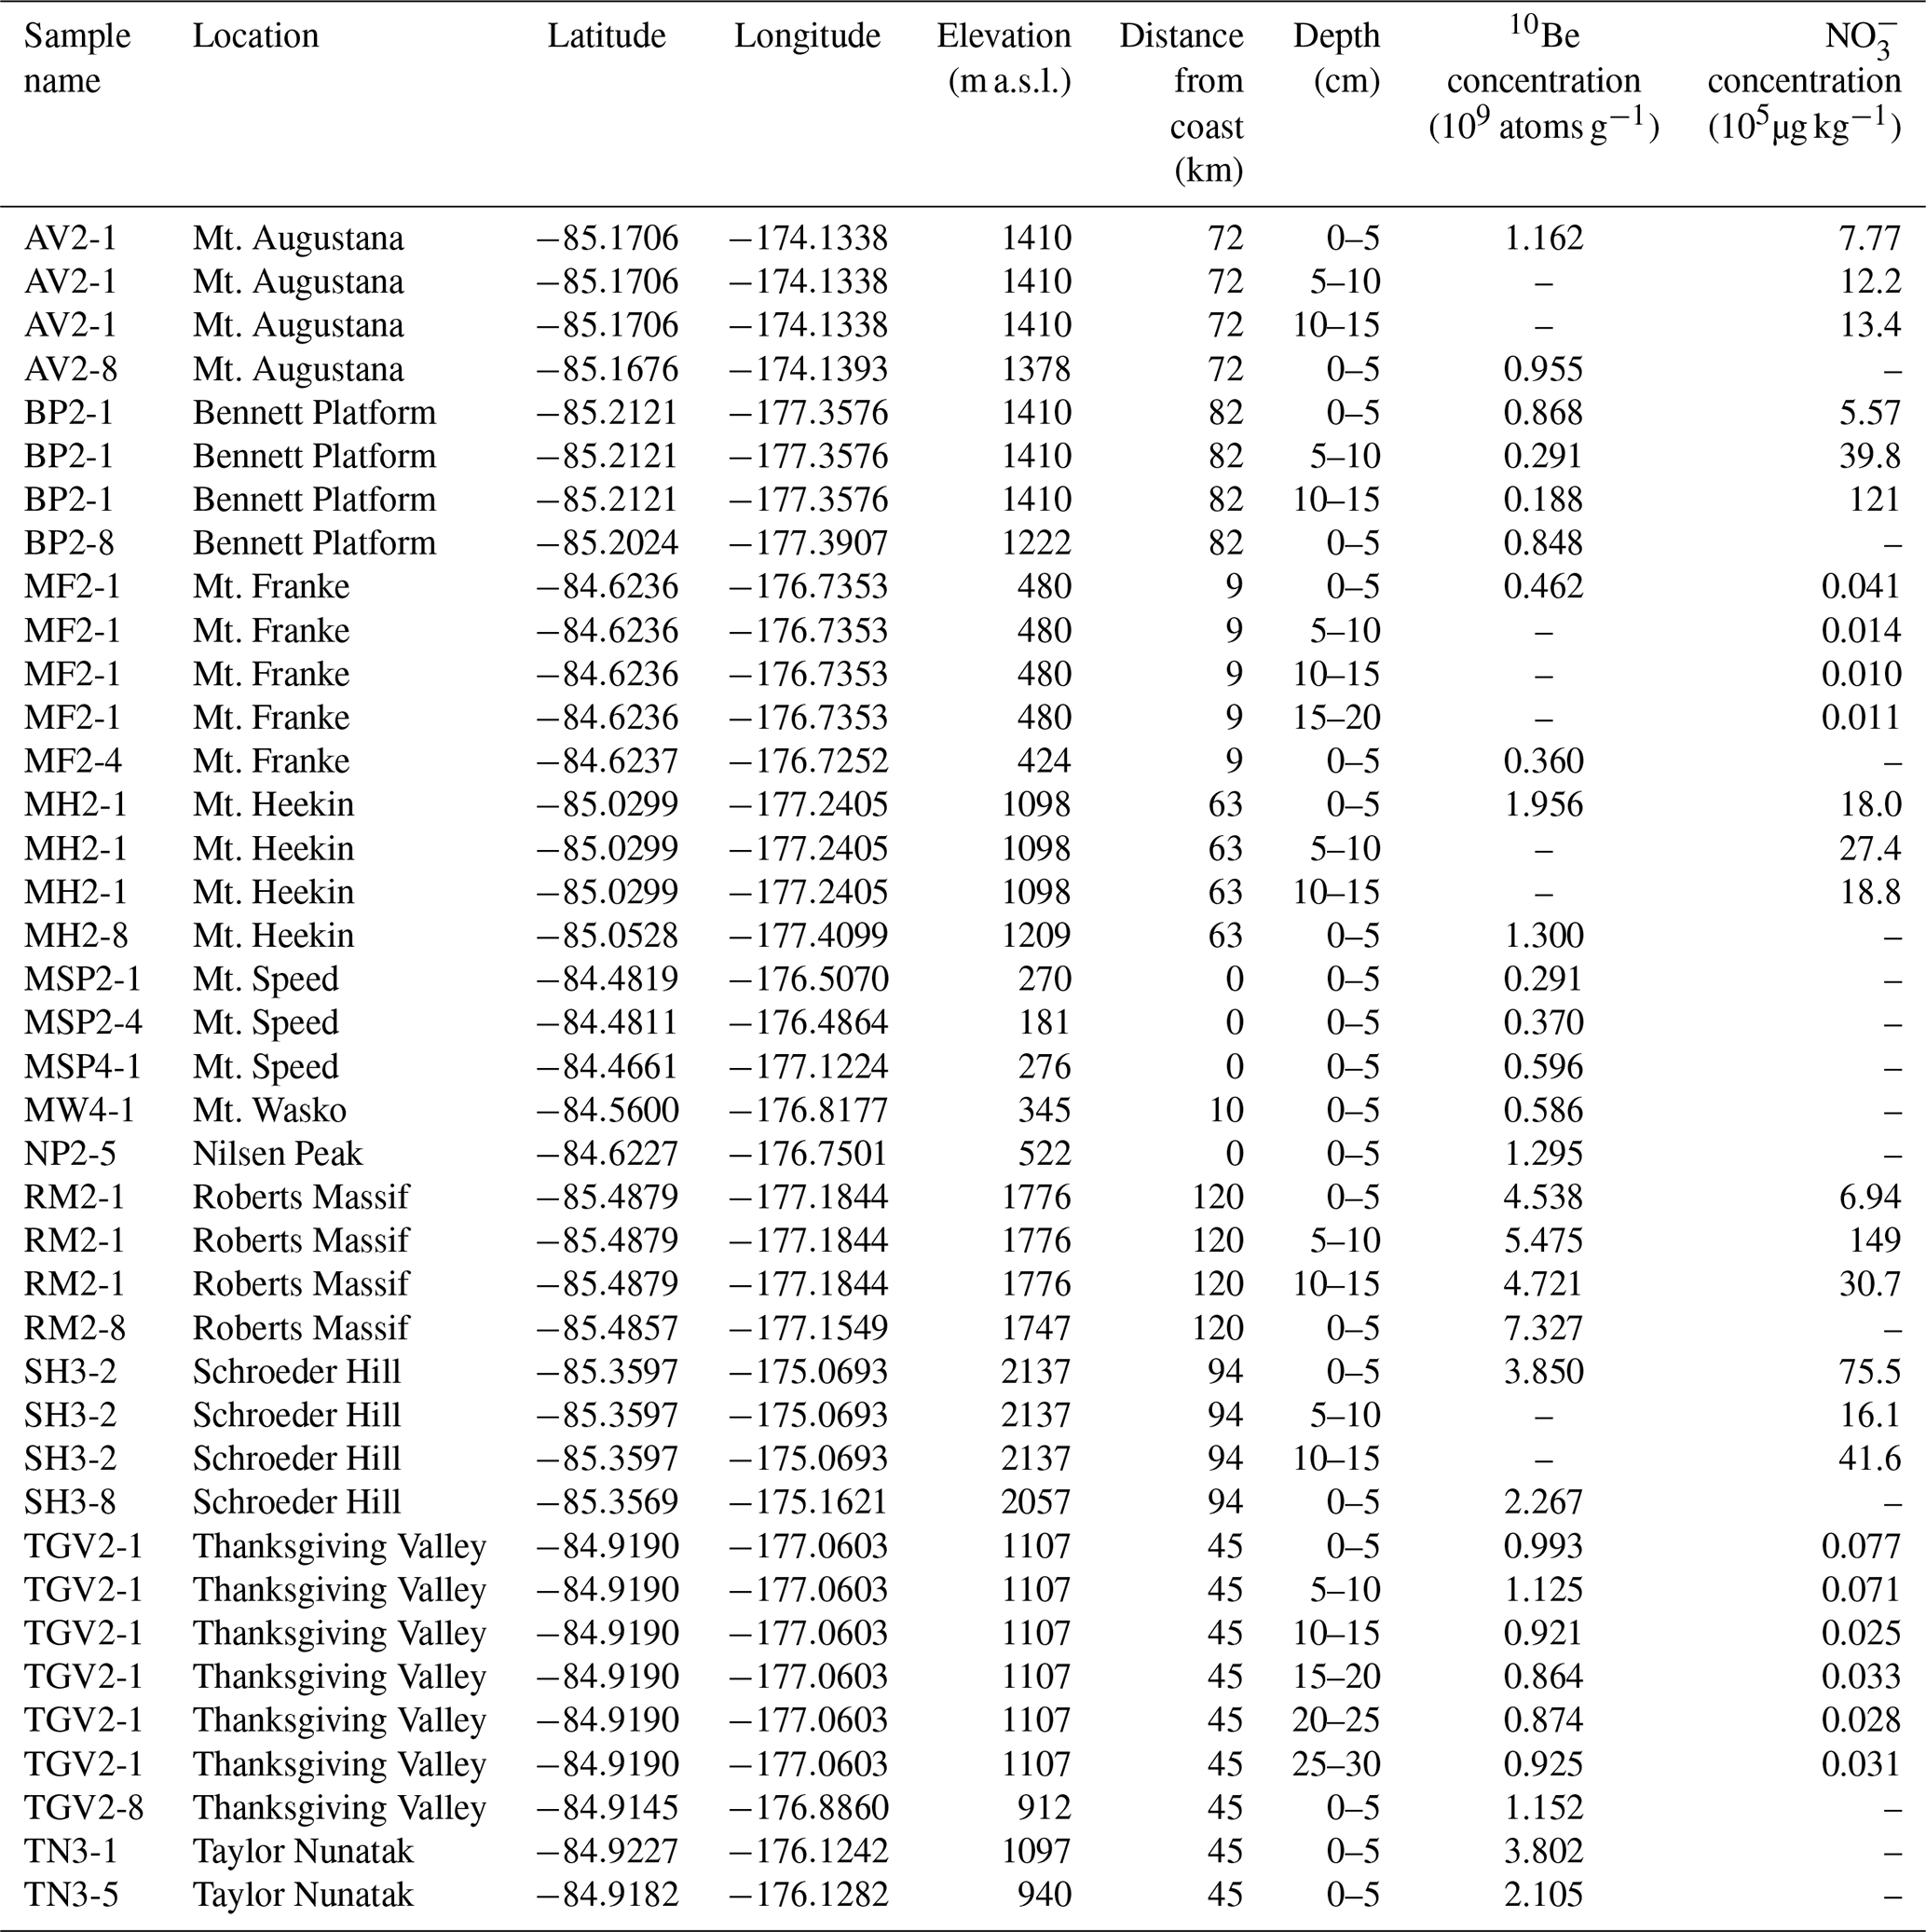
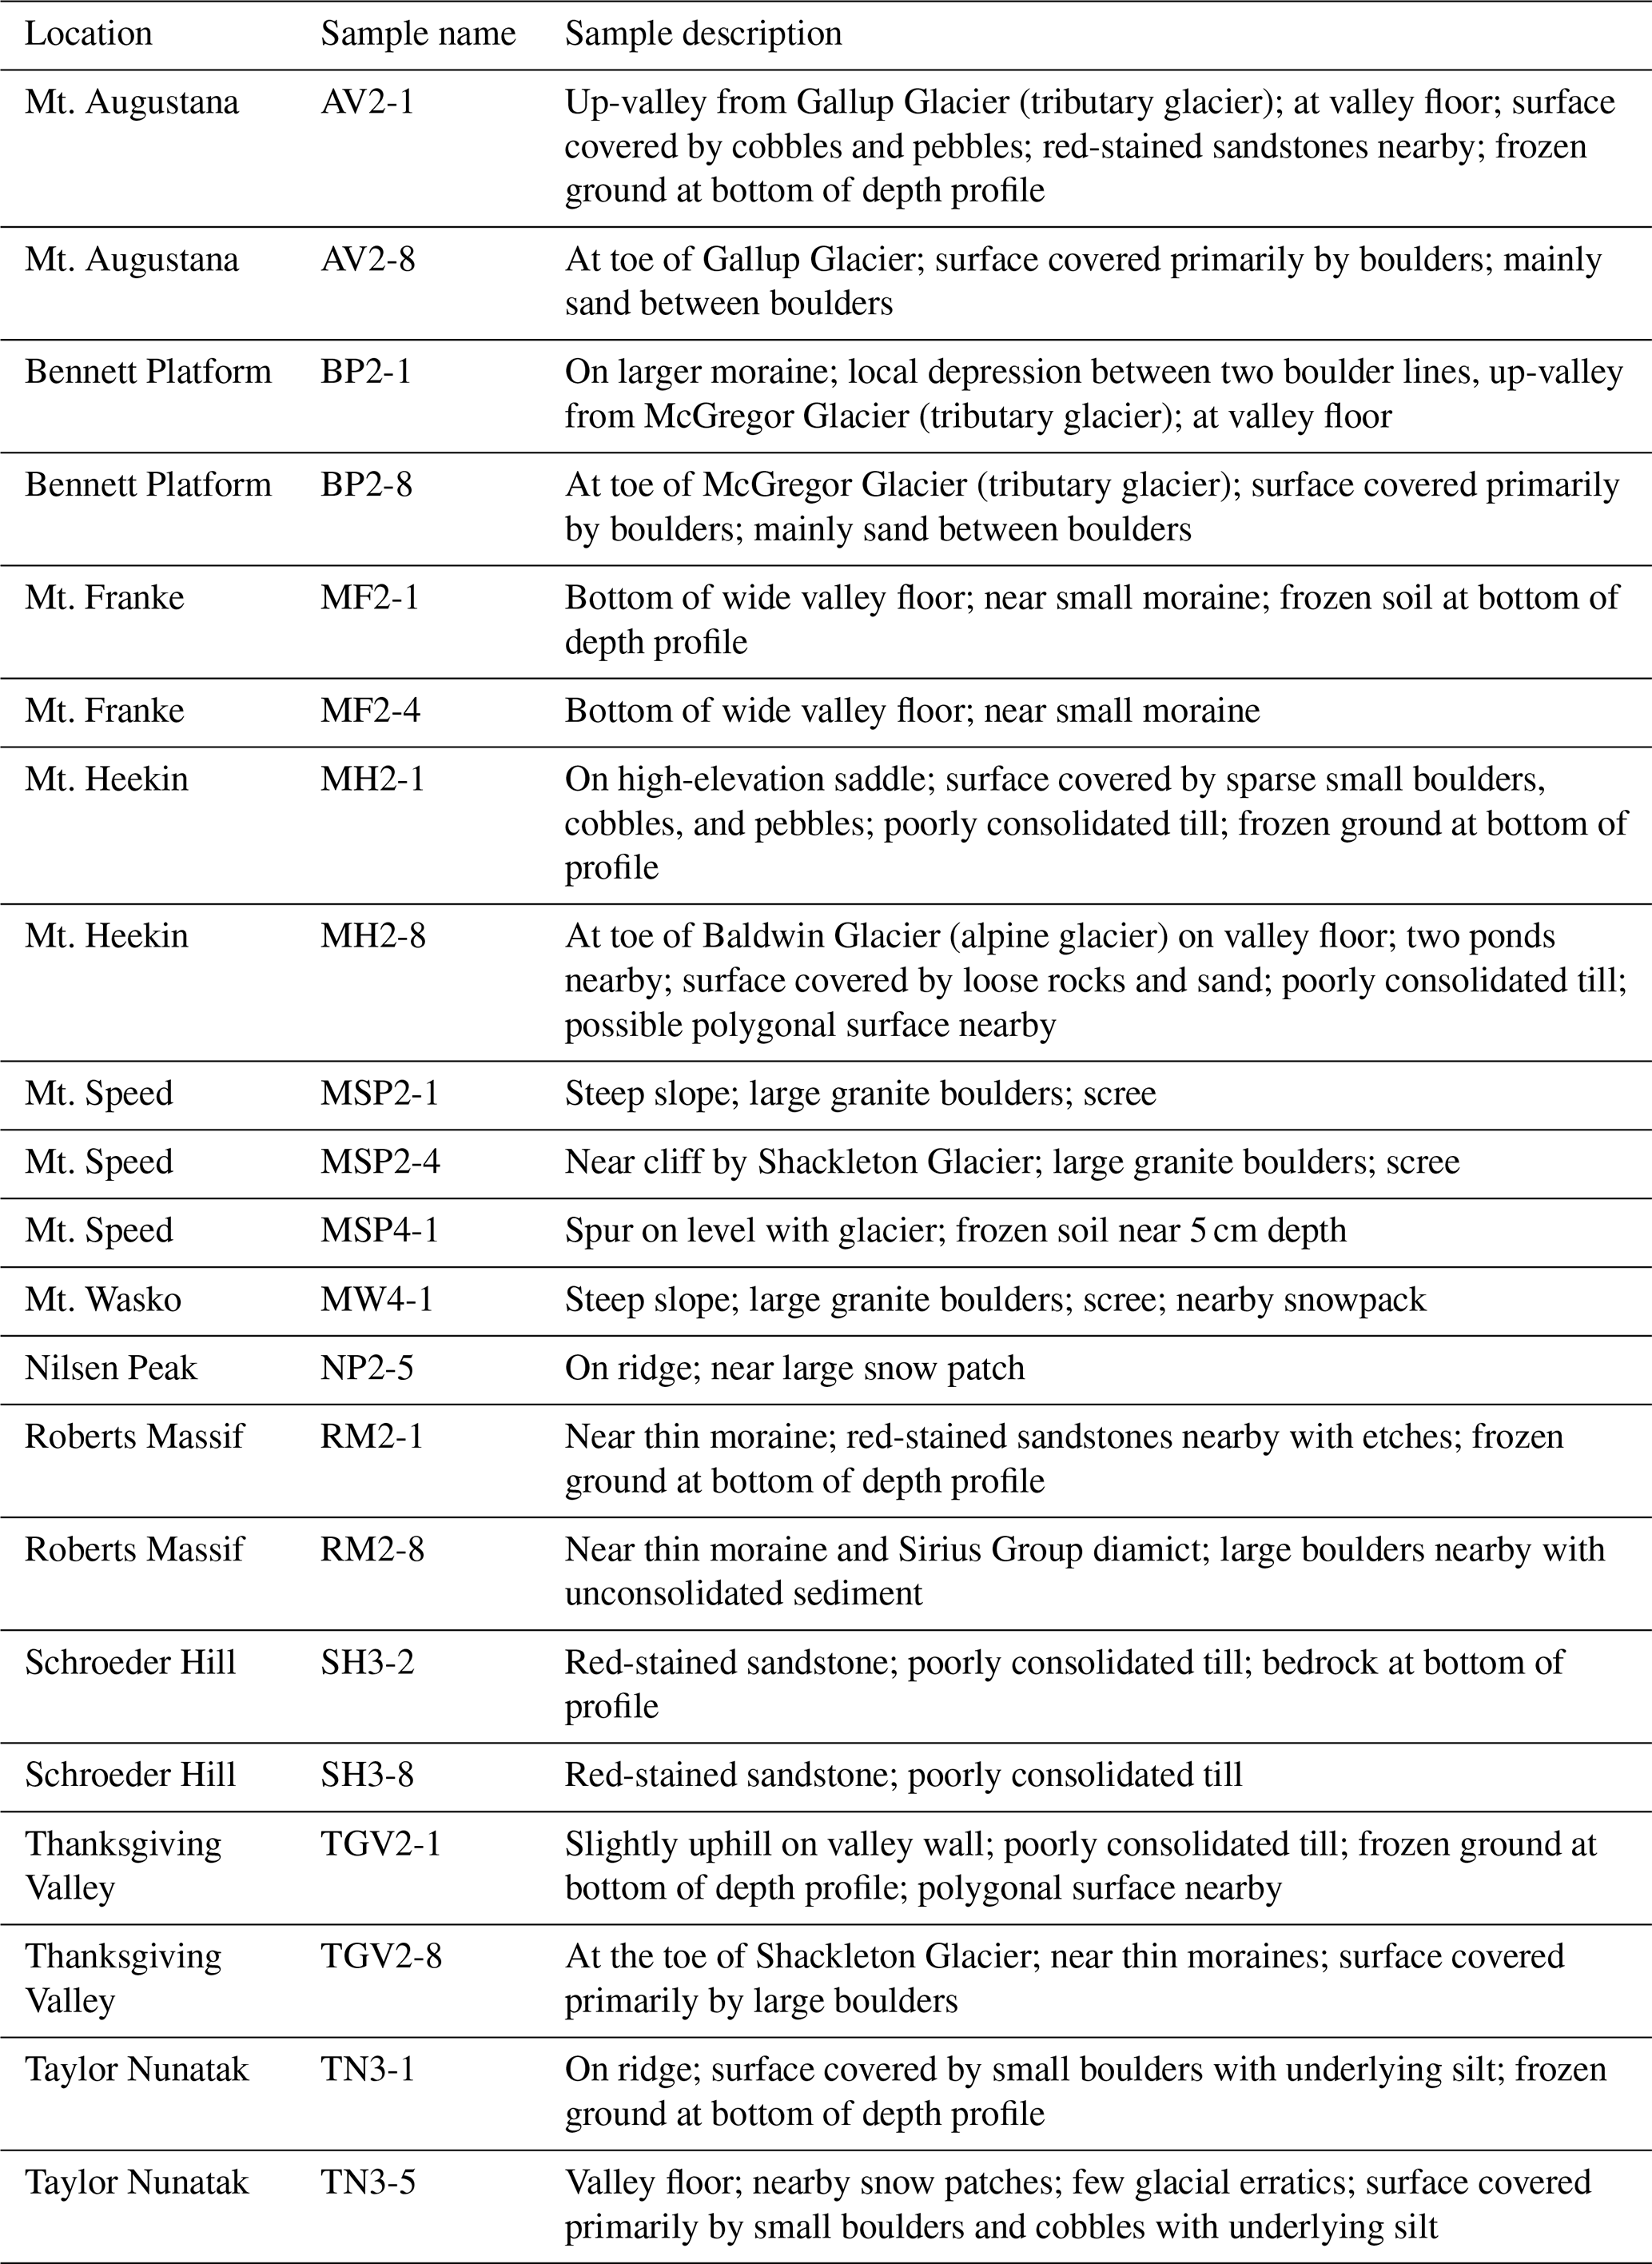
Table 2Surface features of the sample locations from the Shackleton Glacier region.
4.1 Sample collection
During the 2017–2018 austral summer, we visited 11 ice-free areas along Shackleton Glacier: Roberts Massif, Schroeder Hill, Bennett Platform, Mt. Augustana, Mt. Heekin, Thanksgiving Valley, Taylor Nunatak, Mt. Franke, Mt. Wasko, Nilsen Peak, and Mt. Speed (Fig. 1). These areas represent soils from near the head of the glacier to near the glacier terminus at the coast of the RIS. Two surface samples (Table 1) were collected at each location (except for Nilsen Peak and Mt. Wasko, represented by only one sample each) with a plastic scoop and stored in Whirl-Pak™ bags. One sample was collected furthest from Shackleton Glacier or other tributary glaciers (within ∼2000 m) to represent soils that were likely exposed during the LGM and previous recent glacial periods. A second sample was collected closer to the glacier (between ∼1500 and 200 m from the first sample) to represent soils likely to have been covered during the LGM and exposed by more recent ice margin retreat.
Soil pits were dug by hand at the sampling locations furthest from the glacier for Roberts Massif, Schroeder Hill, Mt. Augustana, Bennett Platform, Mt. Heekin, Thanksgiving Valley, and Mt. Franke (seven sites). Continuous samples were collected every 5 cm until refusal (up to 30 cm) and stored frozen in Whirl-Pak™ bags. All surface (21) and depth profile (25) samples were shipped frozen to The Ohio State University and kept frozen until analyzed. We selected Roberts Massif, Bennett Platform, and Thanksgiving Valley as locations for the most in-depth analysis for the depth profiles. These locations were chosen to maximize variability in landscape development: Roberts Massif represented an older, likely minimally disturbed landscape; Bennett Platform represented a landscape with evidence of recent glacial advance and retreat, as well as substantial topographic highs and lows; and Thanksgiving Valley represented a landscape with possible hydrologic activity, as evidenced by nearby ponds (Table 2).
4.2 Analytical methods
4.2.1 Meteoric 10Be analysis
A total of 30 subsamples of surface soils from all locations and the depth profiles from Roberts Massif, Bennett Platform, and Thanksgiving Valley were sieved to determine the grain size at each location. For each sample, the percentages of gravel (>2 mm), sand (63 µm−2 mm), and silt (<63 µm) are reported in Table S1 in the Supplement. Since there is a strong grain size dependence of meteoric 10Be (little 10Be is carried on coarse (>2 mm) grains; Pavich et al., 1986), the gravel portion of the sample was not included in the meteoric 10Be analysis. The remaining soil (<2 mm) was ground to fine powder using a shatterbox.
Meteoric 10Be (Tables 1 and S2) was extracted and purified at the NSF/University of Vermont (UVM) Community Cosmogenic Facility following procedures adapted from Stone (1998). First, 0.5 g of powdered soil was weighed into platinum crucibles, and 0.4 g of SPEX 9Be carrier (with a concentration of 1000 µg mL−1) was added to each sample. The samples were fluxed with a mixture of potassium hydrogen fluoride and sodium sulfate. Perchloric acid was then added to remove potassium by precipitation and later evaporated. Samples were dissolved in nitric acid and precipitated as beryllium hydroxide (Be(OH)2) gel, then packed into stainless-steel cathodes for accelerator mass spectrometer isotopic analysis at the Purdue Rare Isotope Measurement (PRIME) Laboratory. Isotopic ratios were normalized to primary standard 07KNSTD with an assumed ratio of (Nishiizumi et al., 2007). We corrected sample ratios with a blank ratio of , which is the average standard deviation of two blanks processed alongside the samples. We subtracted the blank ratio from the sample ratios and propagated uncertainties in quadrature. The average blank ratio was about 4 orders of magnitude less than the measured sample ratios.
4.2.2 analysis
Separate, un-sieved subsamples of soil from all locations and depth profiles were leached at a 1:5 ratio of soil to deionized water for 24 h, then filtered through a 0.4 µm Nuclepore membrane filter. The leachate was analyzed on a Skalar San Automated Wet Chemistry Analyzer with an SA 1050 Random Access Auto-sampler (Lyons et al., 2016; Welch et al., 2010). Concentrations are reported as (Table 1) with accuracy, as determined using a USGS 2015 “round-robin” standard, and precision better than 5 % (Lyons et al., 2016).
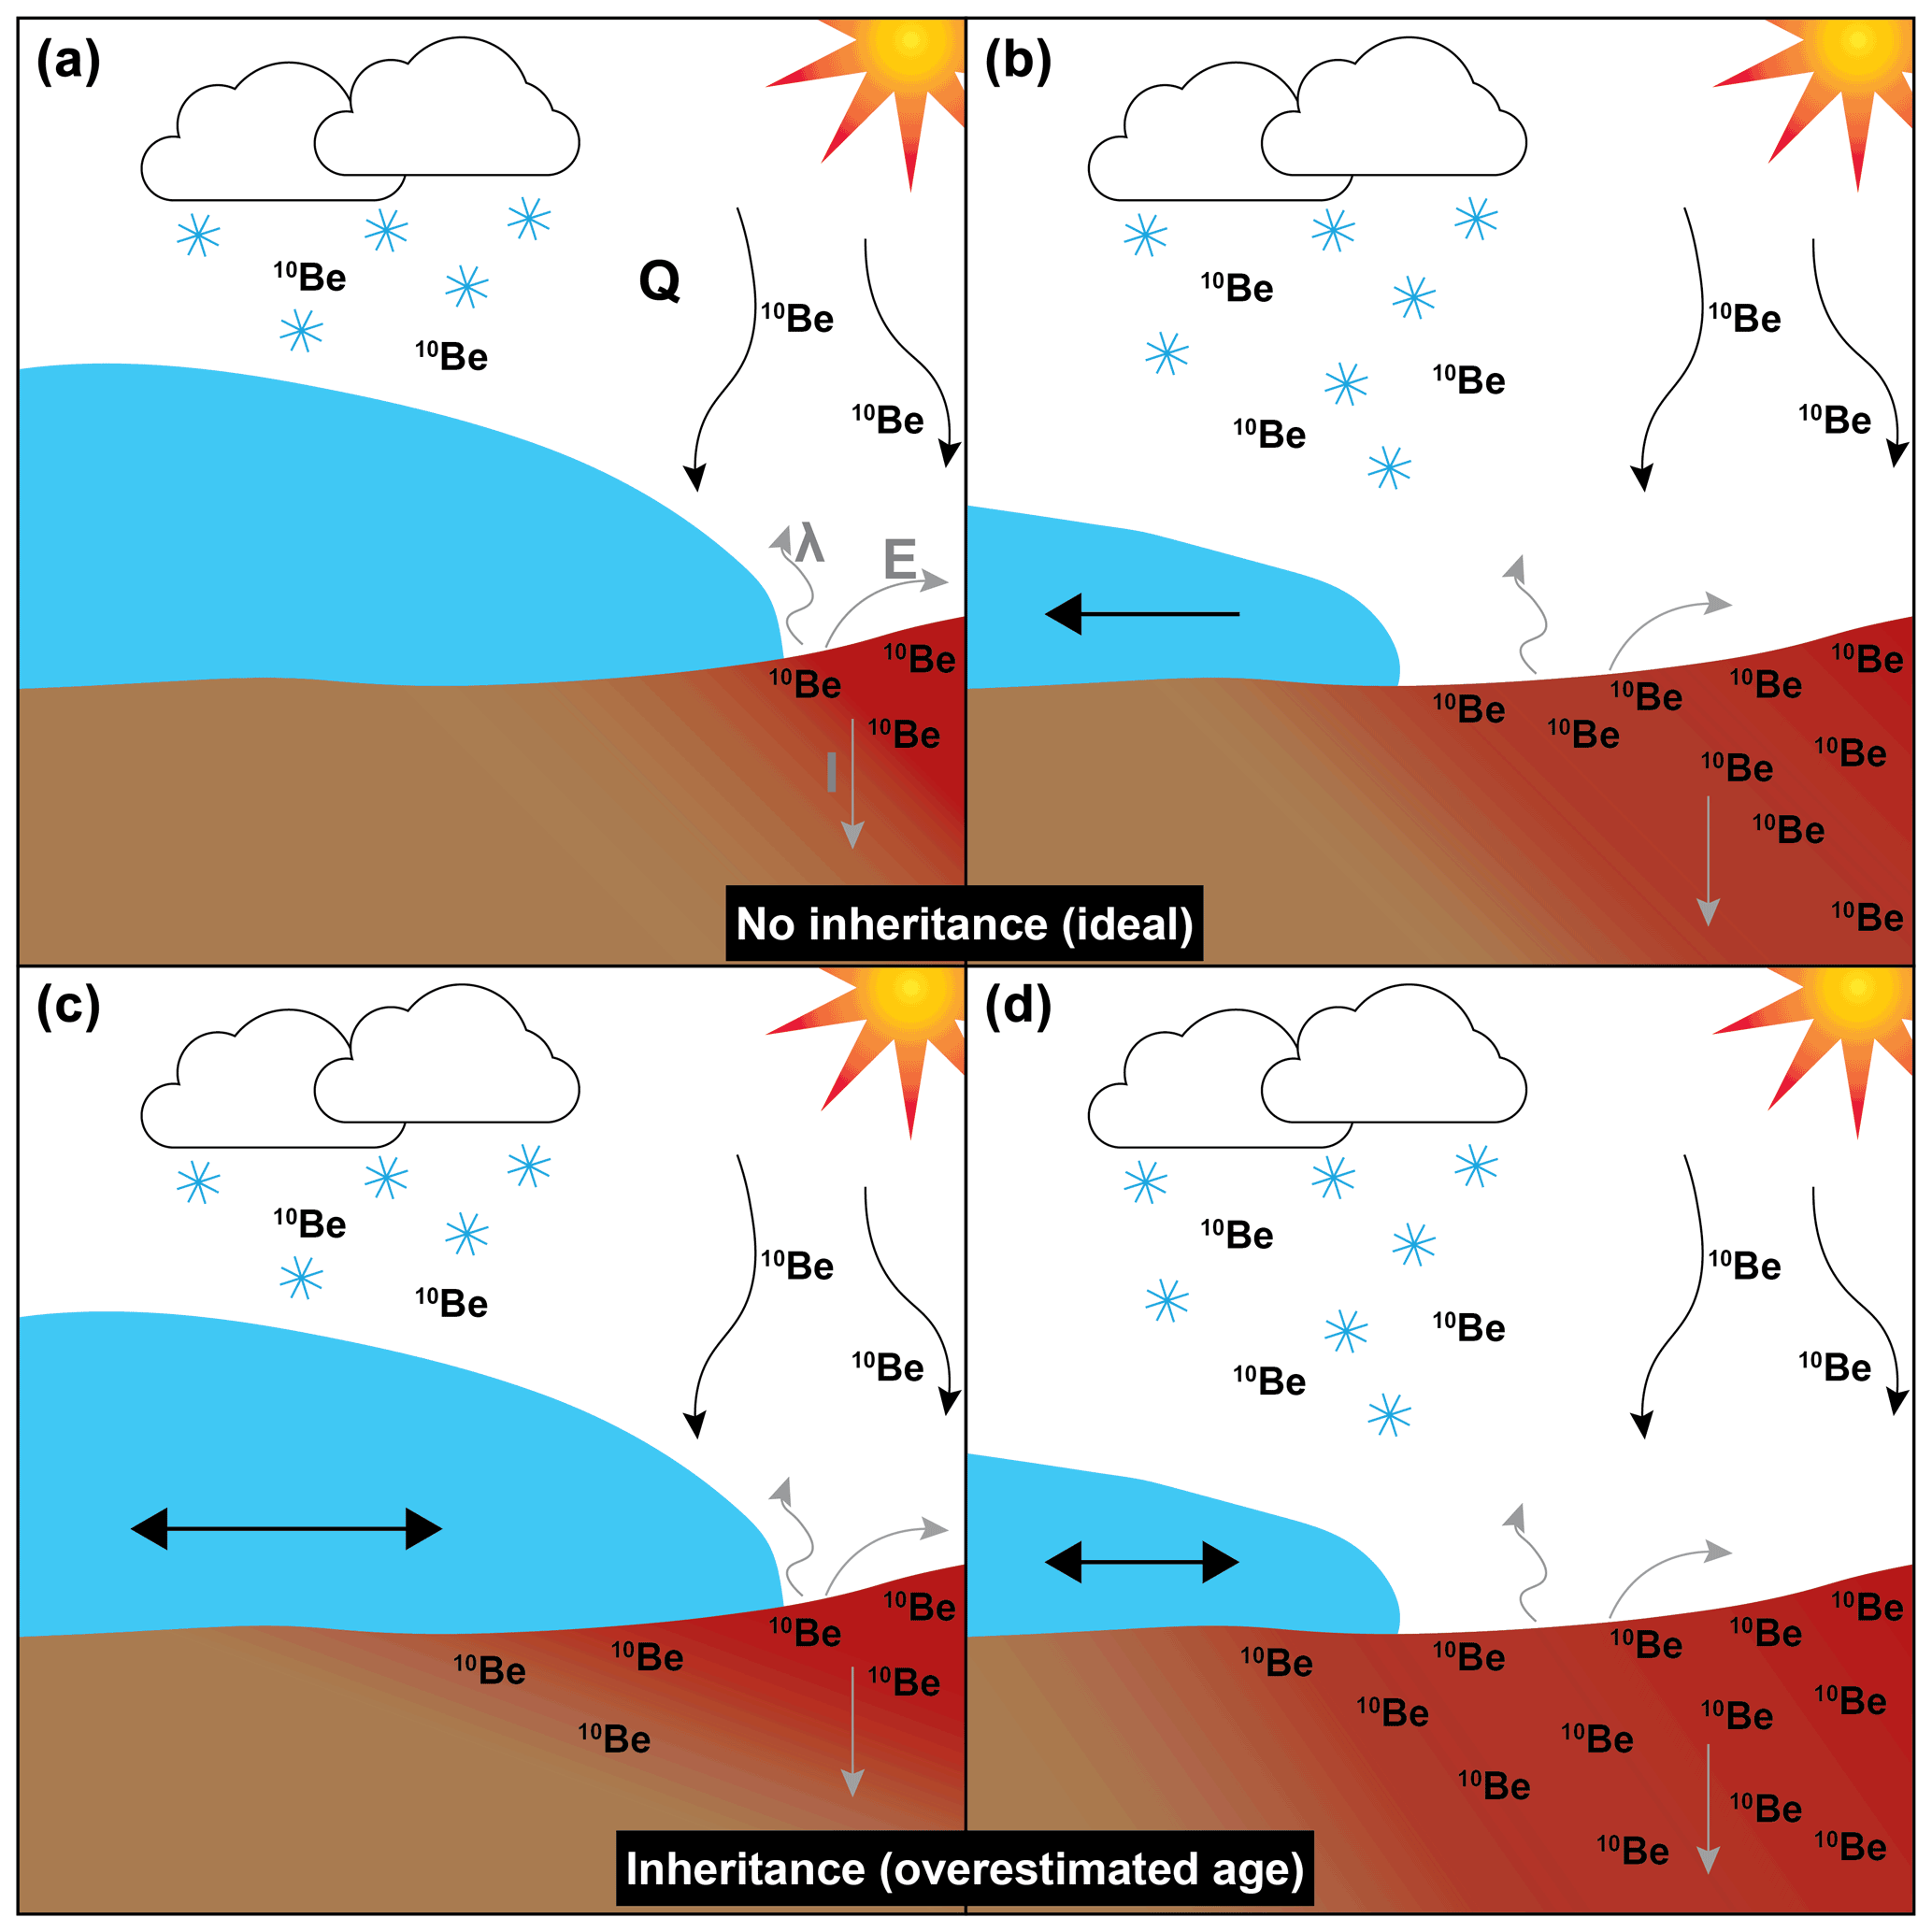
Figure 3Conceptual diagram of meteoric 10Be accumulation in soils during glacial advance and retreat. In “ideal” conditions, 10Be accumulates in exposed soils by wet deposition (with snow) and dry deposition (by gravity as indicated by black arrows), and 10Be concentrations beneath the glacier are negligible at background levels (a). As the glacier retreats, 10Be can begin accumulating in the recently exposed soil (b) and an inventory can be measured to calculate exposure duration. In the case in which the glacier has waxed and waned numerous times and the soils already contain a non-negligible “inheritance” concentration of 10Be, the inventories would need to be corrected for 10Be inheritance (c–d) to accurately determine exposure duration. Q represents of the flux of 10Be to the surface, λ represents radioactive decay of 10Be, E represents erosion, and I represents the migration of 10Be from the surface to depth.
4.3 Meteoric 10Be inventory
We developed a mass balance using the fluxes of meteoric 10Be to and from Shackleton Glacier region soils to understand the accumulation of 10Be in glaciated environments (Pavich et al., 1984, 1986). The model assumes that soils that were overlain by glacial ice in the past and are now exposed accumulated less 10Be than soils that were exposed throughout the glacial periods (Fig. 3). The concentration of meteoric 10Be at the surface (N, atoms g−1) per unit of time (dt) is expressed as a function wherein the addition of 10Be is represented as the atmospheric flux to the surface (Q, atoms cm−2 yr−1), and removal is due to both radioactive decay, which is represented by a disintegration constant (λ, yr−1), and erosion (E, cm yr−1) (Eq. 1). Particle mobility into the soil column is represented by a diffusion constant (D, cm2 yr−1). The differential in depth is represented by dz.
We accounted for uncertainties regarding 10Be migration in the soil column by calculating the inventory (I, atoms cm−2) of the soil (Eq. 2) (Pavich et al., 1986). We used a density (ρ) of 2 g cm−3 and assumed that Q had not changed systematically over the accumulation interval. The inventory is the total sum of meteoric 10Be atoms in the soil profile, and the change in inventory due to deposition, decay, and surface erosion is related to surface exposure duration (Eq. 3).
Meteoric 10Be concentrations typically decrease with depth until they reach a “background” level (Graly et al., 2010). The background is identified as the point at which the concentration of meteoric 10Be is constant with depth (). Typically, the background values can be used to calculate an initial inventory (Ii, atoms cm−2) using Eq. (4), where Nz is the 10Be concentration (atoms g−1) at the bottom of the profile (z, cm). In this case, we assume that the initial concentration of meteoric 10Be is isotropic. However, an accurate initial inventory can only be determined for soil profiles that are deep enough to capture background concentrations. This may not be the case in areas of permafrost where 10Be is restricted to the active layer (Bierman et al., 2014).
Additionally, the initial inventory can be influenced by repeated glacier advance and retreat during glacial–interglacial cycles. For this case, the soil has “inherited” 10Be during each subsequent exposure to the atmosphere, some of which may have been removed with eroded soil (Fig. 3c and d). For constructional landforms, such as moraines, the inheritance is equal to the background and/or initial inventory. Without information on drift sequences, it is difficult to correct the measured inventory for inheritance by distinguishing meteoric 10Be that was deposited after the most recent ice retreat from 10Be that was deposited during previous interglacial periods.
5.1 Depth profile composition and concentrations of meteoric 10Be
Sediment grain size is similar among the three soil profiles collected from Roberts Massif, Bennett Platform, and Thanksgiving Valley; the soils are primarily comprised of sand-sized particles, with less silt-sized and smaller material (Fig. 4). The proportions of silt and gravel are similar at Roberts Massif, although the majority of the profile is sand-sized. Thanksgiving Valley has the coarsest material, while Bennett Platform has a more even grain size distribution. The deepest profile is from Thanksgiving Valley, while the Roberts Massif and Bennett Platform profiles are half the depth. All three profiles are ice-cemented at the bottom and are shallow compared those collected from the McMurdo Dry Valleys (Dickinson et al., 2012; Schiller et al., 2009; Valletta et al., 2015), though they are comparable to profiles collected at Roberts Massif by Graham et al. (1997).
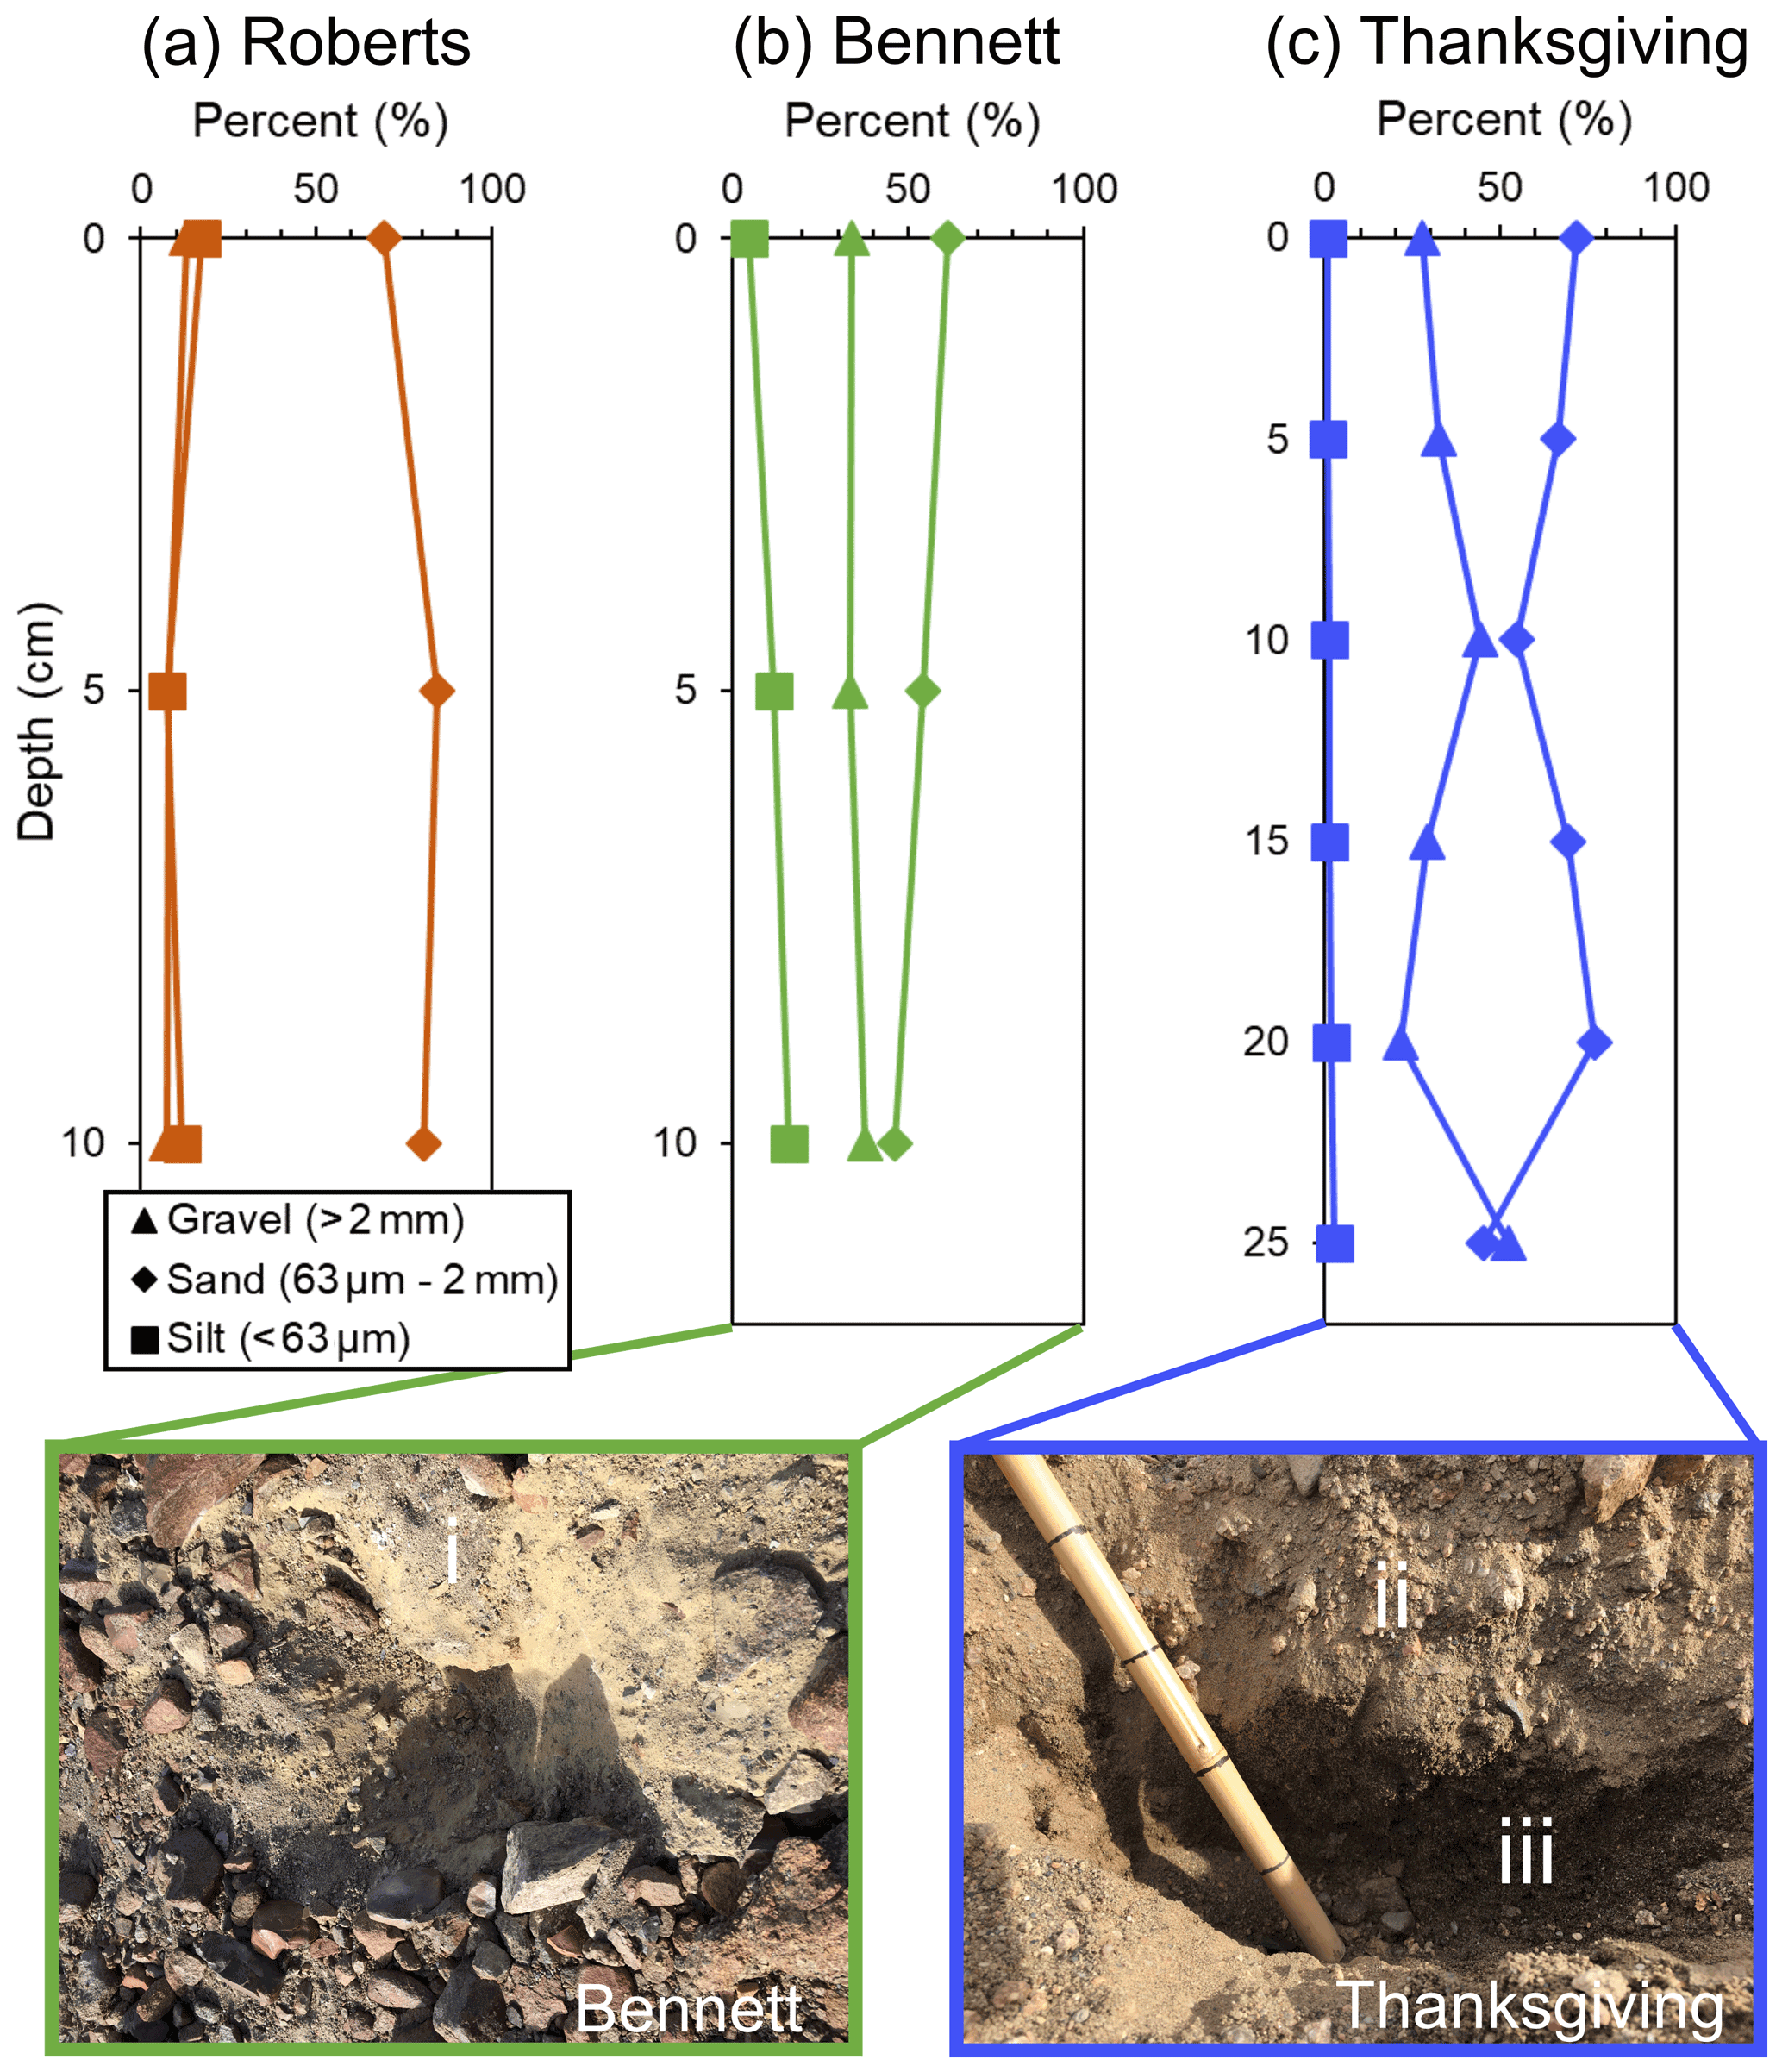
Figure 4The grain size composition of soil profiles collected from Roberts Massif (a, orange), Bennett Platform (b, green), and Thanksgiving Valley (c, blue). The soil pits from Bennett Platform and Thanksgiving Valley are also shown with distinct soil horizons. The different soil horizons observed at Bennett Platform and Thanksgiving Valley are indicated by i, ii, and iii.
Concentrations of meteoric 10Be for both surface and depth profile samples span more than an order of magnitude in the Shackleton Glacier region and range from 2.9×10⁸ atoms g−1 at Mount Speed to 73×108 atoms g−1 at Roberts Massif (Fig. 5; Table 1). At individual sites where samples were collected at two locations, concentrations are typically highest for the samples furthest from the glacier, with notable exceptions at Roberts Massif and Thanksgiving Valley (Fig. 5). This trend is expected since our sampling plan was designed to capture both recently exposed soils (near the glacier(s)) and soils which exposed throughout the LGM and possibly other glacial periods. The measured inventories (Eq. 2) vary from 0.57×10¹¹ atoms at Bennett Platform to 1.5×10¹¹ atoms at Roberts Massif (Table 3).

Figure 5Spatial distribution of surface meteoric 10Be concentrations in the Shackleton Glacier region (a). Where possible, two samples were collected at each location to represent surfaces closest to the glacier, which might have been glaciated during recent glacial periods, and samples furthest from the glacier that are likely to have been exposed during recent glacial periods. Insets of Roberts Massif (b), Bennett Platform (c), and Thanksgiving Valley (d) are included, as these locations have both 10Be and depth profile data. Base maps were provided by the Polar Geospatial Center.
Table 3Estimated exposure durations using the relationship between maximum 10Be concentration and the calculated inventory; see Fig. 7 (Graly et al., 2010).
* Outside the model range.
The meteoric 10Be depth profiles differ between Roberts Massif, Bennett Platform, and Thanksgiving Valley. The profile from Roberts Massif has the highest overall concentrations (Fig. 6). Within the profile, the 5–10 cm sampling interval has the highest concentration, followed by the bottom of the profile, then the surface. The profile behavior for Thanksgiving Valley is similar, though the differences in concentrations within both profiles are relatively small. Bennett Platform is the only location where the surface concentration is the highest compared to the remainder of the profile and the concentration decreases with depth (Fig. 6). Although we sampled the entirety of the active layer where modern particle mobility throughout the soil column occurs, no depth profiles appear to decrease to the background levels needed to calculate an initial meteoric 10Be inventory (Eq. 4). As a result, we are not able to correct the measured inventory for background 10Be, nor are we able estimate the inherited 10Be concentration in the soil.

Figure 6Soil profiles of meteoric 10Be concentrations for Roberts Massif (orange), Bennett Platform (green), and Thanksgiving Valley (blue) compared to profiles from the Antarctic (Dickinson et al., 2012∗; Schiller et al., 2009†; Valletta et al., 2015‡) and Arctic (Bierman et al., 2014§; Ebert et al., 2012¶) (a). The 10Be concentration profiles were also compared to concentration profiles (b).
5.2 Variability of
Measured concentrations of span 4 orders of magnitude across the seven depth profiles we sampled (Fig. 6; Table 1). The lowest concentration is from Mt. Franke of ∼1 µg g−1; the highest concentration is from Roberts Massif of 15 mg g−1. In addition, similar to the meteoric 10Be profiles, the concentrations are highest for the samples that were collected furthest from the coast and at the highest elevations (Table 1). In general, the profiles from Roberts Massif and Thanksgiving Valley are similar (Fig. 6b); 10Be and concentrations are highest just below the surface in the 5–10 cm interval and are fairly consistent throughout the profile. The depth profile mirrors the 10Be profile at Bennett Platform; while 10Be concentration decreases with depth, the concentration increases with depth.
Since we measured concentrations for all seven depth profiles we collected, we compare the profile concentrations and shapes from the four profiles without 10Be depth measurements (Mt. Augustana, Schroeder Hill, Mt. Franke, and Mt. Heekin) to the Roberts Massif, Bennett Platform, and Thanksgiving Valley profiles with both measurements (Fig. 6). Most of the profiles do not significantly change with depth and are similar to the profile from Thanksgiving Valley, though Schroeder Hill is most similar to Roberts Massif (Fig. 6). This is unsurprising given the similar latitudes, surface features, and environmental conditions between the different locations (e.g., high-latitude hyper-arid vs. lower-latitude with possible evidence of wetter conditions) (Fig. 1; Table 2). No other location had large terminal moraines as observed at Bennett Platform.
The Shackleton Glacier region soil profiles and surface samples have some of the highest meteoric 10Be concentrations (∼109 atoms g−1) measured to date in Earth's polar regions (Fig. 6a). Though our profiles are shallower than profiles from the MDV and Victoria Land in Antarctica (Dickinson et al., 2012; Schiller et al., 2009; Valletta et al., 2015) and Sweden and Alaska in the Arctic (Bierman et al., 2014; Ebert et al., 2012), the soils from these previous studies reached background concentrations of 10Be within the top 40 cm, which is close to our maximum depth of 30 cm at Thanksgiving Valley. For comparison, the deepest profile collected by Graham et al. (1997) at Roberts Massif was 36 cm. The Bennett Platform soil profile is most similar to the soil profiles from other regions in Antarctica, as they have decreasing 10Be concentrations with depth, while Thanksgiving Valley and Roberts Massif are relatively homogenous and more similar to profiles from the Arctic.
The inventories from this study are also among the highest calculated for Antarctic soils. The inventories from Bennett Platform and Thanksgiving Valley are most similar (∼1010) to inventories of saprolites and tills from Sweden (Ebert et al., 2012) and the MDV (Schiller et al., 2009), though they are higher than those measured from other high-elevation inland locations in Victoria Land (Dickinson et al., 2012; Valletta et al., 2015). Our inventory from Roberts Massif is the same as the inventory reported for a nearby location by Graham et al. (1997), and all of our inventories are within the range of values from the Arctic (Bierman et al., 2014), despite shallower profiles.
6.1 Relationships between meteoric 10Be and and governing processes
Previous studies have proposed that atmosphere-derived salt concentrations at the surface may correlate with exposure ages and wetting ages in Antarctica (Everett, 1971; Graham et al., 1997, 2002; Graly et al., 2018; Lyons et al., 2016; Schiller et al., 2009). Graly et al. (2018) showed that, in particular, water-soluble and boron exhibited the strongest relationships with exposure age (R2=0.9 and 0.99, respectively). Lyons et al. (2016) used concentrations to estimate the amount of time since the soils were last wetted, and Graham et al. (2002) attempted to calculate exposure ages using the inventory of in the soil. Graly et al. (2018) argue that boron is the preferable exposure proxy due to concerns related to mobility under subarid conditions (e.g., Frey et al., 2009; Michalski et al., 2005) and given that uncertainties in local accumulation rates and ion transport can result in inaccurate ages when using alone (Graham et al., 2002; Schiller et al., 2009). Based on the results presented here for hyper-arid CTAM ice-free regions and the concerns with boron mobility depending on whether the B species present in the soils is (borate) or H3BO3 (boric acid), we suggest that is suitable for interpreting wetting and disturbance histories.
Both meteoric 10Be and are sourced from atmospheric deposition in the Shackleton Glacier region, and there appears to be a relationship between the two constituents in the soil profiles (Fig. 6b). A similar relationship between soluble salts and meteoric 10Be was previously documented at Roberts Massif (Graham et al., 1997). is highly mobile in wetter systems, while 10Be is less mobile under circumneutral pH. Given sustained hyper-arid conditions, minimal landscape disturbance, and negligible biologic activity, one can expect meteoric 10Be and to be correlated throughout a depth profile given the similar accumulation mechanism (Everett, 1971; Graham et al., 1997). Further, their inventories (Eq. 2) should increase monotonically with exposure duration. Deviations from this expected relationship could be due to (1) soil wetting, either in the present or past, (2) deposition of sediment with different 10Be to ratios compared to the depositional environment, (3) changes in the flux of either 10Be or with time, and (4) additional loss of due to denitrification or volatilization. The latter two mechanisms are likely minor processes; however, deposition fluxes are known to be spatially variable (Jackson et al., 2016; Lyons et al., 1990). As described above, Roberts Massif, Bennett Platform, and Thanksgiving Valley were selected for further investigation as locations which may represent different depositional environments: hypothesized hyper-aridity, recent glacial activity with large moraines, and active hydrology, respectively. By comparing differences in the expected and observed relationship between 10Be and , we can infer the processes that have influenced their relationship.
Implications for landscape disturbance and paleoclimate
Our work demonstrates that and 10Be are correlated in much of the Shackleton Glacier region and that the soil profiles can inform our understanding of surficial processes and soil wetting for the region. Exposure age and cosmogenic nuclide data from across Antarctica show that a polar desert regime began in the mid-Miocene and has persisted into modern time (Lewis et al., 2008; Marchant et al., 1996; Spector and Balco, 2020; Valletta et al., 2015). Additionally, Barrett (2013) provides a detailed review of studies focused on Antarctic glacial history, particularly centered around the “stabilist vs. dynamicist” debate concerning the overall stability of the EAIS. Interpreting 40+ years of data from published literature, it is concluded that the EAIS is stable in the interior with retreat occurring along the margins, including at outlet glaciers (Golledge et al., 2012). Given these findings, we would expect and meteoric 10Be concentrations to be correlated in hyper-arid Antarctic soils, such as those from the Shackleton Glacier region, as both constituents are derived from atmospheric deposition with minimal alteration at the surface. The major differences between the two concern transport mechanisms; meteoric 10Be transport is limited by clay particle mobility, and is mobile upon soil wetting.
If we assume an “ideal” situation in which an undisturbed hyper-arid soil has accumulated meteoric 10Be (Fig. 3a and b), 10Be concentrations would be highest at the surface and eventually decrease to background levels at depth. None of the profiles we sampled and measured for meteoric 10Be and reached background concentrations. All profiles had an active layer much shallower than those from the MDV (Graham et al., 2002; Schiller et al., 2009; Valletta et al., 2015). This indicates that the active layer may have deepened and shallowed throughout time, and modern 10Be mobility is limited to the top ∼20 cm for most of the Shackleton Glacier region. Though clay particle translocation by percolating water can explain the correlated behavior of 10Be and at Roberts Massif and Thanksgiving Valley, it is unlikely that the region had sufficient precipitation for significant percolation over the last 14 Myr given the high concentrations (Menzies et al., 2006). The concentrations of fine particles in the soil profiles also do not change significantly with depth, as would be expected if large precipitation or melt events were frequent (Fig. 4). Additionally, the soil horizons are moderately well defined (Fig. 4), suggesting minimal cryoturbation.
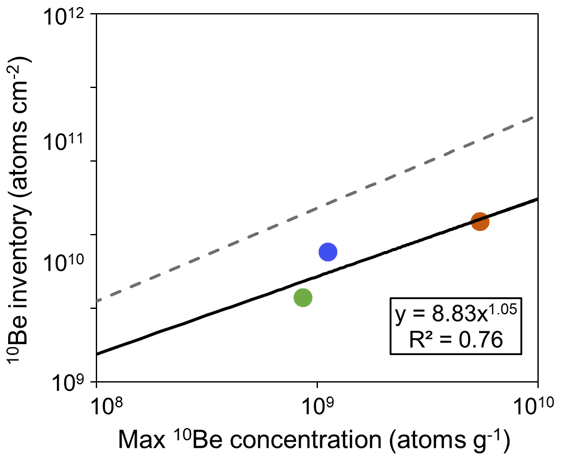
Figure 7Relationship between the measured maximum (or surface) meteoric 10Be concentration and the calculated inventory (Eq. 2). This relationship is used to infer 10Be inventories given a maximum or surface concentration (Graly et al., 2010). The solid black line is the power relationship between concentration and inventory, while the dashed grey line is the regression from Graly et al. (2010).
Similar to Arena Valley and Wright Valley in the MDV (Graham et al., 2002; Schiller et al., 2009), concentrations are highest just beneath the surface at Roberts Massif, indicating shallow salt migration under an arid climate. These data indicate that the samples furthest inland at Roberts Massif and Thanksgiving Valley have been fairly undisturbed since at least the middle to late Pleistocene given the estimates of exposure duration (see Sect. 6.2). Since the meteoric 10Be and profiles at Bennett Platform are mirrored, we argue that the difference could be due to (1) additional 10Be delivery or (2) enhanced transport. Bennett Platform was the only location we sampled on a large moraine (Fig. 2c), and as a constructional landform we would expect 10Be to be highest at the surface and decrease to background concentrations. This is generally the observed behavior. The profile behavior is similar to those throughout the Shackleton Glacier region, though the concentrations continue to increase with depth, possibly indicating some percolation of -rich brine. What may be considered the “anomalous” data point is the surface concentration of meteoric 10Be. Even though we sampled a constructional landform, the sample was collected between two boulder lines in a small, local depression (∼1 m) (Table 2). It is probably no coincidence that this location also has the greatest proportion of fine-grained material in the soil profile. The two boulder lines impede wind flow and act as a sediment and snow trap, possibly resulting in a higher concentration of meteoric 10Be than expected simply from atmospheric deposition. The snow in the depression may also aid in transport when melted. In this case, additional sediment-laden 10Be deposition (superseding any erosion) and/or possible salt transport need to be considered to accurately date the moraine.
6.2 Attempt at inferring surface exposure duration approximation and thoughts on glacial history
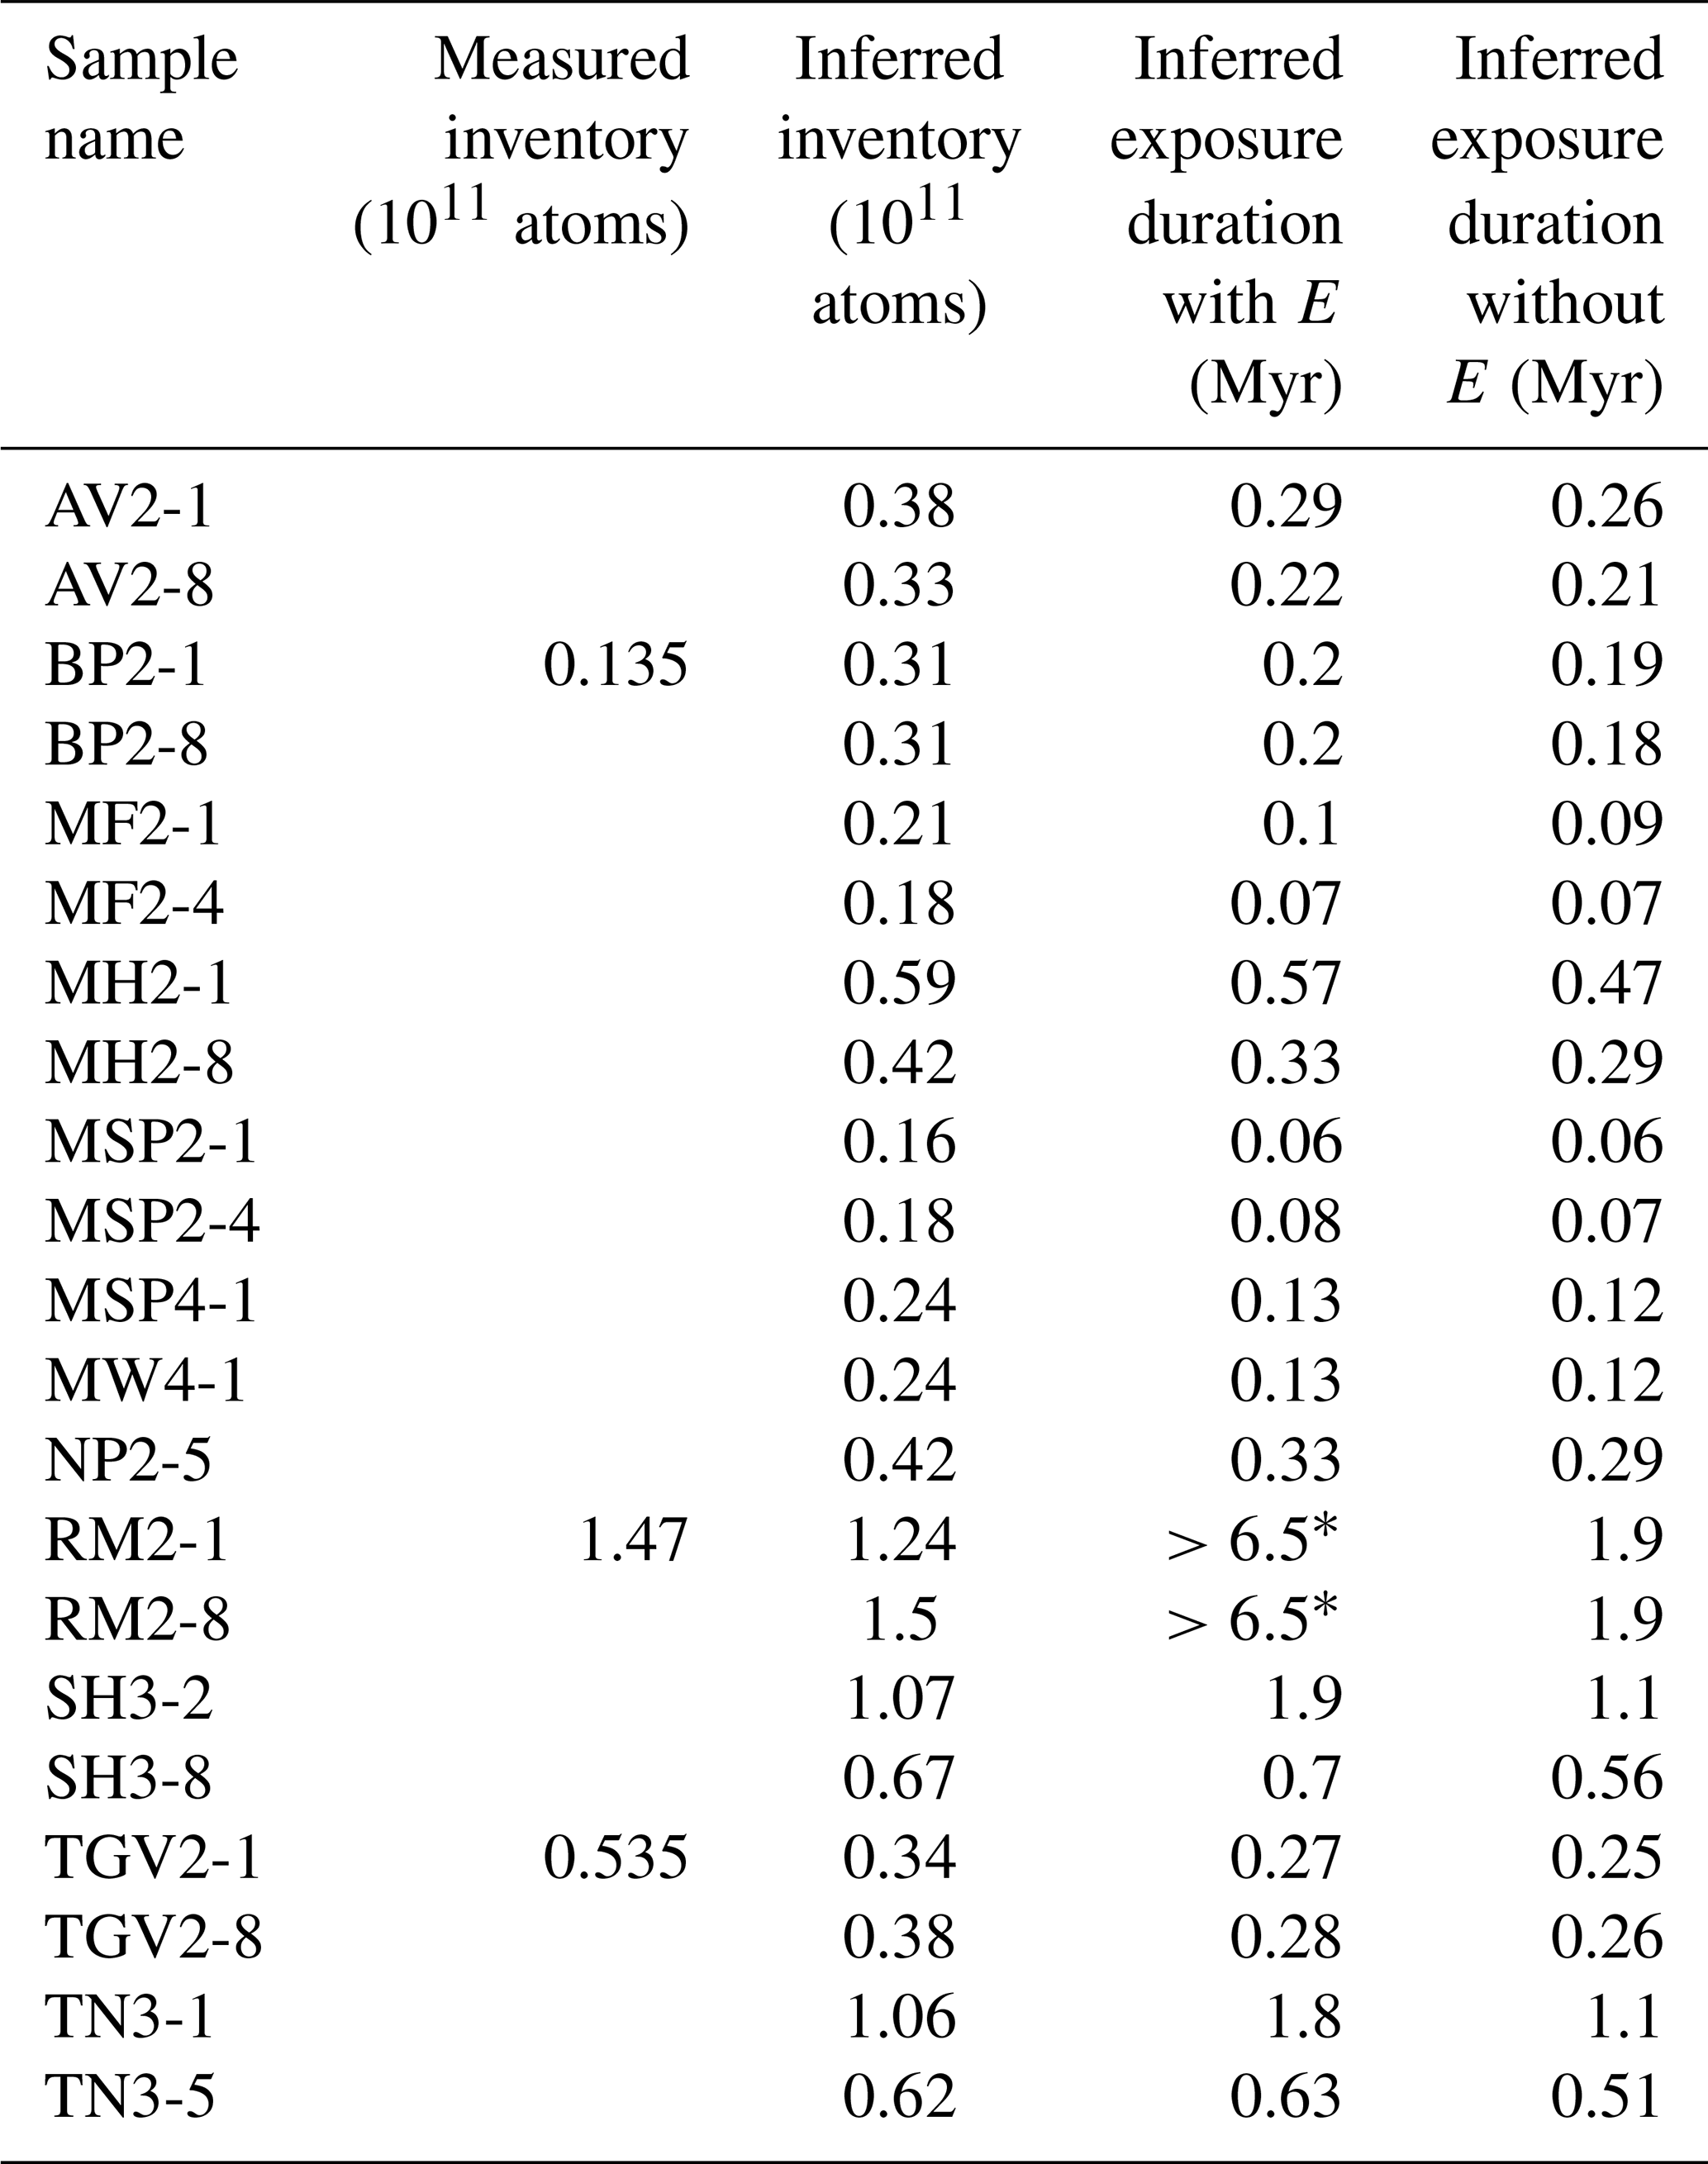
We used the relationship between the maximum meteoric 10Be concentration in the soil profile and the meteoric 10Be inventory (Graly et al., 2010) to speculatively infer 10Be inventories and estimate maximum exposure durations for all 11 locations with and without erosion using Eq. (5) (Fig. 7; Table 3). As is the case for Roberts Massif and Thanksgiving Valley, the highest 10Be concentrations may not always be at the surface for all locations; however, the relationship is sufficiently strong to provide an estimate of the 10Be inventory and thus an exposure duration estimate.
We did not measure erosion rates in this study. Balter-Kennedy et al. (2020) determined erosion rates for boulders at Roberts Massif, which were less than 2 cm Myr−1. Considering we are investigating soils, we chose a conservative value of 5 cm Myr−1 for our calculations. We selected a 10Be flux value (Q) of 1.3×10⁵ atoms cm−2 per year from Taylor Dome (Steig et al., 1995) due to a climate similar to that of the CTAM and an absence of local meteoric 10Be flux data.
Compared to the measured inventories from Roberts Massif, Bennett Platform, and Thanksgiving Valley (from the 10Be depth profiles; see Sect. 5.1), the inferred inventories differ by ∼16 %–130 %. The inferred exposure estimates with erosion range from 58 kyr to >6.5 Myr, and the estimates without erosion range from 57 kyr to 1.94 Myr for Mt. Speed and Roberts Massif, respectively (Fig. 8; Table 3). With the exception of Roberts Massif, Thanksgiving Valley, and Mt. Speed, the oldest surfaces are those which we sampled furthest from the glacier, which is consistent with our sampling methodology to capture younger and older soils. The sample from Roberts Massif collected closest to the glacier has an estimated exposure duration that is outside the model limits (>6.5 Myr).

Figure 8Inferred surface exposure durations versus distance from the coast (a) and elevation (b), with (black) and without (blue) an assumed erosion term. Upward-facing triangles are samples collected furthest from the glacier, while downward triangles are samples collected closest to the glacier.
The youngest surfaces we sampled from the Shackleton Glacier region are those from the lowest elevations and closest to the Ross Ice Shelf (Fig. 8). This is generally consistent with previous glacial modeling studies, which show that the greatest fluctuations in glacier height during the LGM were along outlet glacier and ice shelf margins (Golledge et al., 2012; Mackintosh et al., 2011, 2014). Given the low erosion rates throughout Antarctica (Balter-Kennedy et al., 2020; Ivy-Ochs et al., 1995; Morgan et al., 2010) and possibly low background concentrations of meteoric 10Be (Dickinson et al., 2012; Schiller et al., 2009; Valletta et al., 2015), the Mt. Speed, Mt. Wasko, and Mt. Franke samples were all likely covered by Shackleton Glacier during the LGM, as were the lower-elevation, near-glacier samples from Mt. Heekin, Bennett Platform, and Mt. Augustana. The soils from Schroeder Hill and Roberts Massif have likely been exposed since the early Pleistocene (Fig. 8). We also attempted to estimate exposure durations using two additional methods: (1) the measured 10Be inventories for Roberts Massif, Bennett Platform, and Thanksgiving Valley and (2) by calculating 10Be concentrations using regressions of and 10Be for all seven locations with depth profiles, as detailed in the Supplement. These exposure estimates are similar and range from ∼100 kyr at Bennet Platform to <4.5 Myr at Roberts Massif (Fig. S4; Table S3).
Sirius Group deposits were observed at Roberts Massif and were deposited as Shackleton Glacier retreated in this region (Fig. 2a). Evidence for a dynamic EAIS is derived primarily from the diamictite rocks (tills) of the Sirius Group, which are found throughout the TAM and include well-documented outcrops in the Shackleton Glacier region, but their age is unknown (Hambrey et al., 2003). Some of the deposits contain pieces of shrubby vegetation, indicating that the Sirius Group formed under conditions warmer than present with woody plants occupying inland portions of Antarctica (Webb et al., 1984, 1996; Webb and Harwood, 1991). Sparse marine diatoms found in the sediments were initially interpreted as evidence for the formation of the Sirius Group via glacial overriding of the TAM during the warmer Pliocene (Barrett et al., 1992), though it is now argued that the marine diatoms are wind-derived contamination, indicating that the Sirius Group is older (Scherer et al., 2016; Stroeven et al., 1996). We document a large diamictite at site RM2-8 that is underlain by soils with an inferred exposure of at least 1.9 Myr, possibly greater than 6.5 Myr. These exposure duration estimates indicate that the loose Sirius Group diamict was deposited at Roberts Massif at some point after the Pliocene. While these data cannot constrain the age of the formation, we suggest that the diamict could have formed prior to the Pliocene and was transported during the Pleistocene glaciations.
We determined concentrations of meteoric 10Be and in soils from 11 ice-free areas along Shackleton Glacier, Antarctica, which are among the highest measured meteoric 10Be concentrations from the polar regions. Concentrations of meteoric 10Be spanned from 1.9×10⁸ atoms g−1 at Bennett Platform to 73×108 atoms g−1 at Roberts Massif. The concentrations of were similarly variable and ranged from ∼1 µg g−1 near the ice shelf to 15 mg g−1 near the Polar Plateau. In general, the lowest concentrations of 10Be and we measured were at low elevations, near the ice shelf, and closest to the glacier.
Since and 10Be are both derived from atmospheric deposition, we expect the shape of their accumulation profiles to be similar at depth in hyper-arid soils. In general, this was true for Roberts Massif and Thanksgiving Valley, while and 10Be concentrations were mirrored at Bennett Platform. We conclude that much of the southern Shackleton Glacier region has maintained persistent arid conditions since at least the Pleistocene, though the region may have been warmer and wetter in the past, as evidenced by the presence of the Sirius Group diamict. The onset of aridity is particularly important in understanding refugia and ecological succession in TAM soils. Since parts of the region have remained hyper-arid and undisturbed for upwards of a few million years, prolonged exposure has resulted in the accumulation of salts at high concentrations in the soils. It is an enigma how soil organisms have persisted throughout glacial–interglacial cycles. However, it is possible that organisms have survived near the glacier at locations like Mt. Augustana, where glacial advance appears to have been minimal during the LGM, but seasonal summer melt has the potential to solubilize salts.
Overall, our data show that the relatively youngest soils we sampled were at lower elevations near the Shackleton Glacier terminus and lower elevations further inland (typically near the glacier). Inferred estimates range from 57 kyr (though likely post LGM when corrected) to 1.94 Myr, possibly >6.5 Myr with erosion. Our sampling scheme was successful in capturing a range of surface exposure durations, which can contribute to growing archives for the CTAM. There are outstanding issues regarding inheritance dynamics of meteoric 10Be in disturbed environments, particle erosion and deposition rates, and mobility. We hope that future studies will further evaluate the relationship between water-soluble salts (e.g., ) and meteoric 10Be as a proxy for landscape disturbance and exposure age.
The datasets generated for this study are included in the article or Supplement. The meteoric 10Be data are stored with the US Antarctic Program Data Center (https://doi.org/10.15784/601421; Diaz et al., 2021).
The supplement related to this article is available online at: https://doi.org/10.5194/esurf-9-1363-2021-supplement.
The project was designed and funded by BJA, DHW, IDH, NF, and WBL. Fieldwork was conducted by BJA, DHW, IDH, NF, and MAD. LBC, PRB, and MAD prepared the samples for meteoric 10Be analysis, and MAD analyzed the samples for . MAD wrote the article with contributions and edits from all authors.
The authors declare that they have no conflict of interest.
Publisher's note: Copernicus Publications remains neutral with regard to jurisdictional claims in published maps and institutional affiliations.
We thank the United States Antarctic Program (USAP), Antarctic Science Contractors (ASC), Petroleum Helicopters Inc. (PHI), and Marci Shaver-Adams for logistical and field support. We especially thank Marc Caffee and the Purdue University PRIME Lab for their assistance with AMS measurements. Additionally, we thank Andrew Christ at the University of Vermont for thoughtful discussions and Sue Welch and Daniel Gilbert at The Ohio State University for help with initial laboratory analyses. We appreciate the detailed and thoughtful suggestions and edits from Brent Goehring and an anonymous reviewer, which have greatly improved this paper. This work was supported by NSF OPP grants 1341631 (WBL), 1341618 (DHW), 1341629 (NF), 1341736 (BJA), and NSF-DGE 1840280 (GRFP) (MAD), as well as a PRIME Lab seed proposal (MAD). Sample preparation and LBC's time were supported by NSF EAR 1735676. Geospatial support for this work was provided by the Polar Geospatial Center under NSF OPP grants 1043681 and 1559691.
This research has been supported by the Office of Polar Programs (grant nos. 1341631, 1341629, 1341736) and the National Science Foundation Divisions of Graduate Education and Earth Sciences (grant nos. 60041697 and 1735676).
This paper was edited by Arjen Stroeven and reviewed by Brent Goehring and one anonymous referee.
Ackert, R. P. and Kurz, M. D.: Age and uplift rates of Sirius Group sediments in the Dominion Range, Antarctica, from surface exposure dating and geomorphology, Global Planet. Change, 42, 207–225, https://doi.org/10.1016/j.gloplacha.2004.02.001, 2004.
Anderson, J. B., Shipp, S. S., Lowe, A. L., Wellner, J. S., and Mosola, A. B.: The Antarctic Ice Sheet during the Last Glacial Maximum and its subsequent retreat history: a review, Quaternary Sci. Rev., 21, 49–70, https://doi.org/10.1016/S0277-3791(01)00083-X, 2002.
Augustin, L., Barbante, C., Barnes, P. R. F., Barnola, J. M., Bigler, M., Castellano, E., Cattani, O., Chappellaz, J., Dahl-Jensen, D., Delmonte, B., Dreyfus, G., Durand, G., Falourd, S., Fischer, H., Flückiger, J., Hansson, M. E., Huybrechts, P., Jugie, G., Johnsen, S. J., Jouzel, J., Kaufmann, P., Kipfstuhl, J., Lambert, F., Lipenkov, V. Y., Littot, G. C., Longinelli, A., Lorrain, R., Maggi, V., Masson-Delmotte, V., Miller, H., Mulvaney, R., Oerlemans, J., Oerter, H., Orombelli, G., Parrenin, F., Peel, D. A., Petit, J. R., Raynaud, D., Ritz, C., Ruth, U., Schwander, J., Siegenthaler, U., Souchez, R., Stauffer, B., Steffensen, J. P., Stenni, B., Stocker, T. F., Tabacco, I. E., Udisti, R., van de Wal, R. S. W., van den Broeke, M., Weiss, J., Wilhelms, F., Winther, J. G., Wolff, E. W., and Zucchelli, M.: Eight glacial cycles from an Antarctic ice core, Nature, 429, 623–628, https://doi.org/10.1038/nature02599, 2004.
Balter-Kennedy, A., Bromley, G., Balco, G., Thomas, H., and Jackson, M. S.: A 14.5-million-year record of East Antarctic Ice Sheet fluctuations from the central Transantarctic Mountains, constrained with cosmogenic 3He, 10Be, 21Ne, and 26Al, The Cryosphere, 14, 2647–2672, https://doi.org/10.5194/tc-14-2647-2020, 2020.
Barrett, P. J.: Resolving views on Antarctic Neogene glacial history – The Sirius debate, Earth Environ. Sci. Trans. R. Soc. Edinburgh, 104, 31–53, https://doi.org/10.1017/S175569101300008X, 2013.
Barrett, P. J., Adams, C. J., McIntosh, W. C., Swisher, C. C., and Wilson, G. S.: Geochronological evidence supporting Antarctic deglaciation three million years ago, Nature, 359, 816–818, 1992.
Bierman, P. R., Corbett, L. B., Graly, J. A., Neumann, T. A., Lini, A., Crosby, B. T., and Rood, D. H.: Preservation of a Preglacial Landscape Under the Center of the Greenland Ice Sheet, Science, 344, 402–405, https://doi.org/10.4159/harvard.9780674430501.c21, 2014.
Bockheim, J. G.: Landform and Soil Development in the McMurdo Dry Valleys, Antarctica: A Regional Synthesis, Arctic, Antarct. Alp. Res., 34, 308–317, https://doi.org/10.1080/15230430.2002.12003499, 2002.
Bromley, G. R. M., Hall, B. L., Stone, J. O., Conway, H., and Todd, C. E.: Late Cenozoic deposits at Reedy Glacier, Transantarctic Mountains: implications for former thickness of the West Antarctic Ice Sheet, Quaternary Sci. Rev., 29, 384–398, https://doi.org/10.1016/j.quascirev.2009.07.001, 2010.
Brown, E. T., Edmond, J. M., Raisbeck, G. M., Bourlès, D. L., Yiou, F., and Measures, C. I.: Beryllium isotope geochemistry in tropical river basins, Geochim. Cosmochim. Ac., 56, 1607–1624, https://doi.org/10.1016/0016-7037(92)90228-B, 1992.
Cary, S. C., McDonald, I. R., Barrett, J. E., and Cowan, D. A.: On the rocks: The microbiology of Antarctic Dry Valley soils, Nat. Rev. Microbiol., 8, 129–138, https://doi.org/10.1038/nrmicro2281, 2010.
Claridge, G. G. C. and Campbell, I. B.: Origin of nitrate deposits, Nature, 217, 428–430, https://doi.org/10.1038/217428a0, 1968a.
Claridge, G. G. C. and Campbell, I. B.: Soils of the Shackleton glacier region, Queen Maud Range, Antarctica, New Zeal. J. Sci., 11, 171–218, 1968b.
Claridge, G. G. C. and Campbell, I. B.: Salts in Antarctic soils, their distribution and relationship to soil processes, Soil Sci., 123, 377–384, 1977.
Clark, P. U., Dyke, A. S., Shakun, J. D., Carlson, A. E., Clark, J., Wohlfarth, B., Mitrovica, J. X., Hostetler, S. W., and McCabe, A. M.: The Last Glacial Maximum, Science, 325, 710–714, https://doi.org/10.1126/science.1172873, 2009.
Collins, G. E., Hogg, I. D., Convey, P., Sancho, L. G., Cowan, D. A., Lyons, W. B., Adams, B. J., Wall, D. H., and Green, T. G. A.: Genetic diversity of soil invertebrates corroborates timing estimates for past collapses of the West Antarctic Ice Sheet, P. Natl. Acad. Sci. USA, 117, 22293–22302, https://doi.org/10.1073/pnas.2007925117, 2020.
Convey, P., Gibson, J. A. E., Hillenbrand, C. D., Hodgson, D. A., Pugh, P. J. A., Smellie, J. L., and Stevens, M. I.: Antarctic terrestrial life – Challenging the history of the frozen continent?, Biol. Rev., 83, 103–117, https://doi.org/10.1111/j.1469-185X.2008.00034.x, 2008.
Diaz, M. A., Li, J., Michalski, G., Darrah, T. H., Adams, B. J., Wall, D. H., Hogg, I. D., Fierer, N., Welch, S. A., Gardner, C. B., and Lyons, W. B.: Stable isotopes of nitrate, sulfate, and carbonate in soils from the Transantarctic Mountains, Antarctica: A record of atmospheric deposition and chemical weathering, Front. Earth Sci., 8, 341, https://doi.org/10.3389/feart.2020.00341, 2020.
Diaz, M. A., Corbett, L. B., Bierman, P. R., Adams, B. J., Wall, D. H., Hogg, I. D., Fierer, N., and Lyons, W. B.: Meteoric 10Be data of soils from the Shackleton Glacier region, US Antarctic Program (USAP) Data Center [data set], https://doi.org/10.15784/601421, 2021.
Dickinson, W. W., Schiller, M., Ditchburn, B. G., Graham, I. J., and Zondervan, A.: Meteoric Be-10 from Sirius Group suggests high elevation McMurdo Dry Valleys permanently frozen since 6 Ma, Earth Planet. Sc. Lett., 355–356, 13–19, https://doi.org/10.1016/j.epsl.2012.09.003, 2012.
Ebert, K., Willenbring, J., Norton, K. P., Hall, A., and Hättestrand, C.: Meteoric 10Be concentrations from saprolite and till in northern Sweden: Implications for glacial erosion and age, Quatern. Geochronol., 12, 11–22, https://doi.org/10.1016/j.quageo.2012.05.005, 2012.
Elliot, D. H. and Fanning, C. M.: Detrital zircons from upper Permian and lower Triassic Victoria Group sandstones, Shackleton Glacier region, Antarctica: Evidence for multiple sources along the Gondwana plate margin, Gondwana Res., 13, 259–274, https://doi.org/10.1016/j.gr.2007.05.003, 2008.
Elliot, D. H., Collinson, J. W., and Green, W. J.: Lakes in dry valleys at 85∘ S near Mount Heekin, Shackleton Glacier, Antarct. J. United States, 31, 25–27, 1996.
Everett, K. R.: Soils Of The Meserve Glacier Area, Wright Valley, South Victoria Land, Antarctica, Soil Sci., 112, 425–438, 1971.
Fraser, C. I., Nikula, R., Ruzzante, D. E., and Waters, J. M.: Poleward bound: Biological impacts of Southern Hemisphere glaciation, Trends Ecol. Evol., 27, 462–471, https://doi.org/10.1016/j.tree.2012.04.011, 2012.
Frey, M. M., Savarino, J., Morin, S., Erbland, J., and Martins, J. M. F.: Photolysis imprint in the nitrate stable isotope signal in snow and atmosphere of East Antarctica and implications for reactive nitrogen cycling, Atmos. Chem. Phys., 9, 8681–8696, https://doi.org/10.5194/acp-9-8681-2009, 2009.
Gasson, E., DeConto, R. M., Pollard, D., and Levy, R. H.: Dynamic Antarctic ice sheet during the early to mid-Miocene, P. Natl. Acad. Sci. USA, 113, 3459–3464, https://doi.org/10.1073/pnas.1516130113, 2016.
Golledge, N. R., Fogwill, C. J., Mackintosh, A. N., and Buckley, K. M.: Dynamics of the last glacial maximum Antarctic ice-sheet and its response to ocean forcing, P. Natl. Acad. Sci. USA, 109, 16052–16056, https://doi.org/10.1073/pnas.1205385109, 2012.
Golledge, N. R., Levy, R. H., McKay, R. M., Fogwill, C. J., White, D. A., Graham, A. G. C., Smith, J. A., Hillenbrand, C. D., Licht, K. J., Denton, G. H., Ackert, R. P., Maas, S. M., and Hall, B. L.: Glaciology and geological signature of the Last Glacial Maximum Antarctic ice sheet, Quaternary Sci. Rev., 78, 225–247, https://doi.org/10.1016/j.quascirev.2013.08.011, 2013.
Graham, I., Ditchburn, R. G., Claridge, G. G. G., Whitehead, N. E., Zondervan, A., and Sheppard, D. S.: Dating Antarctic soils using atmospheric derived 10Be and nitrate, R. Soc. New Zeal. Bull., 35, 429–436, 2002.
Graham, I. J., Ditchbum, R. G., Sparks, R. J., and Whitehead, N. E.: 10Be investigations of sediments, soils and loess at GNS, Nucl. Instrum. Meth. Phys. Res. B, 123, 307–318, 1997.
Graly, J. A., Bierman, P. R., Reusser, L. J., and Pavich, M. J.: Meteoric 10Be in soil profiles – A global meta-analysis, Geochim. Cosmochim. Ac., 74, 6814–6829, https://doi.org/10.1016/j.gca.2010.08.036, 2010.
Graly, J. A., Licht, K. J., Druschel, G. K., and Kaplan, M. R.: Polar desert chronologies through quantitative measurements of salt accumulation, Geology, 46, 351–354, https://doi.org/10.1130/G39650.1, 2018.
Gulick, S. P. S., Shevenell, A. E., Montelli, A., Fernandez, R., Smith, C., Warny, S., Bohaty, S. M., Sjunneskog, C., Leventer, A., Frederick, B., and Blankenship, D. D.: Initiation and long-term instability of the East Antarctic Ice Sheet, Nature, 552, 225–229, https://doi.org/10.1038/nature25026, 2017.
Hambrey, M. J., Webb, P. N., Harwood, D. M., and Krissek, L. A.: Neogene glacial record from the Sirius Group of the Shackleton Glacier region, central Transantarctic Mountains, Antarctica, GSA Bull., 115, 994–1015, https://doi.org/10.1130/B25183.1, 2003.
Ivy-Ochs, S., Schluchter, C., Kubik, P. W., Dittrich-Hannen, B., and Beer, J.: Minimum 10Be exposure ages of early Pliocene for the Table Mountain plateau and the Sirius Group at Mount Fleming, Dry Valleys, Antarctica, Geology, 23, 1007–1010, 1995.
Jackson, A., Davila, A. F., Böhlke, J. K., Sturchio, N. C., Sevanthi, R., Estrada, N., Brundrett, M., Lacelle, D., McKay, C. P., Poghosyan, A., Pollard, W., and Zacny, K.: Deposition, accumulation, and alteration of Cl−, , and salts in a hyper-arid polar environment: Mass balance and isotopic constraints, Geochim. Cosmochim. Ac., 182, 197–215, https://doi.org/10.1016/j.gca.2016.03.012, 2016.
Jones, R. S., Mackintosh, A. N., Norton, K. P., Golledge, N. R., Fogwill, C. J., Kubik, P. W., Christl, M., and Greenwood, S. L.: Rapid Holocene thinning of an East Antarctic outlet glacier driven by marine ice sheet instability, Nat. Commun., 6, 9910, https://doi.org/10.1038/ncomms9910, 2015.
Kaplan, M. R., Licht, K. J., Winckler, G., Schaefer, J. M., Bader, N., Mathieson, C., Roberts, M., Kassab, C. M., Schwartz, R., and Graly, J. A.: Middle to Late Pleistocene stability of the central East Antarctic Ice Sheet at the head of Law Glacier, Geology, 45, 963–966, https://doi.org/10.1130/G39189.1, 2017.
Korschinek, G., Bergmaier, A., Faestermann, T., Gerstmann, U. C., Knie, K., Rugel, G., Wallner, A., Dillmann, I., Dollinger, G., von Gostomski, C. L., Kossert, K., Maiti, M., Poutivtsev, M., and Remmert, A.: A new value for the half-life of 10Be by Heavy-Ion Elastic Recoil Detection and liquid scintillation counting, Nucl. Instrum. Meth. Phys. Res. B, 268, 187–191, https://doi.org/10.1016/j.nimb.2009.09.020, 2010.
Lewis, A. R., Marchant, D. R., Ashworth, A. C., Hedenäs, L., Hemming, S. R., Johnson, J. V., Leng, M. J., Machlus, M. L., Newton, A. E., Raine, J. I., Willenbring, J. K., Williams, M., and Wolfe, A. P.: Mid-Miocene cooling and the extinction of tundra in continental Antarctica, P. Natl. Acad. Sci. USA, 105, 10676–10680, https://doi.org/10.1073/pnas.0802501105, 2008.
Lyons, W. B., Mayewski, P. A., Spencer, M. J., and Twickler, M. S.: Nitrate concentrations in snow from remote areas: implication for the global NOx flux, Biogeochemistry, 9, 211–222, https://doi.org/10.1007/BF00000599, 1990.
Lyons, W. B., Deuerling, K., Welch, K. A., Welch, S. A., Michalski, G., Walters, W. W., Nielsen, U., Wall, D. H., Hogg, I., and Adams, B. J.: The Soil Geochemistry in the Beardmore Glacier Region, Antarctica: Implications for Terrestrial Ecosystem History, Sci. Rep., 6, 26189, https://doi.org/10.1038/srep26189, 2016.
Mackintosh, A., Golledge, N., Domack, E., Dunbar, R., Leventer, A., White, D., Pollard, D., Deconto, R., Fink, D., Zwartz, D., Gore, D., and Lavoie, C.: Retreat of the East Antarctic ice sheet during the last glacial termination, Nat. Geosci., 4, 195–202, https://doi.org/10.1038/ngeo1061, 2011.
Mackintosh, A. N., Verleyen, E., O'Brien, P. E., White, D. A., Jones, R. S., McKay, R., Dunbar, R., Gore, D. B., Fink, D., Post, A. L., Miura, H., Leventer, A., Goodwin, I., Hodgson, D. A., Lilly, K., Crosta, X., Golledge, N. R., Wagner, B., Berg, S., van Ommen, T., Zwartz, D., Roberts, S. J., Vyverman, W., and Masse, G.: Retreat history of the East Antarctic Ice Sheet since the Last Glacial Maximum, Quaternary Sci. Rev., 100, 10–30, https://doi.org/10.1016/j.quascirev.2013.07.024, 2014.
Marchant, D. R., Denton, G. H., Swisher, C. C., and Potter, N.: Late Cenozoic Antarctic paleoclimate reconstructed from volcanic ashes in the Dry Valleys region of southern Victoria Land, Geol. Soc. Am. Bull., 108, 181–194, https://doi.org/10.1130/0016-7606(1996)108<0181:LCAPRF>2.3.CO;2, 1996.
McHargue, L. R. and Damon, P. E.: The global beryllium 10 cycle, Rev. Geophys., 29, 141–158, https://doi.org/10.1029/91RG00072, 1991.
Menzies, J., van der Meer, J. J. M., and Rose, J.: Till-as a glacial “tectomict”, its internal architecture, and the development of a “typing” method for till differentiation, Geomorphology, 75, 172–200, https://doi.org/10.1016/j.geomorph.2004.02.017, 2006.
Michalski, G., Bockheim, J. G., Kendall, C., and Thiemens, M.: Isotopic composition of Antarctic Dry Valley nitrate: Implications for NOy sources and cycling in Antarctica, Geophys. Res. Lett., 32, 1–4, https://doi.org/10.1029/2004GL022121, 2005.
Morgan, D., Putkonen, J., Balco, G., and Stone, J.: Quantifying regolith erosion rates with cosmogenic nuclides 10Be and 26Al in the McMurdo Dry Valleys, Antarctica, J. Geophys. Res., 115, F03037, https://doi.org/10.1029/2009JF001443, 2010.
Nishiizumi, K., Imamura, M., Caffee, M. W., Southon, J. R., Finkel, R. C., and McAninch, J.: Absolute calibration of 10Be AMS standards, Nucl. Instrum. Meth. Phys. Res. B, 258, 403–413, https://doi.org/10.1016/j.nimb.2007.01.297, 2007.
Paulsen, T. S., Encarnación, J., and Grunow, A. M.: Structure and timing of transpressional deformation in the Shackleton Glacier area, Ross orogen, Antarctica, J. Geol. Soc. Lond., 161, 1027–1038, https://doi.org/10.1144/0016-764903-040, 2004.
Pavich, M. J., Brown, L., Klein, J., and Middleton, R.: 10Be accumulation in a soil chronosequence, Earth Planet. Sc. Lett., 68, 198–204, https://doi.org/10.1016/0012-821X(84)90151-1, 1984.
Pavich, M. J., Brown, L., Harden, J., Klein, J., and Middleton, R.: 10Be distribution in soils from Merced River terraces, California, Geochim. Cosmochim. Ac., 50, 1727–1735, https://doi.org/10.1016/0016-7037(86)90134-1, 1986.
Pollard, D. and DeConto, R. M.: Modelling West Antarctic ice sheet growth and collapse through the past five million years, Nature, 458, 329–332, https://doi.org/10.1038/nature07809, 2009.
Reich, M. and Bao, H.: Nitrate deposits of the Atacama Desert: A marker of long-term hyperaridity, Elements, 14, 251–256, https://doi.org/10.2138/gselements.14.4.251, 2018.
Scarrow, J. W., Balks, M. R., and Almond, P. C.: Three soil chronosequences in recessional glacial deposits near the polar plateau, in the Central Transantarctic Mountains, Antarctica, Antarct. Sci., 26, 573–583, https://doi.org/10.1017/S0954102014000078, 2014.
Scherer, R. P., DeConto, R. M., Pollard, D., and Alley, R. B.: Windblown Pliocene diatoms and East Antarctic Ice Sheet retreat, Nat. Commun., 7, 1–9, https://doi.org/10.1038/ncomms12957, 2016.
Schiller, M., Dickinson, W., Ditchburn, R. G., Graham, I. J., and Zondervan, A.: Atmospheric 10Be in an Antarctic soil: Implications for climate change, J. Geophys. Res., 114, 1–8, https://doi.org/10.1029/2008jf001052, 2009.
Spector, P. and Balco, G.: Exposure-age data from across Antarctica reveal mid-Miocene establishment of polar desert climate, Geology, 49, 91–95, https://doi.org/10.1130/G47783.1, 2020.
Spector, P., Stone, J., Cowdery, S. G., Hall, B., Conway, H., and Bromley, G.: Rapid early-Holocene deglaciation in the Ross Sea, Antarctica, Geophys. Res. Lett., 44, 7817–7825, https://doi.org/10.1002/2017GL074216, 2017.
Steig, E., Stuiver, M., and Polissar, P.: Cosmogenic isotope concentrations at Taylor Dome, Antarctica, Antarct. J. United States, 30, 95–97, 1995.
Stevens, M. I. and Hogg, I. D.: Long-term isolation and recent range expansion from glacial refugia revealed for the endemic springtail Gomphiocephalus hodgsoni from Victoria Land, Antarctica, Mol. Ecol., 12, 2357–2369, https://doi.org/10.1046/j.1365-294X.2003.01907.x, 2003.
Stone, J.: A rapid fusion method for separation of beryllium-10 from soils and silicates, Geochim. Cosmochim. Ac., 62, 555–561, https://doi.org/10.1016/S0016-7037(97)00340-2, 1998.
Stroeven, A. P., Prentice, M. L., and Kleman, J.: On marine microfossil transport and pathways in Antarctica during the late Neogene: Evidence from the Sirius Group at Mount Fleming, Geology, 24, 727–730, https://doi.org/10.1130/0091-7613(1996)024<0727:ommtap>2.3.co;2, 1996.
Sugden, D. E., Marchant, D. R., and Denton, G. H.: The case for a stable East Antarctic ice sheet, Geogr. Ann. A, 75, 151–351, 1993.
Talarico, F. M., McKay, R. M., Powell, R. D., Sandroni, S., and Naish, T.: Late Cenozoic oscillations of Antarctic ice sheets revealed by provenance of basement clasts and grain detrital modes in ANDRILL core AND-1B, Global Planet. Change, 96–97, 23–40, https://doi.org/10.1016/j.gloplacha.2009.12.002, 2012.
Valletta, R. D., Willenbring, J. K., Lewis, A. R., Ashworth, A. C., and Caffee, M.: Extreme decay of meteoric beryllium-10 as a proxy for persistent aridity, Sci. Rep., 5, 17813, https://doi.org/10.1038/srep17813, 2015.
Webb, P. N. and Harwood, D. M.: Late Cenozoic glacial history of the Ross embayment, Antarctica, Quaternary Sci. Rev., 10, 215–223, https://doi.org/10.1016/0277-3791(91)90020-U, 1991.
Webb, P. N., Harwood, D. M., McKelvey, B. C., Mercer, J. H., and Stott, L. D.: Cenozoic marine sedimentation and ice-volume variation on the East Antarctic craton, Geology, 12, 287–291, https://doi.org/10.1130/0091-7613(1984)12<287:cmsaiv>2.0.co;2, 1984.
Webb, P. N., Harwood, D. M., Mabin, M. G. C., and McKelvey, B. C.: A marine and terrestrial Sirius Group succession, middle Beardmore Glacier-Queen Alexandra Range, Transantarctic Mountains, Antarctica, Mar. Micropaleontol., 27, 273–297, https://doi.org/10.1016/0377-8398(95)00066-6, 1996.
Welch, K. A., Lyons, W. B., Whisner, C., Gardner, C. B., Gooseff, M. N., Mcknight, D. M., and Priscu, J. C.: Spatial variations in the geochemistry of glacial meltwater streams in the Taylor Valley, Antarctica, Antarct. Sci., 22, 662–672, https://doi.org/10.1017/S0954102010000702, 2010.
Willenbring, J. K. and von Blanckenburg, F.: Meteoric cosmogenic Beryllium-10 adsorbed to river sediment and soil: Applications for Earth-surface dynamics, Earth-Sci. Rev., 98, 105–122, https://doi.org/10.1016/j.earscirev.2009.10.008, 2010.
Wilson, G. S.: The neogene east antarctic ice sheet: A dynamic or stable feature?, Quaternary Sci. Rev., 14, 101–123, https://doi.org/10.1016/0277-3791(95)00002-7, 1995.
You, C. F., Lee, T., and Li, Y. H.: The partition of Be between soil and water, Chem. Geol., 77, 105–118, https://doi.org/10.1016/0009-2541(89)90136-8, 1989.