the Creative Commons Attribution 4.0 License.
the Creative Commons Attribution 4.0 License.
 | 23 Apr 2021
Inferring potential landslide damming using slope stability, geomorphic constraints, and run-out analysis: a case study from the NW Himalaya
Imlirenla Jamir
Vikram Gupta
Rajinder K. Bhasin
Prediction of potential landslide damming has been a difficult process owing to the uncertainties related to landslide volume, resultant dam volume, entrainment, valley configuration, river discharge, material composition, friction, and turbulence associated with material. In this study, instability patterns of landslides, geomorphic indices, post-failure run-out predictions, and spatio-temporal patterns of rainfall and earthquakes are explored to predict the potential landslide damming sites. The Satluj valley, NW Himalaya, is chosen as a case study area. The study area has witnessed landslide damming in the past and incurred losses of USD ∼30 million and 350 lives in the last 4 decades due to such processes. A total of 44 active landslides that cover a total m2 area and m3 volume are evaluated to identify those landslides that may result in potential landslide damming. Out of these 44, a total of 5 landslides covering a total volume of m3 are noted to form the potential landslide dams. Spatio-temporal variations in the pattern of rainfall in recent years enhanced the possibility of landslide triggering and hence of potential damming. These five landslides also revealed 24.8±2.7 to 39.8±4.0 m high debris flows in the run-out predictions.
- Article
(31888 KB) - Full-text XML
- BibTeX
- EndNote


Landslide damming is a normal geomorphic process in narrow river valleys and poses significant natural hazard (Dai et al., 2005; Gupta and Sah, 2008; Delaney and Evans, 2015; Fan et al., 2020). Many studies have explored damming characteristics (Li et al., 1986; Costa and Schuster, 1988; Takahashi and Nakawaga, 1993; Ermini and Casagli, 2002; Fujisawa et al., 2009; Stefanelli et al., 2016; Kumar et al., 2019a). However, studies concerning the prediction of potential landslide dams and their stability at a regional scale have been relatively rare, particularly in the Himalaya despite a history of landslide damming and flash floods (Gupta and Sah, 2008; Ruiz-Villanueva et al., 2016; Kumar et al., 2019a). In order to identify the landslides that have the potential to form dams, the following factors have been main prerequisites: (i) pre- and post-failure behaviour of landslide slopes and the (ii) landslide volume, stream power, and morphological setting of the valley (Kumar et al., 2019a).
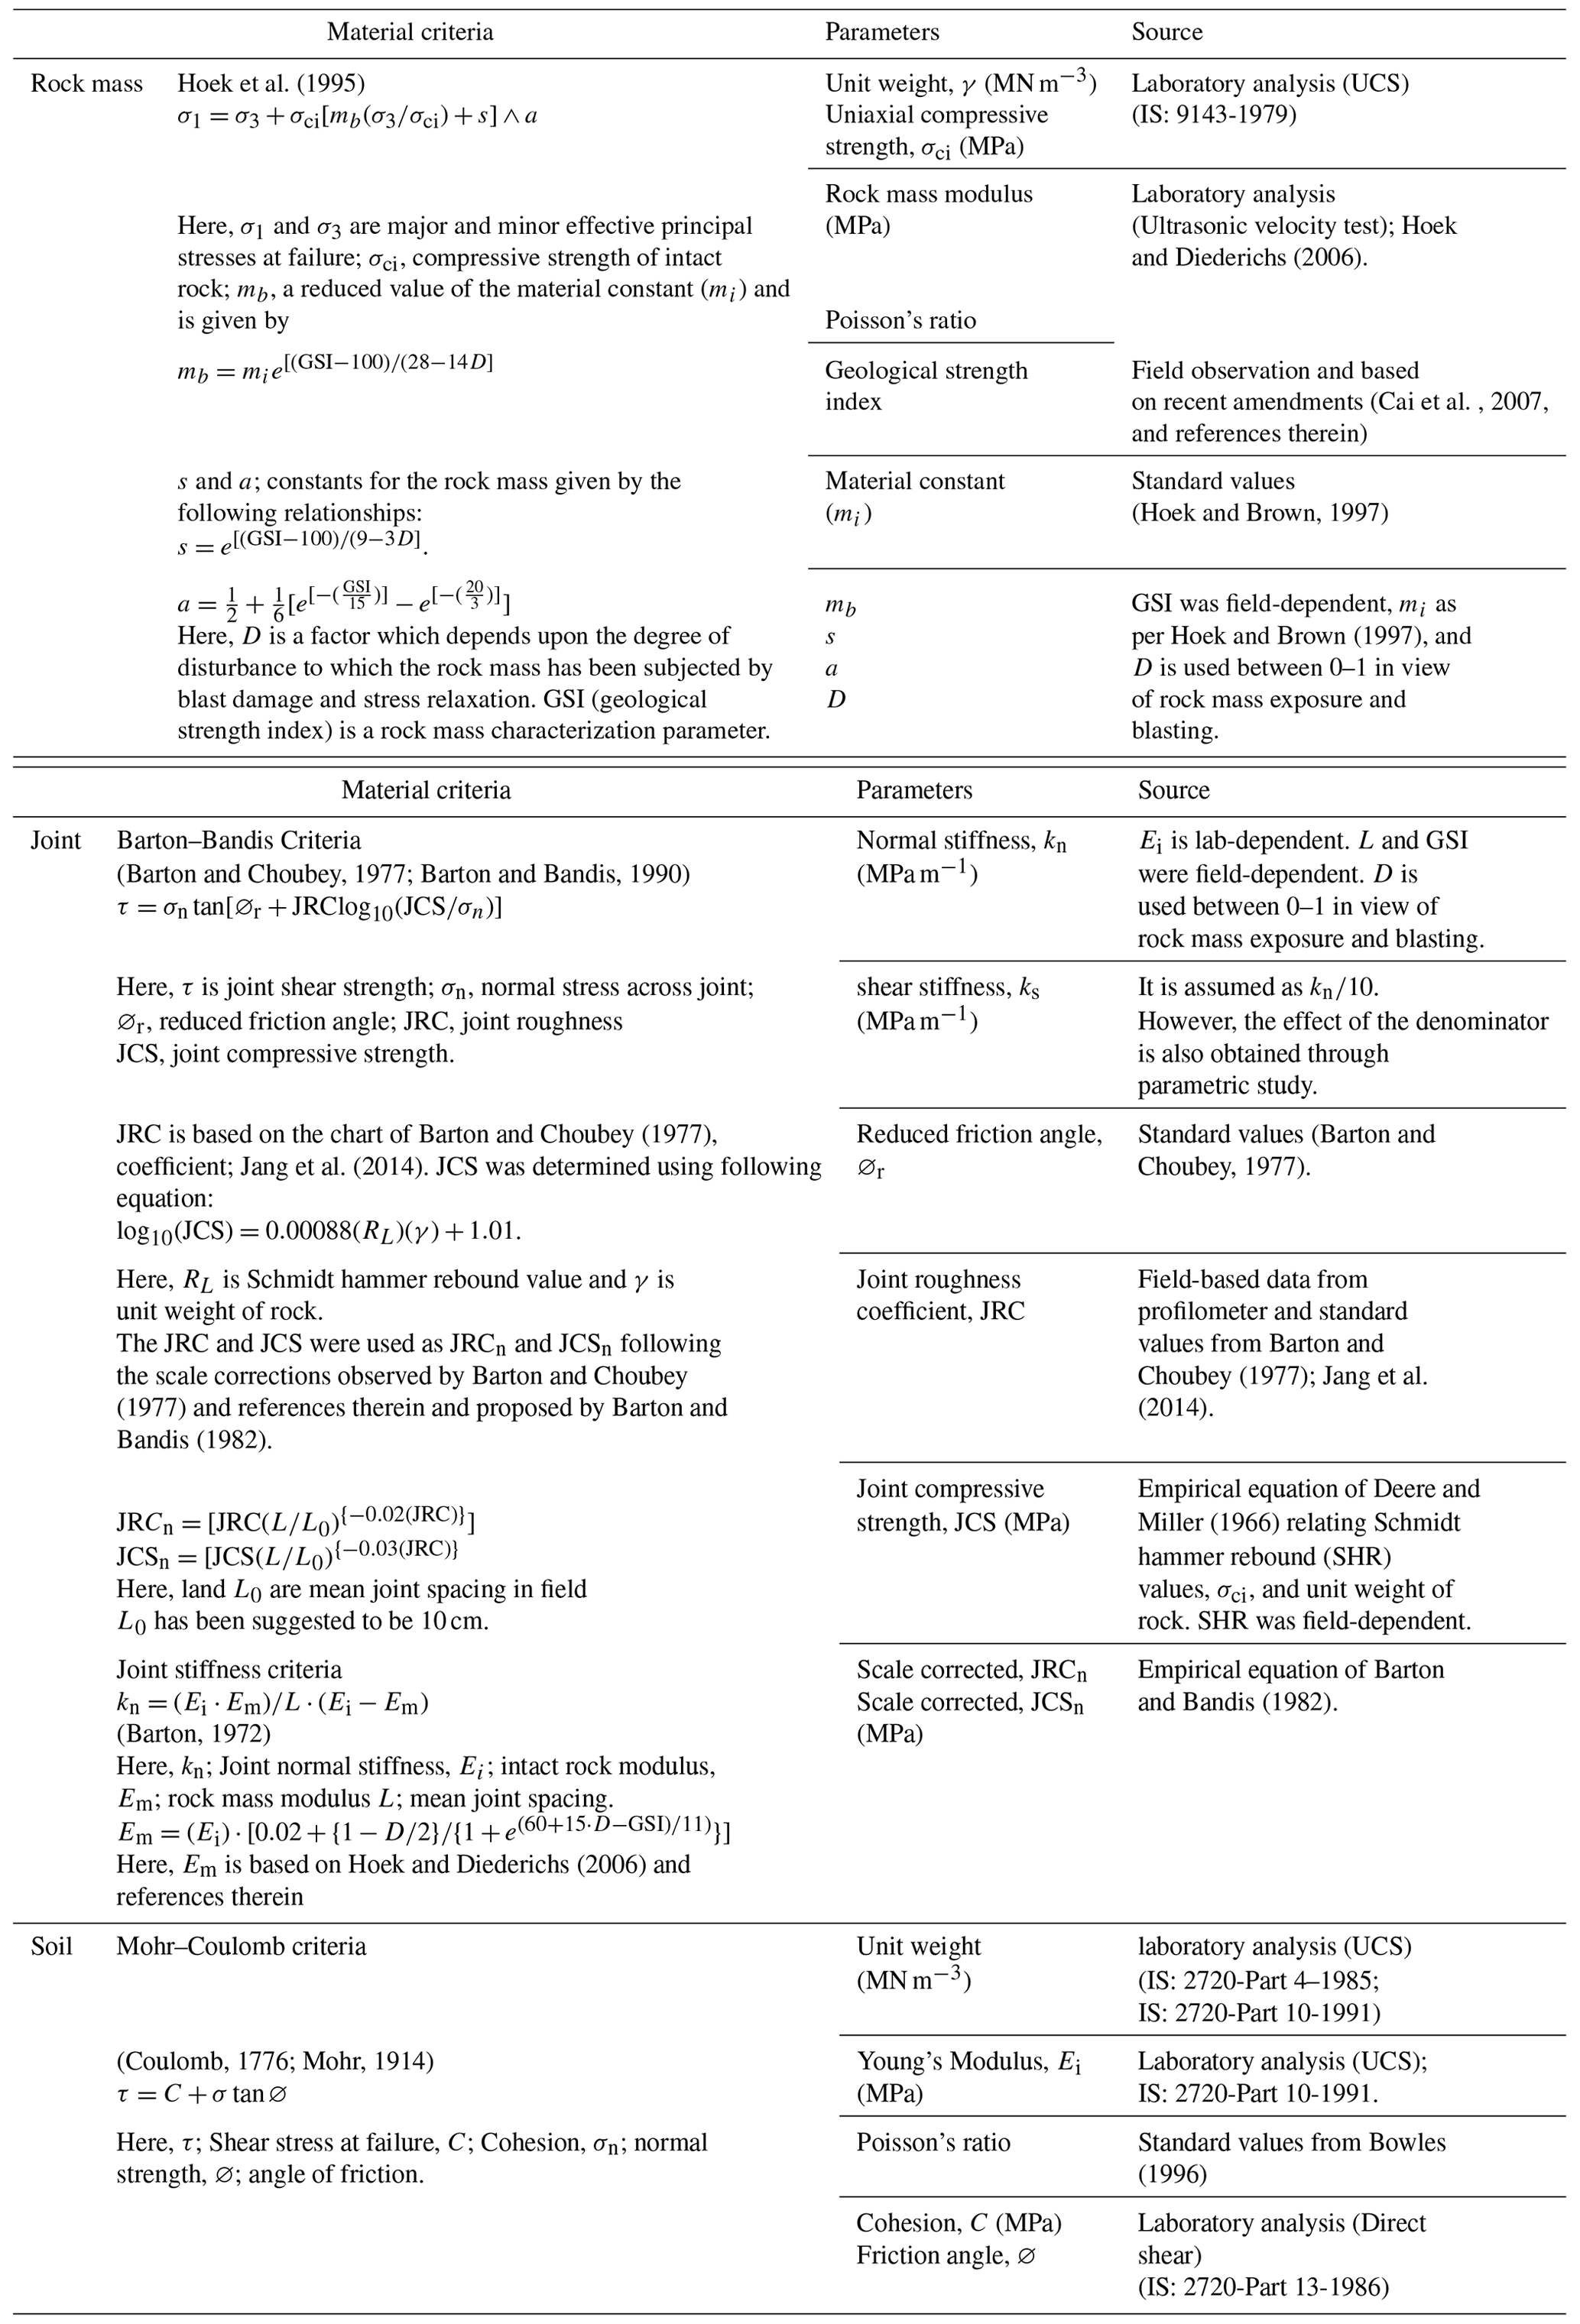
To understand the pre-failure pattern, finite element method (FEM)-based slope stability evaluation has been among the most widely used approaches for complex slope geometry (Griffiths and Lane, 1999; Jing, 2003; Jamir et al., 2017; Kumar et al., 2018). However, the selection of input parameters in FEM analysis and the set of assumptions used (material model, failure criteria, and convergence) may also result in uncertainty in the final output (Wong, 1984; Cho, 2007; Li et al., 2016). Uncertainty from input parameters can be resolved by performing parametric analysis, whereas the utilization of the most appropriate criteria can minimize the uncertainty caused by assumptions. Post-failure behaviour of landslides can be understood using run-out analysis (Hungr et al., 1984; Hutter et al., 1994; Rickenmann and Scheidl, 2013). These methods could be classified into empirical or statistical and dynamical categories (Rickenmann, 2005). Owing to the flexibility in rheology, solution approach, reference frame, and entrainment, dynamic models have been relatively more realistic for site-specific problems (Corominas and Mavrouli, 2011). Though the different numerical models have different advantages and limitations, Voellmy rheology-based (friction and turbulence) (Voellmy, 1955; Salm, 1993) rapid mass movement simulation (RAMMS) (Christen et al., 2010) has been used widely owing to the inclusion of rheological and entrainment rate flexibility.
Apart from the pre- and post-failure pattern, landslide volume, stream power, and morphological setting of the valley are crucial to infer the potential landslide damming. The Morphological Obstruction Index (MOI) and Hydro-morphological Dam Stability Index (HDSI) have been widely used as geomorphic indices to infer the potential of landslide dam formation and their temporal stability (Costa and Schuster, 1988; Ermini and Casagli, 2002; Stefanelli et al., 2016).
The NW Himalaya has been one of most landslide-affected terrains owing to the active tectonics and multiple precipitation sources, i.e. the Indian summer monsoon (ISM) and western disturbance (Dimri et al., 2015; Jamir et al., 2019). The NW Himalaya accommodated ∼51 % of all the landslides in India during the years 1800–2011 (Parkash, 2011). The Satluj River valley, NW Himalaya, is one such region where landslides and associated floods have claimed ∼350 lives and resulted in the loss of minimum USD 30 million in the last 4 decades. This region holds a high potential for future landslide damming and resultant floods (Ruiz-Villanueva et al., 2016; Kumar et al., 2019a). Therefore, the Satluj valley is used here as a case study area, and 44 active landslides belonging to the different litho-tectonic regimes are modelled using the FEM technique. Multiple slope sections and a range of values of different input parameters are used to perform the parametric study. In order to determine the human population that might be affected by these landslides, census statistics are also used. The MOI and HDSI are used to determine the potential of landslide dam formation and their stability, respectively. In view of the role of rainfall and earthquakes as the main landslide-triggering factors, the spatio-temporal regime of these two factors is also discussed. Run-out prediction of certain landslides is also performed to understand the role of run-out in potential landslide damming. This study provides detailed insight into the regional instability pattern, associated uncertainty, and potential landslide damming sites, and hence it can be replicated in other hilly terrain that witnesses frequent landslides and damming.
The study area is located between Moorang (31∘36′1′′ N, 78∘26′47′′ E) and Rampur (31∘27′10′′ N, 77∘38′20′′ E) in the Satluj River valley, NW Himalaya (Fig. 1). The Satluj River flows across the Tethyan Sequence (TS), Higher Himalaya Crystalline (HHC), Lesser Himalaya Crystalline (LHC), and Lesser Himalaya Sequence (LHS). The TS in the study area is comprised of slate or phyllite and schist and has been intruded by the biotite-rich granite, i.e. Kinnaur Kailash Granite (KKG), near the Sangla Detachment (SD) fault (Sharma, 1977; Vannay et al., 2004). The SD fault separates the TS from the underlying crystalline rock mass of the HHC. Migmatitic gneiss marks the upper part of the HHC, whereas the base is marked by the kyanite–sillimanite gneiss rock mass (Sharma, 1977; Vannay et al., 2004; Kumar et al., 2019b). The Main Central Thrust (MCT) fault separates the HHC from the underlying schist and gneissic rock mass of the LHC. The LHC comprises mica schist, carbonaceous schist, quartzite, and amphibolite. A thick zone of gneiss, i.e. Wangtu Gneissic Complex (WGC), is exposed in the LHC, which is comprised of augen gneiss and porphyritic granitoids. The LHC is delimited at the base by the Munsiari Thrust (MT) fault that is thrusted over the Lesser Himalaya Sequence (LHS) rock mass. The MT contains breccia, cataclastic, and fault gouge (Sharma, 1977; Vannay et al., 2004; Kumar et al., 2019b). The LHS in the study area consists of quartz arenite (Rampur Quartzite) with bands of phyllite, meta-volcanics, and paragneiss (Sharma, 1977).
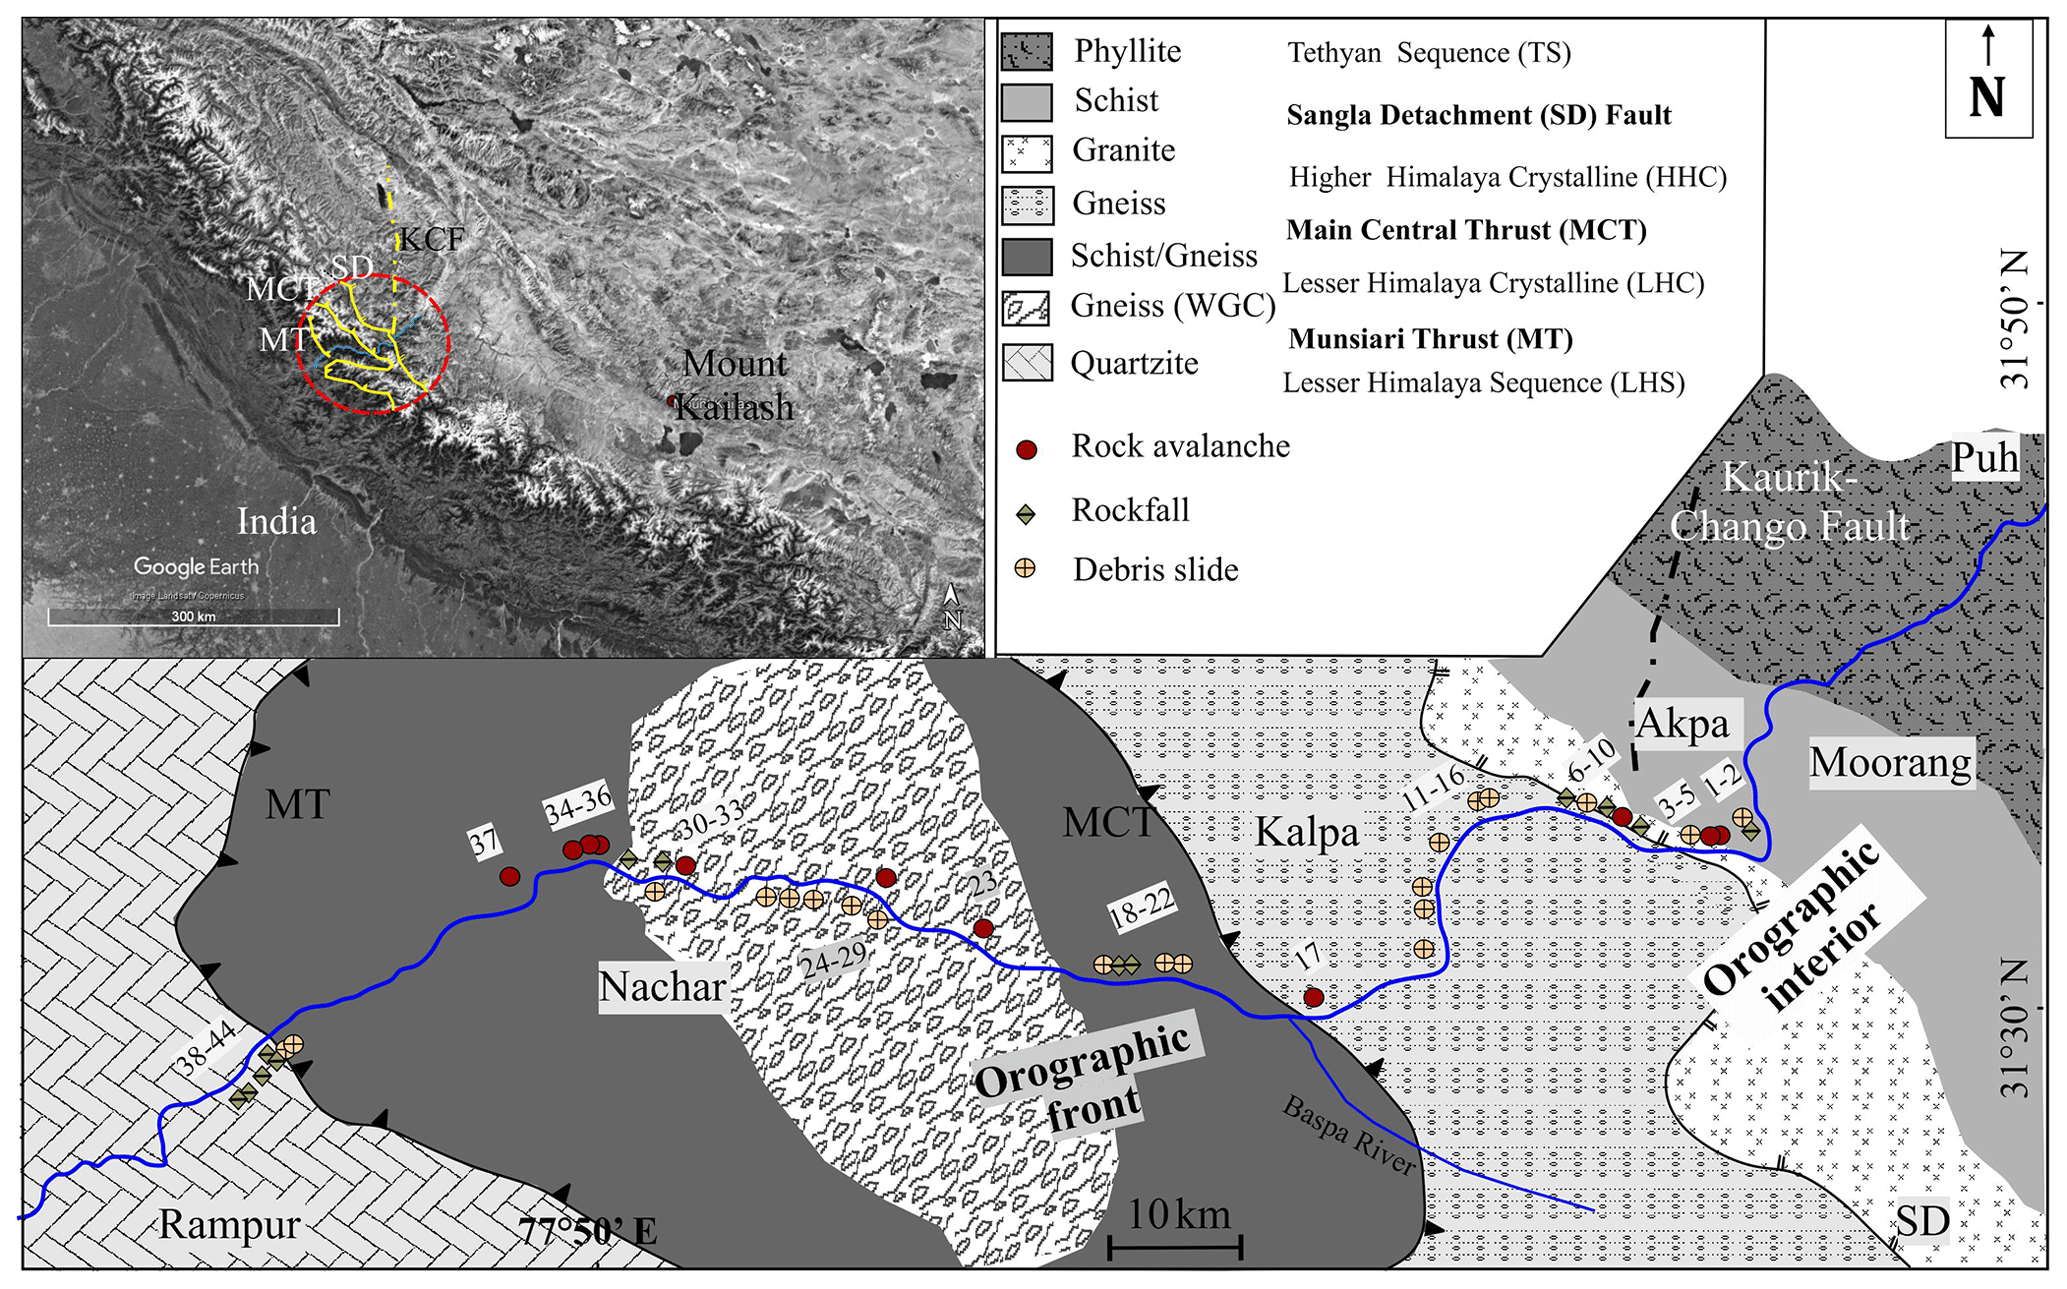
Figure 1Geological setting. WGC stands for Wangtu Gneissic Complex. The dashed red circle in the inset (© Google Earth) represents the region within a 100 km radius from the Satluj River (marked as a blue line) that was used to determine the earthquake distribution in the area. Yellow lines represent the regional faults in the region. KCF in the inset refers to the Kaurik–Chango fault. The numbers 1–44 refer to serial number of landslides in Table 1.
The present study covers 44 active landslides (20 debris slides, 13 rockfalls, and 11 rock avalanches) along the study area (Table 1) that have been mapped recently by Kumar et al. (2019b). Field photographs of some of these landslides are presented in Fig. 2. The TS and LHS in the study area have been subjected to relative tectonic tranquility with exhumation rates as low as 0.5–1.0 mm yr−1, whereas the HHC and LHC region have undergone a 1.0–4.5 mm yr−1 rate of exhumation (Thiede et al., 2009). The MCT fault region and the WGC are noted to have a maximum exhumation rate (i.e., ∼4.5 mm yr−1) that is evident from the deep gorges in these regions (Fig. 2c and e). A majority of the earthquake events in the study area in the last 7 decades have been related to the N–S oriented Kaurik–Chango fault (KCF) (Kundu et al., 2014; Hazarika et al., 2017; http://www.isc.ac.uk/iscbulletin/search/catalogue/, last access: 2 March 2020). The climate in the study area shows a spatial variation, from humid (∼800 mm yr−1 mean annual precipitation) in the LHS to semi-arid (∼200 mm yr−1) in the TS (Kumar et al., 2019b). The HHC acts as a transition zone where climate varies from semi-humid to semi-arid in the SW–NE direction. This transition has been attributed to the “orographic barrier” nature of the HHC that marks the region in its north as “orographic interior” and the region to its south as the “orographic front” (Wulf et al., 2012; Kumar et al., 2019b).
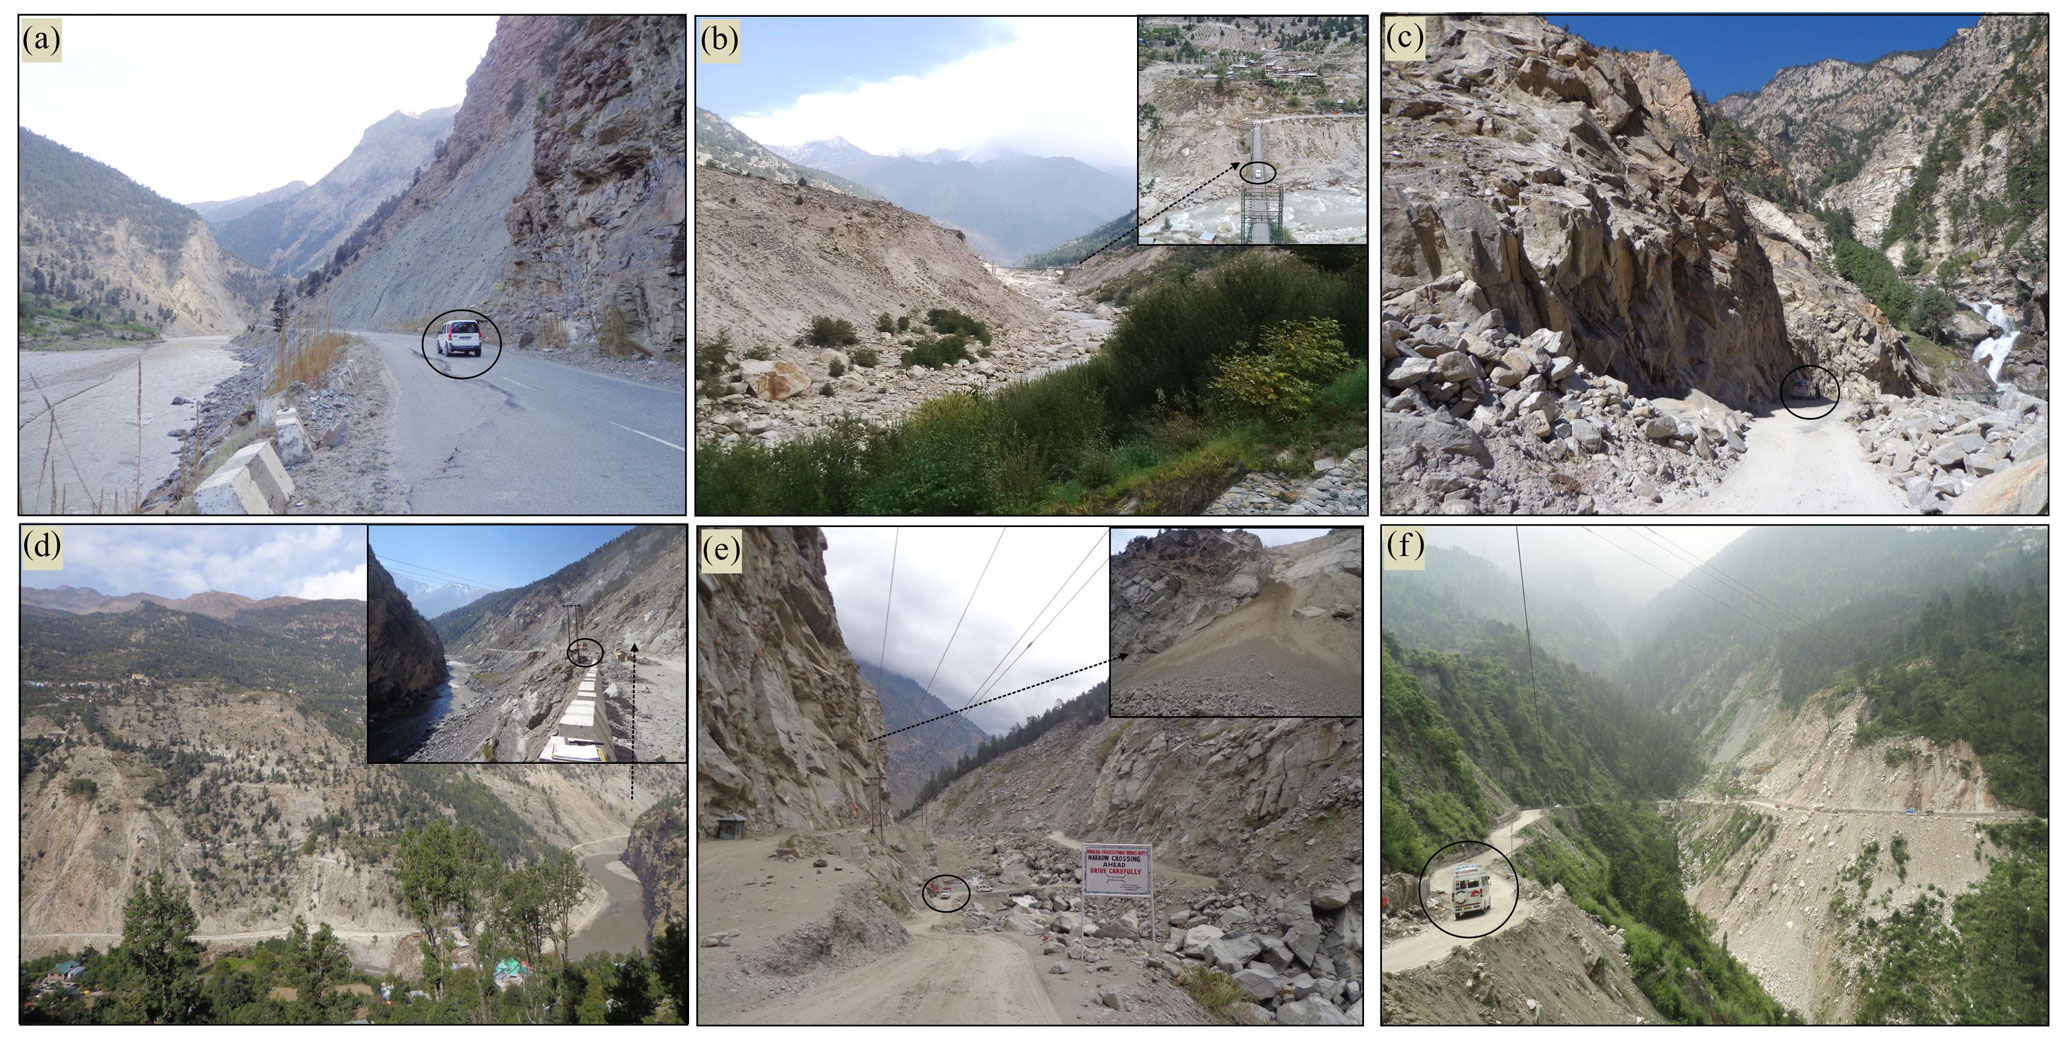
Figure 2Field photographs of some of the landslides: (a) Khokpa landslide (no. 1), (b) Akpa_III landslide (no. 5), (c) Rarang landslide (no. 6), (d) Pawari landslide (no. 14), (e) Urni landslide (no. 19), and (f) Barauni Gad_I_S landslide (no. 38). The black circle in the pictures that encircles the vehicle is intended to represent the relative scale.
Table 1Details of the landslides used in the study.
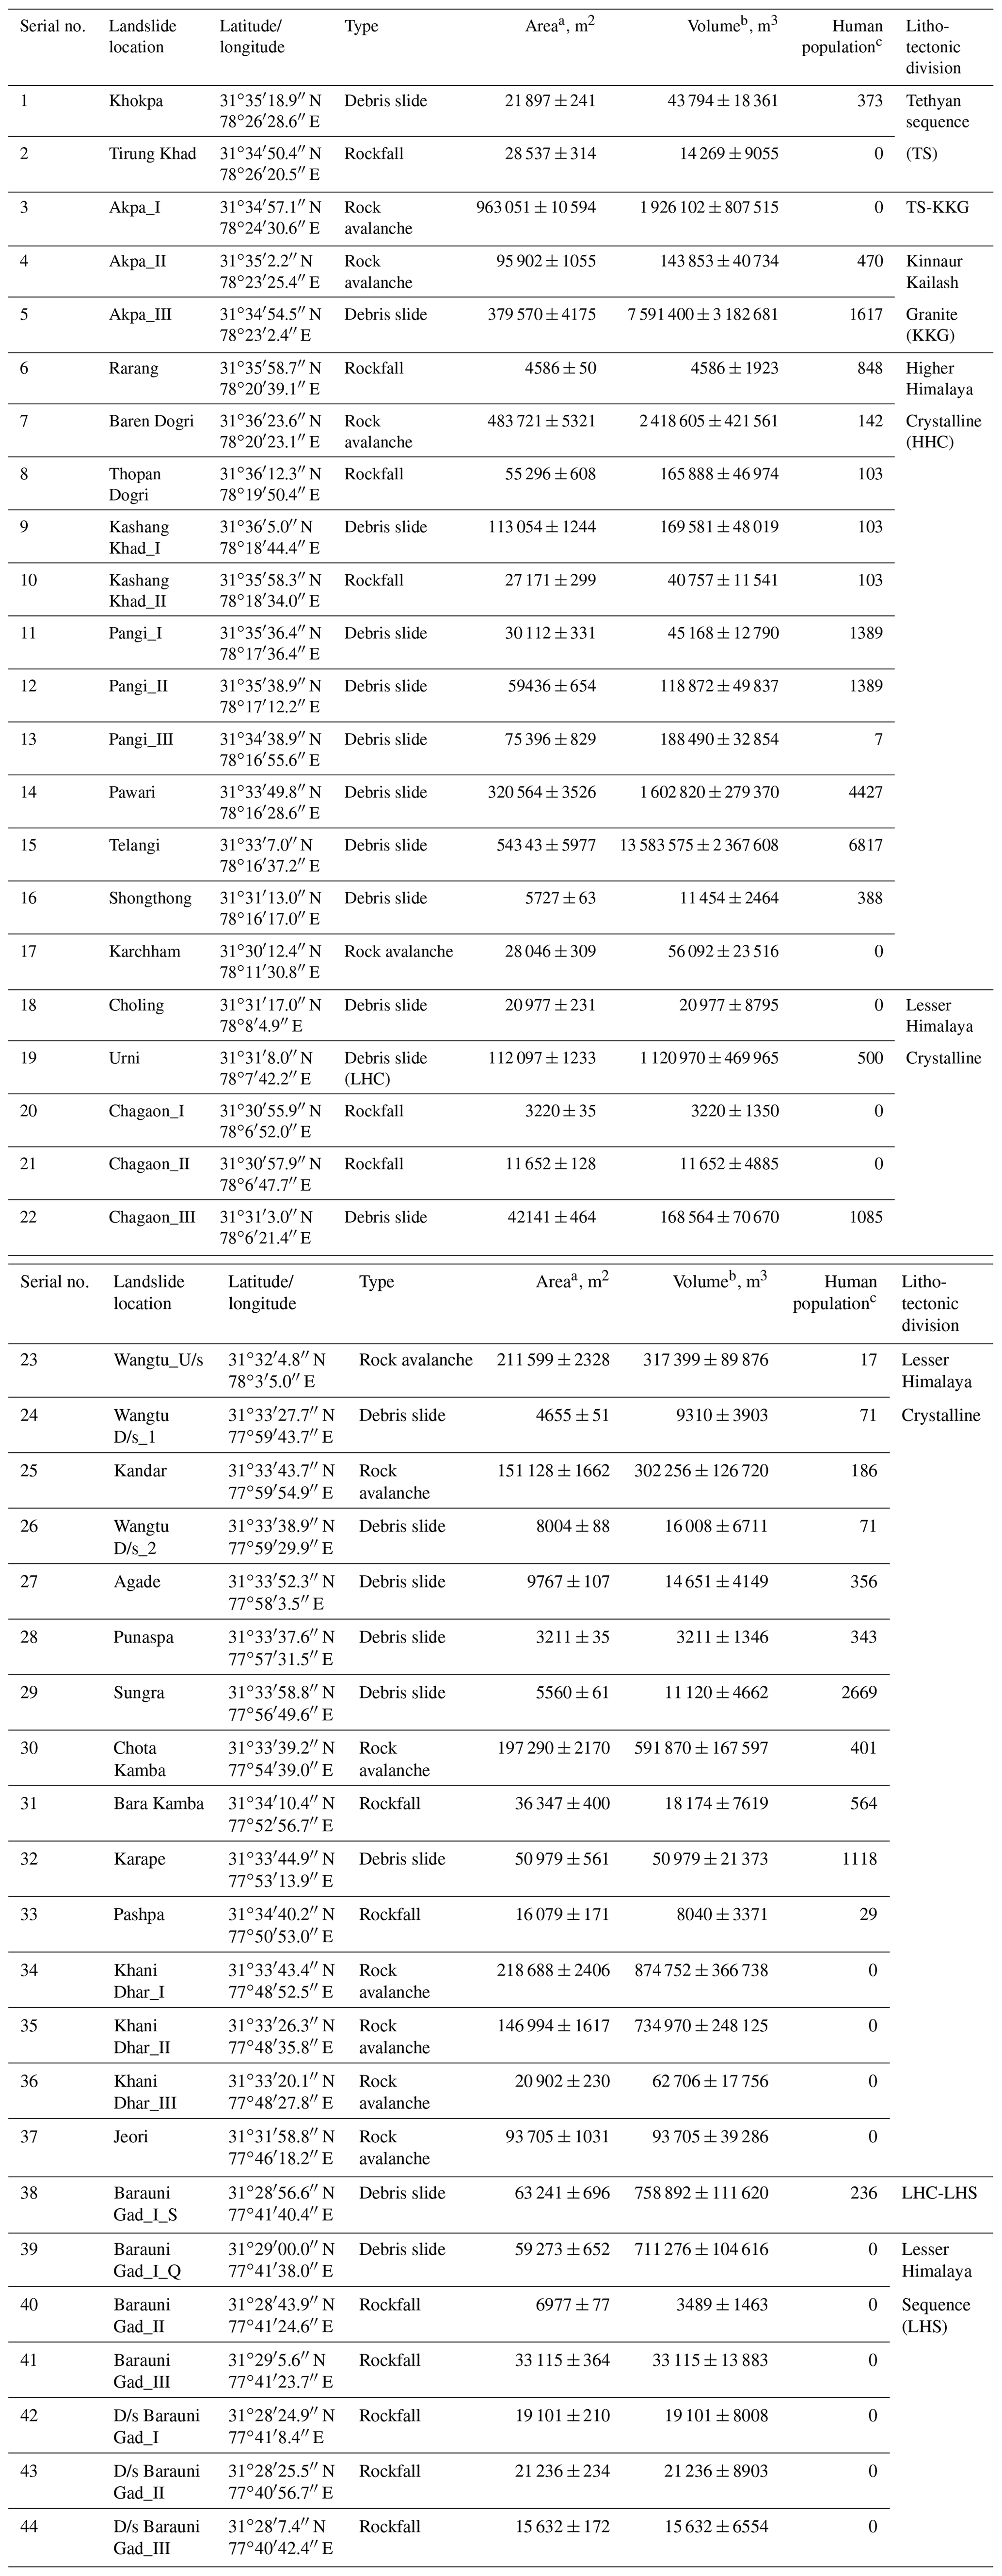
a Error (±) caused by GE measurement (1.06 %). b Error (±) is an outcome of multiplication of area ± error and thickness ± error. Thickness error (SD) corresponds to averaging of field-based approximated thickness. c The human population is based on the 2011 Govt. of India census. The villages and towns in the radius of 500 m from the landslide are considered for counting the human population.
Landslides in the study area have been a consistent threat to the socio-economic condition of the nearby human population (Gupta and Sah, 2008; Ruiz-Villanueva et al., 2016; Kumar et al., 2019a). Therefore, the human population in the vicinity of each landslide was also determined by considering the nearby villages and towns. Notably, a total of 25 822 people reside within 500 m extent of the 44 landslide slopes, and about 70 % of this population is residing in the reach of debris-slide-type landslides. Since the Government of India keeps a 10-year gap in census statistics, the human population data was based on the most recent official data, i.e. the census of 2011. The next official census is due in 2021. The population density in the Indian Himalayan region was estimated to be 181 per square kilometre in the year 2011 that might grow to 212 per square kilometre in 2021 with a decadal growth rate of 17.3 % (https://censusindia.gov.in, last access: 2 September 2020; http://gbpihedenvis.nic.in, last access: 2 September 2020).
The methodology involved field data collection, satellite imagery analysis, laboratory analyses, slope stability modelling, geomorphic indices, rainfall and earthquake patterns and run-out modelling. Details are as follows.
3.1 Field data, satellite imagery processing, and laboratory analyses
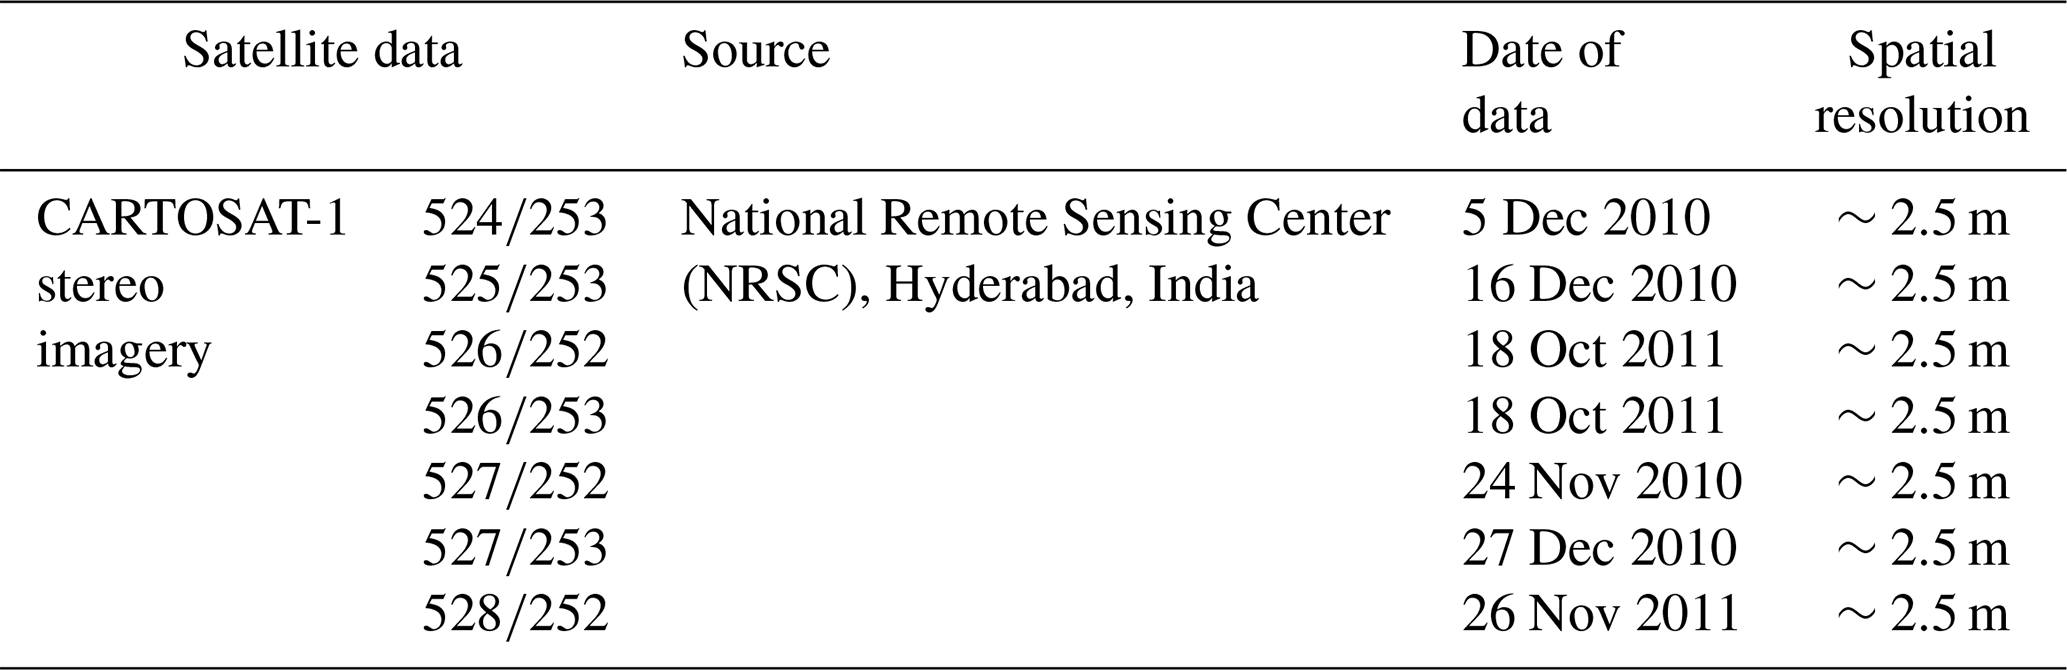
The fieldwork involved rock and soil sample collection from each landslide location, rock mass joint mapping, and N-type Schmidt hammer rebound (SHR) measurement. Joints were included in the slope models for the FEM-based slope stability analysis. The dataset involving the joint details is available in the data repository (Kumar et al., 2021). The SHR values were obtained as per International Society of Rock Mechanics (ISRM) standard (Aydin, 2008). Cartosat-1 satellite imagery and field assessments were used to finalize the location of slope sections (2D) of the landslides. Cartosat-1 imagery has been used widely for the landslide-related studies (Martha et al., 2010). The Cartosat-1 Digital Elevation Model (DEM) having 10 m spatial resolution, prepared using the Cartosat-1 stereo imagery, was used to extract the slope sections of the landslides using the Arc GIS-10.2 software. Details of the satellite imagery are mentioned in Table 2.
The rock/soil samples were analysed in the National Geotechnical Facility (NGF) and Wadia Institute of Himalayan Geology (WIHG) laboratory, India. The rock samples were drilled and smoothed for Unconfined Compressive Strength (UCS) (IS: 9143-1979) and ultrasonic tests (CATS Ultrasonic (1.95) of Geotechnical Consulting & Testing Systems). The ultrasonic test was conducted to determine the density, elastic modulus, and Poisson's ratio of rock samples. The soil samples were tested for grain size (IS: 2720-Part 4-1985), UCS test (IS: 2720-Part 10-1991), and direct shear test (IS: 2720-Part 13-1986). If the soil samples contained <5 % fines (<75 mm), the hydrometer test was not performed for the remaining fine material. In the direct shear test, soil samples were sheared under the constant normal stress of 50, 100, and 150 kN m−2. The UCS test of soil was performed under three different rates of movements, i.e. 1.25, 1.50, and 2.5 mm min−1.
3.2 Slope stability modelling
The finite element method (FEM) was used along with the shear strength reduction (SSR) technique to infer the critical strength reduction factor (SRF), shear strain (SS), and total displacement (TD) in the 44 landslide slopes using the RS2 software. The SRF has been observed to be similar in nature to the factor of safety (FS) of the slope (Zienkiewicz et al., 1975; Griffiths and Lane, 1999). To define the failure in the SSR approach, non-convergence criteria were used (Nian et al., 2011). The boundary condition with the restraining movement was applied to the base and back, whereas the front face was kept free for the movement (Fig. 3). In situ field stress was adjusted in view of dominant stress, i.e. extension or compression, by changing the value of the coefficient of earth pressure (k). A value of was used in extensional regime, whereas was used in compressional regime. The Tethyan Sequence has been observed to possess the NW–SE directed extensional regime. The structures in the upper part of the HHC are influenced by the east directed extension along the SD fault. The lower part, however, is characterized by the SW-directed compression along the Main Central Thrust. In contrast to the HHC, structures in the Lesser Himalaya Crystalline and Munsiari Thrust region are influenced by the compressional regime. In the Lesser Himalaya Sequence region, the SW-directed compressional regime has been observed on the basis of the SW-verging folds, crenulation cleavage, and other features (Vannay et al., 2004).
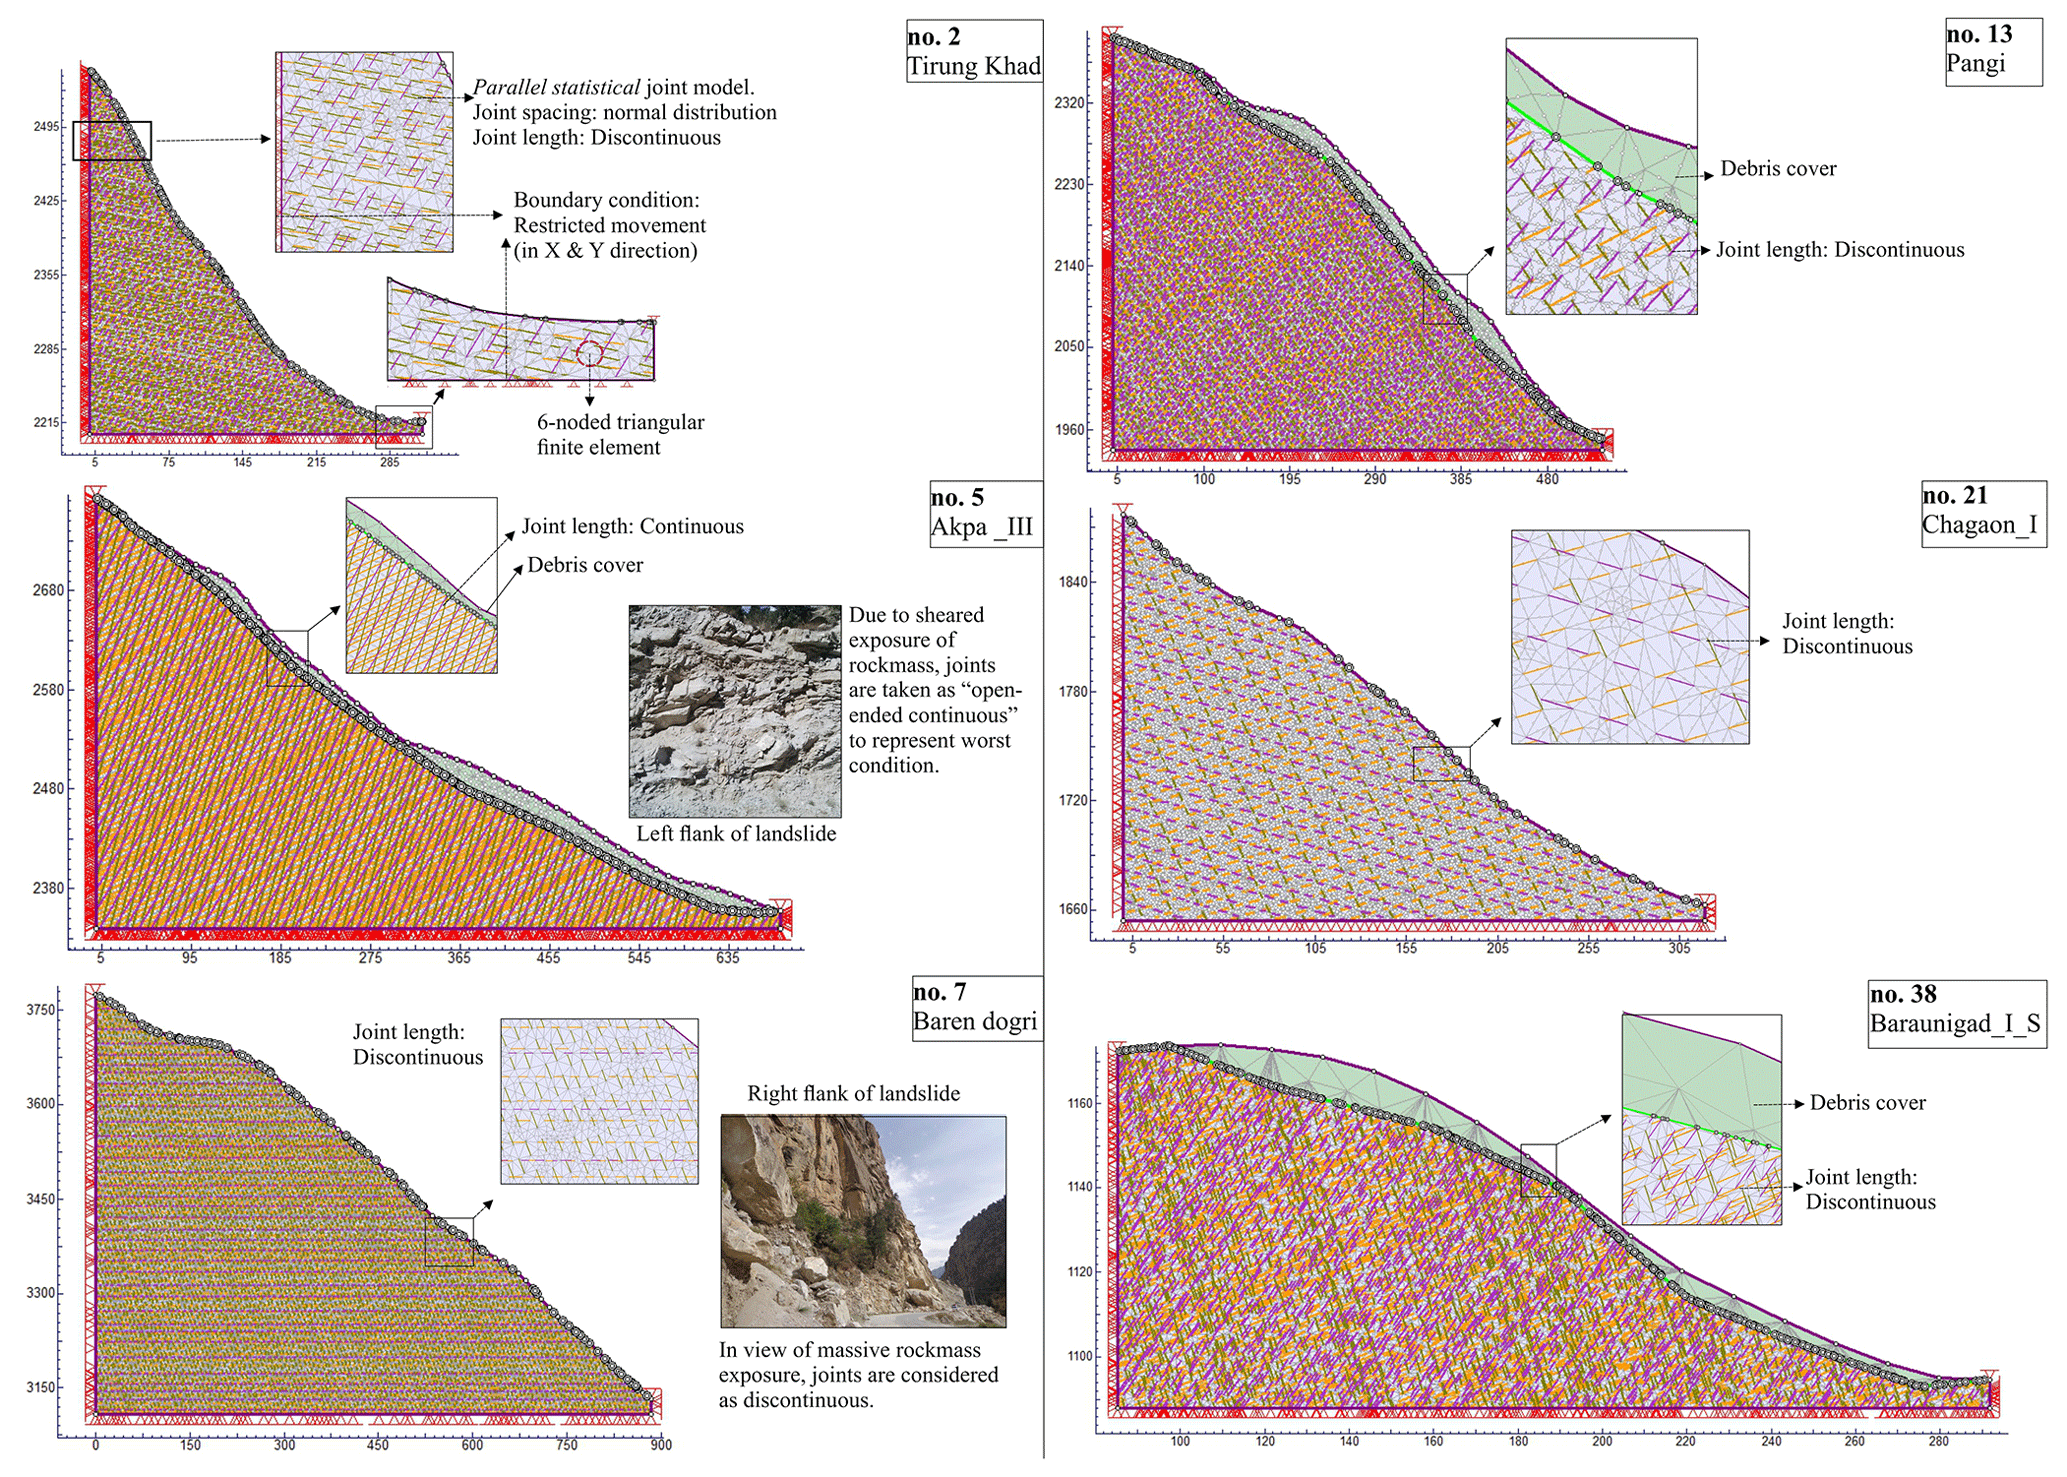
Figure 3The FEM configuration of some of the slope models (no. refers to the serial no. of landslides in Table 1). The joint distribution in all the slopes was parallel statistical with the normal distribution of joint spacing.
The soil and rock mass were used in the models through the Mohr–Coulomb (M–C) failure criterion (Coulomb, 1776; Mohr, 1914) and generalized Hoek–Brown (GHB) criterion (Hoek et al., 1995), respectively. The parallel statistical distribution of the joints with normal distributed joint spacing in the rock mass was applied through the Barton–Bandis (B–B) slip criterion (Barton and Choubey, 1977; Barton and Bandis, 1990). Plane strain triangular elements that have six nodes were used through the graded mesh in the models. Details of the criteria used in the FEM analysis are mentioned in Table 3. The dataset of input parameters used in the FEM analysis is available in the data repository (Kumar et al., 2021). It is worth noting that the FEM analysis was performed under the static load, i.e. field stress and body force. The dynamic analysis was not performed at present due to the absence of any major seismic events in the region in the last 4 decades (Sect. 4.3) and lack of reliable dynamic load data of nearby major seismic events.
To understand the uncertainty caused by the selection of 2D slope section, multiple slope sections were taken wherever possible. More than one slope section was modelled for each debris slide, whereas for the rockfalls or rock avalanches only one slope section was chosen due to the limited width of the rockfalls (or rock avalanches) in the study area. To find out the relative influence of different input parameters on the final output, a parametric study was performed. In the parametric study for debris slides, the Akpa landslide (no. 5 in Fig. 3), Pangi landslide (no. 13 in Fig. 3), and Barauni Gad landslide (no. 38 in Fig. 3) were chosen, whereas the Tirung Khad (no. 2 in Fig. 3) and Chagaon landslides (no. 21 in Fig. 3) were considered to represent rockfall. The Baren Dogri (no. 7 in Fig. 3) landslide was used to represent the rock avalanches. The selection of these landslides for the parametric study was based on the following two factors: (1) to choose the landslides from different litho-tectonic regime and (2) to represent varying stress regimes, i.e. extensional, compressional, and relatively stagnant. The parametric study of the debris slide models involved following nine parameters: field stress coefficient, stiffness ratio, cohesion and angle of friction of soil, elastic modulus and Poisson's ratio of soil, rock mass modulus, Poisson's ratio, and uniaxial compressive strength of rock. For the rockfalls and rock avalanches, the following six parameters were considered: uniaxial compressive strength of rock, rock mass modulus of rock, Poisson's ratio of rock, “mi” parameter, stiffness ratio, and field stress coefficient. The “mi” is a generalized Hoek–Brown (GHB) parameter that is equivalent to the angle of friction of Mohr–coulomb (M–C) criteria.
3.3 Geomorphic indices
Considering the possibility of landslide dam formation in the case of slope failure, the following geomorphic indices were also used:
- i.
Morphological Obstruction Index (MOI)
- ii.
Hydro-morphological Dam Stability Index (HDSI)
where Vd (dam volume) = Vl (landslide volume, m3), Ab is upstream catchment area (km2), Wv is width of the valley (m), and S is local slope gradient of river channel (m m−1). Though the resultant dam volume could be higher or lower than the landslide volume owing to slope entrainment, rock mass fragmentation, retaining of material at the slope, and washout by the river (Hungr and Evans, 2004; Dong et al., 2011), dam volume is assumed to be equal to landslide volume for the worst case. By utilizing the comprehensive dataset of ∼300 landslide dams of Italy, Stefanelli et al. (2016) have classified the MOI into the (i) non-formation domain (MOI < 3.00), (ii) uncertain evolution domain (3.00 < MOI > 4.60), and (iii) formation domain (MOI > 4.60). By utilizing the same dataset, Stefanelli et al. (2016) defined the HDSI into following categories (i) instability domain (HDSI < 5.74), (ii) uncertain determination domain (5.74 < HDSI > 7.44), and (iii) stability domain (HDSI > 7.44).
3.4 Rainfall and earthquake regime
Precipitation in the study area is related primarily to the Indian Summer Monsoon (ISM) and Western Disturbance (WD) and varies spatio-temporally due to various local and regional factors (Gadgil et al., 2007; Hunt et al., 2018). Therefore, we have taken the TRMM_3B42 (Huffman et al., 2016) daily rainfall data of the years 2000–2019 at four different locations: Moorang, Kalpa, Nachar, and Rampur (Locations mentioned in Fig. 1). The dataset of earthquake events () in and around study area during the years 1940–2019 was retrieved from the International Seismological Centre (ISC) catalogue (http://www.isc.ac.uk/iscbulletin/search/catalogue/, last access: 2 March 2020) to determine the spatio-temporal pattern.
3.5 Run-out modelling
Since the study area has witnessed many disastrous (mostly rainfall-triggered) landslides and flash floods in past (Gupta and Sah, 2008; Ruiz-Villanueva et al., 2016), run-out analysis was performed to understand the post-failure scenario. Such run-out predictions will also be helpful to ascertain the possibility of damming because various studies have noted river damming by the debris flows (Li et al., 2011; Braun et al., 2018; Fan et al., 2020). The landslides that have potential to form dams based on the indices (Sect. 3.3) are evaluated for such run-out analyses.
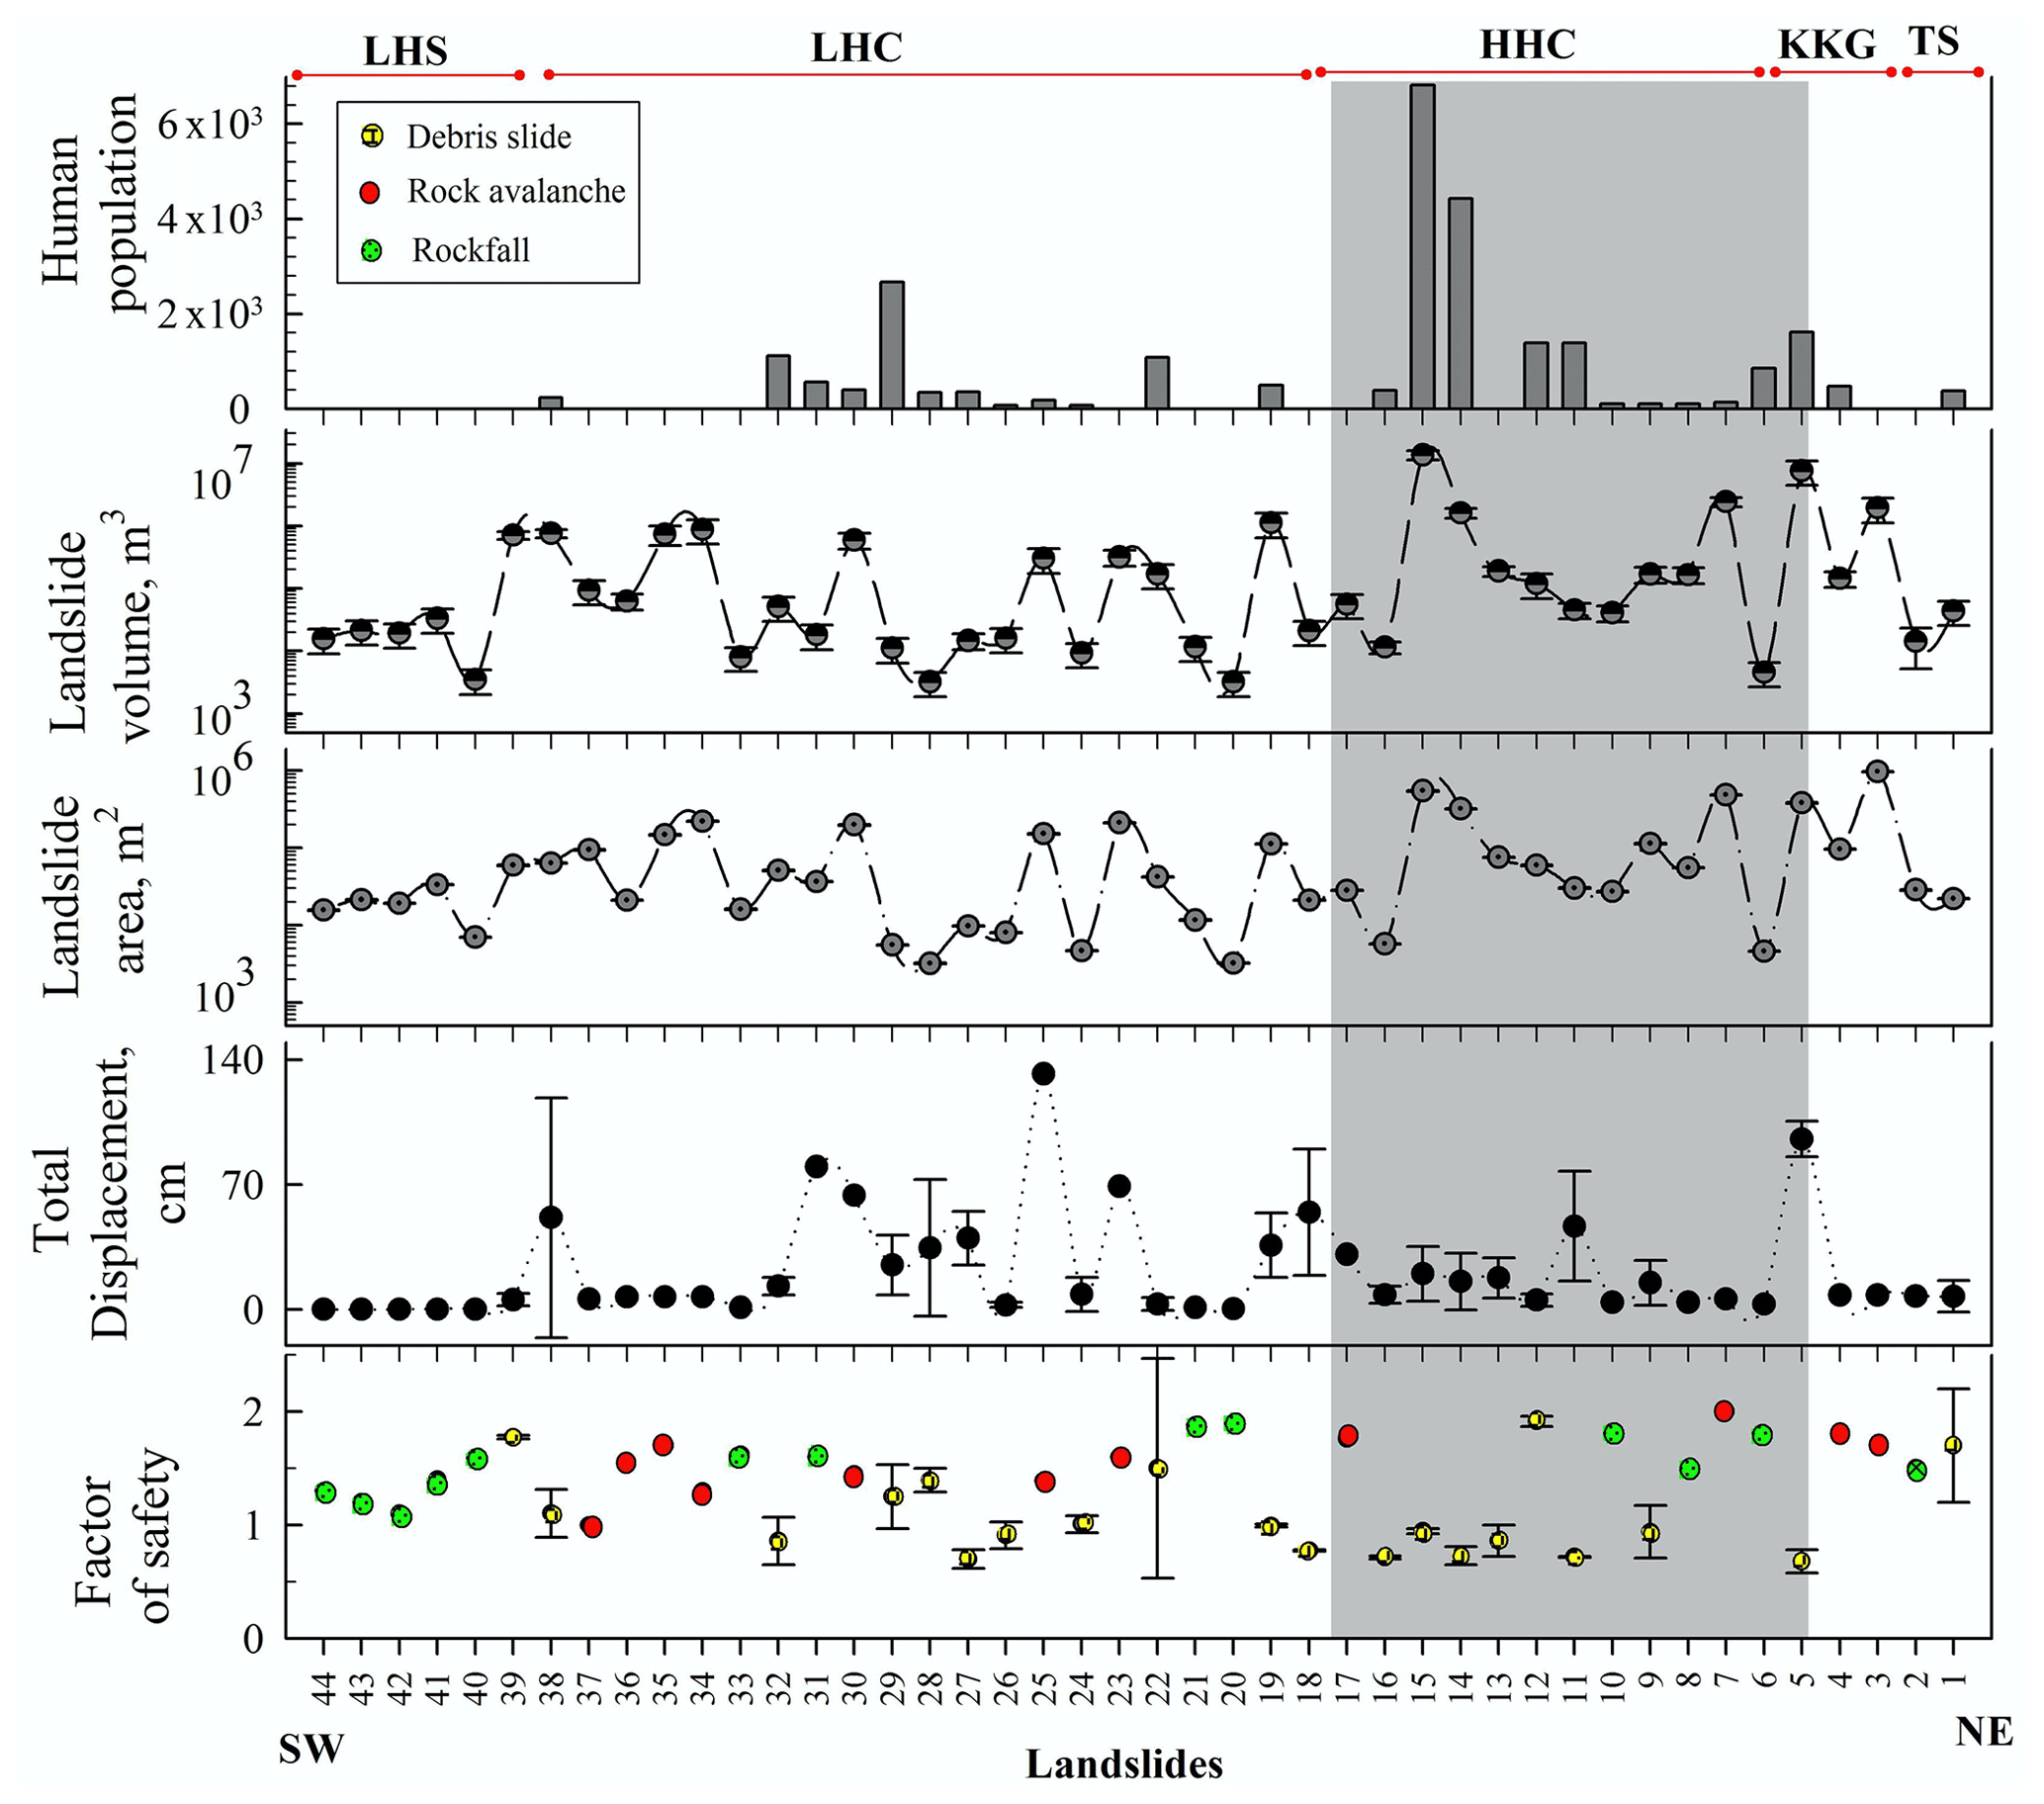
Figure 4The FEM analysis of all 44 landslides. The grey bar in the background highlights the Higher Himalaya Crystalline (HHC) region that comprises relatively unstable landslides, landslide volume, and human population. TS, KKG, HHC, LHC, and LHS are Tethyan Sequence, Kinnaur Kailash Granite, Higher Himalaya Crystalline, Lesser Himalaya Crystalline, and Lesser Himalaya Sequence, respectively.
Table 4Details of input parameters for run-out analysis. No. refers to serial number of landslides in Fig. 1.
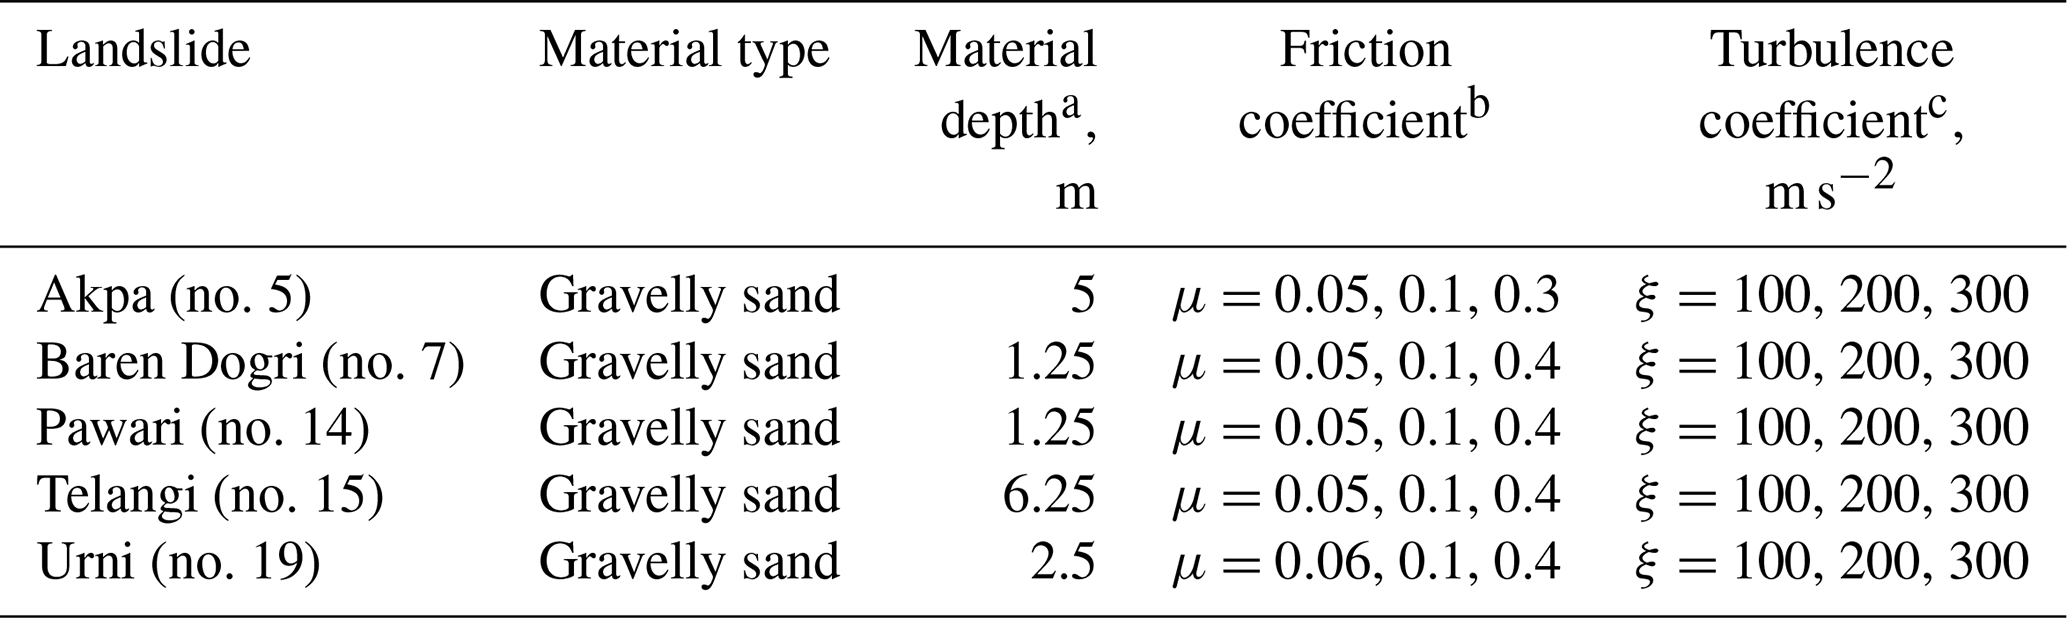
a Considering the fact that during the slope failure, irrespective of type of trigger, the entire loose material might not slide down, the depth is taken as only one-quarter (thickness) in the calculation. b Since the angle of the run-out track (slope and river channel) varied a little beyond the suggested range 2.8–21.8∘ or μ=0.05–0.4 (Hungr et al., 1984; RAMMS v.1.7.0), we kept out input in this suggested range wherever possible to avoid the simulation uncertainty. c This range is used in view of the type of loose material, i.e. granular in this study (RAMMS v.1.7.0).
In this study, a Voellmy rheology-based (Voellmy, 1955; Salm, 1993) rapid mass movement simulation (RAMMS) (Christen et al., 2010) model was used to understand the run-out pattern. The RAMMS for debris flow uses the Voellmy friction law and divides the frictional resistance into a dry Coulomb-type friction (μ) and viscous turbulent friction (ξ). The frictional resistance S (Pa) is
where N=ρhgcos (ϕ) is the normal stress on the running surface, ρ is density, g is gravitational acceleration, ϕ is slope angle, h is flow height, and u=(ux, uy) is the flow velocity in the x and y directions. In this study, a range of friction (μ) and turbulence (ξ) values, apart from other input parameters, are used to evaluate the uncertainty in output (Table 4). Generally, the values for μ and ξ are determined using the reconstruction of real events through the simulation and subsequent comparison between the dimensional characteristics of real and simulated events. However, the landslides in the study area merge with the river floor and/or are in close proximity, and hence there is no failed material left from the previous events to reconstruct. Therefore, the μ and ξ values were taken from a range in view of topography of landslide slope and run-out path, landslide material, similar landslide events or materials, and results from previous studies and models (Hürlimann et al., 2008; Rickenmann and Scheidl, 2013; RAMMS v.1.7.0). Since these landslides are relatively deep in nature and happen during slope failure, irrespective of type of trigger, and the entirety of the loose material might not slide down, the depth of the landslide is taken as only one-quarter (thickness) in the run-out calculation. Further, a release area concept (for unchanneled flow or block release) was used for the run-out simulation. During the field visits, no specific flow channels (or gullies) were found on the landslide slopes except seasonal flow channels that were a few centimetres deep for the no. 5 and no. 15 landslides (Table 1). However, the data pertaining to the spatio-temporal pattern of discharge at these two landslides was not available. Therefore, the release area concept was chosen because it has been more appropriate when the flow path (e.g. gully) and its possible discharge on the slope are uncertain (RAMMS v.1.7.0).
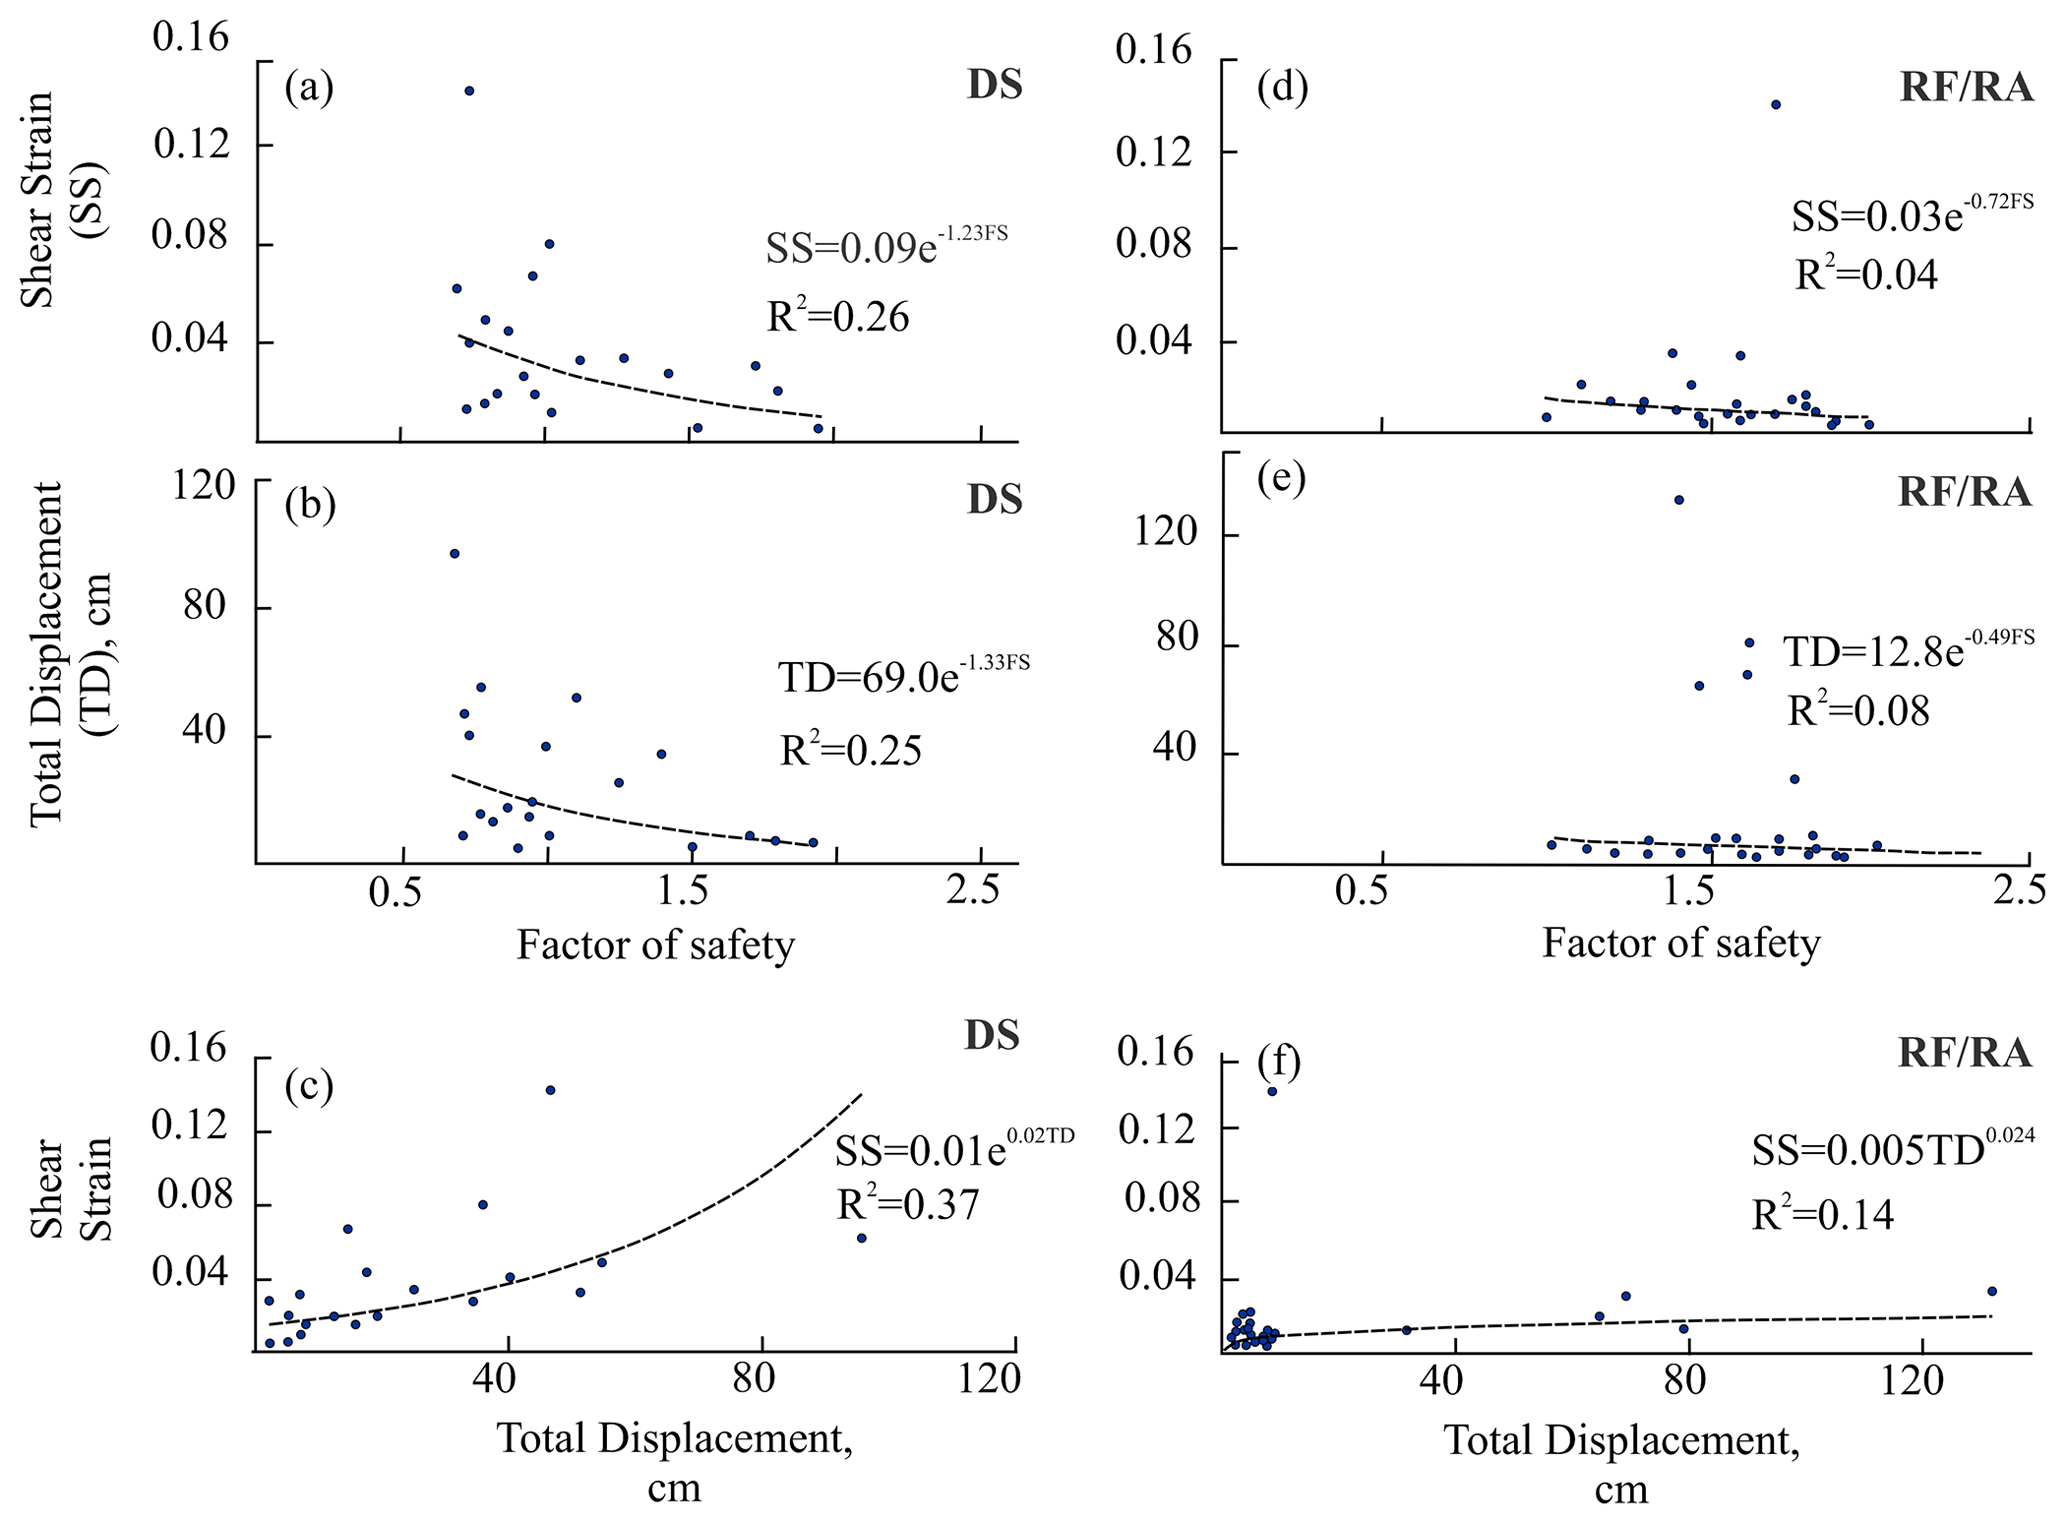
Figure 5Relationship of factor of safety (FS), total displacement (TD), and shear strain (SS). DS, RF, and RA refer to debris slide, rockfall, and rock avalanche, respectively.
4.1 Slope instability regime and parametric output
Out of the 44 landslides studied here, 31 are in a meta-stable state (1 ≤ FS ≤ 2) and 13 are in an unstable state (FS < 1) (Fig. 4). Most of the unstable landslides are debris slides, whereas the majority of the meta-stable landslides are rockfalls and rock avalanches. Debris slides constitute ∼90 % and ∼99 % of the total area and volume of the unstable landslides, respectively. Notably, about ∼70 % of the total human population along the study area resides in the vicinity (∼500 m) of these unstable debris slides (Fig. 4). Rockfalls and rock avalanches constitute ∼84 % and ∼78 % of the area and volume of the meta-stable landslides, respectively. Out of total 20 debris slides, 12 debris slides are found to be in unstable stage, whereas 8 are in a meta-stable condition (Fig. 4). These 20 debris slides occupy m2 area and m3 volume. When comparing the factor of safety (FS) with the total displacement (TD) and shear strain (SS), poor non-linear correlation is achieved (Fig. 5). Since the TD and SS are relatively well correlated (Fig. 5), only the TD and FS are used further. The TD ranges from 7.4±8.9 to 95.5±10 cm for the unstable debris slides and ∼18.8 cm for meta-stable landslides (Fig. 4). Out of 13 rockfalls, 1 belongs to the unstable state and 12 to the meta-stable state (Fig. 4). The TD varies from 0.4 to 80 cm, with the maximum for Bara Kamba rockfall (no. 31). Out of 11 rock avalanches, 1 belongs to the unstable state and 10 to the meta-stable state (Fig. 4). The TD varies from 6.0 to 132.0 cm, with the maximum for the Kandar rock avalanche (no. 25). Relatively high TD is obtained by the rockfall and rock avalanche of the Lesser Himalaya Crystalline region (Fig. 4). The landslides of the Higher Himalaya Crystalline (HHC), Kinnaur Kailash Granite (KKG), and Tethyan Sequence (TS), despite being only 17 out of the total 44 landslides, constituted ∼67 % and ∼82 % of the total area and total volume of the landslides, respectively.
The factor of safety (FS) of debris slides is found to be relatively less sensitive to the change in the value of input parameters than the total displacement (TD) (Fig. 6). In case of the Akpa (Fig. 6a) and Pangi landslides (Fig. 6b), soil friction and field stress have more influence on the FS. However, for TD, the field stress, elastic modulus, and Poisson's ratio of the soil are relatively controlling parameters. The FS and TD of the Barauni Gad landslide (Fig. 6c) are relatively sensitive to soil cohesion and the “mi” parameter. Therefore, it can be inferred that the FS of debris slides is more sensitive to soil friction and field stress, whereas TD is mostly controlled by the field stress and deformation parameters, i.e elastic modulus and Poisson's ratio. Similar to the debris slides, the FS of rockfalls and rock avalanches is found to be relatively less sensitive than TD to the change in the value of input parameters (Fig. 7). The Tirung Khad rockfall (Fig. 7a) and Baren Dogri rock avalanche (Fig. 7b) show dominance of “mi” parameter and field stress in the FS and in TD. In the case of the Chagaon rockfall (Fig. 7c), Poisson's ratio and UCS have relatively more influence on FS and TD. Thus, it can be inferred that the rockfalls and rock avalanches are more sensitive to the “mi” parameter and field stress.
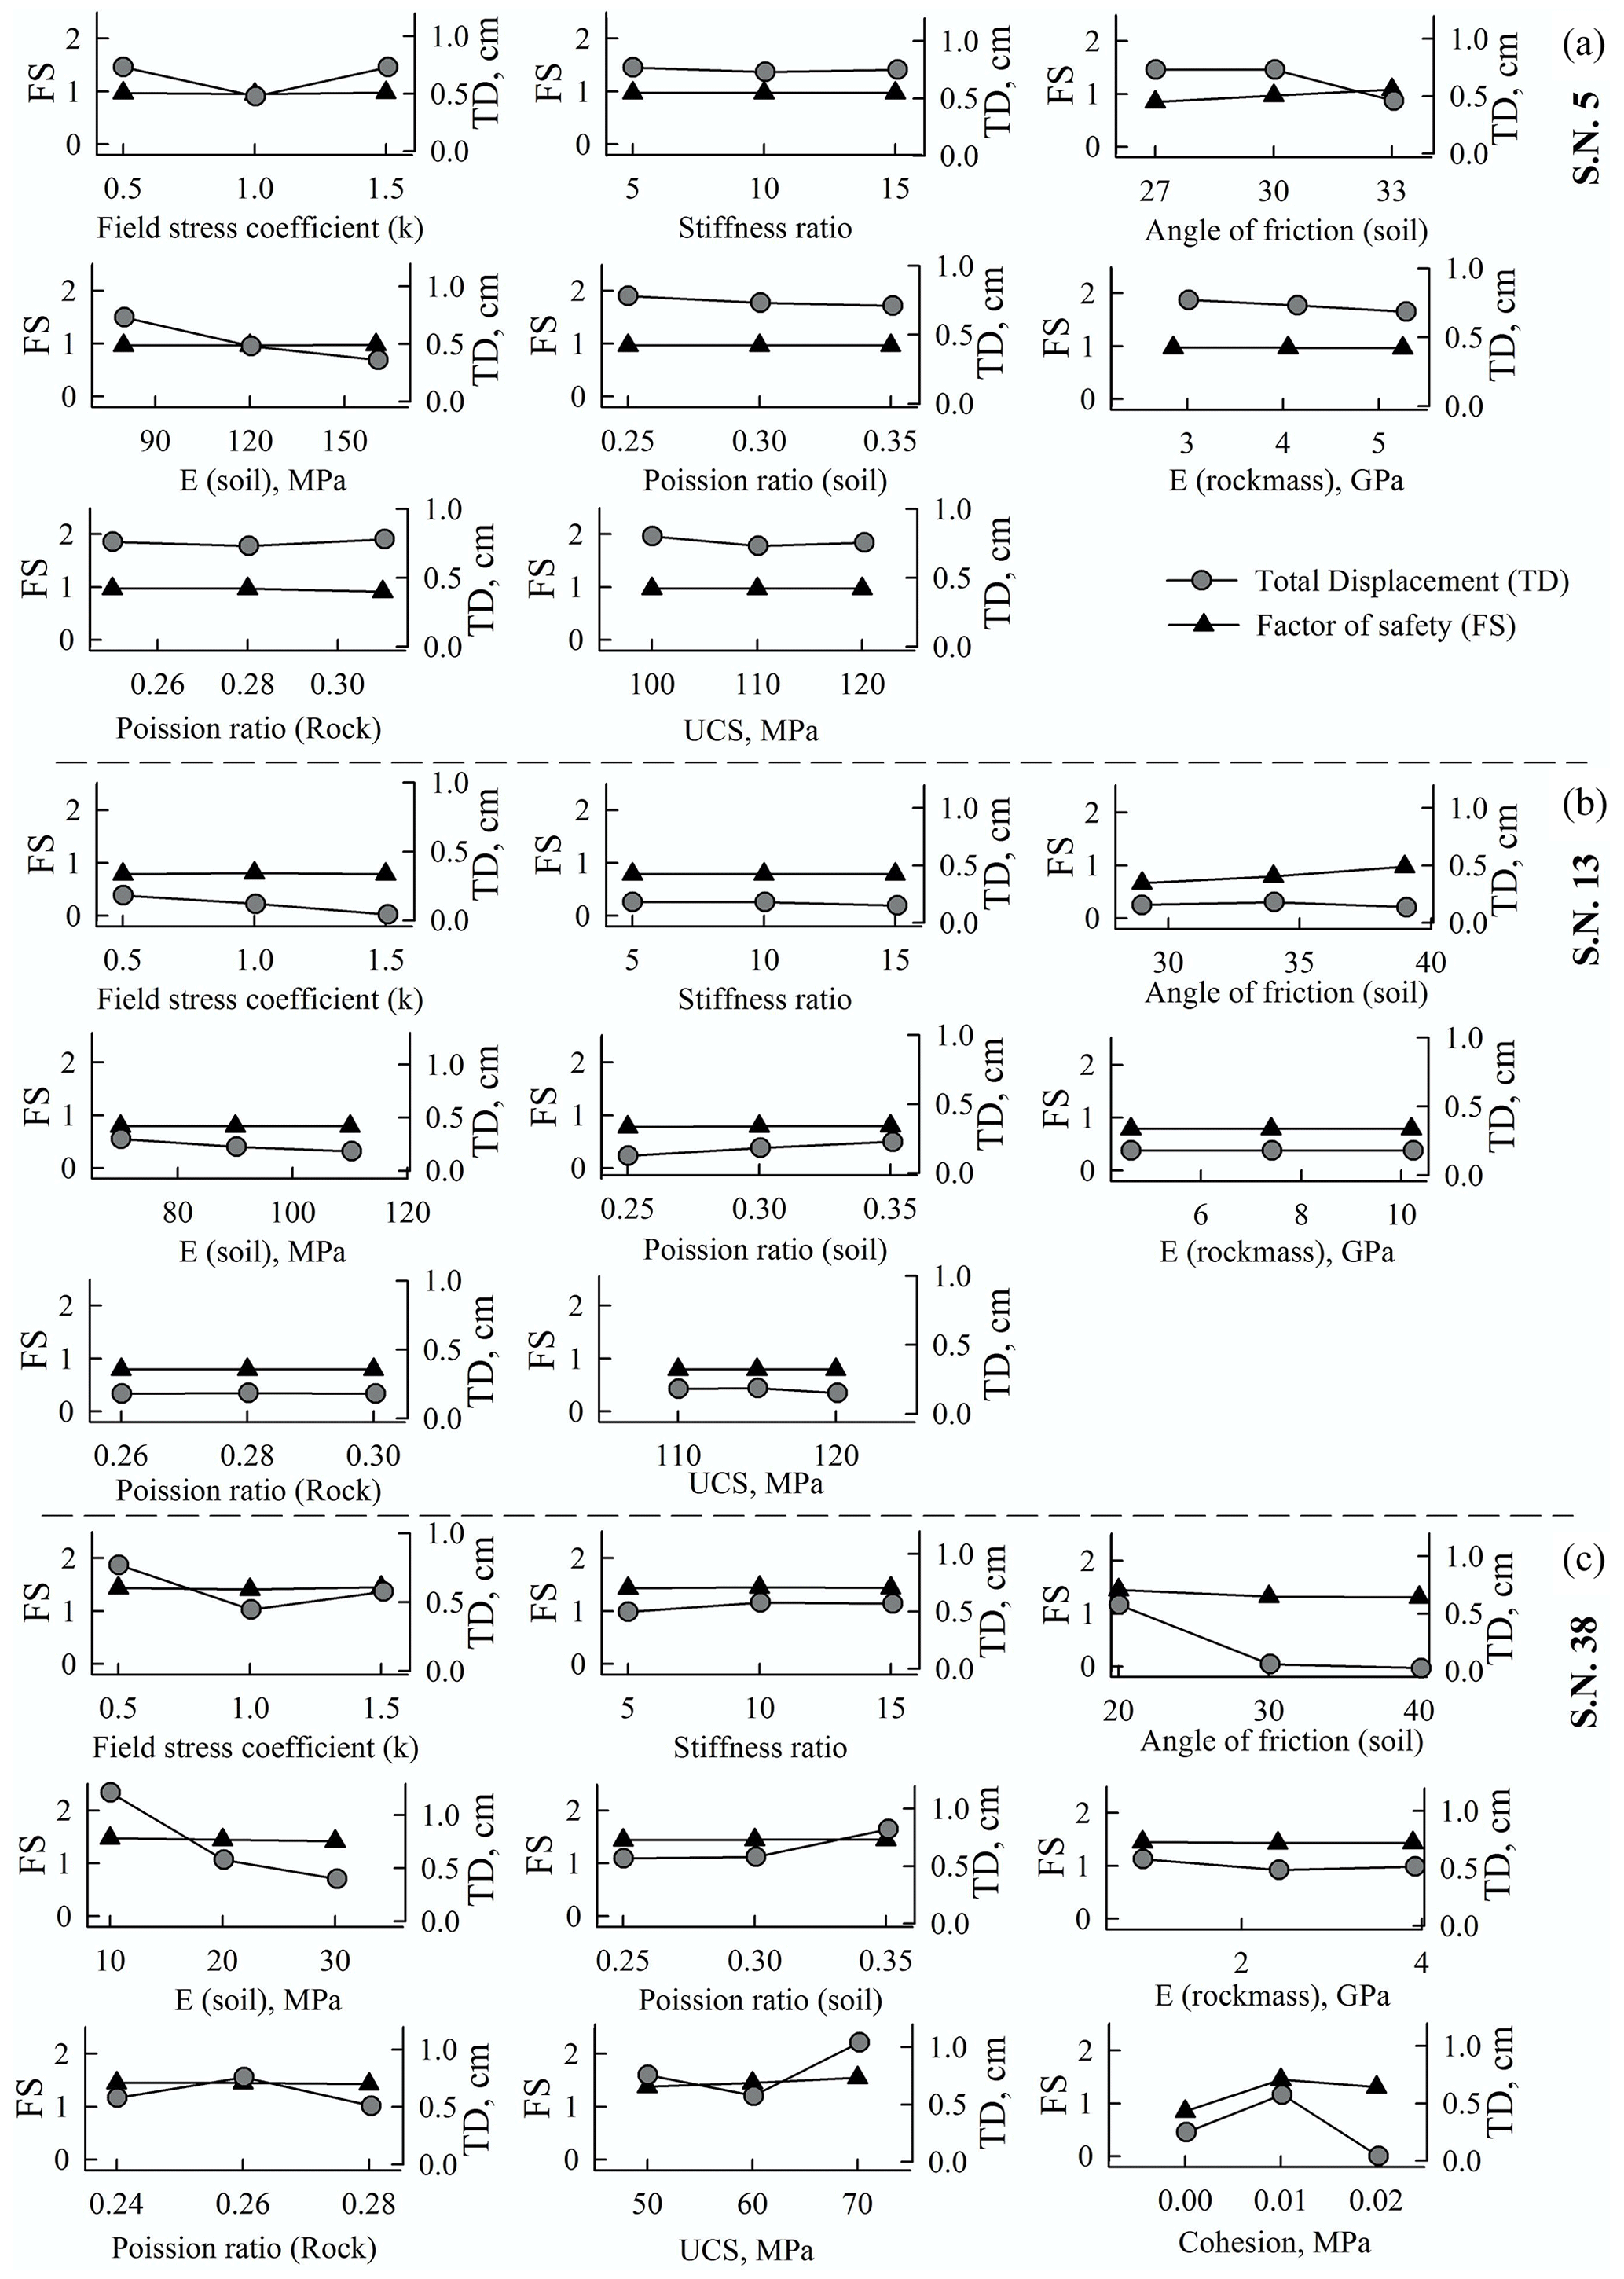
Figure 6Parametric analysis of debris slides: (a) Akpa_III (no. 5), (b) Pangi_III (no. 13), and (c) Barauni Gad_I_S (no. 38). No. refers to the serial no. of landslides in Table 1.
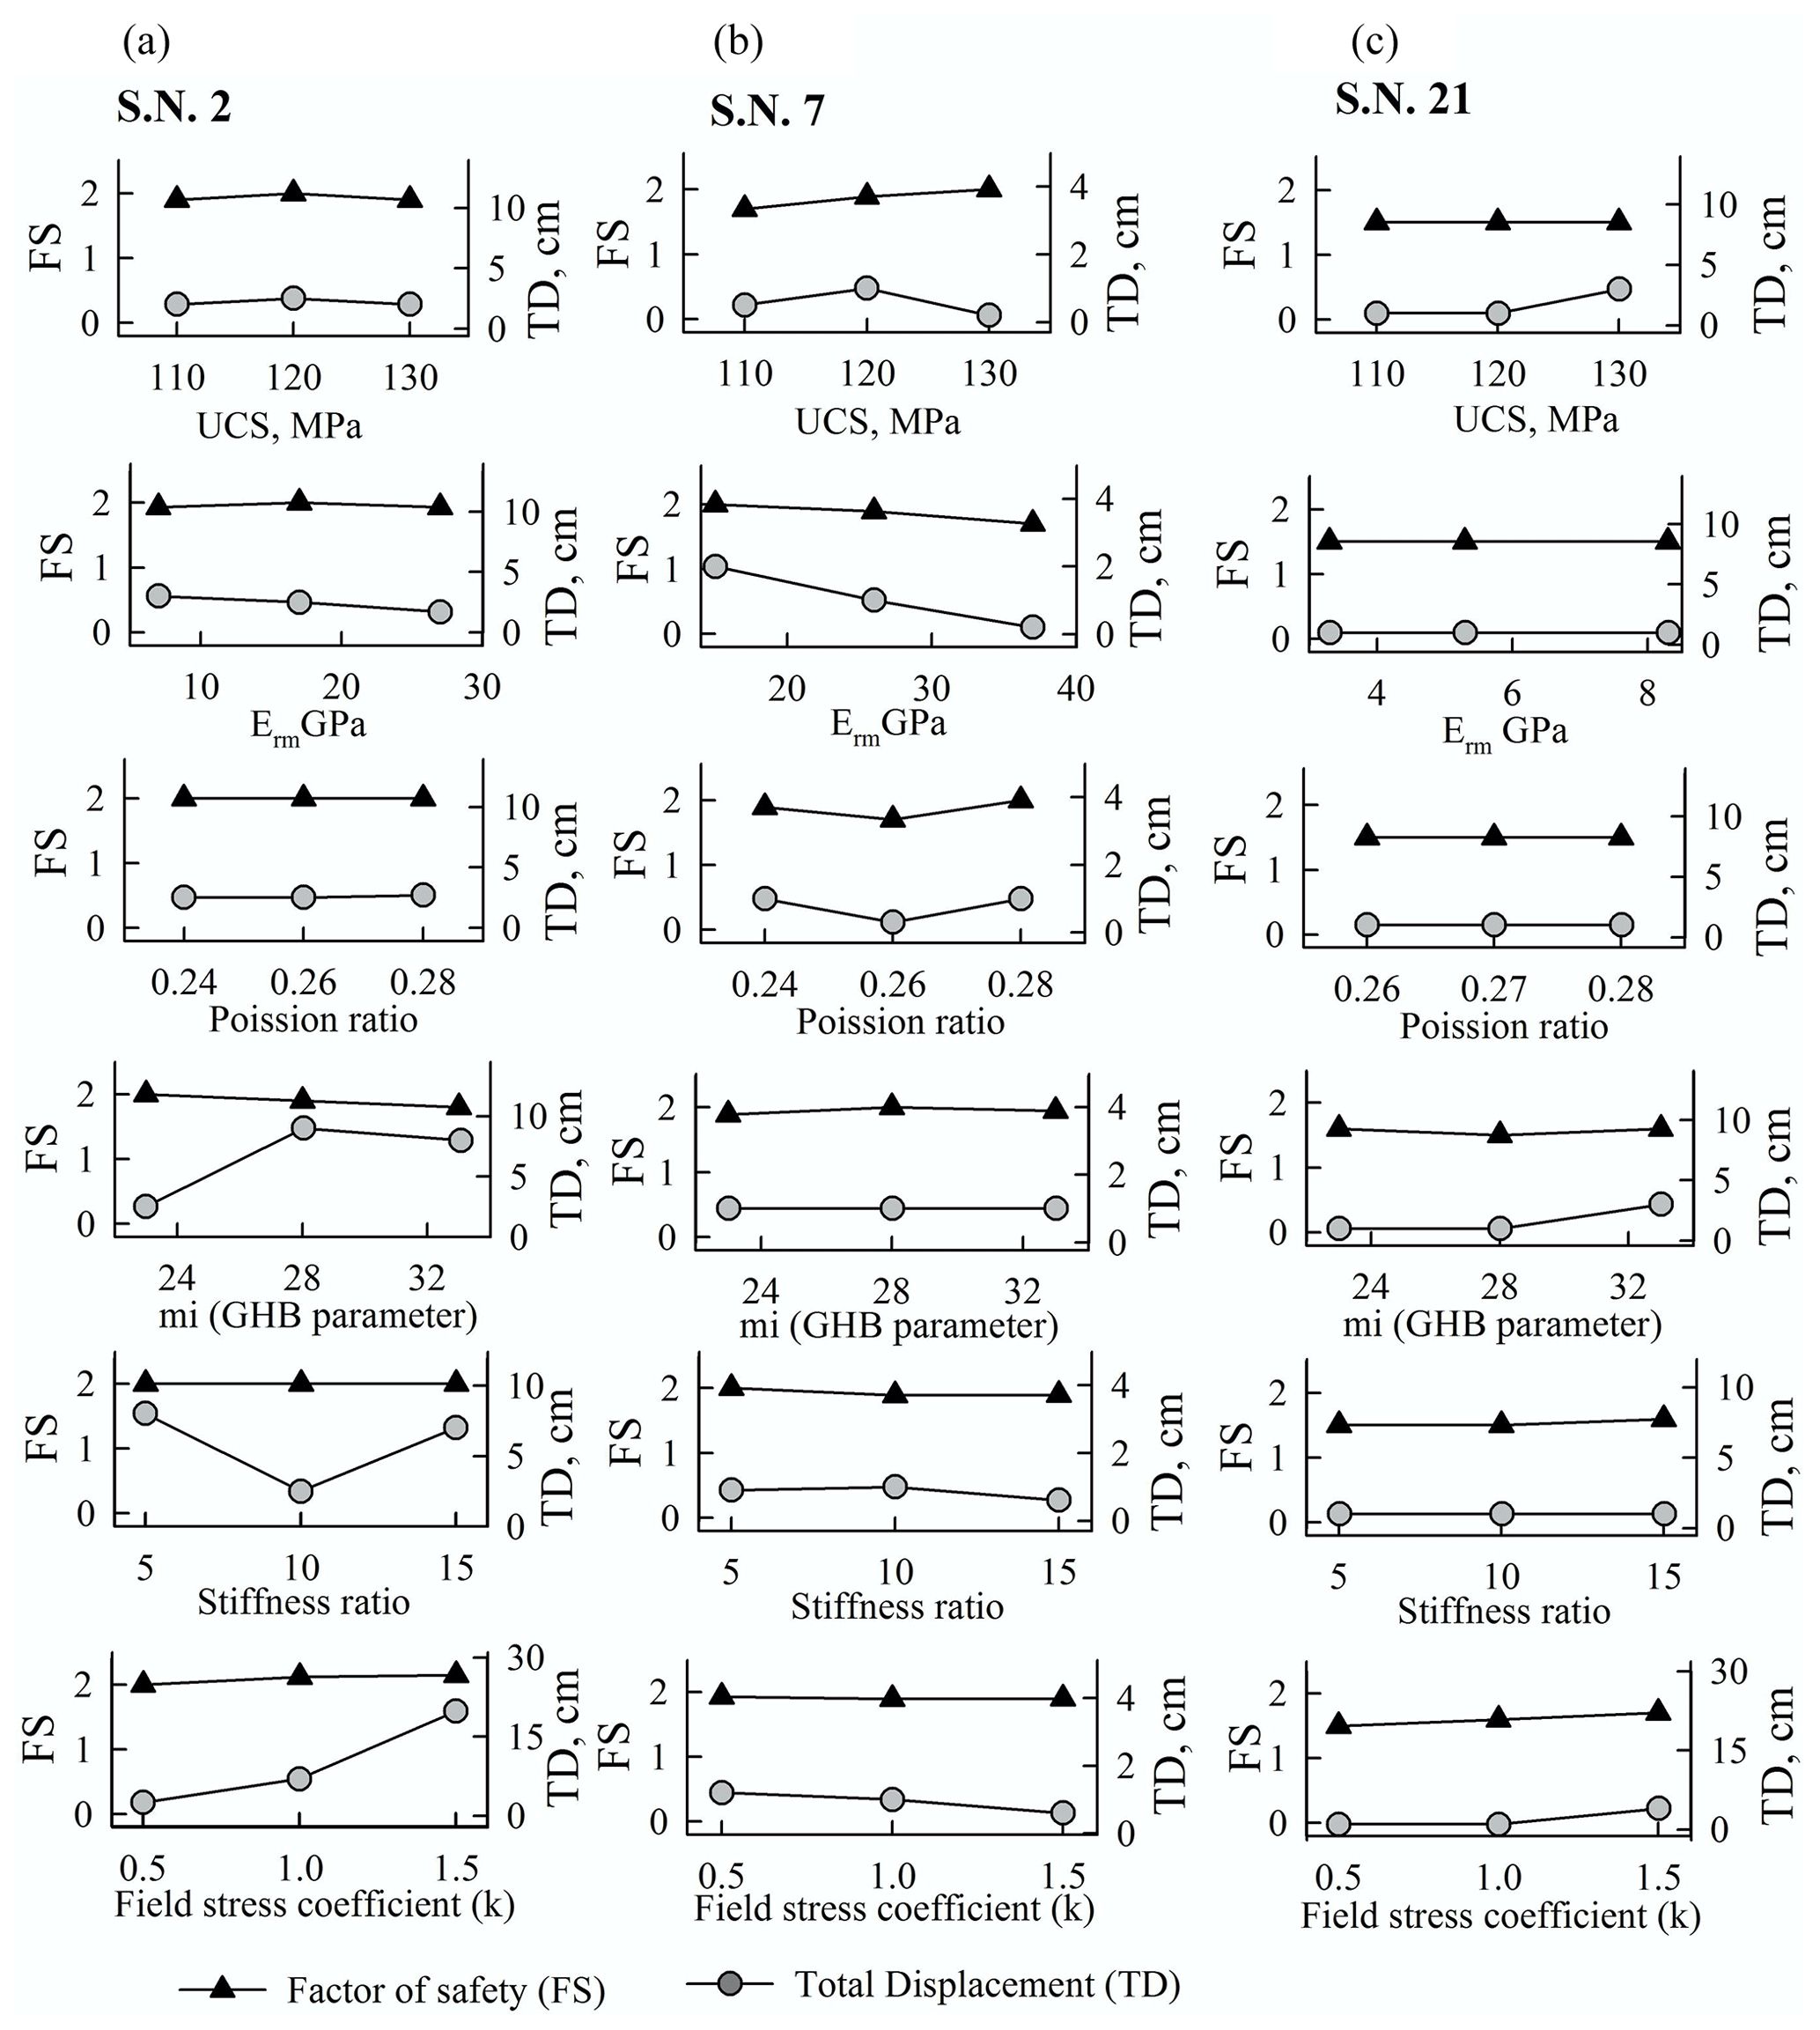
Figure 7Parametric analysis of rockfalls and rock avalanches: (a) Tirung Khad (no. 2), (b) Baren Dogri (no. 7), and (c) Chagaon_II (no. 21).
4.2 Potential landslide damming
Based on the MOI, out of a total of 44 landslides, 5 (nos. 5, 7, 14, 15, 19) are observed to be in the formation domain, 15 in the uncertain domain, and 24 in the non-formation domain (Fig. 8a). The five landslides that have potential to dam the river in case of slope failure comprise m3 volume (Fig. 9a–e). In terms of temporal stability (or durability), out of these five landslides, only one landslide (no. 5) is noted to attain the “uncertain” domain, whereas the remaining four show “instability” (Fig. 8b and d). The lacustrine deposit in the upstream of the Akpa landslide (no. 5) in Fig. 9a shows signs of landslide damming in the past (Fig. 10). The “uncertain” temporal stability indicates that the landslide dam may be stable or unstable depending upon the stream power and landslide volume, which in turn are dynamic factors and may change owing to the changing climate and/or tectonic event. The landslides that have been observed to form the landslide dam but are noted to be in the temporally unstable category (nos. 7, 14, 15, 19) are still considerable, owing to the associated risks of lake impoundment and the generation of secondary landslides. The Urni landslide (no. 19) (Fig. 9e) that damaged part of National Highway road (NH)-05 has already partially dammed the river since 2016 and has potential for further damming (Kumar et al., 2019a). Apart from the no. 5 and no. 19 landslides, the remaining landslides (nos. 7, 14, 15) belong to the Higher Himalaya Crystalline (HHC) region that has been observed to accommodate many landslide dams and subsequent flash flood events in the geological past (Sharma et al., 2017).
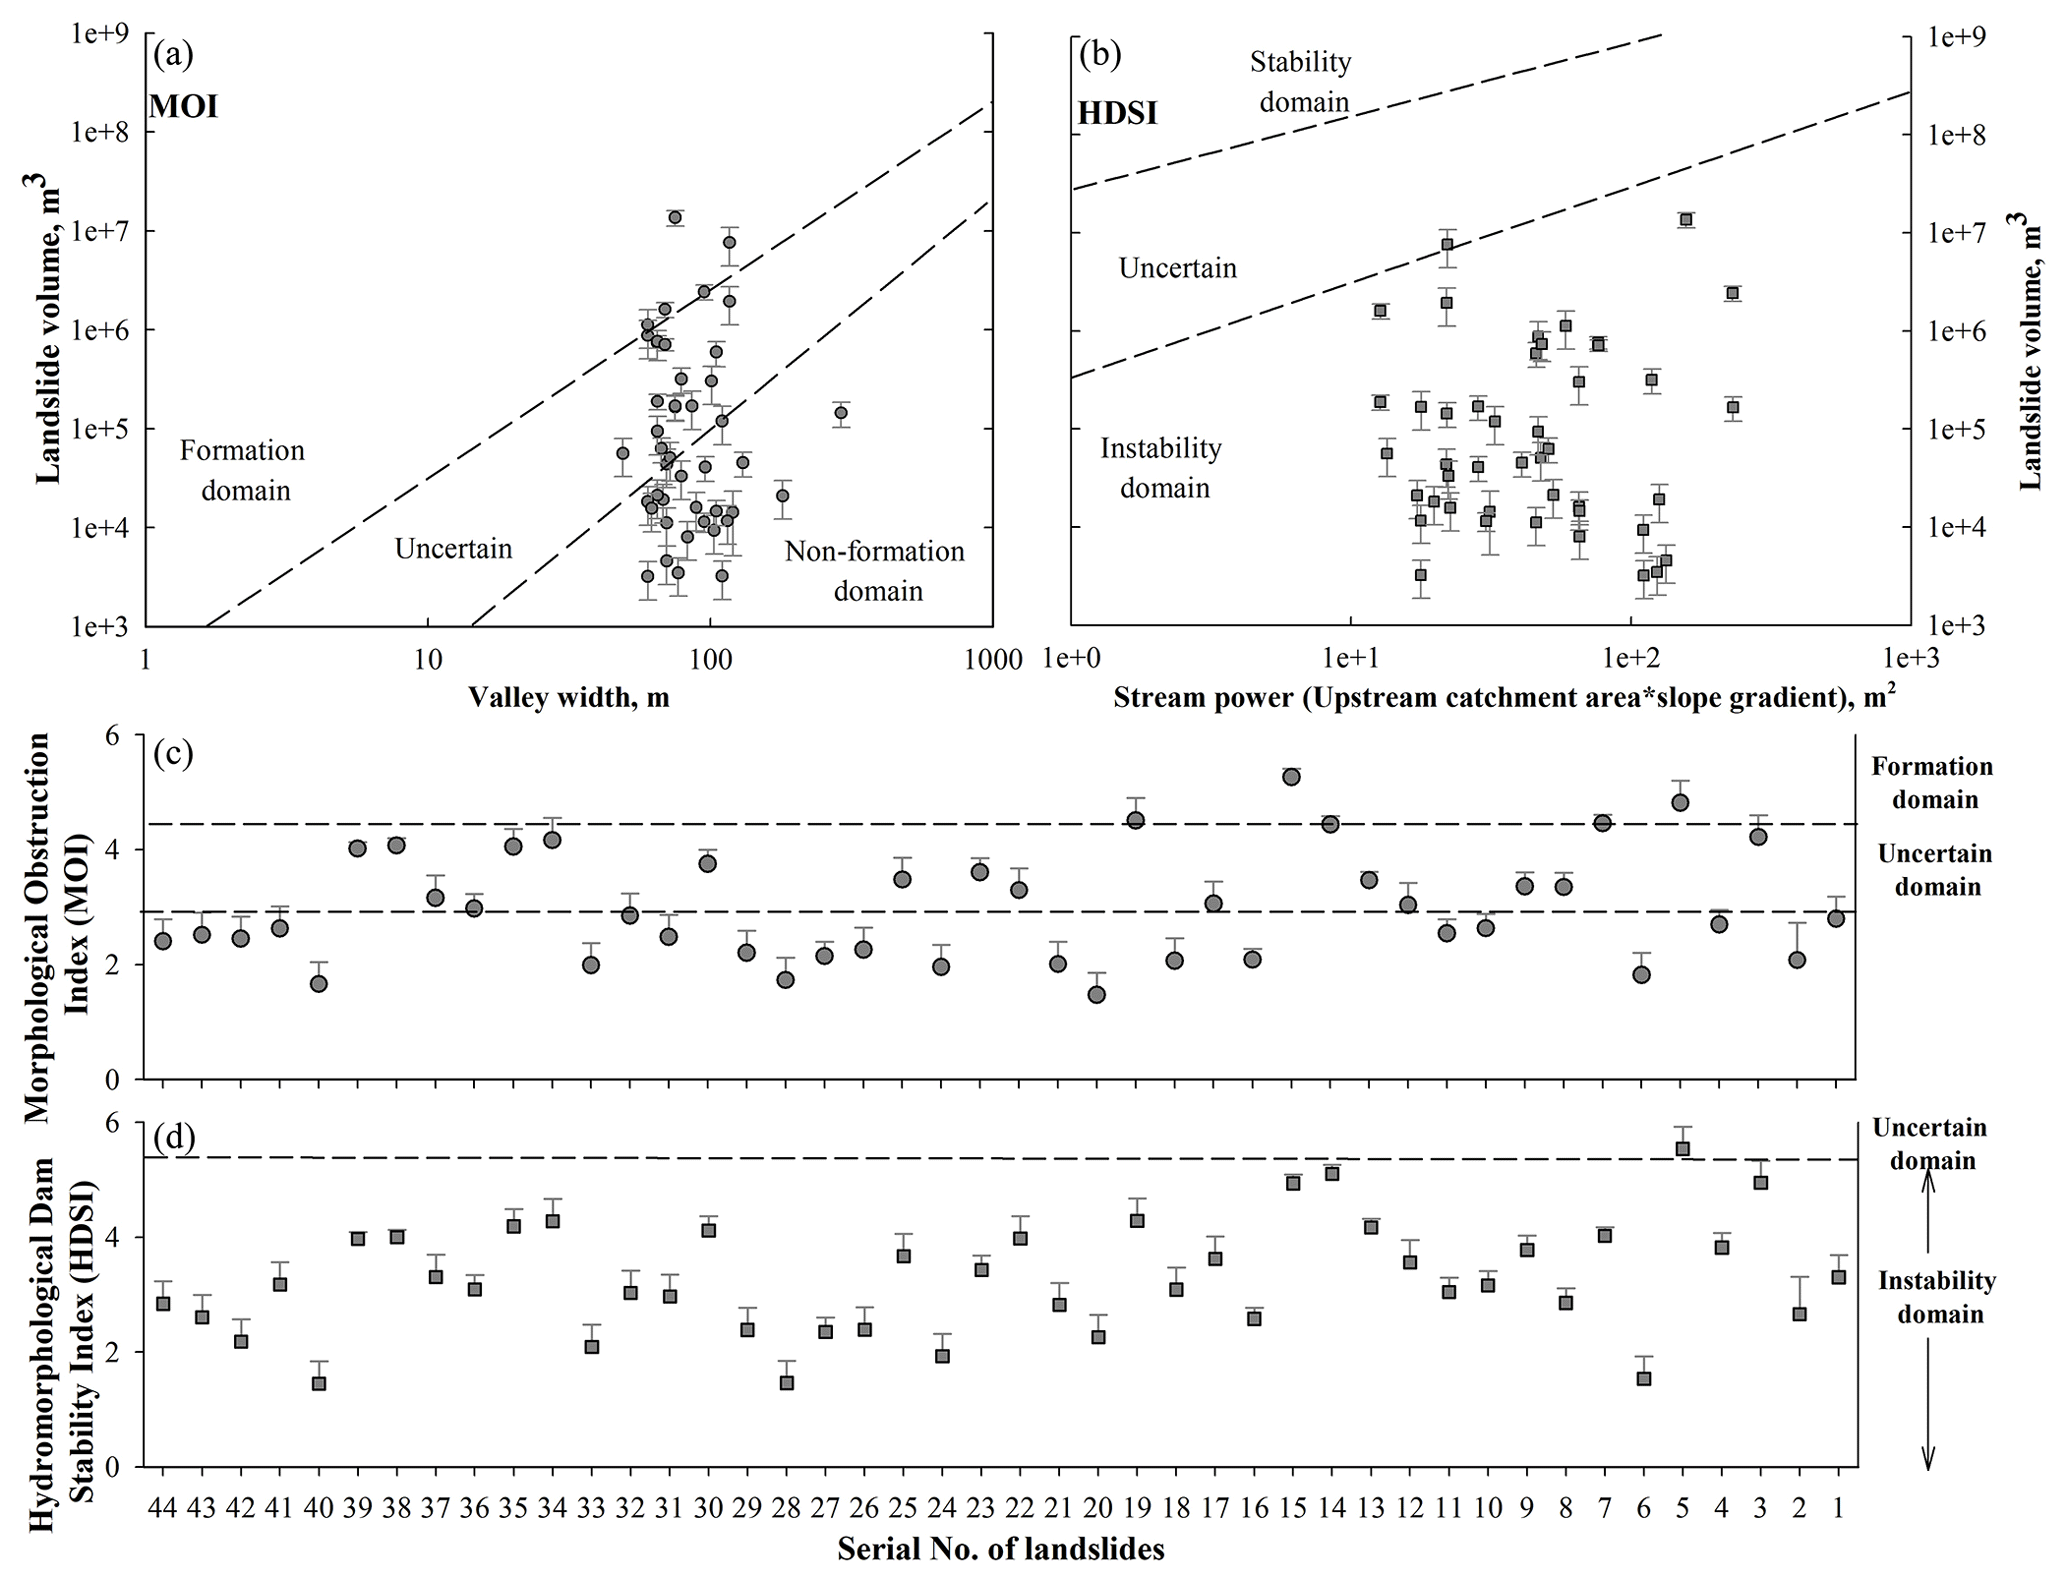
Figure 8Landslide damming indices: (a) Morphological Obstruction Index (MOI), (b) Hydro-morphological Dam Stability Index (HDSI), (c) landslides vs. MOI, and (d) landslides vs. HDSI.
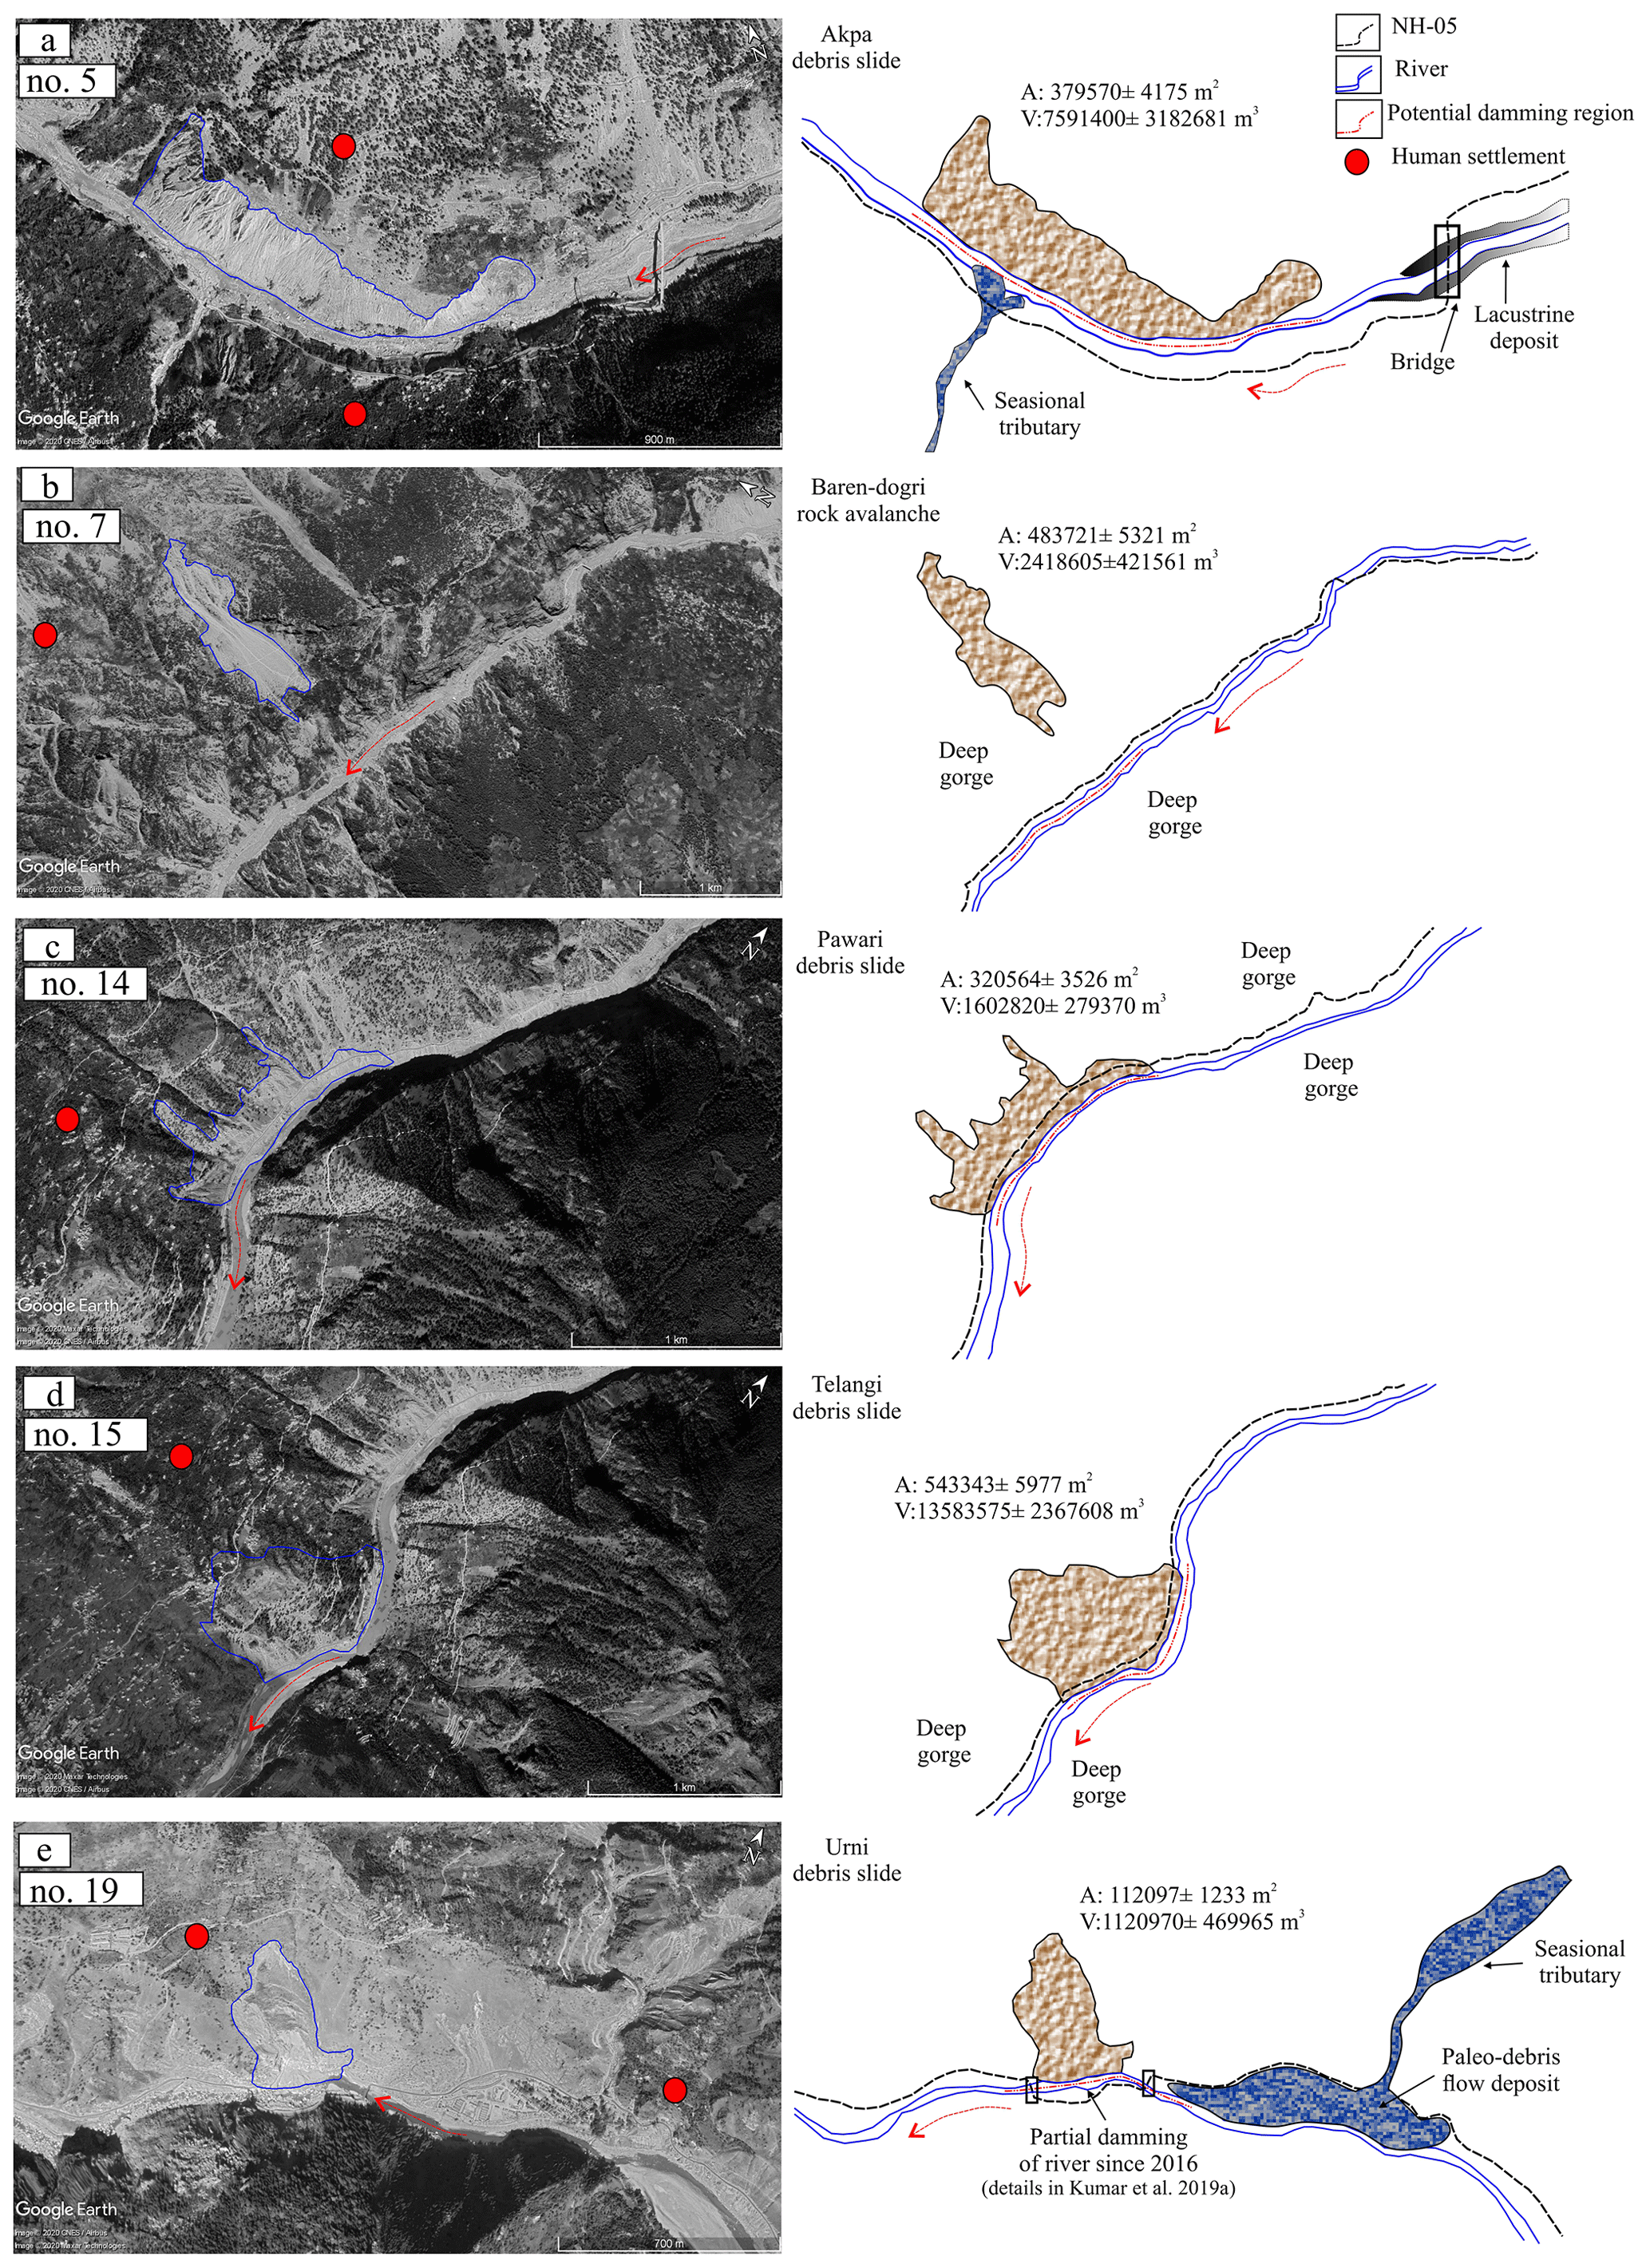
Figure 9Potential landslide damming locations: (a) Akpa_III landslide, (b) Baren Dogri landslide, (c) Pawari landslide, (d) Telangi landslide, and (e) Urni landslide. The dashed red arrow represents the direction of river flow. © Google Earth.
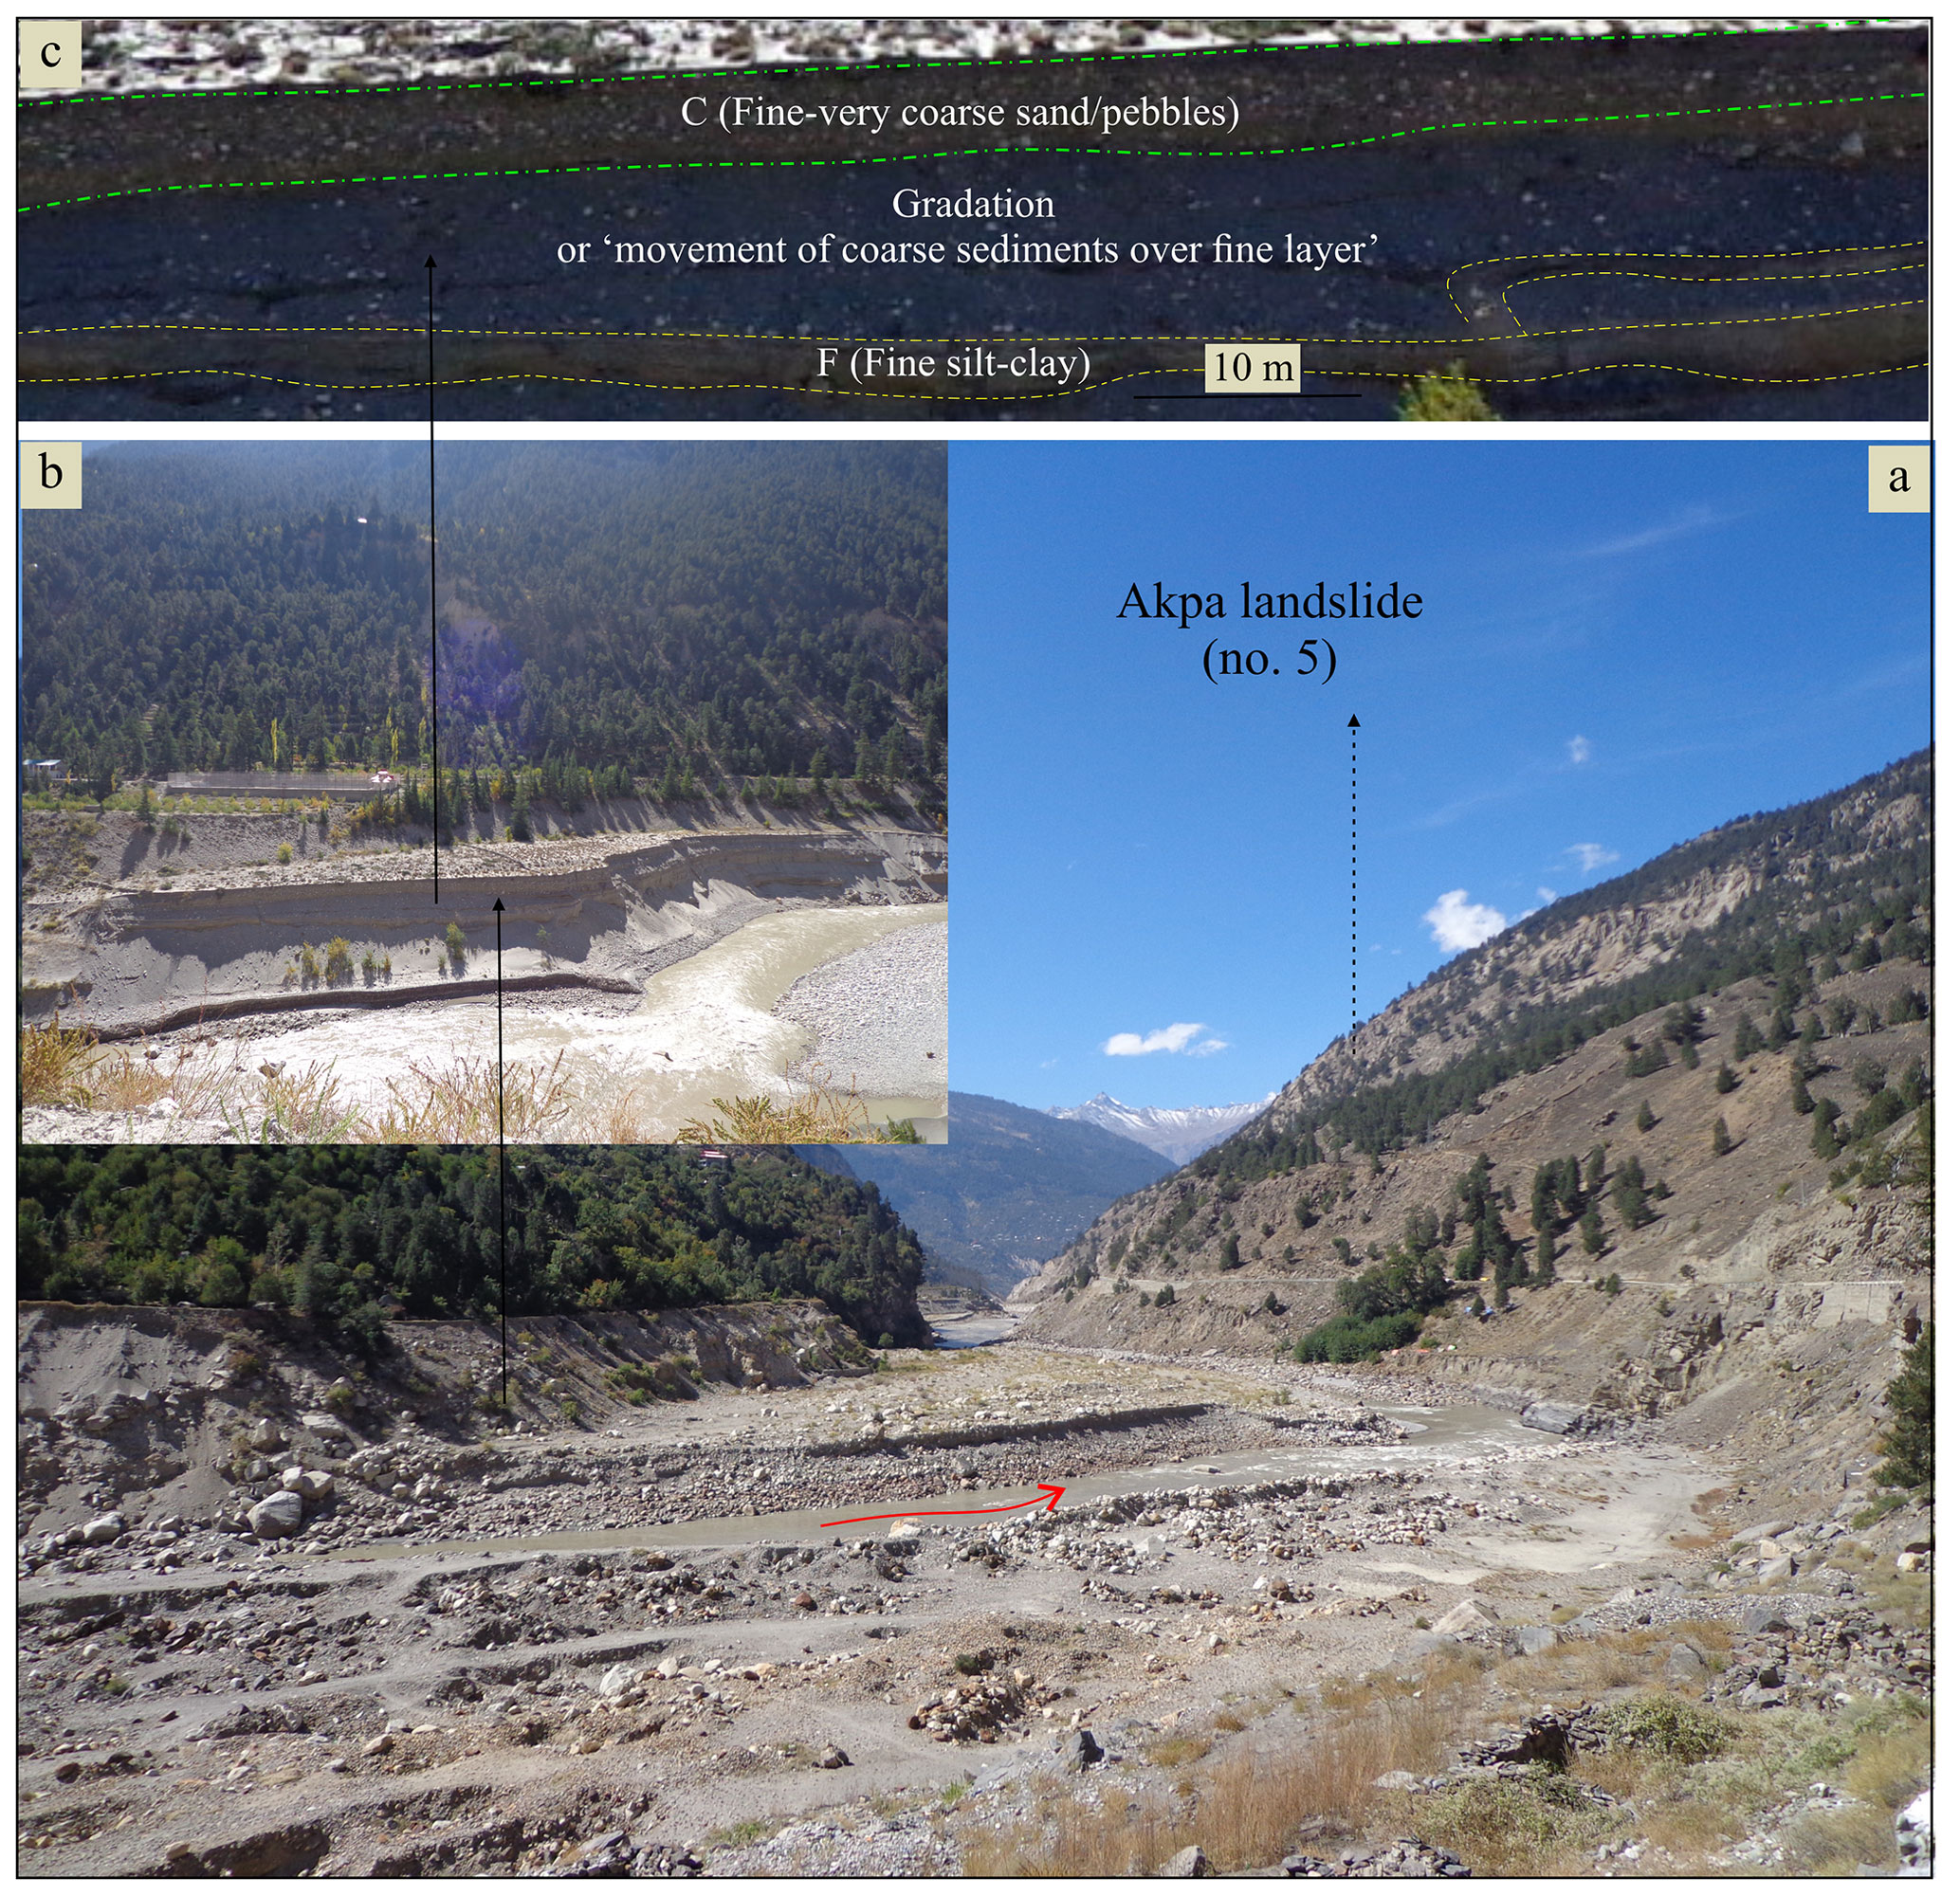
Figure 10Field signatures of the landslide damming near Akpa_III landslide. (a) Upstream view of Akpa landslide with the lacustrine deposit at the left bank. (b) Enlarged view of the lacustrine deposit, with an arrow indicating the lacustrine sequence. (c) Alternating fine–coarse sediments. F and C refer to fine (covered by dashed yellow lines) and coarse (covered by dashed green lines) sediment, respectively.
4.3 Rainfall and earthquake regime
In order to explain the spatio-temporal variation in rainfall, the topographic profile of the study area is also plotted along with the rainfall variation (Fig. 11a). The temporal distribution of rainfall is presented at annual; monsoonal, i.e. Indian Summer Monsoon (ISM; June–September); and non-monsoonal, i.e. Western Disturbance (WD; October–May) (Fig. 11b–d) levels. Rainfall data of the years 2000–2019 revealed a relative increase in the annual rainfall since the year 2010 (Fig. 11b). The Kalpa region (orographic barrier) received relatively high annual rainfall compared to the Rampur, Nachar, and Moorang regions throughout the time period (except during the year 2017). The rainfall dominance at Kalpa is more visible in the non-monsoonal season (Fig. 11d). This difference may be due to the orographic influence on the saturated winds of the WD (Dimri et al., 2015). Further, the rainfall during the monsoon season that was dominant at the Rampur region until the year 2012 has gained dominance in the Kalpa region since the year 2013 (Fig. 11c).
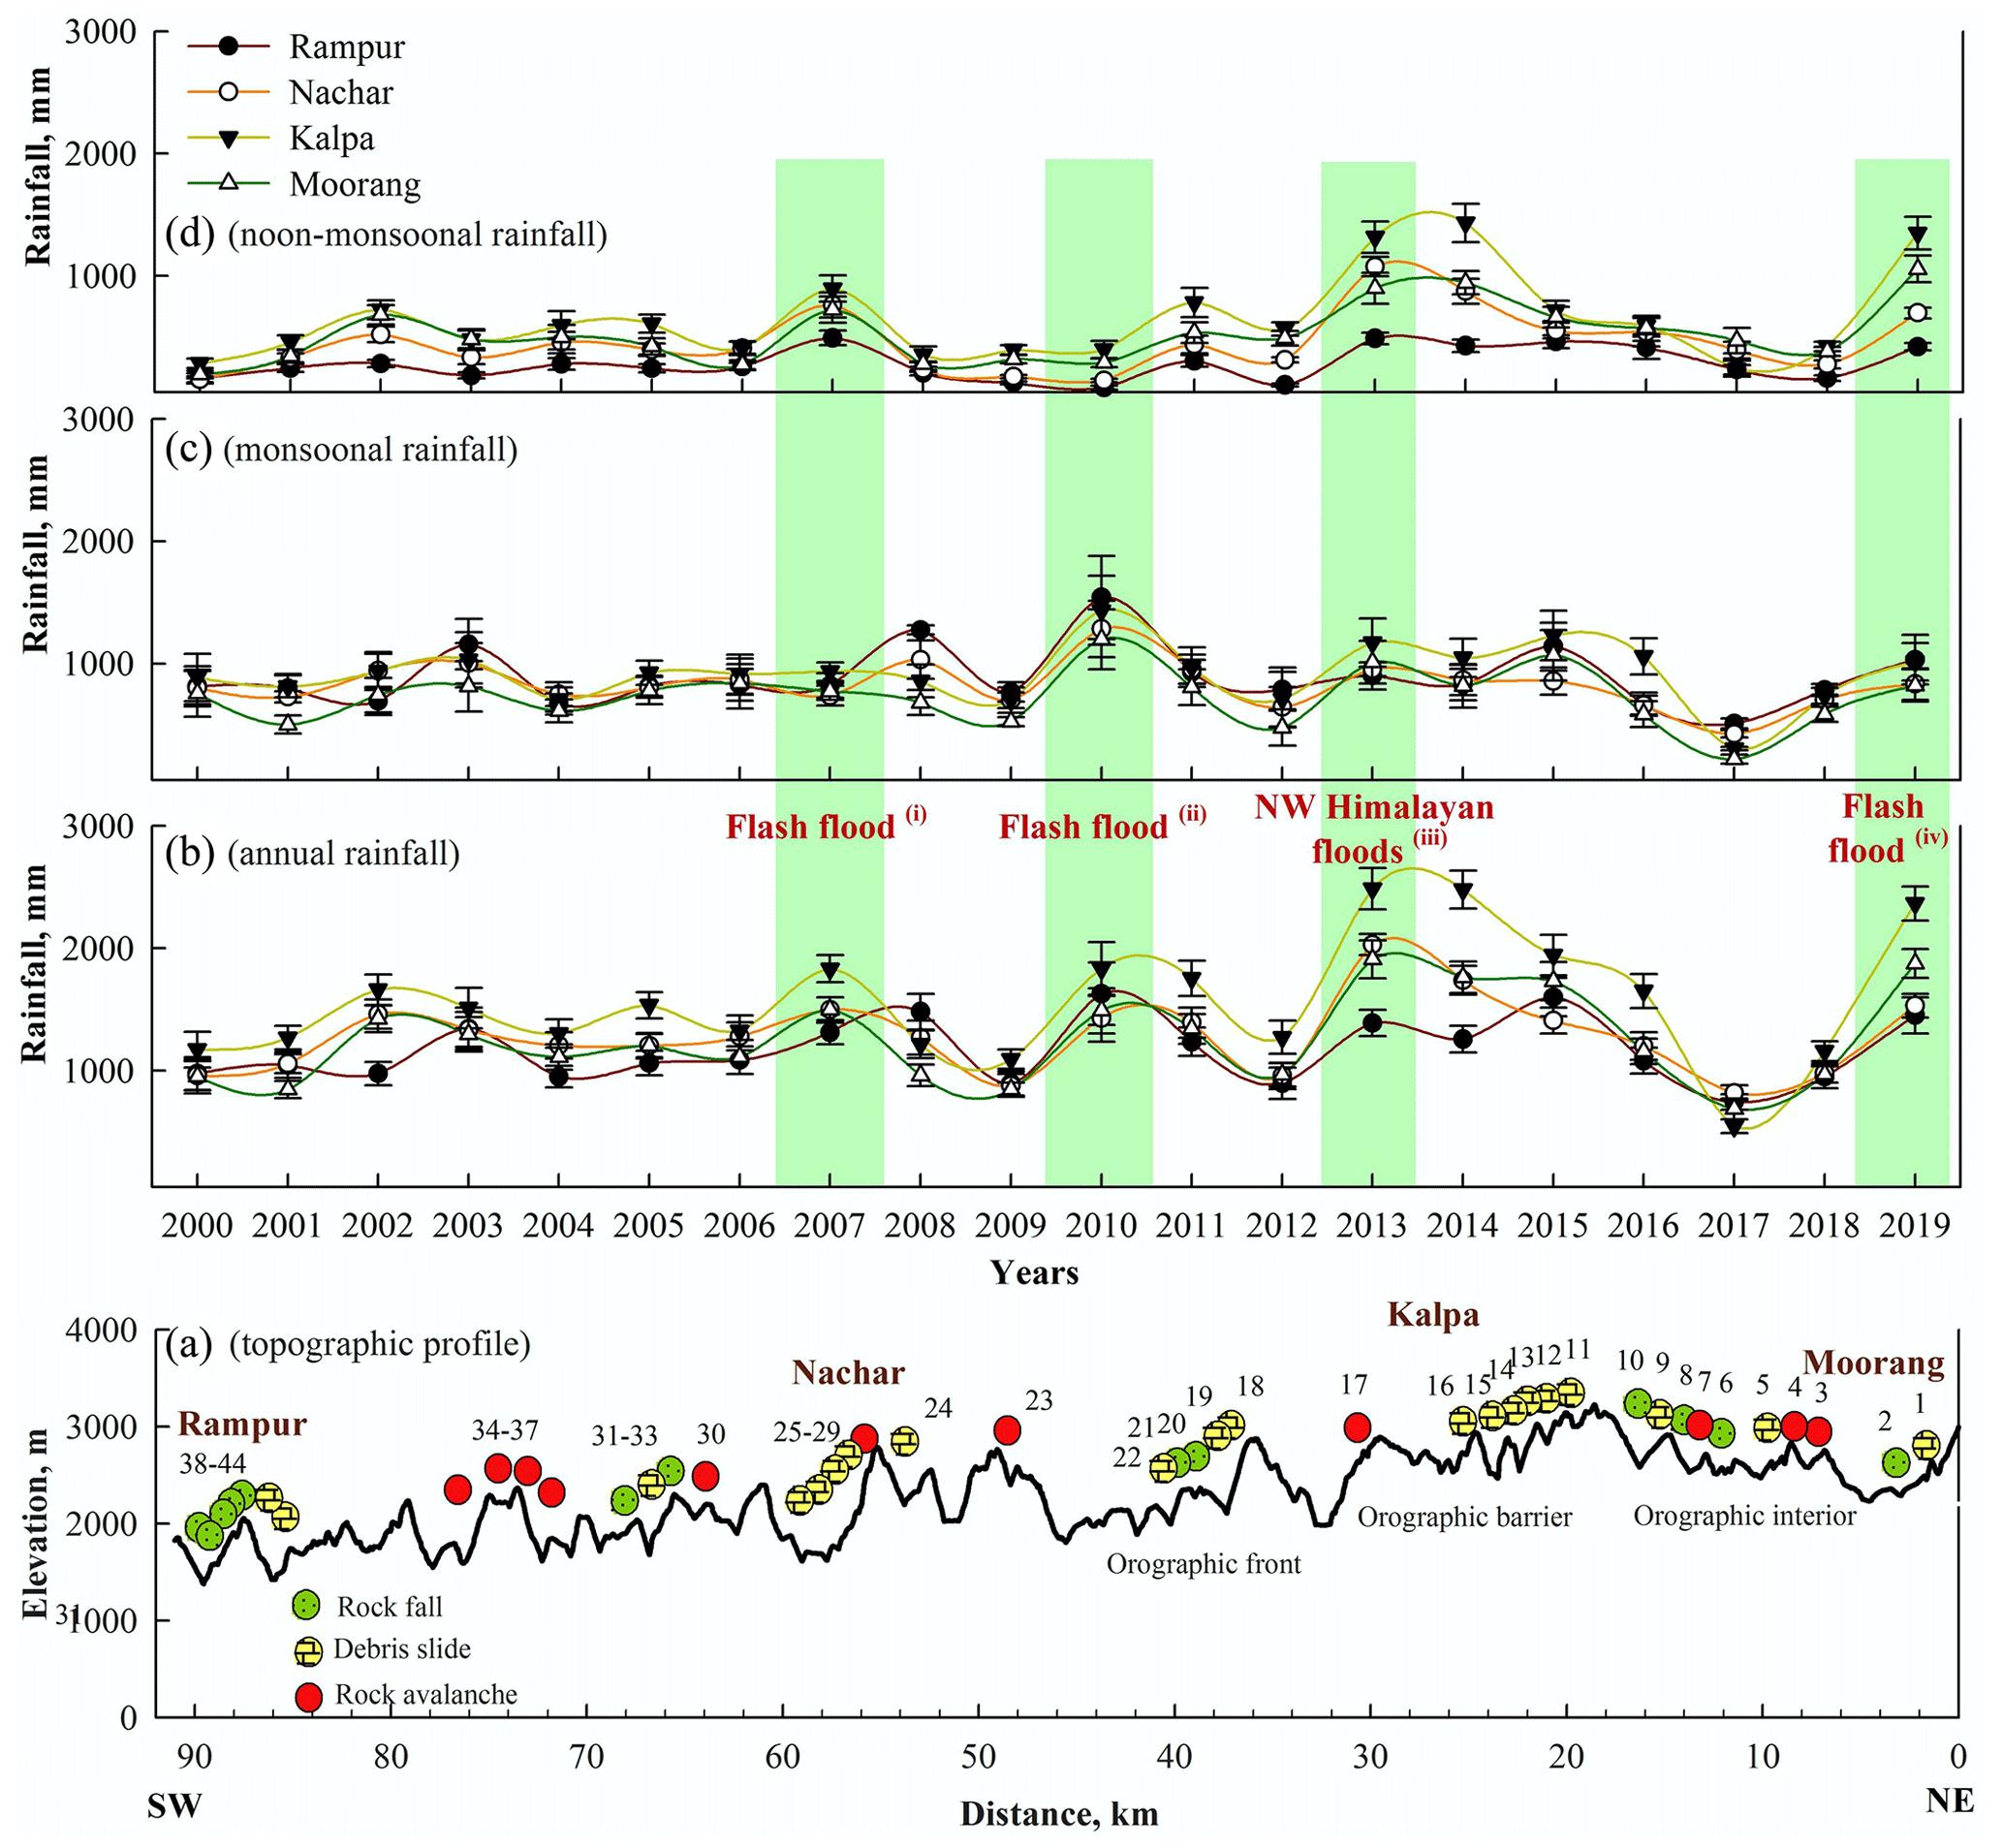
Figure 11Rainfall distribution: (a) topographic profile, (b) annual rainfall, (c) monsoonal (June–September) rainfall, and (d) non-monsoonal (October–May) rainfall. Green bars represent the years of relatively higher rainfall that resulted in flash floods, landslides, and socio-economic loss in the region. The follow references correspond to the flash flood events listed in (b). (i): http://hpenvis.nic.in/, last access: 1 March 2020; Department of Revenue, Govt. of H. P. (ii): http://hpenvis.nic.in/, last access: 1 March 2020. (iii): Kumar et al. (2019a); http://ndma.gov.in/, last access: 1 March 2020. (iv): https://sandrp.in/, last access: 1 March 2020. The numbers 1–44 refer to serial number of the landslides.
Extreme rainfall events of June 2013 that resulted in the widespread slope failure in the NW Himalaya also caused landslide damming in places (National Disaster Management Authority, Govt. of India, 2013; Kumar et al., 2019a). Similar to the year 2013, the years 2007, 2010, and 2019 also witnessed enhanced annual rainfall and associated flash floods and/or landslides in the region (http://hpenvis.nic.in/, last access: 1 March 2020; https://sandrp.in/, last access: 1 March 2020). However, the contribution of the ISM and WD-associated rainfall was variable in those years (Fig. 11). Such frequent but inconsistent rainfall events that possess varied (temporally) dominance regarding ISM and WD are noted to owe their occurrence to the El Niño–Southern Oscillation (ENSO), Equatorial Indian Ocean Circulation (EIOC), and planetary warming (Gadgil et al., 2007; Hunt et al., 2018). The orographic setting is noted to act as a main local factor as evident from the relatively high rainfall (total precipitation = 1748±594 mm yr−1) in the Kalpa region (orographic barrier) in the non-monsoon and monsoon seasons from the year 2010 onwards (Fig. 11). Prediction of the potential landslide damming sites in the region revealed that four (nos. 7, 14, 15, 19) out of five landslides that are predicted to be able to form dams belong to this orographic barrier region. Therefore, in view of the prevailing rainfall trend since the year 2010, regional factors (as discussed above), and orographic setting, precipitation-triggered slope failure events may be expected in the future. If such slope failure events occur at the predicted landslide damming sites, they could certainly dam the river.
The seismic pattern revealed that the region has been hit by 1662 events during the years 1940–2019, with the epicentres located in and around the study area (Fig. 12a). However, ∼99.5 % of these earthquake events had a magnitude of less than 6.0, and only eight events are recorded in the range of 6.0 to 6.8 Ms (http://www.isc.ac.uk/iscbulletin/search/catalogue/, last access: 2 March 2020). Out of these eight events, only one event, i.e. at 6.8 Ms (19 January 1975), has been noted to have induced widespread slope failures in the study area (Khattri et al., 1978). The majority of the earthquake events in the study area occurred in the vicinity of the N–S oriented trans-tensional Kaurik–Chango fault (KCF) that accommodated the epicentre of the 19 January 1975 earthquake (Hazarika et al., 2017; http://www.isc.ac.uk/iscbulletin/search/catalogue/, last access: 2 March 2020). About 95 % of the total 1662 events had their focal depth within 40 km (Fig. 12b). Such a relatively low magnitude and shallow seismicity in the region has been related to the Main Himalayan Thrust (MHT) decollement as a response to the relatively low convergence ( mm yr−1) of the Indian and Eurasian plates in the region (Bilham, 2019) (Fig. 12c). Further, the Himalaya-perpendicular Delhi–Haridwar ridge that is under-thrusting the Eurasian plate in this region has been observed to be responsible for the spatially varied low seismicity in the region (Hazarika et al., 2017). Thus, though the study area has been subjected to frequent earthquakes, chances of earthquake-triggered landslides have been relatively low in comparison to rainfall-triggered landslides and associated landslide damming. For this reason, and due to the lack of reliable dynamic loads for major earthquake events, we have performed static modelling in the present study. However, we intend to perform dynamic modelling in the near future if reliable dynamic load data become available.

Figure 12Earthquake distribution. (a) Spatial variation of earthquakes (© Google Earth). The transparent circle represents the region within a 100 km radius of the Satluj River (blue line). The dashed black line represents the seismic dominance around the Kaurik–Chango fault. (b) Earthquake magnitude vs. focal depth. The dashed red region highlights the concentration of earthquakes within 40 km depth. (c) Cross section view (based on Hazarika et al., 2017; Bilham, 2019). The dashed red circle represents the zone of strain accumulation caused by the Indian and Eurasian plate collision (Bilham, 2019). ISC: stands for International Seismological Centre. HFT stands for Himalayan Frontal Thrust.
4.4 Run-out analysis
All five landslides (nos. 5, 7, 14, 15, and 19 in Fig. 9) that are predicted to form potential landslide dams in case of slope failure were also used for the run-out analysis to evaluate expected run-out distances in the event of reactivation and failure in the future. Results are as follows.
4.4.1 Akpa landslide (no. 5)
Though it is difficult to ascertain the extent to which the predicted debris flow might contribute in the river blockage, it will certainly block the river in view of ∼38 m high debris material with a ∼50 m wide run-out across the channel in this narrow part of river valley (Fig. 9a), even at the maximum value for the coefficient of friction (i.e., μ=0.3) (Fig. 13a). Notably, not only the run-out extent but also the flow height decrease when increasing the friction value (Fig. 13a1–a3). The maximum friction takes into account the shear resistance by slope material and the bed load on the river channel. However, apart from the frictional characteristics of run-out path, turbulence of a debris flow also controls its dimension and hence consequences like potential damming. Therefore, different values of turbulence coefficient (ξ) were used (Table 4). The resultant flow height (representing nine sets of modelled debris flows obtained using μ=0.05, 0.1, and 0.3 and ξ=100, 200, and 300 m s−2) attains its peak value, i.e. 39.8±4.0 m, at the base of the central part of landslide (Fig. 14a).
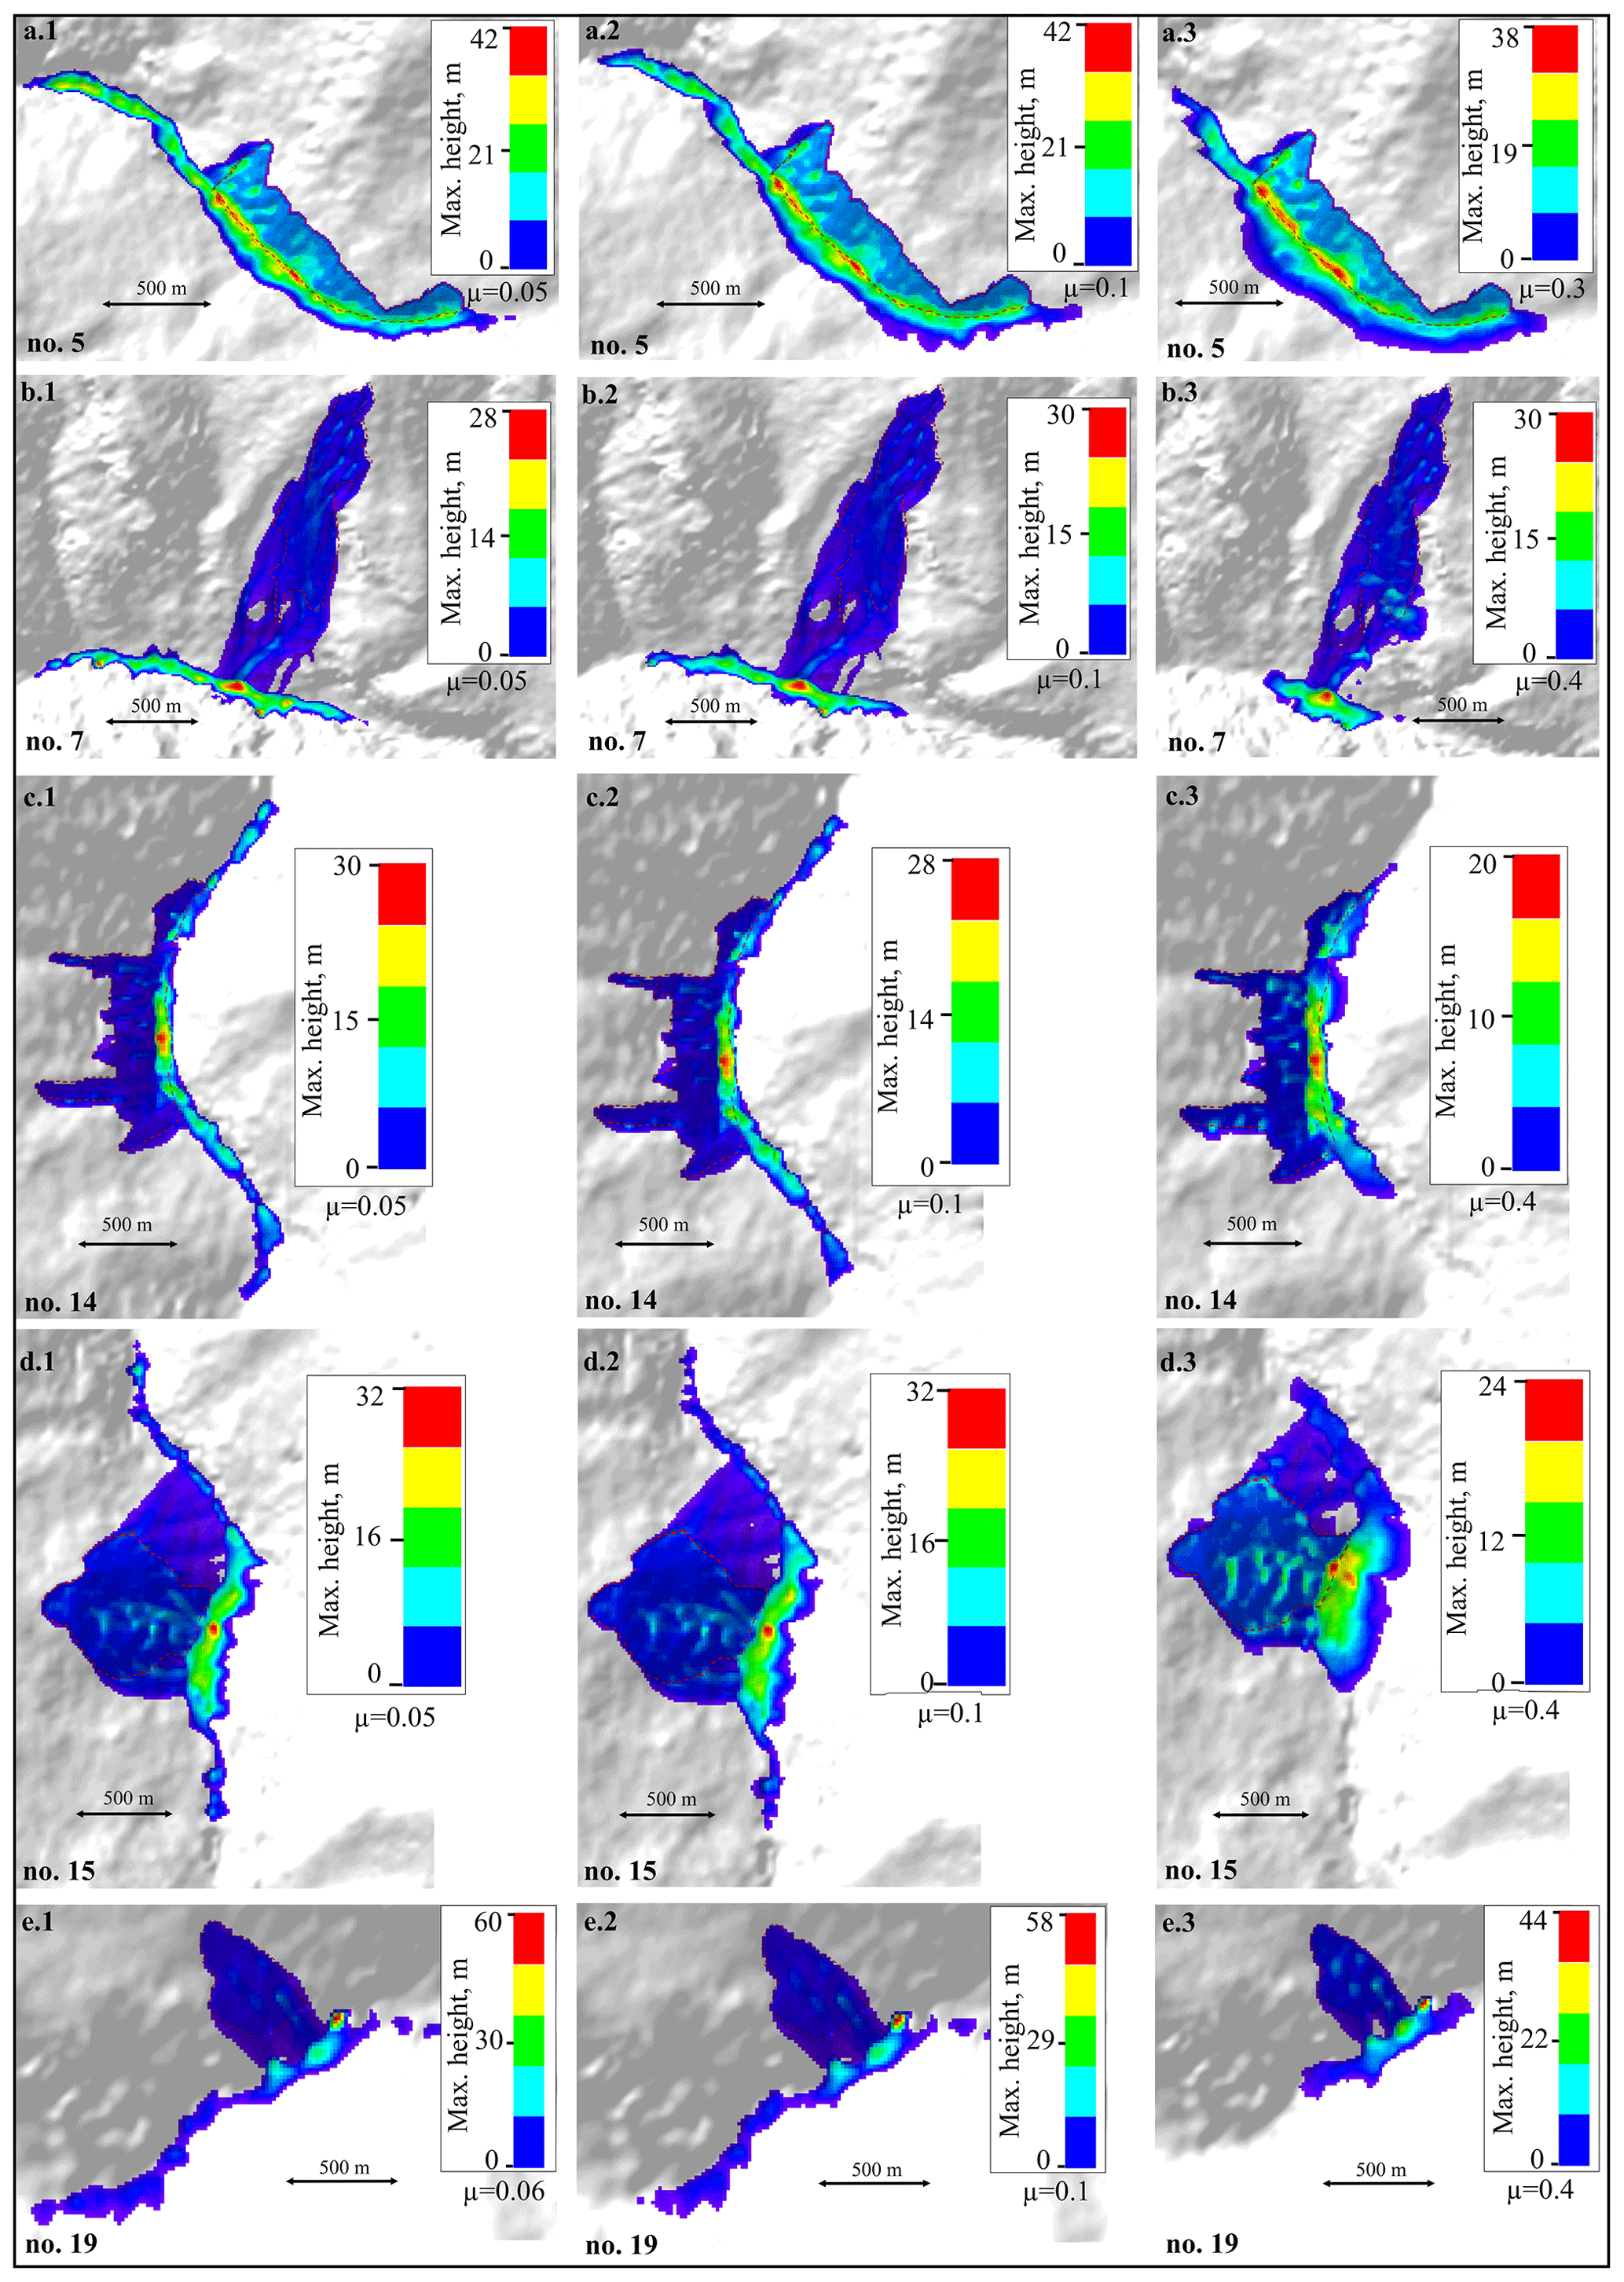
Figure 13Results of the run-out analysis. μ refers to the coefficient of friction.

Figure 14Results of the run-out analysis at different values of μ and ξ. μ and ξ refer to the coefficient of friction and turbulence, respectively.
4.4.2 Baren Dogri landslide (no. 7)
At the maximum friction value (μ=0.4), the Baren Dogri landslide would attain a peak value of flow height, i.e. ∼30 m, at the base of the central part of the landslide (Fig. 13b). Similar to the valley configuration around the Akpa landslide (Sect. 4.4.1), the river valley attains a narrow and deep gorge setting here (Fig. 9b). The maximum value of debris flow height obtained using the different μ and ξ values is 25.6±2.1 m (Fig. 14b). Flow material is also noted to attain more run-out in upstream direction of river (∼1100 m) than in the downstream direction (∼800 m). This spatial variability in the run-out length might exist due to the river channel configuration, as the river channel in the upstream direction is relatively narrow compared to the downstream direction.
4.4.3 Pawari landslide (no. 14)
The Pawari landslide attains maximum flow height of ∼20 m at the maximum friction of the run-out path (μ=0.4) (Fig. 13c). The resultant debris flow that is achieved using the different values of μ and ξ parameters attains a peak value of 24.8±2.7 m and decreases gradually with a run-out of ∼1500 m in the upstream and downstream directions (Fig. 14c). This landslide resulted in a relatively long run-out of ∼1500 in the upstream and downstream directions. Apart from the landslide volume affecting the run-out extent, valley morphology also controls the extent, as is evident from the previous landslides. The river channel in the upstream and downstream directions from the landslide location is observed to be narrow (Fig. 9c).
4.4.4 Telangi landslide (no. 15)
The Telangi landslide resulted in a peak debris flow height of ∼24 m at the maximum friction (μ=0.4) (Fig. 13d). Upon increasing the friction of run-out path, flow run-out decreased along the river channel but increased across the river channel, resulting into possible damming. The debris flow after taking into account different values of μ and ξ parameters attains a peak value of 25.0±4.0 m (Fig. 14d). Similar to Baren Dogri landslide (no. 7), material attained more run-out in the upstream direction of the river (∼1800 m) than in the downstream direction (∼600 m); this difference can be attributed to a narrower river channel in the upstream direction than in the downstream direction. The downstream side attains a wider river channel due to the Main Central Thrust (MCT) fault in its proximity (Fig. 1). Since the Pawari and Telangi landslides (nos. 14 and 15) are situated ∼500 m from each other, their respective flow run-outs might mix in the river channel, resulting in a disastrous cumulative effect.
4.4.5 Urni landslide (no. 19)
The Urni landslide is predicted to attain a peak value of ∼44 m debris flow height at the maximum friction value (μ=0.4) (Fig. 13e). After considering different values of the μ and ξ parameters, the debris flow would attain a height of 26.3±1.8 m (Fig. 14e). The relatively wide river channel in the downstream direction (Fig. 9e) results in longer run-out in the downstream direction than in the upstream direction.
This study aimed to determine potential landslide damming sites in the Satluj River valley, NW Himalaya. In order to achieve this objective, 44 active landslides were considered. First, slope stability evaluation of all the slopes at these landslides sites was performed along with a parametric evaluation. Then the geomorphic indices, i.e. the Morphological Obstruction Index (MOI) and Hydro-morphological Dam Stability Index (HDSI), were used to predict the formation of potential landslide dams and their subsequent stability. Rainfall and earthquake regimes were also explored in the study area. Finally, run-out analysis was performed for those landslides that have been observed to form the potential landslide dam.
The MOI revealed that out of 44 active landslides in the Satluj valley, five of them (nos. 5, 7, 14, 15, 19) have the potential to form the landslide dam (Figs. 8 and 9). Upon evaluating the stability of such potential dam sites using the HDSI, one landslide (no. 5) is predicted to attain an “uncertain” domain (5.74 < HDSI < 7.44) in terms of dam stability. The uncertain term implies that the resultant dam may be stable or unstable depending upon the landslide or dam volume, upstream catchment area (or water discharge), and slope gradient (Sect. 3.3). Since this landslide (no. 5) presents clear signs of having already formed a dam in the past, as indicated by the alternating fine–coarse layered sediment deposit (or lake deposit) in the upstream region (Fig. 10), recurrence is expected in the future. Further, run-out analysis of this landslide has predicted a 39.8±4.0 m high debris flow in the event of failure that will block the river completely (Figs. 13a and 14a). However, the durability of the blocking cannot be ascertained as it will depend on the volume of landslide that will be retained in the channel and river discharge.
The remaining four landslides (nos. 7, 14, 15, 19), though showing instability, i.e. HDSI < 5.74, at present, may form dams in the near future as the region accommodating these landslides has been affected by such damming and subsequent flash floods in the past (Sharma et al., 2017). The last one of these, i.e. no. 19 (Urni landslide) has already dammed the river partially and holds potential to completely block the river in the near future (Kumar et al., 2019a). Run-out analysis of these landslides (no. 7, 14, 15, 19) has predicted 25.6±2.1, 24.8±2.7, 25.0±4.0, and 26.3±1.8 m flow height, respectively, which will result in temporary blocking of the river (Figs. 13 and 14). These findings of run-out indicate the blocking of river in the event of slope failure, irrespective of durability, despite the conservative depth as input because only one-quarter of the landslide thickness is used in the run-out analysis (Sect. 3.5).
Stability evaluation of these five landslide slopes (nos. 5, 7, 14, 15, 19) that have potential to form landslide dams revealed that one landslide (no. 7) is meta-stable, while the other four belong to the unstable category (Fig. 4). Further, these four unstable landslide slopes are debris slides in nature. It is worth discussing the implications of FS < 1. The factor of safety (FS) in the shear strength reduction (SSR) approach is a factor by which the existing shear strength of material is divided to determine the critical shear strength at which failure occurs (Zienkiewicz et al., 1975; Duncan, 1996). Since the landslide represents a failed slope, i.e. critical shear strength > existing shear strength, FS < 1 is justifiable. Further, the failure state of a slope in the FEM can be defined by different criteria; the FS of the same slope may vary a little depending upon the usage of failure criteria and the convergence threshold (Abramson et al., 2001; Griffiths and Lane, 1999).
The possible causes of instability (FS < 1) may be a steep slope gradient, the rock mass having low strength, and joints. Three (nos. 7, 14, 15) out of the five landslides that have potential to form dams belong to the tectonically active Higher Himalaya Crystalline (HHC). The notion of steep slope gradient cannot be generalized because the HHC accommodates voluminous (∼105–107 m3) landslides (Fig. 4). These deep-seated landslides require a smooth slope gradient to accommodate the voluminous overburden. Further, the HHC comprises gneiss that has a high compressive strength and geological strength index (Table S2 in the Supplement, Kumar et al. 2021); therefore, the notion of low-strength rock mass also may not be appropriate. However, the jointed rock mass that owes its origin to numerous small-scale folds, shearing, and faults associated with the active orogeny process can be considered the main factor for relatively high instability of debris-slide-type landslides. Since the study area is subjected to the varied stress regime caused by the tectonic structures (Vannay et al., 2004), thermal variations (Singh et al., 2015), and anthropogenic causes (Lata et al., 2015), joints may continue to develop and destabilize the slopes. Apart from these inherent factors, external factors like rainfall and exhumation rate may also contribute to instability of these landslides. This region receives relatively high annual rainfall owing to the orographic barrier setting (Fig. 11) and is subjected to a relatively high exhumation rate of 2.0–4.5 mm yr−1 (Thiede et al., 2009).
Two landslides (nos. 5 and 19) that are also capable of forming potential landslide dams (Figs. 8 and 9a, e) and that are unstable (FS < 1) in nature (Fig. 4) do not belong to the HHC. The first landslide (no. 5) exists at the lithological contact of schist of the Tethyan Sequence and Kinnaur Kailash granite rock mass. A regional normal fault, the Sangla Detachment (SD), passes through this contact. Some prior studies suggest that the SD is an outcome of reactivation of a former thrust fault that has resulted in intense rock mass shearing (Vannay et al., 2004; Kumar et al., 2019b). Owing to its location in the orographic interior region, hillslopes receive very low annual rainfall (Fig. 11) and thus have the least vegetation on the hillslopes in this region. The lack of vegetation on hillslopes has been observed to result in low shear strength of material and hence in instability (Kokutse et al., 2016). Thus, lithological contrast, rock mass shearing, and lack of vegetation are thought to be the main reasons of instability of the no. 5 landslide. The second landslide (no. 19) belongs to the inter-layered schist and gneiss rock mass of the Lesser Himalaya Crystalline (LHC) and is situated at the orographic front where rainfall increases suddenly (Fig. 11). Further, this region is also subjected to the high exhumation rate of 2.0–4.5 mm yr−1 (Thiede et al., 2009). Therefore, lithological contrast, high rainfall, and high exhumation rate are considered the main reasons for the instability of this landslide slope.
The landslides that are inferred to not result in river damming are mostly in the LHC and Lesser Himalaya Sequence (LHS) regions. These regions consist of a majority of the rockfall and rock avalanches that are generally of meta-stable category (Fig. 4). Despite the narrow valley setting, landslides in these regions may not form the potential landslide dam at present, owing to the relatively small landslide volume. The possible causes of their meta-stability may be the high compressive strength and geological strength index of gneiss (Kumar et al., 2021), dense vegetation on the hillslopes (Chawla et al., 2012), relatively lower amount of sheared rock mass in comparison to the HHC region, and relatively lower decrease in land use and land cover (Lata et al., 2015). Maximum total displacement (TD) is also associated with the rockfalls and rock avalanches of this region (Fig. 4).
In the parametric study, soil friction and in situ stress are noted to affect the FS most in the case of debris slides, whereas the FS of rockfalls and rock avalanches are mainly controlled by the “mi” and the in situ stress. The “mi” is a GHB criteria parameter that is equivalent to the friction in the M–C criteria. For the TD of the debris slides, field stress, elastic modulus, and Poisson's ratio were the most important, whereas for rockfalls and rock avalanches, the “mi” parameter and in situ stress played the dominant role (Figs. 6 and 7). Friction has been a controlling factor for shear strength, and its decrease has been observed to result in the shear failure of slope material (Matsui and San, 1992). Since rainfall plays an important role in decreasing the friction of slope material by changing the pore water pressure regime (Rahardjo et al., 2005), frequent extreme rainfall events in the study area since the year 2013 (Kumar et al., 2019a) amplify the risk of hillslope instability. Furthermore, the in situ field stress that has been compressional and/or extensional owing to the orogenic setting in the region may also enhance the hillslope instability (Eberhardt et al., 2004; Vannay et al., 2004). Deformation parameters, e.g. elastic modulus and Poisson's ratio, are also observed to affect the displacement in slope models of the debris slides. Similar studies in other regions have also noted the sensitivity of the elastic modulus and Poisson's ratio on the slope stability (Zhang and Chen, 2006).
The study area has been subjected to extreme rainfall since the year 2010 and has received widespread slope failures and flash floods (Fig. 11b). Three (nos. 7, 14, 15 in Fig. 9) out of five potential landslide dams belong to the Higher Himalaya Crystalline (HHC) that receives relatively more rainfall (Fig. 11). Contrary to the along “Himalayan” arc distribution of earthquakes, the study area has received most of the earthquakes around the N–S oriented Kaurik–Chango fault (Fig. 12a). However, the only major earthquake event was the Mw 6.8 earthquake on 19 January 1975 that resulted in the widespread landslides (Khattri et al., 1978). The low-magnitude recent seismicity in the region has been attributed to the northward extension of the Delhi–Haridwar ridge (Hazarika et al., 2017), whereas the shallow nature is attributed to the MHT ramp structure in the region that allows strain accumulation at shallow depth (Bilham, 2019). Thus, earthquakes have not been a major landslide-triggering process in the region in recent times. Finally, the word “active landslide” refers to the hillslope that is still subjected to the slope failures caused by the various factors. The word “landslide” can be perceived in the following three ways: pre-failure deformations, failure itself, and post-failure displacement (Terzaghi, 1950; Cruden and Varnes, 1996; Hungr et al., 2014). Landslide slopes in this study pertain to the post-failure state that are categorized into “unstable” and “meta-stable” stages based on their existing FS. If an active landslide is not categorized as “unstable”, it means that the existing slope geometry provides it a “meta-stable” stage that might transform into an unstable stage with time due to the stability controlling parameters (Sect. 4.1). Though the field visits were performed in different seasons to cover all the landslides along the study area, there might be a possibility of vegetation growth on the failed slopes, particularly in the LHC and LHS. However, the landslides in the LHC and LHS are mostly rockfall and rock avalanche types because of the deep gorge setting, whereas the vegetation growth generally requires the debris-laden hillslopes. Nonetheless, such aspects will be explored in future work. The HHC and the TS region are subjected to a semi-humid to semi-arid climate, and hence the vegetation type is mostly scattered trees and shrubs. Therefore, such a possibility might not exist in these regions.
A supplementary table involving all the details like landslide dimensions, factors of safety, and the geomorphic indices output of each landslide is provided in the data repository (Kumar et al., 2021).
In view of the possible uncertainties in the predictive nature of the study, the following assumptions and simplifications were made.
-
To account the effect the spatial variability in the slope geometry, 3D models have been in use for the last decade (Griffiths and Marquez, 2007). However, the pre-requisite for the 3D models involves a detailed understanding of slope geometry and material variability in the subsurface that was not possible in the study area of steep and inaccessible slopes. Therefore, multiple 2D sections were chosen wherever possible. To account the effect of sampling bias and material variability, a range of values of input parameters was used (Sect. 4.1).
-
Determination of the debris thickness has been a major problem in the landslide volume measurement, particularly in the steep, narrow river valleys of the NW Himalaya. Therefore, the thickness was approximated by considering the relative altitude of the ground on either side of the deposit, as also performed by Innes (1983). It was assumed that the ground beneath the deposit is regular.
-
The resultant dam volume could be different from the landslide volume due to the entrainment, rock mass fragmentation, pore water pressure, size of debris particles, and washout of landslide material by the river (Hungr and Evans, 2004; Dong et al., 2011; Yu et al., 2014). Therefore, dam volume is presumed to be equal to landslide volume for the worst-case scenario (Sect. 3.3). Stream power is manifested by the upstream catchment area and local slope gradient in the geomorphic indices. It may also vary on a temporal scale owing to the temporally varying water influx from glaciers and precipitation systems, i.e. ISM and WD (Gadgil et al., 2007; Hunt et al., 2018). Though our study is confined to the spatial scale at present, the findings remain subjected to the change in temporal scale.
-
The RAMMS model (Voellmy, 1955; Salm, 1993; Christen et al., 2010) requires the calibrated friction and turbulence values for the run-out analysis. Though the previous debris flow events have not left evidence in the study area, owing to the convergence of the landslide toes with the river channel, a range of μ and ξ values were used in the study in view of the material type and run-out path characteristics.
Despite these uncertainties, studies such as this one are required to minimize the risk and avert possible disasters relating to the terrain when human populations live in the proximity of unstable landslides.
Out of 44 landslides studied in the Satluj valley in the NW Himalaya, five landslides are noted to form a potential landslide dam if failure occurs. Though the blocking duration is difficult to predict, upstream and downstream consequences of these damming events should be carefully considered as the region has witnessed many damming and flash flood events in the past. These five landslides comprise a total landslide volume of 26.3±6.7 M m3. The slopes of four landslides (debris slides) out of these five are unstable, whereas the remaining one (rock avalanche) is meta-stable. Field observations and previous studies have noted the damming events due to these landslides (or the region consisting these landslides) in the past as well. Since the area has witnessed enhanced rainfall and flash floods since the year 2010, findings of the run-out analysis that revealed 24.8±2.7 to 39.8±4.0 m high material flow from these landslides become more crucial. The parametric analysis for the slope stability evaluation revealed that the angle of internal friction of soil, or mi (equivalent to the angle of internal friction), of the rock mass, and in situ field stress are the most controlling parameters for the stability of slopes.
The dataset is uploaded in the open-access repository (Mendeley data) as Kumar et al. (2021) (https://doi.org/10.17632/jh8b2rh8nz.2).
VK conceived the idea and collected the field data. VK and IJ performed the laboratory analysis. All authors contributed to the dataset compilation, numerical simulation, and geomorphic interpretations. All authors contributed to the writing of the final draft.
The authors declare that they have no conflict of interest.
Vipin Kumar and Imlirenla Jamir acknowledge the constructive discussion on the regional-scale study with Hans-Balder Havenith, Vaughan D. Griffiths, and Debi Prasanna Kanungo. Vikram Gupta and Rajinder K. Bhasin acknowledge the help provided through the project MOES/Indo-Nor/PS-2/2015. The authors are thankful to the RAMMS developer for the license. The authors are also grateful to A. Joshua West (Editor), Xuanmei Fan (Associate Editor), and two anonymous reviewers for their insightful comments that improved the final manuscript.
The field visits and laboratory analyses were funded by the Wadia Institute of Himalayan Geology, Dehradun, India.
This paper was edited by Xuanmei Fan and reviewed by two anonymous referees.
Abramson, L. W., Lee, T. S., Sharma, S., and Boyce, G. M.: Slope stability and stabilization methods, 2nd Edn., Wiley, New York, 736 pp., 2001.
Aydin, A.: ISRM suggested method for determination of the Schmidt hammer rebound hardness: revised version, in: The ISRM Suggested Methods for Rock Characterization, Testing and Monitoring: 2007–2014, edited by: Ulusay, R., Springer, Cham, 25–33, https://doi.org/10.1007/978-3-319-07713-0_2, 2008.
Barton, N. and Bandis, S.: Effects of block size on the shear behavior of jointed rock, in: Proceeding of the 23rd US symposium on rock mechanics, American Rock Mechanics Association, Berkeley, 739–760, 1982.
Barton, N. and Choubey, V.: The shear strength of rock joints in theory and practice, Rock Mech., 10, 1–54, https://doi.org/10.1007/BF01261801, 1977.
Barton, N. R.: A model study of rock-joint deformation, Int. J. Rock Mech. Min., 9, 579–602, https://doi.org/10.1016/0148-9062(72)90010-1, 1972.
Barton, N. R. and Bandis, S. C.: Review of predictive capabilities of JRC-JCS model in engineering practice, in: Rock Joints: proceeding of the International Symposium on Rock Joints, edited by: Barton, N. and Stephansson, O., Rotterdam, 603–610, 1990.
Bilham, R.: Himalayan earthquakes: a review of historical seismicity and early 21st century slip potential, Geol. Soc. Spec. Publ., 483, 423–482, https://doi.org/10.1144/SP483.16, 2019.
Bowles, J. E.: Foundation Analysis and Design, 5th Edn., McGraw-Hill, New York, 1996.
Braun, A., Cuomo, S., Petrosino, S., Wang, X., and Zhang, L.: Numerical SPH analysis of debris flow run-out and related river damming scenarios for a local case study in SW China, Landslides, 15, 535–550, https://doi.org/10.1007/s10346-017-0885-9, 2018.
Cai, M., Kaiser, P. K., Tasaka, Y., and Minami, M.: Determination of residual strength parameters of jointed rock masses using the GSI system, Int. J. Rock Mech. Min., 44, 247–265, https://doi.org/10.1016/j.ijrmms.2006.07.005, 2007.
Chawla, A., Kumar, A., Lal, B., Singh, R. D., and Thukral, A. K.: Ecological Characterization of High Altitude Himalayan Landscapes in the Upper Satluj River Watershed, Kinnaur, Himachal Pradesh, India, J. Indian Soc. Remote, 40, 519–539, https://doi.org/10.1007/s12524-011-0169-0, 2012.
Cho, S. E.: Effects of spatial variability of soil properties on slope stability, Eng. Geol., 92, 97–109, https://doi.org/10.1016/j.enggeo.2007.03.006, 2007.
Christen, M., Kowalski, J., and Bartelt, P.: RAMMS: Numerical simulation of dense snow avalanches in three-dimensional terrain, Cold Reg. Sci. Technol., 63, 1–14, https://doi.org/10.1016/j.coldregions.2010.04.005, 2010.
Corominas, J. and Mavrouli, J.: Living with landslide risk in Europe: Assessment, effects of global change, and risk management strategies, Documento tecnico, SafeLand, 7th Framework Programme Cooperation Theme, NGI – Norwegian Geotechnical Institute, Oslo, Norway, 2011.
Costa, J. E. and Schuster, R. L.: The formation and failure of natural dams, Geol. Soc. Am. Bull., 100, 1054–1068, https://doi.org/10.1130/0016-7606(1988)100<1054:TFAFON>2.3.CO;2, 1988.
Coulomb, C. A.: An attempt to apply the rules of maxima and minima to several problems of stability related to architecture, Mémoires de l'Académie Royale des Sciences, 7, 343–382, 1776.
Cruden, D. M. and Varnes, D. J.: Landslides: investigation and mitigation, in: Landslide types and processes, Special Report 247, Transportation Research Board, US National Academy of Sciences, Washington, DC, 1996.
Dai, F. C., Lee, C. F., Deng, J. H., and Tham, L. G.: The 1786 earthquake-triggered landslide dam and subsequent dam-break flood on the Dadu River, southwestern China, Geomorphology, 65, 205–221, https://doi.org/10.1016/j.geomorph.2004.08.011, 2005.
Deere, D. U. and Miller, R. P.: Engineering classification and index properties for intact rock, Technical Report No. AFWL-TR-65-116, University of Illinois, Urbana, USA, 1966.
Delaney, K. B. and Evans, S. G.: The 2000 Yigong landslide (Tibetan Plateau), rockslide-dammed lake and outburst flood: review, remote sensing analysis, and process modelling, Geomorphology, 246, 377–393, https://doi.org/10.1016/j.geomorph.2015.06.020, 2015.
Dimri, A. P., Niyogi, D., Barros, A. P., Ridley, J., Mohanty, U. C., Yasunari, T., and Sikka, D. R.: Western disturbances: A review, Rev. Geophys., 53, 225–246, https://doi.org/10.1002/2014RG000460, 2015.
Dong, J. J., Tung, Y. H., Chen, C. C., Liao, J. J., and Pan, Y. W.: Logistic regression model for predicting the failure probability of a landslide dam, Eng. Geol., 117, 52–61, https://doi.org/10.1016/j.enggeo.2010.10.004, 2011.
Duncan, J. M.: State of art: limit equilibrium and finite element analysis of slopes, J. Geotech. Eng.-ASCE, 122, 577–596, https://doi.org/10.1061/(ASCE)0733-9410(1996)122:7(577), 1996.
Eberhardt, E., Stead, D., and Coggan, J. S.: Numerical analysis of initiation and progressive failure in natural rock slopes – the 1991 Randa rockslide, Int. J. Rock Mech. Min., 41, 69–87, https://doi.org/10.1016/S1365-1609(03)00076-5, 2004.
Ermini, L. and Casagli, N.: Prediction of the behaviour of landslide dams using a geomorphological dimensionless index, Earth Surf. Proc. Land., 28, 31–47, https://doi.org/10.1002/esp.424, 2002.
Fan, X., Dufresne, A., Subramanian, S. S., Strom, A., Hermanns, R., Stefanelli, C. T., Hewitt, K., Yunus, A. P., Dunning, S., Capra, L., and Geertsema, M.: The formation and impact of landslide dams – State of the art, Earth-Sci. Rev., 203, 103116, https://doi.org/10.1016/j.earscirev.2020.103116, 2020.
Fujisawa, K., Kobayashi, A., and Aoyama, S.: Theoretical description of embankment erosion owing to overflow, Geotechnique, 59, 661–671, https://doi.org/10.1680/geot.7.00035, 2009.
Gadgil, S., Rajeevan, M., and Francis, P. A.: Monsoon variability: Links to major oscillations over the equatorial Pacific and Indian oceans, Curr. Sci., 93, 182–194, 2007.
Griffiths, D. V. and Lane, P. A.: Slope stability analysis by finite elements, Geotechnique, 49, 387–403, https://doi.org/10.1680/geot.1999.49.3.387, 1999.
Griffiths, D. V. and Marquez, R. M.: Three-dimensional slope stability analysis by elasto-plastic finite elements, Geotechnique, 57, 537–546, https://doi.org/10.1680/geot.2007.57.6.537, 2007.
Gupta, V. and Sah, M. P.: Impact of the trans-Himalayan landslide lake outburst flood (LLOF) in the Satluj catchment, Himachal Pradesh, India, Nat. Hazards, 45, 379–390, https://doi.org/10.1007/s11069-007-9174-6, 2008.
Hazarika, D., Wadhawan, M., Paul, A., Kumar, N., and Borah, K.: Geometry of the Main Himalayan Thrust and Moho beneath Satluj valley, northwest Himalaya: Constraints from receiver function analysis, J. Geophys. Res.-Solid, 122, 2929–2945, https://doi.org/10.1002/2016JB013783, 2017.
Hoek, E. and Brown, E. T.: Practical estimates of rock mass strength, Int. J. Rock Mech. Min., 34, 1165–1186, https://doi.org/10.1016/S1365-1609(97)80069-X, 1997.
Hoek, E. and Diederichs, M. S.: Empirical estimation of rock mass modulus, Int. J. Rock Mech. Min., 43, 203–215, https://doi.org/10.1016/j.ijrmms.2005.06.005, 2006.
Hoek, E., Kaiser, P. K., and Bawden, W. F.: Support of Underground Excavations in Hard Rock, A. A. Alkema, Rotterdam, 1995.
Huffman, G. J., Bolvin, D. T., Nelkin, E. J., and Adler, R. F.: TRMM (TMPA) Precipitation L3 1 day 0.25 degree × 0.25 degree V7, edited by: Savtchenko, A., GES DISC – Goddard Earth Sciences Data and Information Services Center, https://doi.org/10.5067/TRMM/TMPA/DAY/7, 2016.
Hungr, O. and Evans, S. G.: Entrainment of debris in rock avalanches: an analysis of a long run-out mechanism, Geol. Soc. Am. Bull., 116, 1240–1252, https://doi.org/10.1130/B25362.1, 2004.
Hungr, O., Morgan, G. C., and Kellerhals, R.: Quantitative analysis of debris torrent hazards for design of remedial measures, Can. Geotech. J., 21, 663–677, https://doi.org/10.1139/t84-073, 1984.
Hungr, O., Leroueil, S., and Picarelli, L.: The Varnes classification of landslide types, an update, Landslides, 11, 167–194, https://doi.org/10.1007/s10346-013-0436-y, 2014.
Hunt, K. M., Turner, A. G., and Shaffrey, L. C.: The evolution, seasonality and impacts of western disturbances, Q. J. Roy. Meteorol. Soc., 144, 278–290, https://doi.org/10.1002/qj.3200, 2018.
Hürlimann, M., Rickenmann, D., Medina, V., and Bateman, A.: Evaluation of approaches to calculate debris-flow parameters for hazard assessment, Eng. Geol., 102, 152–163, https://doi.org/10.1016/j.enggeo.2008.03.012, 2008.
Hutter, K., Svendsen, B., and Rickenmann, D.: Debris flow modelling: a review, Continuum Mech. Thermodyn., 8, 1–35, https://doi.org/10.1007/BF01175749, 1994.
Innes, J. L.: Debris flows, Prog. Phys. Geogr., 7, 469–501, https://doi.org/10.1177/030913338300700401, 1983.
IS – Indian Standard 9143: Method for the determination of unconfined compressive strength of rock materials, in: Bureau of Indian Standards, Delhi, India, 1979.
IS – Indian Standard 2720 (Part 4): Methods of test for soils: Grain size analysis, in: Bureau of Indian Standards, Delhi, India, 1985.
IS – Indian Standard 2720 (Part 13): Method of test for soils: Direct shear test, in: Bureau of Indian Standards, Delhi, India, 1986.
IS – Indian Standard 2720 (Part 10): Method of test for soils: Determination of unconfined compressive strength, in: Bureau of Indian Standards, Delhi, India, 1991.
Jamir, I., Gupta, V., Kumar, V., and Thong, G. T.: Evaluation of potential surface instability using finite element method in Kharsali Village, Yamuna Valley, Northwest Himalaya, J. Mt. Sci., 14, 1666–1676, https://doi.org/10.1007/s11629-017-4410-3, 2017.
Jamir, I., Gupta, V., Thong, G. T., and Kumar, V.: Litho-tectonic and precipitation implications on landslides, Yamuna valley, NW Himalaya, Phys. Geogr., 41, 365–388, https://doi.org/10.1080/02723646.2019.1672024, 2019.
Jang, H. S., Kang, S. S., and Jang, B. A.: Determination of joint roughness coefficients using roughness parameters, Rock Mech. Rock Eng., 47, 2061–2073, https://doi.org/10.1007/s00603-013-0535-z, 2014.
Jing, L.: A review of techniques, advance and outstanding issues in numerical modelling for rock mechanics and rock engineering, Int. J. Rock Mech. Min., 40, 283–353, https://doi.org/10.1016/S1365-1609(03)00013-3, 2003.
Khattri, K., Rai, K., Jain, A. K., Sinvhal, H., Gaur, V. K., and Mithal, R. S.: The Kinnaur earthquake, Himachal Pradesh, India, of 19 January, 1975, Tectonophysics, 49, 1–21, https://doi.org/10.1016/0040-1951(78)90095-1, 1978.
Kokutse, N. K., Temgoua, A. G. T., and Kavazović, Z.: Slope stability and vegetation: Conceptual and numerical investigation of mechanical effects, Ecol. Eng., 86, 146–153, https://doi.org/10.1016/j.ecoleng.2015.11.005, 2016.
Kumar, V., Gupta, V., and Jamir, I.: Hazard Evaluation of Progressive Pawari Landslide Zone, Kinnaur, Satluj Valley, Higher Himalaya, India, Nat. Hazards, 93, 1029–1047, https://doi.org/10.1007/s11069-018-3339-3, 2018.
Kumar, V., Gupta, V., Jamir, I., and Chattoraj, S. L.: Evaluation of potential landslide damming: Case study of Urni landslide, Kinnaur, Satluj valley, India, Geosci. Front., 10, 753–767, https://doi.org/10.1016/j.gsf.2018.05.004, 2019a.
Kumar, V., Gupta, V., and Sundriyal, Y. P.: Spatial interrelationship of landslides, litho-tectonics, and climate regime, Satluj valley, Northwest Himalaya, Geol. J., 54, 537–551, https://doi.org/10.1002/gj.3204, 2019b.
Kumar, V., Jamir, I., Gupta, V., and Bhasin, R.K.: Dataset used to infer regional slope stability, NW Himalaya, Mendeley Data, https://doi.org/10.17632/jh8b2rh8nz.2, 2021.
Kundu, B., Yadav, R. K., Bali, B. S., Chowdhury, S., and Gahalaut, V. K.: Oblique convergence and slip partitioning in the NW Himalaya: Implications from GPS measurements, Tectonics, 33, 2013–2024, https://doi.org/10.1002/2014TC003633, 2014.
Lata, R., Rishi, S., Talwar, D., and Dolma, K.: Comparative Study of Landuse Pattern in the Hilly Area of Kinnaur District, Himachal Pradesh, India, Int. J. Innov. Sci. Eng. Technol., 2, 559–565, 2015.
Li, D. Q., Qi, X. H., Cao, Z. J., Tang, X. S., Phoon, K. K., and Zhou, C. B.: Evaluating slope stability uncertainty using coupled Markov chain, Comput. Geotech., 73, 72–82, https://doi.org/10.1016/j.compgeo.2015.11.021, 2016.
Li, M. H., Sung, R. T., Dong, J. J., Lee, C. T., and Chen, C. C.: The formation and breaching of a short-lived landslide dam at Hsiaolin village, Taiwan – Part II: Simulation of debris flow with landslide dam breach, Eng. Geol., 123, 60–71, https://doi.org/10.1016/j.enggeo.2011.05.002, 2011.
Li, T., Schuster, R. L., and Wu, J.: Landslide dams in south-central China, in: Proc. of the Landslide dams: processes, risk, and mitigation, ASCE Convention, Washington, 146–162, 1986.
Martha, T. R., Kerle, N., Jetten, V., van Westen, C. J., and Kumar, K. V.: Landslide volumetric analysis using Cartosat-1-derived DEMs, IEEE Geosci. Remote Sens., 7, 582–586, https://doi.org/10.1109/LGRS.2010.2041895, 2010.
Matsui, T. and San, K. C.: Finite element slope stability analysis by shear strength reduction technique, Soils Found., 32, 59–70, https://doi.org/10.3208/sandf1972.32.59, 1992.
Mohr, O.: Abhandlungen aus dem Gebiete der Technischen Mechanik, 2nd Edn., W. Ernst & Sohn, Berlin, 1914.
NDMA – National Disaster Management Authority: Annual report, Government of India, Delhi, 2013.
Nian, T. K., Chen, G. Q., Wan, S. S., and Luan, M. T.: Non-convergence Criterion on Slope Stability FE Analysis by Strength Reduction Method, J. Converg. Inform. Technol., 6, 78–88, 2011.
Parkash, S.: Historical records of socio-economically significant landslides in India, J. S. Asia Disast. Stud., 4, 177–204, 2011.
Rahardjo, H., Lee, T. T., Leong, E. C., and Rezaur, R. B.: Response of a residual soil slope to rainfall, Can. Geotech. J., 42, 340–351, https://doi.org/10.1139/t04-101, 2005.
Rickenmann, D.: Runout prediction methods, in: Debris-flow hazards and related phenomena, edited by: Jakob, M. and Hungr, O., Springer, Berlin, Heidelberg, 305–324, https://doi.org/10.1007/3-540-27129-5_13, 2005.
Rickenmann, D. and Scheidl, C.: Debris-Flow Runout and Deposition on the Fan, in: Dating Torrential Processes on Fans and Cones, Advances in Global Change Research, edited by: Bollschweiler, M. S., Stoffel, M., and Miklau, F. R., Springer, Dordrecht, 75–93, https://doi.org/10.1007/978-94-007-4336-6_5, 2013.
Ruiz-Villanueva, V., Allen, S., Arora, M., Goel, N. K., and Stoffel, M.: Recent catastrophic landslide lake outburst floods in the Himalayan mountain range, Prog. Phys. Geogr., 41, 3–28, https://doi.org/10.1177/0309133316658614, 2016.
Salm, B.: Flow, flow transition and runout distances of flowing avalanches, Ann. Glaciol., 18, 221–226, https://doi.org/10.3189/S0260305500011551, 1993.
Sharma, K. K.: A contribution to the geology of Satluj Valley, Kinnaur, Himachal Pradesh, India, Collques Internationaux du CNRS, 268, 369–378, 1977.
Sharma, S., Shukla, A. D., Bartarya, S. K., Marh, B. S., and Juyal, N.: The Holocene floods and their affinity to climatic variability in the western Himalaya, India, Geomorphology, 290, 317–334, https://doi.org/10.1016/j.geomorph.2017.04.030, 2017.
Singh, D., Gupta, R. D., and Jain, S. K.: Statistical analysis of long term spatial and temporal trends of temperature parameters over Sutlej river basin, India, J. Earth Syst. Sci., 124, 17–35, https://doi.org/10.1007/s12040-014-0530-0, 2015.
Stefanelli, C. T., Segoni, S., Casagli, N., and Catani, F.: Geomorphic indexing of landslide dams evolution, Eng. Geol., 208, 1–10, https://doi.org/10.1016/j.enggeo.2016.04.024, 2016.
Takahashi, T. and Nakagawa, H.: Flood and debris flow hydrograph due to collapse of a natural dam by overtopping, Proc. Hydraul. Eng. Jpn., 37, 699–704, https://doi.org/10.2208/prohe.37.699, 1993.
Terzaghi, K.: Mechanism of Landslides, in: Application of Geology to Engineering Practice, Geol. Soc. Am., New York, 83–123, https://doi.org/10.1130/Berkey.1950.83, 1950.
Thiede, R. C., Ehlers, T. A., Bookhagen, B., and Strecker, M. R.: Erosional variability along the northwest Himalaya, J. Geophys. Res.-Earth, 114, F101015, https://doi.org/10.1029/2008JF001010, 2009.
Vannay, J. C., Grasemann, B., Rahn, M., Frank, W., Carter, A., Baudraz, V., and Cosca, M.: Miocene to Holocene exhumation of metamorphic crustal wedges in the NW Himalaya: Evidence for tectonic extrusion coupled to fluvial erosion, Tectonics, 23, TC1014, https://doi.org/10.1029/2002TC001429, 2004.
Voellmy, A.: On the destructive force of avalanche, Translation No. 2, Avalanche Study Center, United States Department of Agriculture, USA, available at: https://collections.lib.utah.edu/ark:/87278/s6sq8xc1 (last access: 10 March 2020), 1955.
Wong, F. S.: Uncertainties in FE modelling of slope stability, Comput. Struct., 19, 777–791, https://doi.org/10.1016/0045-7949(84)90177-9, 1984.
Wulf, H., Bookhagen, B., and Scherler, D.: Climatic and geologic controls on suspended sediment flux in the Sutlej River Valley, western Himalaya, Hydrol. Earth Syst. Sci., 16, 2193–2217, https://doi.org/10.5194/hess-16-2193-2012, 2012.
Yu, G., Zhang, M., and Chen, H.: The dynamic process and sensitivity analysis for debris flow, in: Landslide Science for a Safer Geoenvironment, edited by: Sassa, K., Canuti, P., and Yin, Y., Springer, Cham, 159–165, https://doi.org/10.1007/978-3-319-05050-8_26, 2014.
Zhang, P. W. and Chen, Z. Y.: Influences of soil elastic modulus and Poisson's ratio on slope stability, YantuLixue, Rock Soil Mech., 27, 299–303, 2006.
Zienkiewicz, O. C., Humpheson, C., and Lewis, R. W.: Associated and non-associated viscoplasticity and plasticity in soil mechanics, Geotechnique, 25, 671–689, https://doi.org/10.1680/geot.1975.25.4.671, 1975.