the Creative Commons Attribution 4.0 License.
the Creative Commons Attribution 4.0 License.
 | 05 Sep 2023
Spatiotemporal bedload transport patterns over two-dimensional bedforms
Leah Tevis
Mark Schmeeckle
Despite a rich history of studies investigating fluid dynamics over bedforms and dunes in rivers, the spatiotemporal patterns of sub-bedform bedload transport remain poorly understood. Previous experiments assessing the effects of flow separation on downstream fluid turbulent structures and bedload transport suggest that localized, intermittent, high-magnitude transport events (i.e., permeable splat events) play an important role in both downstream and cross-stream bedload transport near flow reattachment. Here, we report results from flume experiments that assess the combined effects of flow separation–reattachment and flow re-acceleration over fixed two-dimensional bedforms (1.7 cm high; 30 cm long). A high-speed camera observed bedload transport along the entirety of the bedform at 250 frames per second. Grain trajectories, grain velocities, and grain transport directions were acquired from bedload images using semiautomated particle-tracking techniques. Downstream and vertical fluid velocities were measured 3 mm above the bed using laser Doppler velocimetry (LDV) at 15 distances along the bedform profile. Mean downstream fluid velocity increases nonlinearly with increasing distance along the bedform. However, observed bedload transport increases linearly with increasing distance along the bedform, except at the crest of the bedform, where both mean downstream fluid velocity and bedload transport decrease substantially. Bedload transport time series and manual particle-tracking data show a zone of high-magnitude, cross-stream transport near flow reattachment, suggesting that permeable splat events play an essential role in the region downstream of flow reattachment.
- Article
(9253 KB) - Full-text XML
- BibTeX
- EndNote


Although bedload transport has been a subject of scientific inquiry for over a century (Gilbert, 1877; Gilbert and Murphy, 1914), our understanding of bedload transport mechanics on a sub-bedform scale (e.g., transport within the bedform itself) remains limited (Terwisscha van Scheltinga et al., 2021; Leary and Schmeeckle, 2017). Sub-bedform transport mechanics potentially play an essential role in the calculations of bedload transport and our understanding of how bedforms evolve in three dimensions. Sub-bedform particles are not stationary but have detectable mean velocities (Ashley et al., 2020). However, relatively few studies have focused on sediment transport patterns on a sub-bedform scale due to the difficulty in measuring particle migration (Terwisscha van Scheltinga et al., 2021; Radice, 2021). Due to the dearth of studies on this subject, it is critical to start at first principles and assess bedload transport dynamics associated with the two primary and fundamental fluid regimes of bedforms: flow separation–reattachment and flow re-acceleration. An abundance of experiments of this nature were conducted in the latter half of the 20th century (Vanoni and Nomicos, 1960; Raudkivi, 1963, 1966; Vanoni and Hwang, 1967; Rifai and Smith, 1971; Vittal et al., 1977; Itakura and Kishi, 1980; van Mierlo and De Ruiter, 1988; Nelson and Smith, 1989; Wiberg and Nelson, 1992; Lyn, 1993; Nelson et al., 1993; McLean et al., 1994; Nelson et al., 1995; Bennett and Best, 1995). However, these studies primarily focused on fluid mechanics over bedforms and did not always analyze bedload transport at high spatiotemporal resolutions. With few exceptions (e.g., Ashley et al., 2020), previous work has not accounted for the amount of sediment being transported in the streamwise and cross-stream directions on a sub-bedform scale (Leary and Schmeeckle, 2017; Unsworth et al., 2018).
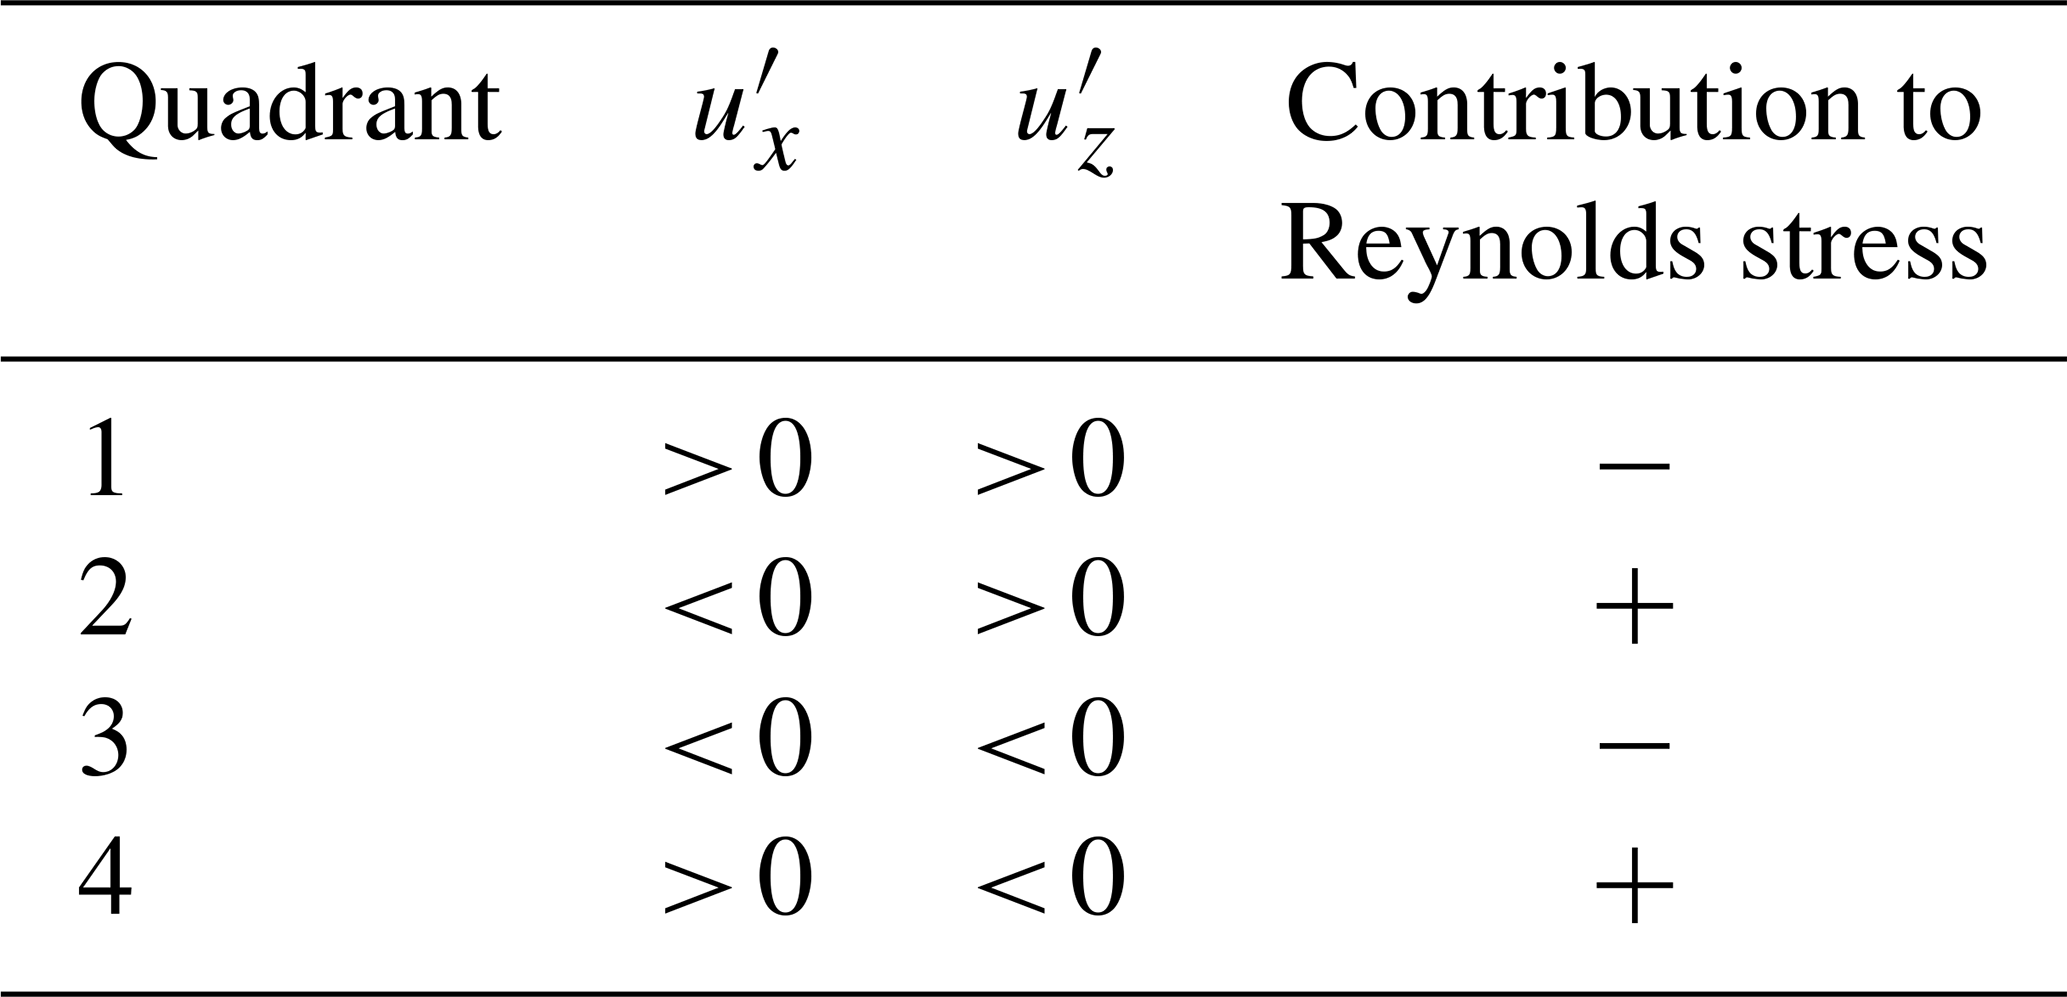
Previous studies have focused on the sub-bedform spatiotemporal patterns of turbulent fluid structures but were limited in their sediment transport analyses. Rather than looking at the spatiotemporal patterns of sediment transport, these studies were limited to whether specific turbulent structures induced entrainment or not. Bennett and Best (1995) found that the turbulence structure over bedforms is intrinsically linked to the flow separation zone's development, magnitude, and extent, which can have a wide variation among neighboring bedforms (Terwisscha van Scheltinga et al., 2021). Notably, they observed that quadrant 4 events (e.g., fluid moving down towards the bed) near flow reattachment contribute significantly to the local Reynolds stress and sediment entrainment. In agreement with McLean et al. (1994), Bennett and Best (1995) also indicate that, in addition to quadrant 4 events, quadrant 1 events may play an important role in entrainment near flow reattachment. Investigations such as those conducted by Bennett and Best (1995) provide important sub-bedform-scale observations regarding fluid turbulence and bedload transport over bedforms. However, new technologies and methods, particularly semiautomated particle-tracking techniques and higher-precision numerical models, suggest the need for experimental replication. Experiments by Tsubaki et al. (2018) showed that under turbulent flow conditions, as seen in the trough area of a bedform, particles experience a specific behavior of transport not seen along other areas of the bedform. Various experimental work shows that particle behavior depends on the location and position relative to the bedform in question (Ashley et al., 2020).
Many successful numerical models of flow and sediment transport over bedforms have involved the Exner equation combined with an algebraic equation for the relationship between bed stress and sediment flux (e.g., Khosronejad and Sotiropoulos, 2014; Chou and Fringer, 2010; Zgheib et al., 2018). Some of the more successful models have used a slightly more complicated formulation involving the pickup and deposition of particles, rather than a simple formula between stress and flux (e.g., Giri and Shimizu, 2006; Nabi et al., 2013). Formulas like this allow for a lag between stress and flux. However, the physical experiments of Nelson et al. (1995) and Leary and Schmeeckle (2017) downstream of a negative step suggest that the relation between stress and flux cannot be well modeled with a simple relation involving either a pickup deposition formulation or, equivalently, a saturation length formulation. In the physical experiments of Leary and Schmeeckle (2017), even where stress is apparently negligible near the point of reattachment, downstream sediment flux is substantial. This work and the LES–DEM (large eddy simulation–discrete element method) of Schmeeckle (2015) show that the temporal variation of sediment flux is large relative to either that over a flat bed or near the crest of a bedform. Kidanemariam and Uhlmann (2017) conducted numerical experiments using a direct numerical simulation (DNS) of fluid coupled to a DEM of particle motion; small bedforms emerged. Using numerical models, Kidanemariam et al. (2022), similar to the results of Leary and Schmeeckle (2017) discussed above, found that the relationship between bed stress and sediment did not follow a simple algebraic relationship that could be resolved. In fact, Kidanemariam et al. (2022) found that the sediment flux could vary by nearly an order of magnitude for the same stress, depending on the location over the bedform. Turbulence-resolving models coupled to DEMs of particle motion have found that sediment mobility can increase greatly with increasing intensity of near-bed vortical structures (Schmeeckle, 2014, 2015; Mazzuoli et al., 2020). It is unlikely that an accurate model of stress and sediment flux over bedforms can be constructed without a detailed description of the spatiotemporal pattern of sediment flux.
The flume and numerical experiments of fluid and bedload dynamics downstream of a backward-facing step by Leary and Schmeeckle (2017) and Schmeeckle (2015) assessed the effect of flow separation and reattachment on downstream bedload and fluid dynamics. Terwisscha van Scheltinga et al. (2021) noted in their bedform experimentation that the transport occurring on the lower stoss side of the dune was comparable to the transport seen in the backward-facing step experiments. Once the flow begins to accelerate along the stoss side of the bedform, this is where the difference in transport over a backward-facing step (which experiences flow re-acceleration over a flat bed) and river dune (which experiences flow re-acceleration over an inclined bed) is most prominent (Fig. 1).
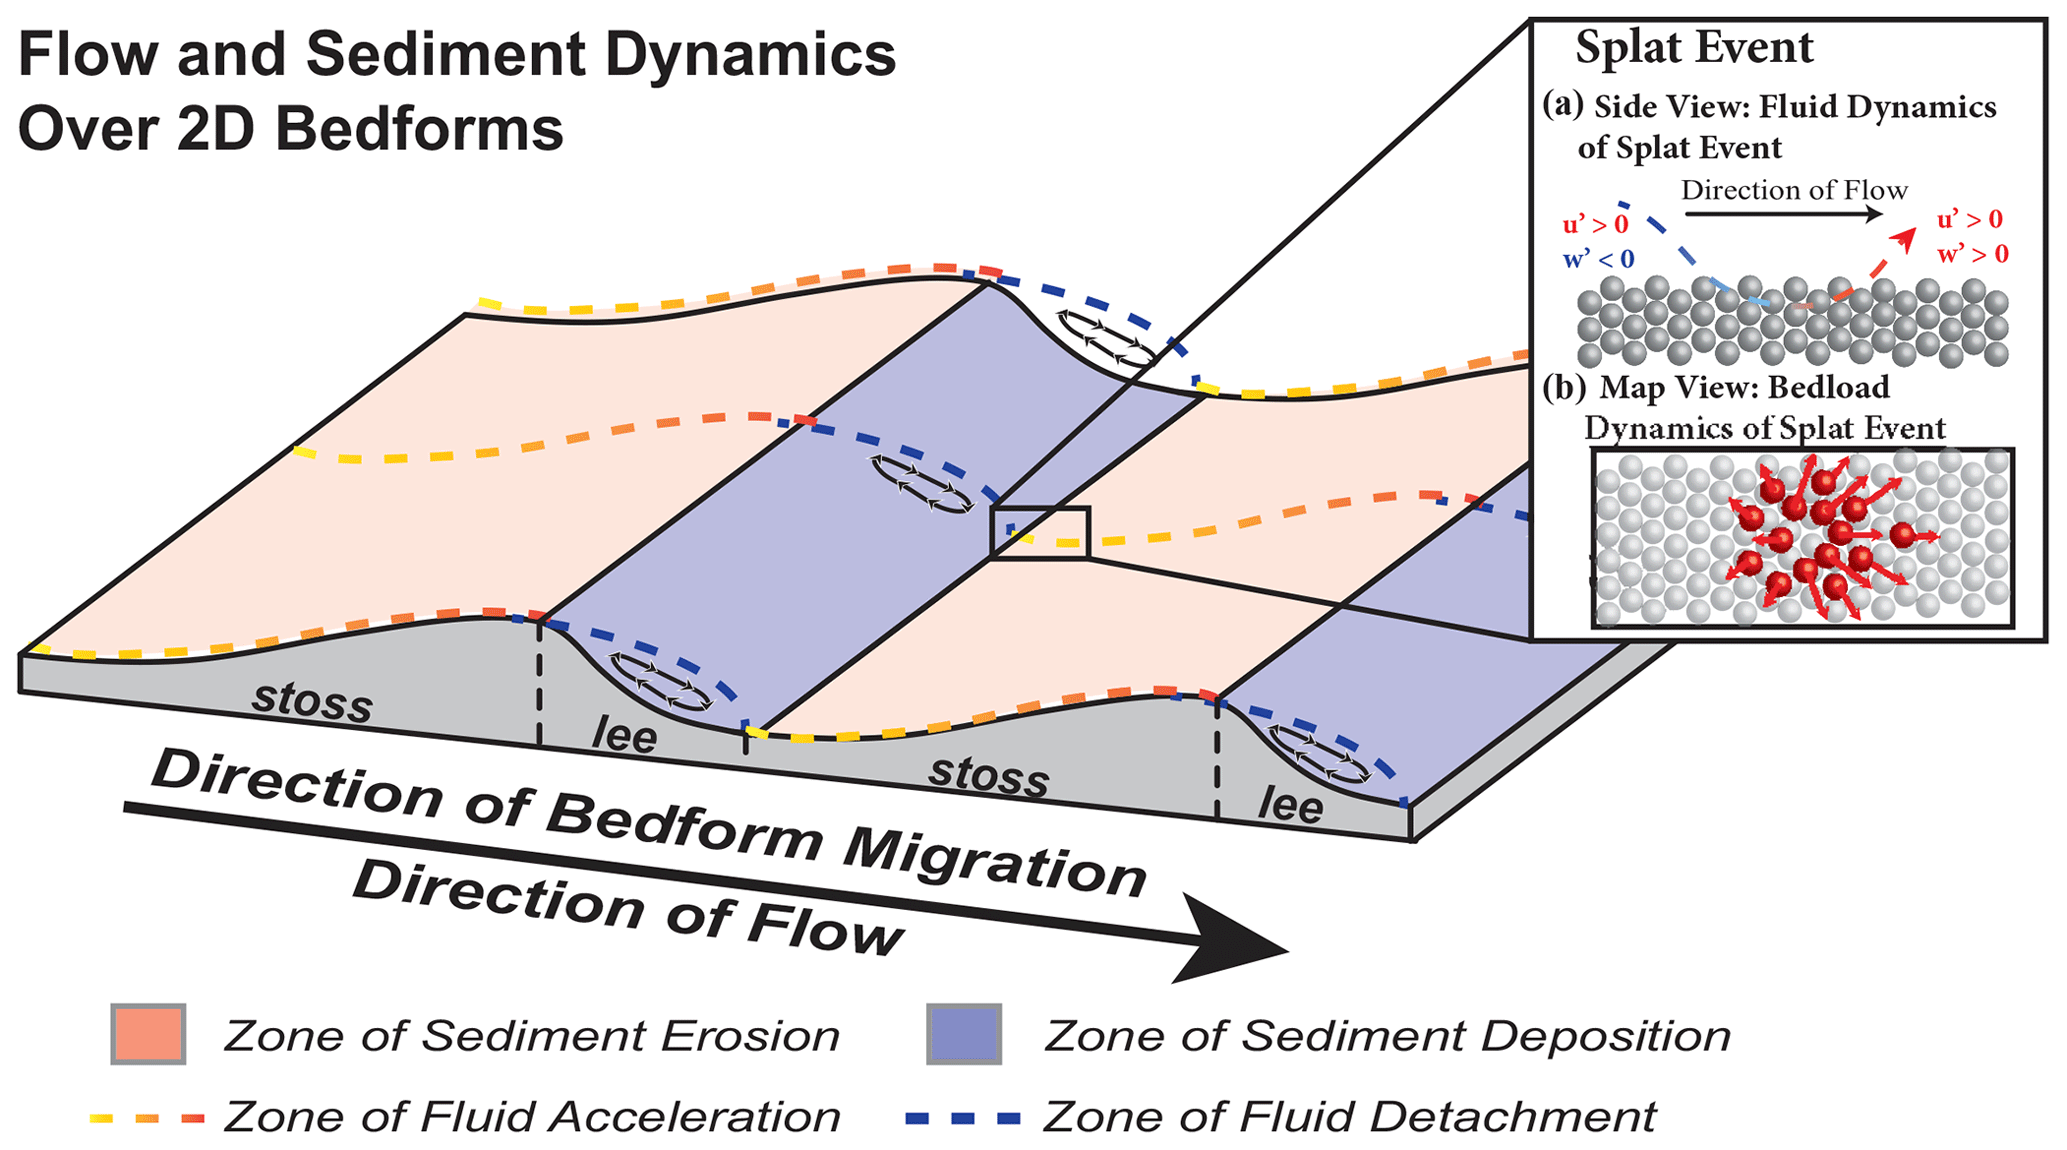
Figure 1Schematic of simplified flow dynamics over bedforms. Flow separates at the crest of each bedform and reattaches downstream. Recirculation of fluid occurs along the lee side of the bedform in the zone beneath the detached fluid. Upon reattachment, flow re-accelerates up the stoss side of the bedform. Splat events are primarily found near flow reattachment. The inset shows the dynamics of a splat event as presented by Leary and Schmeeckle (2017).
Schmeeckle (2015) and Leary and Schmeeckle (2017) found distinct fluid turbulent structures near flow reattachment called splat events. Splat events are localized, high-magnitude, intermittent flow features in which fluid impinges on the bed, infiltrates the top portion of the bed, and then exfiltrates in all directions surrounding the point of impingement, initiating bedload transport in a radial pattern (Perot and Moin, 1995; Fig. 1). These turbulent structures are primarily associated with quadrant 1 and 4 events (Schmeeckle, 2015; Leary and Schmeeckle, 2017). Splat events generate a distinct pattern of bedload transport compared to transport dynamics distal to flow reattachment. Unlike splat events, distal-to-flow reattachment bedload transport is characterized by unidirectional transport (Leary and Schmeeckle, 2017).
The investigations described above indicate that splat events play an essential role in the initiation and pattern of bedload transport proximal to flow reattachment. It is unclear, however, if these events remain an important factor in bedload transport when full bedforms are present. Furthermore, do splat events continue to play a role in bedload transport when both flow reattachment and flow re-acceleration are present? What is the overall spatiotemporal pattern of sediment transport over a two-dimensional bedform? To assess these questions, a series of flume experiments were run in which bedload motion and fluid velocities were observed over stationary ripples. By understanding the evolution of bedforms and grain transport in fluvial systems better, we can accurately develop predictive river models and plan for future water resource use (Guala et al., 2020).
2.1 Experimental methods
Experiments were conducted in the sediment transport research flume at the US Geological Survey's Geomorphology and Sediment Transport Laboratory in Golden, CO. This recirculating flume is approximately 6 m × 0.25 m. The flume was lined with 17 cement ripples, each 30 cm long and 1.8 cm high at the crest (Fig. 2). A half-sine function characterized the stoss side of the ripple. The lee side of the ripple was characterized by a linear function intersecting the bed at 30∘. The size and geometry of these cement ripples were informed by the flume experiments presented in Nelson et al. (2011). The experiments of Nelson et al. (2011) were run in the same flume with the same sediment as the experiments presented herein, assessing fluid and sediment dynamics over live bedforms. The present study's cement ripples and sediment discharge were scaled to replicate the live ripples and discharge from Nelson et al. (2011).
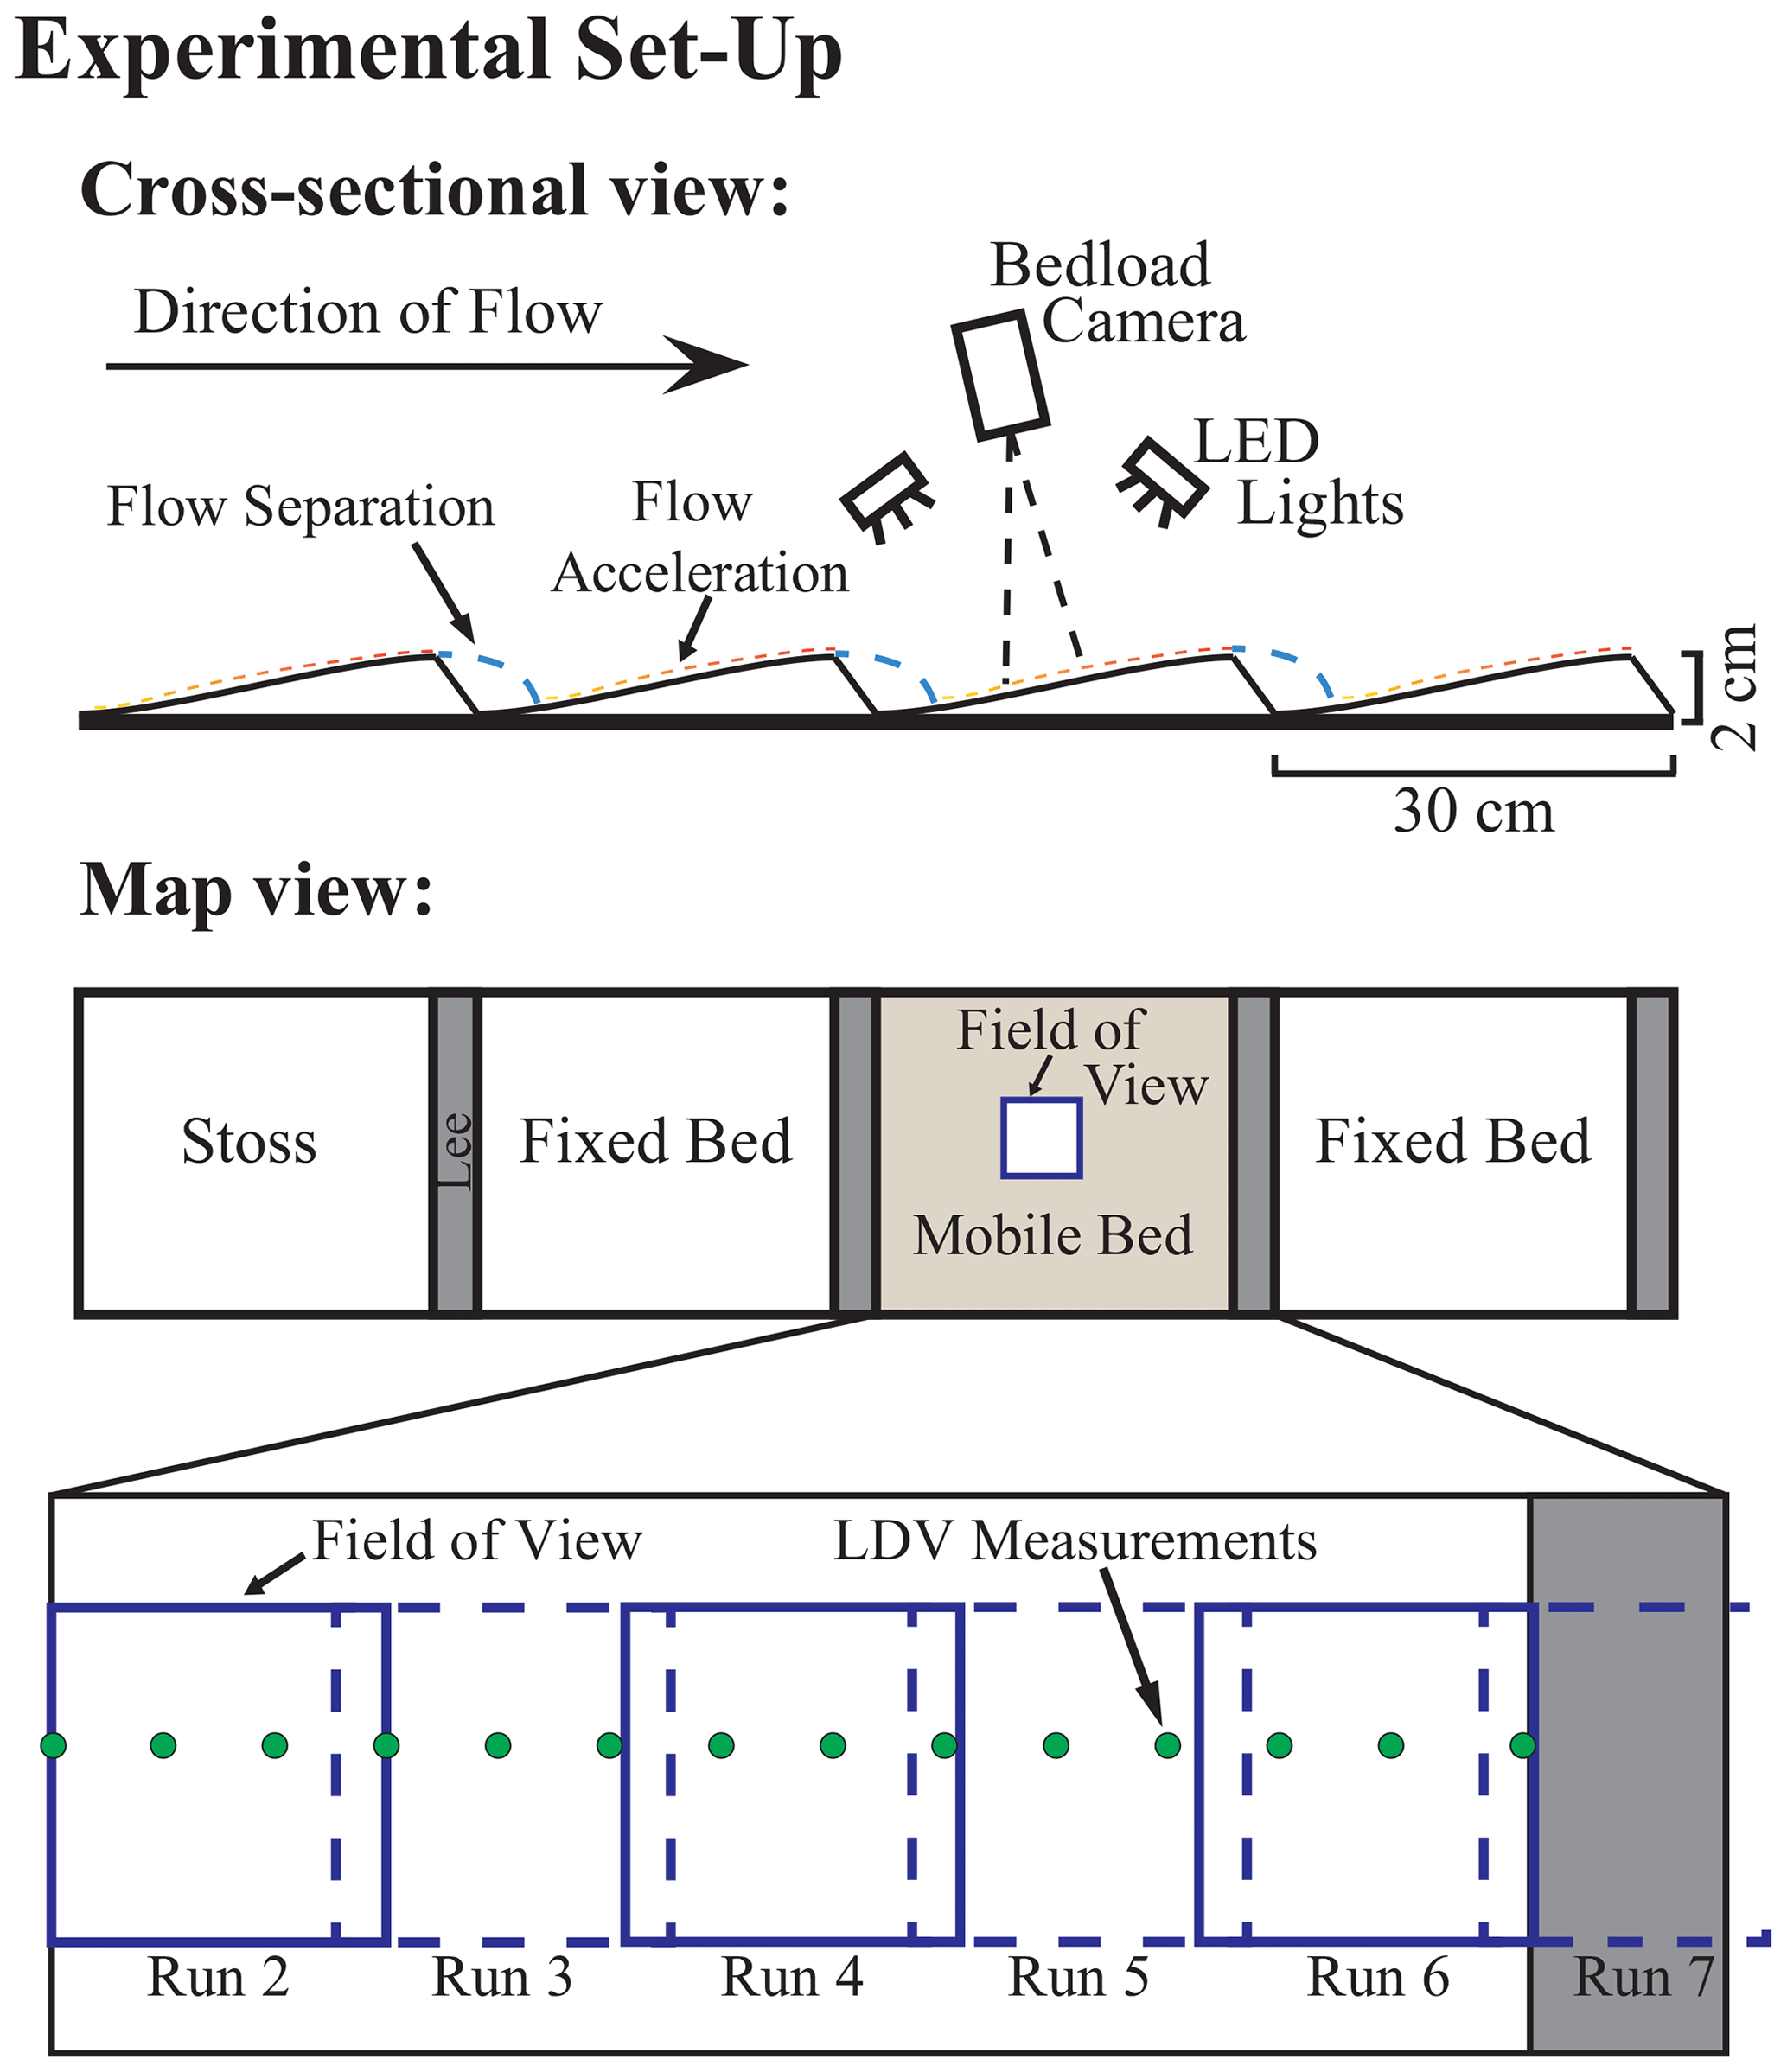
Figure 2Schematic of experimental set-up and measurement locations as well as topography of sample bedform that was loaded with sediment for the experiments.
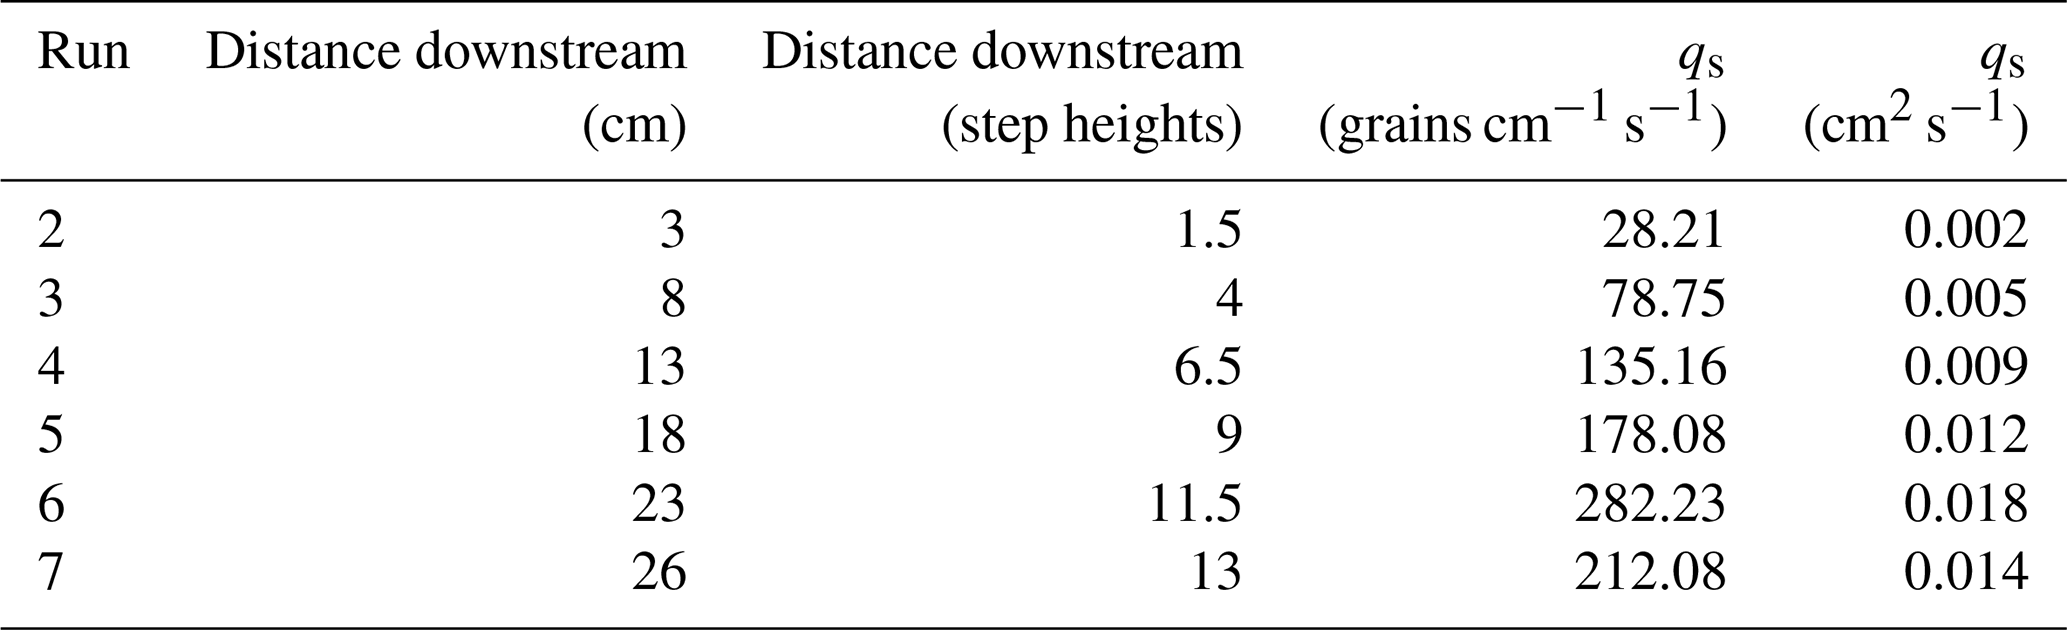
One ripple was designated as the sample ripple. The stoss side of the ripple was loaded with live sediment for every experimental run. Mobile sand was well sorted with a median diameter (50 D) of 0.05 cm. The discharge for each run was determined using an inline vortex flowmeter and was consistently ∼0.01 m3 s−1. The motion of the bedload, illuminated by high-intensity LED lights, was observed with a high-speed camera operating at 250 frames per second. The camera was angled so that the lens was parallel to the sloped bed to minimize distortion due to bed slope and, thus, depth differences. The field of view was approximately 36 cm2 with a 1280×1024 pixel resolution. Images were captured at six distances along the stoss side of the test ripple (runs 2–7; Table 1). Each run overlapped with the previous run by 1 cm (Fig. 2). The flow depth was kept constant at 9.5 cm.
The experimental procedure was as follows: with the flume off, sand was loaded to the test ripple and screed as best as possible into a planar surface. Once the mobile bed was planar, a plexiglass sheet with a centimeter ruler grid printed on it was placed on the mobile bed to ensure the sand stayed intact until the beginning of the recording. The flume was then turned on, and the recirculation rate was raised gradually to a recirculation speed of 17.3 Hz (i.e., recirculation rate required to attain a discharge of approximately 0.01 m3 s−1). Once at 17.3 Hz, a plexiglass window was lowered into the flume to rest on the water surface above the mobile bed to provide optimal image clarity by minimizing distortions from an irregular water surface.
The camera, mounted on a stable platform, was moved above this window. The camera was focused, and an image was taken of the plexiglass grid for post-processing scaling. For runs 2 and 3, the plexiglass grid was pulled, and then the recording of bedload motions began. For runs 4–7, due to high transport rates, recording began while the plexiglass grid was still on the bed. The plexiglass grid was then removed at the beginning of the recording. For these runs, the first 3 s of recording is ignored to account for the plexiglass grid being pulled and the bed equilibrating.
Two additional runs without live sediment were conducted to collect fluid velocity data. Streamwise and vertical fluid velocity data were collected using laser Doppler velocimetry (LDV). Velocity data were collected for 3 min at 15 positions along the test bedform at 2 cm intervals (Fig. 2); measurements were taken at 1 and 3 mm above the bed.
2.2 Bedload transport rate and patterns
Bedload transport analysis was conducted using bedload images and the open-source software ImageJ. Bedload transport rates were acquired by manually tracking sand particles as they crossed a 6 cm line bisecting the field of view. Bedload transport rates (streamwise and cross-stream) were calculated for every 25 frames (0.1 s intervals) over an 8 s time interval at each location to produce time series of sediment transport in the cross-stream and streamwise directions. Average transport rates were then calculated as the average sediment transported over the entire 8 s observation window. From the sediment transport time series data, major transport events (e.g., events with substantial cross-stream and streamwise transport) were chosen for detailed particle tracking to investigate more detailed sediment transport patterns. Transport patterns were determined for each run with the same methods presented in Leary and Schmeeckle (2017) using MTrackJ, an open-source particle-tracking software package for ImageJ. This software package provides instantaneous and average particle velocity, length of transport, and direction of transport for tracked grains.
2.3 Determining flow patterns
LDV fluid velocity data collected at 3 mm above the bed were analyzed as a distribution using basic statistics and as fluid velocity fluctuations using quadrant analysis. LDV yields time-averaged streamwise (ux) and vertical (uz) velocity values. Fluid velocity fluctuations are defined as
where u′ is the magnitude of the fluid velocity and a given point in time (ui) deviates from the mean (). The subscript i denotes the direction of flow (streamwise (x) or vertical (z)). The covariance of streamwise and vertical fluid velocity fluctuations is equal to the Reynolds stress (). Reynolds stress was calculated for all LDV sampling locations.
Quadrant analysis is a two-dimensional analysis wherein fluid velocity fluctuations, calculated by Eq. (1), are paired to produce four quadrants that describe the instantaneous movement of the flow (Table 2). Quadrant plots provide a visual representation of the quadrant activity that dominates the flow. Quadrant plots herein include all data points but are binned to illustrate the spatial density of the data. Significant quadrant observations were derived from only observations that exceed a threshold (H) value of 1 standard deviation of the Reynolds stress (Table 3; Lu and Willmarth, 1973).
Flow exuberance, EXFL, was calculated at all LDV sampling locations along the bedform using only significant quadrant observations (observations greater than H). Exuberance describes the shape of the quadrant distribution by using a ratio of the total Q1 and Q3 events to Q2 and Q4 events (Shaw et al., 1983; Yue et al., 2007; Chapman et al., 2012, 2013). In other words, exuberance is the ratio between positive and negative contributions and the Reynolds stress. We use two methods to calculate flow exuberance: the stress fraction method (Shaw et al., 1983; Yue et al., 2007) and the time fraction method (Chapman et al., 2012, 2013). The time fraction method evaluates the ratio of the sum of Q1 and Q3 events to the sum of Q2 and Q4 events. The stress fraction method defines each quadrant as the ratio between quadrant-specific Reynolds stresses and the overall mean Reynolds stress. Stress fractions were calculated for each quadrant before calculating the ratio between the sum of Q1 and Q3 stress fractions and the sum of Q2 and Q4 stress fractions. If exuberance is near ±1, there is an even distribution of events in all quadrants, and the resulting quadrant plot is roughly circular. If exuberance values approach zero, however, that indicates a dominance of quadrant 2 and quadrant 4 events, and the resulting quadrant plot will be skewed toward those quadrants.
Mean streamwise fluid velocities increase nonlinearly along most of the bedform, the exception being right at the crest, where mean streamwise fluid velocity decreases slightly (Fig. 3). Streamwise fluid velocity data and bedload imagery indicate that flow reattachment occurs at approximately 1 step height downstream from the trough (approx. 3 step heights downstream of flow separation). Mean vertical fluid velocities increase along the bedform up to 10 step heights, where they begin to decrease (Fig. 3). The mean vertical fluid velocity is negative at, and just downstream of, flow reattachment and at the crest. Positive vertical fluid velocities dominate the middle portion of the bedform. Patterns in mean streamwise and vertical fluid velocities follow observations made in previous studies (e.g., Venditti, 2007; Bennett and Best, 1995; McLean et al., 1994; Nelson and Smith, 1989).
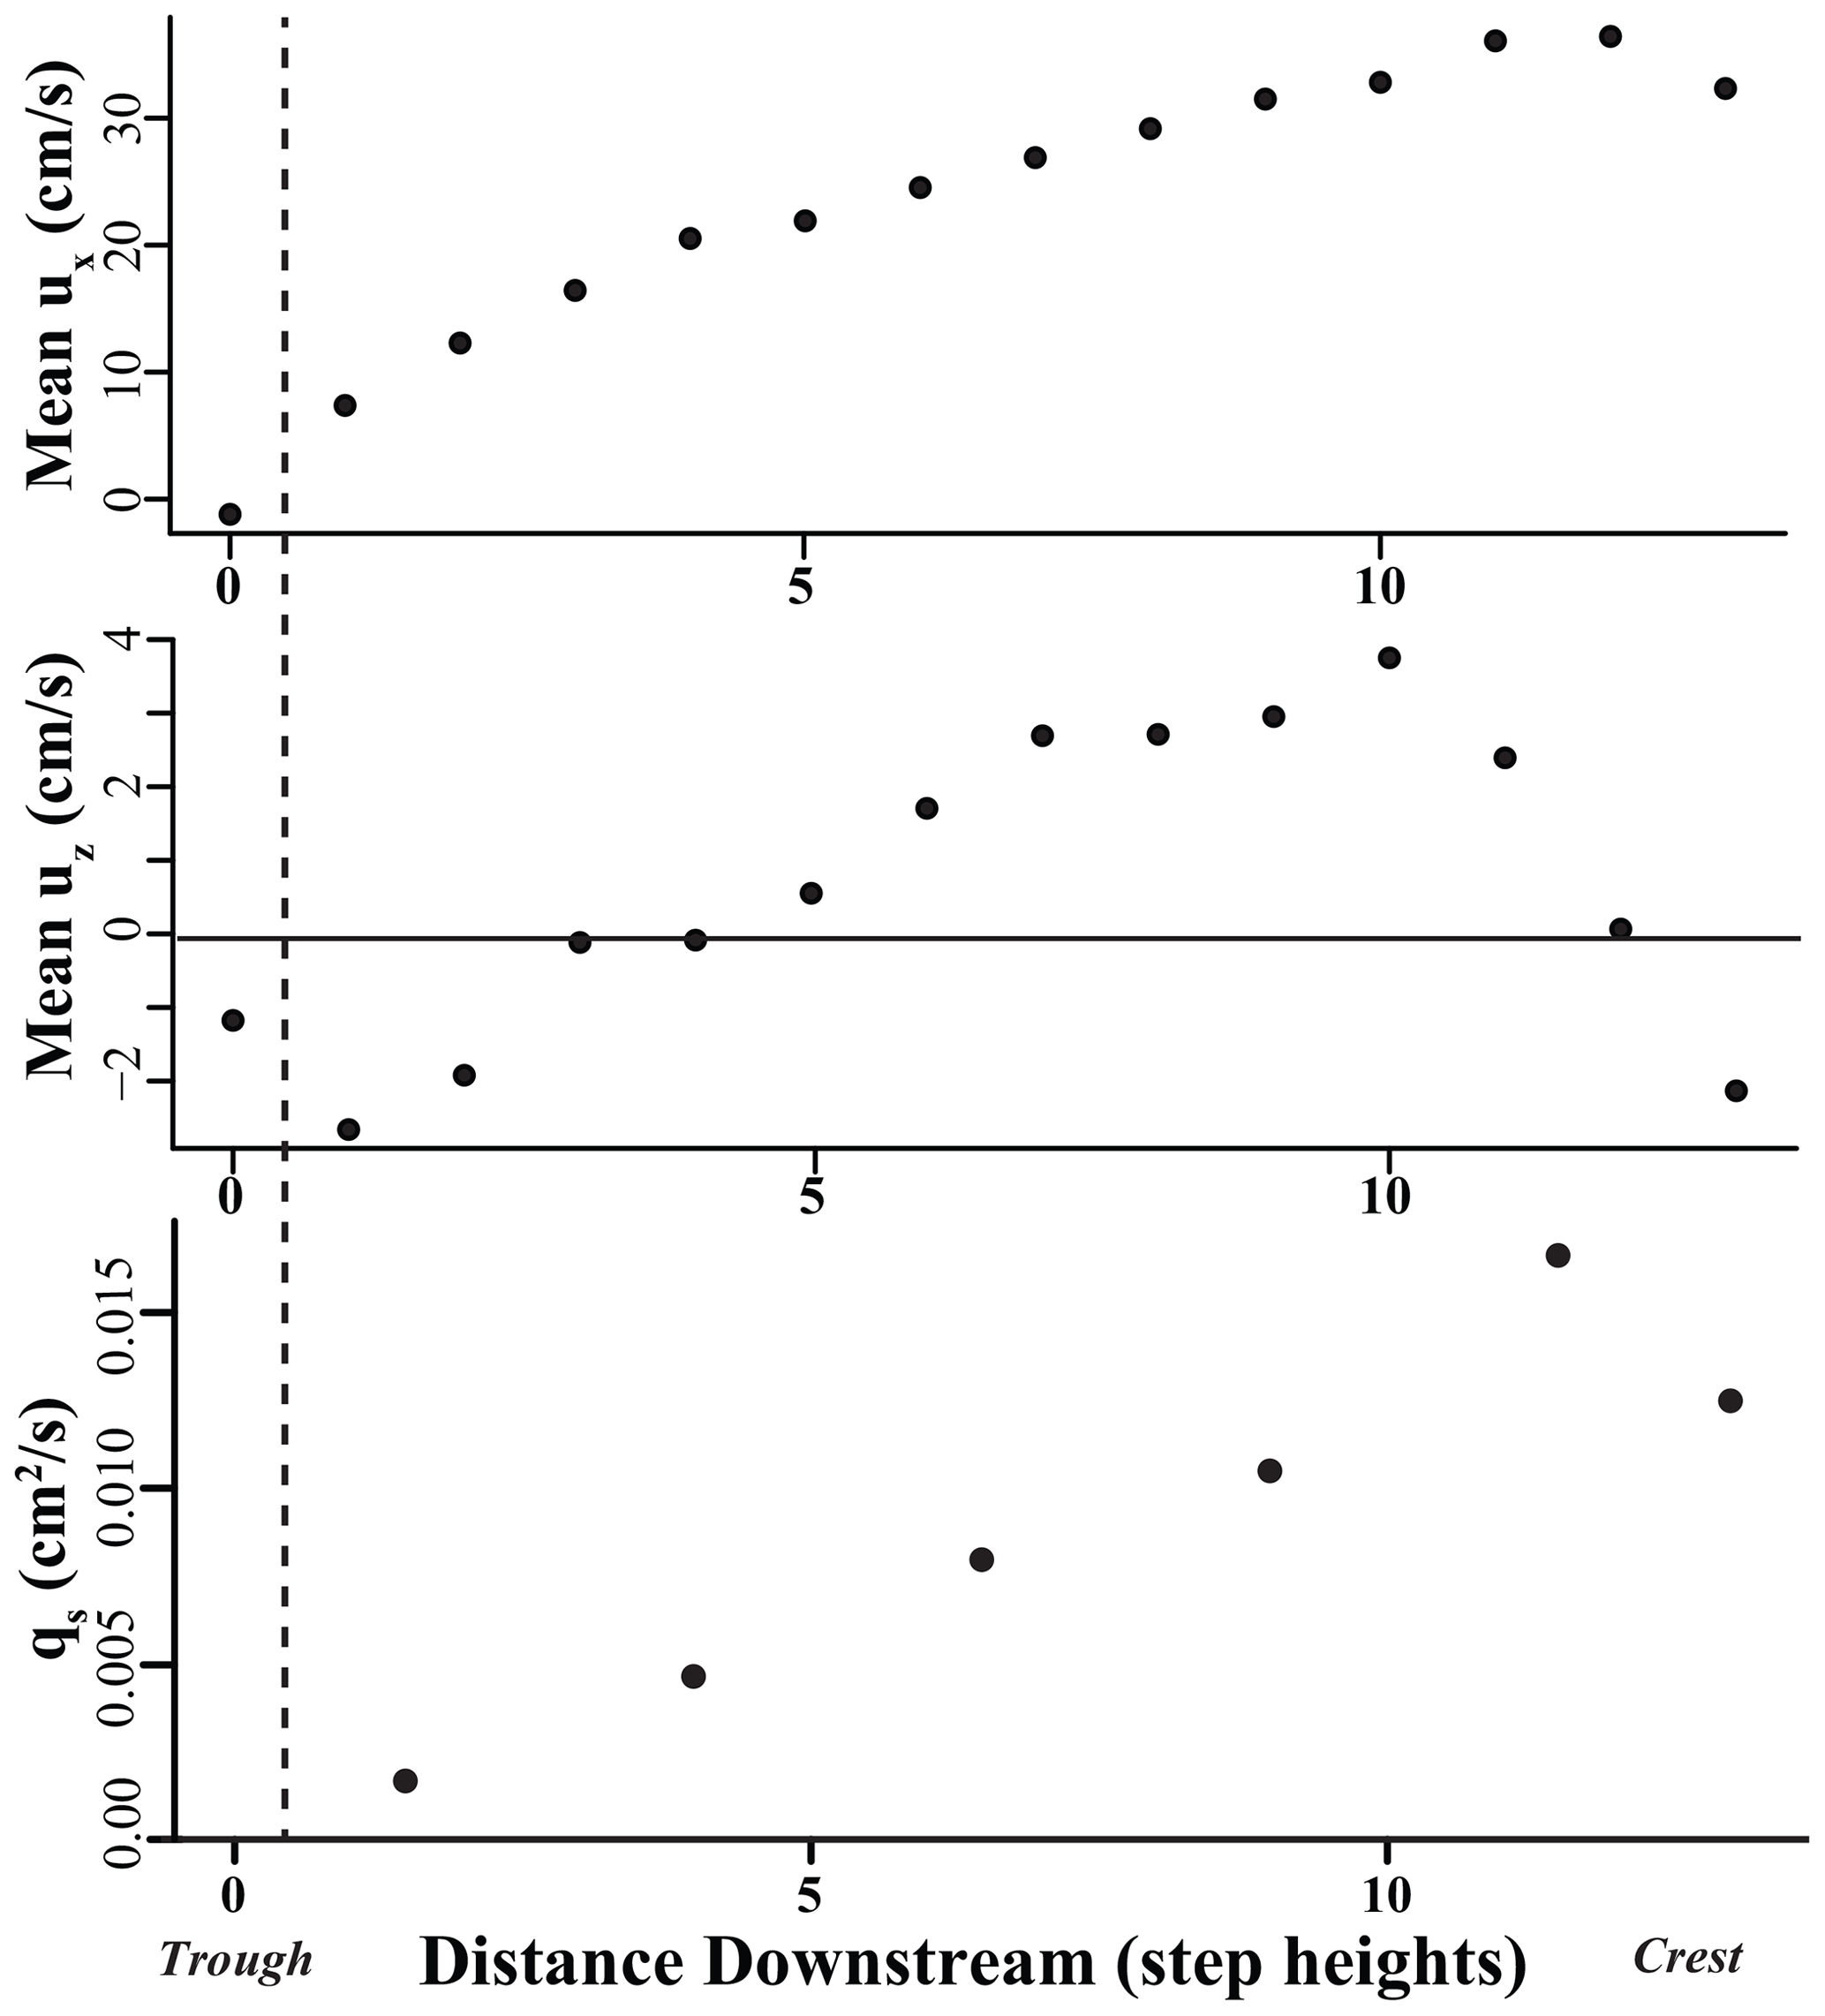
Figure 3Mean streamwise fluid velocities, mean vertical fluid velocities, and observed bedload transport with distance along the bedform. The dashed line indicates the location of flow reattachment (approx. 1 step height along the bedform).
Observed sediment transport increases linearly along the bedform except at the crest, where transport decreases slightly (Fig. 3). This pattern of bedload transport contrasts with results from Leary and Schmeeckle (2017), in which bedload transport downstream of a backward-facing step (i.e., only responding to flow reattachment) increased nonlinearly (Fig. 3). The flow then increased rapidly just downstream of flow reattachment and leveled out with increased distance along the bedform.
3.1 Fluid patterns
Although average streamwise and vertical fluid velocities increase nonlinearly with increased distance along the bedform, the standard deviations of streamwise and vertical velocity distributions reflect a different pattern (Fig. 4a and b). Streamwise and vertical standard deviations peak just downstream of flow reattachment. With increased distance along the bedform, standard deviations of fluid velocities decrease. Near flow reattachment, streamwise and vertical fluid velocity distributions have greater dispersion and higher-magnitude fluid fluctuations. In particular, this suggests the potential for large-magnitude positive streamwise and negative vertical fluid velocity fluctuations. Fluctuations of this type have been observed to be significant factors in splat events (Stoesser et al., 2008; Schmeeckle, 2015; Leary and Schmeeckle, 2017).
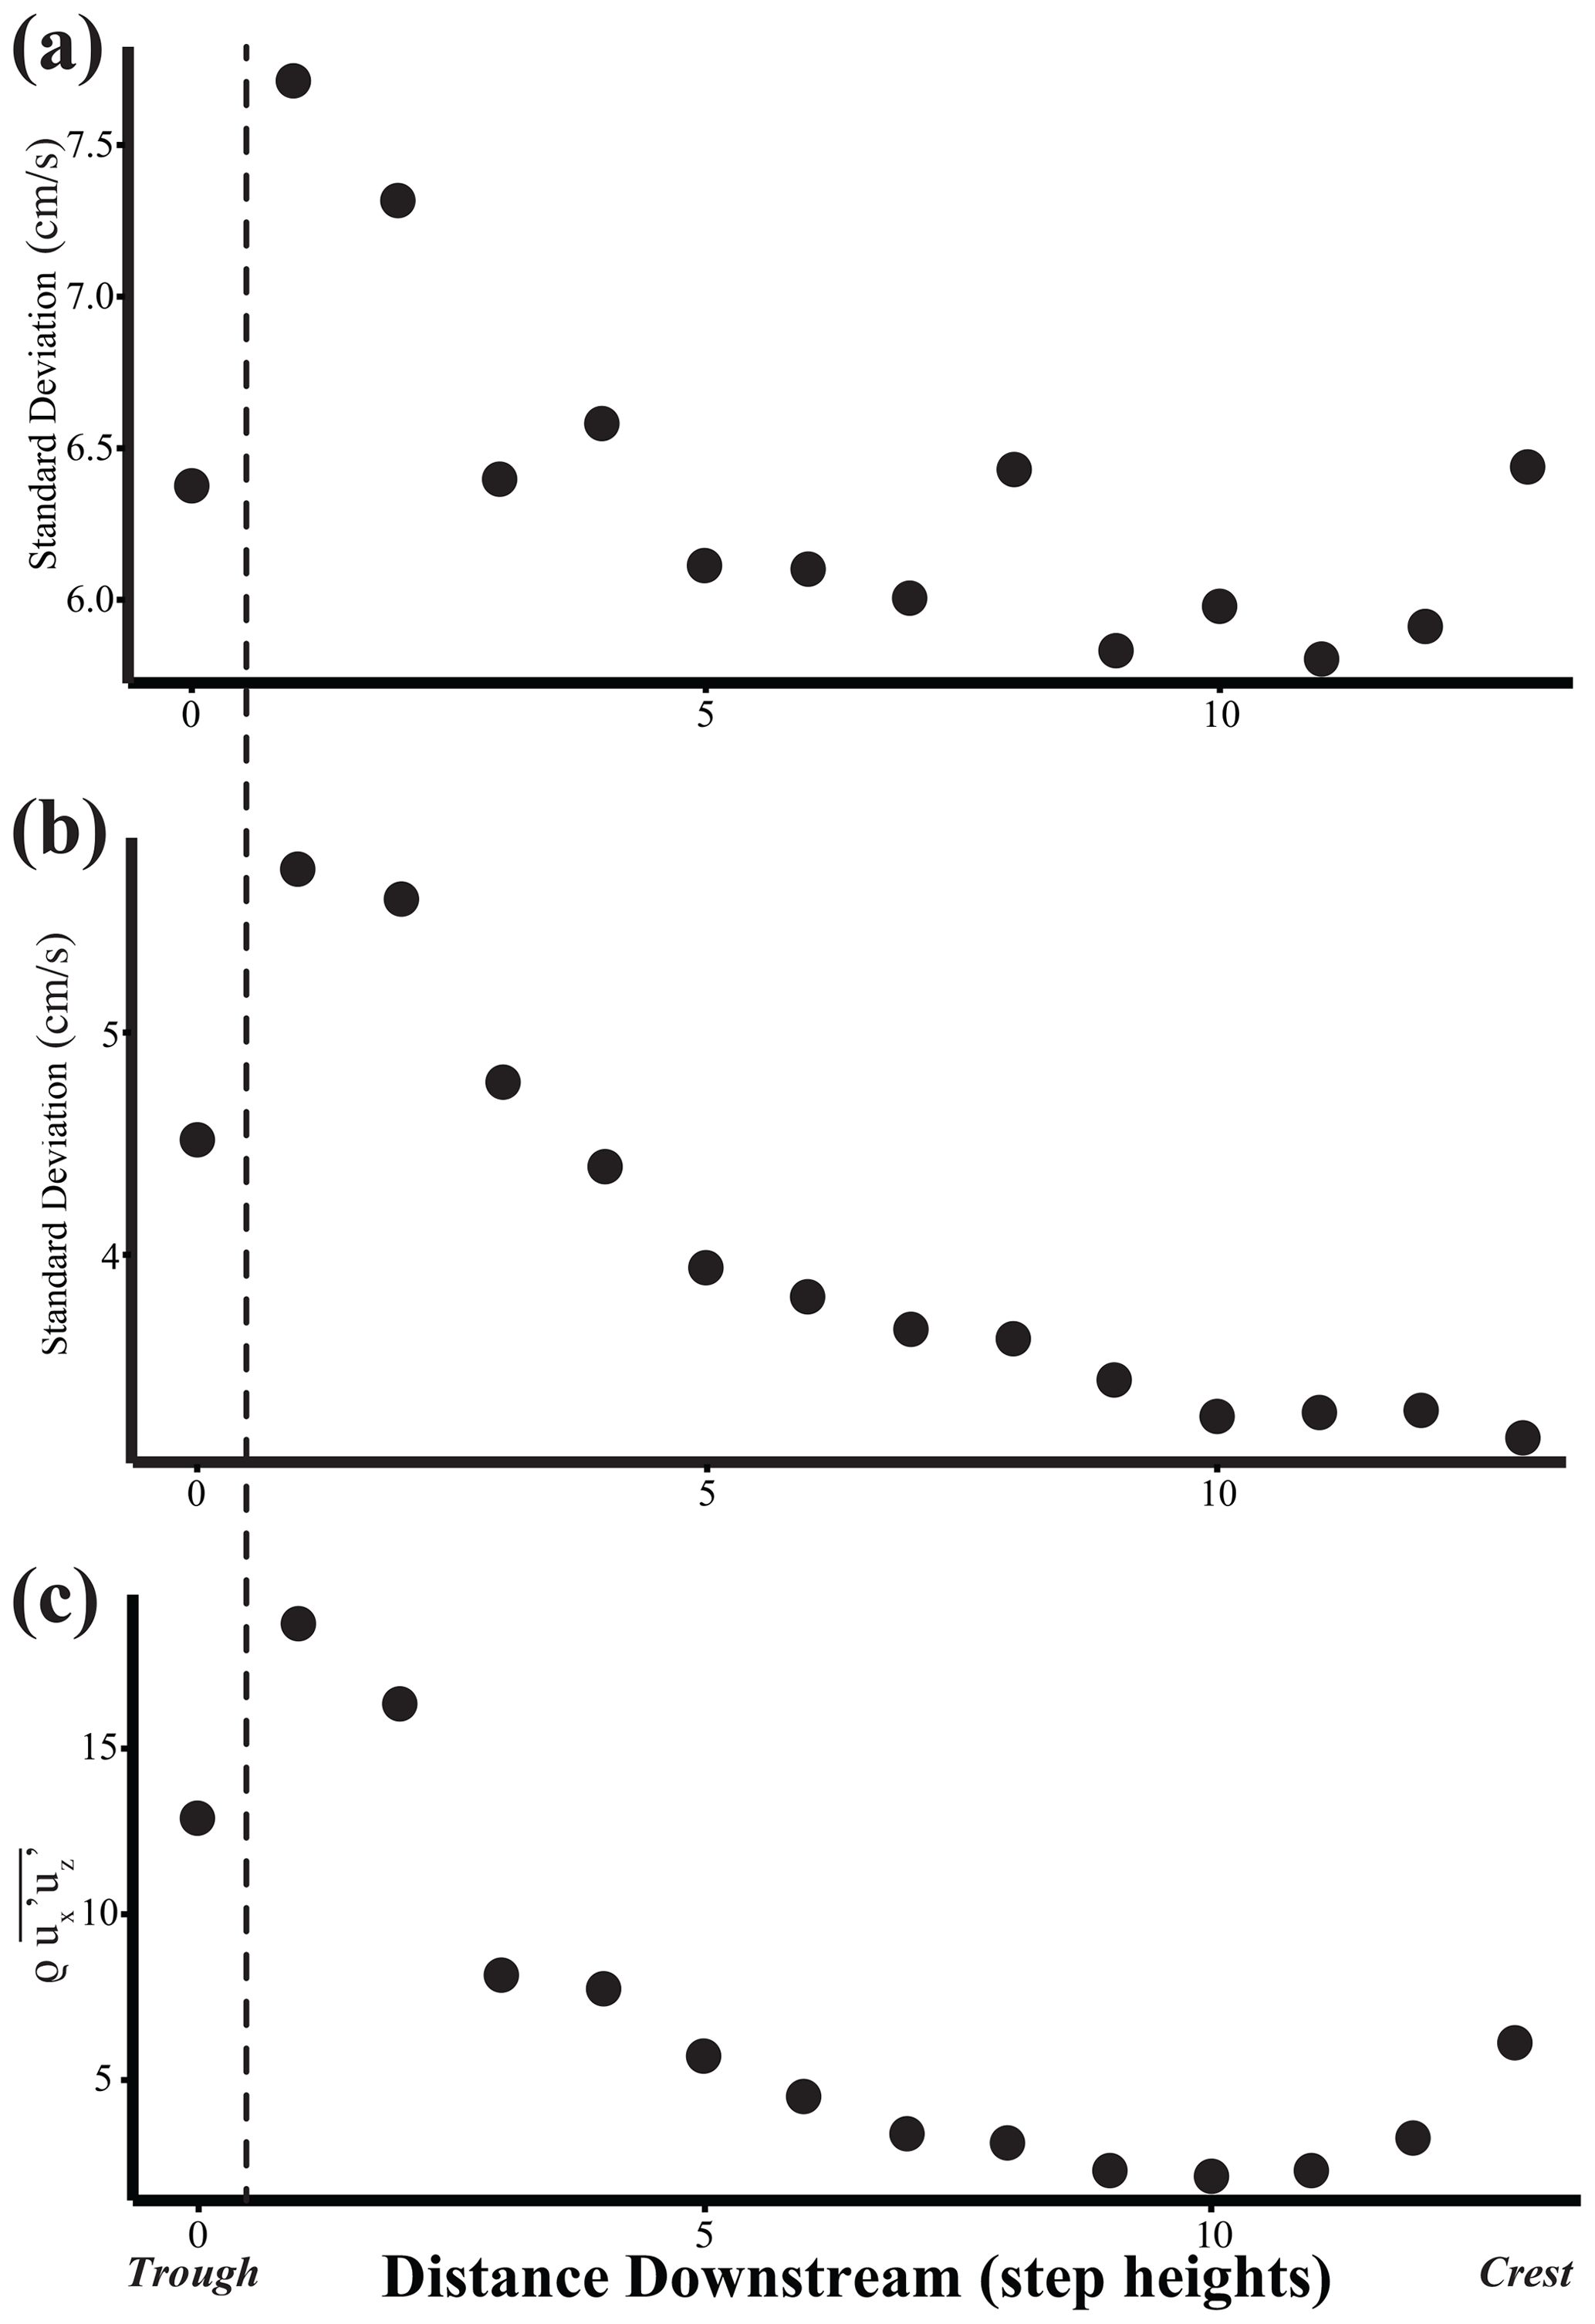
Figure 4Standard deviation of streamwise (a) and vertical (b) fluid velocity distributions. Higher standard deviations near flow reattachment indicate the potential for high-magnitude fluid fluctuations. (c) Reynolds stress with distance along the bedform.
This pattern of standard deviations with increased distance along the bedform is congruent with increased Reynolds stresses in the region proximal to flow reattachment (Fig. 4). Reynolds stress is a measure of the covariance of fluid fluctuations in the streamwise and vertical directions. Reynolds stress decreases in magnitude with increasing distance along the bedform, except at the crest, where it is slightly higher than immediately upstream (Fig. 4c). This pattern of Reynolds stress is in agreement with previous studies’ findings (e.g., Bennett and Best, 1995; Venditti and Bennett, 2000; Robert and Uhlman, 2001; Venditti and Bauer, 2005; Fernandez et al., 2006), wherein decreasing Reynolds stress along the stoss side is due to the development of the internal boundary layer. Measurements near flow reattachment and on the lee side are in the wake region of flow reattachment and therefore have elevated Reynolds stress values. Conversely, measurements made along the stoss side of the bedform are within the internal boundary layer and therefore have greatly reduced Reynolds stress values.
Quadrant analysis conducted at 2, 7, and 12 step heights is also congruent with the above statistical analysis of the flow (Fig. 5; Table 3). At 2 step heights (proximal to flow reattachment), we see the dominance of quadrant 2 and 4 events, which are composed of high-magnitude streamwise and vertical fluctuations. At 7 and 12 step heights, however, all quadrants are roughly equally represented. Additionally, whereas at 2 step heights, the data are oriented towards quadrants 2 and 4, quadrant plots at 7 and 12 step heights are oriented elongate in the direction and narrower in the direction. This change in pattern with increased distance along the bedform indicates that at distances medial and distal to reattachment, the fluid is experiencing more significant magnitude fluctuations in the streamwise direction compared to the vertical direction.
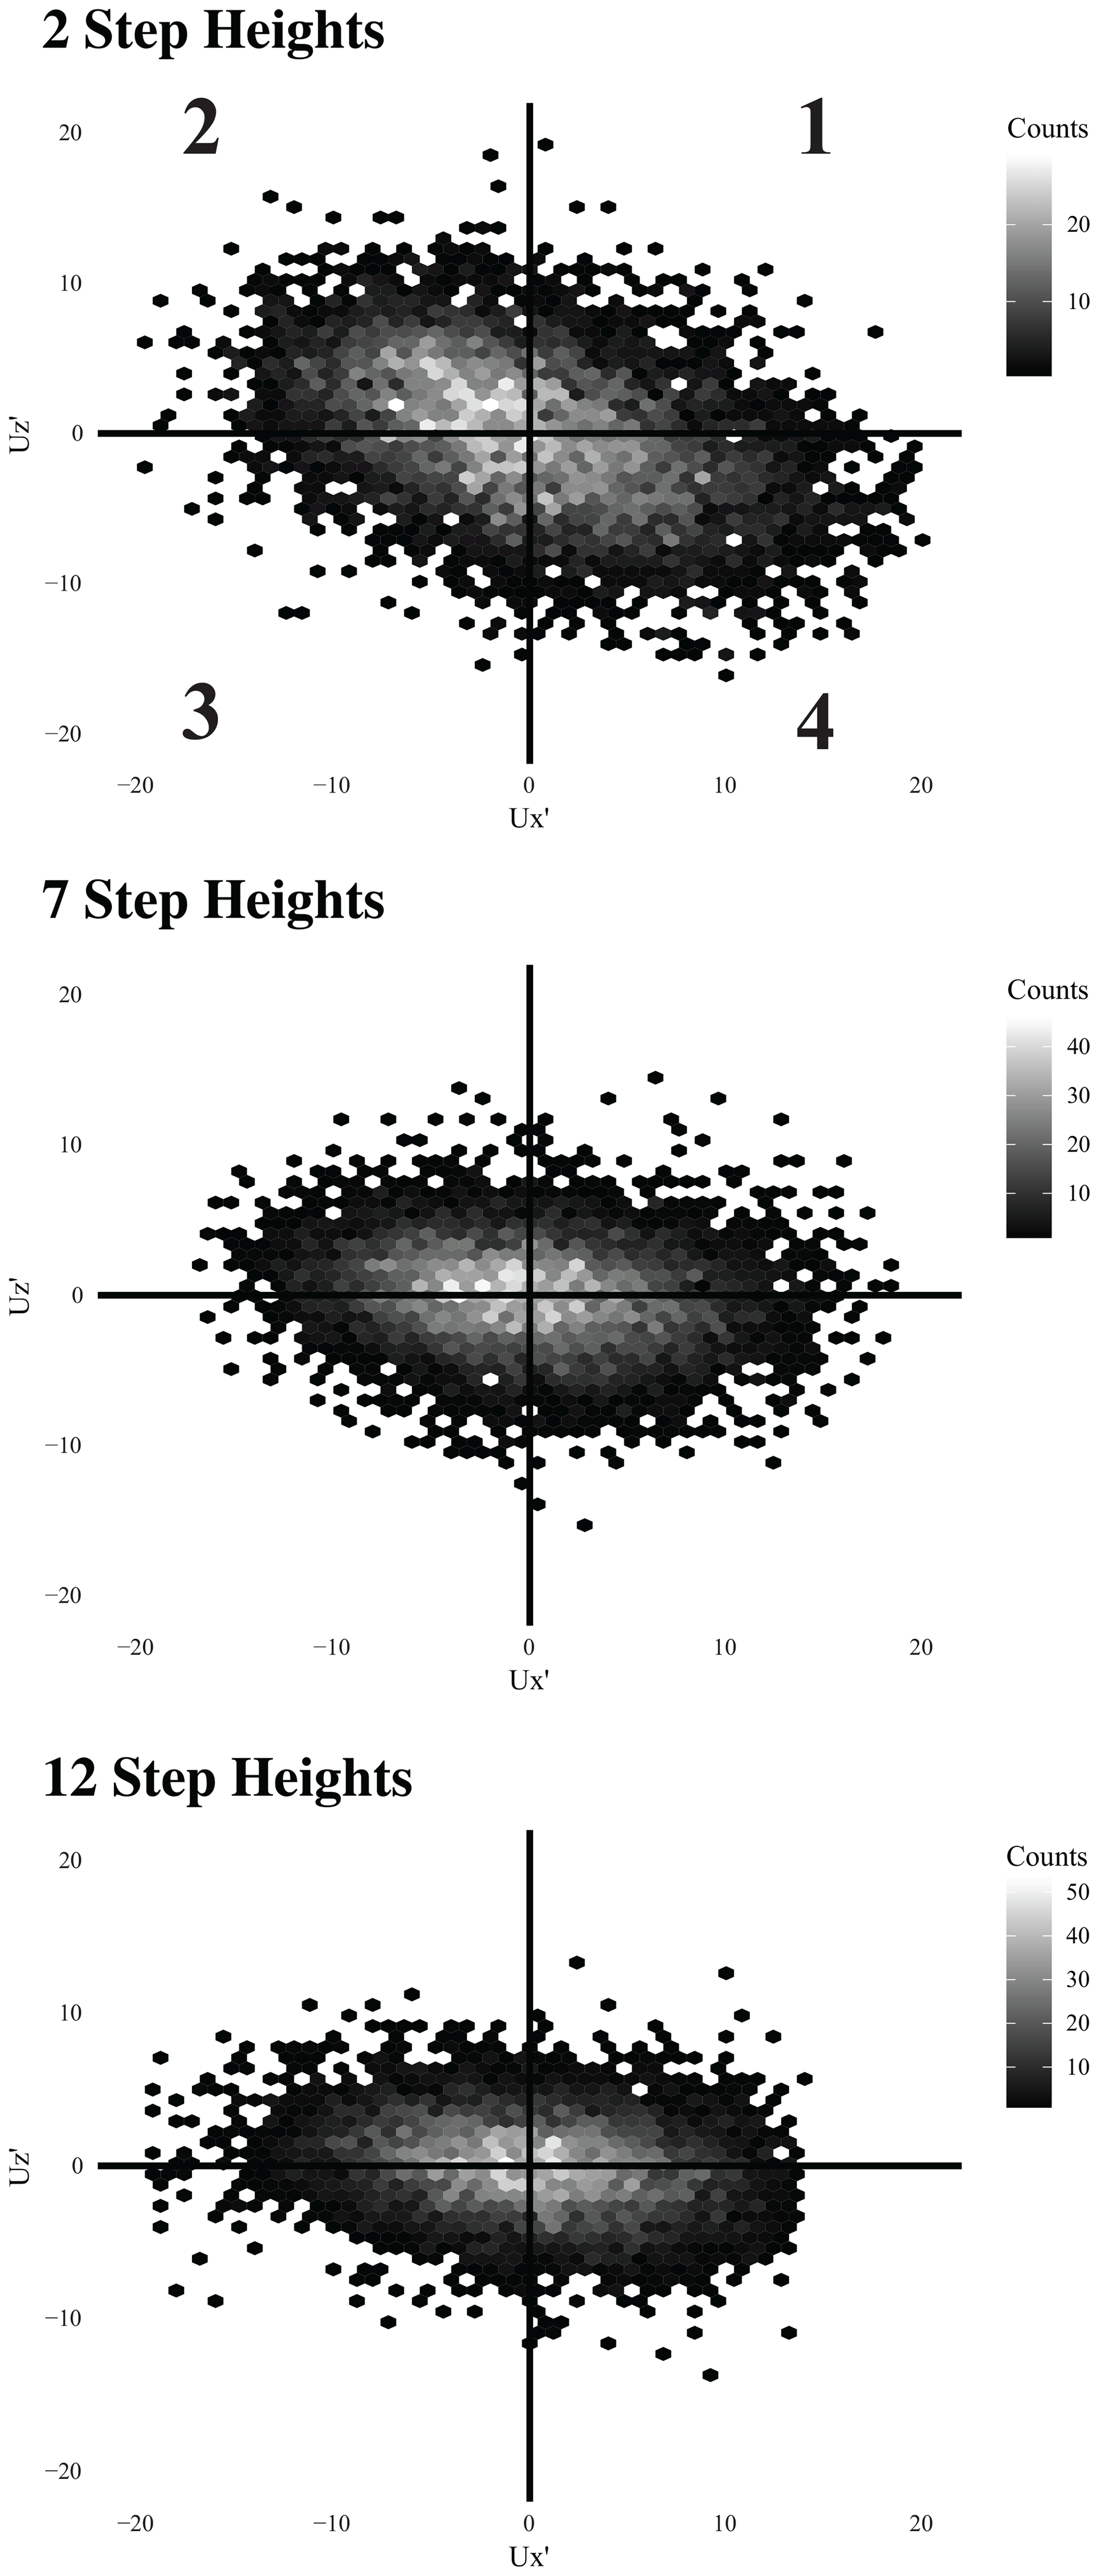
Figure 5Quadrant analysis at three different distances along the bedform. Data are hexagonally binned (no. bins is 50 in each direction) to display varying density of data.
Table 3Summary of significant quadrant events and exuberance (EXFL).
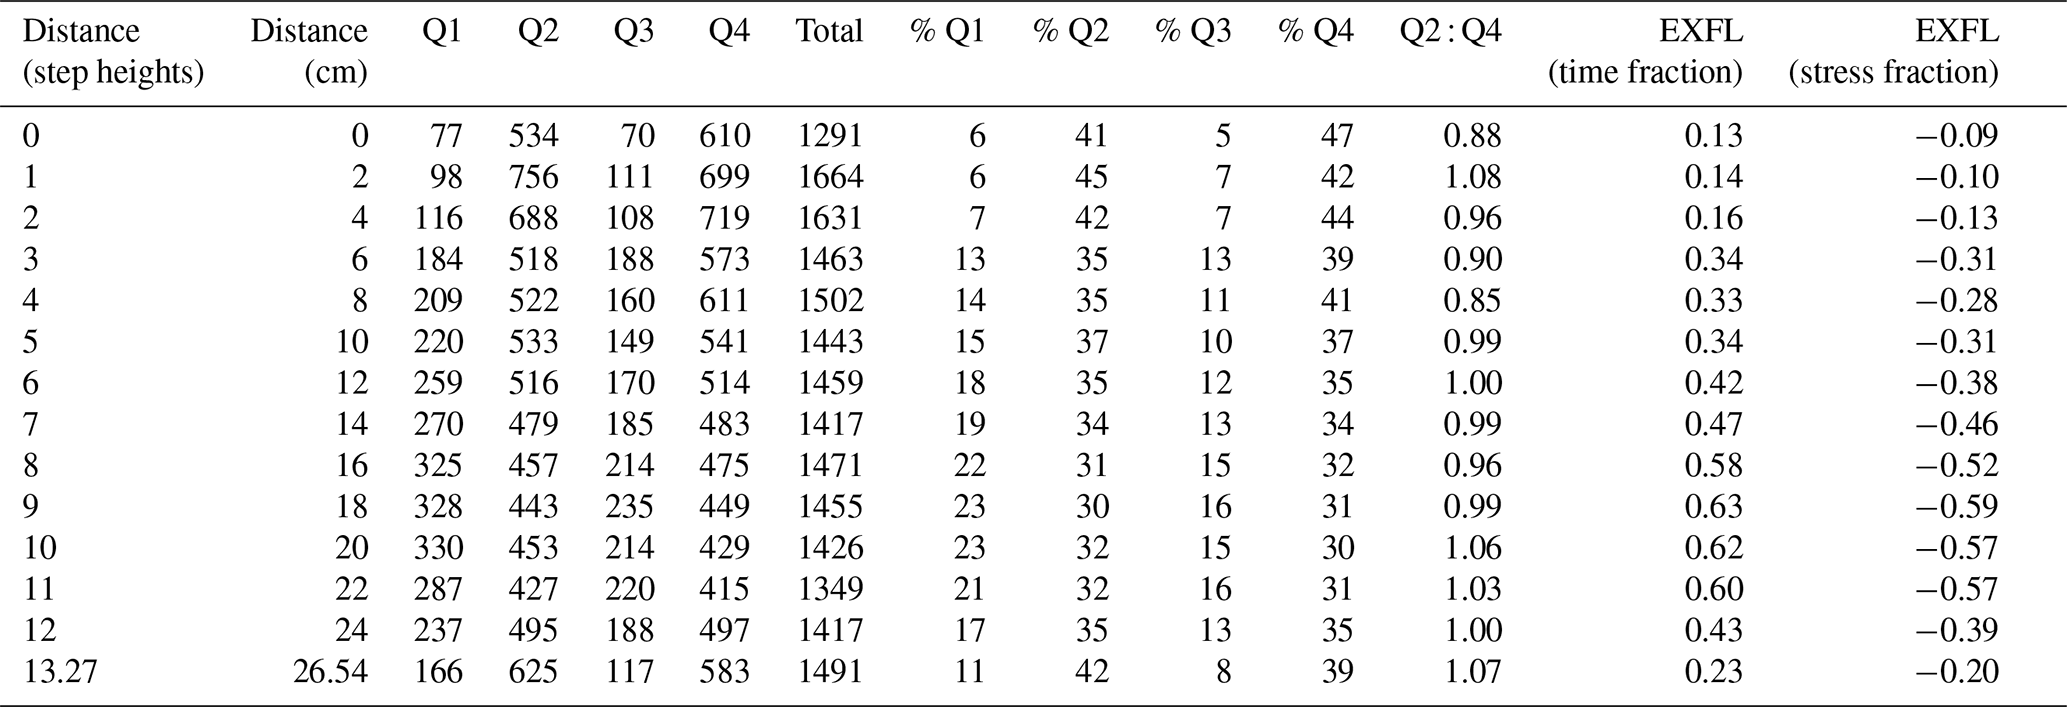
Flow exuberance also captures this change in quadrant distribution with increasing distance along the bedform (Fig. 6). Both time and stress fraction exuberances are nearest to 0 in the region near flow reattachment, indicating that the region is mainly dominated by quadrant 2 and 4 events. With increasing distance along the bedform, however, exuberance increases towards , indicating an increase in the frequency of quadrant 1 and 4 events. Chapman et al. (2012) identified this “exuberance effect” over coastal eolian dunes. They observed that Reynolds stress increased when the time fraction exuberance was low (near the toe and lower stoss region). This is expected as low time fraction exuberance indicates the dominance of quadrant 2 and 4 events that contribute positively to the Reynolds stress.
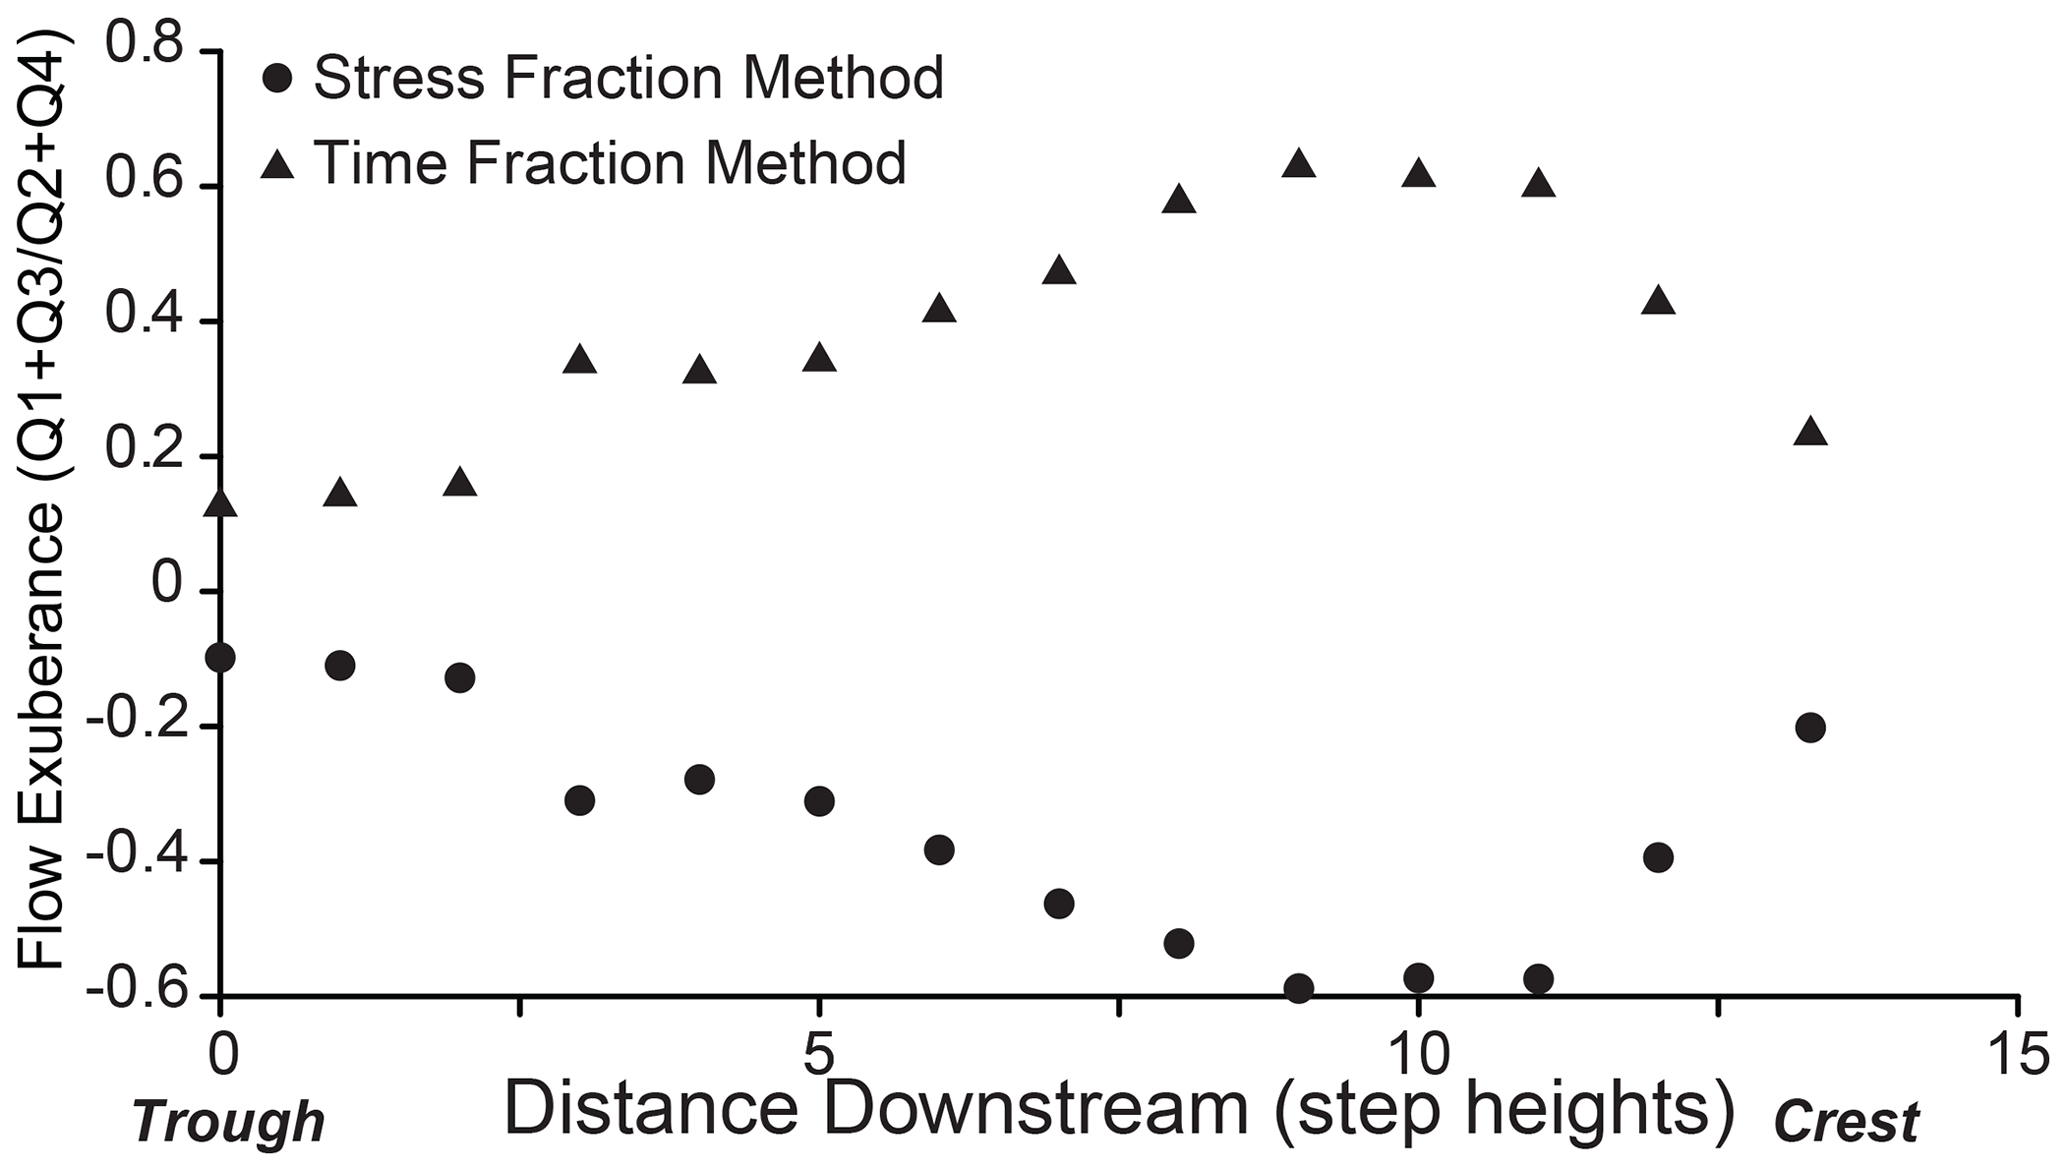
Figure 6Time and stress fraction exuberance at all 14 LDV sampling locations along the bedform. In the region proximal to reattachment, quadrant 2 and 4 events are dominant as indicated by exuberance estimates near 0. Farther along the ripple, exuberance estimates depart from 0 as quadrants 1 and 3 become more prevalent.
3.2 Patterns of bedload transport
Streamwise and cross-stream bedload transport time series data at 1.5, 6.5, and 11.5 step heights show similar patterns to those observed by Leary and Schmeeckle (2017). Cross-stream transport is intermittent at all distances along the bedform (Fig. 7a). Streamwise transport, however, is highly intermittent near flow reattachment (1.5 step heights) with many periods of time at zero or near-zero transport punctuated by periods of high streamwise and cross-stream transport (Fig. 7a). Intermediate (6.5 step heights) and distal (11.5 step heights) to flow reattachment, streamwise transport intermittency decreases, with nonzero transport occurring for the entirety of the sample time.
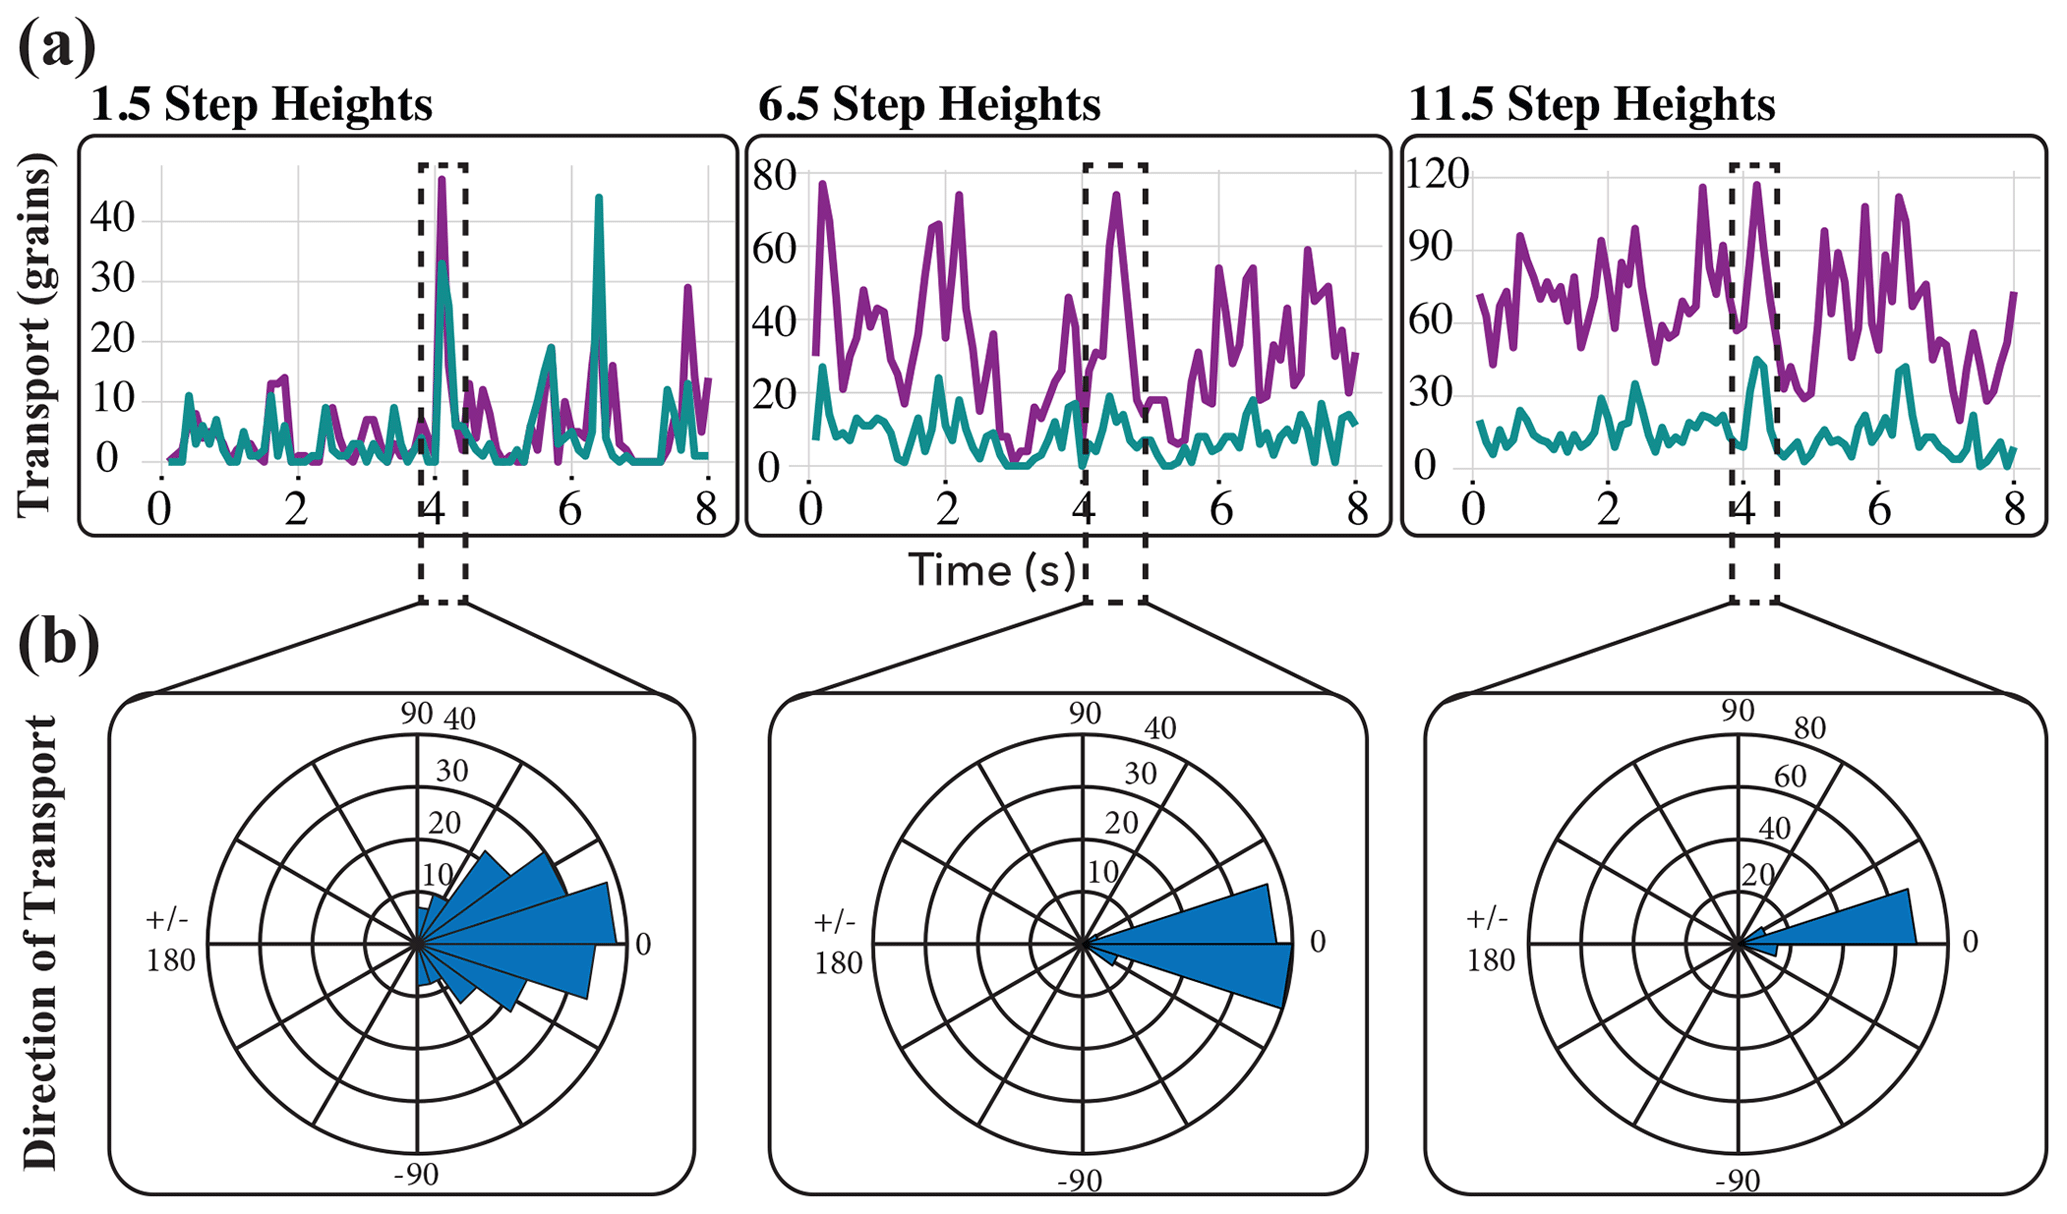
Figure 7(a) Times series of streamwise (purple) and cross-stream (green) bedload transport with increasing distance along the bedform. Streamwise transport is characterized by particles being transported within the directional range of −22.5 to 22.5∘. Cross-stream transport is characterized by particles moving in the directional range of 22.5 to 90 or −22.5 to −90∘. Anything higher than 90∘ is considered upstream transport. (b) Rose diagrams indicating the direction of transport from manual particle tracking of the transport event (outlined by the dashed black box) for each distance along the bedform. The direction of transport becomes more dominated by streamwise transport with increased distance along the bedform. Near flow reattachment, sediment has a wide range of directions in which it is transported.
The direction of sediment transport also varies with distance along the bedform. Near flow reattachment (1.5 step heights) streamwise transport and cross-stream transport are of similar magnitudes. With increased distance along the bedform, however, streamwise transport increasingly outweighs cross-stream transport (Fig. 7a). The direction of transport data from manual particle tracking supports these observations (Fig. 7b). Near flow reattachment, transport occurs in a wide range of directions (+90 to −90∘). With increased distance along the bedform, the direction of transport narrows to just the streamwise direction (within the range of +22.5 to −22.5∘).
Near flow reattachment, transport is much more localized than further downstream (Fig. 8). At 1.5 step heights (Fig. 8a), almost all the transport observed is initiated in the upper left-hand corner of the field of view at the beginning of the transport event. At 7 and 12 step heights (Fig. 8b and c), however, transport is initiated and occurs throughout the field of view and throughout the transport event. Leary and Schmeeckle (2017) attributed these localized, intermittent, high-magnitude, multidirectional transport events, observed near flow reattachment, to bedload patterns associated with splat events. The localized initiation and radial transport pattern observed in Fig. 8a reflect the pattern expected of a splat event (Perot and Moin, 1995; Stoesser et al., 2008; Schmeeckle, 2015; Leary and Schmeeckle, 2017).
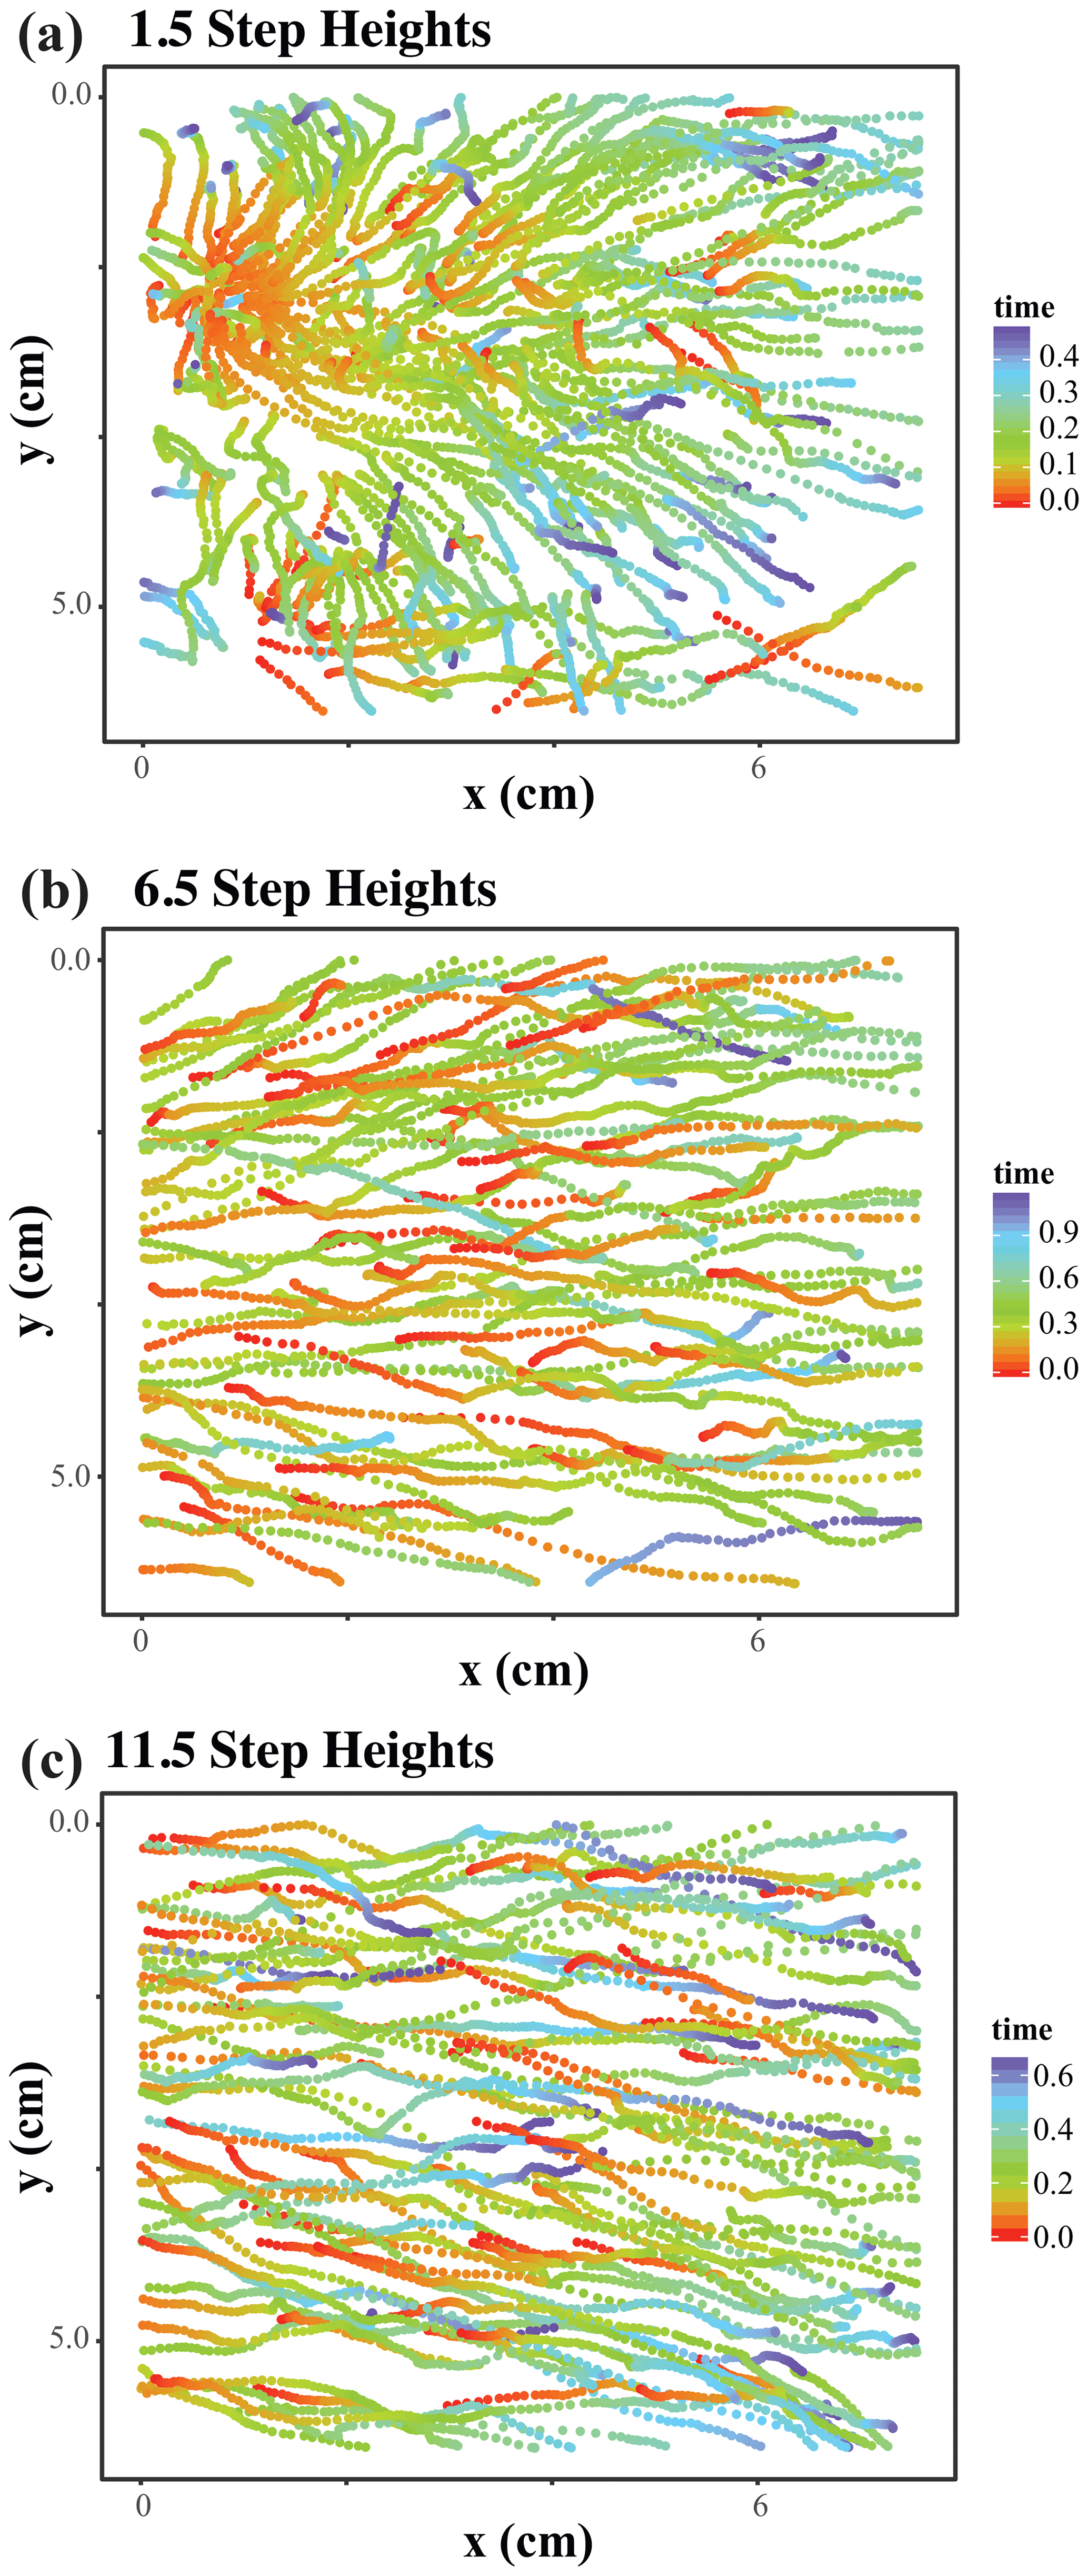
Figure 8Sand grains in transport through time at 1.5, 6.5, and 11.5 step heights downstream of a dune trough. Grains were tracked during the transport events outlined in Fig. 7a. At 1.5 step heights, a majority of grains in transport during the transport event are entrained at a localized position in the upper right-hand corner of the field of view at the beginning of the transport event and continue to be in transport until the end of the transport event. At 6.5 and 11.5 step heights, however, particles are being entrained and transport occurs at all location and times.
4.1 Linear pattern of transport rates
The pattern of sediment transport rates downstream of flow reattachment presented herein contrasts with Leary and Schmeeckle (2017). When flow re-acceleration is present in addition to flow separation and reattachment, bedload transport rates increase linearly with increased distance along the bedform (Fig. 3). The greater the developed flow and acceleration, the greater the sediment transport occurrence for the migration of the bedform downstream (Terwisscha van Scheltinga et al., 2021). Tsubaki et al. (2018) demonstrated that two-dimensional bedforms display a simultaneous sequence of transport events over a broad area. This specific particle movement was seen across adjacent bedform crests and troughs, producing the same transport patterns and maintaining coherent two-dimensional structures due to the uniform velocity; this could contribute to two-dimensional bedforms maintaining their shape.
Consider conservation of mass of the bed in which there is no exchange of suspended sediment with the bed:
where qs is the bedload transport rate in the streamwise direction, is the erosion rate, and λp is the porosity of the sediment. If qs increases with respect to x, erosion occurs. If qs decreases with respect to x, deposition occurs. This is in agreement with the classical formulation that as bedforms migrate, sediment is eroded along the stoss side of the bedform (where sediment transport rates increase due to increasing mean streamwise fluid velocities) and deposited on the lee side (where sediment transport rate decreases due to flow separation).
The pattern of bedload transport presented in this study suggests that deposition is initiated at the crest of the bedform (where qs begins to decline; Fig. 3) and continues over the lee side of the bedform. This pattern of peak qs located upstream of the crest is integral to maintaining bedforms because it initiates deposition at the crest rather than continuing to erode the bedform away. Why does a decrease in qs occur at the crest? The crest represents the region of the bedform in which the zone of fluid acceleration transitions to flow separation. At this transition, near-bed fluid velocities decrease (Fig. 3). Additionally, flow separation does not occur at a fixed point in space and time. This variability creates a flow separation “zone” at the crest that is characterized by decreases in near-bed fluid velocities (Fig. 3), resulting in a decrease in qs at the crest.
The rate of change in qs along the stoss side of the bedform also has important implications for the geometric evolution of bedforms. For erosion to occur on the stoss side of the bedform, only an increasing pattern of transport is necessary (i.e., it is not necessary for transport rate to increase linearly, as seen in this study). A consistent linear increase in transport rate through time is necessary, however, to maintain a spatially and temporally constant erosion rate along the bedform. Substituting a linear equation for qs into Eq. (2) results in
where a and b are constants. Solving the derivative for a change in sediment transport rate with respect to x thus produces a constant rate of erosion independent of distance along the bedform:
In this case of a linear increase in sediment transport rate, in which there is no cross-stream variability (), the bedform will erode an equal amount at all distances along the stoss side and, assuming all that sediment is then deposited on the lee side (i.e., no suspension), therefore retain a two-dimensional geometry (Fig. 9a). Any subsequent change in sediment transport rate could result in deformation (i.e., when the sum of all changes in elevation of the bed does not equal zero; McElroy and Mohrig, 2009) and potentially cause a shift to a more three-dimensional geometry, especially if variability in the cross-stream direction exists () or if suspended sediment is interacting with the bed (McElroy and Mohrig, 2009).
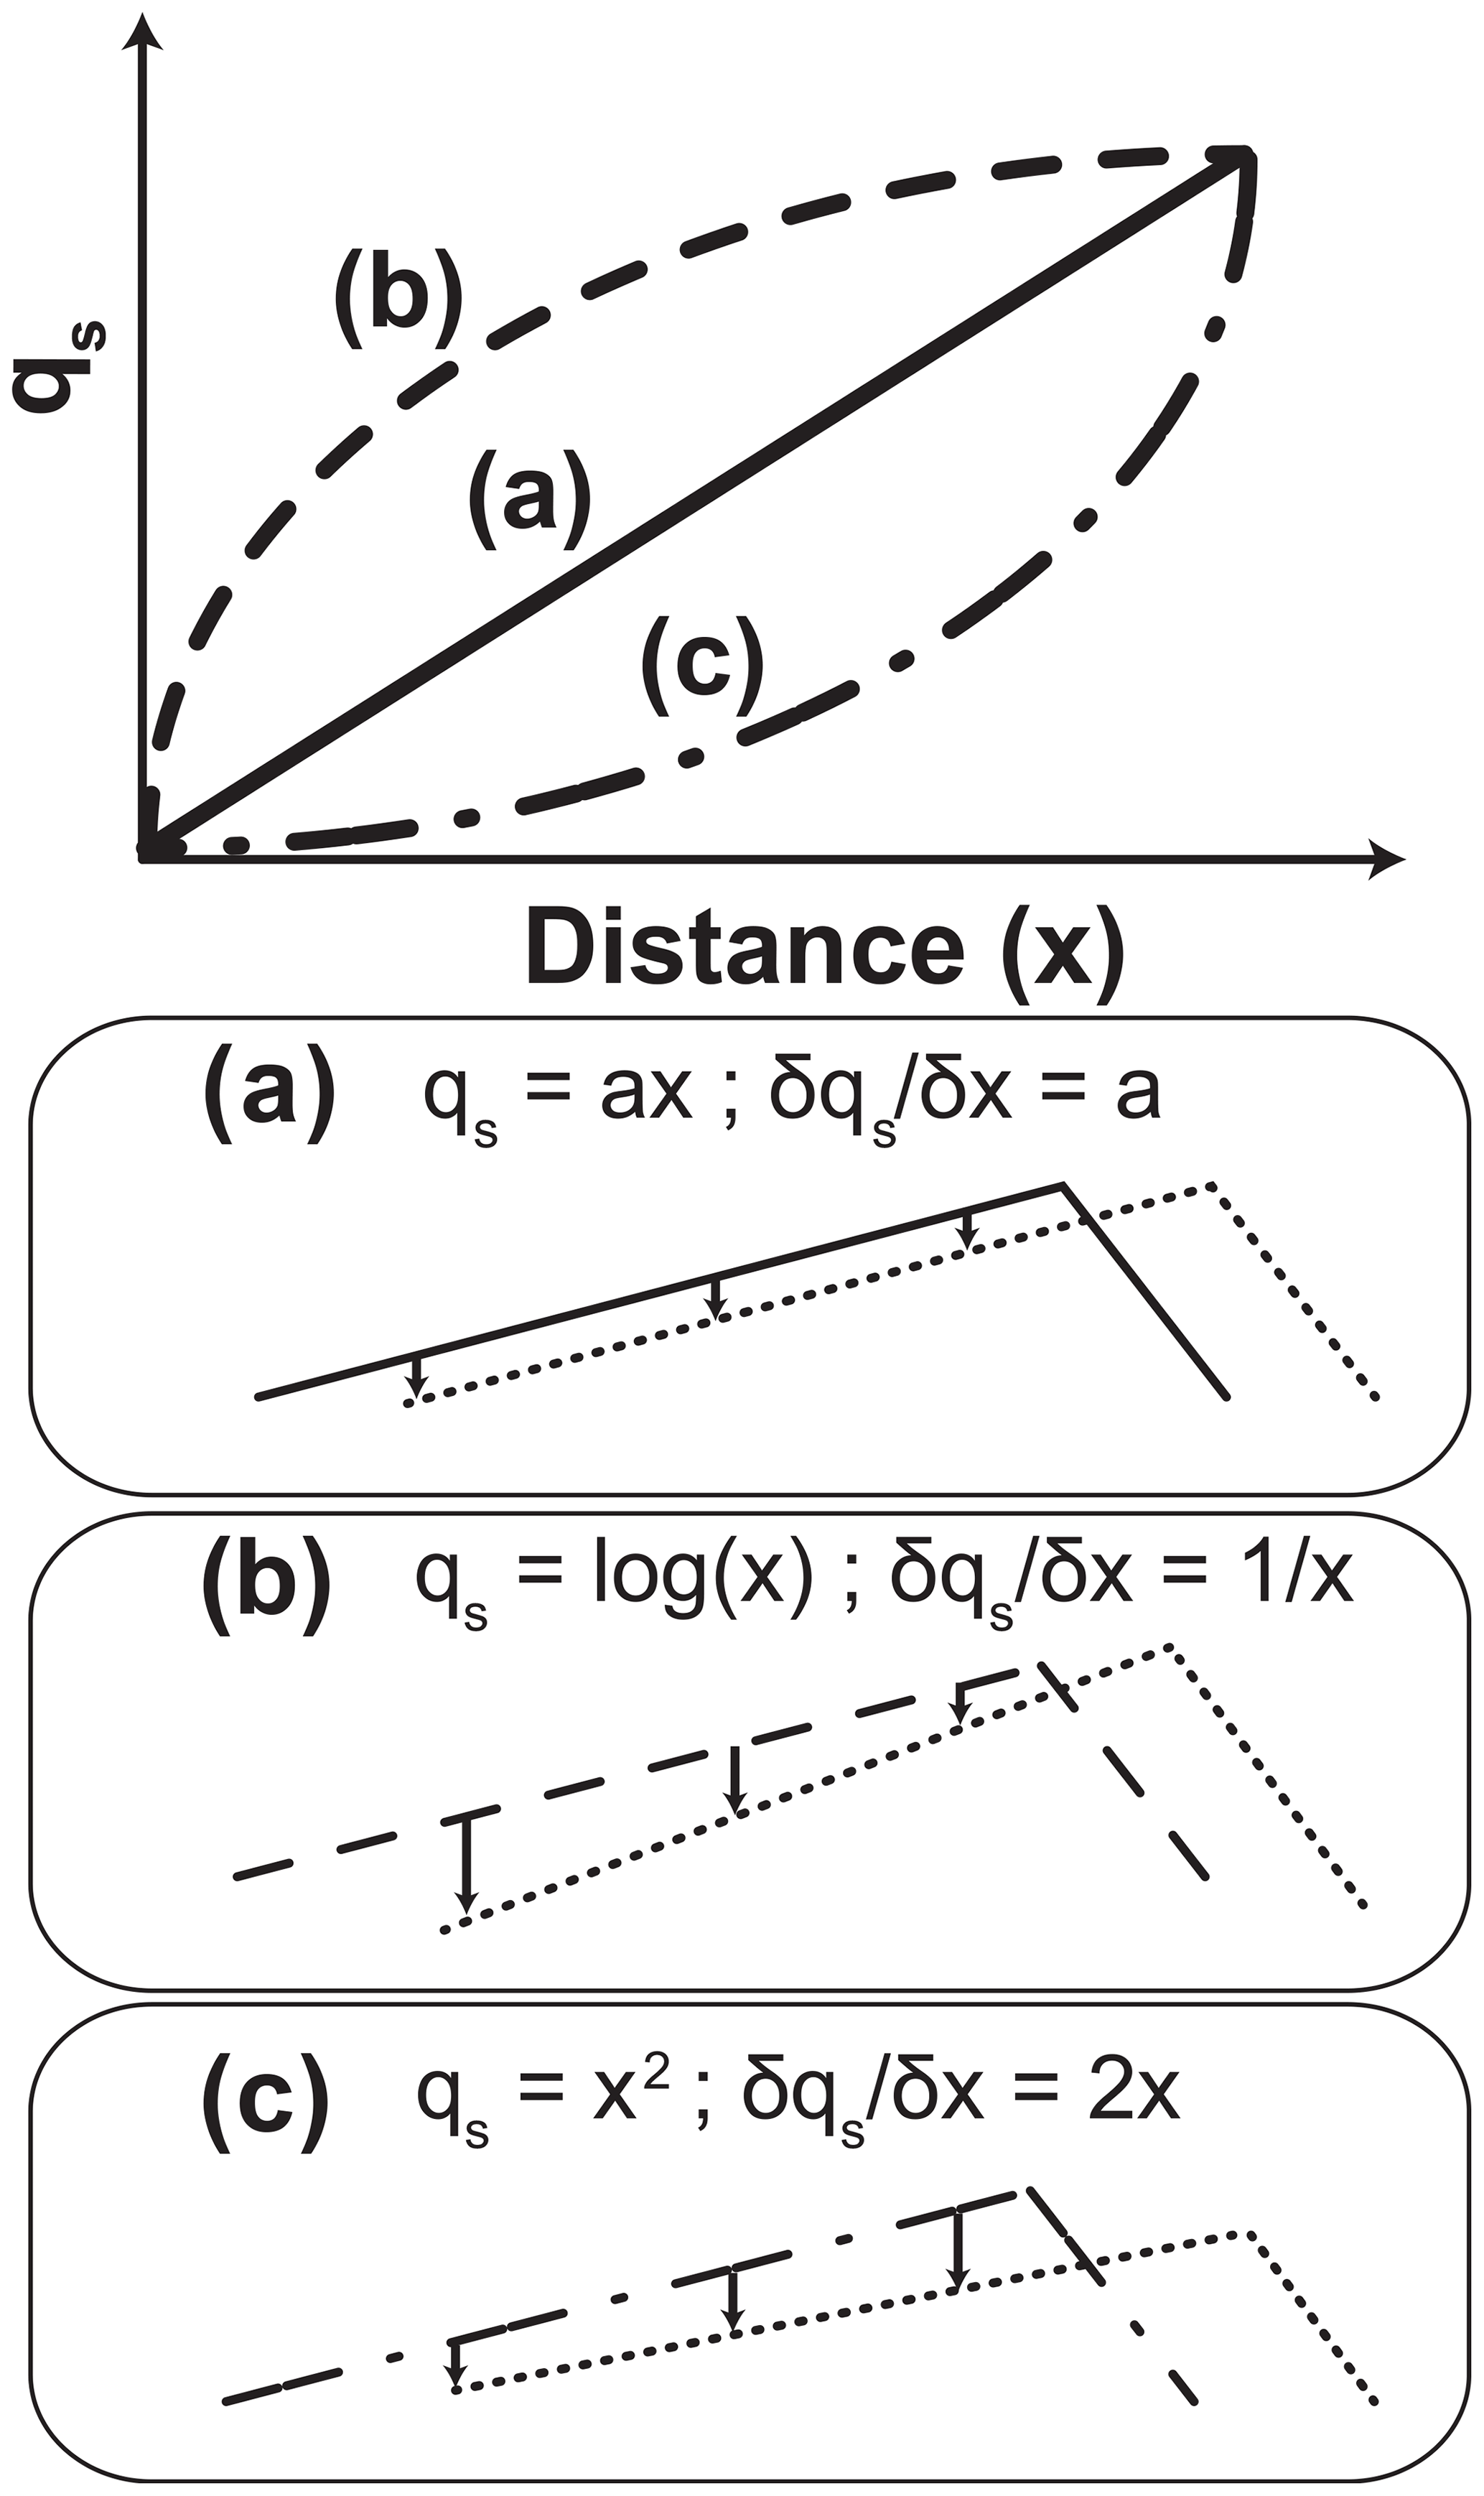
Figure 9Schematic of different patterns of erosion along the stoss side of a bedform based on linear (a), logarithmic (b), and algebraic (c) increases in bedload transport.
Venditti et al. (2005) reported the development and importance of “crest defects” in the transition from two-dimensional to three-dimensional bedforms. Small excesses or deficiencies of sediment at the crest line cause these crest defect features (Venditti et al., 2005). As time elapsed and flow conditions remained constant, Venditti et al. (2005) observed that the field of bedforms (originally two-dimensional) became overwhelmed by crest defect features and transitioned to a field of three-dimensional bedforms.
Based on results from this study, we hypothesize that crest defects could be caused by spatially and/or temporally nonuniform increases in transport rates along the bedform in the cross-stream direction (i.e., linear increase in some regions, nonlinear increase in other regions). For example, if sediment transport rates transition from increasing linearly to increasing algebraically (i.e., qs=xa; where a > 1), the erosion rate will increase along the stoss side, causing a deficiency in sediment near the crest where the erosion rate is highest (Fig. 9c). In contrast, if sediment transport rates transition from increasing linearly to increasing logarithmically (i.e., qs=log (x)), erosion rates will decrease with distance along the stoss side, resulting in an excess of sediment near the crest where erosion rate is lowest (Fig. 9b). The spatiotemporal changes in bedload transport rate over bedforms need to be examined in more complex conditions than that of a fixed two-dimensional ripple (as presented in this study) in order to determine the validity of the above hypotheses.
4.2 The dynamics of splat events
In addition to changes in the overall magnitude of transport occurring along the stoss side of the bedform, changes in the pattern of transport and turbulent structures also occur. In the region just downstream of flow reattachment, the fluid is dominated by large-magnitude streamwise and vertical fluid fluctuations that take the form of either quadrant 2 or 4 events. The dominance of these events decreases with increased distance along the stoss side of the bedform. Notably, quadrant 4 events are integral to splat events (Schmeeckle, 2015; Leary and Schmeeckle, 2017), and the increase in these events near flow reattachment indicates that splat events may be occurring in the region. Bedload transport time series and manual particle tracking indicate that in this zone just downstream of flow reattachment, transport is localized, intermittent, high-magnitude, and multidirectional – the same characteristics previously attributed to particles transported by splat events (Leary and Schmeeckle 2017). These results indicate that splat events still play a significant role in the transport pattern in the zone immediately downstream of flow reattachment, even when flow re-acceleration is present. The majority of transport occurring at 1.5 step heights is the result of a splat event. We can use particle-tracking data to assess the transport characteristics of splat events. For the splat event observed at 1.5 step heights, the length of transport and particle velocity are investigated in relation to the transport direction.
Although splat events initiate transport in a radial pattern, transport velocity (both mean and instantaneous) and transport length (both cumulative and instantaneous) vary with the direction of transport (Fig. 10). “Instantaneous” refers to transport dynamics (length, velocity, and direction) at each time step. Mean velocity is the average speed the particle moves throughout active transport. Cumulative transport length is the distance the particle travels the entire time it is in motion. Instantaneous and cumulative data show that particles moving in the streamwise direction have a much larger velocity distribution and transport length. At a maximum, particles traveling in the streamwise direction have a velocity and transport length approximately double that of a particle moving in a cross-stream direction. This indicates that splat events do not transport particles equally in all directions. Despite this, splat events do actively transport sediment in the cross-stream direction, indicating that cross-stream transport may play a more active role in bedload transport over bedforms than previously thought (Leary and Schmeeckle, 2017).
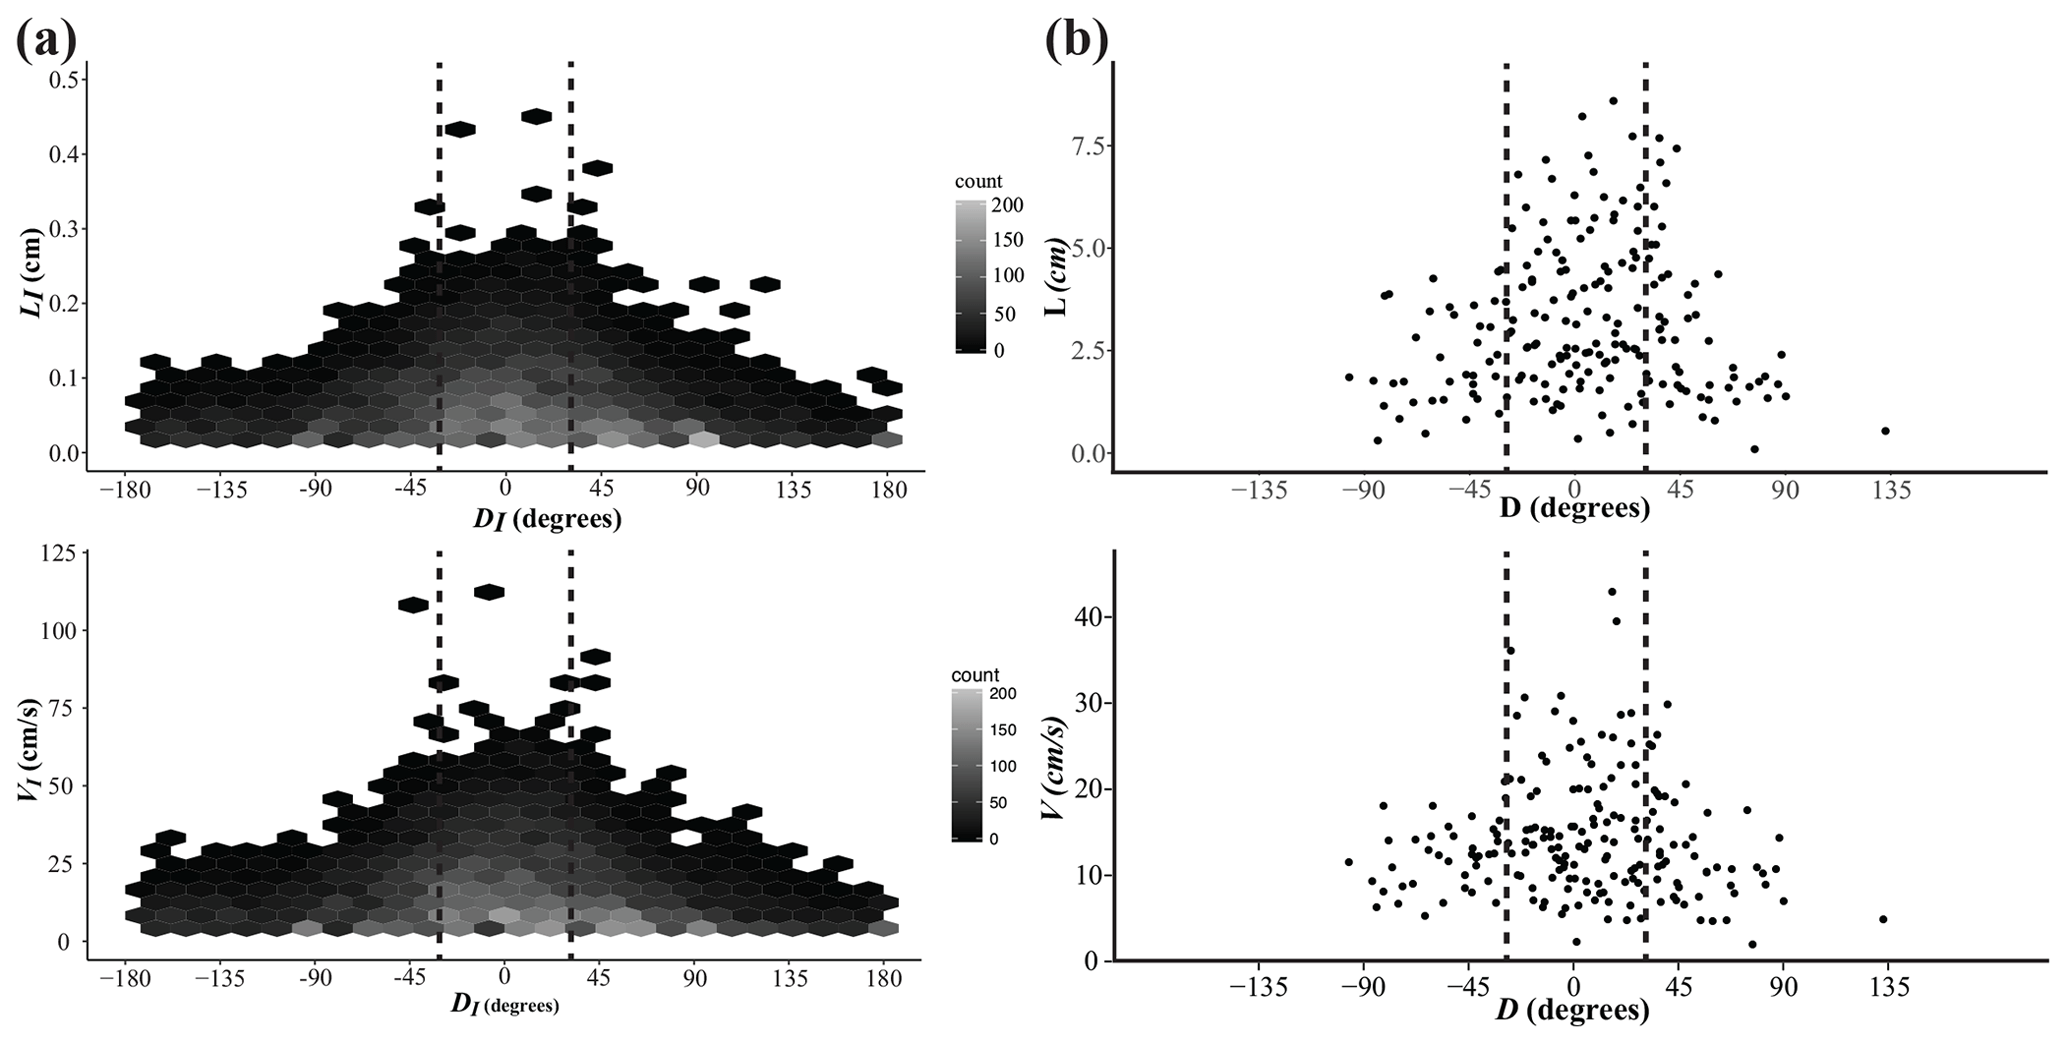
Figure 10Instantaneous (a) and cumulative (b) transport characteristics of a splat event. Vertical dashed lines indicate ±30∘, transport within which is classified as streamwise. (a) Instantaneous length of transport (LI) and instantaneous transport velocity (VI) referenced to the direction of transport. The data are binned hexagonally to illustrate the density of the data (no. bins is 25; n=11 091). (b) Cumulative track length (total distance a particle travels) and mean particle velocity during the entire period of transport.
It is also worth noting that at all locations where particles were tracked, particles were not observed saltating in a classical sense. That is to say, with these coarser sediments, particles are not observed being ejected into the flow or saltating with large hop distances. Instead, particles appear to almost trundle along the surface of the bedform. This agrees with Fathel et al. (2015), wherein streamwise and cross-stream particle motions over a flatbed exhibited predominantly small hop distances.
The experimental work of Radice (2021) determined that the sediment concentration appears to be the main factor in the transport of sediment along a dune. This could affect the transport values in the streamwise and cross-stream direction of the flow field. Radice (2021) noted that the particle migration primarily held a one-dimensional flow in the downstream direction, with cross-stream transport only being reported in the trough, with few particles. Depending on the strength of the flow and the concentration of sediment in the bedload, does a higher bedload concentration create more splat events, therefore initiating more particle movement in the cross-stream direction?
Some biases remain in this method of particle tracking. The first is that particles that are moving slowly are much easier to track. Although effort was made to track particles randomly regardless of speed, this unintended bias is potentially still present. For this reason, particle velocities may be greater than those presented in Fig. 10. Secondly, the length of transport is, of course, biased by the field-of-view size. Once a particle leaves the field of view, its track is terminated, but it may continue to be transported. Therefore, the transport lengths reported in Fig. 10 should be considered minimum estimates. Lastly, small particle displacements, in which particles are transported on very short timescales, are often not taken into account during manual particle tracking (Fathel et al., 2015; Finn et al., 2016). Fathel et al. (2015, 2016) found that these small particle displacements dominate bedload motions over a flatbed. The bedload tracking analysis conducted herein did not expressly address this, so the lower end of transport length and velocity distributions may not be represented.
4.3 The potential role of splat events in bedform three-dimensionality
The dynamics of splat events not only inform our understanding of the importance of cross-stream transport proximal to flow reattachment, but they also potentially provide insight into the three-dimensionality of bedforms. For example, Rubin and Ikeda (1990) and Rubin and Hunter (1987) demonstrated that bedform alignment in multidirectional flows depends on the maximum gross bedform normal transport, which is dictated by the resultant vector of two flow vectors. Although these studies did not investigate flows with more than two flow vectors, the concept of shifting dominant transport directions depending on flow geometry and, by extension, bedform geometry is intriguing.
Building on the experiments of Allen (1966), Venditti (2007) investigated the flow patterns over non-planform dune geometries and found that flow over a lobe shape tended to converge downstream. In contrast, flow over a saddle shape would diverge. We hypothesize that splat events may become concentrated in these regions of flow convergence or divergence, potentially shifting the direction of maximum gross bedform normal transport. The convergence and divergence of flow over lobe and saddle features could potentially cause along-dune variability in the intensity of splat events. Along-dune variability in the intensity of splat events could produce a gradient of sediment transport with respect to y (i.e., ). As noted in the above discussion, variability in transport rates in the cross-stream direction would enable deformation of the downstream crest and induce bedform three-dimensionality. Considering the results presented herein, we suggest two potential mechanisms that could drive the transition from two-dimensional to three-dimensional bedform geometries: (1) splat events near flow reattachment (Leary and Schmeeckle, 2017, and this study) and (2) localized, nonlinear increases in bedload transport rates along the stoss side of the bedform (Jerolmack and Mohrig, 2005). These two processes may be genetically linked, and we hypothesize that (1) could drive (2).
We assess the effects of flow separation and flow re-acceleration on sub-bedform bedload transport dynamics using high-resolution velocity (ADV) and bedload data (high-speed imagery; manual tracking techniques) from flume experiments with bedload transport over fixed 2D ripples. Results reported herein show the following.
-
Mean bedload transport rates increase linearly with distance along the stoss side of bedforms.
-
Intermittency, velocity, and direction of bedload transport vary significantly with increased distance along the stoss side of the bedform.
-
Splat events continue to play a pivotal role in bedload transport near flow reattachment when flow re-acceleration is present.
The existence and importance of splat events are congruent with previous studies that lacked the detailed bedload tracking analysis included in this study but that recognized the importance of quadrant 1 and 4 events in the entrainment of bedload near flow reattachment (Bennett and Best, 1995; McLean et al., 1994a). Results reported herein and by Leary and Schmeeckle (2017) and Schmeeckle (2015) indicate that splat events are (1) the primary mechanisms entraining sediment near flow reattachment, (2) comprised of quadrant 1 and 4 events (or the octant sequence {14−4} in the case of Leary and Schmeeckle, 2017), and (3) entrain sediment in both the streamwise and cross-stream directions. The analysis reported herein also suggests the importance of quadrant 2 events near flow reattachment, but it is unclear how these events play a role in splat events. Although splat events transport sediment at greater velocities and greater distances in the streamwise direction, their transport dynamics in the cross-stream direction remain significant. Further work needs to be done investigating the spatiotemporal patterns of transport rates over live bedforms and the bedform-scale effect splat events have on along-dune transport.
All data presented in this article are available at https://doi.org/10.5281/zenodo.7552715 (Leary, 2023). Data are also available upon request to kate.leary@nmt.edu.
KCPL and MS designed and performed the experiments. KCPL processed the resulting data. KCPL drafted the figures and paper text. LT and MS edited the figures and paper text. All authors were responsible for developing the critical ideas present in the paper.
The contact author has declared that none of the authors has any competing interests.
Publisher's note: Copernicus Publications remains neutral with regard to jurisdictional claims in published maps and institutional affiliations.
We are very grateful to the two anonymous reviewers and associate editor, Rebecca Hodge, for their thoughtful and constructive reviews.
This research has been supported by the National Science Foundation (grant no. 1734752).
This paper was edited by Rebecca Hodge and reviewed by two anonymous referees.
Allen, J.: On bed forms and palaeocurrents, Sedimentology, 6, 153–190, 1966. a
Ashley, T. C., Mahon, R. C., Naqshband, S., Leary, K. C., and McElroy, B.: Probability distributions of particle hop distance and travel time over equilibrium mobile bedforms, J. Geophys. Res.-Earth, 125, e2020JF005647, https://doi.org/10.1029/2020JF005647, 2020. a, b
Bennett, S. and Best, J.: Mean flow and turbulence structure over fixed, two-dimensional dunes: implications for sediment transport and bedform stability, Sedimentology, 42, 491–513, 1995. a, b, c, d, e, f
Chapman, C., Walker, I. J., Hesp, P. A., Bauer, B. O., Davidson-Arnott, R. G., and Ollerhead, J.: Reynolds stress and sand transport over a foredune, Earth Surf. Proc. Land., 38, 1735–1747, 2013. a
Chapman, C. A., Walker, I. J., Hesp, P. A., Bauer, B. O., and Davidson-Arnott, R. G.: Turbulent Reynolds stress and quadrant event activity in wind flow over a coastal foredune, Geomorphology, 151, 1–12, 2012. a
Chou, Y.-J. and Fringer, O. B.: A model for the simulation of coupled flow-bed form evolution in turbulent flows, J. Geophys. Res.-Oceans, 115, C10041, https://doi.org/10.1029/2010JC006103, 2010. a
Fathel, S. L., Furbish, D. J., and Schmeeckle, M. W.: Experimental evidence of statistical ensemble behavior in bed load sediment transport, J. Geophys. Res.-Earth, 120, 2298–2317, 2015. a, b, c
Fathel, S., Furbish, D., and Schmeeckle, M.: Parsing anomalous versus normal diffusive behavior of bedload sediment particles, Earth Surf. Proc. Land., 41, 1797–1803, 2016. a
Fernandez, R., Best, J., and López, F.: Mean flow, turbulence structure, and bed form superimposition across the ripple-dune transition, Water Resour. Res., 42, W05406, https://doi.org/10.1029/2005WR004330, 2006. a
Finn, J. R., Li, M., and Apte, S. V.: Particle based modelling and simulation of natural sand dynamics in the wave bottom boundary layer, J. Fluid Mech., 796, 340–385, 2016. a
Gilbert, G. K.: Report on the Geology of the Henry Mountains, US Government Printing Office, 1877. a
Gilbert, G. K. and Murphy, E. C.: The transportation of debris by running water, 86, US Government Printing Office, 1914. a
Giri, S. and Shimizu, Y.: Numerical computation of sand dune migration with free surface flow, Water Resour. Res., 42, W10422, https://doi.org/10.1029/2005WR004588, 2006. a
Guala, M., Heisel, M., Singh, A., Musa, M., Buscombe, D., and Grams, P.: A mixed length scale model for migrating fluvial bedforms, Geophys. Res. Lett., 47, 2019GL086625, https://doi.org/10.1029/2019GL086625, 2020. a
Itakura, T. and Kishi, T.: Open channel flow with suspended sediments, J. Hydr. Eng. Div.-ASCE, 106, 1325–1343, 1980. a
Jerolmack, D. J. and Mohrig, D.: A unified model for subaqueous bed form dynamics, Water Resour. Res., 41, W12421, https://doi.org/10.1029/2005WR004329, 2005. a
Khosronejad, A. and Sotiropoulos, F.: Numerical simulation of sand waves in a turbulent open channel flow, J. Fluid Mech., 753, 150–216, 2014. a
Kidanemariam, A. G. and Uhlmann, M.: Formation of sediment patterns in channel flow: minimal unstable systems and their temporal evolution, J. Fluid Mech., 818, 716–743, 2017. a
Kidanemariam, A. G., Scherer, M., and Uhlmann, M.: Open-channel flow over evolving subaqueous ripples, J. Fluid Mech., 937, A26, https://doi.org/10.1017/jfm.2022.113, 2022. a
Leary, K.: Replication data for: Spatiotemporal Bedload Transport Patterns Over Two-Dimensional Bedforms, Zenodo [data set], https://doi.org/10.5281/zenodo.7552715, 2023. a
Leary, K. and Schmeeckle, M.: The Importance of Splat Events to the Spatiotemporal Structure of Near-Bed Fluid Velocity and Bed Load Motion Over Bed Forms: Laboratory Experiments Downstream of a Backward Facing Step, J. Geophys. Res.-Earth, 122, 2411–2430, 2017. a, b, c, d, e, f
Lu, S. and Willmarth, W.: Measurements of the structure of the Reynolds stress in a turbulent boundary layer, J. Fluid Mech., 60, 481–511, 1973. a
Lyn, D.: Turbulence measurements in open-channel flows over artificial bed forms, J. Hydraul. Eng., 119, 306–326, 1993. a
Mazzuoli, M., Blondeaux, P., Vittori, G., Uhlmann, M., Simeonov, J., and Calantoni, J.: Interface-resolved direct numerical simulations of sediment transport in a turbulent oscillatory boundary layer, J. Fluid Mech., 885, A28, https://doi.org/10.1017/jfm.2019.1012, 2020. a
McElroy, B. and Mohrig, D.: Nature of deformation of sandy bed forms, J. Geophys. Res.-Earth, 114, F00A04, https://doi.org/10.1029/2008JF001220, 2009. a, b
McLean, S., Nelson, J., and Wolfe, S.: Turbulence structure over two-dimensional bed forms: implications for sediment transport, J. Geophys. Res.-Oceans, 99, 12729–12747, 1994. a, b, c
Nabi, M., De Vriend, H., Mosselman, E., Sloff, C., and Shimizu, Y.: Detailed simulation of morphodynamics: 2. Sediment pickup, transport, and deposition, Water Resour. Res., 49, 4775–4791, 2013. a
Nelson, J., Logan, B., Kinzel, P., Shimizu, Y., Giri, S., Shreve, R., and McLean, S.: Bedform response to flow variability, Earth Surf. Proc. Land., 36, 1938–1947, 2011. a, b
Nelson, J. M. and Smith, J. D.: Mechanics of flow over ripples and dunes, J. Geophys. Res.-Oceans, 94, 8146–8162, 1989. a, b
Nelson, J. M., McLean, S. R., and Wolfe, S. R.: Mean flow and turbulence fields over two-dimensional bed forms, Water Resour. Res., 29, 3935–3953, 1993. a
Nelson, J. M., Shreve, R. L., McLean, S. R., and Drake, T. G.: Role of near-bed turbulence structure in bed load transport and bed form mechanics, Water resources research, 31, 2071–2086, 1995. a, b
Perot, B. and Moin, P.: Shear-free turbulent boundary layers. Part 1. Physical insights into near-wall turbulence, J. Fluid Mech., 295, 199–227, 1995. a
Radice, A.: An experimental investigation of sediment kinematics and multi-scale propagation for laboratory bed-load dunes, Sedimentology, 68, 3476–3493, 2021. a, b
Raudkivi, A.: Study of sediment ripple formation, J. Hydr. Eng. Div.-ASCE, 89, 15–34, 1963. a
Raudkivi, A.: Bed forms in alluvial channels, J. Fluid Mech., 26, 507–514, 1966. a
Rifai, M. F. and Smith, K. V.: Flow over triangular elements simulating dunes, J. Hydr. Eng. Div.-ASCE, 97, 963–976, 1971. a
Robert, A. and Uhlman, W.: An experimental study on the ripple–dune transition, Earth Surf. Proc. Land., 26, 615–629, 2001. a
Rubin, D. M. and Hunter, R. E.: Bedform alignment in directionally varying flows, Science, 237, 276–278, 1987. a
Rubin, D. M. and Ikeda, H.: Flume experiments on the alignment of transverse, oblique, and longitudinal dunes in directionally varying flows, Sedimentology, 37, 673–684, 1990. a
Schmeeckle, M. W.: The role of velocity, pressure, and bed stress fluctuations in bed load transport over bed forms: numerical simulation downstream of a backward-facing step, Earth Surf. Dynam., 3, 105–112, https://doi.org/10.5194/esurf-3-105-2015, 2015. a, b, c
Schmeeckle, M. W.: Numerical simulation of turbulence and sediment transport of medium sand, J. Geophys. Res.-Earth, 119, 1240–1262, 2014. a
Shaw, R. H., Tavangar, J., and Ward, D. P.: Structure of the Reynolds stress in a canopy layer, J. Clim. Appl. Meteorol., 22, 1922–1931, 1983. a
Stoesser, T., Braun, C., Garcia-Villalba, M., and Rodi, W.: Turbulence structures in flow over two-dimensional dunes, J. Hydraul. Eng., 134, 42–55, 2008. a
Terwisscha van Scheltinga, R. C., Coco, G., and Friedrich, H.: Sediment particle velocity and activity during dune migration, Water Resour. Res., 57, e2020WR029017, https://doi.org/10.1029/2020WR029017, 2021. a, b, c, d
Tsubaki, R., Baranya, S., Muste, M., and Toda, Y.: Spatio-temporal patterns of sediment particle movement on 2D and 3D bedforms, Exp. Fluids, 59, 1–14, 2018. a
Unsworth, C., Parsons, D., Hardy, R., Reesink, A., Best, J., Ashworth, P., and Keevil, G.: The impact of nonequilibrium flow on the structure of turbulence over river dunes, Water Resour. Res., 54, 6566–6584, 2018. a
van Mierlo, M. C. L. M., and de Ruiter, J. C. C.: Turbulence measurements above artificial dunes, Delft Hydraulics, Q789, Vols. 1 and 2, 1988. a
Vanoni, V. A. and Hwang, L.-S.: Bed forms and friction in streams, J. Hydr. Eng. Div.-ASCE, 93, https://doi.org/10.1061/JYCEAJ.0001607, 1967. a
Vanoni, V. A. and Nomicos, G. N.: Resistance properties of sediment-laden streams, T. Am. Soc. Civ. Eng., 125, 1140–1167, 1960. a
Venditti, J. G.: Turbulent flow and drag over fixed two-and three-dimensional dunes, J. Geophys. Res.-Earth, 112, F04008, https://doi.org/10.1029/2006JF000650, 2007. a, b
Venditti, J. G. and Bauer, B. O.: Turbulent flow over a dune: Green River, Colorado, Earth Surf. Proc. Land., 30, 289–304, 2005. a
Venditti, J. G. and Bennett, S. J.: Spectral analysis of turbulent flow and suspended sediment transport over fixed dunes, J. Geophys. Res.-Oceans, 105, 22035–22047, 2000. a
Venditti, J. G., Church, M., and Bennett, S. J.: On the transition between 2D and 3D dunes, Sedimentology, 52, 1343–1359, 2005. a, b, c
Vittal, N., Ranga Raju, K., and Garde, R.: Resistance of two dimensional triangular roughness, J. Hydraul. Res., 15, 19–36, 1977. a
Wiberg, P. L. and Nelson, J. M.: Unidirectional flow over asymmetric and symmetric ripples, J. Geophys. Res.-Oceans, 97, 12745–12761, 1992. a
Yue, W., Meneveau, C., Parlange, M. B., Zhu, W., Van Hout, R., and Katz, J.: A comparative quadrant analysis of turbulence in a plant canopy, Water Resour. Res., 43, W05422, https://doi.org/10.1029/2006WR005583, 2007. a
Zgheib, N., Fedele, J., Hoyal, D., Perillo, M., and Balachandar, S.: Direct numerical simulation of transverse ripples: 1. Pattern initiation and bedform interactions, J. Geophys. Res.-Earth, 123, 448–477, 2018. a