the Creative Commons Attribution 4.0 License.
the Creative Commons Attribution 4.0 License.
 | 24 Jun 2026
Grain roughness controls on velocity and bed stress fields around a fully protruding obstacle in supercritical flow
Oscar Link
Supercritical flows in mountain rivers create complex flow-obstacle interactions that govern infrastructure vulnerability and channel morphodynamics, yet current understanding remains focused mostly on smooth-bed assumptions that poorly represent natural gravel-bed channels, where grain-scale roughness fundamentally alters flow physics near the bed and around obstacles such as bridge piers and in-stream vegetation. This study quantifies how bed surface characteristics control velocity fields, turbulent structures, and bed stress patterns around obstacles in supercritical flow through high-resolution detached eddy simulations coupled with volume-of-fluid free surface tracking. We examined three morphodynamic states representative of natural channel evolution: smooth beds analogous to bedrock channels, rough flat beds representing post-flood recovery conditions where sediment has been deposited as relatively uniform gravel sheets, and equilibrium scoured beds representing quasi-steady morphodynamic states. Digital representation of detailed bed surface elevation, including individual sediment grains, was considered using Structure-from-Motion photogrammetry. Numerical simulations reproduced characteristic supercritical flow structures including wall-jet formations, horseshoe vortex systems, and reverse spillage phenomena across all bed configurations. We observed that grain-scale roughness completely transforms flow organization from coherent, predictable vortical structures to chaotic flow fields dominated by grain-roughness effects. While smooth beds exhibit symmetric stress distributions with organized patterns, rough beds generate highly skewed distributions with extreme spatial variability, where coefficient of variation increases from 37 % to 115 %. Individual grains work as micro-obstacles, creating localized stress concentrations exceeding smooth-bed conditions by factors of 2–3, which can fundamentally alter sediment transport mechanisms. An equilibrium scour hole creates hierarchical flow disturbances where large-scale topographic modifications interact with grain-scale disruptions to produce the most complex stress fields observed. These findings demonstrate that engineering design standards based on smooth-bed assumptions can significantly underestimate the spatial heterogeneity and peak stress magnitudes characteristic of natural rough-bed conditions. The transition from organized stress patterns in smooth beds to grain-scale dominated physics in rough beds necessitates fundamentally different approaches to flow prediction, infrastructure design, and morphodynamic modelling in steep channel environments.
- Article
(15790 KB) - Full-text XML
-
Supplement
(2244 KB) - BibTeX
- EndNote


Supercritical flows in mountain rivers drive critical geomorphological processes that shape channel evolution in steep, gravel-bed systems and threaten infrastructure. These flows govern sediment transport dynamics around engineered structures such as bridge piers, bank protection works, and channel stabilization elements (Dissanayaka and Tanaka, 2023; Martínez et al., 2025; Mignot et al., 2016; Roux et al., 2022), as well as at in-stream vegetation (Kothyari et al., 2009), while controlling local scour patterns that can undermine foundation stability (Dissanayaka and Tanaka, 2023; Laursen, 1988; Martínez et al., 2025; Mignot et al., 2016; Roux et al., 2022). In gravel-bed mountain channels, supercritical conditions frequently develop during flood events, creating complex flow-structure interactions that determine both infrastructure vulnerability and long-term channel morphodynamics (Bouratsis et al., 2017; Mignot et al., 2016). These flows develop when inertial forces dominate gravitational forces (Froude number Fr > 1), creating distinctive surface shock waves and complex three-dimensional flow structures that significantly influence sediment transport capacity and local erosion patterns around obstacles.
Flow-obstacle interactions in supercritical conditions exhibit fundamentally different characteristics compared to subcritical flows. Moeckel (1949) and Ippen (1951) first described the formation of surface shock waves around obstacles, while Mignot and Riviere (2010) identified bow wave-like hydraulic jumps and their interactions with horseshoe vortex systems. Riviere et al. (2017) distinguished two primary flow patterns around emergent obstacles: detached hydraulic jumps (DHJ) characterized by small bow waves and distinct horseshoe vortices, and wall-jet-like bow waves (WJ) featuring reverse spillage, lateral jets, and complex vortical structures. The horseshoe vortex system itself is highly dynamic and characterized by a quasi-periodic, multimodal behaviour, switching between distinct states such as “zero-flow” and “back-flow” modes, which can alter near-bed shear stress and sediment entrainment potential (Apsilidis et al., 2015; Chen et al., 2017; Li et al., 2018). These flow patterns create distinctly different erosion potentials and sediment transport mechanisms.
In natural steep channels, obstacles such as large clasts (Monsalve et al., 2017), vegetation stalks (Nepf, 2012), woody debris (Curran and Wohl, 2003; Manga and Kirchner, 2000), or bedrock protrusions (Hodge et al., 2011) significantly influence local flow dynamics and morphodynamic evolution. The dimensionless ratios (obstacle diameter to characteristic grain size) and (flow depth to characteristic grain size) typically range from 2–10 in mountain rivers (Bouratsis et al., 2017; Dissanayaka and Tanaka, 2023; Mignot et al., 2016), creating conditions where individual grains can affect flow patterns and local scour development. These scale relationships establish critical morphodynamic feedback loops: grain-scale bed roughness modifies flow structure, which controls sediment transport capacity, which subsequently alters bed morphology and roughness characteristics (Monsalve et al., 2016; Smith et al., 2023; Yager et al., 2012). The evolution of these morphodynamic systems is particularly sensitive to the obstacle-to-grain size ratio, as the dimensionless parameter fundamentally controls equilibrium scour depth development, with scour depth decreasing as decreases for < 25 (Lee and Sturm, 2009; Link et al., 2019; Sheppard et al., 2004).
Despite extensive research on subcritical flow-obstacle interactions, current understanding of supercritical flow dynamics around obstacles remains severely limited by three critical knowledge gaps. First, the role of grain-scale bed roughness on flow patterns has not been quantified, despite evidence that roughness fundamentally alters turbulent structures in subcritical flows (Apsilidis et al., 2015). Second, the complex turbulent structures characteristic of supercritical flows – including horseshoe vortices, wall jets, and surface shock waves – have not been characterized under realistic rough-bed conditions. Third, while experimental studies have characterized the complex, time-averaged flow fields within equilibrium scour holes (Jenssen and Manhart, 2020; Unglehrt et al., 2022), the feedback mechanisms between local scour development and evolving flow dynamics remain incompletely understood, preventing accurate prediction of morphodynamic evolution around obstacles.
These knowledge gaps severely constrain our ability to predict geomorphological processes in steep channels. While Apsilidis et al. (2015) demonstrated that bed roughness increases flow incoherence and redistributes turbulence around obstacles in subcritical flows, supercritical conditions likely exhibit fundamentally different roughness-flow interactions due to surface shock waves and enhanced flow instabilities. Furthermore, numerical studies have been limited to smooth-bed conditions (Martínez et al., 2025), providing little insight into the grain-scale processes that dominate natural systems.
This study quantifies how grain-scale bed roughness controls velocity fields, turbulent structures, and bed stress patterns around obstacles in supercritical flow. We employ high-resolution detached eddy simulations coupled with volume-of-fluid free surface tracking to examine three morphodynamic states representative of natural channel evolution: (1) smooth bed conditions analogous to bedrock channels, (2) rough flat beds representing initial gravel placement or post-flood recovery, and (3) equilibrium scoured beds representing quasi-steady morphodynamic conditions.
Specifically, we: (1) characterize how grain roughness modifies horseshoe vortex systems and their detachment lengths, (2) quantify changes in wall-jet dynamics, oscillation frequencies, and kinetic heights under different roughness conditions, and (3) assess how equilibrium scour morphology alters these roughness effects on flow structure and bed stress distributions. These findings provide essential insights for predicting morphodynamic evolution in steep, gravel-bed channels and improve understanding of landscape evolution processes in mountain environments.
2.1 Experimental setup
Experimental tests were conducted at the Hydraulics Engineering Laboratory at the Universidad de Concepción. The facility features a rectangular flume measuring 6.0 m in length, 0.4 m in width, and 0.4 m in height. The channel walls are constructed of transparent acrylic, while the bottom consists of high-density polyethylene (HDPE) sheets, providing a smooth and solid surface on which gravel grains are placed on top to account for the rough mobile bed (see Sect. 2.2). The experimental configuration included a Technyl A® cylinder with a diameter (D) of 0.04 m (hereafter referred to as the obstacle), positioned at the centreline of a 2.0 m long test section containing mobile sediment. The obstacle was located 3.0 m downstream from the channel inlet, ensuring fully developed flow conditions at its location (Fig. 1). To maintain consistent rough flow conditions throughout the experimental domain, additional sections of identical sediment were positioned one meter upstream and downstream of the test section. The flume was set to a fixed longitudinal slope of 4 % for the experiments. Water circulation was maintained through a recirculation system powered by a centrifugal pump with a constant discharge of 4.92 L s−1. Flow rate control was achieved manually via a gate valve, with discharge measured using a VETO ultrasonic flowmeter operating at frequencies up to 5000 Hz and providing measurement accuracy within 0.5 % of the recorded flow rate. Water depth measurements were obtained using a UDS sensor (Wehrhahn, P8000) with a precision of ±0.4 mm. The sensor was mounted on a mobile carriage system and positioned 15 cm upstream of the obstacle to capture approach flow conditions while avoiding interference from local flow disturbances around the cylinder. Both the ultrasonic flowmeter and UDS sensor were connected to a Programmable Logic Controller (PLC) system. Data acquisition was managed through dedicated software enabling continuous recording of discharge and water depth at 1 Hz frequency. This configuration facilitated systematic data collection for subsequent processing and analysis.
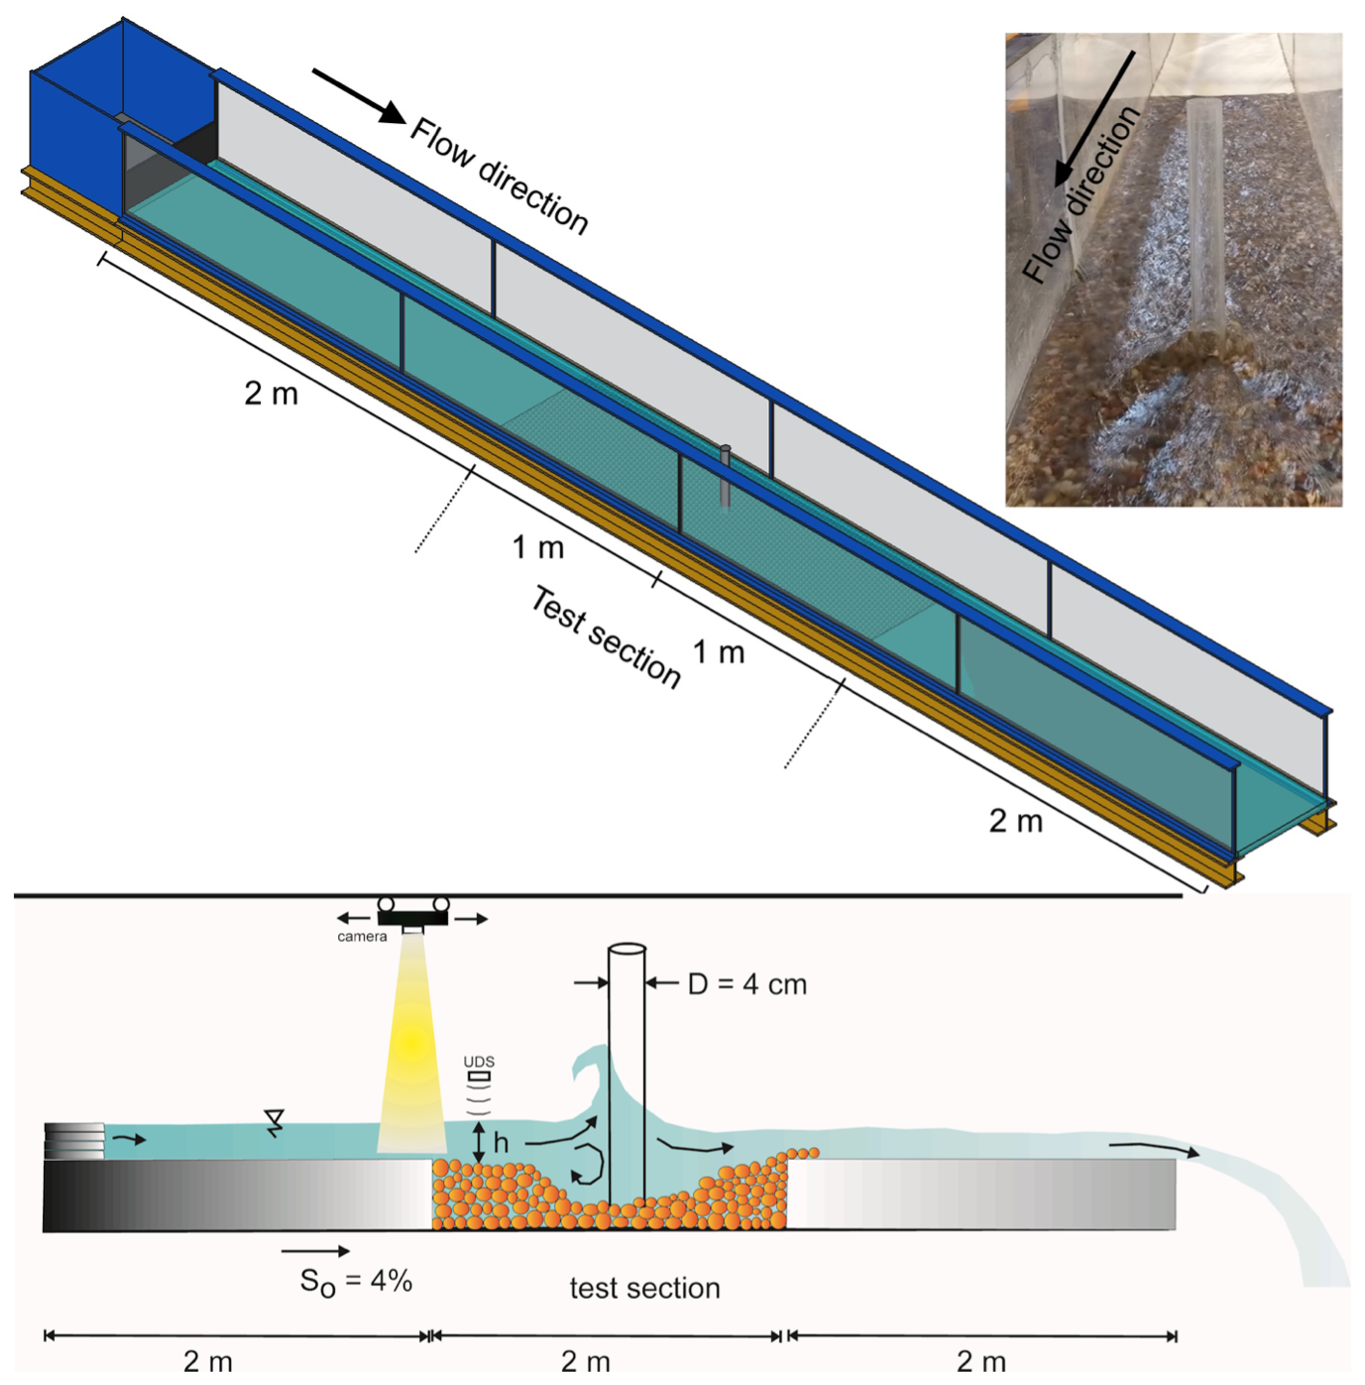
Figure 1Experimental facility and setup configuration. Schematic view of the rectangular flume (6.0 m length × 0.4 m width × 0.4 m height) showing the test section location with mobile sediment bed and cylindrical obstacle positioned at the channel centerline. The photograph shows supercritical flow conditions with characteristic surface wave patterns and air entrainment around the obstacle.
Table 1Summary of hydraulic parameters for experimental and numerical configurations. Note: n/a – not applicable.
To investigate the effects of grain roughness on flow dynamics around the obstacle, we analysed three distinct bed conditions. Our primary experiments were conducted with approach flow conditions characterized by a flow depth (h) of 1.76 cm and mean velocity (V) of 0.70 m s−1, resulting in a Reynolds number () of approximately 49 133, where m2 s−1 is the fluid's kinematic viscosity, and a Froude number (, where g = 9.81 m s−2 is the gravitational acceleration) was 1.68, confirming supercritical flow conditions around the obstacle (Table 1). The three experimental cases comprised: (1) an initial relatively flat rough bed condition, (2) a scoured rough bed condition, and (3) a numerical simulation of a perfectly smooth bed for comparison. For the scoured bed case, discharge was gradually increased until the critical velocity was reached, the velocity at which sediment grains start to move, and the flow was maintained for 8 h to ensure fully developed scour geometry around the obstacle. No sediment was fed during the experiment; scour development resulted entirely from local flow-induced erosion around the obstacle. Subsequently, flow conditions were returned to the original conditions (h = 1.76 cm, V = 0.70 m s−1) to enable direct comparison of flow features under identical hydraulic conditions but different bed topographies. For the smooth bed condition, the same discharge (see Sect. 2.2) was applied numerically with a bed roughness of 1 × 10⁻⁷ m (based on Martínez et al. 2025), resulting in higher velocities and lower flow depths due to reduced friction (Table 1). This yielded a Froude number of 1.94, compared to 1.68 for the rough bed cases, while maintaining comparable Reynolds numbers across all configurations. This approach isolates the effects of grain roughness on flow dynamics; however, direct quantitative comparisons between smooth and rough bed cases should account for these Froude number differences.
The mobile bed consisted of agate stones, typically used as decorative stones, with grain sizes between 6 and 10 mm and characteristic diameters of D10 = 6.21 mm, D30 = 6.92 mm, D50 = 7.51 mm, and D60 = 7.72 mm. The uniformity coefficient (Cu) and curvature coefficient (Cc) were 1.24 and 1.0, respectively, indicating highly uniform particle sizes with a well-graded distribution. Critical velocity was determined experimentally by gradually increasing discharge until upstream sediment motion was observed, yielding a critical velocity of 0.92 m s−1. This value closely matched the theoretical prediction of 0.98 m s−1 using Zanke (2003)'s equation, corresponding to a dimensionless critical shear stress () of 0.055. Due to the spatially variable water surface elevation, very shallow water depth (1.76 cm), and complex three-dimensional (3D) flow patterns with air entrainment around the obstacle, conventional optical velocity measurement techniques such as Particle Image Velocimetry (PIV) or Acoustic Doppler Velocimetry (ADV) were not feasible for comprehensive flow characterization. Therefore, our experimental approach focused on precise measurement of bulk flow parameters (discharge and depth) combined with detailed numerical modelling to capture the full complexity of the flow field around the obstacle.
2.2 Numerical model configuration
We performed computational fluid dynamics simulations using the OpenFOAM® V9 open-source framework (Jasak, 2009; Weller et al., 2021, 1998) to numerically represent the complex flow field around the cylindrical obstacle. Our modelling approach employed a Detached Eddy Simulation (DES) methodology, integrating Reynolds-averaged Navier-Stokes (RANS) equations with Large Eddy Simulations (LES) capabilities. This hybrid approach strategically applies LES in highly turbulent main flow regions while transitioning to RANS near wall boundaries (Strelets, 2001), thereby reducing computational requirements and eliminating the need for extremely refined meshes that pure LES implementations typically require. The LES component directly resolves large-scale turbulent structures through spatially filtered Navier-Stokes equations implemented on a finite-volume computational grid, while subgrid-scale modelling captures smaller-scale flow features. We implemented the Volume of Fluid (VOF) methodology of Hirt and Nichols (1981) to track the air-water interface and account for both spatial and temporal water surface elevation (WSE) variations. This approach utilizes a phase fraction (γ) to monitor the interface between the two immiscible fluids, enabling explicit consideration of obstacle effects on WSE in shallow flow conditions and local bed roughness influences from individual grains and small-scale elevation features.
We solved the governing equations for two immiscible incompressible Newtonian fluids through the coupled LES-VOF solver:
Equations (1) and (2) represent mass and momentum conservation, where variables include velocity field (U), fluid density (ρ), time (t), pressure (p), deviatoric viscous stress tensor (τ), and body forces per unit mass (fb). Equation (3) corresponds to the VOF transport equation, which incorporates the artificial compression term from Rusche (2002) to handle high density ratios between air and water phases. We employed the interFoam solver to simultaneously solve these three equations following Berberović et al. (2009) implementation guidelines.
We utilized the k−ω Shear Stress Transport (SST)-DES turbulence model, which represents a DES modification of the standard RANS k−ω SST model. This formulation combines k−ε and k−ω modeling advantages: applying the k−ε approach in outer boundary layer regions and beyond, while the k−ω formulation operates within inner boundary layer sectors (Menter et al., 2003). This configuration provides enhanced robustness for flows encountering adverse pressure gradients, particularly relevant around obstructions such as our cylindrical obstacle. We employed the Multidimensional Universal Limiter with Explicit Solution (MULES) of Zalesak (1979) for VOF interface tracking.
We designed our computational domain to represent a focused section of the experimental setup, spanning 0.7 m streamwise and 0.25 m cross-stream, with vertical extents of 0.11 m to accommodate increased water surface elevation upstream of the obstacle. This configuration provided approximately 9 cm between the water surface and top boundary, allowing free air phase movement according to our VOF formulation. Our supercritical flow conditions eliminated the need for downstream flow control devices. We positioned the obstacle 0.38 m downstream from the inlet boundary to ensure fully developed velocity profiles. Given the shallow flow conditions, flow stabilized rapidly with 38 cm proving sufficient for rough bed cases and 40 cm for the smooth bed case, both achieving developed profiles before reaching the obstacle. Preliminary simulations verified that velocity profiles achieved fully developed conditions by 0.35 m from the inlet (within 2 % of profiles at the obstacle location), consistent with the reduced upstream influence characteristic of supercritical flows. While longer domains would further ensure complete flow development, computational constraints and the verified profile stability support the adequacy of our domain length. We reduced the flume width based on observations confirming no flow-sidewall interaction around the obstacle, avoiding computational issues from inaccurate grain representation near walls and eliminating artifacts from scaling rulers positioned near the flume sides.
For boundary conditions, we applied the following specifications: (i) Inlet: accounting for the width reduction, we imposed a discharge of L s−1. (ii) Side-walls: we applied impermeable walls with no-slip velocity conditions. (iii) Top: we used a pressure inlet-outlet velocity condition (pressureInletOutletVelocity in OpenFOAM), allowing flow to enter or exit the domain. (iv) Outlet: we applied the inletOutlet boundary condition. (v) Bed surface and obstacle: we configured both as impermeable walls with no-slip velocity conditions. We created the bed surface from high-definition cloud points obtained from Structure-From-Motion (SfM) models (see Sect. 2.3), where individual grains directly account for bed roughness. Individual grains directly account for bed roughness. To accurately resolve flow features induced by the streambed's grain roughness micro-topography (Monsalve et al., 2023), we configured our model to satisfy three temporal resolution criteria simultaneously: (a) maximum timestep of 0.001 s, (b) maximum Courant number of 0.3 for flow velocity (both air and water phases), and (c) maximum interface Courant number of 0.2. The average timestep was approximately 2.5 µs (2.5 × 10⁻⁵ s), a highly restrictive value governed by the phase fraction Courant number. These small timesteps result from our use of fine meshes necessary to capture both flow properties and bed roughness details. We employed an irregular mesh with an average size of 0.9 mm, expanding to ∼ 1.5 mm in regions with high air fraction and refining to 0.1 mm near the bed. Our mesh sensitivity analysis confirmed that this resolution provided consistent flow characteristic descriptions.
We initialized our models with an almost empty channel and ran the simulation until the inlet and outlet flow discharges equilibrated, using first-order Euler time and upwind divergence schemes. This stabilization required approximately 8 s. We then switched to second-order schemes: Crank Nicolson for time, with a 0.9 blending coefficient, and Linear-Upwind Stabilized Transport (LUST) for divergence, utilizing a 0.25 linear upwind and 0.75 linear weights blend. We used Van Leer (1974)'s scheme, bounded between 0 and 1, to calculate γ. After these adjustments, we waited for velocity fluctuations to stabilize again around the mean, taking an additional 7 s, and all subsequent results were derived from this stable period (i.e., from 15 to 20 s). We used PIMPLE as pressure-velocity coupling algorithm.
2.3 Bed surface elevation representation
High-resolution bed topography was captured using an iPhone 13 Pro Max equipped with a 12 MP wide camera system featuring a 6 mm focal length lens and aperture to encompass the complete flume area. We implemented Structure-from-Motion (SfM) photogrammetric techniques through AGISoft Metashape Professional software (version 1.8.4) to construct detailed 3D point clouds and topographic maps representing the bed surface morphology. All photographs were captured using automatic mode, resulting in exposure times of approximately to s. We conducted measurements in an indoor environment using artificial diffuse lighting, ensuring consistent illumination across all photographs and different study cases. Given the extensive documentation of SfM methodologies in existing literature (e.g., Carrivick et al., 2016; Fonstad, 2003; Javernick et al., 2014; Luetzenburg et al., 2021; Masteller and Finnegan, 2017; Monsalve et al., 2023; Morgan et al., 2017; Woodget et al., 2015), we concentrate on the specific data collection protocols and quality control measures implemented in this study. The Hydraulic Civil Engineering Laboratory at the Universidad de Concepción enabled multi-angle access to the study area, facilitating consistent lighting conditions throughout data collection (Fig. 1). We implemented strict quality control by rejecting photographs with quality metrics below 0.5 units while selecting images with forward overlap exceeding 80 % and sideward overlap above 60 %. To minimize SfM warping and ensure geometric accuracy, we established a local coordinate reference frame using 12 control points distributed throughout the test section. Control scale bars (±0.1 mm precision) positioned transversally at the upstream and downstream sections of the test area and longitudinally along both side-walls provided georeferencing constraints for point cloud scaling and spatial orientation. Reference points remained visible across multiple overlapping images to enhance photo alignment. The georeferencing workflow followed an iterative optimization procedure: initial camera alignment was performed using automatic tie-point detection, followed by manual verification and refinement of control point positions, and subsequent bundle adjustment to minimize reprojection errors. Lens distortion parameters were estimated and corrected during camera calibration. The resulting mean reprojection error was 0.15 pixels with a final positional RMSE below 0.3 mm, indicating minimal residual warping.
The photogrammetric processing yielded SfM Digital Elevation Models (DEM) with an average spatial resolution of 0.2 mm. For the rough bed cases, including the relatively flat and scoured beds, we used the DEM to create a stereolithography (STL) file that contains a well-defined description of the bed surface elevation and used OpenFOAM's tool SnappyHexMesh to create a mesh capturing each individual grain according to its elevation. SnappyHexMesh operates as a “mesh sculptor” through octree-based refinement, surface projection, and boundary layer generation algorithms. The process consists of three steps: castellated mesh generation using octree refinement to identify surface intersections, surface snapping that projects vertices onto STL surfaces while maintaining mesh quality, and boundary layer addition through mesh shrinking and prismatic element insertion. This resulted in a domain mesh that closely represents the beds in our test section. Our meshes contained approximately 13.5 million cells with minimum cell volume of 9.94 × 10⁻¹³ m3, maximum cell volume of 3.47 × 10⁻⁹ m3, and face areas ranging from 1.75 × 10⁻¹² to 3.76 × 10⁻⁶ m2, indicating appropriate mesh resolution for interFOAM simulations under DES turbulence modelling (y+ values are described in the Results section).
As detailed in the methods section, the experimental conditions of this study – characterized by shallow supercritical flow with complex 3D patterns and significant air entrainment – precluded the use of conventional velocity measurement techniques. Our results therefore combine precise experimental measurements of bulk flow parameters with comprehensive numerical modelling to characterize the flow field around the obstacle. The following sections present model validation through comparison of experimental observations with numerical predictions, followed by detailed analysis of the flow structures and their governing mechanisms.
3.1 Experimental observations
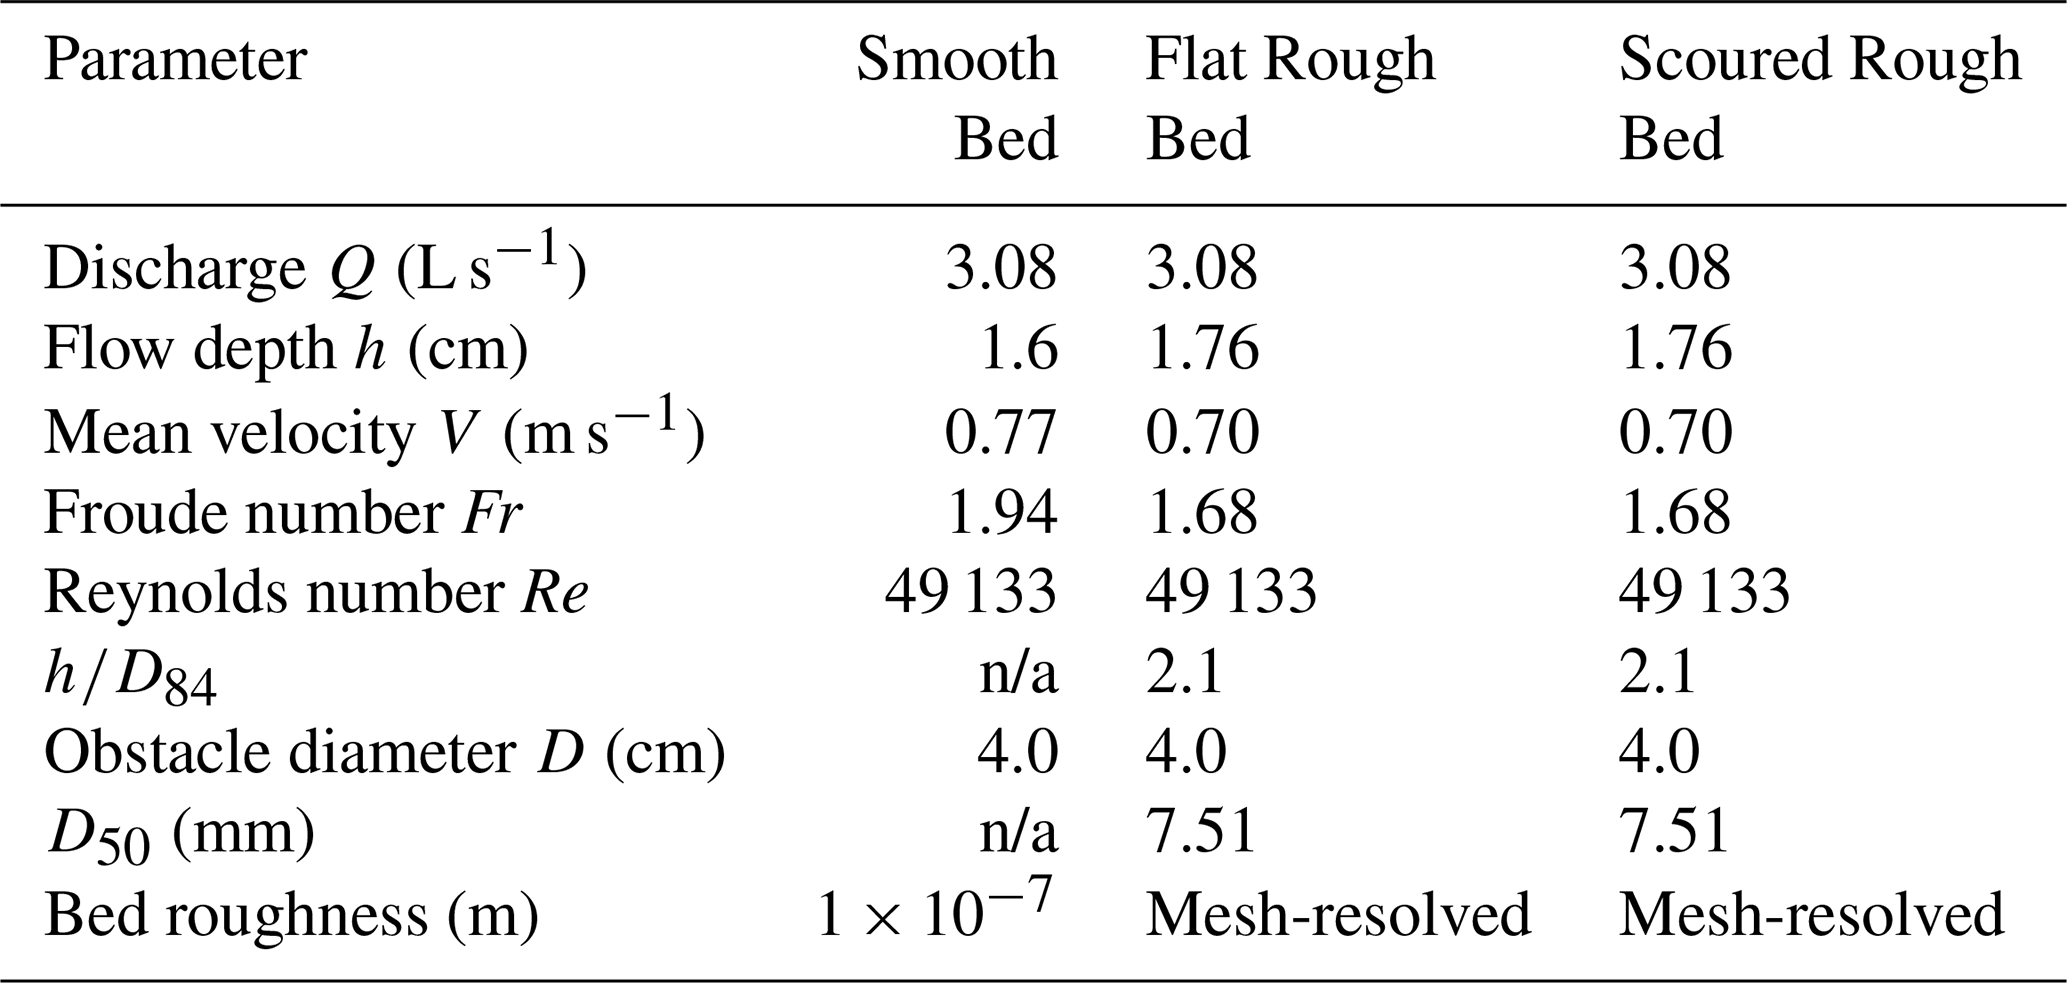
Under our experimental supercritical flow conditions (Fr = 1.68), the flow-obstacle interaction generated a characteristic wall-jet-like bow wave. The flow remained undisturbed upstream, then climbed vertically along the cylinder face upon contact, forming an upward wall jet that increased in height while decreasing in velocity (Fig. 2). The wall jet exhibited periodic reverse spillage at f = 6.5 Hz, where water rolled backward and cascaded down at the obstacle base, creating a distinctive roll-edge pattern consistent between flat and scoured bed conditions. Lateral flow deflection generated pronounced aerated regions on both sides of the cylinder through air entrainment, creating complex 3D interaction patterns with the obstacle geometry. Surface elevation observations showed significant 3D deformation patterns upstream and around the obstacle. The scoured bed condition, developed through 8 h of sustained sediment transport, created local bathymetric features that influenced approach flow characteristics while preserving the overall supercritical flow regime. However, bed scour conditions showed no clear effect on air entrainment intensity or water surface elevation amplitude.
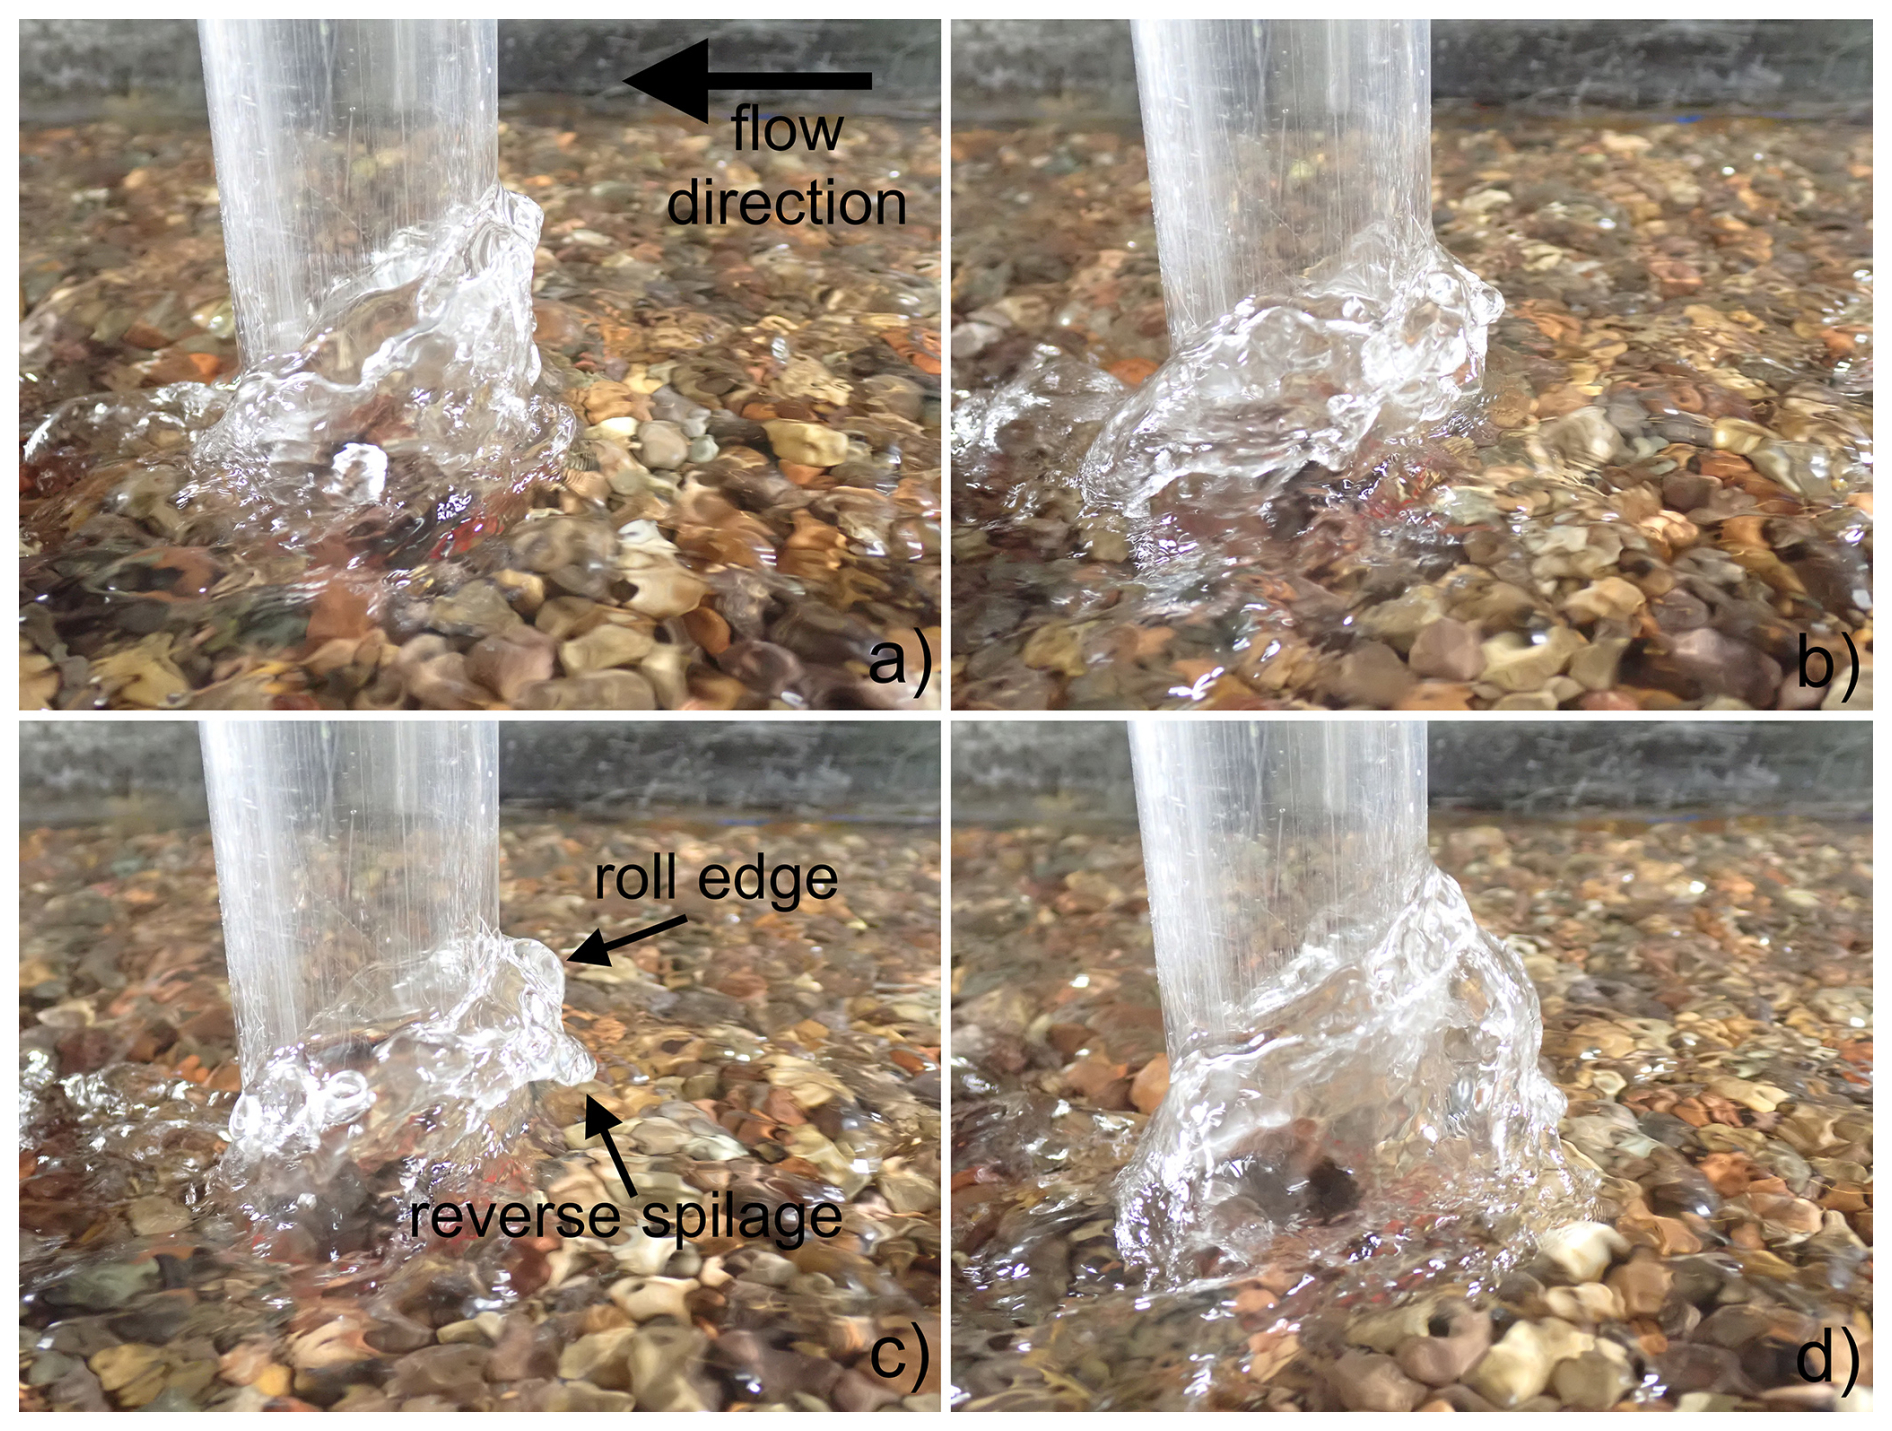
Figure 2Time sequence showing the periodic evolution of a bow wave on a cylindrical pier under supercritical flow (Fr = 1.68). (a, b) The sequence begins with the initial flow run-up and growth of the wave on the pier face. (c) At a later stage, the structure collapses in a reverse spillage event, creating a characteristic roll edge at the base. (d) Following the spillage, a coherent upward wall jet reforms on the pier's upstream face before the cycle repeats.
DEM analysis revealed a well-defined, symmetric scour hole around the obstacle reaching a maximum depth of 3.5 cm. The scour pit geometry showed steep slopes near the obstacle that become progressively flatter outward, with the deepest erosion occurring at the obstacle's side and shallower depths at the leading edge. This asymmetrical streamwise profile suggests horseshoe vortex-dominated erosion under supercritical flow conditions. Comparing the initial flat rough bed (Fig. 3a) with the scoured condition (Fig. 3b), key differences arise while preserving some similarities. Both conditions exhibit characteristic granular texture with clearly resolved individual grains and uniform bed elevation upstream, confirming minimal morphological impact beyond the obstacle vicinity. The critical difference is the prominent scour hole development, contrasting sharply with the initial condition's uniform topography. While the flat bed shows only natural grain-scale variations in height (±5 mm), the scoured condition reveals systematic erosion extending approximately 18 cm streamwise and 14 cm cross-stream around the obstacle. Both conditions preserve overall channel geometry and rough bed characteristics beyond the scour influence zone, indicating the 8 h scouring process created localized changes without affecting broader bed structure. The symmetric cross-stream scour pattern supports horseshoe vortex-dominated erosion mechanics interpretation.
Figure 3Digital Elevation Models (DEMs) of the experimental bed surface. (a) The initial flat, non-scoured bed condition before the experiment. (b) The equilibrium scoured bed after 8 h of sustained flow, showing a distinct scour hole around the obstacle (represented by the grey circle). The colour bar indicates the surface elevation in meters, with the blue region highlighting the area of maximum scour depth. The flow is from left to right along the streamwise direction.
The computational mesh successfully captured complex bed surface topography at grain-scale resolution across all experimental configurations. Individual grains are clearly resolved through adaptive refinement algorithms implemented by SnappyHexMesh processing (Fig. 4), with mesh resolution near the bed and obstacle surfaces resulting in y+ values ranging from 0.2–16, appropriate for the k−ω SST-DES model which can handle both low-Reynolds number and wall function approaches. The average y+ on the obstacle surface was ∼ 1.8, ensuring adequate resolution of near-wall flow features. The smooth bed case (Fig. 4a) exhibits uniform mesh distribution with localized refinement around the obstacle, while the flat rough bed configuration demonstrates successful representation of individual grain geometries based on the 0.2 mm DEM resolution (Fig. 4b). The scoured bed mesh effectively captures complex topographic features of the eroded surface, including the steep-sided scour hole and surrounding grain structures (Fig. 4c and d). The resulting computational domain contained approximately 13.5 million cells with mesh quality metrics appropriate for DES turbulence modelling, successfully translating high-resolution photogrammetric data into a numerical framework capable of resolving grain-scale flow interactions around the obstacle.
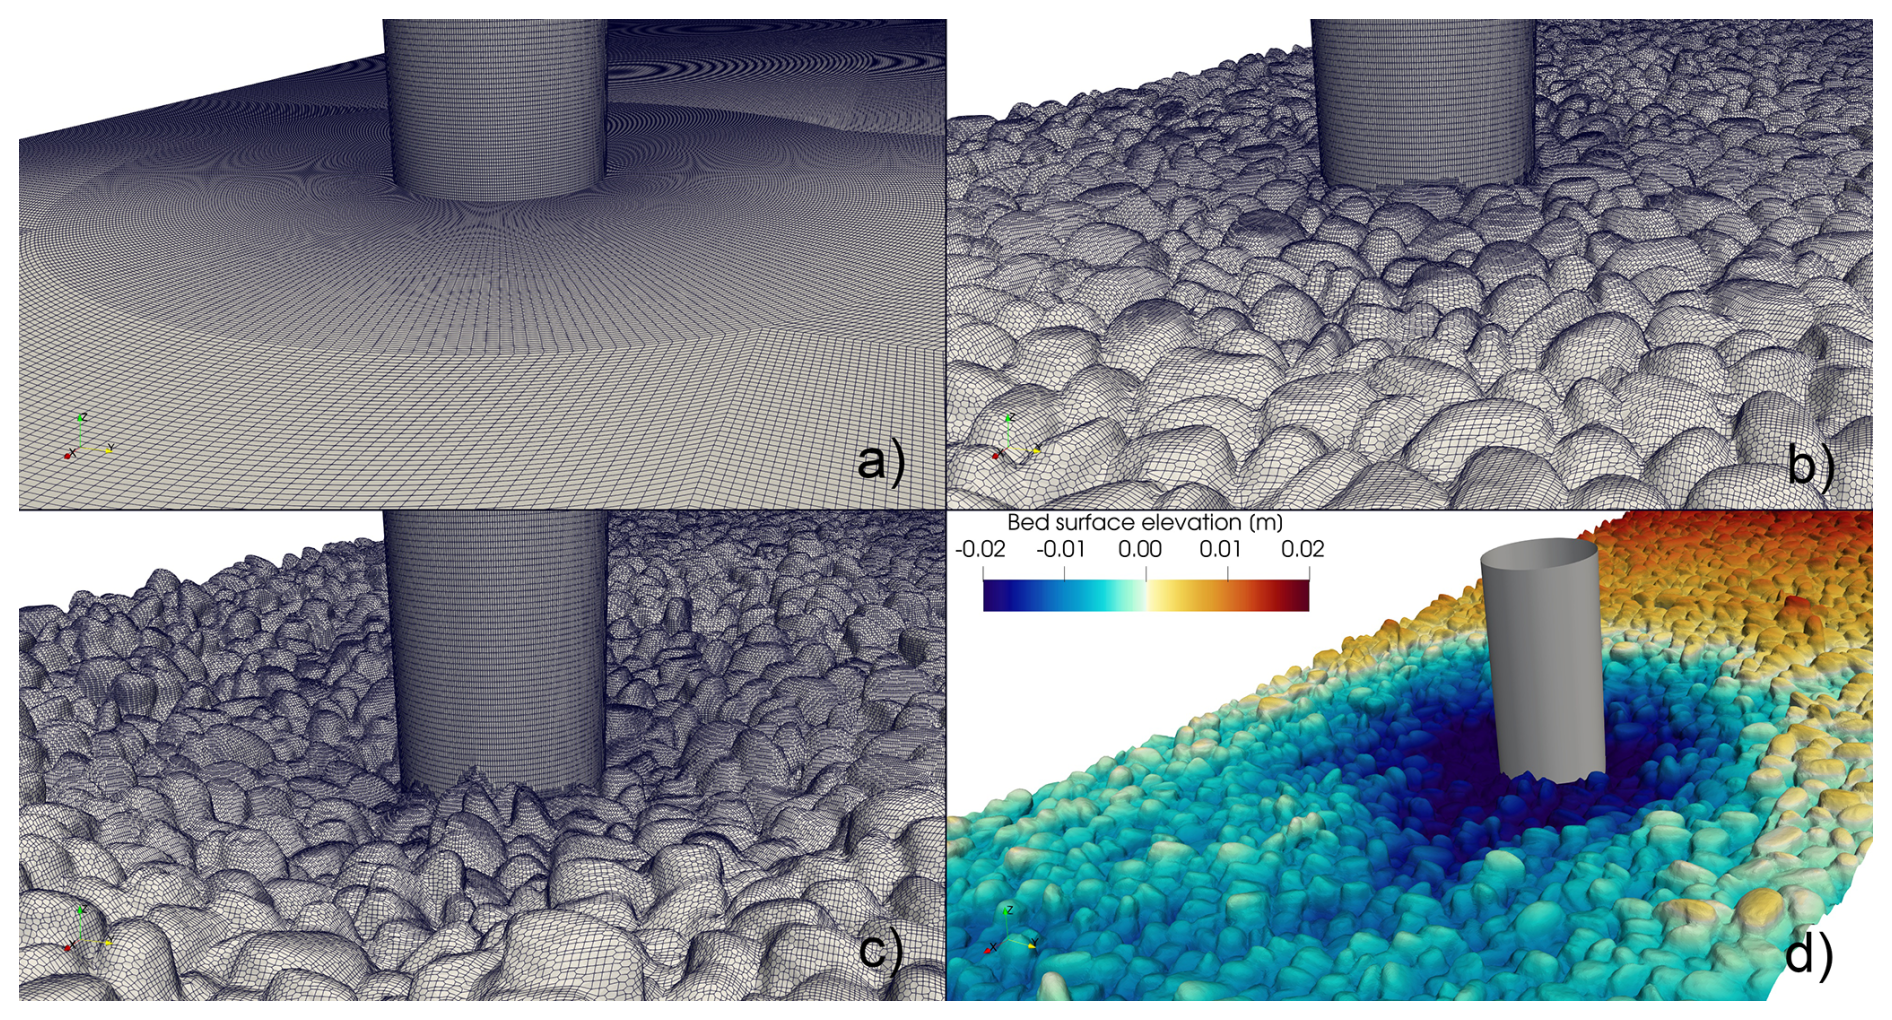
Figure 4Computational mesh representation of bed surface configurations and obstacle geometry for the three modelled cases. (a) Smooth bed configuration with mesh refinement around the obstacle, (b) flat rough bed case showing individual grain-scale mesh resolution, (c) scoured rough bed configuration with complex topographic features, and (d) bed surface elevation visualization of the scoured case with colour gradient indicating the 4 % longitudinal slope and topographic variation ranging from −0.02 to +0.02 m. Flow direction is from right to left in all configurations. Individual grains are captured through adaptive mesh refinement. For purpose of spatial scaling, the radius of the obstacle is 2 cm.
3.2 Model validation
All numerical simulations used identical discharge (Q = 3.08 L s−1) to enable direct comparison of bed roughness effects on flow characteristics. Our model accurately captured the measured water depth of 1.76 cm upstream of the obstacle, where the water surface elevation (WSE) was defined at α = 0.5 (water-air interface) and measured from the mean bed elevation to the WSE, consistent with laboratory conditions. For flow patterns, we compared experimental photographs with numerical simulation results (Fig. 5). The photographs captured overall flow patterns and surface features, while numerical results provided detailed characterization of 3D flow structures not directly measurable using conventional techniques. Our DES-VOF model showed good visual agreement with experimental observations, reproducing characteristic elements of the wall-jet-like bow wave pattern including the upward wall jet climbing the obstacle face, lateral aerated regions on either side of the cylinder, and lateral jets deflecting around the obstacle (Fig. 5a and b). The reverse spillage pattern, where upward flow rolls backward and falls at the obstacle base, appeared clearly in both experimental photographs and numerical predictions (Fig. 5c and d). We observed strong correspondence between experimental and numerical results for free surface deformation and water surface elevation changes upstream and around the obstacle. Our numerical model successfully captured complex three-dimensional flow patterns, including air entrainment regions that were visually observed during experiments but could not be quantified using traditional measurement techniques due to shallow water depth and highly turbulent flow conditions. The VOF method effectively reproduced air-water interface behaviour, particularly in regions of high turbulence and air entrainment around the obstacle. This validation confirms that our numerical approach provides reliable representation of flow features that were experimentally observable but not quantitatively measurable, justifying the combined experimental-numerical methodology adopted in this study.
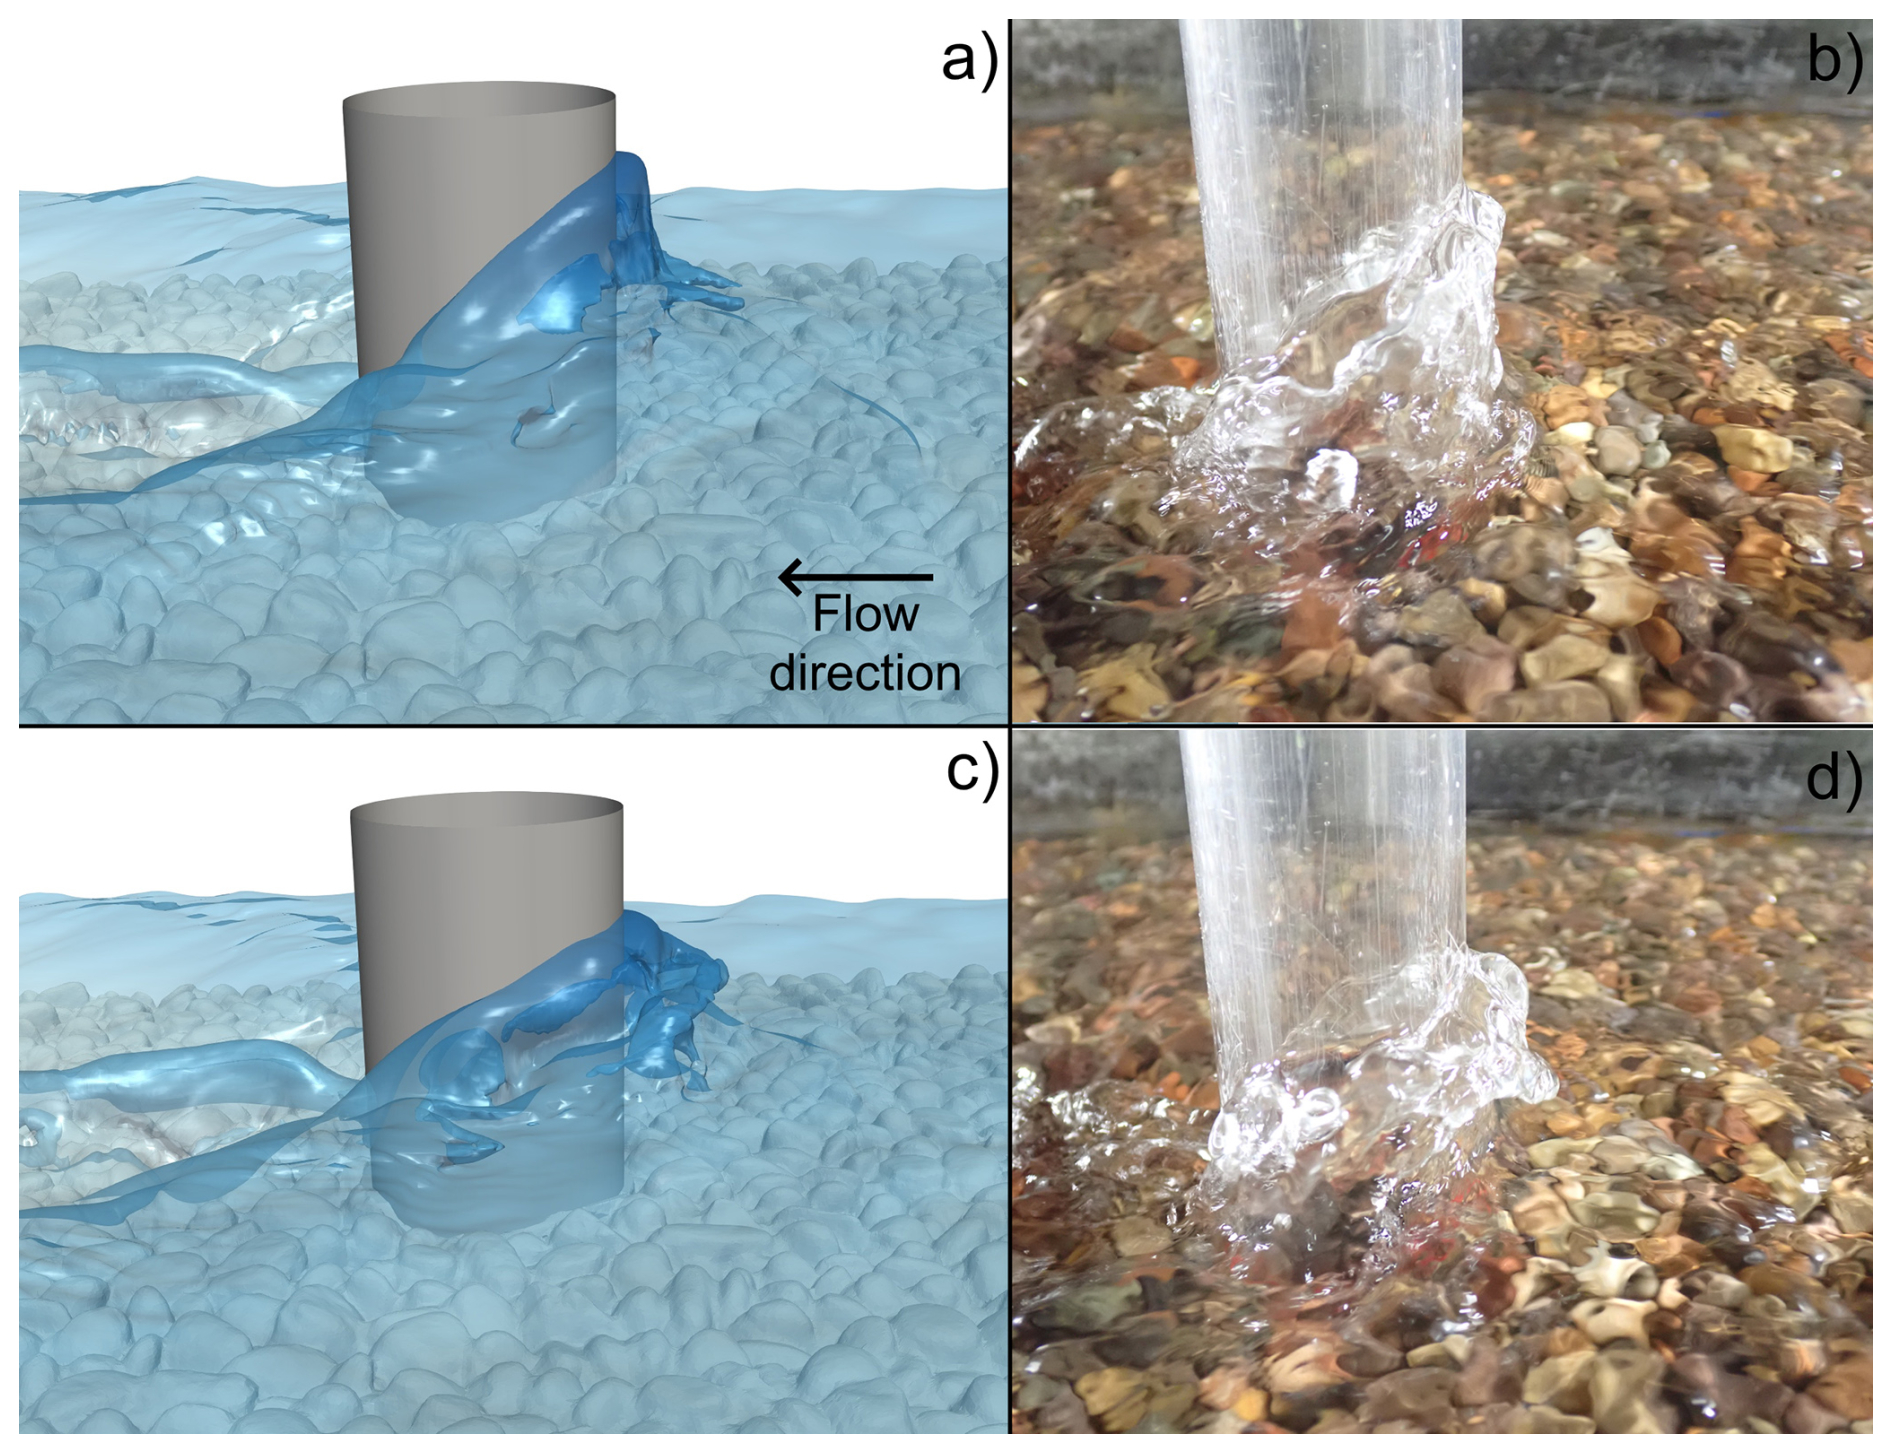
Figure 5Comparison between numerical simulation results (a, c) and experimental photographs (b, d) showing wall-jet-like bow wave formation around the cylindrical obstacle under supercritical flow conditions. (a, b) Formation of upward wall jet climbing the obstacle face with characteristic, blue-tinted flow pattern in the numerical model corresponding to the observed flow climbing behaviour in experiments. (c, d) Development of lateral aerated regions and reverse spillage pattern at the obstacle base, demonstrating strong visual agreement between DES-VOF numerical predictions and experimental observations. The numerical model successfully captures the complex three-dimensional flow structures, including air entrainment zones and lateral jet deflection patterns that characterize supercritical flow-obstacle interactions.
3.3 Time-averaged flow characteristics
To characterize the main flow properties in our experiments, we first examine time-averaged flow characteristics before extending the analysis to time-dependent structures. The time-averaged results reveal consistent wall-jet-like bow wave patterns across the three bed configurations, with generally similar flow dynamics but unique characteristics regarding supercritical flow-obstacle interaction mechanisms. Analysis of velocity fields, vorticity patterns, and turbulent structures provides insight into how bed roughness and morphology influence the horseshoe vortex system, wall jet formation, and associated flow features. The following subsections present detailed characterization of flow properties for each configuration, including horseshoe vortex detachment lengths, wall jet kinetic heights, reverse spillage frequency analysis, and spatial distribution of turbulent kinetic energy and bed shear stress (τ) patterns around the obstacle.
3.3.1 Flat smooth bed
We begin this analysis with the smooth bed case as a baseline condition where roughness is practically negligible, serving as a comparison point for understanding bed morphology influence on supercritical flow-obstacle interactions. The flow characteristics differ slightly from rough bed cases, with h = 1.6 cm and V = 0.77 m s−1, resulting in Re = 49 133 and Fr = 1.94 (Table 1). Under these conditions, the wall-jet-like bow wave pattern exhibits its fundamental characteristics without grain-scale roughness or topographic variation effects. An analysis of the time-averaged flow field reveals the characteristic features of supercritical flow-obstacle interaction in multiple regions of the obstacle. The flow exhibits the distinctive upward wall jet ascending the obstacle upstream face, accompanied by periodic reverse spillage in the upstream vicinity with a frequency of approximately 5 Hz, and a notable water surface depression in the downstream region (Fig. 6a). The oscillation of the bow wave was characterized with the standard Strouhal number, , and with a modified Strouhal number proposed by Riviere et al. (2017) , where f is the oscillation frequency. These values are consistent with the range reported in Riviere et al. (2017) for supercritical flow conditions. Symmetric flow behaviour is visible with pronounced lateral deflection around the obstacle, creating high-velocity jets along the sides and a distinct low-velocity recirculation zone downstream (Fig. 6b). Significant water surface deformation is evident around the obstacle perimeter, with marked elevation variations and strong velocity gradients characterizing the flow field (Fig. 6c).
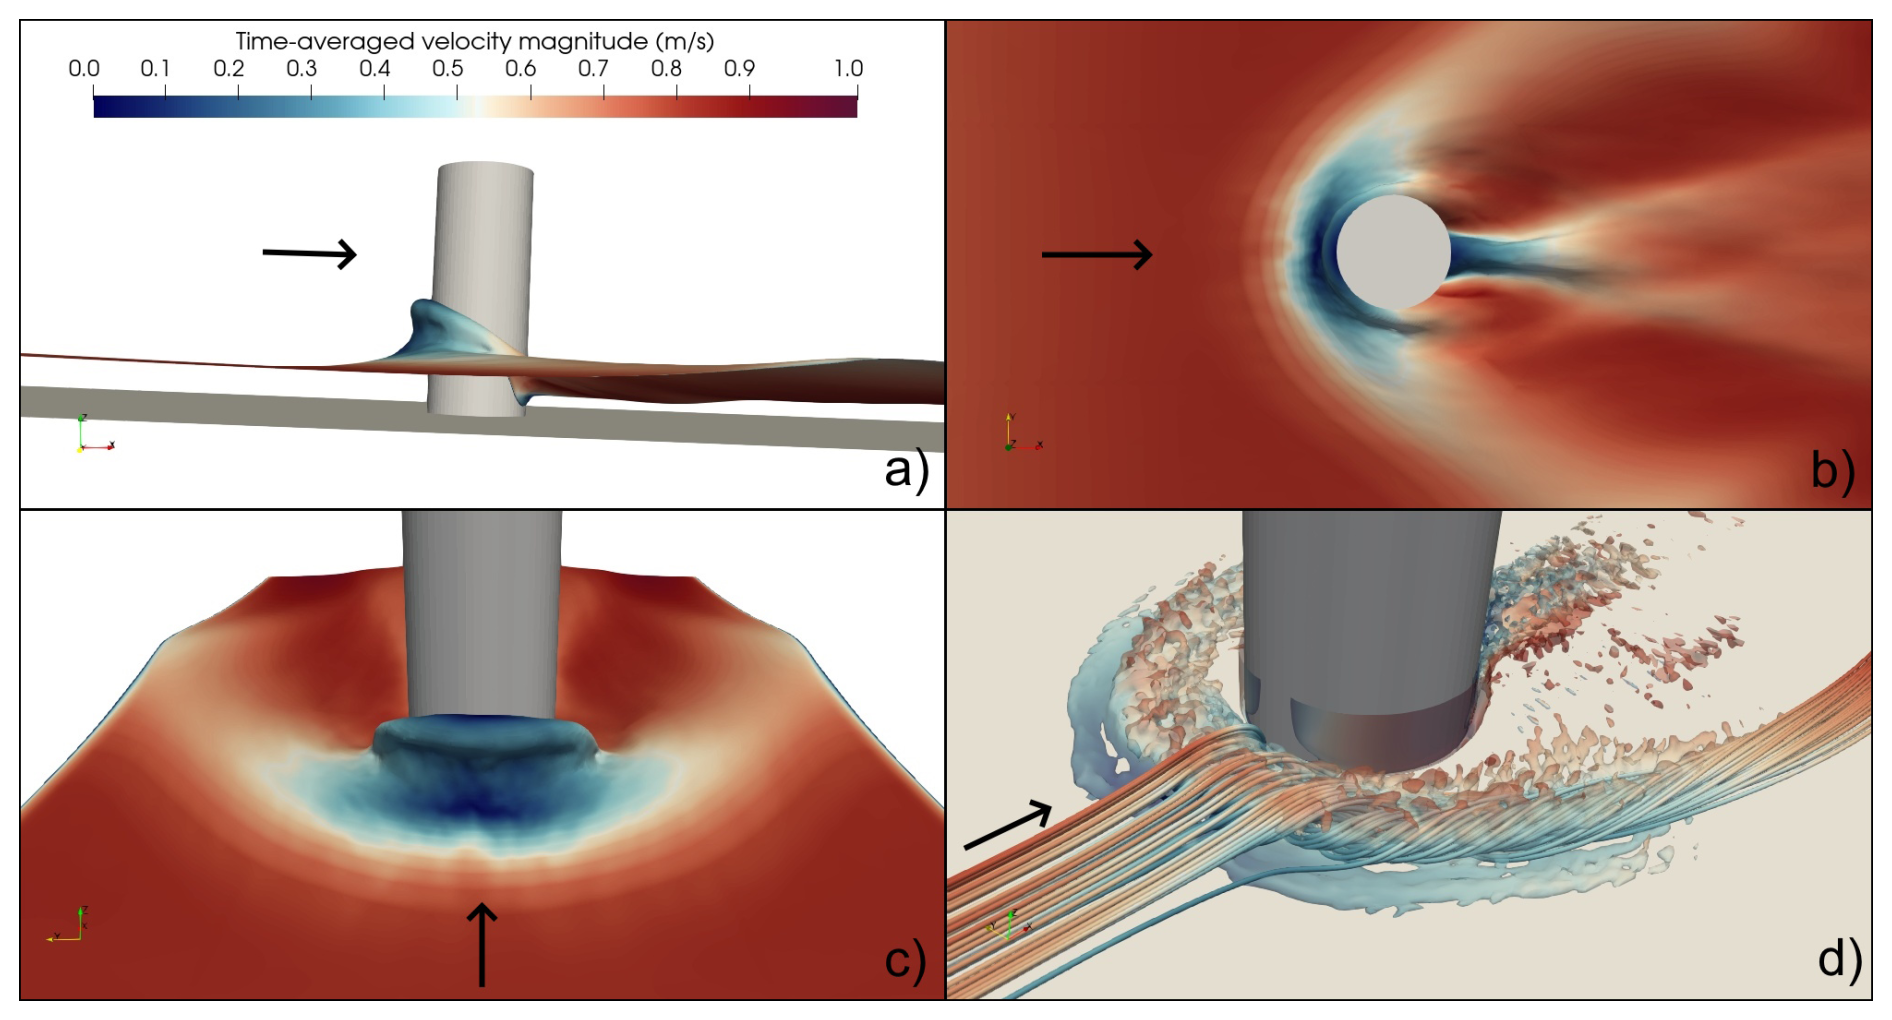
Figure 6Time-averaged flow characteristics showing wall-jet-like bow wave pattern around the cylindrical obstacle. (a) Side view illustrating the characteristic wall jet climbing the obstacle face, reverse spillage at the upstream region, and water surface elevation depression downstream of the obstacle. (b) Top view revealing symmetrical flow deflection around the obstacle with high-velocity lateral jets and low-velocity wake region downstream. (c) Front view demonstrating water surface deformation with pronounced elevation changes and velocity gradients around the obstacle perimeter. (d) 3D flow structures visualized through streamlines and Q-criterion isosurfaces highlighting vortical structures, including the horseshoe vortex system at the obstacle base and lateral flow separation patterns. Black arrows indicate main flow direction. For reference, the obstacle is 4 cm in diameter.
The time-averaged flow field reveals a well-defined horseshoe vortex system upstream of the obstacle (Fig. 6d) with a normalized detachment length of , where λhsv is detachment the length of the horseshoe vortex and R is the obstacle width transverse to the main flow direction, which equals the obstacle diameter (D). This complex system comprises multiple vortical structures with distinct characteristics and spatial distributions. Analysis allowed us to identify the junction vortex (JV) at the obstacle-bed interface, representing flow separation and recirculation immediately adjacent to the obstacle base before entering the cylinder's wake. The main necklace vortex (HV1), the primary and largest vortical structure wrapping around the upstream base of the obstacle, was located 34 mm upstream at . Secondary vortical structures include the smaller necklace vortex (HV2) and amplitude vortices (BAV), identified at 46 and 43 mm upstream of the obstacle ( and 1.08, respectively). These secondary structures, located away from the main necklace vortex and obstacle base, contribute to the complex 3D flow topology characteristic of supercritical flow-obstacle interactions (Fig. 6d).
Further analysis of the velocity field characteristics reveals the quantitative spatial distribution of flow properties around the obstacle. The area below the main horseshoe vortex near the bed exhibits reduced velocities compared to the undisturbed upstream region, while the adverse pressure gradient imposed by the obstacle produces abrupt flow deceleration extending approximately one obstacle diameter upstream (∼ 40 mm). The kinetic height of the wall jet formation was computed following Riviere et al. (2017) as , where hjet = 4.54 cm is the time-averaged height reached by the wall jet in front of the obstacle (Riviere et al., 2017, used the instantaneous height), in front of the obstacle. Maximum τ occurred at the obstacle sides, with pronounced high-stress zones forming distinctive curved patterns that wrap around the obstacle perimeter and extend upstream along the horseshoe vortex separation line. The stress distribution, presented as the ratio with units of m2 s−2 (where ρ = 1000 kg m−3 is water's density), exhibits clear symmetry with peak values approaching 0.004 m2 s−2 concentrated at the lateral edges of the obstacle. Elongated moderate-stress zones extend downstream in the wake region before transitioning to low values (∼ 0.001 m2 s−2), while minimum stress occurs immediately upstream of the main necklace vortex and downstream of the obstacle. The upstream region displays a characteristic bow-shaped high-stress zone corresponding to the horseshoe vortex footprint. Statistical analysis of bed shear stress over the computational domain (n = 538 780 cells) reveals a mean stress of 0.00183 ± 0.00001 m2 s−2 (95 % CI), median of 0.00186 m2 s−2, and standard deviation of 0.000679 m2 s−2. The difference between mean and median (1.5 %) indicates a nearly symmetric distribution, while the coefficient of variation (CV, 37 %) reflects the spatial heterogeneity of stress patterns around the obstacle (see Fig. S1 in the Supplement). High turbulent kinetic energy concentrates along the upstream face of the obstacle in a well-defined zone close to the bed, with peak values reaching approximately 0.008 m2 s−2, closely following the horseshoe vortex topology and tracing the coherent vortical structures that wrap around the obstacle base. Zones of moderate turbulent kinetic energy (∼ 0.004 m2 s−2) appear near the water surface around the obstacle, particularly in the upstream region corresponding to wall-jet formation and reverse spillage, and at the downstream wake surface. The surrounding flow field maintains relatively low turbulent energy levels, creating sharp contrast between high-energy zones associated with organized vortical structures and the undisturbed upstream and lateral regions. This organized distribution of turbulent kinetic energy, directly linked to the coherent horseshoe vortex system, establishes baseline turbulent characteristics for comparison with rough bed configurations (see Fig. S1).
3.3.2 Flat rough bed
The flat rough bed configuration provides insight into how grain-scale roughness affects supercritical flow-obstacle interactions while maintaining a relatively uniform bed topography. The flow characteristics show notable differences from the smooth bed case, with h = 1.76 cm and V = 0.7 m s−1, resulting in a relative flow depth of , where D84=8.4 mm (Table 1). Under these conditions, the wall-jet-like bow wave pattern exhibits modified characteristics due to grain-scale roughness effects that alter the fundamental flow dynamics observed in the smooth bed case. The flow maintains the distinctive upward wall jet ascending the obstacle upstream face, though with altered characteristics compared to the smooth case, accompanied by periodic reverse spillage with a frequency of approximately 5.7 Hz, and a less pronounced water surface depression in the downstream region (Fig. 7a). Compared to the smooth case, the water depth is deeper in the flat rough configuration, with the wall jet height in front of the obstacle (hjet = 4.75 m) being nearly identical to the smooth case, while the downstream surface depression is less severe and does not extend as close to the bed (Fig. 7a). The oscillation of the bow wave had f=5.23 Hz resulting in St = 0.30 and St′ = 0.74, representing a 15 % increase and 5 % decrease, respectively, compared to the smooth bed conditions. Flow around the obstacle exhibited pronounced lateral deflection with notable asymmetries attributable to heterogeneous grain particle characteristics, creating high-velocity jets along the sides with modified patterns (Fig. 7b). Downstream of the obstacle, the high-velocity zones are directed towards the walls at a wider angle compared to the smooth case, which exhibited a narrower angle directed towards the outlet. The water surface elevation had a reduced symmetry compared to the smooth case, with the slow-moving water region extending closer to the obstacle's upstream face, while marked elevation variations around the obstacle perimeter reflect the influence of individual grain irregularities on the local flow field (Fig. 7c).
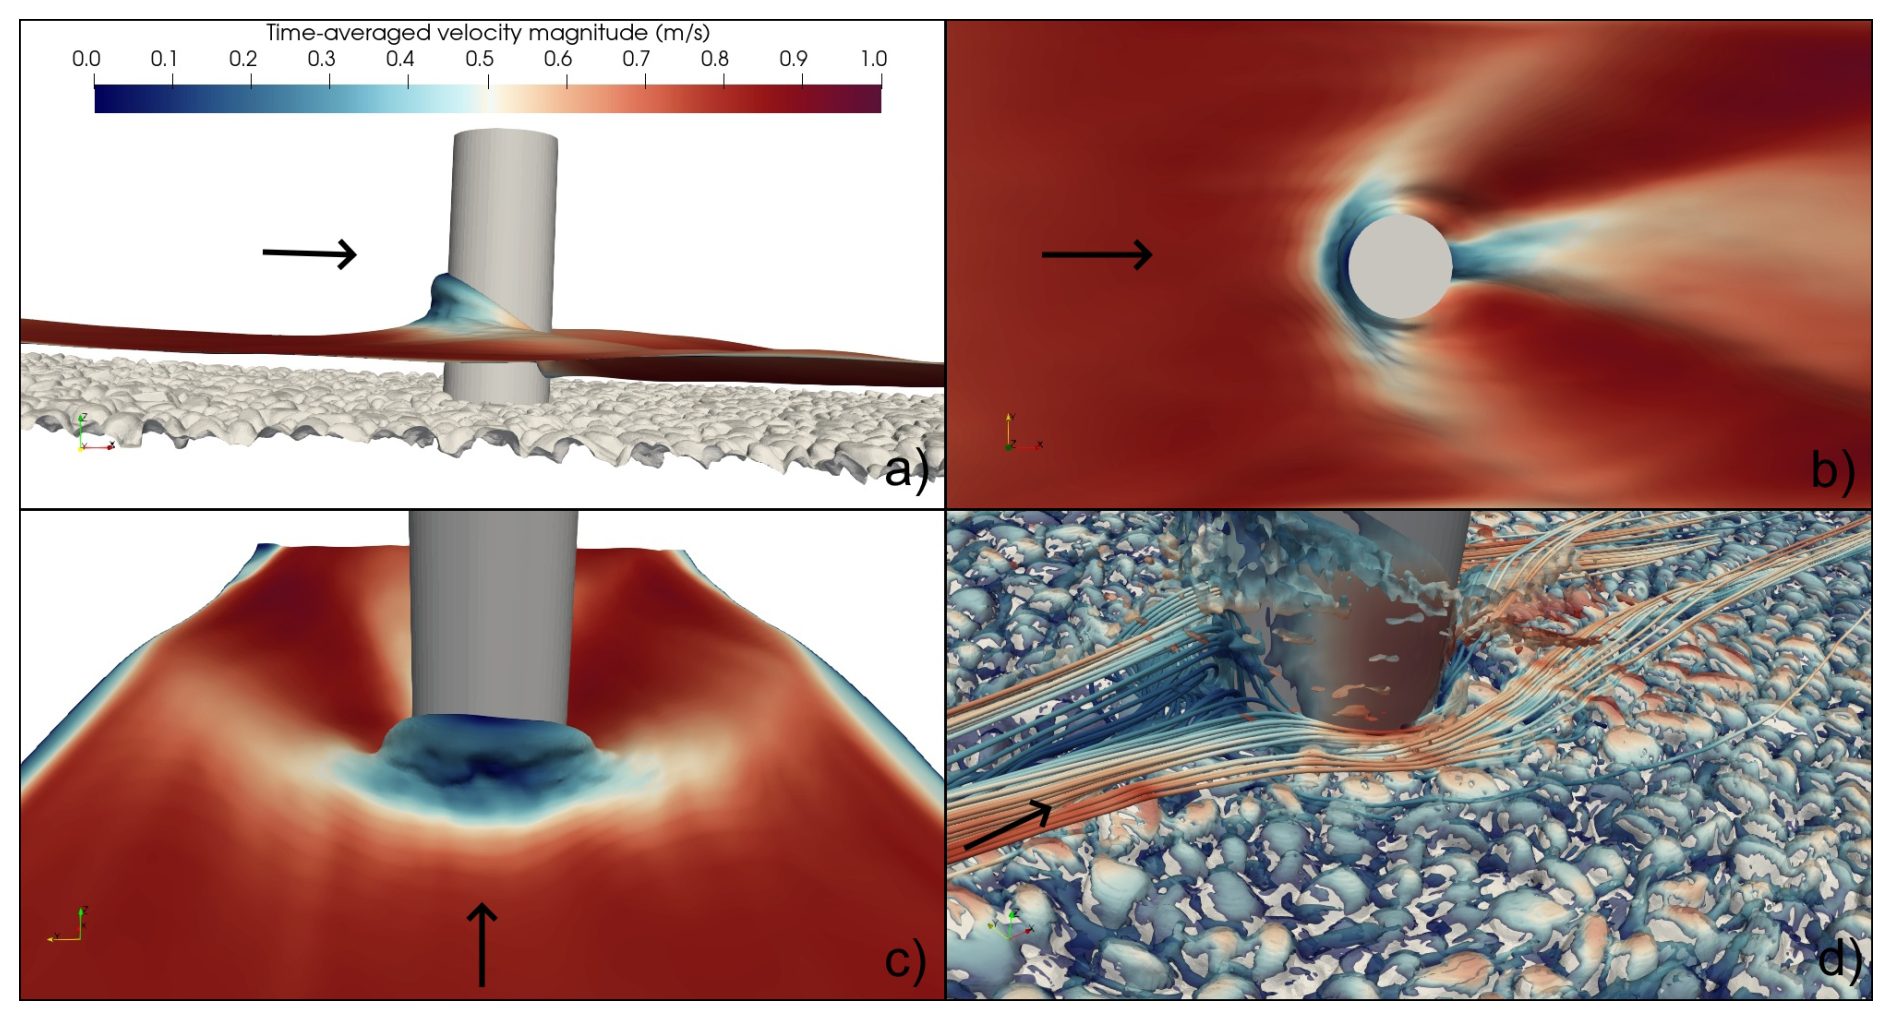
Figure 7Time-averaged flow characteristics for the flat rough bed configuration showing modified wall-jet-like bow wave patterns around the cylindrical obstacle. (a) Side view illustrating the upward wall jet with altered characteristics compared to the smooth case and reduced water surface depression in the downstream region that does not extend as close to the bed. (b) Top view revealing slightly asymmetric flow deflection around the obstacle with high-velocity lateral jets directed toward the walls at wider angles and modified recirculation patterns downstream. (c) Front view demonstrating water surface deformation with reduced symmetry due to grain-scale roughness effects and velocity gradients influenced by individual particle irregularities. (d) 3D flow structures showing disrupted vortical structures, with grain roughness creating localized coherent zones rather than the organized horseshoe vortex system observed in smooth bed conditions.
We observed a less well-defined horseshoe vortex system upstream of the obstacle in the time-averaged flow field (Fig. 7d). The coherent vortical structures characteristic of the smooth bed case were not present in this rough bed, most likely disrupted by grain-scale roughness effects. These modified vortical structures had the junction vortex (JV) at the obstacle-bed interface appearing highly fragmented due to grain-induced flow disturbances. The streamline visualization clearly demonstrates the stark contrast between the two bed conditions: while the smooth bed case (Fig. 6d) exhibits well-organized, coherent streamlines forming distinct large-scale vortical structures, the rough bed case (Fig. 7d) shows highly disrupted flow patterns with streamlines that break up and reform around individual grains. The main necklace vortex (HV1) exhibits severely reduced coherence and was located approximately 9 mm upstream at , though its structure is barely recognizable compared to the smooth case. Secondary vortical structures, including smaller necklace vortices and amplitude vortices, show complete disruption compared to the smooth case, with individual grains acting as micro-obstacles that generate their own small-scale vortical structures. The grain roughness creates a complex field of localized coherent structures at the grain scale, with each grain essentially functioning as a miniature flow obstruction that produces its own wake and separation zones, resulting in a highly heterogeneous flow field rather than the organized, large-scale vortex system observed in smooth bed conditions. These roughness-induced modifications fundamentally alter the three-dimensional flow topology characteristic of supercritical flow-obstacle interactions, transforming it from a coherent, predictable system to a complex, grain-scale dominated flow field (Fig. 7d).
The kinetic height of the wall jet formation was = 1.9, representing a 27 % increase compared to the smooth bed case. Maximum τ did not occur at the same locations and exhibited a fundamentally different pattern compared to the smooth case. Individual grain protrusions create a heterogeneous field of localized high-stress zones scattered throughout the domain, with peak values concentrated around individual particles rather than forming the organized patterns observed in smooth bed conditions. The characteristic symmetric stress distribution is disrupted, replaced by a complex mosaic of stress concentrations that reflect grain-scale flow interactions, while upstream of the main necklace vortex and downstream in the wake region minimum values are maintained though with increased spatial variability. This fragmented stress field demonstrates the transition from organized vortical structures to grain-dominated flow physics, where maximum stress values remain comparable between cases but are distributed across numerous small-scale grain-induced zones rather than the coherent, large-scale patterns characteristic of smooth bed conditions. Statistical comparison reveals the profound impact of grain roughness on shear stress distributions around the obstacle. The rough-flat configuration shows a 27 % reduction in mean stress to 0.00133 ± 0.00000 m2 s−2 (n = 525 044 cells) compared to 0.00183 m2 s−2 for smooth conditions, with median values of 0.00100 m2 s−2 versus 0.00186 m2 s−2, respectively. Notably, the standard deviation increases substantially from 0.000679 m2 s−2 in the smooth case to 0.001146 m2 s−2 in the rough-flat case, reflecting the enhanced spatial heterogeneity characteristic of grain-dominated flow physics. The CV increases dramatically from 37 % (smooth-flat) to 86 % (rough-flat), while the mean-median difference evolves from 1.5 % (nearly symmetric) to 25.1 % (skewed), indicating the transition from organized, coherent stress patterns to increasingly heterogeneous, grain-scale dominated stress fields (Fig. S1). Turbulent kinetic energy distribution exhibits a fundamentally different pattern compared to the smooth case, with no clear primary concentration zones and substantially reduced peak intensities. Grain-induced turbulence creates a more diffuse energy field throughout the flow domain, where individual particles generate localized energy concentrations that elevate overall background turbulence levels. This contrast illustrates differences in turbulence characteristics between smooth and rough bed conditions: whereas the smooth bed exhibits highly localized, intense energy plumes with sharp spatial gradients, the rough bed demonstrates a diffuse energy field with reduced peak intensities but elevated background levels throughout the domain. This transition from concentrated turbulent structures to distributed, grain-induced turbulence corresponds to the shift from large-scale coherent structures to grain-dominated flow interactions from large-scale coherent structures to grain-dominated flow interactions, establishing distinct turbulent signatures that characterize rough bed conditions (Fig. S1).
3.3.3 Scoured rough bed
The scoured rough bed configuration represents the equilibrium morphological state following sustained sediment transport, combining grain-scale roughness with large-scale topographic modifications induced by the obstacle. This case combines grain-scale roughness with large-scale topographic modifications, producing distinct flow patterns compared to flat bed conditions. The flow characteristics reflect the dual influence of micro-scale (grain) and macro-scale (scour hole) bed features under the same relative flow depth of 2.1, given that the average h and V were identical to the flat rough bed scenario (Table 1). Under these equilibrium scour conditions, the wall-jet-like bow wave pattern exhibits characteristics that differ from both previous cases. The distinctive upward wall jet maintains its presence at the obstacle upstream face, now influenced by modified approach flow conditions created by the scour hole geometry, accompanied by periodic reverse spillage at 6.88 Hz and water surface depression patterns reflecting the interaction between scour topography and grain roughness effects (Fig. 8a). The scoured configuration had a hjet = 4.23 cm in front of the obstacle, while the downstream surface depression lacks the well-defined dip observed in the other two cases. The bow wave oscillation had a St = 0.39 and St′ = 0.98, representing a 32 % increase compared to flat rough bed conditions. Flow deflection around the obstacle reveals complex patterns where the scour hole geometry modulates grain-induced asymmetries, creating lateral jets with directional characteristics that differ from both previous cases due to locally modified bed elevation (Fig. 8b). The scour-induced topographic changes create additional complexity in the downstream flow field, with an enlarged low-velocity wake region, particularly notable at and near the water surface. Upstream of the obstacle, the flow field consists almost exclusively of high-velocity zones extending nearly to the obstacle face (Fig. 8b and c).
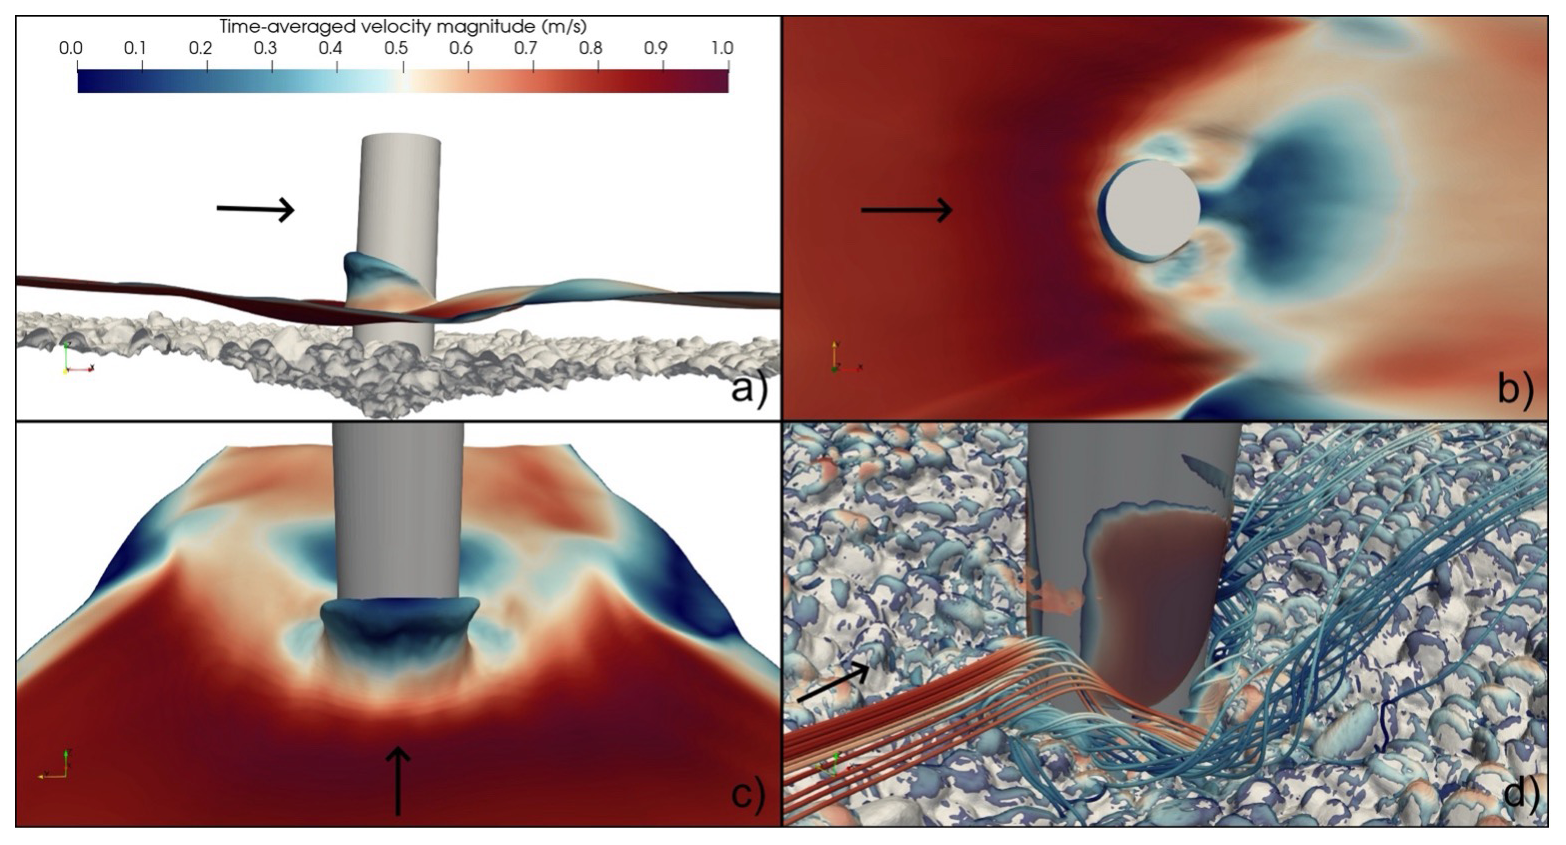
Figure 8Time-averaged flow characteristics for the scoured rough bed configuration showing the complex interaction between grain-scale roughness and scour hole geometry around the cylindrical obstacle. (a) Side view illustrating the wall jet formation within the modified approach flow conditions created by the scour hole, with water surface patterns reflecting the compound effects of local bed morphology and grain roughness. (b) Top view revealing asymmetric flow deflection patterns where scour geometry modulates grain-induced flow irregularities, creating complex lateral jet behaviour distinct from both smooth and flat rough bed cases. (c) Front view demonstrating water surface deformation influenced by the hierarchical effects of scour-scale topographic changes and grain-scale roughness variations. (d) Three-dimensional flow structures showing the most complex vortical patterns of all configurations, where grain-scale flow disruption operates within the larger-scale flow modifications induced by the equilibrium scour hole geometry.
The vortical structure system underwent further alteration due to the interaction between grain-scale disruption and scour-induced flow modifications (Fig. 8d). The horseshoe vortex system, already severely compromised in the flat rough bed case, experienced additional modification from the scour hole's influence on approach flow conditions. The junction vortex (JV) reappeared within the scour hole at the obstacle-bed interface, showing characteristics influenced by both grain-induced fragmentation and modified local bed elevation. The main necklace vortex (HV1) reappeared with clearer definition than in the flat rough case but maintained severely altered coherence compared to smooth bed conditions. We located it approximately 12 mm upstream at = 0.3 and 16 mm below the original bed surface elevation within the scour hole, with its structure reflecting the combined effects of grain roughness and scour-modified approach conditions. The scour hole creates additional complexity by introducing large-scale flow modifications that interact with the grain-scale vortical disruption observed in the flat rough bed case. Individual grains within the scour hole continue to function as micro-obstacles, but their effects are now superimposed on the larger-scale flow modifications induced by the scour geometry itself (Fig. 8d). This creates a hierarchical system of flow disturbances, where scour-scale modifications provide the background flow field within which grain-scale disruptions operate, resulting in the most complex three-dimensional flow topology of all configurations studied.
The scoured bed had a kinetic height of = 1.69, representing an 11 % reduction compared to the flat rough bed case. Despite the significant scour hole depth (3.5 cm), the wall-jet height reduction is relatively modest (0.52 cm, representing 14.9 % of the maximum scour depth, ) suggesting that the scour geometry creates approach flow conditions that partially compensate for the topographic changes.
Bed shear stress patterns reflect the compound influence of scour geometry and grain roughness, with maximum values occurring at locations determined by both individual grain protrusions and the scour hole's topographic features. The stress distribution exhibits the most complex spatial organization of all cases, where grain-induced localized high-stress zones are modulated by the scour hole's influence on the overall flow field, creating patterns that vary significantly from both the organized smooth bed and fragmented flat rough bed distributions. The scour hole geometry introduces additional complexity by creating zones of flow acceleration and deceleration that interact with grain-scale stress concentrations, resulting in a hierarchical stress field where large-scale topographic effects provide the background upon which grain-induced variations operate. Statistical analysis reveals the progressive impact of bed complexity on stress characteristics: the scoured rough bed exhibits the lowest mean stress (0.00115 ± 0.00000 m2 s−2, n = 560 364 cells, 95 % CI) compared to the flat rough bed (0.00133 m2 s−2) and smooth bed (0.00183 m2 s−2), demonstrating a systematic reduction in overall stress levels with increasing bed complexity (−27.4 % from smooth to rough-flat, −13.5 % from rough-flat to rough-scoured, and −37.2 % overall). Similarly, median values follow the same trend (0.00069 m2 s−2 for scoured rough, 0.00100 m2 s−2 for flat rough, and 0.00186 m2 s−2 for smooth), indicating that grain roughness and scour hole geometry effectively reduce stress magnitudes across the domain. However, the standard deviation and distribution characteristics tell a different story: while the smooth bed shows the lowest variability (0.000679 m2 s−2) and nearly symmetric distribution (1.5 % mean-median difference), both rough bed cases exhibit progressively higher spatial variability, with the flat rough case (0.001146 m2 s−2) and scoured case (0.001323 m2 s−2) showing increasingly heterogeneous stress fields. The CV increases dramatically from 37 % (smooth) to 86 % (rough-flat) to 115 % (rough-scoured), while the mean-median difference evolves from 1.5 % (nearly symmetric) to 25.1 % (skewed) to 40.5 % (highly skewed), indicating the transition from organized, coherent stress patterns to increasingly heterogeneous, grain-scale dominated stress fields. This suggests that while scour development reduces overall stress levels, the combination of grain roughness and scour geometry creates the most complex and spatially variable stress field, reflecting the dual-scale nature of the bed-flow interactions in this equilibrium morphological state (Fig. S1). Turbulent kinetic energy distribution shows the most heterogeneous patterns observed, where the diffuse grain-induced energy field characteristic of rough beds is further modified by scour-induced flow accelerations and decelerations, creating a complex energy landscape that reflects the multi-scale nature of the bed-flow interactions in this equilibrium scoured state (Fig. S1).
3.4 Time-dependent flow characteristics
Our LES model captures the time and spatial variations in the flow field with high fidelity. Here, we focus our analysis on the time-series of the velocity field to extract the temporal dynamics hidden within the time-averaged statistics. The instantaneous flow field reveals a different picture compared to the time-averaged analysis, displaying the dynamic and chaotic nature of supercritical flow-obstacle interactions. While the time-averaged results showed well-organized, coherent vortical structures with defined spatial patterns, the instantaneous vorticity visualization demonstrates a complex landscape of turbulent eddies and fragmented coherent structures. The main vortical structures remain present in the time-evolving scenarios but with more complex spatial distributions. The horseshoe vortex system, which appeared as a distinct, organized feature in the time-averaged field, consists of multiple smaller-scale vortical structures that continuously form, interact, and dissipate around the obstacle base in the instantaneous case (Fig. 9). These instantaneous structures exhibit enhanced spatial complexity, with vorticity magnitudes reaching peak values that exceed the time-averaged counterparts by 17 % (smooth bed), 10 % (rough-flat bed), and 13 % (scoured bed) due to temporal fluctuations being smoothed out in the averaging process. The reverse spillage phenomenon contributes to the flow's structural complexity, affecting the entire flow column.
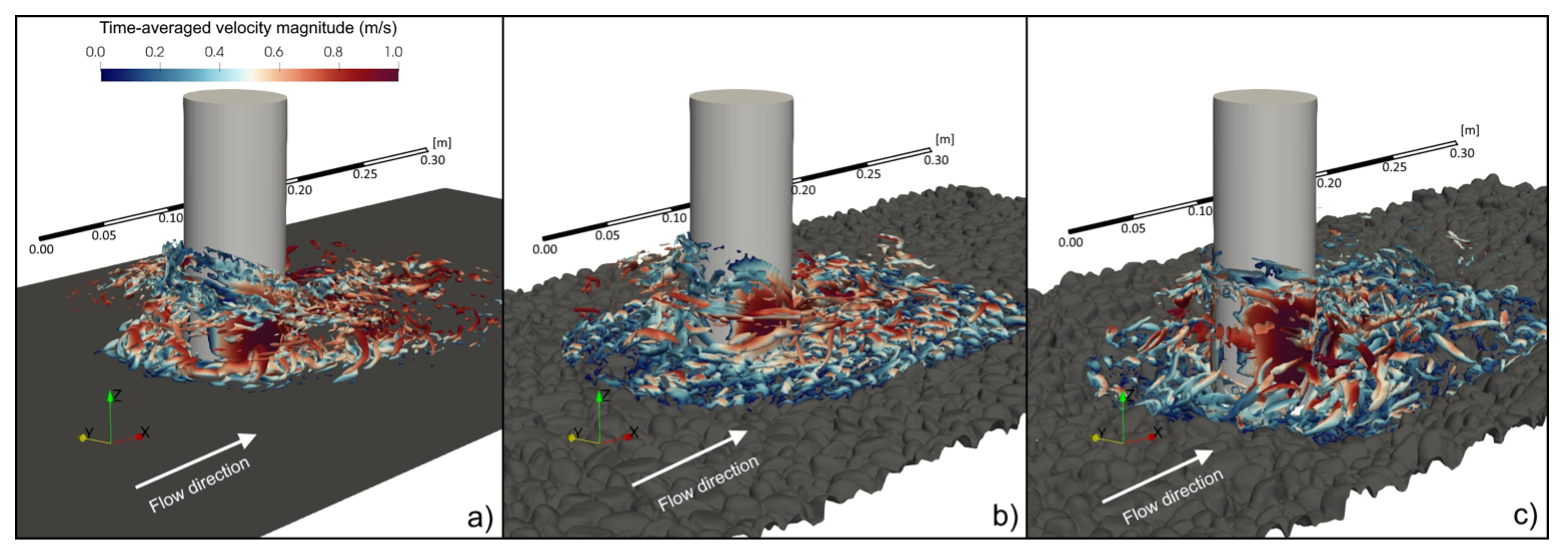
Figure 9Instantaneous coherent vortical structures visualized through Q-criterion isosurfaces coloured by velocity magnitude for the three bed configurations. (a) Smooth bed case showing relatively organized vortical structures with some coherence but considerably more small-scale fragmentation than time-averaged analysis suggests. (b) Flat rough bed configuration demonstrating how individual grains act as micro-obstacles, generating grain-scale vortices that interact chaotically with larger obstacle-induced structures, creating a complex field of multi-scale turbulent eddies. (c) Scoured rough bed case exhibiting the most complex instantaneous behaviour, where scour hole geometry creates additional flow instabilities that fragment vortical structures into a highly three-dimensional, multi-scale turbulent field.
Coherent structure identification using the Q-criterion exposes the three-dimensional complexity hidden within the time-averaged statistics. The smooth bed case (Fig. 9a) shows relatively organized vortical structures that maintain some coherence, though with more small-scale fragmentation than the time-averaged analysis suggested. The flat rough bed configuration (Fig. 9b) demonstrates how individual grains act as micro-obstacles, generating grain-scale vortices that interact chaotically with the larger obstacle-induced structures. The scoured bed case (Fig. 9c) exhibits the most complex instantaneous behaviour, where the scour hole geometry creates additional flow instabilities that fragment vortical structures into a three-dimensional, multi-scale turbulent field. This instantaneous analysis shows that the organization apparent in time-averaged results emerges from statistical averaging of continuously evolving vortical interactions.
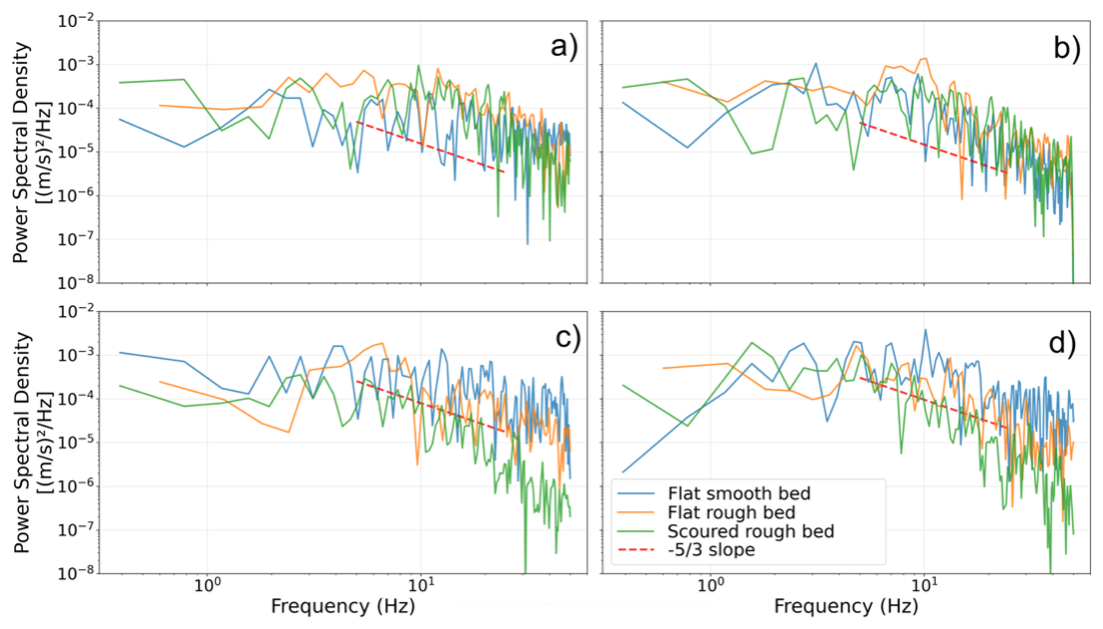
Figure 10Power spectral density analysis at key locations around the obstacle for the three bed configurations. (a) Streamwise velocity component 5 mm upstream of the obstacle. (b) Velocity magnitude 5 mm upstream of the obstacle demonstrating consistent spectral trends across different velocity metrics. (c) Streamwise velocity component 5 mm downstream of the obstacle within the wake region. (d) Velocity magnitude 5 mm downstream of the obstacle. All spectra exhibit the characteristic slope (red dashed line) in the inertial subrange, indicating well-developed turbulent cascade behaviour, while demonstrating the significant influence of bed morphology on both upstream flow conditioning and downstream wake characteristics in supercritical flow-obstacle interactions.
To characterize the temporal dynamics and frequency content of the supercritical flow-obstacle interactions across our three cases, we analyzed the power spectral density (PSD) of velocity fluctuations at key locations around the obstacle. The power spectral analysis reveals the dominant frequencies governing the flow dynamics and provides insights into the energy distribution across different temporal scales in the turbulent flow field (Pope, 2000). The upstream location (Fig. 10a) positioned 5 mm upstream of the obstacle, shows different spectral characteristics across the three bed configurations. The smooth bed case exhibits relatively low energy levels at low frequencies with a gradual increase toward higher frequencies, indicating a flow field less disturbed by upstream roughness effects. Both rough bed configurations show elevated energy levels across the frequency spectrum, with the flat rough bed and scoured rough bed displaying similar high-energy content at low frequencies. This enhanced low-frequency energy reflects the influence of grain-scale disturbances and scour-induced flow modifications on the approaching flow field. All configurations show the characteristic slope in the inertial subrange at higher frequencies, confirming the presence of a well-developed turbulent cascade. The power spectral analysis reveals relatively broad energy distributions rather than sharp dominant peaks, particularly for the rough bed configurations. While the logarithmic scale presentation may reduce the visual prominence of spectral peaks, the analysis indicates that grain roughness creates broadband turbulent energy distributions that contrast with the more organized spectral content observed in smooth bed conditions, where periodic phenomena produce more distinct frequency signatures.
In the downstream region, at 5 mm from the obstacle (Fig. 10c), the bed configurations show more pronounced differences and demonstrate the complex wake dynamics behind the obstacle. The smooth bed case exhibits downstream energy amplification across most frequencies, maintaining relatively organized spectral content with distinct energy peaks at specific frequencies, likely corresponding to periodic wake shedding phenomena. The flat rough bed configuration shows modest downstream enhancement with upstream and downstream energy levels being quite similar across the frequency spectrum, indicating that grain-scale disturbances already elevate the upstream turbulent activity to levels comparable with the wake region. The scoured rough bed case exhibits the most complex behaviour, with frequency-dependent upstream-downstream relationships where low-frequency energy levels are comparable between locations, but higher frequencies show clear wake amplification. This suggests that the scour hole geometry modifies both the approaching flow characteristics and wake dynamics. The spectral slopes in the inertial subrange remain consistent with the Kolmogorov scaling across all configurations, but the degree of wake-induced energy amplification varies with bed morphology, demonstrating that surface roughness and topographic features alter the energy transfer mechanisms in supercritical flow-obstacle interactions.
4.1 Model Accuracy and performance
Our DES-VOF models successfully captured the essential physics of supercritical flow-obstacle interactions across all bed configurations (Fig. 5) representing conditions observed in natural channels: smooth beds analogous to bedrock channels, rough flat beds representing post-flood recovery conditions, and equilibrium scoured beds representing quasi-steady morphodynamic states. The experimental setup achieved geometrically scaled conditions with identical ratios of flow depth to obstacle diameter, flow depth to sediment size, and obstacle diameter to sediment size as found in natural systems, while maintaining appropriate Froude and Reynolds numbers in the fully turbulent range. While challenging experimental conditions precluded conventional velocity measurements, our numerical simulations reproduced characteristic supercritical flow structures documented in literature (Benson, 1995; Martínez et al., 2025; Riviere et al., 2017), including wall-jet formations, horseshoe vortex systems in high Froude number regimes, and reverse spillage phenomena.
Water depth predictions accurately matched the measured upstream value of 1.76 cm, and key flow features – wall-jet climbing behaviour, reverse spillage frequency, and aerated region formation – showed excellent visual correspondence with experimental photographs. Our numerical framework helped us reveal substantial differences in flow dynamics between the three bed configurations, where bed surface characteristics were the only different parameter. These differences manifested in distinct modifications to vortical structure organization, stress distribution patterns, and turbulent energy characteristics, demonstrating the profound influence of grain-scale roughness and scour morphology on supercritical flow physics.
However, despite the robust performance of our models in capturing bulk flow parameters and major flow structures, some inherent limitations warrant discussion. The experimental conditions – characterized by extremely shallow flow depths (∼ 2 cm), high velocities (∼ 0.70 m s−1), and significant air entrainment – precluded direct quantitative velocity field measurements, limiting validation to qualitative comparison of flow patterns and bulk parameter verification. Additionally, the complex grain-scale topography captured through Structure-from-Motion photogrammetry, while providing unprecedented 0.2 mm resolution detail, introduced computational challenges that may have influenced local flow predictions. Despite these limitations, the demonstrated ability to capture complex flow structures and their sensitivity to bed surface characteristics validates our numerical approach for analysing flow-obstacle-bed interactions that cannot be experimentally quantified under supercritical flow conditions.
Regarding grid resolution, our models employed fine meshes with average y+ values ranging from 0.2 to 16, successfully resolving individual grain geometries based on 0.2 mm DEM resolution. However, the inclusion of complex grain-scale features created isolated cells with elevated aspect ratios and non-orthogonality that may have introduced localized numerical errors, particularly in the intricate grain-wake interaction zones. These localized errors are common in grain-resolved simulations where the displacement thickness of the boundary layer is significantly modified by the protruding roughness elements (Wu and Piomelli, 2018). We employed non-orthogonal correctors (3 iterations) and bounded numerical schemes to mitigate these effects, but cannot eliminate them entirely. Concerning turbulence modelling, our selection of the k−ω SST-DES approach was motivated by its superior performance in adverse pressure gradient flows and enhanced wall shear stress representation compared to standard RANS approaches, characteristics essential for accurate supercritical flow-obstacle interaction modelling. While alternative LES formulations exist, the computational demands of grain-resolved simulations with free surface tracking necessitated this hybrid approach. The DES methodology transitions between RANS treatment near walls and LES in separated regions, which, while computationally efficient, may introduce modelling uncertainty in the transition zone, particularly within complex geometries such as grain-wake interaction zones.
From a numerical perspective, the coupled DES-VOF methodology introduces potential discretization and interface-tracking errors, particularly given the extreme temporal resolution requirements (average timestep ∼ 10−4 s) imposed by the phase fraction Courant number limitations. We employed second-order accurate schemes to optimize capture of flow dynamics and surface wave propagation, though some subgrid-scale phenomena may not have been fully resolved. The VOF interface-tracking method, while successfully capturing bulk free-surface behaviour, may not fully resolve small-scale air entrainment dynamics at the grain scale.
A comprehensive grid-convergence analysis at all grain locations would require multiple simulations with progressively refined meshes, which was computationally prohibitive given our ∼ 13.5 million cell baseline. However, we verified mesh independence for bulk quantities (discharge, mean water depth, overall velocity distributions) through preliminary coarser-mesh simulations, confirming that domain-scale patterns are mesh-independent. Local quantities at individual grain crests should be interpreted with greater uncertainty, as formal convergence verification was not performed at these specific locations.
Additionally, our assumption of impermeable bed surfaces omitted potential hyporheic exchange effects, and the static grain configurations did not account for possible sediment mobility during flow events (implications for natural system applications are discussed in Sect. 4.2.1). Despite these acknowledged limitations and potential error sources, our numerical framework successfully captured the essential physics of supercritical flow-obstacle interactions under realistic rough-bed conditions, enabling detailed analysis of flow phenomena that remain experimentally inaccessible and providing reliable predictions for engineering and geomorphological applications.
Based on our validation approach and numerical considerations, we emphasize that this study provides reliable support for understanding qualitative differences in flow organization between smooth and rough bed conditions, characterizing the transition from coherent to grain-dominated flow physics, and comparing relative stress variability and distribution shapes across bed configurations. Our findings are also well-suited for informing conceptual models of supercritical flow-obstacle interactions in rough-bed channels and for guiding experimental design in future studies requiring spatially-resolved measurements. Conversely, certain applications require additional caution. These include extracting precise grain-scale stress values for sediment transport calculations, determining exact entrainment thresholds based on local stress predictions, applying detailed turbulence spectra for quantitative mixing or dispersion modelling, and directly transferring stress magnitudes to field-scale predictions without appropriate scaling considerations. For quantitative applications requiring high local accuracy, we recommend that future studies incorporate direct velocity measurements (where experimentally feasible) or conduct formal grid-convergence analyses focused on specific regions of interest.
Confidence assessment for specific findings
Our validation approach, based on comparing bulk parameters and qualitative flow patterns with experimental observations, provides varying levels of confidence for different aspects of our results. As noted in Sect. 2.1, the extremely shallow flow depths, grain-scale bed roughness, and significant air entrainment around the obstacle precluded spatially-resolved velocity measurements using conventional techniques, constraining our validation to bulk parameters and visual comparisons. With this context, we distinguish three confidence tiers based on how directly findings connect to our validated quantities: (a) High confidence findings include bulk flow characteristics (water depth, discharge conservation), overall flow pattern organization (wall-jet formation, reverse spillage occurrence, wake structure), and qualitative differences between bed configurations. These findings are directly supported by our experimental validation and are robust to local numerical uncertainties. (b) Moderate confidence findings include domain-averaged stress statistics, the relative ranking of stress variability between configurations (CV increasing from smooth to rough-scoured), and large-scale vortical structure organization. These quantities emerge from spatially integrated behaviour and are less sensitive to localized mesh quality issues, though absolute magnitudes should be interpreted with appropriate uncertainty. (c) Lower confidence findings requiring cautious interpretation include grain-scale stress concentrations at individual particle crests, precise turbulence spectra in near-grain regions, and quantitative estimates suitable for determining exact entrainment thresholds. The absence of spatially resolved velocity measurements precludes rigorous validation of these local quantities. Readers applying our grain-scale stress results to predict specific sediment transport rates or entrainment events should treat these values as indicative of patterns and relative magnitudes rather than precise quantitative predictions.
4.2 Bed shear stress distributions and implications for river processes
Bed shear stress distributions transform fundamentally from smooth to rough-scoured conditions, reflecting a transition into a roughness layer where the momentum flux is dominated by individual grain wakes rather than a logarithmic profile revealing changes in flow physics with profound implications for river processes and infrastructure design (Dey et al., 2021; Kadivar et al., 2021; Wu and Piomelli, 2018). A progressive transformation from organized, predictable stress patterns to increasingly heterogeneous, grain-dominated stress fields occurs as bed complexity increases (Fig. 11). The smooth bed case exhibits a nearly symmetric, bell-shaped distribution reflecting large-scale horseshoe vortex dominance, while rough bed configurations display highly skewed distributions with pronounced right tails, indicating numerous low-stress regions punctuated by frequent high-stress events around individual grains (Fig. 11a). This fundamental shift in stress distribution characteristics critically impacts sediment transport processes in natural channels (Monsalve et al., 2017; Monsalve and Yager, 2017). Mean stress values decrease systematically – from 0.00183 m2 s−2 (smooth) to 0.00133 m2 s−2 (rough-flat) to 0.00115 m2 s−2 (rough-scoured) – yet spatial variability increases dramatically. The CV increases from 37 % to 115 %, indicating that individual grains create intense localized stress concentrations exceeding smooth-bed conditions by factors of 2-3. These grain-scale stress peaks directly control sediment entrainment mechanisms by modifying force balances on individual particles, where enhanced local shear stresses compete with gravitational and inter-granular forces to determine grain mobility thresholds (Yager et al., 2018, 2024). Recent research has demonstrated that grain-scale roughness elements generate pressure gradients that exceed those from large obstacles, with widespread occurrence throughout the bed surface creating persistent forcing mechanisms that may significantly influence surface-subsurface water interactions (Monsalve et al., 2025; Tritico and Hotchkiss, 2005). This finding suggests that the localized stress concentrations observed in our supercritical flow study may have broader implications for hyporheic exchange processes.
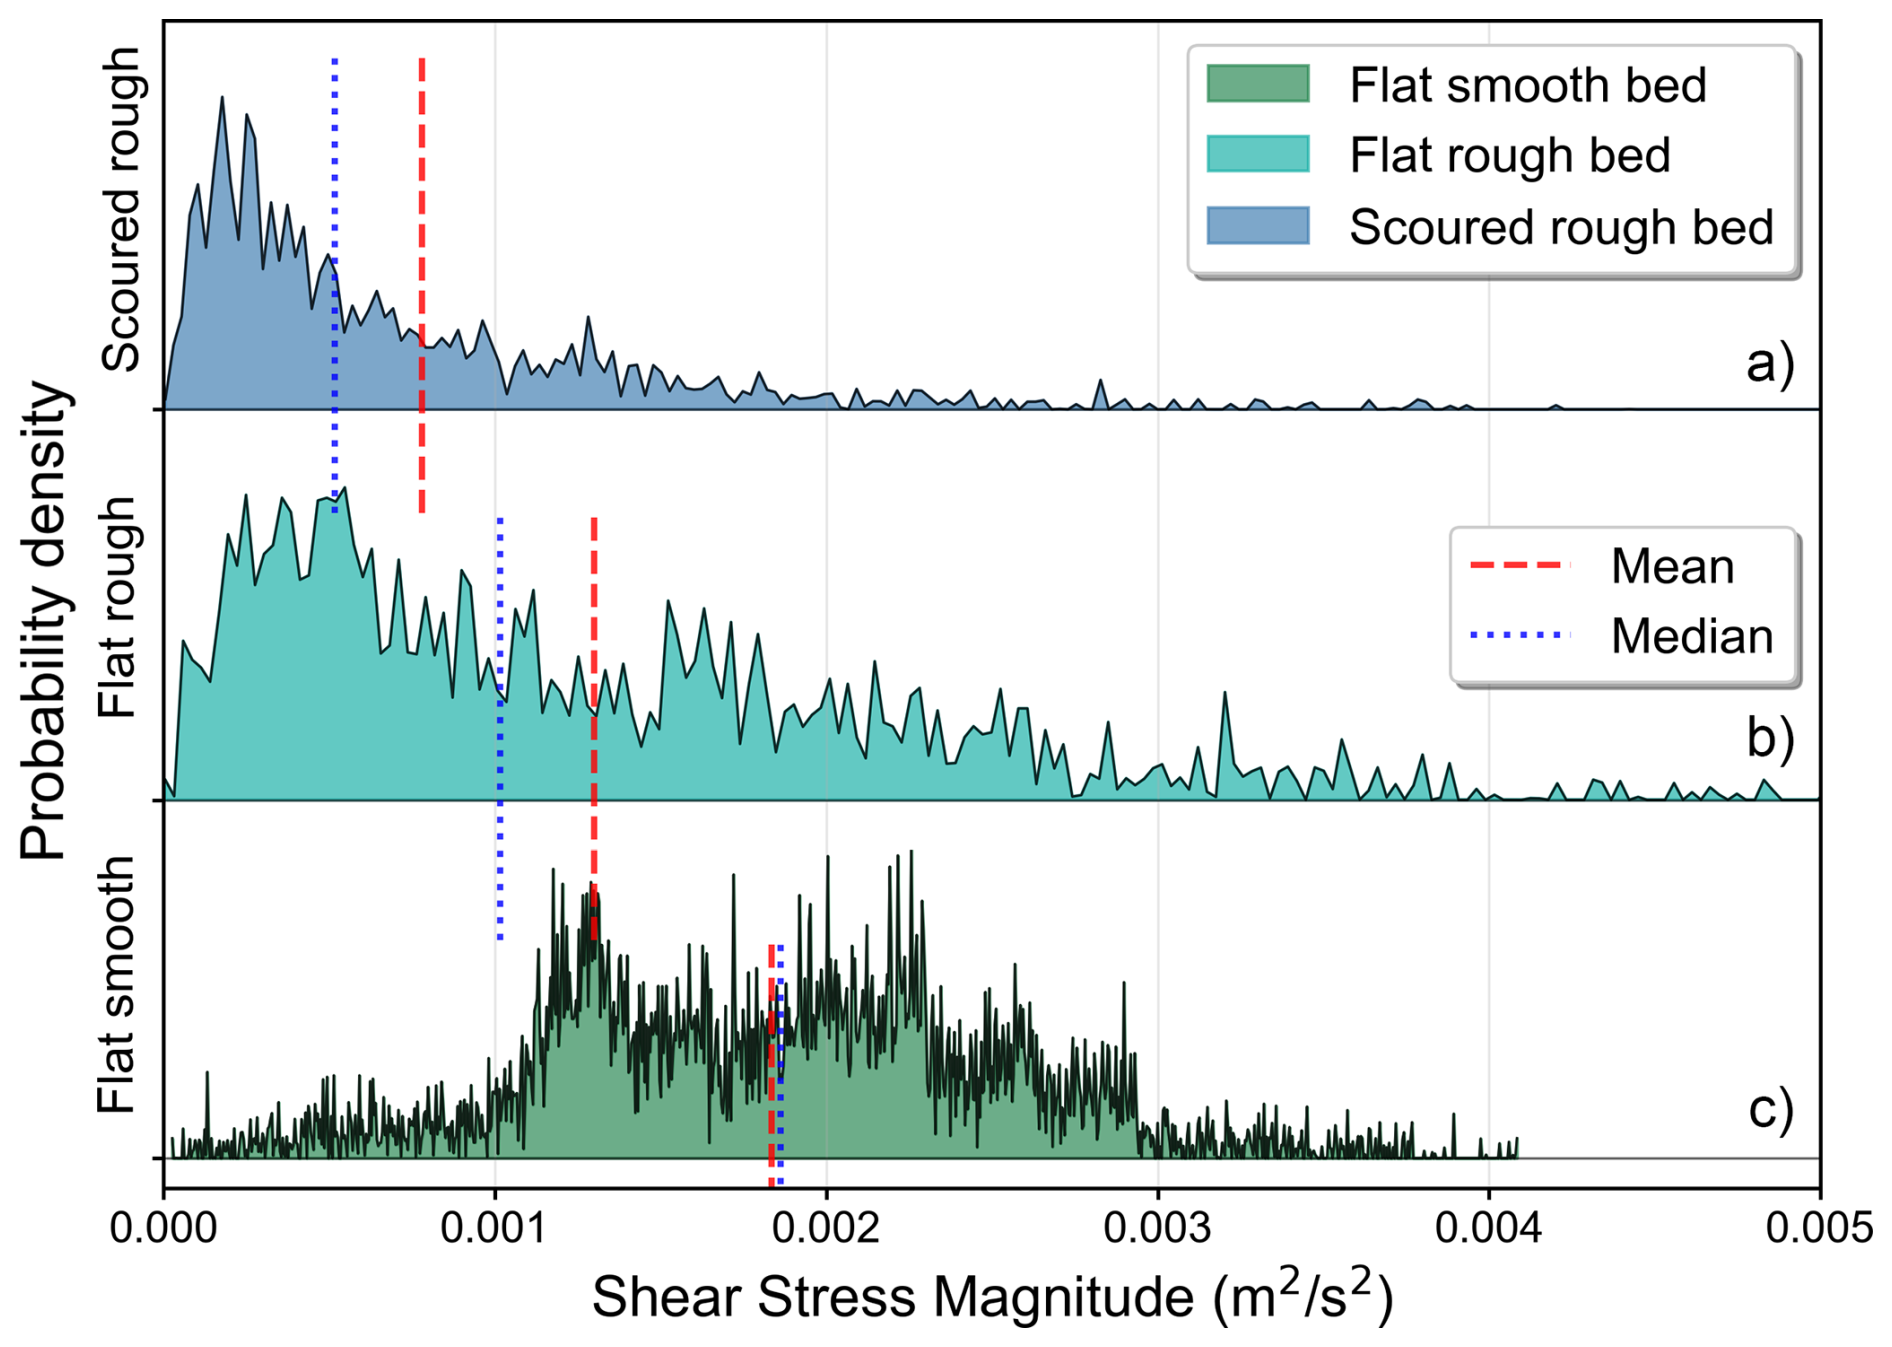
Figure 11(a) Probability density distributions of shear stress magnitude for the three bed configurations (flat smooth, flat rough, and scoured rough). The distribution shifts from approximately symmetric over the smooth bed (skewness = 0.41) to strongly right-skewed over the rough beds (skewness = 1.89 for flat rough and 2.60 for scoured rough). The pronounced right tails of the rough-bed distributions indicate frequent high-stress events around individual grains. Vertical lines mark the mean (red dashed) and median (blue dotted) of each distribution. Shear stress was normalized by water density.
The scoured bed configuration illustrates the compound influence of scour geometry and grain roughness on stress patterns, with maximum values occurring at locations determined by both individual grain protrusions and the scour hole's topographic features. The stress distribution exhibits the most complex spatial organization of all cases, where grain-induced localized high-stress zones are modulated by the scour hole's influence on the overall flow field, creating patterns that differ from both the organized smooth bed and fragmented flat rough bed distributions. The scour hole geometry introduces additional complexity by creating zones of flow acceleration and deceleration that interact with grain-scale stress concentrations, resulting in a hierarchical stress field where large-scale topographic effects provide the background upon which grain-induced variations operate.
The fragmentation of coherent stress patterns observed in rough bed conditions fundamentally alters momentum transfer mechanisms around sediment particles. Each individual grain functions as a micro-obstacle, creating its own wake and separation zones that collectively overwhelm the organized flow patterns characteristic of idealized smooth-bed conditions. This transformation has critical implications for infrastructure design in mountain rivers, where bridge piers and bank protection structures experience fundamentally different loading conditions than predicted by smooth-bed design standards. The transition from symmetric (1.5 % mean-median difference) to highly skewed distributions (40.5 % for scoured beds) indicates that hydraulic structures and bed sediments encounter frequent low-stress periods punctuated by intense stress concentrations – a loading pattern that current engineering design methodologies do not adequately capture.
From an ecological perspective, the heterogeneous stress distributions generated by grain roughness may contribute to microhabitat diversity that supports aquatic ecosystem function (Buffington and Montgomery, 1999; Lamouroux et al., 2004). The spatial patchwork of high and low-stress zones could potentially provide refugia for benthic organisms while maintaining areas of enhanced sediment mobility (Lancaster and Hildrew, 1993). The spatial patchwork of high and low-stress zones provides refugia for benthic organisms while maintaining areas of enhanced sediment mobility that prevent substrate consolidation. The highly skewed stress distributions characteristic of natural rough-bed conditions suggests that most of the bed experiences moderate stress conditions, creating stable habitat zones, while localized high-stress regions maintain the dynamic sediment transport necessary for ecosystem health. This spatial heterogeneity in bed stress patterns likely drives the complex biogeochemical processes that characterize healthy gravel-bed river systems.
The observed stress distribution patterns also have implications for scour prediction and morphodynamic evolution around obstacles. While mean stress reduction might suggest decreased scour potential, the dramatic increase in spatial variability generates numerous localized erosion nucleation sites that can initiate preferential scour pathways. These grain-induced stress concentrations create conditions conducive to selective grain entrainment and the development of complex scour patterns that evolve through positive feedback mechanisms between local topography and flow structure, similar to those observed in cohesive sediments due to the formation of clusters (Link et al., 2013). The progressive increase in distribution skewness from flat to scoured conditions reflects this morphodynamic evolution, where initial grain-scale heterogeneity develops into larger-scale topographic features that further enhance flow complexity.
Implications of fixed-bed assumptions for natural system applications
Our simulations treat the bed as static and impermeable, omitting grain mobility and hyporheic exchange processes that characterize natural gravel-bed rivers. These simplifications have important implications for applying our results to field conditions.
In natural systems, the stress concentrations we identify around individual grains would initiate selective entrainment, progressively modifying bed topography and, consequently, the flow field itself. This morphodynamic feedback is absent in our fixed-bed simulations, meaning that the extreme stress heterogeneity we observe represents an instantaneous condition that would evolve as mobile grains respond to flow forcing. For erosion prediction applications, our stress fields represent upper bounds on spatial heterogeneity, which grain mobility would tend to reduce through preferential erosion of high-stress zones. While our results cannot directly predict scour evolution trajectories, they provide essential boundary conditions for morphodynamic models, specifically the stress field heterogeneity that drives initial erosion patterns. The hierarchical stress organization we identify, with grain-scale concentrations superimposed on obstacle-scale patterns, suggests that morphodynamic models for supercritical rough-bed conditions may require multi-scale stress parameterizations rather than spatially-uniform assumptions.
Additionally, the impermeable bed assumption eliminates surface-subsurface water exchange driven by pressure gradients across grain-scale topography. Recent work (Monsalve et al., 2025) demonstrates that grain-scale roughness elements generate pressure gradient networks that may drive significant hyporheic exchange throughout natural streambeds. Our predicted pressure fields around individual grains could, in principle, be used to estimate exchange potential, but the actual exchange rates depend on subsurface permeability structures not represented in our simulations. For ecohydraulic applications concerned with hyporheic habitat or biogeochemical processing, our surface flow predictions should be coupled with appropriate subsurface models.
4.3 Supercritical vs. subcritical flow-obstacle interactions: fundamental differences
Flow-obstacle interactions in subcritical regimes have been extensively studied, establishing a comprehensive understanding of the characteristic flow structures and their dynamics. Subcritical flows around obstacles (Fr < 1) exhibit well-documented features including surface bow-waves with organized vortical structures, systematic downflow in the front region, and complex horseshoe vortex systems that separate due to adverse pressure gradients (Raudkivi, 1986). The horseshoe vortex system in subcritical flows demonstrates sophisticated temporal dynamics, including bimodal behaviour with distinct backflow and zero-flow modes occurring with characteristic frequencies of 0.1–2.0 Hz and predictable time scales (Dargahi, 1989; Devenport and Simpson, 1990). In these subcritical cases, the bimodal behaviour of the horseshoe vortex remains coherent and systematically organized even as it interactions with the junction geometry (Kirkil et al., 2008; Kirkil and Constantinescu, 2015). Advanced numerical studies have revealed additional complexity, including intermediate modes and near-wall jet structures that contribute significantly to turbulent kinetic energy budgets and wall shear stresses (Apsilidis et al., 2015; Schanderl et al., 2017b, a; Schanderl and Manhart, 2016). These systems maintain coherent organization even under varying Reynolds number conditions (Re = 104–105), with systematic relationships between flow intensity and vortical structure characteristics (Escauriaza and Sotiropoulos, 2011; Paik et al., 2007, 2010).
In stark contrast, supercritical flow-obstacle interactions (Fr > 1) exhibit fundamentally different physics that challenge established understanding from subcritical flow research. The formation of surface shock waves and wall-jet-like bow waves with reverse spillage phenomena creates flow patterns that bear little resemblance to subcritical bow-wave structures. Most significantly, our results demonstrate that grain-scale bed roughness completely disrupts the coherent horseshoe vortex organization characteristic of subcritical flows. While subcritical flows maintain organized vortical structures even with moderate roughness effects (Apsilidis et al., 2015), supercritical flows over rough beds transition to grain-dominated flow physics where individual particles function as micro-obstacles, fragmenting large-scale coherent structures into chaotic, grain-scale vortical fields.
The temporal characteristics also differ dramatically between flow regimes. Subcritical horseshoe vortex systems exhibit predictable oscillation modes with well-defined dominant frequencies and organized transitions between flow states, including the hairpin vortex mechanisms that destabilize horseshoe vortices during mode transitions (Escauriaza and Sotiropoulos, 2011; Jenssen et al., 2021; Paik et al., 2007). In contrast, supercritical flows display fundamentally different temporal signatures, with wall-jet oscillation frequencies (5–7 Hz) that reflect surface wave dynamics rather than vortical mode switching. The reverse spillage phenomenon observed in supercritical conditions has no analogue in subcritical flow patterns, representing a unique momentum transfer mechanism driven by the interaction between surface shock waves and the obstacle.
Perhaps most critically, the stress distribution patterns differ fundamentally between flow regimes. Subcritical flows generate organized stress fields that correspond to coherent vortical structures, with enhanced bed shear stresses occurring in horseshoe vortex regions during specific flow modes (Devenport and Simpson, 1990). Supercritical flows over rough beds create highly heterogeneous stress fields with extreme spatial variability (CV increasing to 115 % in our case), where grain-scale processes dominate momentum transfer mechanisms. This transition from organized to chaotic stress patterns has profound implications for engineering design, as infrastructure designed using subcritical flow principles fails to account for the extreme spatial heterogeneity characteristic of supercritical rough-bed conditions.
The scour development processes also exhibit regime-dependent characteristics. While subcritical flows produce systematic scour patterns linked to horseshoe vortex dynamics, with the horseshoe vortex recognized as the main scouring agent (Dargahi, 1990), supercritical scour development reflects the complex interaction between grain-scale roughness effects and large-scale topographic modifications. Subcritical scour processes feature organized avalanche mechanisms linked to horseshoe vortex oscillations (Soto et al., 2022) and systematic flow adaptation to evolving bed morphology (Unglehrt et al., 2022). In contrast, our supercritical results reveal flatter equilibrium scour morphology that creates hierarchical flow disturbances where large-scale topographic modifications interact with grain-scale disruptions.
These fundamental differences underscore the critical need for supercritical flow-specific research and design methodologies. The extensive knowledge base developed for subcritical flow-obstacle interactions, while valuable for understanding general flow physics principles, cannot be directly transferred and applied to supercritical flow conditions. Our findings demonstrate that grain-scale roughness effects, often considered secondary in subcritical flows, become the dominant flow physics mechanism in supercritical conditions typically observed in mountain streams, necessitating entirely different approaches to flow prediction, infrastructure design, and morphodynamic modelling in steep channel environments.
This study provides a comprehensive analysis of grain-scale roughness effects on supercritical flow-obstacle interactions, revealing fundamental differences from established smooth-bed assumptions and subcritical flow understanding. Through high-resolution detached eddy simulations coupled with Structure-from-Motion photogrammetry, we demonstrate that bed surface characteristics exert profound control over flow physics around obstacles in steep channel environments. Our results reveal that grain-scale roughness completely transforms supercritical flow organization from coherent, predictable vortical structures to chaotic, grain-dominated flow fields. While smooth beds maintain organized horseshoe vortex systems with symmetric stress distributions, rough beds fragment these coherent structures into numerous micro-obstacles that generate highly heterogeneous flow patterns. The systematic progression from smooth to rough-flat to scoured bed conditions shows dramatic increases in spatial variability, with CV increasing from 37 % to 115 %, fundamentally altering momentum transfer mechanisms around obstacles. Individual grains create localized stress concentrations exceeding smooth-bed conditions by factors of 2–3, generating the pressure gradient networks that can drive surface-subsurface water interactions throughout natural streambeds. Equilibrium scour development creates hierarchical flow disturbances where large-scale topographic modifications interact with grain-scale disruptions to produce the most complex stress fields observed. This multi-scale interaction represents a fundamental departure from subcritical flow physics, where coherent vortical structures maintain organization even under varying roughness conditions. The wall-jet dynamics, reverse spillage phenomena, and surface shock wave formations characteristic of supercritical conditions cannot be understood through subcritical flow analogies. Traditional approaches based on smooth-bed assumptions and subcritical flow principles significantly underestimate the spatial heterogeneity and peak stress magnitudes characteristic of natural gravel-bed channels. The transition from organized stress patterns to grain-scale dominated physics requires fundamentally different methodologies for flow prediction, infrastructure design, and morphodynamic modelling in mountain river environments. Future research should focus on developing grain-scale roughness parameterizations for supercritical flow applications, quantifying the collective influence of grain-induced stress variations on sediment transport processes, and establishing design frameworks that account for the extreme spatial variability characteristic of natural rough-bed conditions. The demonstrated ability to resolve grain-scale flow interactions opens new possibilities for understanding river processes across scales, from individual particle entrainment to landscape-scale morphodynamic evolution in steep channel systems.
Research data and computational code are publicly available through GitHub at https://github.com/angelmons/EGUSPHERE-2025-4327 (last access: 11 June 2026) and have been permanently archived through Zenodo for long-term preservation and citation: https://doi.org/10.5281/zenodo.20650590 (Monsalve, 2026).
The supplement related to this article is available online at https://doi.org/10.5194/esurf-14-469-2026-supplement.
AM and OL contributed equally to this research. Both authors jointly developed the research concept and methodology, data analysis, interpreted the results, and wrote and revised the manuscript. OL designed and conducted the experimental work and AM conducted the numerical simulations. Both authors approved the final version of the manuscript.
The contact author has declared that neither of the authors has any competing interests.
Publisher's note: Copernicus Publications remains neutral with regard to jurisdictional claims made in the text, published maps, institutional affiliations, or any other geographical representation in this paper. The authors bear the ultimate responsibility for providing appropriate place names. Views expressed in the text are those of the authors and do not necessarily reflect the views of the publisher.
This research was partially supported by the NSF Idaho EPSCoR Program, by the National Science Foundation under award number OIA-2242769, and by the Chilean National Research and Development Agency (ANID) Fondecyt 1221341 project. We made use of the Falcon supercomputer and associated HPC resources provided by the C3+3 collaboration between Idaho National Laboratory and the Idaho Universities (https://doi.org/10.7923/falcon.id, Idaho C3+3 Collaboration, 2022). Joaquín Bascuñán and René Iribarren are greatly acknowledged for their support during the experimental runs at the hydraulics laboratory.
This research has been supported by the Agencia Nacional de Investigación y Desarrollo (grant no. 1221341) and the National Science Foundation through the NSF Idaho EPSCoR Program (grant no. OIA-2242769).
This paper was edited by Sagy Cohen and reviewed by two anonymous referees.
Apsilidis, N., Diplas, P., Dancey, C. L., and Bouratsis, P.: Time-resolved flow dynamics and Reynolds number effects at a wall–cylinder junction, J. Fluid Mech., 776, 475–511, https://doi.org/10.1017/jfm.2015.341, 2015.
Benson, A. H.: The horseshoe vortex in super-critical flow, in: Proceedings of the 26th IAHR World Congress, 26th IAHR World Congress, 20–24, ISBN 978-0727720566, 1995.
Berberović, E., Van Hinsberg, N. P., Jakirlić, S., Roisman, I. V., and Tropea, C.: Drop impact onto a liquid layer of finite thickness: Dynamics of the cavity evolution, Phys. Rev. E, 79, 036306, https://doi.org/10.1103/PhysRevE.79.036306, 2009.
Bouratsis, P., Diplas, P., Dancey, C. L., and Apsilidis, N.: Quantitative spatio-temporal characterization of scour at the base of a cylinder, Water, 9, 227, https://doi.org/10.3390/w9030227, 2017.
Buffington, J. M. and Montgomery, D. R.: Effects of hydraulic roughness on surface textures of gravel-bed rivers, Water Resour. Res., 35, 3507–3521, https://doi.org/10.1029/1999WR900138, 1999.
Carrivick, J. L., Smith, M. W., and Quincey, D. J.: Structure from Motion in the Geosciences, Wiley-Blackwell, 208 pp., ISBN 978-1-118-89584-9, https://doi.org/10.1002/9781118895818, 2016.
Chen, Q., Qi, M., Zhong, Q., and Li, D.: Experimental study on the multimodal dynamics of the turbulent horseshoe vortex system around a circular cylinder, Phys. Fluids, 29, 015106, https://doi.org/10.1063/1.4974523, 2017.
Curran, J. H. and Wohl, E. E.: Large woody debris and flow resistance in step-pool channels, Cascade Range, Washington, Geomorphology, 51, 141–157, https://doi.org/10.1016/S0169-555X(02)00333-1, 2003.
Dargahi, B.: The turbulent flow field around a circular cylinder, Exp. Fluids, 8, 1–12, https://doi.org/10.1007/BF00203058, 1989.
Dargahi, B.: Controlling Mechanism of Local Scouring, J. Hydraul. Eng., 116, 1197–1214, https://doi.org/10.1061/(ASCE)0733-9429(1990)116:10(1197), 1990.
Devenport, W. J. and Simpson, R. L.: Time-dependent and time-averaged turbulence structure near the nose of a wing-body junction, J. Fluid Mech., 210, 23–55, https://doi.org/10.1017/S0022112090001215, 1990.
Dey, S., Rathore, V., Penna, N., and Gaudio, R.: Hydrodynamics of flow over a gradually varied bed roughness, Phys. Fluids, 33, https://doi.org/10.1063/5.0074428, 2021.
Dissanayaka, K. D. C. R. and Tanaka, N.: Scour around the single emergent cylinder due to subcritical and supercritical approach flow conditions, ISH J. Hydraul. Eng., 29, 227–242, https://doi.org/10.1080/09715010.2023.2212632, 2023.
Escauriaza, C. and Sotiropoulos, F.: Initial stages of erosion and bed form development in a turbulent flow around a cylindrical pier, J. Geophys. Res.-Earth, 116, https://doi.org/10.1029/2010JF001749, 2011.
Fonstad, M. A.: Spatial variation in the power of mountain streams in the Sangre de Cristo Mountains, New Mexico, Geomorphology, 55, 75–96, https://doi.org/10.1016/S0169-555X(03)00133-8, 2003.
Hirt, C. W. and Nichols, B. D.: Volume of fluid (VOF) method for the dynamics of free boundaries, J. Comput. Phys., 39, 201–225, https://doi.org/10.1016/0021-9991(81)90145-5, 1981.
Hodge, R. A., Hoey, T. B., and Sklar, L. S.: Bed load transport in bedrock rivers: The role of sediment cover in grain entrainment, translation, and deposition, J. Geophys. Res., 116, F04028, https://doi.org/10.1029/2011JF002032, 2011.
Idaho C3+3 Collaboration: Falcon: High Performance Supercomputer, https://doi.org/10.7923/falcon.id, 2022.
Ippen, A. T.: High-velocity flow in open channels: A symposium: Mechanics of supercritical flow, Trans. Am. Soc. Civ. Eng., 116, 268–295, https://doi.org/10.1061/TACEAT.0006520, 1951.
Jasak, H.: OpenFOAM: Open source CFD in research and industry, Int. J. Nav. Archit. Ocean Eng., 1, 89–94, https://doi.org/10.2478/IJNAOE-2013-0011, 2009.
Javernick, L., Brasington, J., and Caruso, B.: Modeling the topography of shallow braided rivers using Structure-from-Motion photogrammetry, Geomorphology, 213, 166–182, https://doi.org/10.1016/j.geomorph.2014.01.006, 2014.
Jenssen, U. and Manhart, M.: Flow around a scoured bridge pier: a stereoscopic PIV analysis, Exp. Fluids, 61, https://doi.org/10.1007/s00348-020-03044-z, 2020.
Jenssen, U., Schanderl, W., Strobl, C., Unglehrt, L., and Manhart, M.: The viscous sublayer in front of a wall-mounted cylinder, J. Fluid Mech., 919, https://doi.org/10.1017/jfm.2021.411, 2021.
Kadivar, M., Tormey, D., and McGranaghan, G.: A review on turbulent flow over rough surfaces: Fundamentals and theories, Int. J. Thermofluids, 10, 100077, https://doi.org/10.1016/j.ijft.2021.100077, 2021.
Kirkil, G. and Constantinescu, G.: Effects of cylinder Reynolds number on the turbulent horseshoe vortex system and near wake of a surface-mounted circular cylinder, Phys. Fluids, 27, 075102, https://doi.org/10.1063/1.4923063, 2015.
Kirkil, G., Constantinescu, S. G., and Ettema, R.: Coherent Structures in the Flow Field around a Circular Cylinder with Scour Hole, J. Hydraul. Eng., 134, 572–587, https://doi.org/10.1061/(ASCE)0733-9429(2008)134:5(572), 2008.
Kothyari, U. C., Hashimoto, H., and Hayashi, K.: Effect of tall vegetation on sediment transport by channel flows, J. Hydraul. Res., 47, 700–710, https://doi.org/10.3826/jhr.2009.3317, 2009.
Lamouroux, N., Dolédec, S., and Gayraud, S.: Biological traits of stream macroinvertebrate communities: effects of microhabitat, reach, and basin filters, J. North Am. Benthol. Soc., 23, https://doi.org/10.1899/0887-3593(2004)023<0449:BTOSMC>2.0.CO;2, 2004.
Lancaster, J. and Hildrew, A. G.: Characterizing In-stream Flow Refugia, Can. J. Fish. Aquat. Sci., 50, 1663–1675, https://doi.org/10.1139/f93-187, 1993.
Laursen, E. M.: Scour in Supercritical Flow, Arizona Department of Transportation, The University of Arizona, Tucson, AZ, FHWA/AZ-88/105, 1988.
Lee, S. O. and Sturm, T. W.: Effect of Sediment Size Scaling on Physical Modeling of Bridge Pier Scour, J. Hydraul. Eng., 135, 793–802, https://doi.org/10.1061/(ASCE)HY.1943-7900.0000091, 2009.
Li, J., Qi, M., Fuhrman, D. R., and Chen, Q.: Influence of turbulent horseshoe vortex and associated bed shear stress on sediment transport in front of a cylinder, Exp. Therm. Fluid Sci., 97, 444–457, https://doi.org/10.1016/j.expthermflusci.2018.05.008, 2018.
Link, O., Klischies, K., Montalva, G., and Dey, S.: Effects of Bed Compaction on Scour at Piers in Sand-Clay Mixtures, J. Hydraul. Eng., 139, 1013–1019, https://doi.org/10.1061/(ASCE)HY.1943-7900.0000762, 2013.
Link, O., Mignot, E., Roux, S., Camenen, B., Escauriaza, C., Chauchat, J., Brevis, W., and Manfreda, S.: Scour at Bridge Foundations in Supercritical Flows: An Analysis of Knowledge Gaps, Water, 11, 1656, https://doi.org/10.3390/w11081656, 2019.
Luetzenburg, G., Kroon, A., and Bjørk, A. A.: Evaluation of the Apple iPhone 12 Pro LiDAR for an Application in Geosciences, Sci. Rep., 11, 1–9, https://doi.org/10.1038/s41598-021-01763-9, 2021.
Manga, M. and Kirchner, J. W.: Stress partitioning in streams by large woody debris, Water Resour. Res., 36, 2373–2379, https://doi.org/10.1029/2000WR900153, 2000.
Martínez, B., Guerra, M., Riviere, N., Mignot, E., and Link, O.: RANS simulation of supercritical open channel flows around obstacles, J. Hydraul. Res., 63, 1–14, https://doi.org/10.1080/00221686.2024.2446570, 2025.
Masteller, C. C. and Finnegan, N. J.: Interplay between grain protrusion and sediment entrainment in an experimental flume, J. Geophys. Res.-Earth, 122, 274–289, https://doi.org/10.1002/2016JF003943, 2017.
Menter, F., Kuntz, M., and Langtry, R.: Ten Years of Industrial Experience with the SST Turbulence Model, Turbul. Heat Mass Transf., 4, 625–632, 2003.
Mignot, E. and Riviere, N.: Bow-wave-like hydraulic jump and horseshoe vortex around an obstacle in a supercritical open channel flow, Phys. Fluids, 22, 117105, https://doi.org/10.1063/1.3505013, 2010.
Mignot, E., Moyne, T., Doppler, D., and Riviere, N.: Clear-water scouring process in a flow in supercritical regime, J. Hydraul. Eng., 142, 04015063, https://doi.org/10.1061/(ASCE)HY.1943-7900.0001100, 2016.
Moeckel, W. E.: Approximate method for predicting form and location of detached shock waves ahead of plane or axially symmetric bodies, Lewis Flight Propulsion Laboratory, Cleveland, Ohio, 19930082597, https://ntrs.nasa.gov/citations/19930082597 (last access: 22 June 2026), 1949.
Monsalve, A.: angelmons/EGUSPHERE-2025-4327: Initial public release (v1.0.0), Zenodo [code], https://doi.org/10.5281/zenodo.20650590, 2026.
Monsalve, A. and Yager, E. M.: Bed Surface Adjustments to Spatially Variable Flow in Low Relative Submergence Regimes, Water Resour. Res., 53, 9350–9367, https://doi.org/10.1002/2017WR020845, 2017.
Monsalve, A. D., Yager, E. M., Turowski, J. M., and Rickenmann, D.: A probabilistic formulation of bed load transport to include spatial variability of flow and surface grain size distributions, Water Resour. Res., 52, 3579–3598, https://doi.org/10.1002/2015WR017694, 2016.
Monsalve, A., Yager, E. M., and Schmeeckle, M. W.: Effects of bedforms and large protruding grains on near-bed flow hydraulics in low relative submergence conditions., J. Geophys. Res.-Earth, 122, 1845–1866, https://doi.org/10.1002/2016JF004152, 2017.
Monsalve, A., Yager, E. M., and Tonina, D.: Evaluating Apple iPhone LiDAR measurements of topography and roughness elements in coarse bedded streams, J. Ecohydraulics, 1–11, https://doi.org/10.1080/24705357.2023.2204087, 2023.
Monsalve, A., Reeder, W. J., Adler, K., Moreto, J. R., Liu, X., and Tonina, D.: Spatial variations of velocity and pressure fields induced by large-scale (single stalk) and small-scale (sediment) roughness elements, Adv. Water Resour., 199, 104954, https://doi.org/10.1016/j.advwatres.2025.104954, 2025.
Morgan, J. A., Brogan, D. J., and Nelson, P. A.: Application of Structure-from-Motion photogrammetry in laboratory flumes, Geomorphology, 276, 125–143, https://doi.org/10.1016/j.geomorph.2016.10.021, 2017.
Nepf, H. M.: Flow and Transport in Regions with Aquatic Vegetation, Annu. Rev. Fluid Mech., 44, 123–142, https://doi.org/10.1146/annurev-fluid-120710-101048, 2012.
Paik, J., Escauriaza, C., and Sotiropoulos, F.: On the bimodal dynamics of the turbulent horseshoe vortex system in a wing-body junction, Phys. Fluids, 19, 045107, https://doi.org/10.1063/1.2716813, 2007.
Paik, J., Escauriaza, C., and Sotiropoulos, F.: Coherent structure dynamics in turbulent flows past in-stream structures: Some insights gained via numerical simulation, J. Hydraul. Eng., 136, 981–993, https://doi.org/10.1061/(ASCE)HY.1943-7900.0000089, 2010.
Pope, S. B.: Turbulent Flows, 1st edn., Cambridge University Press, https://doi.org/10.1017/CBO9780511840531, 2000.
Raudkivi, A. J.: Functional trends of scour at bridge piers, J. Hydraul. Eng., 112, 1–13, https://doi.org/10.1061/(ASCE)0733-9429(1986)112:1(1), 1986.
Riviere, N., Vouaillat, G., Launay, G., and Mignot, E.: Emerging obstacles in supercritical open-channel flows: Detached hydraulic jump versus wall-jet-like bow wave, J. Hydraul. Eng., 143, 04017011, https://doi.org/10.1061/(ASCE)HY.1943-7900.0001291, 2017.
Roux, S., Link, O., Riviere, N., and Mignot, E.: Live-bed pier scour in supercritical open-channel flows, J. Hydraul. Res., 60, 675–685, https://doi.org/10.1080/00221686.2022.2041499, 2022.
Rusche, H.: Computational fluid dynamics of dispersed two-phase flows at high phase fractions, PhD thesis, Imperial College London, London, UK, http://hdl.handle.net/10044/1/8110 (last access: 22 June 2026), 2002.
Schanderl, W. and Manhart, M.: Reliability of wall shear stress estimations of the flow around a wall-mounted cylinder, Comput. Fluids, 128, 16–29, https://doi.org/10.1016/j.compfluid.2016.01.002, 2016.
Schanderl, W., Jenssen, U., and Manhart, M.: Near-Wall Stress Balance in Front of a Wall-Mounted Cylinder, Flow Turbul. Combust., 99, 665–684, https://doi.org/10.1007/s10494-017-9865-3, 2017a.
Schanderl, W., Jenssen, U., Strobl, C., and Manhart, M.: The structure and budget of turbulent kinetic energy in front of a wall-mounted cylinder, J. Fluid Mech., 827, 285–321, https://doi.org/10.1017/jfm.2017.486, 2017b.
Sheppard, D. M., Odeh, M., and Glasser, T.: Large Scale Clear-Water Local Pier Scour Experiments, J. Hydraul. Eng., 130, 957–963, https://doi.org/10.1061/(ASCE)0733-9429(2004)130:10(957), 2004.
Smith, H. E. J., Monsalve, A. D., Turowski, J. M., Rickenmann, D., and Yager, E. M.: Controls of local grain size distribution, bed structure and flow conditions on sediment mobility, Earth Surf. Proc. Land., 48, 1990–2004, https://doi.org/10.1002/esp.5599, 2023.
Soto, J., Link, O., and Brevis, W.: Elucidating the importance of sediment avalanches in scour at obstacles, J. Hydraul. Res., 60, 62–73, https://doi.org/10.1080/00221686.2020.1866694, 2022.
Strelets, M.: Detached eddy simulation of massively separated flows, in: 39th Aerospace Sciences Meeting and Exhibit, Aerospace Sciences Meetings, AIAA Paper 2001-0878, https://doi.org/10.2514/6.2001-879, 2001.
Tritico, H. M. and Hotchkiss, R. H.: Unobstructed and obstructed turbulent flow in gravel bed rivers, J. Hydraul. Eng., 131, 635–645, https://doi.org/10.1061/(ASCE)0733-9429(2005)131:8(635), 2005.
Unglehrt, L., Jenssen, U., Kurz, F., Schanderl, W., Kreuzinger, J., Schwertfirm, F., and Manhart, M.: Large–Eddy Simulation of the flow inside a scour hole around a circular cylinder using a cut cell immersed boundary method, Flow Turbul. Combust., 109, 893–929, https://doi.org/10.1007/s10494-022-00379-x, 2022.
Van Leer, B.: Towards the ultimate conservative difference scheme. II. Monotonicity and conservation combined in a second-order scheme, J. Comput. Phys., 14, 361–370, https://doi.org/10.1016/0021-9991(74)90019-9, 1974.
Weller, H., Greenshields, C., Bainbridge, W., Peltola, J., Niemi, T., Schlegel, F., Lehnigk, R., Kníř, J., and Contino, F.: OpenFOAM, version 9, The OpenFOAM Foundation Ltd, London, UK [code], https://openfoam.org/version/9/ (last access: 1 June 2026), 2021.
Weller, H. G., Tabor, G., Jasak, H., and Fureby, C.: A tensorial approach to computational continuum mechanics using object-oriented techniques, Comput. Phys., 12, 620–631, https://doi.org/10.1063/1.168744, 1998.
Woodget, A. S., Carbonneau, P. E., Visser, F., and Maddock, I. P.: Quantifying submerged fluvial topography using hyperspatial resolution UAS imagery and structure from motion photogrammetry, Earth Surf. Process. Landf., 40, 47–64, https://doi.org/10.1002/esp.3613, 2015.
Wu, W. and Piomelli, U.: Effects of surface roughness on a separating turbulent boundary layer, J. Fluid Mech., 841, 552–580, https://doi.org/10.1017/jfm.2018.101, 2018.
Yager, E. M., Dietrich, W. E., Kirchner, J. W., and McArdell, B. W.: Patch dynamics and stability in steep, rough streams, J. Geophys. Res.-Earth, 117, 1–16, https://doi.org/10.1029/2011JF002253, 2012.
Yager, E. M., Schmeeckle, M. W., and Badoux, A.: Resistance Is Not Futile: Grain Resistance Controls on Observed Critical Shields Stress Variations, J. Geophys. Res.-Earth, 123, 3308–3322, https://doi.org/10.1029/2018JF004817, 2018.
Yager, E. M., Shim, J., Hodge, R., Monsalve, A., Tonina, D., Johnson, J. P. L., and Telfer, L.: Pro+: Automated protrusion and critical shear stress estimates from 3D point clouds of gravel beds, Earth Surf. Process. Landf., 49, 2155–2170, https://doi.org/10.1002/esp.5822, 2024.
Zalesak, S. T.: Fully multidimensional flux-corrected transport algorithms for fluids, J. Comput. Phys., 31, 335–362, https://doi.org/10.1016/0021-9991(79)90051-2, 1979.
Zanke, U.: On the influence of turbulence on the initiation of sediment motion, Int. J. Sediment Res., 18, 17–31, 2003.